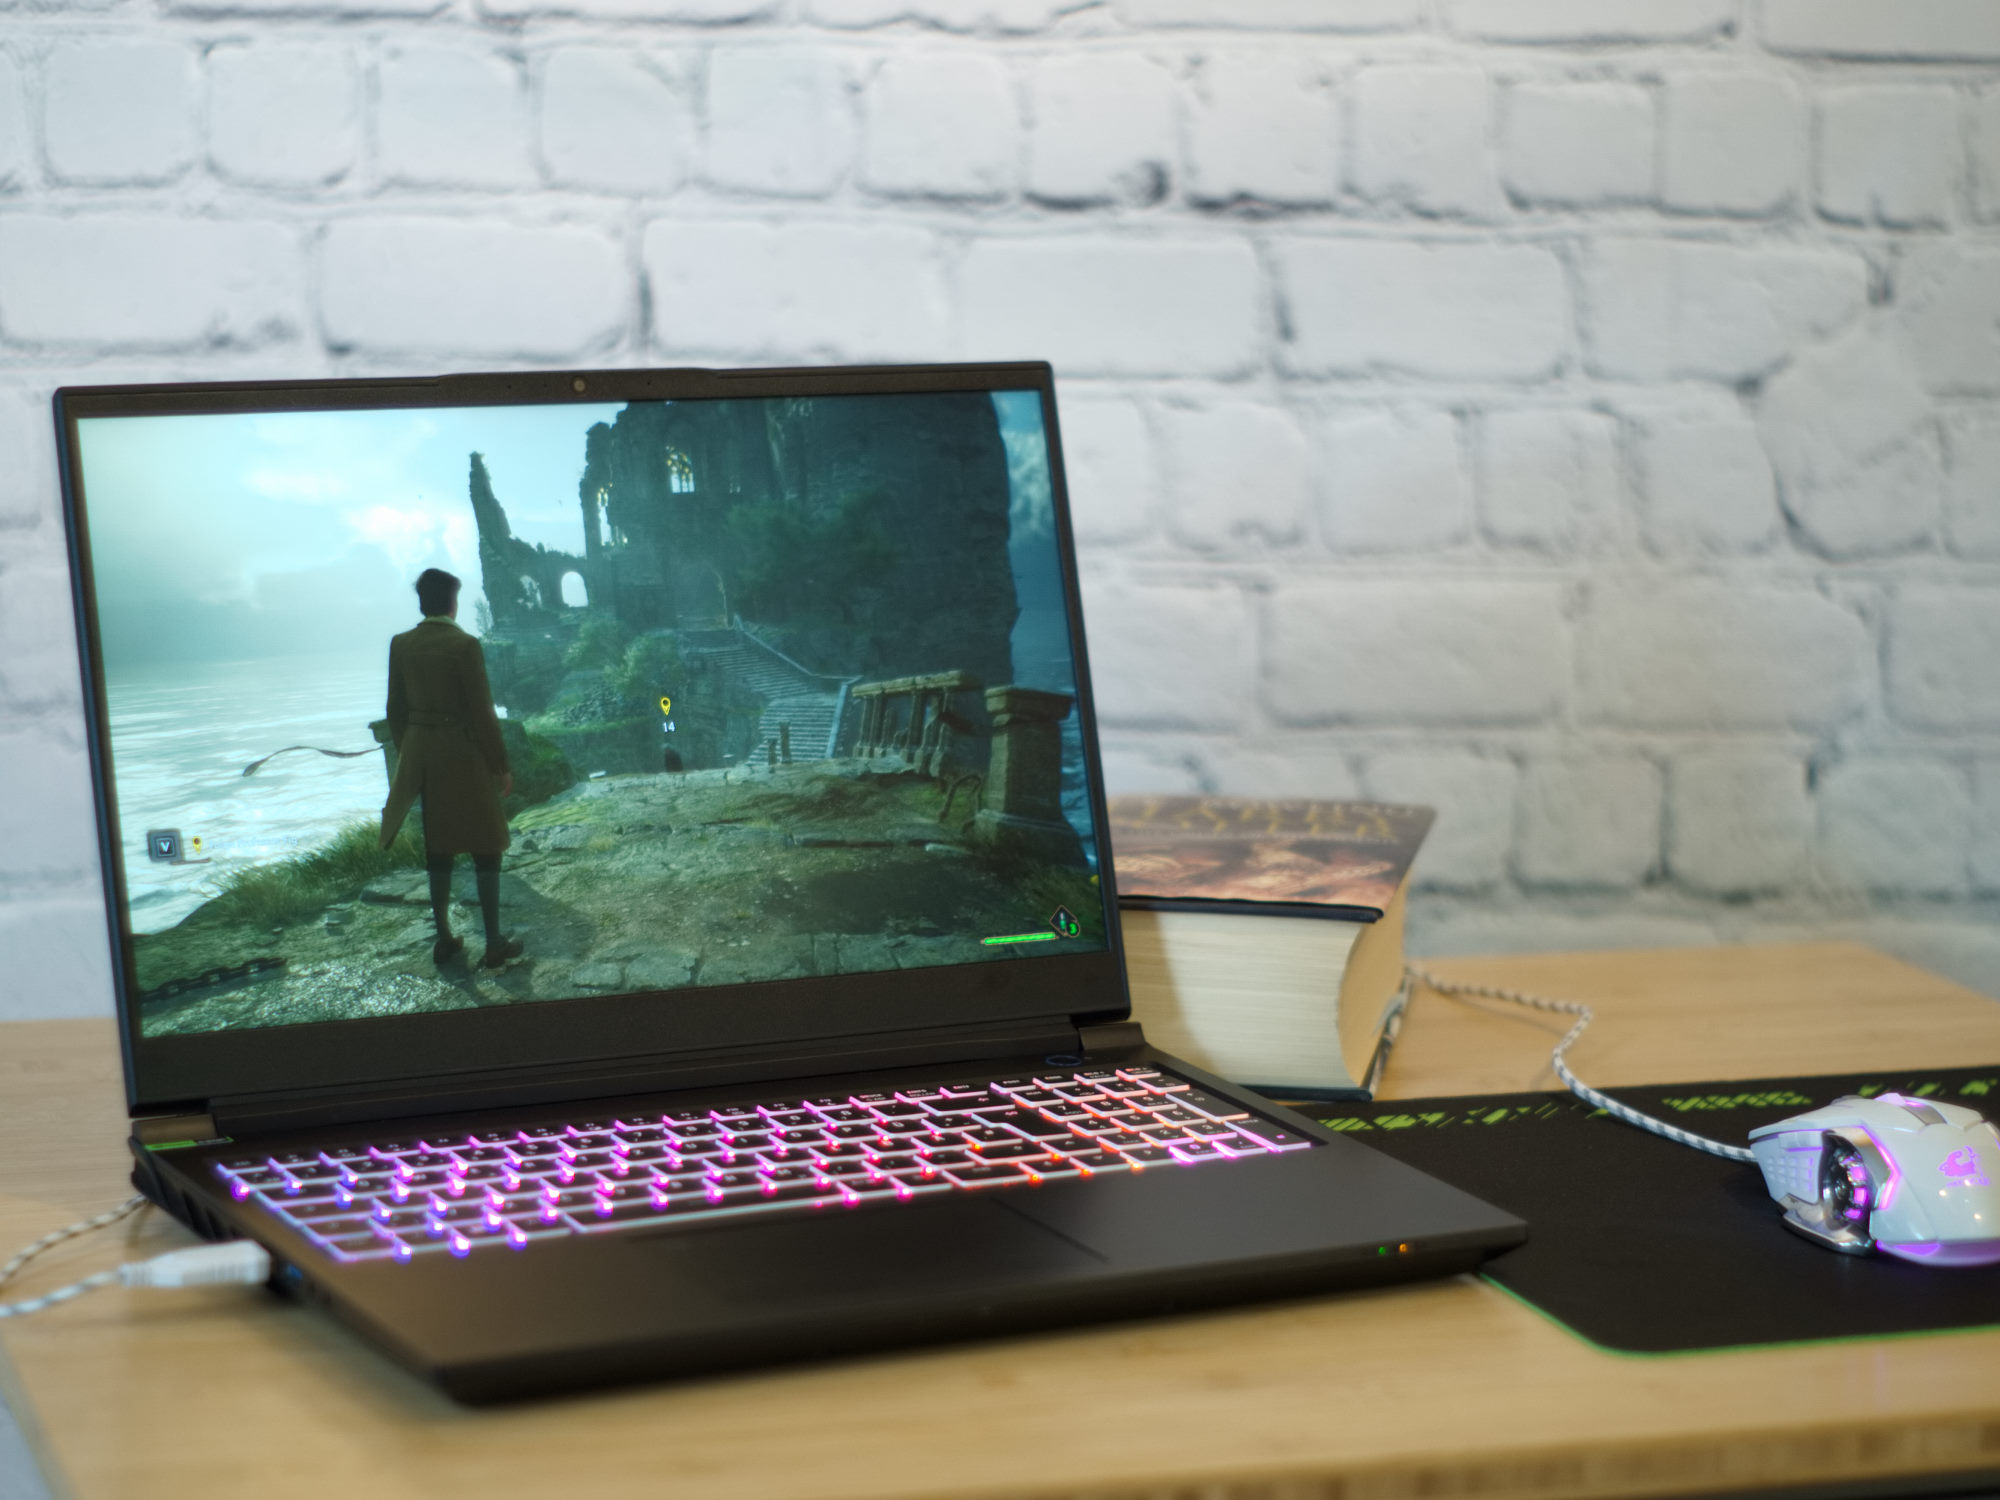
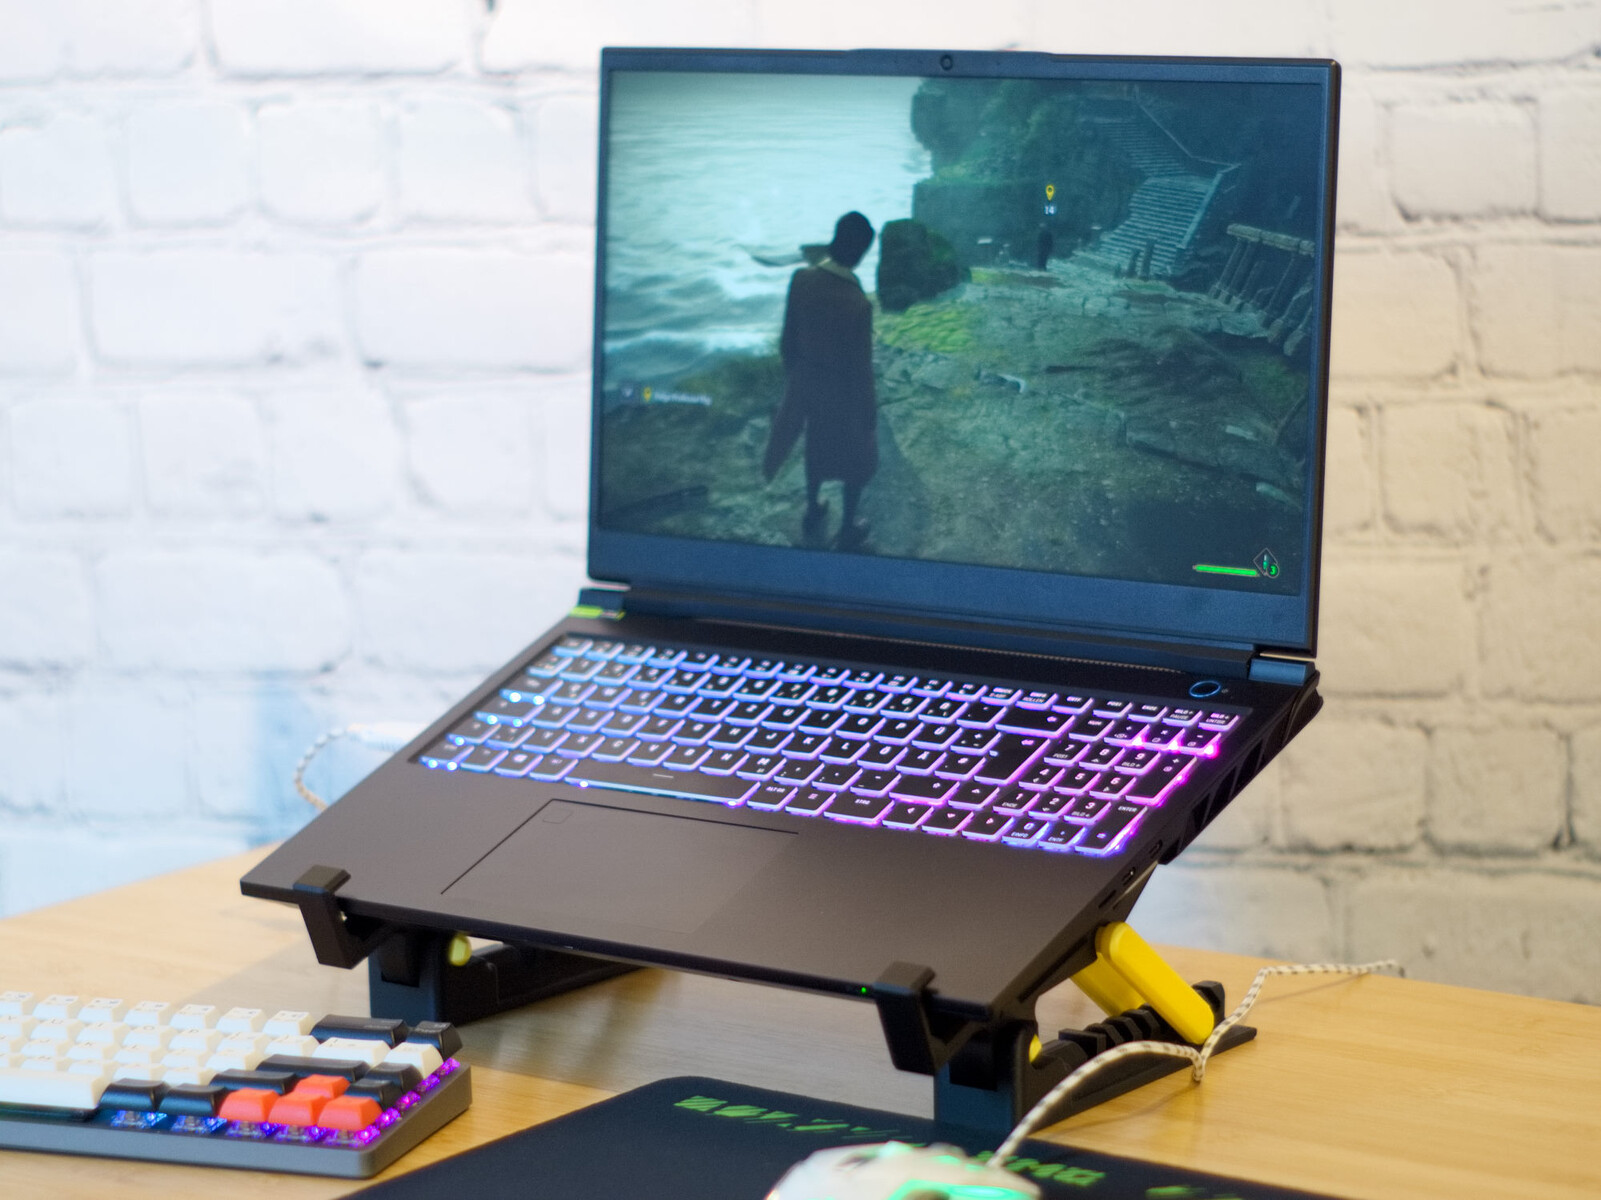
Schenker XMG Pro 15 E23 (PD50SND-G) gaming laptop testad: Skål för balans mellan arbete och spel!
Schenkers bärbara datorer uppdateras regelbundet och förra året testade vi två av föregångarna till XMG Pro 15. En med enTiger Lake CPU, en med Alder Lakeoch båda kommer med en RTX 3080. När det gäller processorn är vår granskningsenhet utrustad med den senaste Raptor Lake-generationen och har valt enNvidia GeForce RTX 4060. Men den bärbara datorn har inte bara fått interna justeringar eftersom designen också har fått en liten makeover. Enheten är nu baserad på Clevo PD50SND-G barebone.
En jämförelse med föregångaren är intressant eftersom även om grafikkortet nu härstammar från Nvidias senaste Ada Lovelace-generation, har dess klass sänkts från 80 till 60. Ett annat konfigurationsalternativ tillhandahålls i form avRTX 4070. Båda grafikkorten arbetar med 140 till 150 watt. Pro 15 E23 har lyckats leverera en imponerande prestanda och den står sig väl i jämförelse med bärbara speldatorer som t.ex Dell G15 5530 ellerAorus 15X ASF. Lite bortom denna nivå ärAsus ZenBook Pro 14 Duo. Multimedia-bärbara datorn har dock också höga fps-räkningar i många aktuella titlar.
Potentiella konkurrenter i jämförelse
Gradering | Datum | Modell | Vikt | Höjd | Storlek | Upplösning | Pris |
|---|---|---|---|---|---|---|---|
| 86.2 % v7 (old) | 07/2023 | Schenker XMG Pro 15 (E23) i9-13900HX, GeForce RTX 4060 Laptop GPU | 2.4 kg | 24.9 mm | 15.60" | 2560x1440 | |
| 86.9 % v7 (old) | 07/2022 | Schenker XMG Pro 15 (i7-12700H, RTX 3080 Ti) i7-12700H, GeForce RTX 3080 Ti Laptop GPU | 2.4 kg | 25 mm | 15.60" | 2560x1440 | |
| 84.2 % v7 (old) | 06/2023 | Dell G15 5530 i7-13650HX, GeForce RTX 4060 Laptop GPU | 3 kg | 26.95 mm | 15.60" | 1920x1080 | |
| 86.3 % v7 (old) | 06/2023 | Asus TUF A15 FA507 R7 7735HS, GeForce RTX 4050 Laptop GPU | 2.2 kg | 24.9 mm | 15.60" | 1920x1080 | |
| 86.2 % v7 (old) | 04/2023 | Aorus 15X ASF i7-13700HX, GeForce RTX 4070 Laptop GPU | 2.3 kg | 19.7 mm | 15.60" | 2560x1440 | |
| 87 % v7 (old) | 06/2023 | Asus ZenBook Pro 14 Duo UX8402VV-P1021W i9-13900H, GeForce RTX 4060 Laptop GPU | 1.8 kg | 21 mm | 14.50" | 2880x1800 | |
| 82.4 % v7 (old) | 04/2023 | MSI Cyborg 15 A12VF i7-12650H, GeForce RTX 4060 Laptop GPU | 2 kg | 22.9 mm | 15.60" | 1920x1080 | |
| 88.4 % v7 (old) | 06/2023 | Alienware x16 R1 i9-13900HK, GeForce RTX 4080 Laptop GPU | 2.6 kg | 18.57 mm | 16.00" | 2560x1600 |
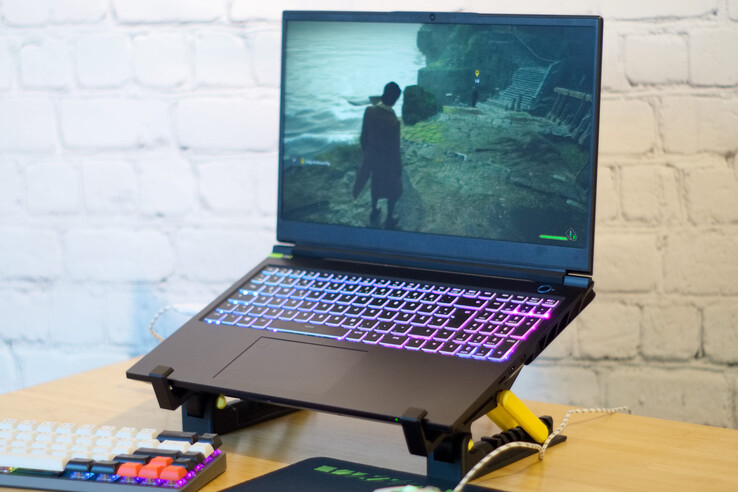
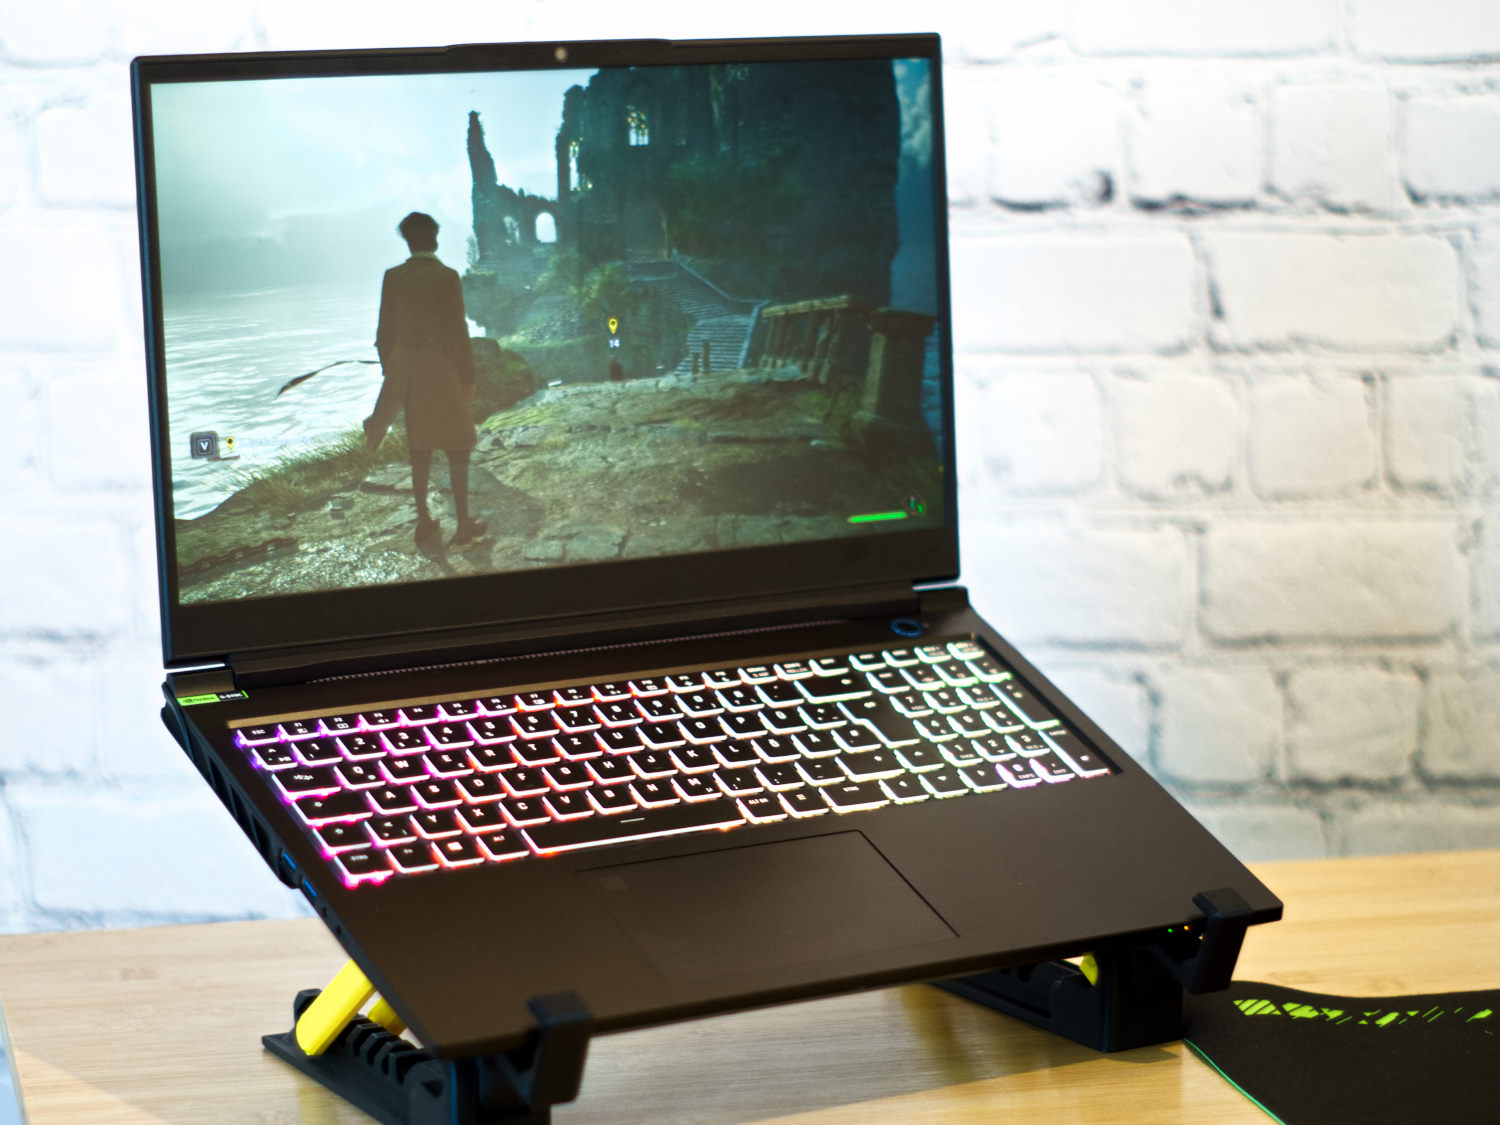
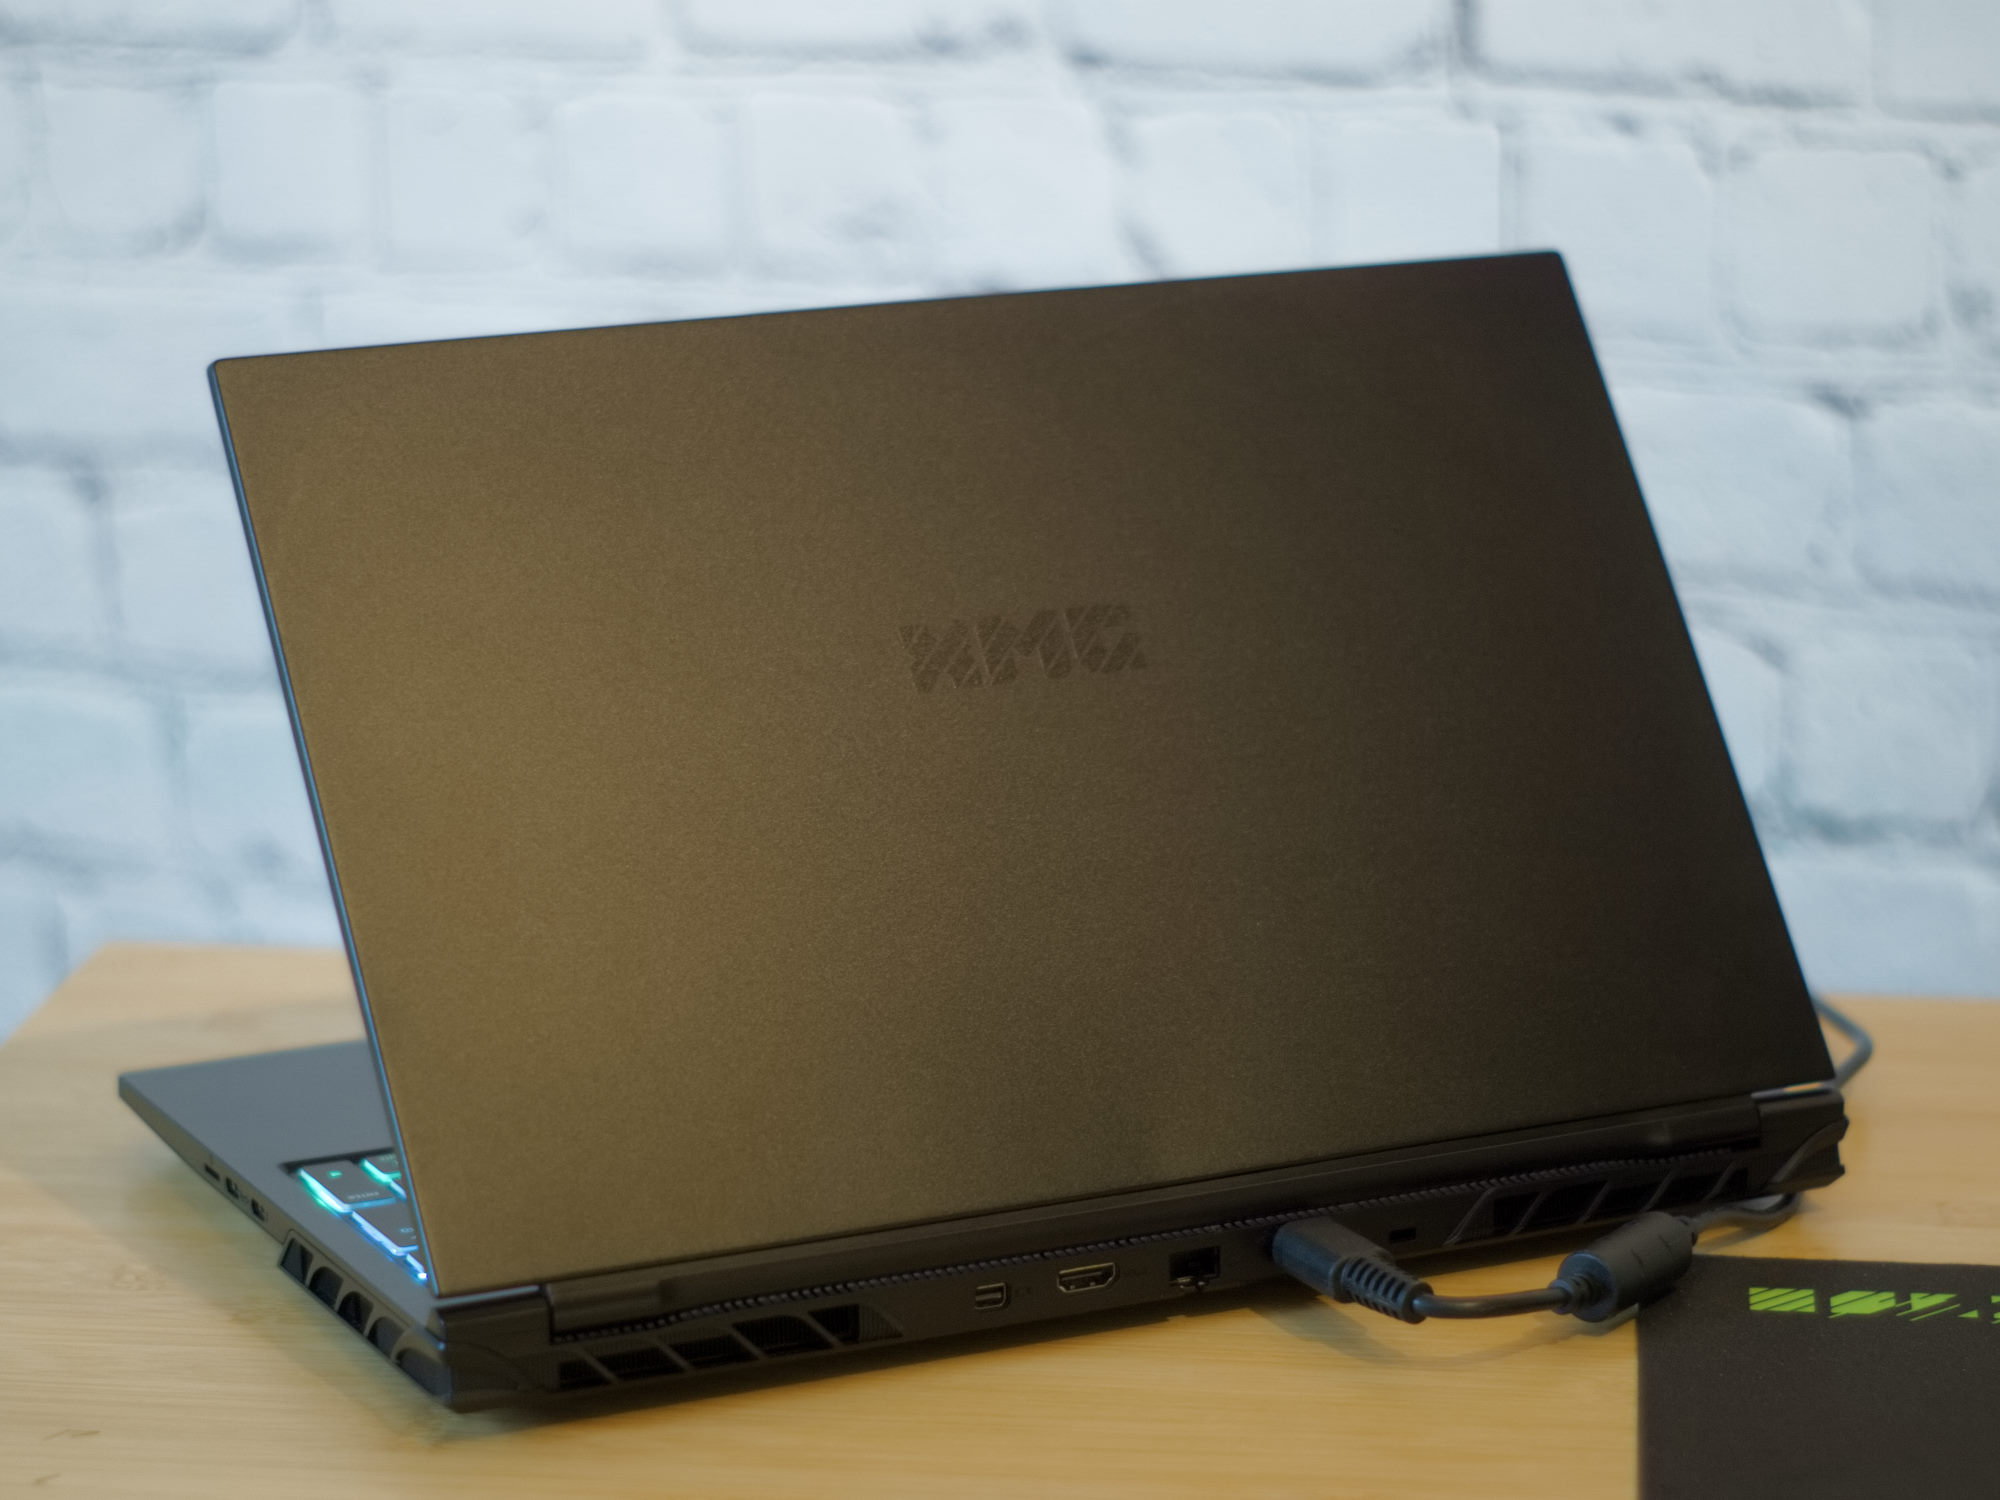
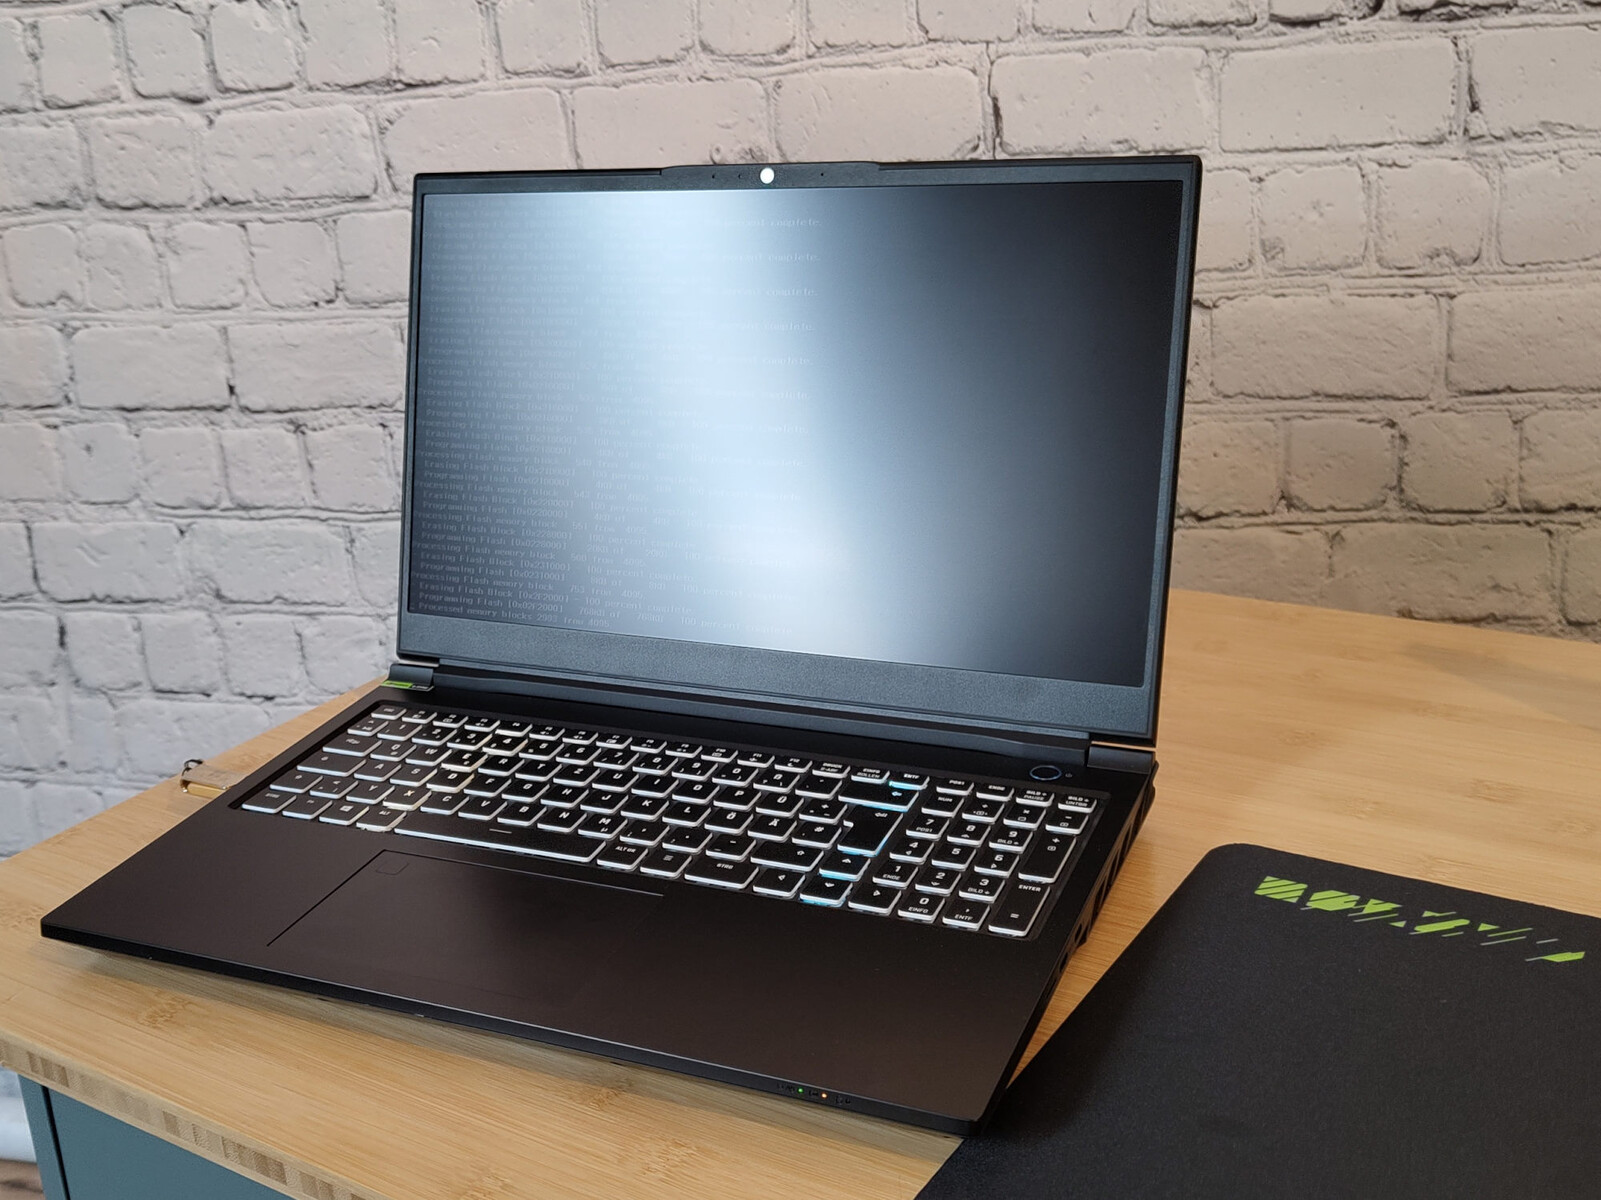
Case & funktioner - Högt metallinnehåll
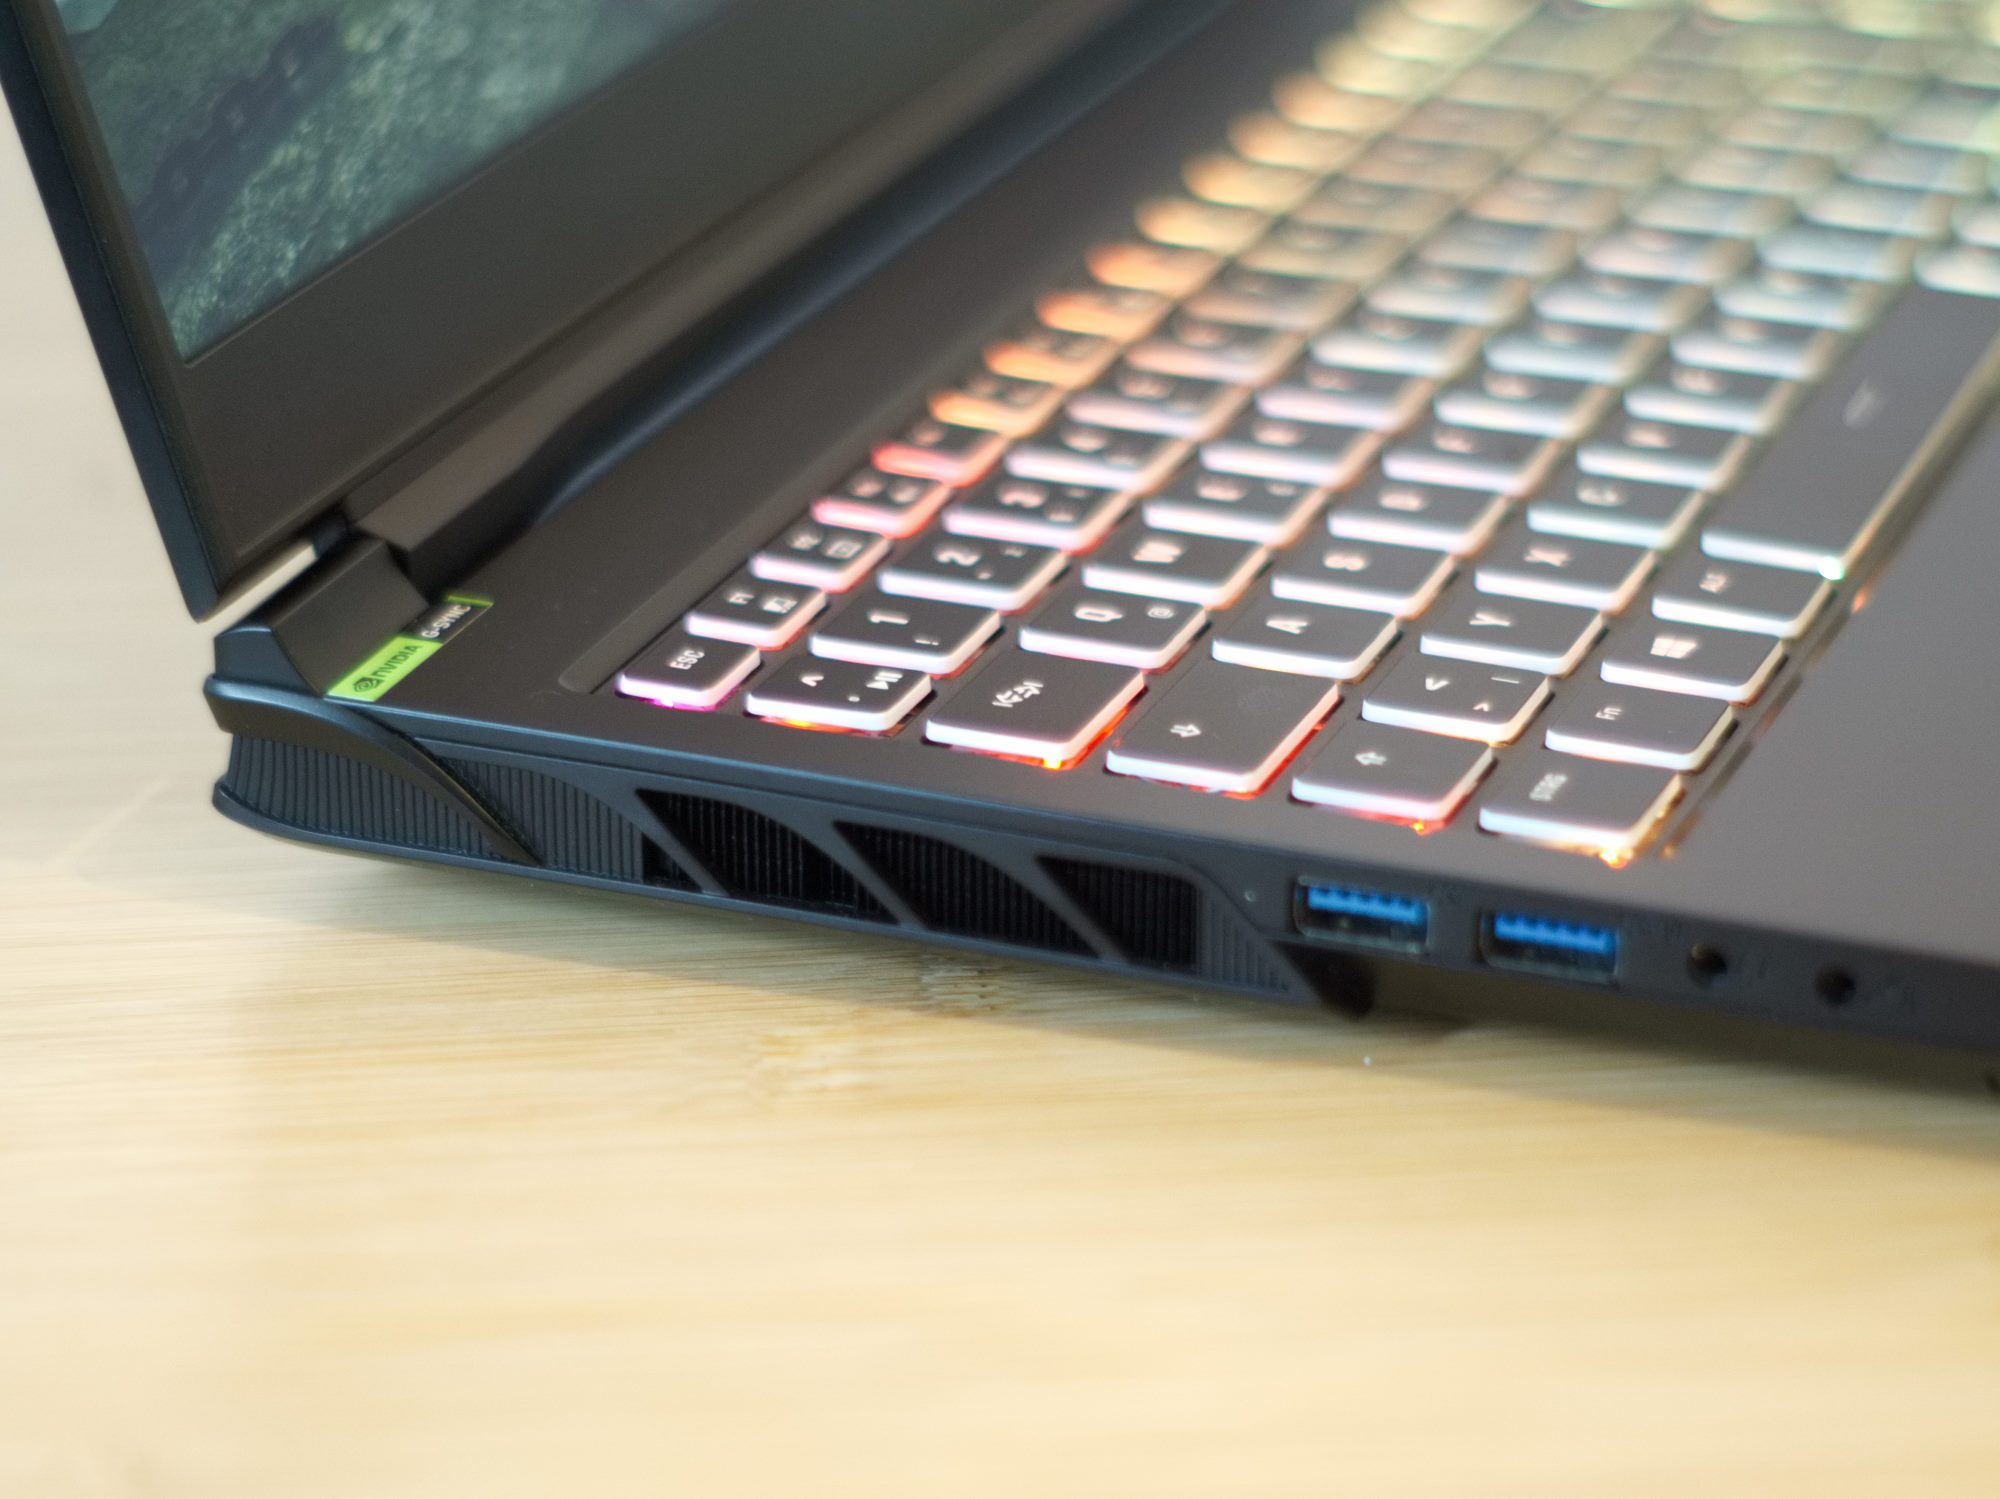
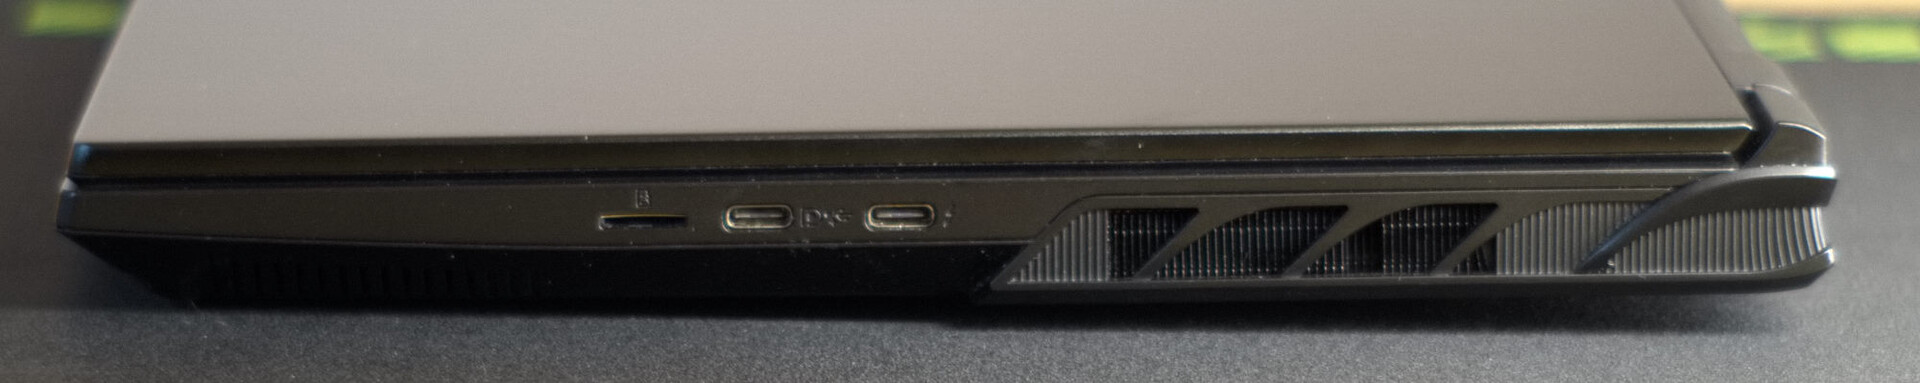
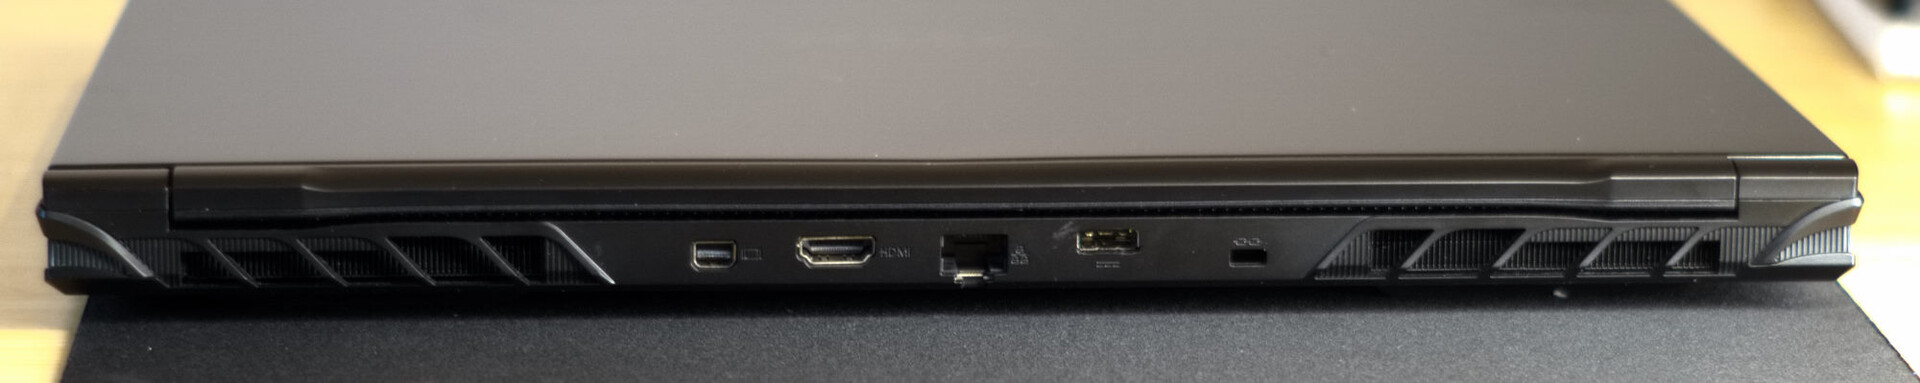
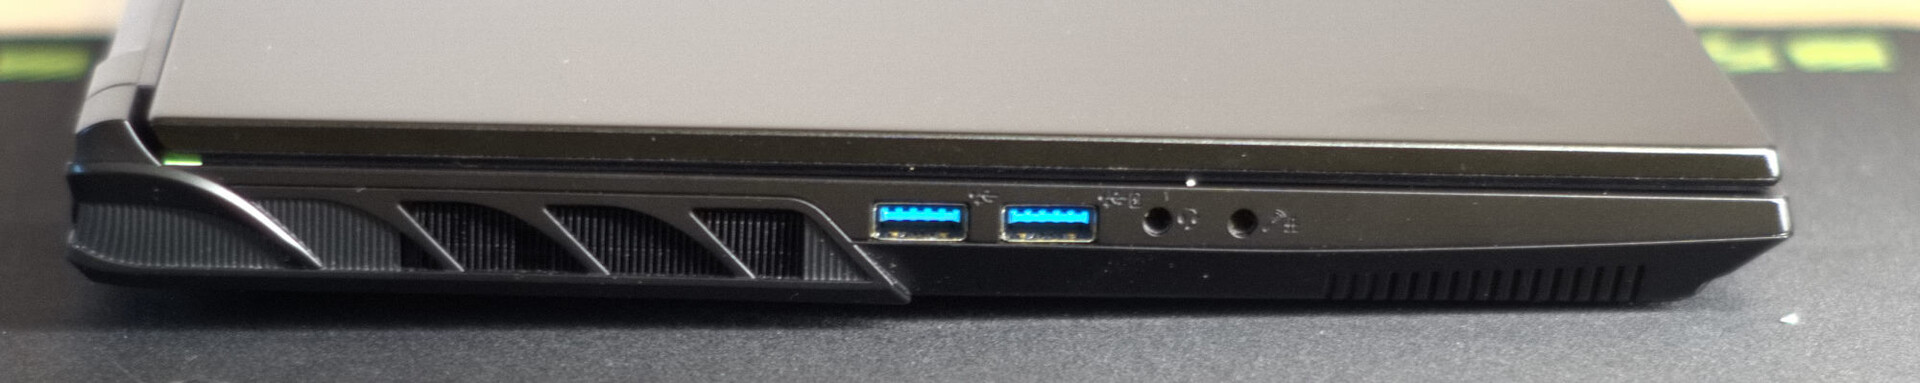
Jämfört med sin föregångare har Pro 15 E23 fått några mindre detaljjusteringar. De som påverkats är i huvudsak ventilationsöppningarna på den bärbara datorns sidor och ett byte av position mellan RJ45-platsen och en USB-C-plats. Nu finns alla USB-portar på sidorna av enheten.
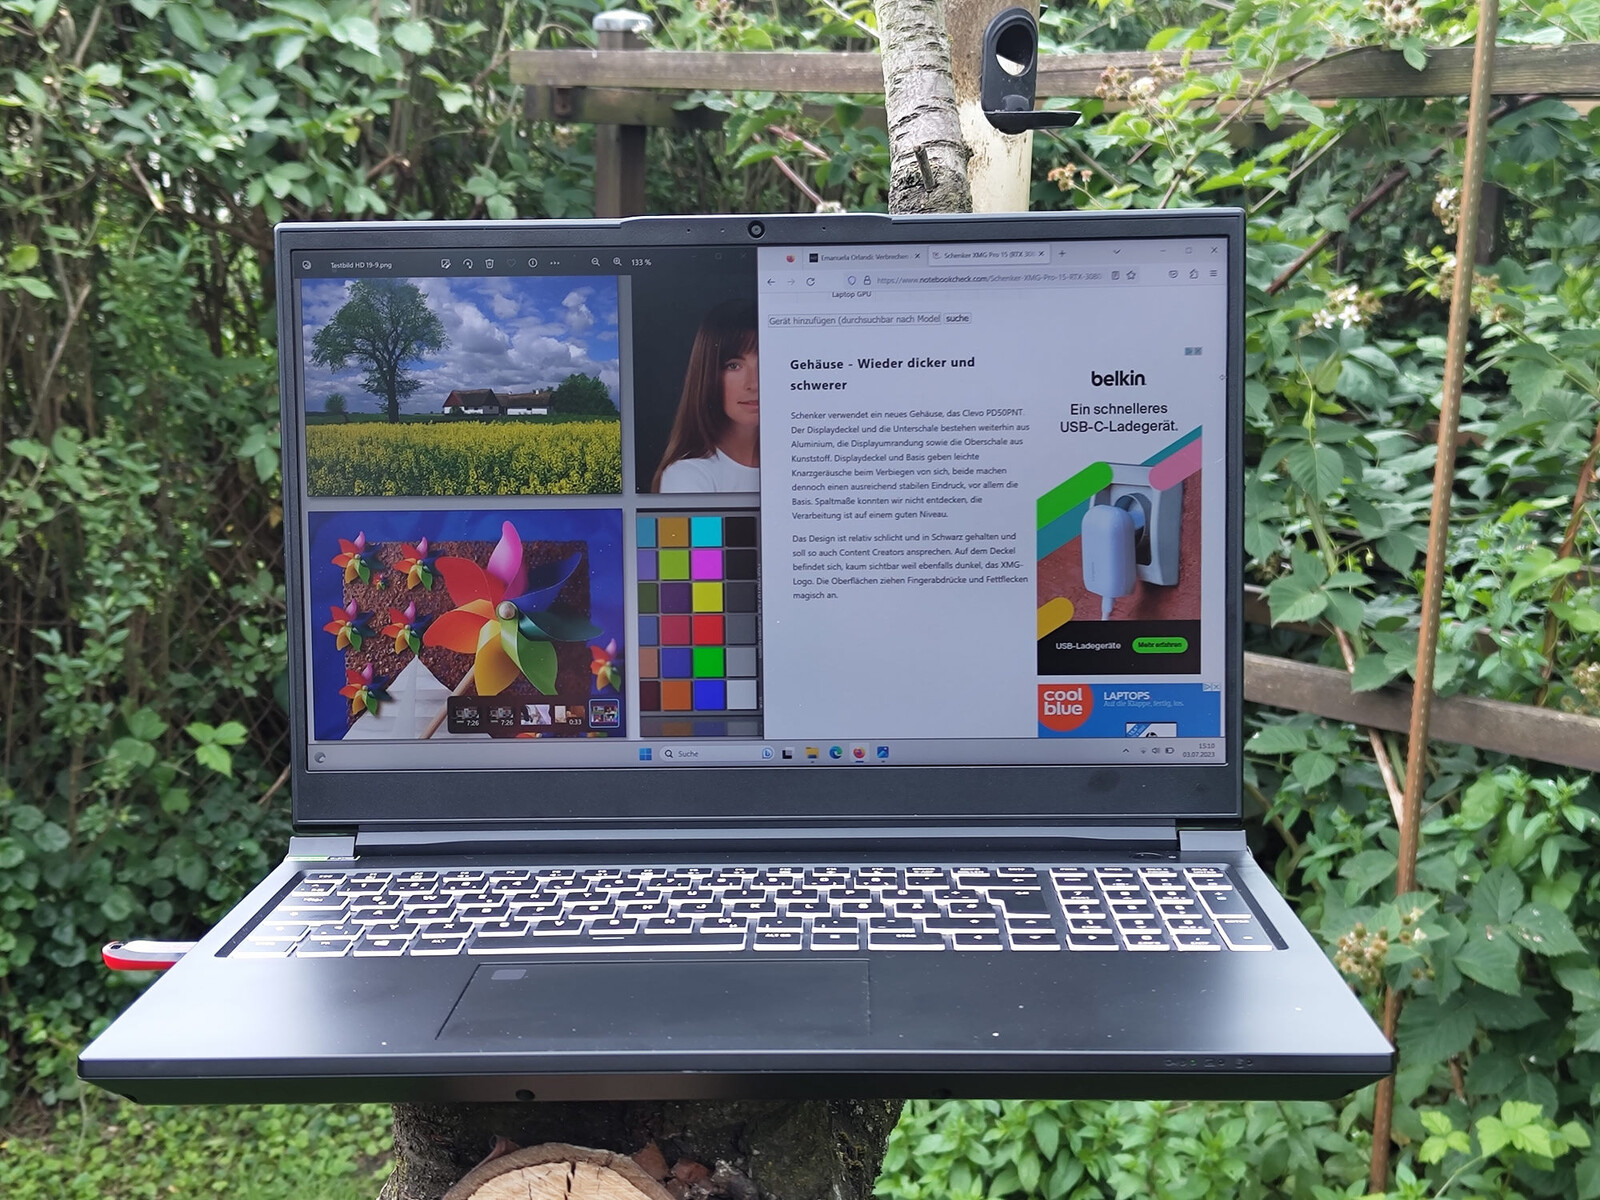
Designen är fortfarande diskret, svart och i stort sett fri från varumärken. Både storleken och vikten på den bärbara datorn är nästan identiska med föregångaren. Den bärbara datorns displaylock och botten av skalet fortsätter att vara tillverkade av aluminium medan toppen av skalet är tillverkat av plast. Skärmen ramas in av en bred plastkant som bara är 5 mm tjock på sidorna, en centimeter upptill och två centimeter nedtill. Det är möjligt att få fram ett litet knarrande ljud från skärmen och basen genom att vrida på dem. Men för att uppnå detta måste man anstränga sig en hel del eftersom alla delar i den bärbara datorn är mycket välbyggda och solida. Tangentbordet och skärmlocket böjer sig bara något när man trycker hårt och gångjärnen håller säkert fast skärmen i alla tänkbara lägen mellan 0° och 135°.

SD-kortläsare, Wi-Fi och webbkamera
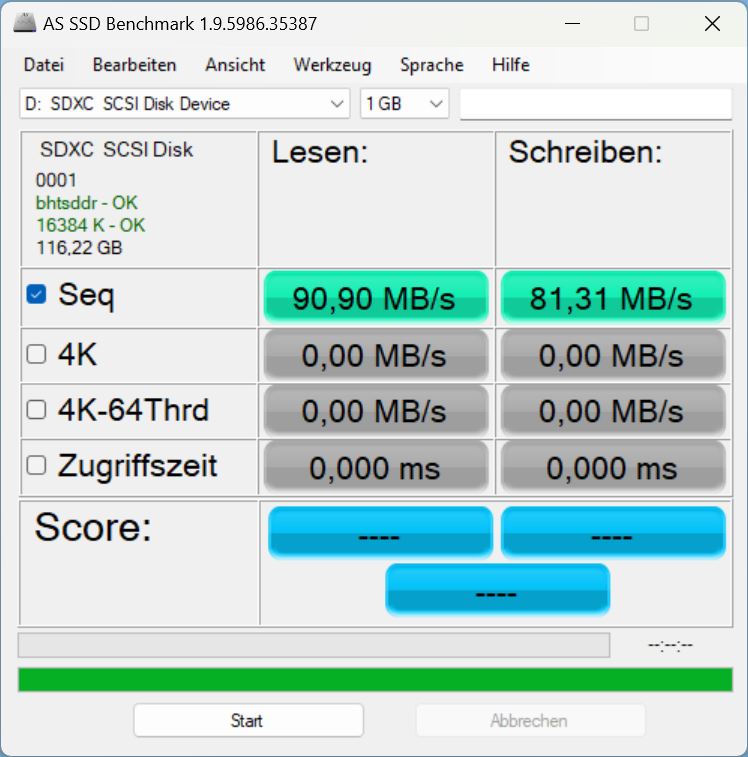
Das Pro 15 har, åtminstone i jämförelse med många andra bärbara speldatorer, en microSD-kortläsare. I kombination med vårt AV Pro microSD (V60) registrerade vi bra överföringshastigheter i intervallet 80 till 90 MB/s.
I 6 GHz-nätverket visade den bärbara datorns Intel Wi-Fi 6E AX211 mestadels utmärkta datahastigheter, men i 5 GHz-nätverket returnerade den snarare siffror under genomsnittet när det gäller överföringshastigheter.
För streamers kommer kvaliteten på den inbyggda Full HD-webbkameran sannolikt att vara otillräcklig, särskilt under dåliga ljusförhållanden. Den kan dock användas för enstaka videosamtal.
| SD Card Reader | |
| average JPG Copy Test (av. of 3 runs) | |
| Genomsnitt av klass Gaming (20.9 - 210, n=54, senaste 2 åren) | |
| Schenker XMG Pro 15 (E23) | |
| Schenker XMG Pro 15 (i7-12700H, RTX 3080 Ti) | |
| Asus ZenBook Pro 14 Duo UX8402VV-P1021W (AV Pro SD microSD 128 GB V60) | |
| Alienware x16 R1 (AV PRO microSD 128 GB V60) | |
| maximum AS SSD Seq Read Test (1GB) | |
| Alienware x16 R1 (AV PRO microSD 128 GB V60) | |
| Genomsnitt av klass Gaming (25.5 - 261, n=51, senaste 2 åren) | |
| Schenker XMG Pro 15 (i7-12700H, RTX 3080 Ti) | |
| Schenker XMG Pro 15 (E23) | |
| Asus ZenBook Pro 14 Duo UX8402VV-P1021W (AV Pro SD microSD 128 GB V60) | |

 GeForce RTX 4060 Laptop GPU, i9-13900HX, Crucial P5 Plus 1TB CT1000P5PSSD8")
 GeForce RTX 4060 Laptop GPU, i9-13900HX, Crucial P5 Plus 1TB CT1000P5PSSD8")
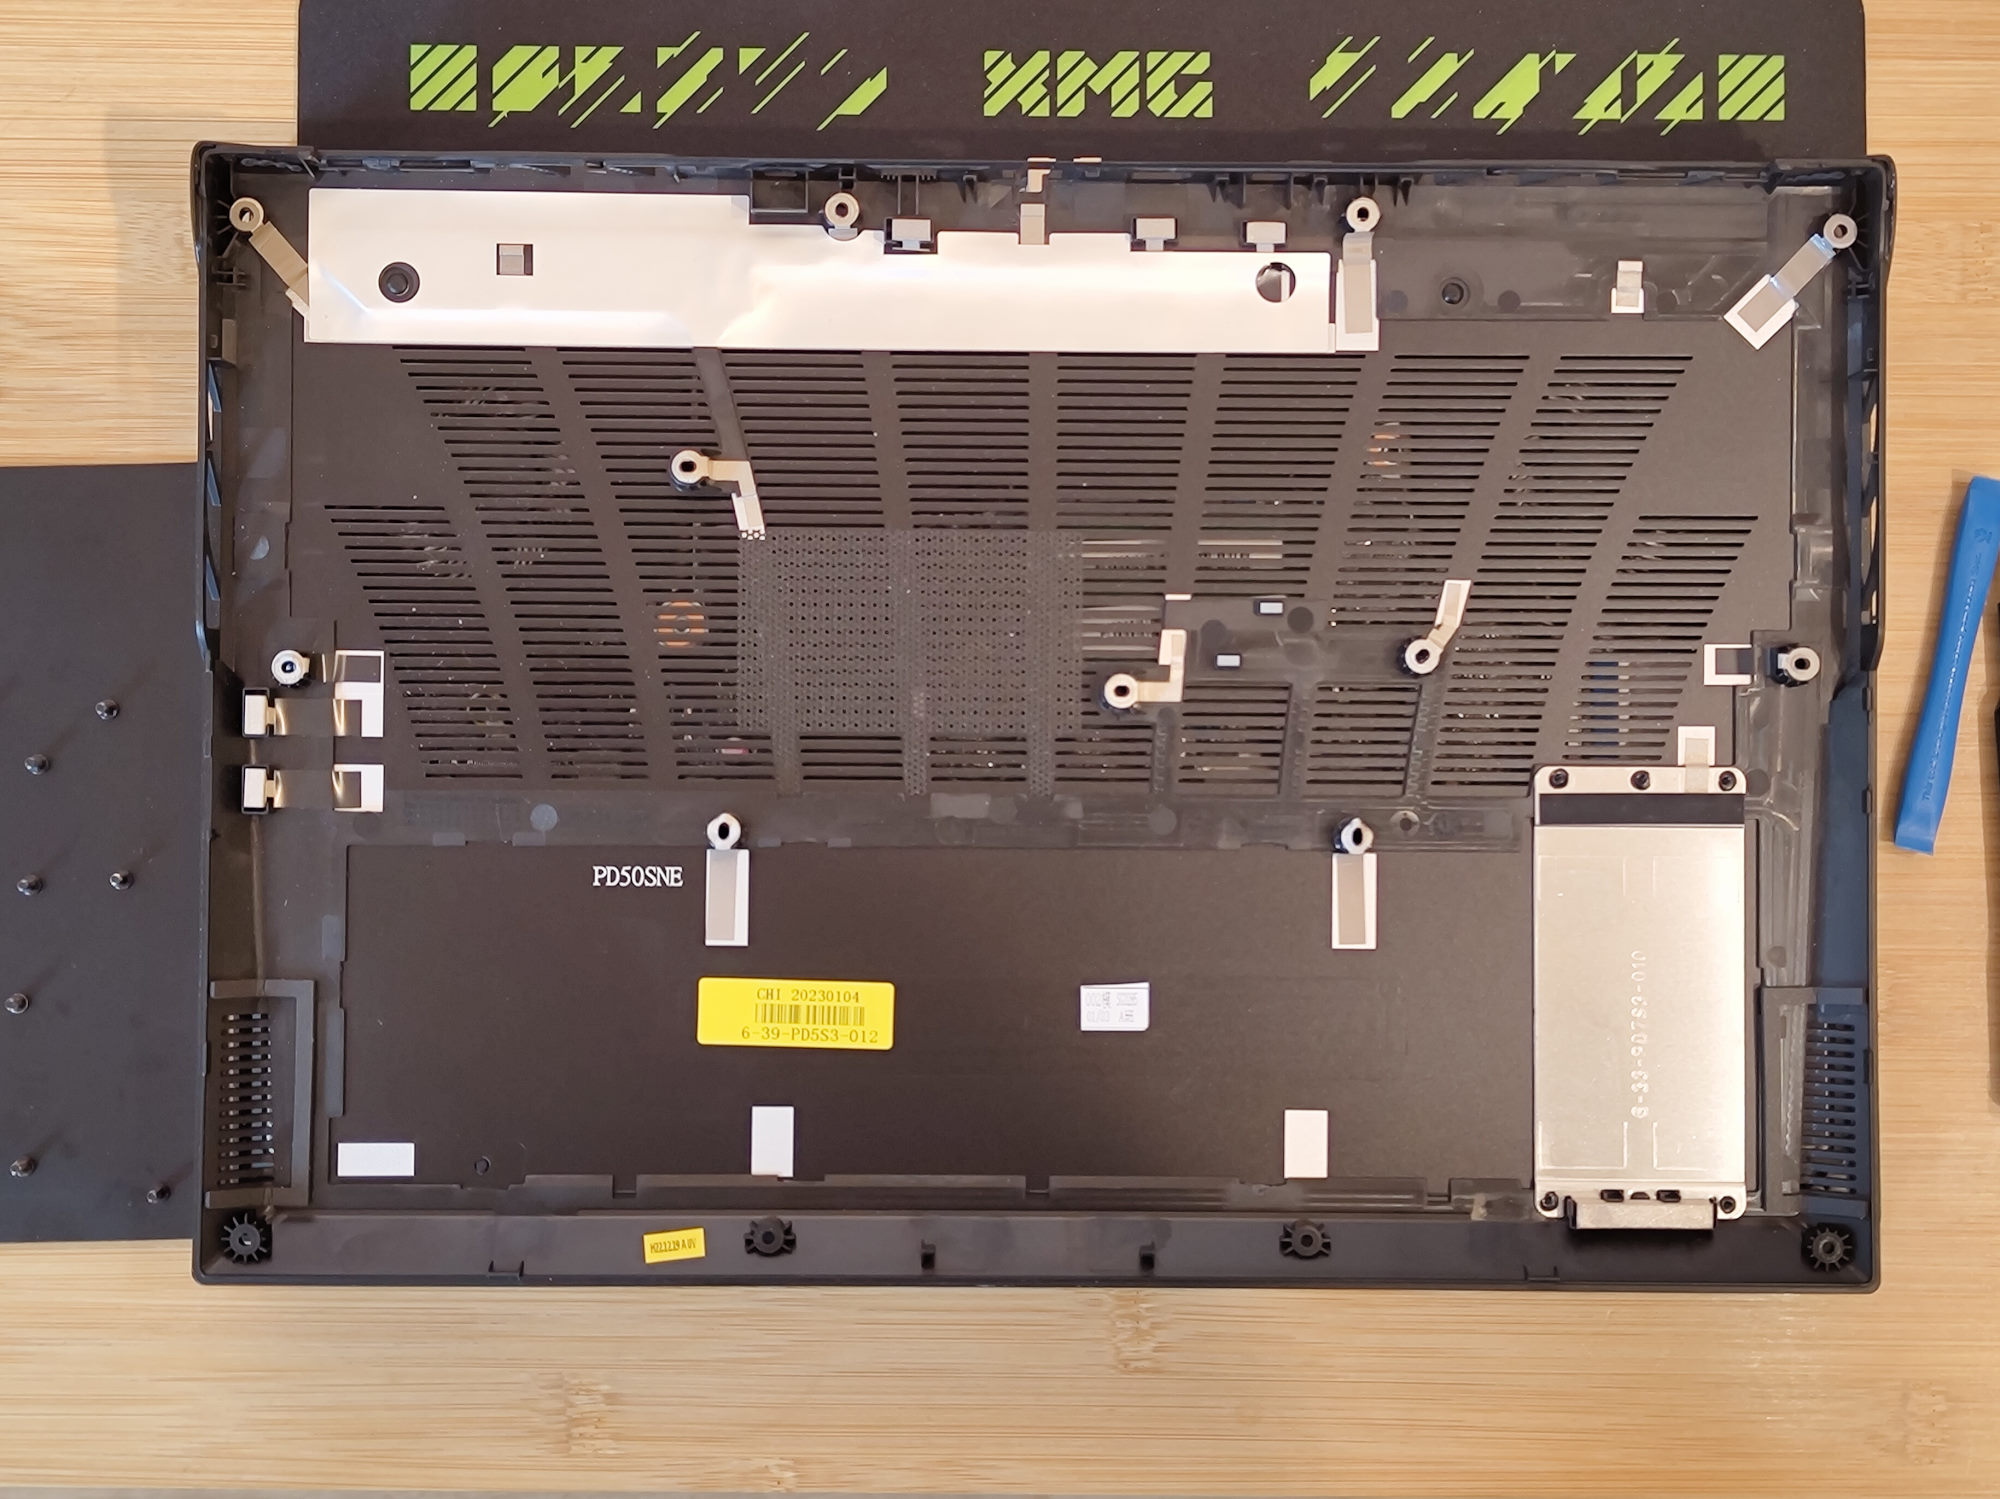
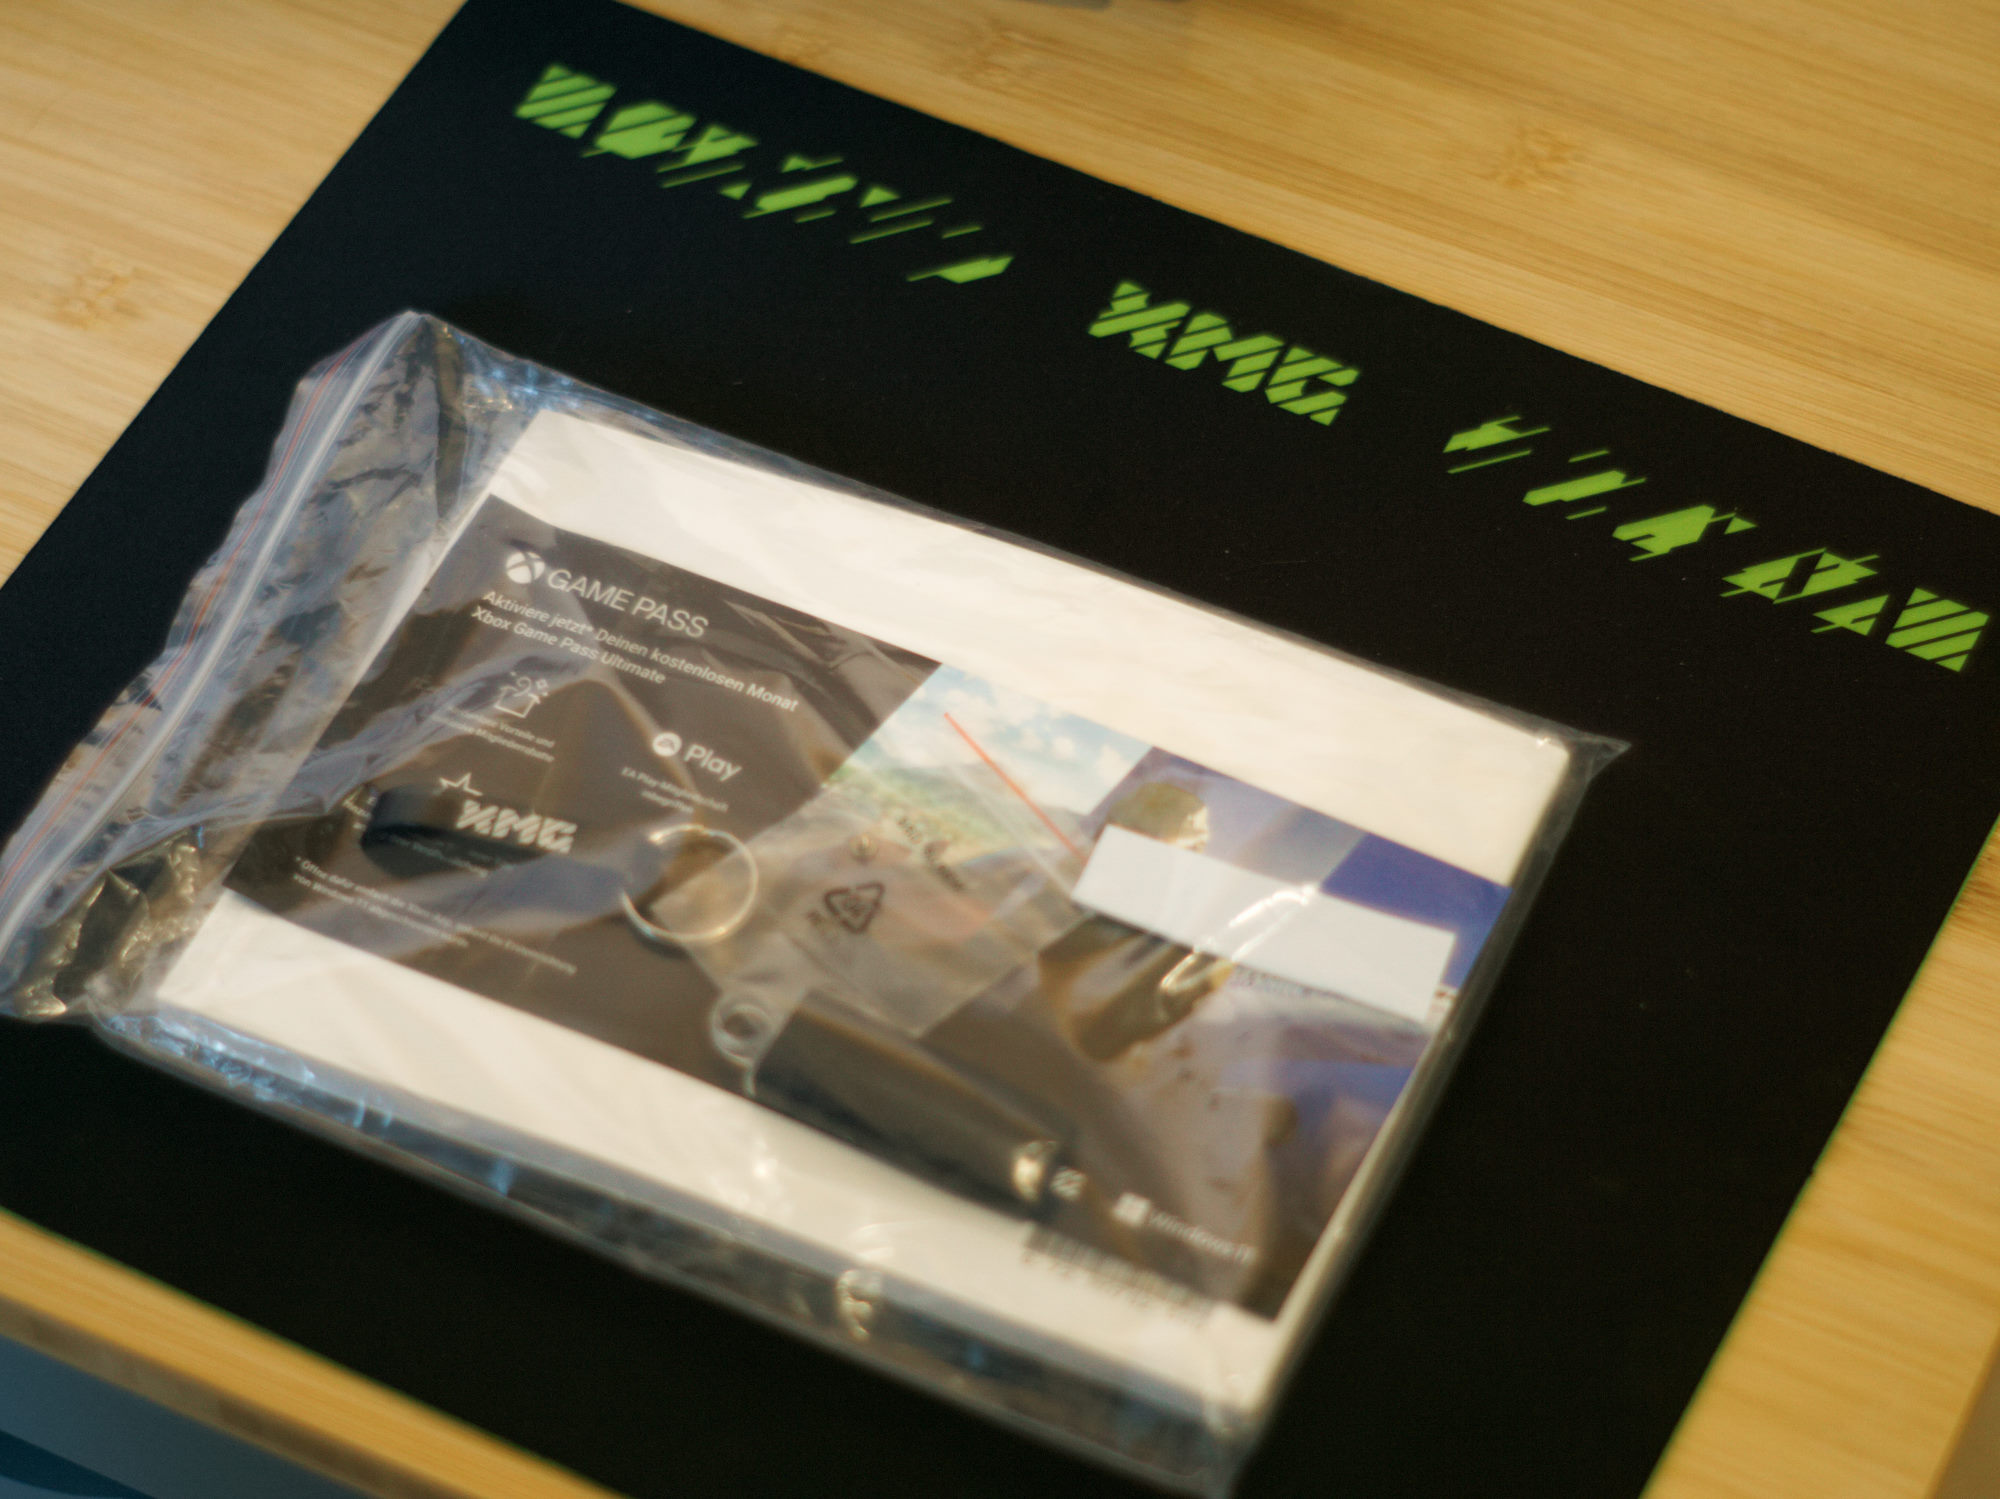
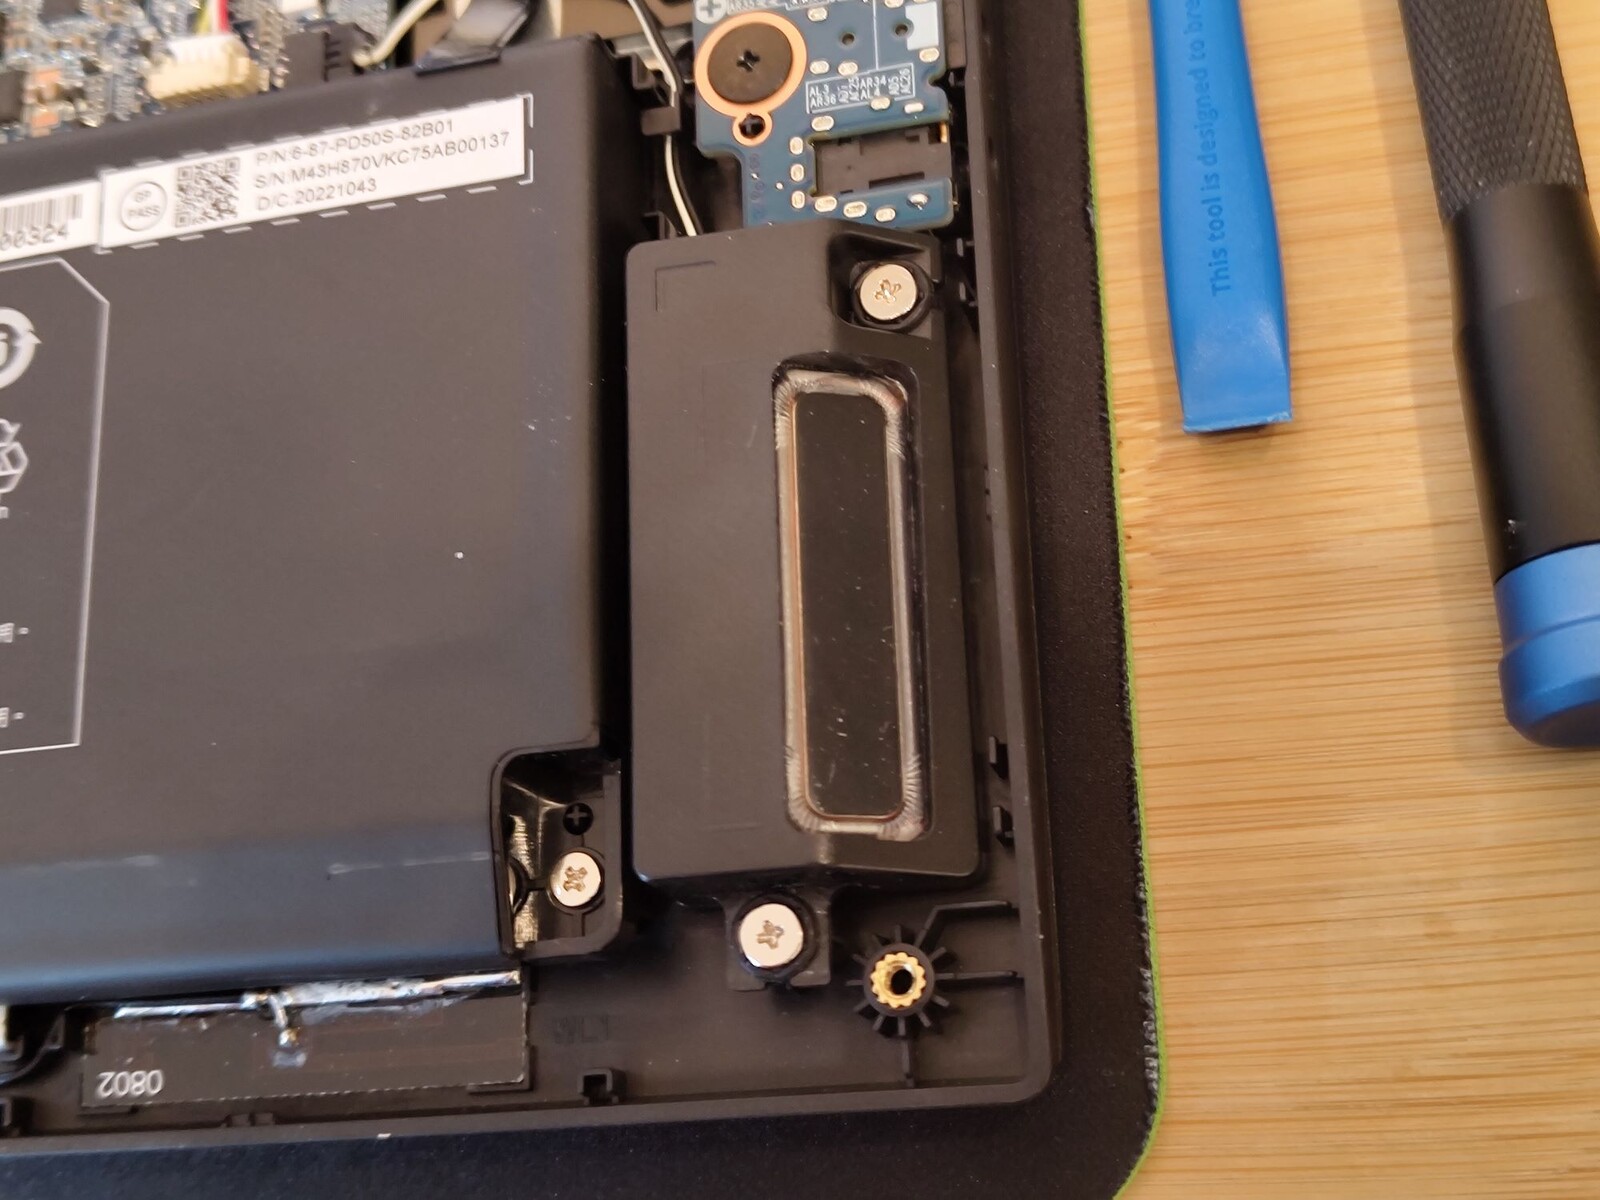
Tillbehör och underhåll
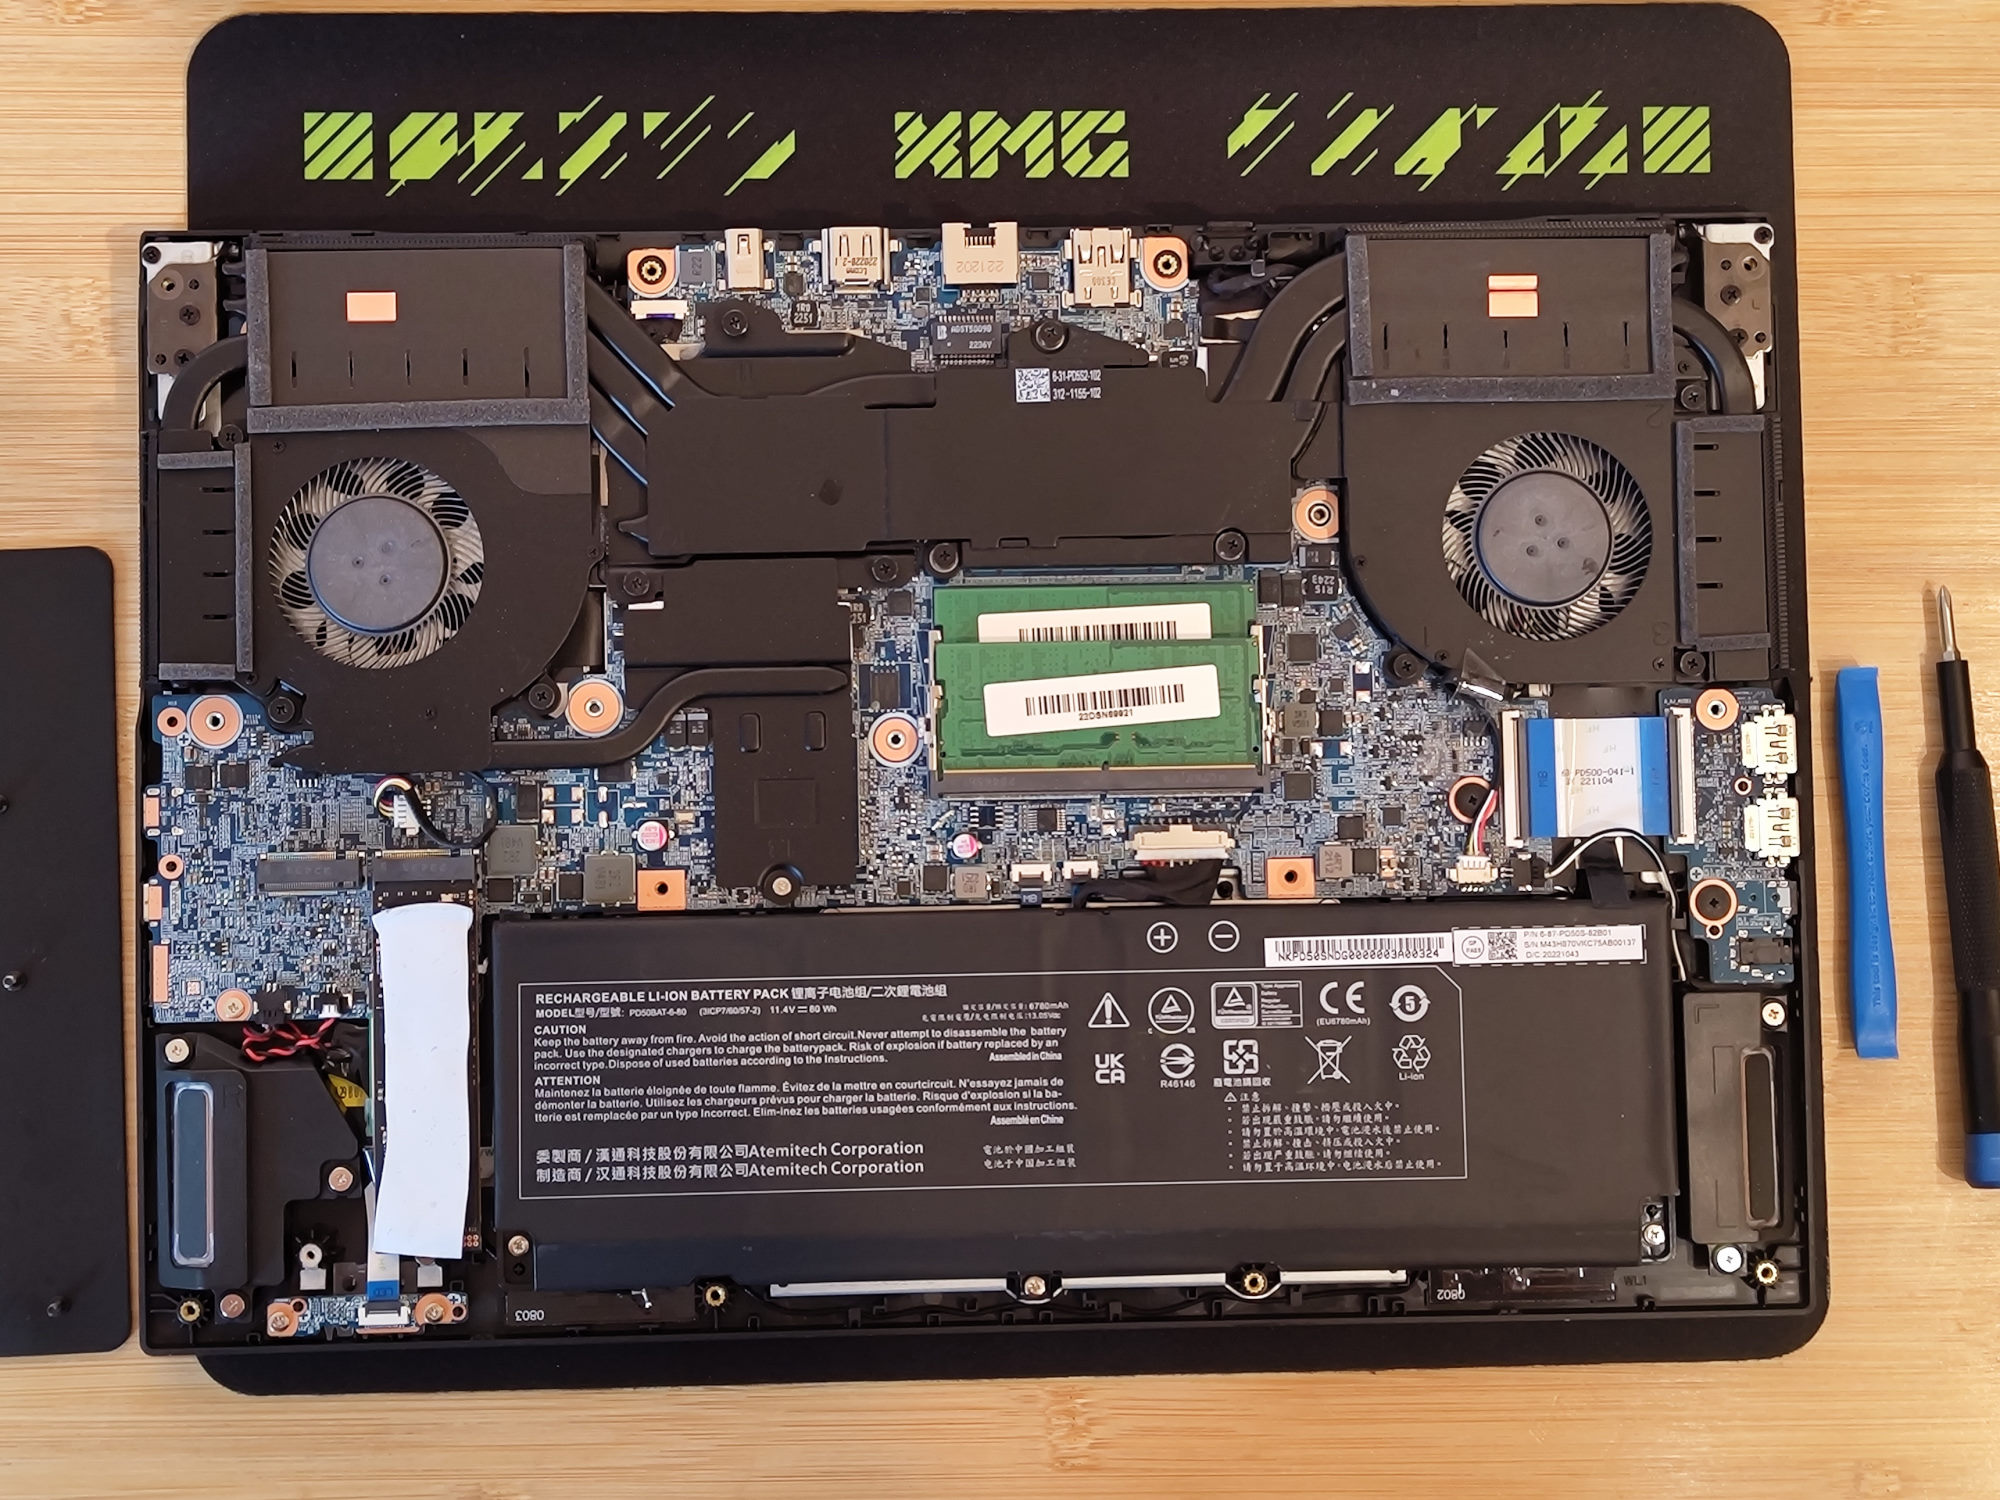
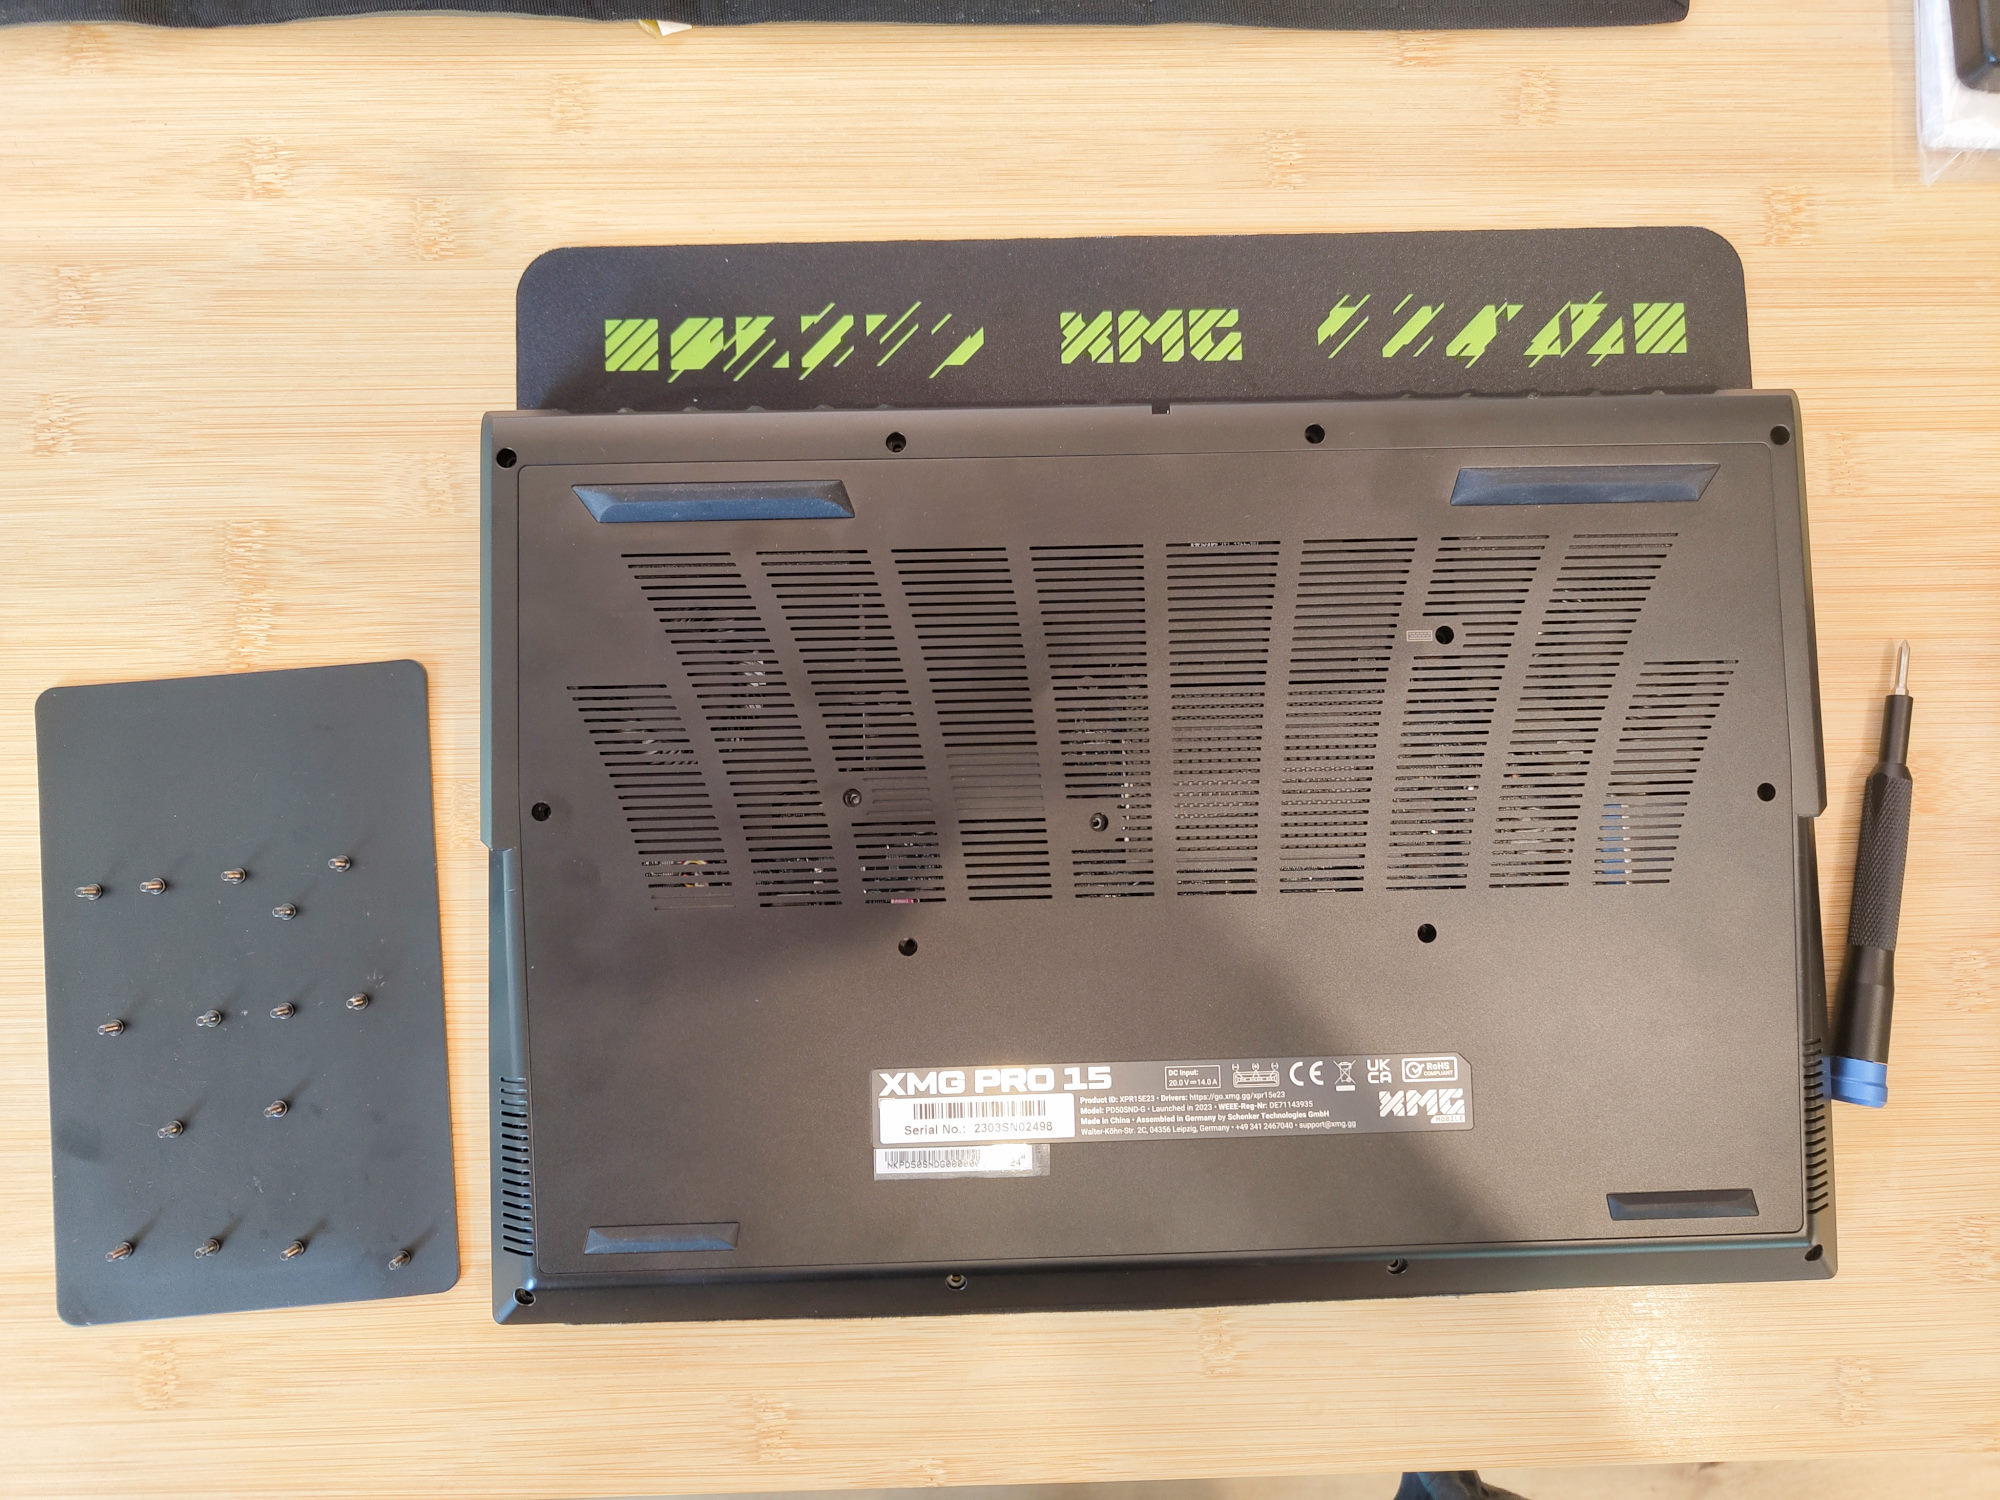
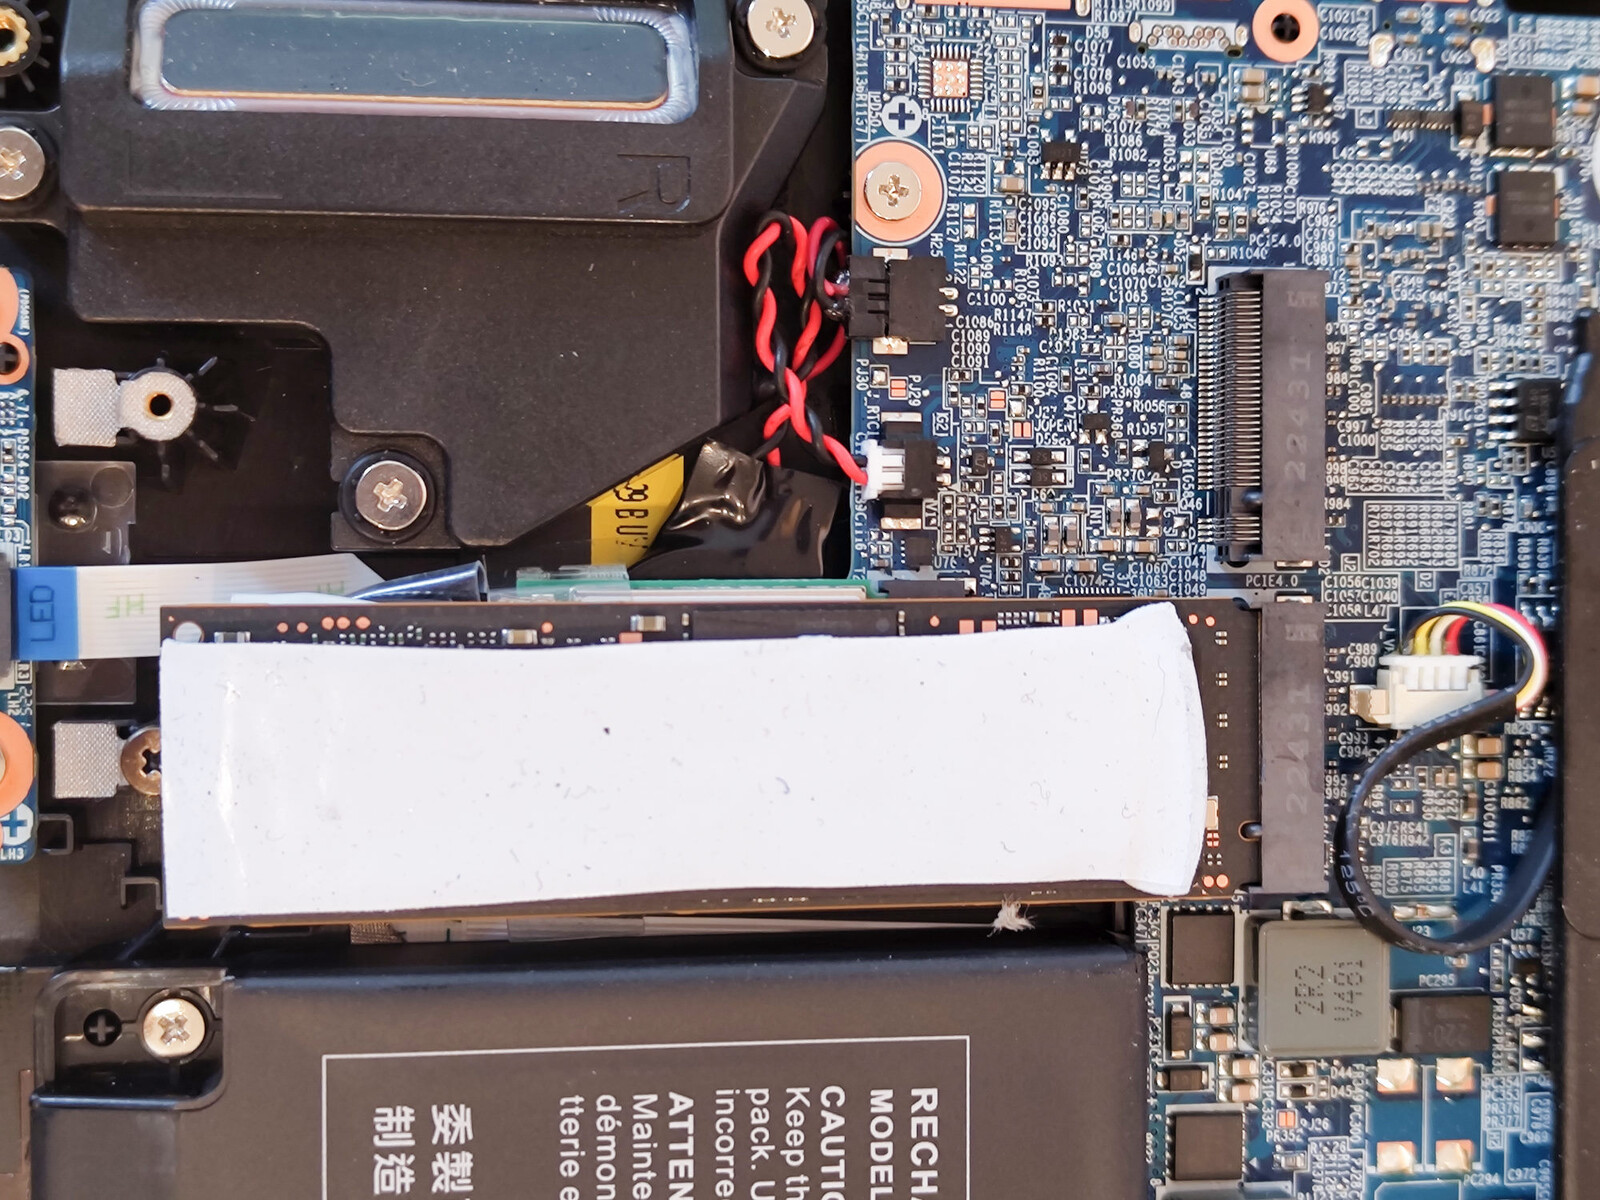
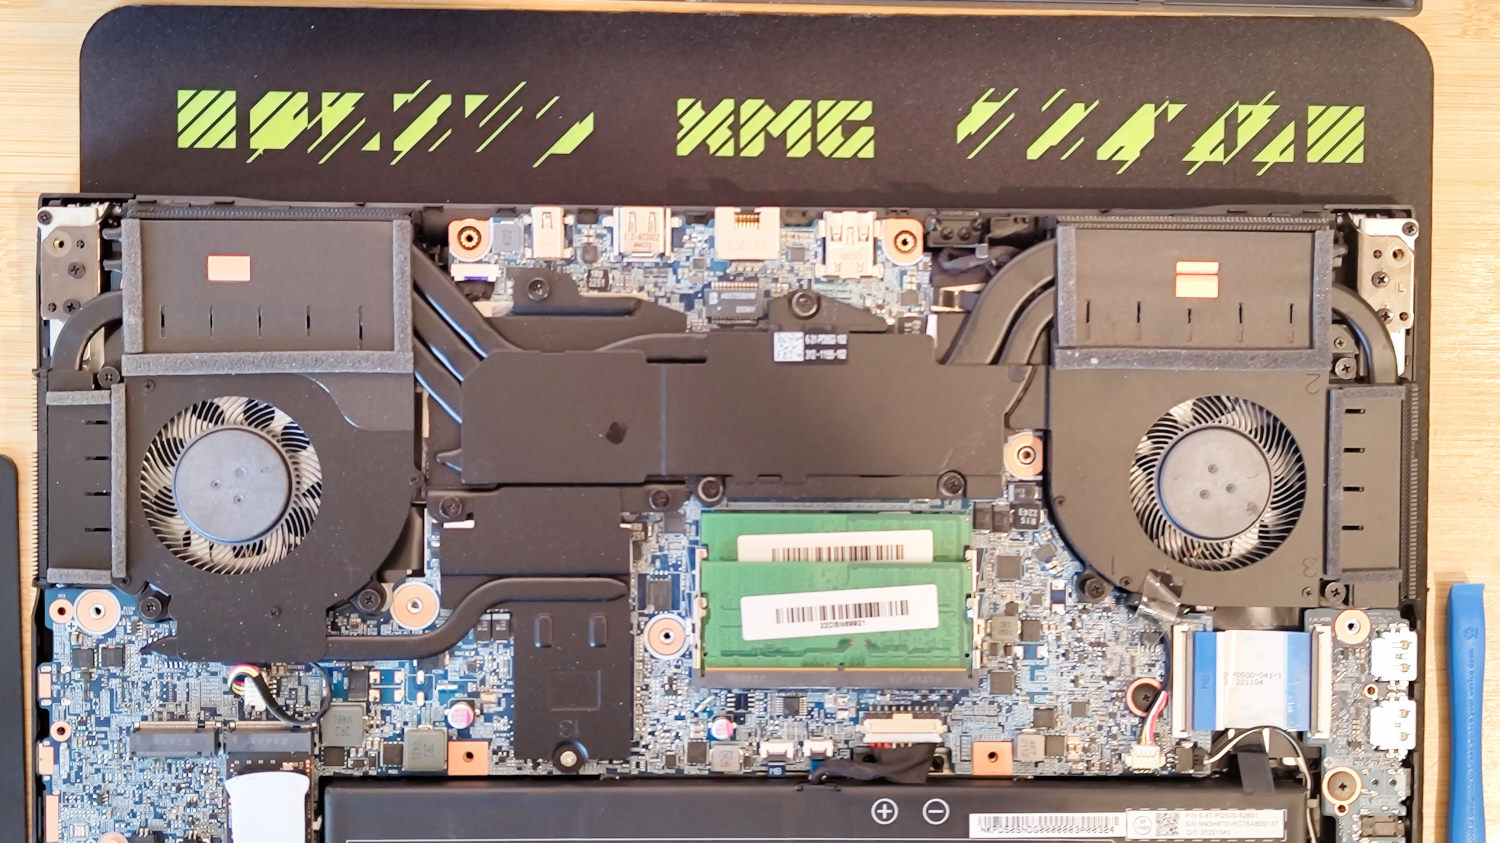
Hela 15 skruvar håller fast bottenlocket. När du skruvar loss dem kan du enkelt öppna locket framifrån med hjälp av ett öppningsverktyg i plast. Under den hittar du utbytbart RAM-minne och en ledig M.2-plats för en extra SSD. Lämplig termisk pad medföljer den bärbara datorn, liksom en CD med drivrutiner, ett USB-minne med samma innehåll, en stor musmatta och en flasköppnare.
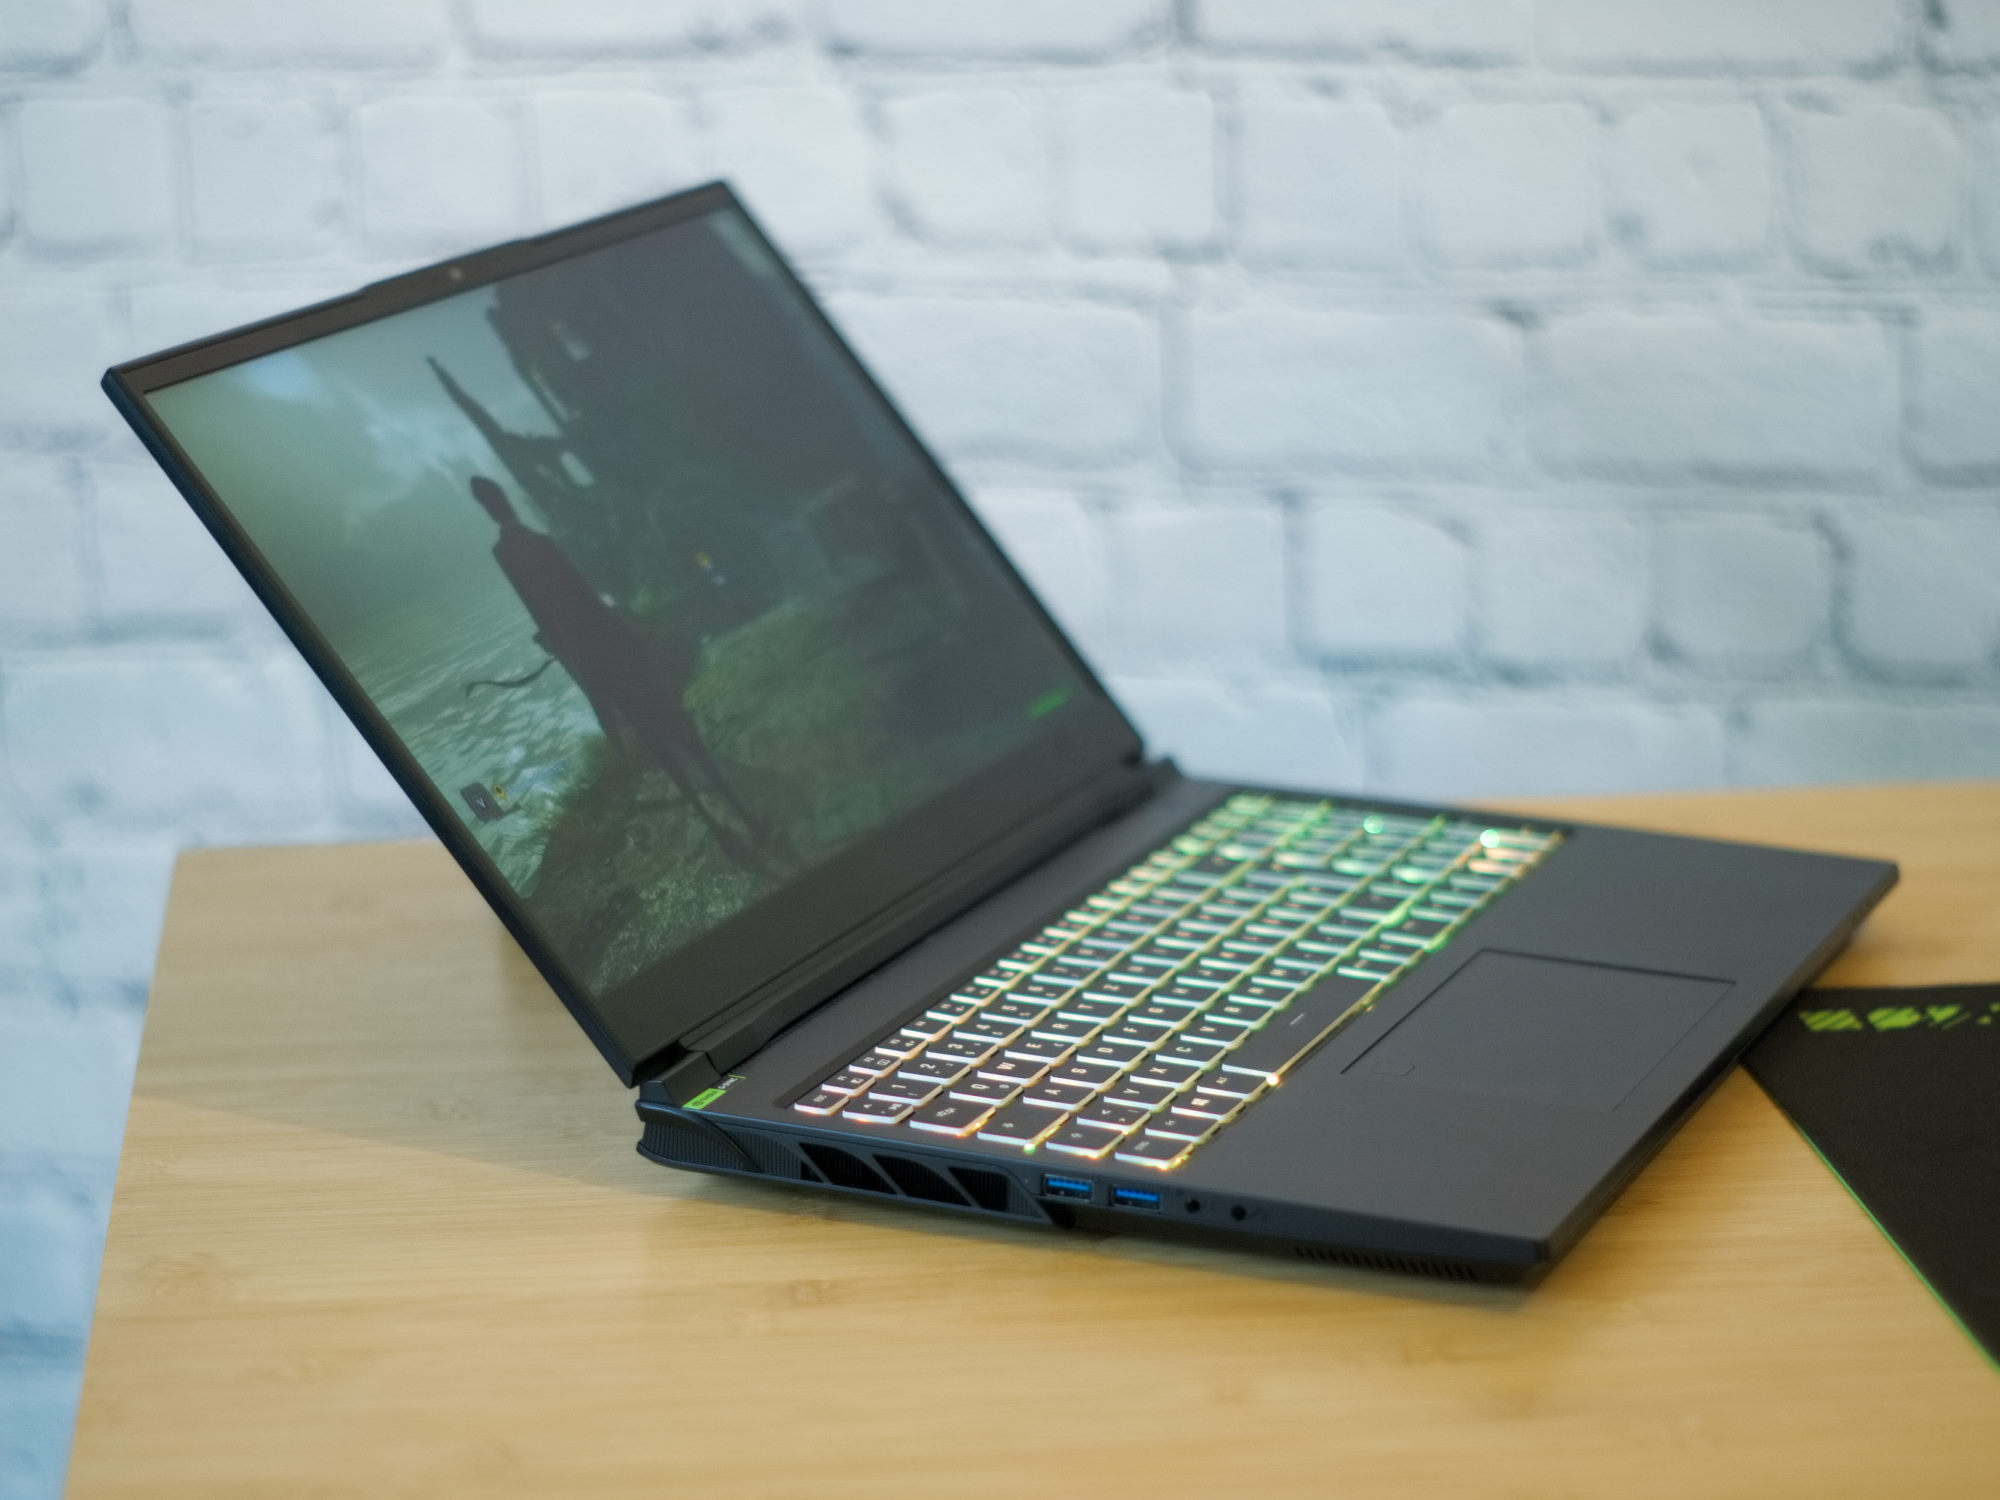
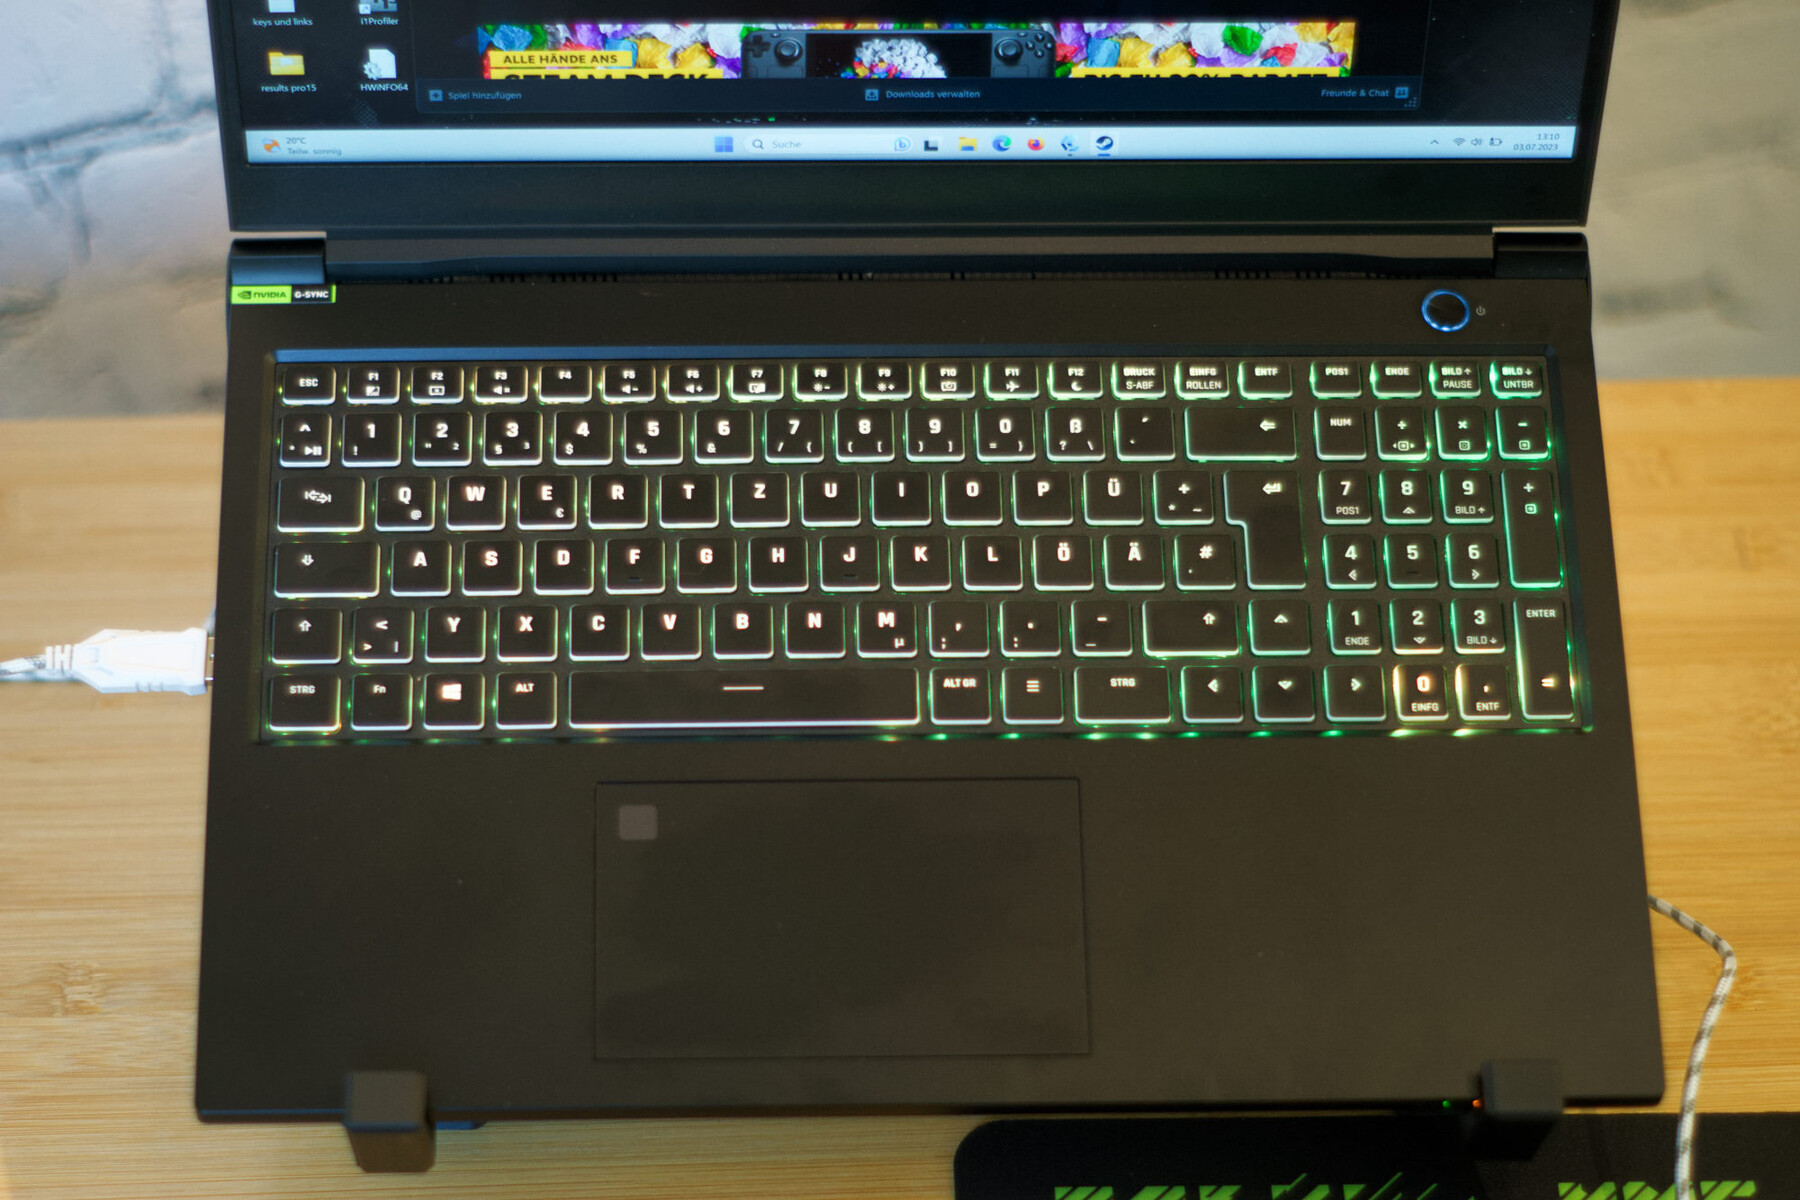
Inmatningsenheter - Ett fullstort RGB-tangentbord
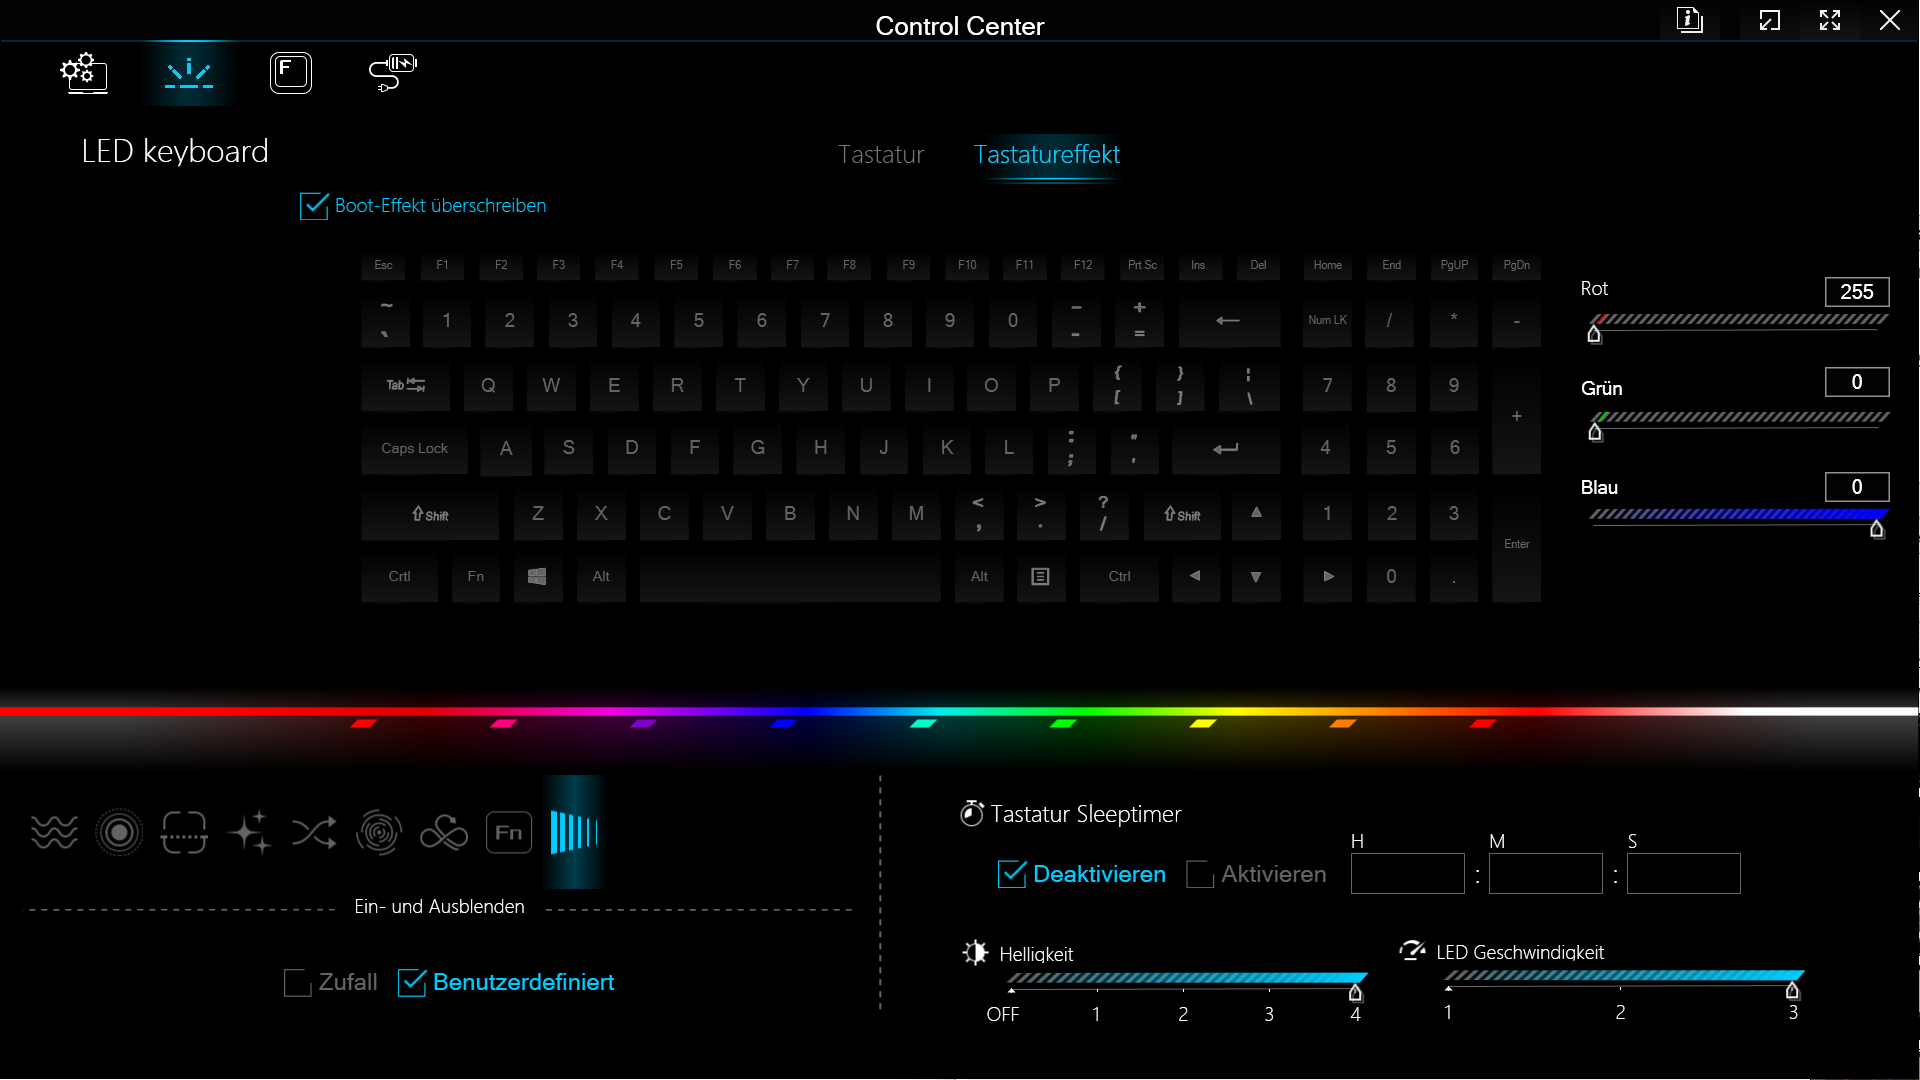
XMG Pro 15 har en 12 × 7 cm stor klickplatta med fingeravtrycksläsare och ett tangentbord i full storlek med numerisk knappsats som inmatningsenheter. Båda har behaglig haptik och en påtaglig tryckpunkt. När det gäller tangentbordet är tangentvägen cirka 1,5 mm. Alla tangenter kan belysas individuellt med RGB-belysning.
Display - A 240 Hz QHD och DisplayP3
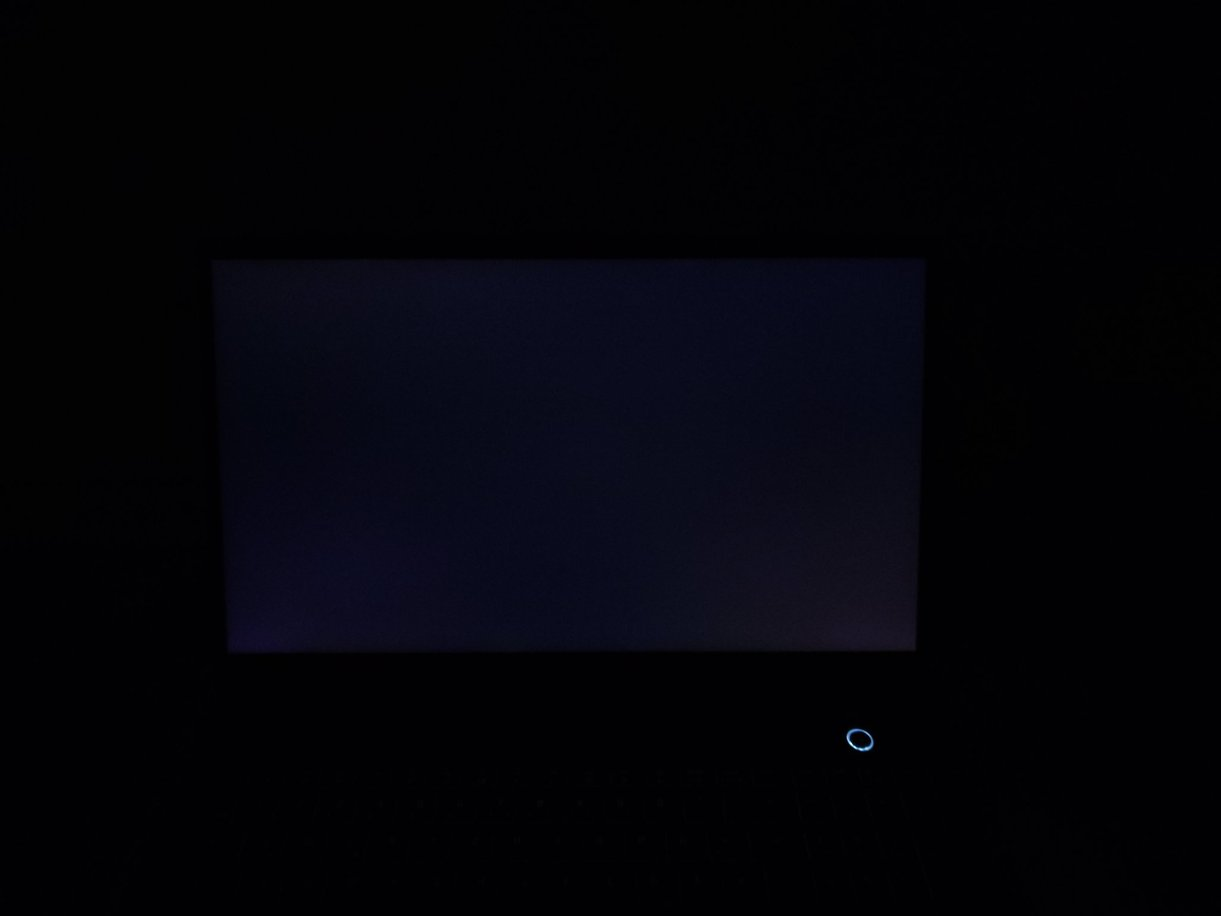
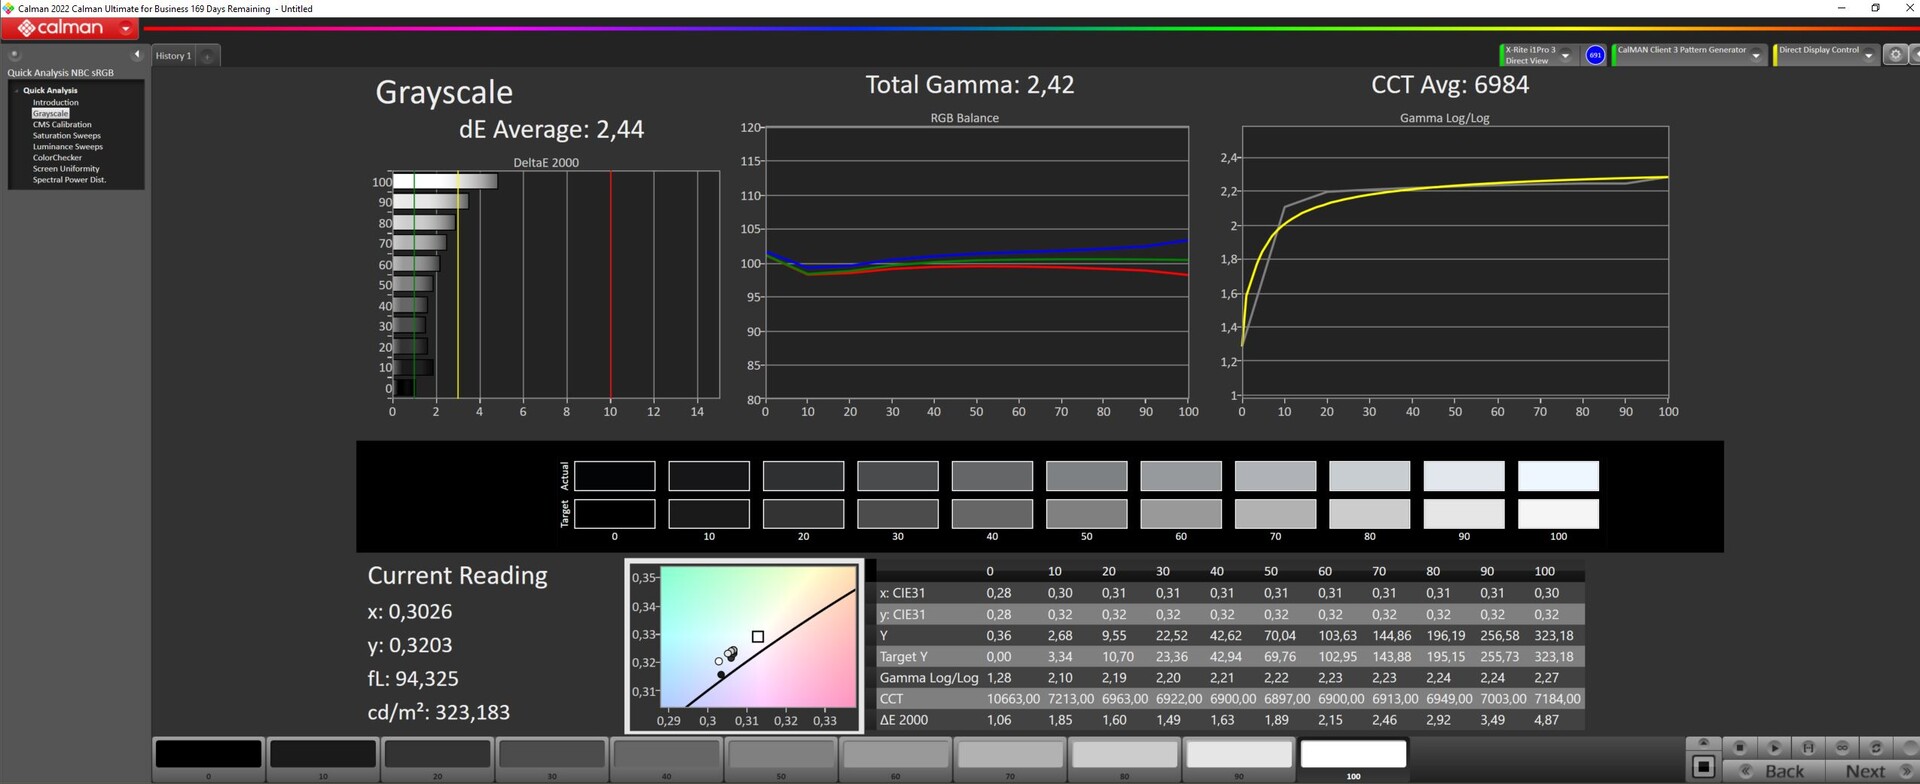
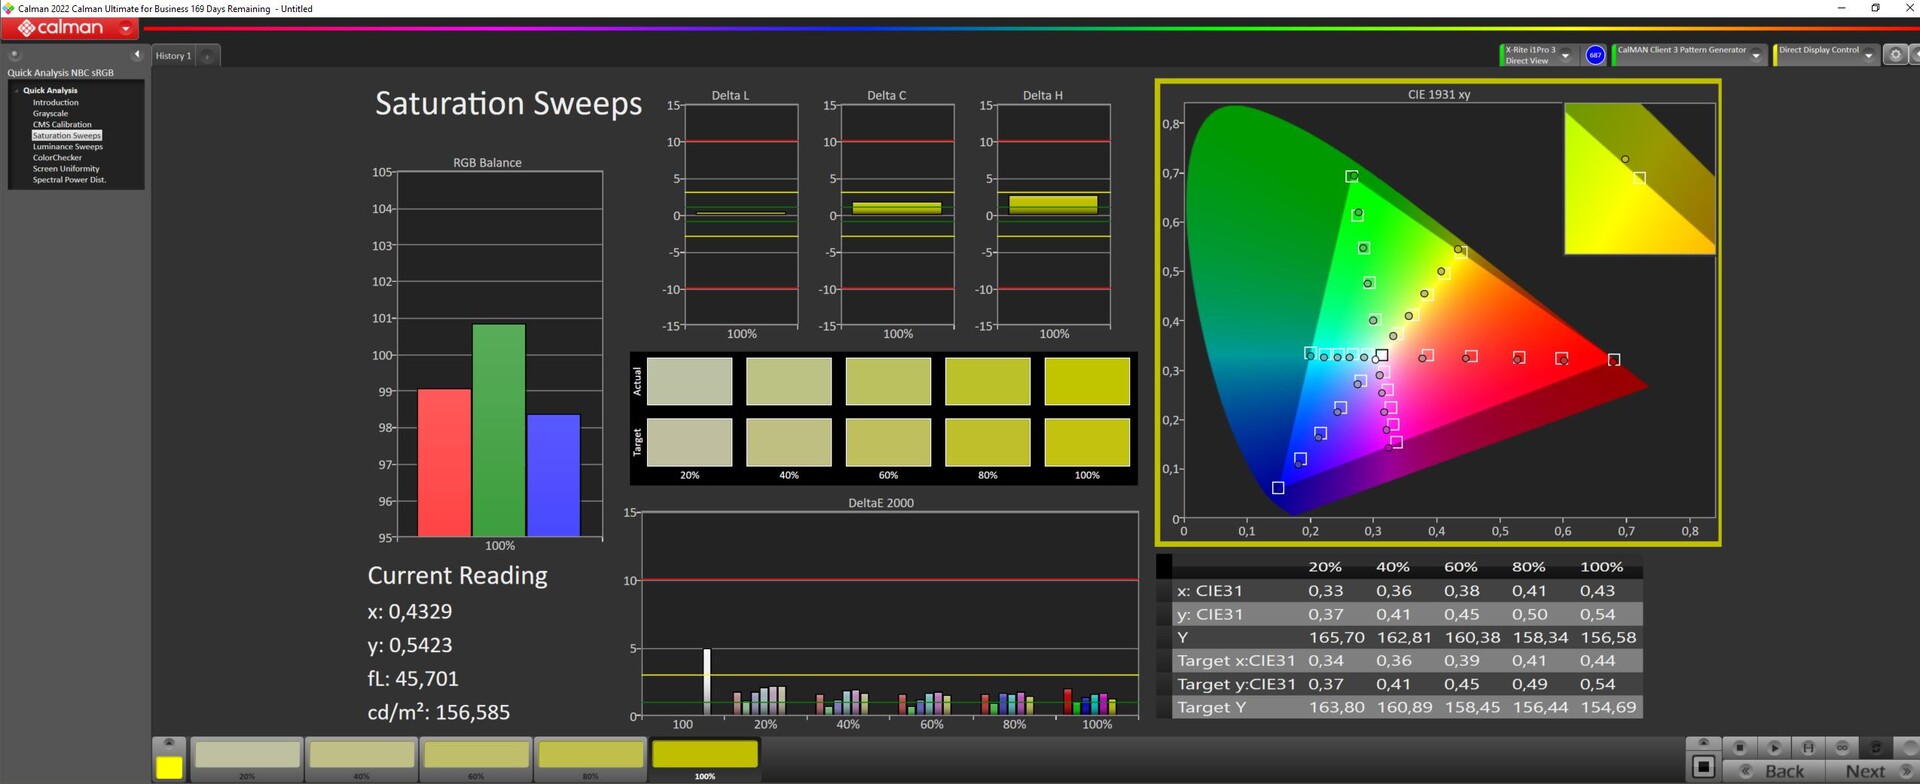
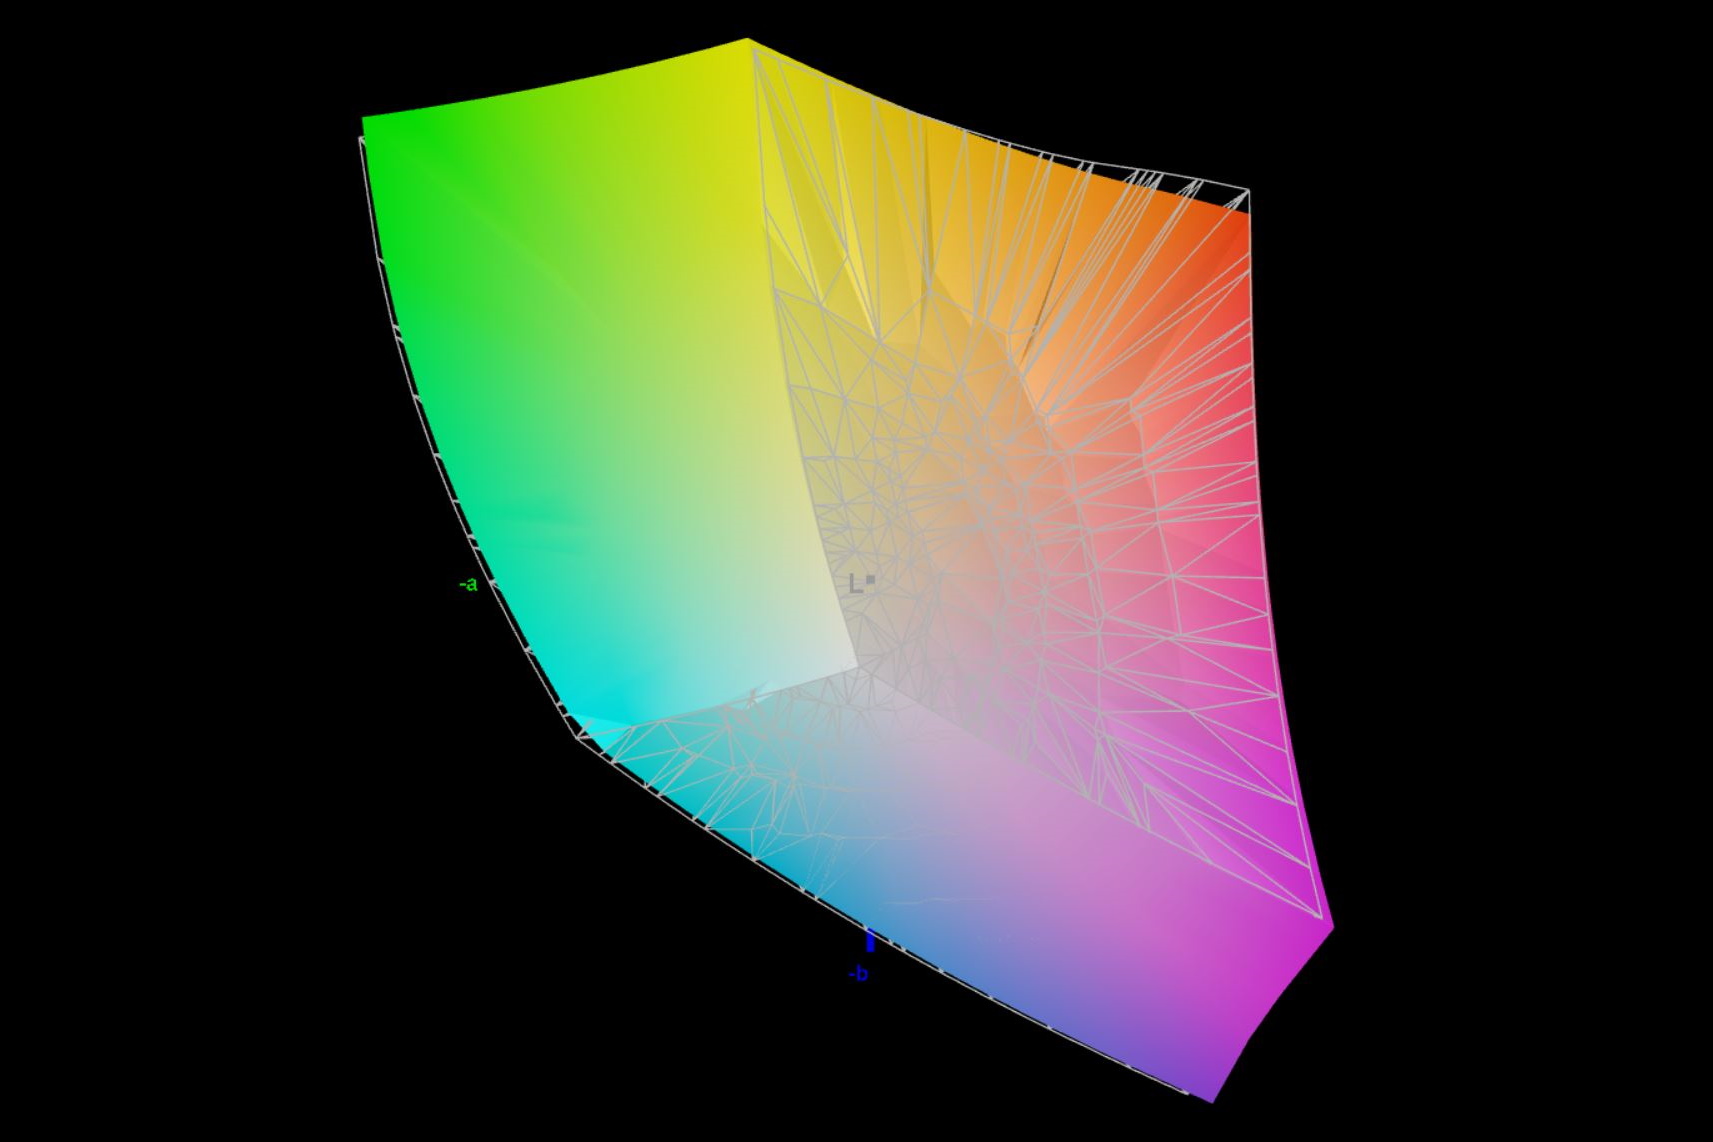
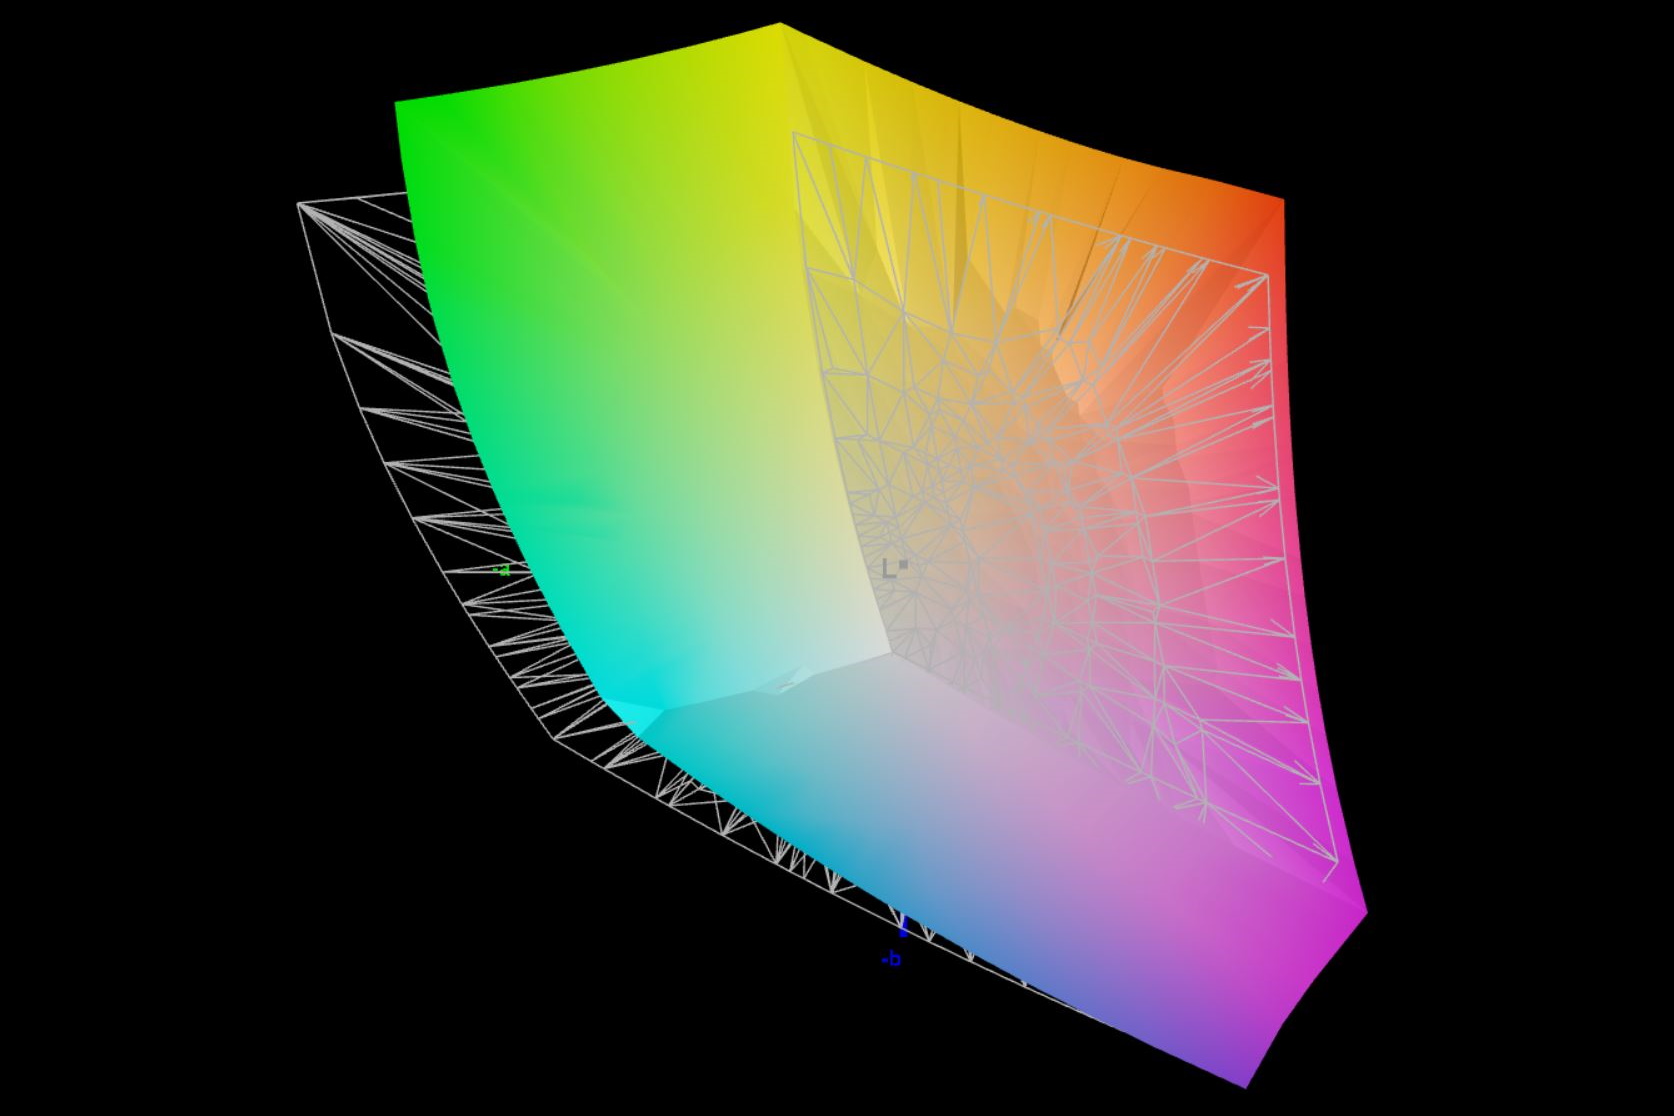
Även om det inte är en OLED, har XMG Pro 15 en bra G-Sync, IPS-skärm. Vid 240 Hz och 2 560 × 1 660 pixlar täcks färgrymderna sRGB och DisplayP3 nästan helt. Vid full ljusstyrka är det dock något märkbart att 300 cd/m²-skärmen är upplyst betydligt mer i mitten av skärmen än i kanterna. Men till skillnad från föregångaren manifesterar sig detta inte i tydligt synlig skärmblödning.
I jämförelse med förra generationens modell är skärmens svarstider i stort sett oförändrade. Bildfrekvensen har uppgraderats från 165 Hz till 240 Hz. Vi upptäckte inte något skärmflimmer.
| |||||||||||||||||||||||||
Distribution av ljusstyrkan: 85 %
Kontrast: 894:1 (Svärta: 0.36 cd/m²)
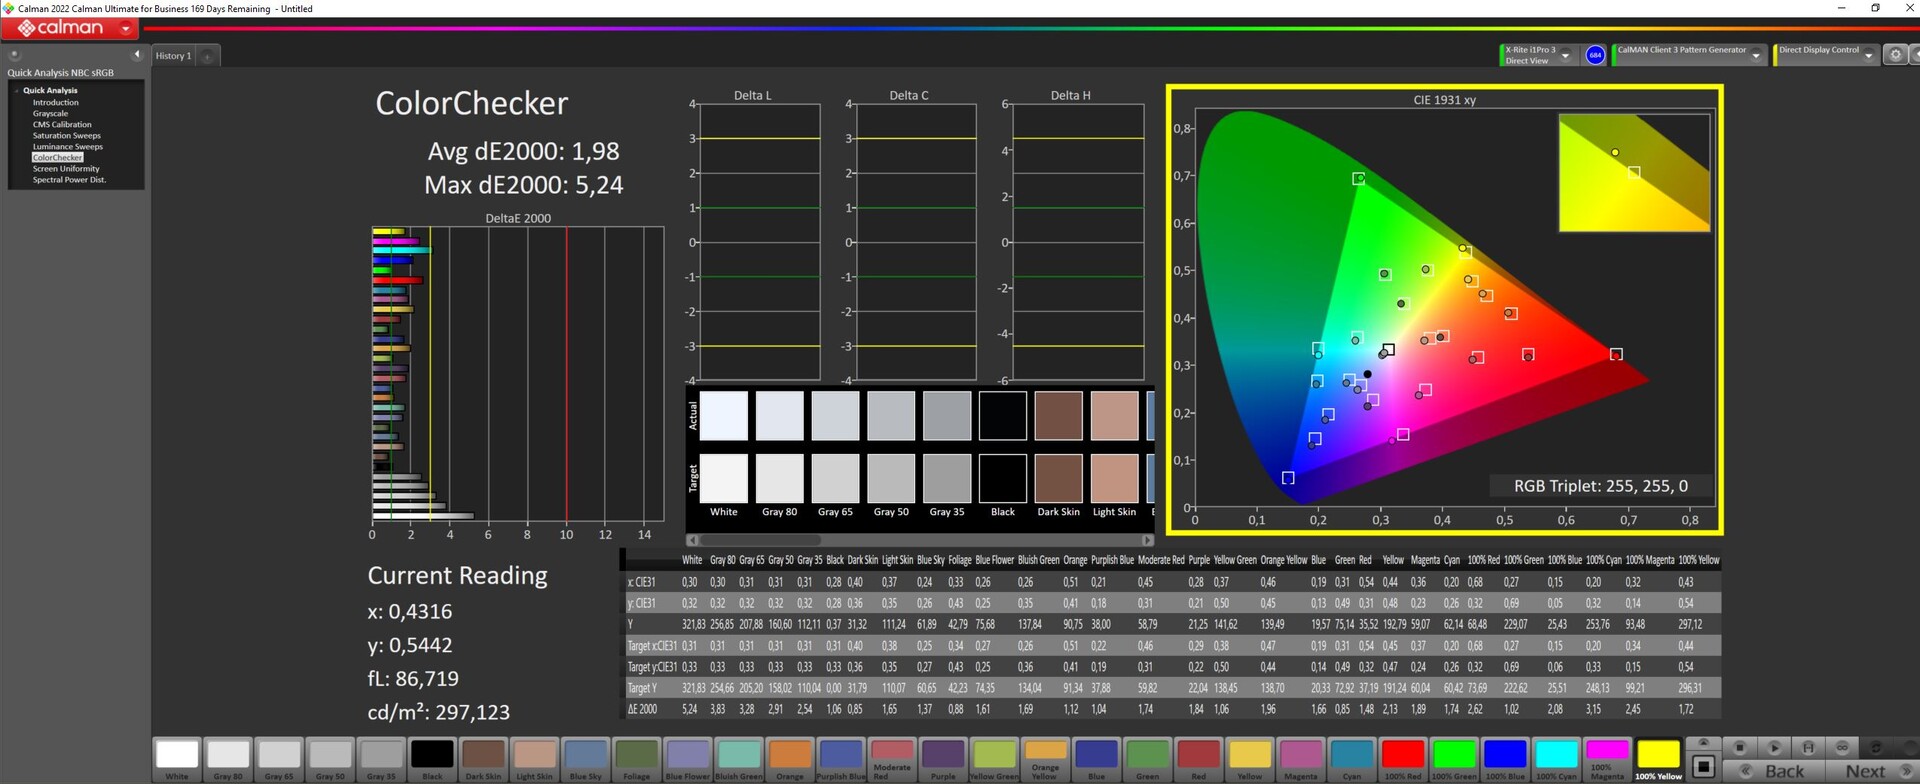
ΔE ColorChecker Calman: 1.98 | ∀{0.5-29.43 Ø4.71}
calibrated: 1.98
ΔE Greyscale Calman: 2.44 | ∀{0.09-98 Ø4.96}
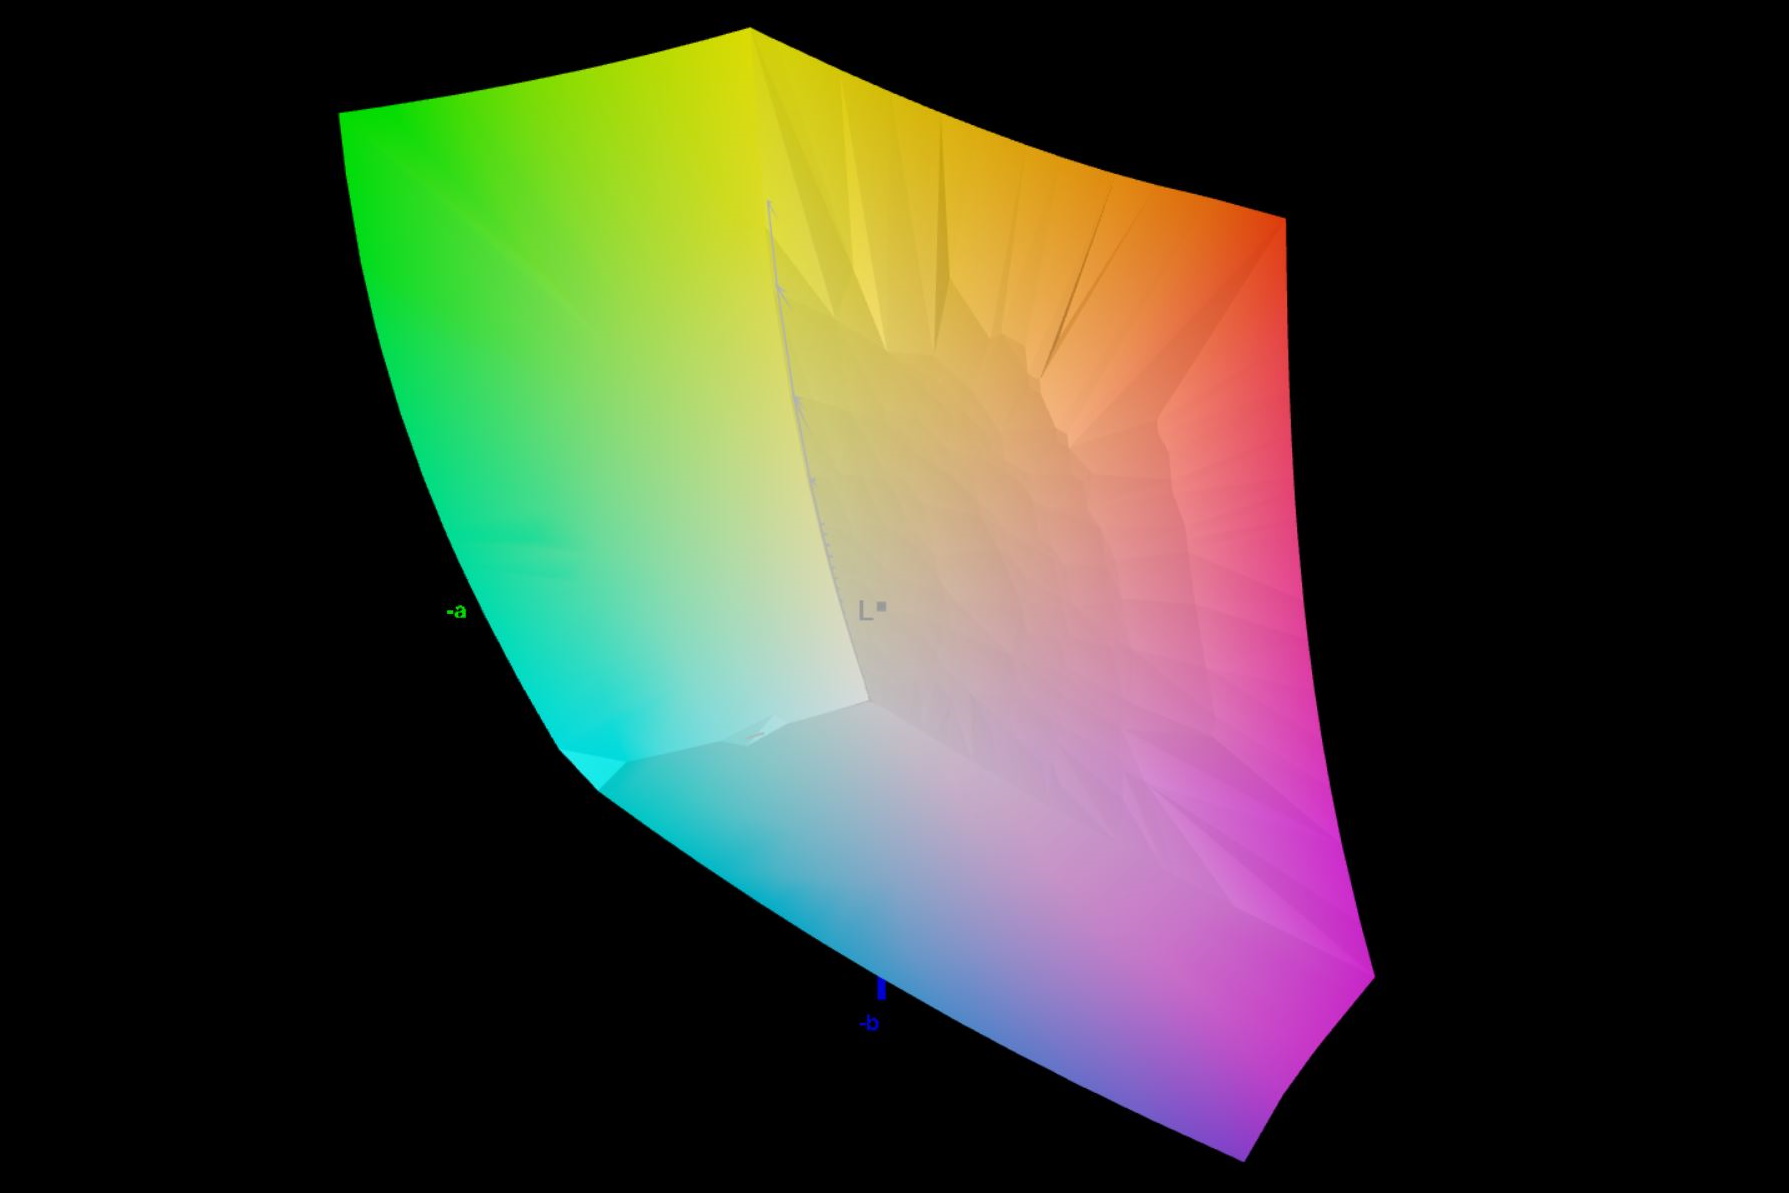
85.4% AdobeRGB 1998 (Argyll 3D)
99.9% sRGB (Argyll 3D)
97.8% Display P3 (Argyll 3D)
Gamma: 2.42
CCT: 6984 K
| Schenker XMG Pro 15 (E23) BOE0AD1, IPS, 2560x1440, 15.6" | Schenker XMG Pro 15 (i7-12700H, RTX 3080 Ti) BOE09C2 (BOE CQ NE156QHM-NY1), IPS, 2560x1440, 15.6" | Dell G15 5530 AUO B156HAN, IPS, 1920x1080, 15.6" | Aorus 15X ASF BOE CQ NE156QHM-NZ1, IPS, 2560x1440, 15.6" | MSI Cyborg 15 A12VF AU Optronics B156HAN15.1, IPS, 1920x1080, 15.6" | Alienware x16 R1 BOE NE16NZ4, IPS, 2560x1600, 16" | |
|---|---|---|---|---|---|---|
| Display | 0% | -13% | -16% | -48% | 2% | |
| Display P3 Coverage (%) | 97.8 | 97.5 0% | 73.1 -25% | 69.3 -29% | 42.3 -57% | 99.2 1% |
| sRGB Coverage (%) | 99.9 | 99.9 0% | 98.4 -2% | 98.2 -2% | 62.6 -37% | 100 0% |
| AdobeRGB 1998 Coverage (%) | 85.4 | 85.2 0% | 74.4 -13% | 70.5 -17% | 43.7 -49% | 88.6 4% |
| Response Times | 7% | 60% | 7% | -52% | 29% | |
| Response Time Grey 50% / Grey 80% * (ms) | 14 ? | 13.2 ? 6% | 3.39 ? 76% | 12.4 ? 11% | 22 ? -57% | 5.1 ? 64% |
| Response Time Black / White * (ms) | 9.6 ? | 8.8 ? 8% | 5.35 ? 44% | 9.4 ? 2% | 14 ? -46% | 10.3 ? -7% |
| PWM Frequency (Hz) | 21620 ? | |||||
| Screen | -33% | -25% | 24% | -22% | 14% | |
| Brightness middle (cd/m²) | 322 | 317 -2% | 320 -1% | 316 -2% | 247 -23% | 302.2 -6% |
| Brightness (cd/m²) | 301 | 294 -2% | 316 5% | 301 0% | 234 -22% | 285 -5% |
| Brightness Distribution (%) | 85 | 83 -2% | 94 11% | 90 6% | 89 5% | 89 5% |
| Black Level * (cd/m²) | 0.36 | 0.32 11% | 0.21 42% | 0.28 22% | 0.25 31% | 0.26 28% |
| Contrast (:1) | 894 | 991 11% | 1524 70% | 1129 26% | 988 11% | 1162 30% |
| Colorchecker dE 2000 * | 1.98 | 4.22 -113% | 4.55 -130% | 1.54 22% | 3.78 -91% | 1.63 18% |
| Colorchecker dE 2000 max. * | 5.24 | 5.97 -14% | 9.83 -88% | 2.46 53% | 6.42 -23% | 4.13 21% |
| Colorchecker dE 2000 calibrated * | 1.98 | 4.09 -107% | 1.51 24% | 1.21 39% | 3.94 -99% | 1.17 41% |
| Greyscale dE 2000 * | 2.44 | 4.41 -81% | 6.2 -154% | 1.3 47% | 2.16 11% | 2.5 -2% |
| Gamma | 2.42 91% | 2.29 96% | 2.07 106% | 2.307 95% | 2.33 94% | 2.23 99% |
| CCT | 6984 93% | 6733 97% | 6479 100% | 6456 101% | 6906 94% | 6590 99% |
| Totalt genomsnitt (program/inställningar) | -9% /
-20% | 7% /
-10% | 5% /
13% | -41% /
-32% | 15% /
14% |
* ... mindre är bättre
Med färger och gråskalor i Calman ColorChecker, på ΔΕ 1,98 respektive ΔΕ 2,44, ligger XMG Pro 15 klart inom målområdet för ΔΕ < 3. Vår egen ICC-profil (ladda ner i informationsrutan) borde kunna minska den överbetonade blå färgen något och avsevärt förbättra både gråskalorna och färgåtergivningen. Tillsammans med den nästan helt täckta DisplayP3-färgrymden har vi att göra med en bildskärm som verkar vara lämplig för professionell videoredigering.
Visa svarstider
| ↔ Svarstid svart till vitt | ||
|---|---|---|
| 9.6 ms ... stiga ↗ och falla ↘ kombinerat | ↗ 4.2 ms stiga | 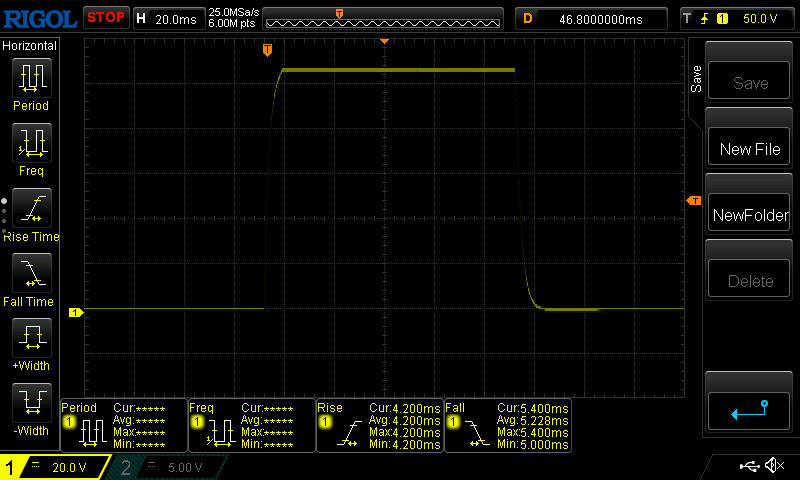 |
| ↘ 5.4 ms hösten | ||
| Skärmen visar snabba svarsfrekvenser i våra tester och bör passa för spel. I jämförelse sträcker sig alla testade enheter från 0.1 (minst) till 240 (maximalt) ms. » 26 % av alla enheter är bättre. Det betyder att den uppmätta svarstiden är bättre än genomsnittet av alla testade enheter (19.8 ms). | ||
| ↔ Svarstid 50 % grått till 80 % grått | ||
| 14 ms ... stiga ↗ och falla ↘ kombinerat | ↗ 6.6 ms stiga | 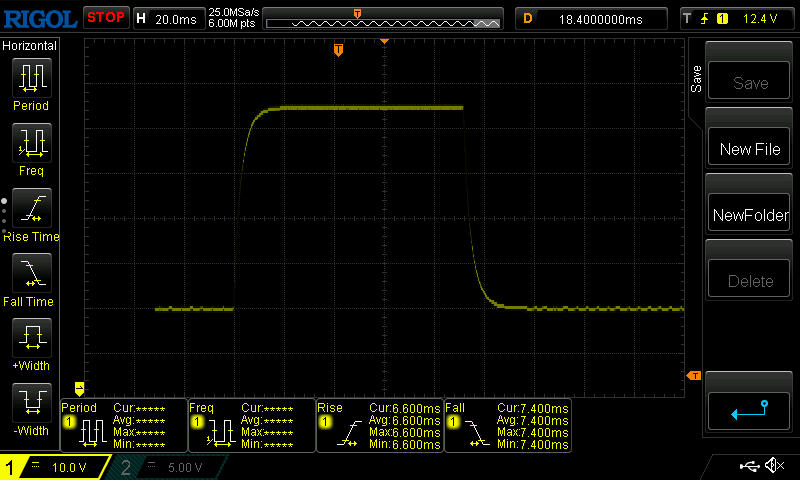 |
| ↘ 7.4 ms hösten | ||
| Skärmen visar bra svarsfrekvens i våra tester, men kan vara för långsam för konkurrenskraftiga spelare. I jämförelse sträcker sig alla testade enheter från 0.165 (minst) till 636 (maximalt) ms. » 28 % av alla enheter är bättre. Det betyder att den uppmätta svarstiden är bättre än genomsnittet av alla testade enheter (31 ms). | ||
Skärmflimmer / PWM (Puls-Width Modulation)
| Skärmflimmer / PWM upptäcktes inte |  | ||
Som jämförelse: 52 % av alla testade enheter använder inte PWM för att dämpa skärmen. Om PWM upptäcktes mättes ett medelvärde av 7757 (minst: 5 - maximum: 343500) Hz. | |||
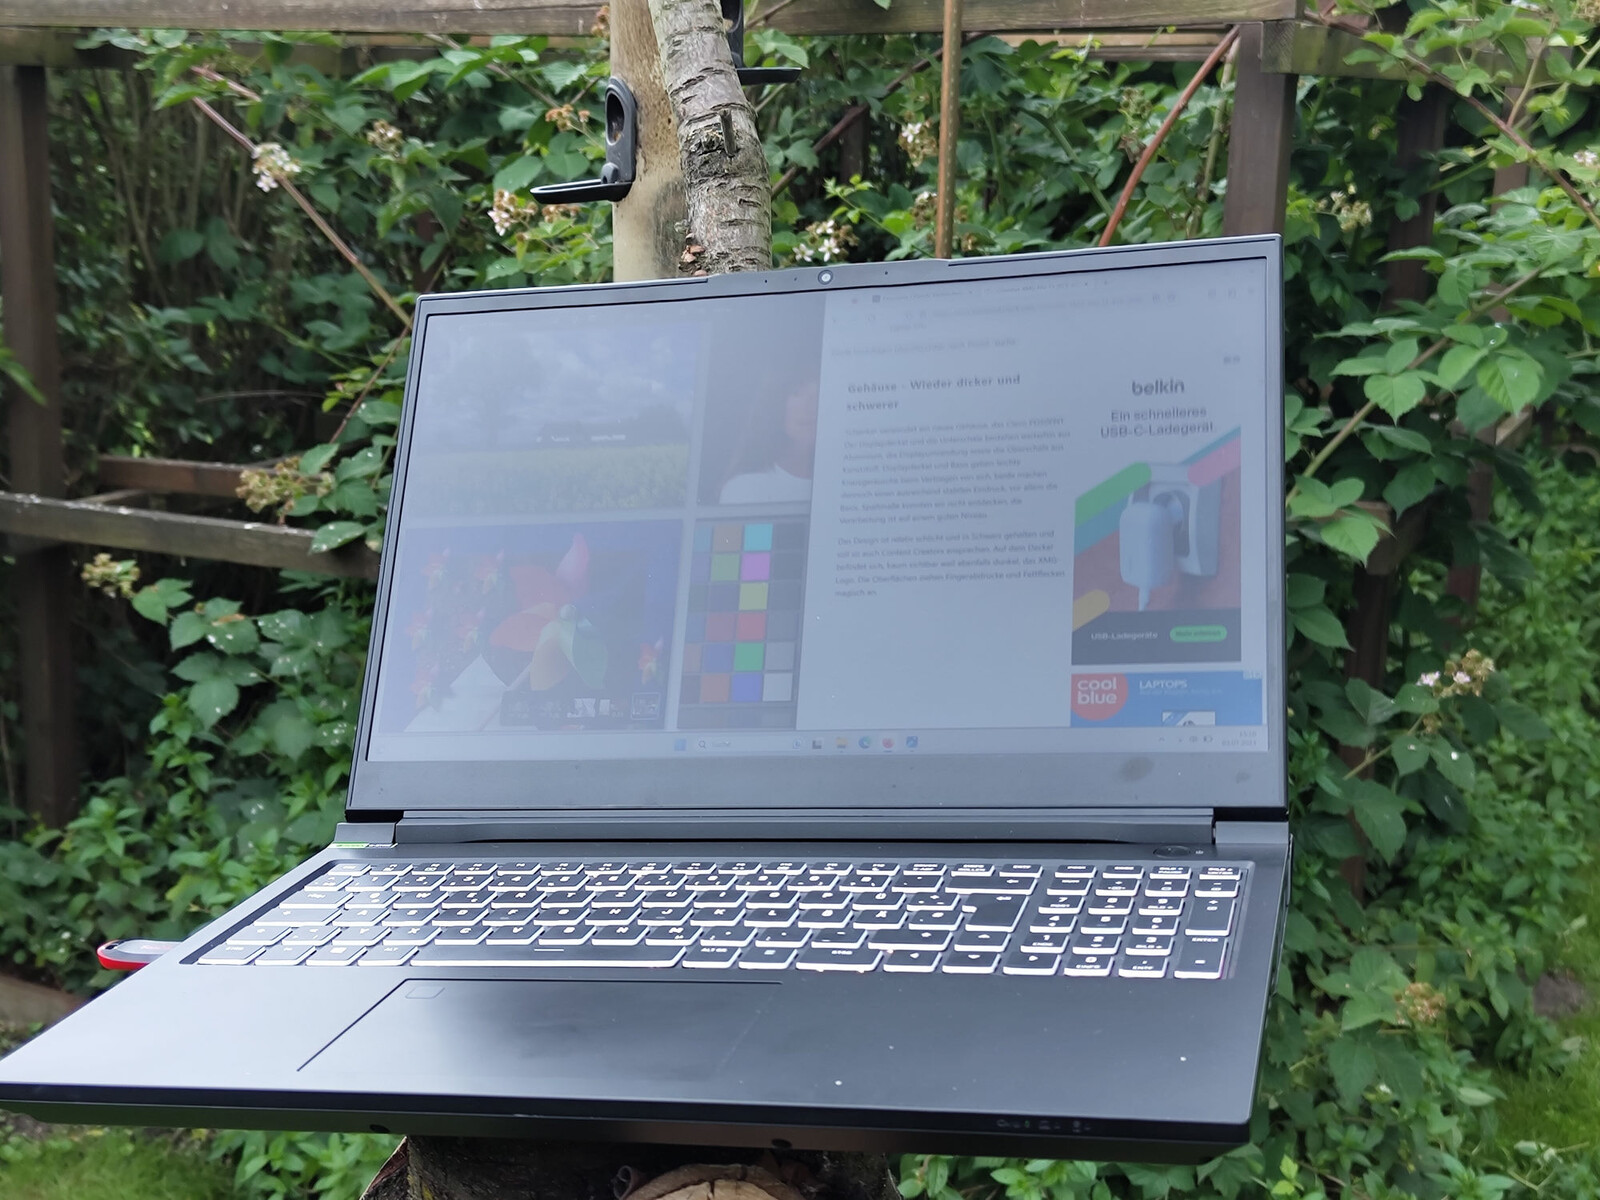
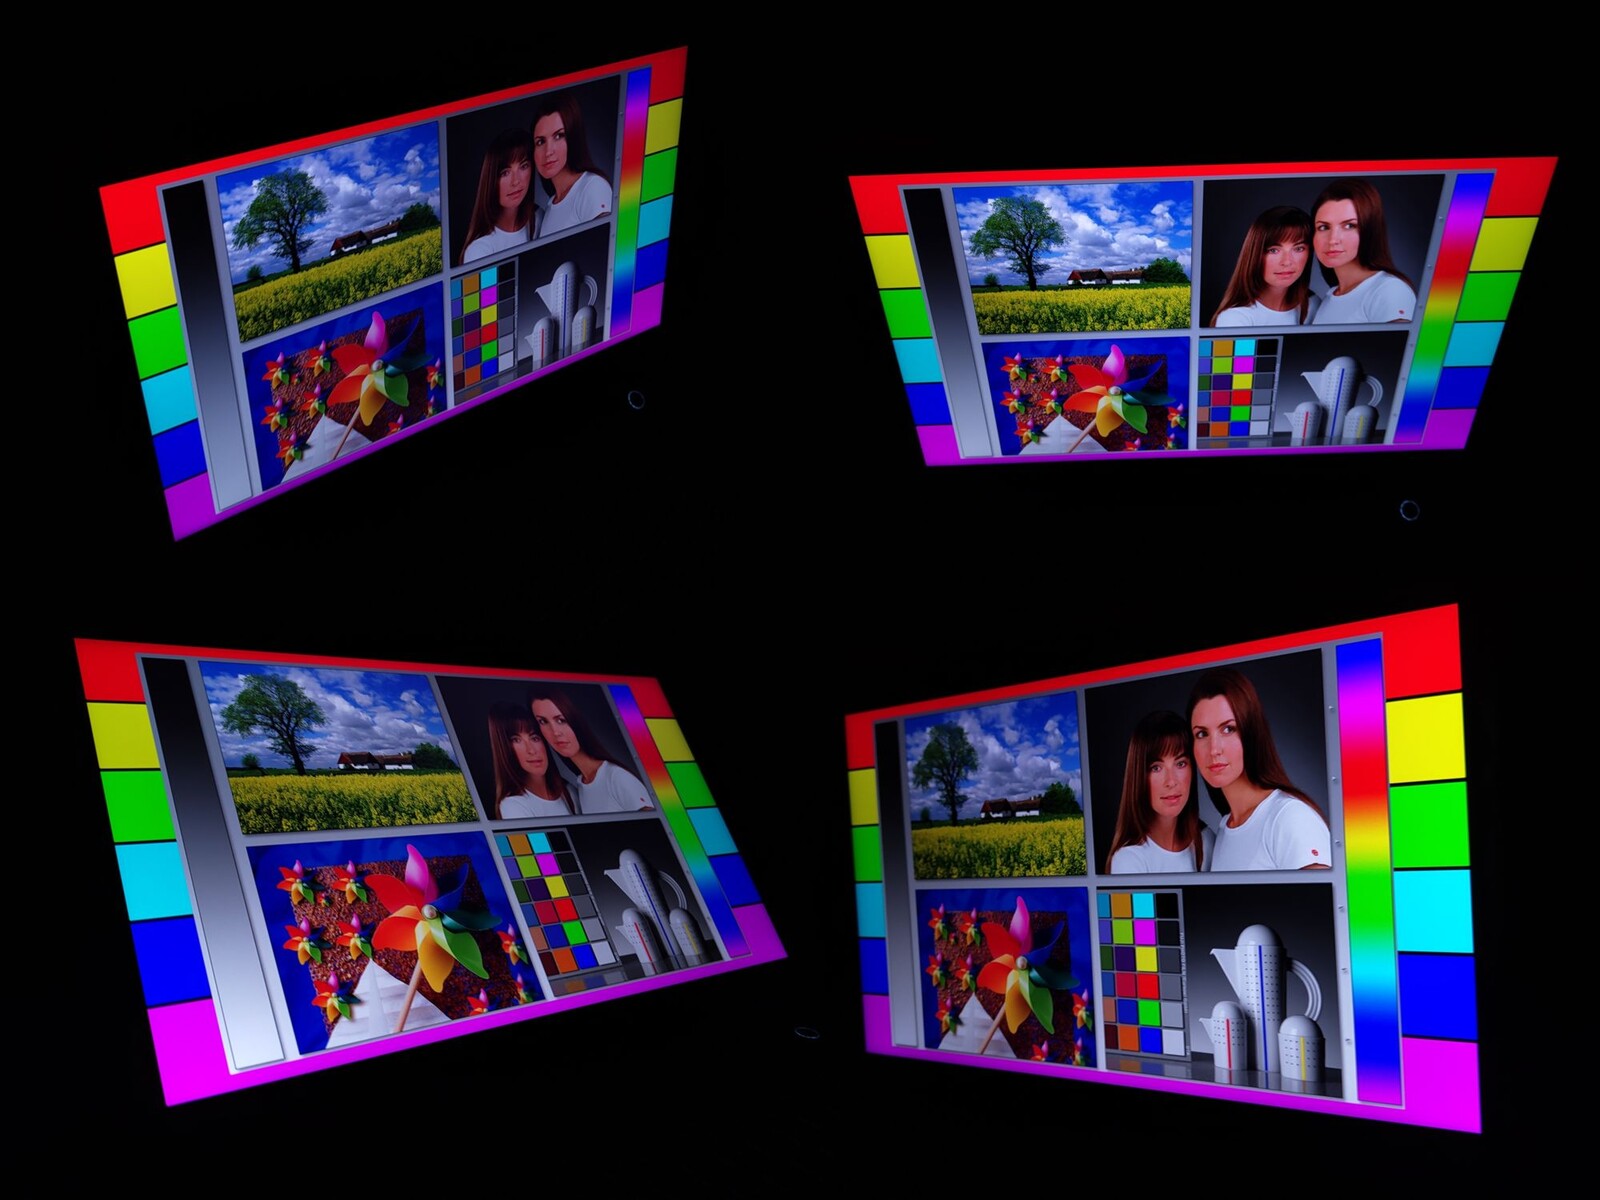
Det är också möjligt att använda 15-tumsdatorn utomhus, tack vare den matta och relativt ljusstarka skärmen. Beroende på platsen måste du välja lämplig betraktningsvinkel för att uppleva minsta möjliga mängd reflektioner. Lyckligtvis har IPS-panelen mycket stabila betraktningsvinklar.
Prestanda - Intel Core i9 och Nvidia GeForce RTX 4060 har uthållig kraft
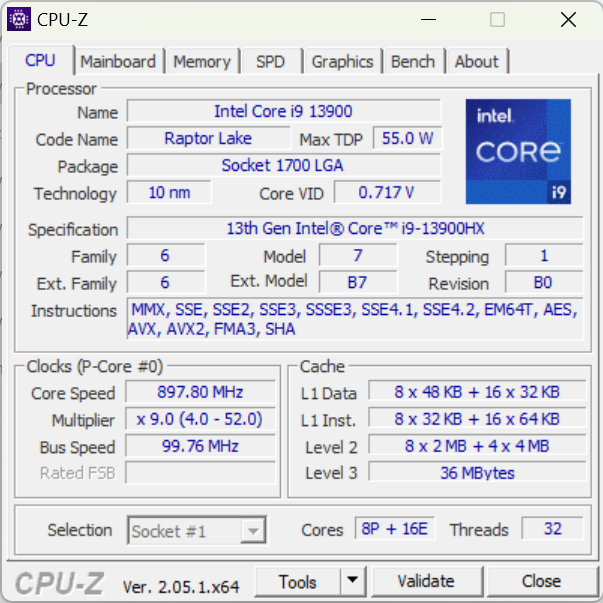
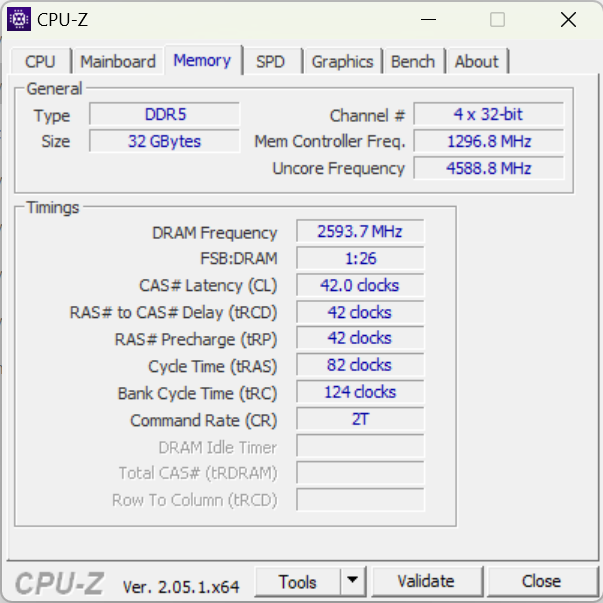
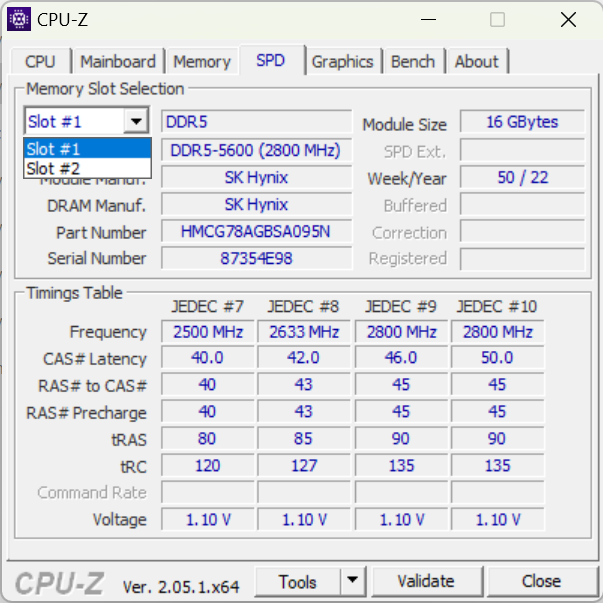
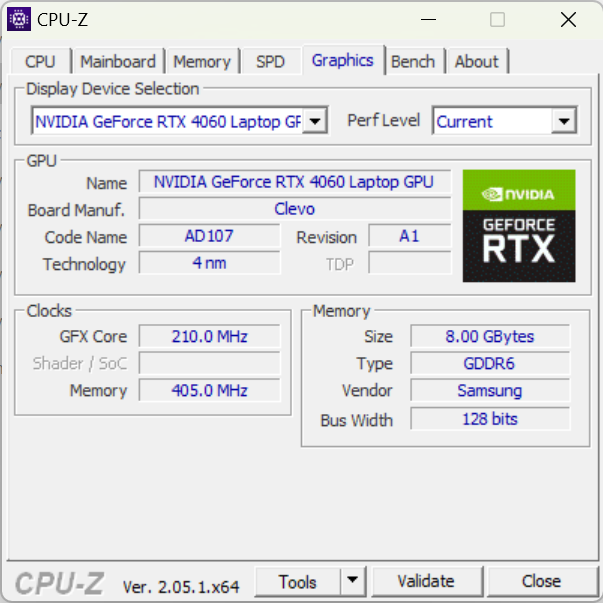
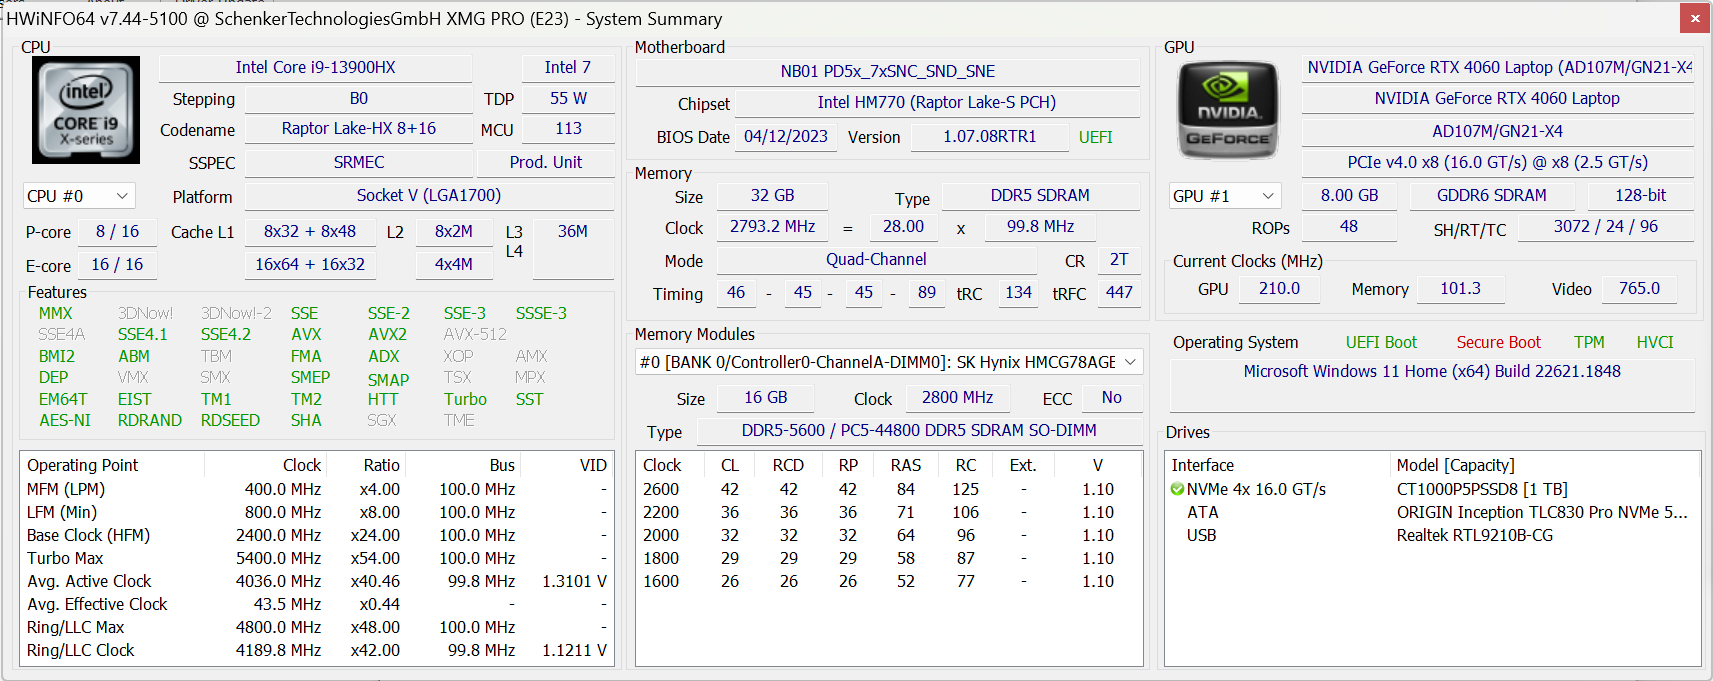
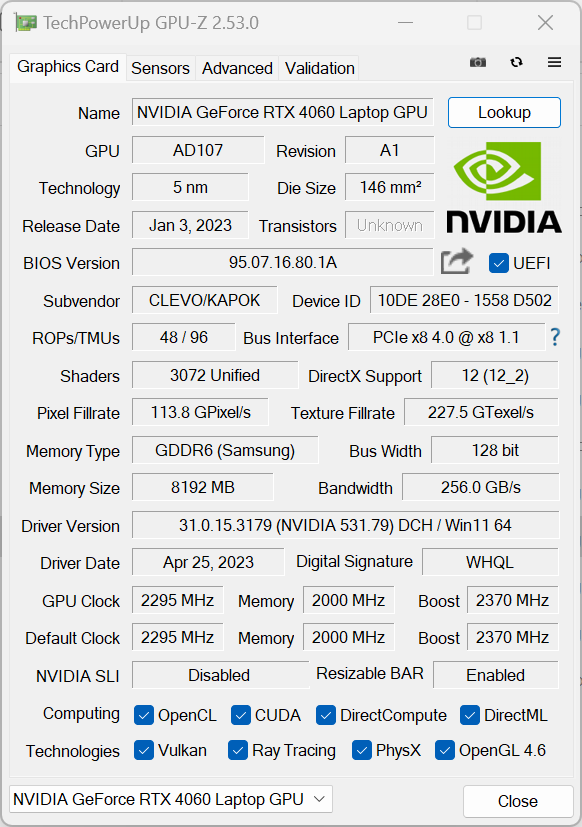
I vår testenhet används en kraftfullIntel Core i9-13900HX ochNvidia GeForce RTX 4060 ansvarar för tillräcklig kraft för att kunna hantera spel och de flesta kreativa uppgifter. Den bärbara datorn kan konfigureras med 8 till 64 GB DDR5 RAM-minne. Vårt recensionsexemplar är utrustat med 32 GB. Typiskt för Schenker kan man välja mellan många olika alternativ som en del av Bestwares beställningsprocess. Förutom RTX 4060 är en RTX 4070 också konfigurerbar. När det gäller SSD-enheter och WiFi-alternativ finns också ett brett urval tillgängligt.
Testförhållanden
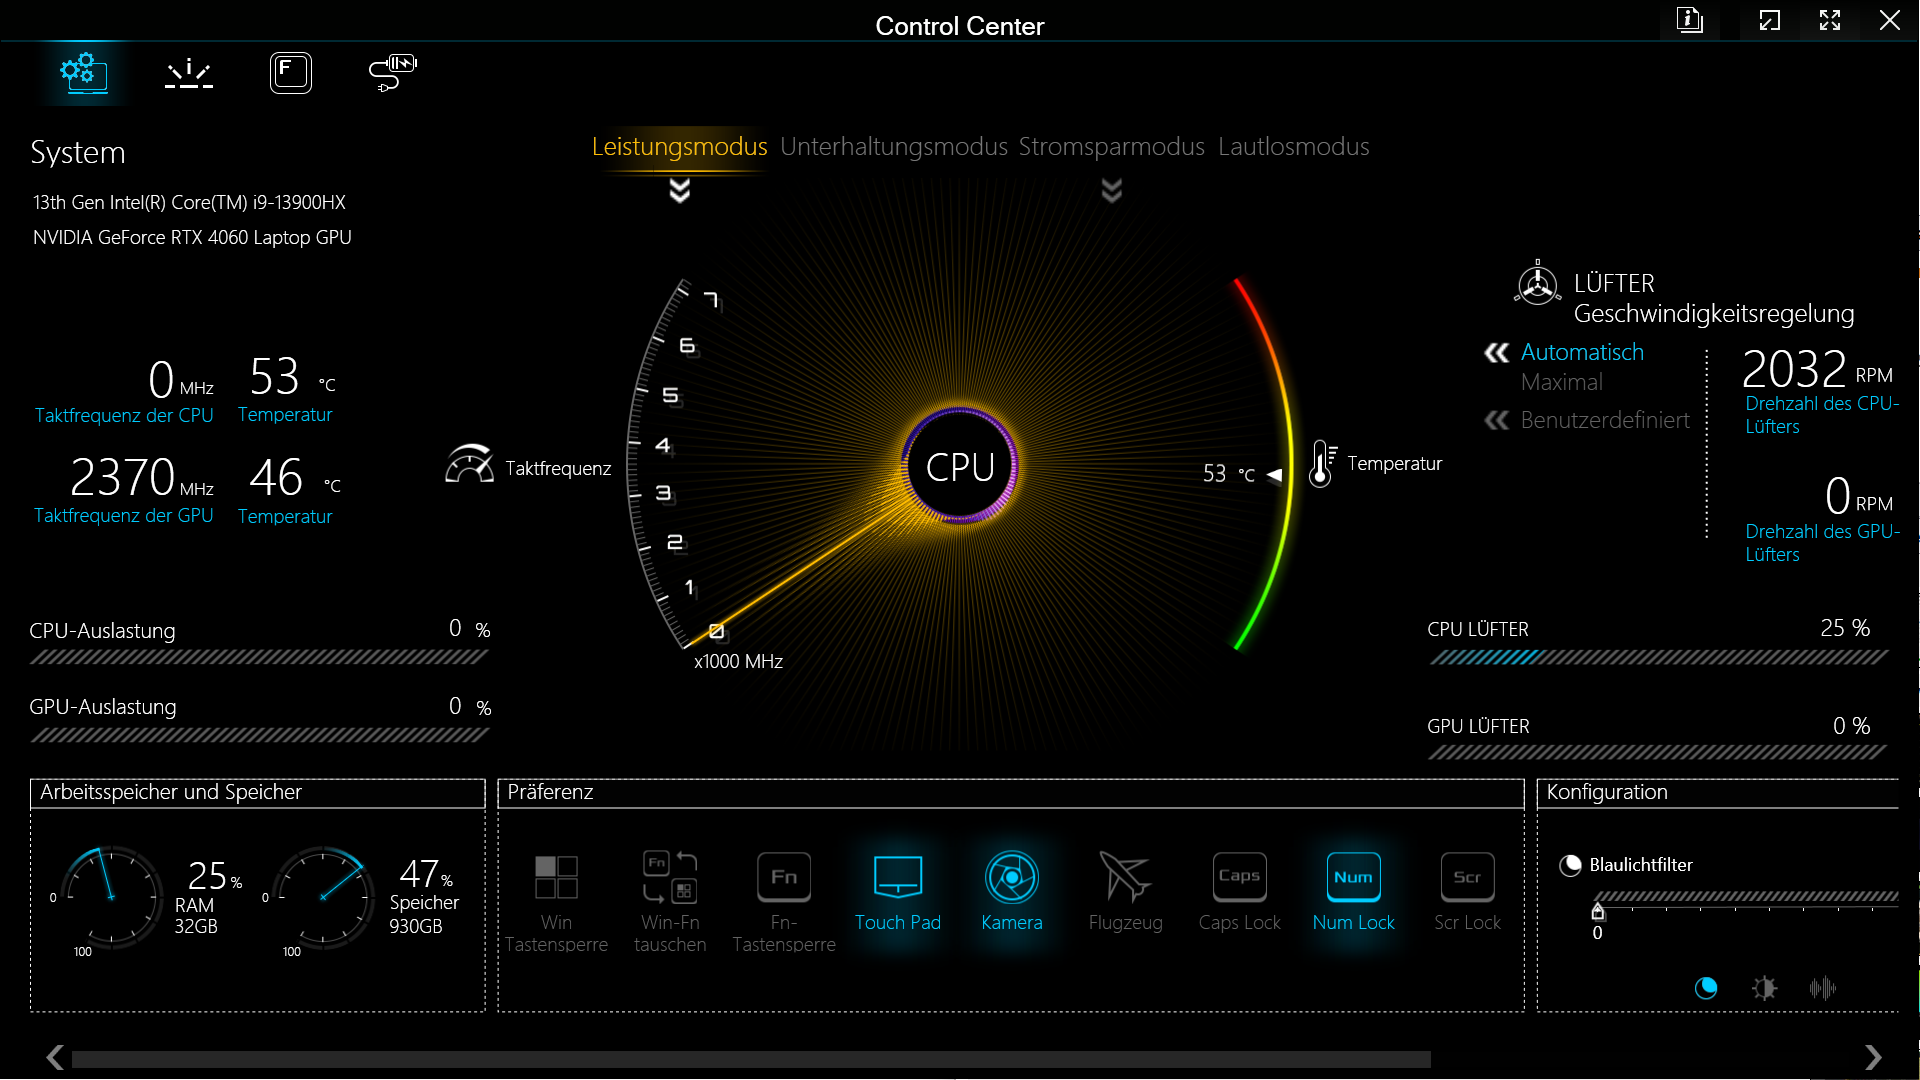
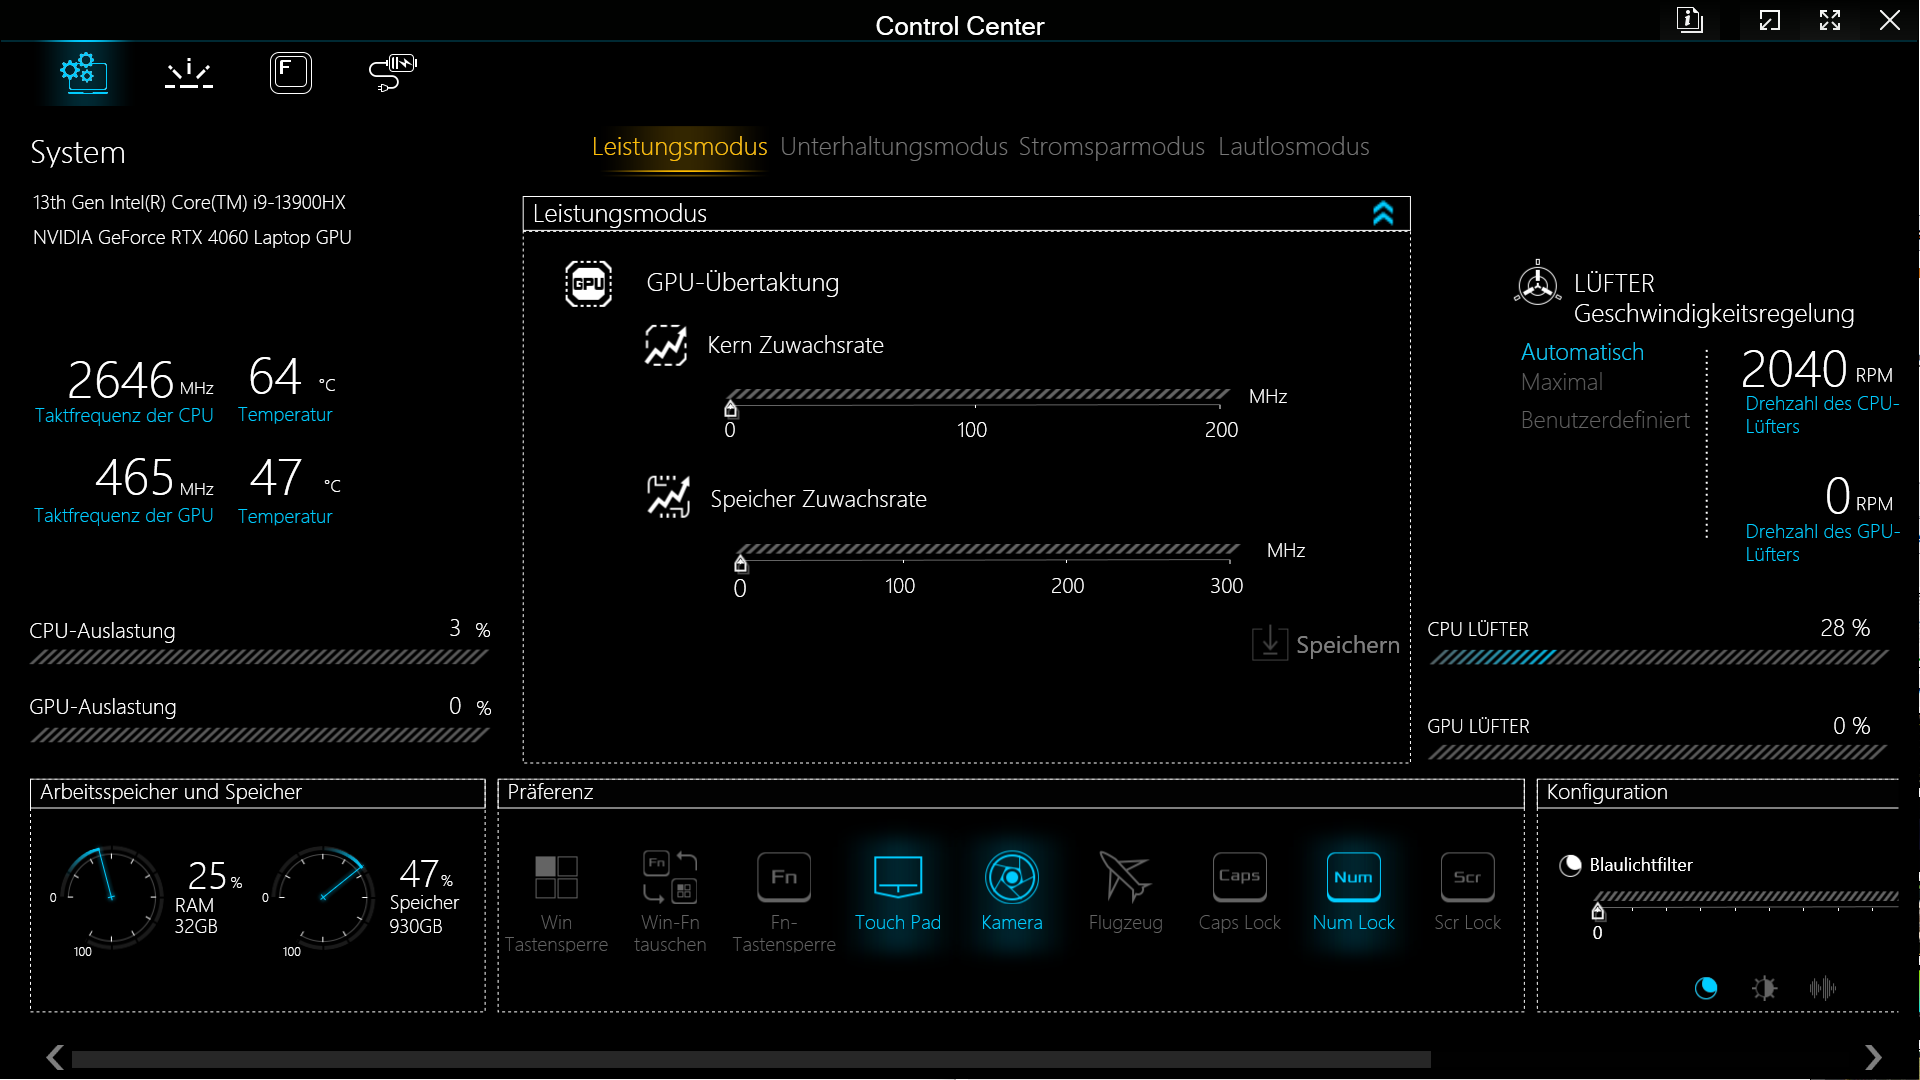
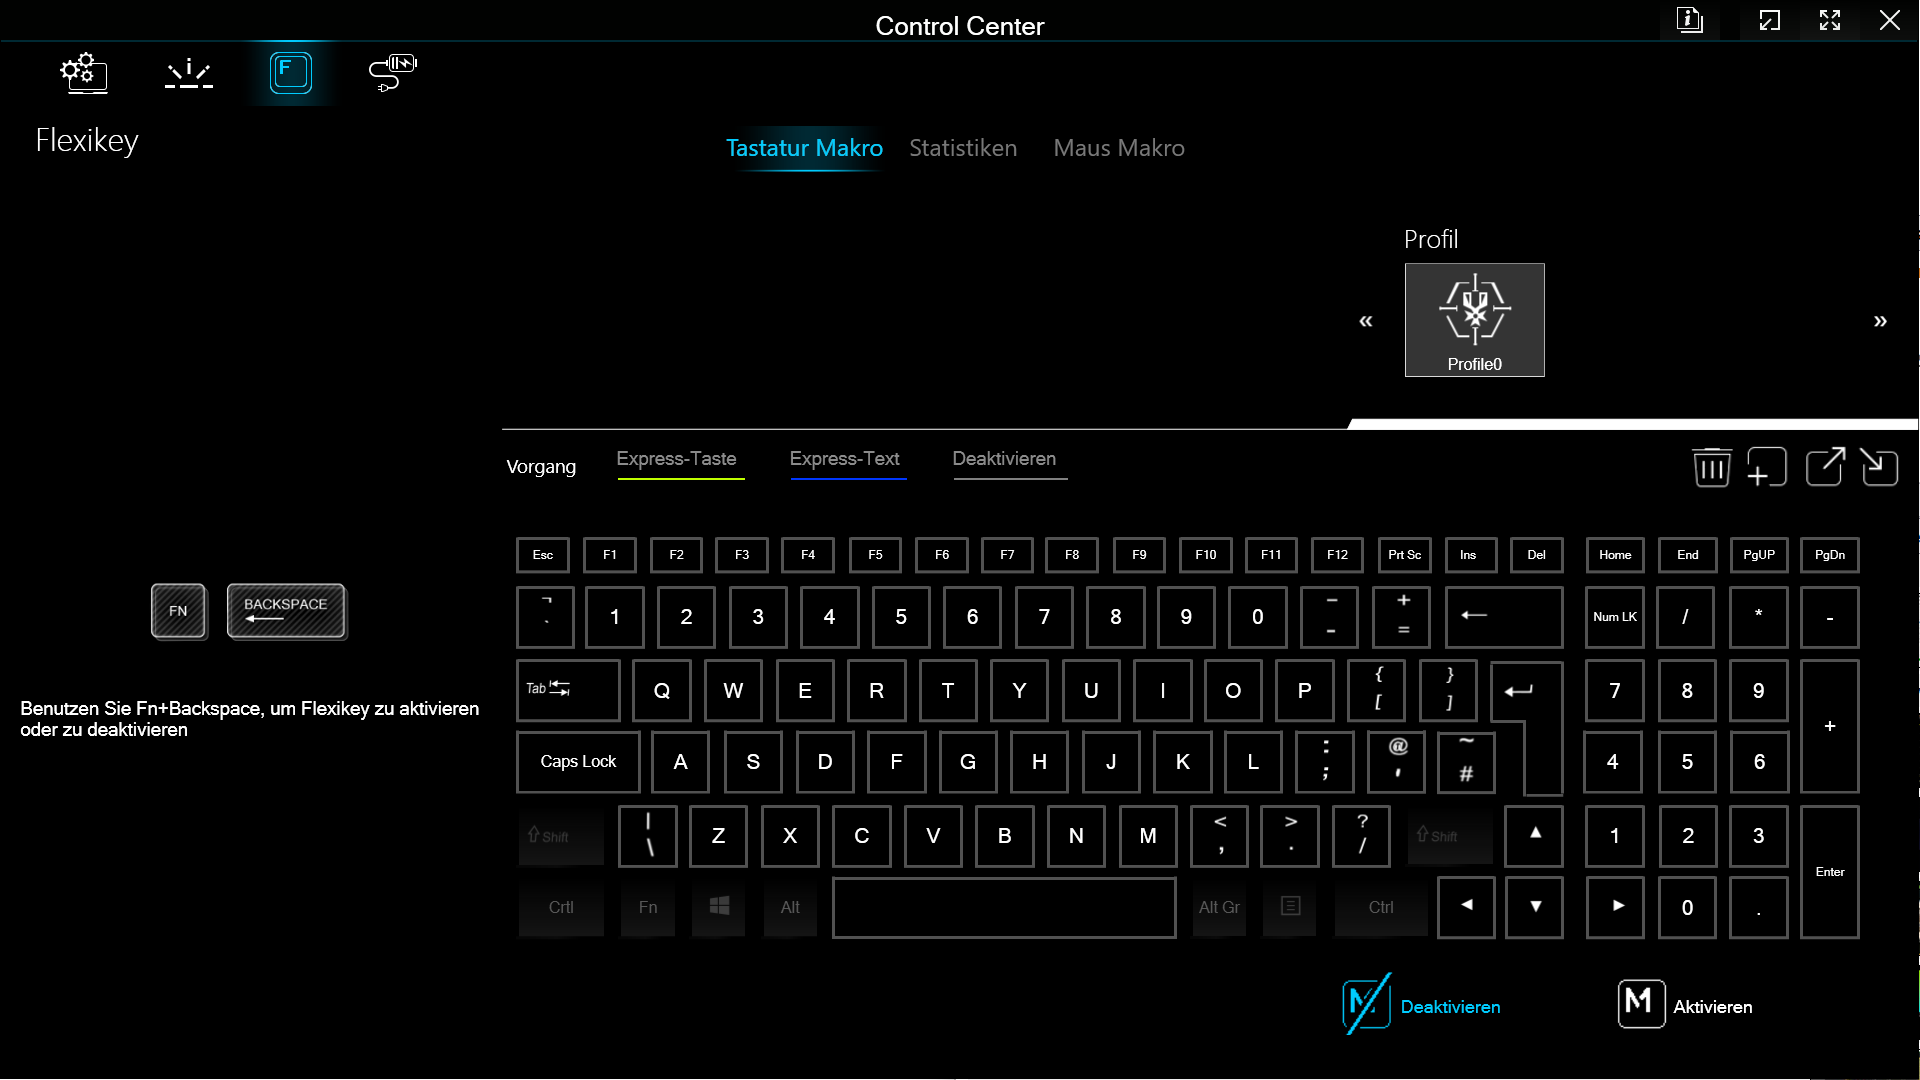
De olika prestandanivåerna - prestandaläge, underhållningsläge, energisparläge och tyst läge - kan väljas via Control Center. I prestandaläget finns det dessutom alternativ för att överklocka GPU och grafikminne något. Intel Core i9 försörjs med maximalt 135 watt och GeForce RTX 4060 med 140 watt, om 25 watt flyttas från processorn till grafikkortet. Följande målvärden gäller i de enskilda energisparlägena:
| Modus: | Prestandaläge | Underhållningsläge | Energisparläge | Tyst läge |
|---|---|---|---|---|
| CPU PL1 | 135 W | 65 W | 55 W | 45 W |
| CPU PL2 | 162 W | 115 W | 115 W | 115 W |
| Måltemperatur CPU | 93 °C | 87 °C | 85 °C | 85 °C |
| GPU TGP + Dynamic Boost | 115 W + 25 W | 115 W + 0 W | 115 W + 0 W | 115 W + 0 W |
| Måltemperatur GPU | 87 °C | 87 °C | 87 °C | 87 °C |
Loggarna som vi sammanställde visar att gaming-laptopen klarar av en mycket hög prestandaökning i upp till 90 sekunder i både underhållnings- och prestandaläge. Schenker föreslår att man utför vardagliga uppgifter i underhållningsläget. Vi bestämde oss dock för att utföra alla riktmärken i prestandaläget.
Processor
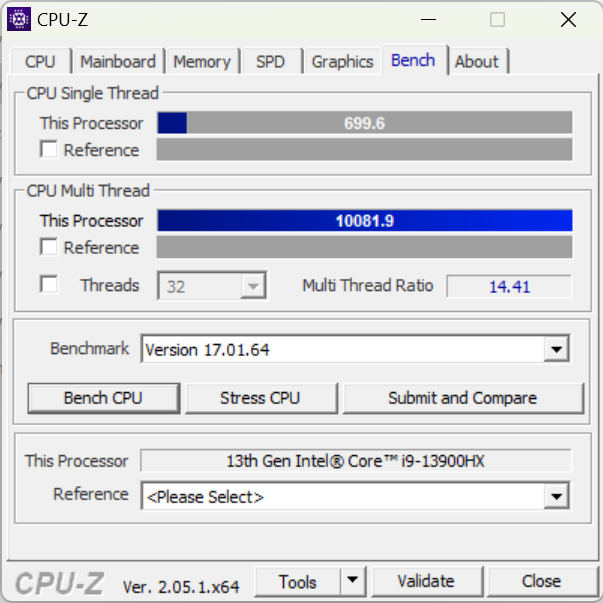
Intel Core i9-13900HXIntel Core i9-13900HX är den mest kraftfulla processorn för bärbara datorer i den nuvarande Raptor Lake-generationen. Denna CPU kan samtidigt bearbeta 32 trådar fördelade på 8 P-kärnor och 16 E-kärnor. Tack vare sina höga PL1- och PL2-värden visar i9 verkligen vilken potential den har med XMG Pro 15 som toppar alla andra enheter i processorbenchmarks.
Cinebench R15 Multi Continuous Test
Cinebench R23: Multi Core | Single Core
Cinebench R20: CPU (Multi Core) | CPU (Single Core)
Cinebench R15: CPU Multi 64Bit | CPU Single 64Bit
Blender: v2.79 BMW27 CPU
7-Zip 18.03: 7z b 4 | 7z b 4 -mmt1
Geekbench 5.5: Multi-Core | Single-Core
HWBOT x265 Benchmark v2.2: 4k Preset
LibreOffice : 20 Documents To PDF
R Benchmark 2.5: Overall mean
| CPU Performance rating | |
| Genomsnitt Intel Core i9-13900HX | |
| Genomsnitt av klass Gaming | |
| Schenker XMG Pro 15 (E23) | |
| Alienware x16 R1 -1! | |
| Aorus 15X ASF | |
| Dell G15 5530 | |
| Asus ZenBook Pro 14 Duo UX8402VV-P1021W | |
| Schenker XMG Pro 15 (i7-12700H, RTX 3080 Ti) | |
| MSI Cyborg 15 A12VF | |
| Asus TUF A15 FA507 | |
| Cinebench R23 / Multi Core | |
| Genomsnitt Intel Core i9-13900HX (24270 - 32623, n=23) | |
| Genomsnitt av klass Gaming (10488 - 42661, n=107, senaste 2 åren) | |
| Schenker XMG Pro 15 (E23) | |
| Dell G15 5530 | |
| Aorus 15X ASF | |
| Alienware x16 R1 | |
| Asus ZenBook Pro 14 Duo UX8402VV-P1021W | |
| Schenker XMG Pro 15 (i7-12700H, RTX 3080 Ti) | |
| MSI Cyborg 15 A12VF | |
| Asus TUF A15 FA507 | |
| Cinebench R23 / Single Core | |
| Genomsnitt Intel Core i9-13900HX (1867 - 2105, n=20) | |
| Genomsnitt av klass Gaming (1166 - 2415, n=107, senaste 2 åren) | |
| Asus ZenBook Pro 14 Duo UX8402VV-P1021W | |
| Alienware x16 R1 | |
| Aorus 15X ASF | |
| Schenker XMG Pro 15 (E23) | |
| Dell G15 5530 | |
| Schenker XMG Pro 15 (i7-12700H, RTX 3080 Ti) | |
| MSI Cyborg 15 A12VF | |
| Asus TUF A15 FA507 | |
| Cinebench R20 / CPU (Multi Core) | |
| Genomsnitt Intel Core i9-13900HX (9152 - 12541, n=21) | |
| Genomsnitt av klass Gaming (4029 - 16433, n=106, senaste 2 åren) | |
| Schenker XMG Pro 15 (E23) | |
| Dell G15 5530 | |
| Aorus 15X ASF | |
| Alienware x16 R1 | |
| Asus ZenBook Pro 14 Duo UX8402VV-P1021W | |
| Schenker XMG Pro 15 (i7-12700H, RTX 3080 Ti) | |
| MSI Cyborg 15 A12VF | |
| Asus TUF A15 FA507 | |
| Cinebench R20 / CPU (Single Core) | |
| Genomsnitt Intel Core i9-13900HX (722 - 810, n=21) | |
| Genomsnitt av klass Gaming (442 - 913, n=106, senaste 2 åren) | |
| Asus ZenBook Pro 14 Duo UX8402VV-P1021W | |
| Alienware x16 R1 | |
| Aorus 15X ASF | |
| Schenker XMG Pro 15 (E23) | |
| Dell G15 5530 | |
| Schenker XMG Pro 15 (i7-12700H, RTX 3080 Ti) | |
| MSI Cyborg 15 A12VF | |
| Asus TUF A15 FA507 | |
| Cinebench R15 / CPU Multi 64Bit | |
| Genomsnitt Intel Core i9-13900HX (3913 - 4970, n=22) | |
| Genomsnitt av klass Gaming (1578 - 6330, n=105, senaste 2 åren) | |
| Schenker XMG Pro 15 (E23) | |
| Aorus 15X ASF | |
| Dell G15 5530 | |
| Alienware x16 R1 | |
| Asus ZenBook Pro 14 Duo UX8402VV-P1021W | |
| Schenker XMG Pro 15 (i7-12700H, RTX 3080 Ti) | |
| Asus TUF A15 FA507 | |
| MSI Cyborg 15 A12VF | |
| Cinebench R15 / CPU Single 64Bit | |
| Genomsnitt av klass Gaming (188.8 - 350, n=106, senaste 2 åren) | |
| Genomsnitt Intel Core i9-13900HX (247 - 304, n=22) | |
| Asus ZenBook Pro 14 Duo UX8402VV-P1021W | |
| Alienware x16 R1 | |
| Aorus 15X ASF | |
| Dell G15 5530 | |
| Schenker XMG Pro 15 (i7-12700H, RTX 3080 Ti) | |
| Asus TUF A15 FA507 | |
| Schenker XMG Pro 15 (E23) | |
| MSI Cyborg 15 A12VF | |
| Blender / v2.79 BMW27 CPU | |
| MSI Cyborg 15 A12VF | |
| Asus TUF A15 FA507 | |
| Schenker XMG Pro 15 (i7-12700H, RTX 3080 Ti) | |
| Asus ZenBook Pro 14 Duo UX8402VV-P1021W | |
| Aorus 15X ASF | |
| Dell G15 5530 | |
| Genomsnitt av klass Gaming (79 - 330, n=104, senaste 2 åren) | |
| Schenker XMG Pro 15 (E23) | |
| Genomsnitt Intel Core i9-13900HX (101 - 153, n=22) | |
| 7-Zip 18.03 / 7z b 4 | |
| Genomsnitt Intel Core i9-13900HX (90675 - 127283, n=21) | |
| Schenker XMG Pro 15 (E23) | |
| Genomsnitt av klass Gaming (33491 - 148086, n=105, senaste 2 åren) | |
| Dell G15 5530 | |
| Alienware x16 R1 | |
| Aorus 15X ASF | |
| Asus ZenBook Pro 14 Duo UX8402VV-P1021W | |
| Schenker XMG Pro 15 (i7-12700H, RTX 3080 Ti) | |
| Asus TUF A15 FA507 | |
| MSI Cyborg 15 A12VF | |
| 7-Zip 18.03 / 7z b 4 -mmt1 | |
| Genomsnitt Intel Core i9-13900HX (6340 - 7177, n=21) | |
| Genomsnitt av klass Gaming (4199 - 7436, n=105, senaste 2 åren) | |
| Aorus 15X ASF | |
| Schenker XMG Pro 15 (E23) | |
| Asus ZenBook Pro 14 Duo UX8402VV-P1021W | |
| Alienware x16 R1 | |
| Dell G15 5530 | |
| Asus TUF A15 FA507 | |
| Schenker XMG Pro 15 (i7-12700H, RTX 3080 Ti) | |
| MSI Cyborg 15 A12VF | |
| Geekbench 5.5 / Multi-Core | |
| Genomsnitt Intel Core i9-13900HX (17614 - 21075, n=22) | |
| Schenker XMG Pro 15 (E23) | |
| Genomsnitt av klass Gaming (6460 - 28263, n=105, senaste 2 åren) | |
| Aorus 15X ASF | |
| Alienware x16 R1 | |
| Dell G15 5530 | |
| Asus ZenBook Pro 14 Duo UX8402VV-P1021W | |
| Schenker XMG Pro 15 (i7-12700H, RTX 3080 Ti) | |
| MSI Cyborg 15 A12VF | |
| Asus TUF A15 FA507 | |
| Geekbench 5.5 / Single-Core | |
| Genomsnitt av klass Gaming (986 - 2474, n=105, senaste 2 åren) | |
| Genomsnitt Intel Core i9-13900HX (1345 - 2093, n=22) | |
| Alienware x16 R1 | |
| Asus ZenBook Pro 14 Duo UX8402VV-P1021W | |
| Aorus 15X ASF | |
| Dell G15 5530 | |
| Schenker XMG Pro 15 (E23) | |
| MSI Cyborg 15 A12VF | |
| Schenker XMG Pro 15 (i7-12700H, RTX 3080 Ti) | |
| Asus TUF A15 FA507 | |
| HWBOT x265 Benchmark v2.2 / 4k Preset | |
| Genomsnitt Intel Core i9-13900HX (23.5 - 34.4, n=22) | |
| Genomsnitt av klass Gaming (11.5 - 44.4, n=105, senaste 2 åren) | |
| Schenker XMG Pro 15 (E23) | |
| Dell G15 5530 | |
| Alienware x16 R1 | |
| Aorus 15X ASF | |
| Schenker XMG Pro 15 (i7-12700H, RTX 3080 Ti) | |
| Asus ZenBook Pro 14 Duo UX8402VV-P1021W | |
| Asus TUF A15 FA507 | |
| MSI Cyborg 15 A12VF | |
| MSI Cyborg 15 A12VF | |
| LibreOffice / 20 Documents To PDF | |
| Schenker XMG Pro 15 (E23) | |
| Asus TUF A15 FA507 | |
| Genomsnitt av klass Gaming (33.2 - 88.8, n=105, senaste 2 åren) | |
| Schenker XMG Pro 15 (i7-12700H, RTX 3080 Ti) | |
| Dell G15 5530 | |
| Alienware x16 R1 | |
| Aorus 15X ASF | |
| Genomsnitt Intel Core i9-13900HX (32.8 - 51.1, n=21) | |
| Asus ZenBook Pro 14 Duo UX8402VV-P1021W | |
| MSI Cyborg 15 A12VF | |
| R Benchmark 2.5 / Overall mean | |
| Asus TUF A15 FA507 | |
| MSI Cyborg 15 A12VF | |
| Schenker XMG Pro 15 (E23) | |
| Schenker XMG Pro 15 (i7-12700H, RTX 3080 Ti) | |
| Aorus 15X ASF | |
| Asus ZenBook Pro 14 Duo UX8402VV-P1021W | |
| Genomsnitt av klass Gaming (0.3439 - 0.759, n=106, senaste 2 åren) | |
| Alienware x16 R1 | |
| Dell G15 5530 | |
| Genomsnitt Intel Core i9-13900HX (0.375 - 0.4564, n=22) | |
* ... mindre är bättre
AIDA64: FP32 Ray-Trace | FPU Julia | CPU SHA3 | CPU Queen | FPU SinJulia | FPU Mandel | CPU AES | CPU ZLib | FP64 Ray-Trace | CPU PhotoWorxx
| Performance rating | |
| Genomsnitt av klass Gaming | |
| Genomsnitt Intel Core i9-13900HX | |
| Schenker XMG Pro 15 (E23) | |
| Alienware x16 R1 | |
| Aorus 15X ASF | |
| Dell G15 5530 | |
| Asus TUF A15 FA507 | |
| Asus ZenBook Pro 14 Duo UX8402VV-P1021W | |
| MSI Cyborg 15 A12VF | |
| Schenker XMG Pro 15 (i7-12700H, RTX 3080 Ti) | |
| AIDA64 / FP32 Ray-Trace | |
| Genomsnitt av klass Gaming (10227 - 85542, n=105, senaste 2 åren) | |
| Genomsnitt Intel Core i9-13900HX (17589 - 27615, n=22) | |
| Alienware x16 R1 | |
| Dell G15 5530 | |
| Schenker XMG Pro 15 (E23) | |
| Aorus 15X ASF | |
| Asus TUF A15 FA507 | |
| Asus ZenBook Pro 14 Duo UX8402VV-P1021W | |
| MSI Cyborg 15 A12VF | |
| Schenker XMG Pro 15 (i7-12700H, RTX 3080 Ti) | |
| AIDA64 / FPU Julia | |
| Genomsnitt av klass Gaming (51376 - 238426, n=105, senaste 2 åren) | |
| Genomsnitt Intel Core i9-13900HX (88686 - 137015, n=22) | |
| Asus TUF A15 FA507 | |
| Schenker XMG Pro 15 (E23) | |
| Alienware x16 R1 | |
| Dell G15 5530 | |
| Aorus 15X ASF | |
| Asus ZenBook Pro 14 Duo UX8402VV-P1021W | |
| MSI Cyborg 15 A12VF | |
| Schenker XMG Pro 15 (i7-12700H, RTX 3080 Ti) | |
| AIDA64 / CPU SHA3 | |
| Genomsnitt av klass Gaming (2180 - 10115, n=105, senaste 2 åren) | |
| Genomsnitt Intel Core i9-13900HX (4362 - 7029, n=22) | |
| Schenker XMG Pro 15 (E23) | |
| Dell G15 5530 | |
| Alienware x16 R1 | |
| Aorus 15X ASF | |
| Asus TUF A15 FA507 | |
| Asus ZenBook Pro 14 Duo UX8402VV-P1021W | |
| MSI Cyborg 15 A12VF | |
| Schenker XMG Pro 15 (i7-12700H, RTX 3080 Ti) | |
| AIDA64 / CPU Queen | |
| Genomsnitt Intel Core i9-13900HX (125644 - 141385, n=22) | |
| Schenker XMG Pro 15 (E23) | |
| Alienware x16 R1 | |
| Genomsnitt av klass Gaming (49785 - 173351, n=90, senaste 2 åren) | |
| Aorus 15X ASF | |
| Asus ZenBook Pro 14 Duo UX8402VV-P1021W | |
| Dell G15 5530 | |
| Asus TUF A15 FA507 | |
| Schenker XMG Pro 15 (i7-12700H, RTX 3080 Ti) | |
| MSI Cyborg 15 A12VF | |
| AIDA64 / FPU SinJulia | |
| Genomsnitt Intel Core i9-13900HX (12334 - 17179, n=22) | |
| Genomsnitt av klass Gaming (4424 - 33636, n=105, senaste 2 åren) | |
| Asus TUF A15 FA507 | |
| Schenker XMG Pro 15 (E23) | |
| Aorus 15X ASF | |
| Alienware x16 R1 | |
| Dell G15 5530 | |
| Schenker XMG Pro 15 (i7-12700H, RTX 3080 Ti) | |
| Asus ZenBook Pro 14 Duo UX8402VV-P1021W | |
| MSI Cyborg 15 A12VF | |
| AIDA64 / FPU Mandel | |
| Genomsnitt av klass Gaming (25115 - 128721, n=105, senaste 2 åren) | |
| Genomsnitt Intel Core i9-13900HX (43850 - 69202, n=22) | |
| Asus TUF A15 FA507 | |
| Alienware x16 R1 | |
| Schenker XMG Pro 15 (E23) | |
| Dell G15 5530 | |
| Aorus 15X ASF | |
| Asus ZenBook Pro 14 Duo UX8402VV-P1021W | |
| MSI Cyborg 15 A12VF | |
| Schenker XMG Pro 15 (i7-12700H, RTX 3080 Ti) | |
| AIDA64 / CPU AES | |
| Aorus 15X ASF | |
| Genomsnitt Intel Core i9-13900HX (89413 - 237881, n=22) | |
| Genomsnitt av klass Gaming (39258 - 247074, n=105, senaste 2 åren) | |
| Schenker XMG Pro 15 (E23) | |
| Dell G15 5530 | |
| Alienware x16 R1 | |
| Asus TUF A15 FA507 | |
| MSI Cyborg 15 A12VF | |
| Asus ZenBook Pro 14 Duo UX8402VV-P1021W | |
| Schenker XMG Pro 15 (i7-12700H, RTX 3080 Ti) | |
| AIDA64 / CPU ZLib | |
| Genomsnitt Intel Core i9-13900HX (1284 - 1958, n=22) | |
| Genomsnitt av klass Gaming (574 - 2531, n=105, senaste 2 åren) | |
| Schenker XMG Pro 15 (E23) | |
| Dell G15 5530 | |
| Alienware x16 R1 | |
| Aorus 15X ASF | |
| Schenker XMG Pro 15 (i7-12700H, RTX 3080 Ti) | |
| MSI Cyborg 15 A12VF | |
| Asus ZenBook Pro 14 Duo UX8402VV-P1021W | |
| Asus TUF A15 FA507 | |
| AIDA64 / FP64 Ray-Trace | |
| Genomsnitt av klass Gaming (5509 - 45446, n=105, senaste 2 åren) | |
| Genomsnitt Intel Core i9-13900HX (9481 - 15279, n=22) | |
| Alienware x16 R1 | |
| Dell G15 5530 | |
| Schenker XMG Pro 15 (E23) | |
| Aorus 15X ASF | |
| Asus TUF A15 FA507 | |
| Asus ZenBook Pro 14 Duo UX8402VV-P1021W | |
| MSI Cyborg 15 A12VF | |
| Schenker XMG Pro 15 (i7-12700H, RTX 3080 Ti) | |
| AIDA64 / CPU PhotoWorxx | |
| Schenker XMG Pro 15 (E23) | |
| Alienware x16 R1 | |
| Genomsnitt Intel Core i9-13900HX (42994 - 51994, n=22) | |
| Genomsnitt av klass Gaming (12271 - 89891, n=105, senaste 2 åren) | |
| Asus ZenBook Pro 14 Duo UX8402VV-P1021W | |
| Dell G15 5530 | |
| MSI Cyborg 15 A12VF | |
| Aorus 15X ASF | |
| Schenker XMG Pro 15 (i7-12700H, RTX 3080 Ti) | |
| Asus TUF A15 FA507 | |
Systemets prestanda
När det gäller systemprestanda visade granskningsenheten också starka siffror och överträffade till och med Aorus 15X ASFtrots att de delar liknande TDP- och TGP-värden. I PCMark 10 är XMG Pro 15 bara några få poäng bakom den smala Asus ZenBook Pro 14 Duo vilket visar att en kraftfull bärbar speldator inte alltid behöver vara en tung bärbar speldator.
CrossMark: Overall | Productivity | Creativity | Responsiveness
| PCMark 10 / Score | |
| Genomsnitt av klass Gaming (5828 - 12414, n=93, senaste 2 åren) | |
| Alienware x16 R1 | |
| Asus ZenBook Pro 14 Duo UX8402VV-P1021W | |
| Schenker XMG Pro 15 (E23) | |
| Genomsnitt Intel Core i9-13900HX, NVIDIA GeForce RTX 4060 Laptop GPU (n=1) | |
| Asus TUF A15 FA507 | |
| Aorus 15X ASF | |
| MSI Cyborg 15 A12VF | |
| Dell G15 5530 | |
| Schenker XMG Pro 15 (i7-12700H, RTX 3080 Ti) | |
| PCMark 10 / Essentials | |
| Schenker XMG Pro 15 (E23) | |
| Genomsnitt Intel Core i9-13900HX, NVIDIA GeForce RTX 4060 Laptop GPU (n=1) | |
| Asus ZenBook Pro 14 Duo UX8402VV-P1021W | |
| Alienware x16 R1 | |
| Dell G15 5530 | |
| Schenker XMG Pro 15 (i7-12700H, RTX 3080 Ti) | |
| Aorus 15X ASF | |
| MSI Cyborg 15 A12VF | |
| Genomsnitt av klass Gaming (8810 - 11935, n=97, senaste 2 åren) | |
| Asus TUF A15 FA507 | |
| PCMark 10 / Productivity | |
| Genomsnitt av klass Gaming (6845 - 25323, n=95, senaste 2 åren) | |
| Schenker XMG Pro 15 (E23) | |
| Genomsnitt Intel Core i9-13900HX, NVIDIA GeForce RTX 4060 Laptop GPU (n=1) | |
| Dell G15 5530 | |
| MSI Cyborg 15 A12VF | |
| Alienware x16 R1 | |
| Asus ZenBook Pro 14 Duo UX8402VV-P1021W | |
| Aorus 15X ASF | |
| Asus TUF A15 FA507 | |
| Schenker XMG Pro 15 (i7-12700H, RTX 3080 Ti) | |
| PCMark 10 / Digital Content Creation | |
| Alienware x16 R1 | |
| Genomsnitt av klass Gaming (7602 - 19954, n=95, senaste 2 åren) | |
| Asus ZenBook Pro 14 Duo UX8402VV-P1021W | |
| Asus TUF A15 FA507 | |
| Aorus 15X ASF | |
| Schenker XMG Pro 15 (E23) | |
| Genomsnitt Intel Core i9-13900HX, NVIDIA GeForce RTX 4060 Laptop GPU (n=1) | |
| MSI Cyborg 15 A12VF | |
| Schenker XMG Pro 15 (i7-12700H, RTX 3080 Ti) | |
| Dell G15 5530 | |
| CrossMark / Overall | |
| Aorus 15X ASF | |
| Genomsnitt av klass Gaming (1366 - 2409, n=94, senaste 2 åren) | |
| Schenker XMG Pro 15 (E23) | |
| Genomsnitt Intel Core i9-13900HX, NVIDIA GeForce RTX 4060 Laptop GPU (n=1) | |
| Alienware x16 R1 | |
| Asus ZenBook Pro 14 Duo UX8402VV-P1021W | |
| Dell G15 5530 | |
| MSI Cyborg 15 A12VF | |
| Asus TUF A15 FA507 | |
| CrossMark / Productivity | |
| Aorus 15X ASF | |
| Genomsnitt av klass Gaming (1386 - 2254, n=94, senaste 2 åren) | |
| Alienware x16 R1 | |
| Schenker XMG Pro 15 (E23) | |
| Genomsnitt Intel Core i9-13900HX, NVIDIA GeForce RTX 4060 Laptop GPU (n=1) | |
| Asus ZenBook Pro 14 Duo UX8402VV-P1021W | |
| Dell G15 5530 | |
| MSI Cyborg 15 A12VF | |
| Asus TUF A15 FA507 | |
| CrossMark / Creativity | |
| Genomsnitt av klass Gaming (1343 - 2786, n=94, senaste 2 åren) | |
| Schenker XMG Pro 15 (E23) | |
| Genomsnitt Intel Core i9-13900HX, NVIDIA GeForce RTX 4060 Laptop GPU (n=1) | |
| Aorus 15X ASF | |
| Asus ZenBook Pro 14 Duo UX8402VV-P1021W | |
| Dell G15 5530 | |
| Alienware x16 R1 | |
| MSI Cyborg 15 A12VF | |
| Asus TUF A15 FA507 | |
| CrossMark / Responsiveness | |
| Aorus 15X ASF | |
| Alienware x16 R1 | |
| Schenker XMG Pro 15 (E23) | |
| Genomsnitt Intel Core i9-13900HX, NVIDIA GeForce RTX 4060 Laptop GPU (n=1) | |
| Genomsnitt av klass Gaming (1226 - 2334, n=94, senaste 2 åren) | |
| MSI Cyborg 15 A12VF | |
| Asus ZenBook Pro 14 Duo UX8402VV-P1021W | |
| Dell G15 5530 | |
| Asus TUF A15 FA507 | |
| PCMark 10 Score | 7521 poäng | |
Hjälp | ||
| AIDA64 / Memory Copy | |
| Schenker XMG Pro 15 (E23) | |
| Genomsnitt Intel Core i9-13900HX (67716 - 79193, n=22) | |
| Alienware x16 R1 | |
| Genomsnitt av klass Gaming (21750 - 129946, n=105, senaste 2 åren) | |
| Asus ZenBook Pro 14 Duo UX8402VV-P1021W | |
| Dell G15 5530 | |
| Aorus 15X ASF | |
| MSI Cyborg 15 A12VF | |
| Asus TUF A15 FA507 | |
| Schenker XMG Pro 15 (i7-12700H, RTX 3080 Ti) | |
| AIDA64 / Memory Read | |
| Schenker XMG Pro 15 (E23) | |
| Genomsnitt Intel Core i9-13900HX (73998 - 88462, n=22) | |
| Genomsnitt av klass Gaming (22956 - 118858, n=105, senaste 2 åren) | |
| Dell G15 5530 | |
| Alienware x16 R1 | |
| Aorus 15X ASF | |
| MSI Cyborg 15 A12VF | |
| Asus ZenBook Pro 14 Duo UX8402VV-P1021W | |
| Asus TUF A15 FA507 | |
| Schenker XMG Pro 15 (i7-12700H, RTX 3080 Ti) | |
| AIDA64 / Memory Write | |
| Alienware x16 R1 | |
| Genomsnitt av klass Gaming (22297 - 135096, n=105, senaste 2 åren) | |
| Schenker XMG Pro 15 (E23) | |
| Genomsnitt Intel Core i9-13900HX (65472 - 77045, n=22) | |
| Asus ZenBook Pro 14 Duo UX8402VV-P1021W | |
| Dell G15 5530 | |
| MSI Cyborg 15 A12VF | |
| Aorus 15X ASF | |
| Asus TUF A15 FA507 | |
| Schenker XMG Pro 15 (i7-12700H, RTX 3080 Ti) | |
| AIDA64 / Memory Latency | |
| Genomsnitt av klass Gaming (75.3 - 259, n=105, senaste 2 åren) | |
| Alienware x16 R1 | |
| Asus ZenBook Pro 14 Duo UX8402VV-P1021W | |
| MSI Cyborg 15 A12VF | |
| Dell G15 5530 | |
| Aorus 15X ASF | |
| Genomsnitt Intel Core i9-13900HX (75.3 - 91.1, n=22) | |
| Schenker XMG Pro 15 (E23) | |
| Asus TUF A15 FA507 | |
* ... mindre är bättre
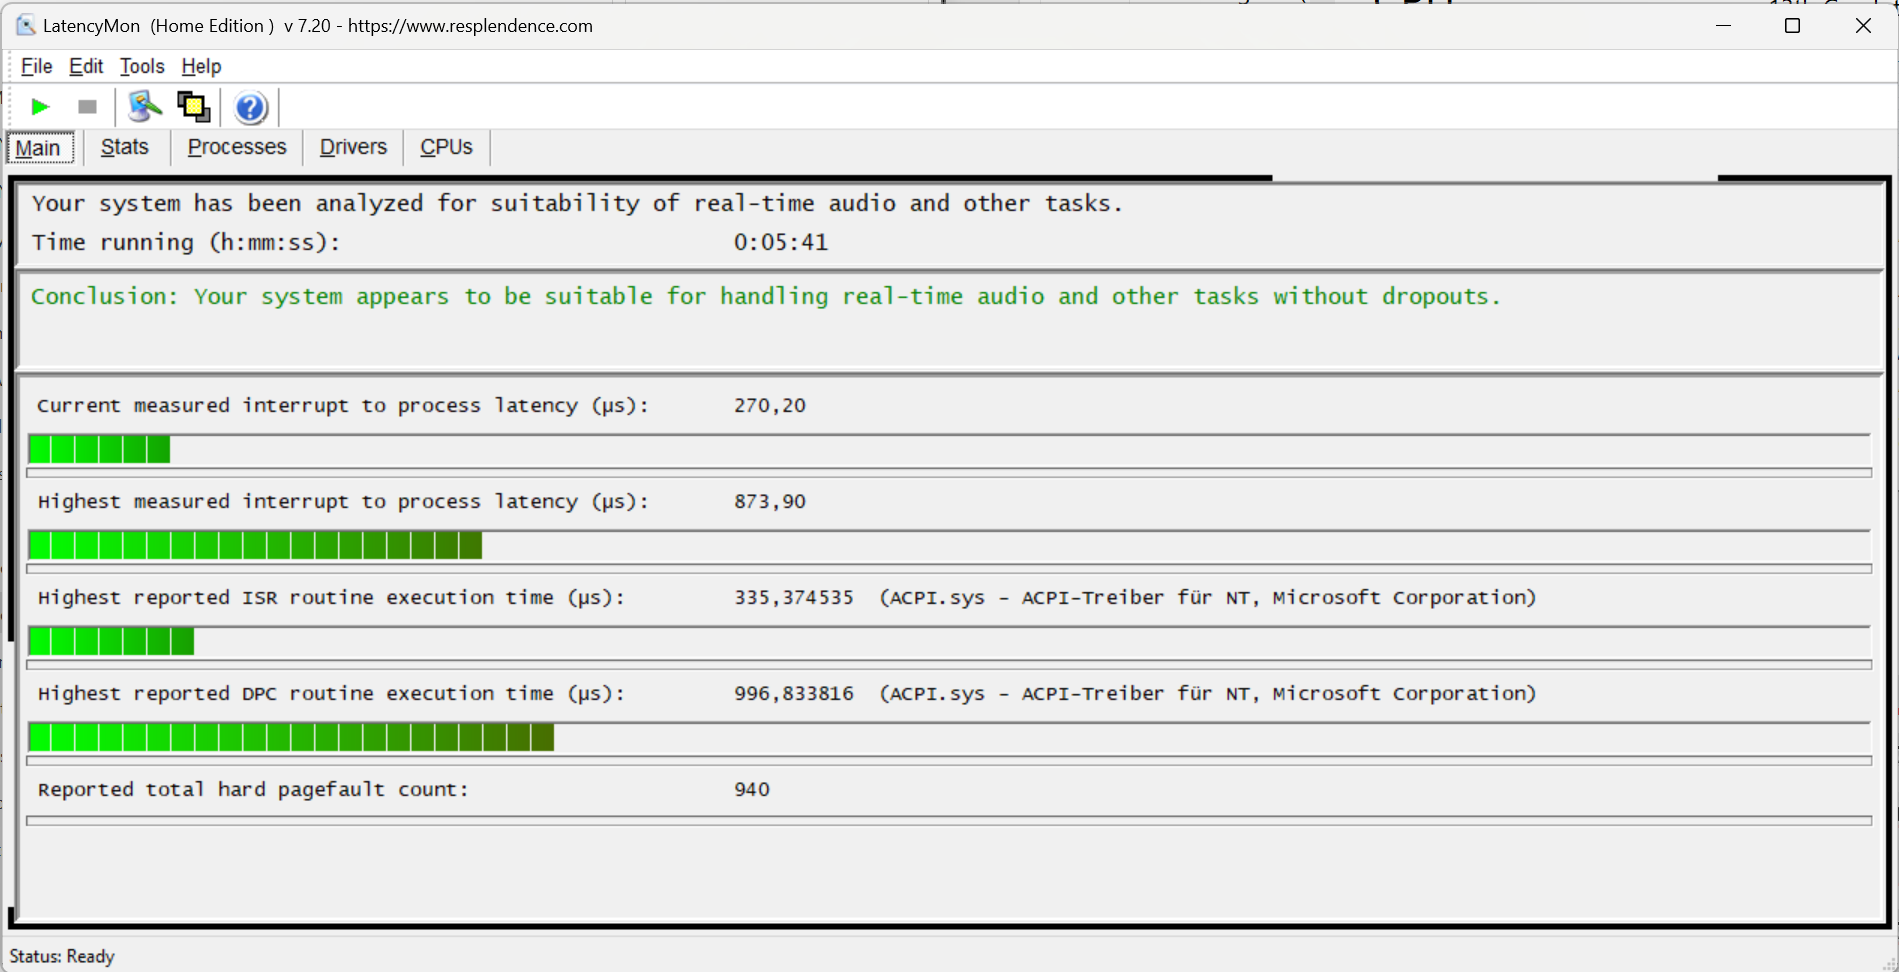
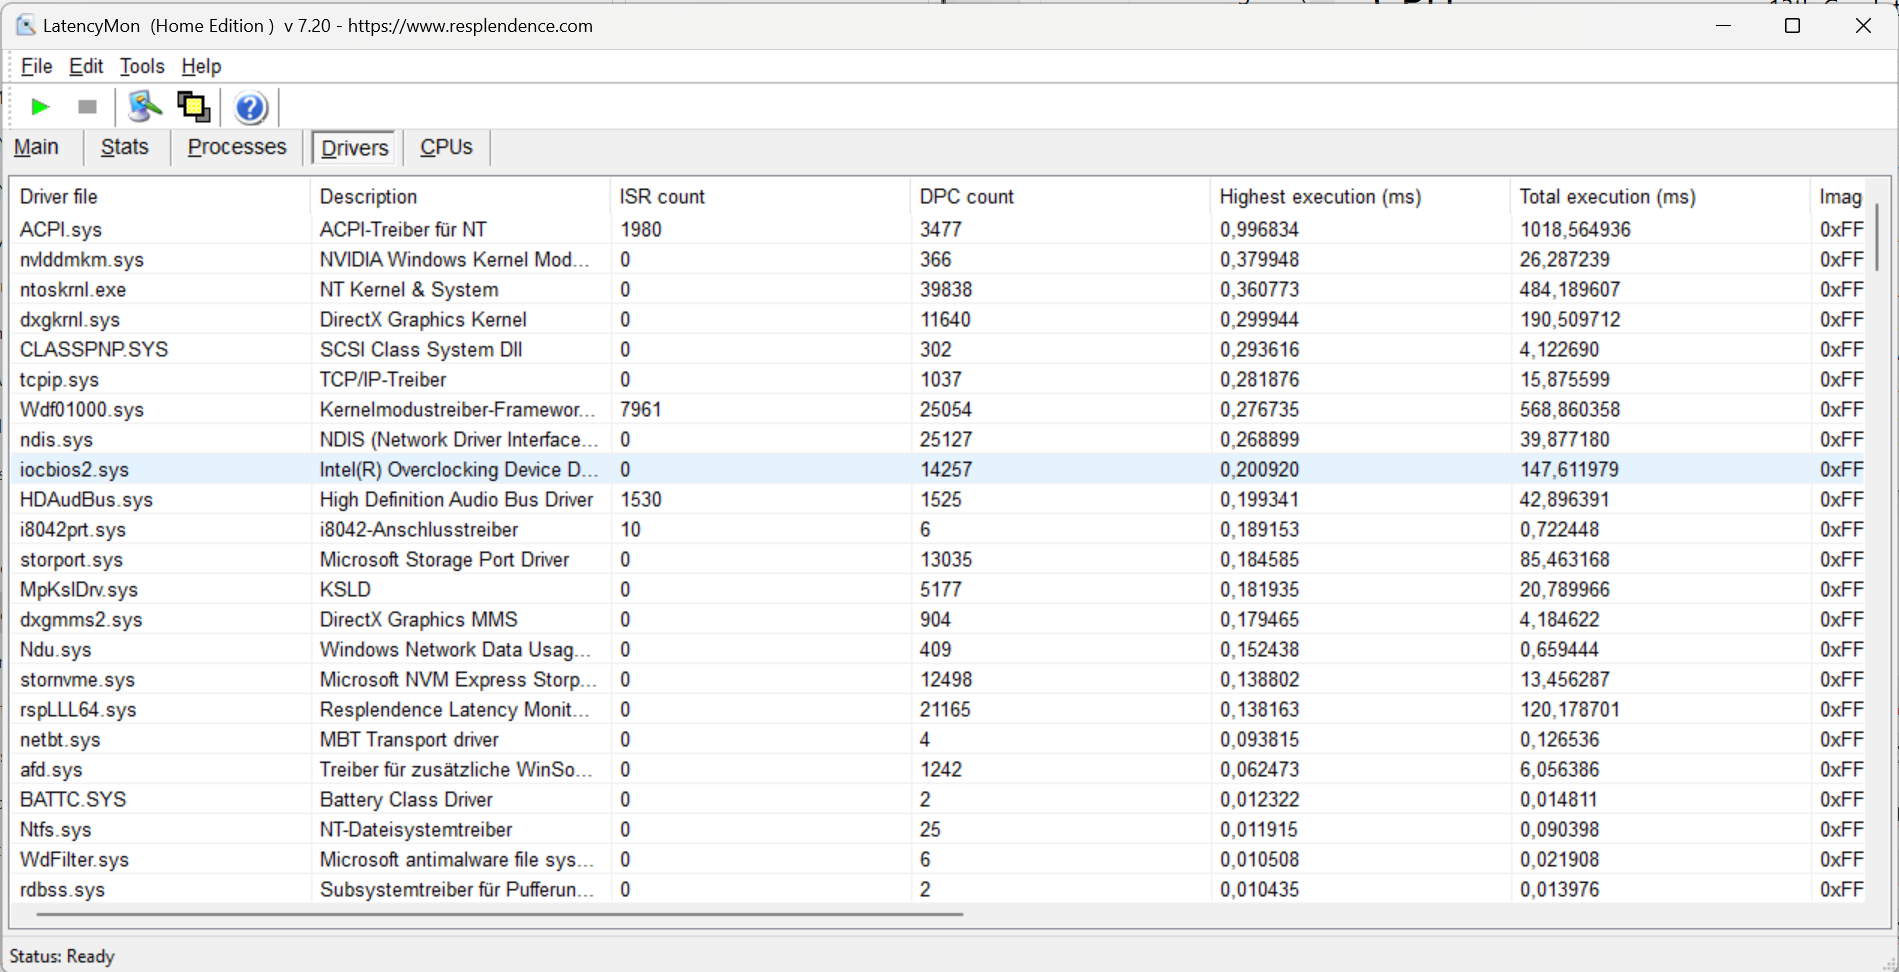
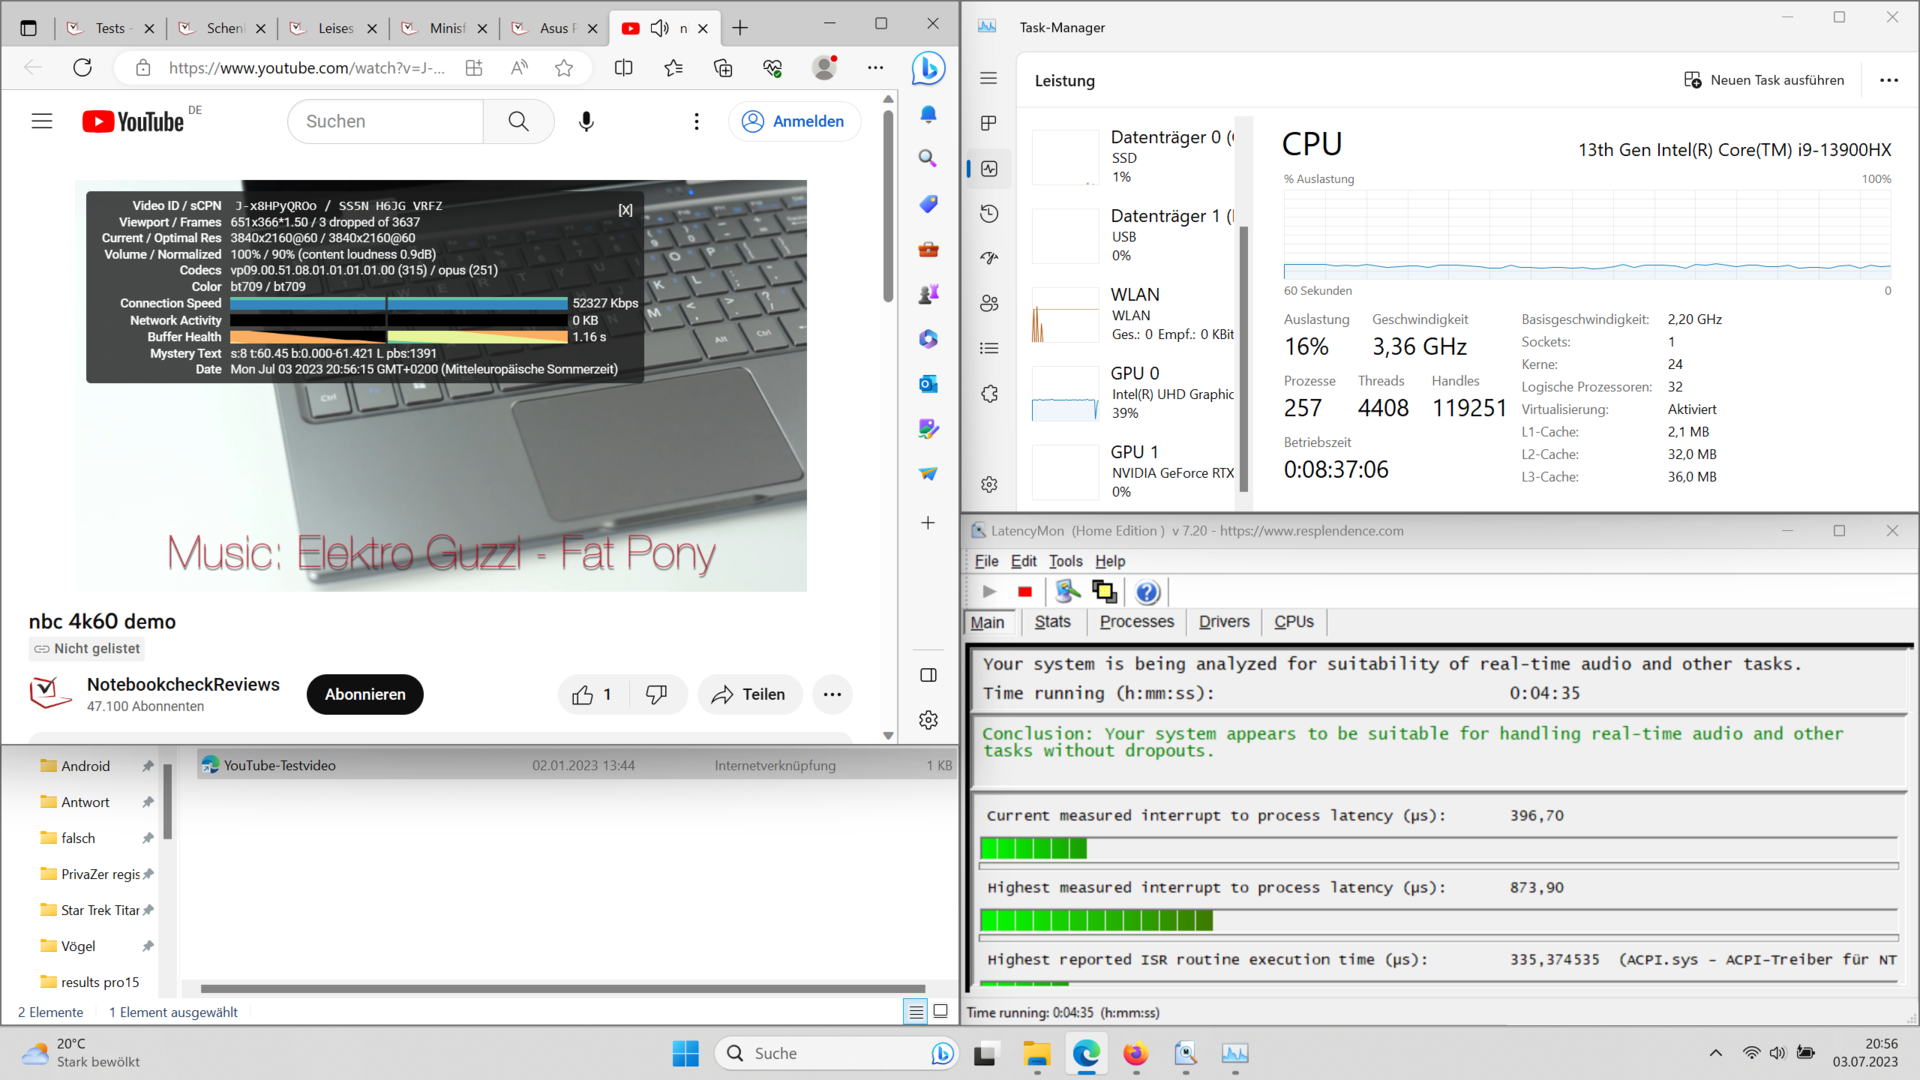
DPC-fördröjningar
På det här området märks det att interaktionsproblemen mellan Nvidia-drivrutinerna och andra drivrutiner under tiden har övervunnits. I den här bärbara datorn, vid tidpunkten för testningen, ligger DPC-latenserna på en låg nivå med nuvarande drivrutiner och firmware.
| DPC Latencies / LatencyMon - interrupt to process latency (max), Web, Youtube, Prime95 | |
| Dell G15 5530 | |
| Aorus 15X ASF | |
| Schenker XMG Pro 15 (i7-12700H, RTX 3080 Ti) | |
| Alienware x16 R1 | |
| MSI Cyborg 15 A12VF | |
| Asus ZenBook Pro 14 Duo UX8402VV-P1021W | |
| Schenker XMG Pro 15 (E23) | |
* ... mindre är bättre
Masslagring
Av alla NVMe SSD-enheter som Schenker erbjuder för XMG Pro 15 är Crucial P5 Plus förmodligen inte det snabbaste alternativet. I tester levererade den dock bra värden som den behöll under längre tidsperioder. I DiskSpd-loopen observerade vi bara minimal strypning efter ganska många körningar.

* ... mindre är bättre
Continuous Performance Read: DiskSpd Read Loop, Queue Depth 8
Grafikkort
Nu kommer vi till kärnfrågan i vår granskning. KanNvidia GeForce RTX 4060 i vår granskningsenhet hålla jämna steg med föregångarensRTX 3080 Ti? Det ärliga svaret på denna fråga är ett tydligt ja och nej. Beroende på benchmark kommer du att behöva räkna med 10 % till 20 % lägre prestanda. När det gäller spel beror skillnaden i prestanda mellan den nuvarande XMG Pro 15 och föregångaren snarare på spelet. Medan något som The Witcher 3 drar nytta av 4060: s högre klockhastighet och uppnår högre bildfrekvenser, i GTA V, släpar Pro 15 E23 något bakom sin föregångare. XMG Pro 15 kan dock också konfigureras med enRTX 4070. DenAorus 15X ASFvisar att skillnaden i prestanda mellan en RTX 3080 Ti och en RTX 4070 är mycket låg - i alla situationer. Eftersom Aorus och XMG Pro 15 arbetar med nästan identiska TDP- och TGP-värden, indikerar detta den möjliga prestanda som kan förväntas i XMG Pro 15 med en RTX 4070.
| 3DMark 11 Performance | 29518 poäng | |
| 3DMark Ice Storm Standard Score | 146918 poäng | |
| 3DMark Cloud Gate Standard Score | 54429 poäng | |
| 3DMark Fire Strike Score | 23131 poäng | |
| 3DMark Time Spy Score | 10776 poäng | |
Hjälp | ||
* ... mindre är bättre
| The Witcher 3 - 1920x1080 Ultra Graphics & Postprocessing (HBAO+) | |
| Genomsnitt av klass Gaming (104.7 - 240, n=7, senaste 2 åren) | |
| Alienware x16 R1 | |
| Schenker XMG Pro 15 (E23) | |
| Asus ZenBook Pro 14 Duo UX8402VV-P1021W | |
| Schenker XMG Pro 15 (i7-12700H, RTX 3080 Ti) | |
| Aorus 15X ASF | |
| Dell G15 5530 | |
| Asus TUF A15 FA507 | |
| MSI Cyborg 15 A12VF | |
| Final Fantasy XV Benchmark - 1920x1080 High Quality | |
| Alienware x16 R1 | |
| Genomsnitt av klass Gaming (41 - 215, n=95, senaste 2 åren) | |
| Aorus 15X ASF | |
| Schenker XMG Pro 15 (i7-12700H, RTX 3080 Ti) | |
| Dell G15 5530 | |
| Asus ZenBook Pro 14 Duo UX8402VV-P1021W | |
| Asus TUF A15 FA507 | |
| MSI Cyborg 15 A12VF | |
| Hogwarts Legacy | |
| 2560x1440 Ultra Preset AA:High T | |
| Genomsnitt av klass Gaming (n=1senaste 2 åren) | |
| Schenker XMG Pro 15 (E23) | |
| Genomsnitt NVIDIA GeForce RTX 4060 Laptop GPU (42.8 - 45, n=4) | |
| 1920x1080 Ultra Preset AA:High T | |
| Genomsnitt av klass Gaming (n=1senaste 2 åren) | |
| Genomsnitt NVIDIA GeForce RTX 4060 Laptop GPU (61.9 - 91.9, n=6) | |
| Schenker XMG Pro 15 (E23) | |
| MSI Cyborg 15 A12VF | |
| Asus TUF A15 FA507 | |
| 1920x1080 High Preset AA:High T | |
| Asus TUF A15 FA507 | |
| Genomsnitt NVIDIA GeForce RTX 4060 Laptop GPU (70.8 - 107.7, n=6) | |
| MSI Cyborg 15 A12VF | |
| Schenker XMG Pro 15 (E23) | |
| låg | med. | hög | ultra | QHD | 4K | |
|---|---|---|---|---|---|---|
| GTA V (2015) | 184.5 | 178.9 | 170.6 | 107.2 | 87 | |
| The Witcher 3 (2015) | 112 | 159.7 | ||||
| Dota 2 Reborn (2015) | 210 | 182.9 | 176.1 | 154.3 | 126.4 | |
| X-Plane 11.11 (2018) | 154.9 | 135.9 | 111 | 102 | ||
| Strange Brigade (2018) | 377 | 267 | 213 | 183.3 | 127.5 | |
| Shadow of the Tomb Raider (2018) | 142 | 94 | ||||
| Cyberpunk 2077 1.6 (2022) | 80.6 | 48.56 | ||||
| Tiny Tina's Wonderlands (2022) | 89.29 | 60.01 | ||||
| F1 22 (2022) | 245 | 235 | 179.8 | 66.4 | 43 | |
| Call of Duty Modern Warfare 2 2022 (2022) | 91 | 66 | ||||
| Hogwarts Legacy (2023) | 90.4 | 70.8 | 64 | 44.4 |
Utsläpp och energi - tysta talare och högljudda fläktar
Utsläpp av buller
Tyvärr visade sig XMG Pro 15 vara mycket högljudd i tester. Med aktiverat prestandaläge under full belastning och på ett avstånd av 15 centimeter uppmätte vi hela 53 dB(A) i Prime95 och Furmark. Fläktarna har dock andra knep i rockärmen. Vår erfarenhet visar att underhållningsläget även ger tillräcklig prestanda för många spel. Detta minskar ljudnivån från den bärbara datorn avsevärt. Vid normal användning utan 3D-applikationer kan du till och med förvänta dig mycket tyst till tyst drift. Detta hjälper den åtminstone att ha näsan lite framför jämfört med föregångaren.
Ljudnivå
| Låg belastning |
| 24 / 24 / 24 dB(A) |
| Hög belastning |
| 53.65 / 53.65 dB(A) |
 | ||
30 dB tyst 40 dB(A) hörbar 50 dB(A) högt ljud |
||
min: | ||
| Schenker XMG Pro 15 (E23) GeForce RTX 4060 Laptop GPU, i9-13900HX, Crucial P5 Plus 1TB CT1000P5PSSD8 | Schenker XMG Pro 15 (i7-12700H, RTX 3080 Ti) GeForce RTX 3080 Ti Laptop GPU, i7-12700H, Samsung SSD 980 Pro 1TB MZ-V8P1T0BW | Dell G15 5530 GeForce RTX 4060 Laptop GPU, i7-13650HX, SSTC CL4-3D512-Q11 | Asus TUF A15 FA507 GeForce RTX 4050 Laptop GPU, R7 7735HS, Micron 2400 MTFDKBA512QFM | Aorus 15X ASF GeForce RTX 4070 Laptop GPU, i7-13700HX, Gigabyte AG470S1TB-SI B10 | Asus ZenBook Pro 14 Duo UX8402VV-P1021W GeForce RTX 4060 Laptop GPU, i9-13900H, Samsung PM9A1 MZVL22T0HBLB | MSI Cyborg 15 A12VF GeForce RTX 4060 Laptop GPU, i7-12650H, Samsung PM9B1 1024GB MZVL41T0HBLB | Alienware x16 R1 GeForce RTX 4080 Laptop GPU, i9-13900HK, SK hynix PC801 HFS001TEJ9X101N | |
|---|---|---|---|---|---|---|---|---|
| Noise | -11% | 7% | 14% | -13% | -13% | -25% | 4% | |
| av / miljö * (dB) | 24 | 23 4% | 20.41 15% | 23.3 3% | 25 -4% | 25.2 -5% | 27 -13% | 22.7 5% |
| Idle Minimum * (dB) | 24 | 23 4% | 26.85 -12% | 23.3 3% | 28 -17% | 25.2 -5% | 27 -13% | 23.1 4% |
| Idle Average * (dB) | 24 | 31.22 -30% | 26.85 -12% | 23.3 3% | 29 -21% | 25.2 -5% | 37.5 -56% | 25.8 -8% |
| Idle Maximum * (dB) | 24 | 33.09 -38% | 26.85 -12% | 23.3 3% | 36 -50% | 32.5 -35% | 38 -58% | 25.8 -8% |
| Load Average * (dB) | 53.65 | 56.35 -5% | 27.65 48% | 29.6 45% | 50 7% | 59.7 -11% | 56.3 -5% | 39.3 27% |
| Witcher 3 ultra * (dB) | 53.53 | 56.89 -6% | 47.9 11% | 43 20% | 54 -1% | 49.9 7% | ||
| Load Maximum * (dB) | 53.65 | 56.89 -6% | 47.86 11% | 43 20% | 58 -8% | 60.9 -14% | 56.3 -5% | 54.8 -2% |
* ... mindre är bättre
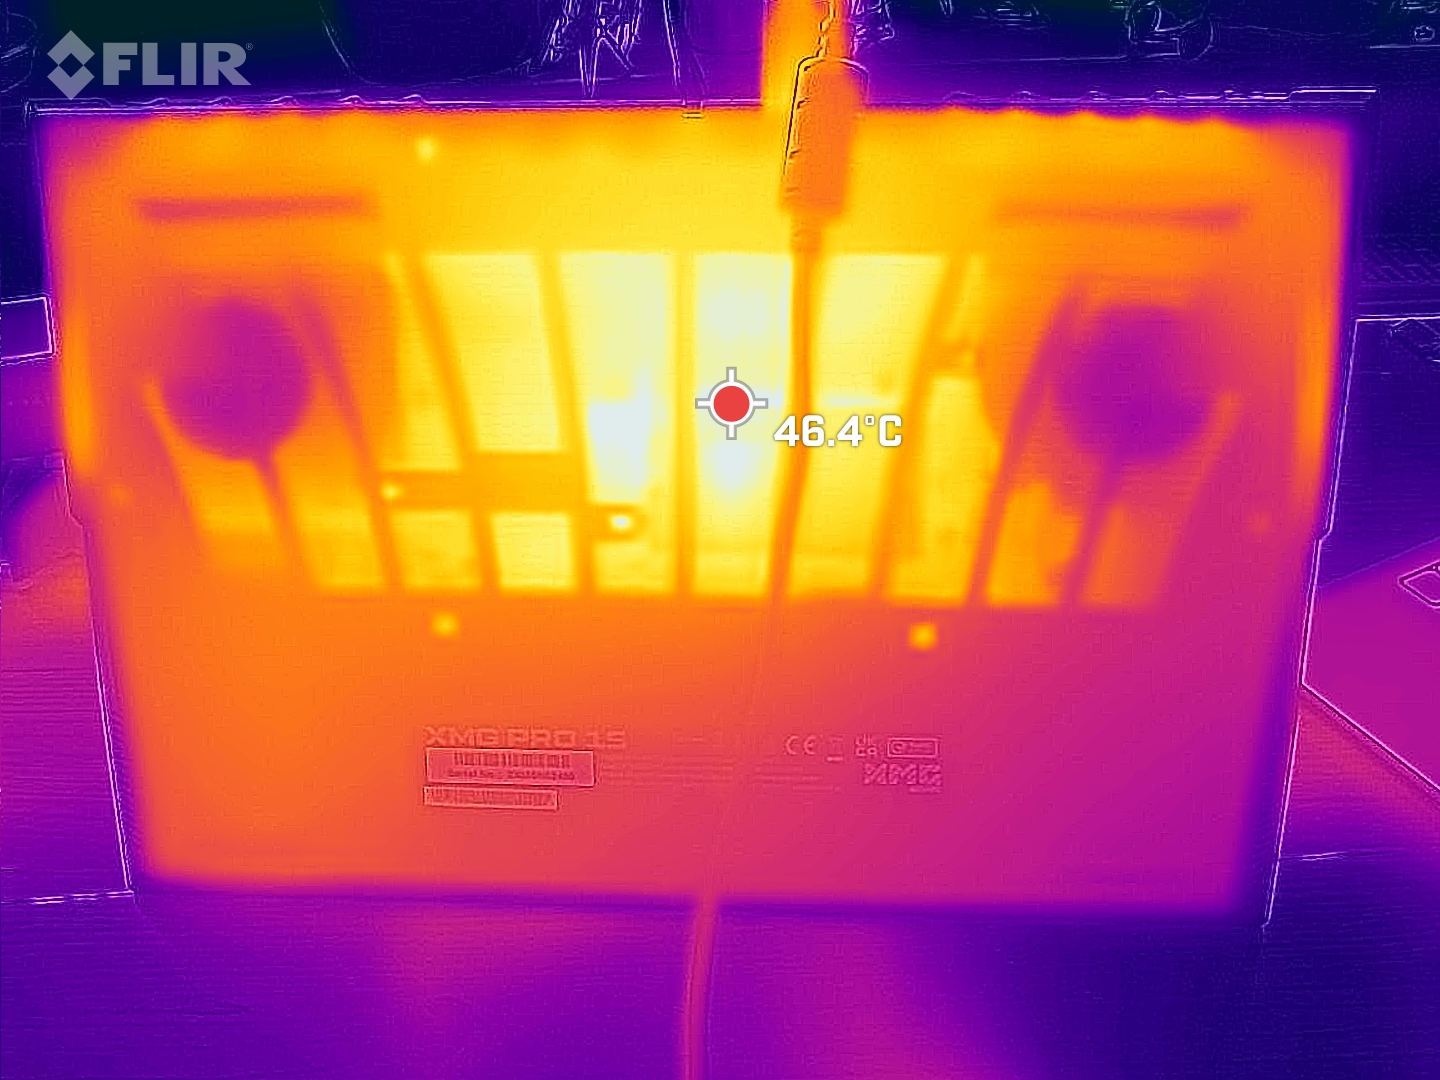
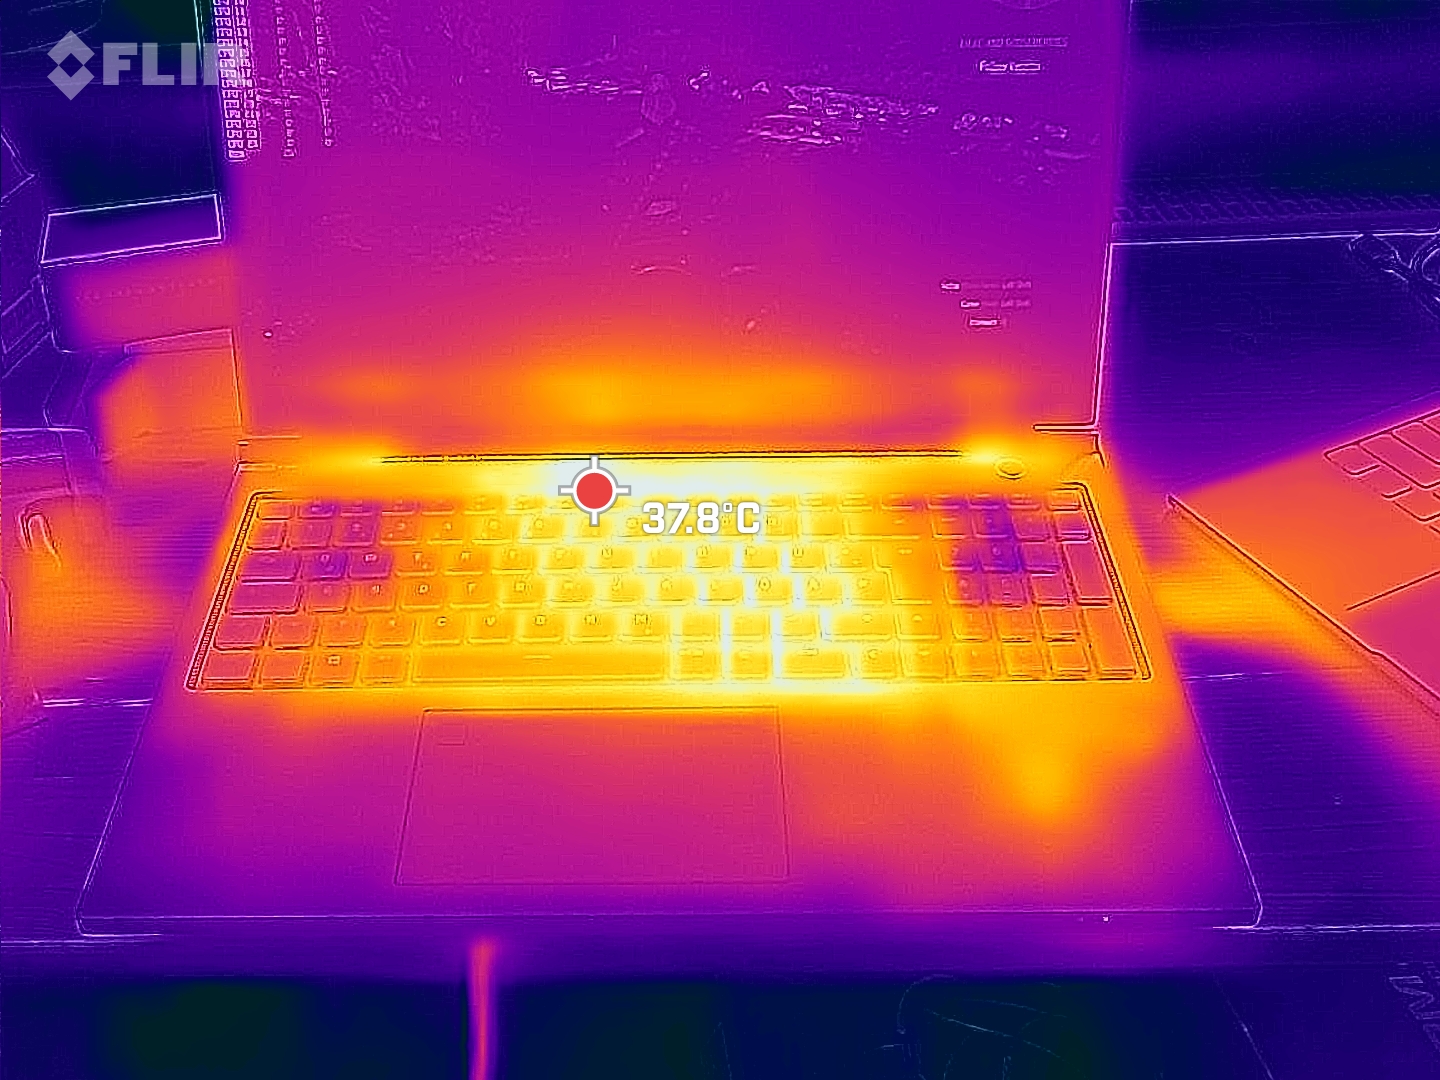
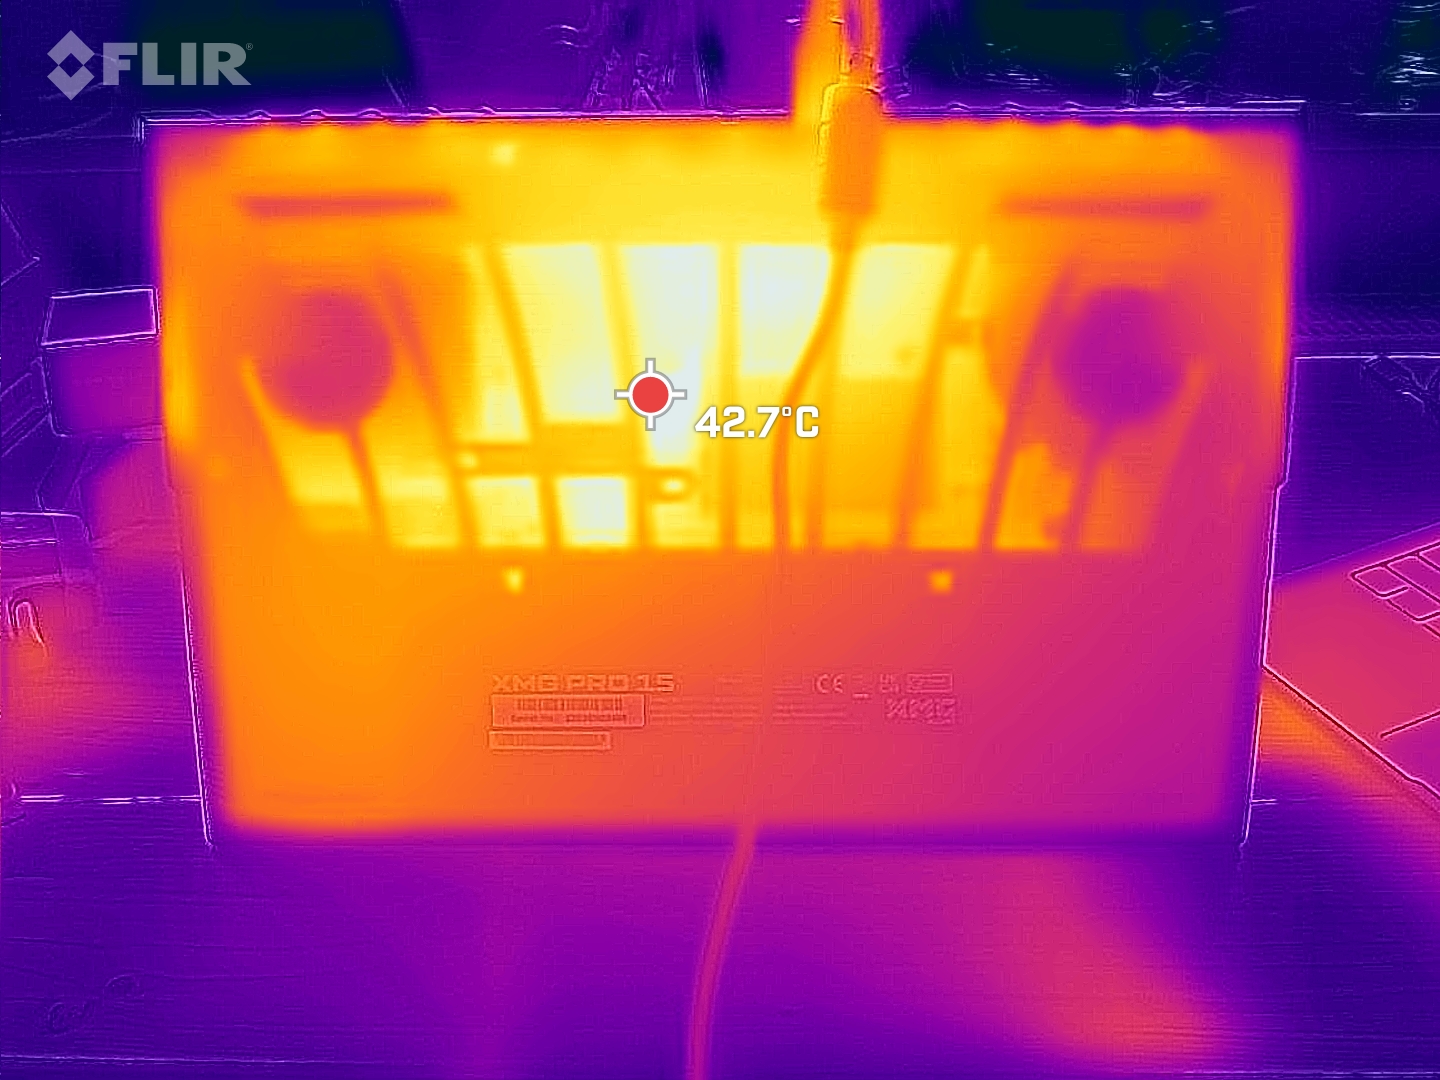
Temperatur
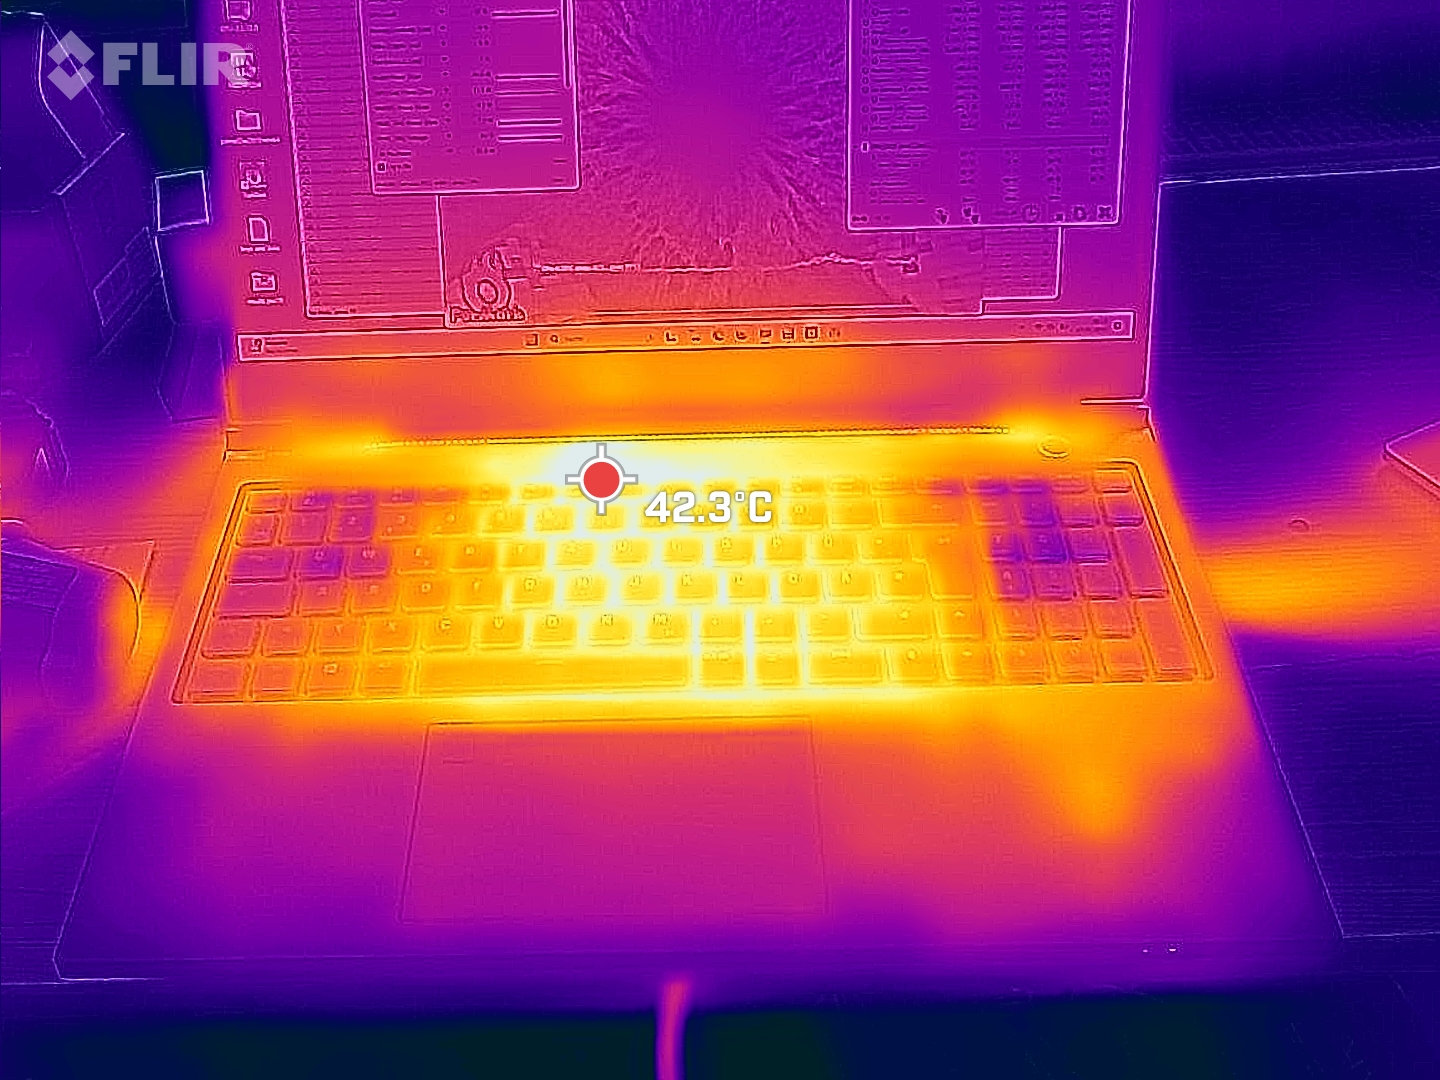
Med yttemperaturer på upp till 50 °C i stresstestet är XMG Pro 15 betydligt varmare än många av sina konkurrenter. Men för det första handlar det bara om relativt små hotspots och för det andra är basenhetens yta tillverkad av plast. Vid kontakt gör detta att de höga temperaturerna upplevs som betydligt lägre. När man spelar skulle det vara fel att beskriva tangentbordet som svalt men det känns dock inte obehagligt varmt. Den bärbara datorns prestanda stryps inte heller över tid.
(-) Den maximala temperaturen på ovansidan är 50 °C / 122 F, jämfört med genomsnittet av 40.4 °C / 105 F , allt från 21.2 till 68.8 °C för klassen Gaming.
(-) Botten värms upp till maximalt 50 °C / 122 F, jämfört med genomsnittet av 43.2 °C / 110 F
(+) Vid tomgångsbruk är medeltemperaturen för ovansidan 28.7 °C / 84 F, jämfört med enhetsgenomsnittet på 33.9 °C / ### class_avg_f### F.
(±) När du spelar The Witcher 3 är medeltemperaturen för ovansidan 35.6 °C / 96 F, jämfört med enhetsgenomsnittet på 33.9 °C / ## #class_avg_f### F.
(+) Handledsstöden och pekplattan når maximal hudtemperatur (34 °C / 93.2 F) och är därför inte varma.
(-) Medeltemperaturen för handledsstödsområdet på liknande enheter var 28.8 °C / 83.8 F (-5.2 °C / -9.4 F).
| Schenker XMG Pro 15 (E23) Intel Core i9-13900HX, NVIDIA GeForce RTX 4060 Laptop GPU | Schenker XMG Pro 15 (i7-12700H, RTX 3080 Ti) Intel Core i7-12700H, NVIDIA GeForce RTX 3080 Ti Laptop GPU | Dell G15 5530 Intel Core i7-13650HX, NVIDIA GeForce RTX 4060 Laptop GPU | Asus TUF A15 FA507 AMD Ryzen 7 7735HS, NVIDIA GeForce RTX 4050 Laptop GPU | Aorus 15X ASF Intel Core i7-13700HX, NVIDIA GeForce RTX 4070 Laptop GPU | Asus ZenBook Pro 14 Duo UX8402VV-P1021W Intel Core i9-13900H, NVIDIA GeForce RTX 4060 Laptop GPU | MSI Cyborg 15 A12VF Intel Core i7-12650H, NVIDIA GeForce RTX 4060 Laptop GPU | Alienware x16 R1 Intel Core i9-13900HK, NVIDIA GeForce RTX 4080 Laptop GPU | |
|---|---|---|---|---|---|---|---|---|
| Heat | -5% | -9% | 11% | 13% | 9% | 15% | -4% | |
| Maximum Upper Side * (°C) | 50 | 57 -14% | 54 -8% | 48.9 2% | 42 16% | 37.1 26% | 47.5 5% | 47.2 6% |
| Maximum Bottom * (°C) | 50 | 52 -4% | 62.2 -24% | 44.6 11% | 51 -2% | 49.4 1% | 35.5 29% | 47.8 4% |
| Idle Upper Side * (°C) | 33 | 32 3% | 33.4 -1% | 27.1 18% | 27 18% | 30 9% | 27.7 16% | 36.8 -12% |
| Idle Bottom * (°C) | 32 | 34 -6% | 33.4 -4% | 27.5 14% | 26 19% | 32.4 -1% | 29.5 8% | 35.8 -12% |
* ... mindre är bättre
Högtalare
Den genomsnittliga upplevda volymen för XMG Pro 15:s två högtalare ligger på endast 72,5 dB(A). Många frekvensområden ligger betydligt under fläktens volym under belastning. Därför är ett headset eller externa högtalare ett måste när du spelar. Dessa kan anslutas via 3,5 mm hörlursuttag, Bluetooth eller optisk S/PDIF via 3,5 mm-kontakten. Med denna metod är det också möjligt att ansluta ett Surround Sound-system direkt till datorn.
Schenker XMG Pro 15 (E23) ljudanalys
(±) | högtalarljudstyrkan är genomsnittlig men bra (72.52 dB)
Bas 100 - 315 Hz
(±) | reducerad bas - i genomsnitt 12.9% lägre än medianen
(±) | linjäriteten för basen är genomsnittlig (7.2% delta till föregående frekvens)
Mellan 400 - 2000 Hz
(±) | högre mellan - i genomsnitt 6.2% högre än median
(±) | linjäriteten för mids är genomsnittlig (7.8% delta till föregående frekvens)
Högsta 2 - 16 kHz
(+) | balanserade toppar - endast 2.5% från medianen
(+) | toppar är linjära (4.6% delta till föregående frekvens)
Totalt 100 - 16 000 Hz
(±) | linjäriteten för det totala ljudet är genomsnittlig (18% skillnad mot median)
Jämfört med samma klass
» 56% av alla testade enheter i den här klassen var bättre, 9% liknande, 36% sämre
» Den bästa hade ett delta på 6%, genomsnittet var 18%, sämst var 132%
Jämfört med alla testade enheter
» 38% av alla testade enheter var bättre, 8% liknande, 54% sämre
» Den bästa hade ett delta på 4%, genomsnittet var 23%, sämst var 134%
Asus ZenBook Pro 14 Duo UX8402VV-P1021W ljudanalys
(+) | högtalare kan spela relativt högt (83.7 dB)
Bas 100 - 315 Hz
(-) | nästan ingen bas - i genomsnitt 19.9% lägre än medianen
(±) | linjäriteten för basen är genomsnittlig (11.9% delta till föregående frekvens)
Mellan 400 - 2000 Hz
(+) | balanserad mellan - endast 1.2% från medianen
(+) | mids är linjära (4.7% delta till föregående frekvens)
Högsta 2 - 16 kHz
(±) | högre toppar - i genomsnitt 5.5% högre än medianen
(+) | toppar är linjära (5.9% delta till föregående frekvens)
Totalt 100 - 16 000 Hz
(±) | linjäriteten för det totala ljudet är genomsnittlig (16.1% skillnad mot median)
Jämfört med samma klass
» 41% av alla testade enheter i den här klassen var bättre, 6% liknande, 53% sämre
» Den bästa hade ett delta på 5%, genomsnittet var 17%, sämst var 45%
Jämfört med alla testade enheter
» 26% av alla testade enheter var bättre, 5% liknande, 69% sämre
» Den bästa hade ett delta på 4%, genomsnittet var 23%, sämst var 134%
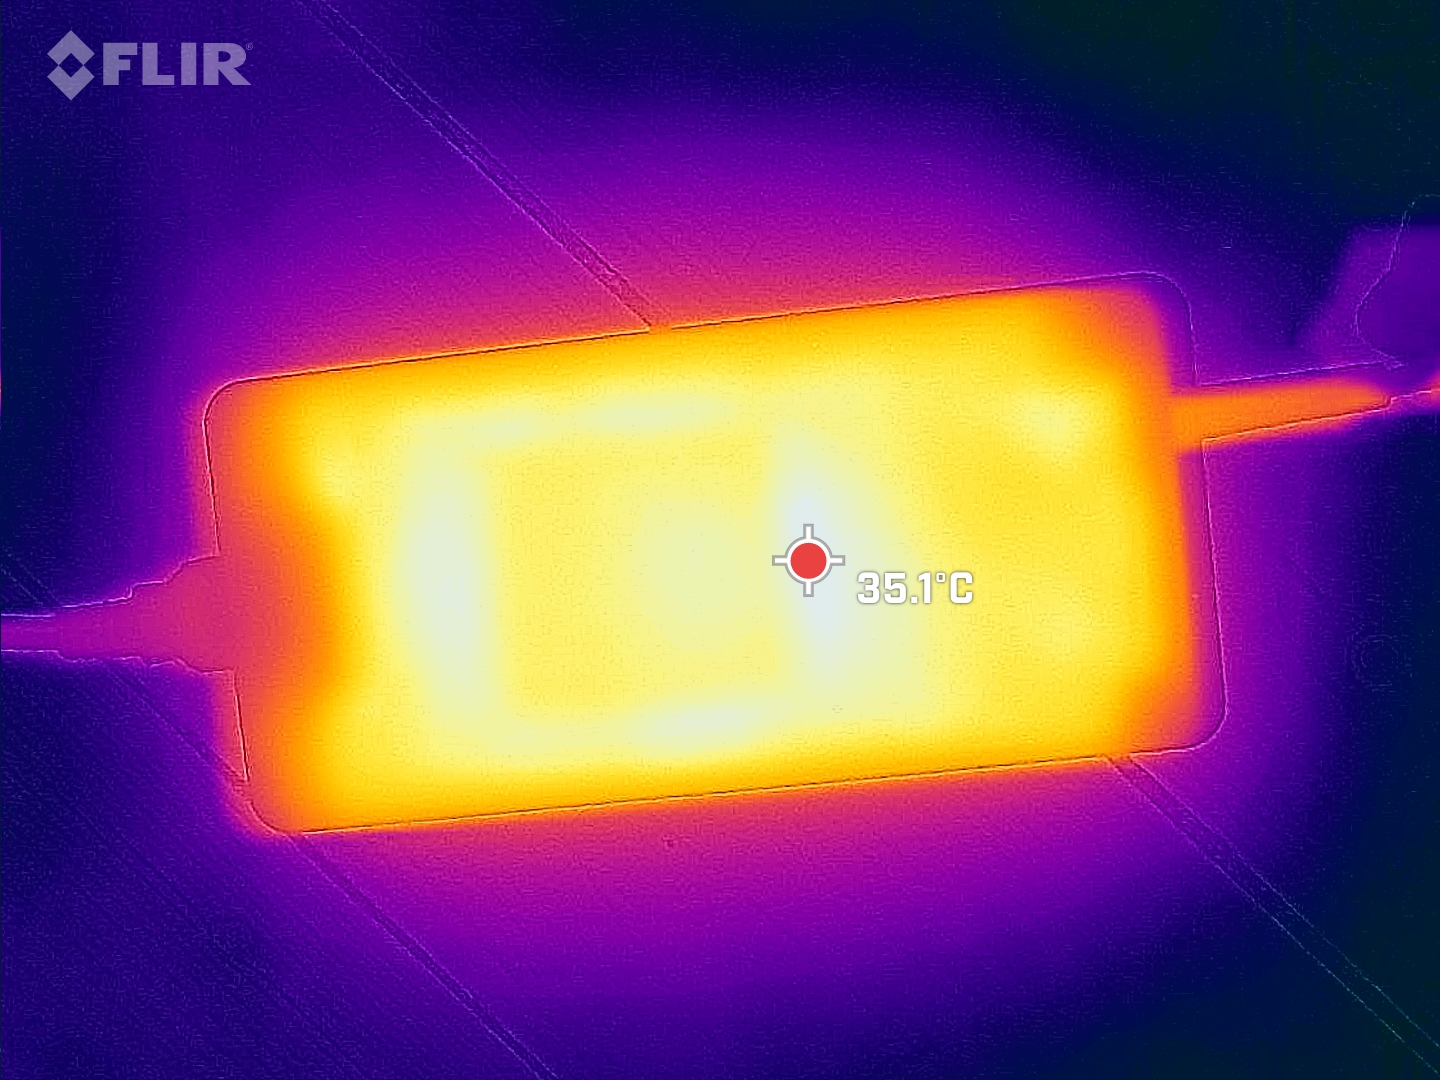
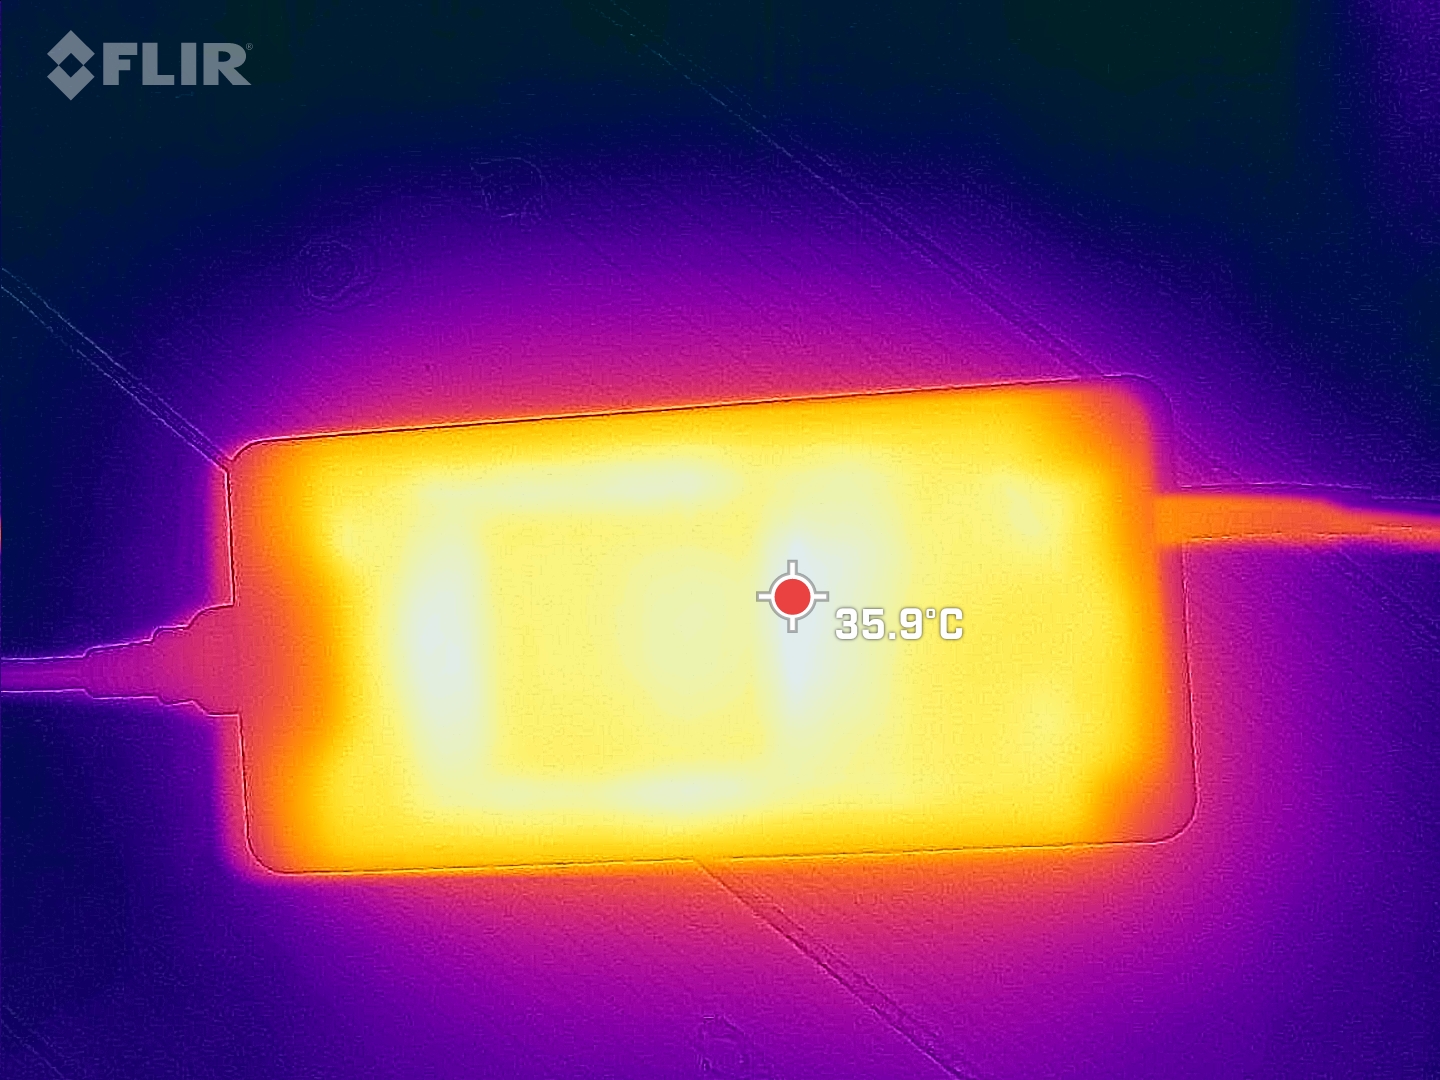
Strömförbrukning
I enlighet med sin kategori är Schenker XMG Pro 15 inte ett energibesparande mirakel. Ett stort nätaggregat ingår som kan leverera upp till 280 watt. När den används med gaminglaptopen betyder det att den fortfarande har lite kvar i reserv. I Prime95-stresstestet och Furmark drog den maximalt 269 watt, men var mer som 215 watt i genomsnitt.
| Av/Standby | |
| Låg belastning | |
| Hög belastning |
|
Förklaring:
min: | |
Power consumption Witcher 3 / stress test
Power consumption with an external monitor
Batteriets livslängd
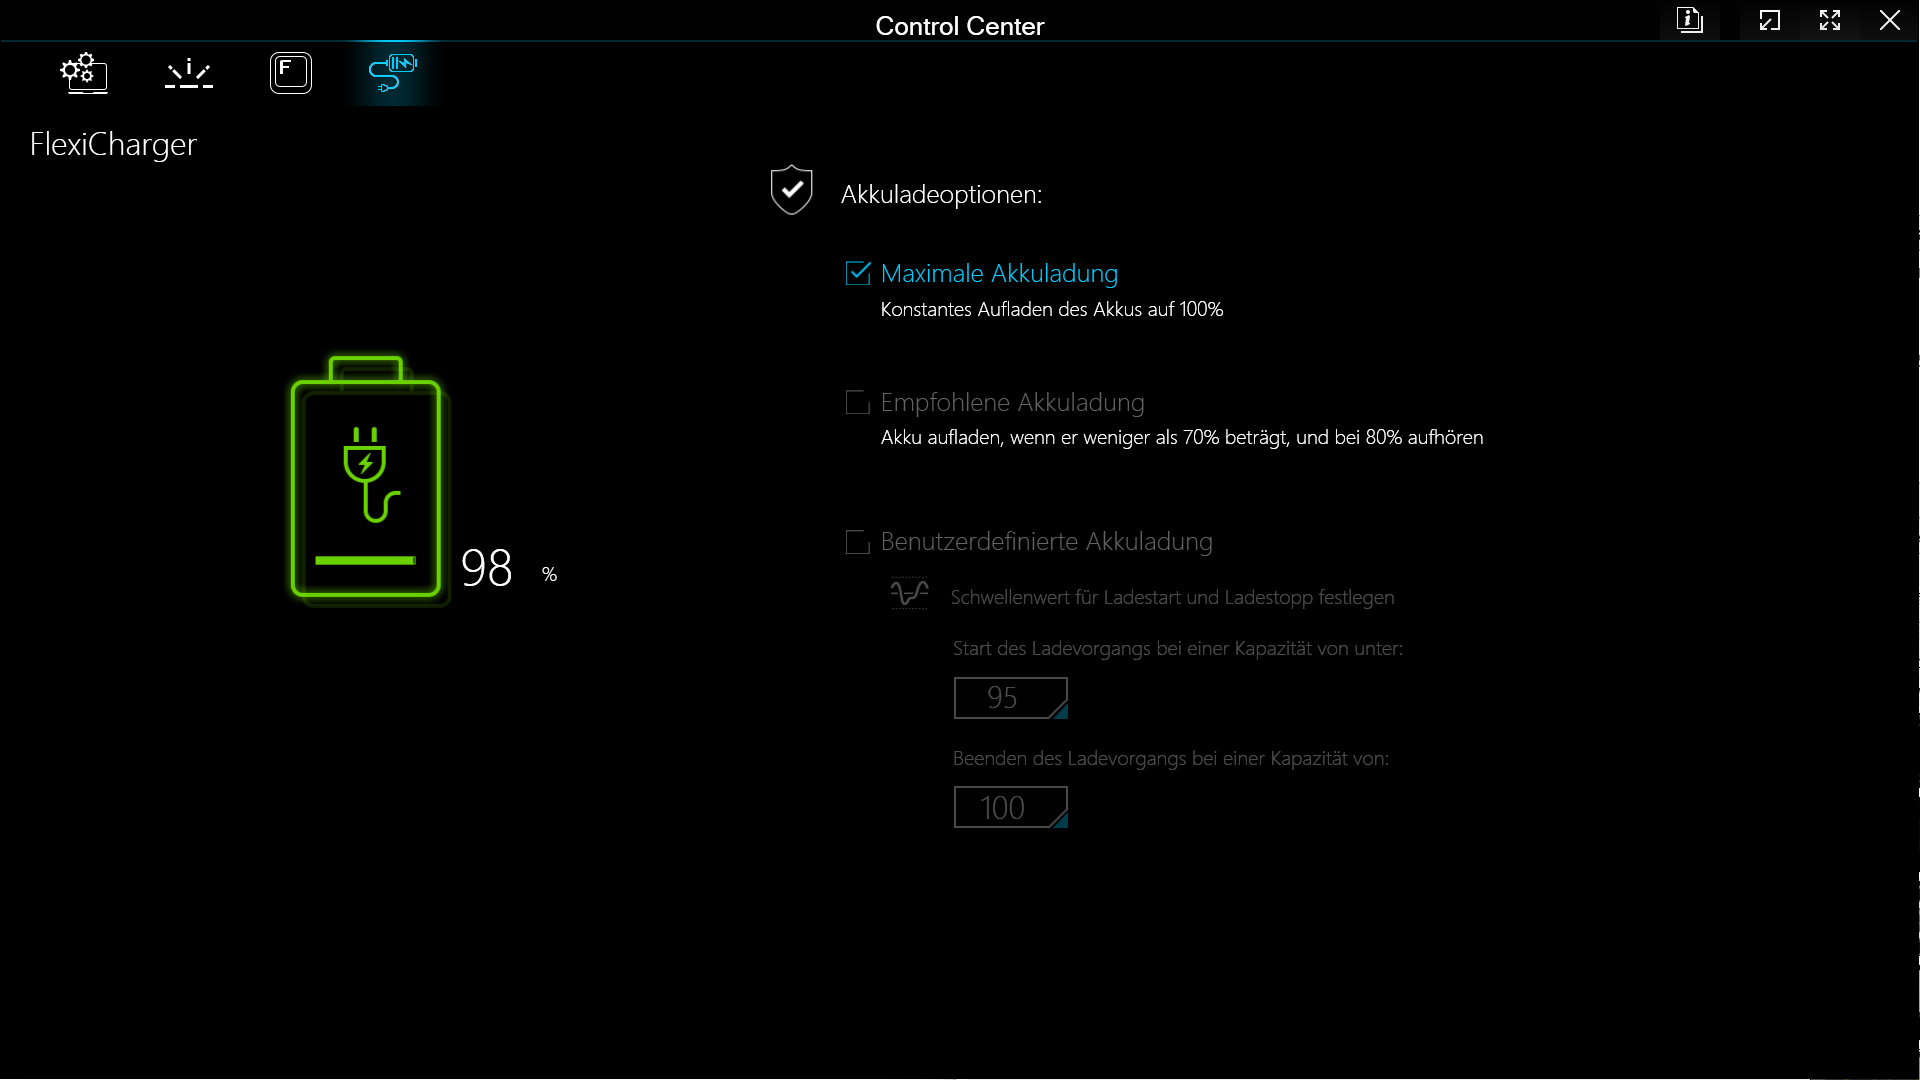
I vårt Wi-Fi-test för internetsurfning klarade XMG Pro 15 E23 inte mer än sex timmar. Man kan dock inte förvänta sig mycket annat av ett 80 Wh-batteri. Med detta sagt har granskningsenheten ett litet problem när det gäller dGPU: s viloläge. Det är inte alltid påslaget på ett tillförlitligt sätt men Schenker är medveten om problemet och arbetar på en lösning.
| Schenker XMG Pro 15 (E23) i9-13900HX, GeForce RTX 4060 Laptop GPU, 80 Wh | Schenker XMG Pro 15 (i7-12700H, RTX 3080 Ti) i7-12700H, GeForce RTX 3080 Ti Laptop GPU, 80 Wh | Dell G15 5530 i7-13650HX, GeForce RTX 4060 Laptop GPU, 86 Wh | Asus TUF A15 FA507 R7 7735HS, GeForce RTX 4050 Laptop GPU, 90 Wh | Aorus 15X ASF i7-13700HX, GeForce RTX 4070 Laptop GPU, 99 Wh | Asus ZenBook Pro 14 Duo UX8402VV-P1021W i9-13900H, GeForce RTX 4060 Laptop GPU, 76 Wh | MSI Cyborg 15 A12VF i7-12650H, GeForce RTX 4060 Laptop GPU, 53.5 Wh | Alienware x16 R1 i9-13900HK, GeForce RTX 4080 Laptop GPU, 90 Wh | Genomsnitt av klass Gaming | |
|---|---|---|---|---|---|---|---|---|---|
| Batteridrifttid | -2% | -22% | 29% | 25% | 71% | 27% | -60% | 2% | |
| WiFi v1.3 (h) | 5.7 | 5.8 2% | 6.5 14% | 11.7 105% | 8.2 44% | 9 58% | 7.5 32% | 2.5 -56% | 7.11 ? 25% |
| Load (h) | 1.9 | 1.8 -5% | 0.8 -58% | 1 -47% | 2 5% | 3.5 84% | 2.3 21% | 0.7 -63% | 1.502 ? -21% |
| H.264 (h) | 5.3 | 6.8 | 12.5 | 7.9 | 8 | 8.32 ? | |||
| Witcher 3 ultra (h) | 0.8 | ||||||||
| Reader / Idle (h) | 11.3 | 13.6 | 7.3 | 8.27 ? |
För
Emot
Omdöme - perfekt för balans mellan arbete och fritid
XMG Pro 15 E23 marknadsförs som en gaming-arbetsstation. I vår recension uppfyller den alla krav för en bra bärbar dator för spel i mellanklassen, men även många aspekter som gör den till en anständig bärbar dator för video- och filmarbete. Den anspråkslösa designen återspeglar inte på något sätt 15,6-tumsenhetens dundrande prestanda. Schenker har förfinat en solid barebone som levereras med bra inmatningsenheter och ett starkt urval av portar samt premiumkomponenter.
Några av föregångarens nackdelar har antingen reducerats avsevärt eller helt eliminerats. Nu körs SSD-enheten stabilt i höga hastigheter, skärmen är ljusare och volymen har justerats något. Den bärbara speldatorn kanske fortfarande inte är tyst, men den vet nu när den ska bete sig ordentligt.
Några av XMG Pro 15 E23:s ojämna kanter har slätats ut, vilket innebär att den bärbara speldatorn nu bara kommer med några mindre irritationsmoment.
Det finns inga tydliga negativa punkter som sticker ut. En saknad USB-port på baksidan är ganska olycklig, vilket innebär att endast en trådlös mus- och tangentbordsinställning kommer att resultera i ett kabelfritt skrivbord. Den som inte permanent vill pressa den bärbara datorn till dess prestandagränser kommer att njuta av att använda det tysta underhållningsläget. De flesta spel fungerar också bra. Det är bara QHD-skärmens långsamma svarstider på 240 Hz som stör oss. Under tiden är skillnaden till konkurrenter somAorus 15X ASF eller MSI Cyborg 15 kan bara hittas i detaljerna. Den som har ett öga på en mer spännande bärbar dator för spel skulle vara bättre att ta en titt påAlienware x16 R1 ellerAsus ROG Strix G16- men du kommer inte att belönas med så mycket mer kraft.
Pris och tillgänglighet
XMG Pro 15 kan konfigureras på Bestware. Utan Windows, en SSD och den minsta mängden RAM börjar den bärbara datorn på 1 893 euro. Vår granskningsenhet utan Windows 11 kommer in på 2 150 euro. För en aktiverad Windows 11 Home begär Bestware ytterligare 100 euro. Schenker följer uppenbarligen inte den uppåtgående prisspiralen. Förra året var Pro 15 E22med en RTX 3070 Ti, 32 GB RAM och en 1 TB SSD kostade 2 510 euro. För E23 med en RTX 4070, 32 GB RAM och en 1 TB SSD har Bestware ett begärt pris på 2 400 euro.
Schenker XMG Pro 15 (E23)
- 07/04/2023 v7 (old)
Marc Herter
Genomskinlighet
Valet av enheter som ska granskas görs av vår redaktion. Testprovet gavs till författaren som ett lån av tillverkaren eller återförsäljaren för denna recension. Långivaren hade inget inflytande på denna recension och inte heller fick tillverkaren en kopia av denna recension innan publiceringen. Det fanns ingen skyldighet att publicera denna recension. Som ett oberoende medieföretag är Notebookcheck inte föremål för auktoritet från tillverkare, återförsäljare eller förlag.
This is how Notebookcheck is testingEvery year, Notebookcheck independently reviews hundreds of laptops and smartphones using standardized procedures to ensure that all results are comparable. We have continuously developed our test methods for around 20 years and set industry standards in the process. In our test labs, high-quality measuring equipment is utilized by experienced technicians and editors. These tests involve a multi-stage validation process. Our complex rating system is based on hundreds of well-founded measurements and benchmarks, which maintains objectivity.
Price comparison

