Recension av Asus ROG Zephyrus Duo 16: En ovanlig bärbar dator med bra batteritid

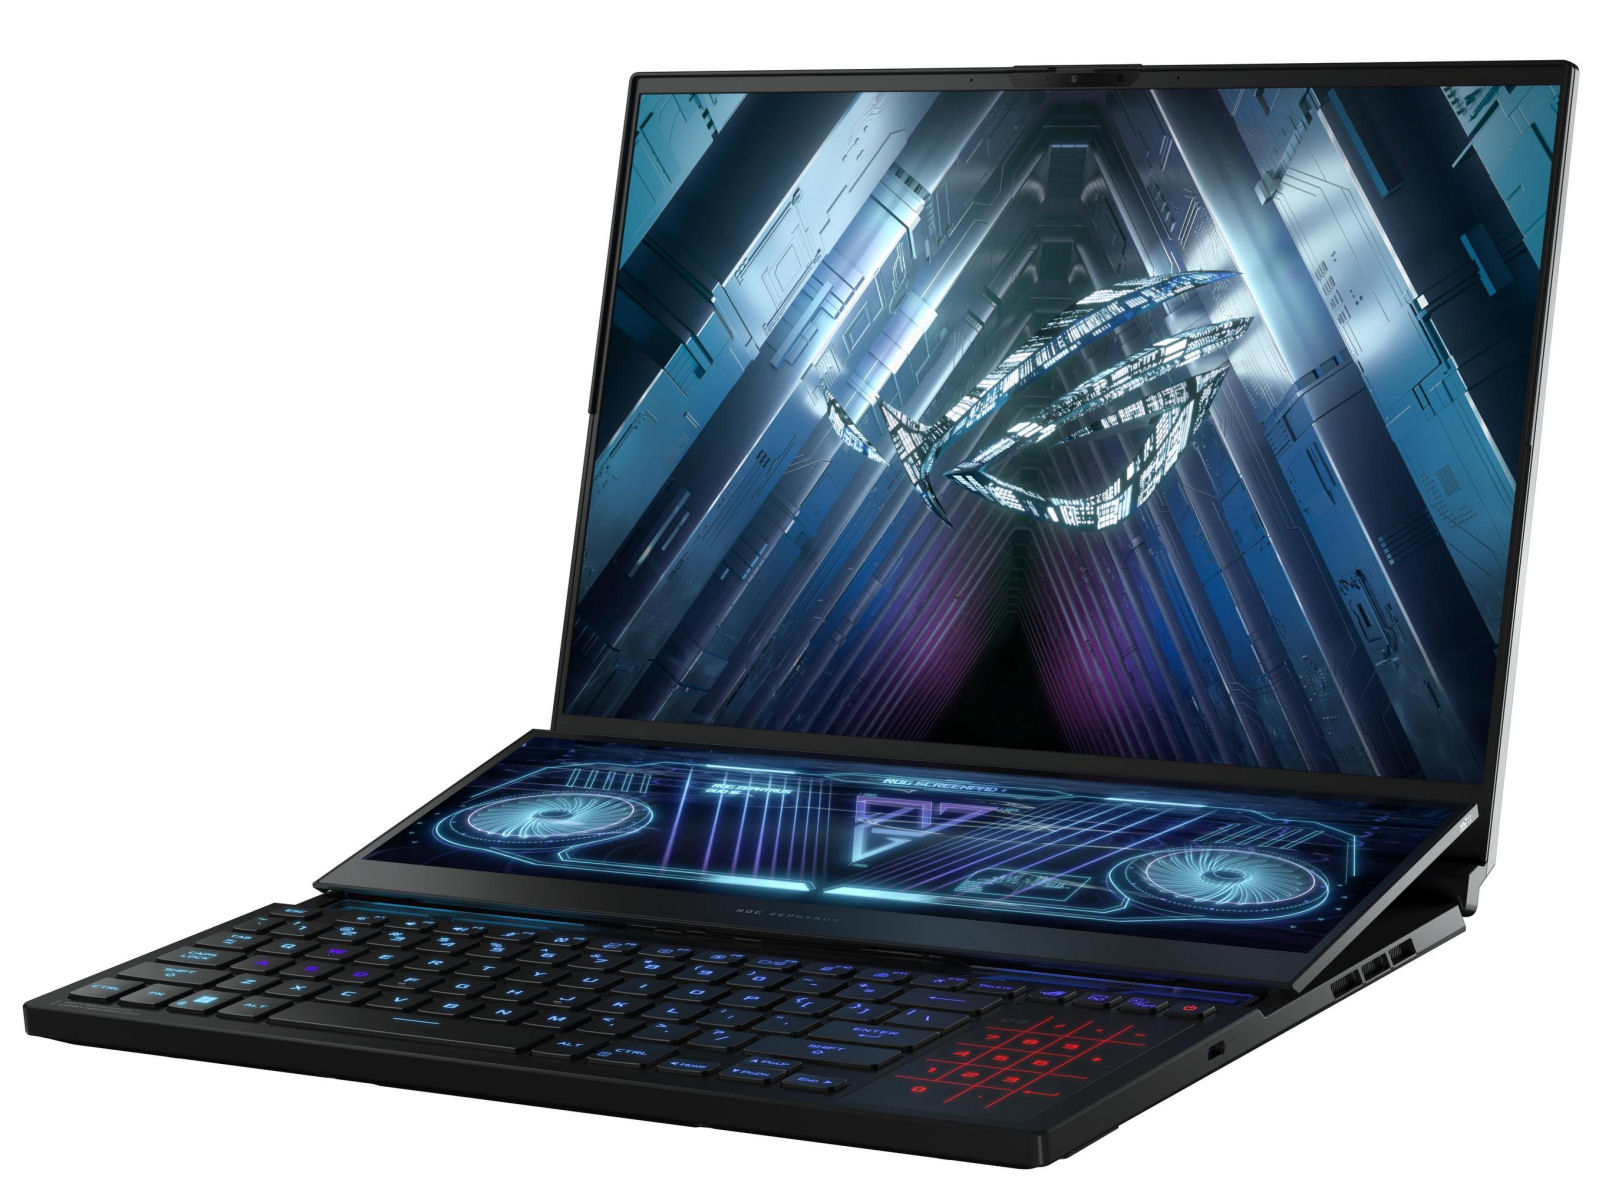
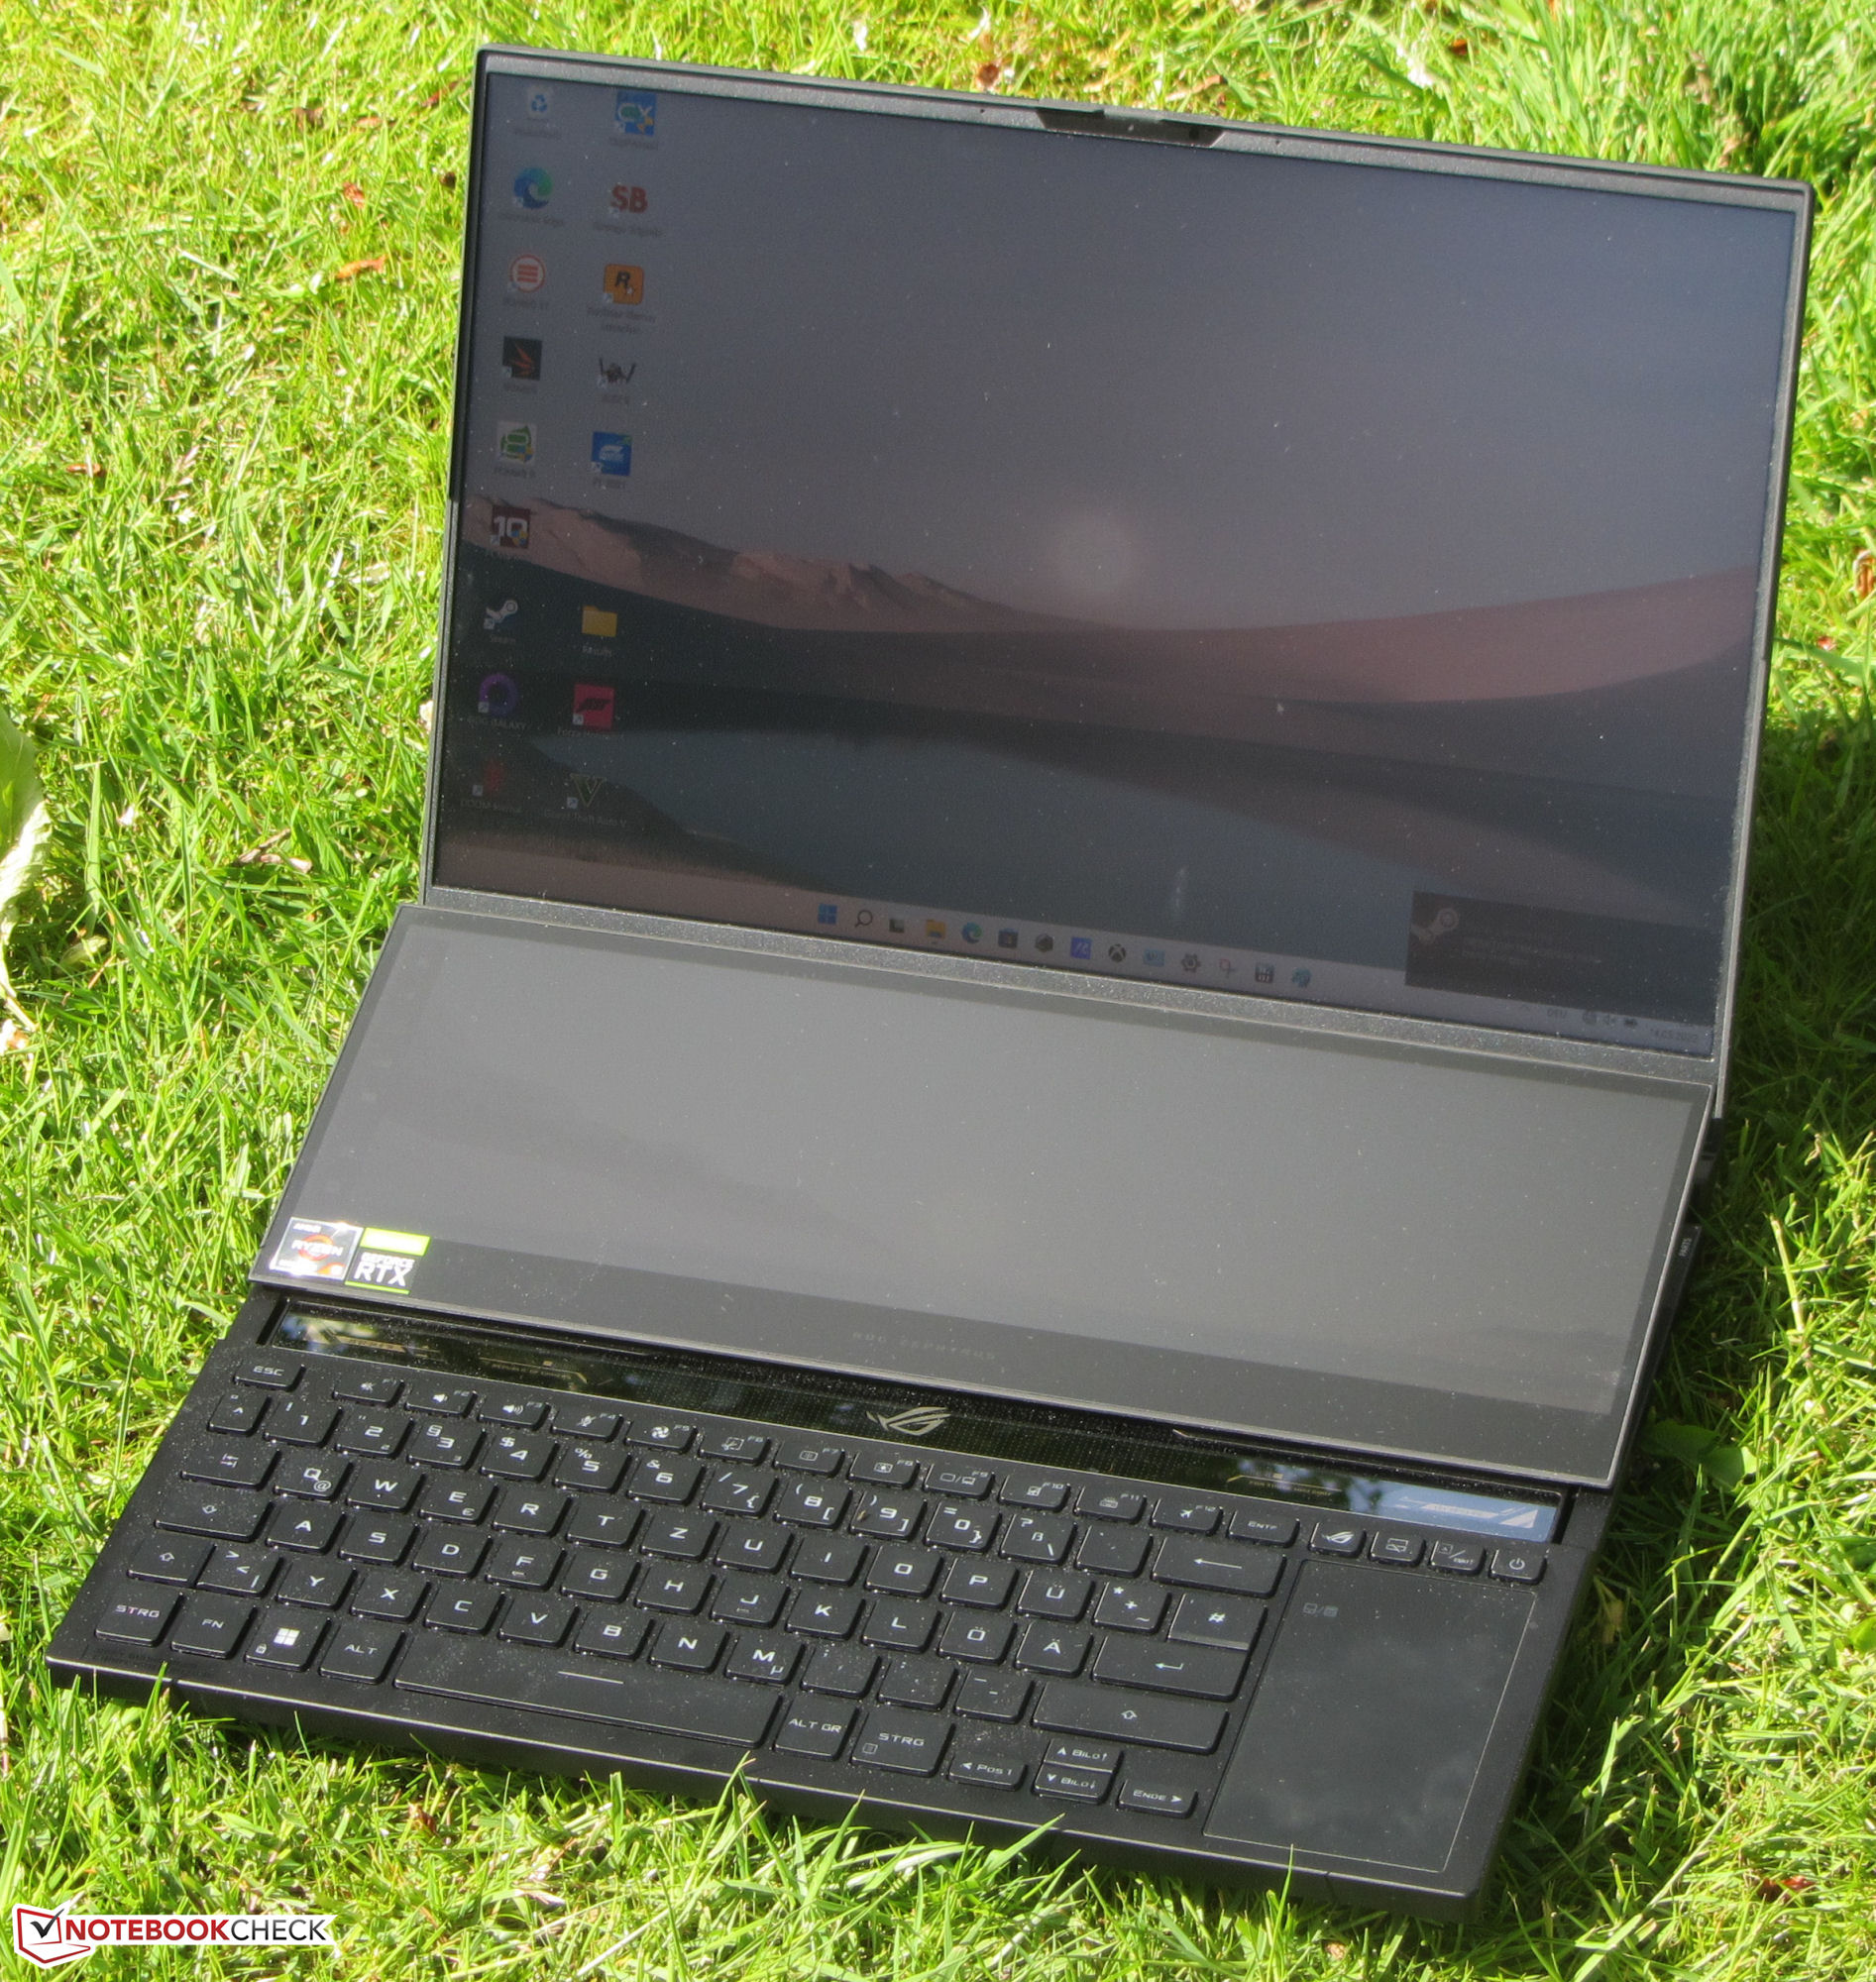
Med Zephyrus Duo 16 presenterar Asus en bärbar dator för spelare, streamers och innehållsskapare, vars mest slående egenskap är omedelbart uppenbar: Den mest utmärkande egenskapen är den som är tydligast på första parkett: ovanför tangentbordet finns en andra skärm med pekskärmsfunktion (Screenpad Plus). Bland konkurrenterna finns enheter som t.ex Razer Blade 15 Advanced Model, denGigabyte Aero 16 YE5, denMSI GE76 Raider, denMedion Erazer Beast X30och Apple MacBook Pro 16 2021.
Jämförelse med potentiella konkurrenter
Gradering | Datum | Modell | Vikt | Höjd | Storlek | Upplösning | Pris |
|---|---|---|---|---|---|---|---|
| 88.2 % v7 (old) | 05/2022 | Asus ROG Zephyrus Duo 16 GX650RX R9 6900HX, GeForce RTX 3080 Ti Laptop GPU | 2.6 kg | 20.5 mm | 16.00" | 3840x2400 | |
| 92.5 % v7 (old) | 11/2021 | Apple MacBook Pro 16 2021 M1 Max M1 Max, M1 Max 32-Core GPU | 2.2 kg | 16.8 mm | 16.20" | 3456x2234 | |
| 88.3 % v7 (old) | 05/2022 | Razer Blade 15 Advanced Model Early 2022 i7-12800H, GeForce RTX 3080 Ti Laptop GPU | 2.1 kg | 16.99 mm | 15.60" | 1920x1080 | |
| 87.5 % v7 (old) | 01/2022 | MSI GE76 Raider i9-12900HK, GeForce RTX 3080 Ti Laptop GPU | 3 kg | 26 mm | 17.30" | 1920x1080 | |
| 86.7 % v7 (old) | 05/2022 | Medion Erazer Beast X30 i9-12900HK, GeForce RTX 3080 Ti Laptop GPU | 2.2 kg | 23 mm | 17.30" | 2560x1440 | |
| 84.7 % v7 (old) | 03/2022 | Gigabyte Aero 16 YE5 i9-12900HK, GeForce RTX 3080 Ti Laptop GPU | 2.3 kg | 22.4 mm | 16.00" | 3840x2400 |
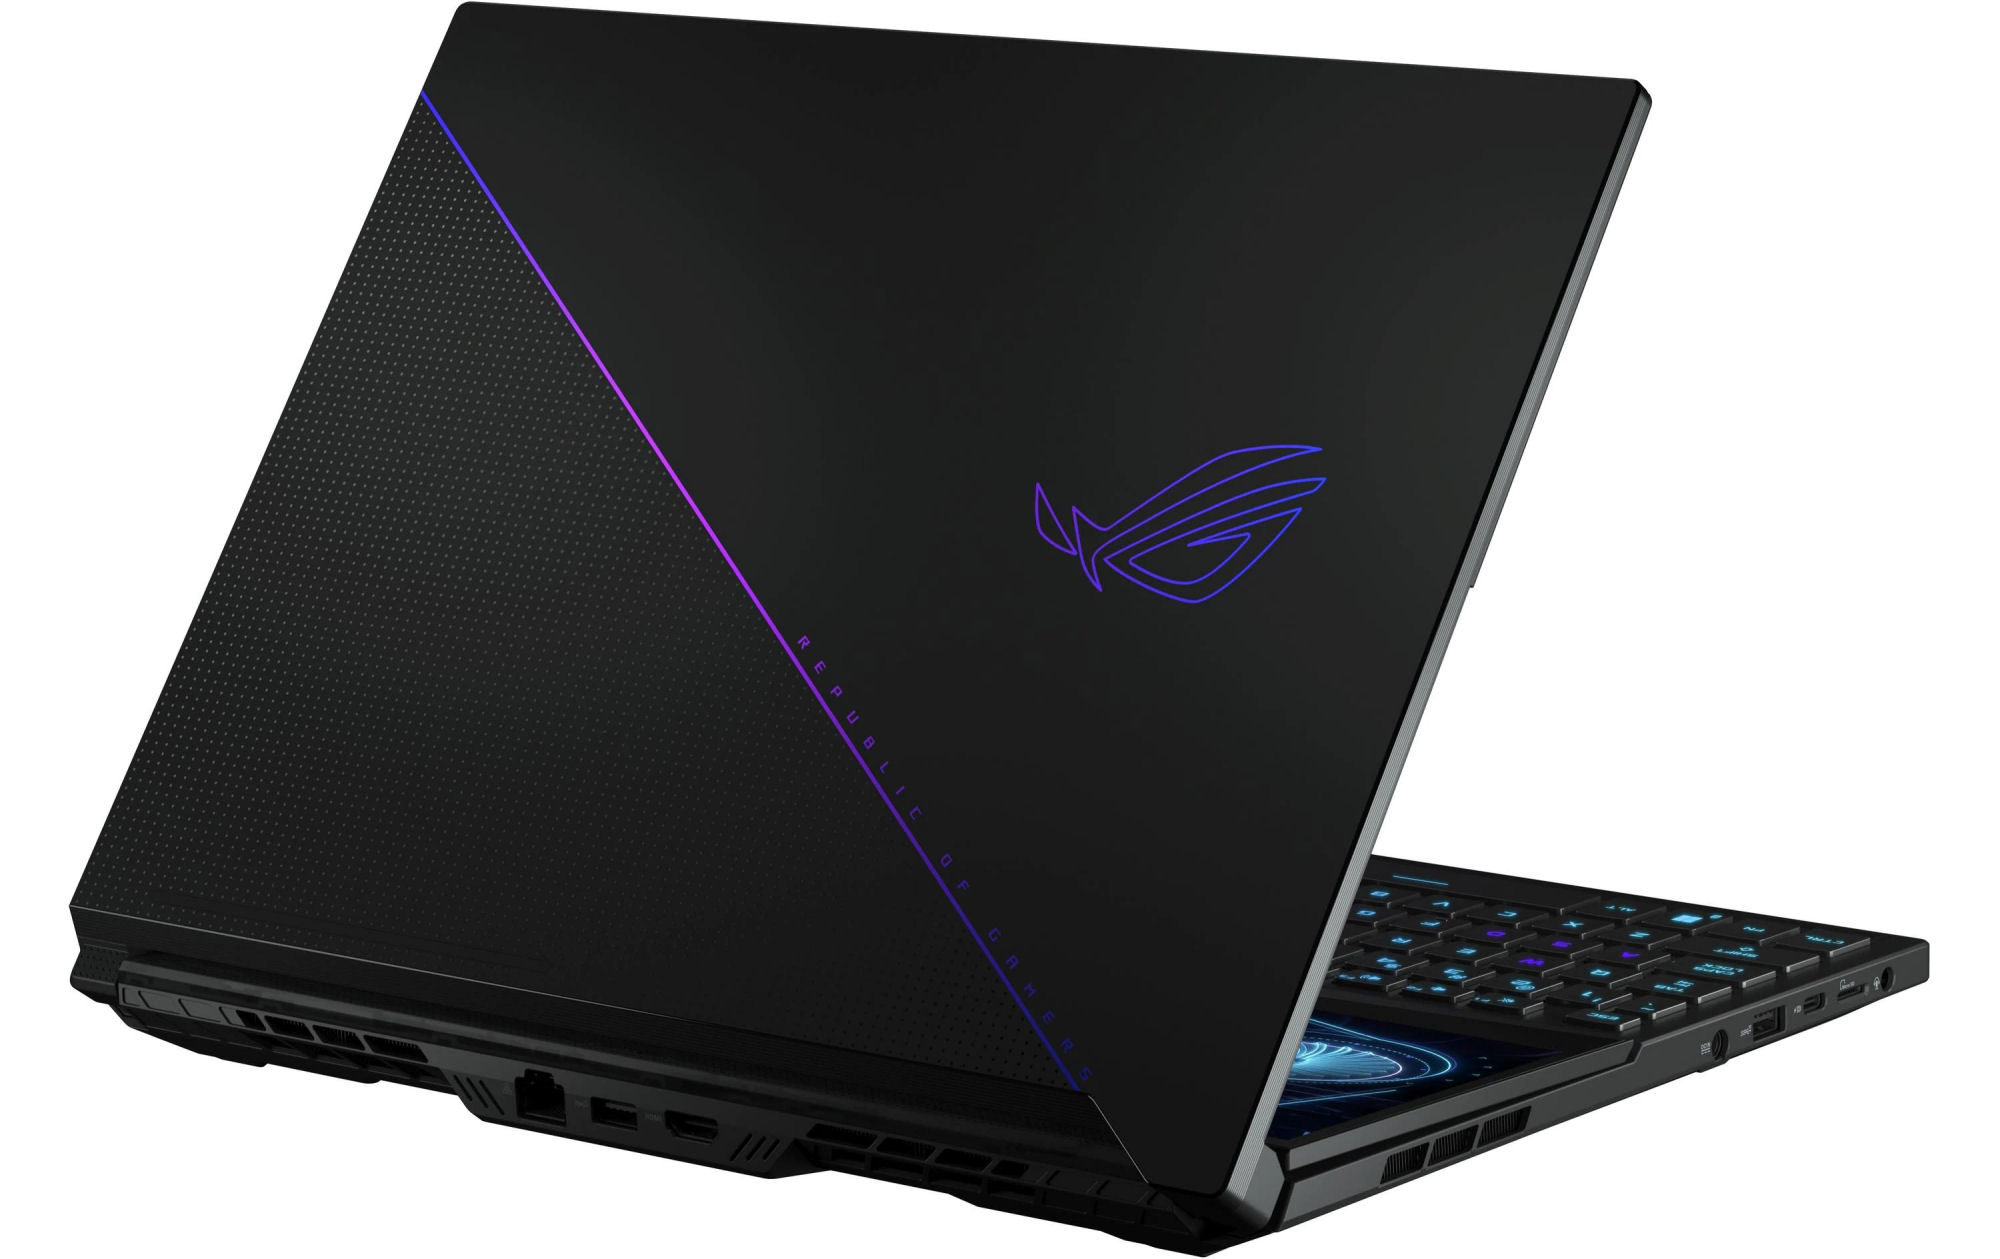
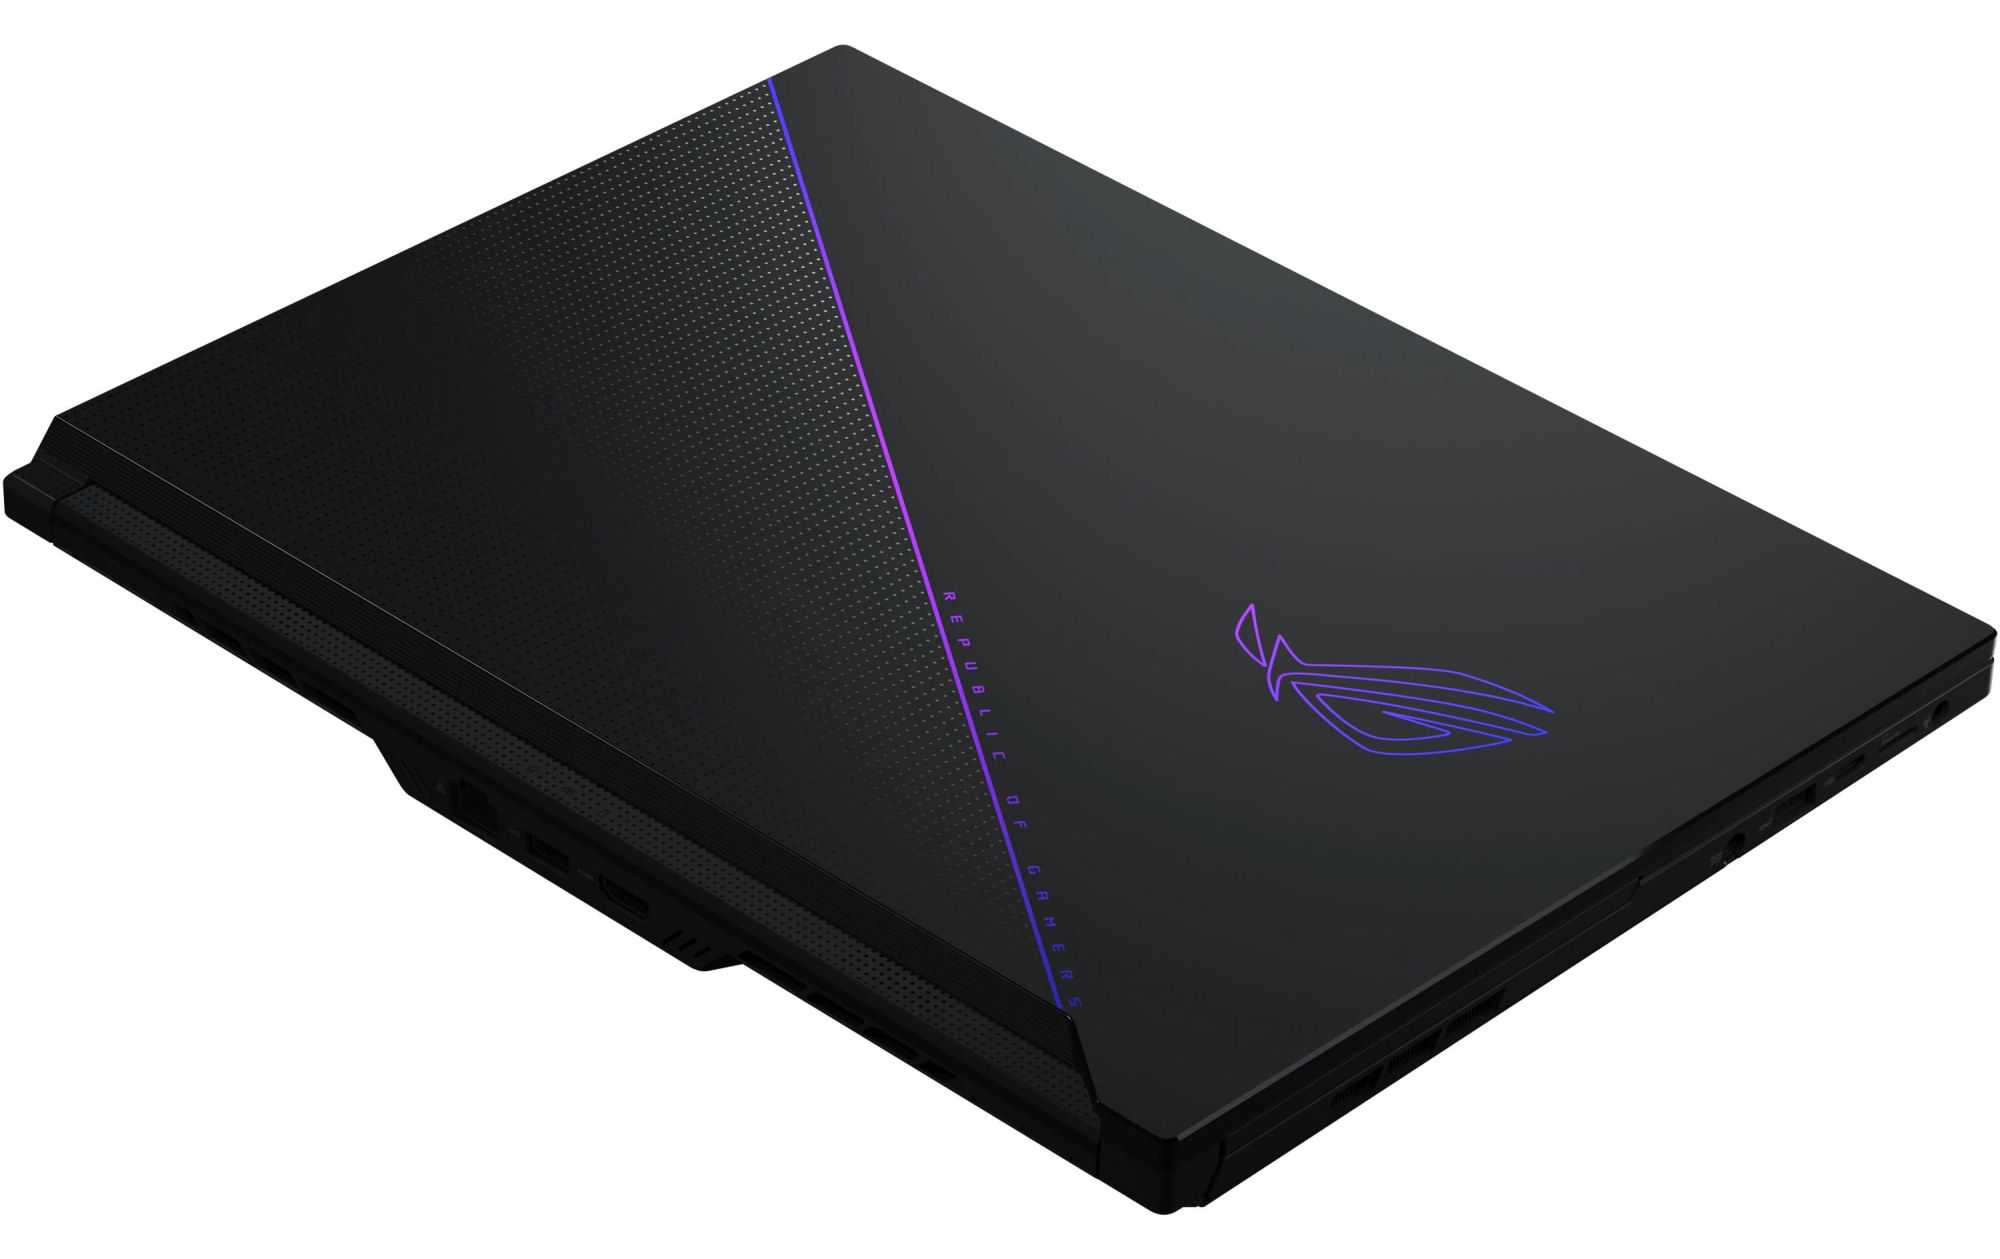
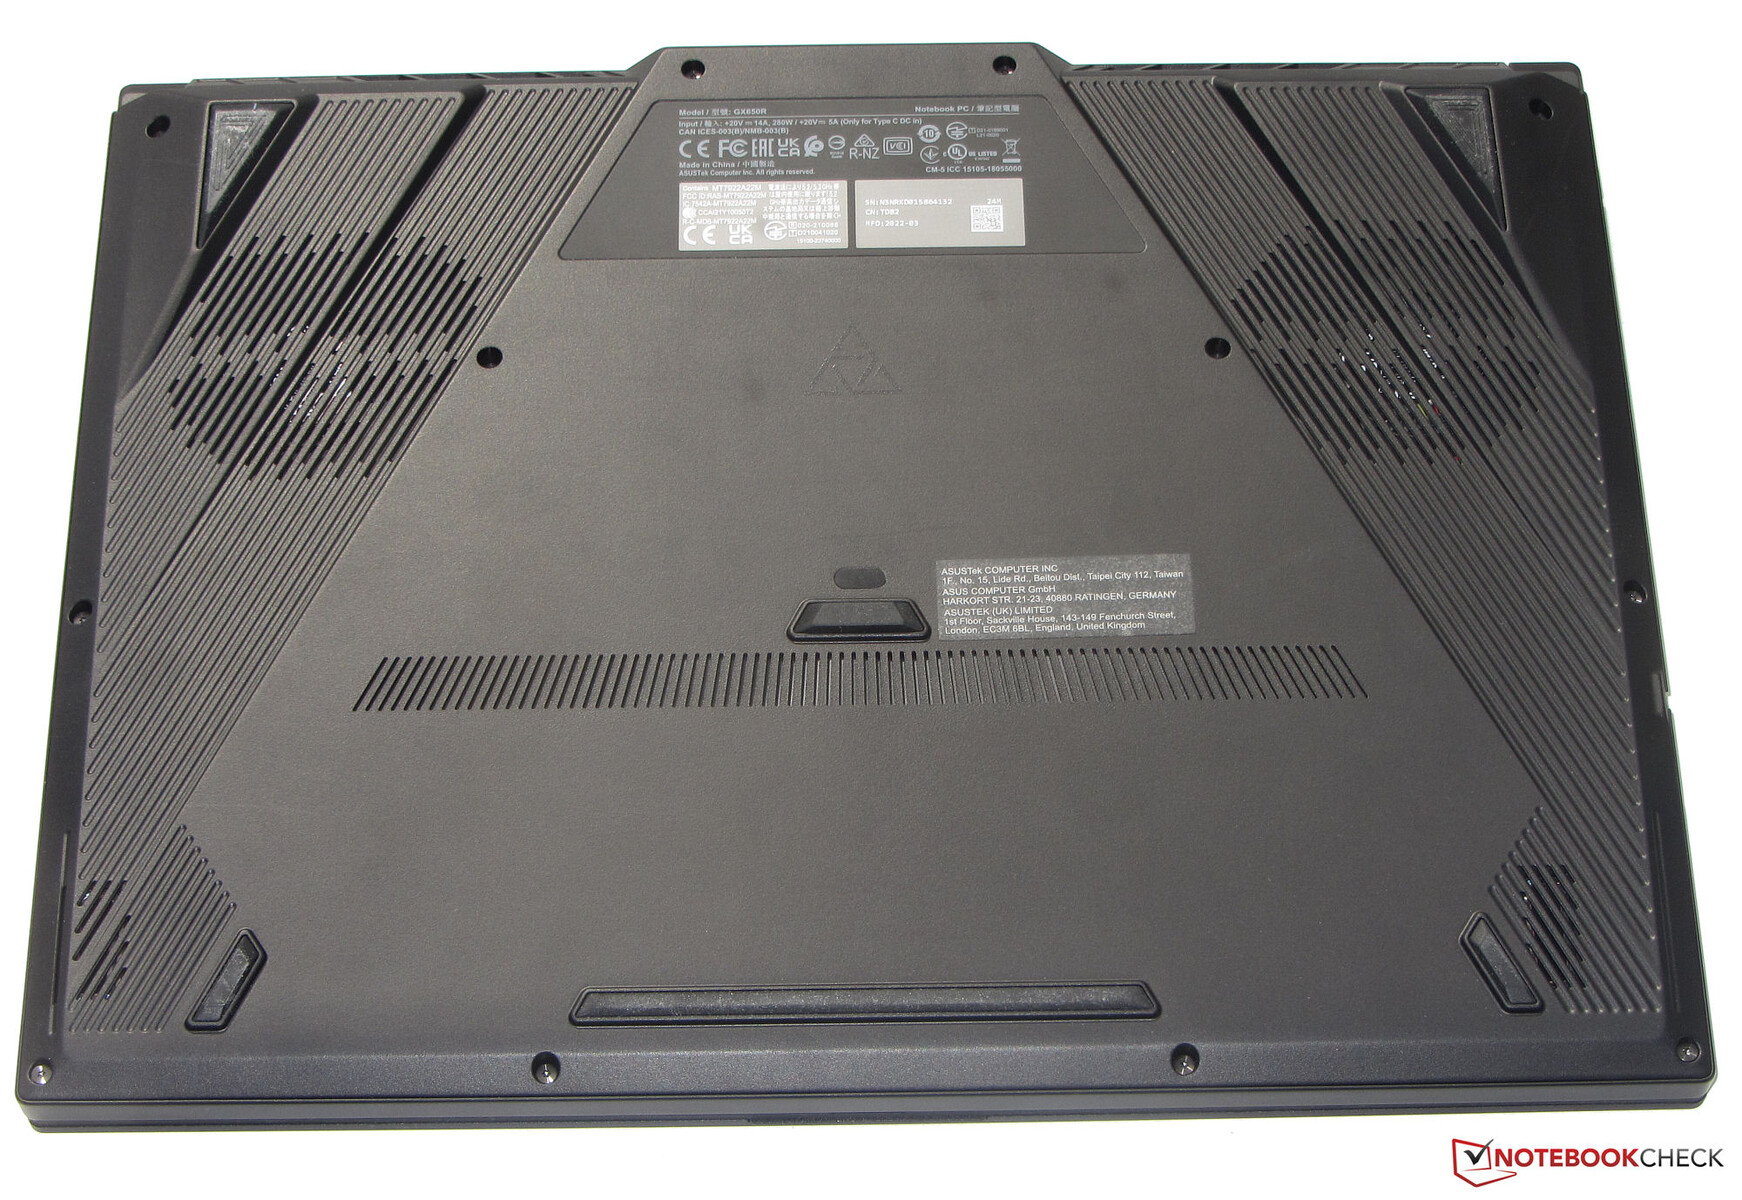
Hölje - GX650 har ett robust metallhölje
Det mattsvarta metallfodralet har ett bra utförande. Det finns inga uppenbara luckor och inga märkbara skarpa kanter. En annan positiv punkt är att basenheten inte kan skeva. Å andra sidan skulle locket kunna behöva lite mer styvhet. Gångjärnen klarar av att hålla locket stadigt på plats. Den maximala öppningsvinkeln är cirka 130 grader och du kan öppna locket med en hand
När du öppnar displaylocket höjs Screenpad, en andra display med pekskärmsfunktionalitet, med en fast vinkel på cirka 15 grader mot användaren. Dessutom flyttas den med cirka 2 cm mot huvudskärmen. Den resulterande luckan visar en genomskinlig plastplatta som på vissa ställen ger en glimt av fodralets insida. Att Screenpad höjs har inte bara ergonomiska skäl, utan det finns också ventilationsöppningar under skärmen för att möjliggöra luftflöde in i fodralet.


Zephyrus är en av de tyngre bärbara datorerna i vår jämförelse. Endast MSI GE76 Raiderär tyngre. Dimensionerna blir också något större än jämförbara bärbara 16-tumsdatorer som t.ex MacBook Pro 16.
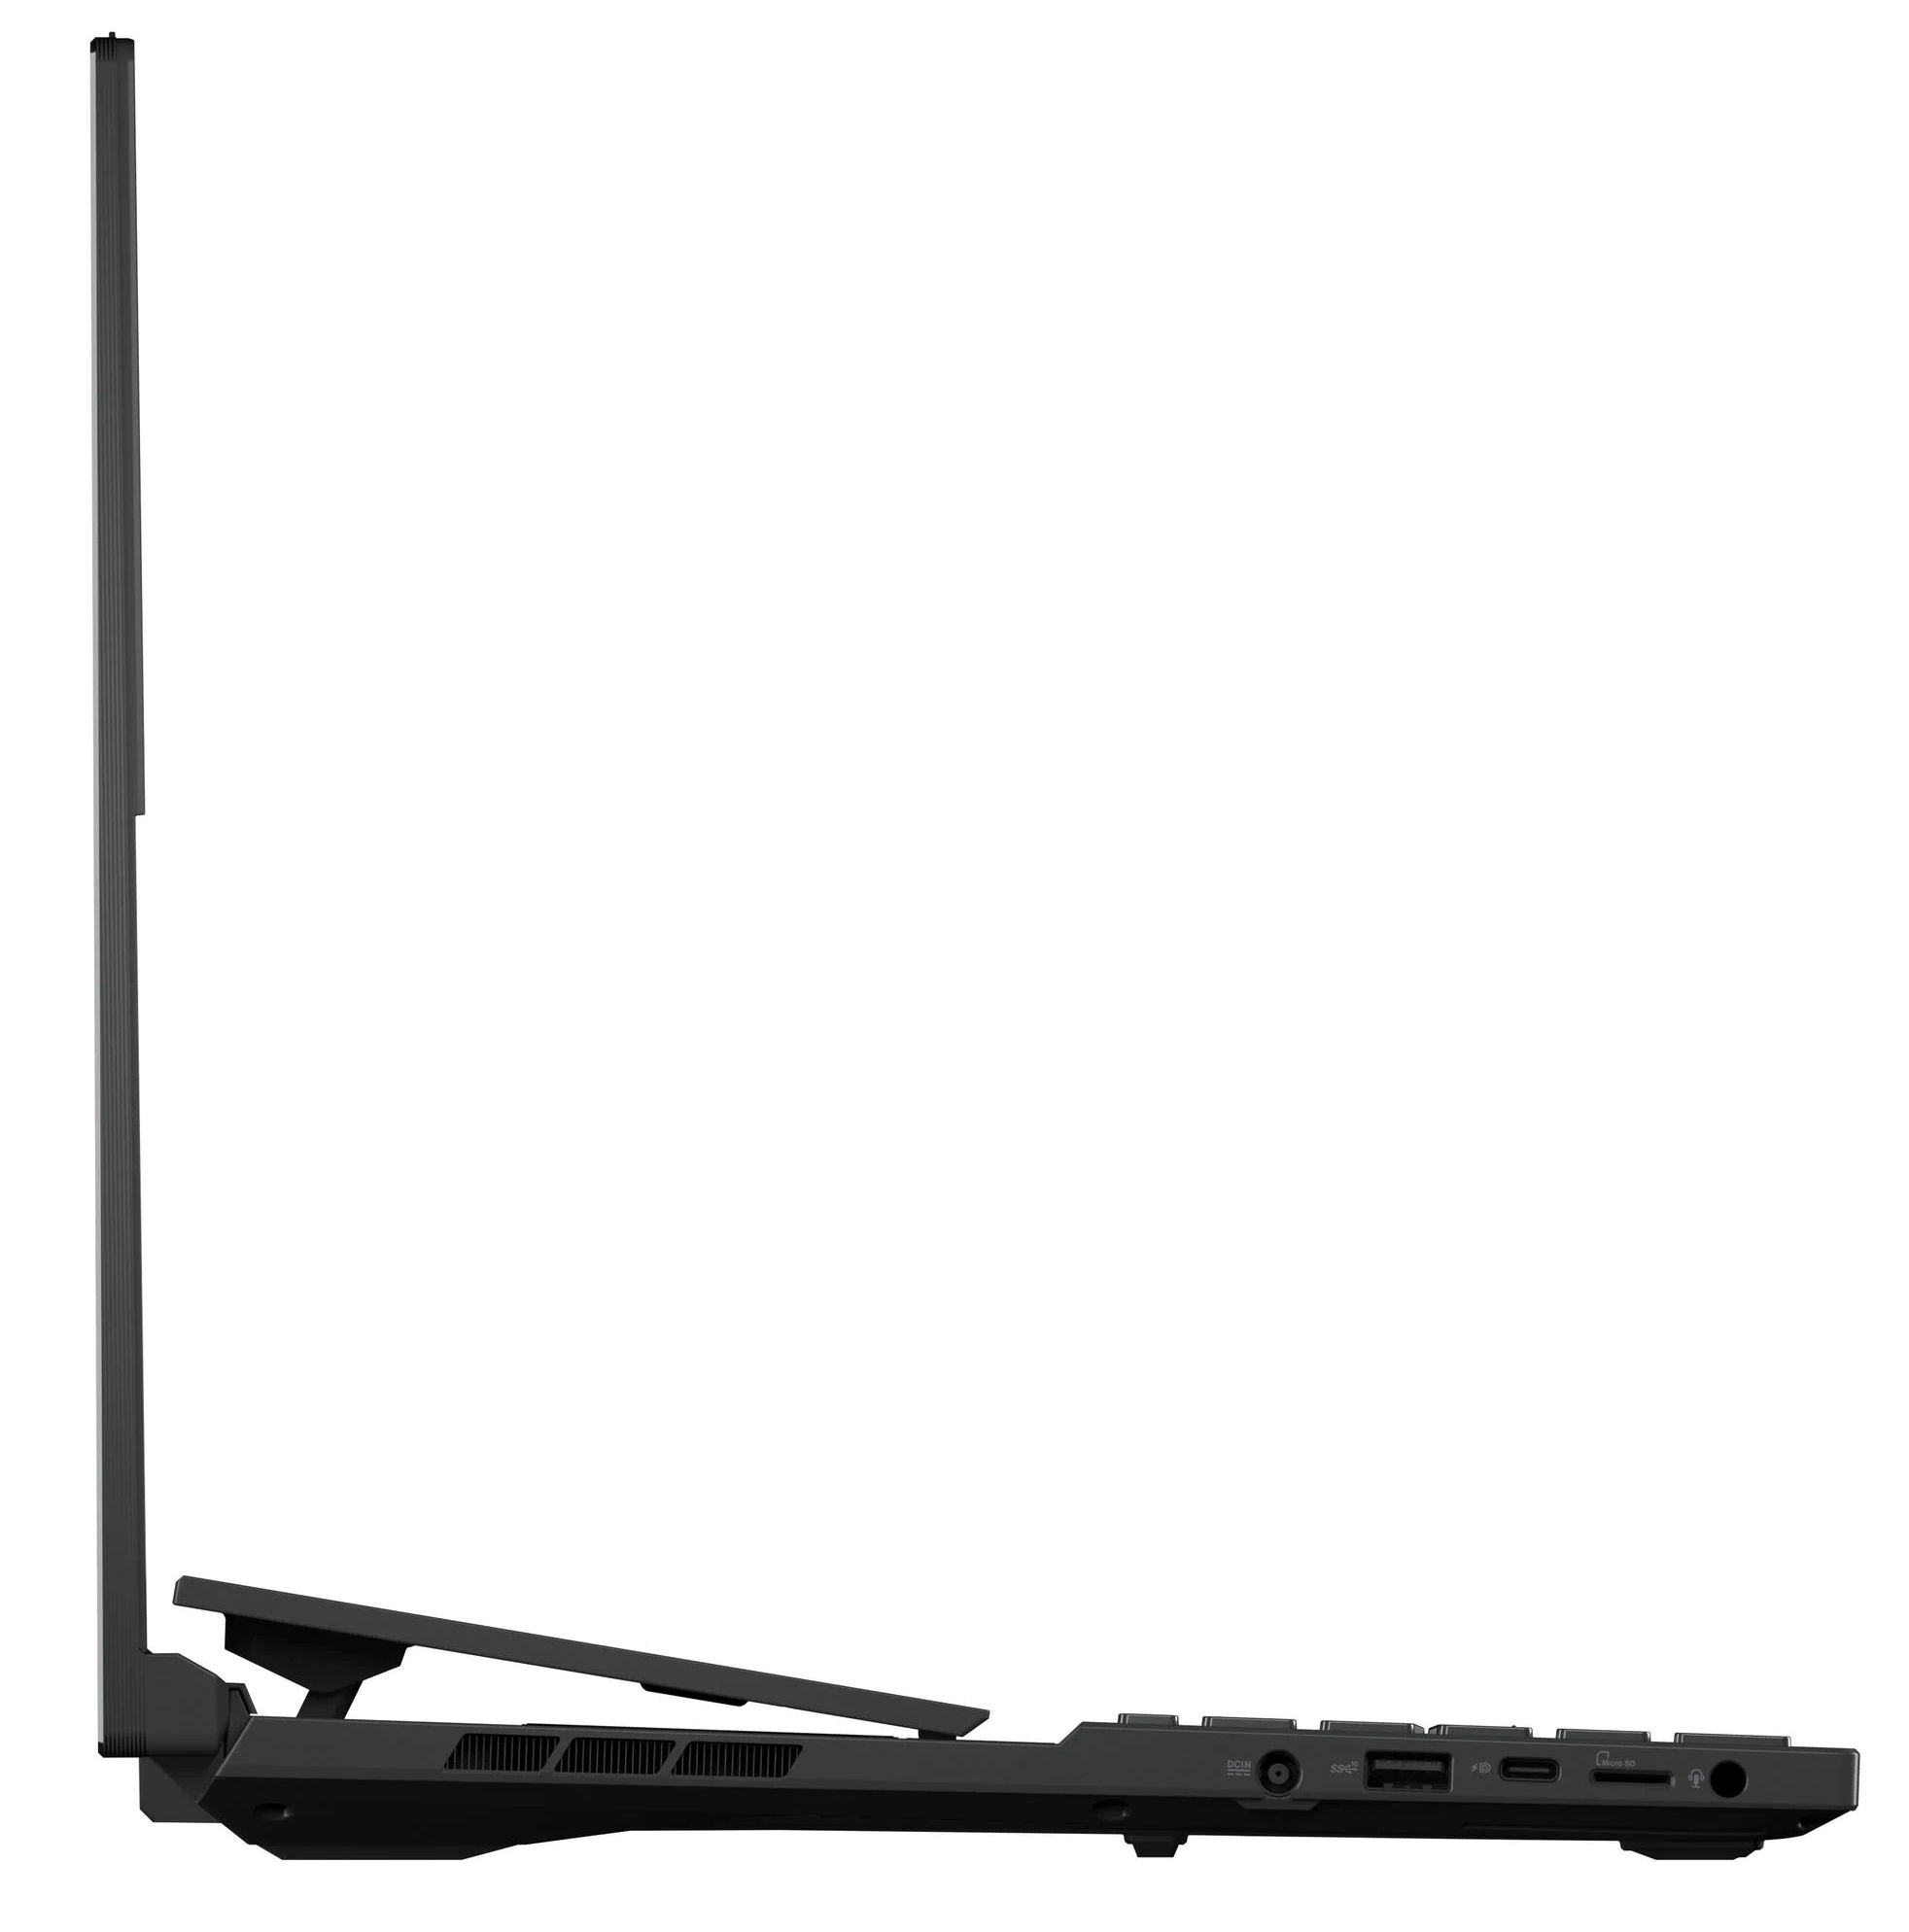
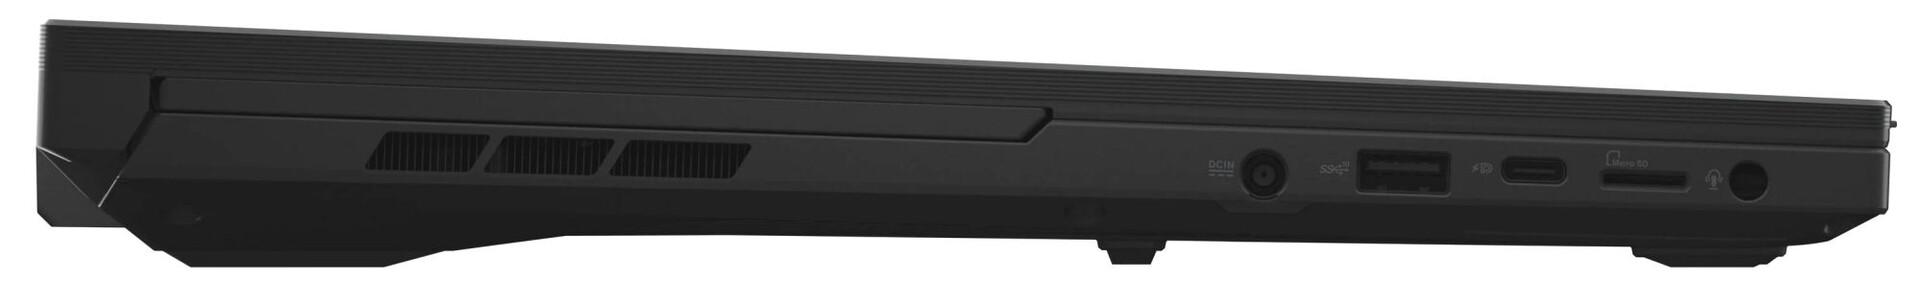
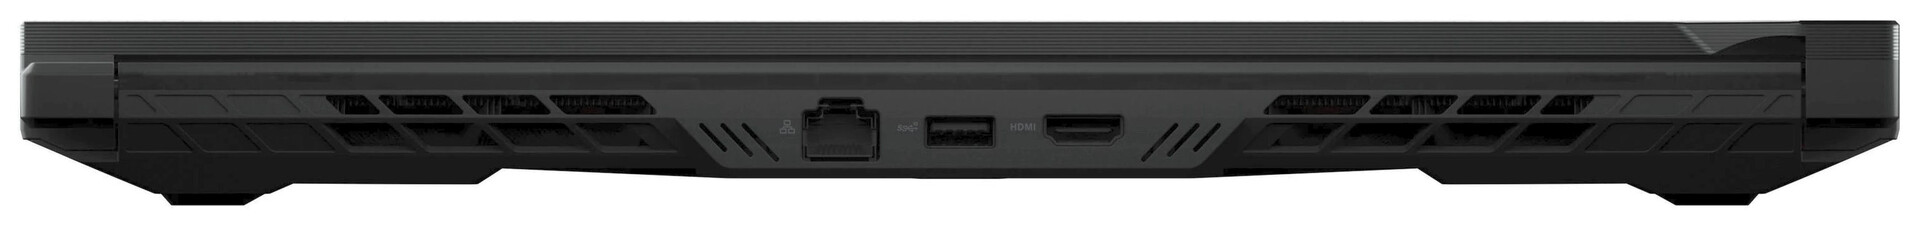
Utrustning - Zephyrus erbjuder inte Thunderbolt 4
Alla fyra USB-anslutningar (2x USB-A, 2x USB-C) stöder standarden USB 3.2 Gen 2. En av de två USB-C-portarna erbjuder Power Delivery och båda portarna stöder DisplayPort via USB-C. Med detta erbjuder den bärbara datorn tre videoutgångsportar tillsammans med HDMI 2.1-anslutningen. Anslutningarna kompletteras av en kombinerad ljudport och en Gigabit Ethernet-port.

SD-kortläsare
MicroSD-kortläsaren är en av de snabba modellerna med maximala överföringshastigheter på 155 MB/s (överföring av 250 jpg-bildfiler på cirka 5 MB vardera) och 185 MB/s (kopiering av stora datablock) med vårt referenslagringskort AV PRO microSD 128 GB V60.
| SD Card Reader | |
| average JPG Copy Test (av. of 3 runs) | |
| Razer Blade 15 Advanced Model Early 2022 (AV PRO microSD 128 GB V60) | |
| Asus ROG Zephyrus Duo 16 GX650RX (AV PRO microSD 128 GB V60) | |
| Genomsnitt av klass Gaming (20.9 - 210, n=54, senaste 2 åren) | |
| MSI GE76 Raider (AV PRO microSD 128 GB V60) | |
| Medion Erazer Beast X30 (AV PRO microSD 128 GB V60) | |
| maximum AS SSD Seq Read Test (1GB) | |
| Asus ROG Zephyrus Duo 16 GX650RX (AV PRO microSD 128 GB V60) | |
| Genomsnitt av klass Gaming (25.5 - 261, n=51, senaste 2 åren) | |
| Medion Erazer Beast X30 (AV PRO microSD 128 GB V60) | |
Kommunikation
Överföringshastigheten för WLAN-överföringen under optimala förhållanden (utan ytterligare WLAN-enheter i närheten och med den bärbara datorn och serverdatorn nära varandra) är utmärkt och motsvarar kapaciteten hos WiFi-chipet (Mediatek MT7922; 802.11 ax, WiFi 6E). Trådbundna nätverksanslutningar hanteras av ett Gigabit Ethernet-chip (RTL8125) från Realtek.
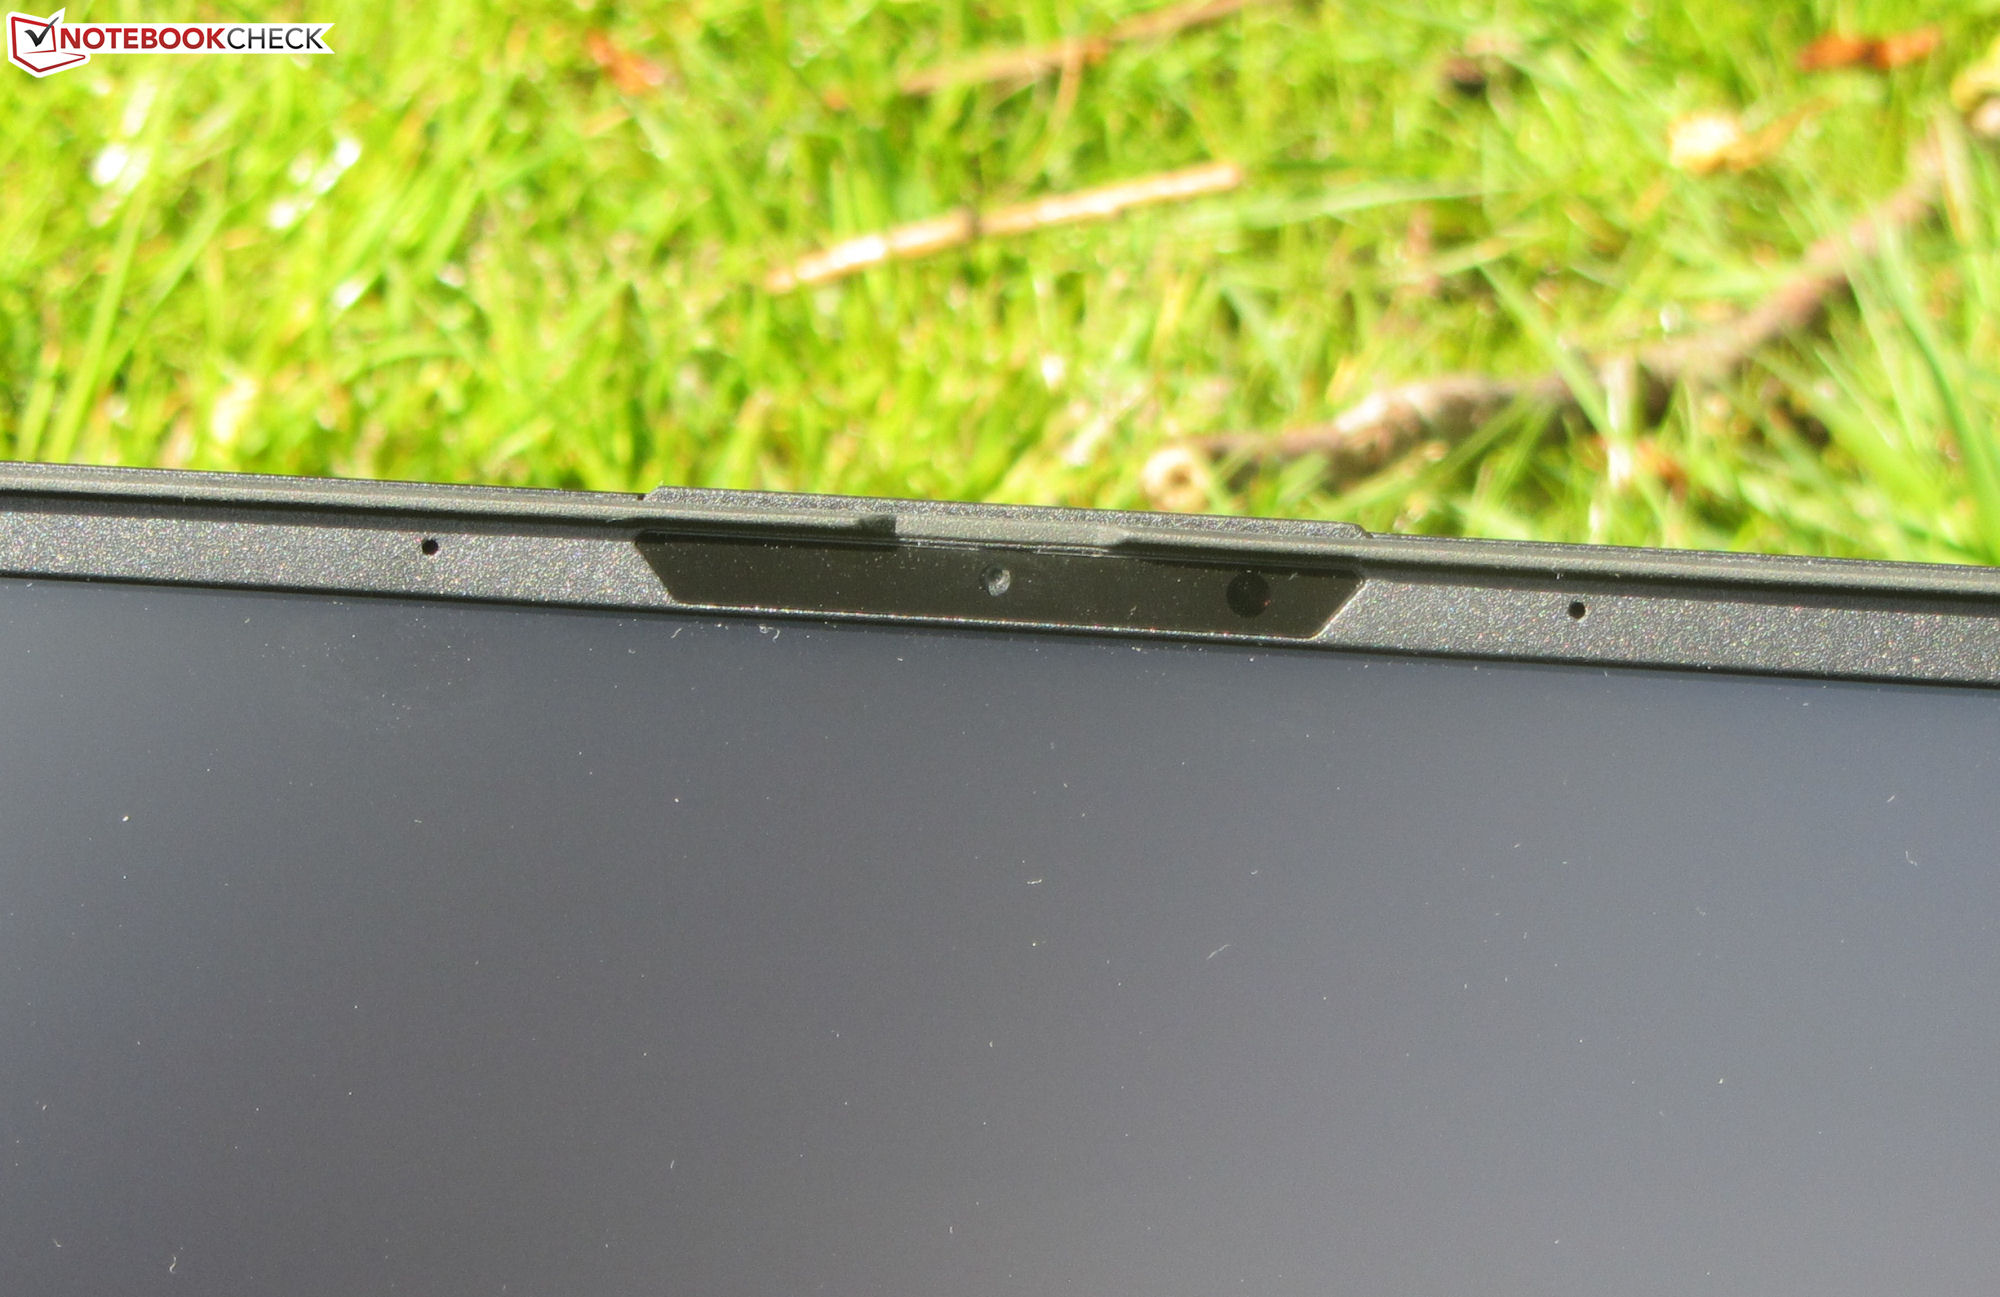
Webbkamera
Zephyrus webbkamera på 0,9 MP ger bilder med en maximal upplösning på 1280 x 720 pixlar. Den saknar färgprecision och färgerna avviker avsevärt från målet. Kameran har inget mekaniskt skydd.

")
")
Tillbehör
Förutom den vanliga dokumentationen (snabbstartmanual och garantiinformation) ingår även ett handflatsstöd i gummi i den bärbara datorn.
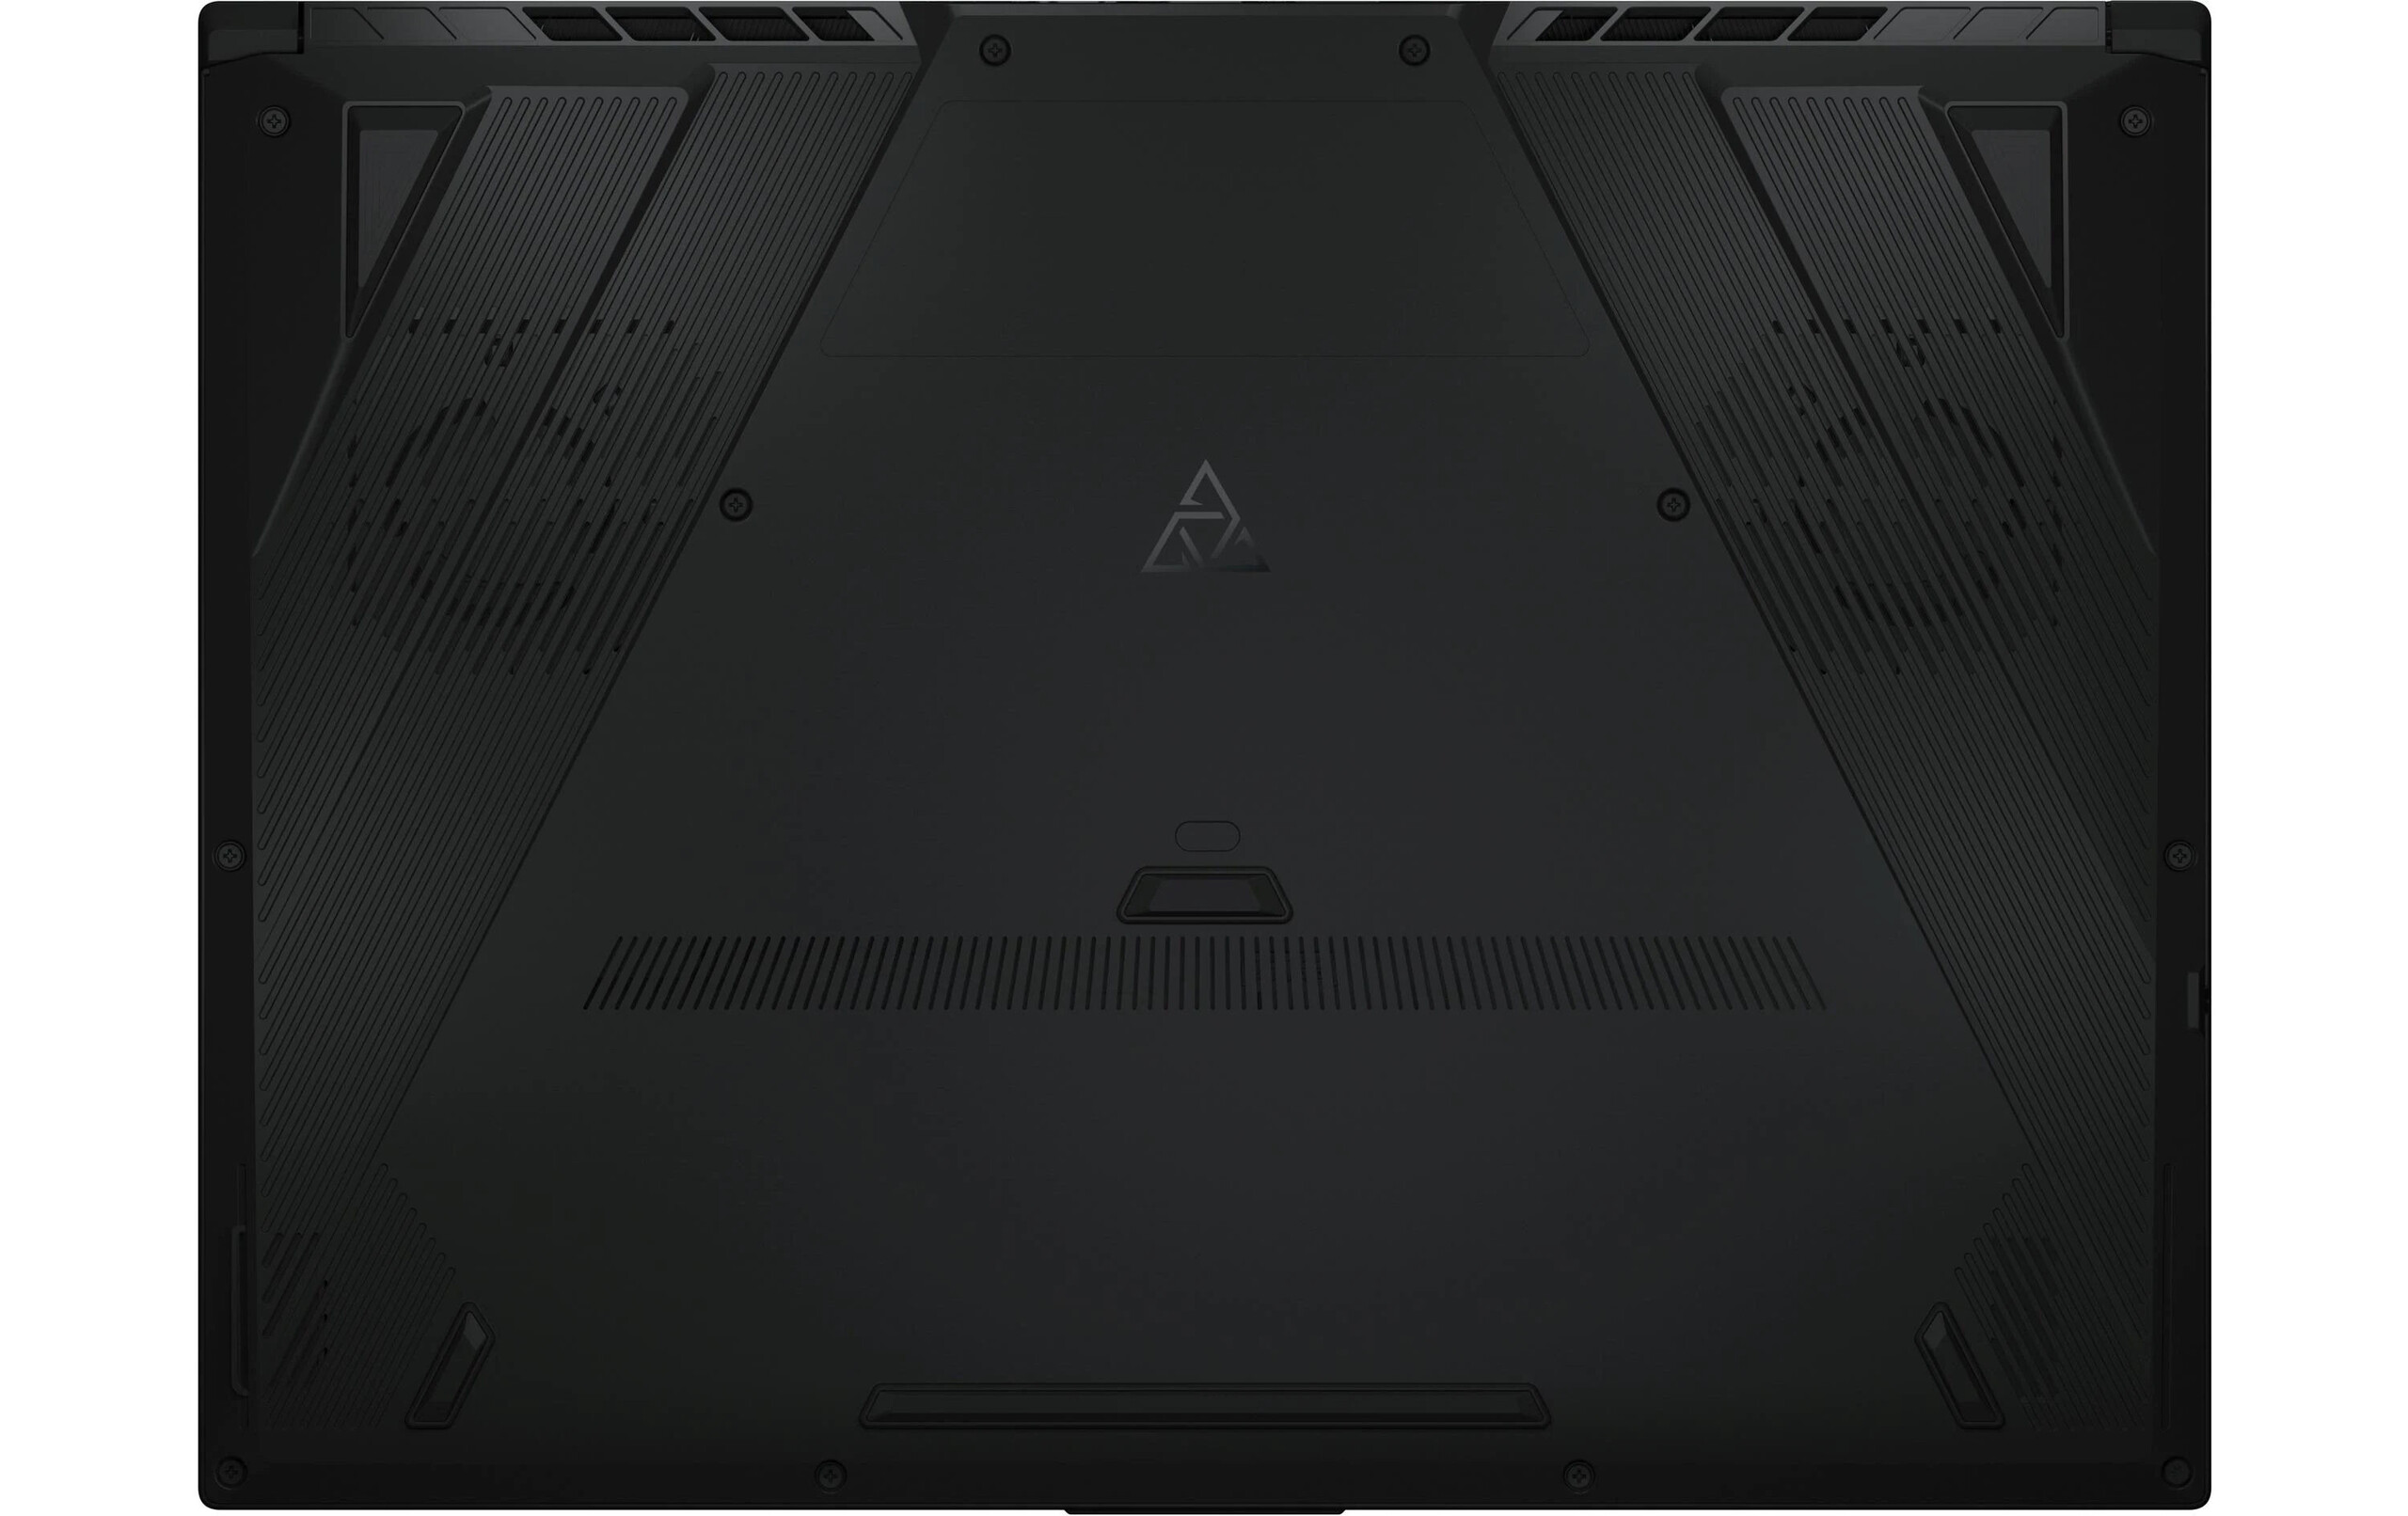
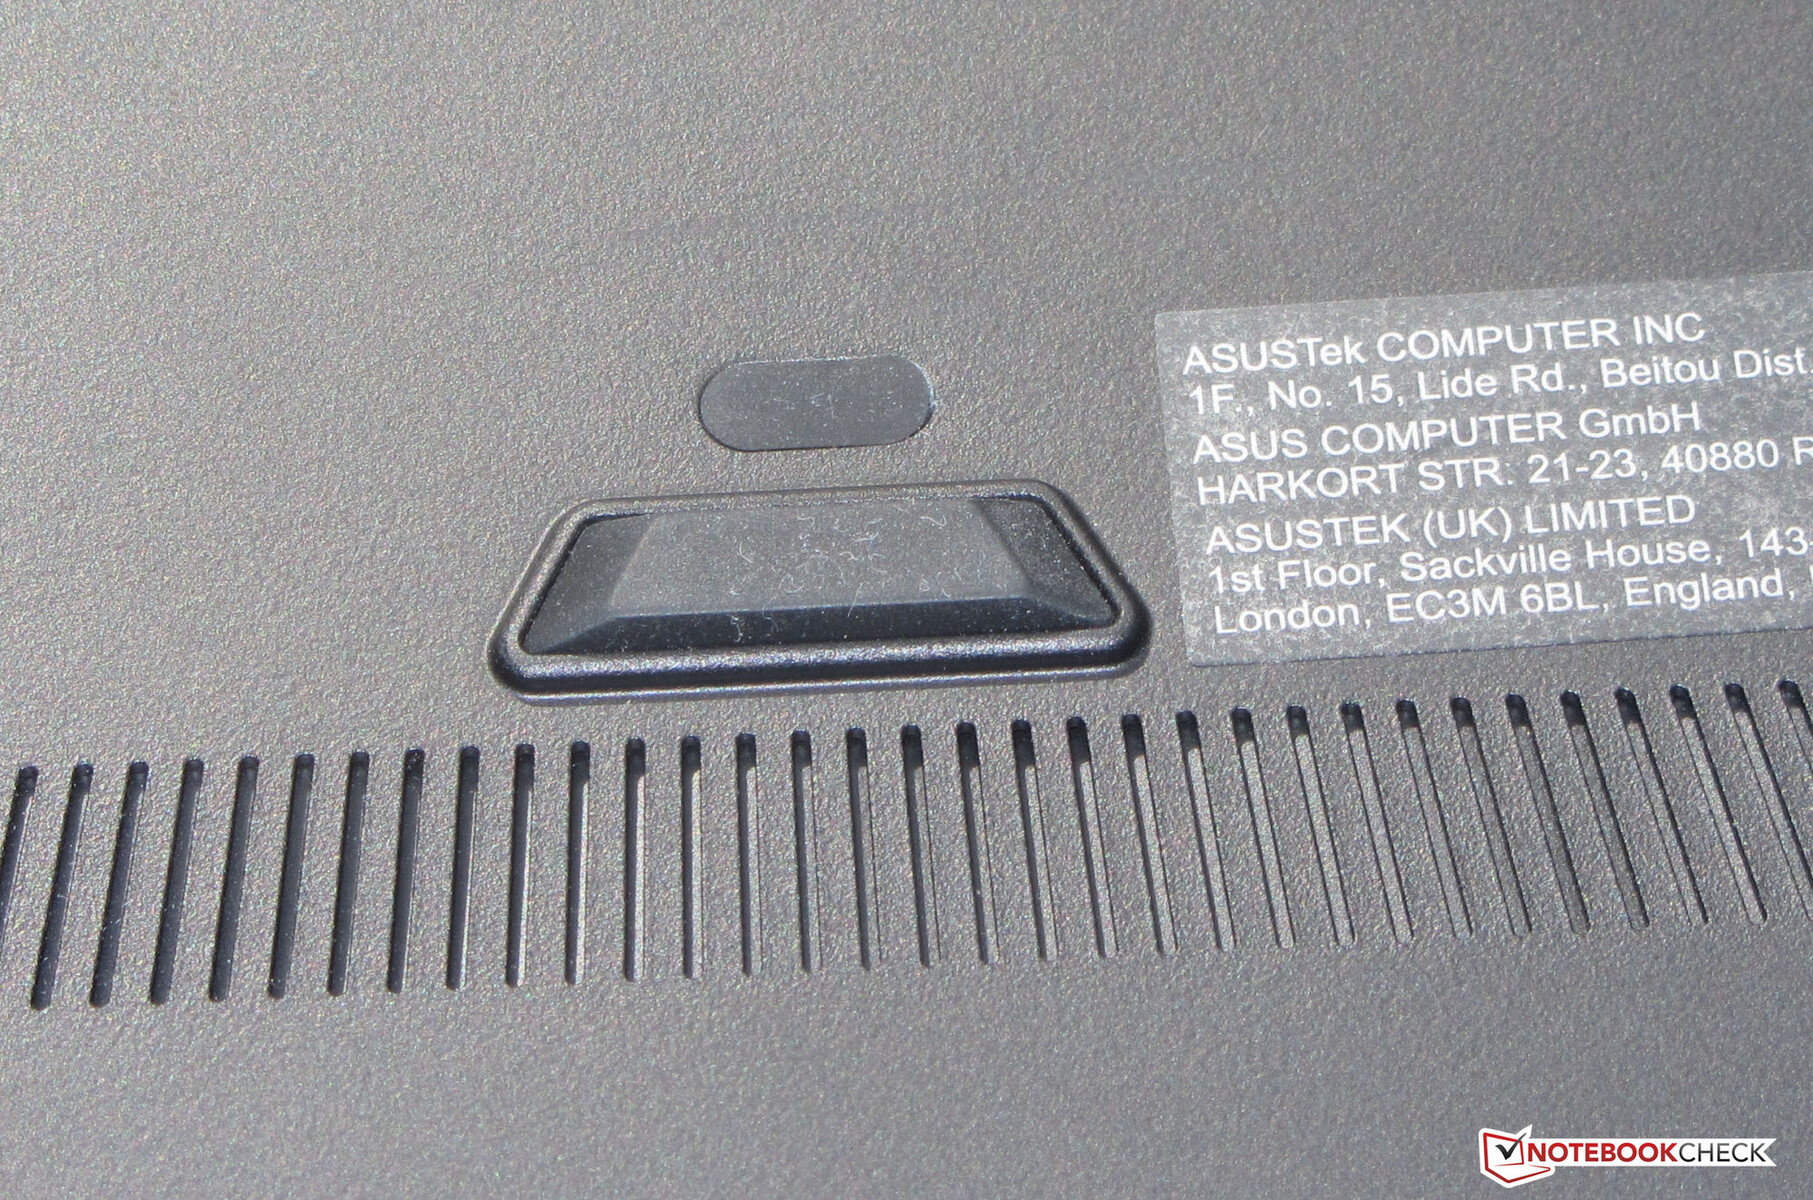
Underhåll
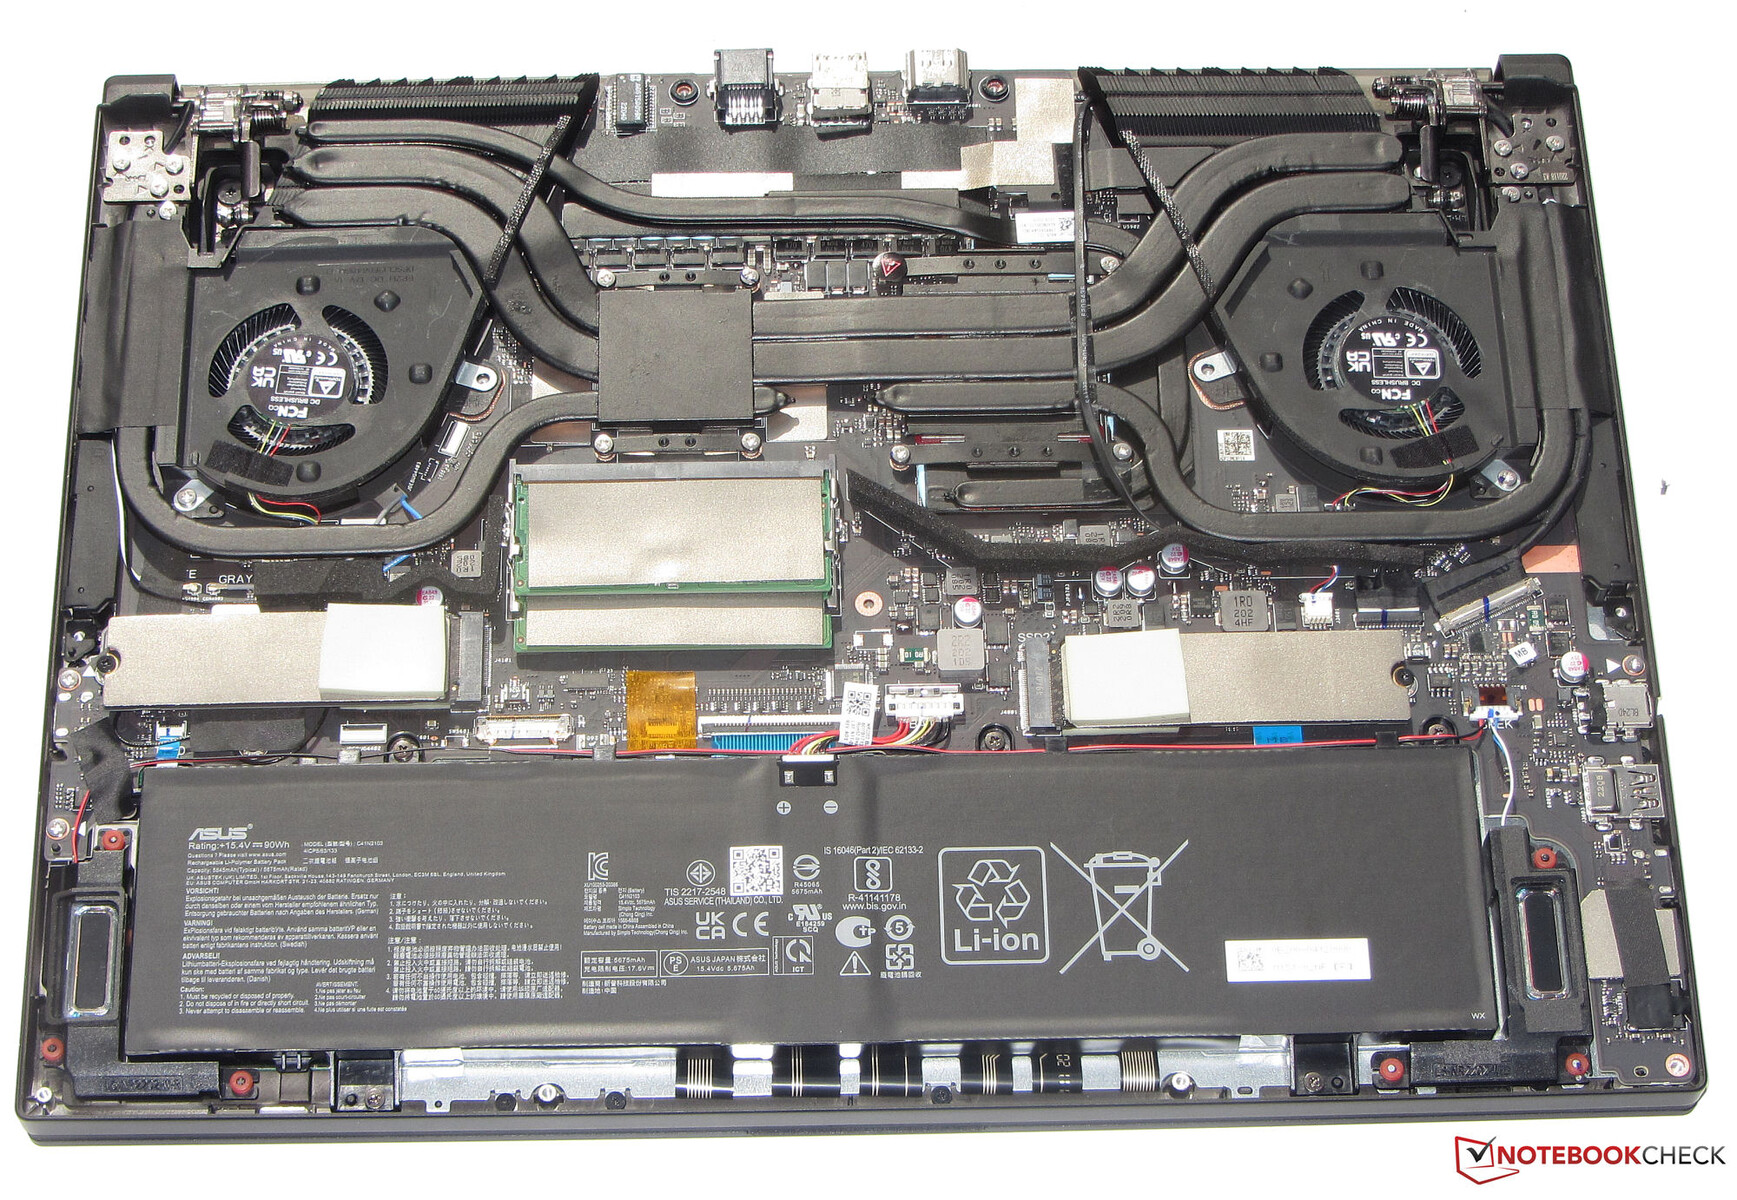
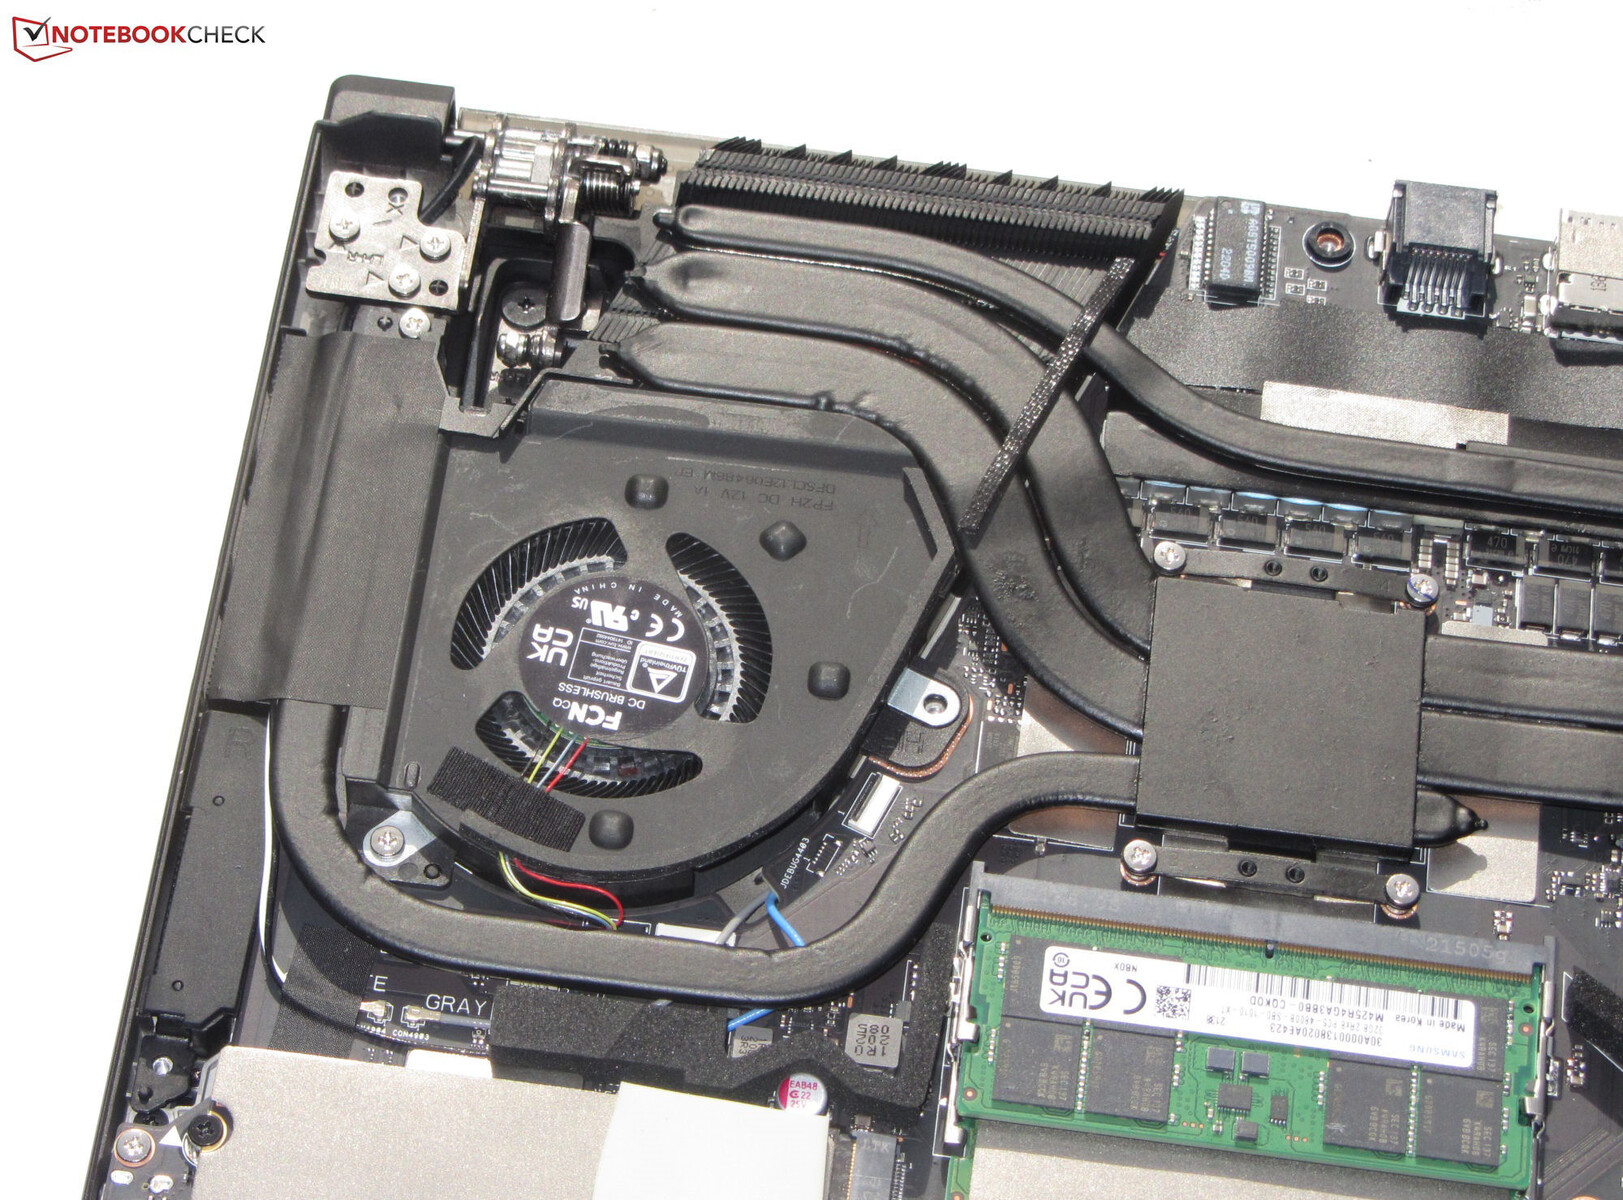
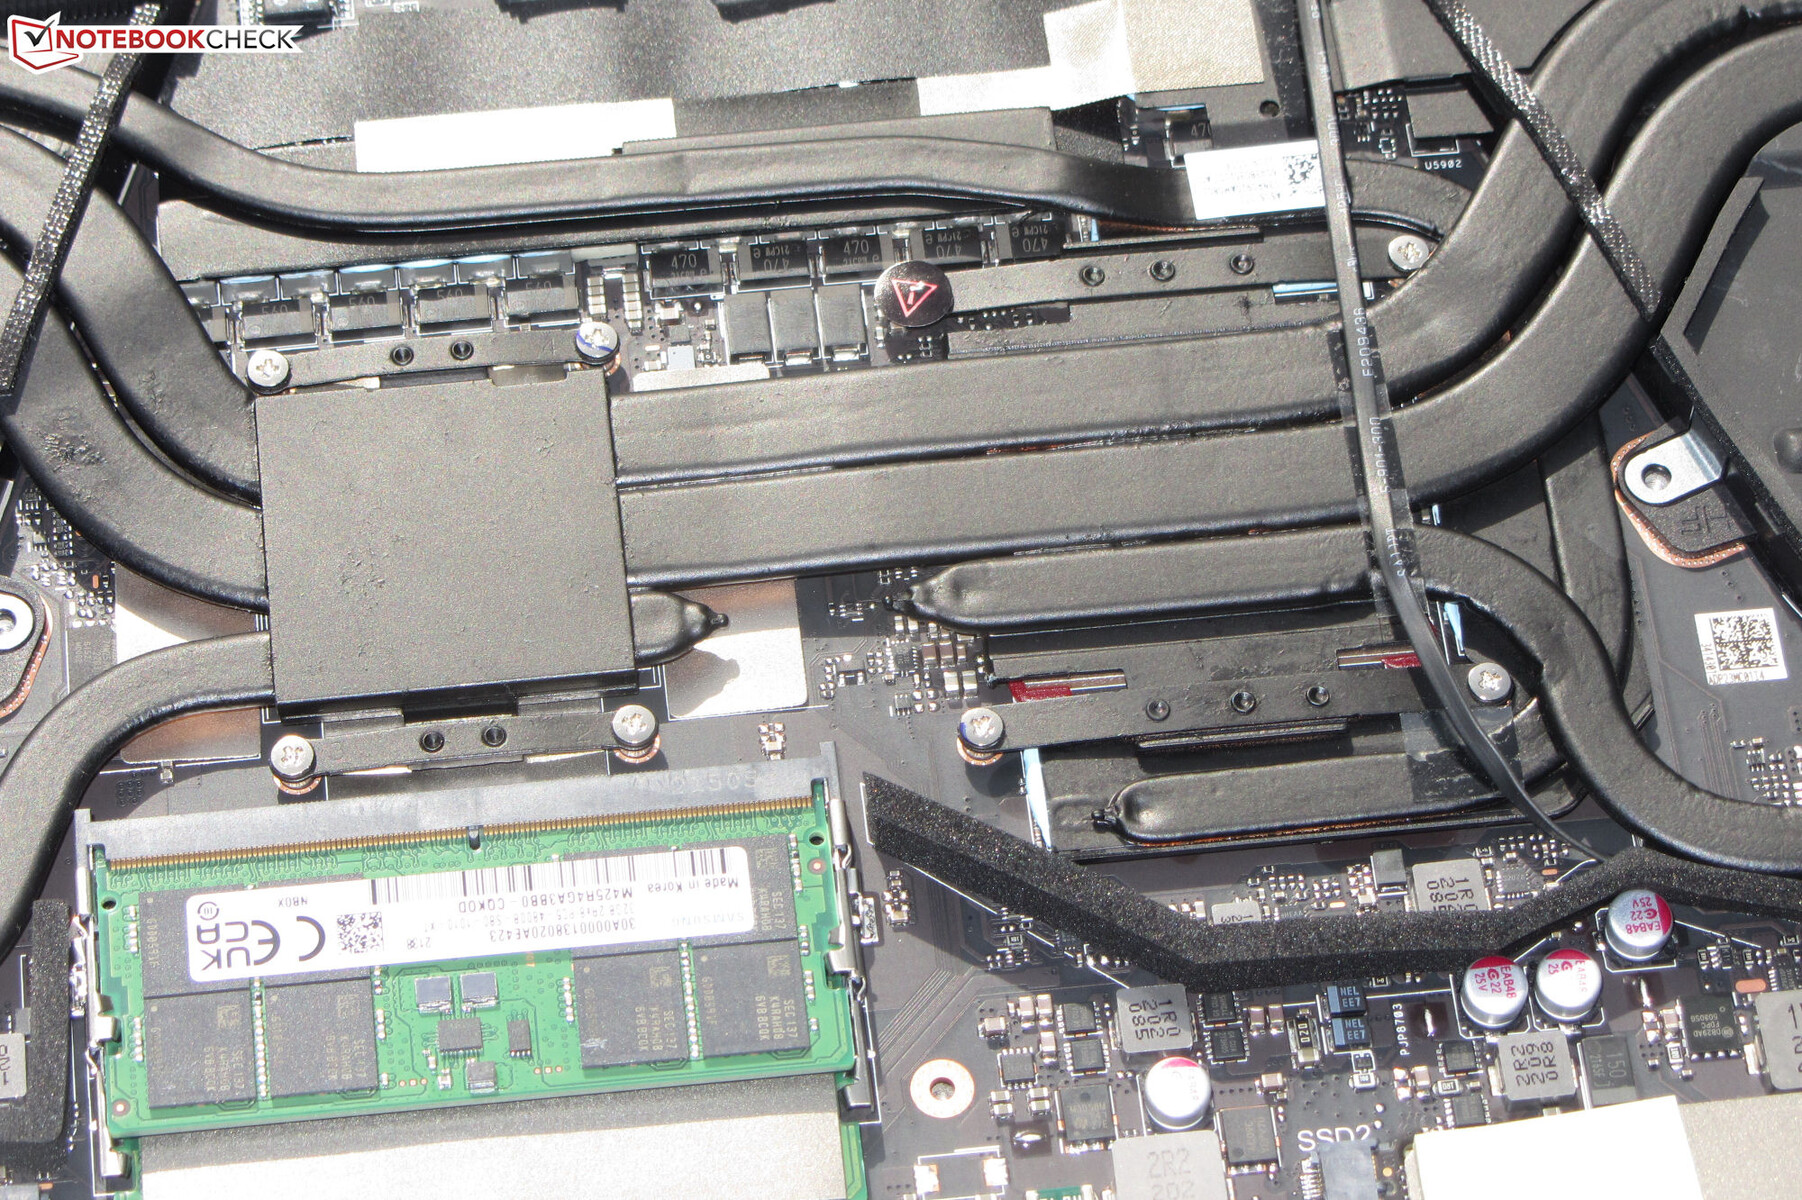
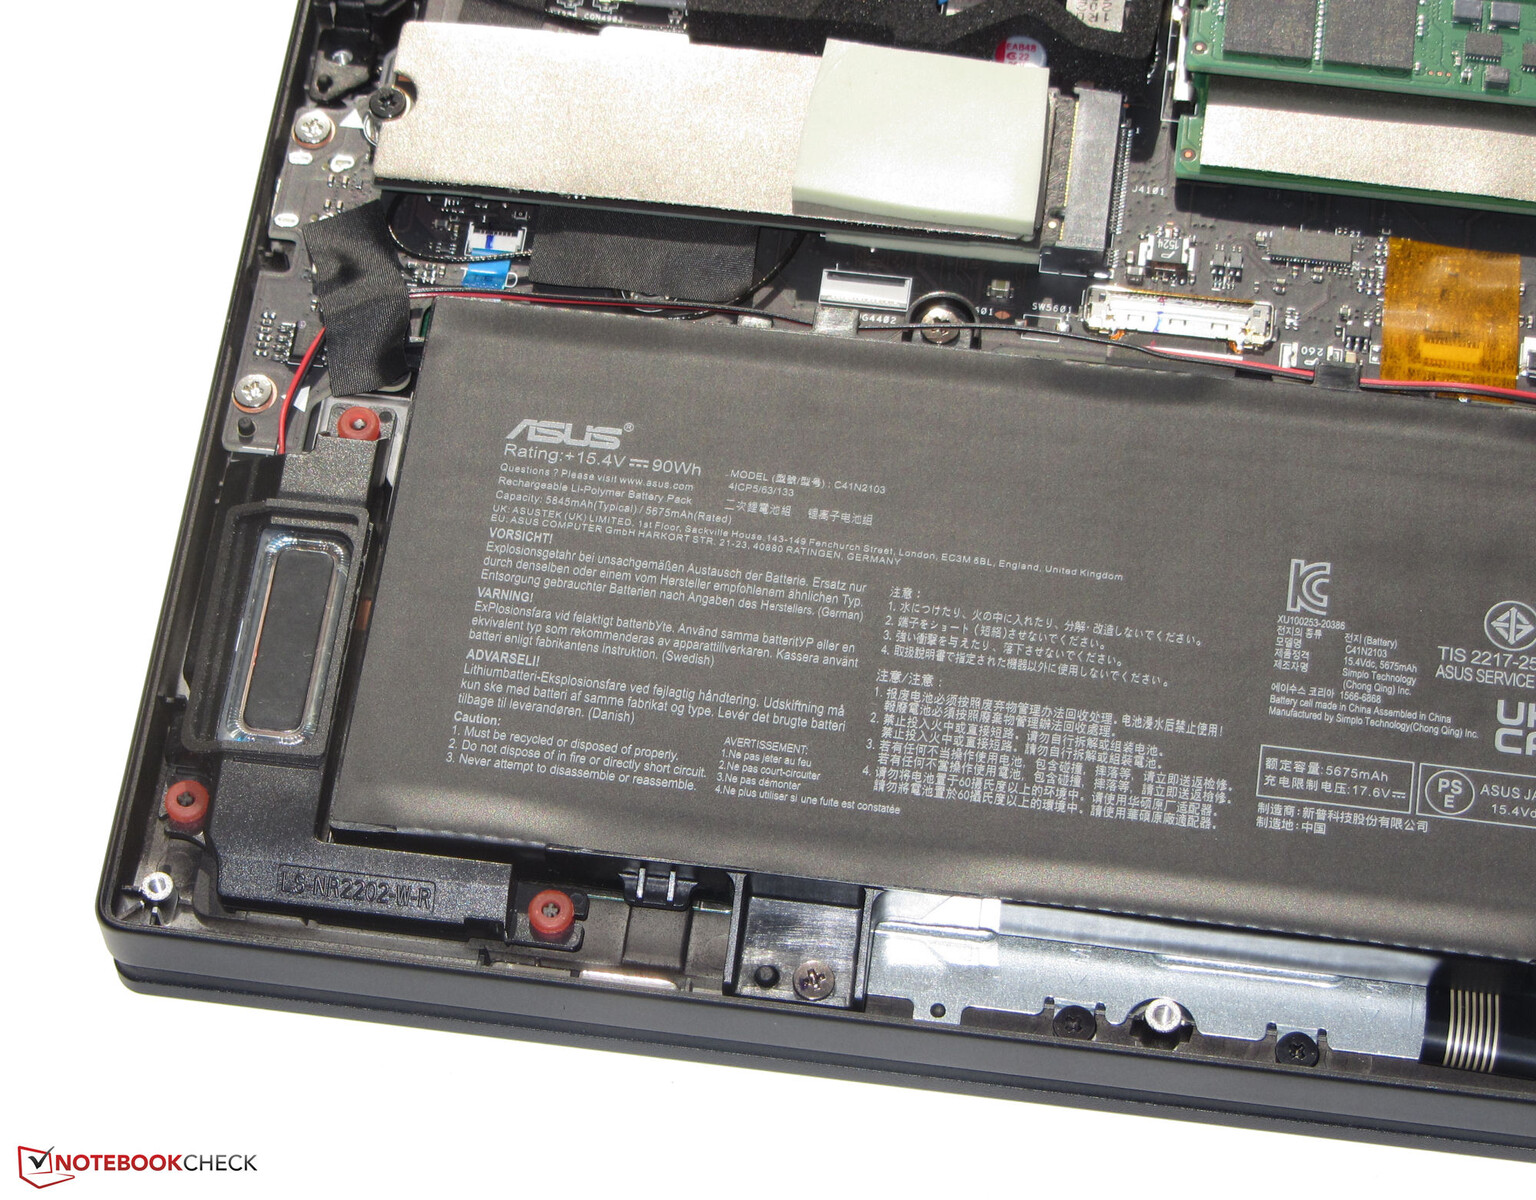
För att ta bort botten av fodralet måste du först ta bort skruvarna i botten. Men du måste vara uppmärksam, eftersom en av skruvarna i mitten av fodralet är täckt av en liten gummiplatta. Baksidan av fodralet hålls också på plats av några klämmor som kan lossas genom att man vickar försiktigt eller med hjälp av ett platt plockverktyg. Efter att ha avlägsnat fallets botten får du tillgång till arbetsminnesbankerna (båda upptagna), de två SSD-enheterna (PCIe 4), fläktarna och batteriet.

Garanti
Asus erbjuder en tvåårig garanti på Zephyrus. En förlängning av garantin till 3 år kostar 129 euro (~136 dollar) extra.
Inmatningsenheter - En andra skärm för den bärbara datorn från Asus
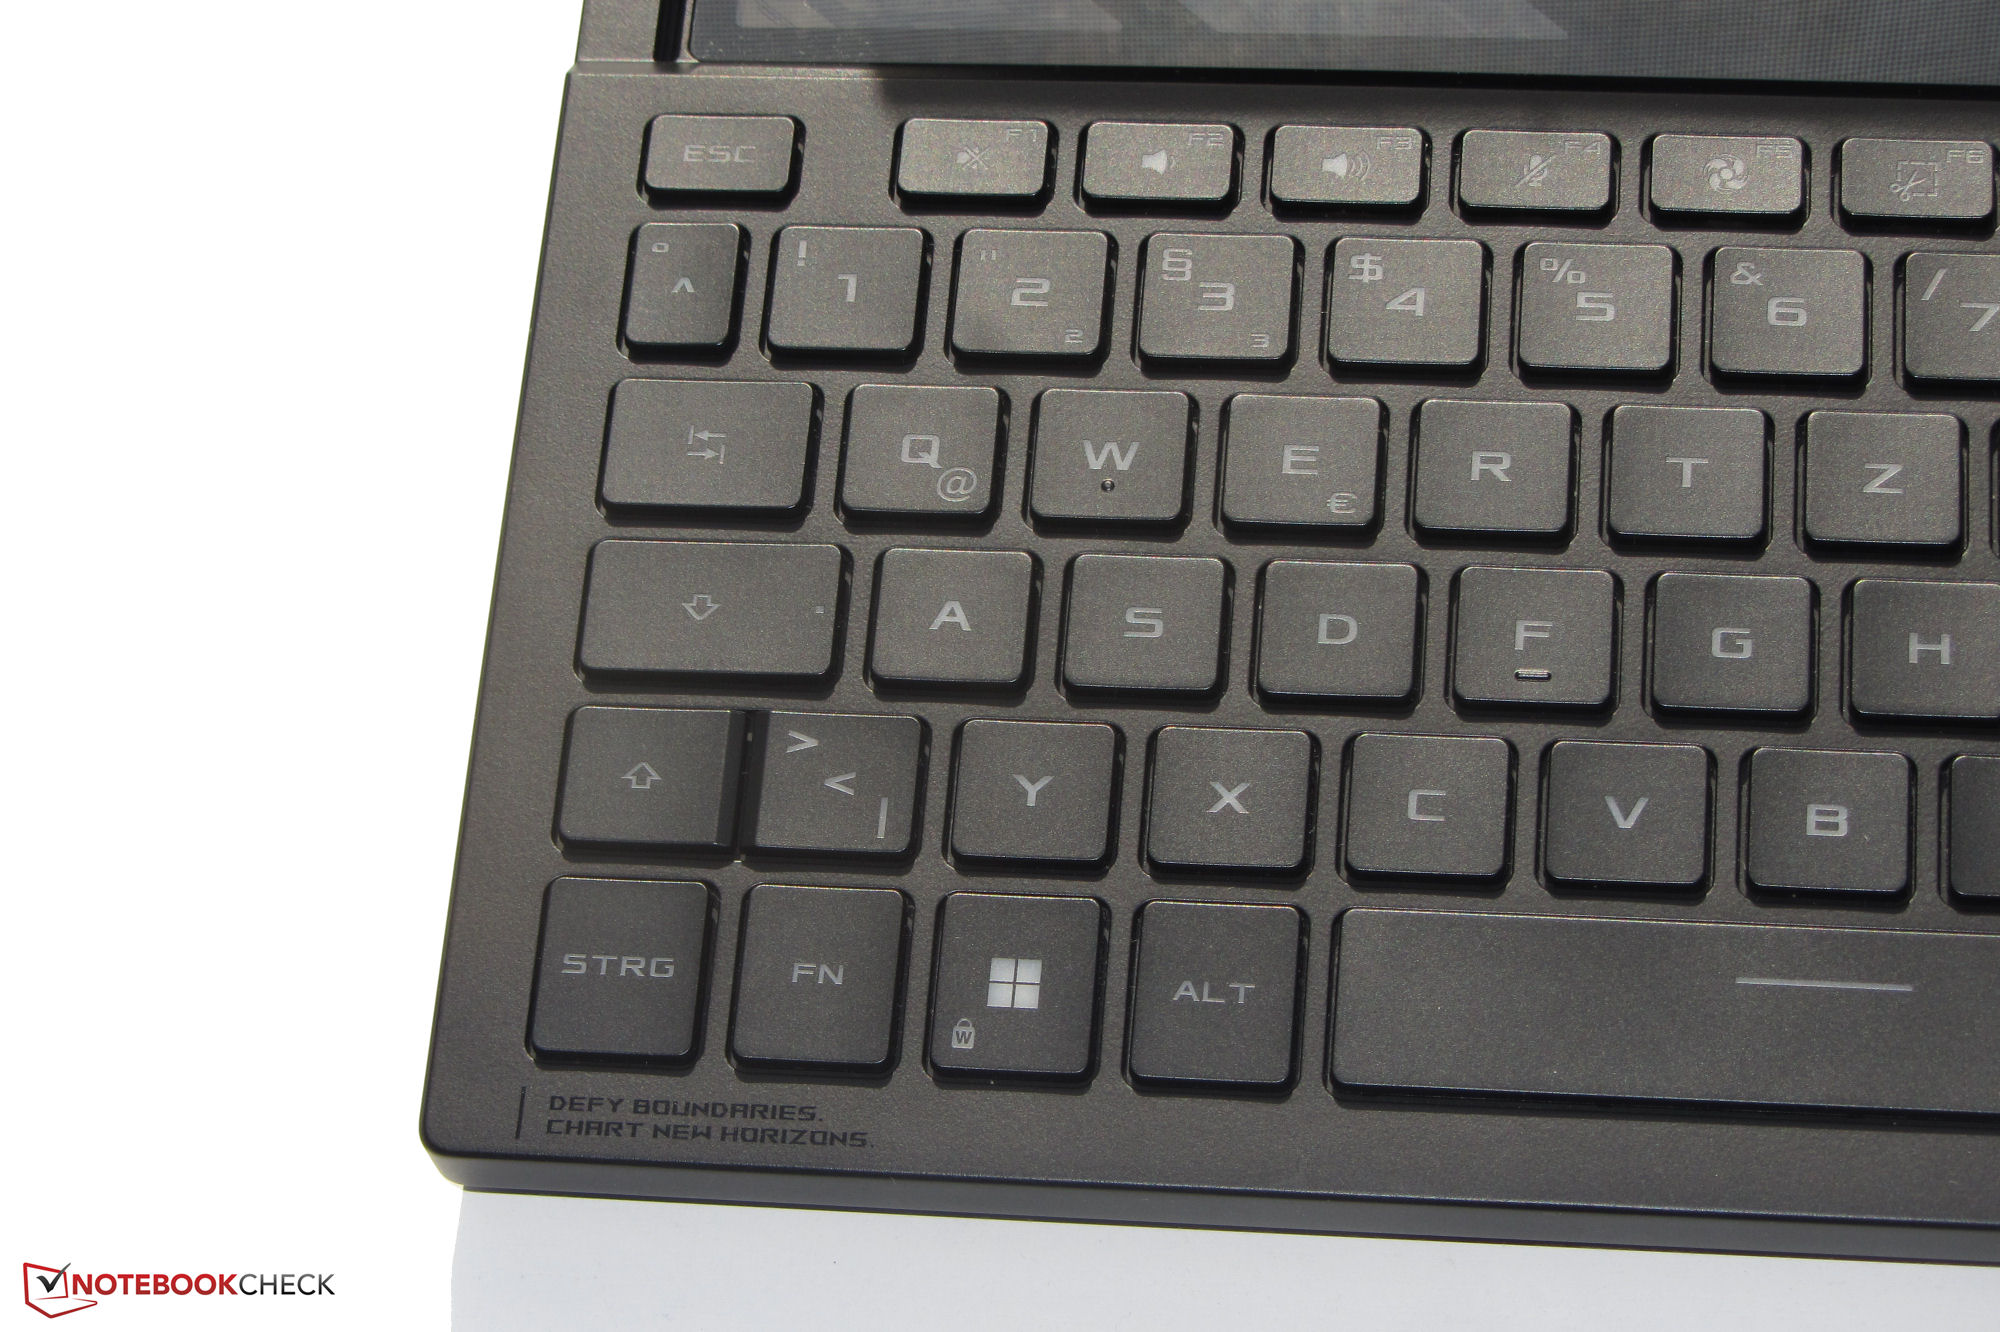
Tangentbord
Tangentbordet är endast bekvämt att skriva om du använder det medföljande handledsstödet av gummi (djup: ~5,5 cm, 2,2 tum, vinklat). Även om det gör ett ganska bra jobb fungerar det egentligen bara på en fast yta. De släta tangenterna på det upplysta chiclet-tangentbordet har en kort slaglängd och en tydlig tryckpunkt. Tangentmotståndet är okej och tangentbordet böjer sig inte när du skriver. Den trestegs RGB-belysningen styrs via en funktionstangent. Sammantaget levererar Asus här ett tangentbord som är lämpligt för vardagliga uppgifter.
Pekplatta
En multitouch-kapabel Clickpad (~5,8 x 9,6 cm, ~2,3 x 3,8 tum) i stående läge ersätter musen. Den släta ytan underlättar för fingrarna att glida. Padden har en kort slaglängd och en tydlig tryckpunkt. Genom att trycka på motsvarande symbol på plattan visas en sifferplatta.

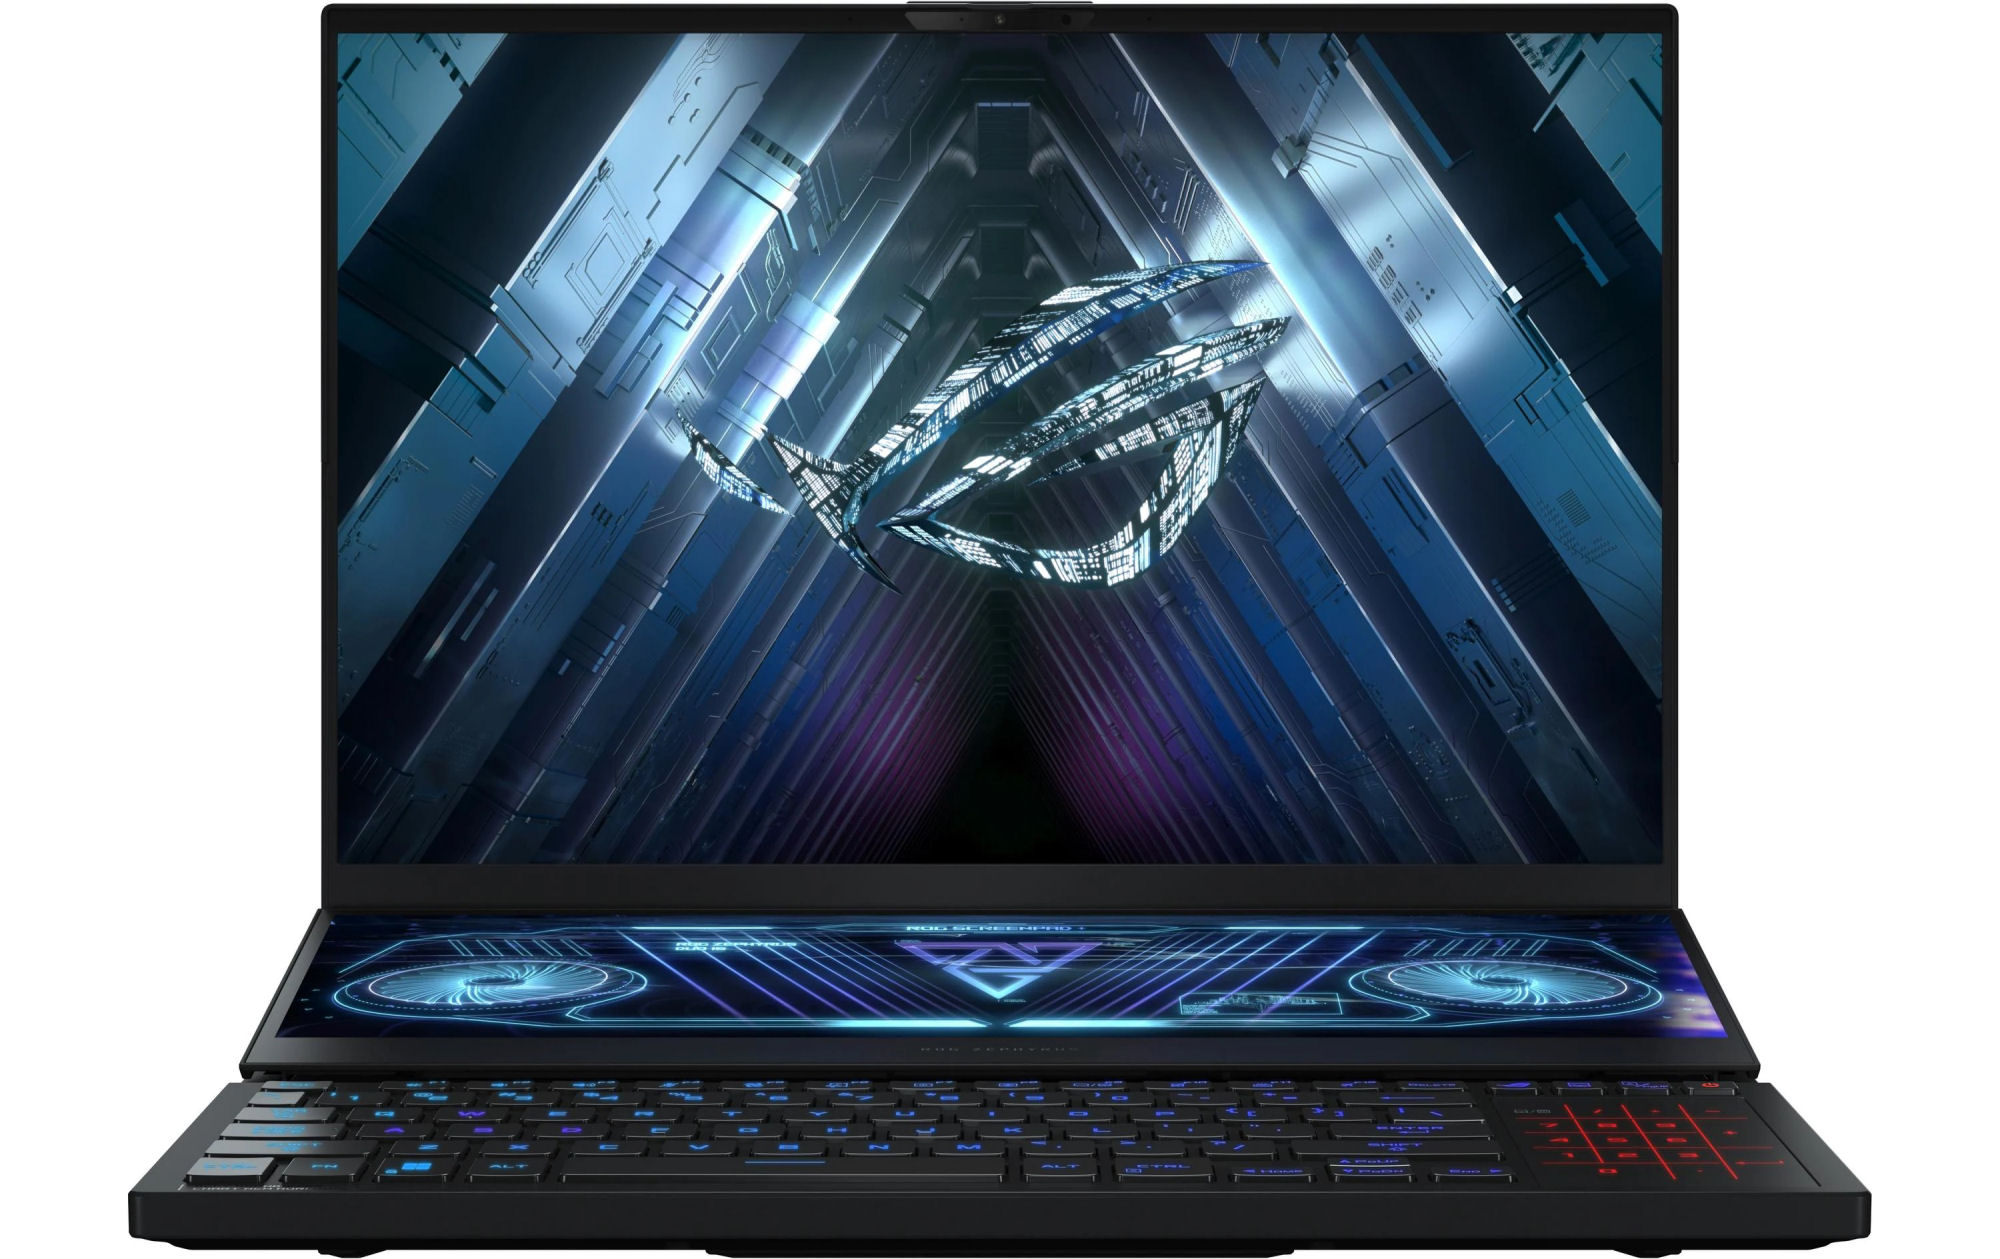
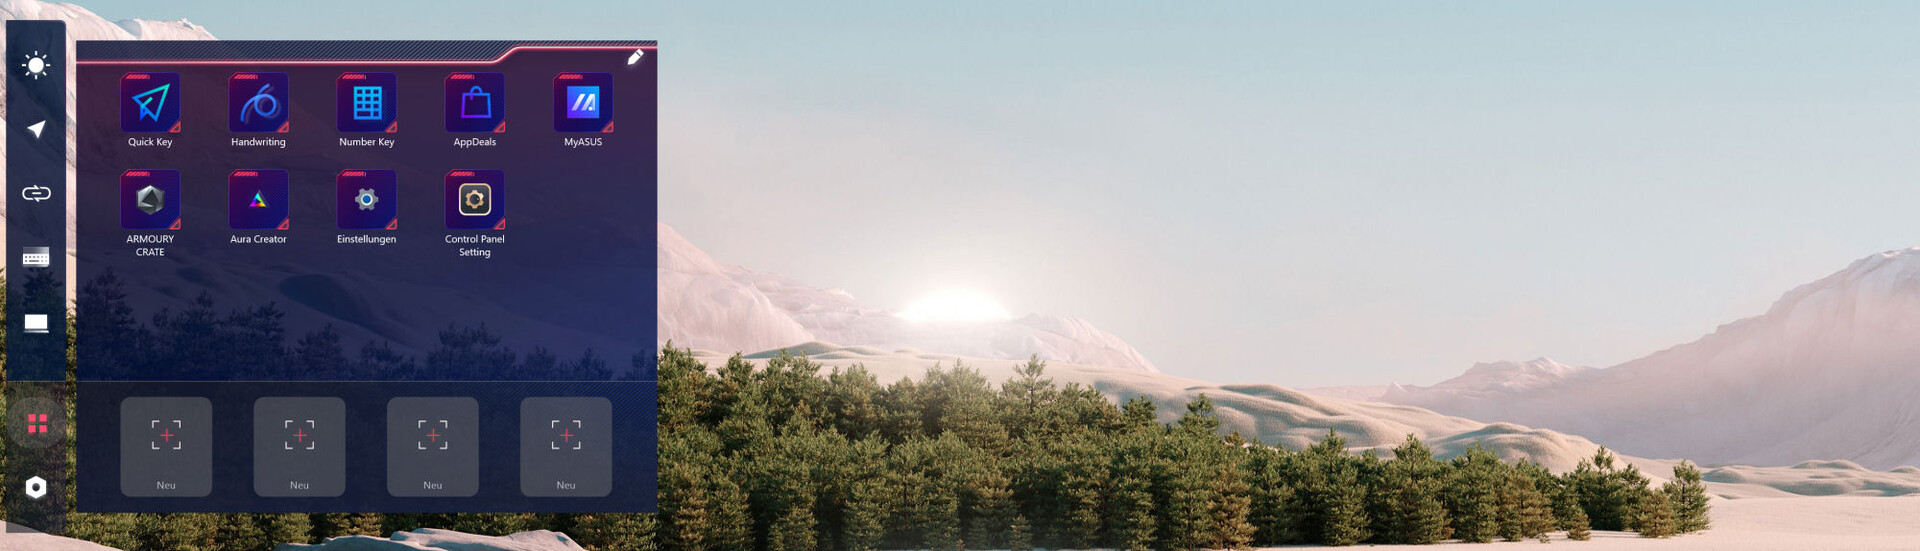
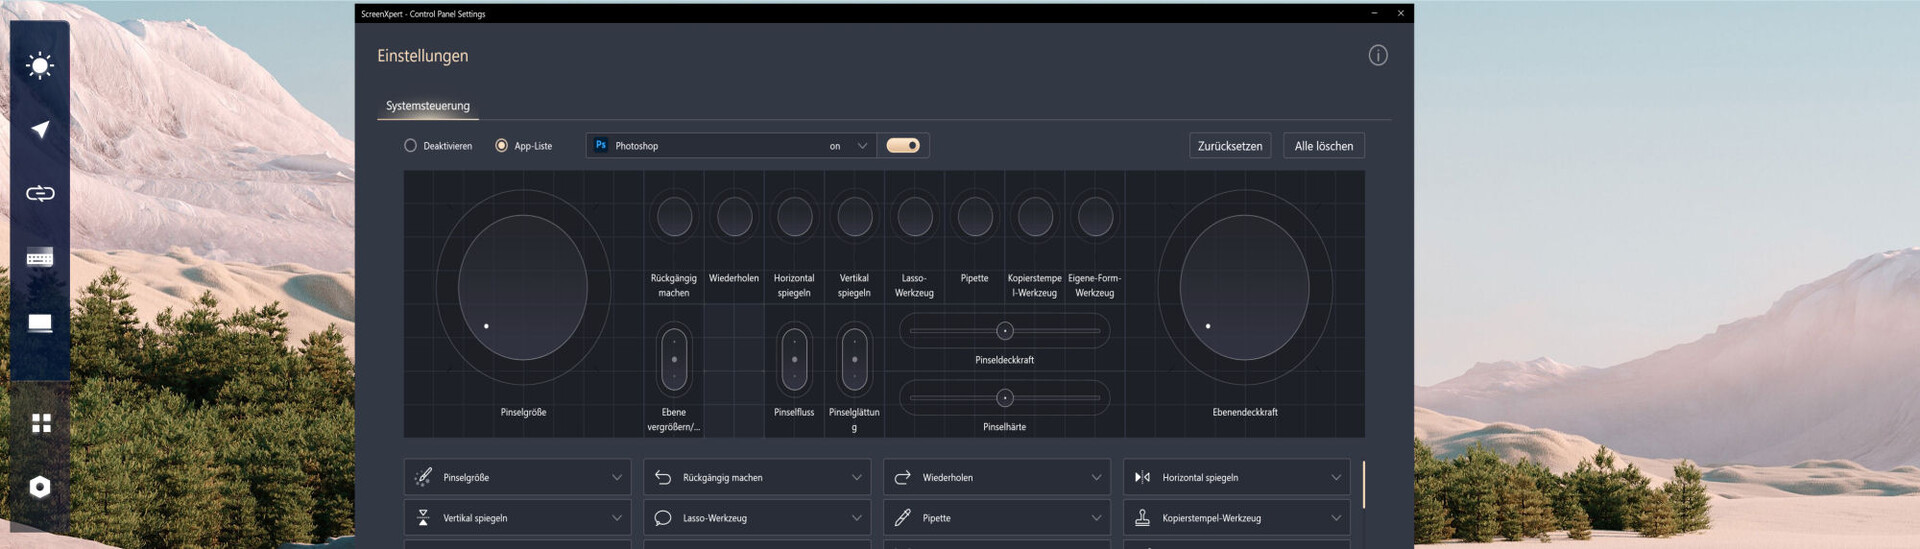
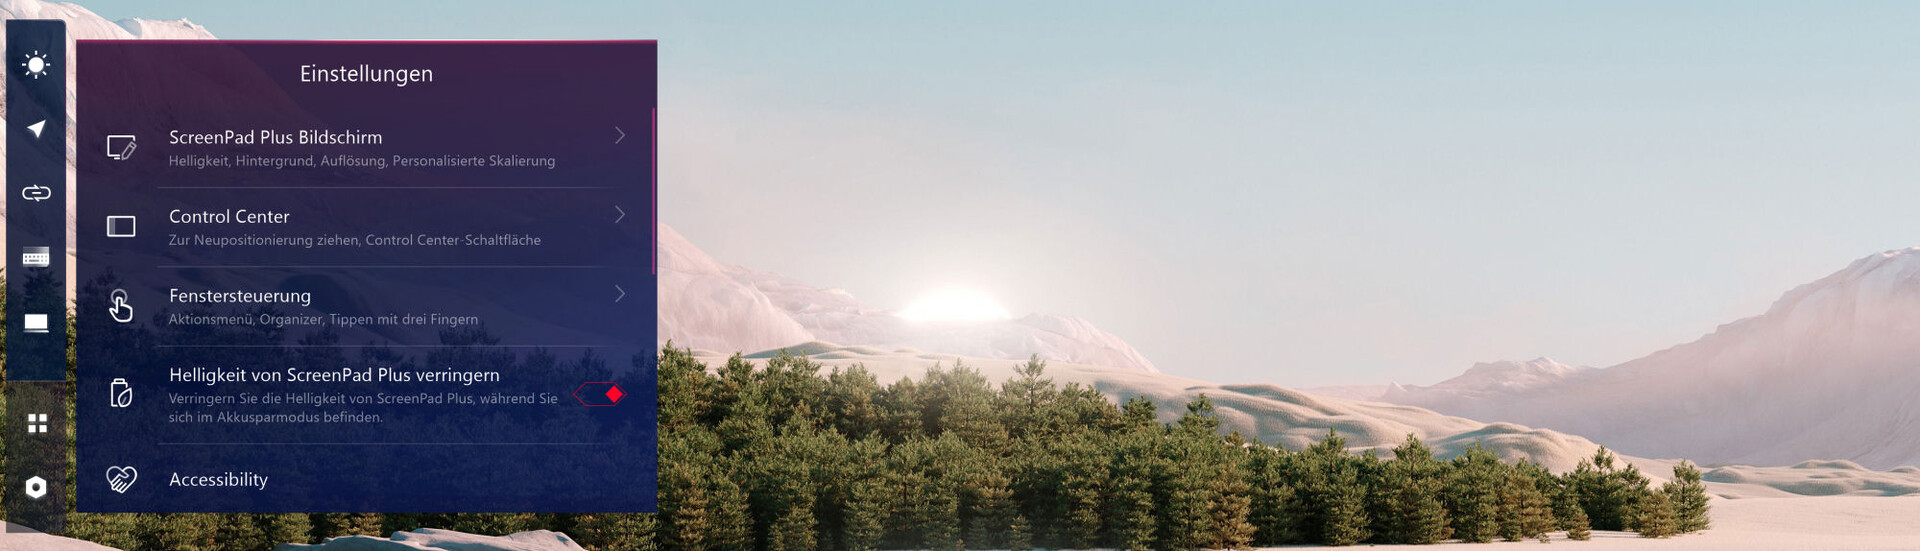
Asus Screenpad Plus
Det finns ytterligare ett inmatningsalternativ i form av Screenpad Plus (14 tum, 3840 x 1100 pixlar, matt), som är en andra skärm med pekskärmsfunktionalitet (stöd för aktiva inmatningspennor). Den beter sig som vilken annan inkopplad extern skärm som helst och kan slås på och stängas av via en separat tangent.
Screenpad ger möjlighet att flytta program eller deras navigeringselement till pekskärmen. Det senare beror på om programmet stöder detta. Vi kan till exempel flytta chattfönstret till skärmplattan medan ett spel körs på huvudskärmen.
Det finns flera små förinstallerade appar som ger en bild av Screenpads möjligheter. Det finns till exempel en miniräknare och ett fält för inmatning av handskrift, och ett Quick Key-program samlar ofta använda funktioner som klippa, kopiera och klistra in.

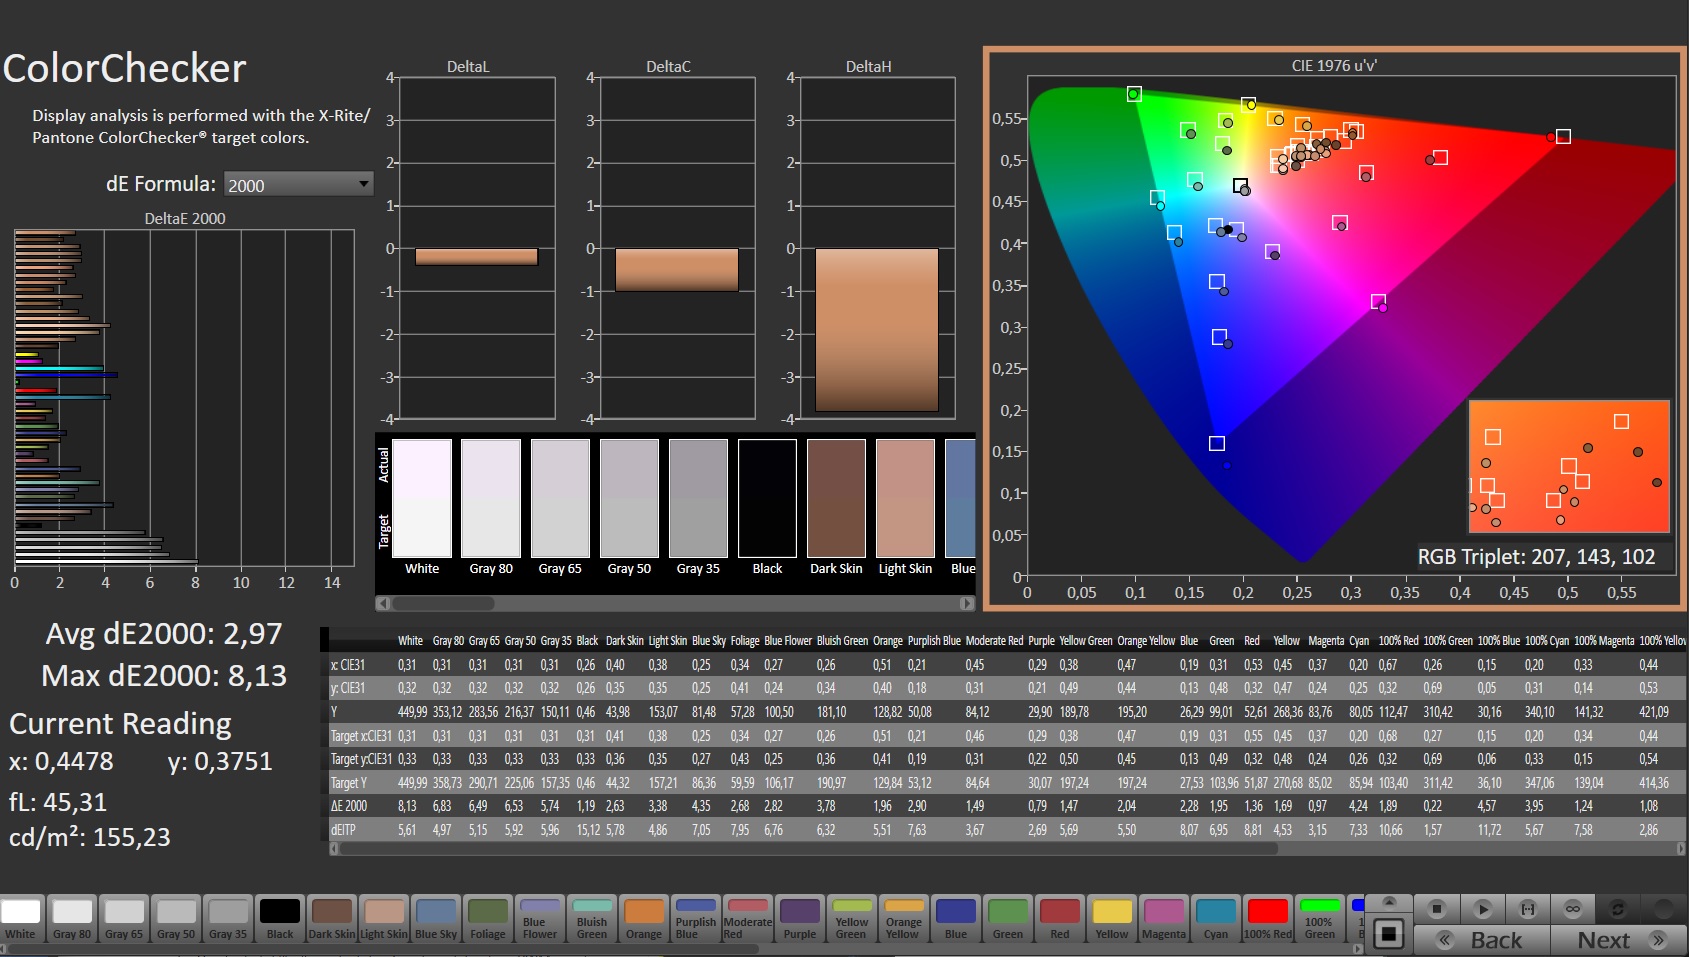
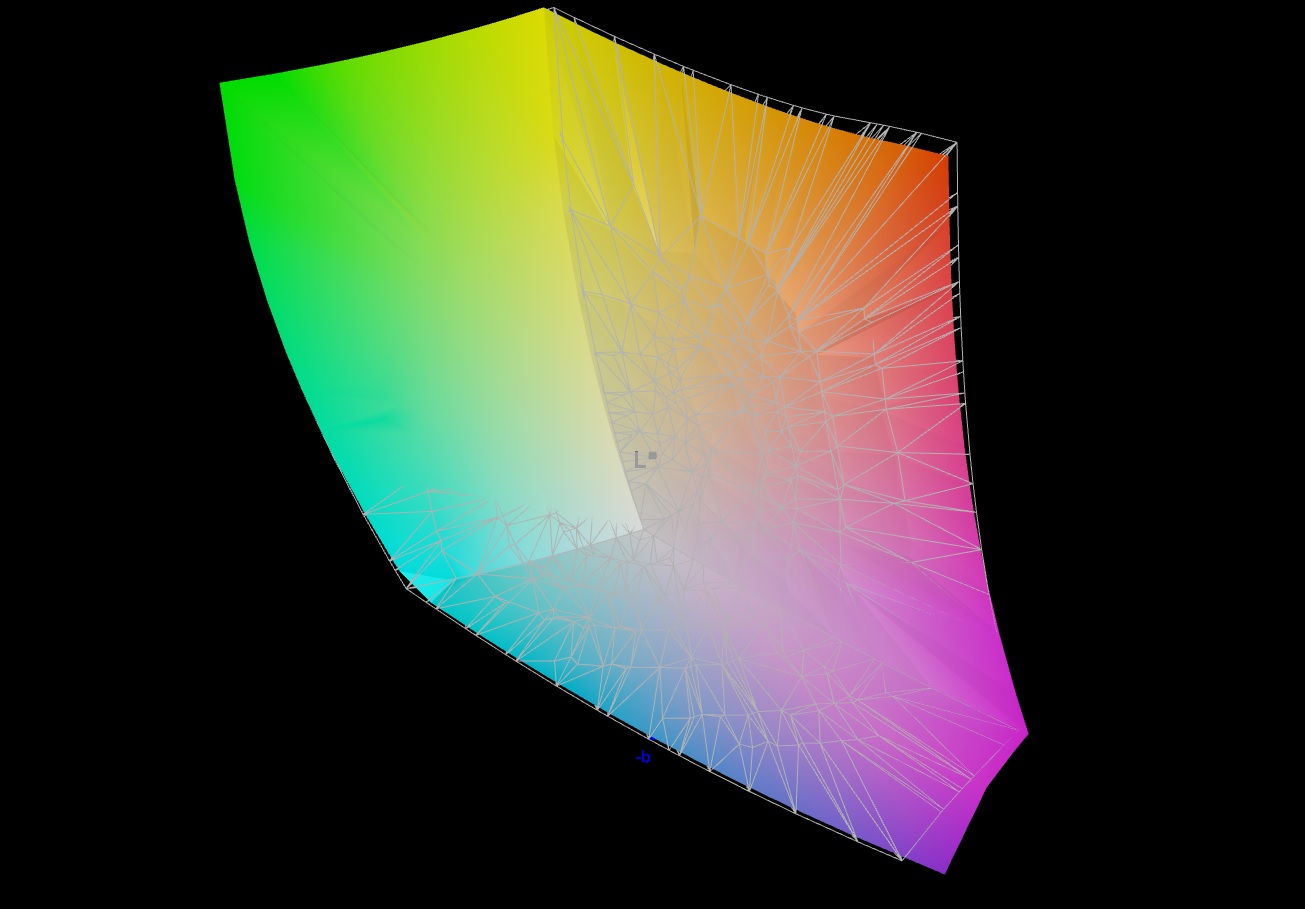
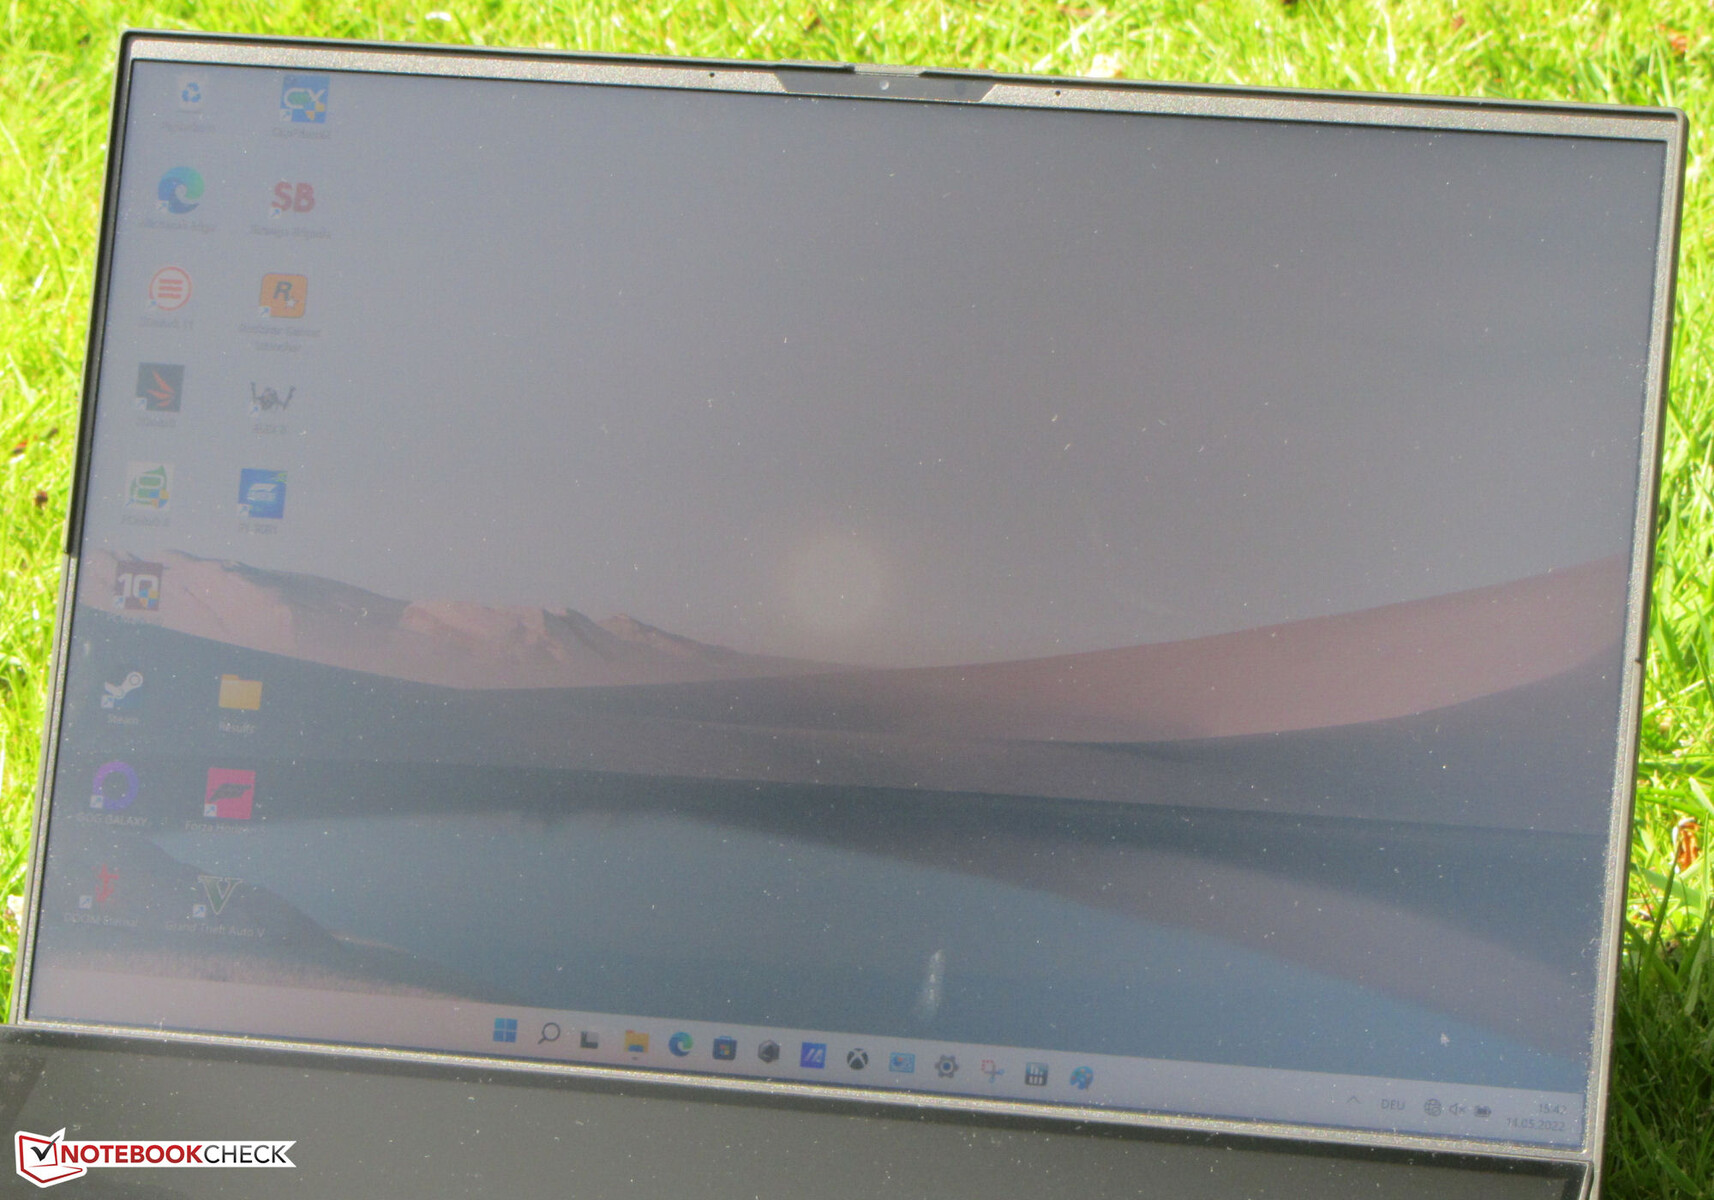
Skärm - Bra färgåtergivning
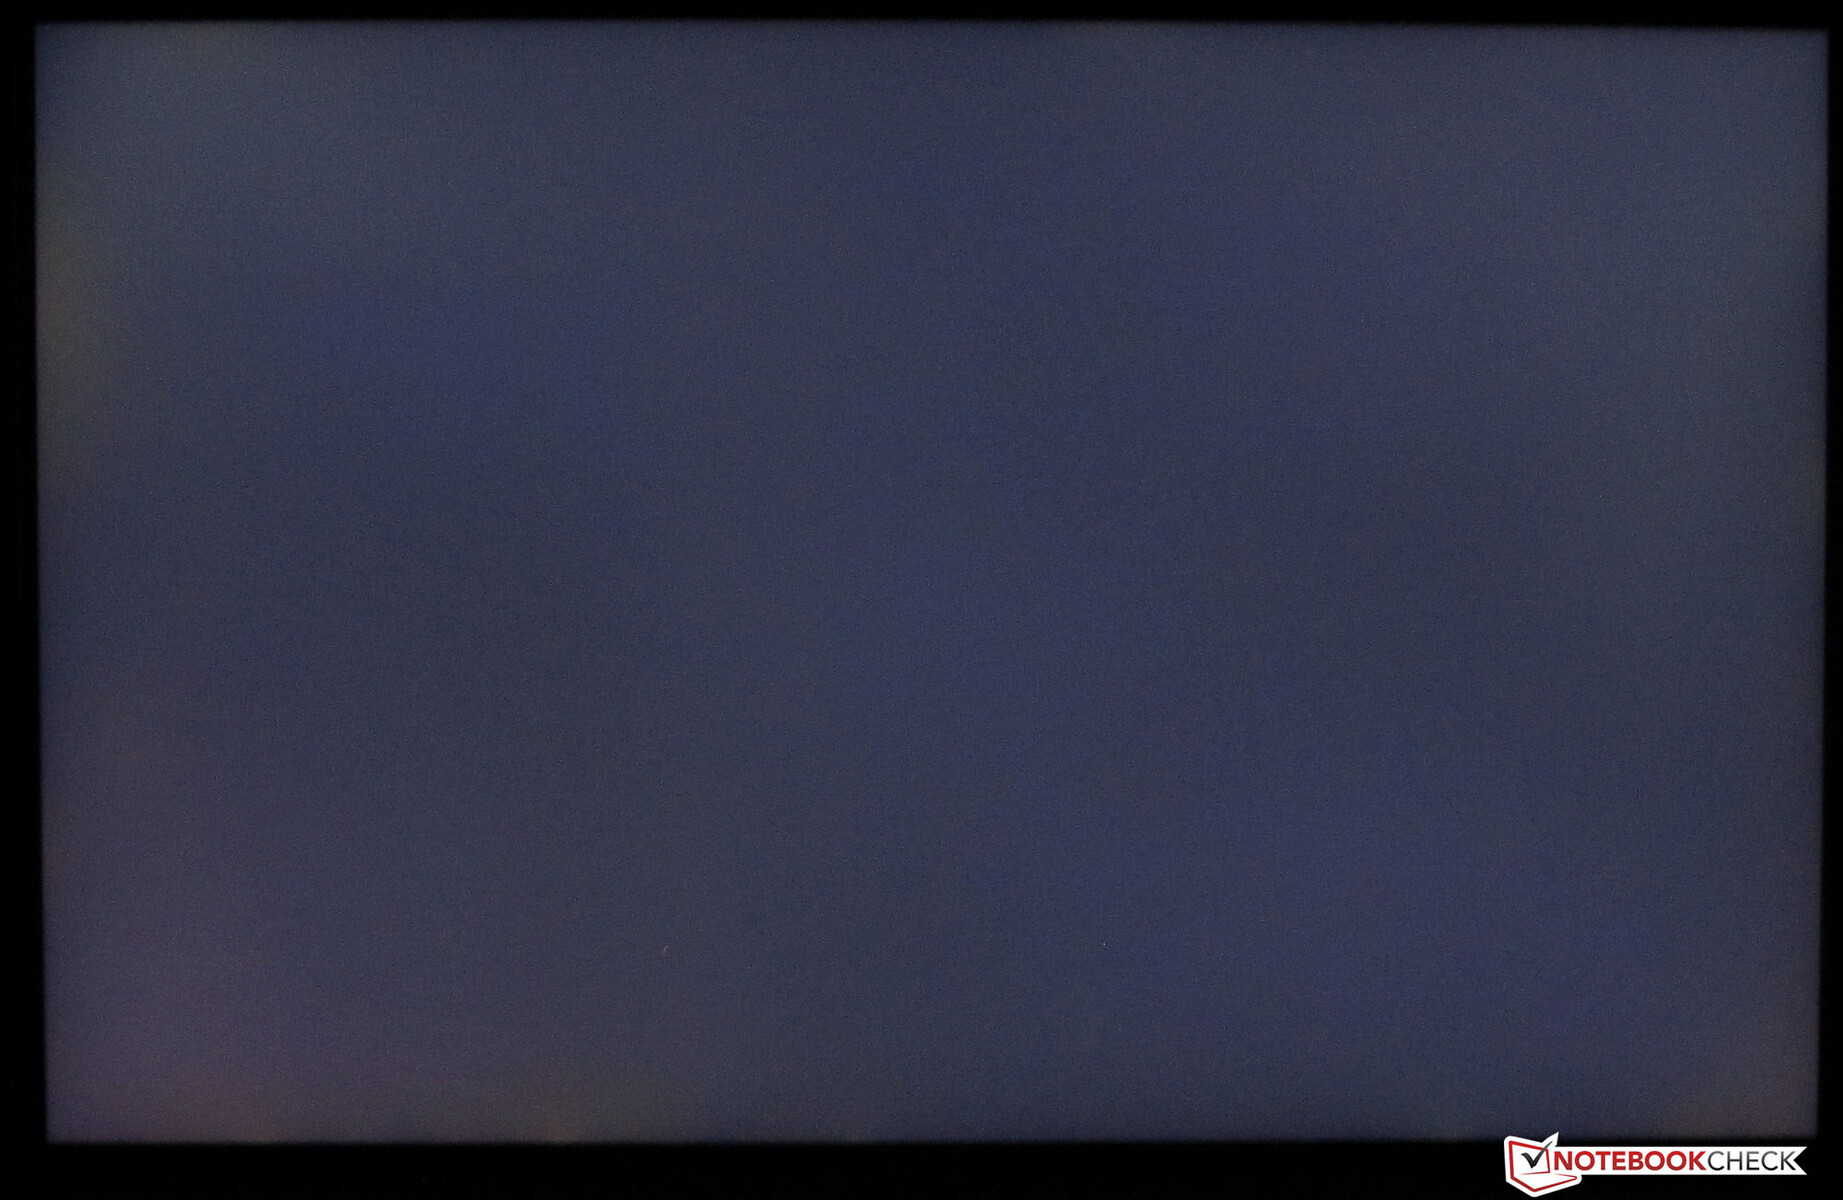
Ljusstyrkan (433,9 cd/m²) och kontrasten (1043:1) på den matta 16-tumsskärmen (3840 x 2400 pixlar) uppfyller kraven. Positiva punkter är de snabba svarstiderna och avsaknaden av PWM-flimmer.
Skärmen stöder AMD:s FreeSync-teknik, som dynamiskt anpassar skärmens uppdateringsfrekvens och GPU:ns bildfrekvens till varandra. På så sätt ska den skapade bilden vara så jämn som möjligt, särskilt under datorspel.
| |||||||||||||||||||||||||
Distribution av ljusstyrkan: 88 %
Mitt på batteriet: 459 cd/m²
Kontrast: 1043:1 (Svärta: 0.44 cd/m²)
ΔE ColorChecker Calman: 2.97 | ∀{0.5-29.43 Ø4.71}
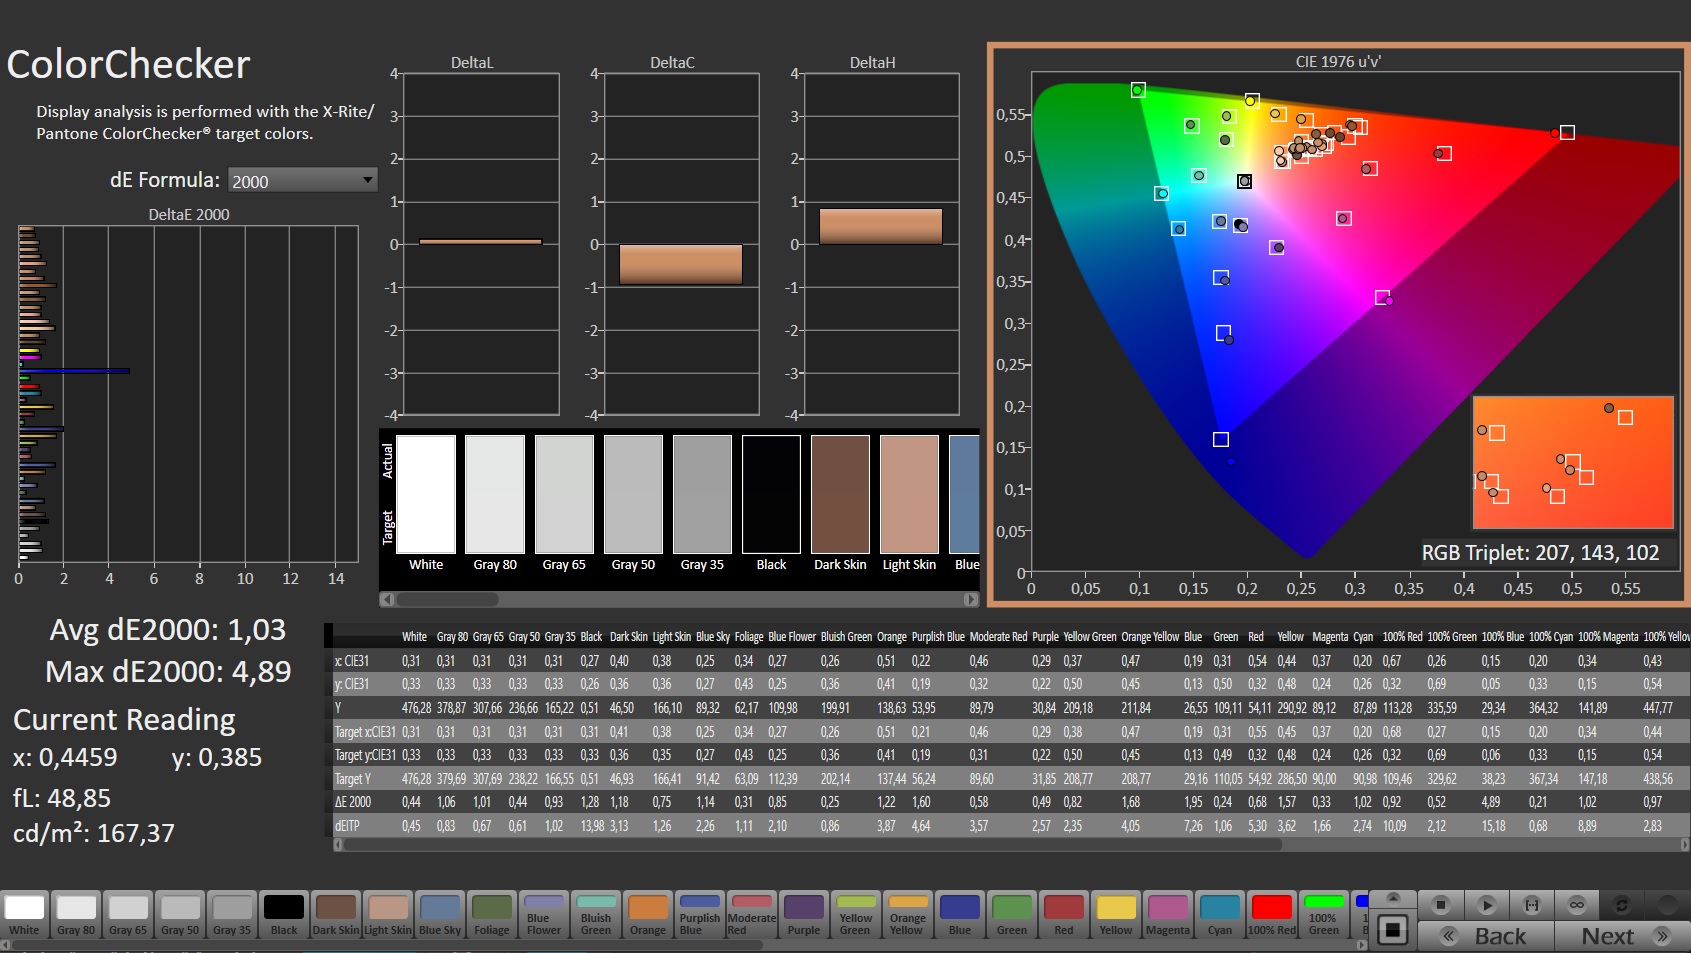
calibrated: 1.03
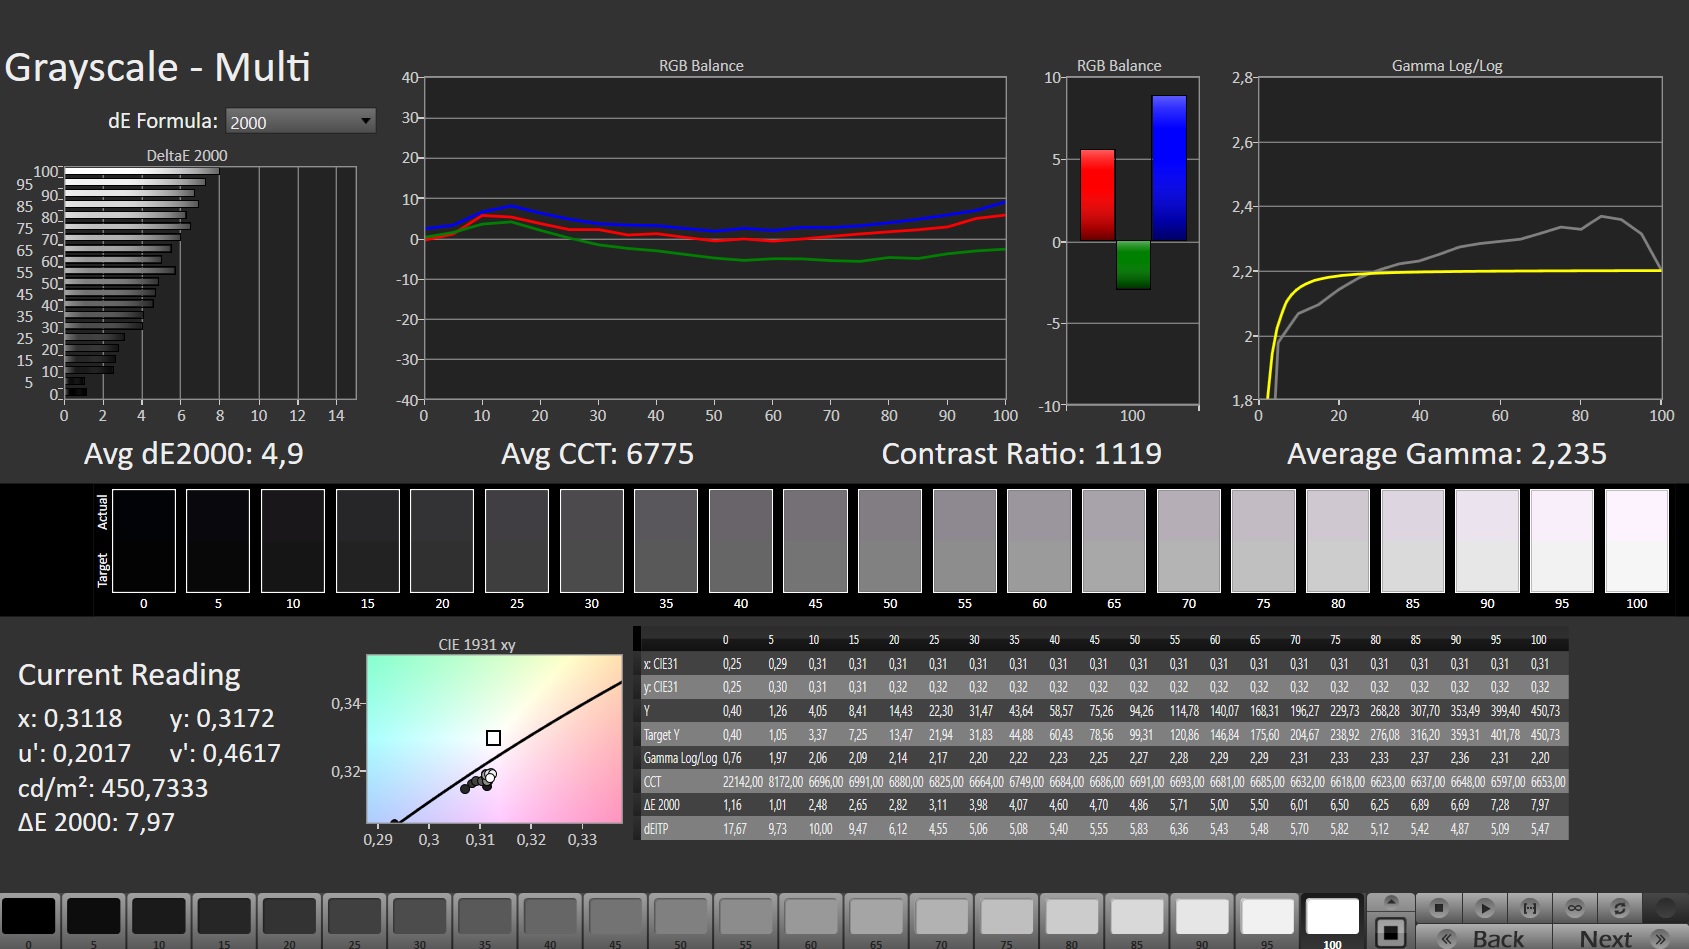
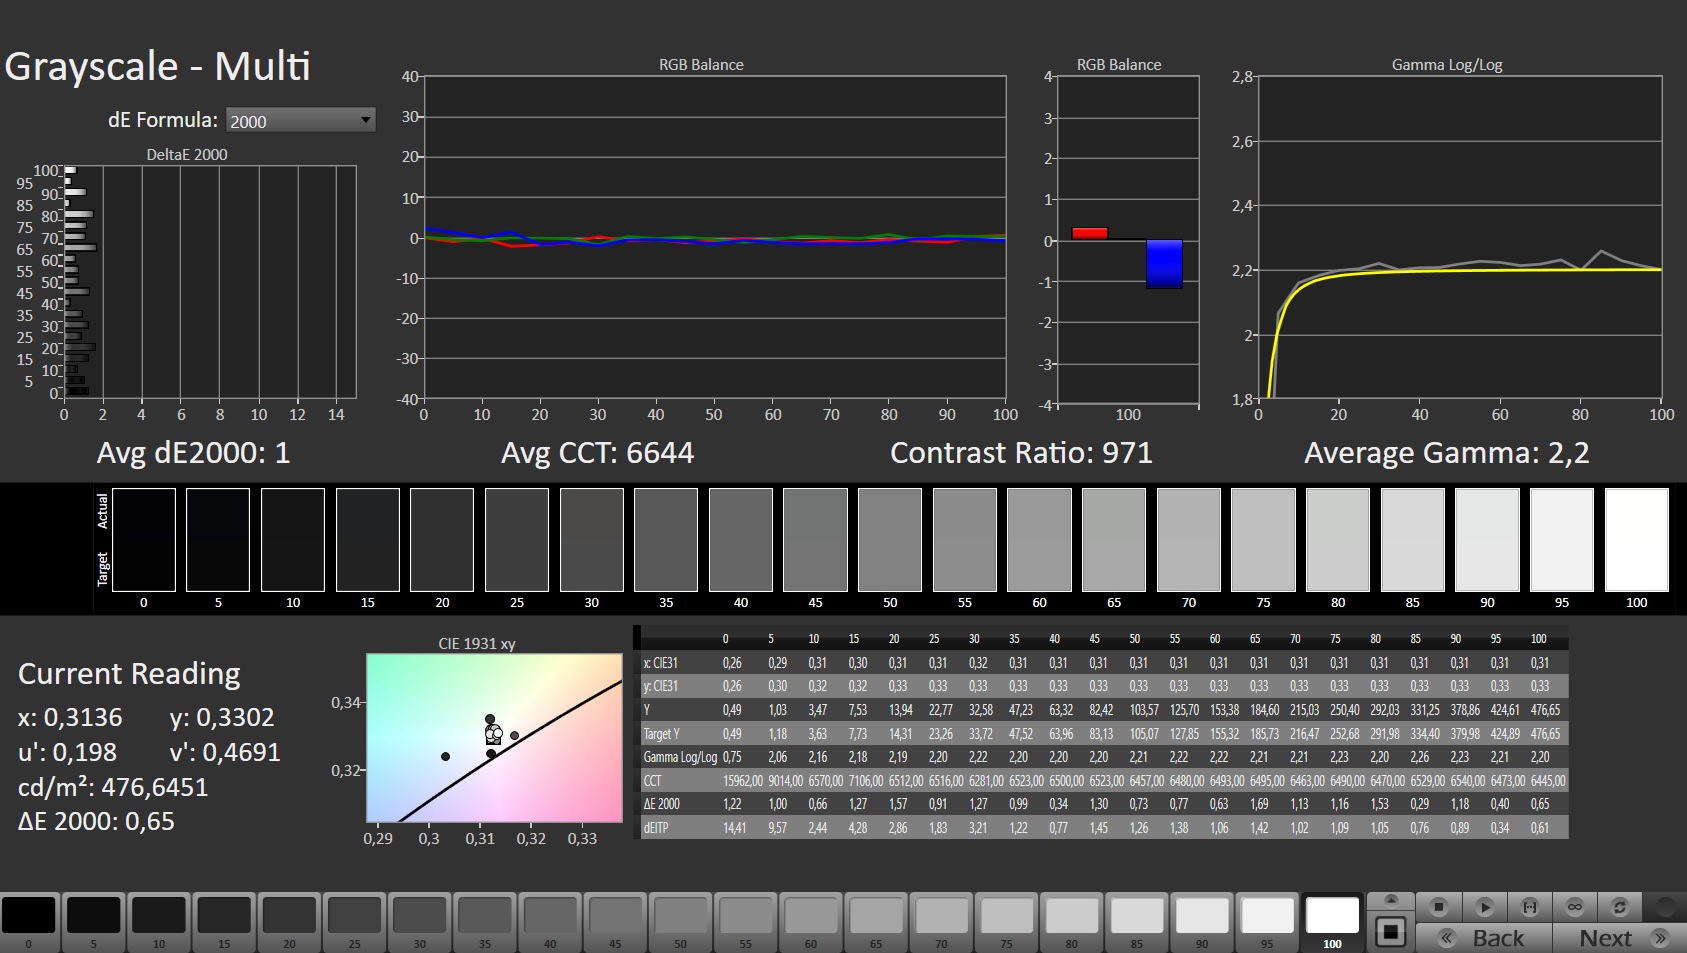
ΔE Greyscale Calman: 4.9 | ∀{0.09-98 Ø4.96}
86.3% AdobeRGB 1998 (Argyll 3D)
99.9% sRGB (Argyll 3D)
98% Display P3 (Argyll 3D)
Gamma: 2.235
CCT: 6775 K
| Asus ROG Zephyrus Duo 16 GX650RX BOE NE160QAM-NX1, IPS-Level, 3840x2400, 16" | Apple MacBook Pro 16 2021 M1 Max Mini-LED, 3456x2234, 16.2" | Razer Blade 15 Advanced Model Early 2022 TL156VDXP02-0, IPS, 1920x1080, 15.6" | MSI GE76 Raider AU Optronics B173HAN05.4 (AUOE295), IPS-Level, 1920x1080, 17.3" | Medion Erazer Beast X30 BOE CQ NE173QHM-NZ3, IPS, 2560x1440, 17.3" | Gigabyte Aero 16 YE5 Samsung SDC416B, AMOLED, 3840x2400, 16" | |
|---|---|---|---|---|---|---|
| Display | -23% | -22% | -18% | |||
| Display P3 Coverage (%) | 98 | 65.3 -33% | 63.1 -36% | 67.7 -31% | ||
| sRGB Coverage (%) | 99.9 | 85.1 -15% | 94 -6% | 97.6 -2% | ||
| AdobeRGB 1998 Coverage (%) | 86.3 | 67.4 -22% | 65.2 -24% | 69.2 -20% | ||
| Response Times | -9% | -5% | -26% | 74% | ||
| Response Time Grey 50% / Grey 80% * (ms) | 14.6 ? | 4.3 ? 71% | 5.6 ? 62% | 14.7 ? -1% | 2.4 ? 84% | |
| Response Time Black / White * (ms) | 5.6 ? | 10.5 ? -88% | 9.6 ? -71% | 8.4 ? -50% | 2 ? 64% | |
| PWM Frequency (Hz) | 60 ? | |||||
| Screen | 329% | 27% | 20% | 3% | 456% | |
| Brightness middle (cd/m²) | 459 | 507 10% | 330 -28% | 290 -37% | 377 -18% | 368 -20% |
| Brightness (cd/m²) | 434 | 494 14% | 315 -27% | 290 -33% | 352 -19% | 368 -15% |
| Brightness Distribution (%) | 88 | 96 9% | 89 1% | 96 9% | 86 -2% | 93 6% |
| Black Level * (cd/m²) | 0.44 | 0.02 95% | 0.24 45% | 0.23 48% | 0.32 27% | 0.01 98% |
| Contrast (:1) | 1043 | 25350 2330% | 1375 32% | 1261 21% | 1178 13% | 36800 3428% |
| Colorchecker dE 2000 * | 2.97 | 1.4 53% | 1.47 51% | 1.59 46% | 2.91 2% | 2.33 22% |
| Colorchecker dE 2000 max. * | 8.13 | 2.8 66% | 2.73 66% | 3.17 61% | 6.78 17% | 4.34 47% |
| Colorchecker dE 2000 calibrated * | 1.03 | 0.63 39% | 0.87 16% | 1.3 -26% | ||
| Greyscale dE 2000 * | 4.9 | 2.3 53% | 1.8 63% | 2.5 49% | 3.4 31% | 0.8 84% |
| Gamma | 2.235 98% | 2.27 97% | 2.282 96% | 2.253 98% | 2.109 104% | 2.119 104% |
| CCT | 6775 96% | 6792 96% | 6499 100% | 6640 98% | 7273 89% | 6569 99% |
| Totalt genomsnitt (program/inställningar) | 329% /
329% | -2% /
11% | -2% /
8% | -14% /
-6% | 265% /
380% |
* ... mindre är bättre
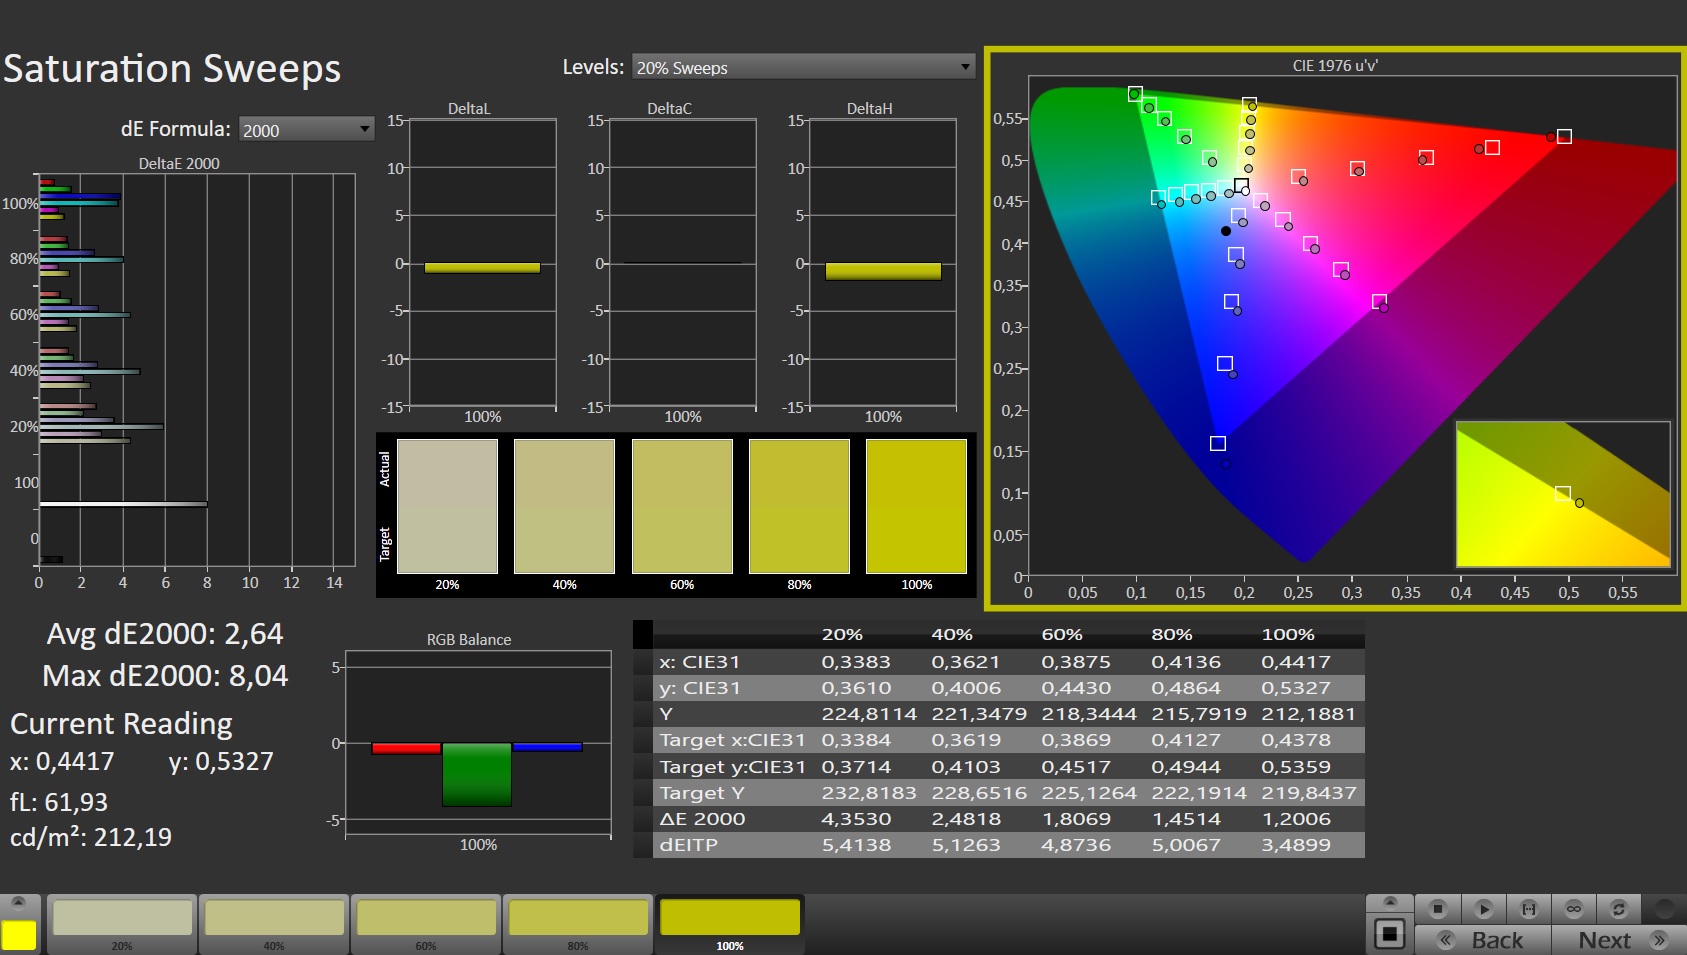
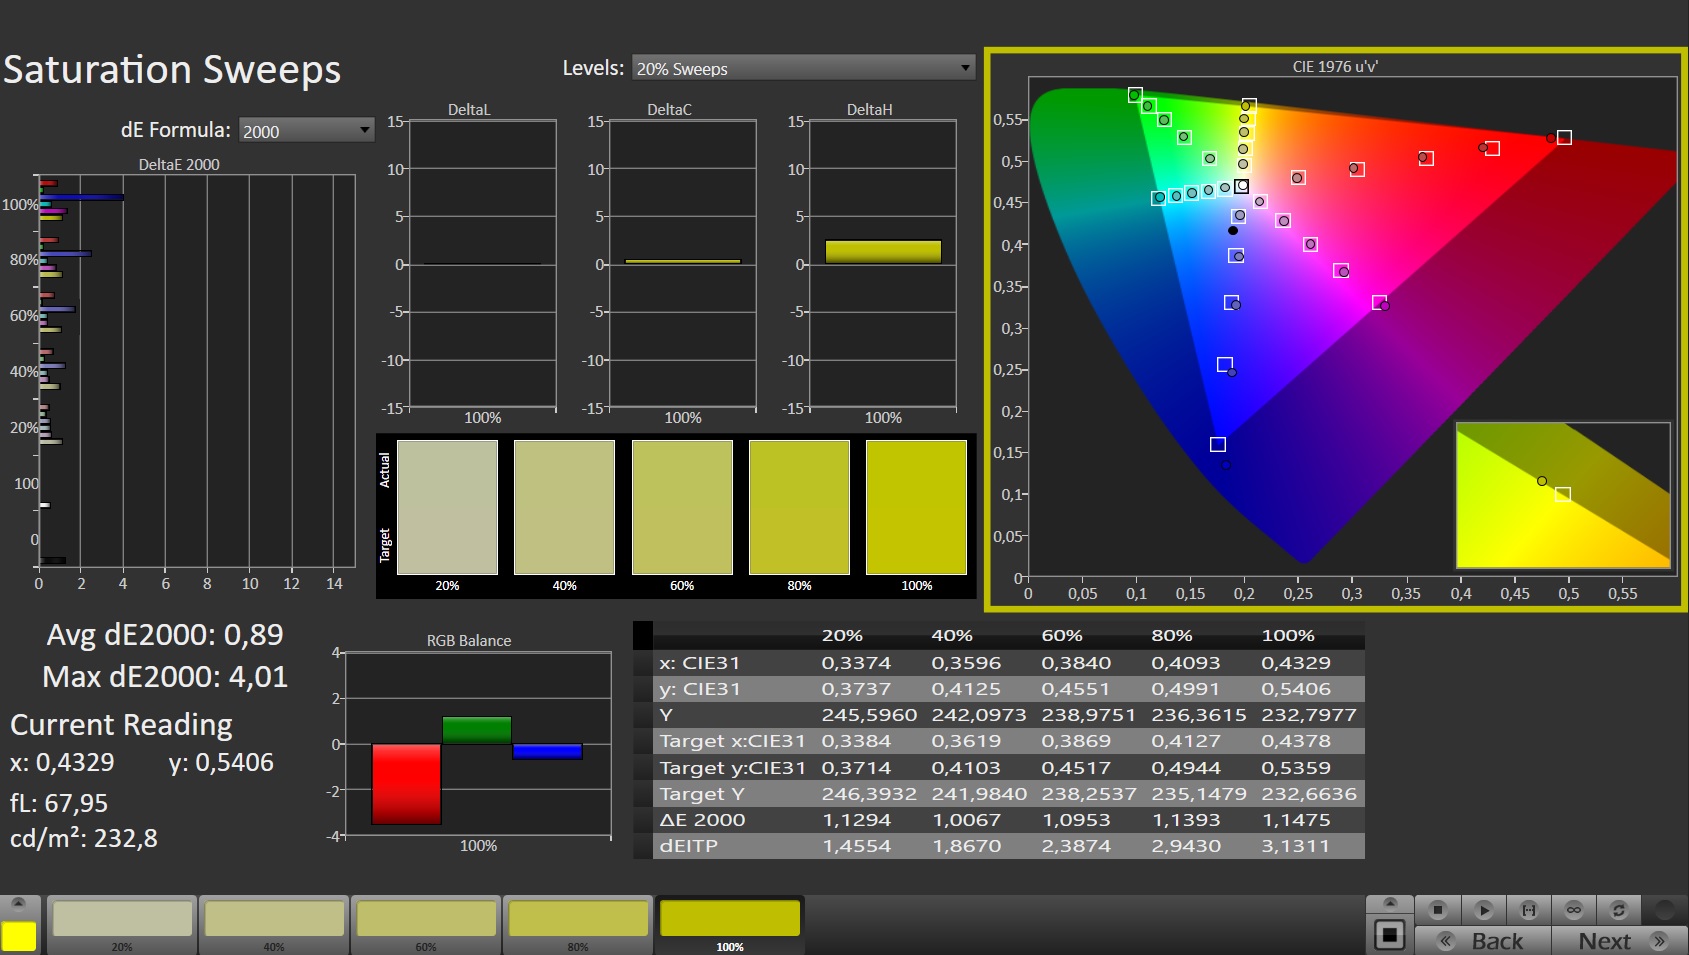
Skärmens X Rite Pantone-certifiering garanterar en mycket naturlig färgåtergivning. På motsvarande sätt är färgvisningen ganska exakt redan i leveransstadiet. Även om färgavvikelsen håller sig inom målgränserna ger en kalibrering ändå betydande förbättringar. Skärmen kan visa sRGB- (99,9 %) och DCI-P3- (98 %) färgrymderna nästan helt och hållet, och 86 % av AdobeRGB-färgrymderna täcks också.


Visa svarstider
| ↔ Svarstid svart till vitt | ||
|---|---|---|
| 5.6 ms ... stiga ↗ och falla ↘ kombinerat | ↗ 2 ms stiga | 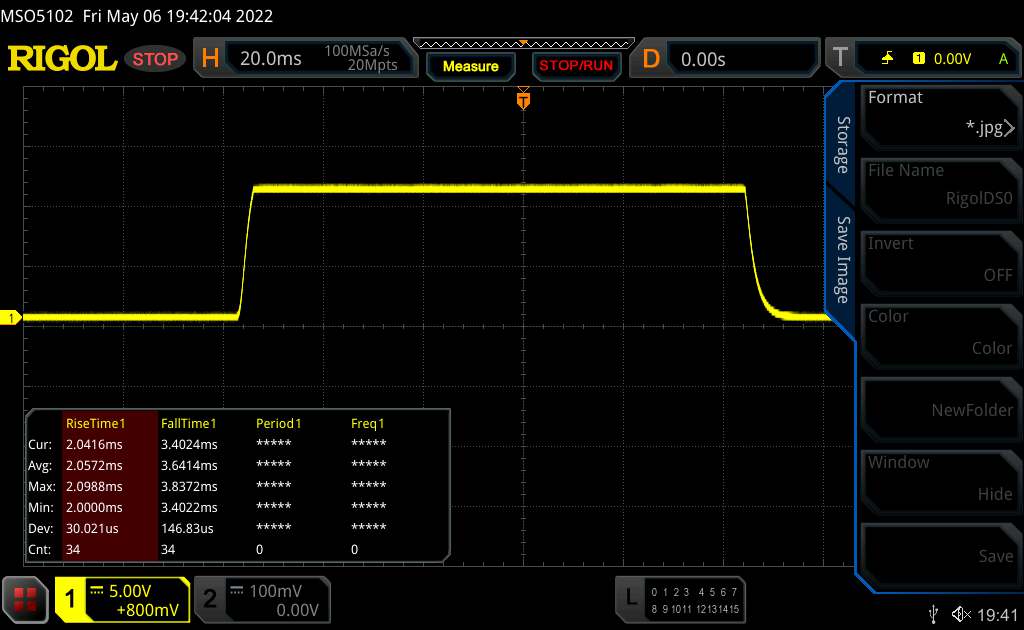 |
| ↘ 3.6 ms hösten | ||
| Skärmen visar väldigt snabba svarsfrekvenser i våra tester och borde vara mycket väl lämpad för fartfyllt spel. I jämförelse sträcker sig alla testade enheter från 0.1 (minst) till 240 (maximalt) ms. » 18 % av alla enheter är bättre. Det betyder att den uppmätta svarstiden är bättre än genomsnittet av alla testade enheter (19.8 ms). | ||
| ↔ Svarstid 50 % grått till 80 % grått | ||
| 14.6 ms ... stiga ↗ och falla ↘ kombinerat | ↗ 6.7 ms stiga | 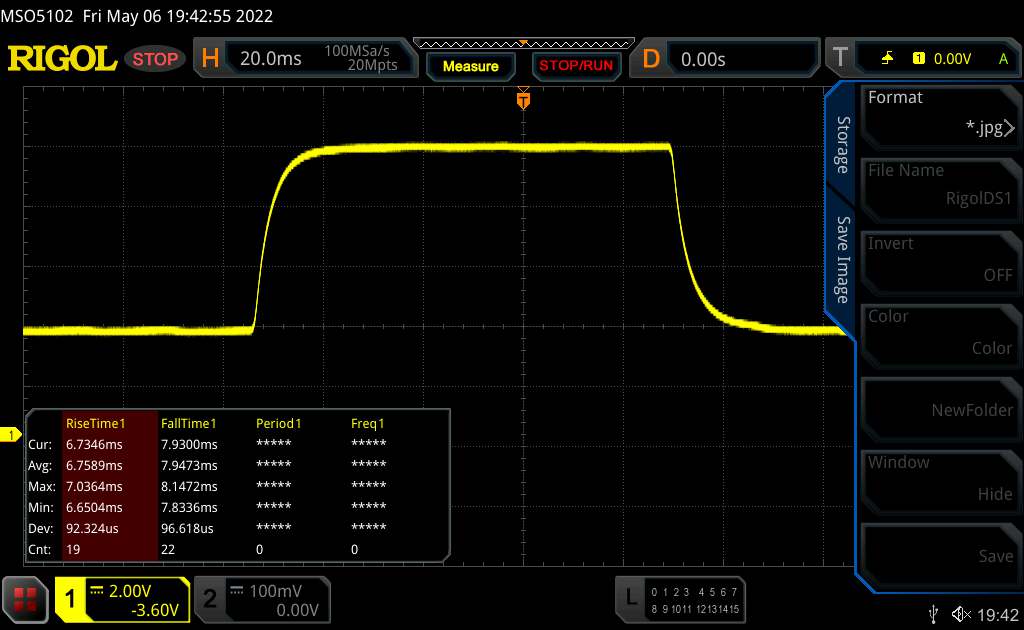 |
| ↘ 7.9 ms hösten | ||
| Skärmen visar bra svarsfrekvens i våra tester, men kan vara för långsam för konkurrenskraftiga spelare. I jämförelse sträcker sig alla testade enheter från 0.165 (minst) till 636 (maximalt) ms. » 29 % av alla enheter är bättre. Det betyder att den uppmätta svarstiden är bättre än genomsnittet av alla testade enheter (30.9 ms). | ||
Skärmflimmer / PWM (Puls-Width Modulation)
| Skärmflimmer / PWM upptäcktes inte | 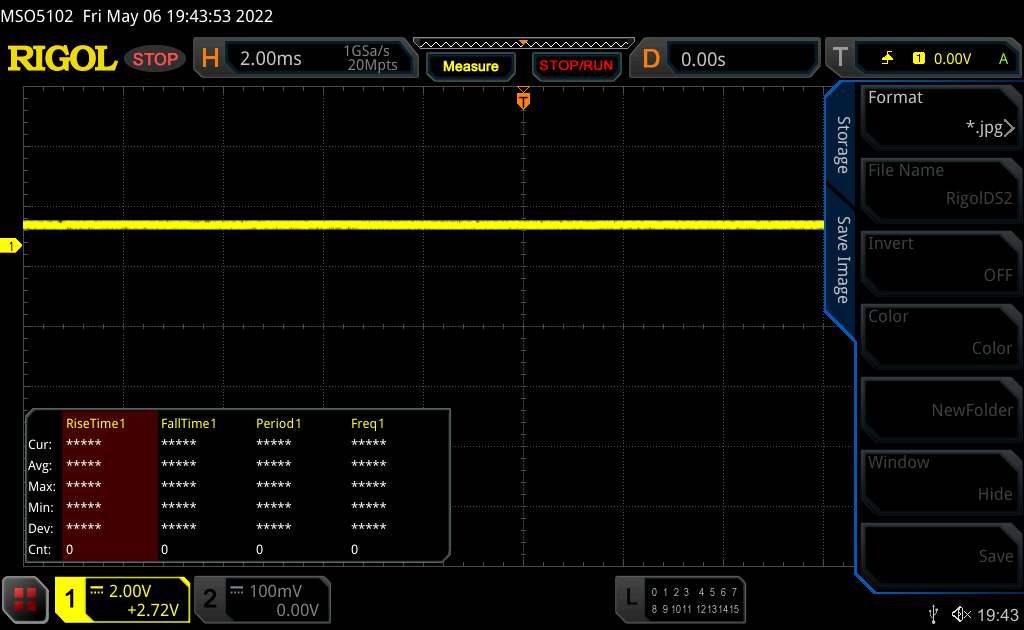 | ||
Som jämförelse: 52 % av alla testade enheter använder inte PWM för att dämpa skärmen. Om PWM upptäcktes mättes ett medelvärde av 7748 (minst: 5 - maximum: 343500) Hz. | |||
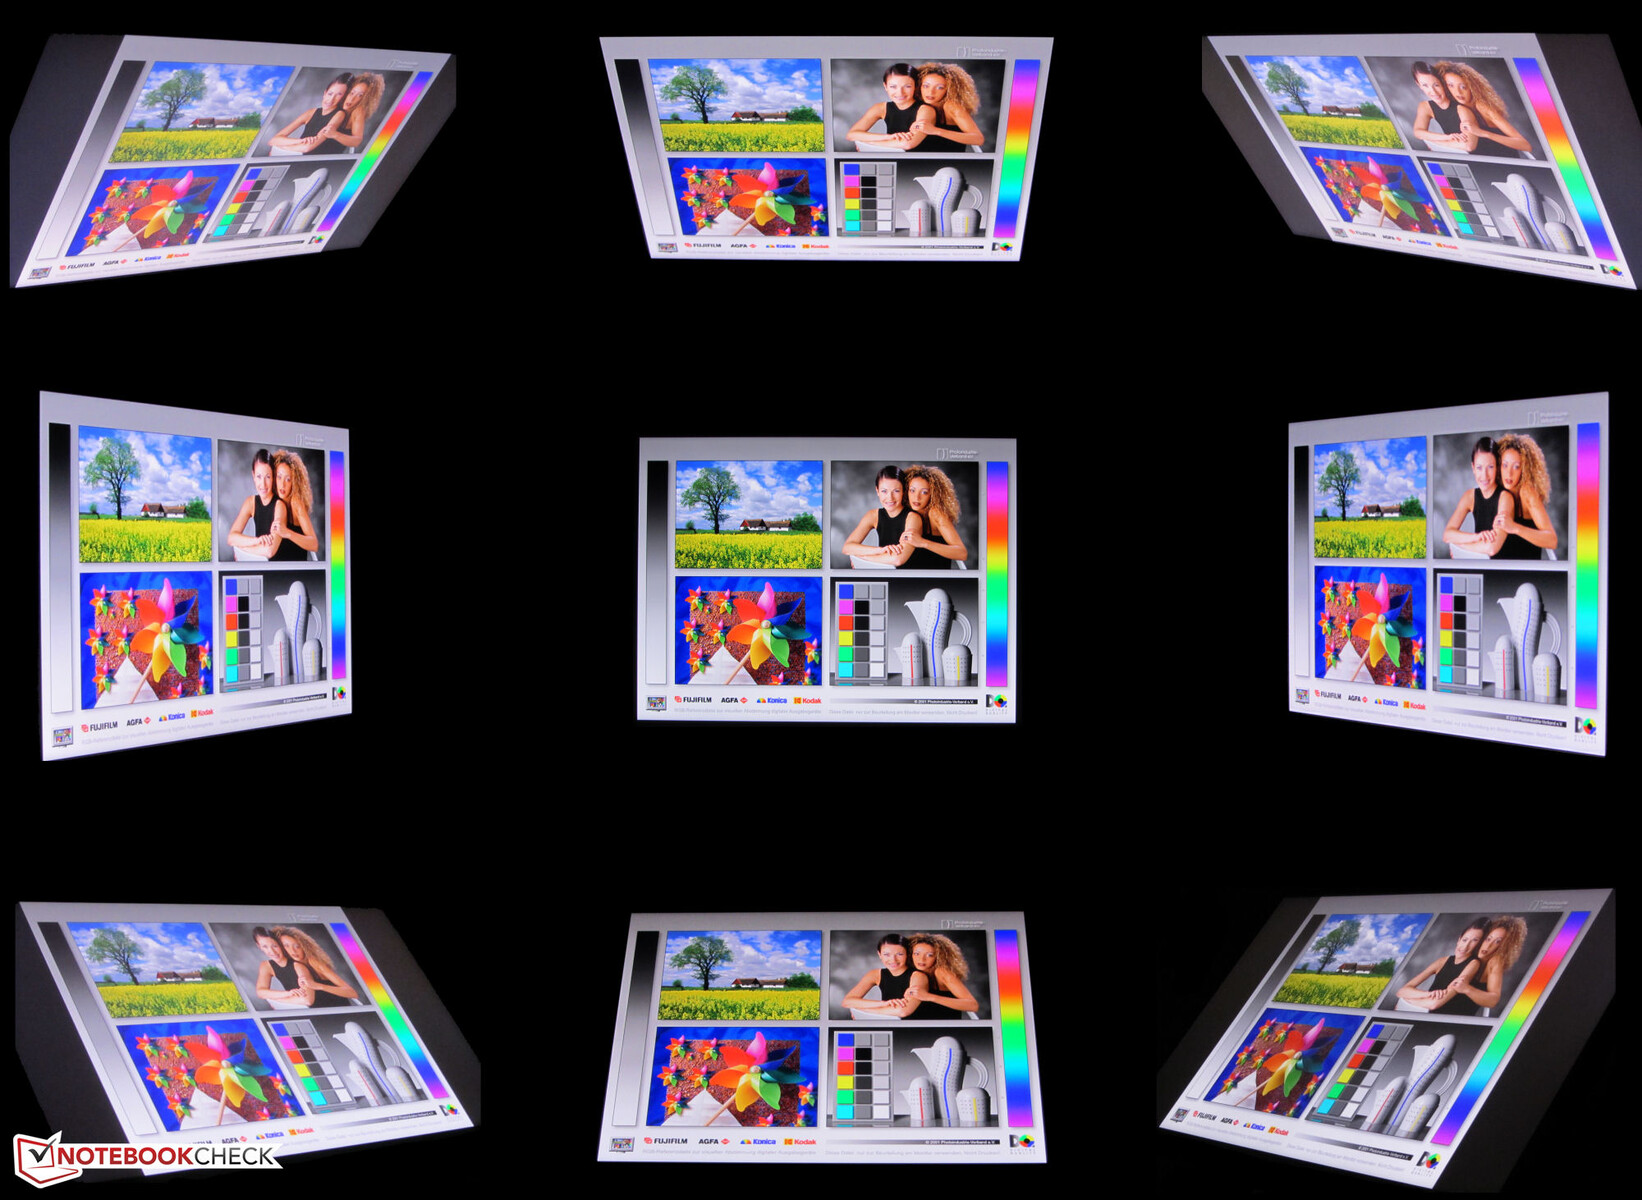
IPS-panelens betraktningsvinklar är stabila och den kan läsas från alla vinklar. Skärmen kan läsas utomhus om solljuset inte är för starkt.
Föreställning - Rembrandt möter Ampere
Med Zephyrus Duo 16 GX650RX erbjuder Asus en 16-tums bärbar dator som i första hand är avsedd för spel. Enheten är dock även inriktad på streamers och innehållsskapare.
Testvillkor
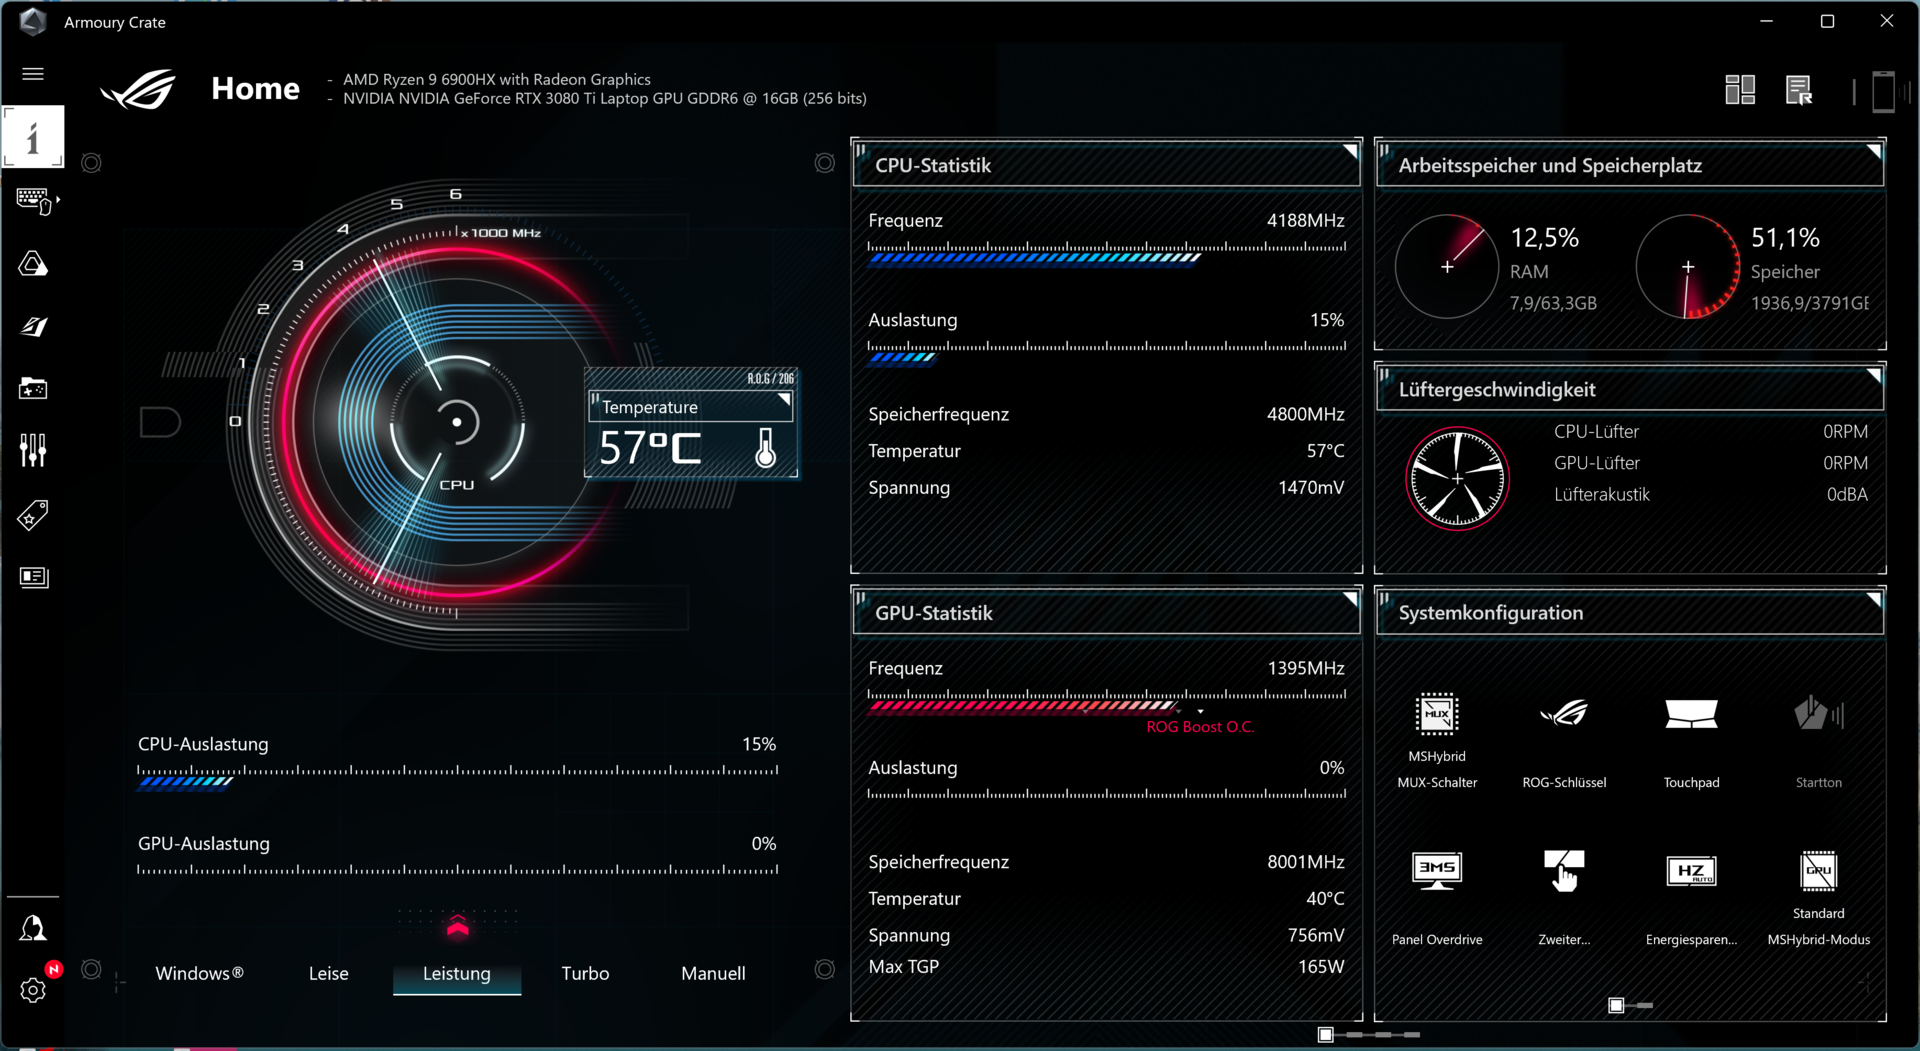
Den bärbara datorn erbjuder tre tillverkarspecifika prestandaprofiler ("Silent", "Performance" och "Turbo") och du kan växla mellan dem med hjälp av tangentkombinationen "Fn" + "F5". Profilen "Turbo" kan endast användas vid nätdrift. Våra batteritester utfördes med profilen "Silent" och alla benchmarks med profilen "Performance" aktiverad.
| Prestanda | Turbo | Silent | |
|---|---|---|---|
| Effektbegränsning 1 | 80 Watt | 100 Watt | 70 Watt |
| Effektgräns 2 | 80 Watt | 125 Watt | 70 Watt |
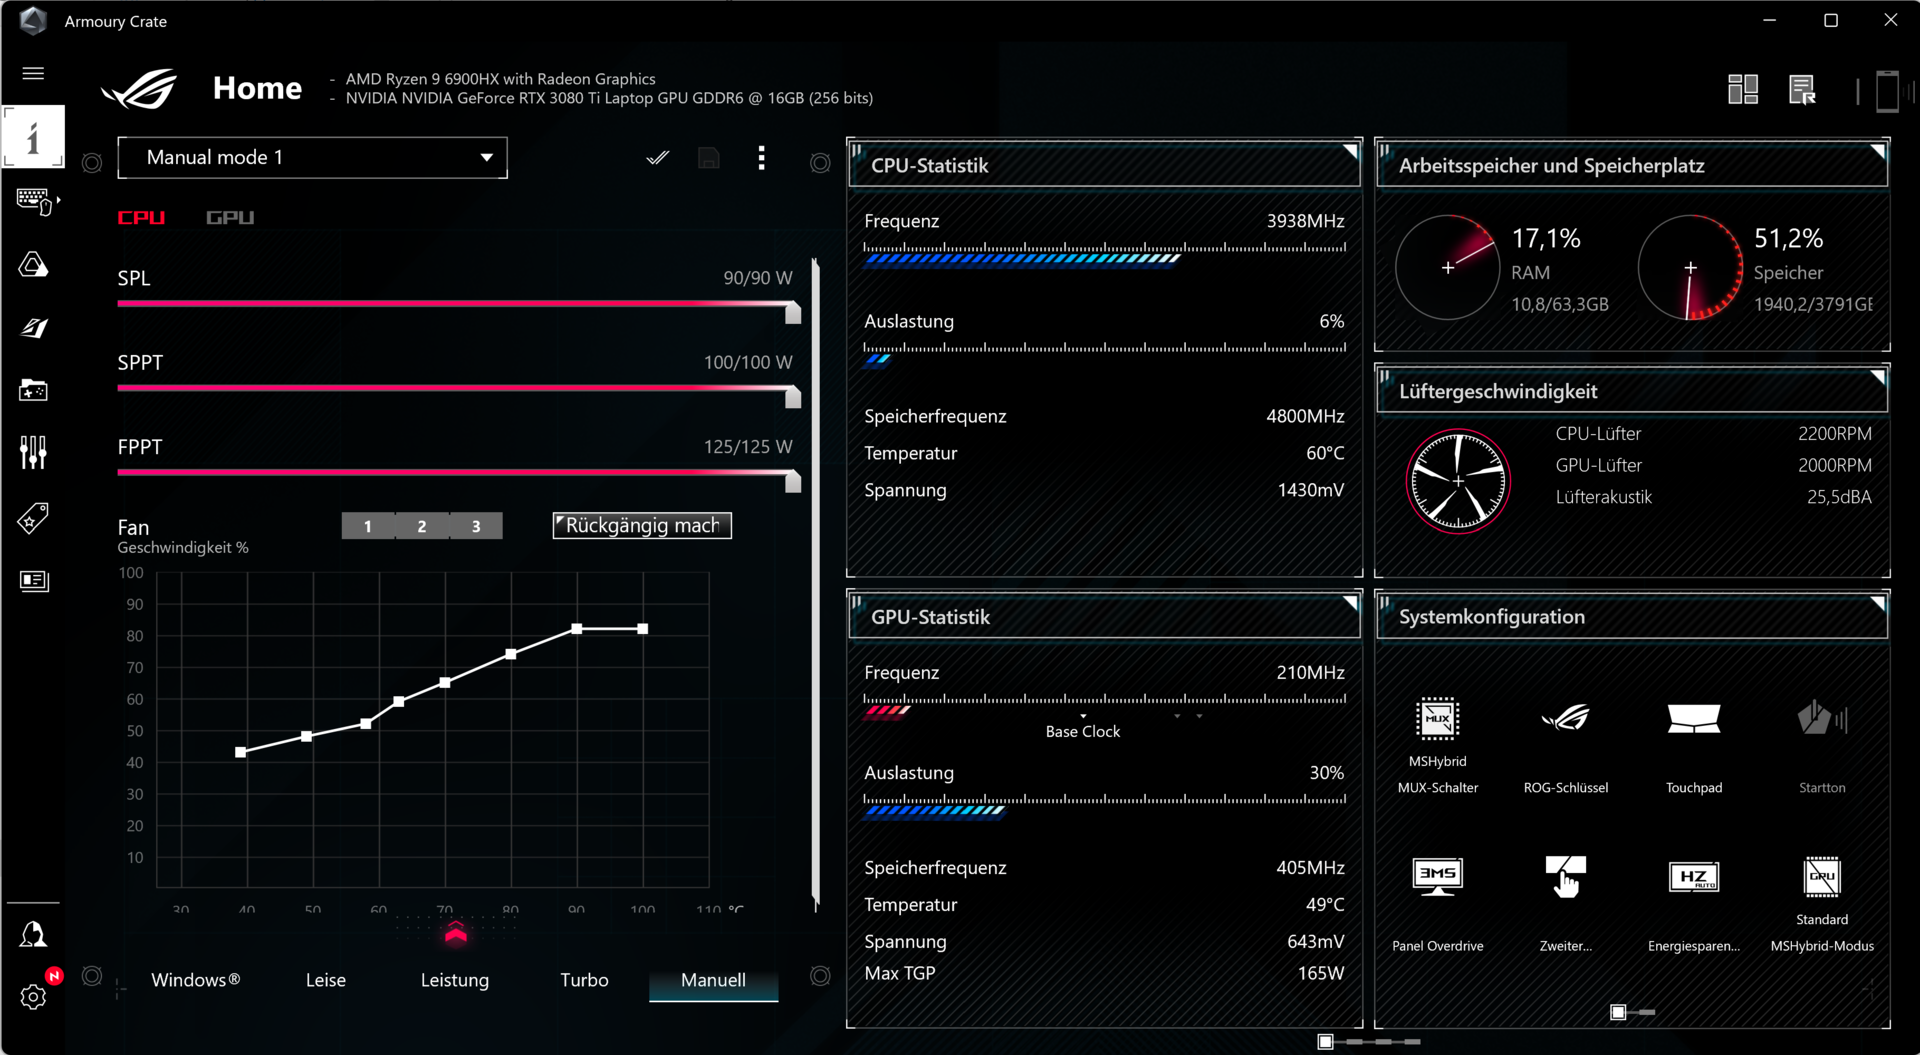
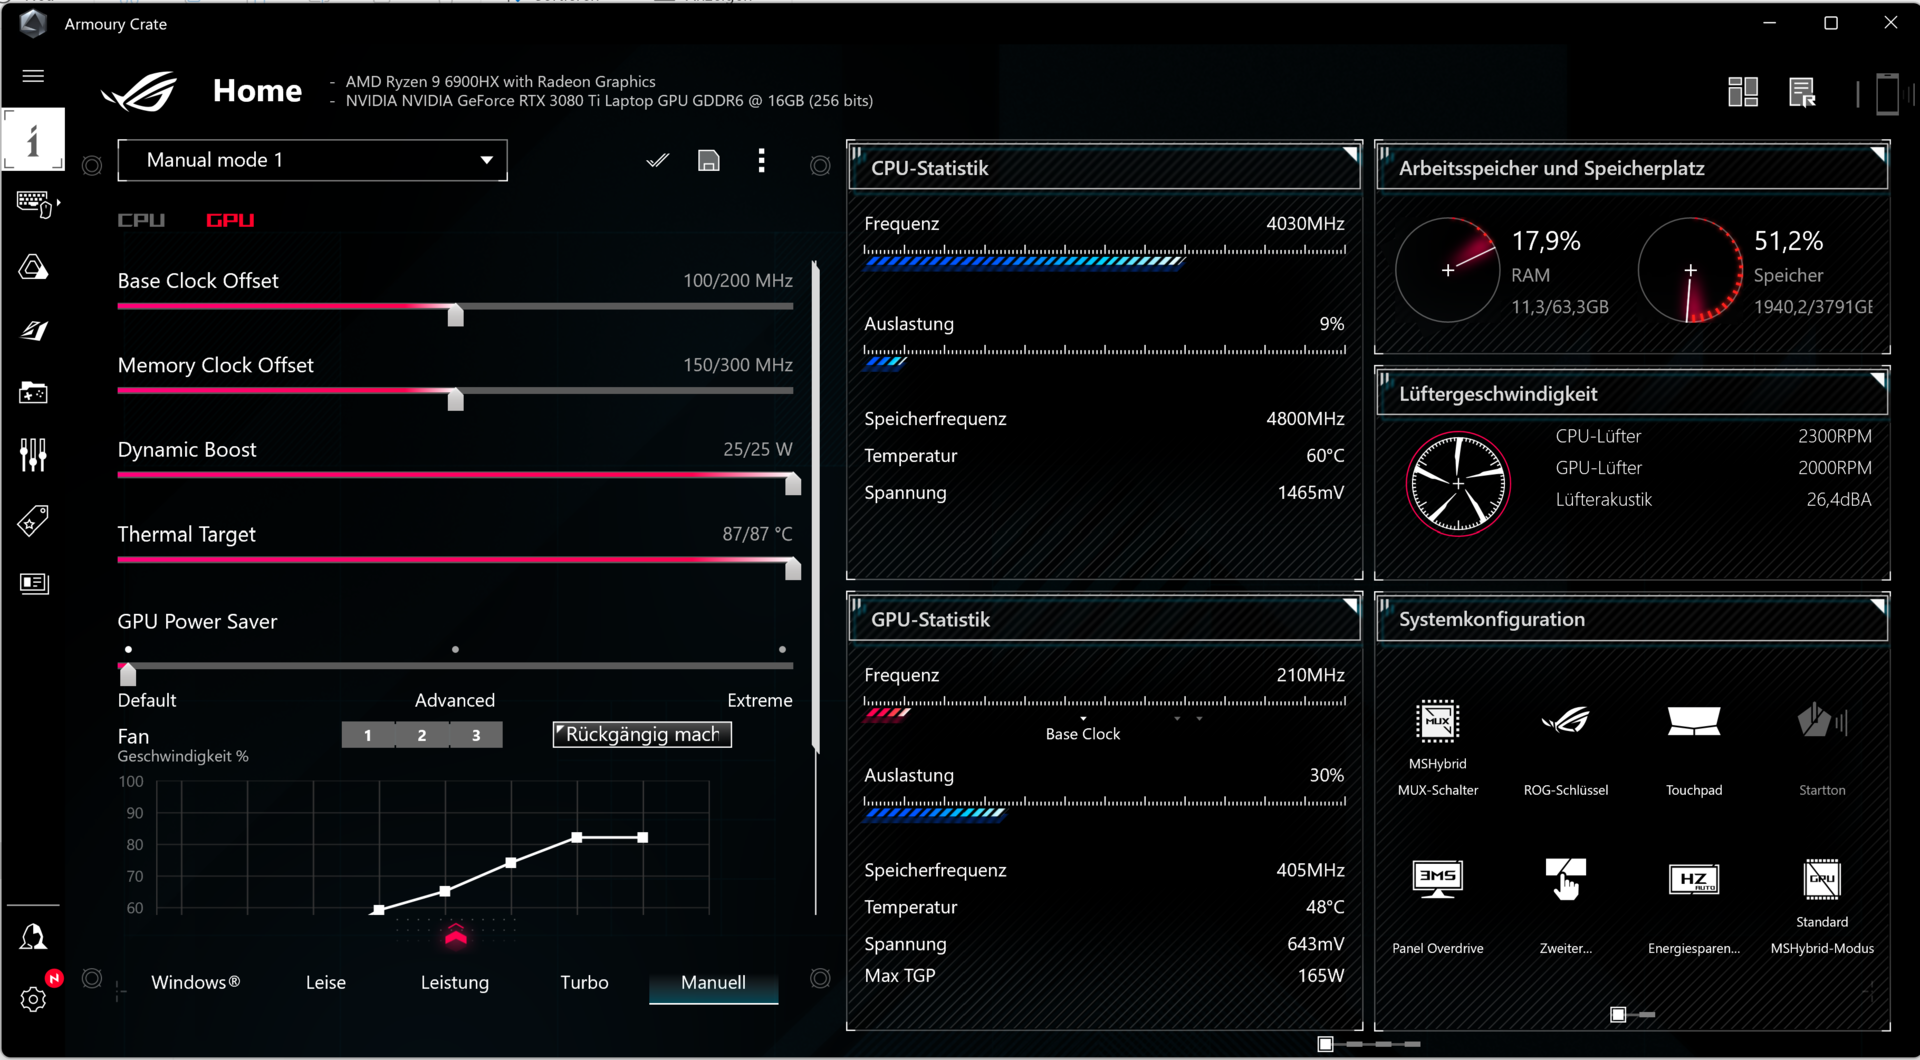
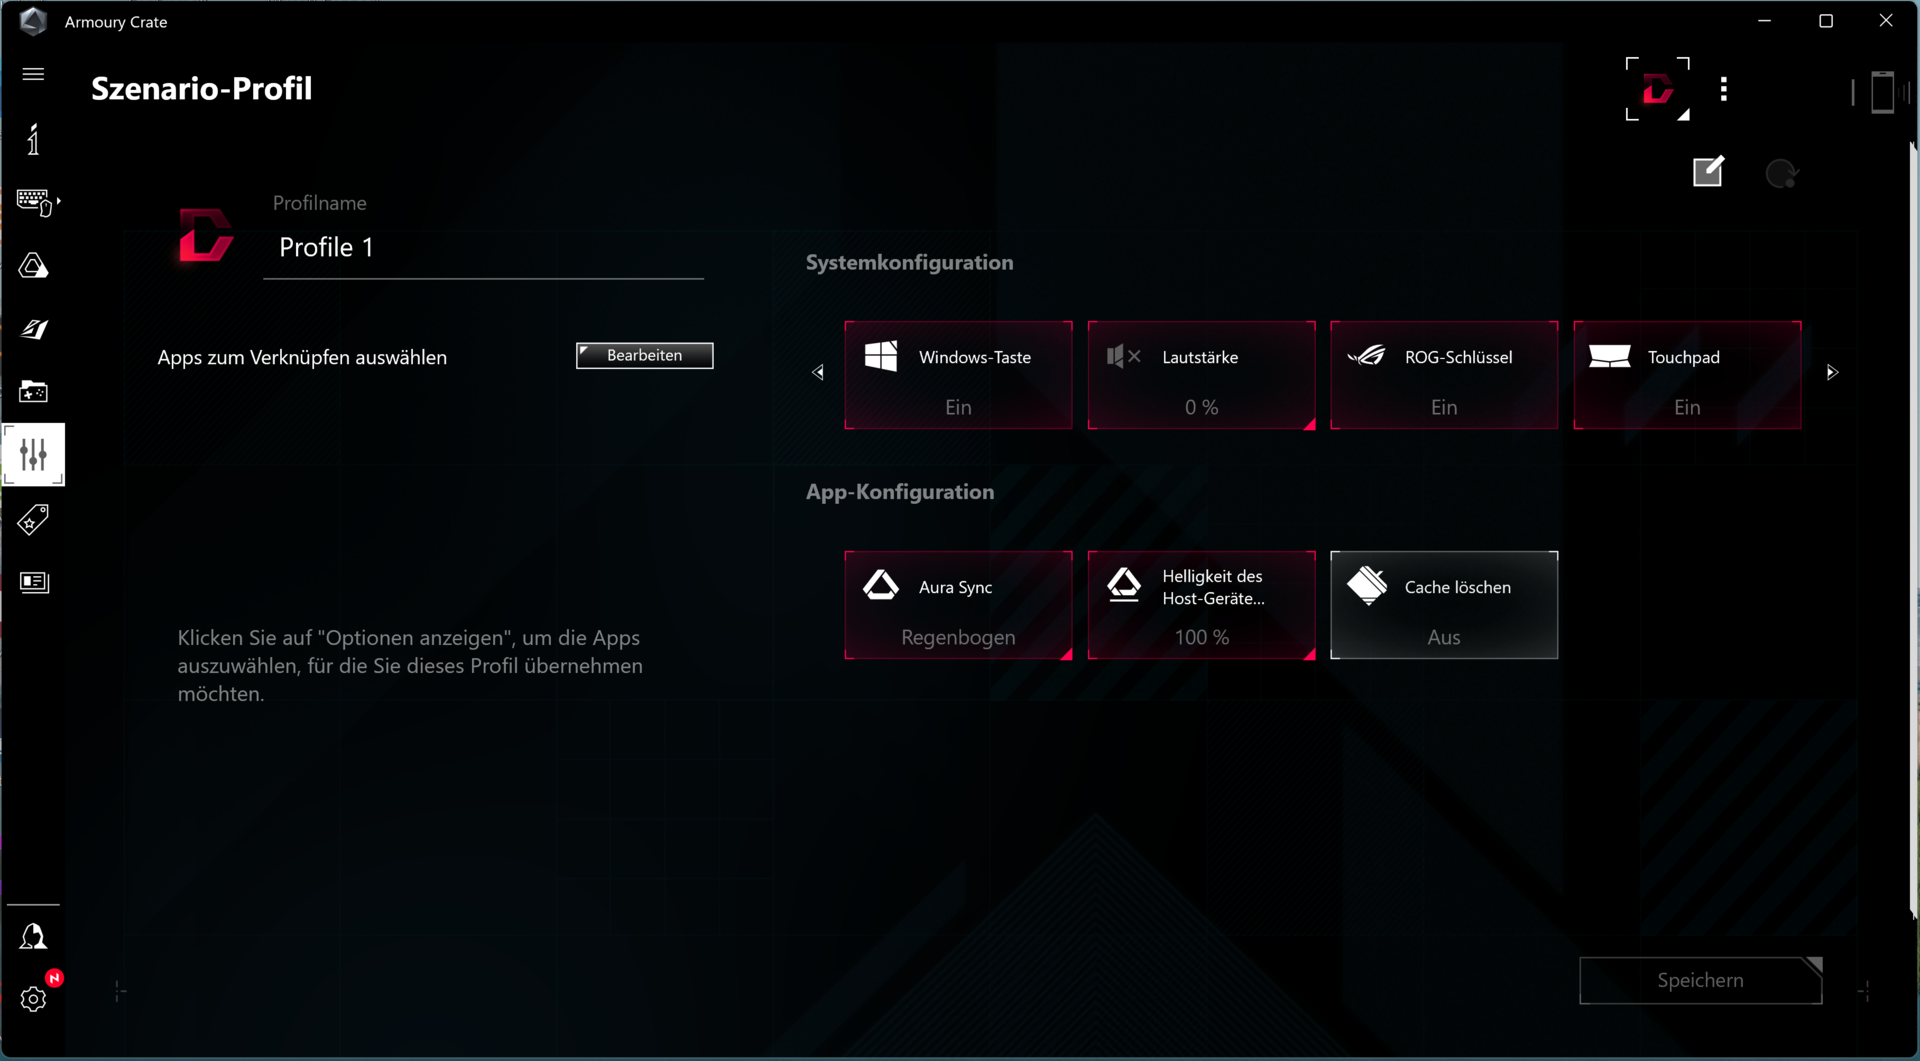
Med den förinstallerade Armoury Crate-programvaran kan du skapa individuella profiler ("Manual"). Vi konfigurerade till exempel CPU:ns effektgränser och GPU:ns dynamiska boost individuellt. Du kan också överklocka grafiklagret.
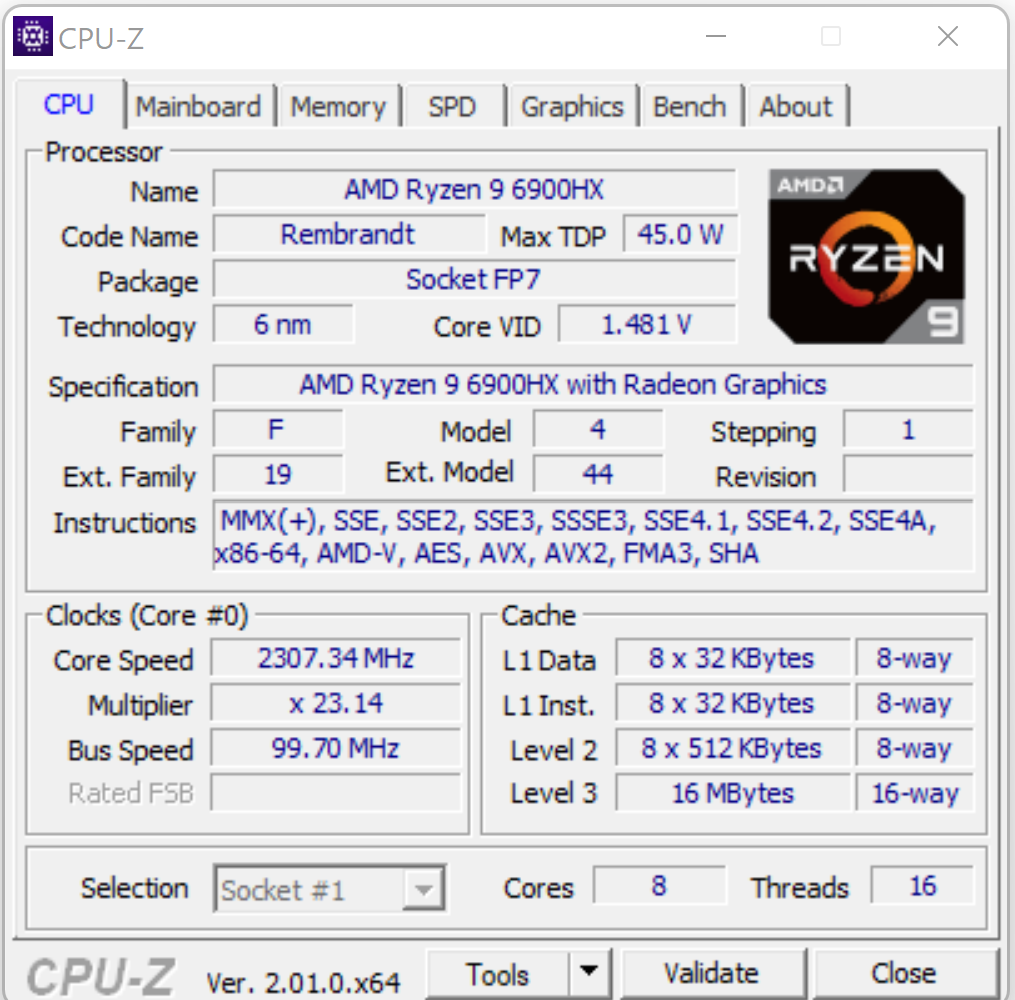
Processor
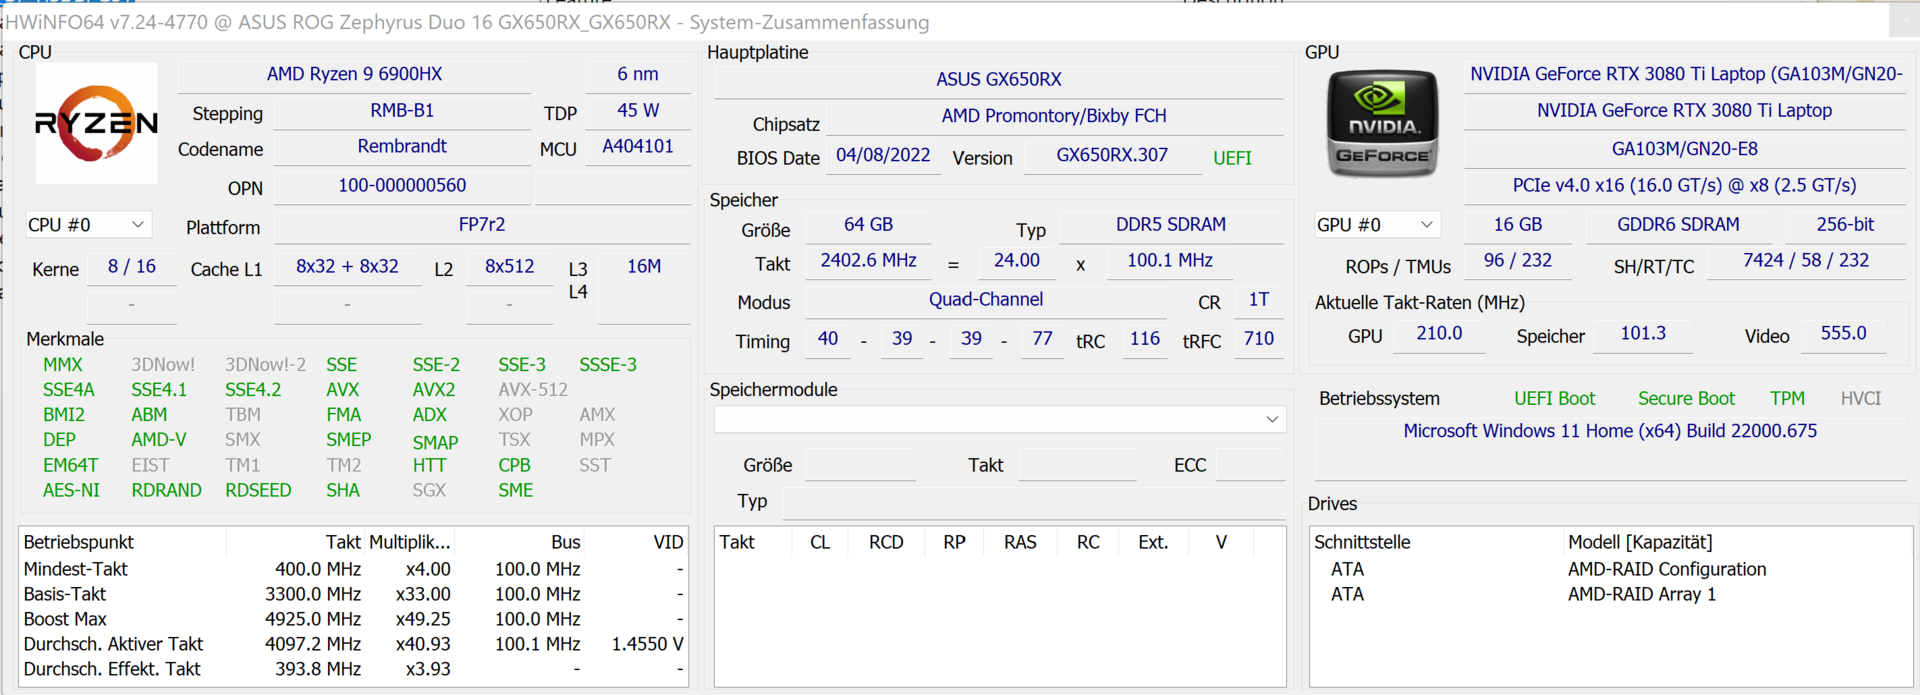
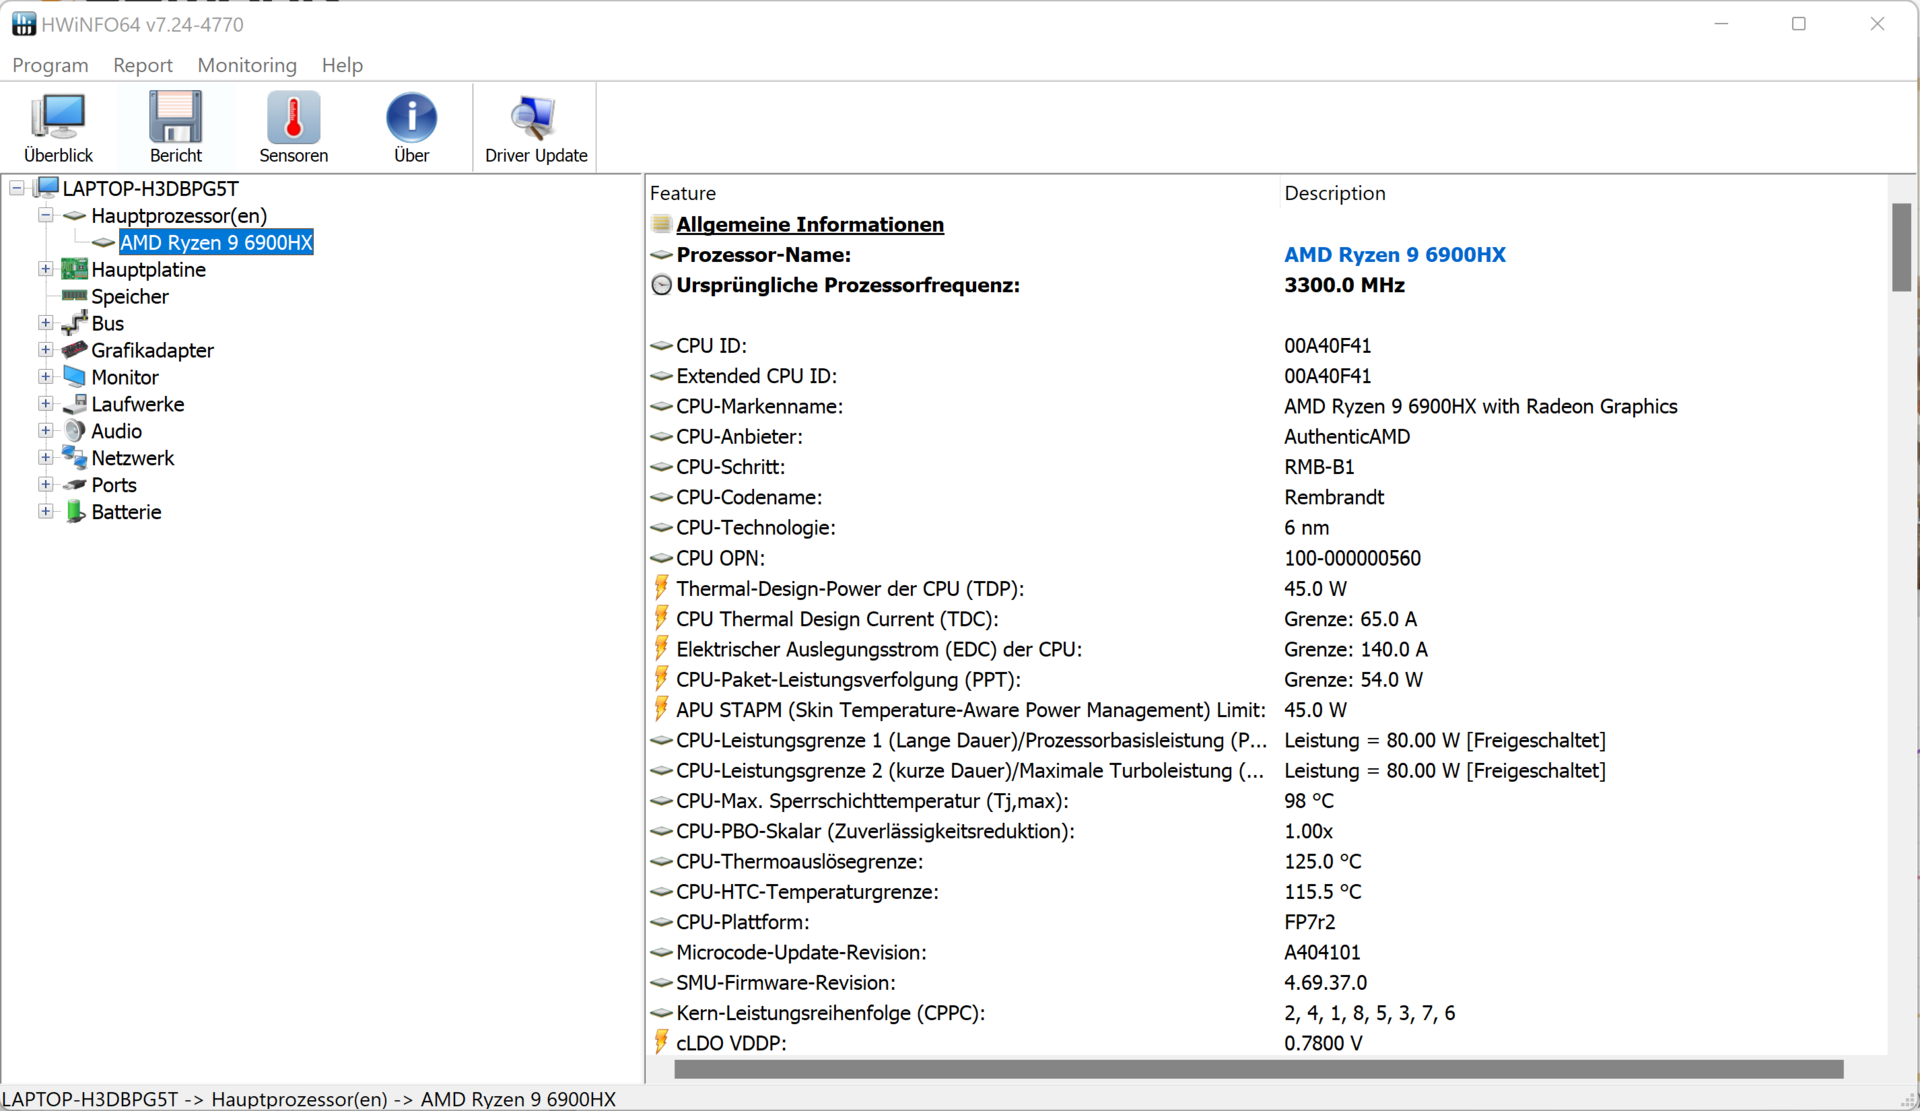
CPU-segmentet i Ryzen 9-6900HXaPU (Rembrandt) består av en octa-core-processor som körs med en grundläggande klockfrekvens på 3,3 GHz. Hastigheten kan ökas upp till 4,9 GHz via Turbo. Simultan multitrådning (två trådar per kärna) stöds.
Flertrådstestet i riktmärket Cinebench R15 körs kortfattat vid klockfrekvenser mellan 4 och 4,4 GHz och enkeltrådstestet mellan 3,1 och 4,7 GHz. Vid batteridrift körs processorn på 3 till 4,1 GHz (multitråd) och 2 till 4,7 GHz (enkeltråd).
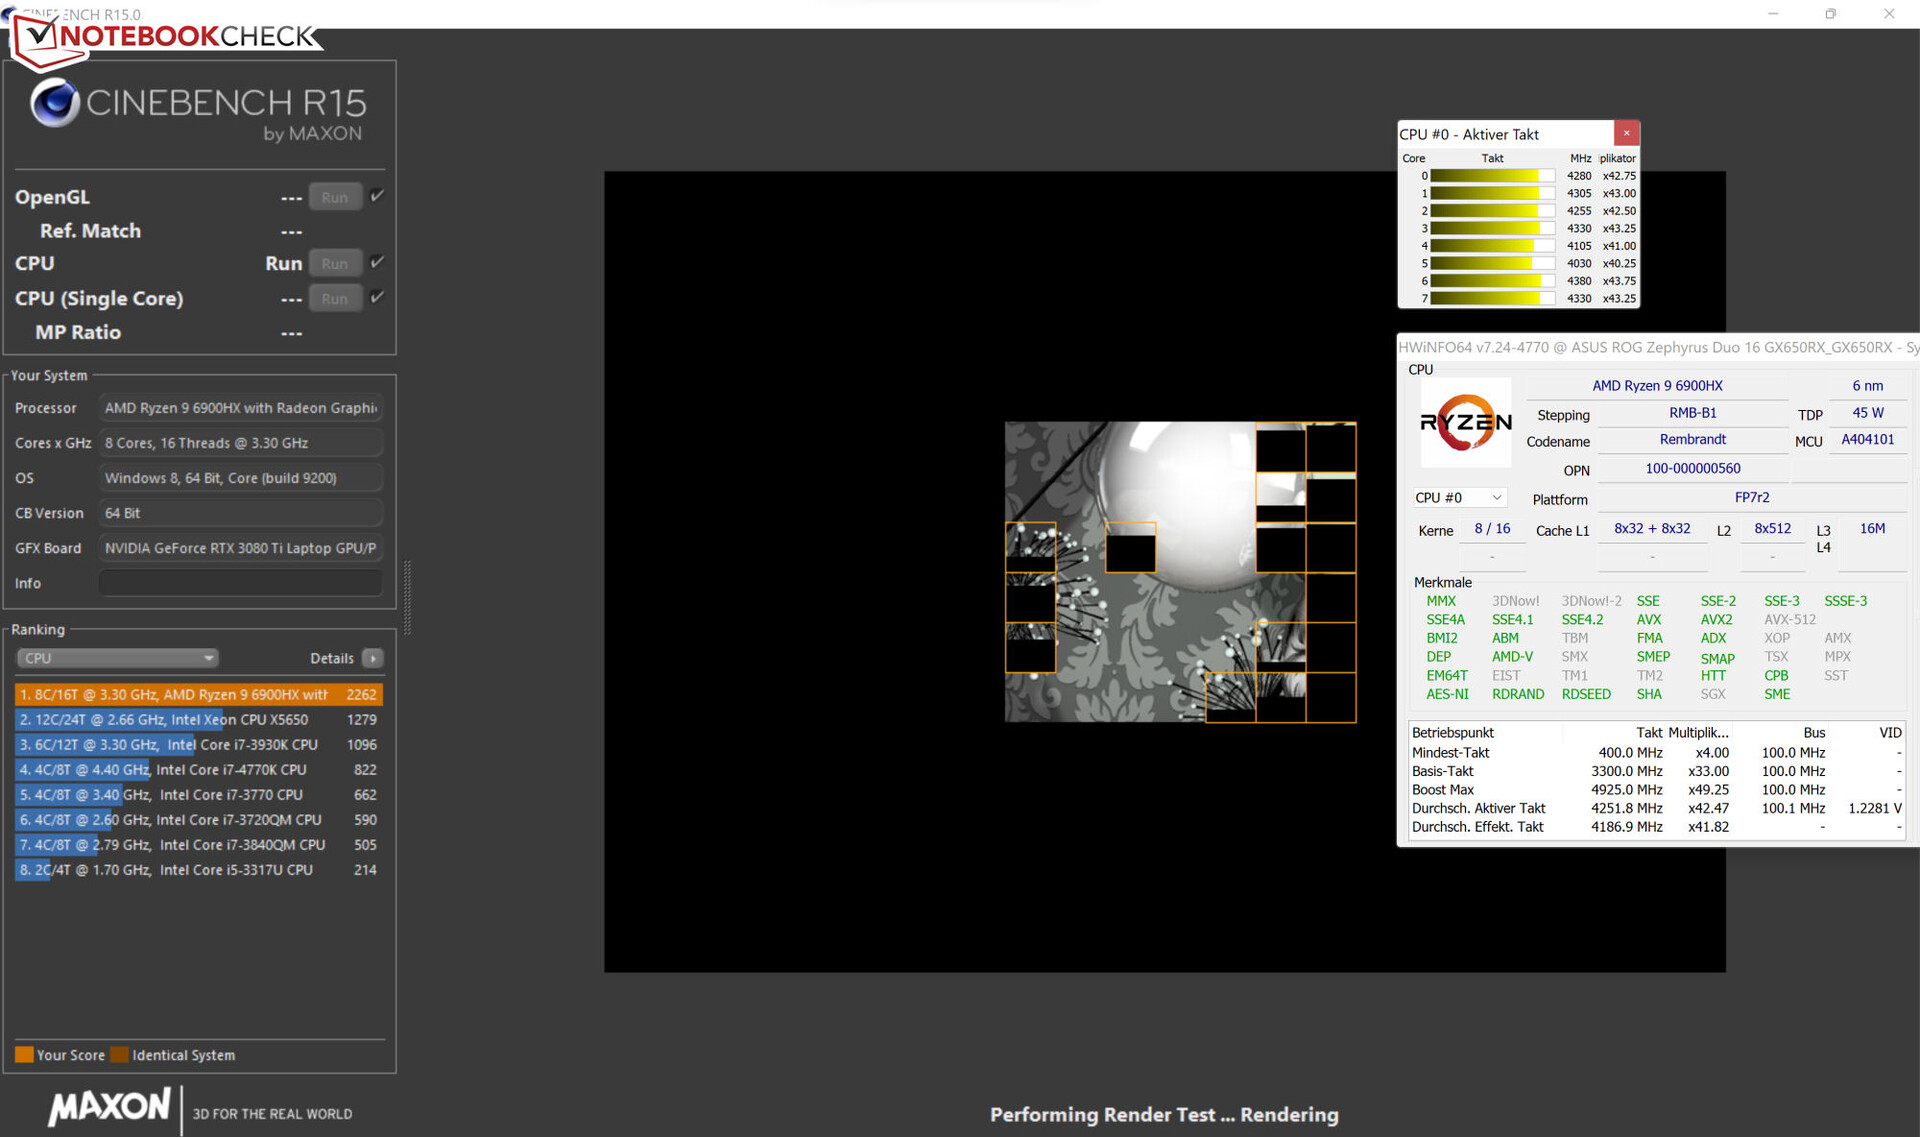

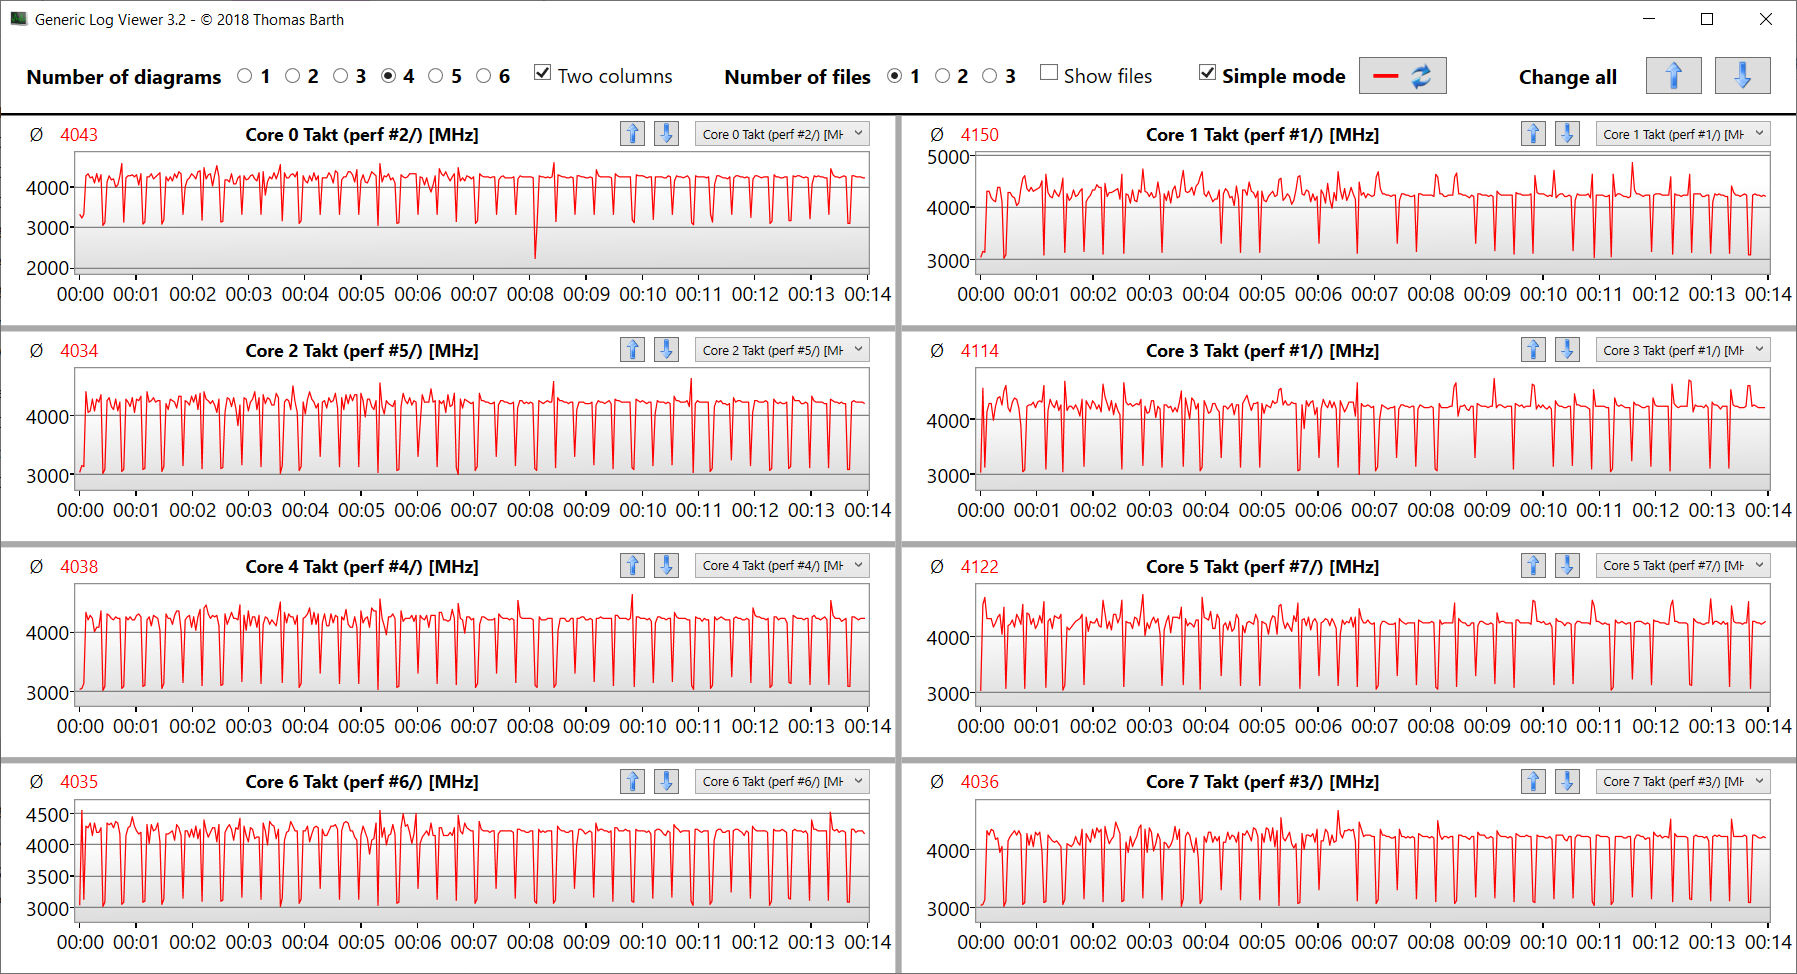
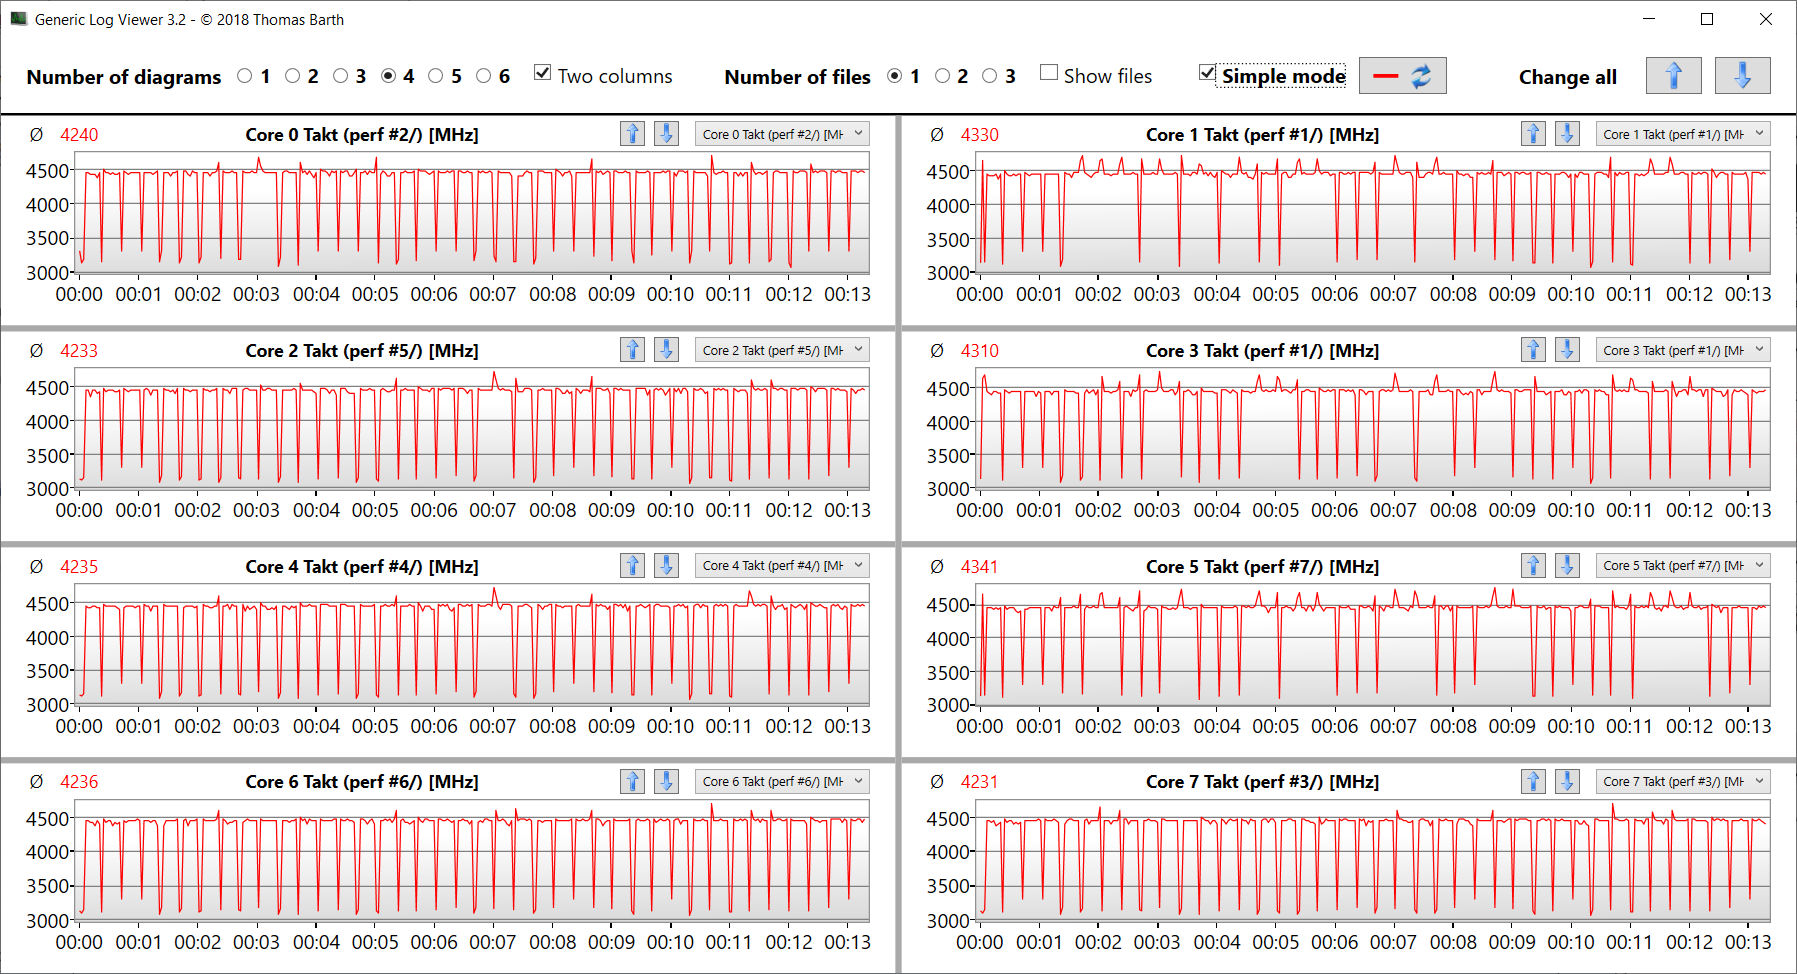
Vi utvärderar om CPU Turbo används konstant i nätdrift genom att köra multitrådstestet i Cinebench R15 benchmark i minst 30 minuter i en konstant slinga. Turbo används på en hög nivå. Genom att använda prestandaprofilen "Turbo" kan klockfrekvensen ökas ännu något högre.
Cinebench R15 Multi Constant Load Test
| CPU Performance rating - Percent | |
| Genomsnitt av klass Gaming | |
| MSI GE76 Raider | |
| Gigabyte Aero 16 YE5 | |
| Medion Erazer Beast X30 | |
| Asus ROG Zephyrus Duo 16 GX650RX | |
| Asus ROG Zephyrus Duo 16 GX650RX | |
| Asus ROG Zephyrus Duo 16 GX650RX | |
| Apple MacBook Pro 16 2021 M1 Max -5! | |
| Genomsnitt AMD Ryzen 9 6900HX | |
| Razer Blade 15 Advanced Model Early 2022 | |
| Cinebench R23 | |
| Multi Core | |
| Genomsnitt av klass Gaming (10488 - 42661, n=104, senaste 2 åren) | |
| Medion Erazer Beast X30 | |
| MSI GE76 Raider | |
| Gigabyte Aero 16 YE5 | |
| Asus ROG Zephyrus Duo 16 GX650RX (Turbo) | |
| Asus ROG Zephyrus Duo 16 GX650RX | |
| Asus ROG Zephyrus Duo 16 GX650RX (Leise) | |
| Genomsnitt AMD Ryzen 9 6900HX (9709 - 15100, n=19) | |
| Apple MacBook Pro 16 2021 M1 Max | |
| Razer Blade 15 Advanced Model Early 2022 | |
| Single Core | |
| Genomsnitt av klass Gaming (1601 - 2415, n=104, senaste 2 åren) | |
| Gigabyte Aero 16 YE5 | |
| MSI GE76 Raider | |
| Razer Blade 15 Advanced Model Early 2022 | |
| Medion Erazer Beast X30 | |
| Asus ROG Zephyrus Duo 16 GX650RX (Leise) | |
| Asus ROG Zephyrus Duo 16 GX650RX (Turbo) | |
| Asus ROG Zephyrus Duo 16 GX650RX | |
| Genomsnitt AMD Ryzen 9 6900HX (1516 - 1616, n=19) | |
| Apple MacBook Pro 16 2021 M1 Max | |
| Cinebench R20 | |
| CPU (Multi Core) | |
| Genomsnitt av klass Gaming (4029 - 16433, n=103, senaste 2 åren) | |
| Medion Erazer Beast X30 | |
| Gigabyte Aero 16 YE5 | |
| MSI GE76 Raider | |
| Asus ROG Zephyrus Duo 16 GX650RX (Turbo) | |
| Asus ROG Zephyrus Duo 16 GX650RX | |
| Asus ROG Zephyrus Duo 16 GX650RX (Leise) | |
| Genomsnitt AMD Ryzen 9 6900HX (3742 - 5813, n=19) | |
| Razer Blade 15 Advanced Model Early 2022 | |
| Apple MacBook Pro 16 2021 M1 Max | |
| CPU (Single Core) | |
| Genomsnitt av klass Gaming (622 - 913, n=103, senaste 2 åren) | |
| MSI GE76 Raider | |
| Razer Blade 15 Advanced Model Early 2022 | |
| Gigabyte Aero 16 YE5 | |
| Asus ROG Zephyrus Duo 16 GX650RX (Turbo) | |
| Asus ROG Zephyrus Duo 16 GX650RX (Leise) | |
| Genomsnitt AMD Ryzen 9 6900HX (595 - 631, n=19) | |
| Medion Erazer Beast X30 | |
| Asus ROG Zephyrus Duo 16 GX650RX | |
| Apple MacBook Pro 16 2021 M1 Max | |
| Cinebench R15 | |
| CPU Multi 64Bit | |
| Genomsnitt av klass Gaming (1578 - 6330, n=102, senaste 2 åren) | |
| MSI GE76 Raider | |
| Medion Erazer Beast X30 | |
| Gigabyte Aero 16 YE5 | |
| Asus ROG Zephyrus Duo 16 GX650RX (Turbo) | |
| Asus ROG Zephyrus Duo 16 GX650RX | |
| Asus ROG Zephyrus Duo 16 GX650RX (Leise) | |
| Genomsnitt AMD Ryzen 9 6900HX (1588 - 2411, n=19) | |
| Apple MacBook Pro 16 2021 M1 Max (Rosetta 2) | |
| Razer Blade 15 Advanced Model Early 2022 | |
| CPU Single 64Bit | |
| Genomsnitt av klass Gaming (188.8 - 350, n=103, senaste 2 åren) | |
| Gigabyte Aero 16 YE5 | |
| MSI GE76 Raider | |
| Asus ROG Zephyrus Duo 16 GX650RX (Turbo) | |
| Genomsnitt AMD Ryzen 9 6900HX (241 - 261, n=19) | |
| Asus ROG Zephyrus Duo 16 GX650RX | |
| Asus ROG Zephyrus Duo 16 GX650RX (Leise) | |
| Razer Blade 15 Advanced Model Early 2022 | |
| Medion Erazer Beast X30 | |
| Apple MacBook Pro 16 2021 M1 Max (Rosetta 2) | |
| Blender - v2.79 BMW27 CPU | |
| Razer Blade 15 Advanced Model Early 2022 | |
| Asus ROG Zephyrus Duo 16 GX650RX (Leise) | |
| Genomsnitt AMD Ryzen 9 6900HX (212 - 357, n=21) | |
| Asus ROG Zephyrus Duo 16 GX650RX | |
| Asus ROG Zephyrus Duo 16 GX650RX (Turbo) | |
| Gigabyte Aero 16 YE5 | |
| Apple MacBook Pro 16 2021 M1 Max (Blender 3.0 beta for mac) | |
| MSI GE76 Raider | |
| Medion Erazer Beast X30 | |
| Genomsnitt av klass Gaming (79 - 330, n=101, senaste 2 åren) | |
| 7-Zip 18.03 | |
| 7z b 4 | |
| Genomsnitt av klass Gaming (33491 - 148086, n=102, senaste 2 åren) | |
| Medion Erazer Beast X30 | |
| MSI GE76 Raider | |
| Gigabyte Aero 16 YE5 | |
| Asus ROG Zephyrus Duo 16 GX650RX (Turbo) | |
| Asus ROG Zephyrus Duo 16 GX650RX | |
| Asus ROG Zephyrus Duo 16 GX650RX (Leise) | |
| Genomsnitt AMD Ryzen 9 6900HX (49526 - 65336, n=20) | |
| Razer Blade 15 Advanced Model Early 2022 | |
| 7z b 4 -mmt1 | |
| Genomsnitt av klass Gaming (4824 - 7436, n=102, senaste 2 åren) | |
| Gigabyte Aero 16 YE5 | |
| MSI GE76 Raider | |
| Asus ROG Zephyrus Duo 16 GX650RX (Turbo) | |
| Razer Blade 15 Advanced Model Early 2022 | |
| Asus ROG Zephyrus Duo 16 GX650RX (Leise) | |
| Genomsnitt AMD Ryzen 9 6900HX (5090 - 6070, n=20) | |
| Asus ROG Zephyrus Duo 16 GX650RX | |
| Medion Erazer Beast X30 | |
| Geekbench 5.5 | |
| Multi-Core | |
| Genomsnitt av klass Gaming (6460 - 28263, n=102, senaste 2 åren) | |
| Gigabyte Aero 16 YE5 | |
| MSI GE76 Raider | |
| Apple MacBook Pro 16 2021 M1 Max | |
| Medion Erazer Beast X30 | |
| Asus ROG Zephyrus Duo 16 GX650RX (Turbo) | |
| Asus ROG Zephyrus Duo 16 GX650RX | |
| Asus ROG Zephyrus Duo 16 GX650RX (Leise) | |
| Genomsnitt AMD Ryzen 9 6900HX (8313 - 10490, n=21) | |
| Razer Blade 15 Advanced Model Early 2022 | |
| Single-Core | |
| Genomsnitt av klass Gaming (1403 - 2474, n=102, senaste 2 åren) | |
| MSI GE76 Raider | |
| Gigabyte Aero 16 YE5 | |
| Razer Blade 15 Advanced Model Early 2022 | |
| Apple MacBook Pro 16 2021 M1 Max | |
| Asus ROG Zephyrus Duo 16 GX650RX (Turbo) | |
| Medion Erazer Beast X30 | |
| Asus ROG Zephyrus Duo 16 GX650RX | |
| Genomsnitt AMD Ryzen 9 6900HX (1523 - 1652, n=21) | |
| Asus ROG Zephyrus Duo 16 GX650RX (Leise) | |
| HWBOT x265 Benchmark v2.2 - 4k Preset | |
| Genomsnitt av klass Gaming (11.5 - 44.4, n=102, senaste 2 åren) | |
| Medion Erazer Beast X30 | |
| MSI GE76 Raider | |
| Asus ROG Zephyrus Duo 16 GX650RX (Turbo) | |
| Gigabyte Aero 16 YE5 | |
| Asus ROG Zephyrus Duo 16 GX650RX | |
| Asus ROG Zephyrus Duo 16 GX650RX (Leise) | |
| Genomsnitt AMD Ryzen 9 6900HX (12.6 - 18.7, n=20) | |
| Razer Blade 15 Advanced Model Early 2022 | |
| LibreOffice - 20 Documents To PDF | |
| Genomsnitt AMD Ryzen 9 6900HX (44.8 - 81.7, n=20) | |
| Genomsnitt av klass Gaming (33.2 - 88.8, n=102, senaste 2 åren) | |
| Medion Erazer Beast X30 | |
| Asus ROG Zephyrus Duo 16 GX650RX (Leise) | |
| Asus ROG Zephyrus Duo 16 GX650RX | |
| Asus ROG Zephyrus Duo 16 GX650RX (Turbo) | |
| Razer Blade 15 Advanced Model Early 2022 | |
| Gigabyte Aero 16 YE5 | |
| MSI GE76 Raider | |
| R Benchmark 2.5 - Overall mean | |
| Medion Erazer Beast X30 | |
| Genomsnitt AMD Ryzen 9 6900HX (0.4627 - 0.4974, n=20) | |
| Asus ROG Zephyrus Duo 16 GX650RX (Leise) | |
| Asus ROG Zephyrus Duo 16 GX650RX | |
| Asus ROG Zephyrus Duo 16 GX650RX (Turbo) | |
| Razer Blade 15 Advanced Model Early 2022 | |
| MSI GE76 Raider | |
| Genomsnitt av klass Gaming (0.3439 - 0.59, n=102, senaste 2 åren) | |
| Gigabyte Aero 16 YE5 | |
* ... mindre är bättre
| Performance rating - Percent | |
| Genomsnitt av klass Gaming | |
| Asus ROG Zephyrus Duo 16 GX650RX | |
| Asus ROG Zephyrus Duo 16 GX650RX | |
| Asus ROG Zephyrus Duo 16 GX650RX | |
| Genomsnitt AMD Ryzen 9 6900HX | |
| MSI GE76 Raider | |
| Medion Erazer Beast X30 | |
| Gigabyte Aero 16 YE5 | |
| Razer Blade 15 Advanced Model Early 2022 | |
Systemets prestanda
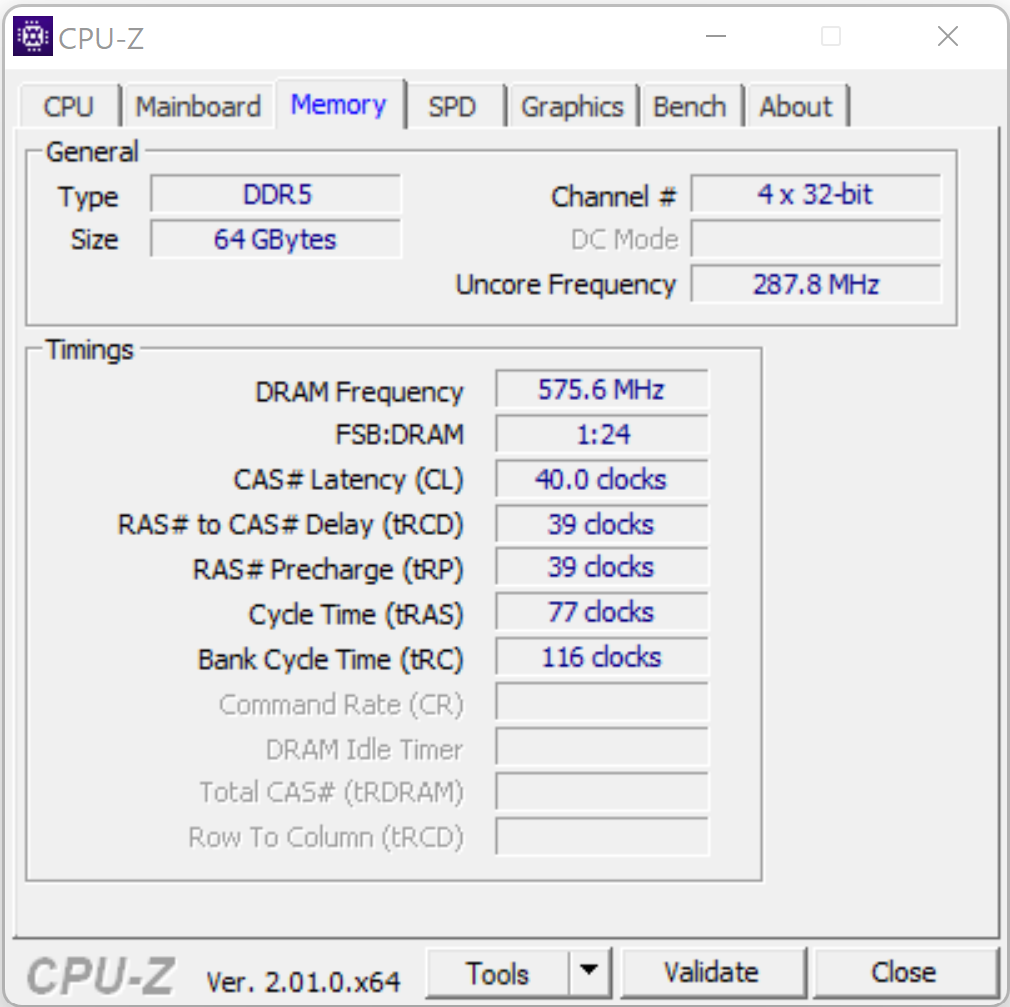
Det smidigt fungerande systemet har tillräcklig prestanda för spel, videoredigering och rendering under de närmaste åren. Överföringshastigheterna för det inbyggda arbetsminnet ligger under värdena för jämförbara bärbara datorer som är utrustade med DDR5-4800-lagring. Detta åtföljs av mycket goda PC-Mark-resultat.

| PCMark 8 Home Score Accelerated v2 | 4418 poäng | |
| PCMark 8 Creative Score Accelerated v2 | 5798 poäng | |
| PCMark 8 Work Score Accelerated v2 | 4622 poäng | |
| PCMark 10 Score | 6351 poäng | |
Hjälp | ||
CrossMark: Overall | Productivity | Creativity | Responsiveness
| PCMark 10 / Score | |
| Genomsnitt av klass Gaming (5828 - 12414, n=93, senaste 2 åren) | |
| MSI GE76 Raider | |
| Gigabyte Aero 16 YE5 | |
| Razer Blade 15 Advanced Model Early 2022 | |
| Medion Erazer Beast X30 | |
| Asus ROG Zephyrus Duo 16 GX650RX | |
| PCMark 10 / Essentials | |
| Gigabyte Aero 16 YE5 | |
| MSI GE76 Raider | |
| Genomsnitt av klass Gaming (8810 - 11935, n=97, senaste 2 åren) | |
| Razer Blade 15 Advanced Model Early 2022 | |
| Medion Erazer Beast X30 | |
| Asus ROG Zephyrus Duo 16 GX650RX | |
| PCMark 10 / Productivity | |
| Genomsnitt av klass Gaming (6845 - 25323, n=95, senaste 2 åren) | |
| MSI GE76 Raider | |
| Gigabyte Aero 16 YE5 | |
| Razer Blade 15 Advanced Model Early 2022 | |
| Medion Erazer Beast X30 | |
| Asus ROG Zephyrus Duo 16 GX650RX | |
| PCMark 10 / Digital Content Creation | |
| Genomsnitt av klass Gaming (7602 - 19954, n=95, senaste 2 åren) | |
| MSI GE76 Raider | |
| Gigabyte Aero 16 YE5 | |
| Medion Erazer Beast X30 | |
| Razer Blade 15 Advanced Model Early 2022 | |
| Asus ROG Zephyrus Duo 16 GX650RX | |
| CrossMark / Overall | |
| Gigabyte Aero 16 YE5 | |
| Genomsnitt av klass Gaming (1366 - 2409, n=94, senaste 2 åren) | |
| Razer Blade 15 Advanced Model Early 2022 | |
| Medion Erazer Beast X30 | |
| Asus ROG Zephyrus Duo 16 GX650RX | |
| Apple MacBook Pro 16 2021 M1 Max | |
| CrossMark / Productivity | |
| Gigabyte Aero 16 YE5 | |
| Genomsnitt av klass Gaming (1386 - 2254, n=94, senaste 2 åren) | |
| Razer Blade 15 Advanced Model Early 2022 | |
| Asus ROG Zephyrus Duo 16 GX650RX | |
| Medion Erazer Beast X30 | |
| Apple MacBook Pro 16 2021 M1 Max | |
| CrossMark / Creativity | |
| Genomsnitt av klass Gaming (1343 - 2786, n=94, senaste 2 åren) | |
| Gigabyte Aero 16 YE5 | |
| Apple MacBook Pro 16 2021 M1 Max | |
| Medion Erazer Beast X30 | |
| Razer Blade 15 Advanced Model Early 2022 | |
| Asus ROG Zephyrus Duo 16 GX650RX | |
| CrossMark / Responsiveness | |
| Gigabyte Aero 16 YE5 | |
| Asus ROG Zephyrus Duo 16 GX650RX | |
| Genomsnitt av klass Gaming (1226 - 2334, n=94, senaste 2 åren) | |
| Razer Blade 15 Advanced Model Early 2022 | |
| Medion Erazer Beast X30 | |
| Apple MacBook Pro 16 2021 M1 Max | |
| AIDA64 / Memory Copy | |
| Genomsnitt av klass Gaming (21750 - 129946, n=102, senaste 2 åren) | |
| MSI GE76 Raider (v6.50.5800) | |
| Gigabyte Aero 16 YE5 (v6.50.5800) | |
| Razer Blade 15 Advanced Model Early 2022 (v6.50.5800) | |
| Medion Erazer Beast X30 (v6.50.5800) | |
| Asus ROG Zephyrus Duo 16 GX650RX | |
| Genomsnitt AMD Ryzen 9 6900HX (47938 - 53345, n=20) | |
| AIDA64 / Memory Read | |
| Genomsnitt av klass Gaming (22956 - 118858, n=102, senaste 2 åren) | |
| Medion Erazer Beast X30 (v6.50.5800) | |
| Gigabyte Aero 16 YE5 (v6.50.5800) | |
| MSI GE76 Raider (v6.50.5800) | |
| Razer Blade 15 Advanced Model Early 2022 (v6.50.5800) | |
| Asus ROG Zephyrus Duo 16 GX650RX (v6.50.5800) | |
| Genomsnitt AMD Ryzen 9 6900HX (43892 - 53321, n=20) | |
| AIDA64 / Memory Write | |
| Genomsnitt av klass Gaming (22297 - 135096, n=102, senaste 2 åren) | |
| Razer Blade 15 Advanced Model Early 2022 (v6.50.5800) | |
| Medion Erazer Beast X30 (v6.50.5800) | |
| MSI GE76 Raider (v6.50.5800) | |
| Gigabyte Aero 16 YE5 (v6.50.5800) | |
| Asus ROG Zephyrus Duo 16 GX650RX (v6.50.5800) | |
| Genomsnitt AMD Ryzen 9 6900HX (51085 - 57202, n=20) | |
| AIDA64 / Memory Latency | |
| Genomsnitt av klass Gaming (75.3 - 165.4, n=102, senaste 2 åren) | |
| Razer Blade 15 Advanced Model Early 2022 (v6.50.5800) | |
| MSI GE76 Raider (v6.50.5800) | |
| Asus ROG Zephyrus Duo 16 GX650RX (v6.50.5800) | |
| Gigabyte Aero 16 YE5 (v6.50.5800) | |
| Genomsnitt AMD Ryzen 9 6900HX (80.7 - 120.6, n=20) | |
| Medion Erazer Beast X30 (v6.50.5800) | |
* ... mindre är bättre
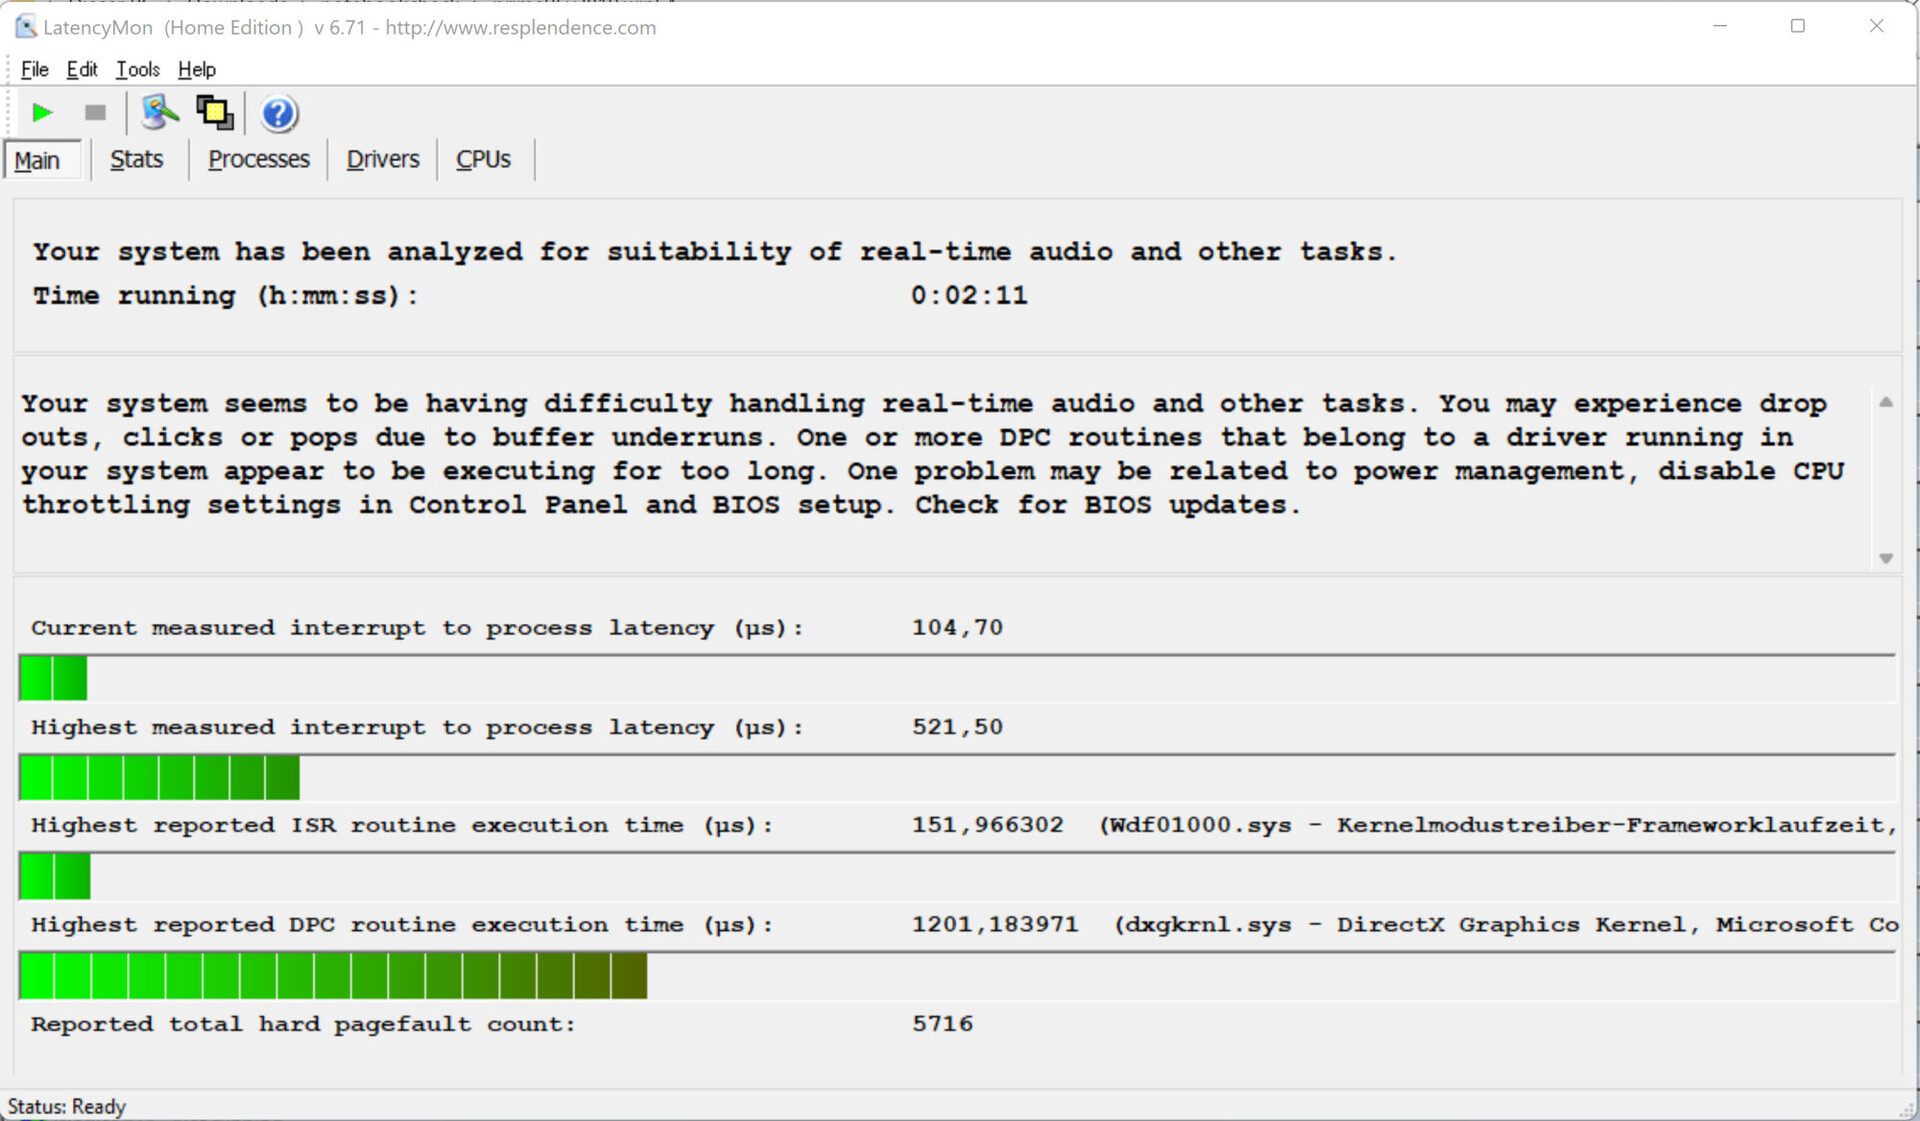
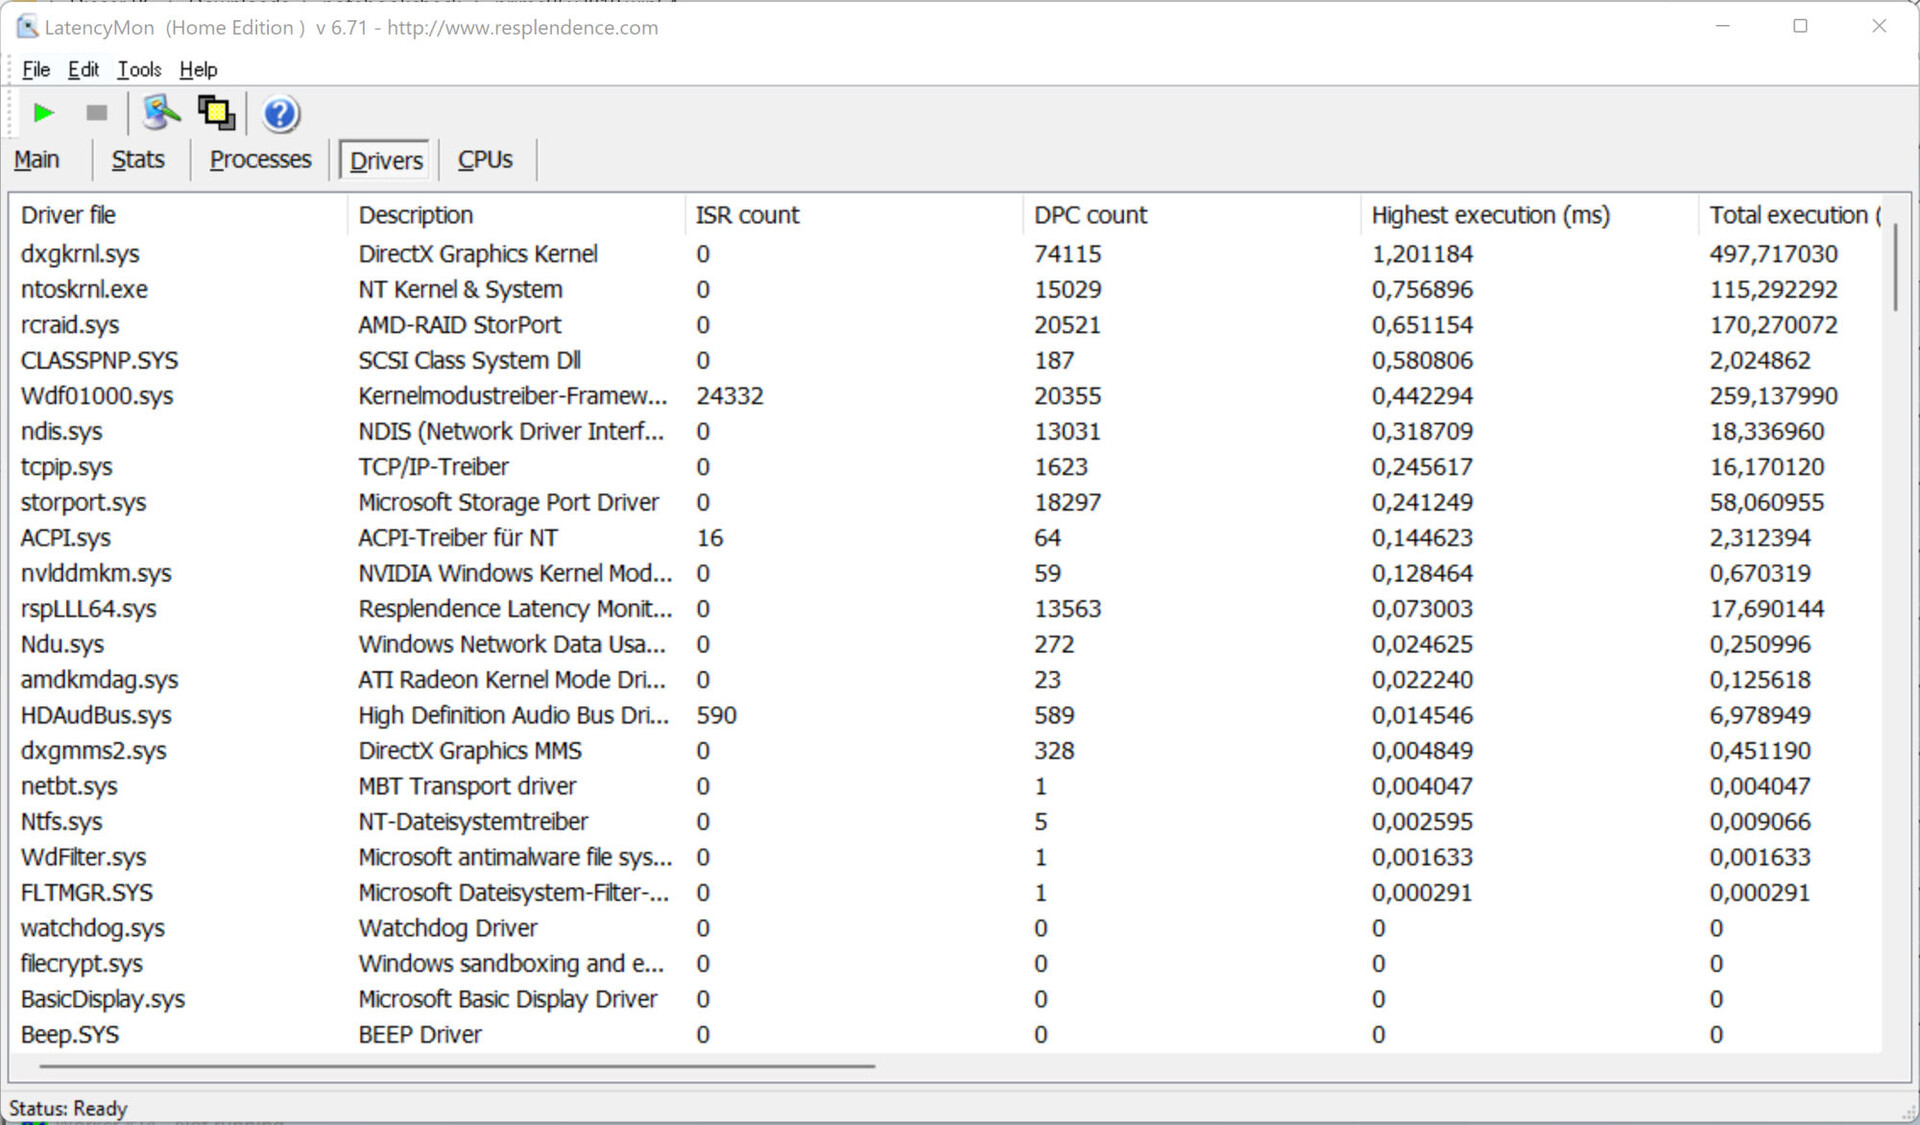
DPC-latenstider
Det standardiserade Latency Monitor-testet (webbsurfning, 4k-videoåtergivning, Prime95 hög belastning) avslöjade några tydliga fördröjningar i DPC-latenserna. Systemet verkar inte vara lämpat för video- och ljudbearbetning i realtid. Framtida mjukvaruuppdateringar kan dock leda till vissa förbättringar eller till och med göra saker och ting sämre.
| DPC Latencies / LatencyMon - interrupt to process latency (max), Web, Youtube, Prime95 | |
| Razer Blade 15 Advanced Model Early 2022 | |
| MSI GE76 Raider | |
| Medion Erazer Beast X30 | |
| Gigabyte Aero 16 YE5 | |
| Asus ROG Zephyrus Duo 16 GX650RX | |
* ... mindre är bättre
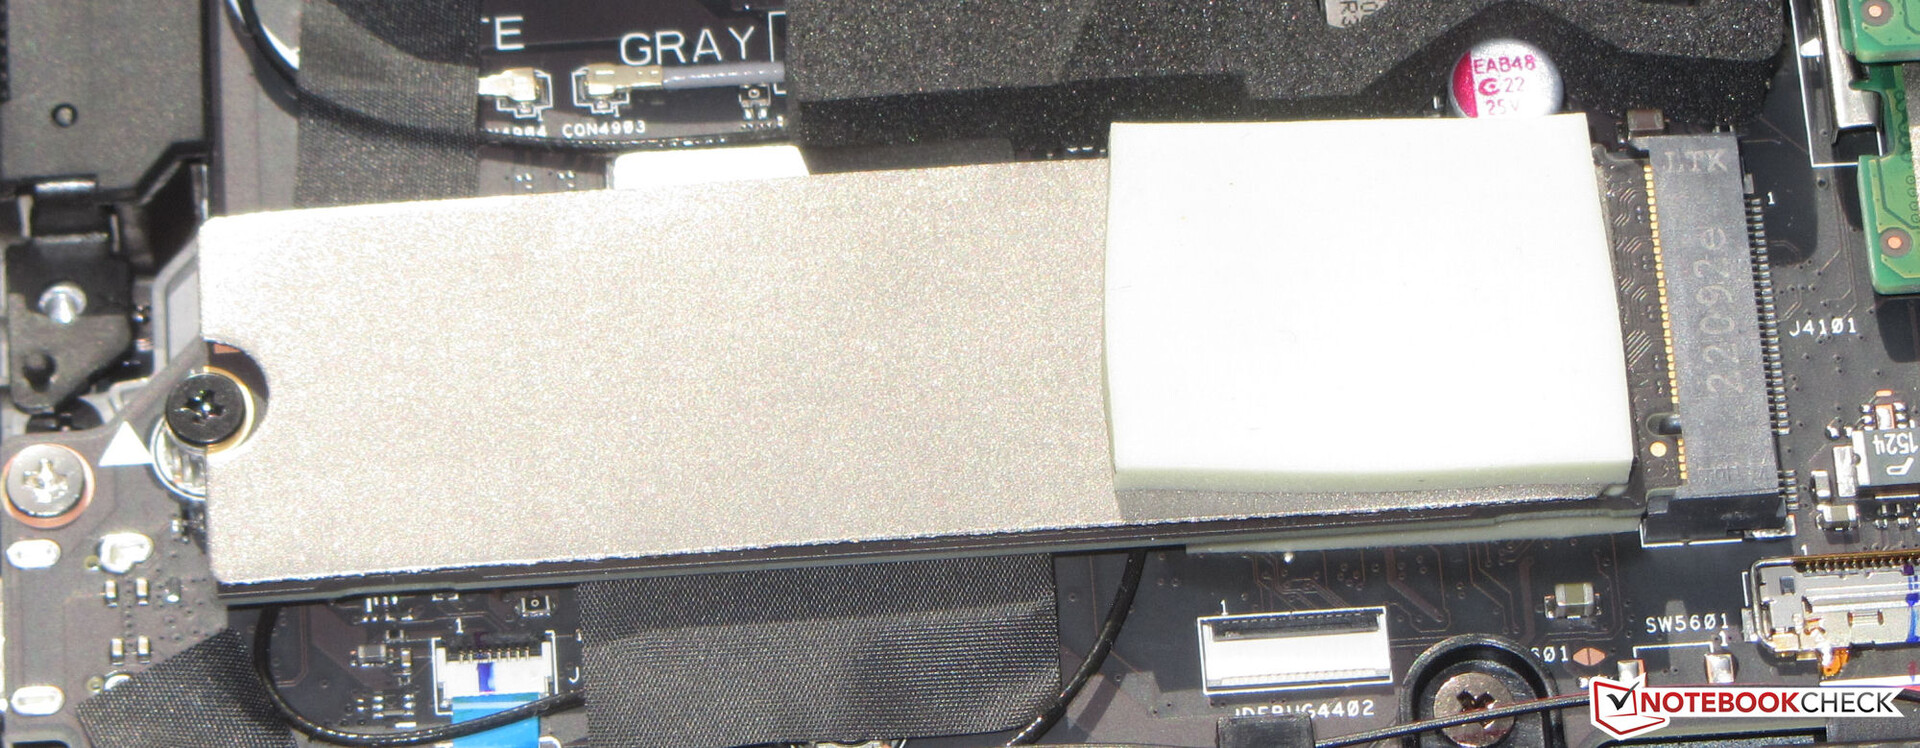
Lösning för lagring
Två PCIe 4 SSD-enheter (M.2-2280) med en lagringskapacitet på 2 TB kombineras i en RAID 0-array, så att operativsystemet ser de två SSD-enheterna som en enda SSD-enhet på 4 TB. Alla data som ska lagras fördelas på båda SSD-enheterna. De höga överföringshastigheterna och korta laddningstiderna som blir resultatet är optimala för spel.


| Drive Performance rating - Percent | |
| Gigabyte Aero 16 YE5 | |
| Asus ROG Zephyrus Duo 16 GX650RX | |
| MSI GE76 Raider | |
| Razer Blade 15 Advanced Model Early 2022 | |
| Medion Erazer Beast X30 | |
| Genomsnitt av klass Gaming | |
* ... mindre är bättre
Constant Performance Reading: DiskSpd Read Loop, Queue Depth 8
Grafikkort
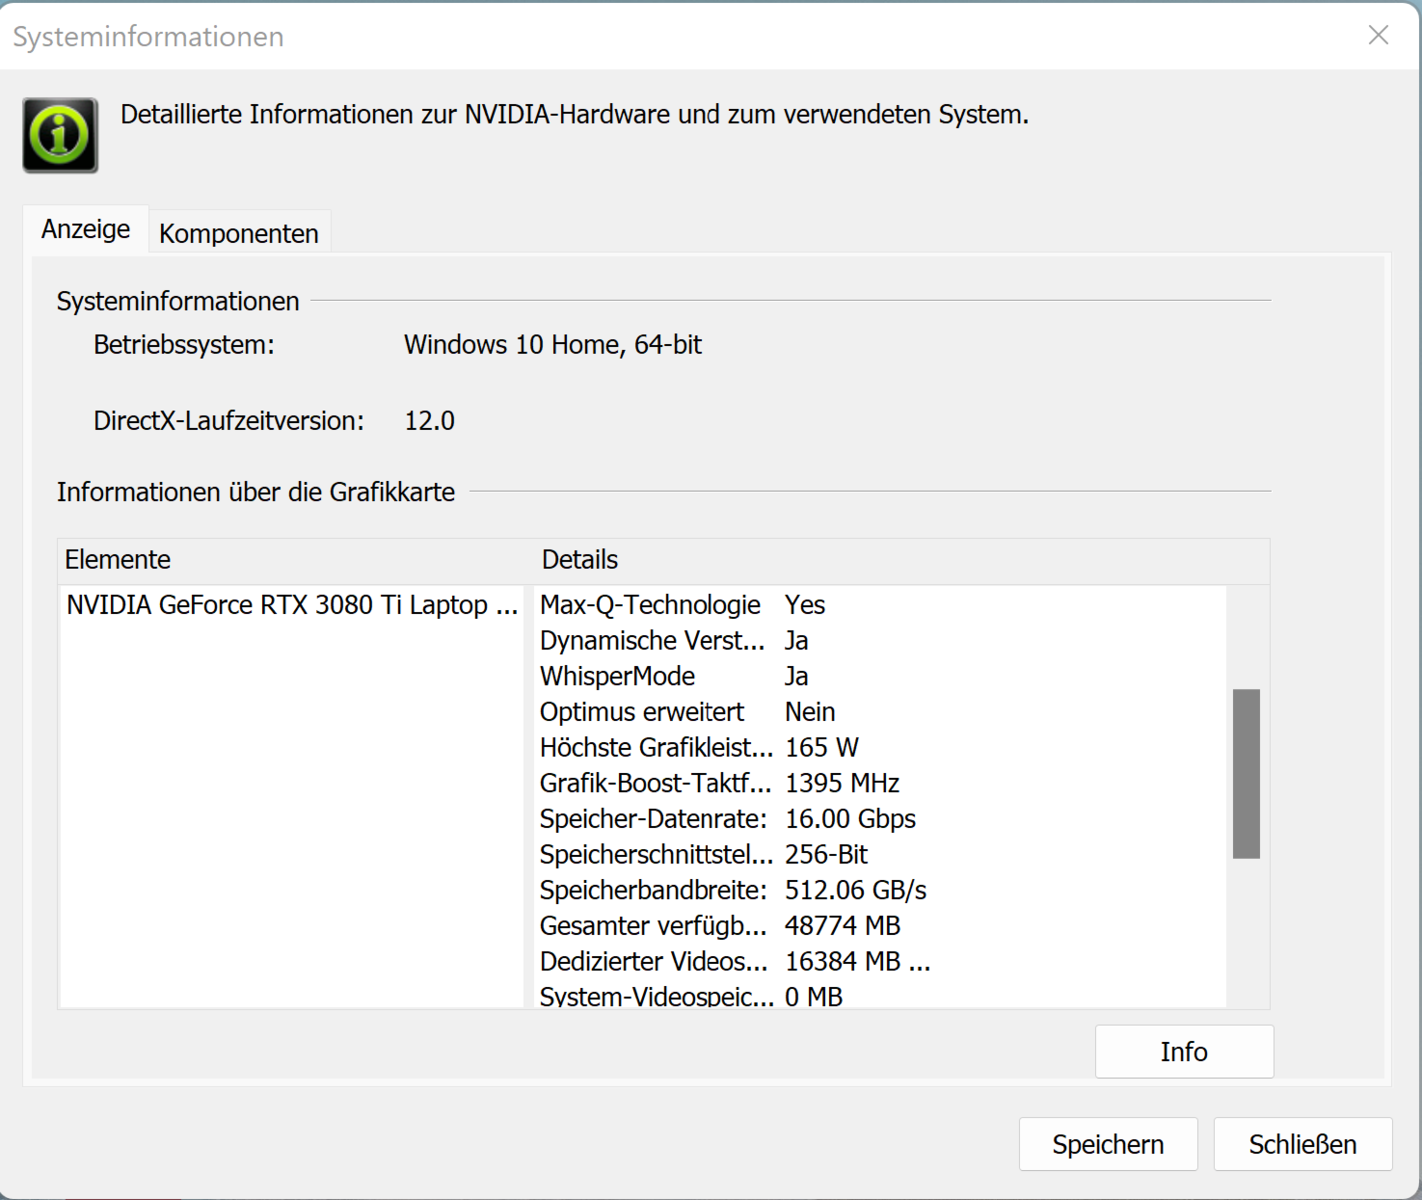
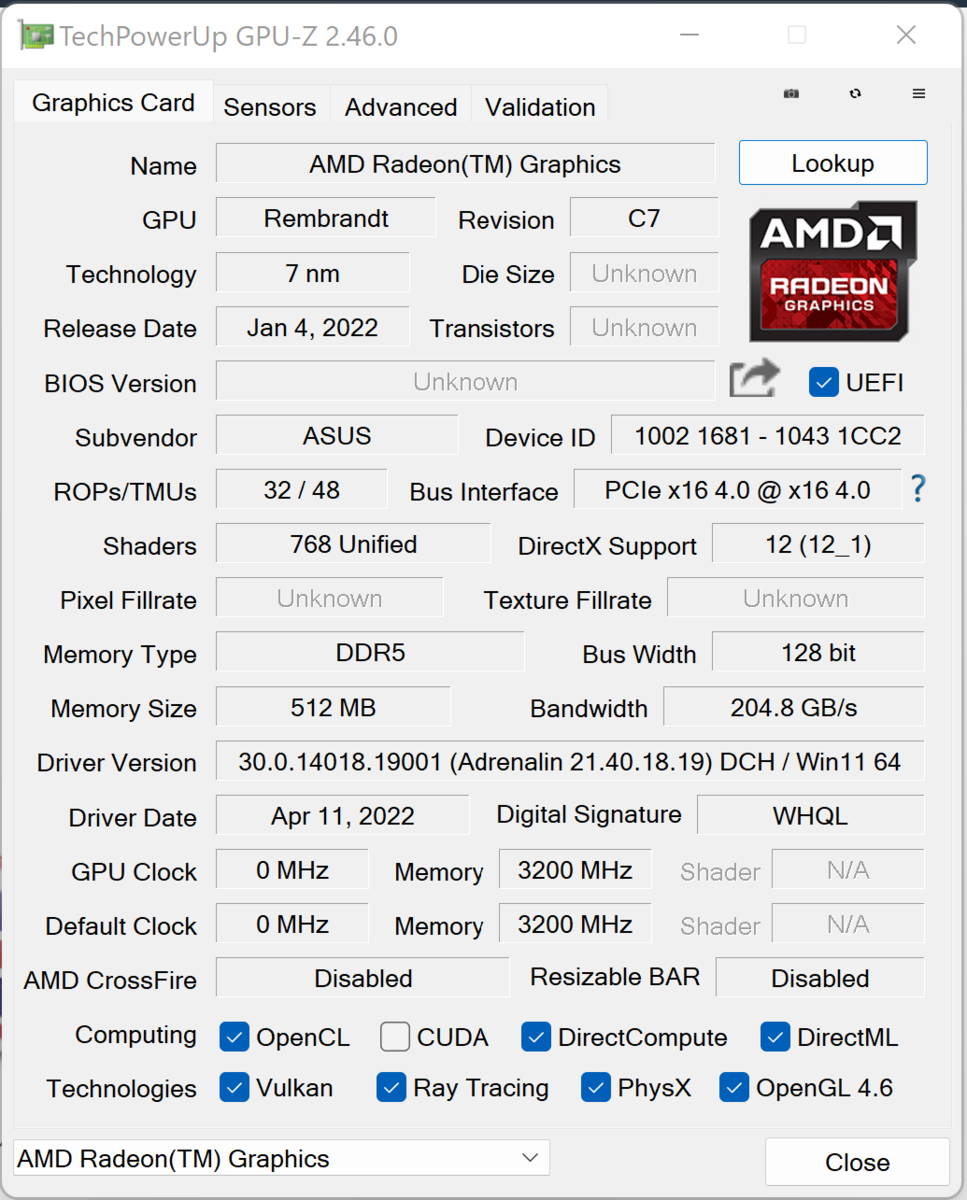
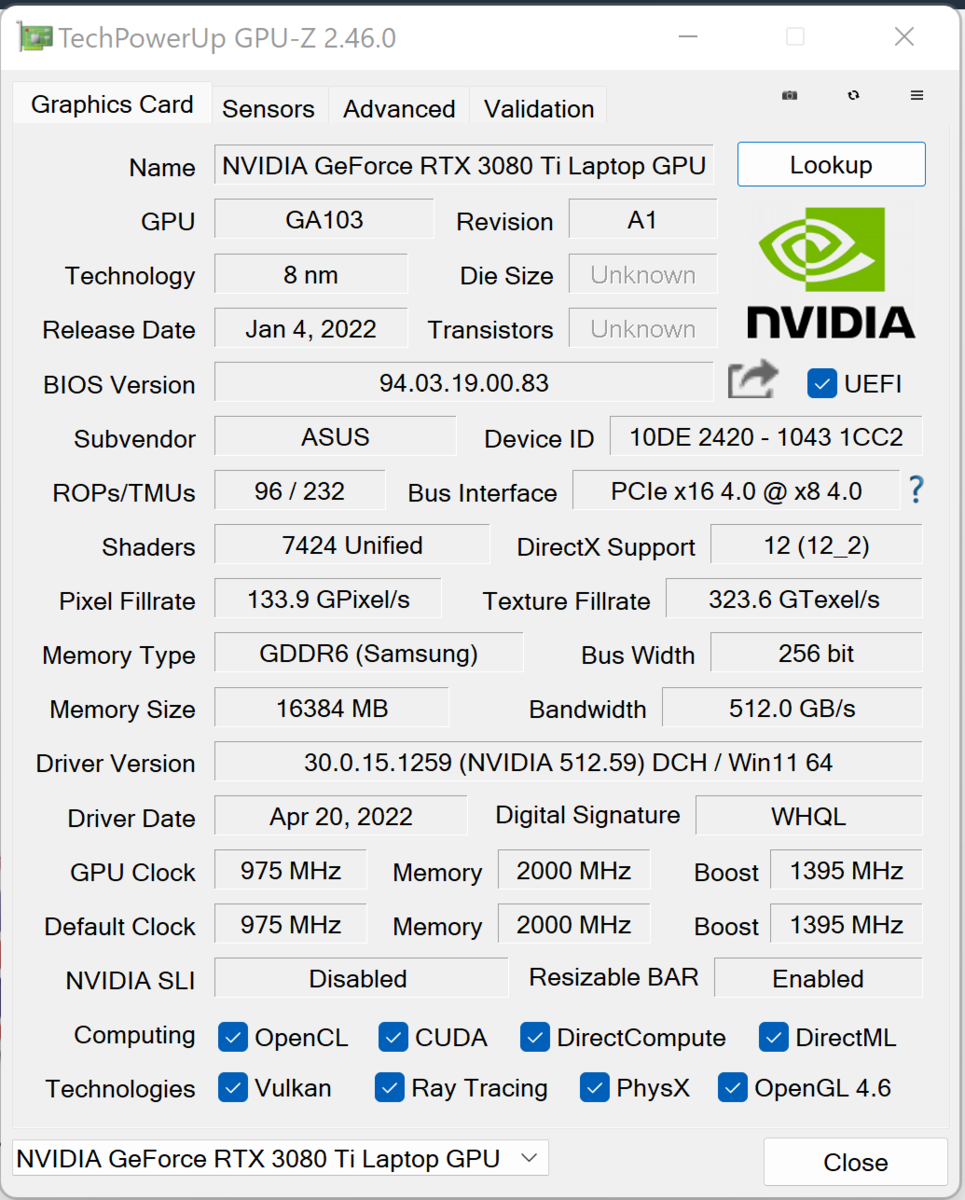
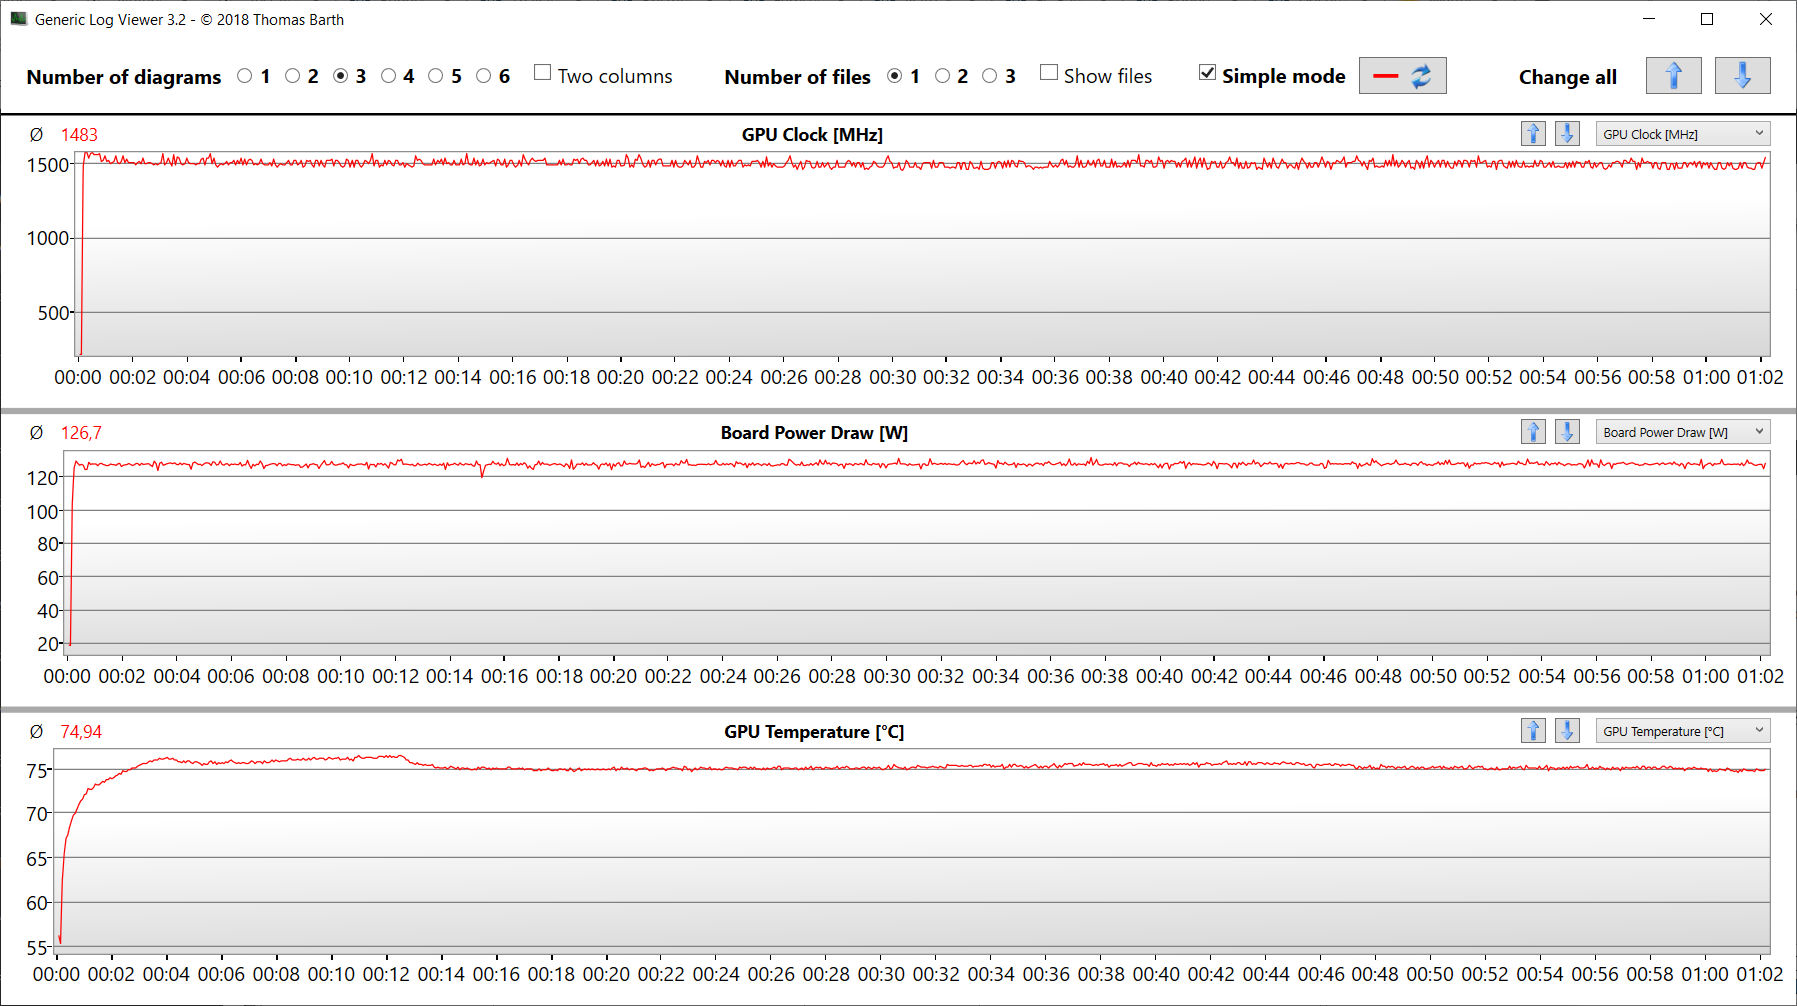
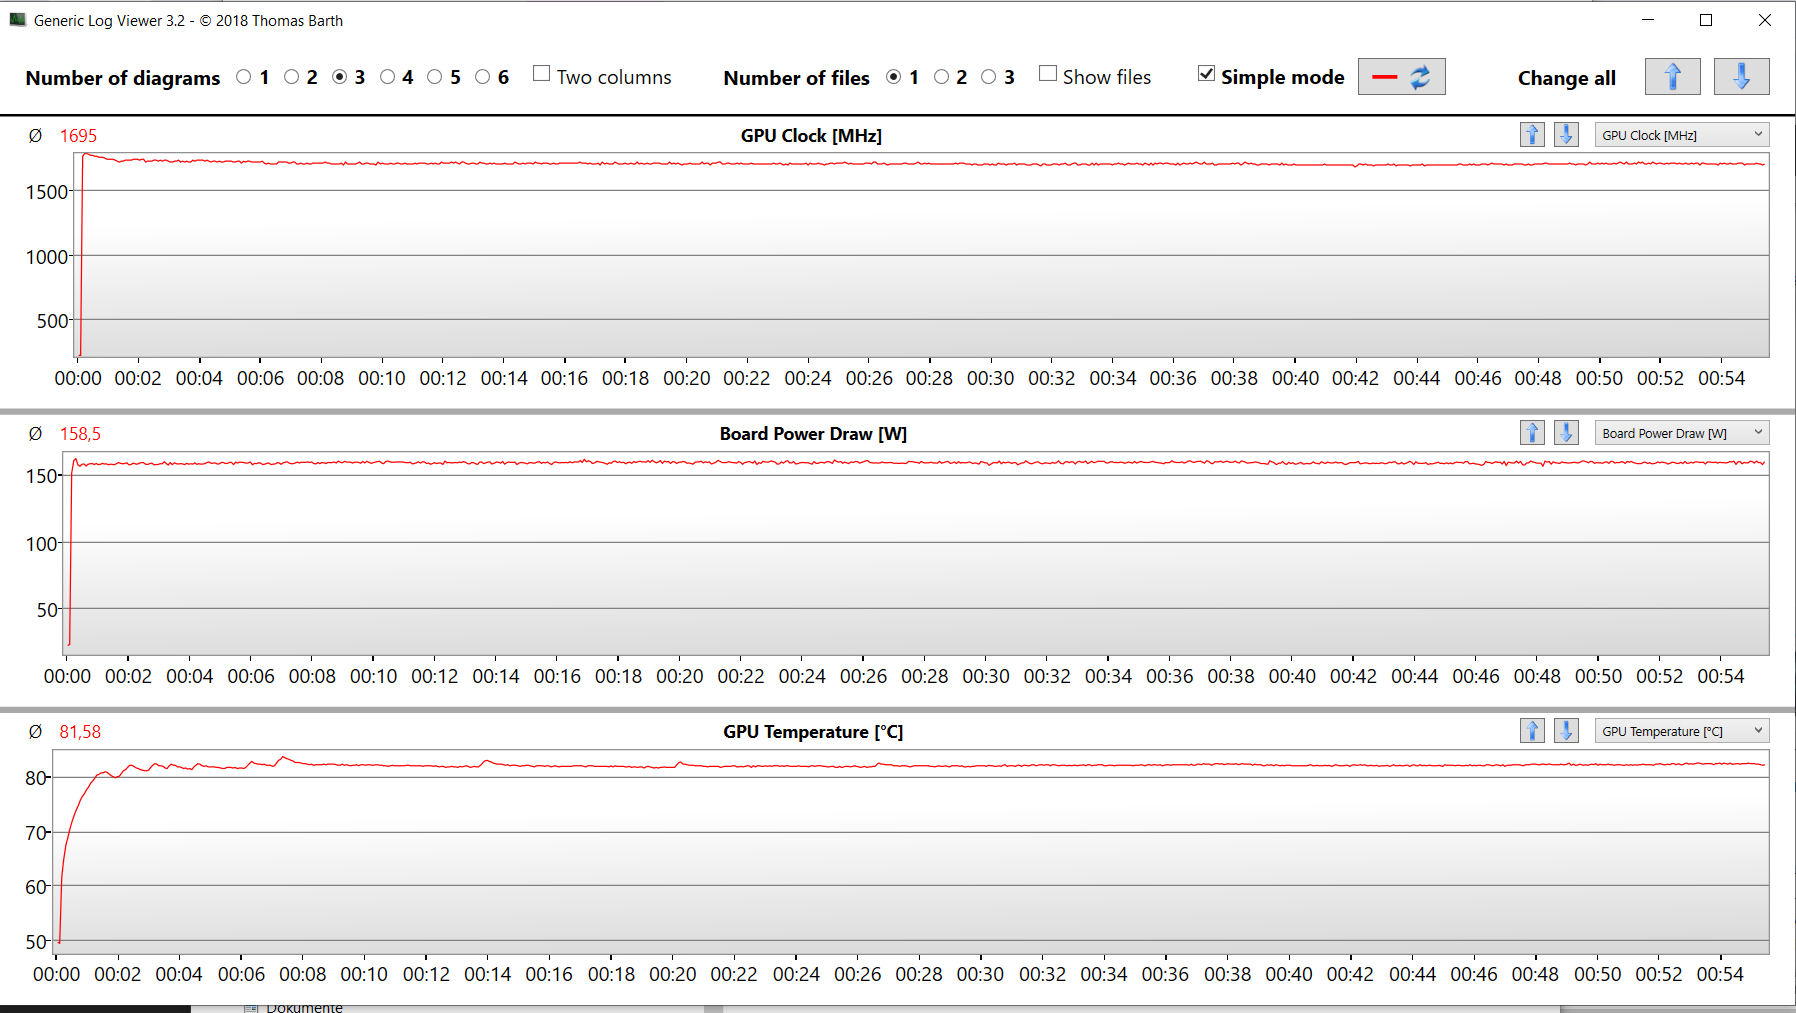
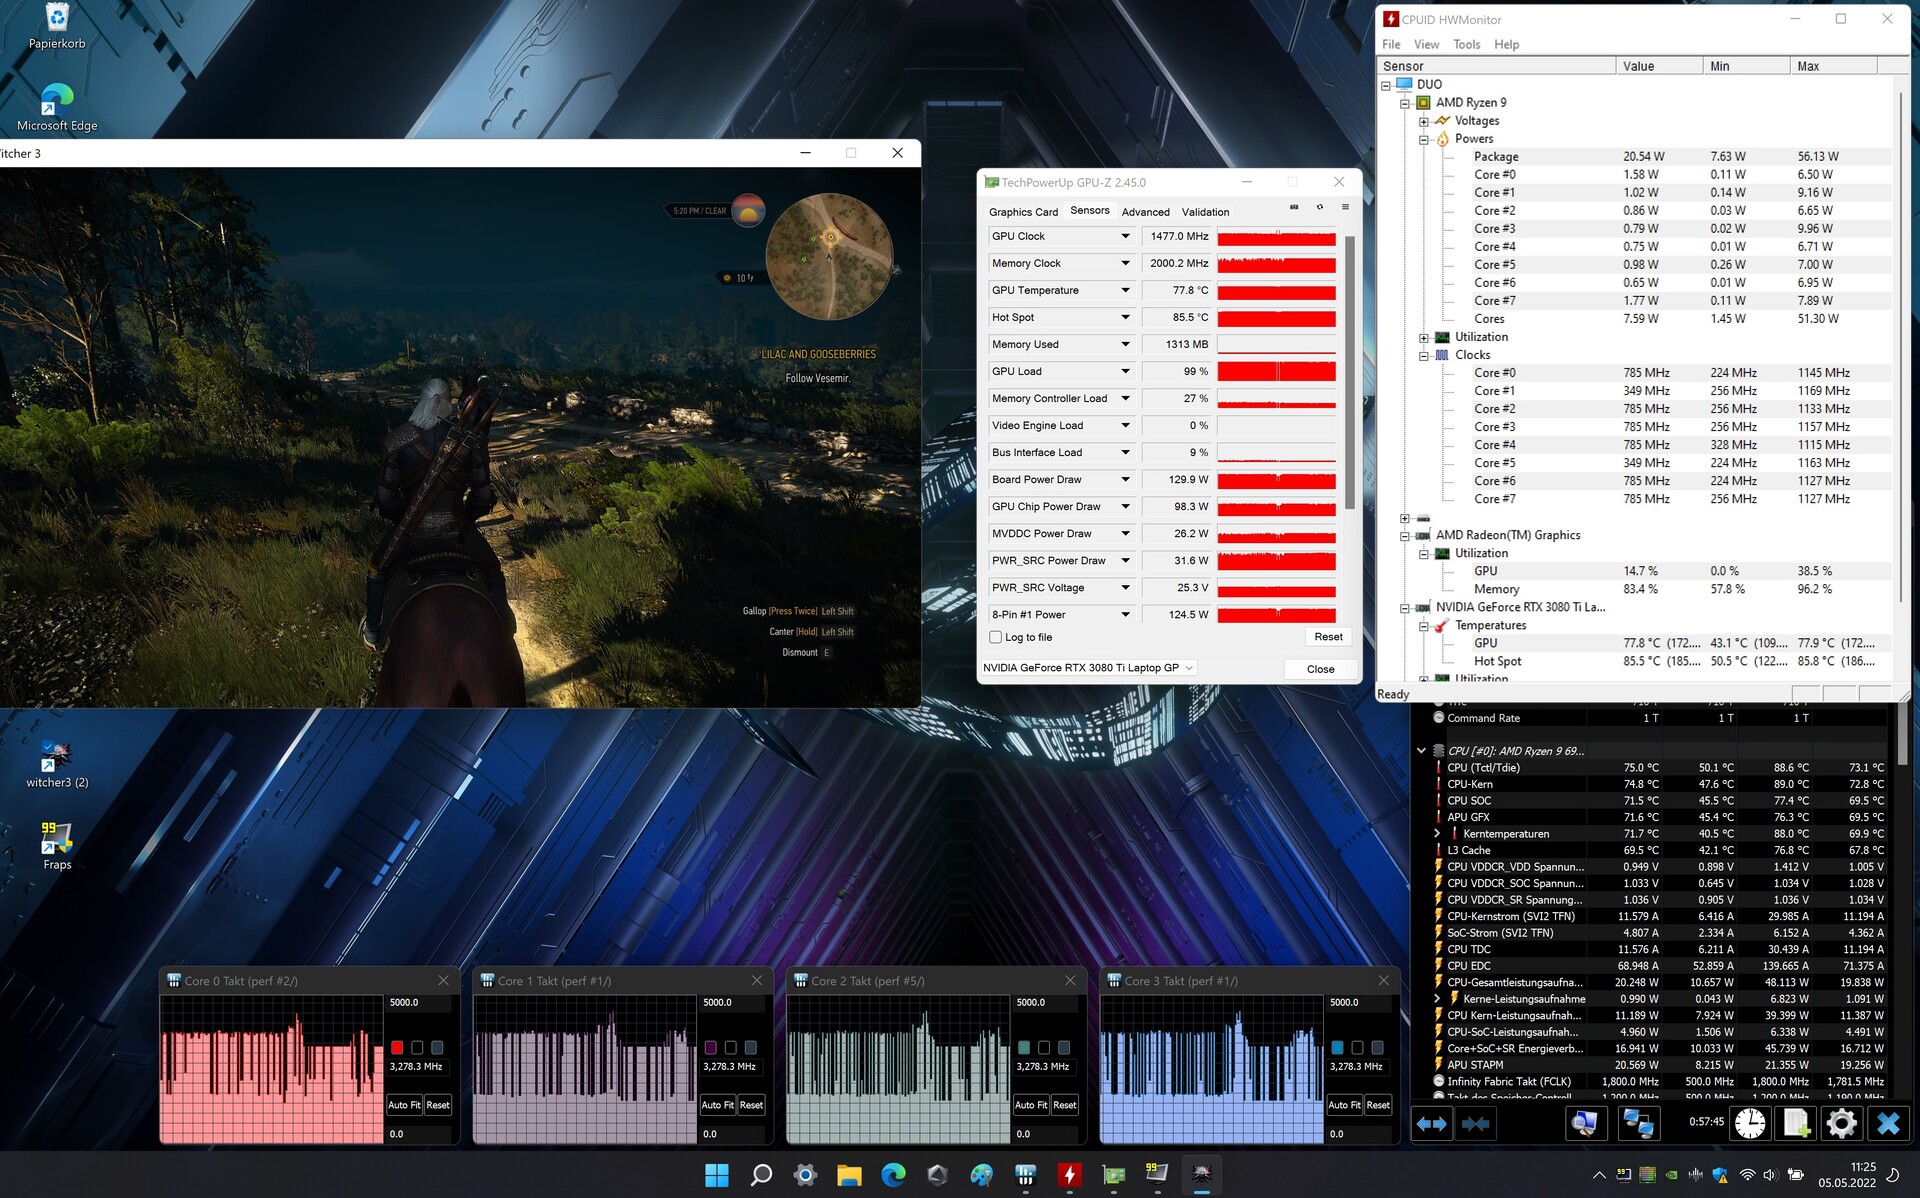
Den faktiska prestandan hos en RTX 3000 GPU beror på flera faktorer: kylningen, lagringsutrustningen och den maximala TGP som en tillverkare konfigurerar inom de gränser som Nvidia har definierat. Asus tillåter GeForce RTX 3080 Ti Bärbar datorgPU en maximal TGP på 165 watt (140 watt + 25 watt dynamisk boost). GPU:n kan använda snabb GDDR6-grafiklagring (16 384 MB).
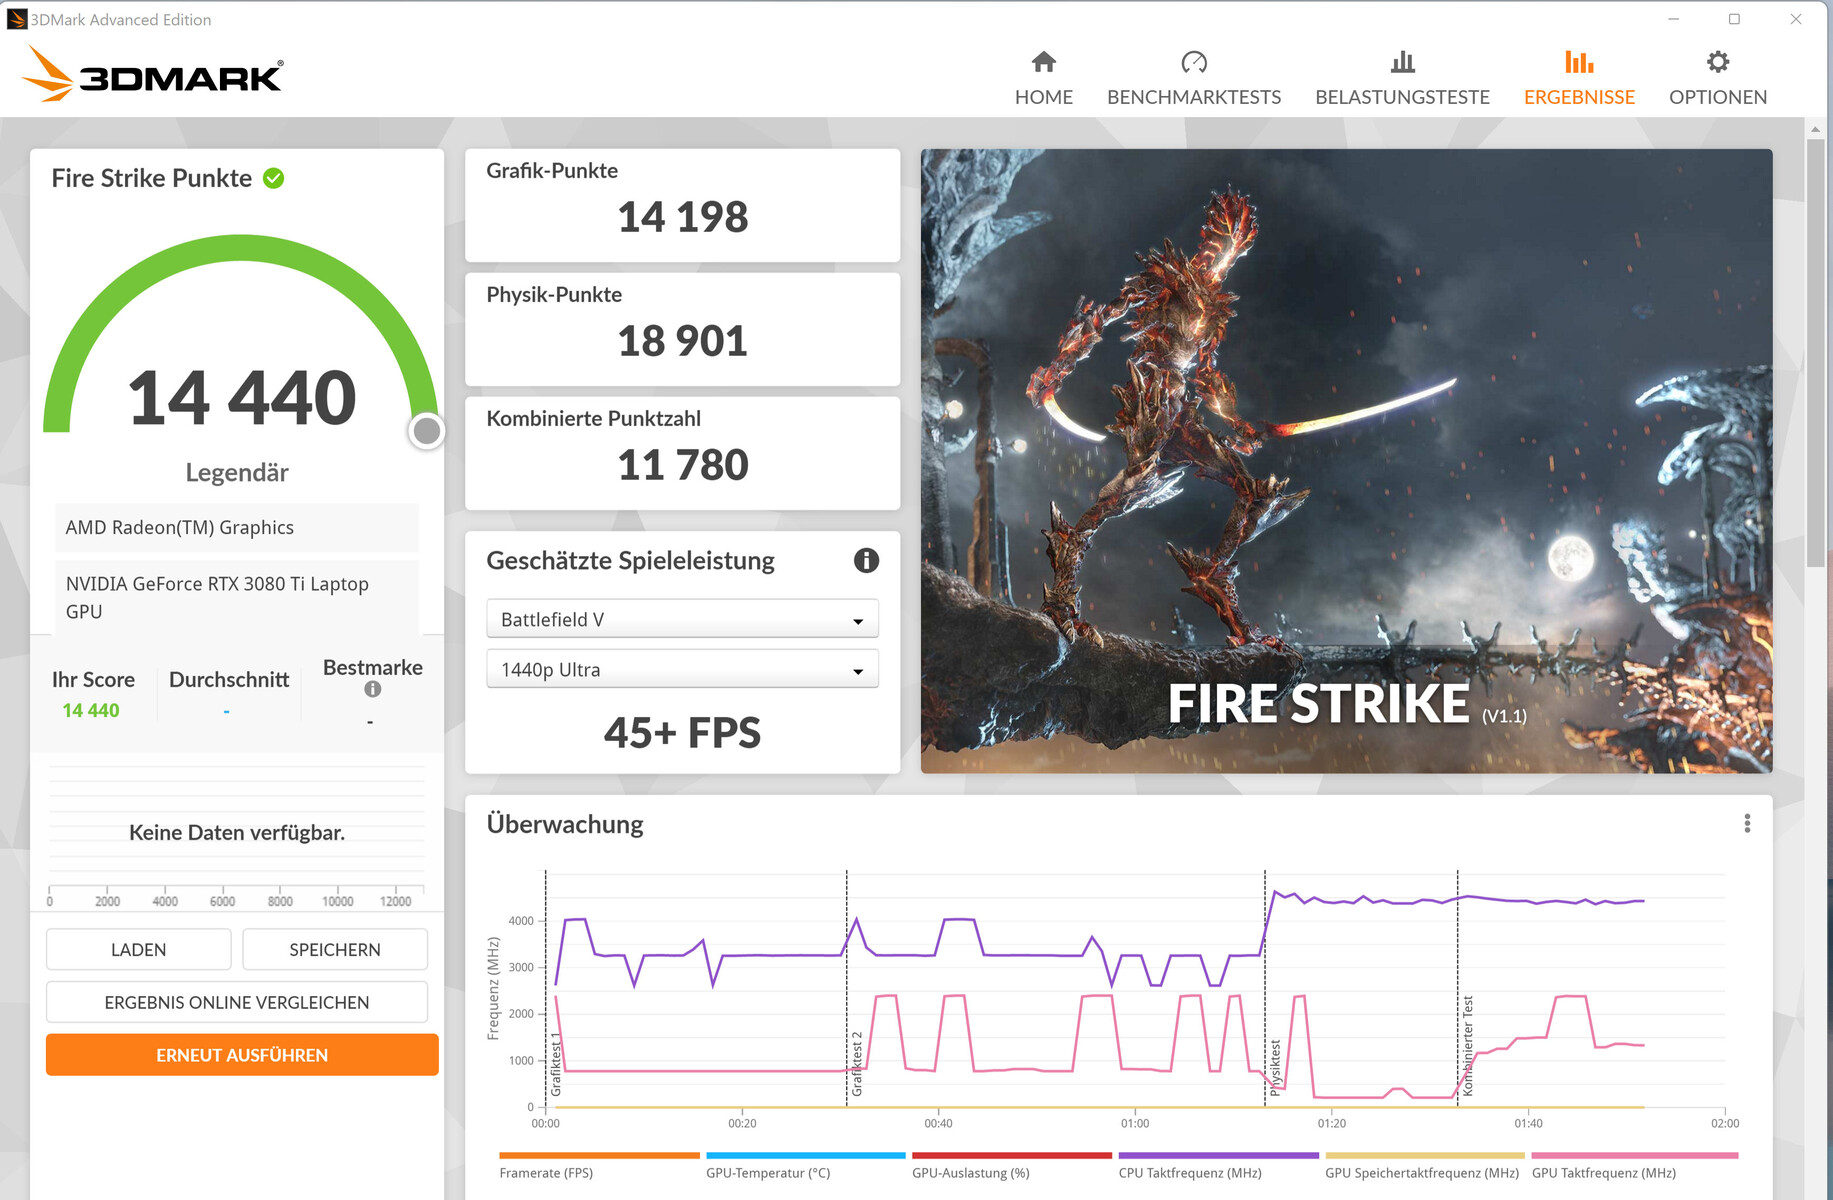
Enligt Asus är den dynamiska förstärkningen (max 10 watt) endast tillgänglig om prestandaprofilen "Turbo" är vald, och testet Witcher 3 bekräftar detta. Det maximala (25 watt) skulle behöva aktiveras med hjälp av programvaran Armoury Crate (profilen "Manual"). Benchmarkresultaten ligger strax över RTX 3080 Ti-genomsnittet som vi hittills fastställt.
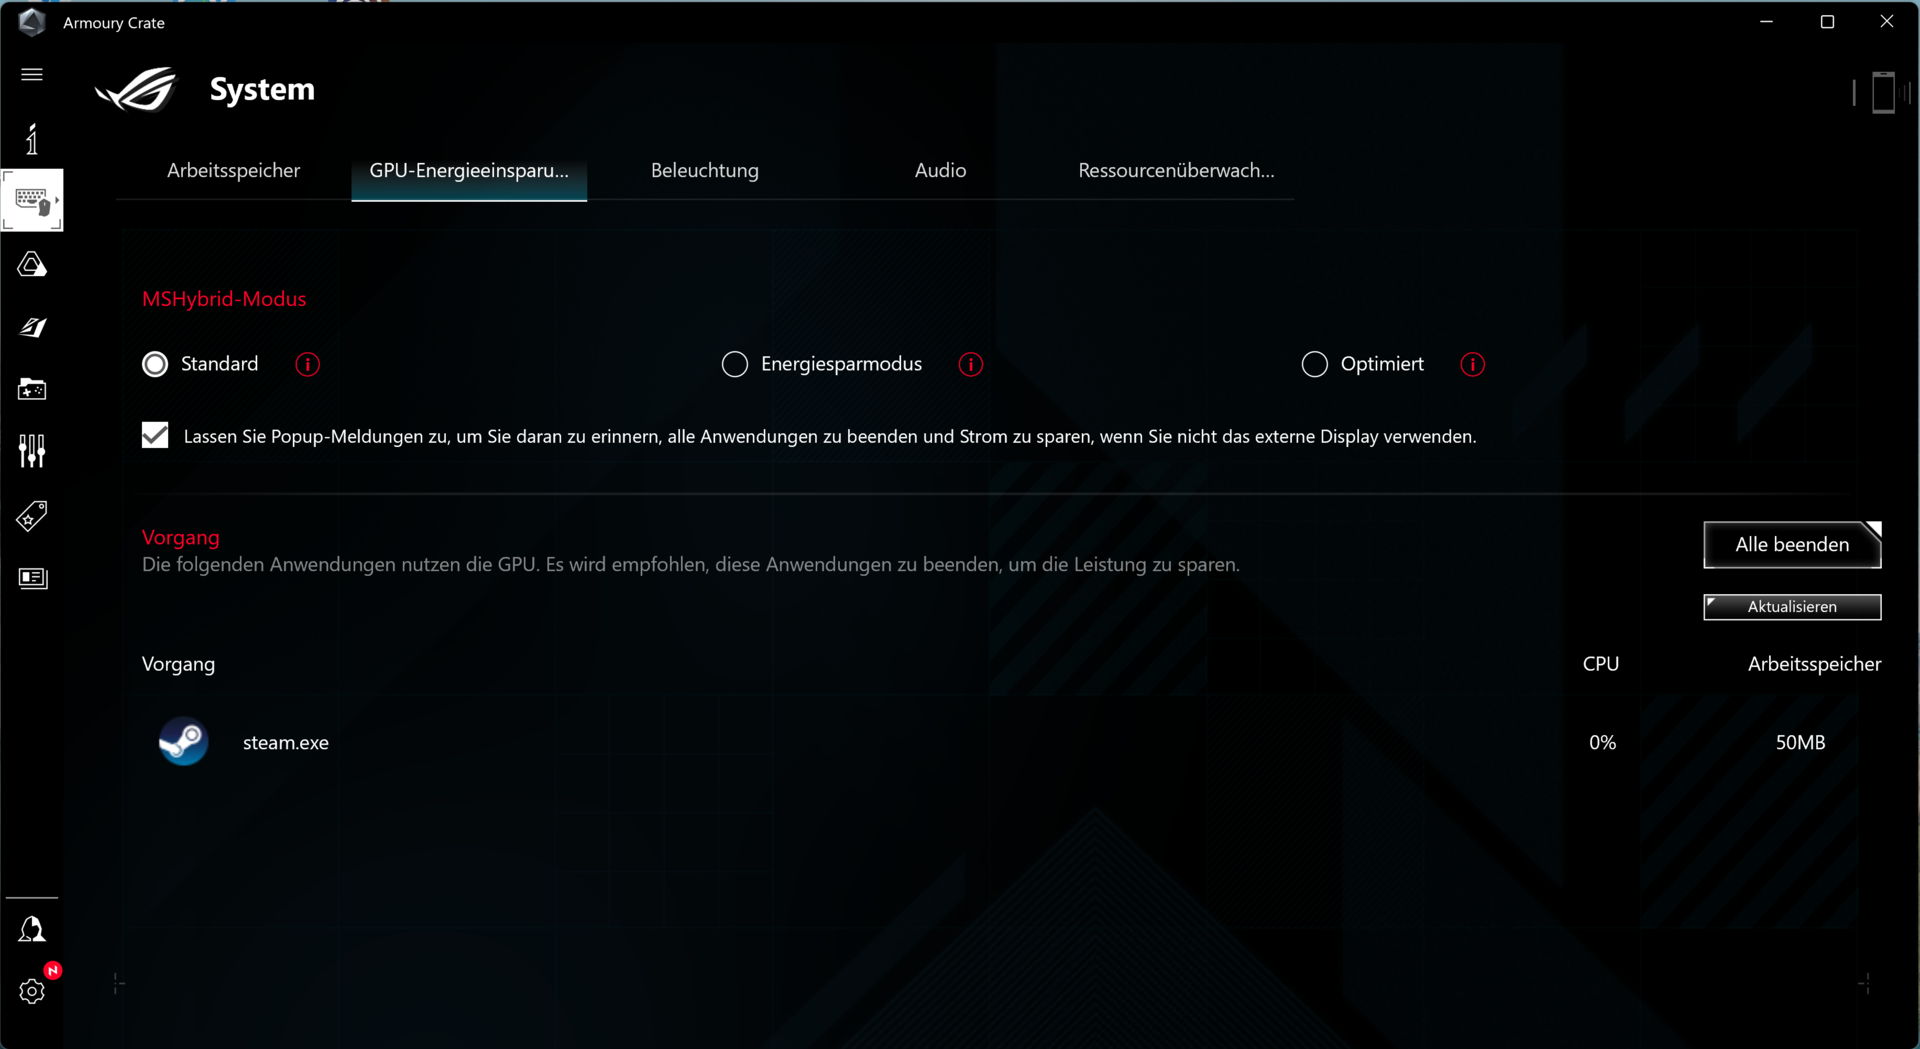
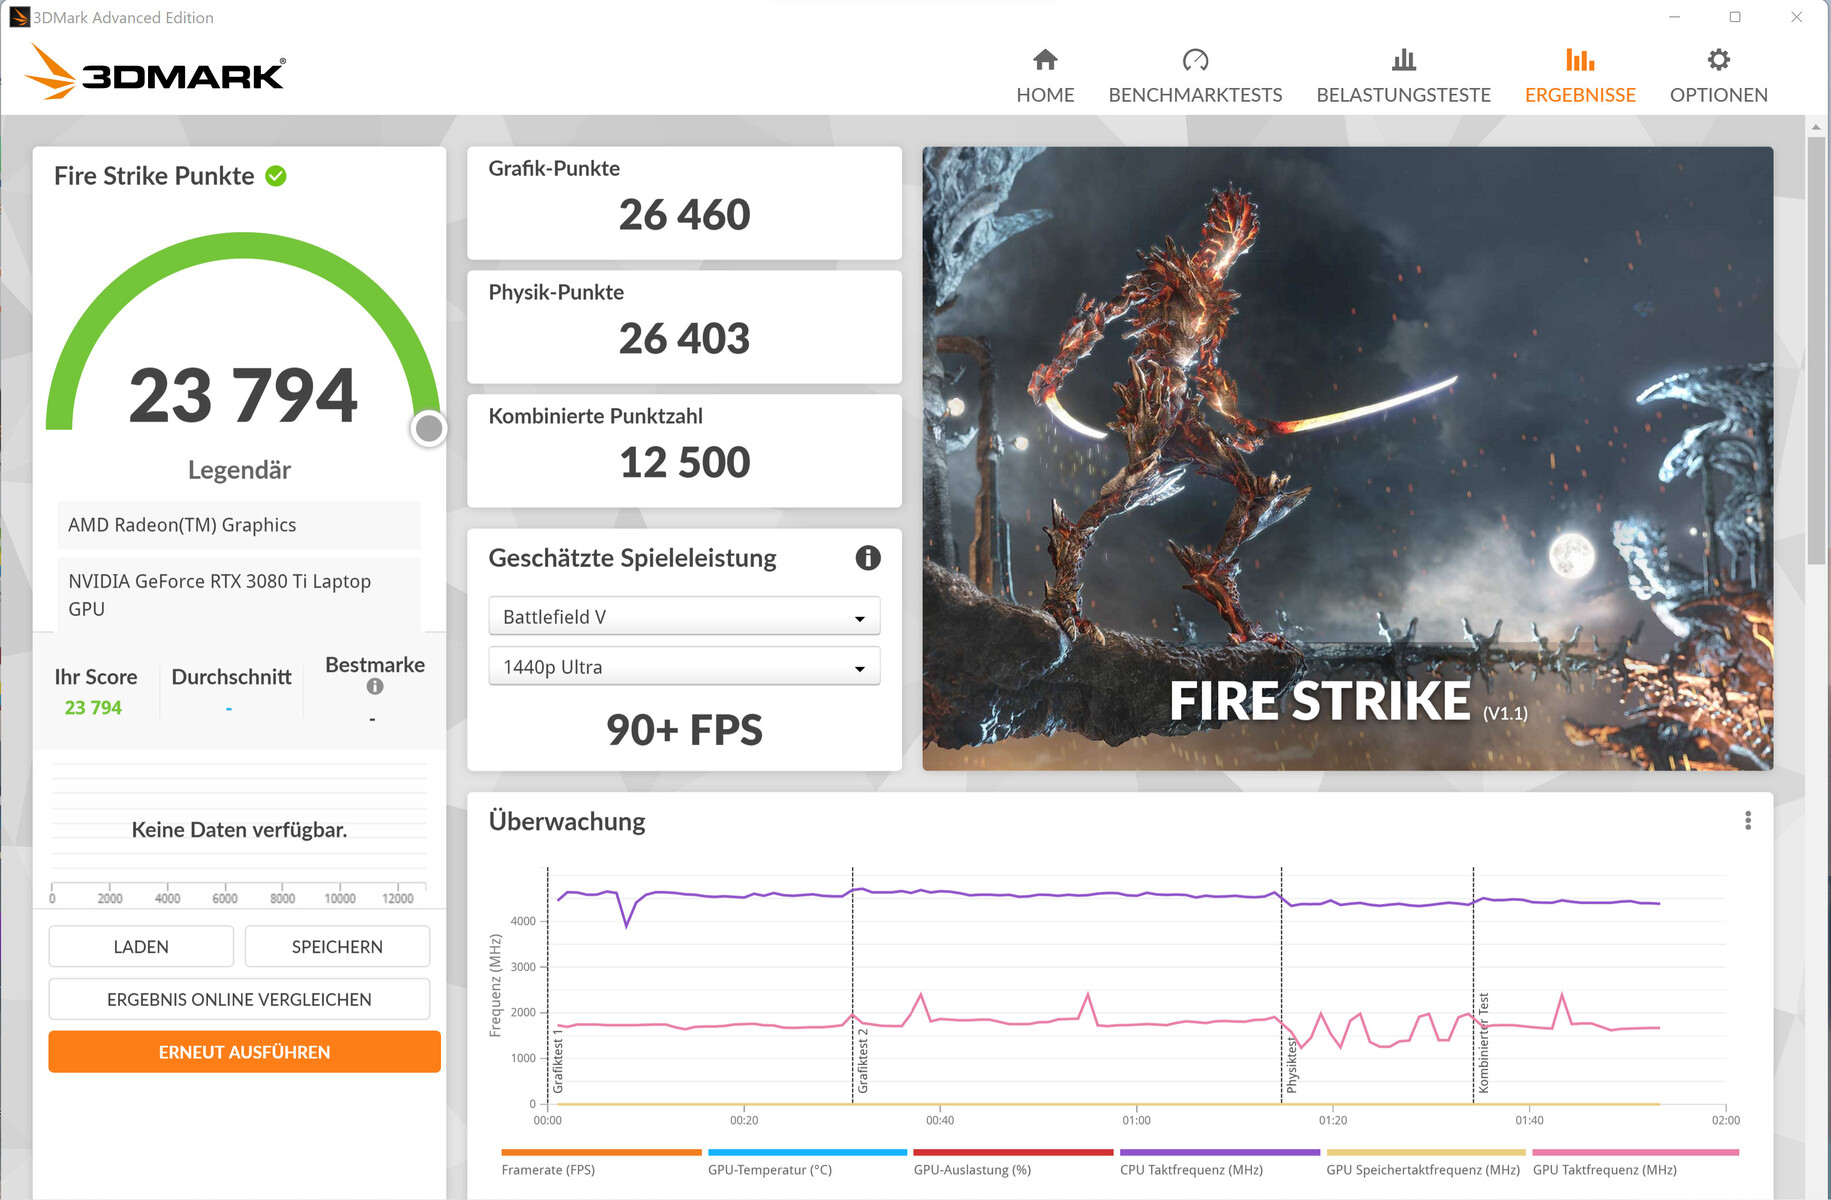
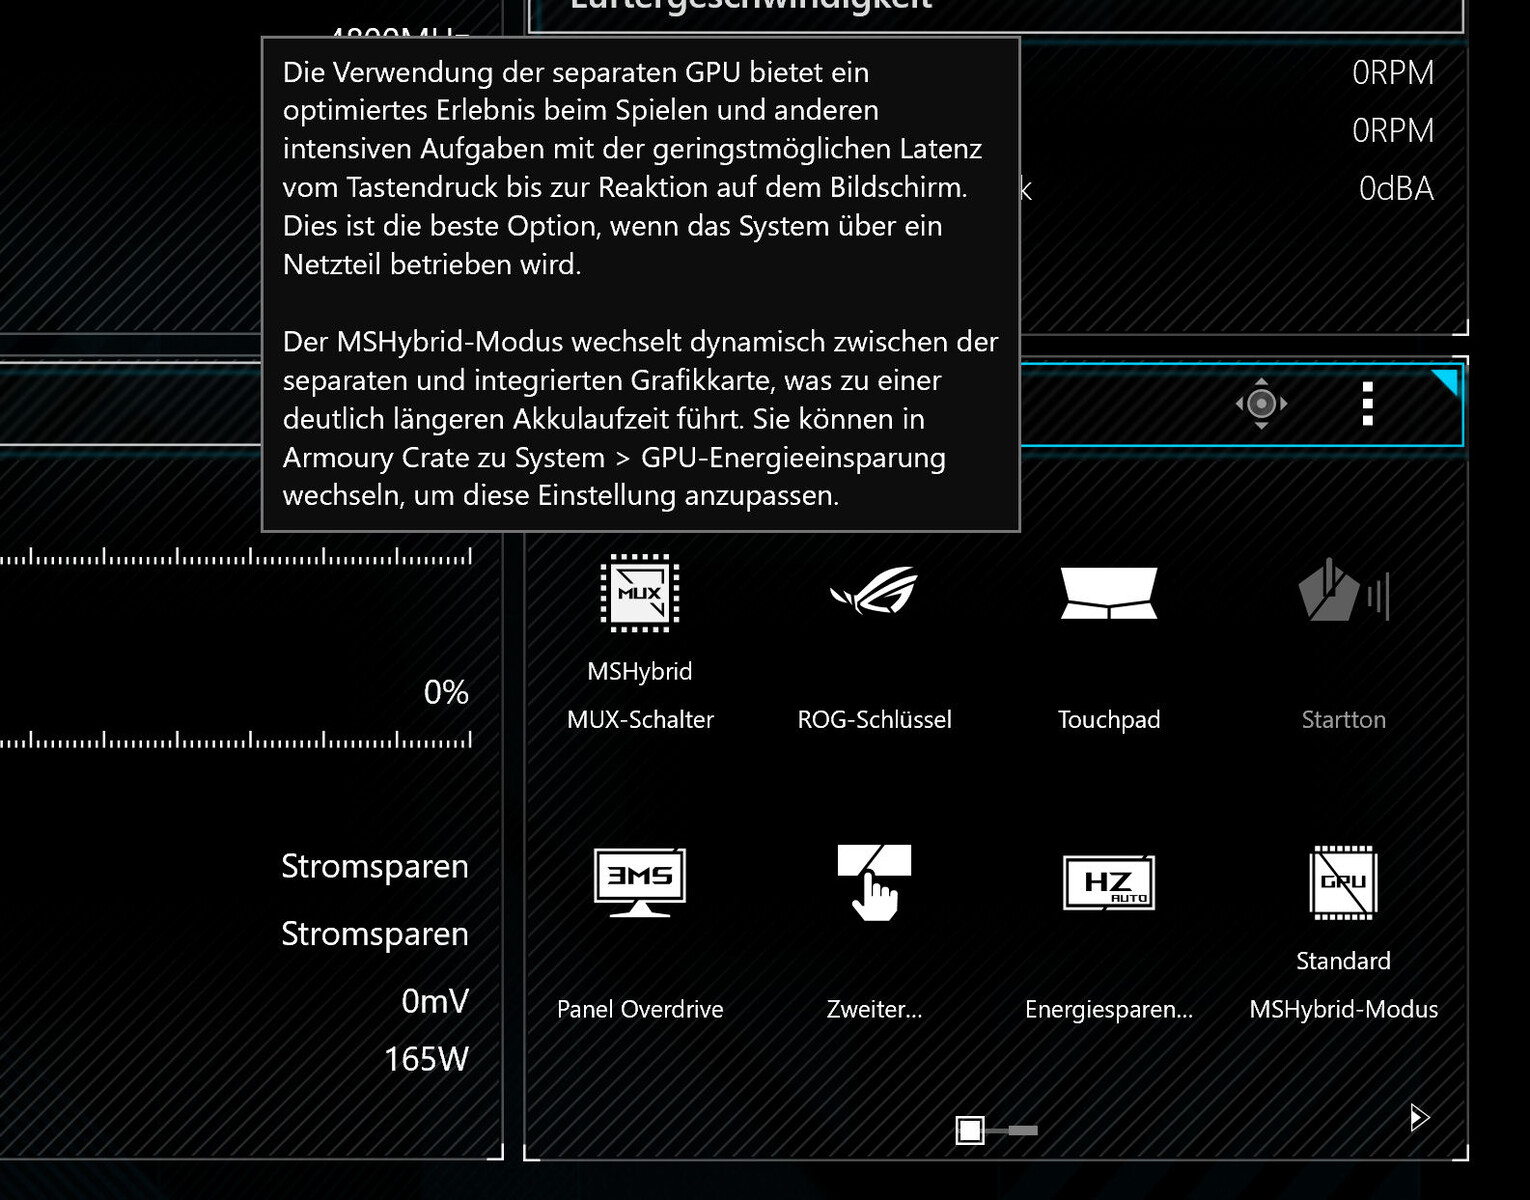
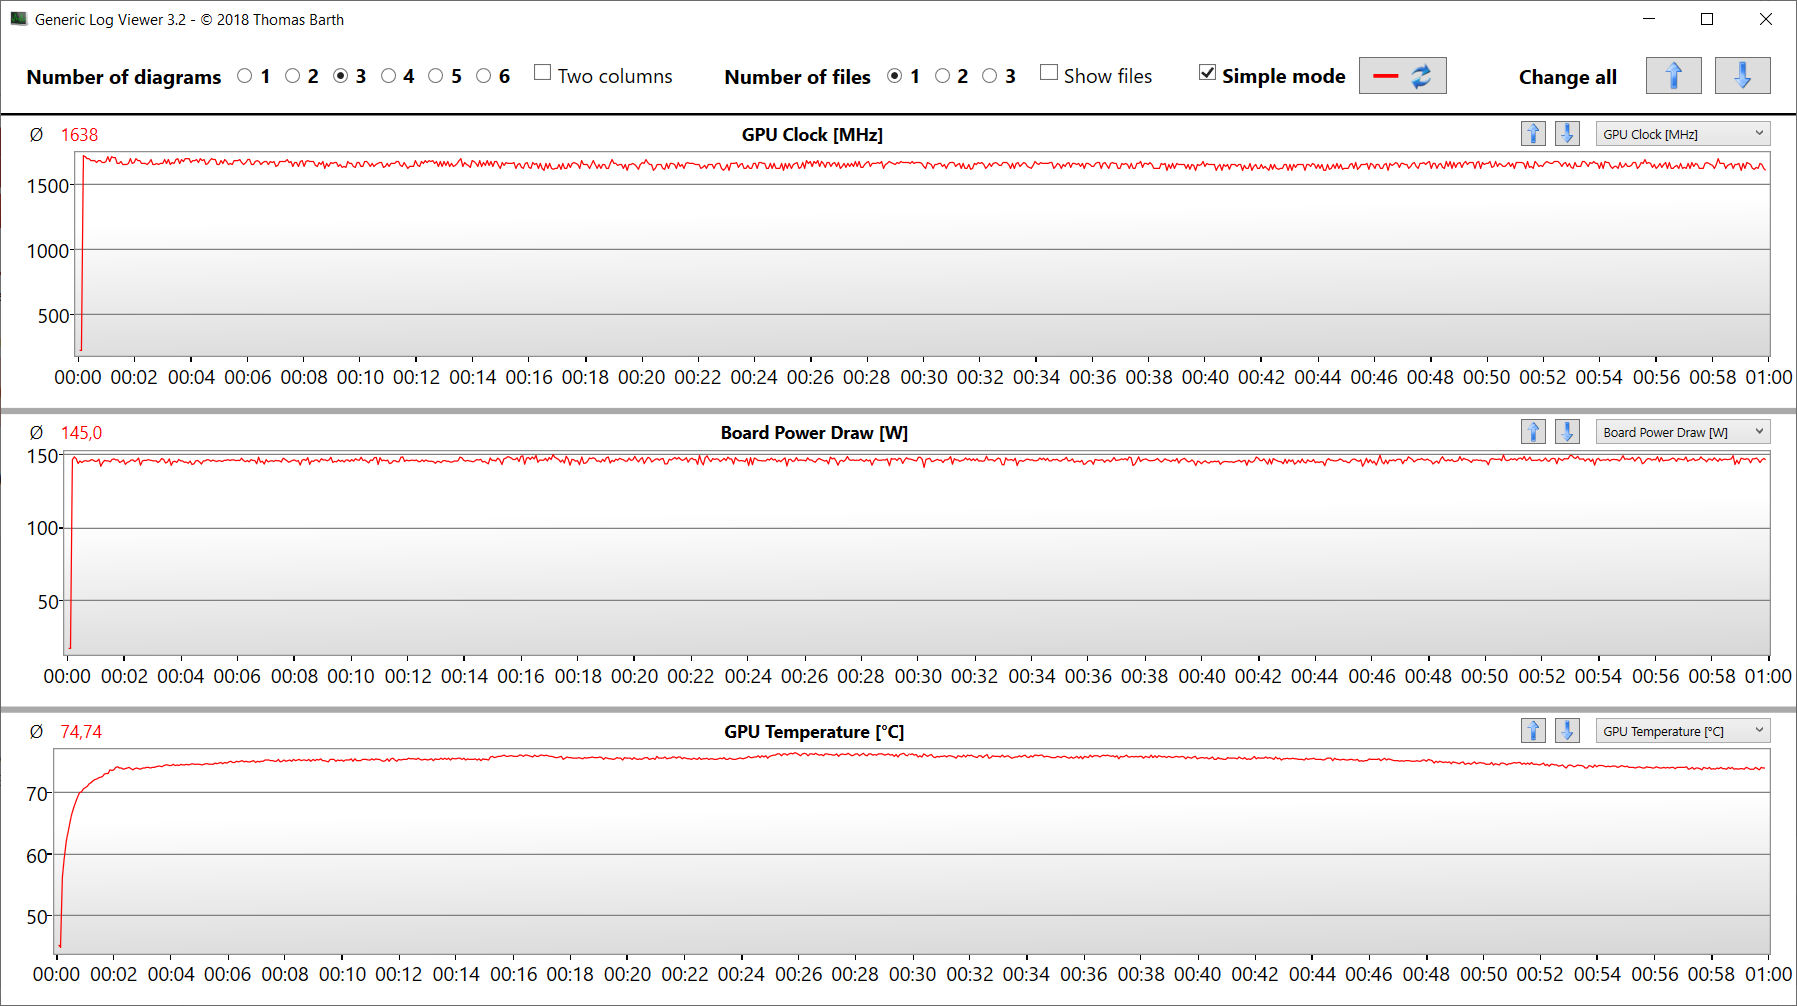
Men detta är inte slutet på det hela. Det finns också möjlighet till direkt bildutgång via GeForce GPU (Armoury Crate, MUX-switch: separat GPU). I kombination med en manuell ökning av dynamisk boost till 25 watt ökar grafikprestandan märkbart.

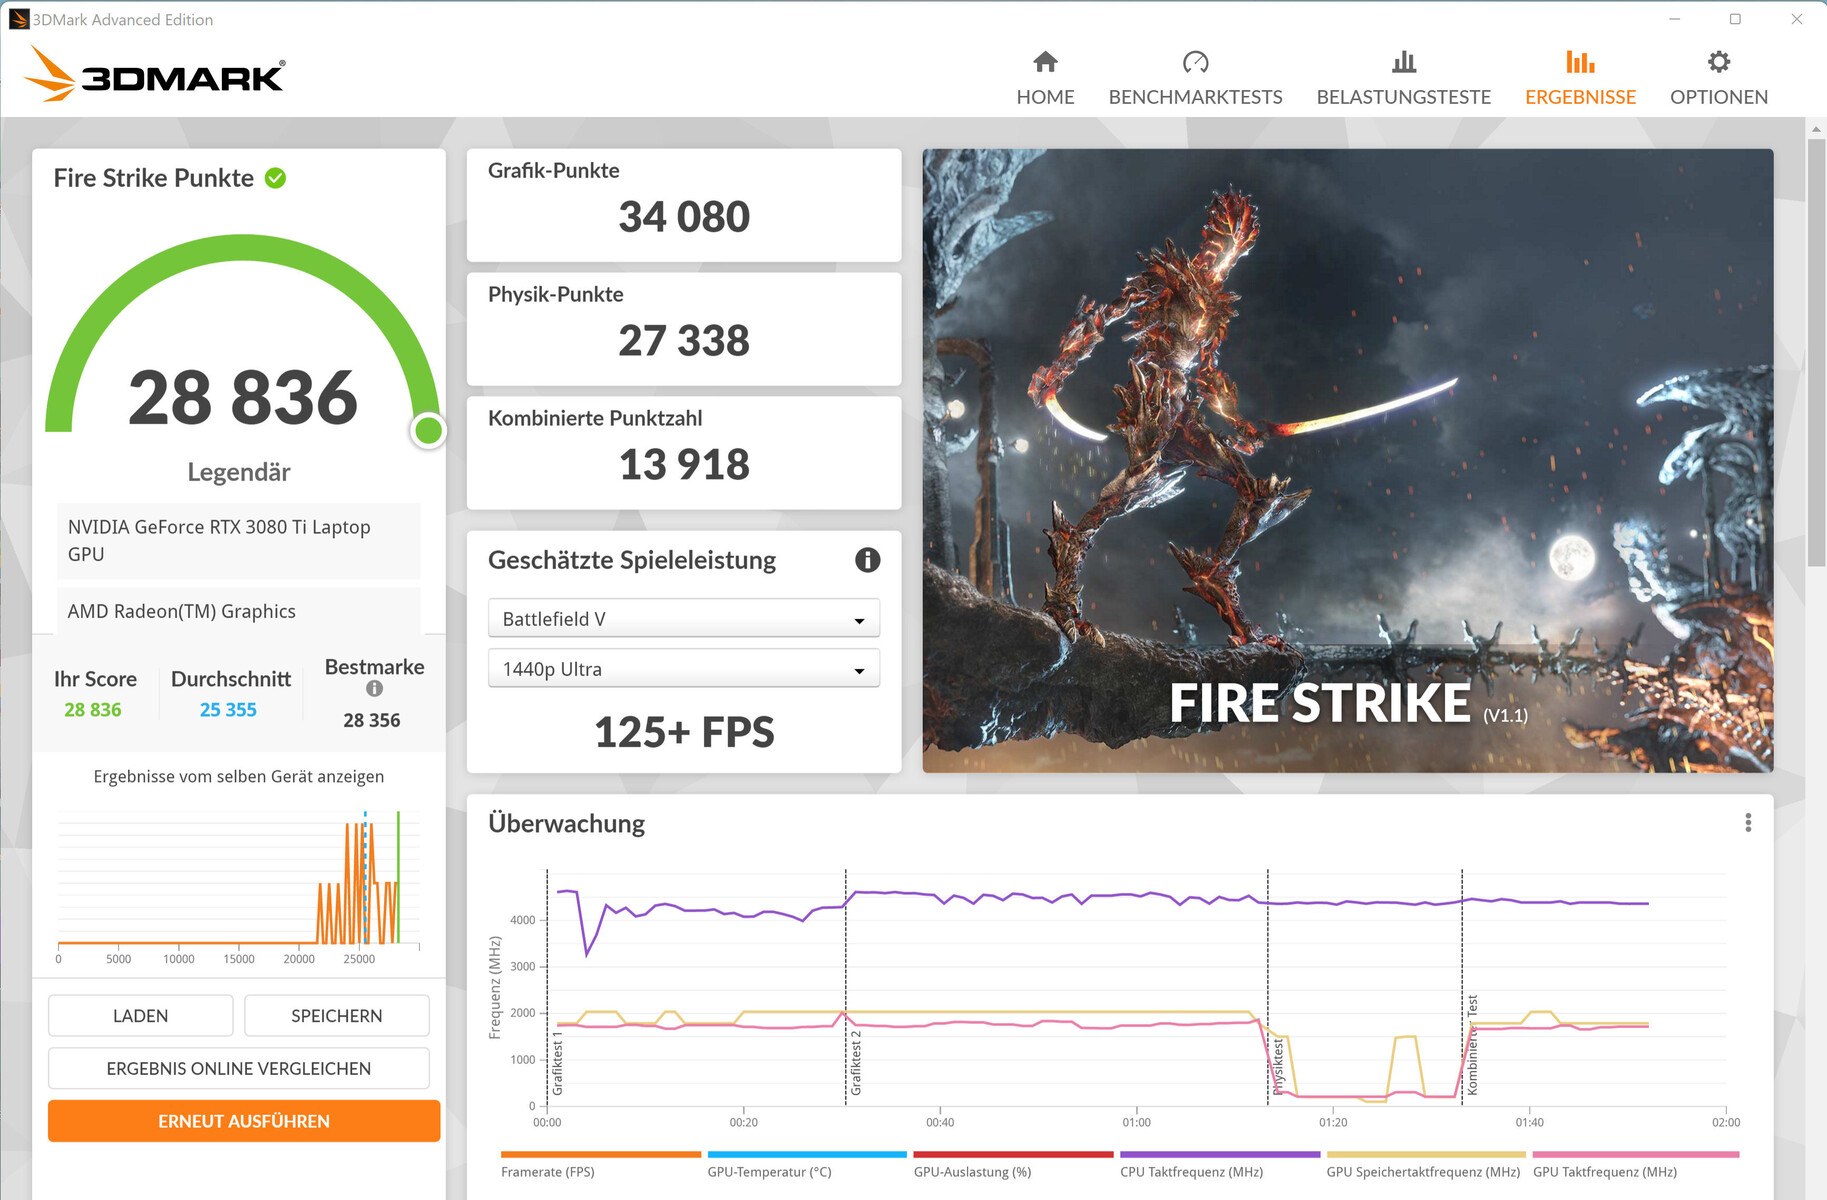
| 3DMark 11 Performance | 31771 poäng | |
| 3DMark Cloud Gate Standard Score | 47119 poäng | |
| 3DMark Fire Strike Score | 24278 poäng | |
Hjälp | ||
| 3DMark Performance rating - Percent | |
| Genomsnitt av klass Gaming -2! | |
| MSI GE76 Raider -25! | |
| Asus ROG Zephyrus Duo 16 GX650RX -25! | |
| Genomsnitt NVIDIA GeForce RTX 3080 Ti Laptop GPU | |
| Medion Erazer Beast X30 -25! | |
| Asus ROG Zephyrus Duo 16 GX650RX -2! | |
| Asus ROG Zephyrus Duo 16 GX650RX -25! | |
| Gigabyte Aero 16 YE5 -1! | |
| Razer Blade 15 Advanced Model Early 2022 -25! | |
| Asus ROG Zephyrus Duo 16 GX650RX -25! | |
| 3DMark 11 - 1280x720 Performance GPU | |
| Genomsnitt av klass Gaming (21841 - 80022, n=103, senaste 2 åren) | |
| MSI GE76 Raider | |
| Asus ROG Zephyrus Duo 16 GX650RX (Turbo) | |
| Asus ROG Zephyrus Duo 16 GX650RX (sep. GPU, 25W) | |
| Medion Erazer Beast X30 | |
| Asus ROG Zephyrus Duo 16 GX650RX | |
| Genomsnitt NVIDIA GeForce RTX 3080 Ti Laptop GPU (13920 - 45841, n=45) | |
| Gigabyte Aero 16 YE5 | |
| Razer Blade 15 Advanced Model Early 2022 | |
| Asus ROG Zephyrus Duo 16 GX650RX (Leise) | |
Spelprestanda
Hårdvaran visar alla aktuella spel smidigt på skärmen i FHD- till QHD-upplösning och maximala inställningar. Användning av den fulla skärmupplösningen på 3840 x 2400 pixlar kräver ibland reducerade inställningar. Bildfrekvensen ligger runt RTX 3080 Ti-genomsnittet. Den direkta bildutgången via GeForce GPU (MUX-switch: separat GPU) i kombination med en ökning av den dynamiska förstärkningen till 25 watt leder till en liten ökning av bildfrekvensen.
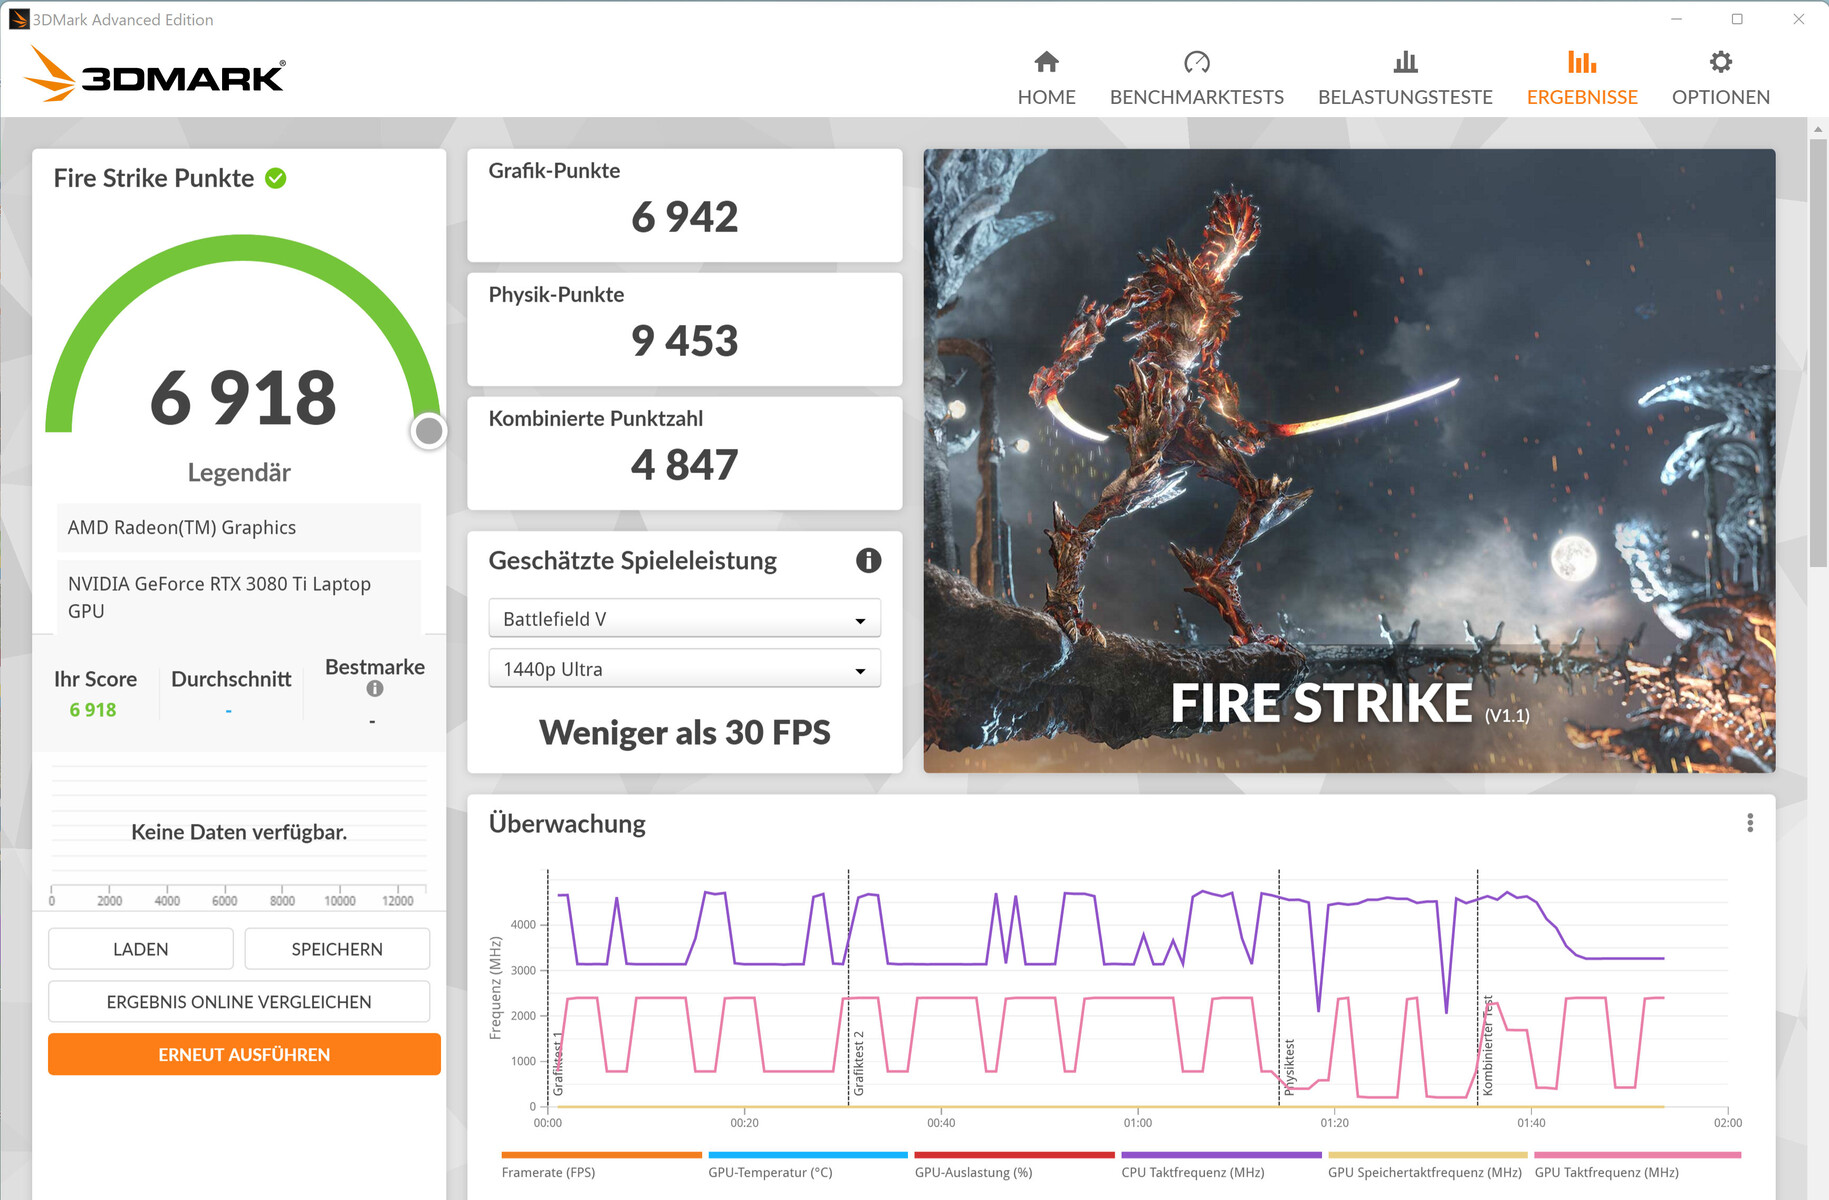
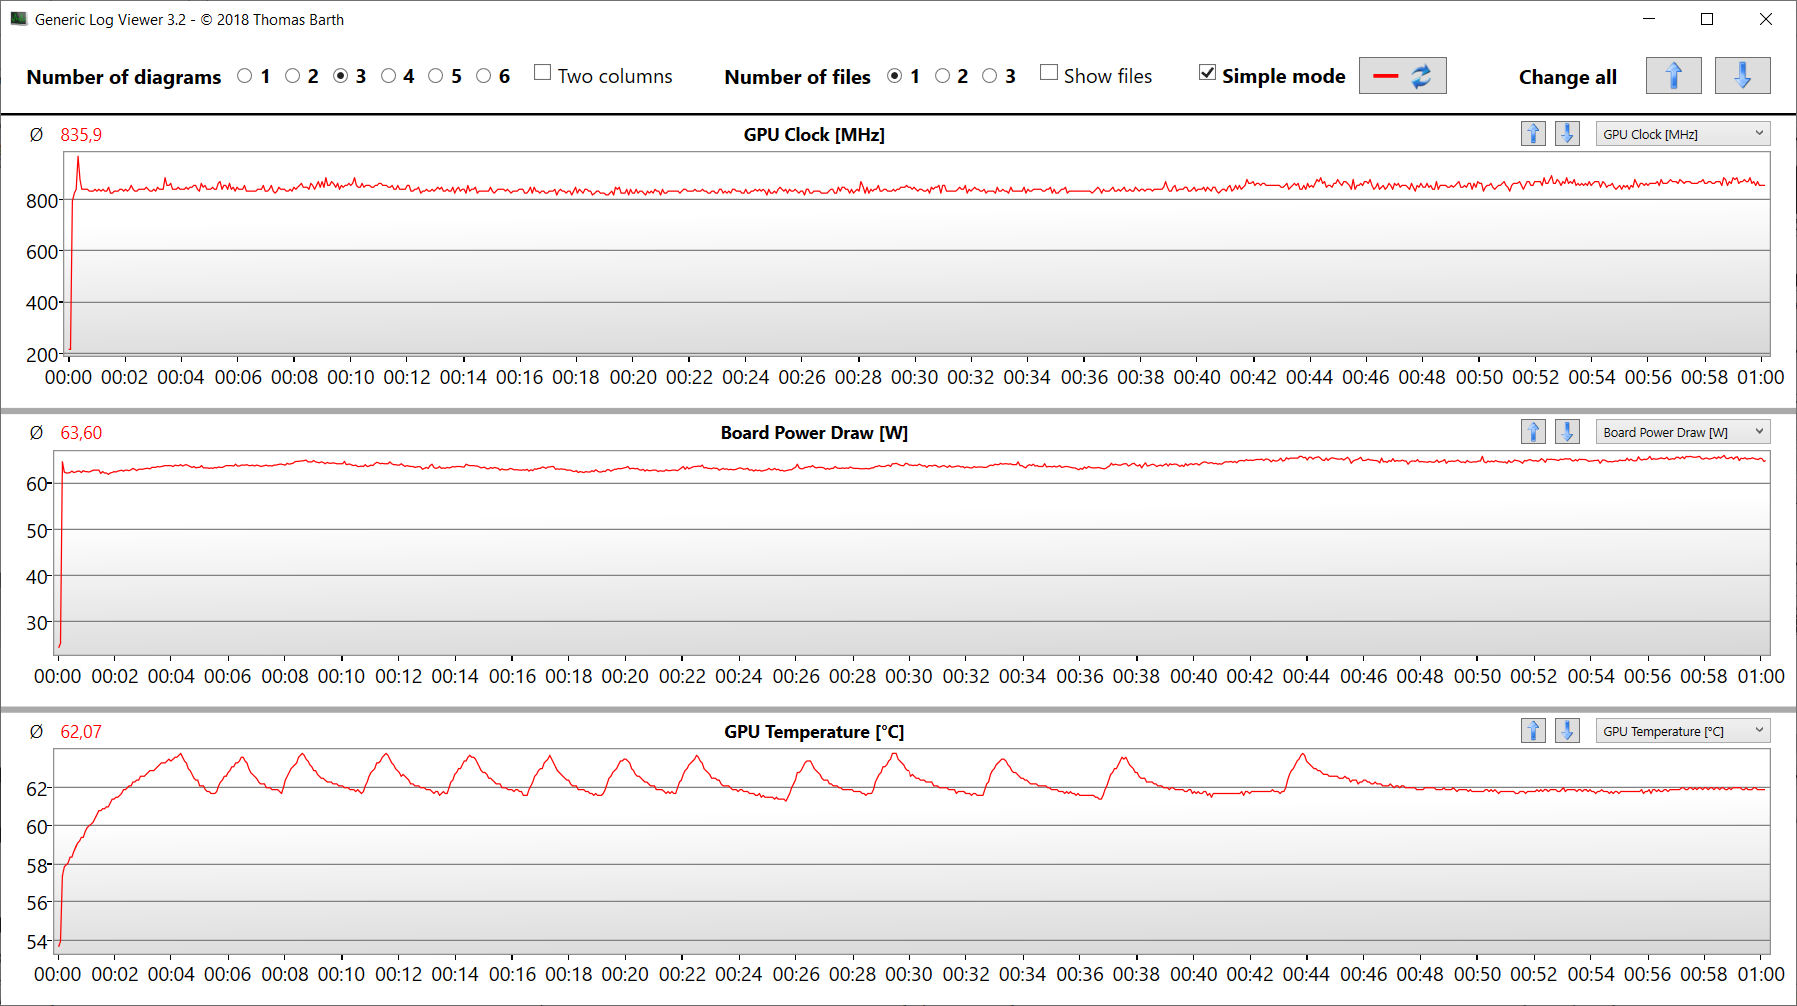
De låga bildfrekvenserna när profilen "Silent" är aktiverad beror på GeForce GPU:s "Whisper mode 2.0", som är tänkt att hålla ljudnivån så låg som möjligt samtidigt som bildfrekvensnivån fortfarande är tillräcklig för ett spel (minst 30 till 60 fps). Detta innebär att GPU:n inte behöver köra på full effekt, vilket ger mindre värmeproduktion och gör att fläktarna kan förbli tystare.
| The Witcher 3 | |
| 1920x1080 Ultra Graphics & Postprocessing (HBAO+) | |
| Genomsnitt av klass Gaming (104.7 - 240, n=7, senaste 2 åren) | |
| MSI GE76 Raider | |
| Asus ROG Zephyrus Duo 16 GX650RX (sep. GPU, 25W) | |
| Asus ROG Zephyrus Duo 16 GX650RX (Turbo) | |
| Medion Erazer Beast X30 | |
| Genomsnitt NVIDIA GeForce RTX 3080 Ti Laptop GPU (30 - 130.6, n=43) | |
| Asus ROG Zephyrus Duo 16 GX650RX | |
| Gigabyte Aero 16 YE5 | |
| Razer Blade 15 Advanced Model Early 2022 | |
| Asus ROG Zephyrus Duo 16 GX650RX (Leise) | |
| 3840x2160 Ultra Graphics & Postprocessing (HBAO+) | |
| Genomsnitt av klass Gaming (112.4 - 114.8, n=2, senaste 2 åren) | |
| Genomsnitt NVIDIA GeForce RTX 3080 Ti Laptop GPU (44.8 - 62.7, n=5) | |
| Asus ROG Zephyrus Duo 16 GX650RX | |
| Gigabyte Aero 16 YE5 | |
| Dota 2 Reborn | |
| 1920x1080 ultra (3/3) best looking | |
| Gigabyte Aero 16 YE5 | |
| MSI GE76 Raider | |
| Genomsnitt av klass Gaming (84.8 - 252, n=104, senaste 2 åren) | |
| Medion Erazer Beast X30 | |
| Genomsnitt NVIDIA GeForce RTX 3080 Ti Laptop GPU (29.9 - 170.5, n=45) | |
| Asus ROG Zephyrus Duo 16 GX650RX (sep. GPU, 25W) | |
| Asus ROG Zephyrus Duo 16 GX650RX (Turbo) | |
| Asus ROG Zephyrus Duo 16 GX650RX | |
| Razer Blade 15 Advanced Model Early 2022 | |
| Asus ROG Zephyrus Duo 16 GX650RX (Leise) | |
| 3840x2160 ultra (3/3) best looking | |
| Genomsnitt av klass Gaming (114.9 - 199.2, n=32, senaste 2 åren) | |
| Genomsnitt NVIDIA GeForce RTX 3080 Ti Laptop GPU (70.8 - 155.6, n=19) | |
| Gigabyte Aero 16 YE5 | |
| Asus ROG Zephyrus Duo 16 GX650RX (Leise) | |
| Asus ROG Zephyrus Duo 16 GX650RX (Turbo) | |
| Asus ROG Zephyrus Duo 16 GX650RX | |
| X-Plane 11.11 | |
| 3840x2160 high (fps_test=3) | |
| Genomsnitt av klass Gaming (60 - 124.1, n=32, senaste 2 åren) | |
| Genomsnitt NVIDIA GeForce RTX 3080 Ti Laptop GPU (32.9 - 109.5, n=20) | |
| Gigabyte Aero 16 YE5 | |
| Asus ROG Zephyrus Duo 16 GX650RX (Turbo) | |
| Asus ROG Zephyrus Duo 16 GX650RX | |
| Asus ROG Zephyrus Duo 16 GX650RX (Leise) | |
| 1920x1080 high (fps_test=3) | |
| MSI GE76 Raider | |
| Gigabyte Aero 16 YE5 | |
| Genomsnitt NVIDIA GeForce RTX 3080 Ti Laptop GPU (32.6 - 127, n=45) | |
| Genomsnitt av klass Gaming (55.5 - 148.5, n=106, senaste 2 åren) | |
| Medion Erazer Beast X30 | |
| Razer Blade 15 Advanced Model Early 2022 | |
| Asus ROG Zephyrus Duo 16 GX650RX (sep. GPU, 25W) | |
| Asus ROG Zephyrus Duo 16 GX650RX (Turbo) | |
| Asus ROG Zephyrus Duo 16 GX650RX | |
| Asus ROG Zephyrus Duo 16 GX650RX (Leise) | |
| Final Fantasy XV Benchmark | |
| 3840x2160 High Quality | |
| Genomsnitt av klass Gaming (49.1 - 111.8, n=33, senaste 2 åren) | |
| Asus ROG Zephyrus Duo 16 GX650RX (1.3, sep. GPU, 25W) | |
| Asus ROG Zephyrus Duo 16 GX650RX (1.3, Turbo) | |
| Genomsnitt NVIDIA GeForce RTX 3080 Ti Laptop GPU (35.1 - 61.2, n=18) | |
| Asus ROG Zephyrus Duo 16 GX650RX (1.3) | |
| Asus ROG Zephyrus Duo 16 GX650RX (1.3, Leise) | |
| Gigabyte Aero 16 YE5 (1.3) | |
| 1920x1080 High Quality | |
| Genomsnitt av klass Gaming (64.2 - 215, n=91, senaste 2 åren) | |
| MSI GE76 Raider | |
| Asus ROG Zephyrus Duo 16 GX650RX (1.3, sep. GPU, 25W) | |
| Asus ROG Zephyrus Duo 16 GX650RX (1.3, Turbo) | |
| Genomsnitt NVIDIA GeForce RTX 3080 Ti Laptop GPU (30.7 - 140.6, n=42) | |
| Asus ROG Zephyrus Duo 16 GX650RX (1.3) | |
| Razer Blade 15 Advanced Model Early 2022 (1.3) | |
| Medion Erazer Beast X30 (1.3) | |
| Gigabyte Aero 16 YE5 (1.3) | |
| GTA V | |
| 3840x2160 Highest AA:4xMSAA + FX AF:16x | |
| Genomsnitt av klass Gaming (53.9 - 123.2, n=25, senaste 2 åren) | |
| Asus ROG Zephyrus Duo 16 GX650RX (Turbo) | |
| Asus ROG Zephyrus Duo 16 GX650RX | |
| Genomsnitt NVIDIA GeForce RTX 3080 Ti Laptop GPU (37.7 - 67.2, n=14) | |
| Gigabyte Aero 16 YE5 | |
| 1920x1080 Highest AA:4xMSAA + FX AF:16x | |
| Genomsnitt av klass Gaming (67.1 - 186.9, n=90, senaste 2 åren) | |
| MSI GE76 Raider | |
| Gigabyte Aero 16 YE5 | |
| Genomsnitt NVIDIA GeForce RTX 3080 Ti Laptop GPU (30 - 139.2, n=42) | |
| Medion Erazer Beast X30 | |
| Asus ROG Zephyrus Duo 16 GX650RX (sep. GPU, 25W) | |
| Asus ROG Zephyrus Duo 16 GX650RX (Turbo) | |
| Asus ROG Zephyrus Duo 16 GX650RX | |
| Razer Blade 15 Advanced Model Early 2022 | |
| Asus ROG Zephyrus Duo 16 GX650RX (Leise) | |
| F1 2021 | |
| 3840x2160 Ultra High Preset + Raytracing AA:T AF:16x | |
| MSI GE76 Raider | |
| Asus ROG Zephyrus Duo 16 GX650RX (874931, sep. GPU, 25W) | |
| Asus ROG Zephyrus Duo 16 GX650RX (874931, Turbo) | |
| Genomsnitt NVIDIA GeForce RTX 3080 Ti Laptop GPU (41.1 - 70.2, n=18) | |
| Asus ROG Zephyrus Duo 16 GX650RX (874931) | |
| Asus ROG Zephyrus Duo 16 GX650RX (874931, Leise) | |
| Gigabyte Aero 16 YE5 (852849) | |
| 1920x1080 Ultra High Preset + Raytracing AA:T AF:16x | |
| MSI GE76 Raider | |
| Asus ROG Zephyrus Duo 16 GX650RX (874931, sep. GPU, 25W) | |
| Asus ROG Zephyrus Duo 16 GX650RX (874931, Turbo) | |
| Asus ROG Zephyrus Duo 16 GX650RX (874931) | |
| Medion Erazer Beast X30 (874931) | |
| Genomsnitt NVIDIA GeForce RTX 3080 Ti Laptop GPU (30.2 - 160.6, n=30) | |
| Gigabyte Aero 16 YE5 (852849) | |
| Asus ROG Zephyrus Duo 16 GX650RX (874931, Leise) | |
| Strange Brigade | |
| 3840x2160 ultra AA:ultra AF:16 | |
| Genomsnitt av klass Gaming (83 - 187.2, n=34, senaste 2 åren) | |
| Asus ROG Zephyrus Duo 16 GX650RX (1.47.22.14 D3D12, Turbo) | |
| Genomsnitt NVIDIA GeForce RTX 3080 Ti Laptop GPU (61.7 - 100.7, n=15) | |
| Asus ROG Zephyrus Duo 16 GX650RX (1.47.22.14 D3D12) | |
| Gigabyte Aero 16 YE5 (1.47.22.14 D3D12) | |
| 1920x1080 ultra AA:ultra AF:16 | |
| Genomsnitt av klass Gaming (113.6 - 458, n=83, senaste 2 åren) | |
| MSI GE76 Raider (1.47.22.14 D3D12) | |
| Asus ROG Zephyrus Duo 16 GX650RX (1.47.22.14 D3D12, sep. GPU, 25W) | |
| Medion Erazer Beast X30 (1.47.22.14 D3D12) | |
| Asus ROG Zephyrus Duo 16 GX650RX (1.47.22.14 D3D12, Turbo) | |
| Genomsnitt NVIDIA GeForce RTX 3080 Ti Laptop GPU (42.3 - 224, n=41) | |
| Asus ROG Zephyrus Duo 16 GX650RX (1.47.22.14 D3D12) | |
| Gigabyte Aero 16 YE5 (1.47.22.14 D3D12) | |
| Razer Blade 15 Advanced Model Early 2022 (1.47.22.14 D3D12) | |
| Asus ROG Zephyrus Duo 16 GX650RX (1.47.22.14 D3D12, Leise) | |
| Cyberpunk 2077 1.6 | |
| 1920x1080 Ray Tracing Ultra Preset (DLSS off) | |
| Gigabyte Aero 16 YE5 | |
| Genomsnitt NVIDIA GeForce RTX 3080 Ti Laptop GPU (39.2 - 49.9, n=7) | |
| Asus ROG Zephyrus Duo 16 GX650RX | |
| 3840x2160 Ultra Preset | |
| Genomsnitt NVIDIA GeForce RTX 3080 Ti Laptop GPU (19.6 - 32.4, n=6) | |
| Asus ROG Zephyrus Duo 16 GX650RX | |
| Gigabyte Aero 16 YE5 | |
| 1920x1080 Ultra Preset | |
| Asus ROG Zephyrus Duo 16 GX650RX | |
| Genomsnitt NVIDIA GeForce RTX 3080 Ti Laptop GPU (54 - 144.1, n=16) | |
| Gigabyte Aero 16 YE5 | |
| Far Cry 6 | |
| 1920x1080 Ultra Graphics Quality + HD Textures AA:T | |
| Genomsnitt av klass Gaming (n=1senaste 2 åren) | |
| MSI GE76 Raider | |
| Genomsnitt NVIDIA GeForce RTX 3080 Ti Laptop GPU (71.3 - 114, n=6) | |
| Asus ROG Zephyrus Duo 16 GX650RX | |
| Asus ROG Zephyrus Duo 16 GX650RX | |
| 3840x2160 Ultra Graphics Quality + HD Textures AA:T | |
| MSI GE76 Raider | |
| Genomsnitt NVIDIA GeForce RTX 3080 Ti Laptop GPU (46.2 - 57, n=4) | |
| Asus ROG Zephyrus Duo 16 GX650RX | |
| 1920x1080 Ultra Graphics Quality + HD Textures + DXR AA:T | |
| Genomsnitt av klass Gaming (n=1senaste 2 åren) | |
| Genomsnitt NVIDIA GeForce RTX 3080 Ti Laptop GPU (91 - 92, n=3) | |
| MSI GE76 Raider | |
| Rainbow Six Extraction | |
| 1920x1080 Ultra Preset (with Fixed Resolution Quality) | |
| Asus ROG Zephyrus Duo 16 GX650RX | |
| Medion Erazer Beast X30 | |
| Genomsnitt NVIDIA GeForce RTX 3080 Ti Laptop GPU (128 - 169, n=3) | |
| Gigabyte Aero 16 YE5 | |
| 3840x2160 Ultra Preset (with Fixed Resolution Quality) | |
| Asus ROG Zephyrus Duo 16 GX650RX | |
| Genomsnitt NVIDIA GeForce RTX 3080 Ti Laptop GPU (44 - 57, n=2) | |
| Gigabyte Aero 16 YE5 | |
| Ghostwire Tokyo | |
| 1920x1080 Highest Settings | |
| Asus ROG Zephyrus Duo 16 GX650RX | |
| Genomsnitt NVIDIA GeForce RTX 3080 Ti Laptop GPU (125 - 143.3, n=2) | |
| Medion Erazer Beast X30 | |
| 3840x2160 Highest Settings | |
| Asus ROG Zephyrus Duo 16 GX650RX | |
| Genomsnitt NVIDIA GeForce RTX 3080 Ti Laptop GPU (n=1) | |
| 1920x1080 Highest Settings + Maximum Ray Tracing | |
| Medion Erazer Beast X30 | |
| Genomsnitt NVIDIA GeForce RTX 3080 Ti Laptop GPU (66.1 - 68.3, n=2) | |
| Asus ROG Zephyrus Duo 16 GX650RX | |
| Tiny Tina's Wonderlands | |
| 1920x1080 Badass Preset (DX12) | |
| Genomsnitt NVIDIA GeForce RTX 3080 Ti Laptop GPU (100.7 - 110.5, n=4) | |
| Asus ROG Zephyrus Duo 16 GX650RX | |
| Medion Erazer Beast X30 | |
| Genomsnitt av klass Gaming (55 - 159.4, n=4, senaste 2 åren) | |
| 3840x2160 Badass Preset (DX12) | |
| Genomsnitt av klass Gaming (n=1senaste 2 åren) | |
| Genomsnitt NVIDIA GeForce RTX 3080 Ti Laptop GPU (40.1 - 43.9, n=2) | |
| Asus ROG Zephyrus Duo 16 GX650RX | |
| Guardians of the Galaxy | |
| 1920x1080 Ultra Preset | |
| MSI GE76 Raider | |
| Genomsnitt NVIDIA GeForce RTX 3080 Ti Laptop GPU (112 - 155, n=3) | |
| Asus ROG Zephyrus Duo 16 GX650RX | |
| 3840x2160 Ultra Preset | |
| MSI GE76 Raider | |
| Genomsnitt NVIDIA GeForce RTX 3080 Ti Laptop GPU (60 - 75, n=2) | |
| Asus ROG Zephyrus Duo 16 GX650RX | |
| 1920x1080 Ultra Preset + Ultra Ray-Tracing | |
| MSI GE76 Raider | |
| Genomsnitt NVIDIA GeForce RTX 3080 Ti Laptop GPU (82 - 104, n=2) | |
| Asus ROG Zephyrus Duo 16 GX650RX | |
| Alan Wake Remastered | |
| 3840x2160 High Preset | |
| MSI GE76 Raider | |
| Genomsnitt NVIDIA GeForce RTX 3080 Ti Laptop GPU (71.6 - 89, n=2) | |
| Asus ROG Zephyrus Duo 16 GX650RX | |
| 1920x1080 High Preset | |
| MSI GE76 Raider | |
| Genomsnitt NVIDIA GeForce RTX 3080 Ti Laptop GPU (118.8 - 155, n=2) | |
| Asus ROG Zephyrus Duo 16 GX650RX | |
| Dying Light 2 | |
| 1920x1080 High Quality Raytracing | |
| Asus ROG Zephyrus Duo 16 GX650RX | |
| Genomsnitt NVIDIA GeForce RTX 3080 Ti Laptop GPU (33.4 - 42.3, n=5) | |
| Gigabyte Aero 16 YE5 | |
| 3840x2160 High Quality | |
| Asus ROG Zephyrus Duo 16 GX650RX | |
| Genomsnitt NVIDIA GeForce RTX 3080 Ti Laptop GPU (27.3 - 31, n=2) | |
| Gigabyte Aero 16 YE5 | |
| 1920x1080 High Quality | |
| Genomsnitt NVIDIA GeForce RTX 3080 Ti Laptop GPU (69.2 - 88.4, n=5) | |
| Asus ROG Zephyrus Duo 16 GX650RX | |
| Gigabyte Aero 16 YE5 | |
För att utvärdera om bildfrekvensen förblir ganska konstant under en längre tidsperiod lät vi spelet"The Witcher 3" köras i cirka 60 minuter i Full-HD-upplösning och maximala kvalitetsinställningar, utan att flytta spelkaraktären. Vi märkte inte av någon nedgång i bildfrekvensen.
The Witcher 3 FPS Chart
| låg | med. | hög | ultra | QHD | 4K | |
|---|---|---|---|---|---|---|
| GTA V (2015) | 180.4 | 175.4 | 158.9 | 101.5 | 92.2 | 101.5 |
| The Witcher 3 (2015) | 345 | 298 | 197.9 | 111.1 | 80.5 | |
| Dota 2 Reborn (2015) | 133.8 | 122.2 | 114.8 | 111.3 | 89.2 | |
| Final Fantasy XV Benchmark (2018) | 177.8 | 138.7 | 108 | 84.6 | 51.4 | |
| X-Plane 11.11 (2018) | 112.9 | 95.1 | 78.2 | 66.1 | ||
| Far Cry 5 (2018) | 146 | 124 | 120 | 111 | 104 | 60 |
| Strange Brigade (2018) | 359 | 229 | 198.8 | 182.4 | 140.2 | 84.5 |
| F1 2021 (2021) | 330 | 275 | 225 | 130.2 | 102.5 | 60 |
| Alan Wake Remastered (2021) | 142.4 | 123.4 | 118.8 | 114.4 | 71.6 | |
| Far Cry 6 (2021) | 116.2 | 100.3 | 90.9 | 71.3 | 75.2 | 46.2 |
| Guardians of the Galaxy (2021) | 118 | 113 | 112 | 112 | 103 | 60 |
| Rainbow Six Extraction (2022) | 243 | 207 | 202 | 169 | 113 | 57 |
| Dying Light 2 (2022) | 106.9 | 88.4 | 77.6 | 55.8 | 31 | |
| Cyberpunk 2077 1.6 (2022) | 136.3 | 119.6 | 98.3 | 99.1 | 53.7 | 25.2 |
| Ghostwire Tokyo (2022) | 148.1 | 146.8 | 143.8 | 143.3 | 110.6 | 59.9 |
| Tiny Tina's Wonderlands (2022) | 192.7 | 167.3 | 128.9 | 104.3 | 73.5 | 40.1 |
Utsläpp - Asus ROG 16 med acceptabel buller- och värmeutveckling
Bullerutsläpp
Under vardaglig drift med kontors- och internetuppgifter tar de två fläktarna det lugnt och producerar endast mycket lite ljud. Ibland är de till och med avstängda. Vid full belastning blir de däremot högljudda med en maximal ljudnivå på 50 dB(A) under stresstestet och 48 dB(A) under Witcher 3 -testet. Även om bullerutvecklingen kan minskas genom att välja profilen "Silent", sker detta på bekostnad av datorprestanda.
Ljudnivå
| Låg belastning |
| 26 / 27 / 29 dB(A) |
| Hög belastning |
| 41 / 50 dB(A) |
 | ||
30 dB tyst 40 dB(A) hörbar 50 dB(A) högt ljud |
||
min: | ||
| Asus ROG Zephyrus Duo 16 GX650RX R9 6900HX, GeForce RTX 3080 Ti Laptop GPU | Apple MacBook Pro 16 2021 M1 Max M1 Max, M1 Max 32-Core GPU | Razer Blade 15 Advanced Model Early 2022 i7-12800H, GeForce RTX 3080 Ti Laptop GPU | MSI GE76 Raider i9-12900HK, GeForce RTX 3080 Ti Laptop GPU | Medion Erazer Beast X30 i9-12900HK, GeForce RTX 3080 Ti Laptop GPU | Gigabyte Aero 16 YE5 i9-12900HK, GeForce RTX 3080 Ti Laptop GPU | |
|---|---|---|---|---|---|---|
| Noise | 10% | 4% | -11% | -8% | -9% | |
| av / miljö * (dB) | 26 | 24.2 7% | 26 -0% | 26 -0% | 26 -0% | 25 4% |
| Idle Minimum * (dB) | 26 | 24.2 7% | 26 -0% | 26 -0% | 27 -4% | 30 -15% |
| Idle Average * (dB) | 27 | 24.2 10% | 27 -0% | 27 -0% | 29 -7% | 32 -19% |
| Idle Maximum * (dB) | 29 | 24.2 17% | 29 -0% | 40 -38% | 34 -17% | 33 -14% |
| Load Average * (dB) | 41 | 42.9 -5% | 37 10% | 50 -22% | 48 -17% | 45 -10% |
| Witcher 3 ultra * (dB) | 48 | 39.5 18% | 44 8% | 53 -10% | 51 -6% | 50 -4% |
| Load Maximum * (dB) | 50 | 42.9 14% | 45 10% | 53 -6% | 53 -6% | 52 -4% |
* ... mindre är bättre
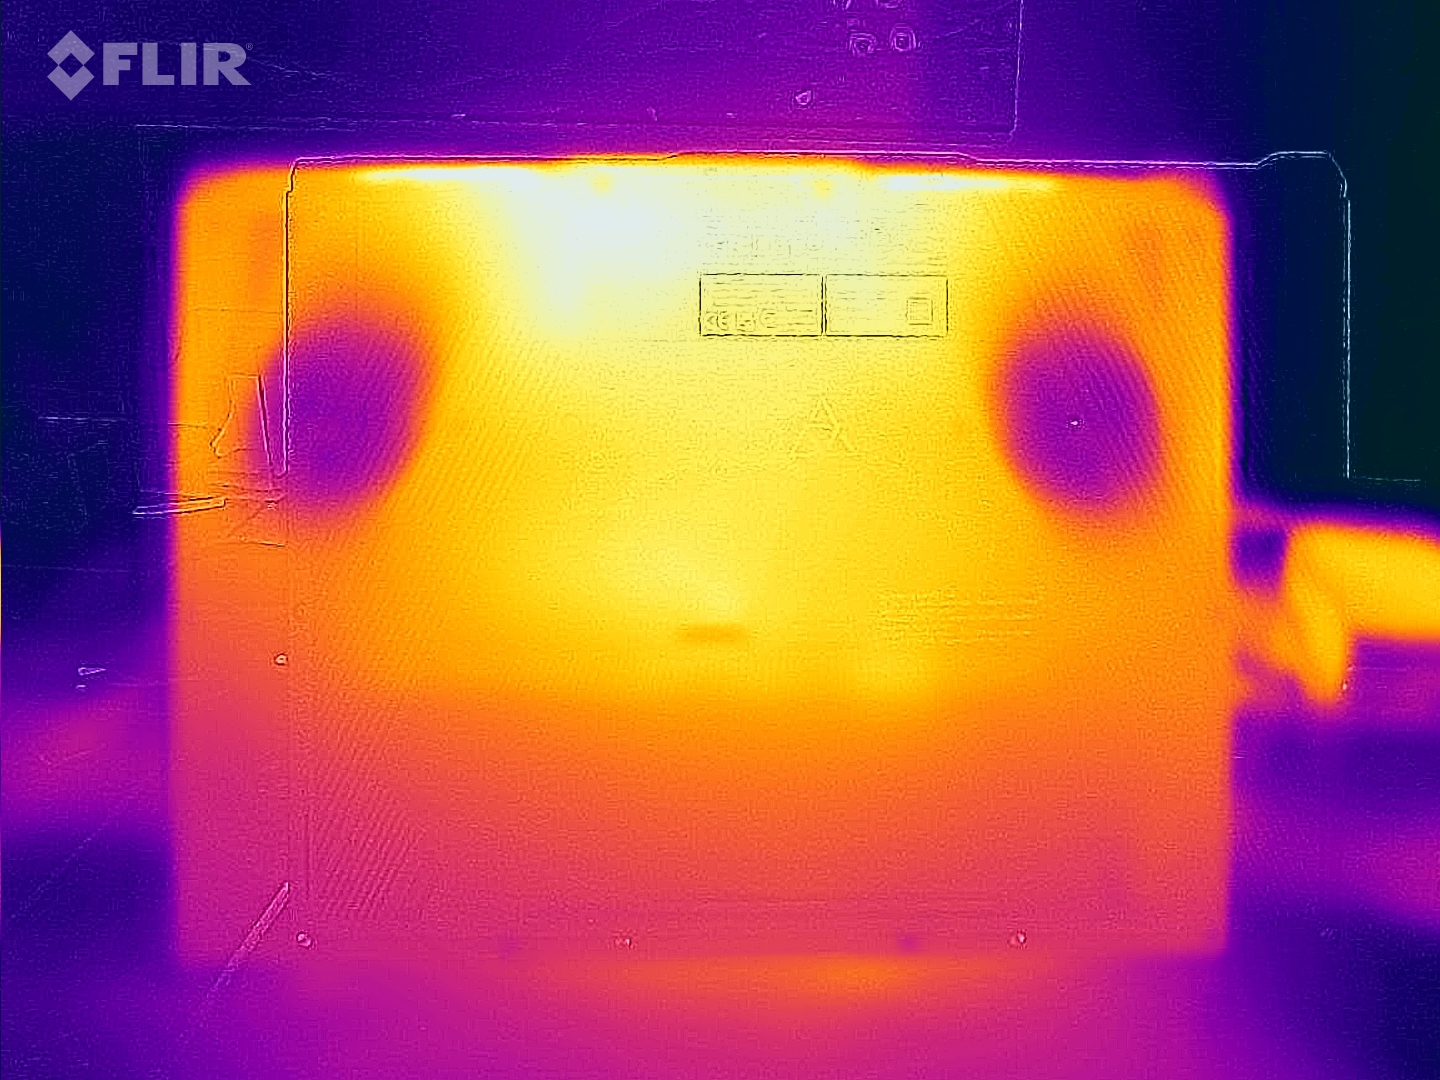
Temperaturer
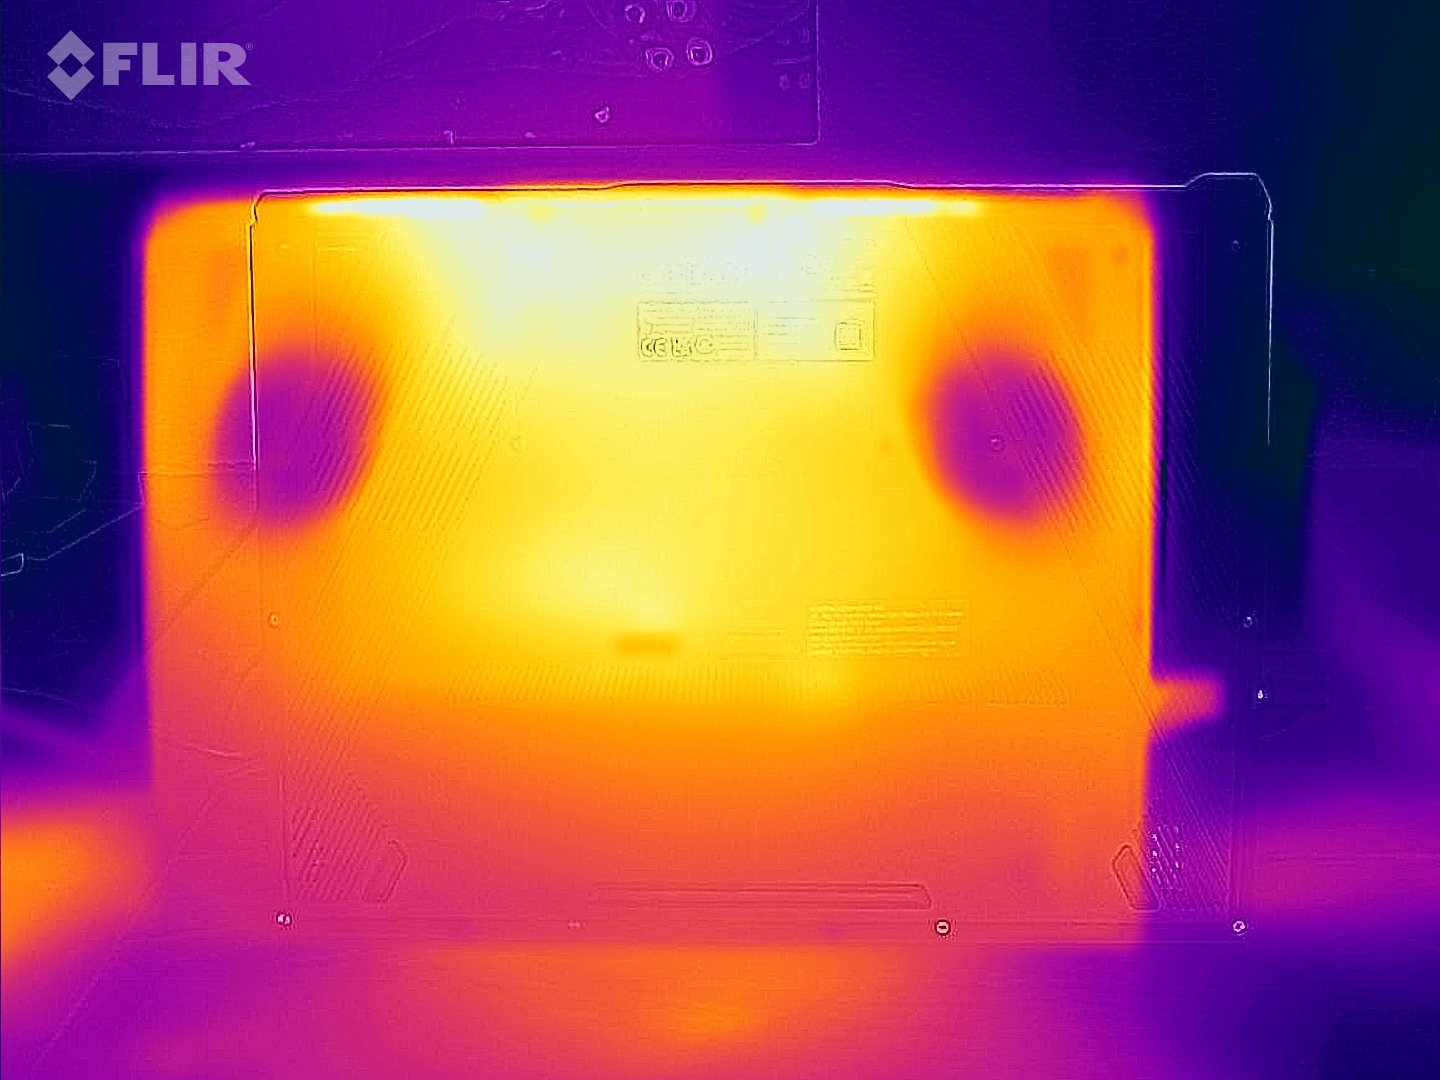
Under daglig drift (kontor, Internet) håller sig temperaturerna inom det gröna intervallet. Under belastning (stresstest, Witcher 3 test) värms den bärbara datorn upp utan att bli överdrivet varm. CPU-temperaturerna ligger inom acceptabla nivåer.
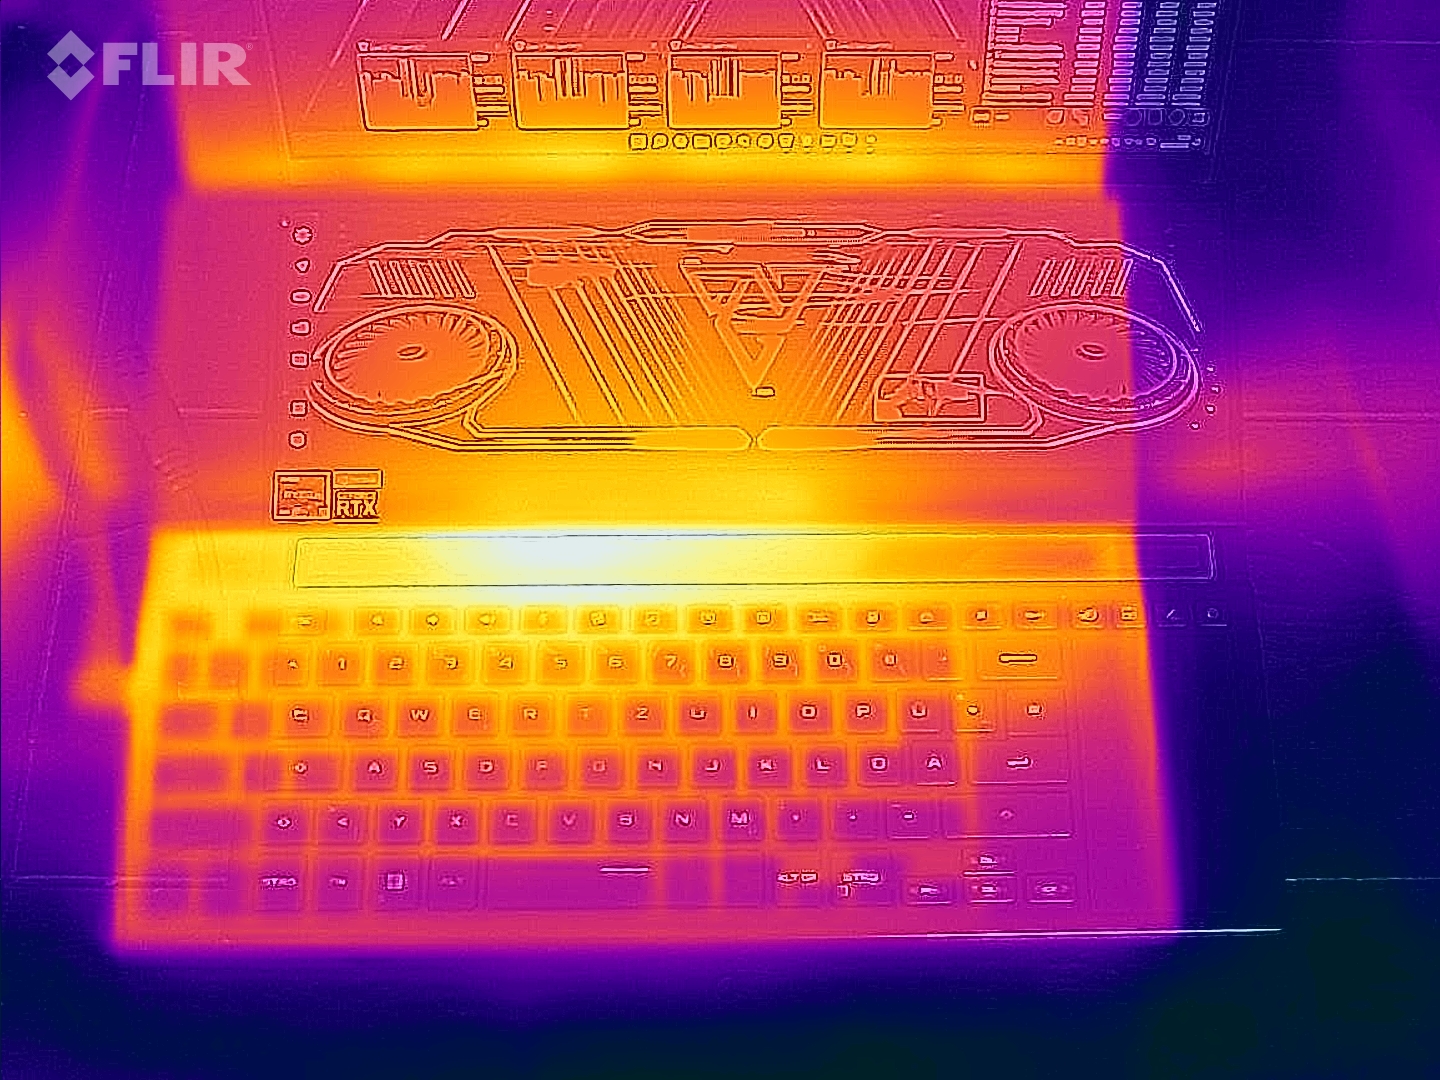
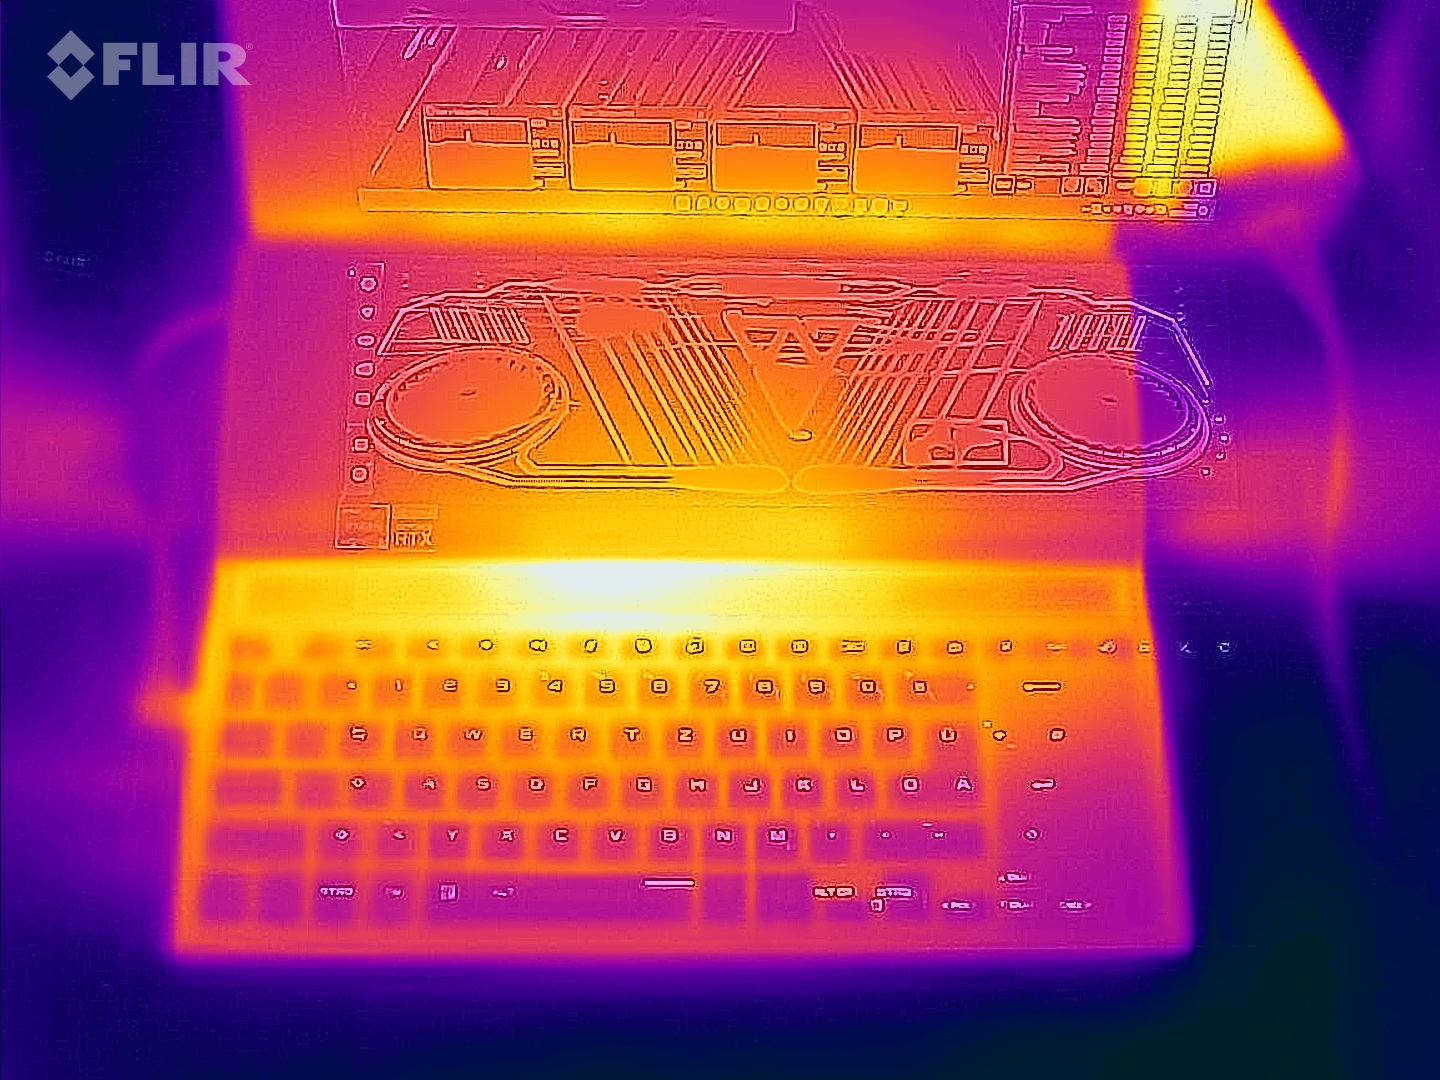
(±) Den maximala temperaturen på ovansidan är 45 °C / 113 F, jämfört med genomsnittet av 40.4 °C / 105 F , allt från 21.2 till 68.8 °C för klassen Gaming.
(-) Botten värms upp till maximalt 50 °C / 122 F, jämfört med genomsnittet av 43.2 °C / 110 F
(+) Vid tomgångsbruk är medeltemperaturen för ovansidan 29.8 °C / 86 F, jämfört med enhetsgenomsnittet på 33.9 °C / ### class_avg_f### F.
(-) När du spelar The Witcher 3 är medeltemperaturen för ovansidan 40.1 °C / 104 F, jämfört med enhetsgenomsnittet på 33.9 °C / ## #class_avg_f### F.
(-) Handledsstöden och pekplattan kan bli väldigt varma vid beröring med maximalt 42 °C / 107.6 F.
(-) Medeltemperaturen för handledsstödsområdet på liknande enheter var 28.8 °C / 83.8 F (-13.2 °C / -23.8 F).
| Asus ROG Zephyrus Duo 16 GX650RX AMD Ryzen 9 6900HX, NVIDIA GeForce RTX 3080 Ti Laptop GPU | Apple MacBook Pro 16 2021 M1 Max Apple M1 Max, Apple M1 Max 32-Core GPU | Razer Blade 15 Advanced Model Early 2022 Intel Core i7-12800H, NVIDIA GeForce RTX 3080 Ti Laptop GPU | MSI GE76 Raider Intel Core i9-12900HK, NVIDIA GeForce RTX 3080 Ti Laptop GPU | Medion Erazer Beast X30 Intel Core i9-12900HK, NVIDIA GeForce RTX 3080 Ti Laptop GPU | Gigabyte Aero 16 YE5 Intel Core i9-12900HK, NVIDIA GeForce RTX 3080 Ti Laptop GPU | |
|---|---|---|---|---|---|---|
| Heat | 20% | -12% | -1% | -13% | -5% | |
| Maximum Upper Side * (°C) | 45 | 42.3 6% | 53 -18% | 43 4% | 55 -22% | 49 -9% |
| Maximum Bottom * (°C) | 50 | 41.7 17% | 53 -6% | 47 6% | 62 -24% | 55 -10% |
| Idle Upper Side * (°C) | 33 | 23.9 28% | 36 -9% | 33 -0% | 32 3% | 33 -0% |
| Idle Bottom * (°C) | 33 | 23.9 28% | 38 -15% | 37 -12% | 36 -9% | 33 -0% |
* ... mindre är bättre
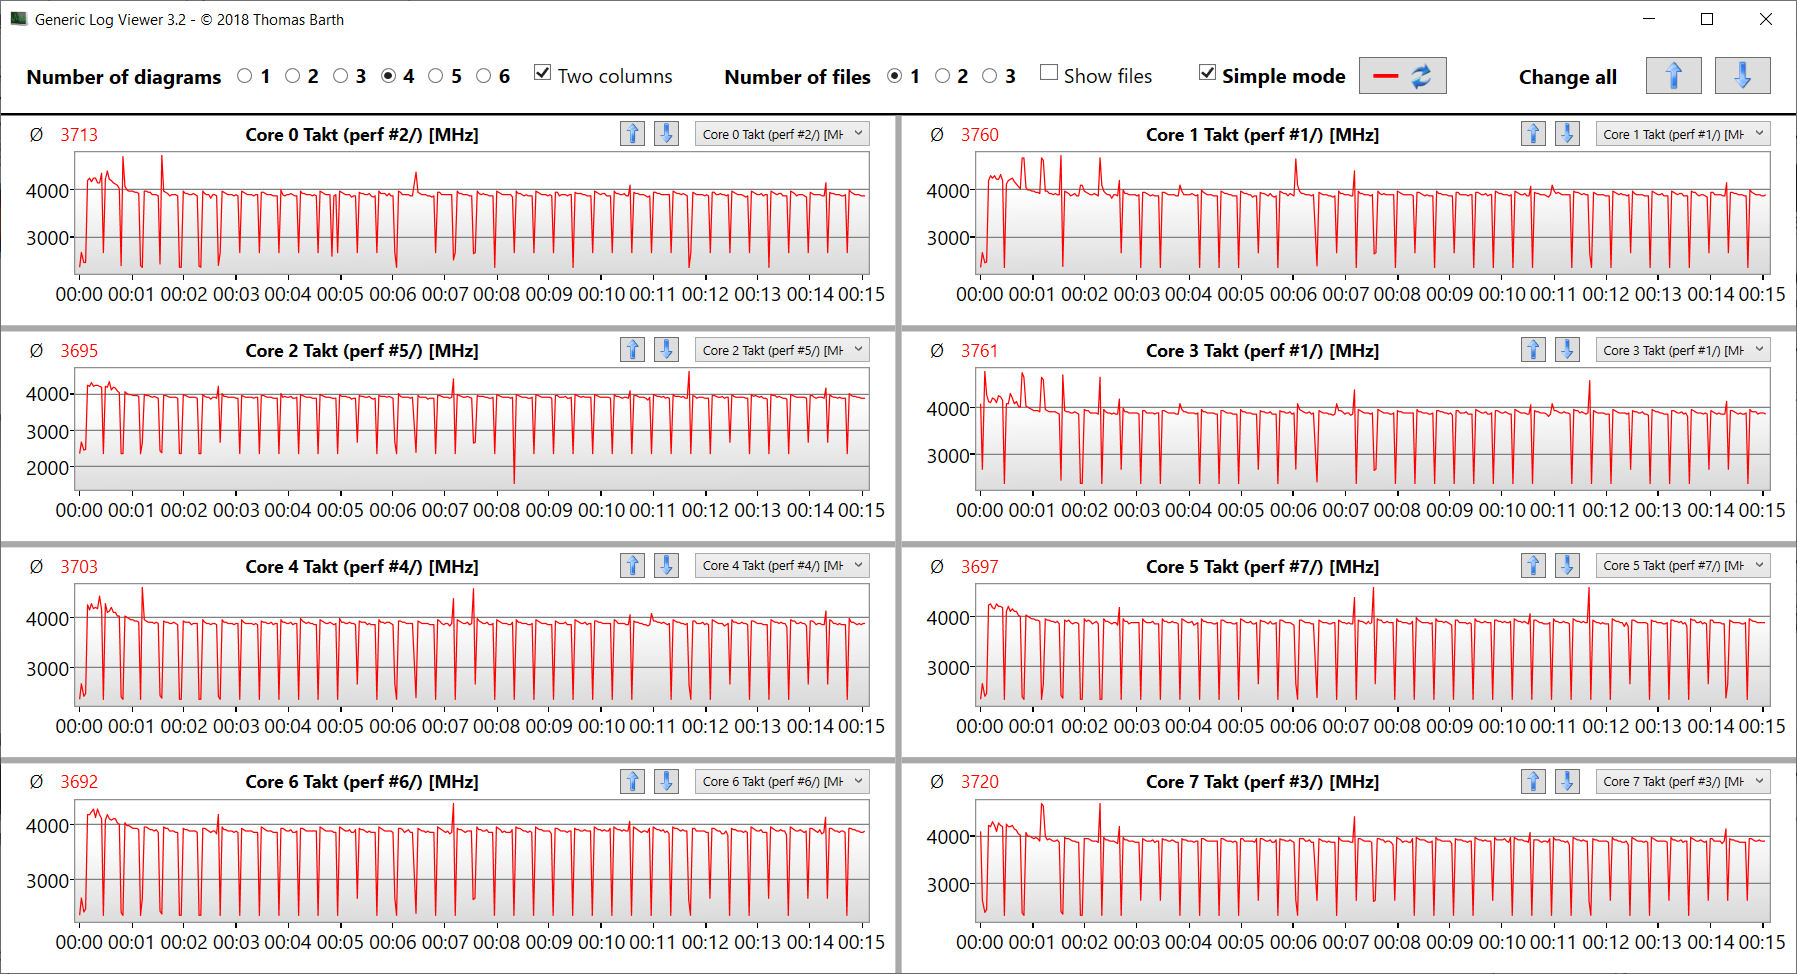
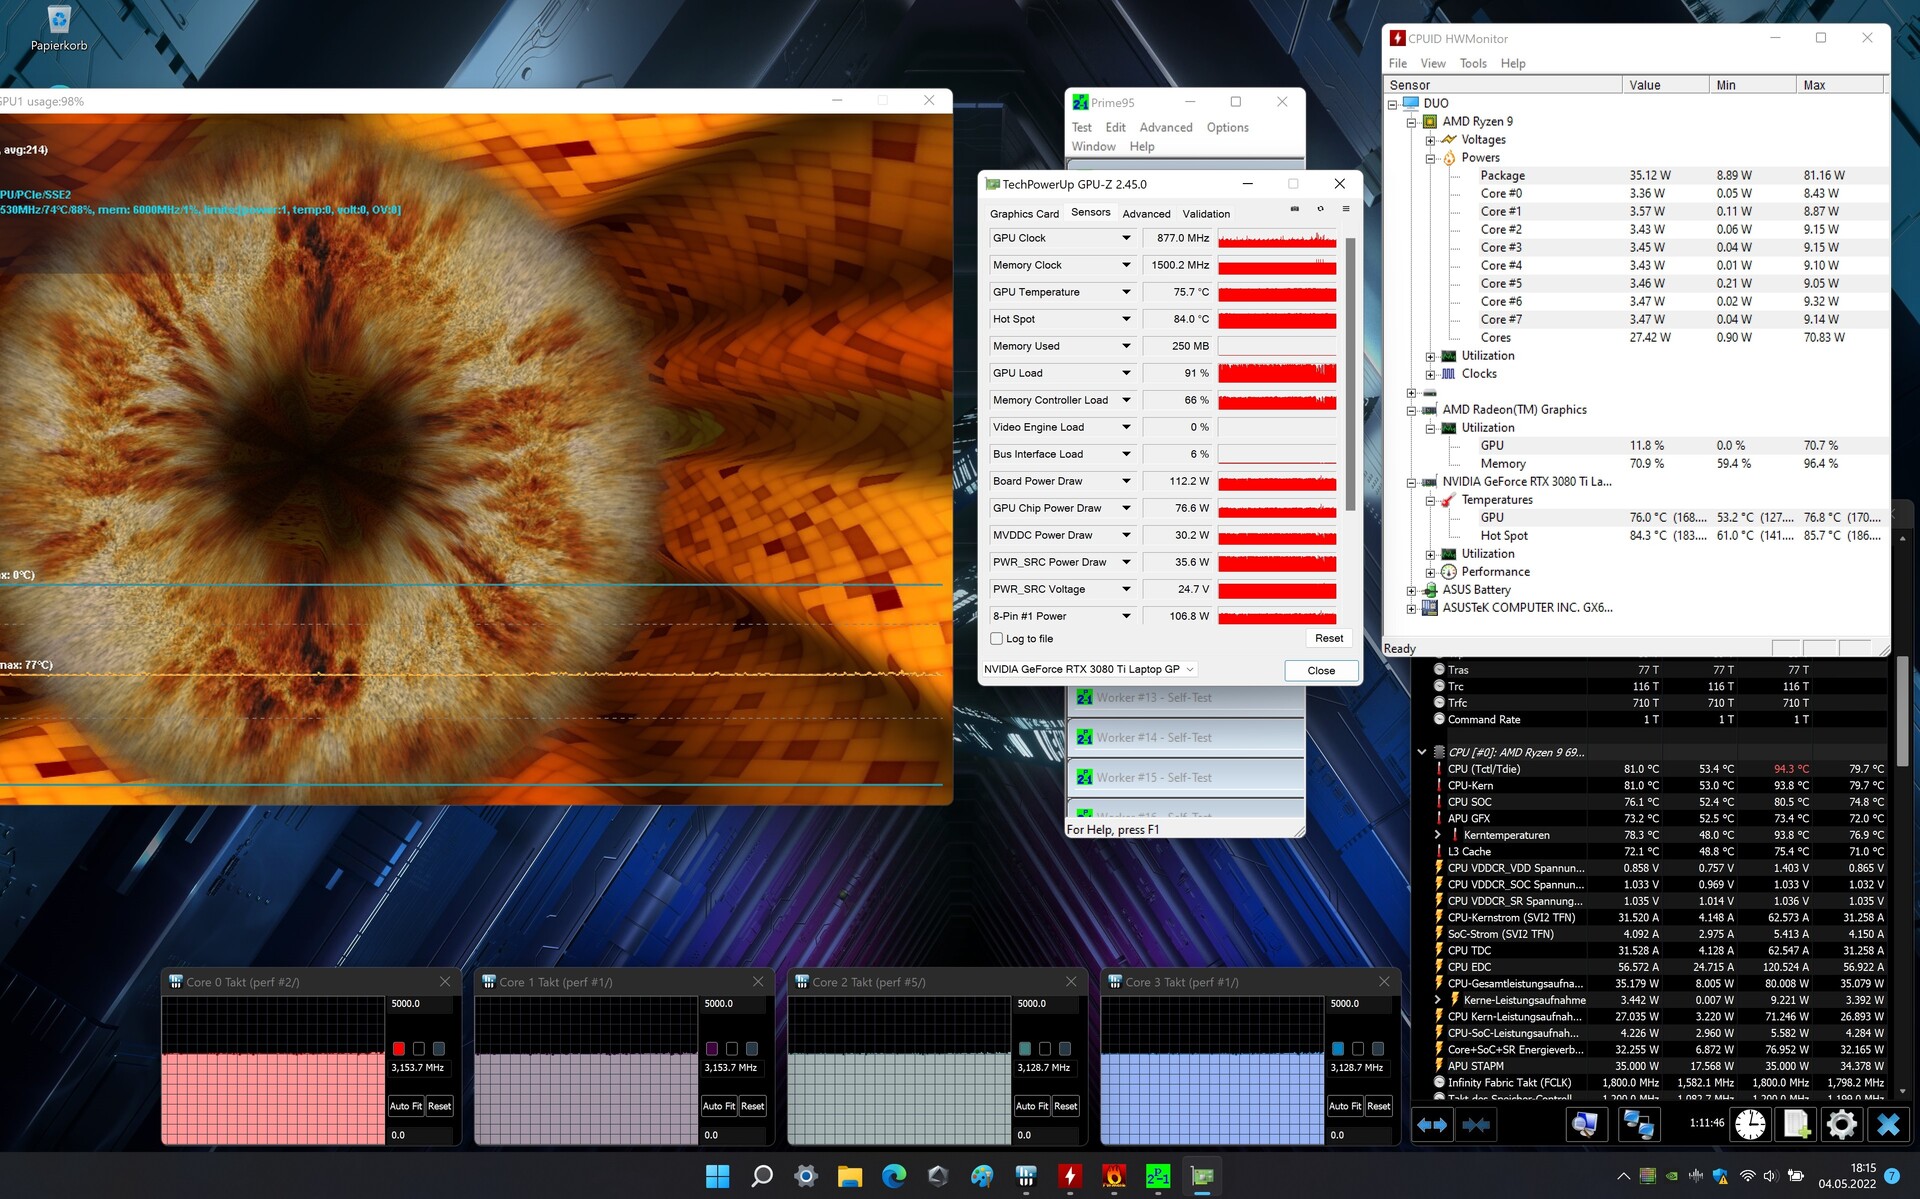
Stresstest
I början av stresstestet med Prime95 och Furmark igång i minst en timme körs CPU:n (4-4,1 GHz) och GPU:n (1 000-1 600 MHz) med höga klockfrekvenser. Fortsättningsvis sjunker värdena till mellan 3 och 3,1 GHz (CPU) och mellan 850 och 900 MHz (GPU). Stresstestet representerar ett extremt scenario, och vi använder detta test för att utvärdera om systemet förblir stabilt under full belastning.
Högtalare
Stereohögtalarna ger ett hyfsat ljud, även om det skulle behöva mer bas. För en bättre ljudupplevelse rekommenderas hörlurar eller externa högtalare.
Asus ROG Zephyrus Duo 16 GX650RX ljudanalys
(±) | högtalarljudstyrkan är genomsnittlig men bra (80 dB)
Bas 100 - 315 Hz
(±) | reducerad bas - i genomsnitt 8.9% lägre än medianen
(±) | linjäriteten för basen är genomsnittlig (12.4% delta till föregående frekvens)
Mellan 400 - 2000 Hz
(±) | högre mellan - i genomsnitt 6.8% högre än median
(+) | mids är linjära (4.3% delta till föregående frekvens)
Högsta 2 - 16 kHz
(±) | reducerade toppar - i genomsnitt 6% lägre än medianen
(±) | linjäriteten för toppar är genomsnittlig (7.3% delta till föregående frekvens)
Totalt 100 - 16 000 Hz
(±) | linjäriteten för det totala ljudet är genomsnittlig (16.5% skillnad mot median)
Jämfört med samma klass
» 42% av alla testade enheter i den här klassen var bättre, 7% liknande, 51% sämre
» Den bästa hade ett delta på 6%, genomsnittet var 18%, sämst var 132%
Jämfört med alla testade enheter
» 28% av alla testade enheter var bättre, 6% liknande, 66% sämre
» Den bästa hade ett delta på 4%, genomsnittet var 23%, sämst var 134%
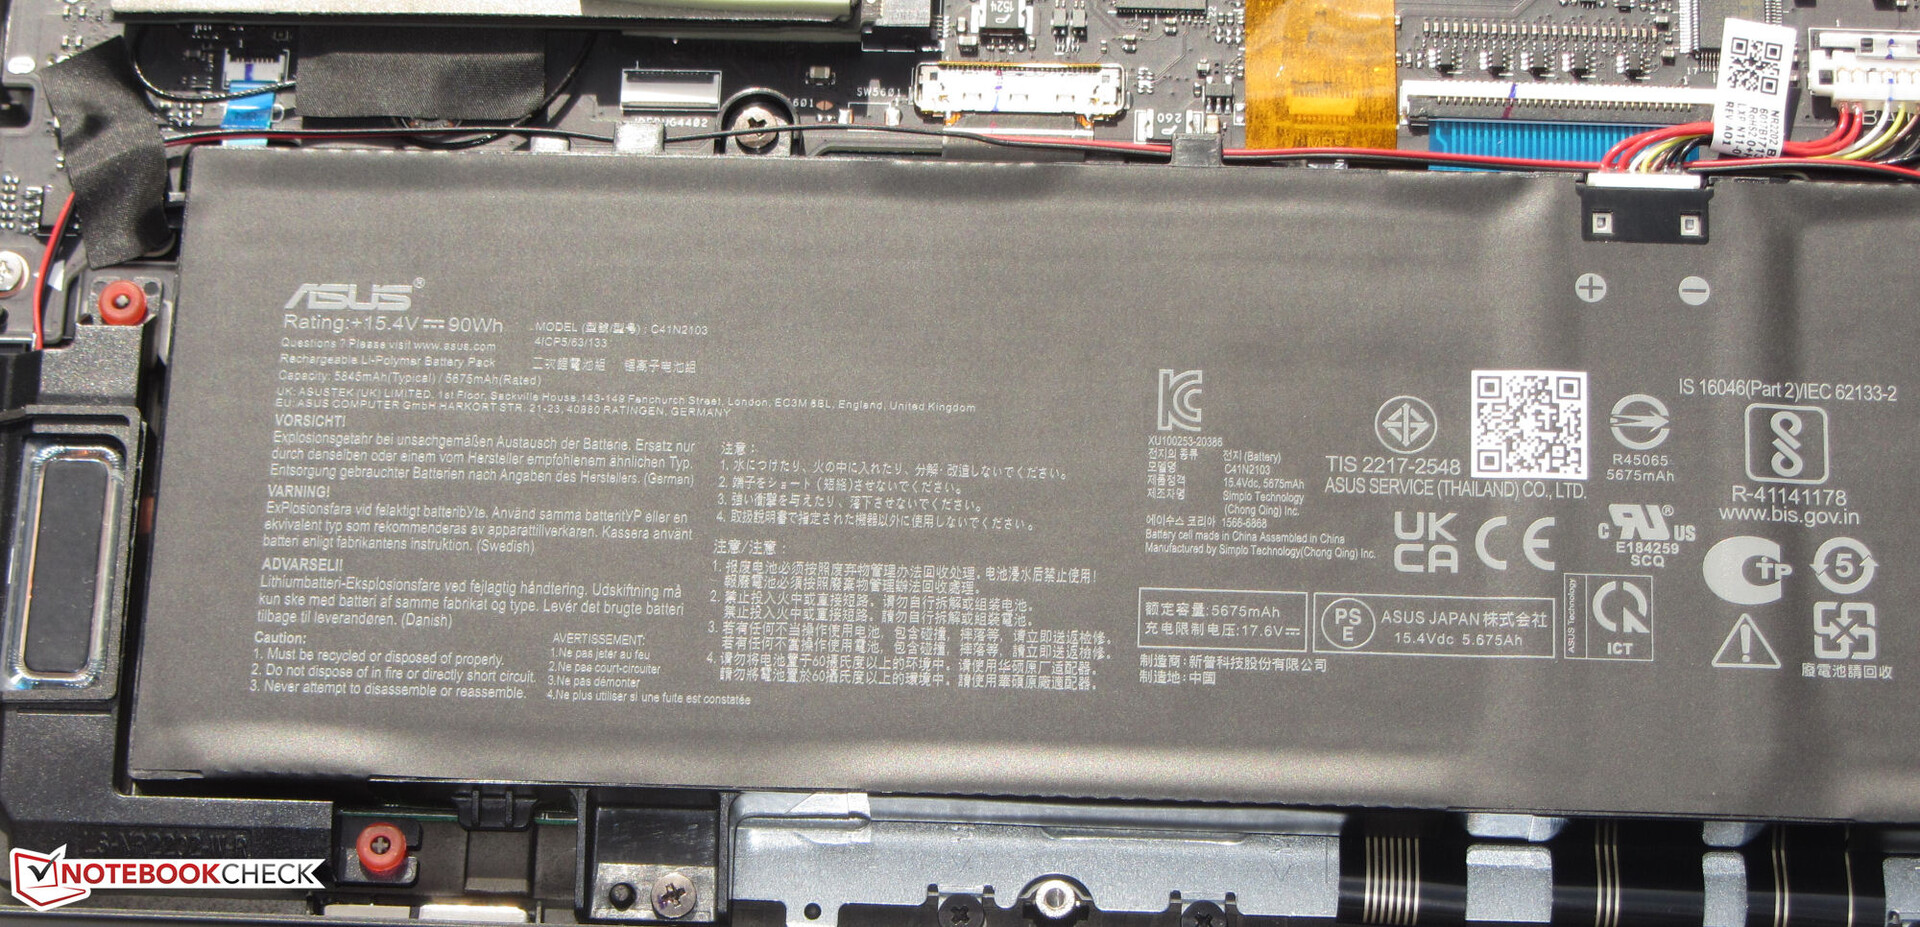
Energihantering - Zephyrus Duo har en bra batteritid
Effektförbrukning
Vid tomgångsdrift har GX650 en något högre strömförbrukning än de flesta andra Windows-konkurrenter. Ingen av de andra konkurrenterna kan dock nå upp till de låga värdena för MacBook Pro 16. Stresstestet eller Witcher-3-testet leder till att Zephyrus förbrukning ökar upp till maximalt 256 watt eller 186,5 watt i genomsnitt, vilket är normala värden för den hårdvara som används här. Medan strömförbrukningen förblir konstant under Witcher 3 -testet, sjunker den något under stresstestet. Det medföljande nätaggregatet är dimensionerat till 280 watt och är tillräckligt stort.
| Av/Standby | |
| Låg belastning | |
| Hög belastning |
|
Förklaring:
min: | |
| Asus ROG Zephyrus Duo 16 GX650RX R9 6900HX, GeForce RTX 3080 Ti Laptop GPU | Apple MacBook Pro 16 2021 M1 Max M1 Max, M1 Max 32-Core GPU | Razer Blade 15 Advanced Model Early 2022 i7-12800H, GeForce RTX 3080 Ti Laptop GPU | MSI GE76 Raider i9-12900HK, GeForce RTX 3080 Ti Laptop GPU | Medion Erazer Beast X30 i9-12900HK, GeForce RTX 3080 Ti Laptop GPU | Gigabyte Aero 16 YE5 i9-12900HK, GeForce RTX 3080 Ti Laptop GPU | Genomsnitt av klass Gaming | |
|---|---|---|---|---|---|---|---|
| Power Consumption | 42% | 16% | 4% | 9% | -15% | 13% | |
| Idle Minimum * (Watt) | 19 | 5.4 72% | 17 11% | 12 37% | 12 37% | 26 -37% | 13.1 ? 31% |
| Idle Average * (Watt) | 24 | 16.4 32% | 19 21% | 17 29% | 16 33% | 30 -25% | 19 ? 21% |
| Idle Maximum * (Watt) | 31 | 16.7 46% | 25 19% | 28 10% | 22 29% | 37 -19% | 24.6 ? 21% |
| Load Average * (Watt) | 104 | 94 10% | 108 -4% | 118 -13% | 118 -13% | 127 -22% | 111.3 ? -7% |
| Witcher 3 ultra * (Watt) | 186.5 | 104 44% | 150 20% | 252 -35% | 223 -20% | 176 6% | |
| Load Maximum * (Watt) | 256 | 135 47% | 179 30% | 272 -6% | 290 -13% | 236 8% | 260 ? -2% |
* ... mindre är bättre
Power Consumption The Witcher 3 / Stress Test
Power Consumption With External Monitor
Batteritid
I WLAN-testet där webbplatser laddas via skript och i videotestet där kortfilmen Big Buck Bunny (H.264-kodning, FHD) körs i en konstant slinga håller den bärbara 16-tums datorn i 7:49 timmar respektive 9:19 timmar. Under båda testerna är den bärbara datorns energisparfunktioner inaktiverade och skärmens ljusstyrka justerad till cirka 150 cd/m². När videotestet körs är kommunikationsmodulerna också avstängda.
| Asus ROG Zephyrus Duo 16 GX650RX R9 6900HX, GeForce RTX 3080 Ti Laptop GPU, 90 Wh | Apple MacBook Pro 16 2021 M1 Max M1 Max, M1 Max 32-Core GPU, 99.6 Wh | Razer Blade 15 Advanced Model Early 2022 i7-12800H, GeForce RTX 3080 Ti Laptop GPU, 80 Wh | MSI GE76 Raider i9-12900HK, GeForce RTX 3080 Ti Laptop GPU, 99.99 Wh | Medion Erazer Beast X30 i9-12900HK, GeForce RTX 3080 Ti Laptop GPU, 91.2 Wh | Gigabyte Aero 16 YE5 i9-12900HK, GeForce RTX 3080 Ti Laptop GPU, 99 Wh | Genomsnitt av klass Gaming | |
|---|---|---|---|---|---|---|---|
| Batteridrifttid | 61% | -2% | -35% | 11% | -2% | -2% | |
| Reader / Idle (h) | 12.5 | 8.1 -35% | 7.7 -38% | 8.9 -29% | 7.84 ? -37% | ||
| H.264 (h) | 9.3 | 17 83% | 5.9 -37% | 6.4 -31% | 7.5 -19% | 8.27 ? -11% | |
| WiFi v1.3 (h) | 7.8 | 14.9 91% | 4.9 -37% | 5.1 -35% | 5.7 -27% | 6.4 -18% | 7.08 ? -9% |
| Load (h) | 1 | 1.1 10% | 2 100% | 2.4 140% | 1.6 60% | 1.496 ? 50% |
För
Emot
Omdöme - En kraftfull bärbar dator för det kreativa segmentet
Asus marknadsför Zephyrus främst som en bärbar dator för spel, men konceptet för den bärbara datorn är också inriktat på innehållsskapare: Video- och bildbehandling, rendering och givetvis även spelande är de centrala disciplinerna. 4k-spel är möjligt i höga till maximala inställningar.
Även om Screenpad Plus bör erbjuda ett visst mervärde i vissa scenarier ökar också datorns vikt, inköpspris och storlek.
ARyzen 9-6900HXaPU och GeForce RTX 3080-Ti bärbar datorgPU levererar den nödvändiga datorprestandan, och båda komponenterna körs med en konstant, hög klockfrekvens. Två PCIe 4 SSD-enheter (RAID 0) garanterar korta laddningstider och erbjuder mycket lagringsutrymme (4 TB). Hela paketet avrundas av 64 GB arbetsminne.
Buller- och värmeutvecklingen under belastning ligger på den vanliga nivån för den här klassen av bärbara datorer. Under daglig drift förblir den bärbara datorn dock mycket tyst. Den bra 16-tumsskärmen i formatet 16:10 poängterar med en utmärkt färgåtergivning (Pantone-certifiering) och täcker DCI-P3-färgrymden helt och hållet.
Trots den höga datorprestandan behöver du inte leva med en kort batteritid. En batteriladdning (90 Wh) räcker för en WLAN-drifttid på nästan 8 timmar. En annan positiv punkt är möjligheten att ladda batteriet med en universell USB-C-laddare (45 watt min.), eftersom den vänstra USB-C Gen 2-porten också stöder Power Delivery. Det innebär att du inte nödvändigtvis behöver ta med dig det rejäla nätaggregatet på 280 watt.
Ett alternativ till Zephyrus skulle vara följande Gigabyte Aero 16, som erbjuder en högre CPU-prestanda och en Thunderbolt 4-port. Nackdelarna är en sämre batteritid, en reflekterande skärm och mer värmeutveckling. Om du behöver en kraftfull datorprestanda och en så lång batteritid som möjligt kan du knappast komma förbi Apple MacBook Pro 16. Å andra sidan kan du då varken byta ut eller utöka SSD-enheten eller arbetsminnet. Dessutom använder MacBook också en reflekterande skärm.
Pris och tillgänglighet
ROG Zephyrus Duo 16 GX650RX är redan listad på Asus amerikanska webbplatsvid tidpunkten för detta test, finns det andra onlinebutiker som CDW (4097 dollar) och B&H Photo ($4000) visar att den inte finns i lager ännu.
Asus ROG Zephyrus Duo 16 GX650RX
- 05/23/2022 v7 (old)
Sascha Mölck
Price comparison

