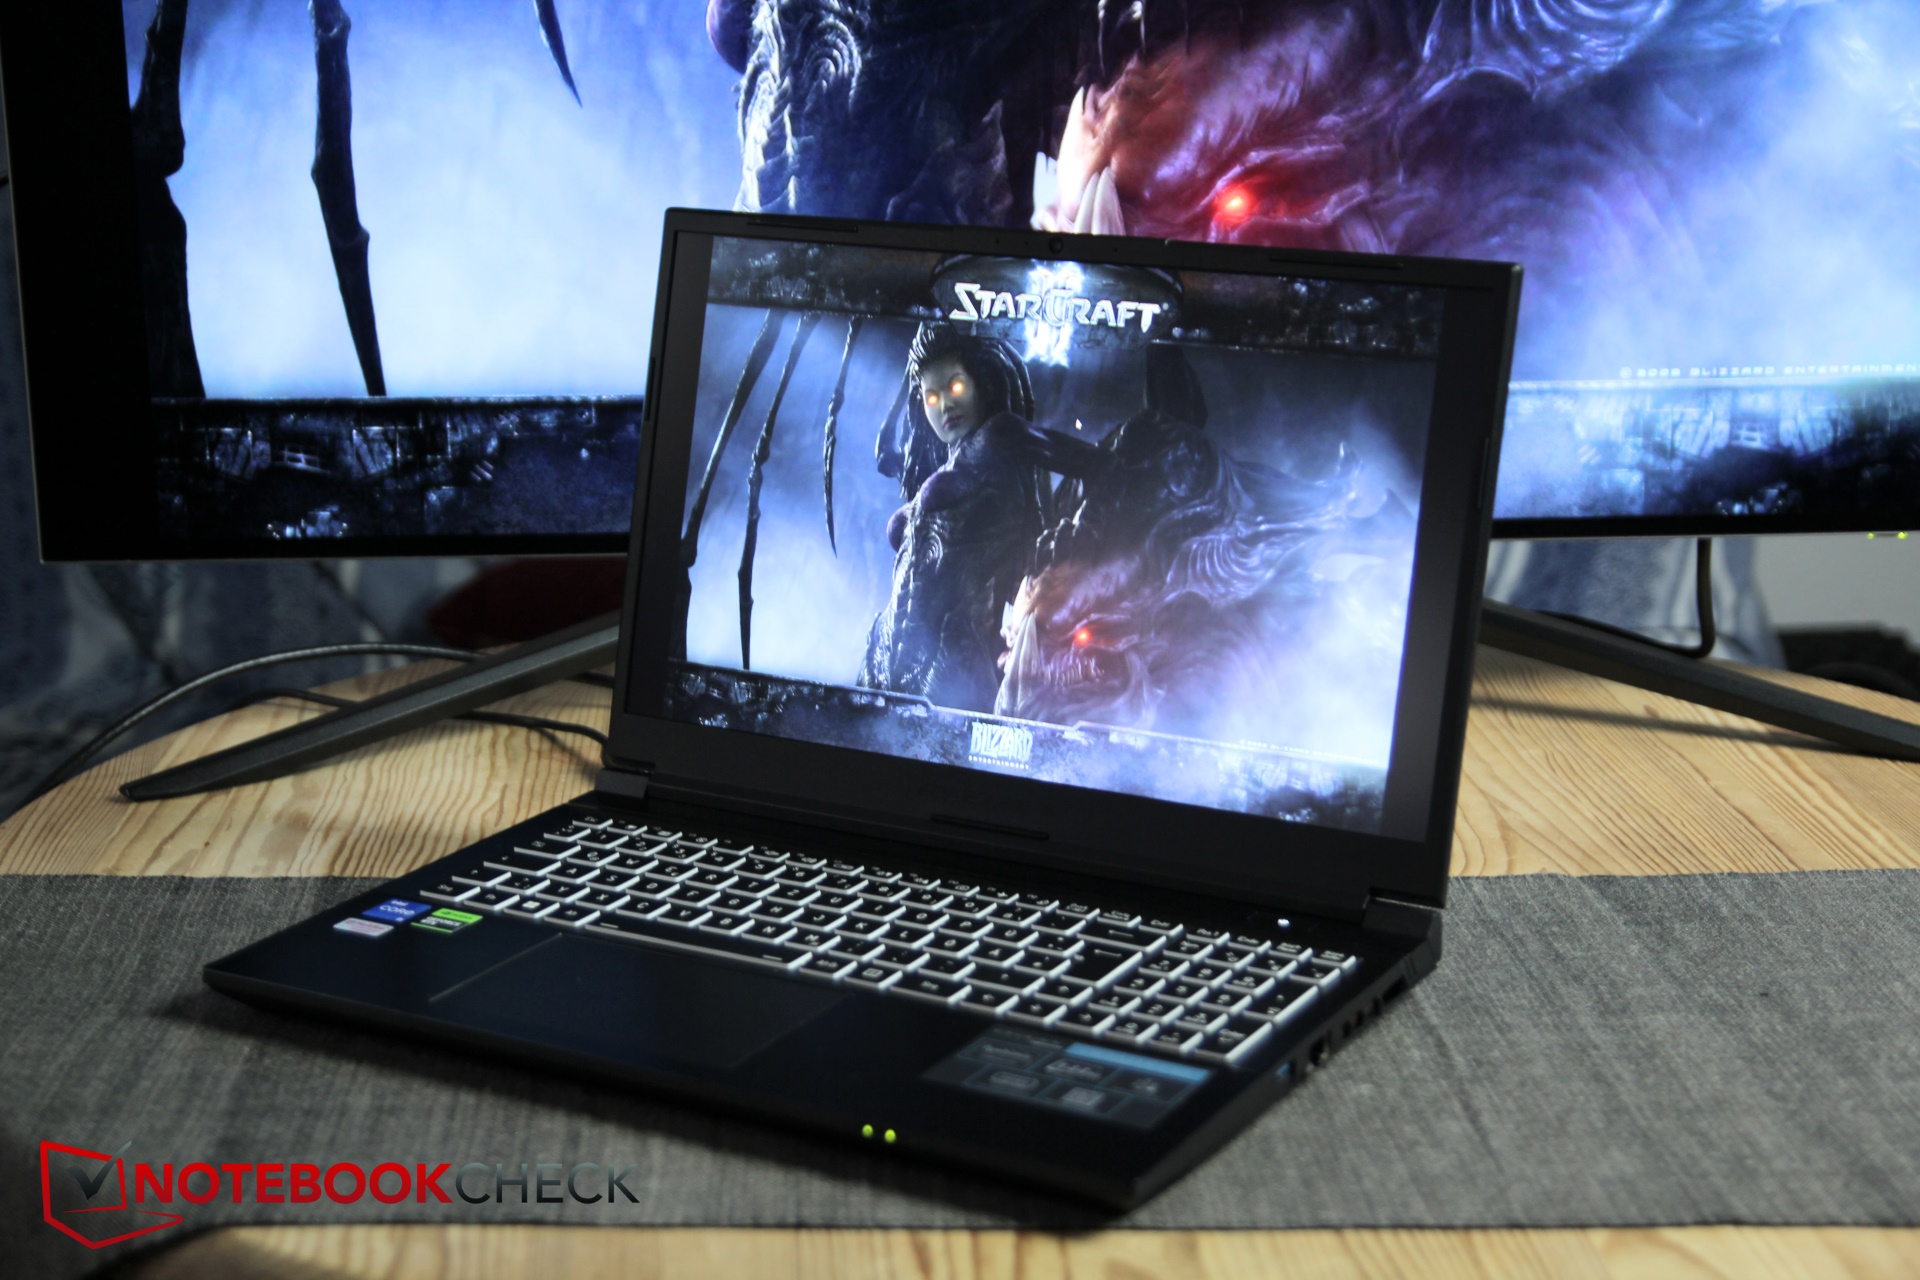
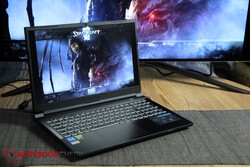
Medion Erazer Crawler E40 laptop recension: Prisvärd gamer med bra RTX 4050-prestanda

Medion Erazer Crawler E40 ersätter E30 (med Intel Gen12 och RTX 30xx) och tar serien upp till den senaste tekniken med Intel Gen 13 och RTX 4050. Priset för denna bärbara speldator på instegsnivå är för närvarande strax under ~1100 USD.
Medion Erazer Crawler E40 konkurrerar med andra bärbara speldatorer på budgetnivå och möter rivaler som t.ex Lenovo LOQ 15, den Asus TUF Gaming A15, den XMG Apex 15eller MSI Katana 15.
Medion samlar många modeller under varumärket "Erazer", vilket gör det svårt att hålla reda på dem alla. Medan andra tillverkare organiserar serier där de kombinerar olika konfigurationer i samma hölje, verkar Medion tro att varje konfiguration motiverar ett nytt serienamn. Erazer Crawler E40 finns bara tillgänglig i denna specifika konfiguration och säljs därför bara som denna modell. Det finns inga alternativ vad gäller CPU, GPU eller skärm.
Andra Medion Erazer-modeller som vi tidigare har testat inkluderar:
Potentiella konkurrenter i jämförelse
Gradering | Datum | Modell | Vikt | Höjd | Storlek | Upplösning | Pris |
|---|---|---|---|---|---|---|---|
| 85.4 % v7 (old) | 12/2023 | Medion Erazer Crawler E40 - MD 62518 i5-13500H, GeForce RTX 4050 Laptop GPU | 2.3 kg | 28 mm | 15.60" | 1920x1080 | |
| 85.9 % v7 (old) | 10/2023 | Lenovo LOQ 15IRH8 Core i7 i7-13620H, GeForce RTX 4050 Laptop GPU | 2.4 kg | 25.2 mm | 15.60" | 2560x1440 | |
| 86.3 % v7 (old) | 06/2023 | Asus TUF A15 FA507 R7 7735HS, GeForce RTX 4050 Laptop GPU | 2.2 kg | 24.9 mm | 15.60" | 1920x1080 | |
| 86.2 % v7 (old) | 10/2023 | Schenker XMG Apex 15 (Late 23) R7 7840HS, GeForce RTX 4050 Laptop GPU | 2.2 kg | 26.7 mm | 15.60" | 2560x1440 | |
| 82.9 % v7 (old) | 03/2023 | MSI Katana 15 B12VEK i7-12650H, GeForce RTX 4050 Laptop GPU | 2.3 kg | 24.9 mm | 15.60" | 1920x1080 |
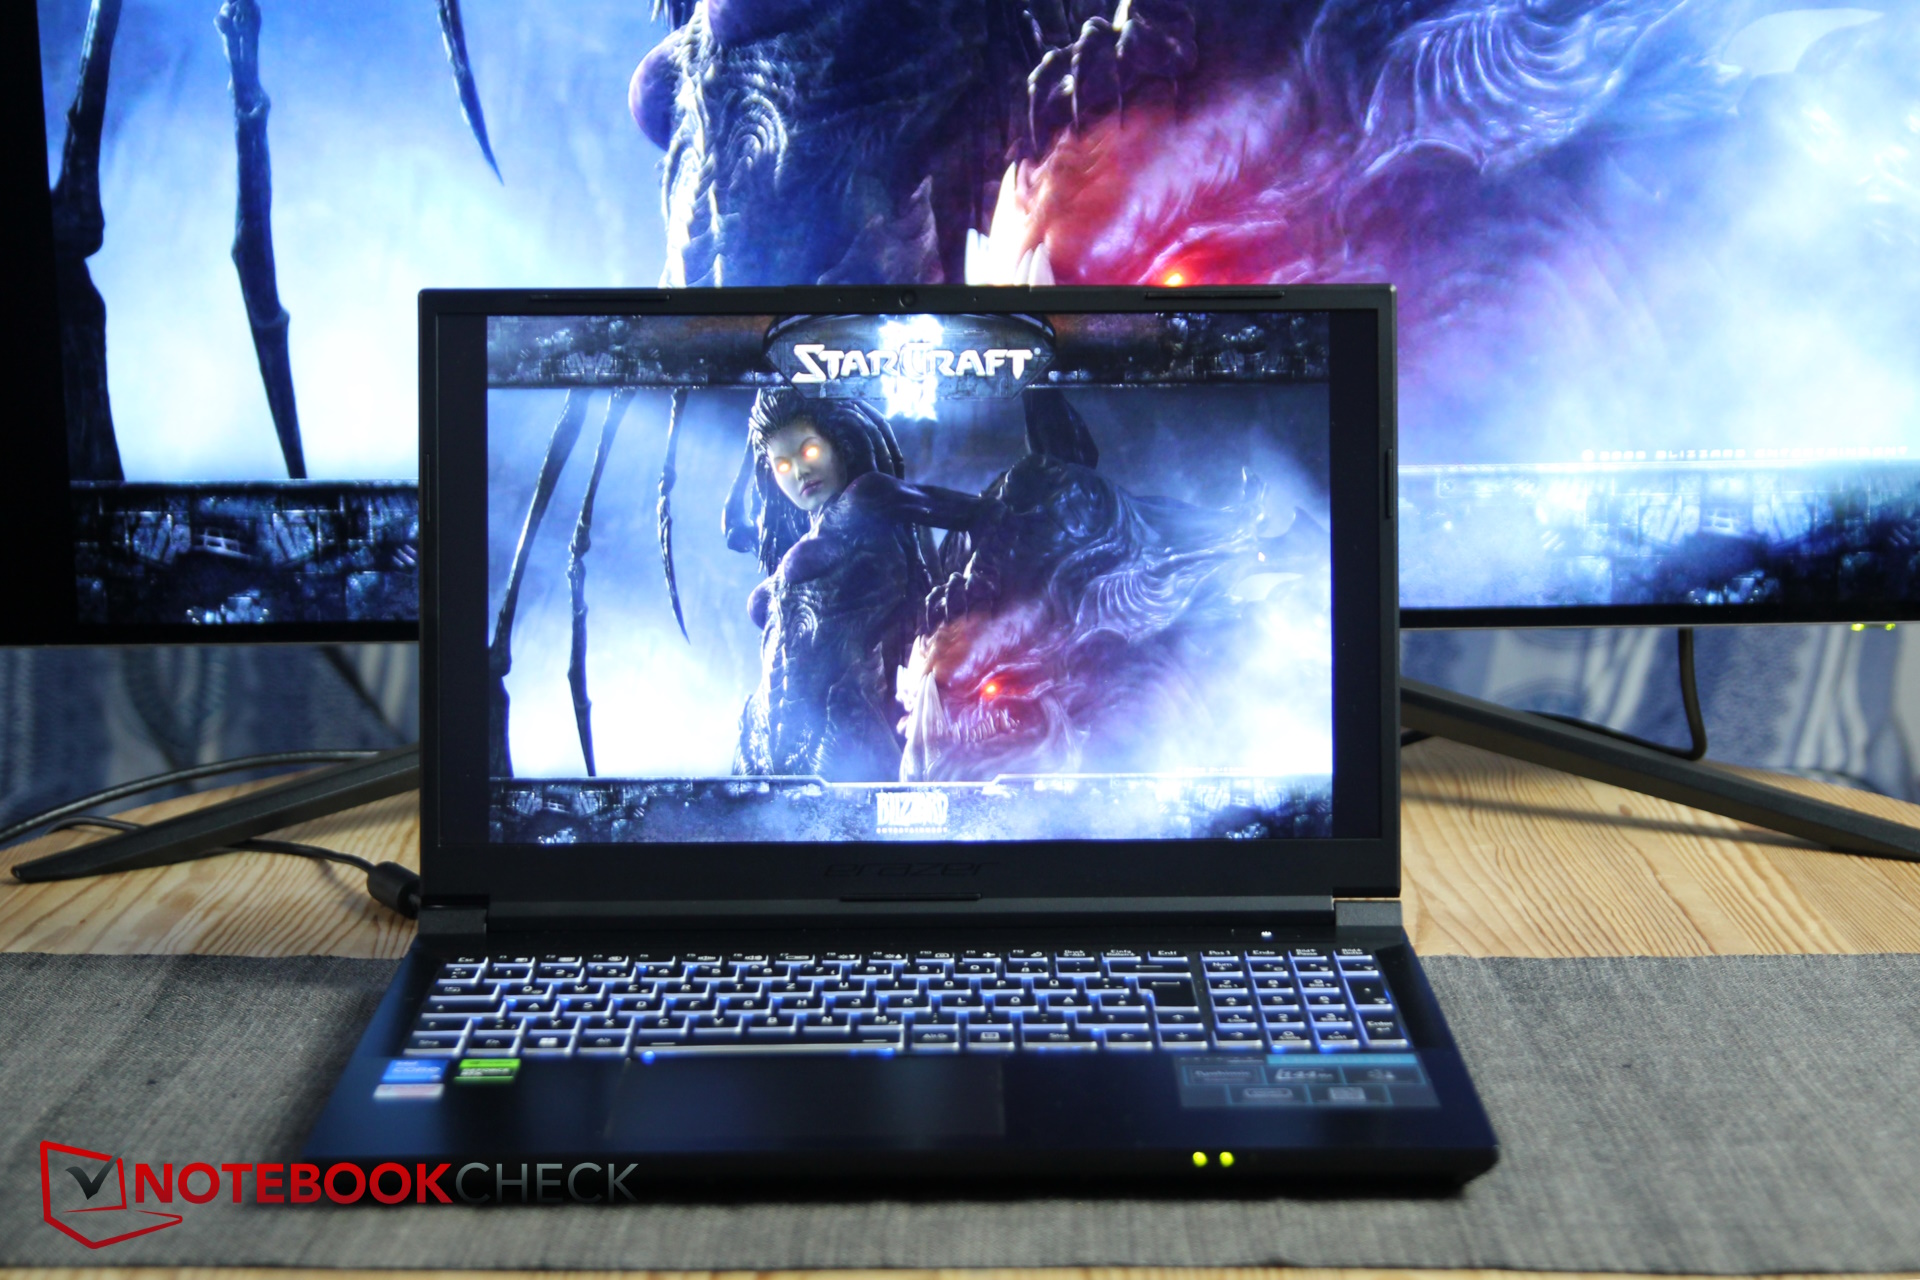
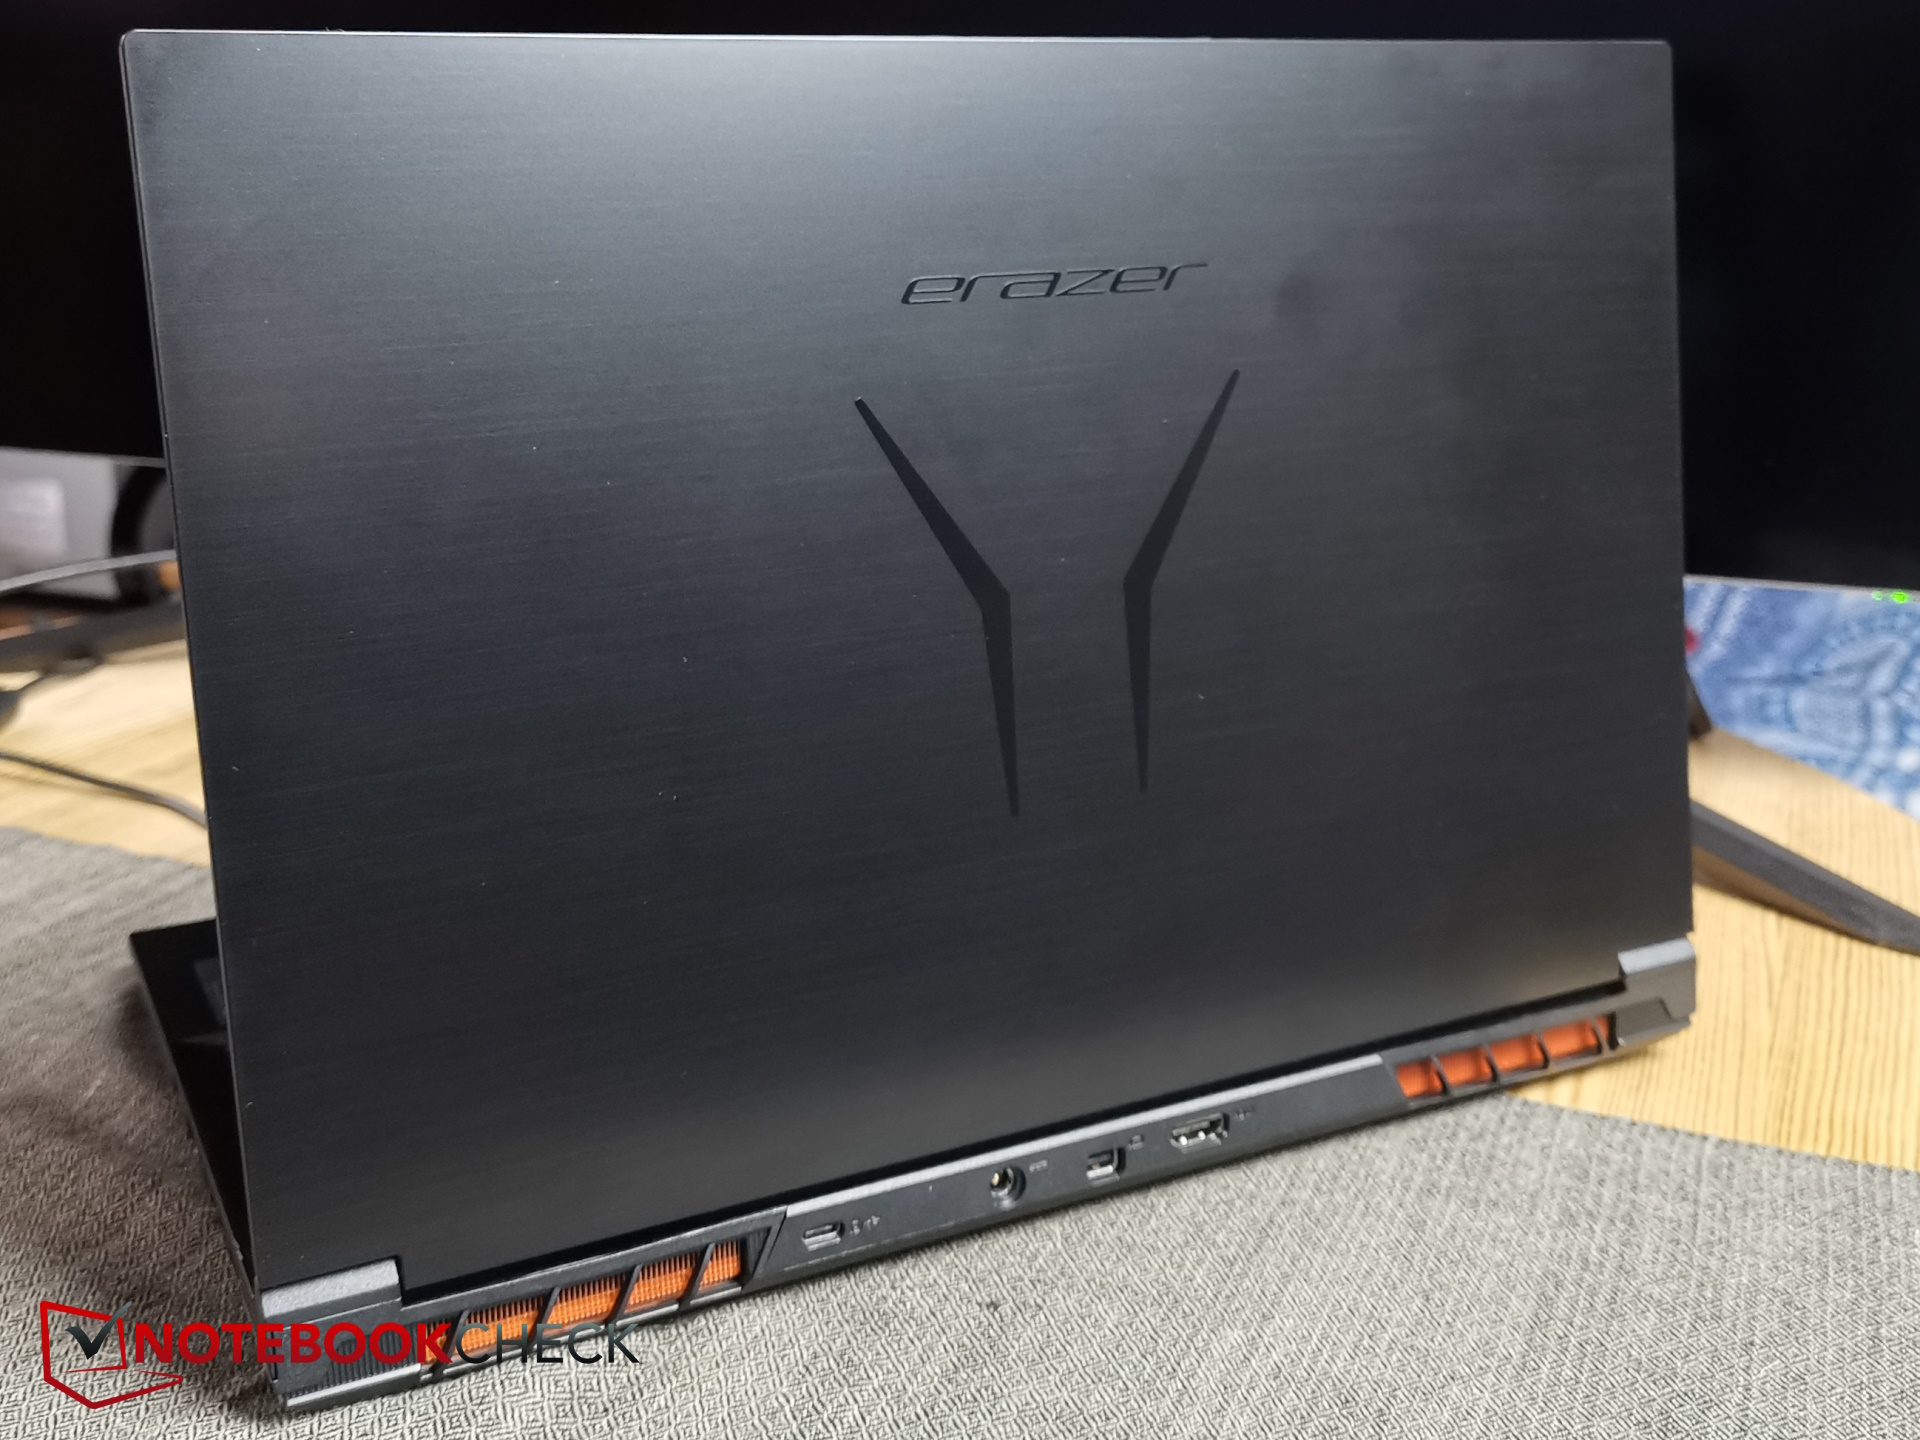
Case & Connectivity - Crawler E40 i borstad plastfinish
Displayens lock och bas är tillverkade av robust plast som påminner mycket om aluminium, vilket ger den ett avsiktligt utseende. Displayens kanter och undersidan av den bärbara datorn är tillverkade av mjuk plast. Både det släta locket och basen är benägna att dra till sig fingeravtryck.
Med en helt svart design, inklusive Erazer-logotypen på locket, har den bärbara datorn en relativt enkel estetik. Basen uppvisar en hög nivå av vridmotstånd, medan locket, även om det är mindre, verkar anmärkningsvärt "mjukt" och böjer sig avsevärt när det vrids, med skärmen som hanterar det stoiskt. Det övergripande utförandet är av god standard och det finns inga synliga luckor.
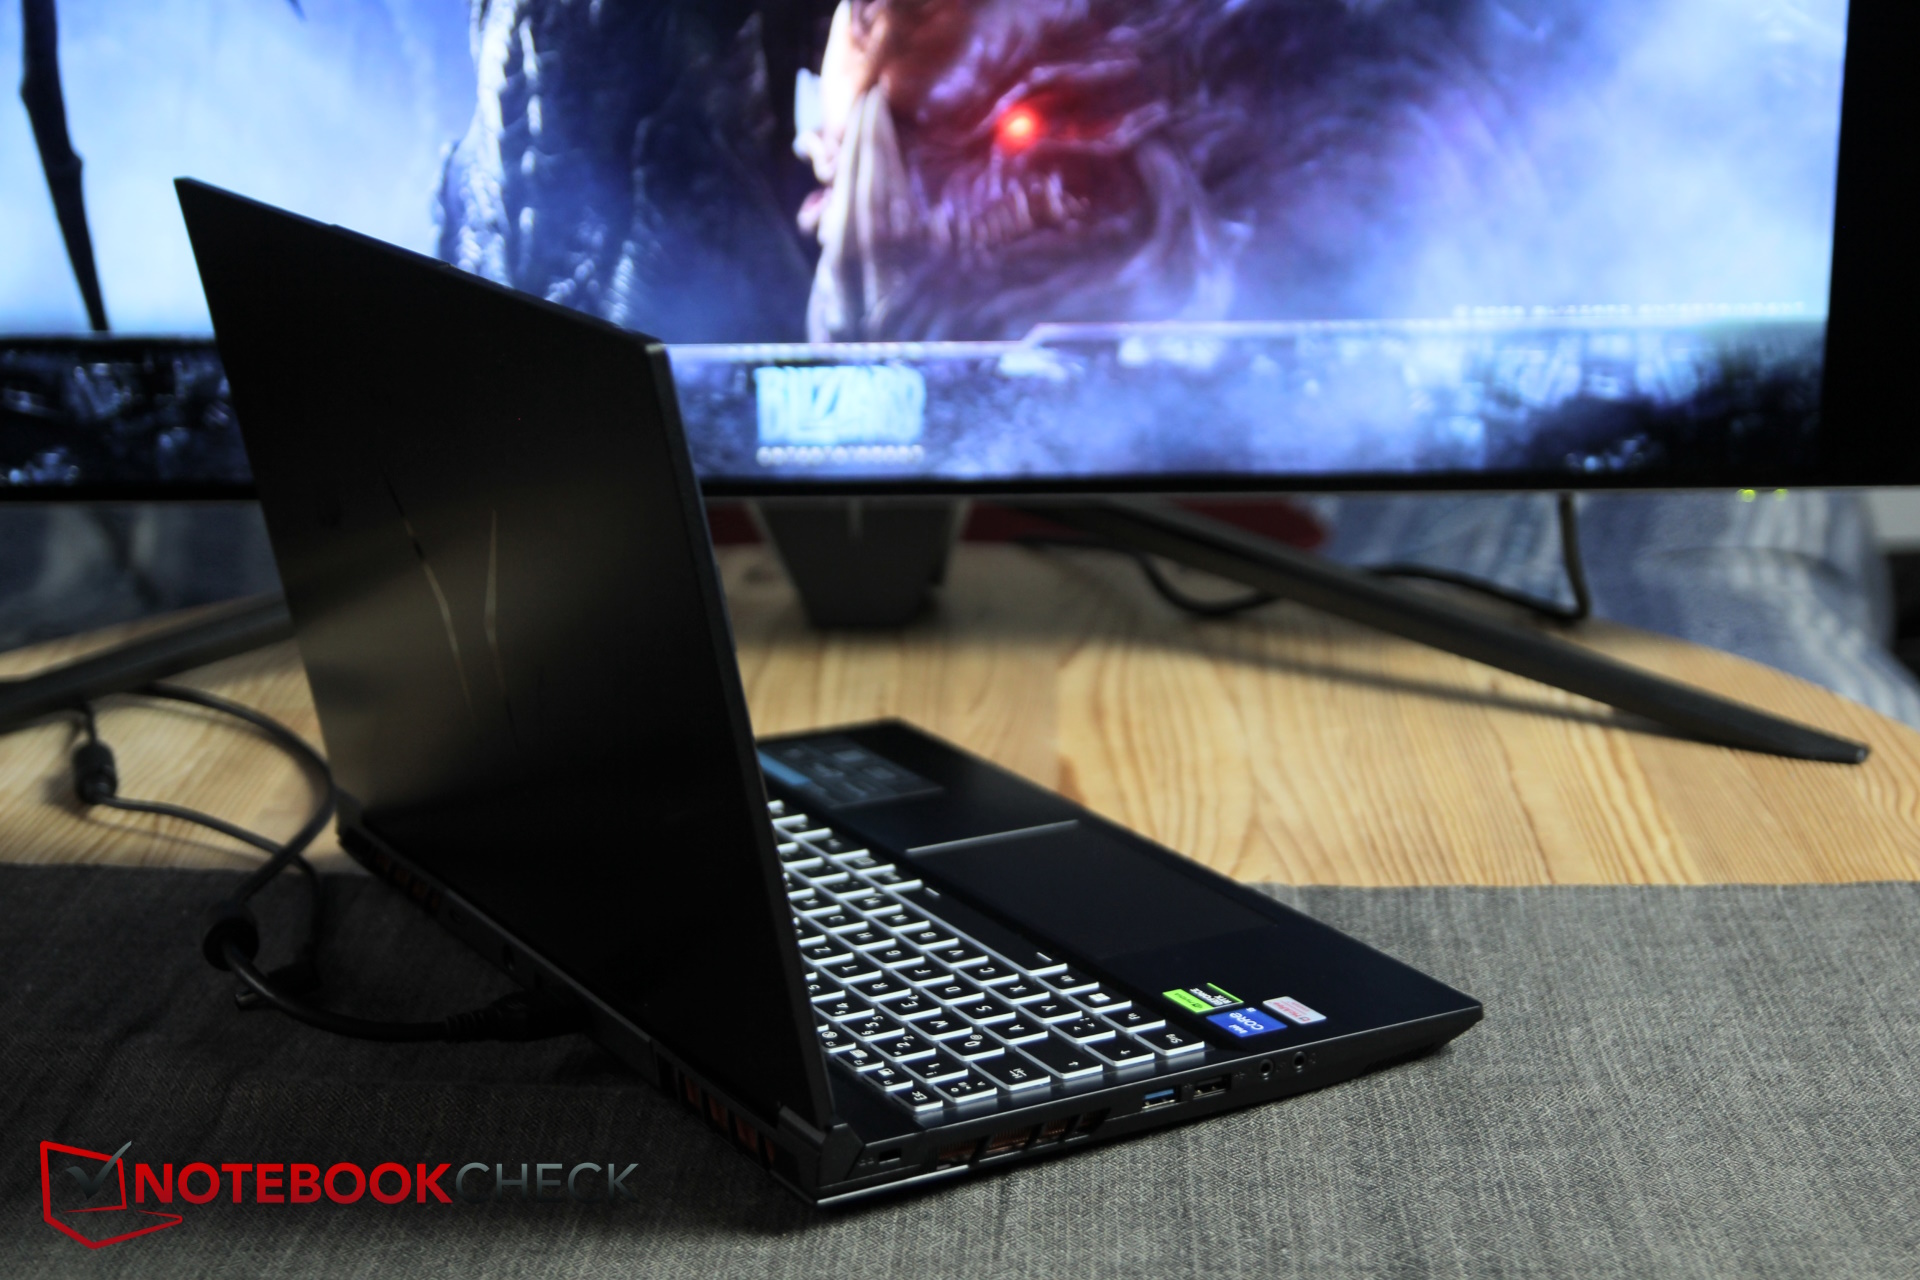
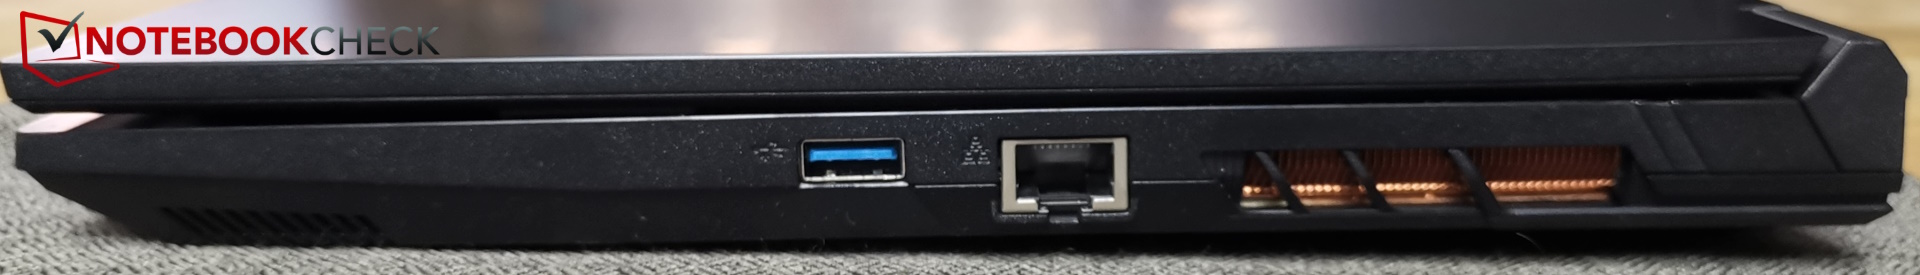
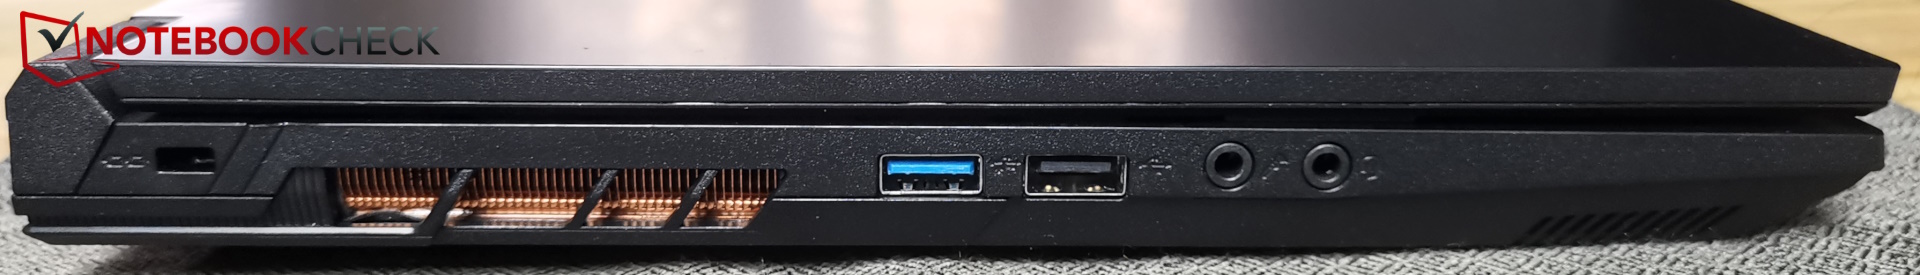
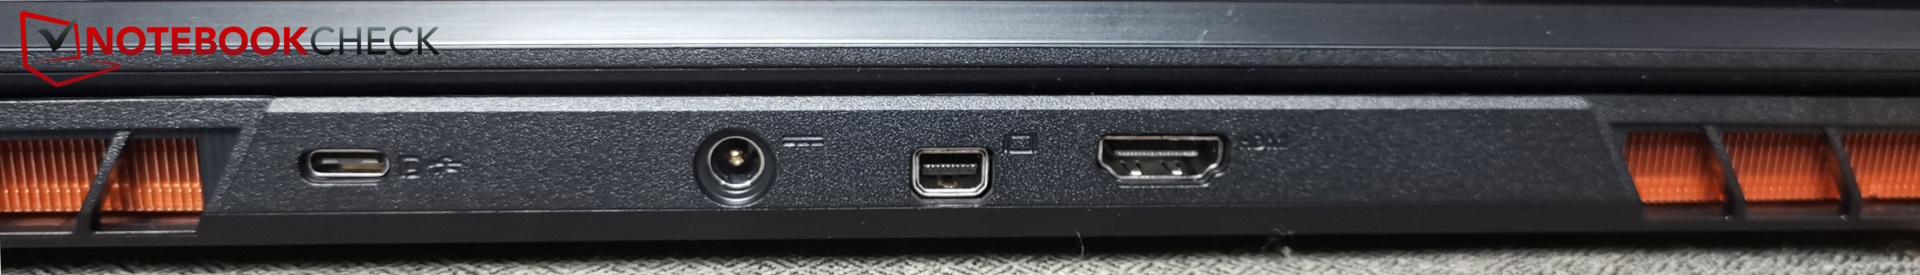
Anslutningar - Ingen Thunderbolt, men USB 2.0 istället
Trots att E40 har en Intel-processor saknar den Thunderbolt-stöd. Den har USB-C med en hastighet på 10 Gb/s. Men den har också en föråldrad USB-A 2.0-port, som potentiellt skulle kunna uppgraderas till ett snabbare alternativ. Noterbart är att det inte finns någon kortläsare.


Underhåll
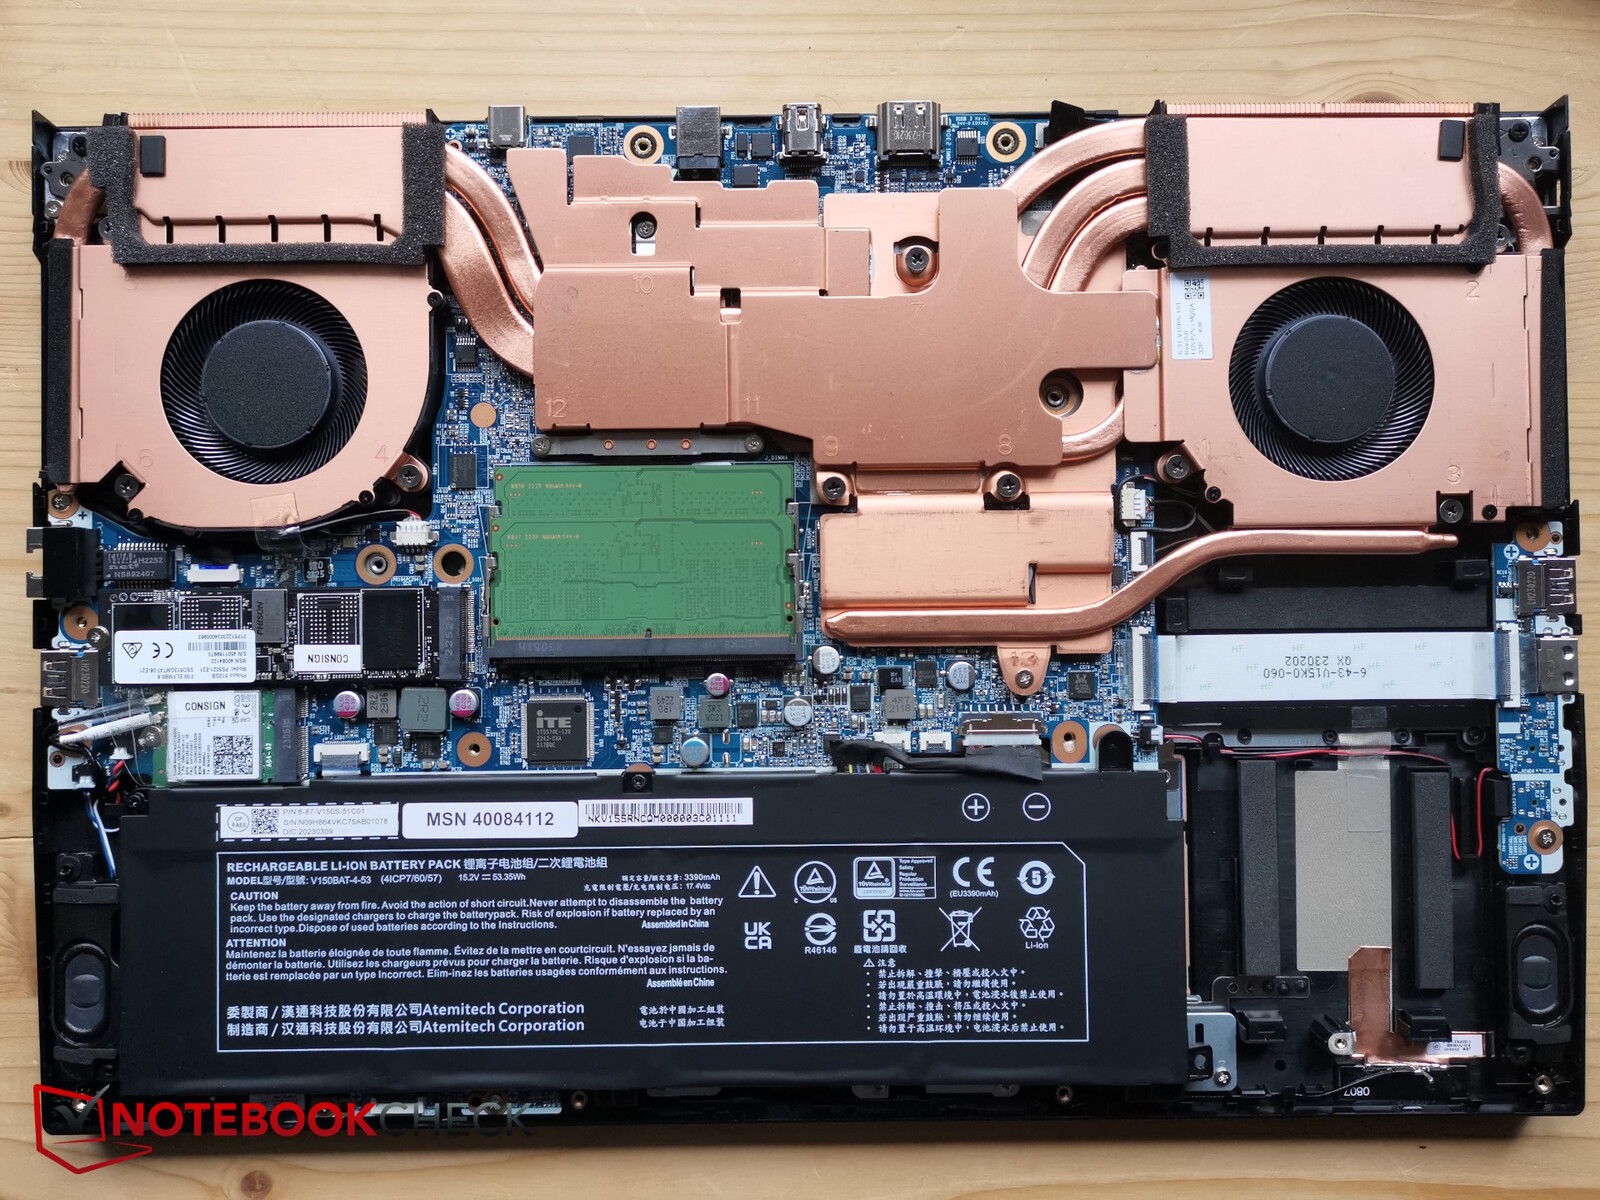
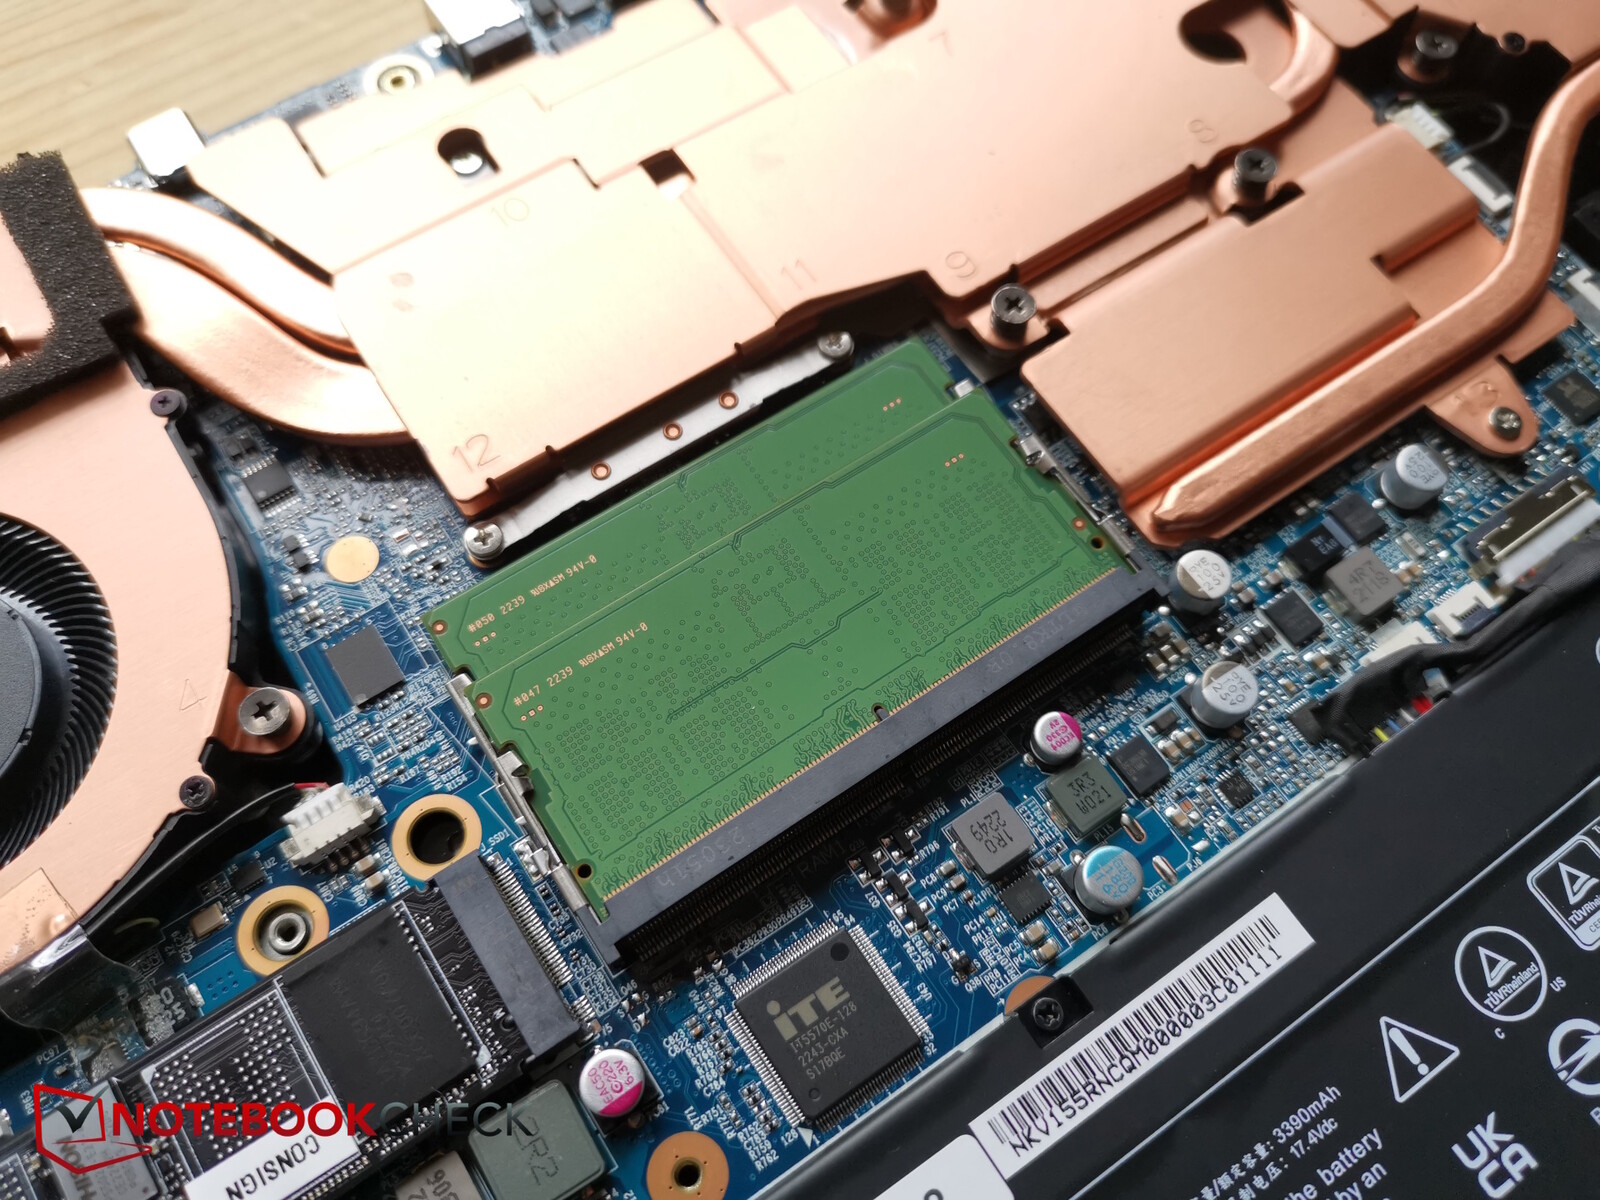
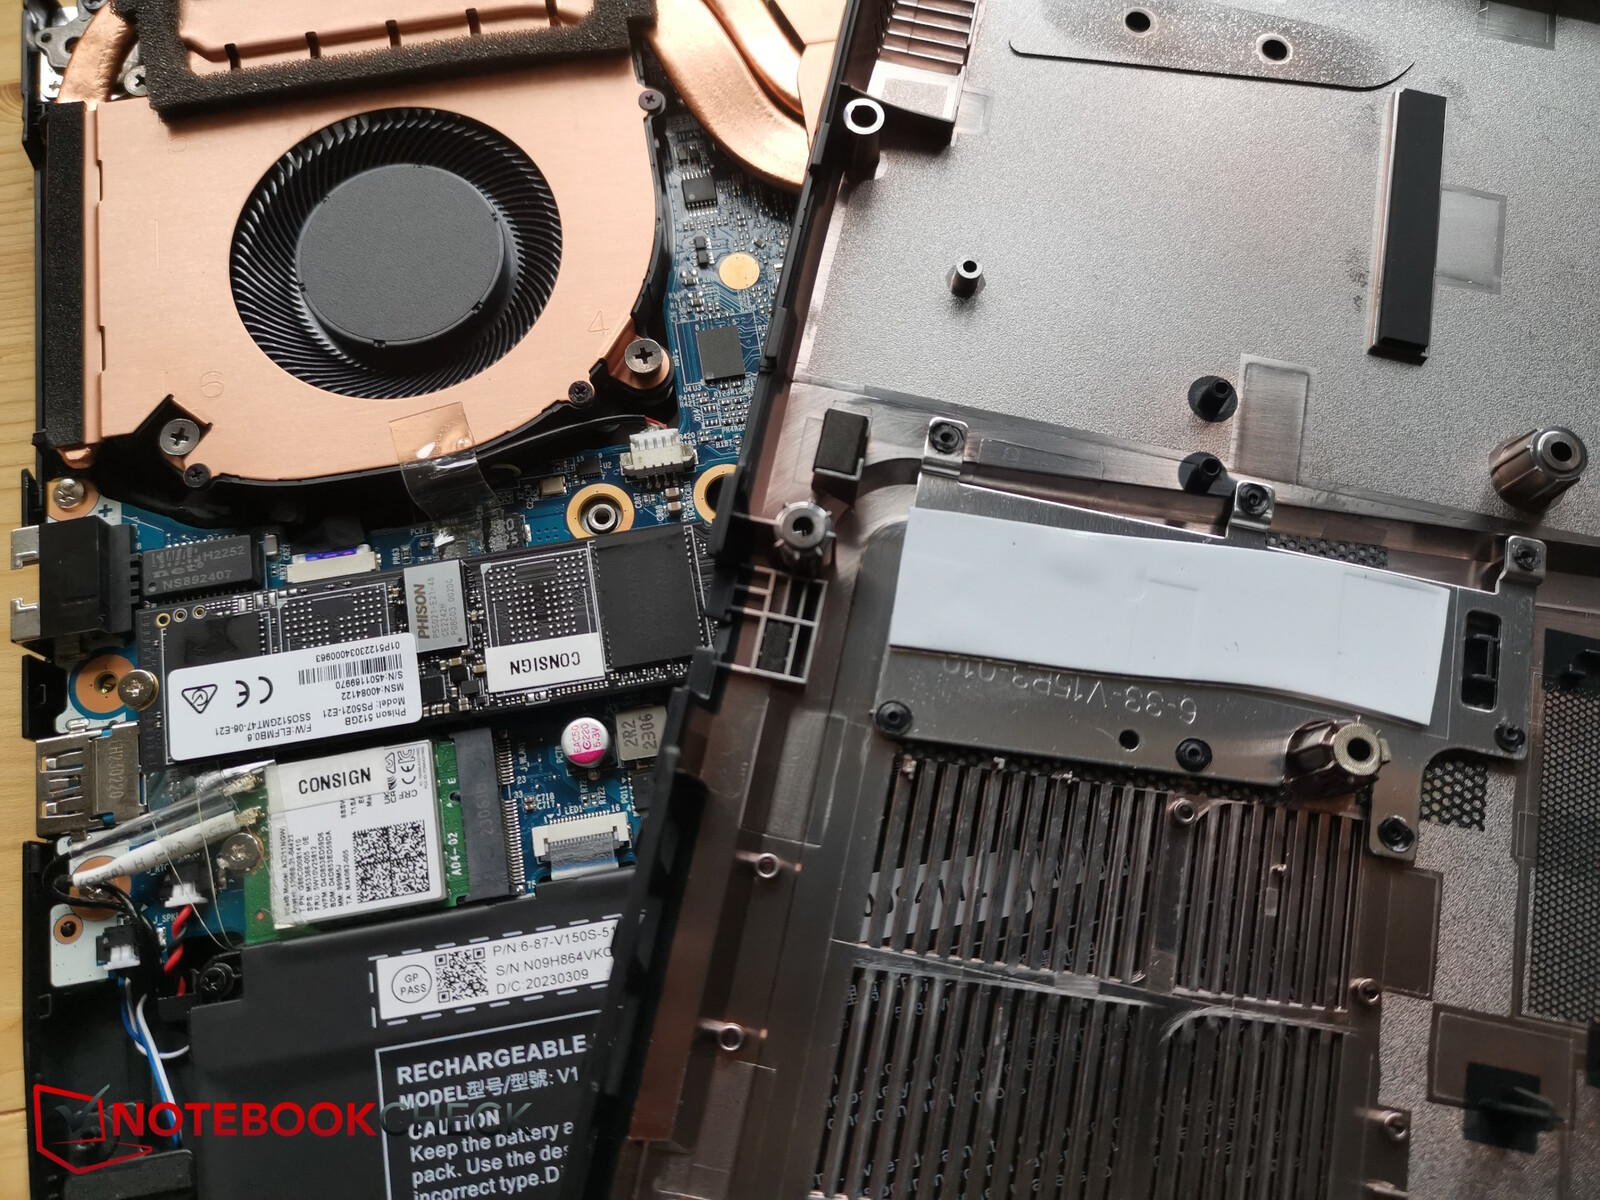
För att komma åt de interna komponenterna måste du ta bort 14 stjärnskruvar av samma storlek. Basplattan av plast kan sedan enkelt lyftas av. Undertill hittar du ett kylsystem med mycket koppar, ett skruvat batteri, två RAM-kortplatser, SSD-enheten som kyls av två kuddar och den utbytbara WiFi-modulen.
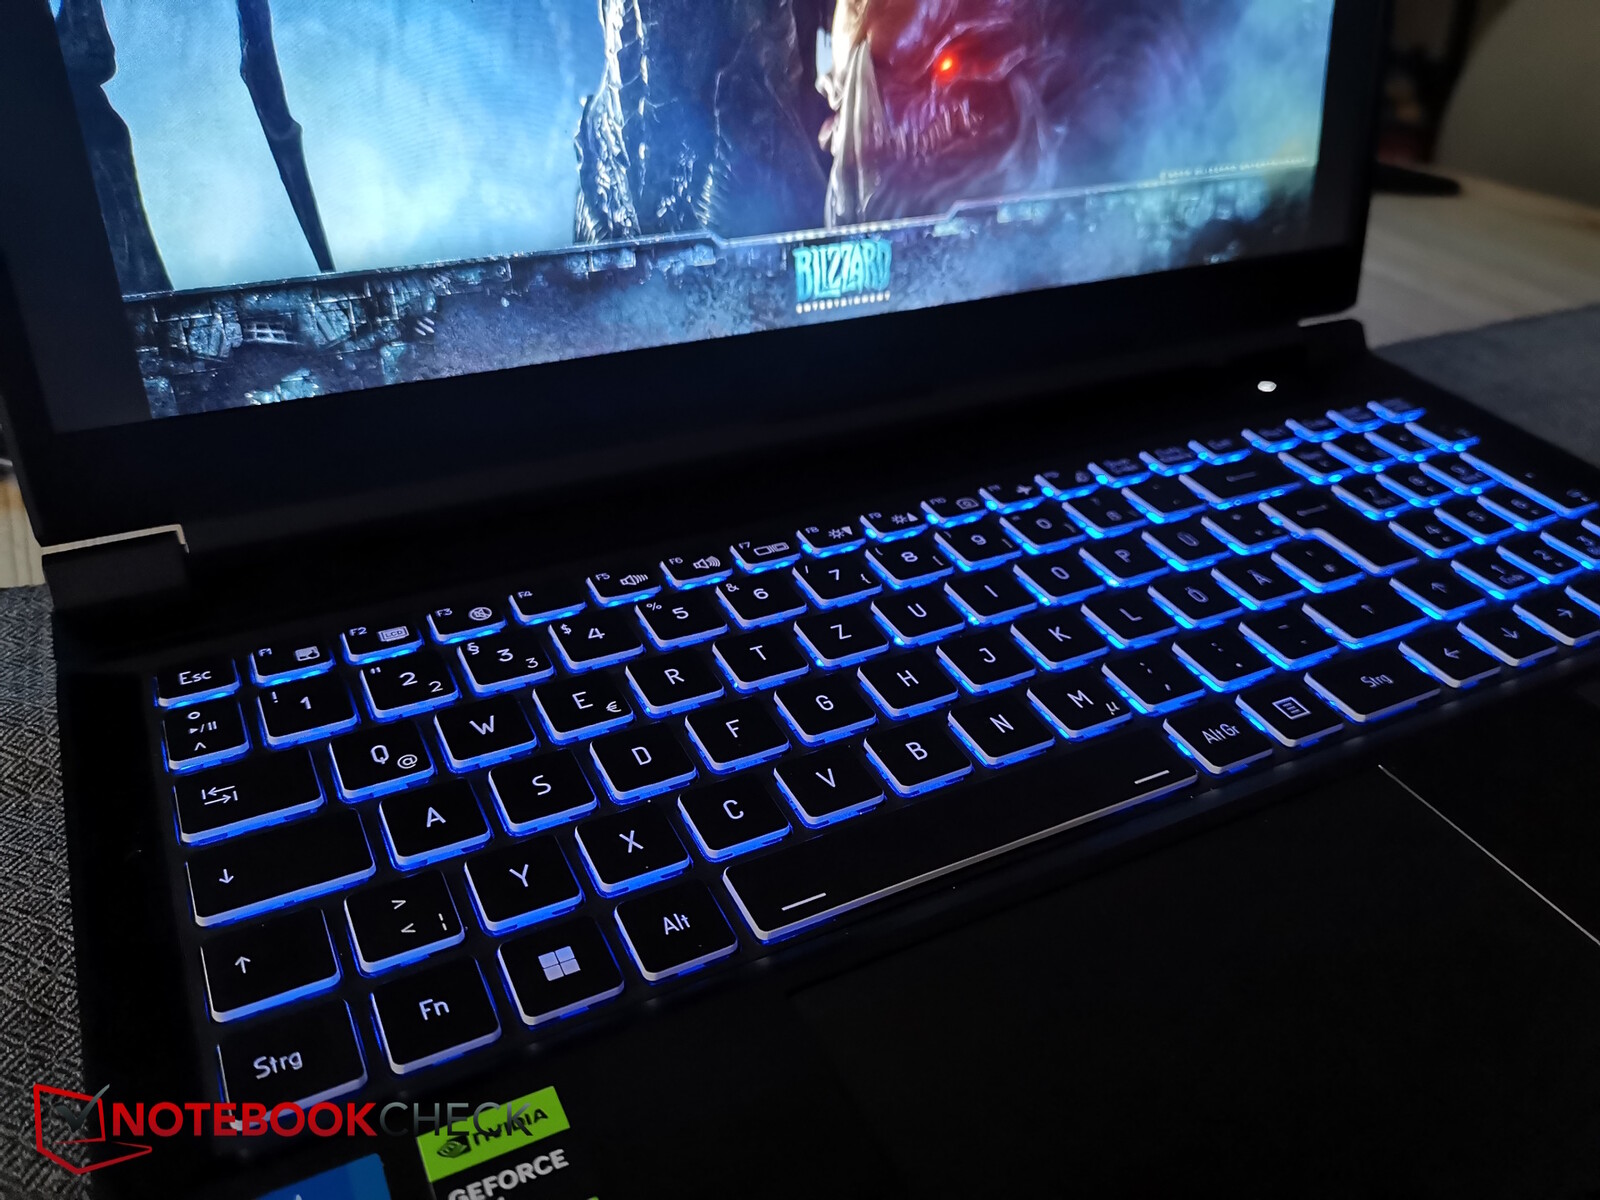
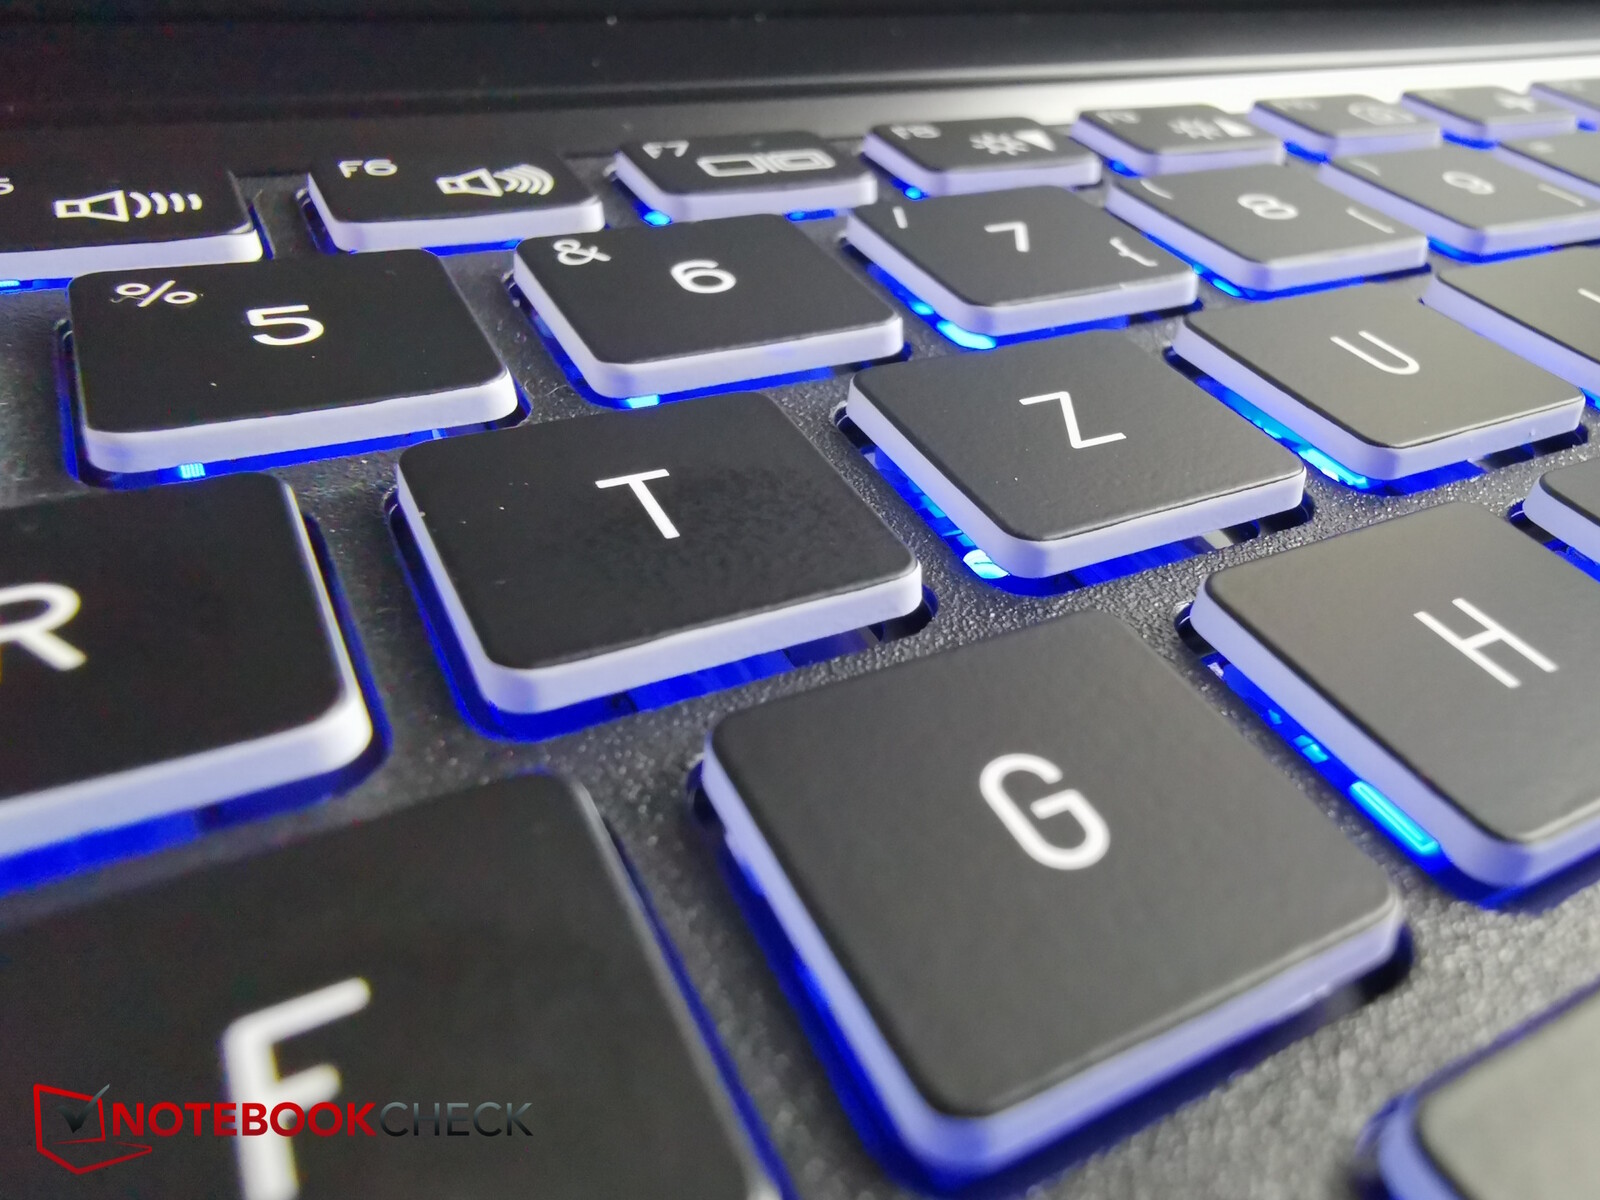
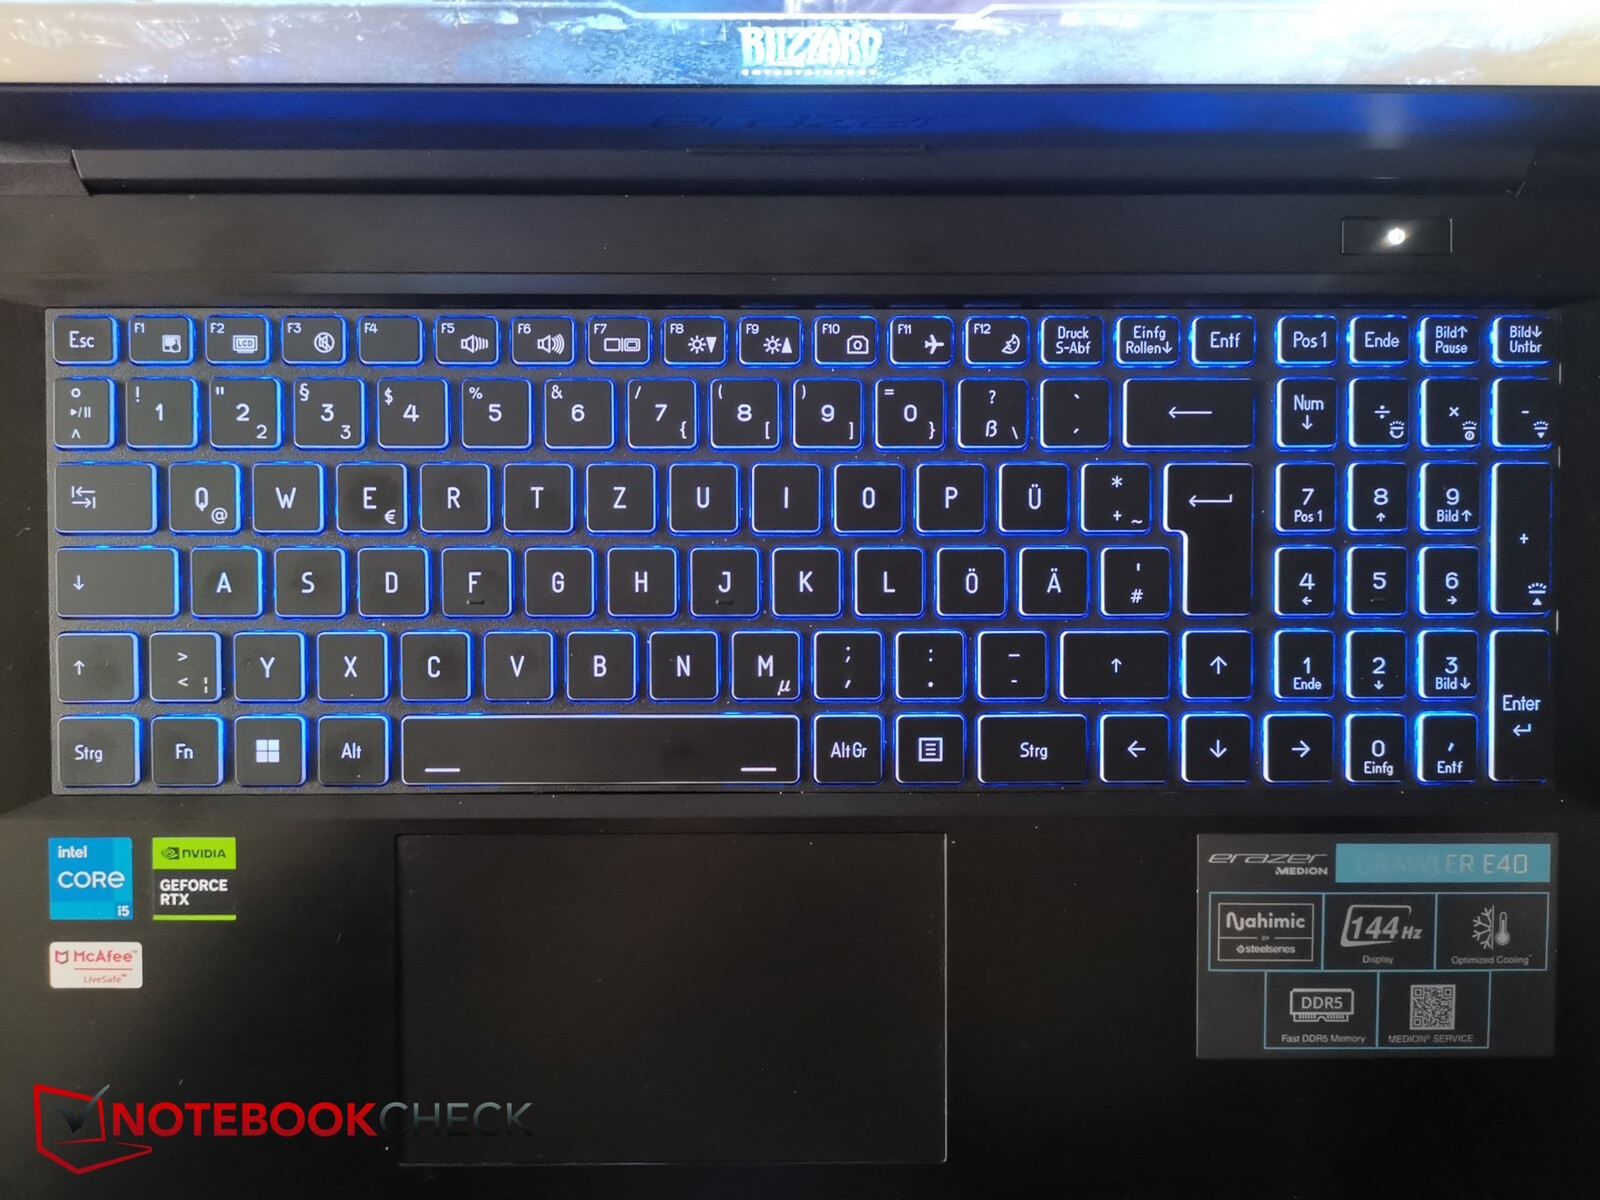
Inmatningsenheter - Övergripande soliditet
Tangentbordslayouten är, precis som på andra Medion-enheter som granskats i år, ganska ren. Tangenterna är dock ganska små (1,4 cm), men de är ordentligt placerade. Till höger finns en numerisk knappsats med ännu mindre tangenter.
Tangentförflyttningen är genomsnittlig och återkopplingen är något mjuk. Ändå är det enkelt och går snabbt att skriva på.
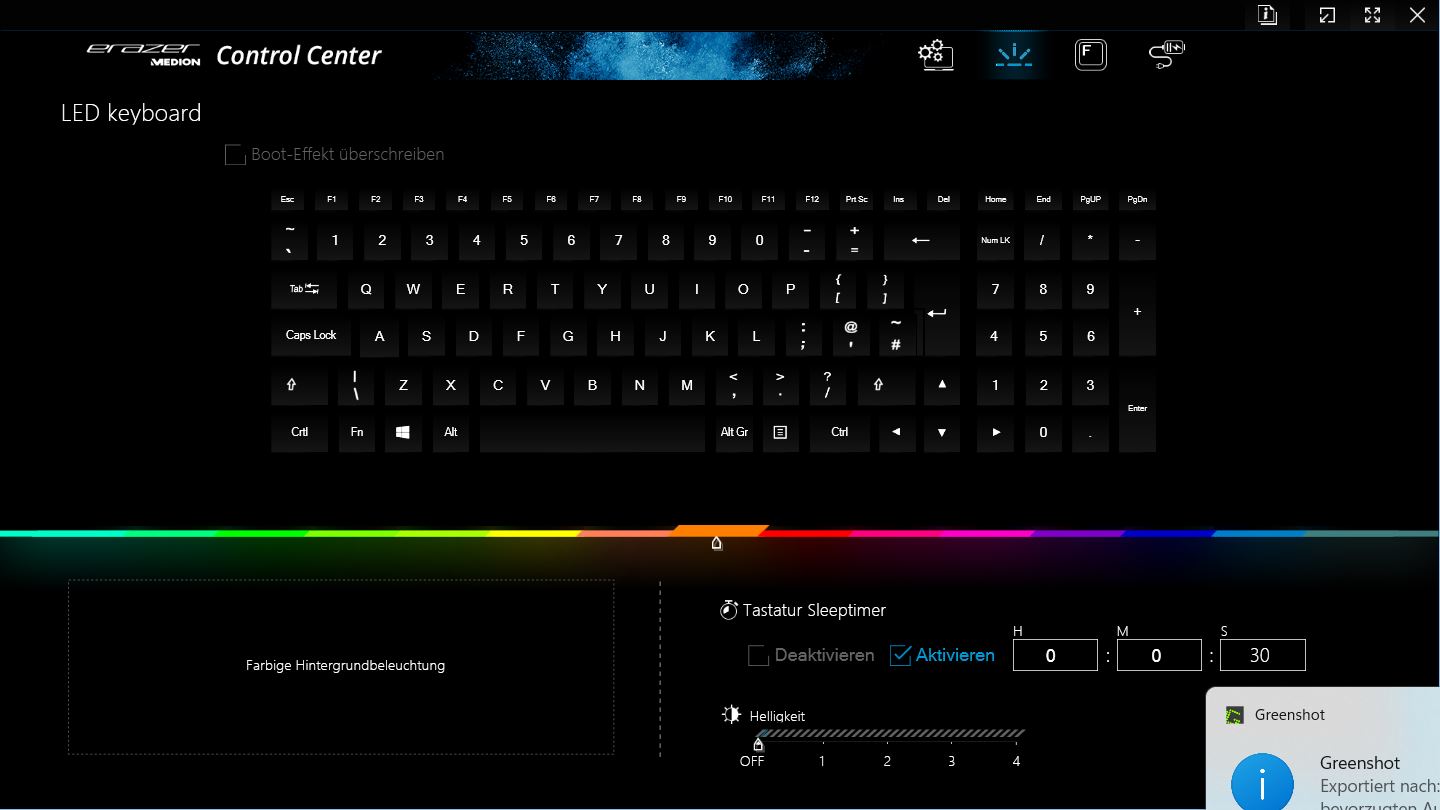
RGB-bakgrundsbelysningen i två steg, som kan konfigureras via Control Center (olika färger) och styras via specialtangenter, underlättar i mörka miljöer. Men det är bara en enda zon.
Pekplattan (ca 12,1 x 7,3 cm) är något förskjuten åt vänster för att ligga så centralt som möjligt under de andra tangenterna på grund av den numeriska knappsatsen. Ytan är hal, men de inte exakt tysta klickljuden verkar lite billiga.
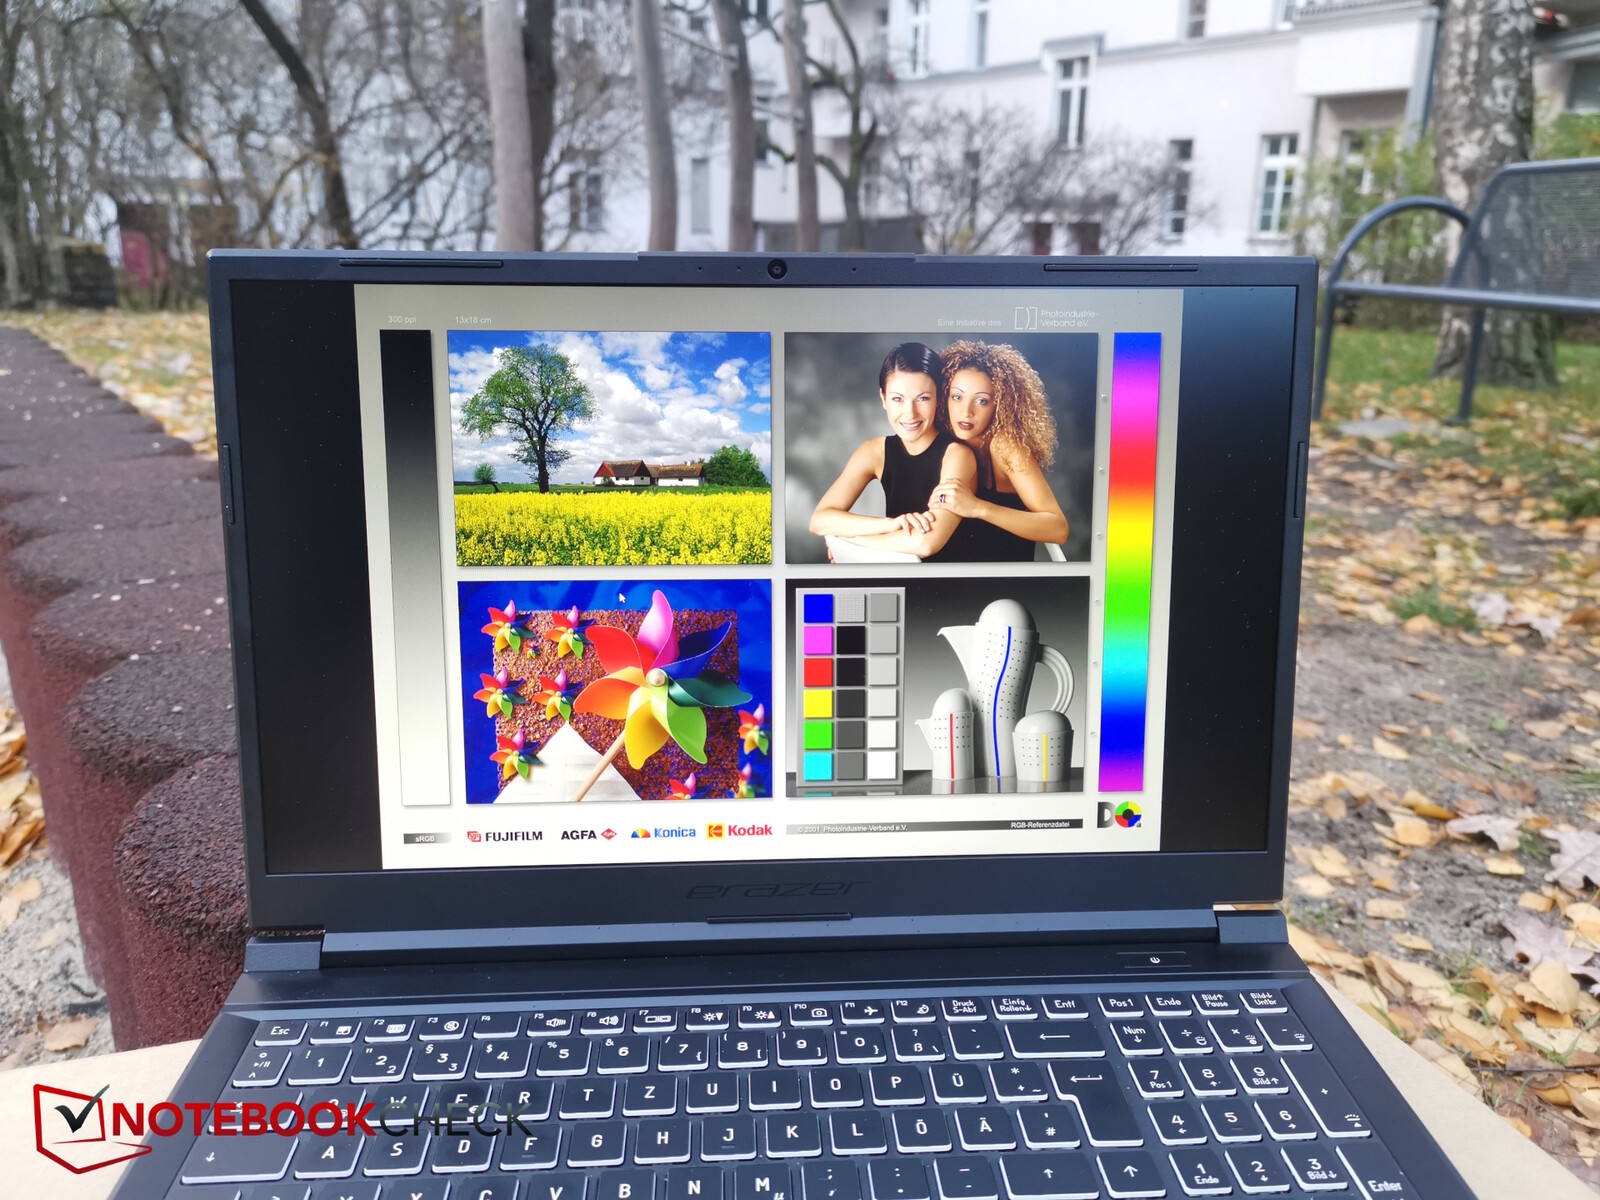
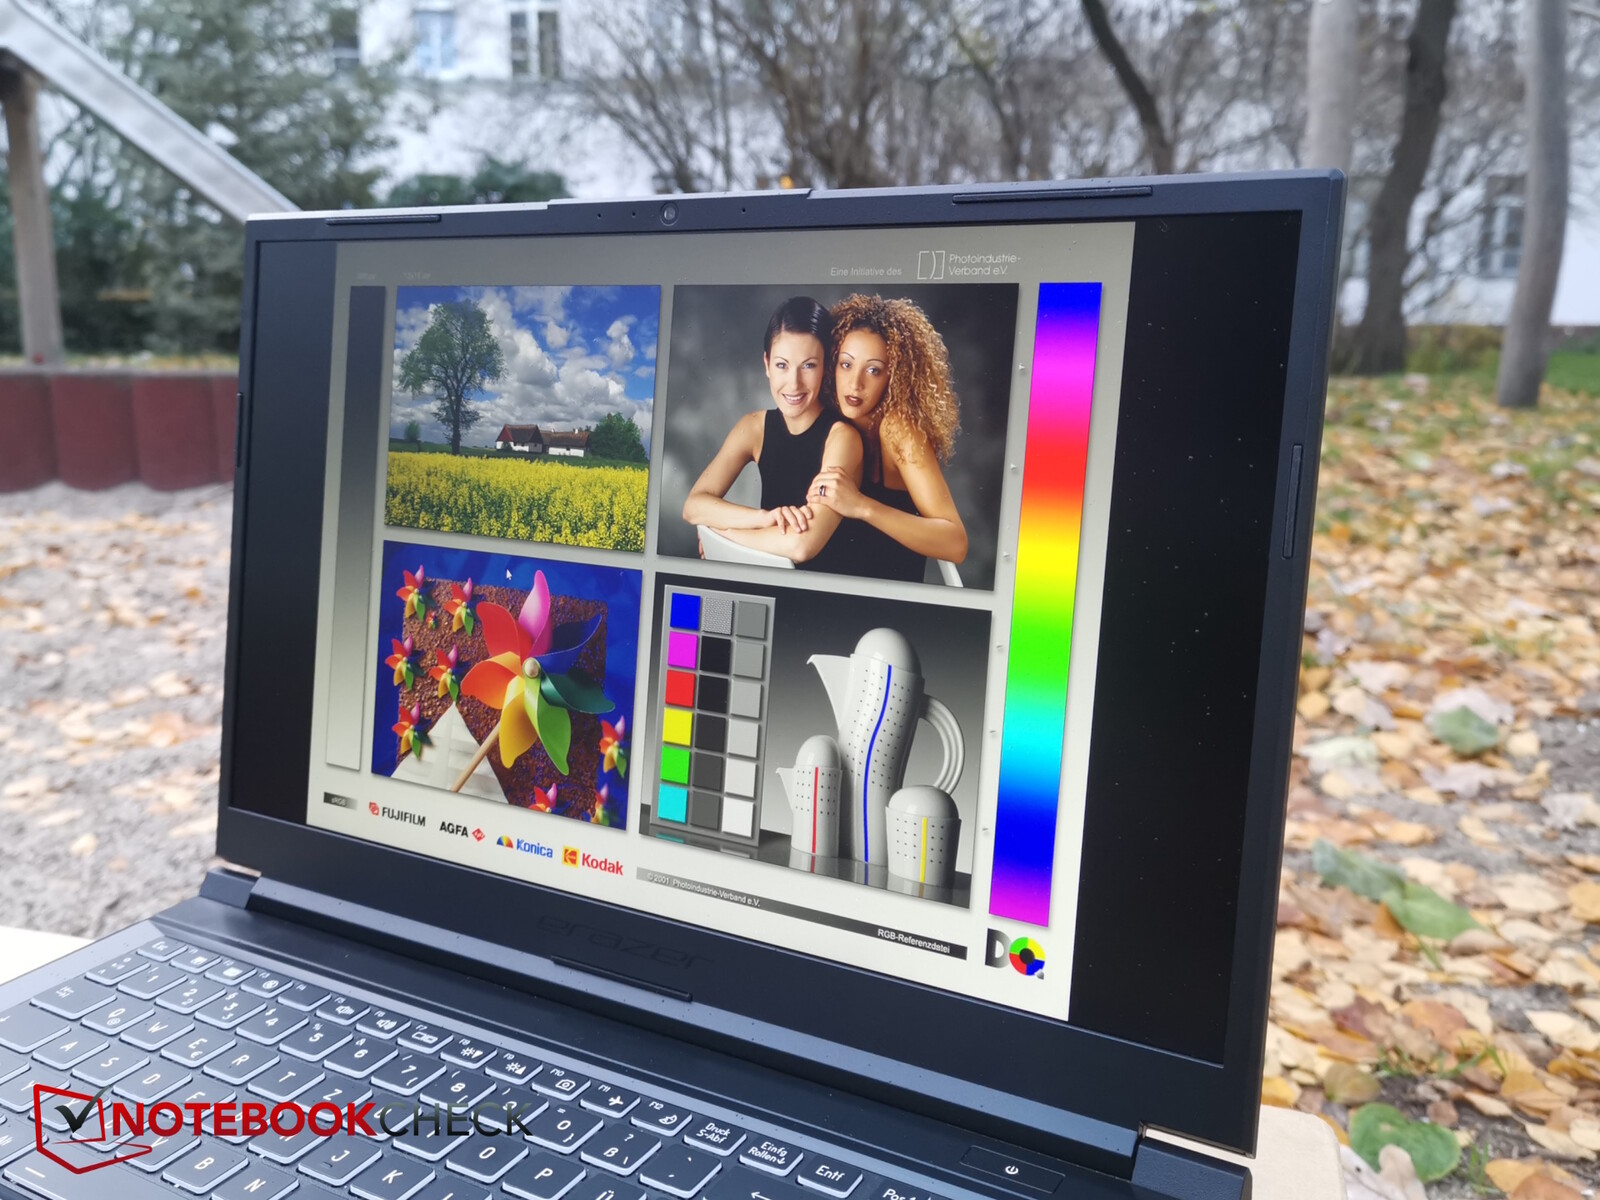
Display - En gammal bekant från 2019
Medion Erazer Crawler E40 har en välbekant skärm, som har använts i flera bärbara datorer tidigare. Den matta Full HD IPS-skärmen med en uppdateringsfrekvens på 144 Hz är inte den senaste, utan har använts i XMG Fusion 15 redan 2019.
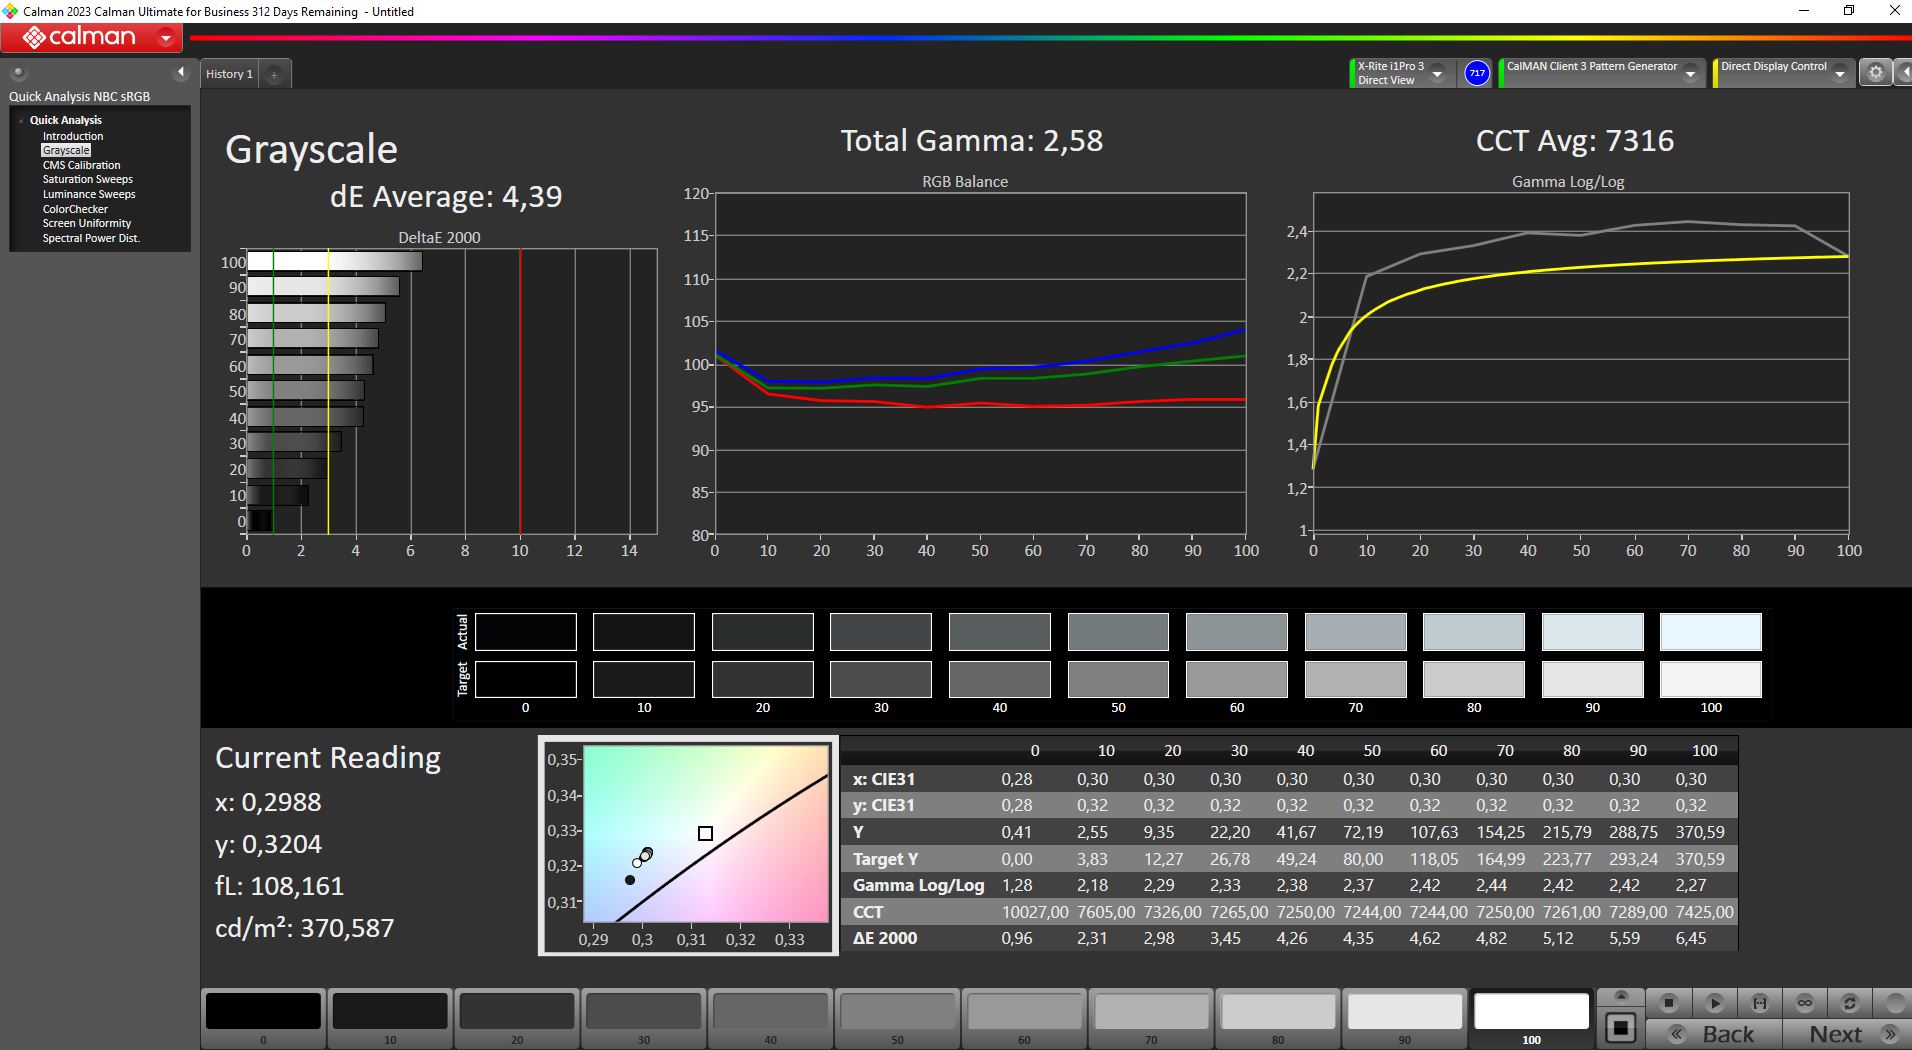
Skärmens genomsnittliga ljusstyrka på 350 nits är acceptabel, även om kontrasten äventyras något av det svaga svartvärdet.
Svarstiderna är anständiga för en bärbar speldator, och det finns en liten förekomst av blödning i bakgrundsbelysningen.
| |||||||||||||||||||||||||
Distribution av ljusstyrkan: 91 %
Mitt på batteriet: 356 cd/m²
Kontrast: 847:1 (Svärta: 0.43 cd/m²)
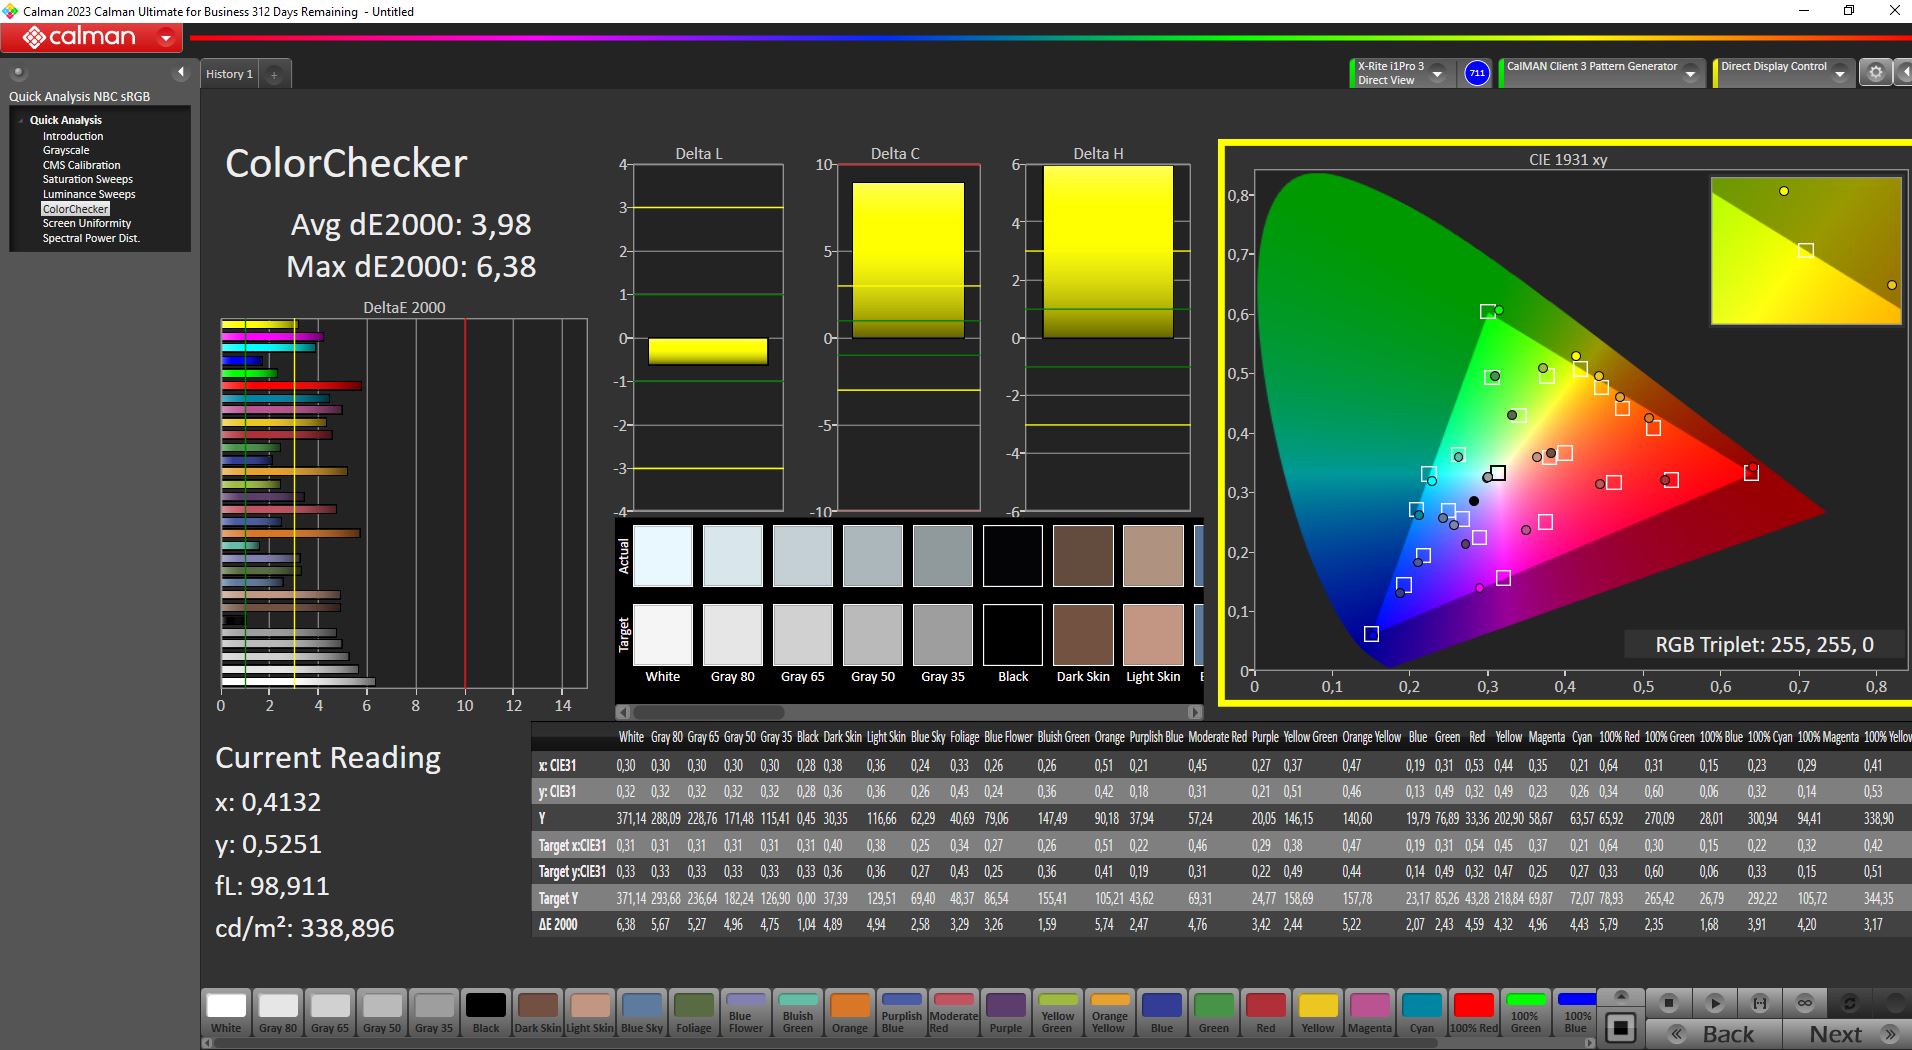
ΔE ColorChecker Calman: 3.98 | ∀{0.5-29.43 Ø4.71}
calibrated: 1.36
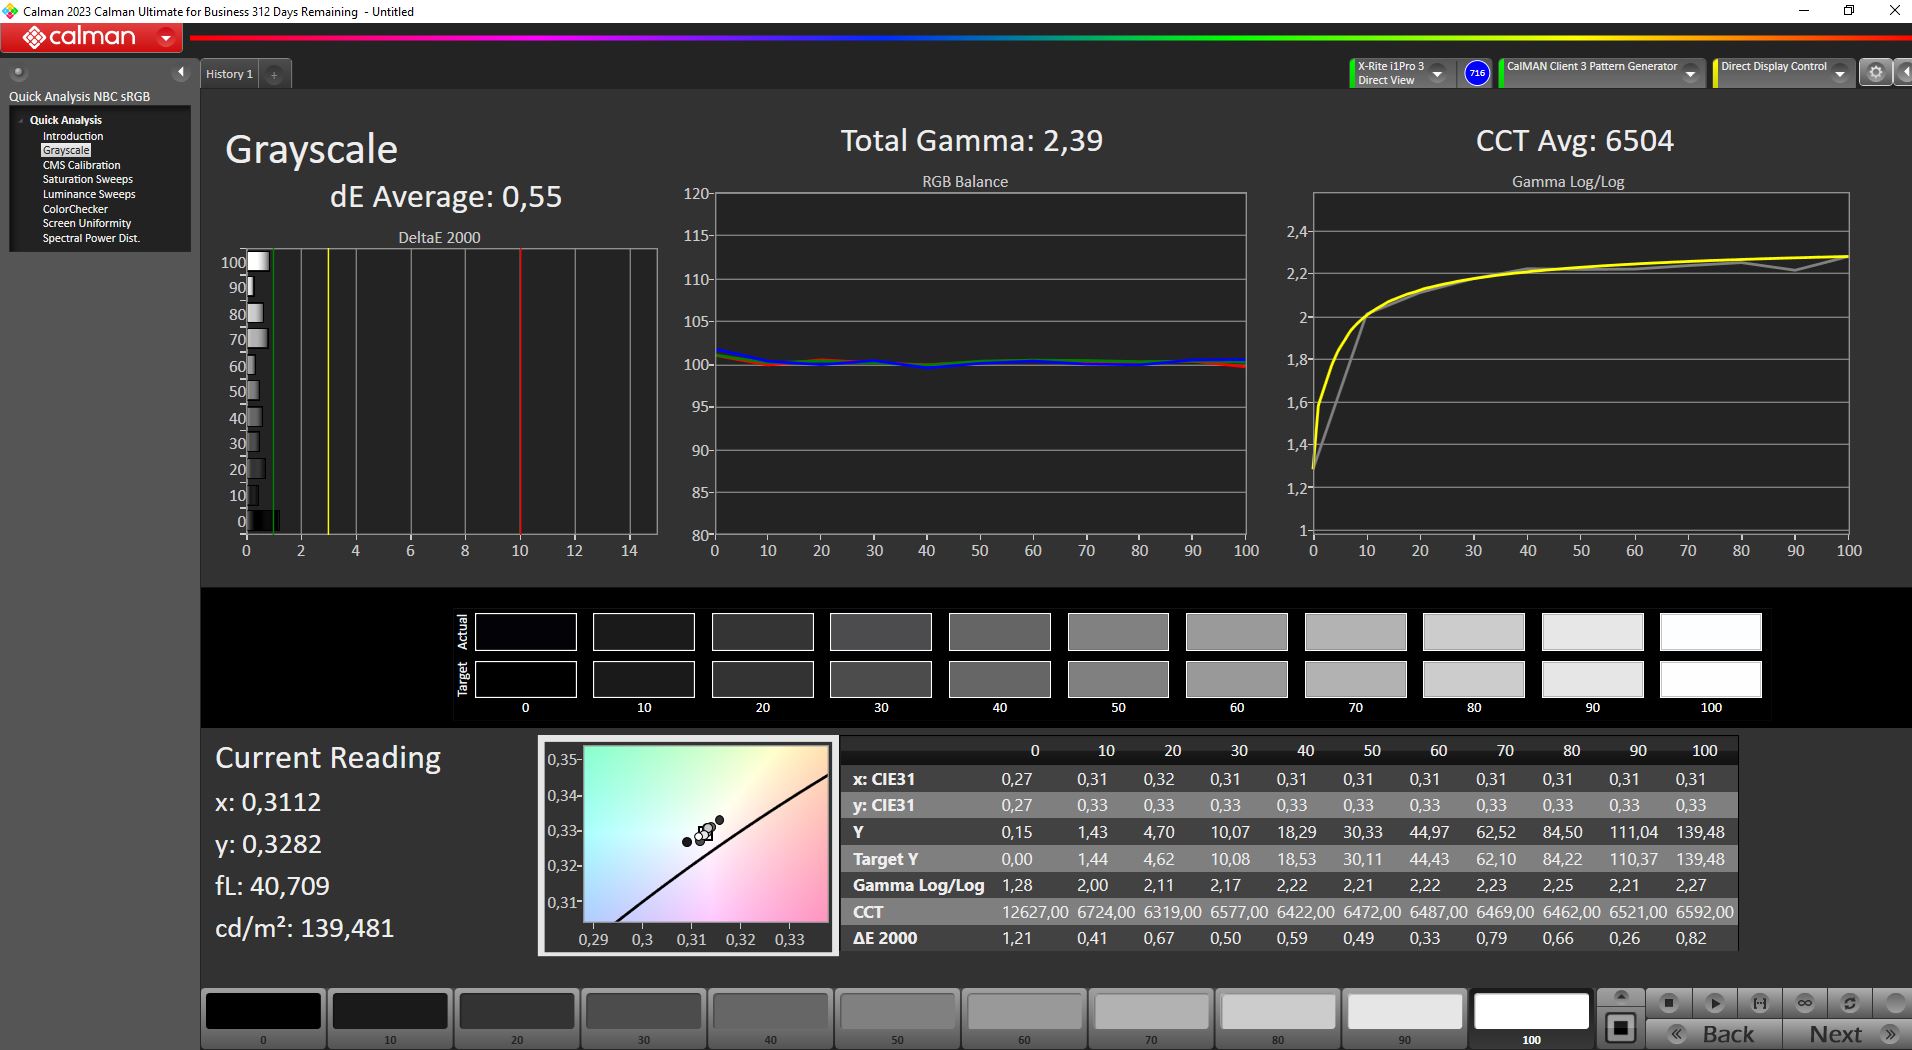
ΔE Greyscale Calman: 4.39 | ∀{0.09-98 Ø4.96}
63.2% AdobeRGB 1998 (Argyll 3D)
89.7% sRGB (Argyll 3D)
61.4% Display P3 (Argyll 3D)
Gamma: 2.58
CCT: 7316 K
| Medion Erazer Crawler E40 - MD 62518 BOE HF NV156FHM-N4G, IPS, 1920x1080, 15.6" | Lenovo LOQ 15IRH8 Core i7 BOE CQ NE156QHM-NY4, IPS, 2560x1440, 15.6" | Asus TUF A15 FA507 N156HMA-GA1, IPS, 1920x1080, 15.6" | Schenker XMG Apex 15 (Late 23) BOE CQ NE156QHM-NY2, IPS, 2560x1440, 15.6" | MSI Katana 15 B12VEK AUOAF90 (B156HAN08.4), IPS, 1920x1080, 15.6" | |
|---|---|---|---|---|---|
| Display | 8% | 6% | 9% | -38% | |
| Display P3 Coverage (%) | 61.4 | 66.3 8% | 64.9 6% | 67.5 10% | 38.1 -38% |
| sRGB Coverage (%) | 89.7 | 96.6 8% | 96.5 8% | 97.6 9% | 56.8 -37% |
| AdobeRGB 1998 Coverage (%) | 63.2 | 67.7 7% | 66.6 5% | 68.9 9% | 39.3 -38% |
| Response Times | 25% | -199% | -29% | -282% | |
| Response Time Grey 50% / Grey 80% * (ms) | 8 ? | 5 ? 37% | 30.4 ? -280% | 13.2 ? -65% | 38.8 ? -385% |
| Response Time Black / White * (ms) | 9.6 ? | 8.41 ? 12% | 20.8 ? -117% | 8.8 ? 8% | 26.8 ? -179% |
| PWM Frequency (Hz) | |||||
| Screen | 3% | 32% | 12% | -46% | |
| Brightness middle (cd/m²) | 364 | 373 2% | 288 -21% | 336 -8% | 261 -28% |
| Brightness (cd/m²) | 351 | 365 4% | 271 -23% | 307 -13% | 258 -26% |
| Brightness Distribution (%) | 91 | 90 -1% | 91 0% | 77 -15% | 92 1% |
| Black Level * (cd/m²) | 0.43 | 0.33 23% | 0.17 60% | 0.38 12% | 0.19 56% |
| Contrast (:1) | 847 | 1130 33% | 1694 100% | 884 4% | 1374 62% |
| Colorchecker dE 2000 * | 3.98 | 4.19 -5% | 1.9 52% | 1.96 51% | 5.57 -40% |
| Colorchecker dE 2000 max. * | 6.38 | 8.47 -33% | 3.3 48% | 5.07 21% | 20.6 -223% |
| Colorchecker dE 2000 calibrated * | 1.36 | 1.07 21% | 0.9 34% | 1.27 7% | 4.63 -240% |
| Greyscale dE 2000 * | 4.39 | 5 -14% | 2.7 38% | 2.3 48% | 3.19 27% |
| Gamma | 2.58 85% | 1.93 114% | 2.32 95% | 2.017 109% | 2.45 90% |
| CCT | 7316 89% | 7520 86% | 6535 99% | 6644 98% | 6146 106% |
| Totalt genomsnitt (program/inställningar) | 12% /
7% | -54% /
-6% | -3% /
6% | -122% /
-78% |
* ... mindre är bättre
Displayens prestanda direkt från start är inte optimal, med DeltaE-värden för färger och gråskala långt över målet, och svartnivån är överdrivet hög. Genom att kalibrera panelen och minska ljusstyrkan förbättras dock bildkvaliteten avsevärt. Efter kalibreringen reduceras DeltaE-värdena till berömvärda 0,55 för gråskala och 1,36 för ColorChecker.
Du kan ladda ner vår kalibrerade färgprofil gratis ovan.
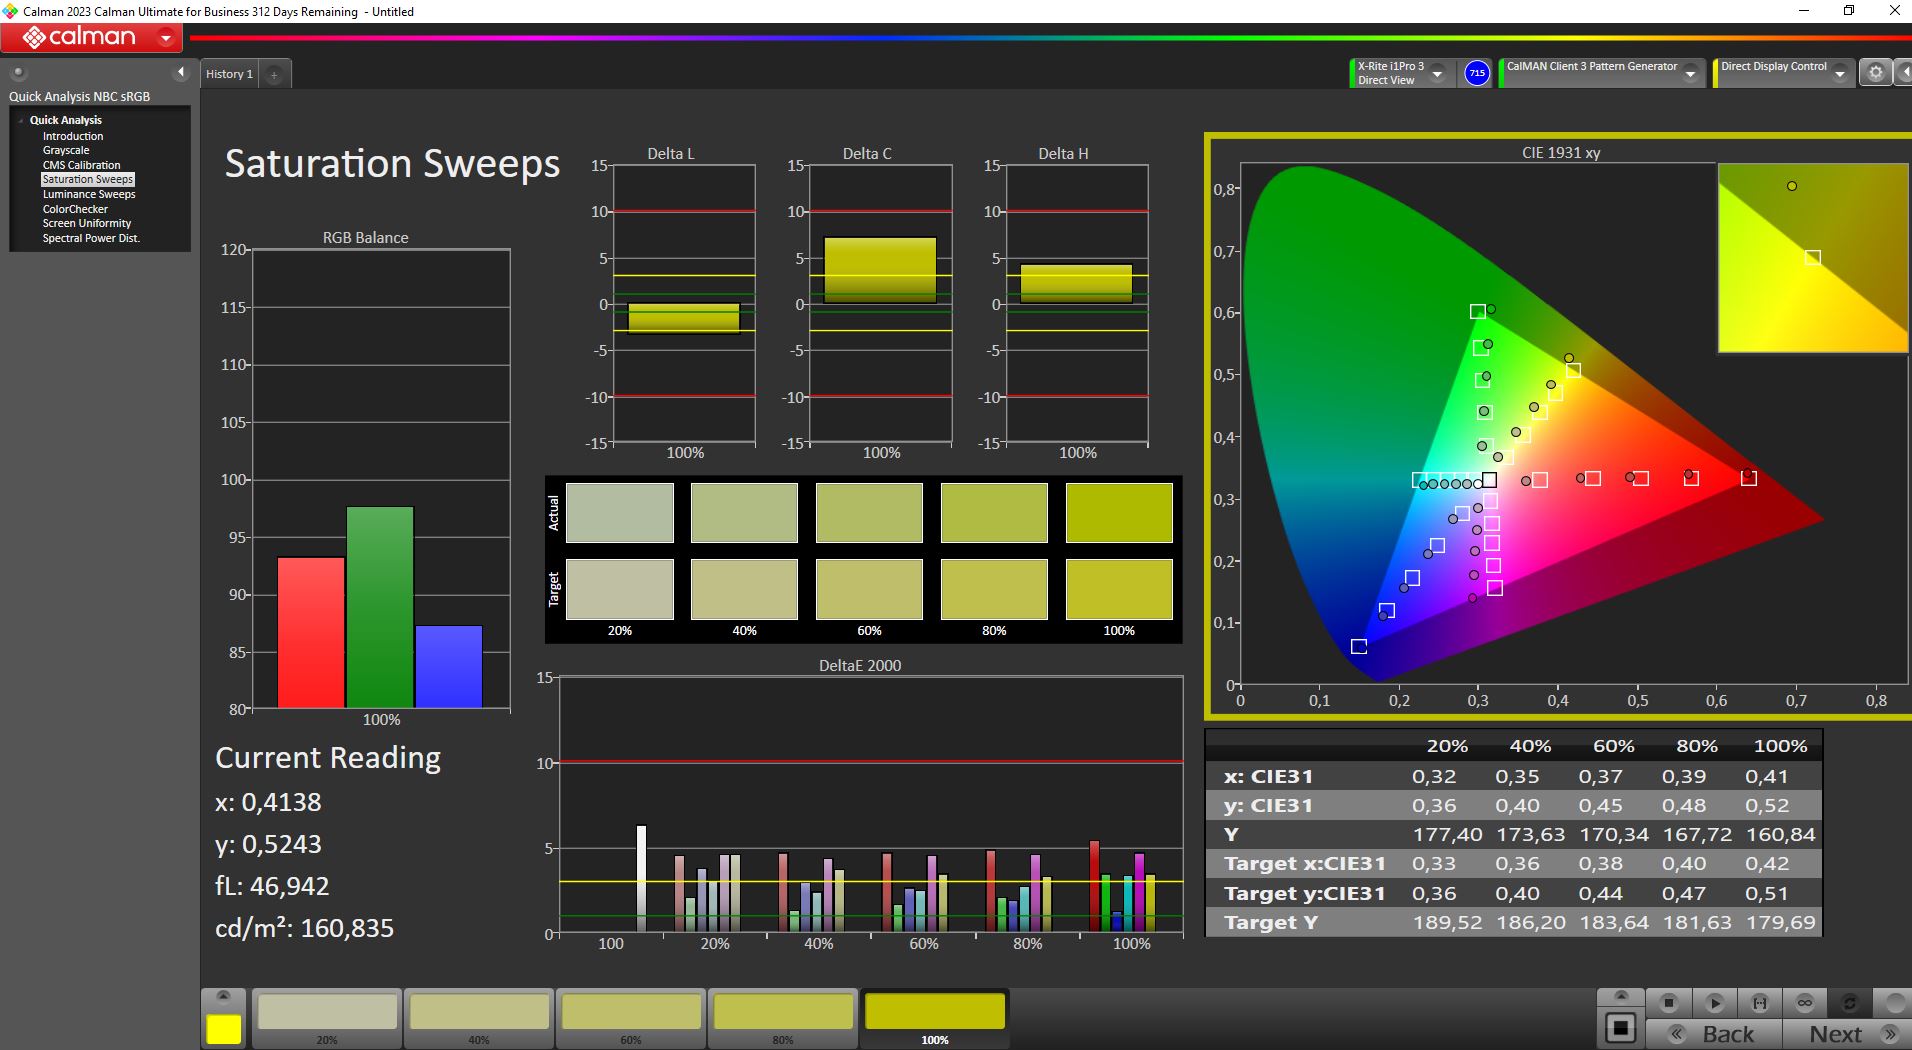
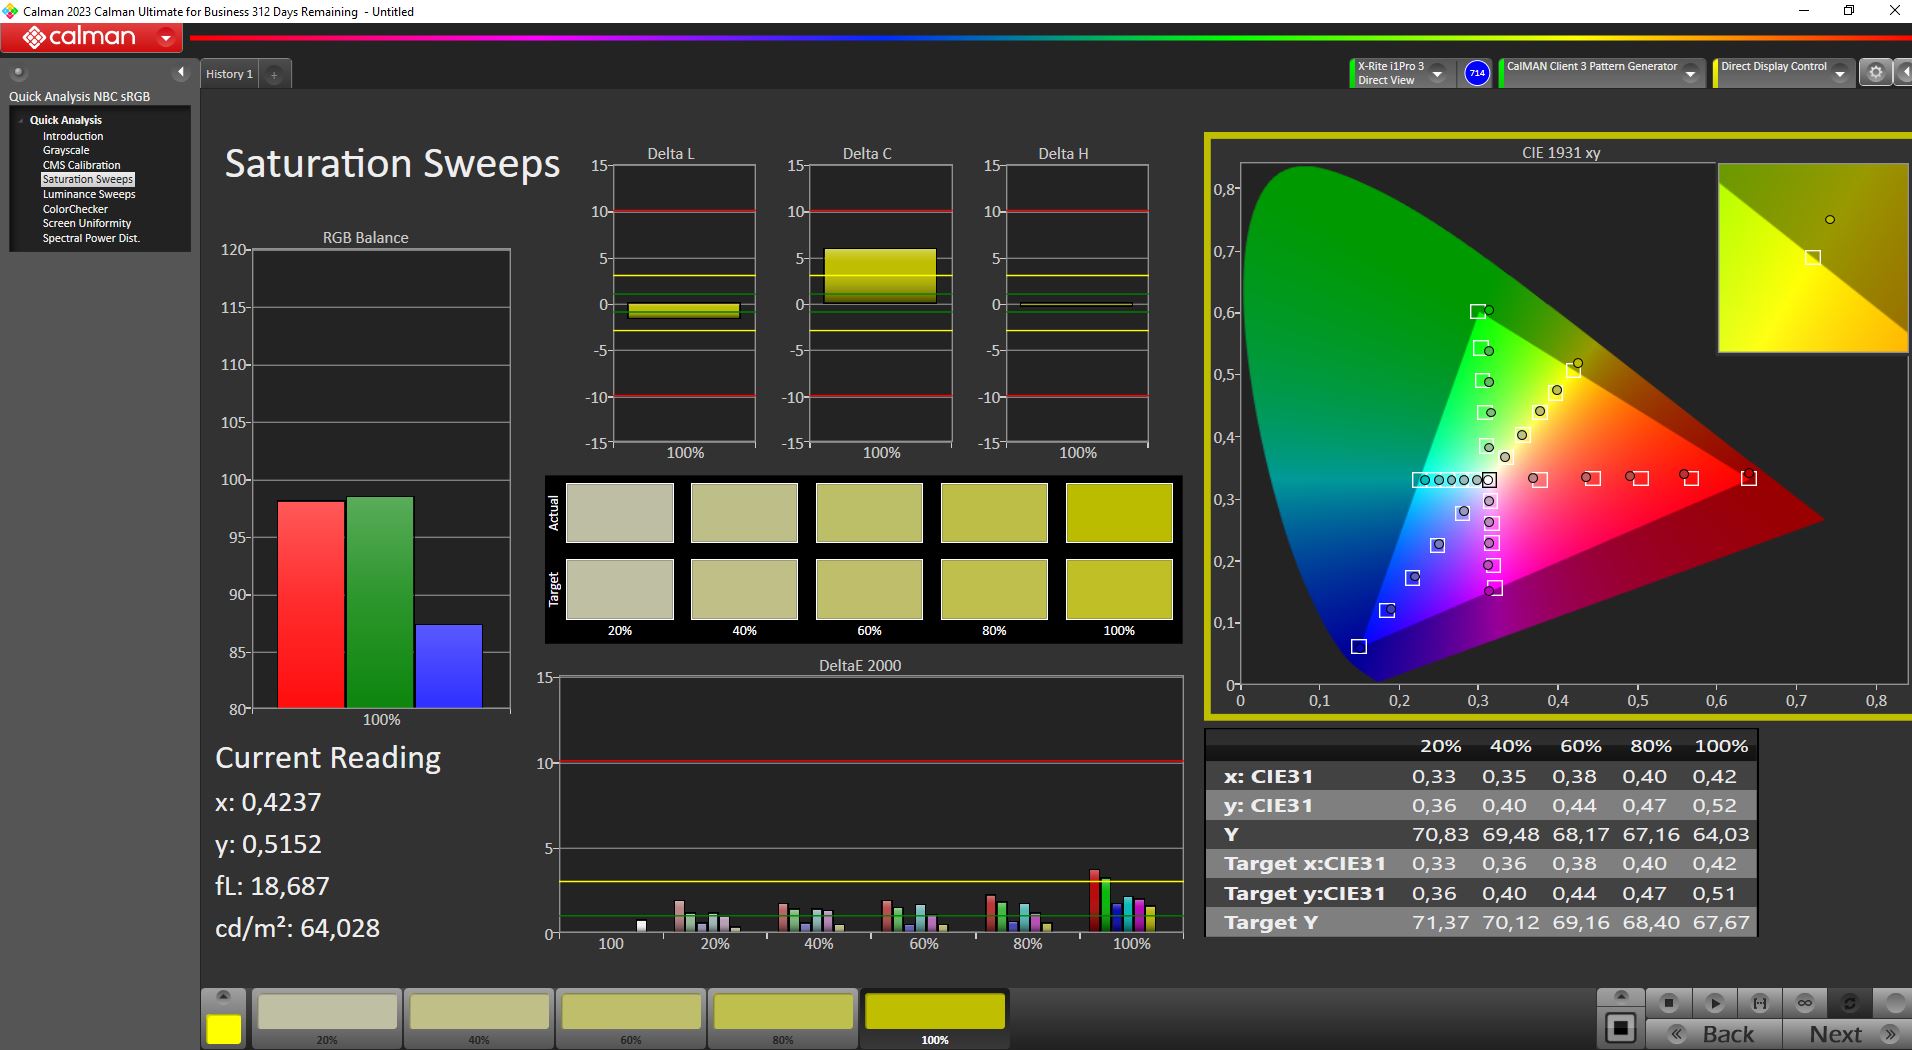
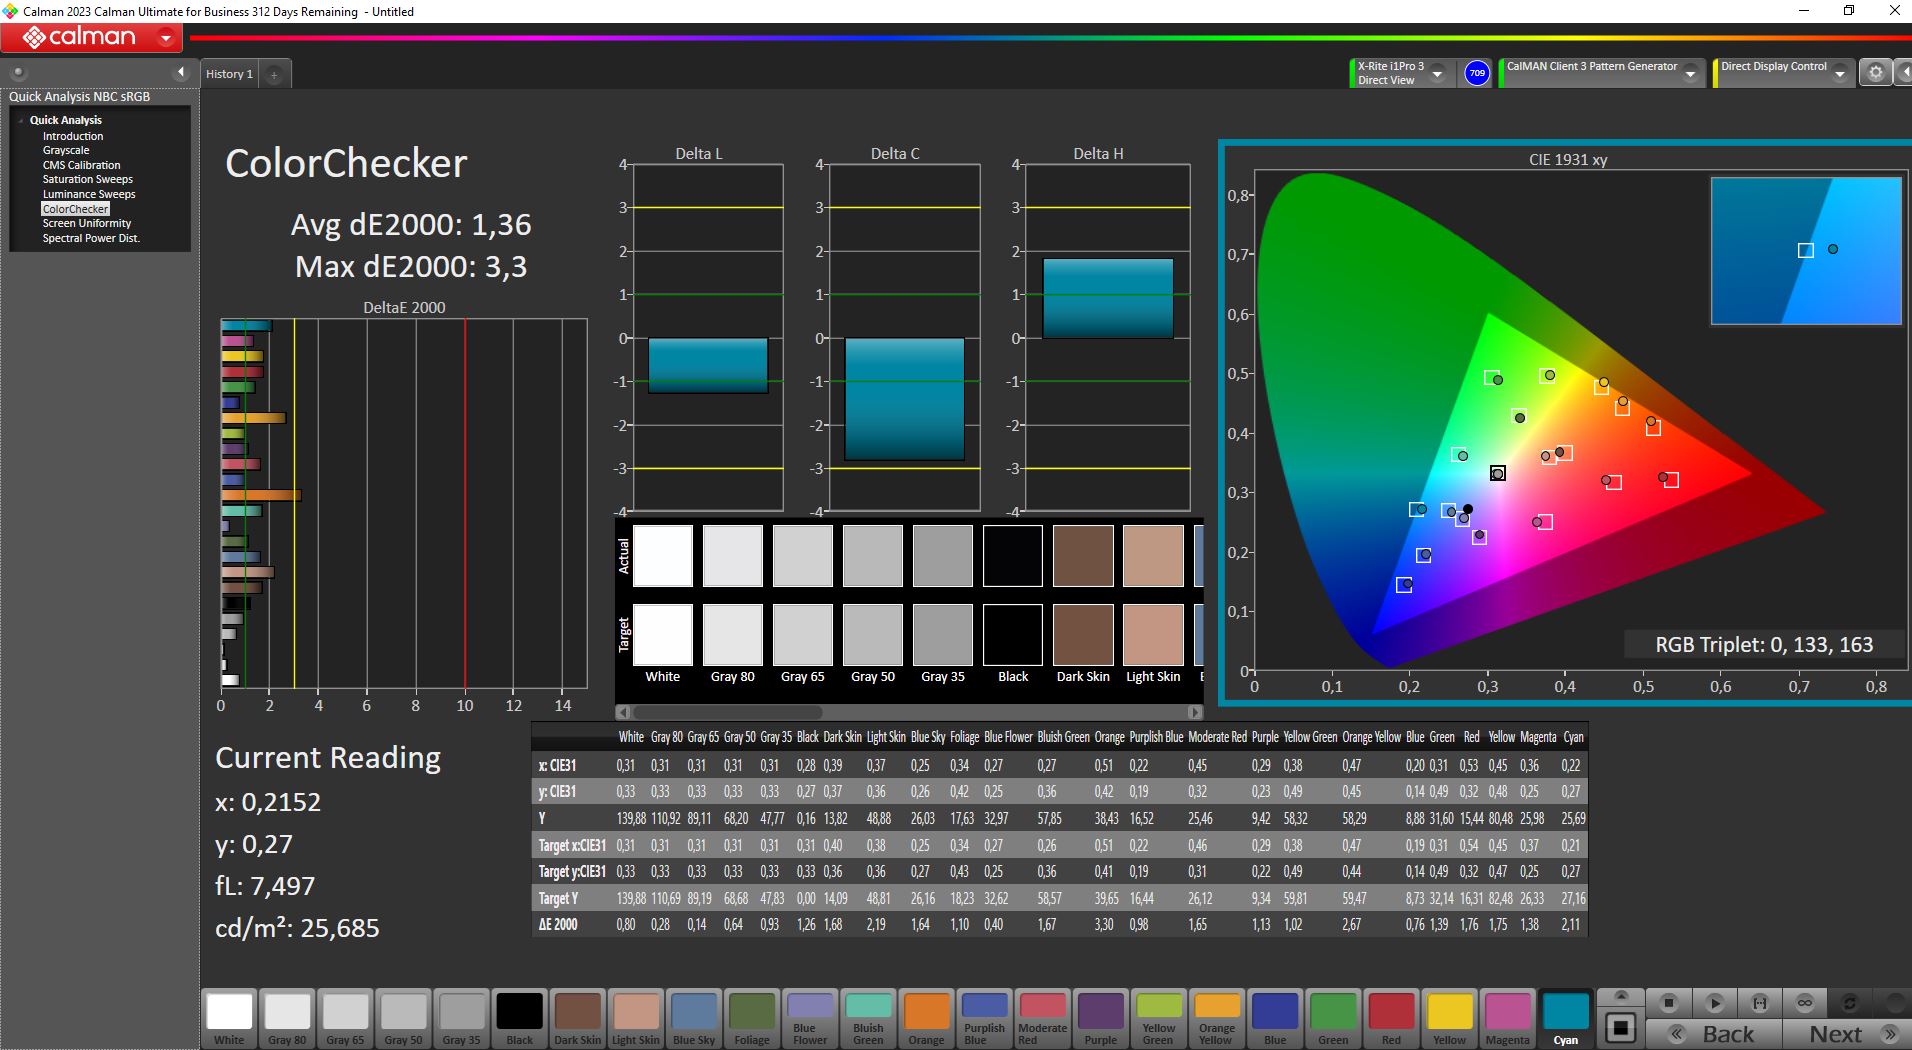
Den äldre panelen uppvisar tydliga svagheter när det gäller färgrymdstäckning, där även sRGB täcks till endast 90 procent i bästa fall. Trots bra DeltaE-värden kan panelen vara mindre lämplig för innehållsskapare.
Visa svarstider
| ↔ Svarstid svart till vitt | ||
|---|---|---|
| 9.6 ms ... stiga ↗ och falla ↘ kombinerat | ↗ 5.4 ms stiga | 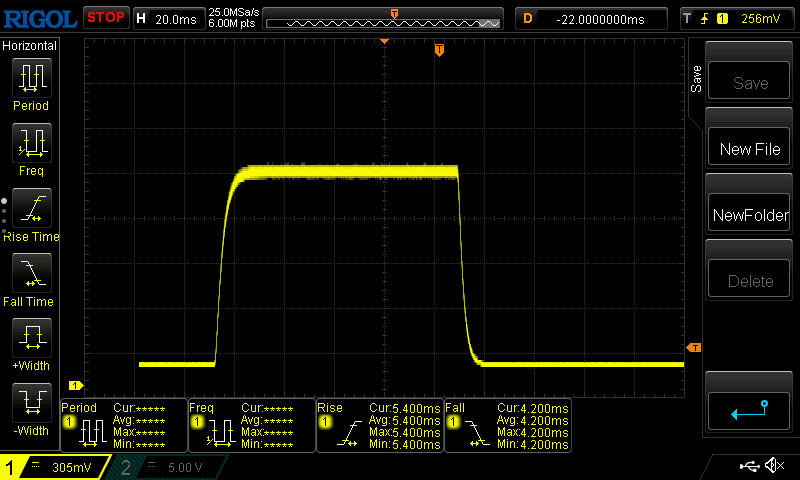 |
| ↘ 4.2 ms hösten | ||
| Skärmen visar snabba svarsfrekvenser i våra tester och bör passa för spel. I jämförelse sträcker sig alla testade enheter från 0.1 (minst) till 240 (maximalt) ms. » 26 % av alla enheter är bättre. Det betyder att den uppmätta svarstiden är bättre än genomsnittet av alla testade enheter (19.8 ms). | ||
| ↔ Svarstid 50 % grått till 80 % grått | ||
| 8 ms ... stiga ↗ och falla ↘ kombinerat | ↗ 3.8 ms stiga | 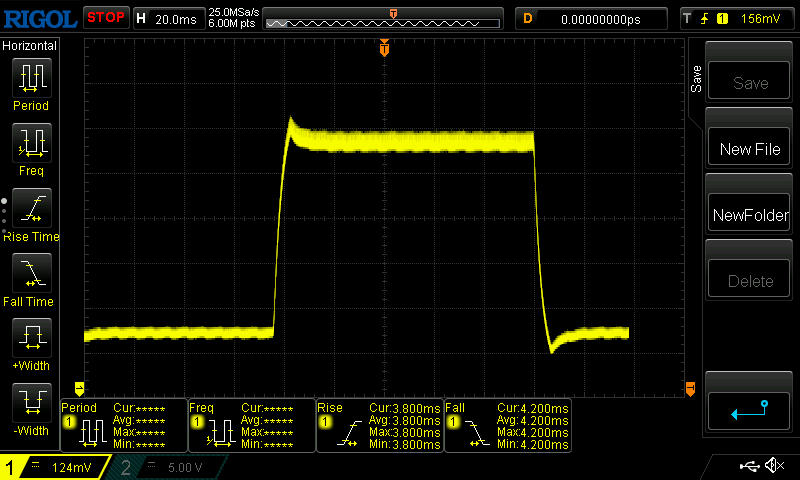 |
| ↘ 4.2 ms hösten | ||
| Skärmen visar snabba svarsfrekvenser i våra tester och bör passa för spel. I jämförelse sträcker sig alla testade enheter från 0.165 (minst) till 636 (maximalt) ms. » 21 % av alla enheter är bättre. Det betyder att den uppmätta svarstiden är bättre än genomsnittet av alla testade enheter (30.9 ms). | ||
Skärmflimmer / PWM (Puls-Width Modulation)
| Skärmflimmer / PWM upptäcktes inte | 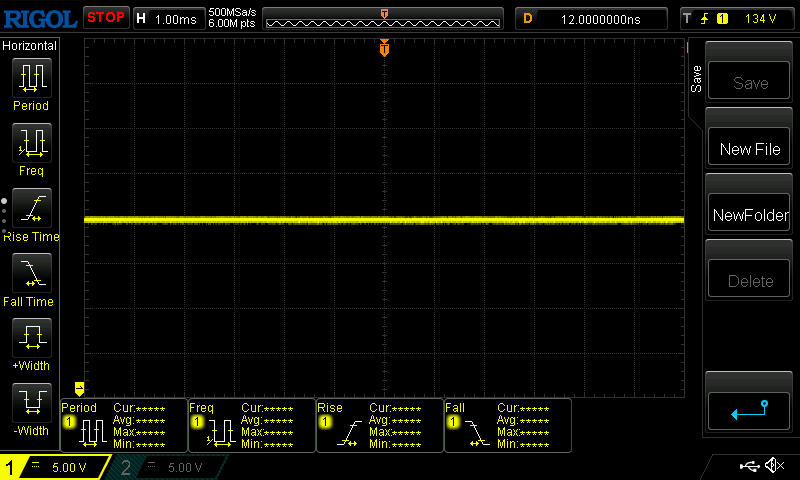 | ||
Som jämförelse: 52 % av alla testade enheter använder inte PWM för att dämpa skärmen. Om PWM upptäcktes mättes ett medelvärde av 7741 (minst: 5 - maximum: 343500) Hz. | |||
Den matta ytan, tillsammans med ljusstyrkan på 350 nits, säkerställer att arbete utomhus, åtminstone på en skuggig plats, inte är någon utmaning.
Prestanda - En bra kombination av i5-13500H och RTX 4050
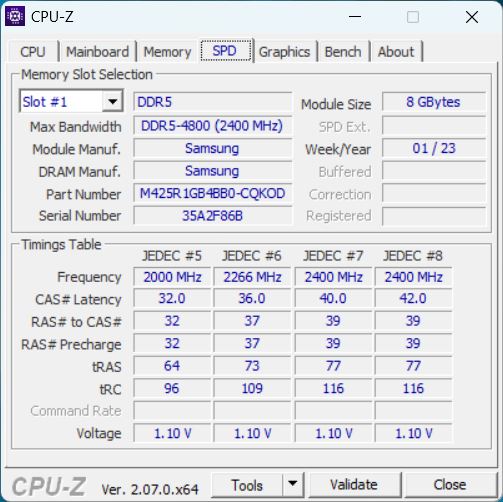
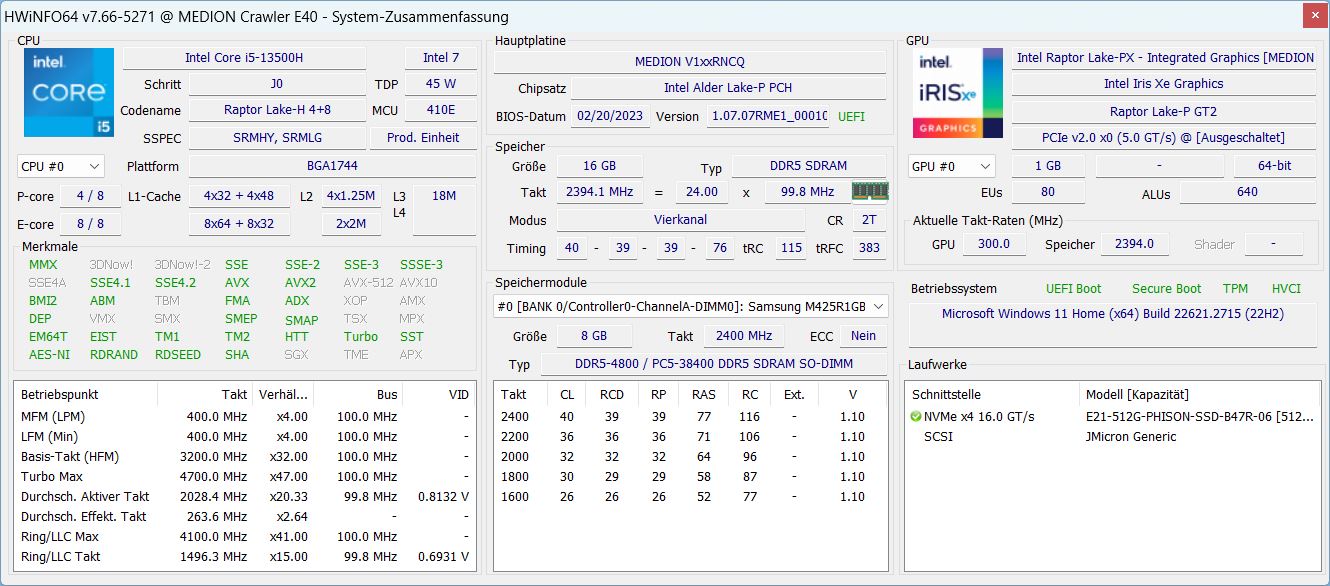
Med Crawler har vi en bärbar speldator i instegsklassen, vilket framgår av Nvidia GeForce RTX 4050 och Intel Core i5-13500Hsom båda är solida budgetvarianter bland spelkomponenter. Det finns också 16 GB modernt DDR5-4800 RAM-minne och en NVMe SSD med 512 GB, och lagringsutrymmet är också mer av ett budgetalternativ.
Detta gör den bärbara datorn lämplig för alla som inte nödvändigtvis behöver spela alla aktuella spel i maximala detaljer. För många spel bör dock prestandan i den inbyggda 1080p-upplösningen vara tillräcklig för höga detaljer. Innehållsskapare kan också vara intresserade av prestanda och enkel design, men skärmen kommer sannolikt att vara ett knockout-kriterium för verkligt kreativt arbete (bilder, videor).

Villkor för testning
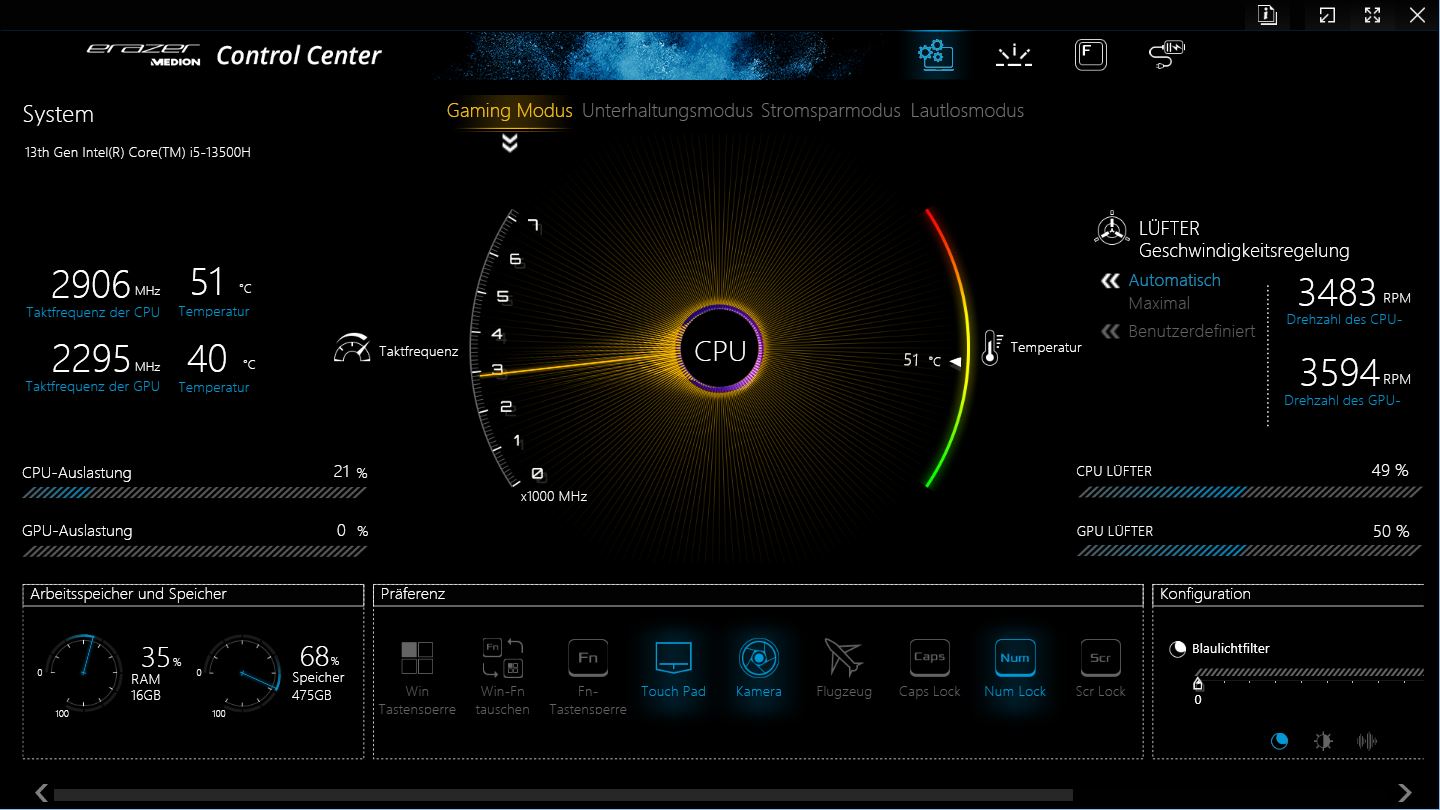
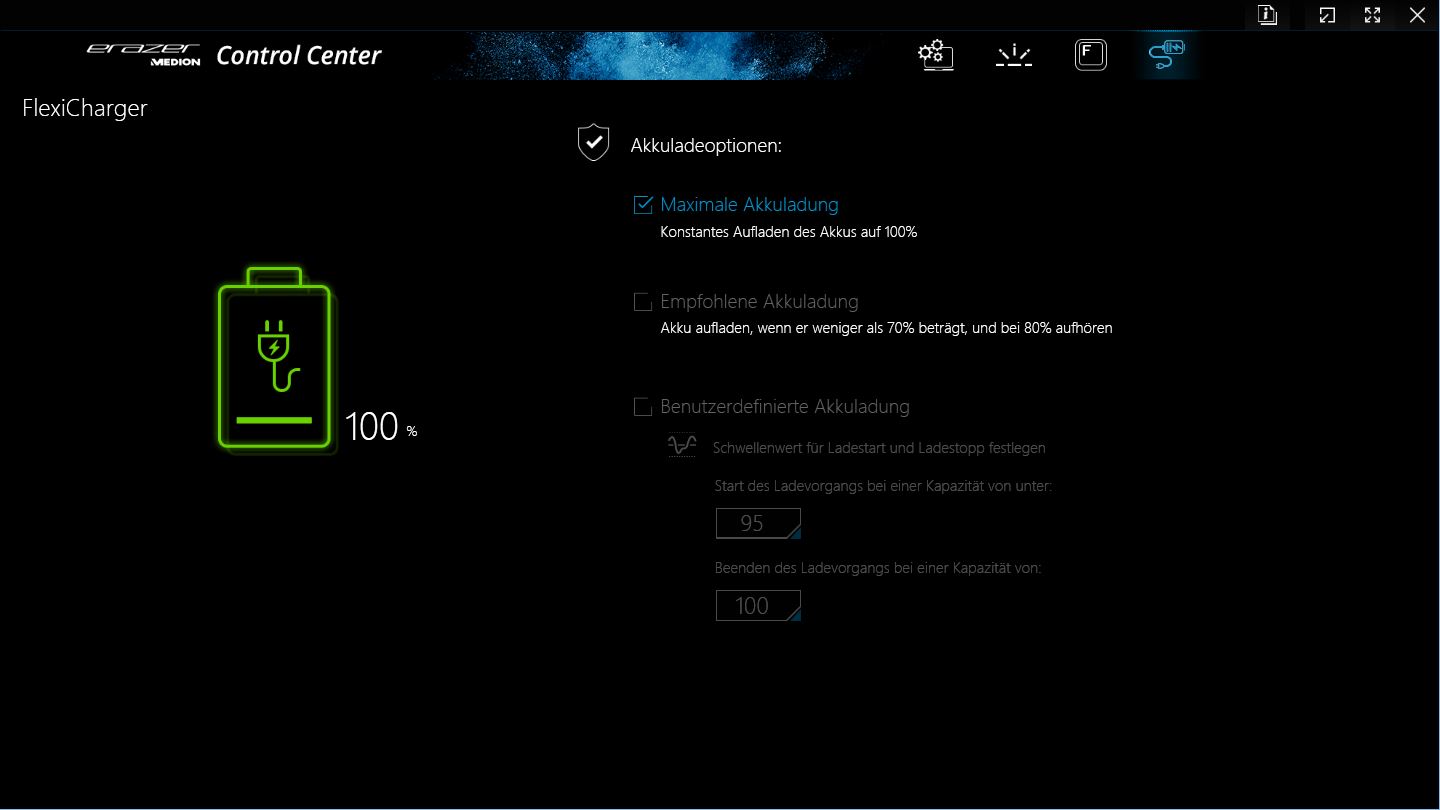
Medion har förinstallerat ett generiskt Control Center på Crawler E40, som innehåller prestandaprofiler, tangentbordsbelysning och andra inställningar. Appen är inte särskilt snabb och bearbetar ofta inmatningar med en liten fördröjning.
På huvudskärmen är det också lite irriterande att du måste bläddra längst ner till höger för att komma åt GPU-switchen (MSHybrid vs. dGPU, omstart krävs), till exempel, som kan utformas tydligare med lite ansträngning.
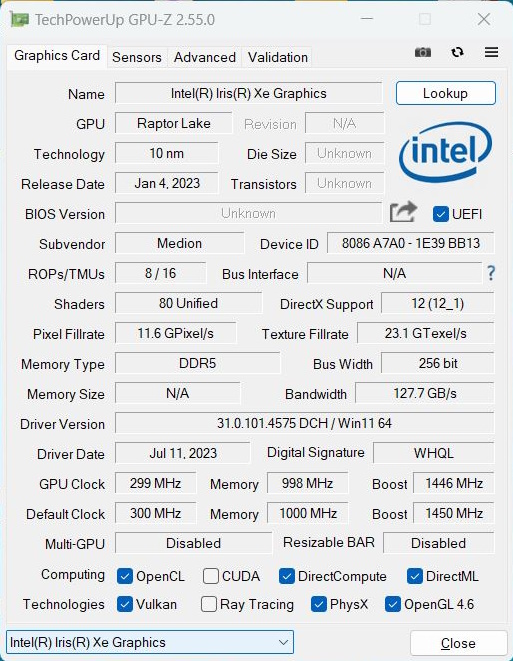
Vi använde spelläget för prestandatesterna och energisparläget för batteritesterna, eftersom dGPU är avaktiverat här och den integrerade GPU:n tar över.
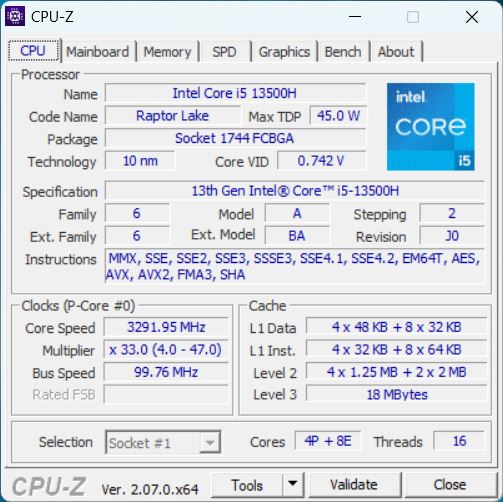
Processor
Intel Core i-1-1H Intel Core i5-13500H är en mellanklass-CPU från den nuvarande Raptor Lake-H-serien (Intel Gen13). Den har 4 av de möjliga 6 P-kärnorna och 8 E-kärnorna. Tillsammans har den 12 kärnor och 16 trådar (endast P-kärnorna stöder hyperthreading). E-basklockan är 1,9 GHz, P-kärnorna kan individuellt klocka upp till 4,7 GHz och tillsammans upp till 4,6 GHz.
För övrigt finns det en Medion Erazer Crawler E50 med Intel Gen 12 i5-12450H. Medions namngivningsschema är verkligen väldigt ogenomskinligt och kan vilseleda köpare, så var försiktig när du köper!
I våra benchmarks levererade processorn bra prestanda och är ganska mycket i nivå med en genomsnittlig i5-13500 från vår databas.
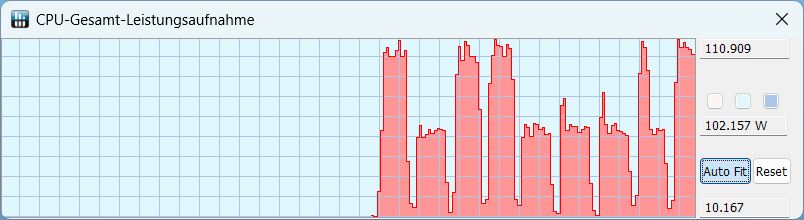
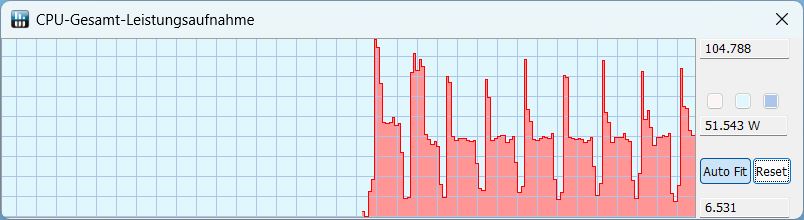
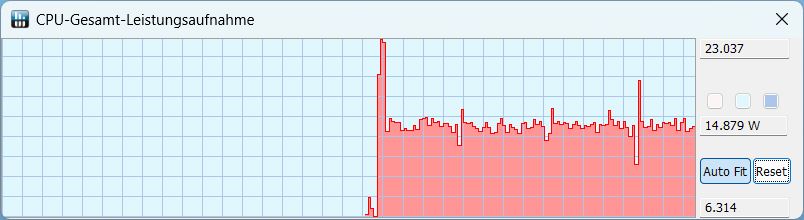
Under Cinebench R15-loopen visar processorn mycket konsekvent prestanda direkt från början utan en minskning efter de första körningarna. Tabellen nedan visar beteendet i de olika prestandalägena, inklusive batteriläget.
| Läge/Värde | Cinebench R15 poäng | CPU strömförbrukning Utbud | CPU strömförbrukning typisk |
|---|---|---|---|
| Spel | 2,331 | 60 - 110 W | 105 |
| Underhållning | 2.135 | 50-105 | 51 |
| Tyst | 835 | 15-23 | 15 |
| Batteri | 1 065 | 19-21 | 21 |
Cinebench R15 Multi Loop
Cinebench R23: Multi Core | Single Core
Cinebench R20: CPU (Multi Core) | CPU (Single Core)
Cinebench R15: CPU Multi 64Bit | CPU Single 64Bit
Blender: v2.79 BMW27 CPU
7-Zip 18.03: 7z b 4 | 7z b 4 -mmt1
Geekbench 5.5: Multi-Core | Single-Core
HWBOT x265 Benchmark v2.2: 4k Preset
LibreOffice : 20 Documents To PDF
R Benchmark 2.5: Overall mean
| CPU Performance rating | |
| Genomsnitt av klass Gaming | |
| Schenker XMG Apex 15 (Late 23) | |
| Lenovo LOQ 15IRH8 Core i7 | |
| MSI Katana 15 B12VEK | |
| Medion Erazer Crawler E40 - MD 62518 | |
| Genomsnitt Intel Core i5-13500H | |
| Asus TUF A15 FA507 | |
| Cinebench R23 / Multi Core | |
| Genomsnitt av klass Gaming (10488 - 42661, n=104, senaste 2 åren) | |
| Schenker XMG Apex 15 (Late 23) | |
| MSI Katana 15 B12VEK | |
| Lenovo LOQ 15IRH8 Core i7 | |
| Genomsnitt Intel Core i5-13500H (13542 - 16335, n=5) | |
| Medion Erazer Crawler E40 - MD 62518 | |
| Asus TUF A15 FA507 | |
| Cinebench R23 / Single Core | |
| Genomsnitt av klass Gaming (1601 - 2415, n=104, senaste 2 åren) | |
| Lenovo LOQ 15IRH8 Core i7 | |
| Medion Erazer Crawler E40 - MD 62518 | |
| Schenker XMG Apex 15 (Late 23) | |
| Genomsnitt Intel Core i5-13500H (1704 - 1799, n=5) | |
| MSI Katana 15 B12VEK | |
| Asus TUF A15 FA507 | |
| Cinebench R20 / CPU (Multi Core) | |
| Genomsnitt av klass Gaming (4029 - 16433, n=103, senaste 2 åren) | |
| Schenker XMG Apex 15 (Late 23) | |
| MSI Katana 15 B12VEK | |
| Lenovo LOQ 15IRH8 Core i7 | |
| Genomsnitt Intel Core i5-13500H (5108 - 6212, n=5) | |
| Asus TUF A15 FA507 | |
| Medion Erazer Crawler E40 - MD 62518 | |
| Cinebench R20 / CPU (Single Core) | |
| Genomsnitt av klass Gaming (622 - 913, n=103, senaste 2 åren) | |
| Lenovo LOQ 15IRH8 Core i7 | |
| Schenker XMG Apex 15 (Late 23) | |
| Medion Erazer Crawler E40 - MD 62518 | |
| Genomsnitt Intel Core i5-13500H (655 - 687, n=5) | |
| MSI Katana 15 B12VEK | |
| Asus TUF A15 FA507 | |
| Cinebench R15 / CPU Multi 64Bit | |
| Genomsnitt av klass Gaming (1578 - 6330, n=102, senaste 2 åren) | |
| Schenker XMG Apex 15 (Late 23) | |
| Medion Erazer Crawler E40 - MD 62518 | |
| Genomsnitt Intel Core i5-13500H (2234 - 2475, n=5) | |
| Lenovo LOQ 15IRH8 Core i7 | |
| Asus TUF A15 FA507 | |
| MSI Katana 15 B12VEK | |
| Cinebench R15 / CPU Single 64Bit | |
| Genomsnitt av klass Gaming (188.8 - 350, n=103, senaste 2 åren) | |
| Schenker XMG Apex 15 (Late 23) | |
| Lenovo LOQ 15IRH8 Core i7 | |
| Genomsnitt Intel Core i5-13500H (243 - 261, n=5) | |
| Asus TUF A15 FA507 | |
| Medion Erazer Crawler E40 - MD 62518 | |
| MSI Katana 15 B12VEK | |
| Blender / v2.79 BMW27 CPU | |
| Lenovo LOQ 15IRH8 Core i7 | |
| Genomsnitt Intel Core i5-13500H (205 - 263, n=6) | |
| MSI Katana 15 B12VEK | |
| Asus TUF A15 FA507 | |
| Medion Erazer Crawler E40 - MD 62518 | |
| Schenker XMG Apex 15 (Late 23) | |
| Genomsnitt av klass Gaming (79 - 330, n=101, senaste 2 åren) | |
| 7-Zip 18.03 / 7z b 4 | |
| Genomsnitt av klass Gaming (33491 - 148086, n=102, senaste 2 åren) | |
| Schenker XMG Apex 15 (Late 23) | |
| Asus TUF A15 FA507 | |
| MSI Katana 15 B12VEK | |
| Medion Erazer Crawler E40 - MD 62518 | |
| Lenovo LOQ 15IRH8 Core i7 | |
| Genomsnitt Intel Core i5-13500H (50846 - 58567, n=6) | |
| 7-Zip 18.03 / 7z b 4 -mmt1 | |
| Schenker XMG Apex 15 (Late 23) | |
| Genomsnitt av klass Gaming (4824 - 7436, n=102, senaste 2 åren) | |
| Lenovo LOQ 15IRH8 Core i7 | |
| Asus TUF A15 FA507 | |
| Genomsnitt Intel Core i5-13500H (5500 - 5885, n=6) | |
| MSI Katana 15 B12VEK | |
| Medion Erazer Crawler E40 - MD 62518 | |
| Geekbench 5.5 / Multi-Core | |
| Genomsnitt av klass Gaming (6460 - 28263, n=102, senaste 2 åren) | |
| Schenker XMG Apex 15 (Late 23) | |
| Lenovo LOQ 15IRH8 Core i7 | |
| MSI Katana 15 B12VEK | |
| Medion Erazer Crawler E40 - MD 62518 | |
| Genomsnitt Intel Core i5-13500H (9312 - 11465, n=5) | |
| Asus TUF A15 FA507 | |
| Geekbench 5.5 / Single-Core | |
| Genomsnitt av klass Gaming (1403 - 2474, n=102, senaste 2 åren) | |
| Schenker XMG Apex 15 (Late 23) | |
| Lenovo LOQ 15IRH8 Core i7 | |
| Genomsnitt Intel Core i5-13500H (1674 - 1762, n=5) | |
| Medion Erazer Crawler E40 - MD 62518 | |
| MSI Katana 15 B12VEK | |
| Asus TUF A15 FA507 | |
| HWBOT x265 Benchmark v2.2 / 4k Preset | |
| Genomsnitt av klass Gaming (11.5 - 44.4, n=102, senaste 2 åren) | |
| Schenker XMG Apex 15 (Late 23) | |
| Medion Erazer Crawler E40 - MD 62518 | |
| MSI Katana 15 B12VEK | |
| Asus TUF A15 FA507 | |
| Lenovo LOQ 15IRH8 Core i7 | |
| Genomsnitt Intel Core i5-13500H (14.4 - 17.9, n=6) | |
| LibreOffice / 20 Documents To PDF | |
| Medion Erazer Crawler E40 - MD 62518 | |
| Genomsnitt Intel Core i5-13500H (44 - 65.5, n=5) | |
| Asus TUF A15 FA507 | |
| Genomsnitt av klass Gaming (33.2 - 88.8, n=102, senaste 2 åren) | |
| MSI Katana 15 B12VEK | |
| Schenker XMG Apex 15 (Late 23) | |
| Lenovo LOQ 15IRH8 Core i7 | |
| R Benchmark 2.5 / Overall mean | |
| Asus TUF A15 FA507 | |
| MSI Katana 15 B12VEK | |
| Genomsnitt Intel Core i5-13500H (0.471 - 0.51, n=6) | |
| Medion Erazer Crawler E40 - MD 62518 | |
| Lenovo LOQ 15IRH8 Core i7 | |
| Schenker XMG Apex 15 (Late 23) | |
| Genomsnitt av klass Gaming (0.3439 - 0.59, n=102, senaste 2 åren) | |
* ... mindre är bättre
AIDA64: FP32 Ray-Trace | FPU Julia | CPU SHA3 | CPU Queen | FPU SinJulia | FPU Mandel | CPU AES | CPU ZLib | FP64 Ray-Trace | CPU PhotoWorxx
| Performance rating | |
| Genomsnitt av klass Gaming | |
| Schenker XMG Apex 15 (Late 23) | |
| Asus TUF A15 FA507 | |
| MSI Katana 15 B12VEK | |
| Medion Erazer Crawler E40 - MD 62518 | |
| Genomsnitt Intel Core i5-13500H | |
| Lenovo LOQ 15IRH8 Core i7 | |
| AIDA64 / FP32 Ray-Trace | |
| Genomsnitt av klass Gaming (10227 - 85542, n=102, senaste 2 åren) | |
| Schenker XMG Apex 15 (Late 23) | |
| Asus TUF A15 FA507 | |
| MSI Katana 15 B12VEK | |
| Medion Erazer Crawler E40 - MD 62518 | |
| Genomsnitt Intel Core i5-13500H (11081 - 15390, n=6) | |
| Lenovo LOQ 15IRH8 Core i7 | |
| AIDA64 / FPU Julia | |
| Genomsnitt av klass Gaming (51376 - 372155, n=102, senaste 2 åren) | |
| Schenker XMG Apex 15 (Late 23) | |
| Asus TUF A15 FA507 | |
| MSI Katana 15 B12VEK | |
| Medion Erazer Crawler E40 - MD 62518 | |
| Genomsnitt Intel Core i5-13500H (56813 - 74251, n=6) | |
| Lenovo LOQ 15IRH8 Core i7 | |
| AIDA64 / CPU SHA3 | |
| Genomsnitt av klass Gaming (2180 - 10115, n=102, senaste 2 åren) | |
| Schenker XMG Apex 15 (Late 23) | |
| Medion Erazer Crawler E40 - MD 62518 | |
| Asus TUF A15 FA507 | |
| MSI Katana 15 B12VEK | |
| Genomsnitt Intel Core i5-13500H (2621 - 3623, n=6) | |
| Lenovo LOQ 15IRH8 Core i7 | |
| AIDA64 / CPU Queen | |
| Genomsnitt av klass Gaming (49785 - 173351, n=86, senaste 2 åren) | |
| Schenker XMG Apex 15 (Late 23) | |
| Asus TUF A15 FA507 | |
| MSI Katana 15 B12VEK | |
| Medion Erazer Crawler E40 - MD 62518 | |
| Genomsnitt Intel Core i5-13500H (77835 - 85727, n=6) | |
| Lenovo LOQ 15IRH8 Core i7 | |
| AIDA64 / FPU SinJulia | |
| Schenker XMG Apex 15 (Late 23) | |
| Genomsnitt av klass Gaming (4424 - 33636, n=102, senaste 2 åren) | |
| Asus TUF A15 FA507 | |
| MSI Katana 15 B12VEK | |
| Medion Erazer Crawler E40 - MD 62518 | |
| Genomsnitt Intel Core i5-13500H (7249 - 8086, n=6) | |
| Lenovo LOQ 15IRH8 Core i7 | |
| AIDA64 / FPU Mandel | |
| Genomsnitt av klass Gaming (25115 - 196829, n=102, senaste 2 åren) | |
| Schenker XMG Apex 15 (Late 23) | |
| Asus TUF A15 FA507 | |
| MSI Katana 15 B12VEK | |
| Medion Erazer Crawler E40 - MD 62518 | |
| Genomsnitt Intel Core i5-13500H (27820 - 38336, n=6) | |
| Lenovo LOQ 15IRH8 Core i7 | |
| AIDA64 / CPU AES | |
| Schenker XMG Apex 15 (Late 23) | |
| Genomsnitt av klass Gaming (39258 - 247074, n=102, senaste 2 åren) | |
| Genomsnitt Intel Core i5-13500H (62657 - 120493, n=6) | |
| MSI Katana 15 B12VEK | |
| Asus TUF A15 FA507 | |
| Medion Erazer Crawler E40 - MD 62518 | |
| Lenovo LOQ 15IRH8 Core i7 | |
| AIDA64 / CPU ZLib | |
| Genomsnitt av klass Gaming (574 - 2531, n=102, senaste 2 åren) | |
| Schenker XMG Apex 15 (Late 23) | |
| Medion Erazer Crawler E40 - MD 62518 | |
| Genomsnitt Intel Core i5-13500H (782 - 992, n=6) | |
| MSI Katana 15 B12VEK | |
| Lenovo LOQ 15IRH8 Core i7 | |
| Asus TUF A15 FA507 | |
| AIDA64 / FP64 Ray-Trace | |
| Genomsnitt av klass Gaming (5509 - 45446, n=102, senaste 2 åren) | |
| Schenker XMG Apex 15 (Late 23) | |
| Asus TUF A15 FA507 | |
| MSI Katana 15 B12VEK | |
| Medion Erazer Crawler E40 - MD 62518 | |
| Genomsnitt Intel Core i5-13500H (5955 - 8495, n=6) | |
| Lenovo LOQ 15IRH8 Core i7 | |
| AIDA64 / CPU PhotoWorxx | |
| Genomsnitt av klass Gaming (12271 - 89891, n=102, senaste 2 åren) | |
| MSI Katana 15 B12VEK | |
| Medion Erazer Crawler E40 - MD 62518 | |
| Schenker XMG Apex 15 (Late 23) | |
| Lenovo LOQ 15IRH8 Core i7 | |
| Genomsnitt Intel Core i5-13500H (20212 - 37618, n=6) | |
| Asus TUF A15 FA507 | |
Systemets prestanda
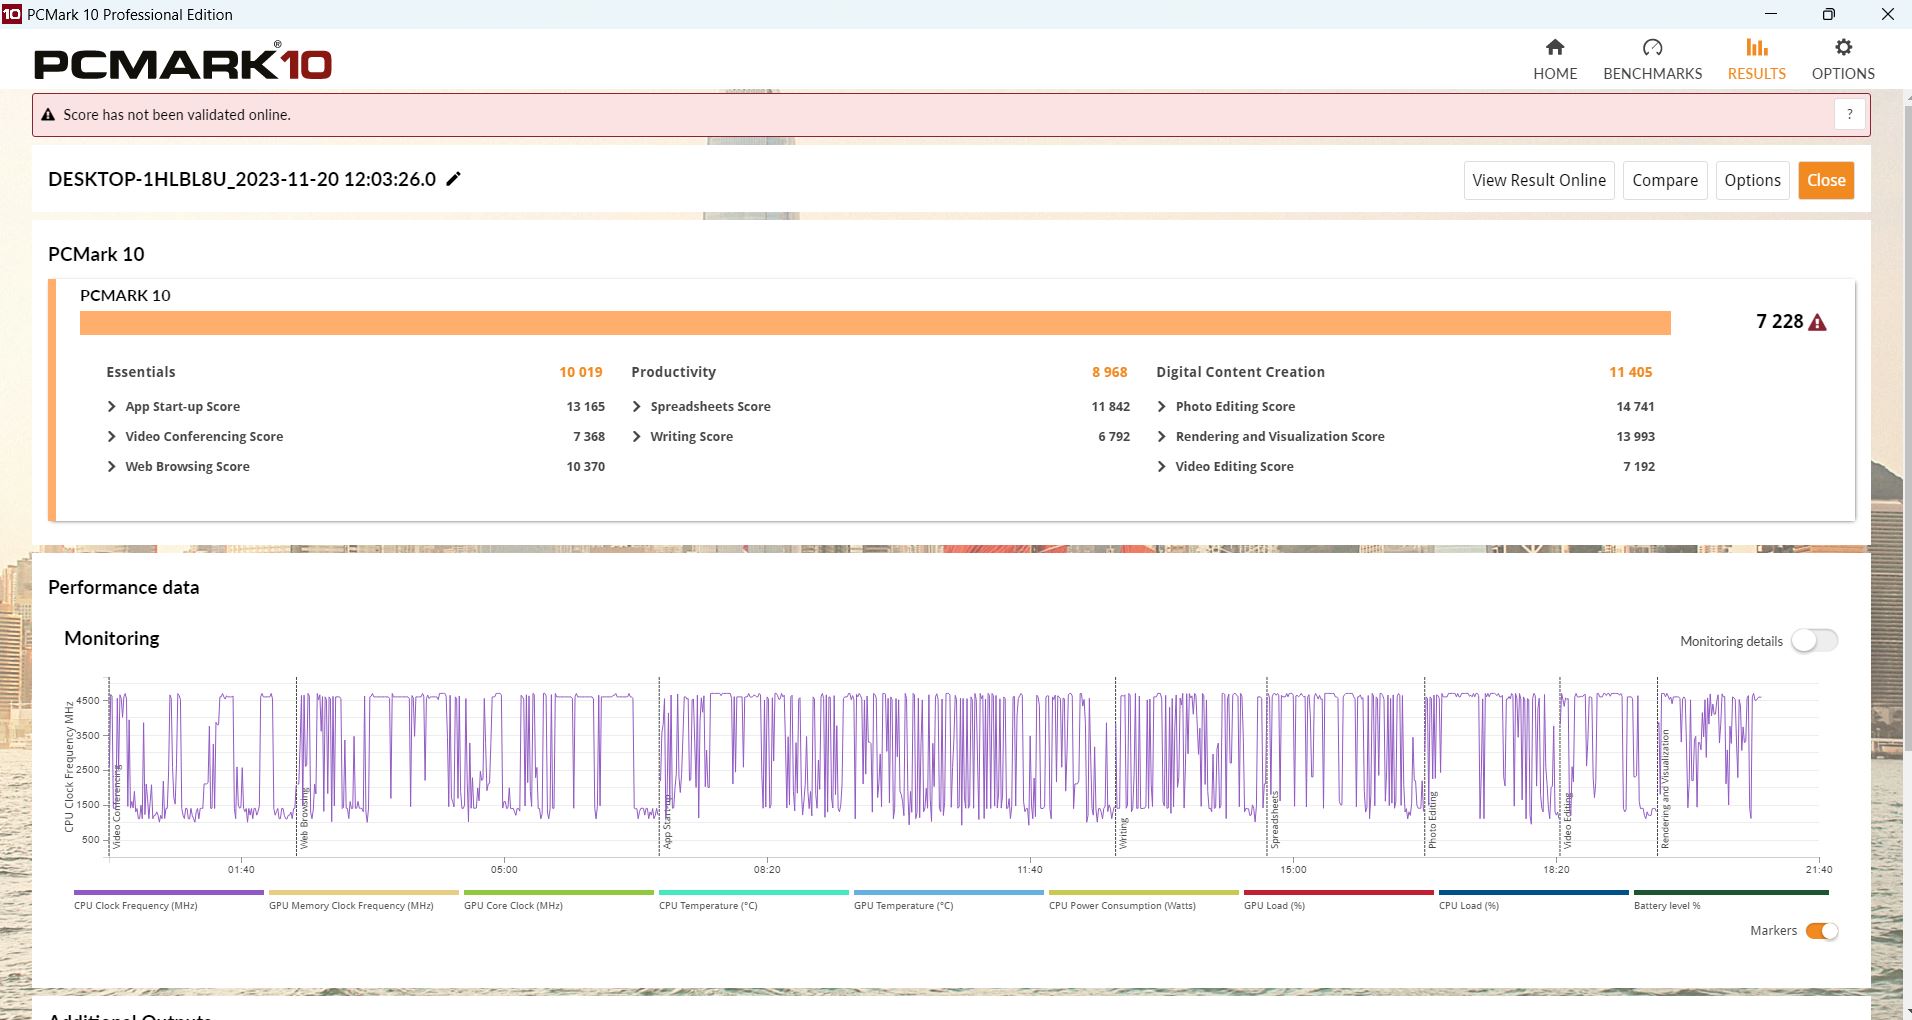
I PCMark 10 är XMG Apex 15 och Lenovo LOQ 15 något bättre, särskilt inom Productivity och Essentials. Crawler är likvärdig i Digital Content Creation. Endast LOQ 15 är något snabbare i Crossmark.
CrossMark: Overall | Productivity | Creativity | Responsiveness
| PCMark 10 / Score | |
| Genomsnitt av klass Gaming (5828 - 12414, n=93, senaste 2 åren) | |
| Schenker XMG Apex 15 (Late 23) | |
| Lenovo LOQ 15IRH8 Core i7 | |
| Medion Erazer Crawler E40 - MD 62518 | |
| Asus TUF A15 FA507 | |
| Genomsnitt Intel Core i5-13500H, NVIDIA GeForce RTX 4050 Laptop GPU (6812 - 7228, n=2) | |
| MSI Katana 15 B12VEK | |
| PCMark 10 / Essentials | |
| Lenovo LOQ 15IRH8 Core i7 | |
| Schenker XMG Apex 15 (Late 23) | |
| Genomsnitt av klass Gaming (8810 - 11935, n=97, senaste 2 åren) | |
| Asus TUF A15 FA507 | |
| MSI Katana 15 B12VEK | |
| Medion Erazer Crawler E40 - MD 62518 | |
| Genomsnitt Intel Core i5-13500H, NVIDIA GeForce RTX 4050 Laptop GPU (9521 - 10019, n=2) | |
| PCMark 10 / Productivity | |
| Genomsnitt av klass Gaming (6845 - 25323, n=95, senaste 2 åren) | |
| Schenker XMG Apex 15 (Late 23) | |
| MSI Katana 15 B12VEK | |
| Lenovo LOQ 15IRH8 Core i7 | |
| Asus TUF A15 FA507 | |
| Medion Erazer Crawler E40 - MD 62518 | |
| Genomsnitt Intel Core i5-13500H, NVIDIA GeForce RTX 4050 Laptop GPU (8890 - 8968, n=2) | |
| PCMark 10 / Digital Content Creation | |
| Genomsnitt av klass Gaming (7602 - 19954, n=95, senaste 2 åren) | |
| Lenovo LOQ 15IRH8 Core i7 | |
| Schenker XMG Apex 15 (Late 23) | |
| Medion Erazer Crawler E40 - MD 62518 | |
| Genomsnitt Intel Core i5-13500H, NVIDIA GeForce RTX 4050 Laptop GPU (10134 - 11405, n=2) | |
| Asus TUF A15 FA507 | |
| MSI Katana 15 B12VEK | |
| CrossMark / Overall | |
| Genomsnitt av klass Gaming (1366 - 2409, n=94, senaste 2 åren) | |
| Lenovo LOQ 15IRH8 Core i7 | |
| Medion Erazer Crawler E40 - MD 62518 | |
| Genomsnitt Intel Core i5-13500H, NVIDIA GeForce RTX 4050 Laptop GPU (n=1) | |
| Schenker XMG Apex 15 (Late 23) | |
| MSI Katana 15 B12VEK | |
| Asus TUF A15 FA507 | |
| CrossMark / Productivity | |
| Genomsnitt av klass Gaming (1386 - 2254, n=94, senaste 2 åren) | |
| Lenovo LOQ 15IRH8 Core i7 | |
| Medion Erazer Crawler E40 - MD 62518 | |
| Genomsnitt Intel Core i5-13500H, NVIDIA GeForce RTX 4050 Laptop GPU (n=1) | |
| Schenker XMG Apex 15 (Late 23) | |
| MSI Katana 15 B12VEK | |
| Asus TUF A15 FA507 | |
| CrossMark / Creativity | |
| Genomsnitt av klass Gaming (1343 - 2786, n=94, senaste 2 åren) | |
| Lenovo LOQ 15IRH8 Core i7 | |
| Schenker XMG Apex 15 (Late 23) | |
| Medion Erazer Crawler E40 - MD 62518 | |
| Genomsnitt Intel Core i5-13500H, NVIDIA GeForce RTX 4050 Laptop GPU (n=1) | |
| MSI Katana 15 B12VEK | |
| Asus TUF A15 FA507 | |
| CrossMark / Responsiveness | |
| Lenovo LOQ 15IRH8 Core i7 | |
| Medion Erazer Crawler E40 - MD 62518 | |
| Genomsnitt Intel Core i5-13500H, NVIDIA GeForce RTX 4050 Laptop GPU (n=1) | |
| Genomsnitt av klass Gaming (1226 - 2334, n=94, senaste 2 åren) | |
| MSI Katana 15 B12VEK | |
| Schenker XMG Apex 15 (Late 23) | |
| Asus TUF A15 FA507 | |
| PCMark 10 Score | 7228 poäng | |
Hjälp | ||
| AIDA64 / Memory Copy | |
| Genomsnitt av klass Gaming (21750 - 129946, n=102, senaste 2 åren) | |
| Schenker XMG Apex 15 (Late 23) | |
| Medion Erazer Crawler E40 - MD 62518 | |
| MSI Katana 15 B12VEK | |
| Lenovo LOQ 15IRH8 Core i7 | |
| Genomsnitt Intel Core i5-13500H (36916 - 57830, n=6) | |
| Asus TUF A15 FA507 | |
| AIDA64 / Memory Read | |
| Genomsnitt av klass Gaming (22956 - 118858, n=102, senaste 2 åren) | |
| MSI Katana 15 B12VEK | |
| Medion Erazer Crawler E40 - MD 62518 | |
| Lenovo LOQ 15IRH8 Core i7 | |
| Schenker XMG Apex 15 (Late 23) | |
| Genomsnitt Intel Core i5-13500H (41676 - 65633, n=6) | |
| Asus TUF A15 FA507 | |
| AIDA64 / Memory Write | |
| Schenker XMG Apex 15 (Late 23) | |
| Genomsnitt av klass Gaming (22297 - 135096, n=102, senaste 2 åren) | |
| Medion Erazer Crawler E40 - MD 62518 | |
| MSI Katana 15 B12VEK | |
| Asus TUF A15 FA507 | |
| Lenovo LOQ 15IRH8 Core i7 | |
| Genomsnitt Intel Core i5-13500H (36826 - 60523, n=6) | |
| AIDA64 / Memory Latency | |
| Lenovo LOQ 15IRH8 Core i7 | |
| Genomsnitt av klass Gaming (75.3 - 165.4, n=102, senaste 2 åren) | |
| Medion Erazer Crawler E40 - MD 62518 | |
| MSI Katana 15 B12VEK | |
| Genomsnitt Intel Core i5-13500H (86.2 - 96.1, n=6) | |
| Schenker XMG Apex 15 (Late 23) | |
| Asus TUF A15 FA507 | |
* ... mindre är bättre
DPC-fördröjning
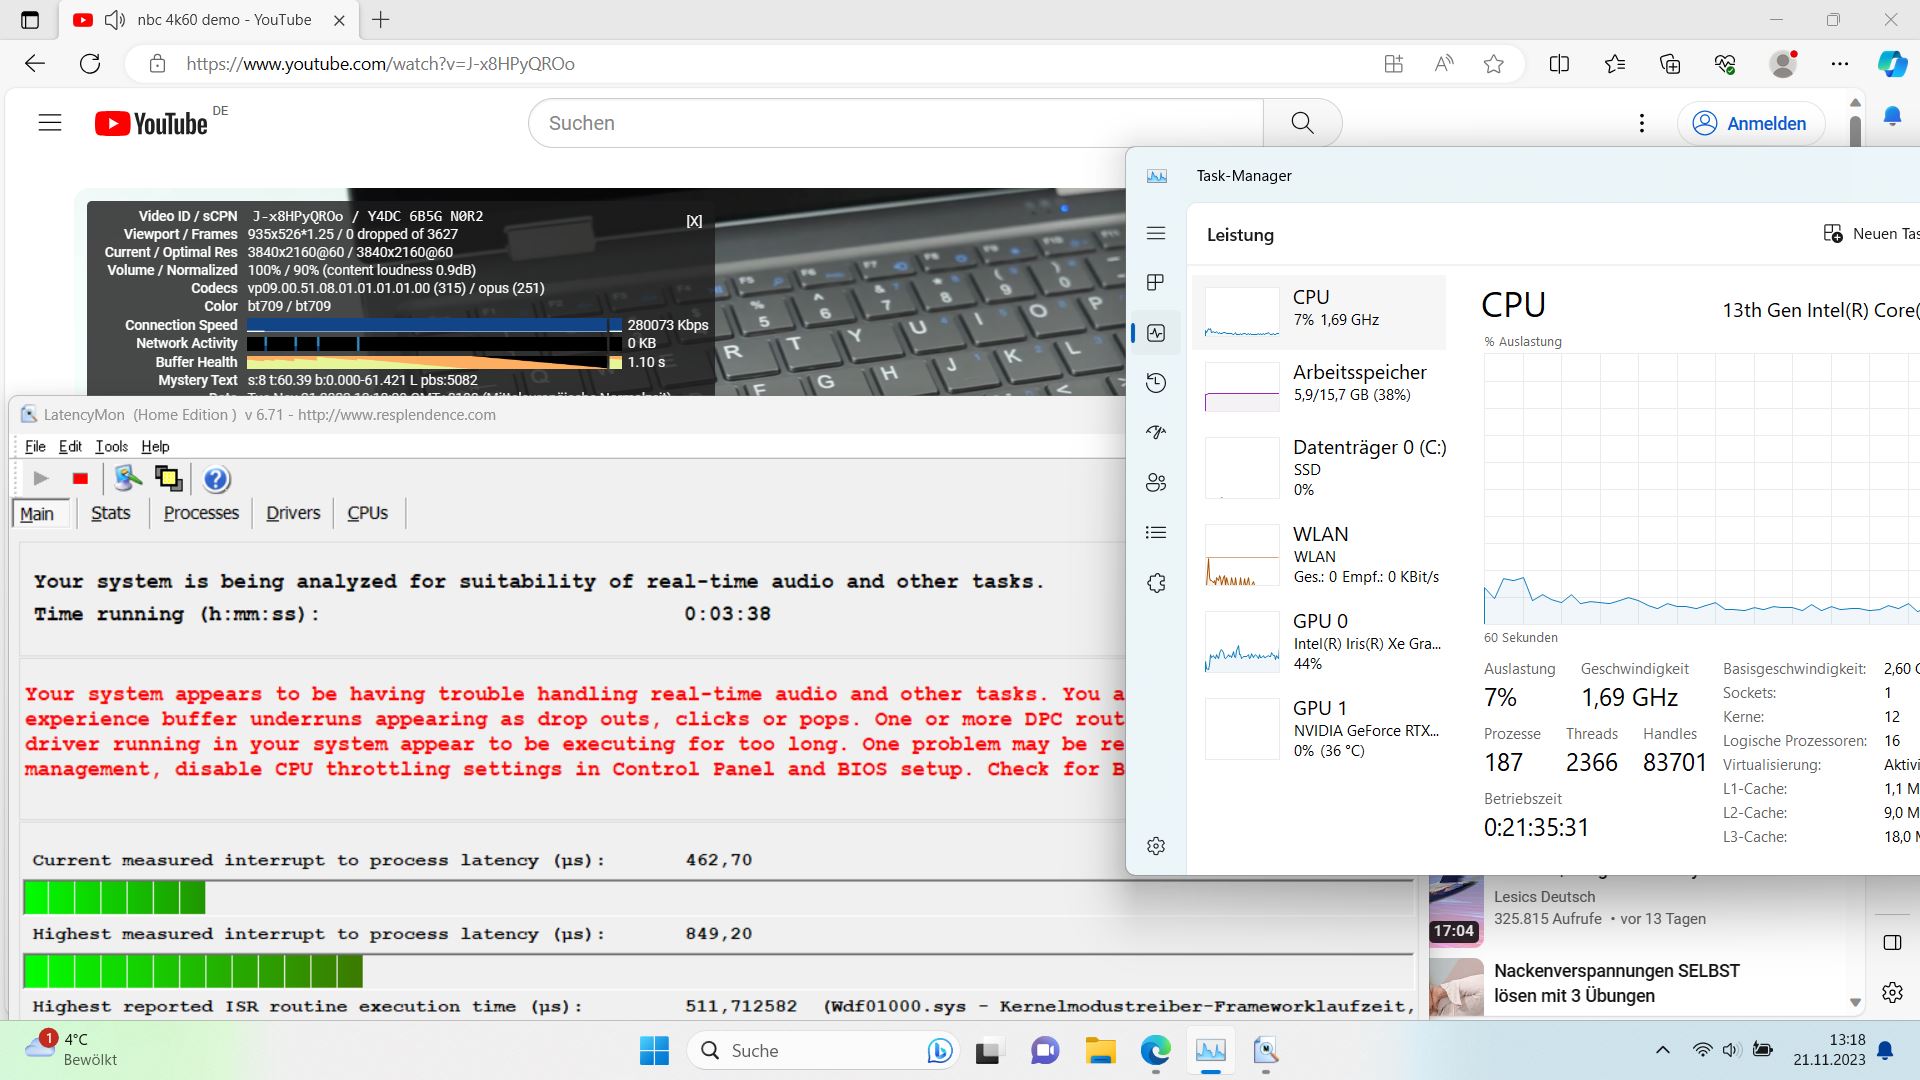
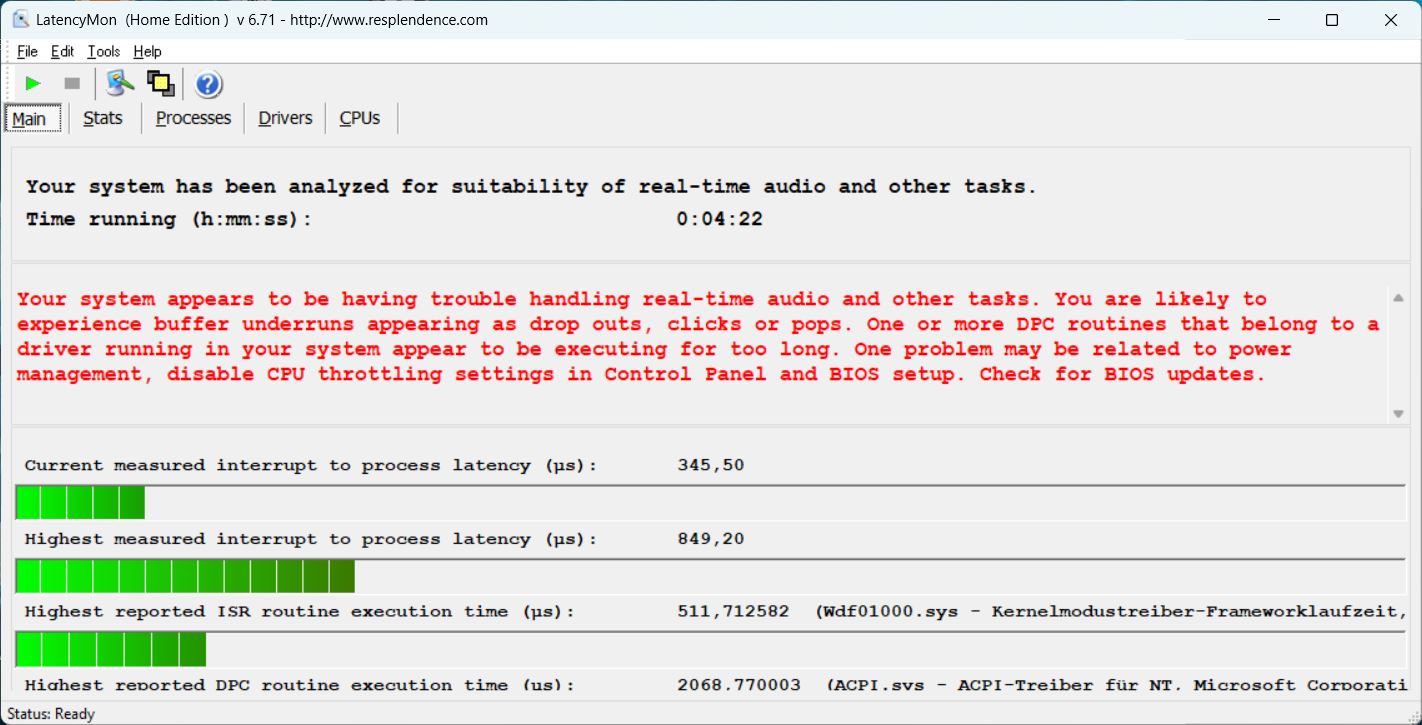
Det finns inga problem när du öppnar webbläsaren eller flera flikar. LatencyMon upptäcker dock några problem när vi spelar upp vår 4K/60 fps YouTube-video. Åtminstone spelas den upp utan några tappade bildrutor. Latensvärdet ökar något under Prime95.
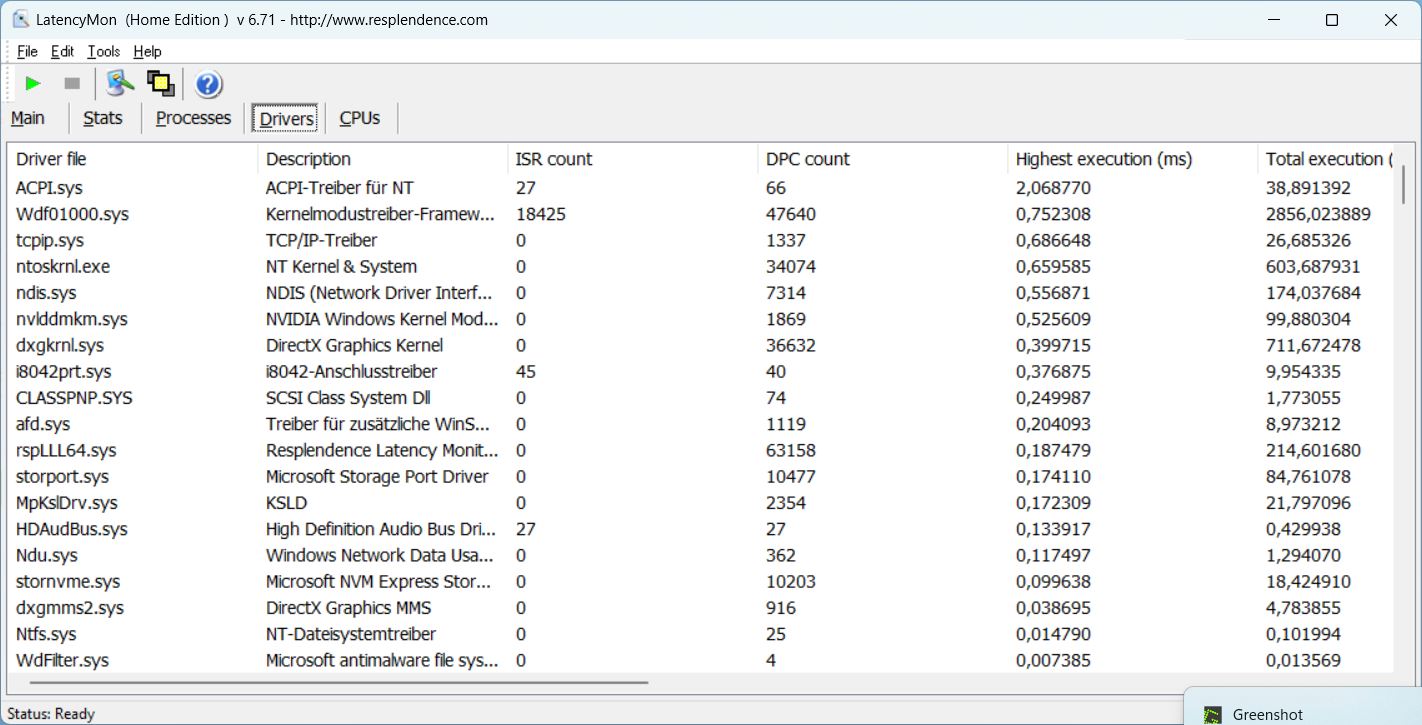
| DPC Latencies / LatencyMon - interrupt to process latency (max), Web, Youtube, Prime95 | |
| MSI Katana 15 B12VEK | |
| Medion Erazer Crawler E40 - MD 62518 | |
| Lenovo LOQ 15IRH8 Core i7 | |
| Schenker XMG Apex 15 (Late 23) | |
* ... mindre är bättre
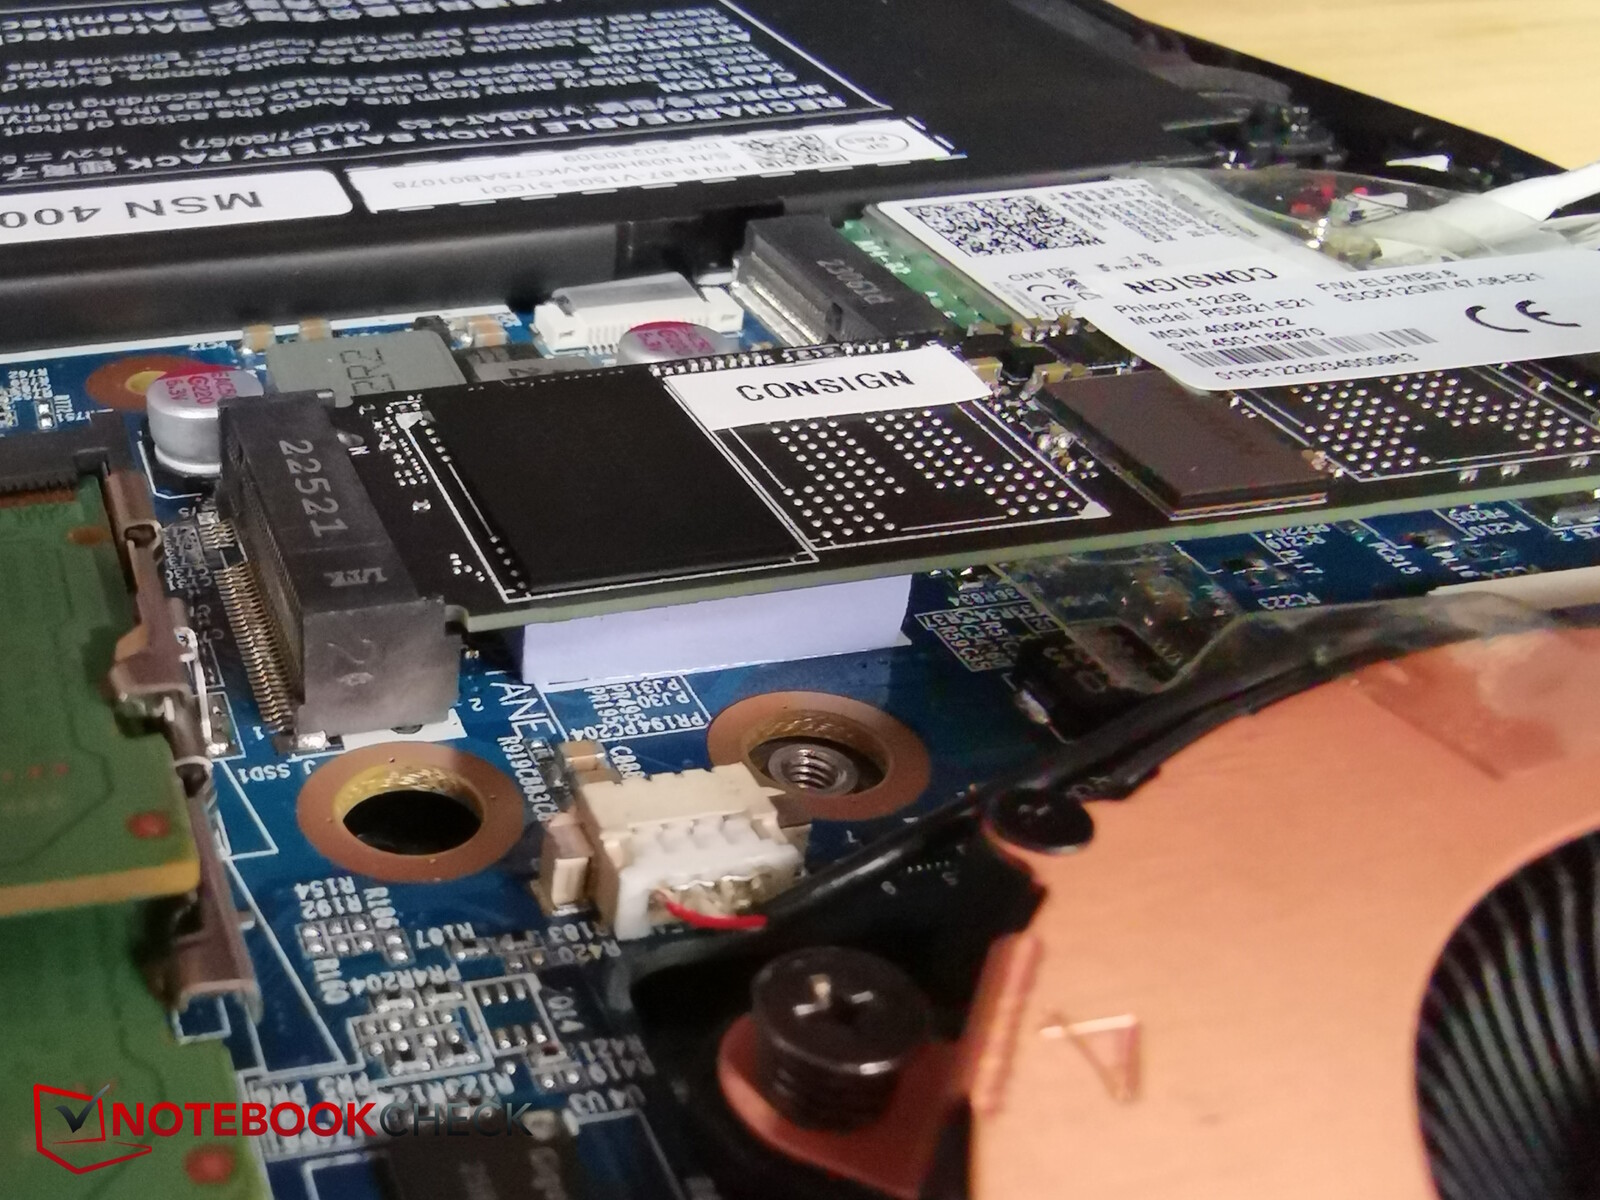
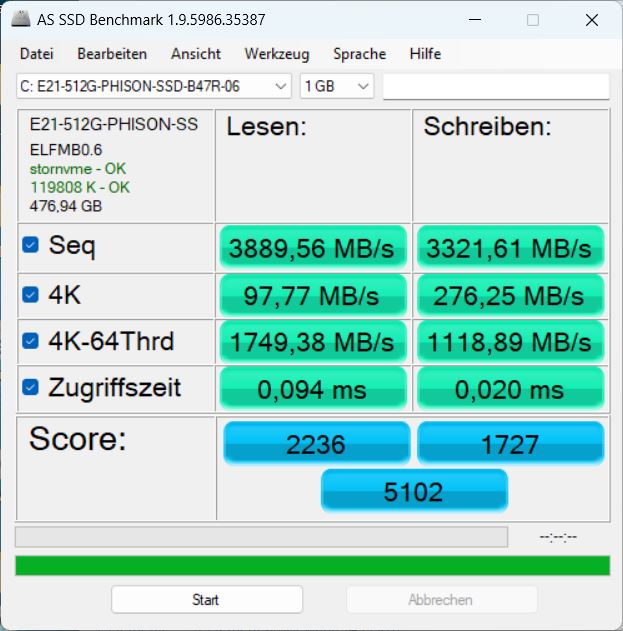
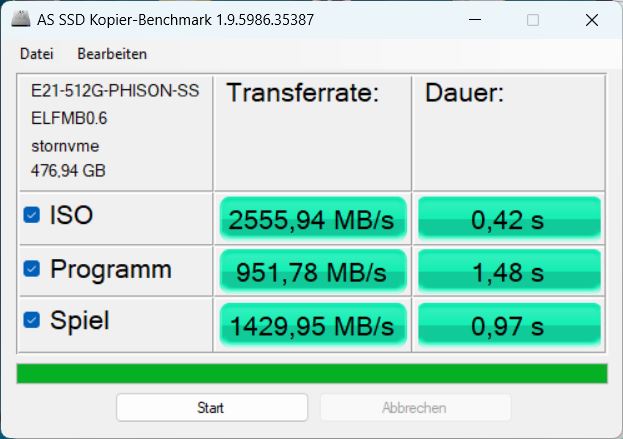
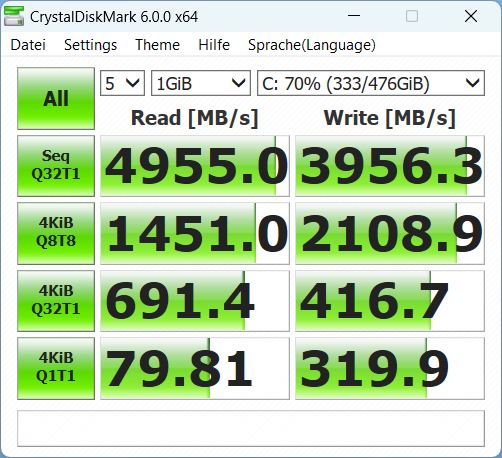
Lagringsenheter
Medion använder en 512 GB NVMe SSD från Phison. Även om detta inte kommer i närheten av hastigheten hos Samsung 990 Pro i XMG Apex 15, överträffar den lagringsutrymmet hos de andra tre konkurrenterna och dess prestanda är också mycket konsekvent över en längre tidsperiod. Det finns fler SSD-jämförelser i vår SSD-bästalista.

* ... mindre är bättre
Continuous power read: DiskSpd Read Loop, Queue Depth 8
Grafikkort
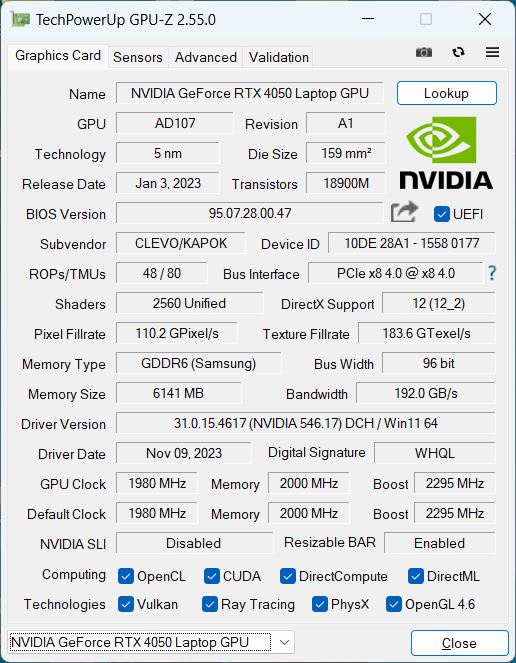
I vår E40 crawler, en RTX 4050 med en maximal effekt på 100 W installerad.
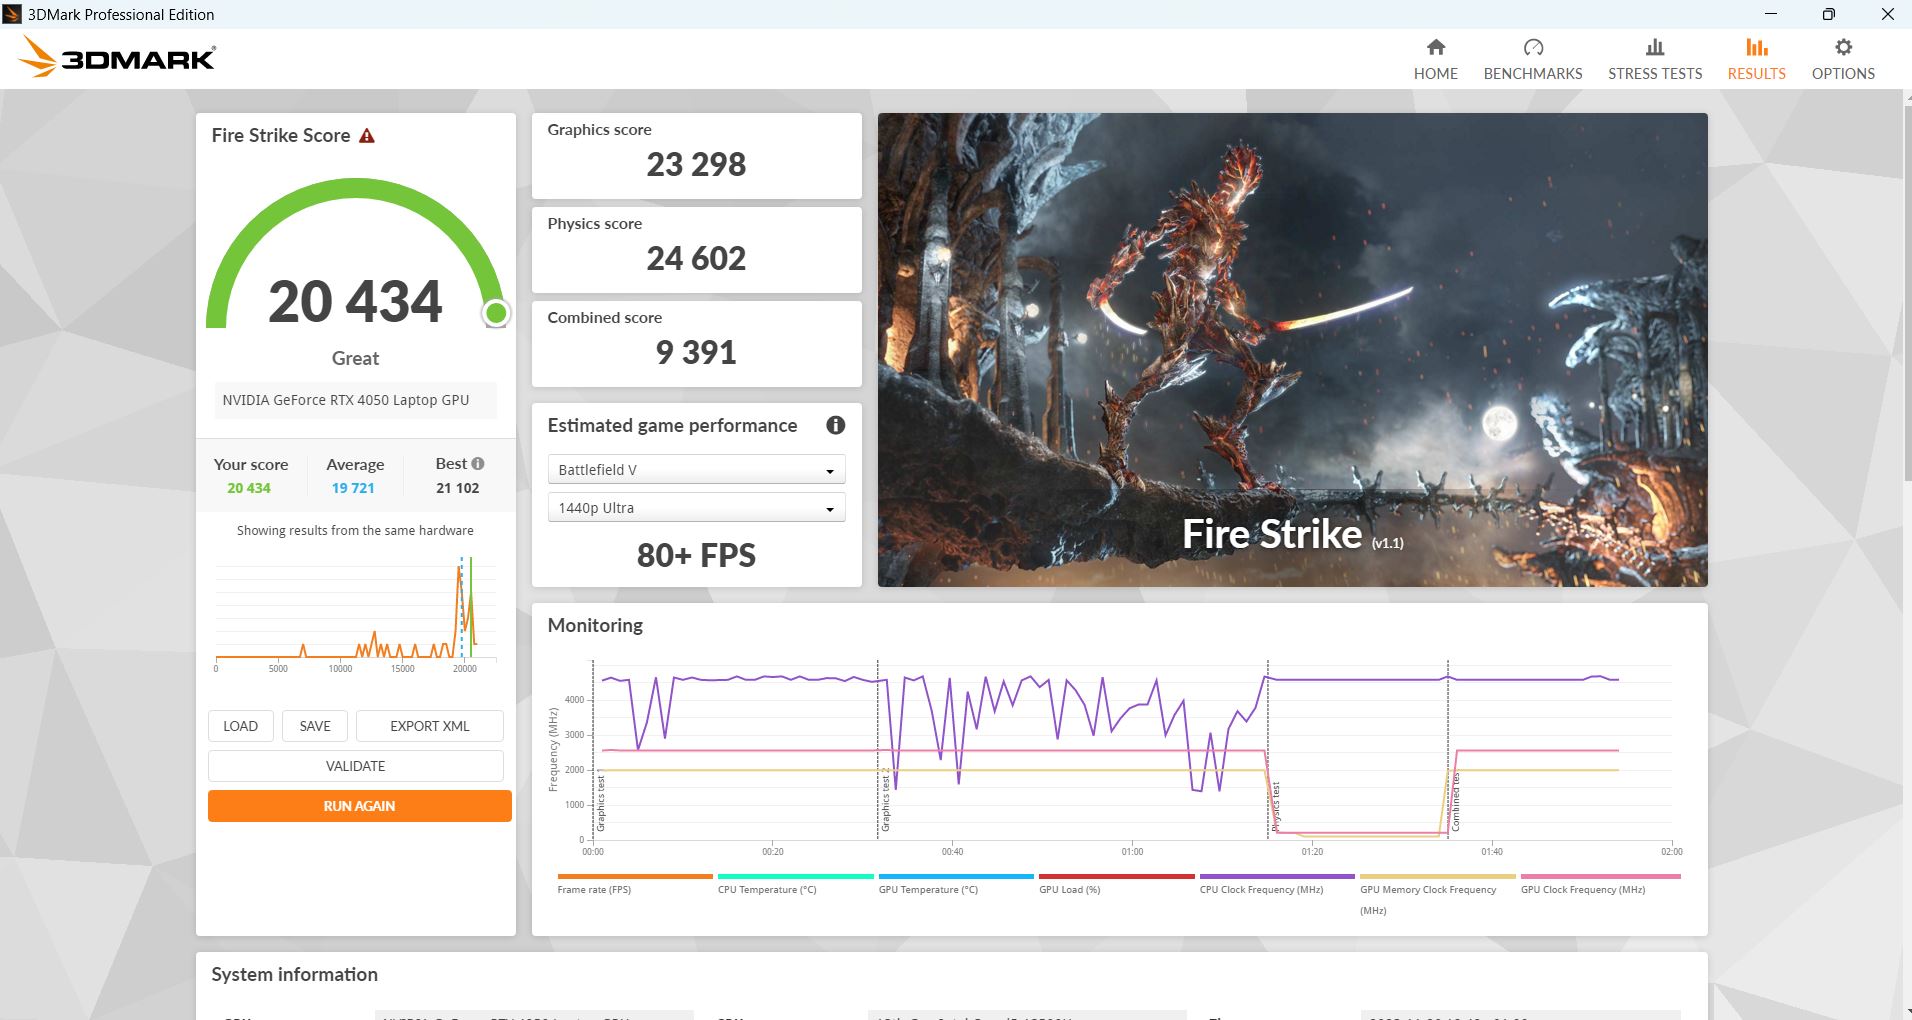
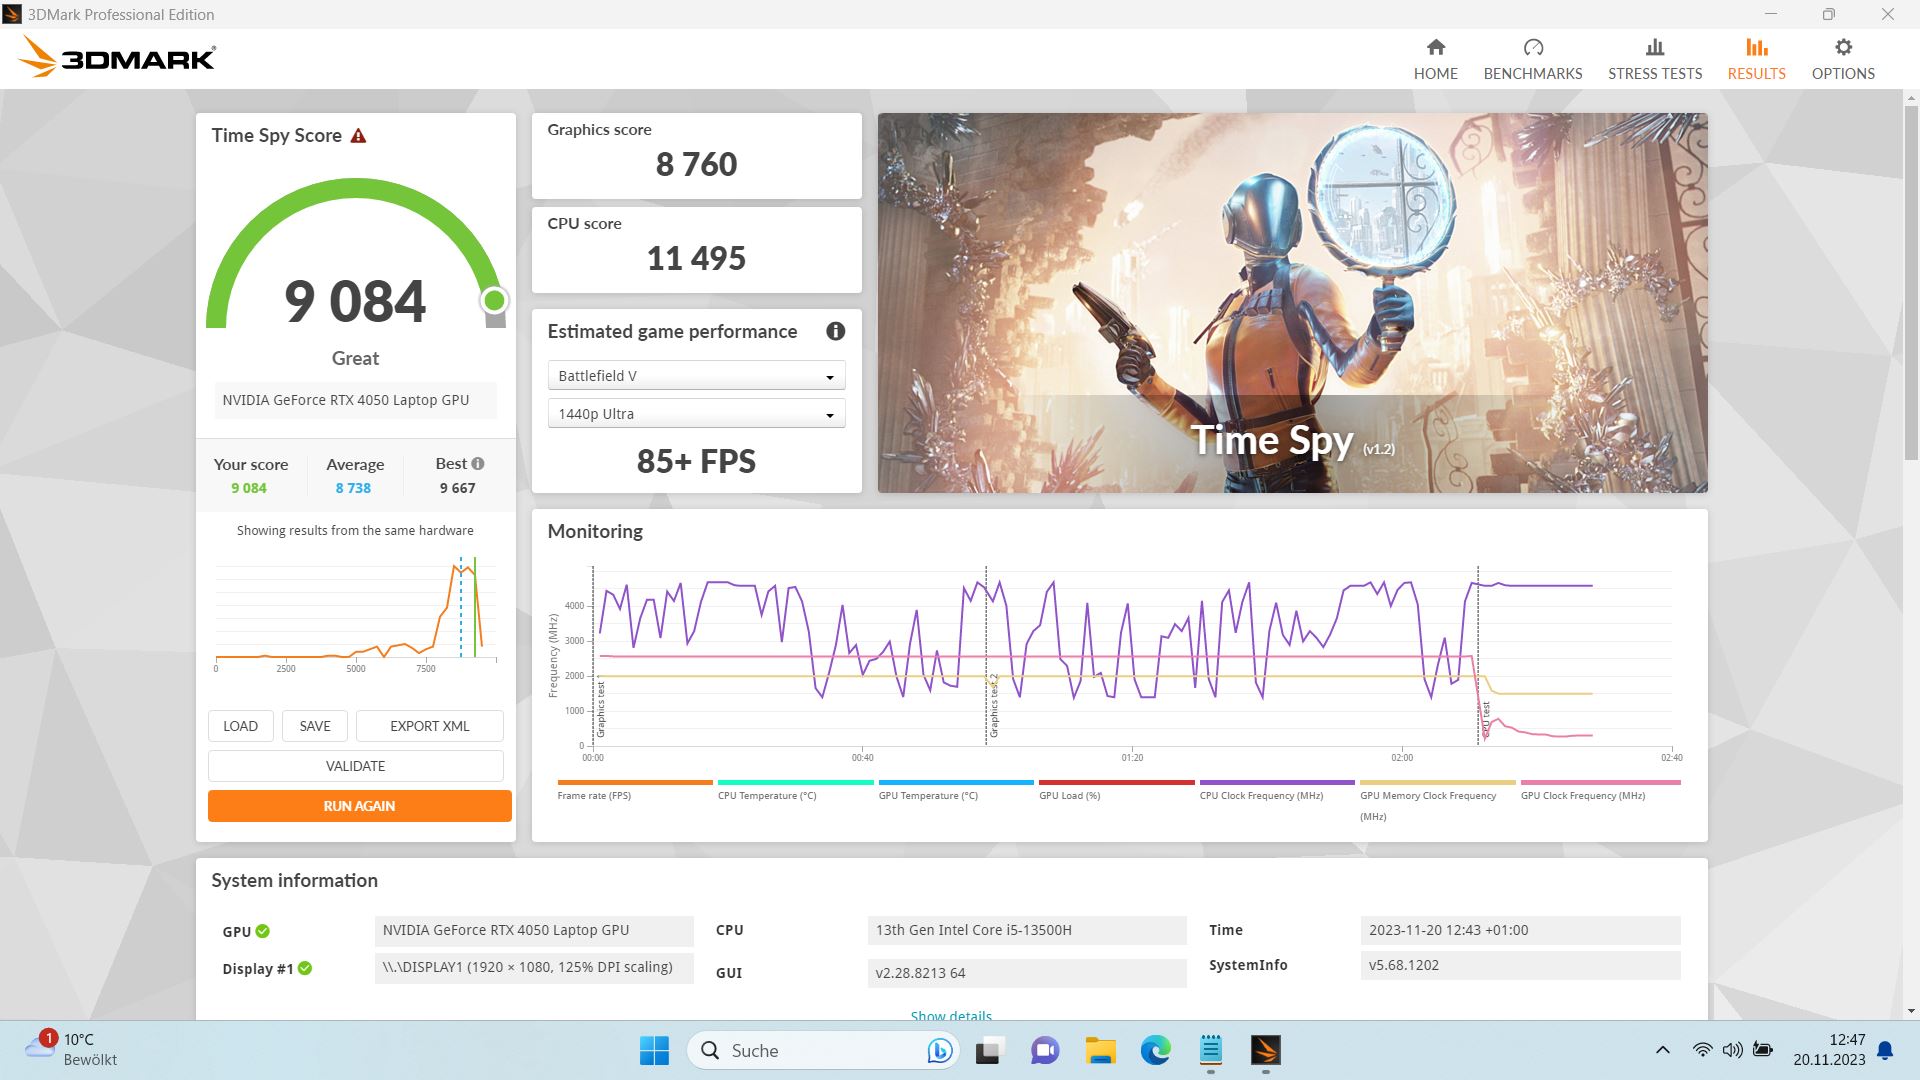
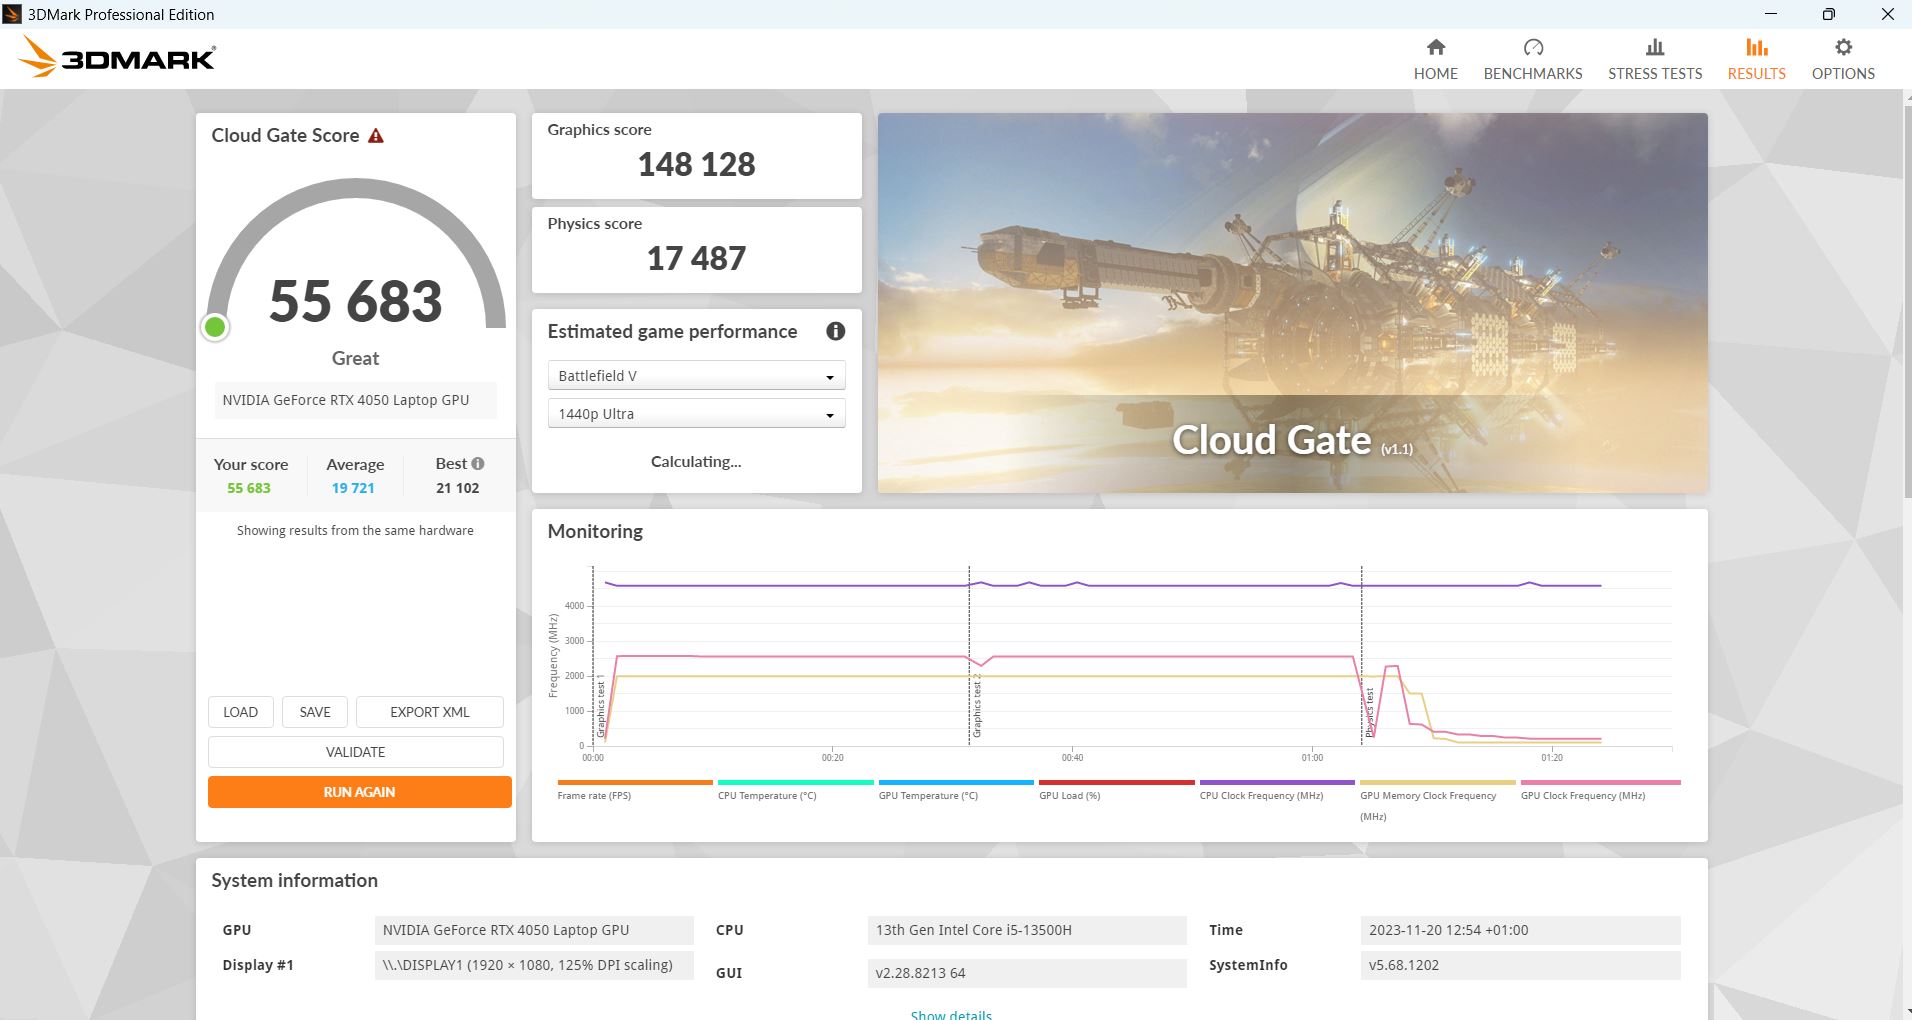
E40 presterar riktigt bra i 3DMark-riktmärkena, ligger något över en genomsnittlig RTX 4050 och i nivå med XMG Apex 15 och MSI Katana 15, som också är starka i denna kategori.
I batteriläge sjunker 3D-prestandan i Fire Strike med hela 70 procent.
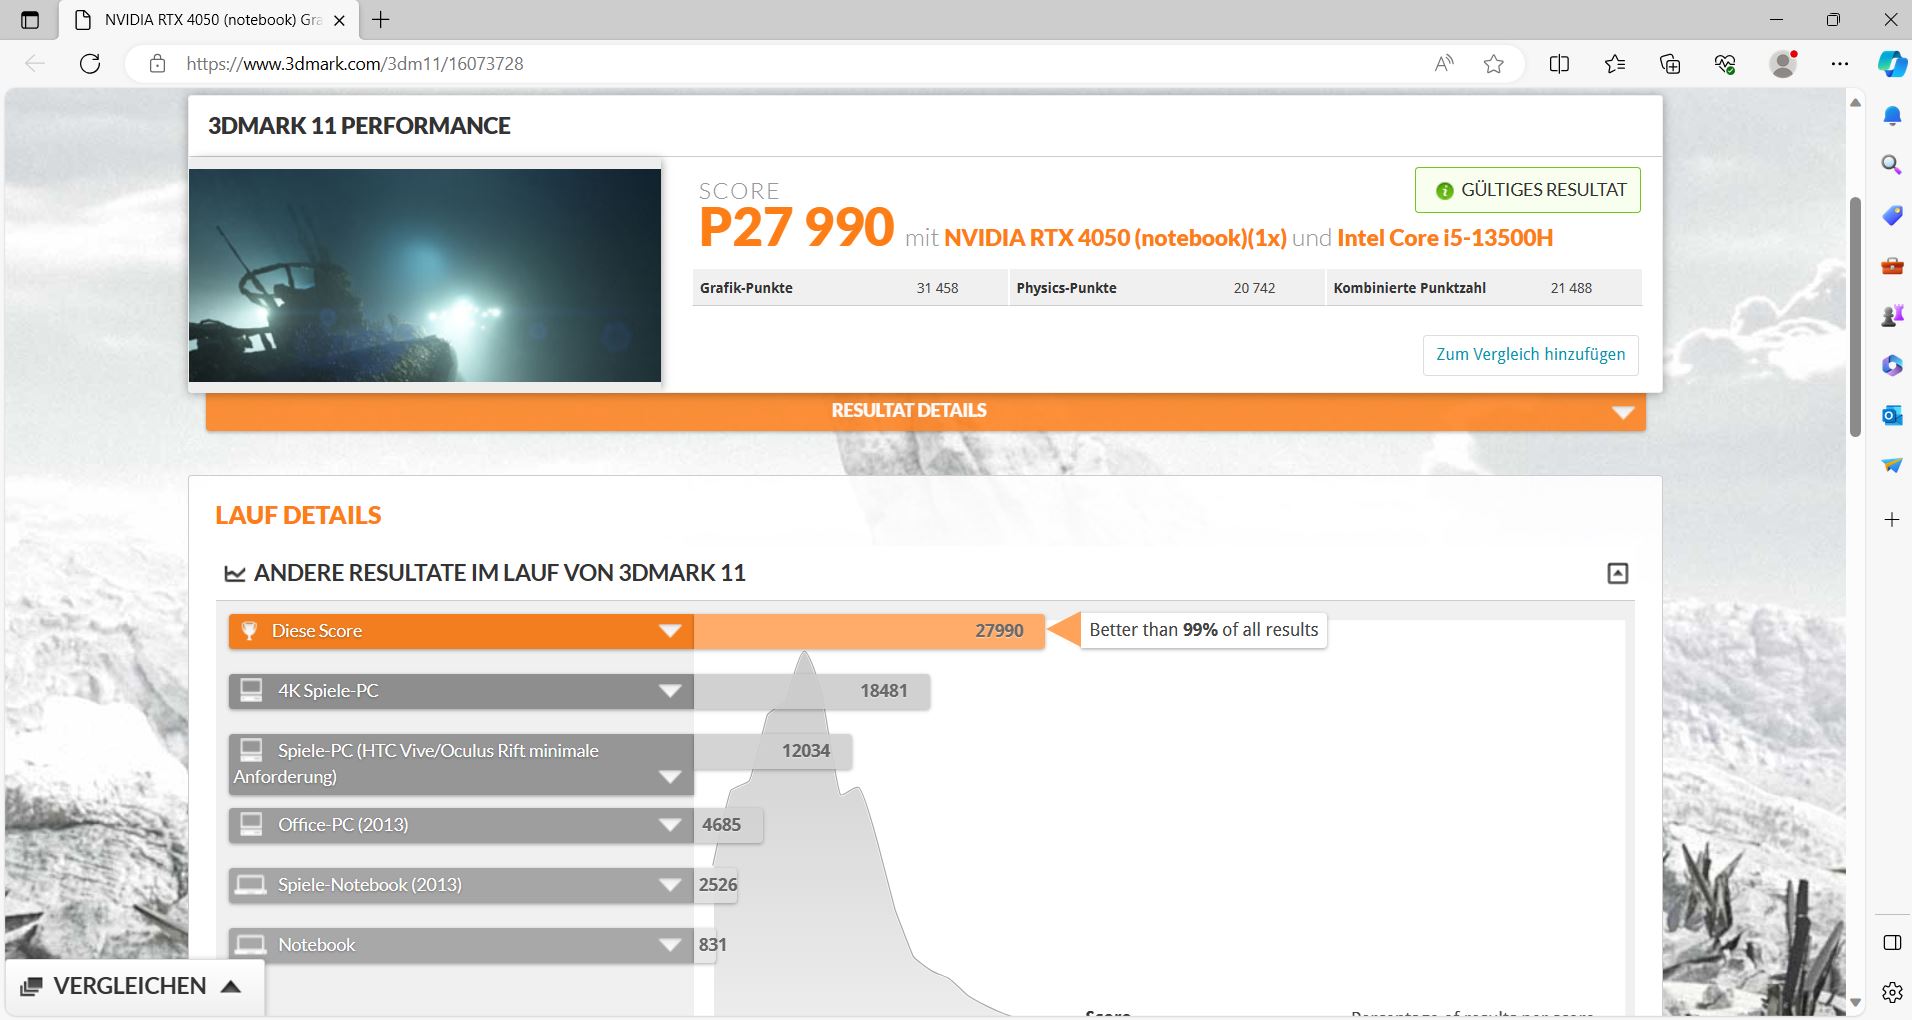
| 3DMark 11 Performance | 27990 poäng | |
| 3DMark Cloud Gate Standard Score | 55683 poäng | |
| 3DMark Fire Strike Score | 20434 poäng | |
| 3DMark Time Spy Score | 9084 poäng | |
Hjälp | ||
* ... mindre är bättre
Spel
I våra loggdata för Witcher 3 (se skärmdumpar nedan) kan du se att GPU-klockan och strömförbrukningen i underhållnings- och tyst läge är nästan exakt densamma och bara något lägre än i spelläge. Följaktligen skiljer sig bildfrekvenserna knappast åt. Den enda skillnaden mellan lägena är fläktbeteendet, vilket leder till en annan volym- och temperaturutveckling. I tyst läge blir GPU:n varmare än i de andra lägena. I spelläget är bildfrekvensen på Witcher 3 mycket konstant.
Jämfört med konkurrenterna presterar E40 bra. Den tar förstaplatsen i synnerhet i Far Cry 5. I Witcher 3, å andra sidan, är den sist, men skillnaderna är mycket små. I det övergripande spelresultatet ligger konkurrenterna nära varandra, LOQ 15 är något bättre än vår crawler, Katana 15 är ungefär densamma och Apex 15 och särskilt Asus TUF A15 är svagare.
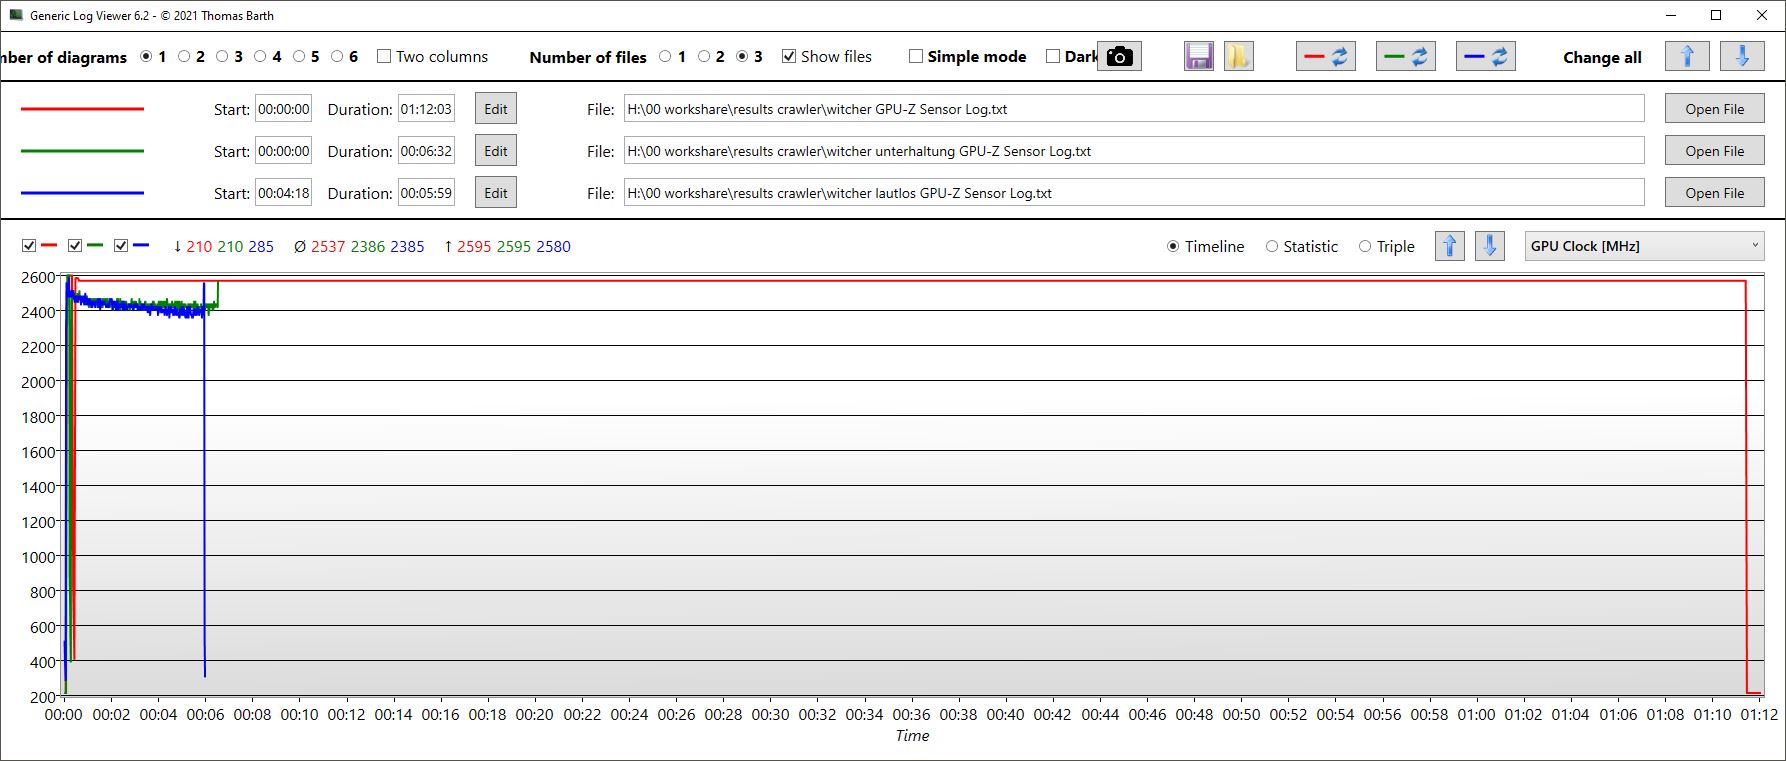
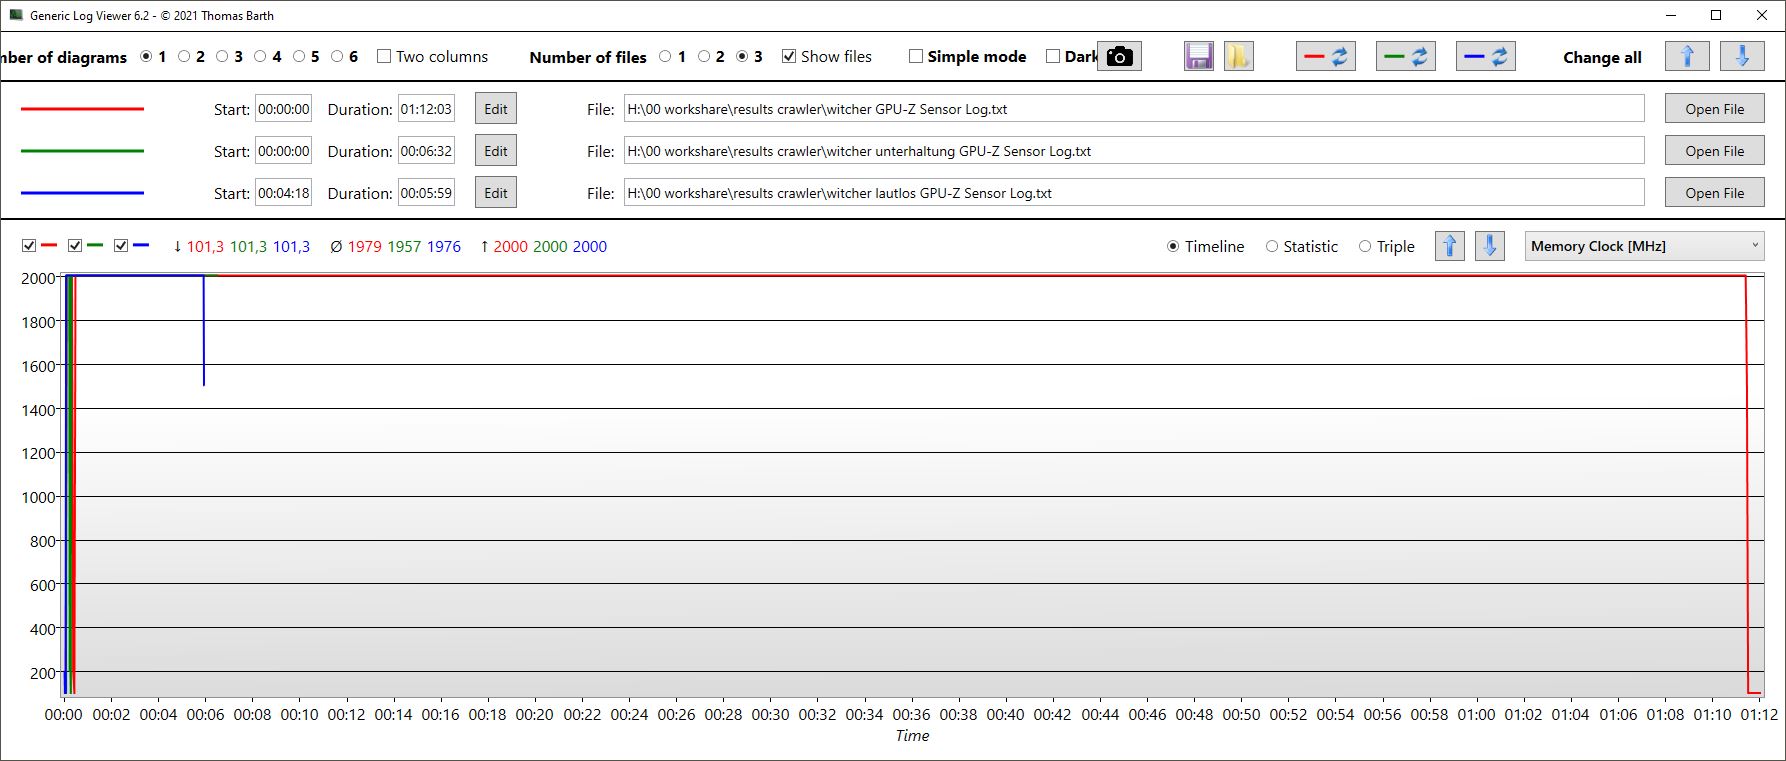
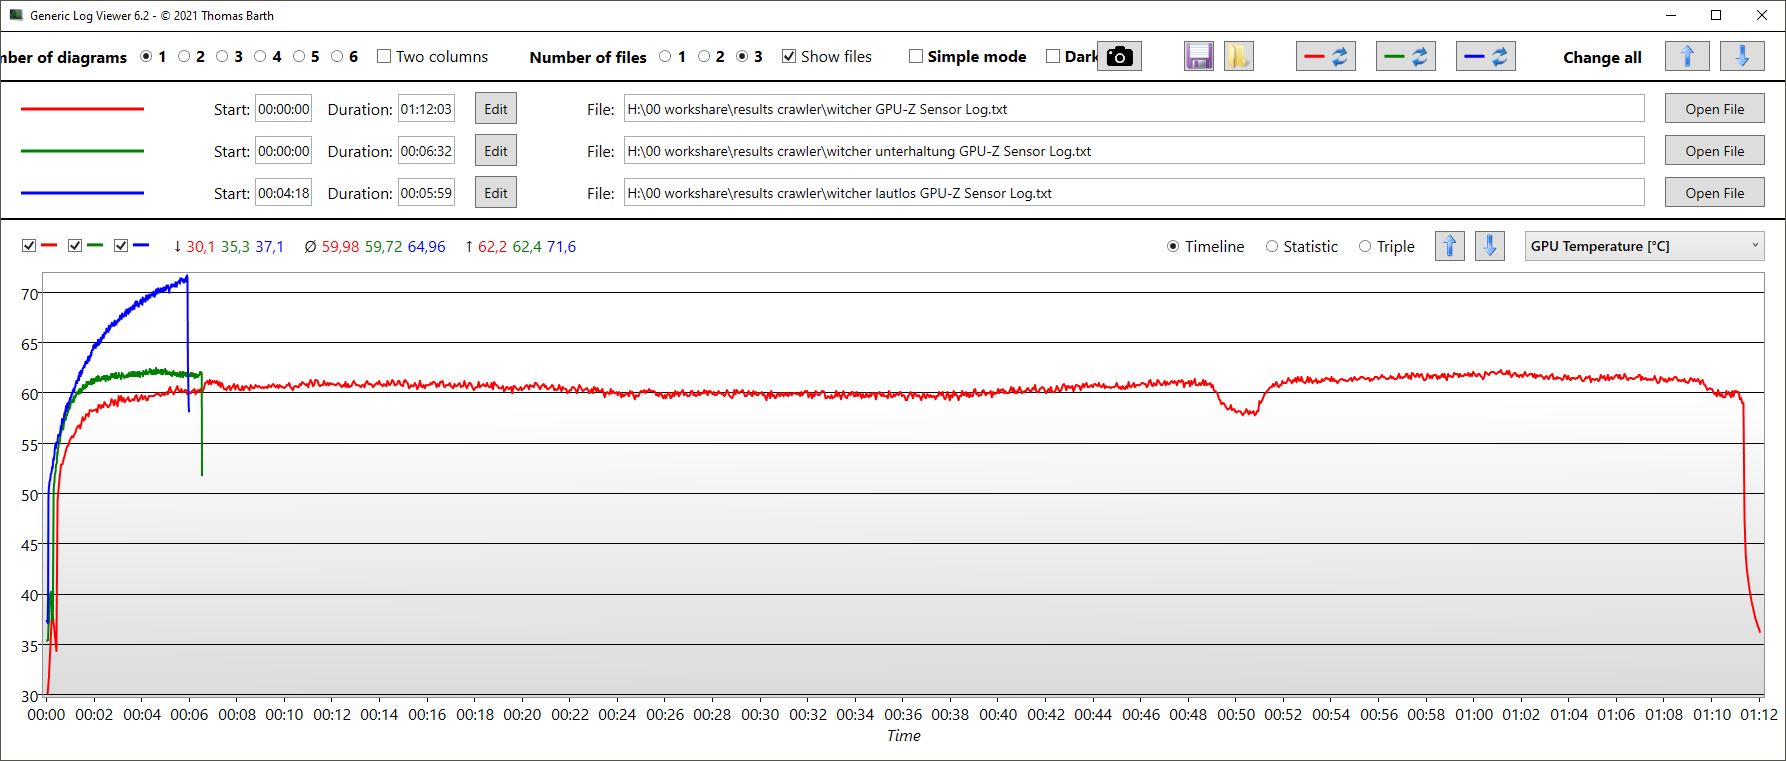
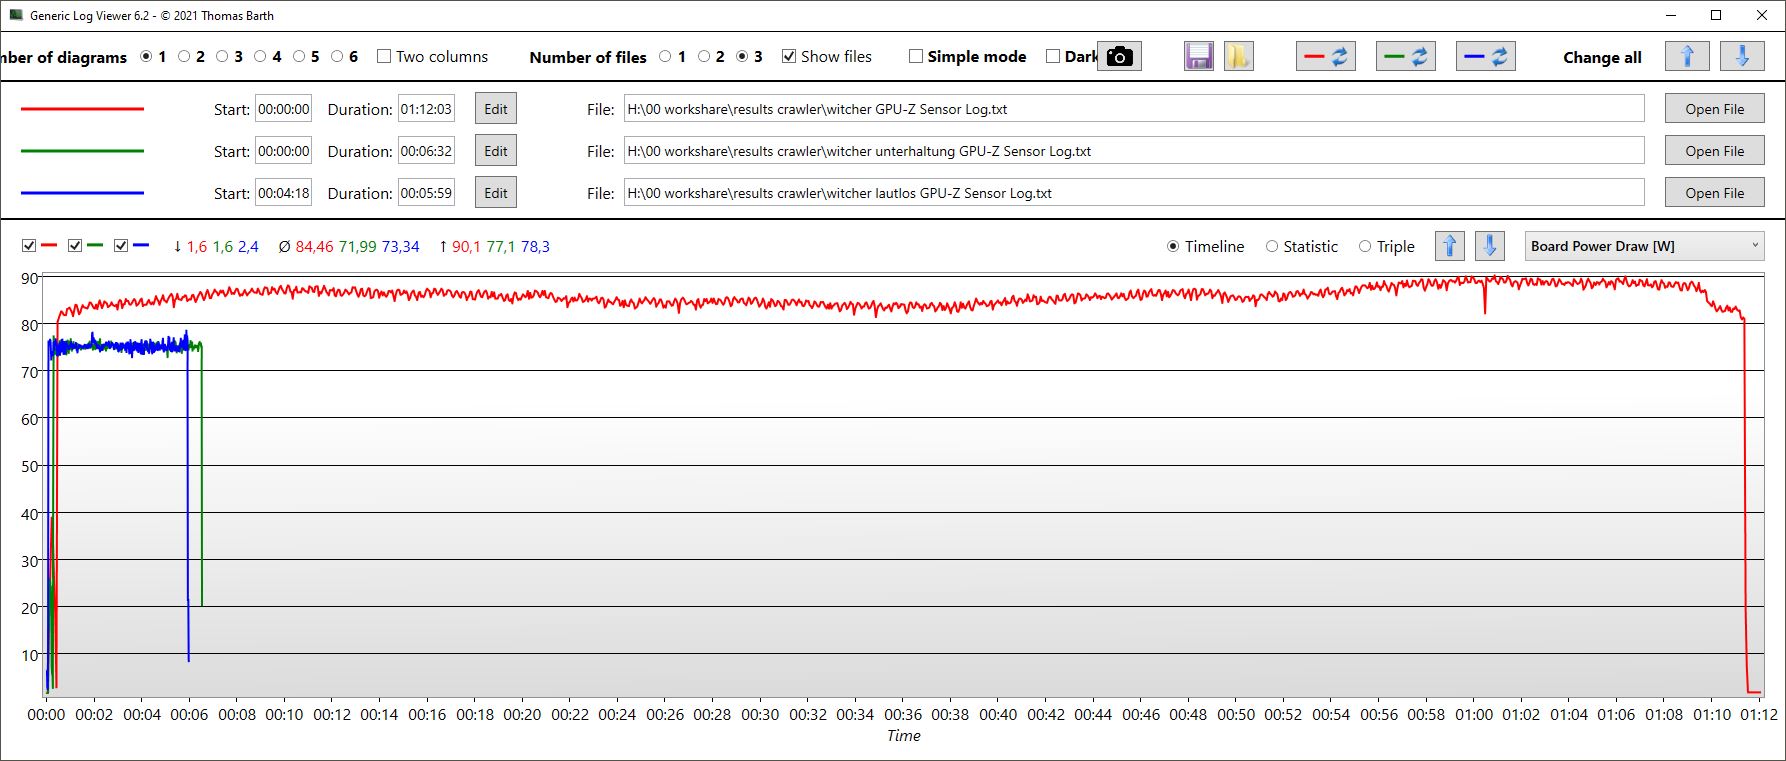
| Mode/Witcher 3 GPU-mätning | Genomsnittlig FPS | GPU-klocka | Minnesklocka | Genomsnittlig temperatur | Strömförbrukning |
|---|---|---|---|---|---|
| Spel | 79,5 | 2,595 MHz | 2,000 MHz | 60 °C | 85 W |
| Underhållning | 77 | 2,400 MHz | 2,000 MHz | ca 62 °C | 72 W |
| Tyst | 78 | 2,400 MHz | 2,000 MHz | ca 75 °C | 73 W |
| Performance rating - Percent | |
| Genomsnitt av klass Gaming | |
| Lenovo LOQ 15IRH8 Core i7 | |
| Medion Erazer Crawler E40 - MD 62518 | |
| MSI Katana 15 B12VEK | |
| Schenker XMG Apex 15 (Late 23) -1! | |
| Asus TUF A15 FA507 | |
| The Witcher 3 - 1920x1080 Ultra Graphics & Postprocessing (HBAO+) | |
| Genomsnitt av klass Gaming (104.7 - 240, n=7, senaste 2 åren) | |
| Lenovo LOQ 15IRH8 Core i7 | |
| Schenker XMG Apex 15 (Late 23) | |
| MSI Katana 15 B12VEK | |
| Asus TUF A15 FA507 | |
| Medion Erazer Crawler E40 - MD 62518 | |
| GTA V - 1920x1080 Highest AA:4xMSAA + FX AF:16x | |
| Genomsnitt av klass Gaming (67.1 - 186.9, n=90, senaste 2 åren) | |
| Medion Erazer Crawler E40 - MD 62518 | |
| Lenovo LOQ 15IRH8 Core i7 | |
| MSI Katana 15 B12VEK | |
| Asus TUF A15 FA507 | |
| Final Fantasy XV Benchmark - 1920x1080 High Quality | |
| Genomsnitt av klass Gaming (64.2 - 215, n=91, senaste 2 åren) | |
| Schenker XMG Apex 15 (Late 23) | |
| Medion Erazer Crawler E40 - MD 62518 | |
| Lenovo LOQ 15IRH8 Core i7 | |
| MSI Katana 15 B12VEK | |
| Asus TUF A15 FA507 | |
| Strange Brigade - 1920x1080 ultra AA:ultra AF:16 | |
| Genomsnitt av klass Gaming (113.6 - 458, n=83, senaste 2 åren) | |
| Lenovo LOQ 15IRH8 Core i7 | |
| MSI Katana 15 B12VEK | |
| Schenker XMG Apex 15 (Late 23) | |
| Asus TUF A15 FA507 | |
| Medion Erazer Crawler E40 - MD 62518 | |
| Dota 2 Reborn - 1920x1080 ultra (3/3) best looking | |
| Lenovo LOQ 15IRH8 Core i7 | |
| Genomsnitt av klass Gaming (84.8 - 252, n=104, senaste 2 åren) | |
| MSI Katana 15 B12VEK | |
| Medion Erazer Crawler E40 - MD 62518 | |
| Schenker XMG Apex 15 (Late 23) | |
| Asus TUF A15 FA507 | |
Witcher 3 FPS chart
| låg | med. | hög | ultra | |
|---|---|---|---|---|
| GTA V (2015) | 182.2 | 176.4 | 169.1 | 97.7 |
| The Witcher 3 (2015) | 369 | 283 | 170 | 81 |
| Dota 2 Reborn (2015) | 162.7 | 152.7 | 147.9 | 140.2 |
| Final Fantasy XV Benchmark (2018) | 183.5 | 122.9 | 84.6 | |
| X-Plane 11.11 (2018) | 128.5 | 121.8 | 98.6 | |
| Far Cry 5 (2018) | 146 | 140 | 133 | 124 |
| Strange Brigade (2018) | 391 | 205 | 167.6 | 146.9 |
Utsläpp och energi - Aggressivt och bullrigt kylsystem
Buller från systemet
Crawler är inte på något sätt en tyst spelare. I jämförelse med konkurrenterna är det den mest högljudda spelaren, vi uppmätte upp till 56 dB i stresstestet och fortfarande över 51 dB under Witcher 3, konkurrenterna förblir vanligtvis långt under 50 dB här. Detsamma gäller för en 3DMark06-körning: Medan andra bärbara datorer förblir helt tysta här i faser och bara låter fläktarna rotera ganska tyst under andra halvan av testet, roterar de redan vid 50 dB i E40.
Kylsystemet är för aggressivt och högt för oss. Som du kan se i nästa avsnitt är temperaturerna så låga att tystare fläktar lätt skulle vara möjliga här. Vi rekommenderar spel i underhållning eller till och med tyst läge.
Åtminstone i viloläge förblir E40 vanligtvis tyst, bara när bakgrundsprocesser genererar mer belastning än önskat i viloläge slås fläktarna på. Men även om Crawler E40 har utsatts för en längre belastning lugnar inte fläktarna ner sig helt. Även i tyst läge kommer fläktarna inte att stängas av inom överskådlig framtid.
| Läge/Witcher 3 mätning | Volym | Systemförbrukning |
|---|---|---|
| Spel | 51,46 dB | 155 W |
| Underhållning | 48,21 | 139 W |
| Tyst | 31,37 dB | 117 W |
Ljudnivå
| Låg belastning |
| 23 / 23 / 28.02 dB(A) |
| Hög belastning |
| 50.21 / 56.79 dB(A) |
 | ||
30 dB tyst 40 dB(A) hörbar 50 dB(A) högt ljud |
||
min: | ||
| Medion Erazer Crawler E40 - MD 62518 GeForce RTX 4050 Laptop GPU, i5-13500H, Phison PS5021-E21 512GB | Lenovo LOQ 15IRH8 Core i7 GeForce RTX 4050 Laptop GPU, i7-13620H, Kioxia BG5 KBG50ZNT512G | Asus TUF A15 FA507 GeForce RTX 4050 Laptop GPU, R7 7735HS, Micron 2400 MTFDKBA512QFM | Schenker XMG Apex 15 (Late 23) GeForce RTX 4050 Laptop GPU, R7 7840HS, Samsung 990 Pro 1 TB | MSI Katana 15 B12VEK GeForce RTX 4050 Laptop GPU, i7-12650H, Micron 2400 MTFDKBA1T0QFM | |
|---|---|---|---|---|---|
| Noise | -5% | 14% | -2% | 6% | |
| av / miljö * (dB) | 23 | 23.69 -3% | 23.3 -1% | 24 -4% | 24 -4% |
| Idle Minimum * (dB) | 23 | 29.03 -26% | 23.3 -1% | 25 -9% | 24 -4% |
| Idle Average * (dB) | 23 | 29.03 -26% | 23.3 -1% | 29 -26% | 24 -4% |
| Idle Maximum * (dB) | 28.02 | 29.03 -4% | 23.3 17% | 33 -18% | 24 14% |
| Load Average * (dB) | 50.21 | 48.7 3% | 29.6 41% | 36 28% | 37.71 25% |
| Witcher 3 ultra * (dB) | 51.46 | 48.5 6% | 43 16% | 48 7% | 45.75 11% |
| Load Maximum * (dB) | 56.79 | 48.7 14% | 43 24% | 53 7% | 54.55 4% |
* ... mindre är bättre
Temperatur
Tack vare det aggressiva kylsystemet är yttemperaturerna nästan förvånansvärt låga. Även under maximal belastning stiger dessa knappt över 96,8 ° F i spelläge (omgivningstemperatur 64,4 ° F). Det finns fortfarande gott om utrymme för ett tystare kylsystem här.
(+) Den maximala temperaturen på ovansidan är 36 °C / 97 F, jämfört med genomsnittet av 40.4 °C / 105 F , allt från 21.2 till 68.8 °C för klassen Gaming.
(+) Botten värms upp till maximalt 36 °C / 97 F, jämfört med genomsnittet av 43.2 °C / 110 F
(+) Vid tomgångsbruk är medeltemperaturen för ovansidan 23.7 °C / 75 F, jämfört med enhetsgenomsnittet på 33.9 °C / ### class_avg_f### F.
(+) När du spelar The Witcher 3 är medeltemperaturen för ovansidan 27.4 °C / 81 F, jämfört med enhetsgenomsnittet på 33.9 °C / ## #class_avg_f### F.
(+) Handledsstöden och pekplattan är kallare än hudtemperaturen med maximalt 24 °C / 75.2 F och är därför svala att ta på.
(+) Medeltemperaturen för handledsstödsområdet på liknande enheter var 28.8 °C / 83.8 F (+4.8 °C / 8.6 F).
| Medion Erazer Crawler E40 - MD 62518 Intel Core i5-13500H, NVIDIA GeForce RTX 4050 Laptop GPU | Lenovo LOQ 15IRH8 Core i7 Intel Core i7-13620H, NVIDIA GeForce RTX 4050 Laptop GPU | Asus TUF A15 FA507 AMD Ryzen 7 7735HS, NVIDIA GeForce RTX 4050 Laptop GPU | Schenker XMG Apex 15 (Late 23) AMD Ryzen 7 7840HS, NVIDIA GeForce RTX 4050 Laptop GPU | MSI Katana 15 B12VEK Intel Core i7-12650H, NVIDIA GeForce RTX 4050 Laptop GPU | |
|---|---|---|---|---|---|
| Heat | -40% | -17% | -31% | -35% | |
| Maximum Upper Side * (°C) | 36 | 46.4 -29% | 48.9 -36% | 52 -44% | 47 -31% |
| Maximum Bottom * (°C) | 36 | 59.2 -64% | 44.6 -24% | 47 -31% | 48 -33% |
| Idle Upper Side * (°C) | 26 | 34.4 -32% | 27.1 -4% | 33 -27% | 35 -35% |
| Idle Bottom * (°C) | 27 | 36.2 -34% | 27.5 -2% | 33 -22% | 38 -41% |
* ... mindre är bättre
Högtalare
Stereohögtalarna är placerade i de främre hörnen och strålar nedåt. Diskanten är balanserad, men det finns knappt någon bas. Vi rekommenderar att du ansluter hörlurar via jackutgången.
Medion Erazer Crawler E40 - MD 62518 ljudanalys
(±) | högtalarljudstyrkan är genomsnittlig men bra (81.47 dB)
Bas 100 - 315 Hz
(-) | nästan ingen bas - i genomsnitt 32.7% lägre än medianen
(±) | linjäriteten för basen är genomsnittlig (11% delta till föregående frekvens)
Mellan 400 - 2000 Hz
(+) | balanserad mellan - endast 4.6% från medianen
(±) | linjäriteten för mids är genomsnittlig (7.1% delta till föregående frekvens)
Högsta 2 - 16 kHz
(+) | balanserade toppar - endast 3.1% från medianen
(+) | toppar är linjära (5.7% delta till föregående frekvens)
Totalt 100 - 16 000 Hz
(±) | linjäriteten för det totala ljudet är genomsnittlig (21.8% skillnad mot median)
Jämfört med samma klass
» 78% av alla testade enheter i den här klassen var bättre, 6% liknande, 16% sämre
» Den bästa hade ett delta på 6%, genomsnittet var 18%, sämst var 132%
Jämfört med alla testade enheter
» 62% av alla testade enheter var bättre, 7% liknande, 31% sämre
» Den bästa hade ett delta på 4%, genomsnittet var 23%, sämst var 134%
Lenovo LOQ 15IRH8 Core i7 ljudanalys
(±) | högtalarljudstyrkan är genomsnittlig men bra (75.9 dB)
Bas 100 - 315 Hz
(-) | nästan ingen bas - i genomsnitt 18.6% lägre än medianen
(±) | linjäriteten för basen är genomsnittlig (10.2% delta till föregående frekvens)
Mellan 400 - 2000 Hz
(+) | balanserad mellan - endast 2.2% från medianen
(+) | mids är linjära (3.1% delta till föregående frekvens)
Högsta 2 - 16 kHz
(+) | balanserade toppar - endast 2.3% från medianen
(+) | toppar är linjära (4.4% delta till föregående frekvens)
Totalt 100 - 16 000 Hz
(+) | det totala ljudet är linjärt (13.7% skillnad mot median)
Jämfört med samma klass
» 21% av alla testade enheter i den här klassen var bättre, 7% liknande, 72% sämre
» Den bästa hade ett delta på 6%, genomsnittet var 18%, sämst var 132%
Jämfört med alla testade enheter
» 15% av alla testade enheter var bättre, 4% liknande, 81% sämre
» Den bästa hade ett delta på 4%, genomsnittet var 23%, sämst var 134%
Strömförbrukning
Strömförbrukningen är något hög i viloläge och i stresstestet, men sticker inte riktigt ut. Under normal belastning ligger förbrukningen väl inom genomsnittet för tävlingen. I spel är det i nivå med Lenovo LOQ 15, men högre än de andra konkurrenterna.
Vi uppmätte en tillfällig maximal förbrukning på 202,5 W under vårt samtidiga CPU- och GPU-stresstest. 230 W-strömförsörjningen från LiteOn borde inte ha några problem här.
| Av/Standby | |
| Låg belastning | |
| Hög belastning |
|
Förklaring:
min: | |
| Medion Erazer Crawler E40 - MD 62518 GeForce RTX 4050 Laptop GPU, i5-13500H, Phison PS5021-E21 512GB | Lenovo LOQ 15IRH8 Core i7 GeForce RTX 4050 Laptop GPU, i7-13620H, Kioxia BG5 KBG50ZNT512G | Asus TUF A15 FA507 GeForce RTX 4050 Laptop GPU, R7 7735HS, Micron 2400 MTFDKBA512QFM | Schenker XMG Apex 15 (Late 23) GeForce RTX 4050 Laptop GPU, R7 7840HS, Samsung 990 Pro 1 TB | MSI Katana 15 B12VEK GeForce RTX 4050 Laptop GPU, i7-12650H, Micron 2400 MTFDKBA1T0QFM | |
|---|---|---|---|---|---|
| Power Consumption | 1% | 23% | 15% | 18% | |
| Idle 150cd/m2 * (Watt) | 15.3 | 9.48 38% | 10.8 29% | 9.8 36% | |
| 3DMark06 Return To Proxycon * (Watt) | 88 | 94.5 -7% | 84 5% | ||
| Witcher 3 ultra * (Watt) | 155 | 154.4 -0% | 136.6 12% | 136.5 12% | 128 17% |
| 1280x720 Prime95 28.10 and Furmark 1.25 * (Watt) | 190 | 169.2 11% | 156.7 18% | 181 5% | 165 13% |
* ... mindre är bättre
Power consumption Witcher 3 / stress test
Power consumption with external monitor
Batteritid
Medion använder ett batteri med 54 Wh. Endast MSI Katana har ett liknande litet batteri men håller fortfarande lite längre i alla tester. Resten av konkurrenterna har minst 60 Wh-batterier, och Asus TUF A15 har till och med ett 90 Wh-batteri. Kort sagt: Medion har de kortaste körtiderna i en direkt jämförelse. I vårt video- eller surftest med reducerad ljusstyrka uppnår den bärbara datorn en drifttid på cirka 4 timmar - det är inte upplyftande.
| Medion Erazer Crawler E40 - MD 62518 i5-13500H, GeForce RTX 4050 Laptop GPU, 54 Wh | Lenovo LOQ 15IRH8 Core i7 i7-13620H, GeForce RTX 4050 Laptop GPU, 60 Wh | Asus TUF A15 FA507 R7 7735HS, GeForce RTX 4050 Laptop GPU, 90 Wh | Schenker XMG Apex 15 (Late 23) R7 7840HS, GeForce RTX 4050 Laptop GPU, 62.32 Wh | MSI Katana 15 B12VEK i7-12650H, GeForce RTX 4050 Laptop GPU, 53.5 Wh | Genomsnitt av klass Gaming | |
|---|---|---|---|---|---|---|
| Batteridrifttid | 50% | 130% | 73% | 14% | 70% | |
| H.264 (h) | 3.9 | 6.1 56% | 12.5 221% | 8.3 113% | 4.4 13% | 8.27 ? 112% |
| WiFi v1.3 (h) | 4.1 | 5.9 44% | 11.7 185% | 7.1 73% | 4.3 5% | 7.08 ? 73% |
| Load (h) | 1.2 | 1 -17% | 1.6 33% | 1.5 25% | 1.496 ? 25% | |
| Reader / Idle (h) | 8.4 | 7.84 ? |
För
Emot
Omdöme - Budgetspelare med kompromisser men bra prestanda
Medion Crawler E40 kostar ~1300 USD och är ett budgetvänligt alternativ för en bärbar speldator med en RTX 4050. Medan den faller inom budgetintervallet finns det ännu billigare modeller tillgängliga, vilket föranleder en närmare titt på pris-prestandaförhållandet. Crawler E40 avslöjar sitt budgetursprung med funktioner som i5-13500H istället för i7-13700H, en skärm från 2019, en 720p-webbkamera och en USB 2.0-plats, bland andra aspekter. Därför kanske den inte uppfyller förväntningarna hos spelare med höga krav. CPU- och GPU-prestandan är dock lovvärd och SSD-enheten presterar bra. Skärmen, även om den inte är den senaste, är tillräckligt ljusstark med 350 nits, responsiv och erbjuder en uppdateringsfrekvens på 144 Hz, även om den inte helt täcker typiska färgrymder.
Även om det finns några punkter att kritisera, är många av dem acceptabla för en budgetlaptop. Å andra sidan är den anmärkningsvärt svaga batteritiden och det överdrivet högljudda kylsystemet mer relevanta problem. Optimering av programvaran skulle kunna lösa problemet med kylsystemet, eftersom det verkar finnas utrymme för förbättringar med tanke på de låga temperaturerna.
Sammanfattningsvis är Medion Crawler E40 en budgetvänlig bärbar speldator med vissa kompromisser, men prestandan hos dess komponenter är lovvärd. Den huvudsakliga kritiken ligger i det högljudda och aggressiva kylsystemet samt den svaga batteritiden.
Var och en av konkurrenterna som diskuteras i testet har sina fördelar, och skillnaderna mellan dem är relativt små. Asus TUF A15, även om den ger något svagare prestanda, sticker ut för sina imponerande batteritider. Om förlängd batteritid med jämförbar prestanda är en prioritet och du är villig att spendera lite mer, kan Lenovo LOQ 15 vara ett lämpligt val, trots att den har vissa nackdelar. Det är viktigt att notera att det inte finns någon klar vinnare, särskilt med tanke på att XMG Apex 15 har ett pris som är nästan ~550 USD högre.
Pris och tillgänglighet
Medion Erazer Crawler E40 kostar cirka ~ US $ 1300 direkt från Medion.
Medion Erazer Crawler E40 - MD 62518
- 11/28/2023 v7 (old)
Christian Hintze
Genomskinlighet
Valet av enheter som ska granskas görs av vår redaktion. Testprovet gavs till författaren som ett lån av tillverkaren eller återförsäljaren för denna recension. Långivaren hade inget inflytande på denna recension och inte heller fick tillverkaren en kopia av denna recension innan publiceringen. Det fanns ingen skyldighet att publicera denna recension. Som ett oberoende medieföretag är Notebookcheck inte föremål för auktoritet från tillverkare, återförsäljare eller förlag.
This is how Notebookcheck is testingEvery year, Notebookcheck independently reviews hundreds of laptops and smartphones using standardized procedures to ensure that all results are comparable. We have continuously developed our test methods for around 20 years and set industry standards in the process. In our test labs, high-quality measuring equipment is utilized by experienced technicians and editors. These tests involve a multi-stage validation process. Our complex rating system is based on hundreds of well-founded measurements and benchmarks, which maintains objectivity.
Price comparison

