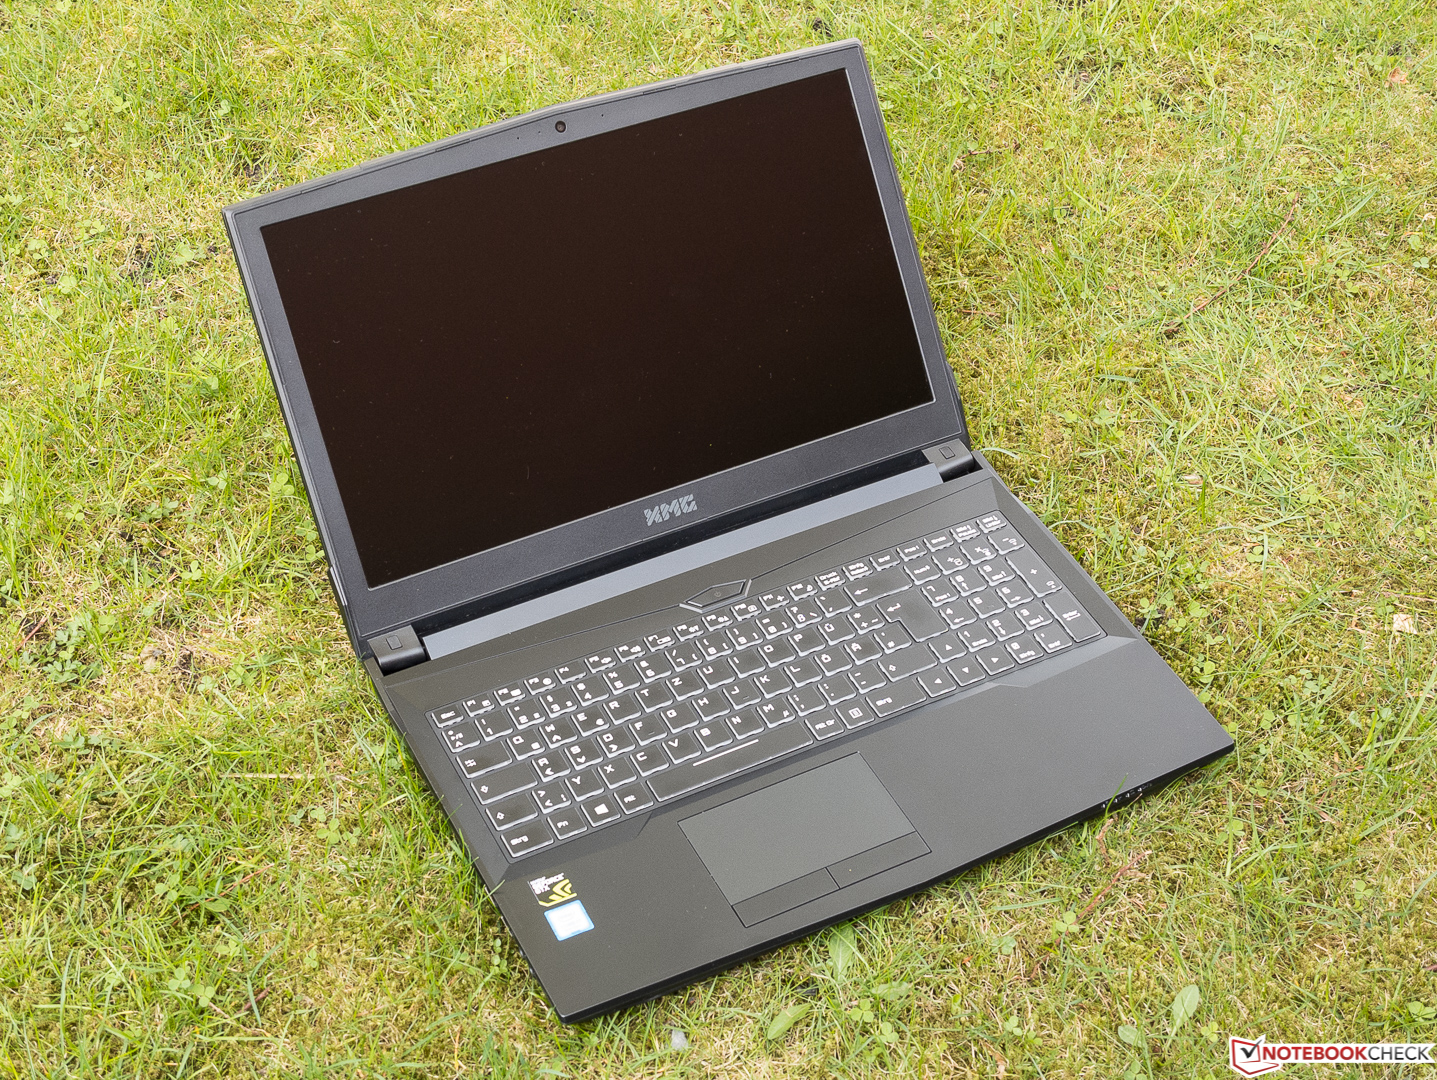
Test: Schenker XMG Apex 15 (Clevo N950TP6) Laptop (Sammanfattning)

| SD Card Reader | |
| average JPG Copy Test (av. of 3 runs) | |
| MSI GE63VR 7RF Raider (Toshiba Exceria Pro SDXC 64 GB UHS-II) | |
| Genomsnitt av klass Gaming (20.9 - 210, n=54, senaste 2 åren) | |
| Schenker XMG Apex 15 (Toshiba Exceria Pro SDXC 64 GB UHS-II) | |
| Schenker XMG Core 15 (Toshiba Exceria Pro SDXC 64 GB UHS-II) | |
| HP Omen 15t-ce000 (Toshiba Exceria Pro SDXC 64 GB UHS-II) | |
| maximum AS SSD Seq Read Test (1GB) | |
| MSI GE63VR 7RF Raider (Toshiba Exceria Pro SDXC 64 GB UHS-II) | |
| Genomsnitt av klass Gaming (25.5 - 261, n=51, senaste 2 åren) | |
| Schenker XMG Apex 15 (Toshiba Exceria Pro SDXC 64 GB UHS-II) | |
| HP Omen 15t-ce000 (Toshiba Exceria Pro SDXC 64 GB UHS-II) | |
| Schenker XMG Core 15 (Toshiba Exceria Pro SDXC 64 GB UHS-II) | |
| Networking | |
| iperf3 transmit AX12 | |
| HP Omen 15t-ce000 | |
| MSI GE63VR 7RF Raider | |
| Schenker XMG Apex 15 | |
| Schenker XMG Core 15 | |
| iperf3 receive AX12 | |
| MSI GE63VR 7RF Raider | |
| Schenker XMG Apex 15 | |
| Schenker XMG Core 15 | |
| HP Omen 15t-ce000 | |
| |||||||||||||||||||||||||
Distribution av ljusstyrkan: 91 %
Mitt på batteriet: 269 cd/m²
Kontrast: 1170:1 (Svärta: 0.23 cd/m²)
ΔE ColorChecker Calman: 4.25 | ∀{0.5-29.43 Ø4.71}
calibrated: 2.51
ΔE Greyscale Calman: 3.11 | ∀{0.09-98 Ø4.96}
83% sRGB (Argyll 1.6.3 3D)
54% AdobeRGB 1998 (Argyll 1.6.3 3D)
60.4% AdobeRGB 1998 (Argyll 3D)
82.7% sRGB (Argyll 3D)
62% Display P3 (Argyll 3D)
Gamma: 2.36
CCT: 6851 K
| Schenker XMG Apex 15 LG Philips LP156WF6 (LGD046F), IPS, 1920x1080 | MSI GE63VR 7RF Raider Chi Mei N156HHE-GA1 (CMN15F4), TN LED, 1920x1080 | HP Omen 15t-ce000 AU Optronics AUO23EB, IPS, 3840x2160 | Schenker XMG Core 15 LG Philips LP156WF6 (LGD046F), IPS, 1920x1080 | |
|---|---|---|---|---|
| Display | 37% | 10% | 1% | |
| Display P3 Coverage (%) | 62 | 91.3 47% | 66.1 7% | 64.3 4% |
| sRGB Coverage (%) | 82.7 | 100 21% | 91.8 11% | 83 0% |
| AdobeRGB 1998 Coverage (%) | 60.4 | 86.7 44% | 66.9 11% | 60.6 0% |
| Response Times | 77% | 17% | 5% | |
| Response Time Grey 50% / Grey 80% * (ms) | 42.4 ? | 9.6 ? 77% | 37.6 ? 11% | 40.8 ? 4% |
| Response Time Black / White * (ms) | 32 ? | 7.2 ? 77% | 24.8 ? 22% | 30.4 ? 5% |
| PWM Frequency (Hz) | 20490 ? | 26000 ? | 20490 ? | |
| Screen | 12% | -5% | -11% | |
| Brightness middle (cd/m²) | 269 | 285 6% | 358.5 33% | 297 10% |
| Brightness (cd/m²) | 274 | 273 0% | 350 28% | 276 1% |
| Brightness Distribution (%) | 91 | 84 -8% | 95 4% | 87 -4% |
| Black Level * (cd/m²) | 0.23 | 0.23 -0% | 0.39 -70% | 0.3 -30% |
| Contrast (:1) | 1170 | 1239 6% | 919 -21% | 990 -15% |
| Colorchecker dE 2000 * | 4.25 | 3.52 17% | 4.6 -8% | 5.25 -24% |
| Colorchecker dE 2000 max. * | 10.39 | 5.18 50% | 8.5 18% | 10.3 1% |
| Colorchecker dE 2000 calibrated * | 2.51 | |||
| Greyscale dE 2000 * | 3.11 | 3.41 -10% | 5.2 -67% | 4.64 -49% |
| Gamma | 2.36 93% | 2.05 107% | 2.28 96% | 2.39 92% |
| CCT | 6851 95% | 7077 92% | 6410 101% | 6600 98% |
| Color Space (Percent of AdobeRGB 1998) (%) | 54 | 77 43% | 66.9 24% | 54 0% |
| Color Space (Percent of sRGB) (%) | 83 | 100 20% | 91.8 11% | 83 0% |
| Totalt genomsnitt (program/inställningar) | 42% /
26% | 7% /
1% | -2% /
-6% |
* ... mindre är bättre
Visa svarstider
| ↔ Svarstid svart till vitt | ||
|---|---|---|
| 32 ms ... stiga ↗ och falla ↘ kombinerat | ↗ 18 ms stiga | 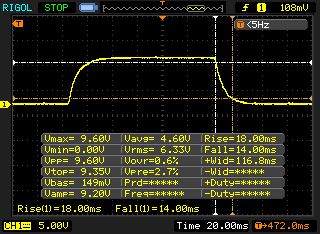 |
| ↘ 14 ms hösten | ||
| Skärmen visar långsamma svarsfrekvenser i våra tester och kommer att vara otillfredsställande för spelare. I jämförelse sträcker sig alla testade enheter från 0.1 (minst) till 240 (maximalt) ms. » 86 % av alla enheter är bättre. Detta innebär att den uppmätta svarstiden är sämre än genomsnittet av alla testade enheter (19.8 ms). | ||
| ↔ Svarstid 50 % grått till 80 % grått | ||
| 42.4 ms ... stiga ↗ och falla ↘ kombinerat | ↗ 20.4 ms stiga | 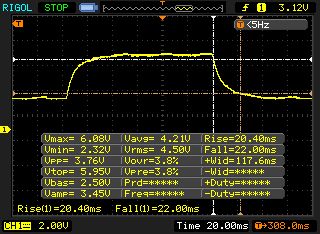 |
| ↘ 22 ms hösten | ||
| Skärmen visar långsamma svarsfrekvenser i våra tester och kommer att vara otillfredsställande för spelare. I jämförelse sträcker sig alla testade enheter från 0.165 (minst) till 636 (maximalt) ms. » 70 % av alla enheter är bättre. Detta innebär att den uppmätta svarstiden är sämre än genomsnittet av alla testade enheter (31 ms). | ||
Skärmflimmer / PWM (Puls-Width Modulation)
| Skärmflimmer / PWM upptäckt | 20490 Hz | ≤ 99 % ljusstyrka inställning | 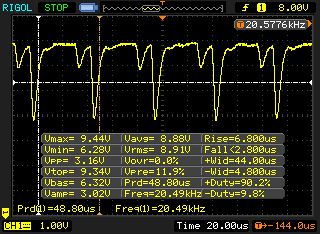 |
Displayens bakgrundsbelysning flimrar vid 20490 Hz (i värsta fall, t.ex. med PWM) Flimrande upptäckt vid en ljusstyrkeinställning på 99 % och lägre. Det ska inte finnas något flimmer eller PWM över denna ljusstyrkeinställning. Frekvensen för 20490 Hz är ganska hög, så de flesta användare som är känsliga för PWM bör inte märka något flimmer. Som jämförelse: 52 % av alla testade enheter använder inte PWM för att dämpa skärmen. Om PWM upptäcktes mättes ett medelvärde av 7757 (minst: 5 - maximum: 343500) Hz. | |||
| PCMark 8 Home Score Accelerated v2 | 4697 poäng | |
| PCMark 8 Work Score Accelerated v2 | 5653 poäng | |
| PCMark 10 Score | 5732 poäng | |
Hjälp | ||
| Schenker XMG Apex 15 Samsung SSD 960 Evo 250GB m.2 NVMe | MSI GE63VR 7RF Raider Toshiba HG6 THNSNJ256G8NY | HP Omen 15t-ce000 Samsung PM961 NVMe MZVLW128HEGR | Schenker XMG Core 15 Samsung SSD 960 Evo 250GB m.2 NVMe | Genomsnitt Samsung SSD 960 Evo 250GB m.2 NVMe | |
|---|---|---|---|---|---|
| CrystalDiskMark 3.0 | -59% | -40% | -12% | -4% | |
| Read Seq (MB/s) | 1751 | 507 -71% | 1411 -19% | 1338 -24% | 1642 ? -6% |
| Write Seq (MB/s) | 1375 | 441.4 -68% | 749 -46% | 1188 -14% | 1408 ? 2% |
| Read 512 (MB/s) | 792 | 411.9 -48% | 503 -36% | 780 -2% | 880 ? 11% |
| Write 512 (MB/s) | 1007 | 409.9 -59% | 174 -83% | 1006 0% | 1065 ? 6% |
| Read 4k (MB/s) | 60 | 21.77 -64% | 46.09 -23% | 58.3 -3% | 54.2 ? -10% |
| Write 4k (MB/s) | 164.1 | 88.9 -46% | 130.7 -20% | 134 -18% | 141.9 ? -14% |
| Read 4k QD32 (MB/s) | 676 | 368.8 -45% | 518 -23% | 577 -15% | 617 ? -9% |
| Write 4k QD32 (MB/s) | 571 | 190.3 -67% | 173.9 -70% | 481.9 -16% | 511 ? -11% |

| 3DMark 11 Performance | 14618 poäng | |
| 3DMark Cloud Gate Standard Score | 36010 poäng | |
| 3DMark Fire Strike Score | 10794 poäng | |
Hjälp | ||
| The Witcher 3 | |
| 1920x1080 Ultra Graphics & Postprocessing (HBAO+) | |
| Genomsnitt av klass Gaming (104.7 - 240, n=7, senaste 2 åren) | |
| MSI GE63VR 7RF Raider | |
| Schenker XMG Apex 15 | |
| Genomsnitt NVIDIA GeForce GTX 1060 Mobile (24 - 42.3, n=60) | |
| Schenker XMG Core 15 | |
| HP Omen 15t-ce000 | |
| 1920x1080 High Graphics & Postprocessing (Nvidia HairWorks Off) | |
| Genomsnitt av klass Gaming (341 - 404, n=2, senaste 2 åren) | |
| Schenker XMG Apex 15 | |
| Schenker XMG Core 15 | |
| HP Omen 15t-ce000 | |
| Genomsnitt NVIDIA GeForce GTX 1060 Mobile (52.6 - 80.6, n=49) | |
| Rise of the Tomb Raider | |
| 1920x1080 Very High Preset AA:FX AF:16x | |
| MSI GE63VR 7RF Raider | |
| Schenker XMG Apex 15 | |
| Genomsnitt NVIDIA GeForce GTX 1060 Mobile (51 - 68.8, n=37) | |
| Schenker XMG Core 15 | |
| HP Omen 15t-ce000 | |
| 1920x1080 High Preset AA:FX AF:4x | |
| MSI GE63VR 7RF Raider | |
| Schenker XMG Apex 15 | |
| Genomsnitt NVIDIA GeForce GTX 1060 Mobile (65.3 - 82, n=24) | |
| Schenker XMG Core 15 | |
| HP Omen 15t-ce000 | |
| The Division | |
| 1920x1080 Ultra Preset AF:16x | |
| Schenker XMG Apex 15 | |
| Genomsnitt NVIDIA GeForce GTX 1060 Mobile (37.8 - 57.4, n=7) | |
| 1920x1080 High Preset AF:8x | |
| Schenker XMG Apex 15 | |
| Genomsnitt NVIDIA GeForce GTX 1060 Mobile (46.9 - 73.3, n=6) | |
| For Honor | |
| 1920x1080 Extreme Preset AA:T AF:16x | |
| MSI GE63VR 7RF Raider | |
| Schenker XMG Apex 15 | |
| Genomsnitt NVIDIA GeForce GTX 1060 Mobile (42.4 - 78.9, n=8) | |
| 1920x1080 High Preset AA:T AF:8x | |
| MSI GE63VR 7RF Raider | |
| Schenker XMG Apex 15 | |
| Genomsnitt NVIDIA GeForce GTX 1060 Mobile (56.3 - 103.2, n=7) | |
| Ghost Recon Wildlands | |
| 1920x1080 Ultra Preset AA:T AF:16x | |
| MSI GE63VR 7RF Raider | |
| Schenker XMG Apex 15 | |
| Genomsnitt NVIDIA GeForce GTX 1060 Mobile (34.5 - 38.7, n=6) | |
| 1920x1080 High Preset AA:T AF:4x | |
| MSI GE63VR 7RF Raider | |
| Schenker XMG Apex 15 | |
| Genomsnitt NVIDIA GeForce GTX 1060 Mobile (60.1 - 67.8, n=6) | |
| Assassin´s Creed Origins | |
| 1920x1080 Ultra High Preset | |
| Schenker XMG Apex 15 | |
| Genomsnitt NVIDIA GeForce GTX 1060 Mobile (42 - 56, n=5) | |
| 1920x1080 High Preset | |
| Schenker XMG Apex 15 | |
| Genomsnitt NVIDIA GeForce GTX 1060 Mobile (49 - 66, n=5) | |
| Final Fantasy XV Benchmark | |
| 1920x1080 High Quality | |
| Genomsnitt av klass Gaming (41 - 215, n=95, senaste 2 åren) | |
| Schenker XMG Apex 15 | |
| Genomsnitt NVIDIA GeForce GTX 1060 Mobile (37.2 - 47.3, n=5) | |
| 1920x1080 Standard Quality | |
| Genomsnitt av klass Gaming (85.7 - 236, n=82, senaste 2 åren) | |
| Schenker XMG Apex 15 | |
| Genomsnitt NVIDIA GeForce GTX 1060 Mobile (58.6 - 62.4, n=2) | |
| Far Cry 5 | |
| 1920x1080 Ultra Preset AA:T | |
| Genomsnitt av klass Gaming (70 - 151, n=6, senaste 2 åren) | |
| Schenker XMG Apex 15 | |
| Genomsnitt NVIDIA GeForce GTX 1060 Mobile (59 - 65, n=5) | |
| 1920x1080 High Preset AA:T | |
| Genomsnitt av klass Gaming (82 - 163, n=6, senaste 2 åren) | |
| Schenker XMG Apex 15 | |
| Genomsnitt NVIDIA GeForce GTX 1060 Mobile (62 - 69, n=5) | |
| låg | med. | hög | ultra | |
|---|---|---|---|---|
| The Witcher 3 (2015) | 77.6 | 41.9 | ||
| Rainbow Six Siege (2015) | 118 | |||
| Rise of the Tomb Raider (2016) | 76.1 | 67.9 | ||
| The Division (2016) | 72.8 | 56.7 | ||
| For Honor (2017) | 108.3 | 103.2 | 78.9 | |
| Ghost Recon Wildlands (2017) | 67.8 | 38.7 | ||
| Assassin´s Creed Origins (2017) | 74 | 66 | 56 | |
| Final Fantasy XV Benchmark (2018) | 62.4 | 47.3 | ||
| Far Cry 5 (2018) | 75 | 69 | 64 |
Ljudnivå
| Låg belastning |
| 32 / 33 / 38 dB(A) |
| Hårddisk |
| 33 dB(A) |
| Hög belastning |
| 47 / 52 dB(A) |
 | ||
30 dB tyst 40 dB(A) hörbar 50 dB(A) högt ljud |
||
min: | ||
(-) Den maximala temperaturen på ovansidan är 50 °C / 122 F, jämfört med genomsnittet av 40.4 °C / 105 F , allt från 21.2 till 68.8 °C för klassen Gaming.
(-) Botten värms upp till maximalt 49 °C / 120 F, jämfört med genomsnittet av 43.2 °C / 110 F
(+) Vid tomgångsbruk är medeltemperaturen för ovansidan 25.6 °C / 78 F, jämfört med enhetsgenomsnittet på 33.9 °C / ### class_avg_f### F.
(-) När du spelar The Witcher 3 är medeltemperaturen för ovansidan 42.7 °C / 109 F, jämfört med enhetsgenomsnittet på 33.9 °C / ## #class_avg_f### F.
(-) Handledsstöden och pekplattan kan bli väldigt varma vid beröring med maximalt 43 °C / 109.4 F.
(-) Medeltemperaturen för handledsstödsområdet på liknande enheter var 28.8 °C / 83.8 F (-14.2 °C / -25.6 F).
Schenker XMG Apex 15 ljudanalys
(±) | högtalarljudstyrkan är genomsnittlig men bra (81 dB)
Bas 100 - 315 Hz
(-) | nästan ingen bas - i genomsnitt 24.2% lägre än medianen
(±) | linjäriteten för basen är genomsnittlig (11.7% delta till föregående frekvens)
Mellan 400 - 2000 Hz
(±) | högre mellan - i genomsnitt 6.8% högre än median
(±) | linjäriteten för mids är genomsnittlig (8.3% delta till föregående frekvens)
Högsta 2 - 16 kHz
(±) | högre toppar - i genomsnitt 5.1% högre än medianen
(+) | toppar är linjära (4.1% delta till föregående frekvens)
Totalt 100 - 16 000 Hz
(±) | linjäriteten för det totala ljudet är genomsnittlig (25.3% skillnad mot median)
Jämfört med samma klass
» 90% av alla testade enheter i den här klassen var bättre, 2% liknande, 7% sämre
» Den bästa hade ett delta på 6%, genomsnittet var 18%, sämst var 132%
Jämfört med alla testade enheter
» 78% av alla testade enheter var bättre, 5% liknande, 18% sämre
» Den bästa hade ett delta på 4%, genomsnittet var 23%, sämst var 134%
MSI GE63VR 7RF Raider ljudanalys
(+) | högtalare kan spela relativt högt (93 dB)
Bas 100 - 315 Hz
(±) | reducerad bas - i genomsnitt 6.6% lägre än medianen
(±) | linjäriteten för basen är genomsnittlig (8.2% delta till föregående frekvens)
Mellan 400 - 2000 Hz
(+) | balanserad mellan - endast 4.1% från medianen
(+) | mids är linjära (4.7% delta till föregående frekvens)
Högsta 2 - 16 kHz
(+) | balanserade toppar - endast 2.6% från medianen
(+) | toppar är linjära (4.6% delta till föregående frekvens)
Totalt 100 - 16 000 Hz
(+) | det totala ljudet är linjärt (9.9% skillnad mot median)
Jämfört med samma klass
» 5% av alla testade enheter i den här klassen var bättre, 2% liknande, 94% sämre
» Den bästa hade ett delta på 6%, genomsnittet var 18%, sämst var 132%
Jämfört med alla testade enheter
» 4% av alla testade enheter var bättre, 1% liknande, 95% sämre
» Den bästa hade ett delta på 4%, genomsnittet var 23%, sämst var 134%
HP Omen 15t-ce000 ljudanalys
(-) | inte särskilt höga högtalare (65.4 dB)
Bas 100 - 315 Hz
(±) | reducerad bas - i genomsnitt 13.8% lägre än medianen
(-) | basen är inte linjär (15.7% delta till föregående frekvens)
Mellan 400 - 2000 Hz
(+) | balanserad mellan - endast 3.3% från medianen
(±) | linjäriteten för mids är genomsnittlig (10.4% delta till föregående frekvens)
Högsta 2 - 16 kHz
(+) | balanserade toppar - endast 3.8% från medianen
(±) | linjäriteten för toppar är genomsnittlig (7.2% delta till föregående frekvens)
Totalt 100 - 16 000 Hz
(±) | linjäriteten för det totala ljudet är genomsnittlig (21.7% skillnad mot median)
Jämfört med samma klass
» 78% av alla testade enheter i den här klassen var bättre, 5% liknande, 17% sämre
» Den bästa hade ett delta på 6%, genomsnittet var 18%, sämst var 132%
Jämfört med alla testade enheter
» 62% av alla testade enheter var bättre, 7% liknande, 31% sämre
» Den bästa hade ett delta på 4%, genomsnittet var 23%, sämst var 134%
Schenker XMG Core 15 ljudanalys
(±) | högtalarljudstyrkan är genomsnittlig men bra (75 dB)
Bas 100 - 315 Hz
(±) | reducerad bas - i genomsnitt 8% lägre än medianen
(±) | linjäriteten för basen är genomsnittlig (11.7% delta till föregående frekvens)
Mellan 400 - 2000 Hz
(±) | högre mellan - i genomsnitt 10.1% högre än median
(±) | linjäriteten för mids är genomsnittlig (13.2% delta till föregående frekvens)
Högsta 2 - 16 kHz
(+) | balanserade toppar - endast 1.9% från medianen
(±) | linjäriteten för toppar är genomsnittlig (7.5% delta till föregående frekvens)
Totalt 100 - 16 000 Hz
(±) | linjäriteten för det totala ljudet är genomsnittlig (23.6% skillnad mot median)
Jämfört med samma klass
» 86% av alla testade enheter i den här klassen var bättre, 4% liknande, 10% sämre
» Den bästa hade ett delta på 6%, genomsnittet var 18%, sämst var 132%
Jämfört med alla testade enheter
» 71% av alla testade enheter var bättre, 6% liknande, 23% sämre
» Den bästa hade ett delta på 4%, genomsnittet var 23%, sämst var 134%
| Av/Standby | |
| Låg belastning | |
| Hög belastning |
|
Förklaring:
min: | |
| Schenker XMG Apex 15 i7-8700, GeForce GTX 1060 Mobile | MSI GE63VR 7RF Raider i7-7700HQ, GeForce GTX 1070 Mobile | HP Omen 15t-ce000 i7-7700HQ, GeForce GTX 1060 Max-Q | Schenker XMG Core 15 i7-7700HQ, GeForce GTX 1060 Mobile | Genomsnitt av klass Gaming | |
|---|---|---|---|---|---|
| Power Consumption | -38% | -38% | -57% | -61% | |
| Idle Minimum * (Watt) | 7 | 11 -57% | 15.4 -120% | 18 -157% | 13 ? -86% |
| Idle Average * (Watt) | 10 | 16 -60% | 22.4 -124% | 22 -120% | 19 ? -90% |
| Idle Maximum * (Watt) | 14 | 21 -50% | 22.4 -60% | 26 -86% | 24.6 ? -76% |
| Load Average * (Watt) | 114 | 92 19% | 78.1 31% | 93 18% | 110.7 ? 3% |
| Witcher 3 ultra * (Watt) | 131 | 185 -41% | 97.5 26% | 119 9% | |
| Load Maximum * (Watt) | 164 | 224 -37% | 133.52 19% | 175 -7% | 259 ? -58% |
* ... mindre är bättre
| Schenker XMG Apex 15 i7-8700, GeForce GTX 1060 Mobile, 62 Wh | MSI GE63VR 7RF Raider i7-7700HQ, GeForce GTX 1070 Mobile, 51 Wh | HP Omen 15t-ce000 i7-7700HQ, GeForce GTX 1060 Max-Q, 70 Wh | Schenker XMG Core 15 i7-7700HQ, GeForce GTX 1060 Mobile, 82 Wh | Genomsnitt av klass Gaming | |
|---|---|---|---|---|---|
| Batteridrifttid | -48% | -36% | -29% | 15% | |
| Reader / Idle (h) | 9.6 | 5.4 -44% | 5 -48% | 5 -48% | 8.27 ? -14% |
| H.264 (h) | 5.1 | 3.9 -24% | 8.32 ? 63% | ||
| WiFi v1.3 (h) | 5.6 | 3.4 -39% | 3.5 -37% | 4.7 -16% | 7.11 ? 27% |
| Load (h) | 1.8 | 0.7 -61% | 1.4 -22% | 1.3 -28% | 1.502 ? -17% |
För
Emot
Läs den fullständiga versionen av den här recensionen på engelska här.
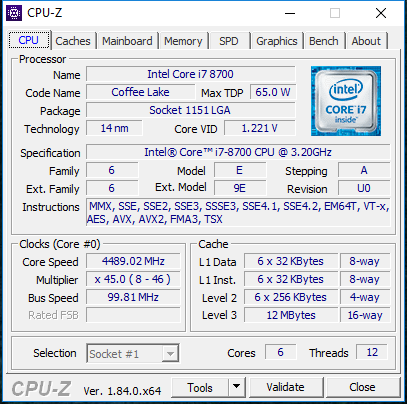
Core i7-8700 CPU:n i Schenker XMG Apex 15 är förvisso för mycket när man i huvudsak tittar på spelkrav. Men det behöver inte göra något med tanke på att dom vanliga nackdelarna såsom högre energiförbrukning och mer uttalad ljudnivå mystiskt nog saknas i det här fallet.
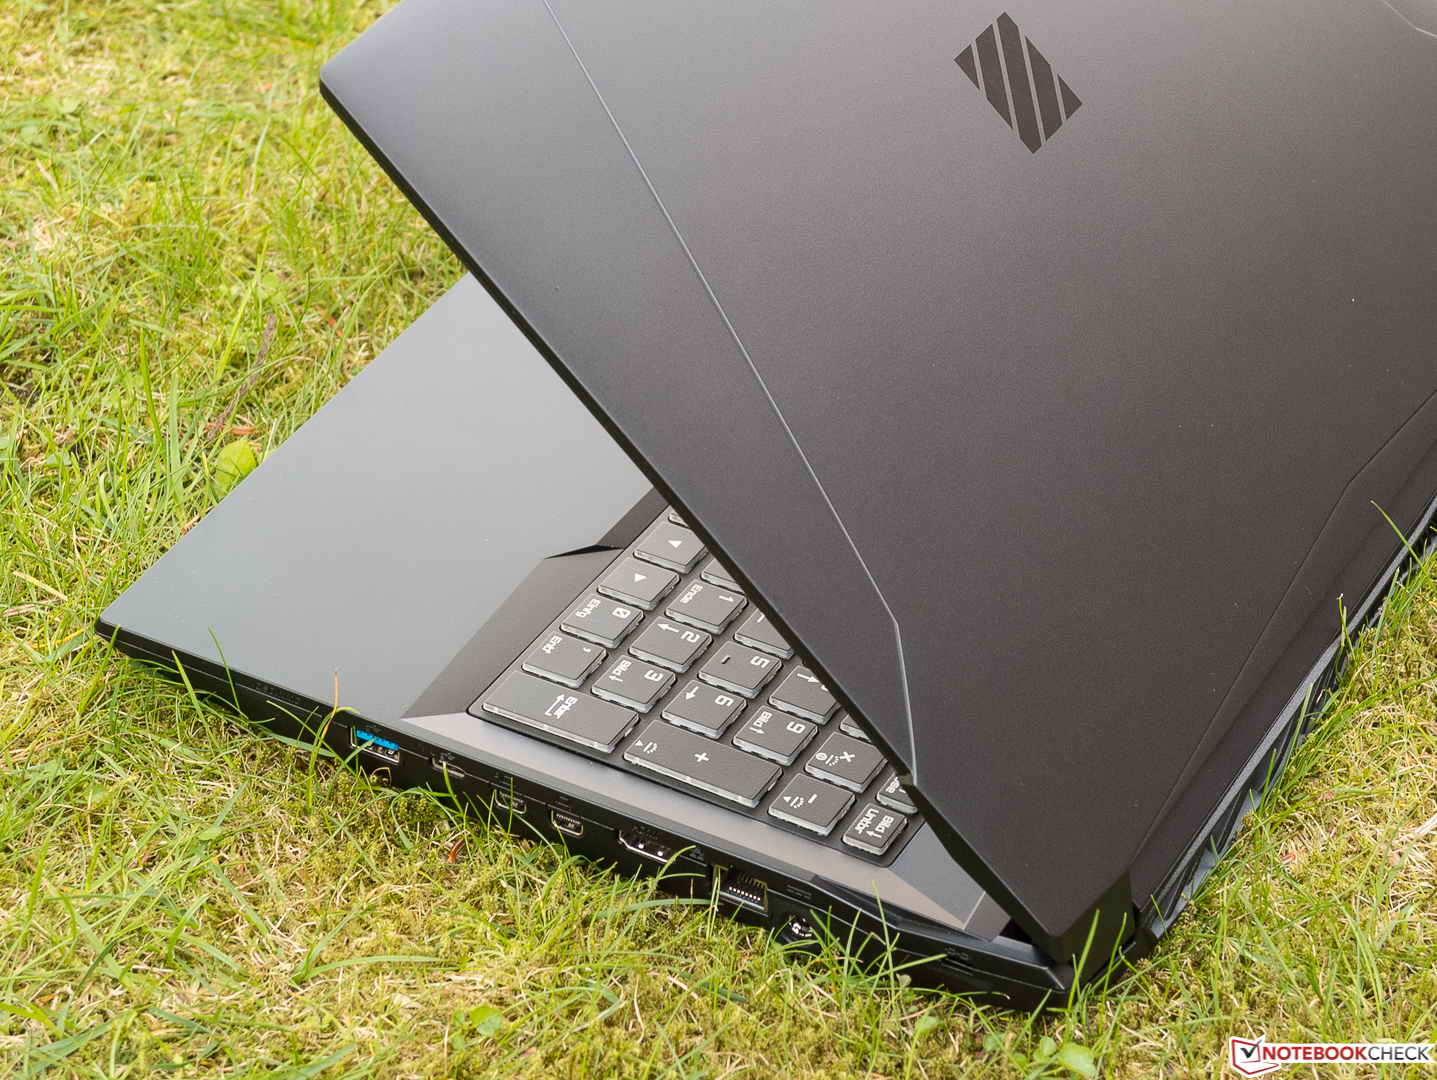
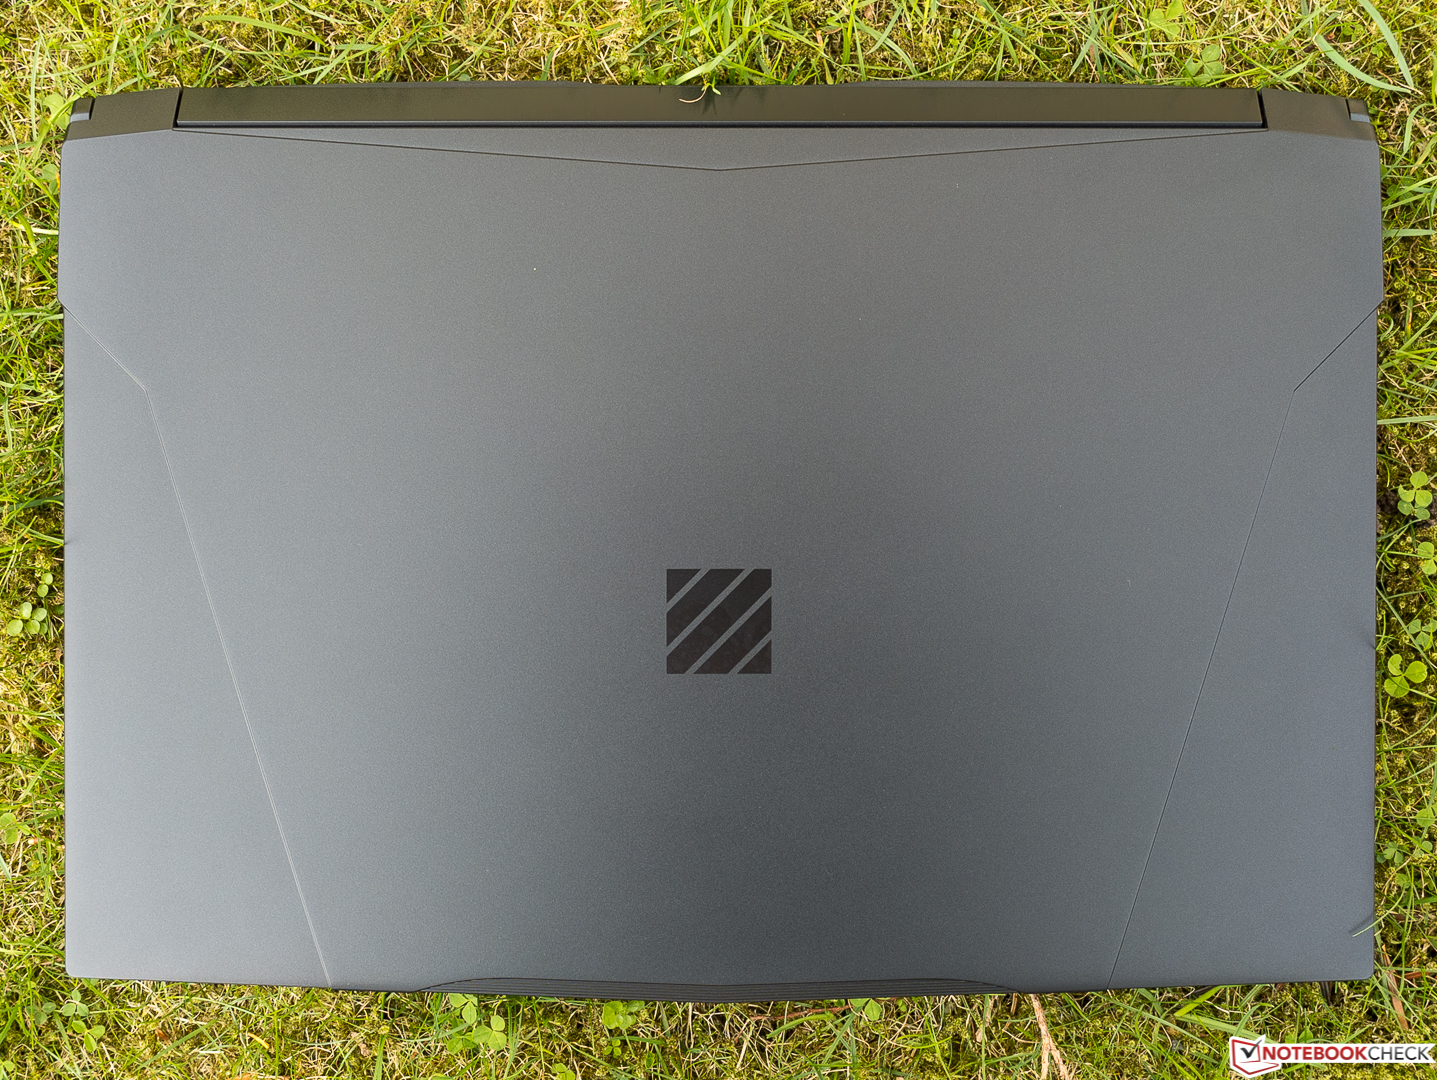
Allt som allt så är Apex 15 en kul laptop. Om det bara inte vore för den dåliga designen på skärmlocket.
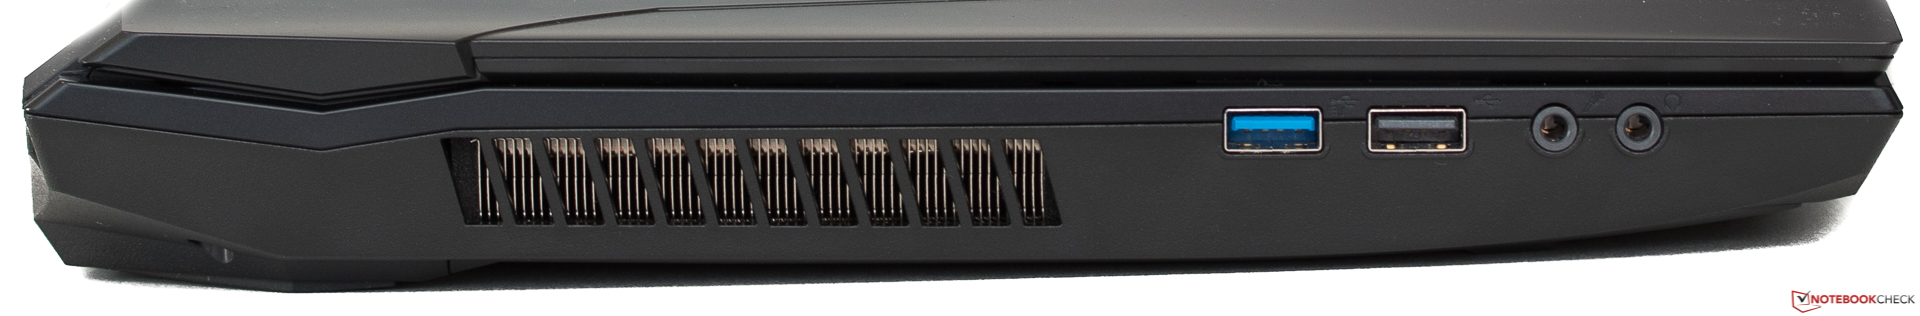
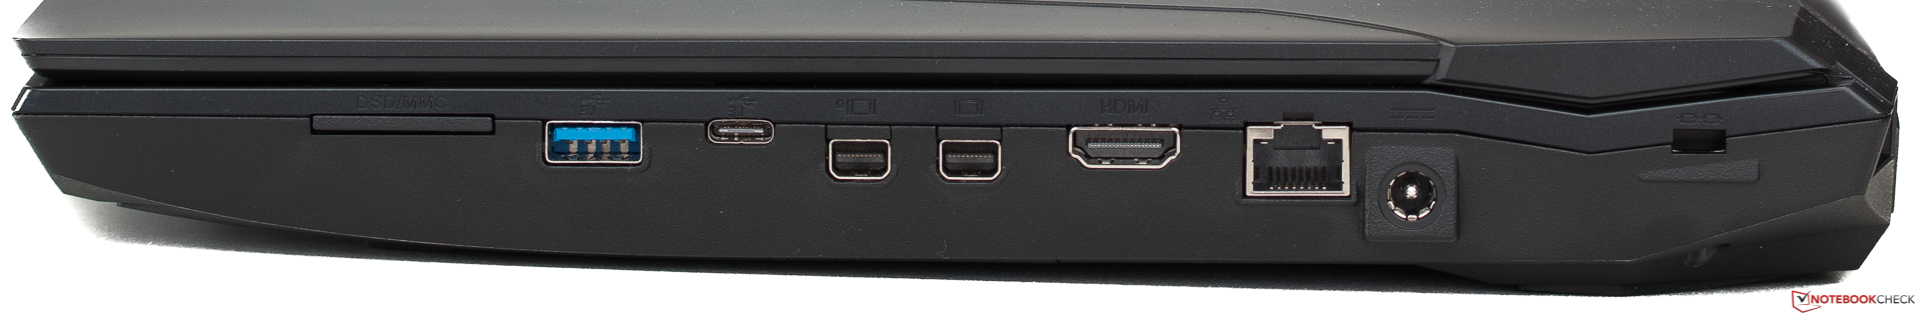
För en kostnad på ungefär 17 000 kronor så får du en gedigen spellaptop utan tillägg såsom G-Sync eller Thunderbolt 3. Om du inte planerar att gå bortom FHD i en nära framtid så kommer GTX 1060 att hålla ganska många år till, särskilt med tanke på att Apex 15 har en av dom snabbaste tillämpningarna av GTX 1060 som finns för tillfället.
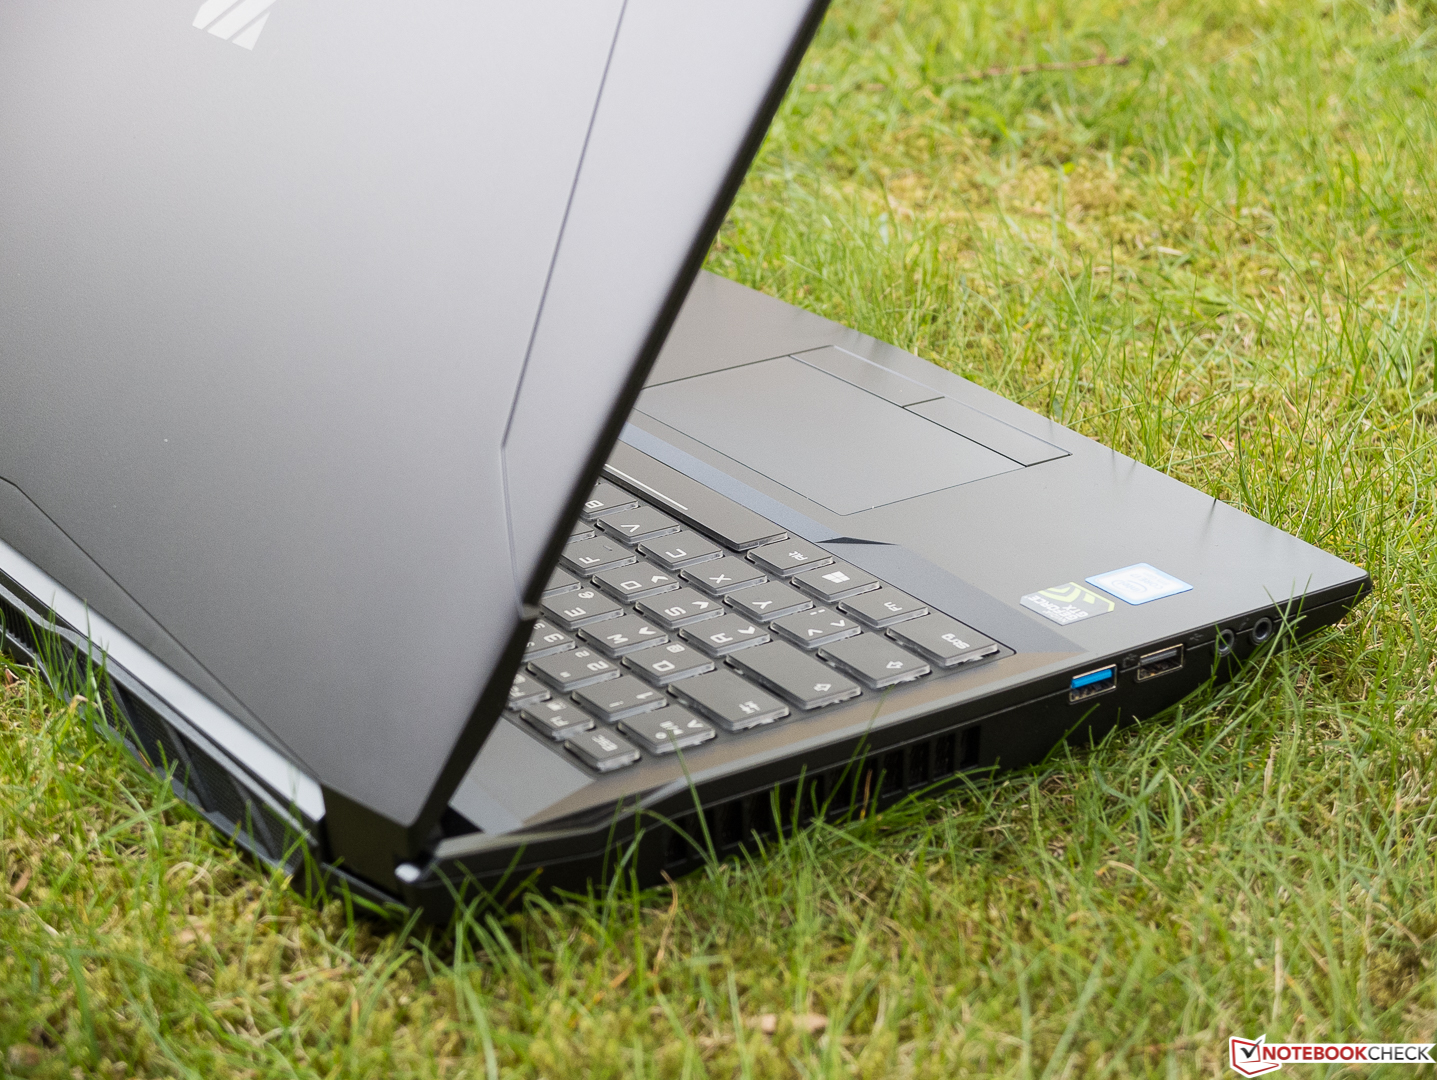
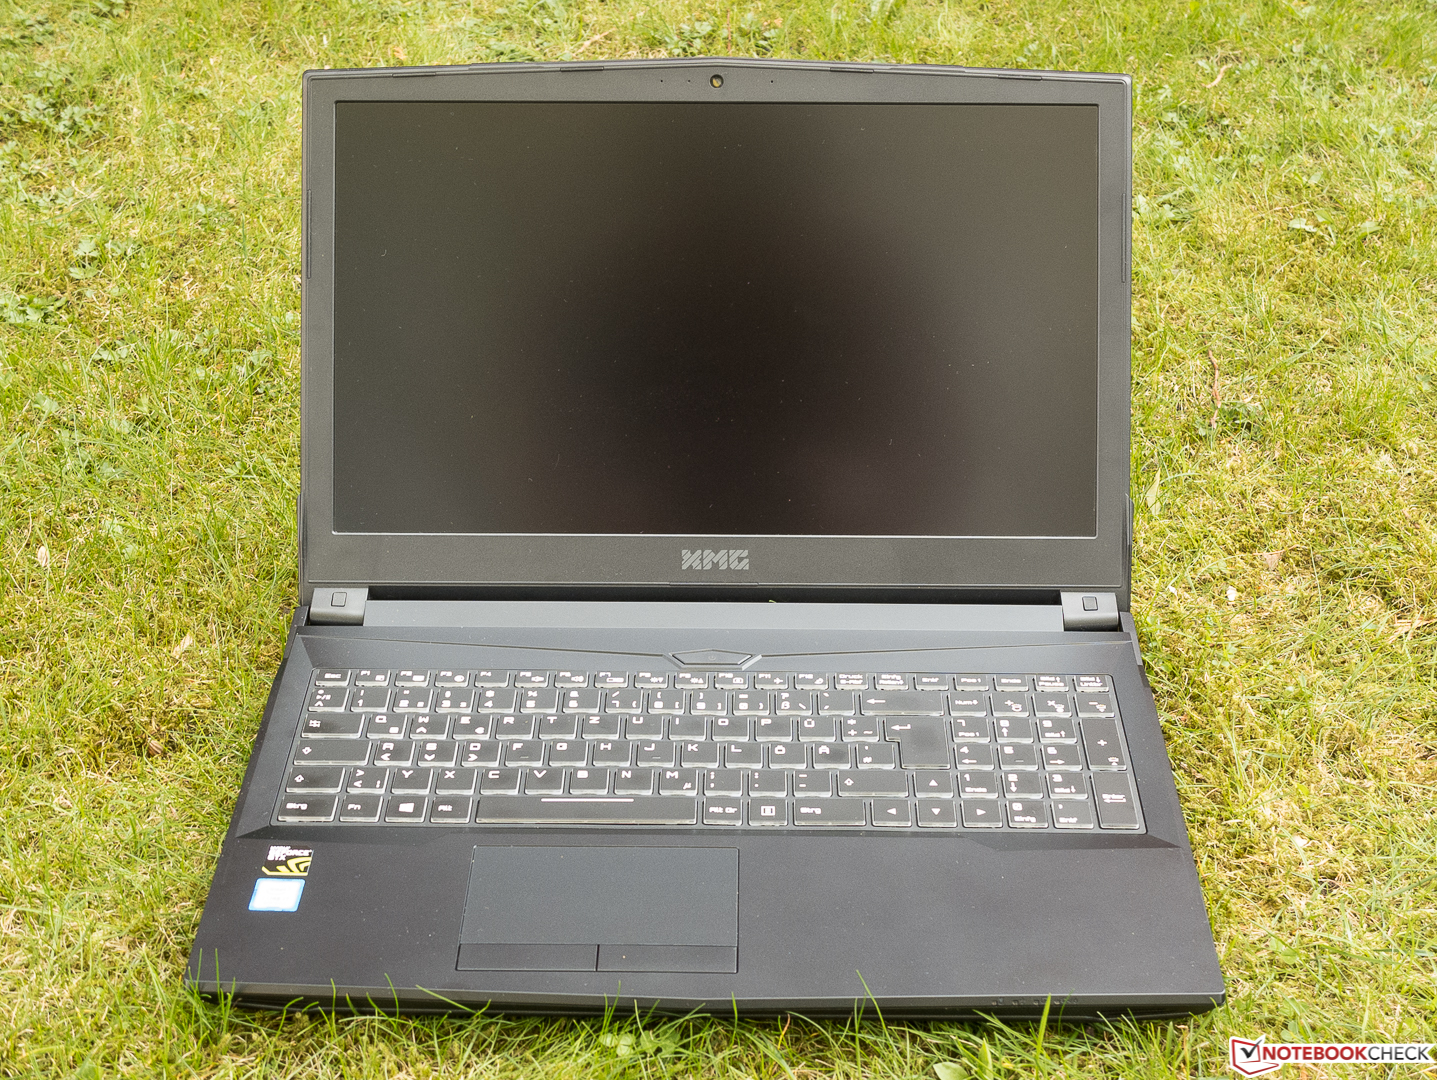
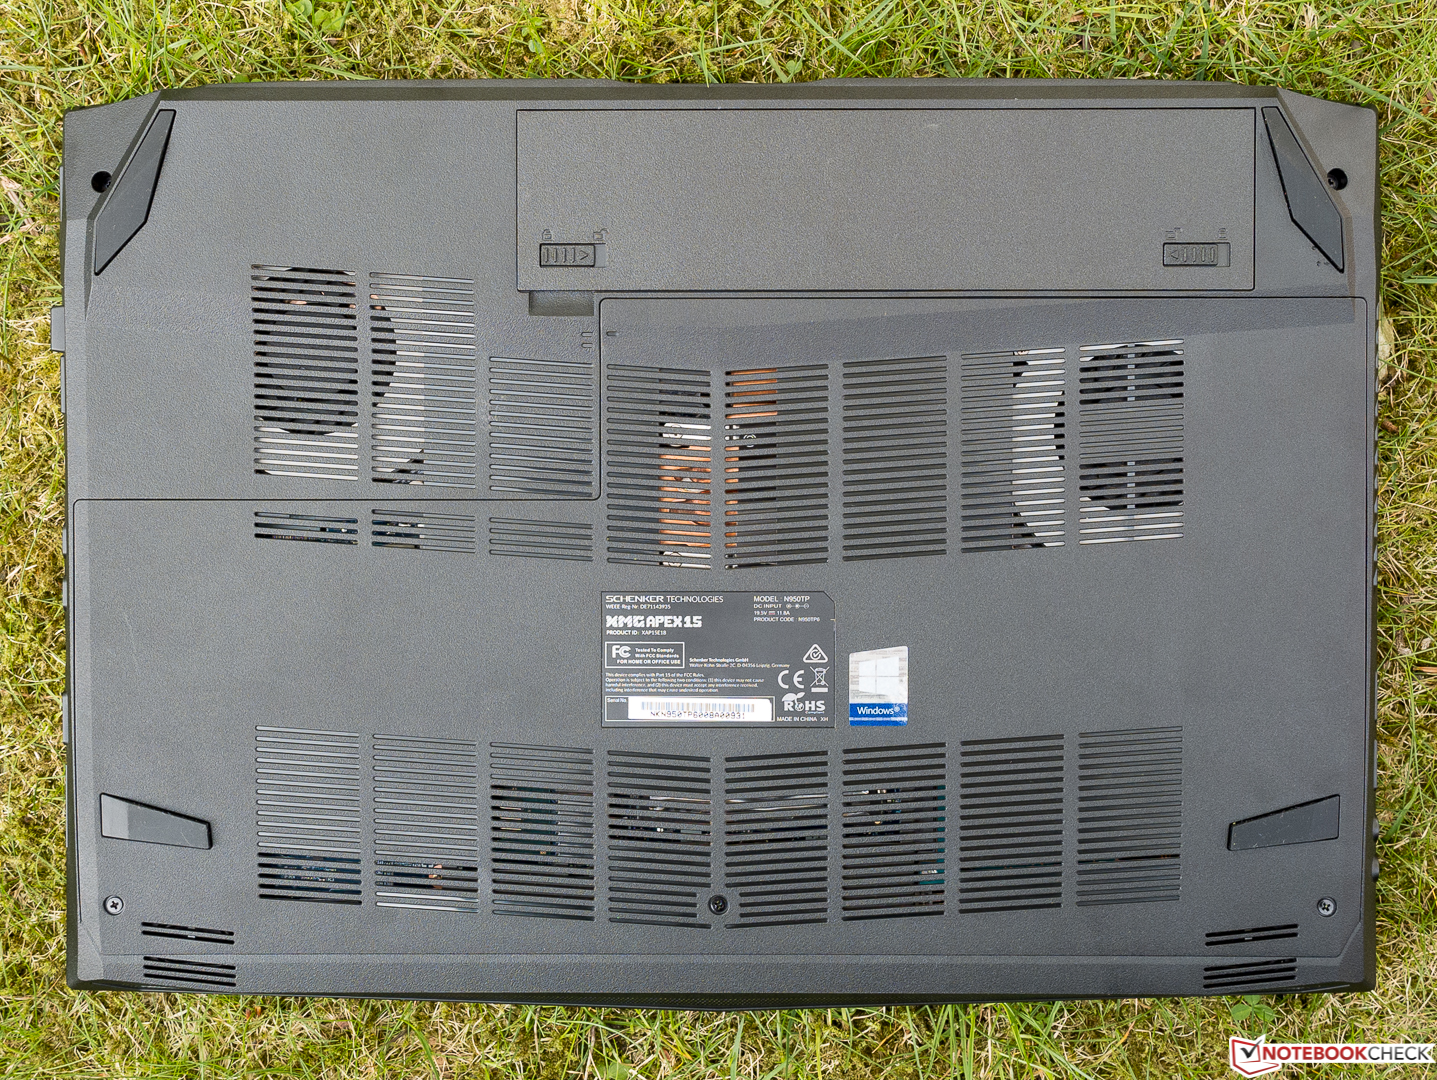
Anslutbarheten får denna laptop att stå ut gentemot många av sina konkurrenter, och servicemöjligheterna är nästintill ideala. Det är sant, skärmen saknar dedikerade spelfunktioner som vi har vant oss vid. Men trots det så gör den ett ganska bra jobb. Den snabba CPU:n ackompanjeras av en väldigt snabb SSD och datorns låga energiförbrukning resulterar i väldigt lång batteritid. Dom flesta nackdelar rör skärmen, eller mer specifikt, lockets design. Även om vi inte kan förstå vilka val som ledde till denna dåliga design så förtjänar enheten ändå vårt fulla stöd. Om du behöver mer 3D-kraft kan MSI:s laptop som drivs av GTX 1070 vara värd att titta närmare på. Var dock försiktig med dess TN-panel.
Schenker XMG Apex 15
- 04/28/2018 v6 (old)
Sven Kloevekorn
Price comparison
