Nvidia RTX 3000 Ada prestandadebut: Dell Precision 5480 arbetsstation recension

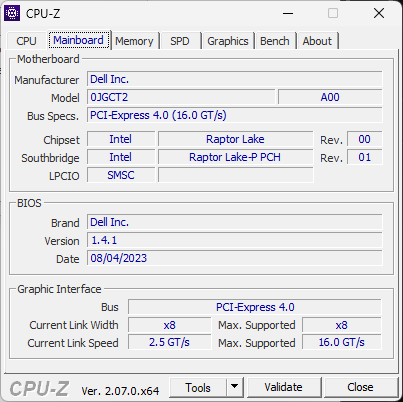
Precision 5480 är en direkt efterföljare till förra årets Precision 5470 genom att uppdatera 12:e generationens Alder Lake-H CPU och Nvidia Ampere GPU med 13:e generationens Raptor Lake-H respektive Ada Lovelace-alternativ. Det råkar också vara en av de första mobila arbetsstationerna som har RTX 3000 Ada. Chassit eller skelettet är annars detsamma som på Precision 5470 och därför rekommenderar vi att du kollar in vår recension av förra årets modell för att lära dig mer om de fysiska egenskaperna hos Precision 5480.
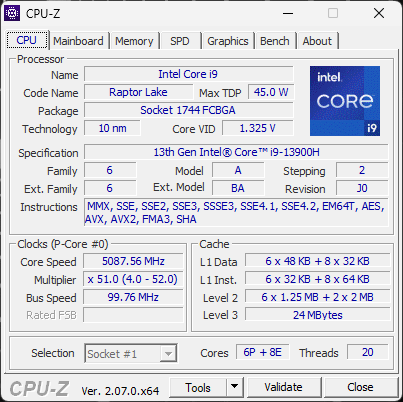
Vår specifika testenhet är en avancerad konfiguration med Core i9-13900H CPU, RTX 3000 Ada GPU och QHD+ pekskärm för cirka 4400 USD. Mindre SKU:er med Core i5-13500H, integrerad Iris Xe-grafik och beröringsfri FHD+-skärm finns också tillgängliga från 2300 USD.
Utrymmet för 14-tums subnotebooks för arbetsstationer är relativt litet, men det finns fortfarande ett par alternativ, inklusiveLenovo ThinkPad P14s och HP ZBook Firefly 14-serien.
Fler recensioner av Dell:
Potentiella konkurrenter i jämförelse
Gradering | Datum | Modell | Vikt | Höjd | Storlek | Upplösning | Pris |
|---|---|---|---|---|---|---|---|
| 89.6 % v7 (old) | 09/2023 | Dell Precision 5480 i9-13900H, RTX 3000 Ada Generation Laptop | 1.6 kg | 18.95 mm | 14.00" | 2560x1600 | |
| 87.6 % v7 (old) | 09/2022 | Dell Precision 5000 5470 i9-12900H, RTX A1000 Laptop GPU | 1.6 kg | 18.95 mm | 14.00" | 2560x1600 | |
| 88.3 % v7 (old) | 12/2021 | Dell Precision 5000 5560 i7-11850H, RTX A2000 Laptop GPU | 2 kg | 18 mm | 15.60" | 3840x2400 | |
| 86.9 % v7 (old) | 04/2023 | Lenovo ThinkPad P14s G3 AMD 21J6S05000 R7 PRO 6850U, Radeon 680M | 1.5 kg | 17.9 mm | 14.00" | 1920x1200 | |
| 87.4 % v7 (old) | 01/2023 | HP ZBook Firefly 14 G9-6B8A2EA i7-1265U, T550 Laptop GPU | 1.5 kg | 19.9 mm | 14.00" | 1920x1200 | |
| 87.8 % v7 (old) | 04/2023 | Lenovo ThinkPad P15v G3 21EM001AGE R7 PRO 6850H, RTX A2000 Laptop GPU | 2.2 kg | 22.7 mm | 15.60" | 3840x2160 |
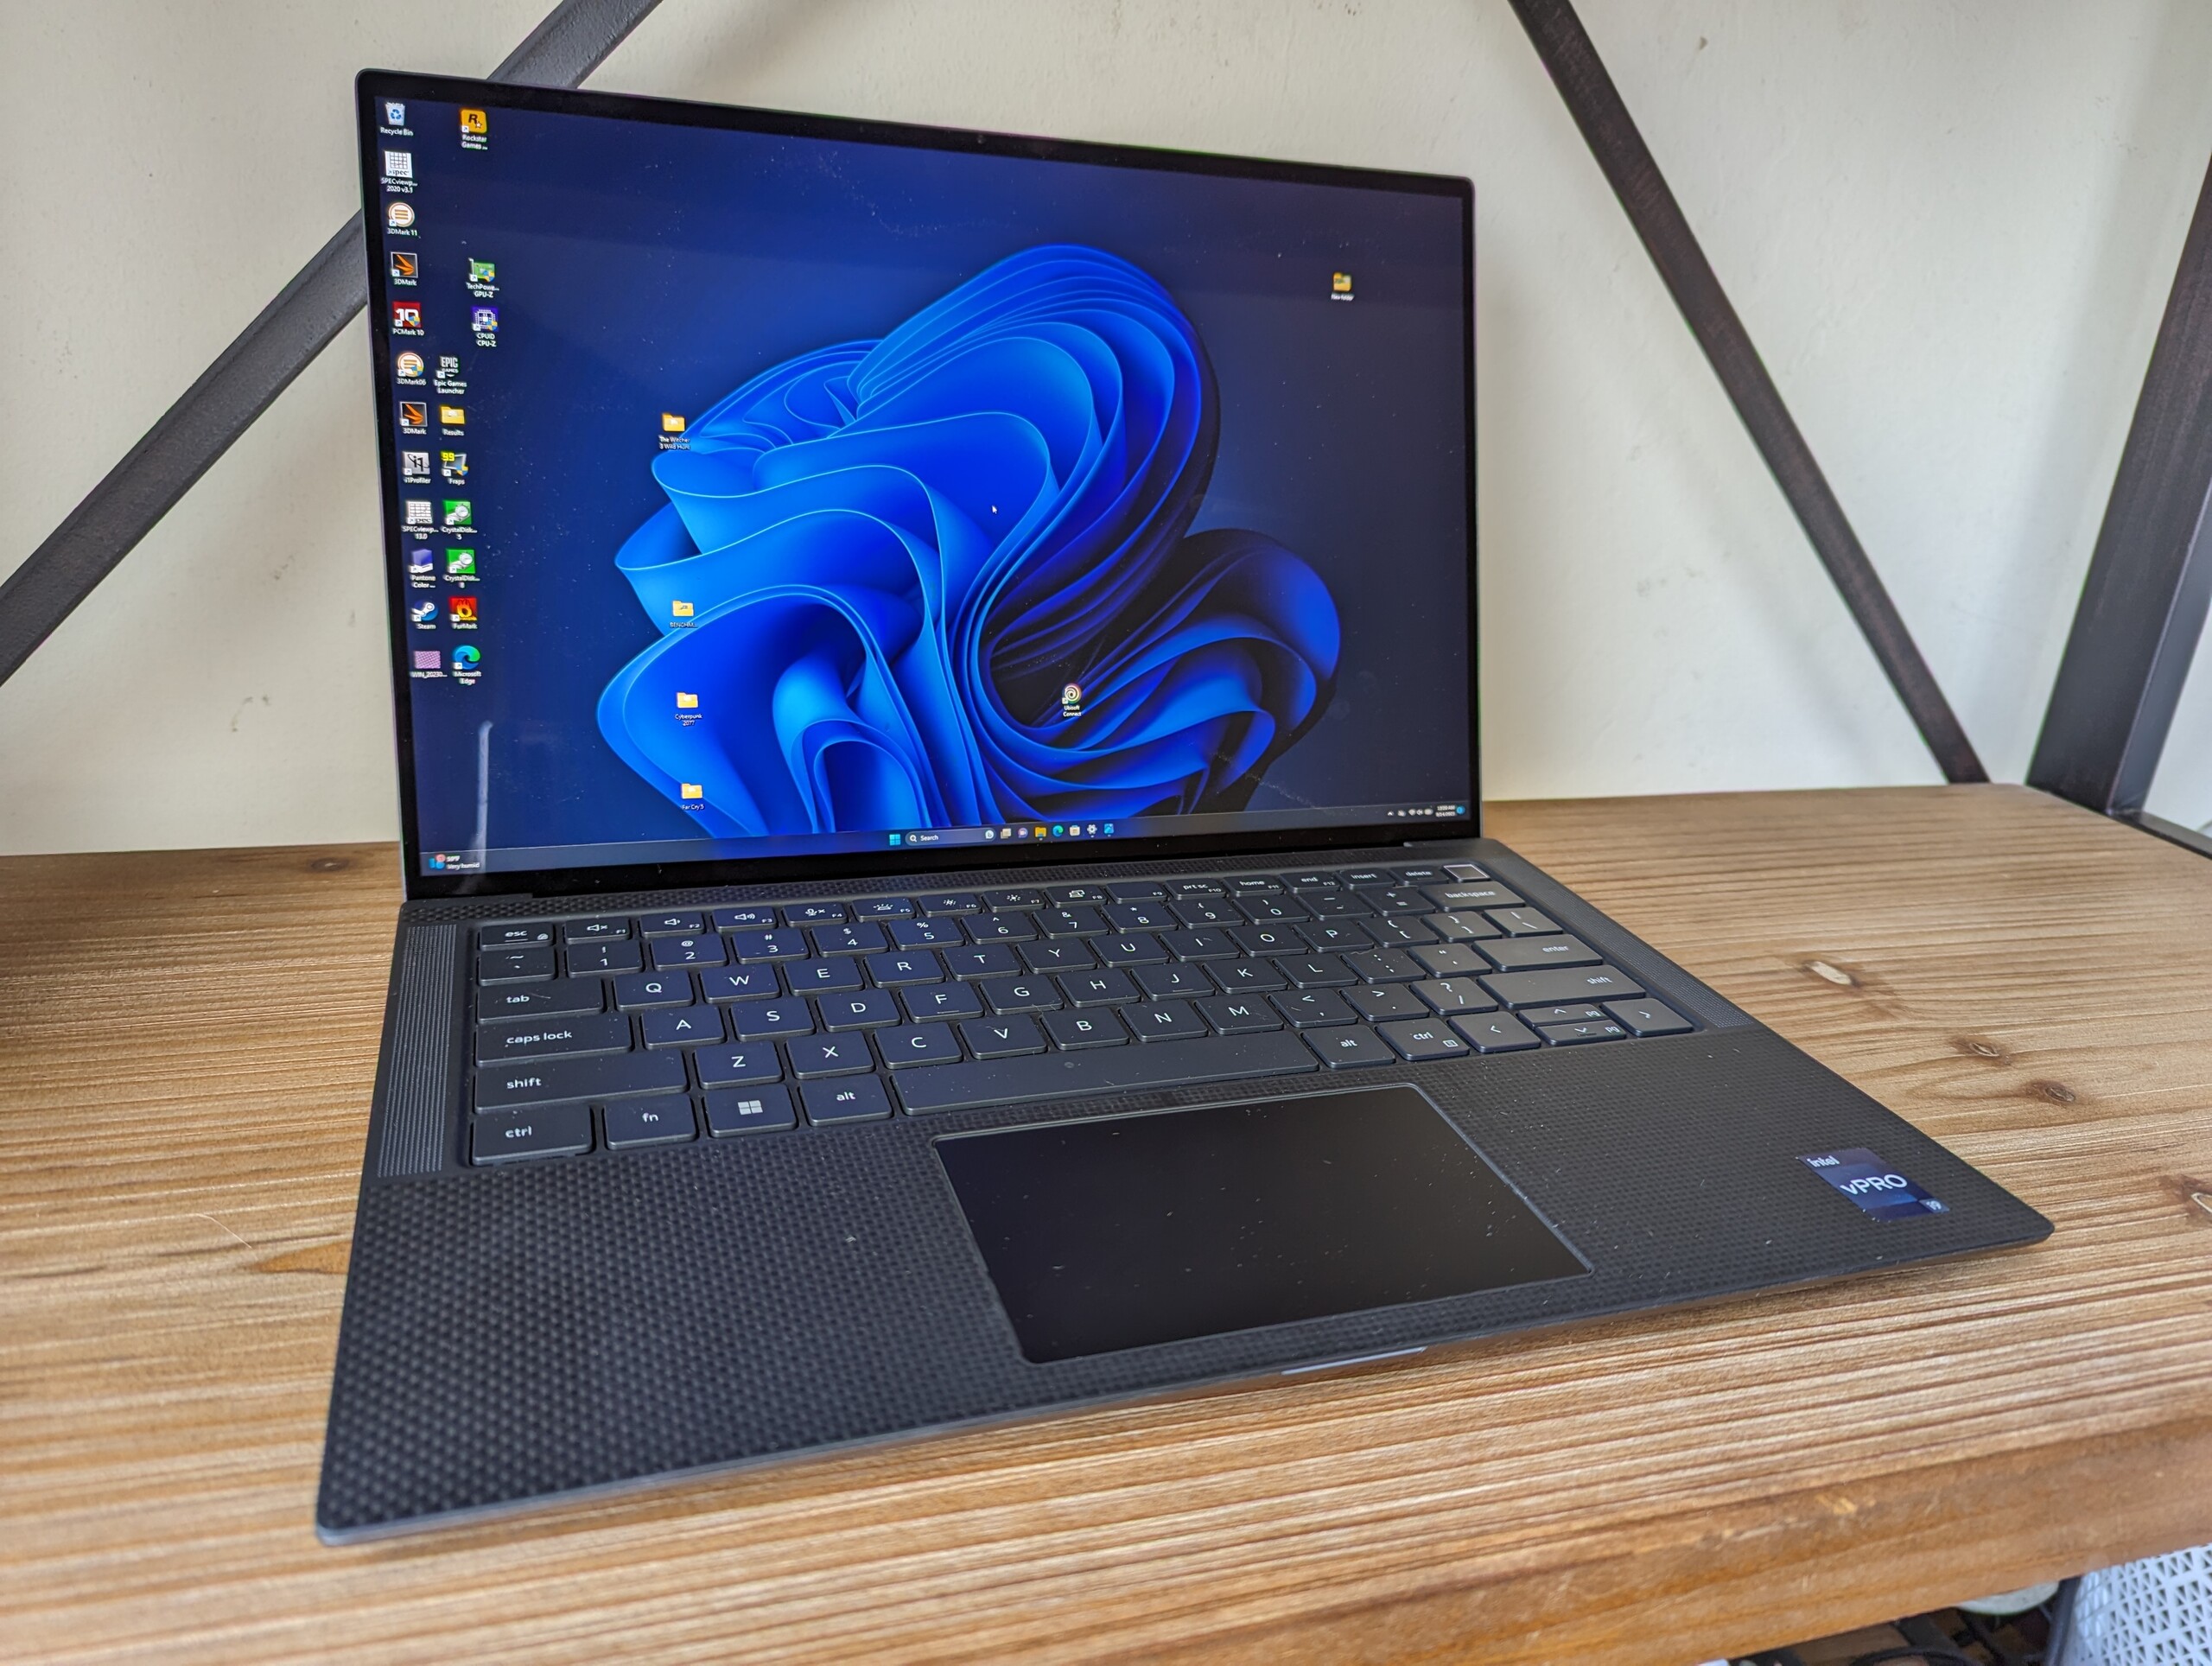
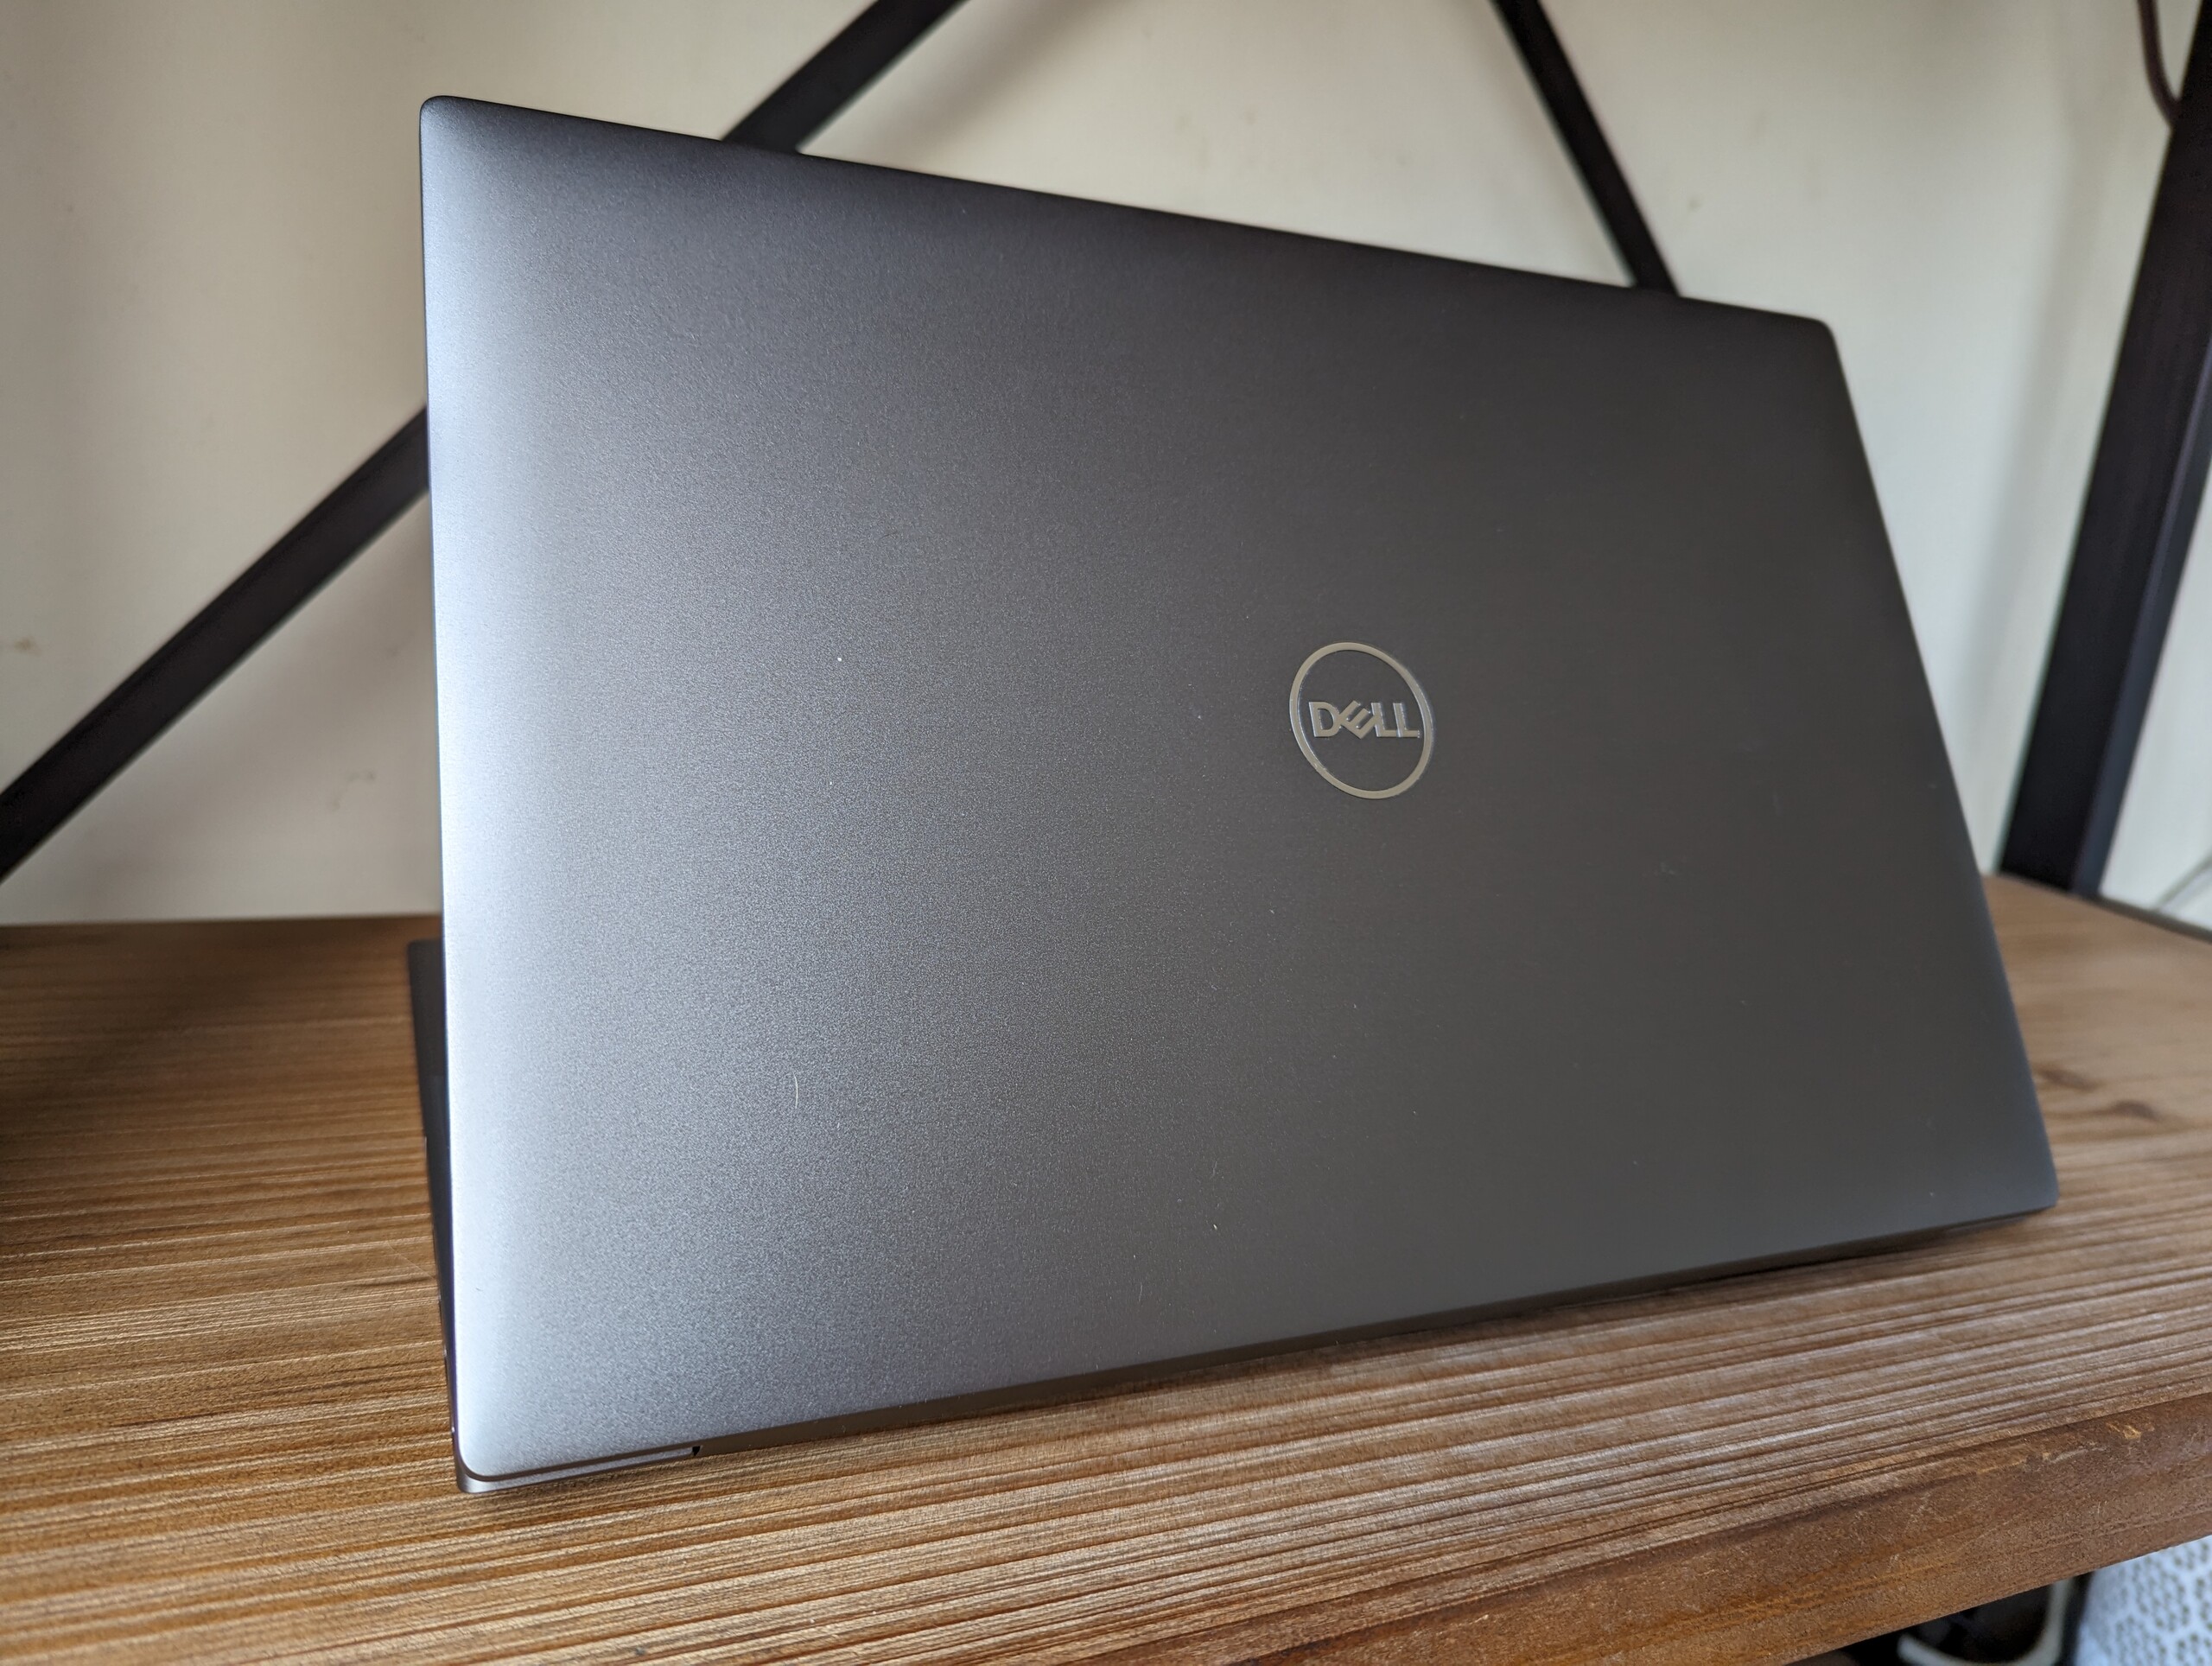
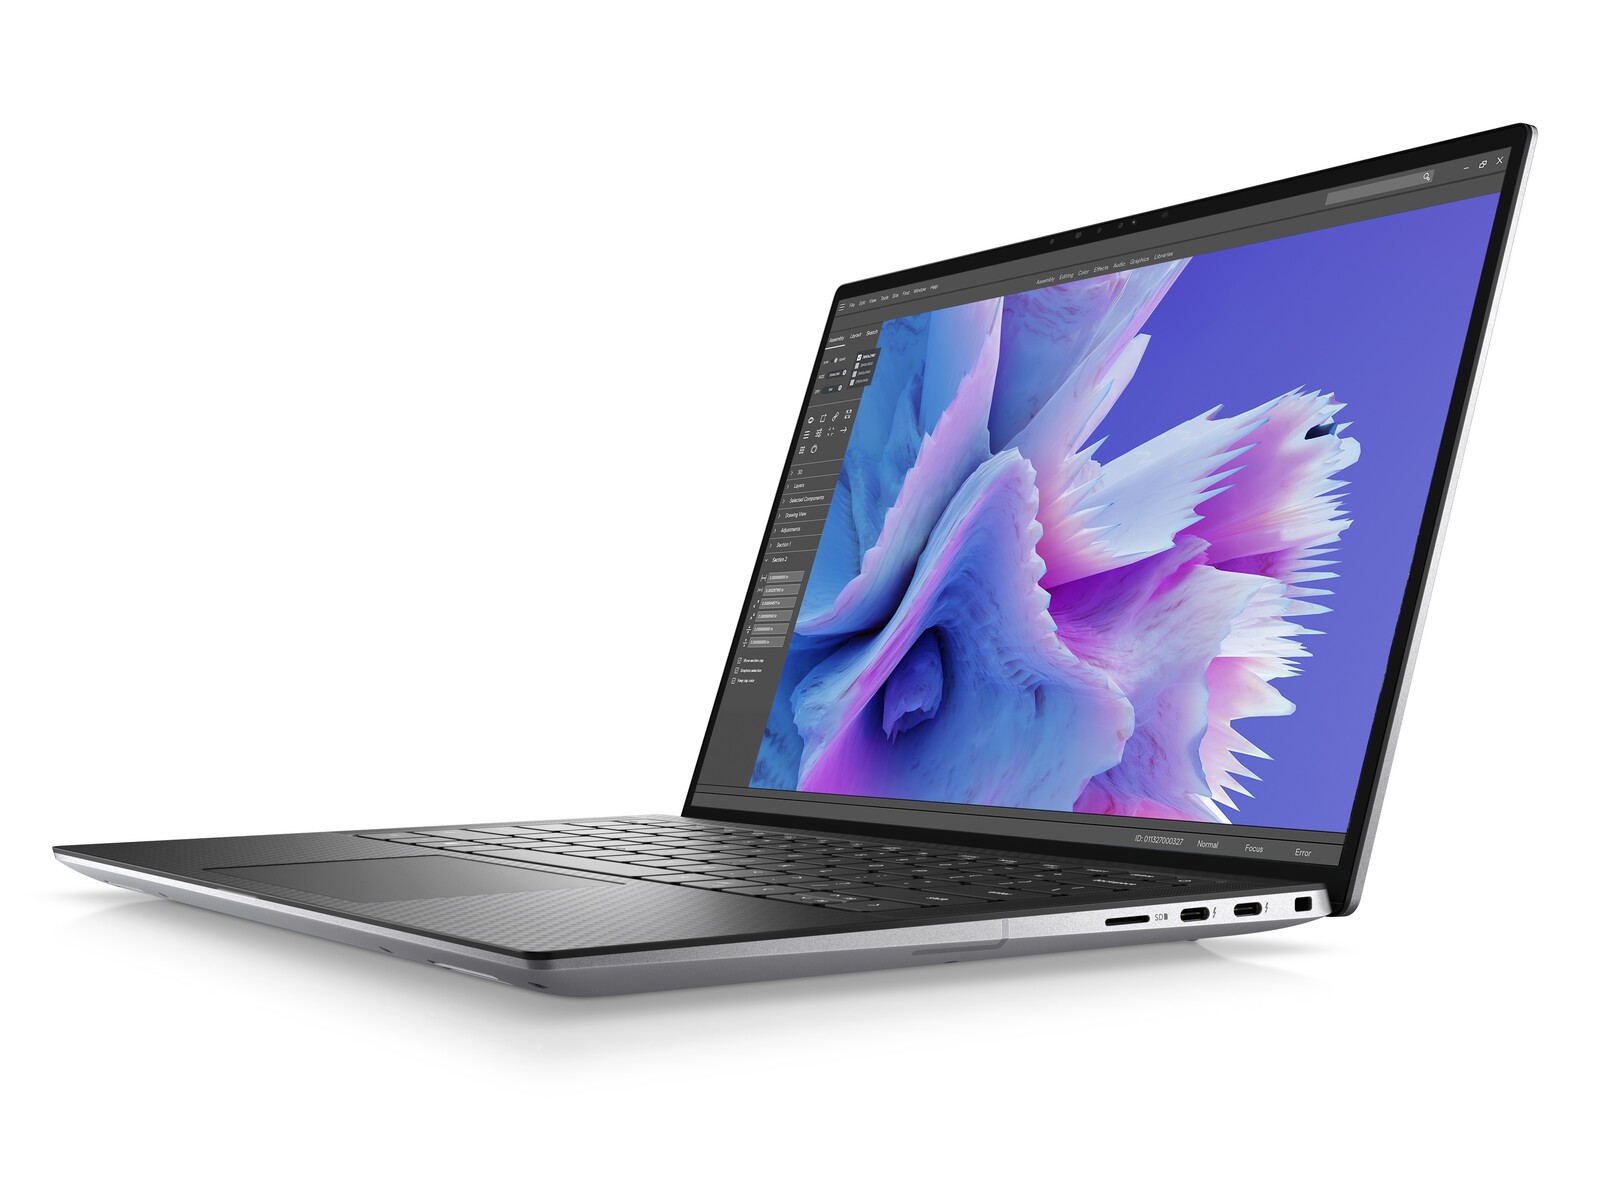
Fodral - Inspirerad av XPS
SD-kortläsare
| SD Card Reader | |
| average JPG Copy Test (av. of 3 runs) | |
| Dell Precision 5000 5560 (AV Pro V60) | |
| Lenovo ThinkPad P15v G3 21EM001AGE (AV Pro V60) | |
| Dell Precision 5000 5470 (AV Pro V60) | |
| Dell Precision 5480 (AV Pro V60) | |
| maximum AS SSD Seq Read Test (1GB) | |
| Dell Precision 5000 5470 (AV Pro V60) | |
| Lenovo ThinkPad P15v G3 21EM001AGE (AV Pro V60) | |
| Dell Precision 5000 5560 (AV Pro V60) | |
| Dell Precision 5480 (AV Pro V60) | |
Kommunikation
| Networking | |
| iperf3 transmit AX12 | |
| Dell Precision 5000 5560 | |
| iperf3 receive AX12 | |
| Dell Precision 5000 5560 | |
| iperf3 transmit AXE11000 | |
| Dell Precision 5480 | |
| Lenovo ThinkPad P14s G3 AMD 21J6S05000 | |
| Lenovo ThinkPad P15v G3 21EM001AGE | |
| iperf3 receive AXE11000 | |
| Lenovo ThinkPad P14s G3 AMD 21J6S05000 | |
| Lenovo ThinkPad P15v G3 21EM001AGE | |
| Dell Precision 5480 | |
| iperf3 transmit AXE11000 6GHz | |
| Dell Precision 5480 | |
| Lenovo ThinkPad P14s G3 AMD 21J6S05000 | |
| Dell Precision 5000 5470 | |
| Lenovo ThinkPad P15v G3 21EM001AGE | |
| iperf3 receive AXE11000 6GHz | |
| Lenovo ThinkPad P14s G3 AMD 21J6S05000 | |
| Lenovo ThinkPad P15v G3 21EM001AGE | |
| Dell Precision 5480 | |
| Dell Precision 5000 5470 | |
Webbkamera
Dell levererar fortfarande 720p-webbkameror till många av sina flaggskeppsprodukter, inklusive XPS-serien och Precision laptops baserade på XPS-designen. Andra tillverkare har redan gått vidare till 2 MP eller 5 MP sensorer och vi förväntar oss att Dell gör detsamma för alla framtida redesigner.


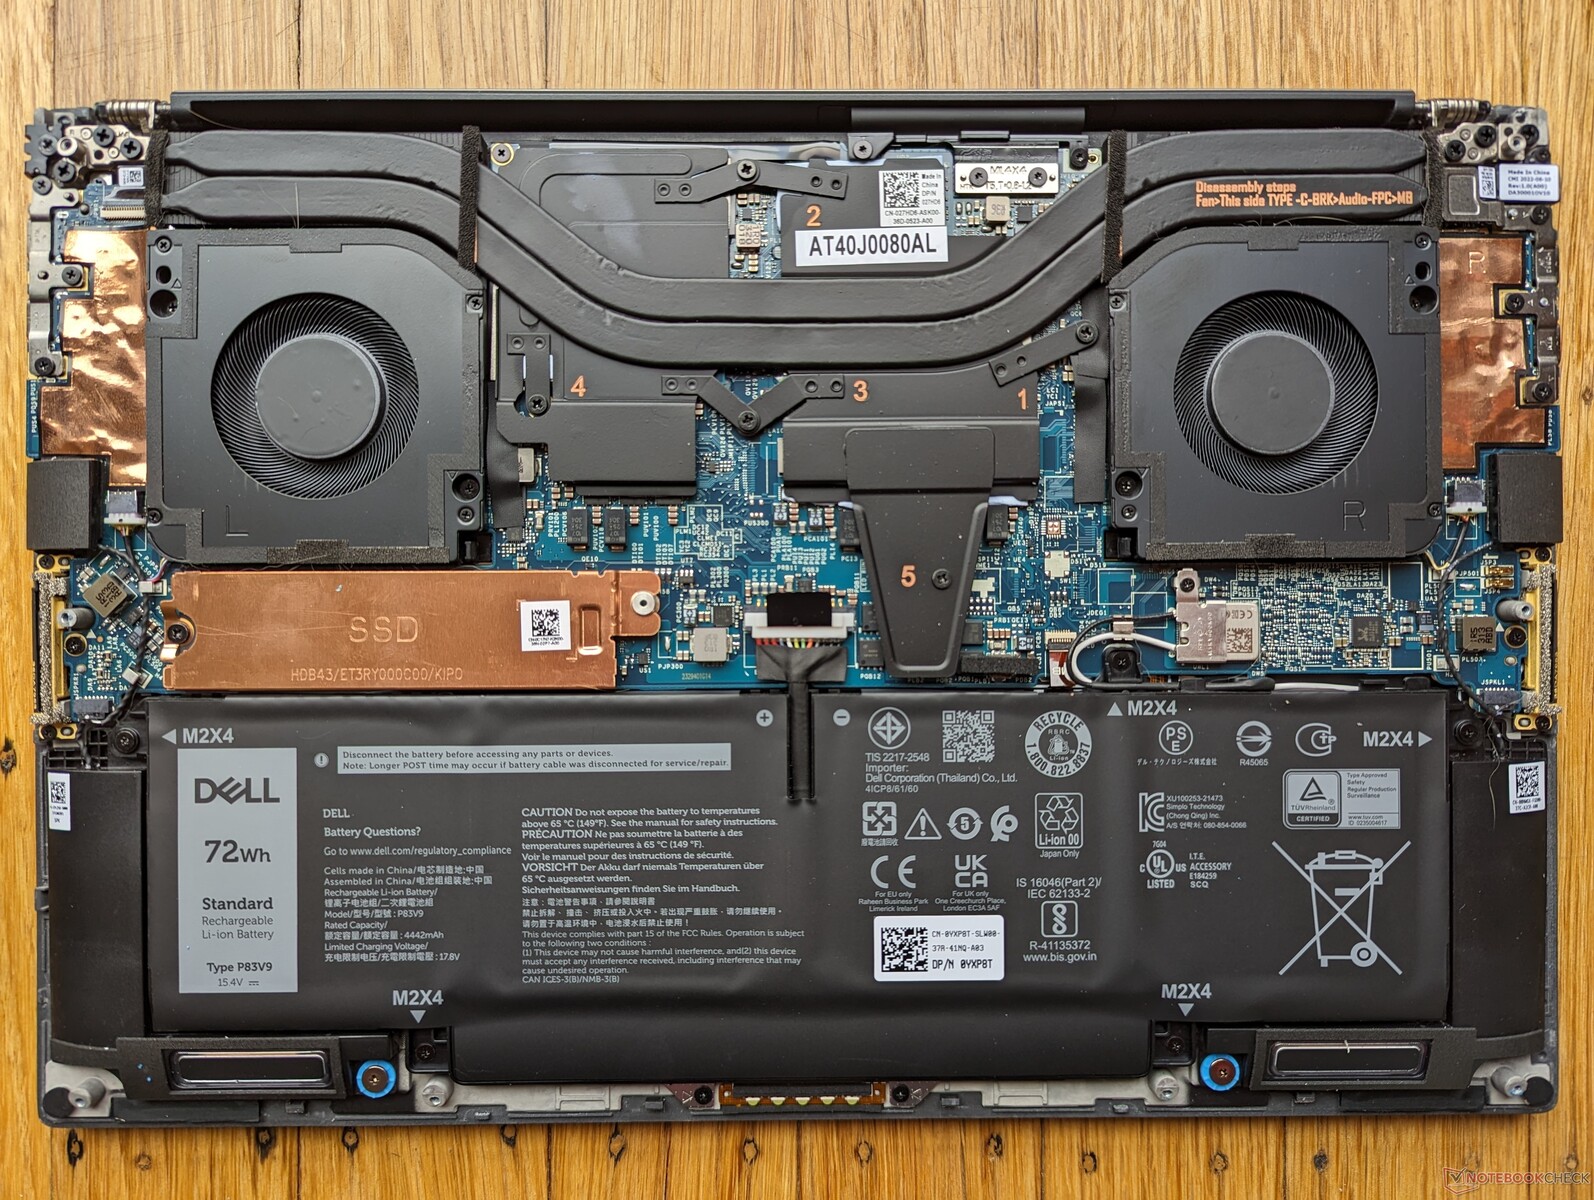
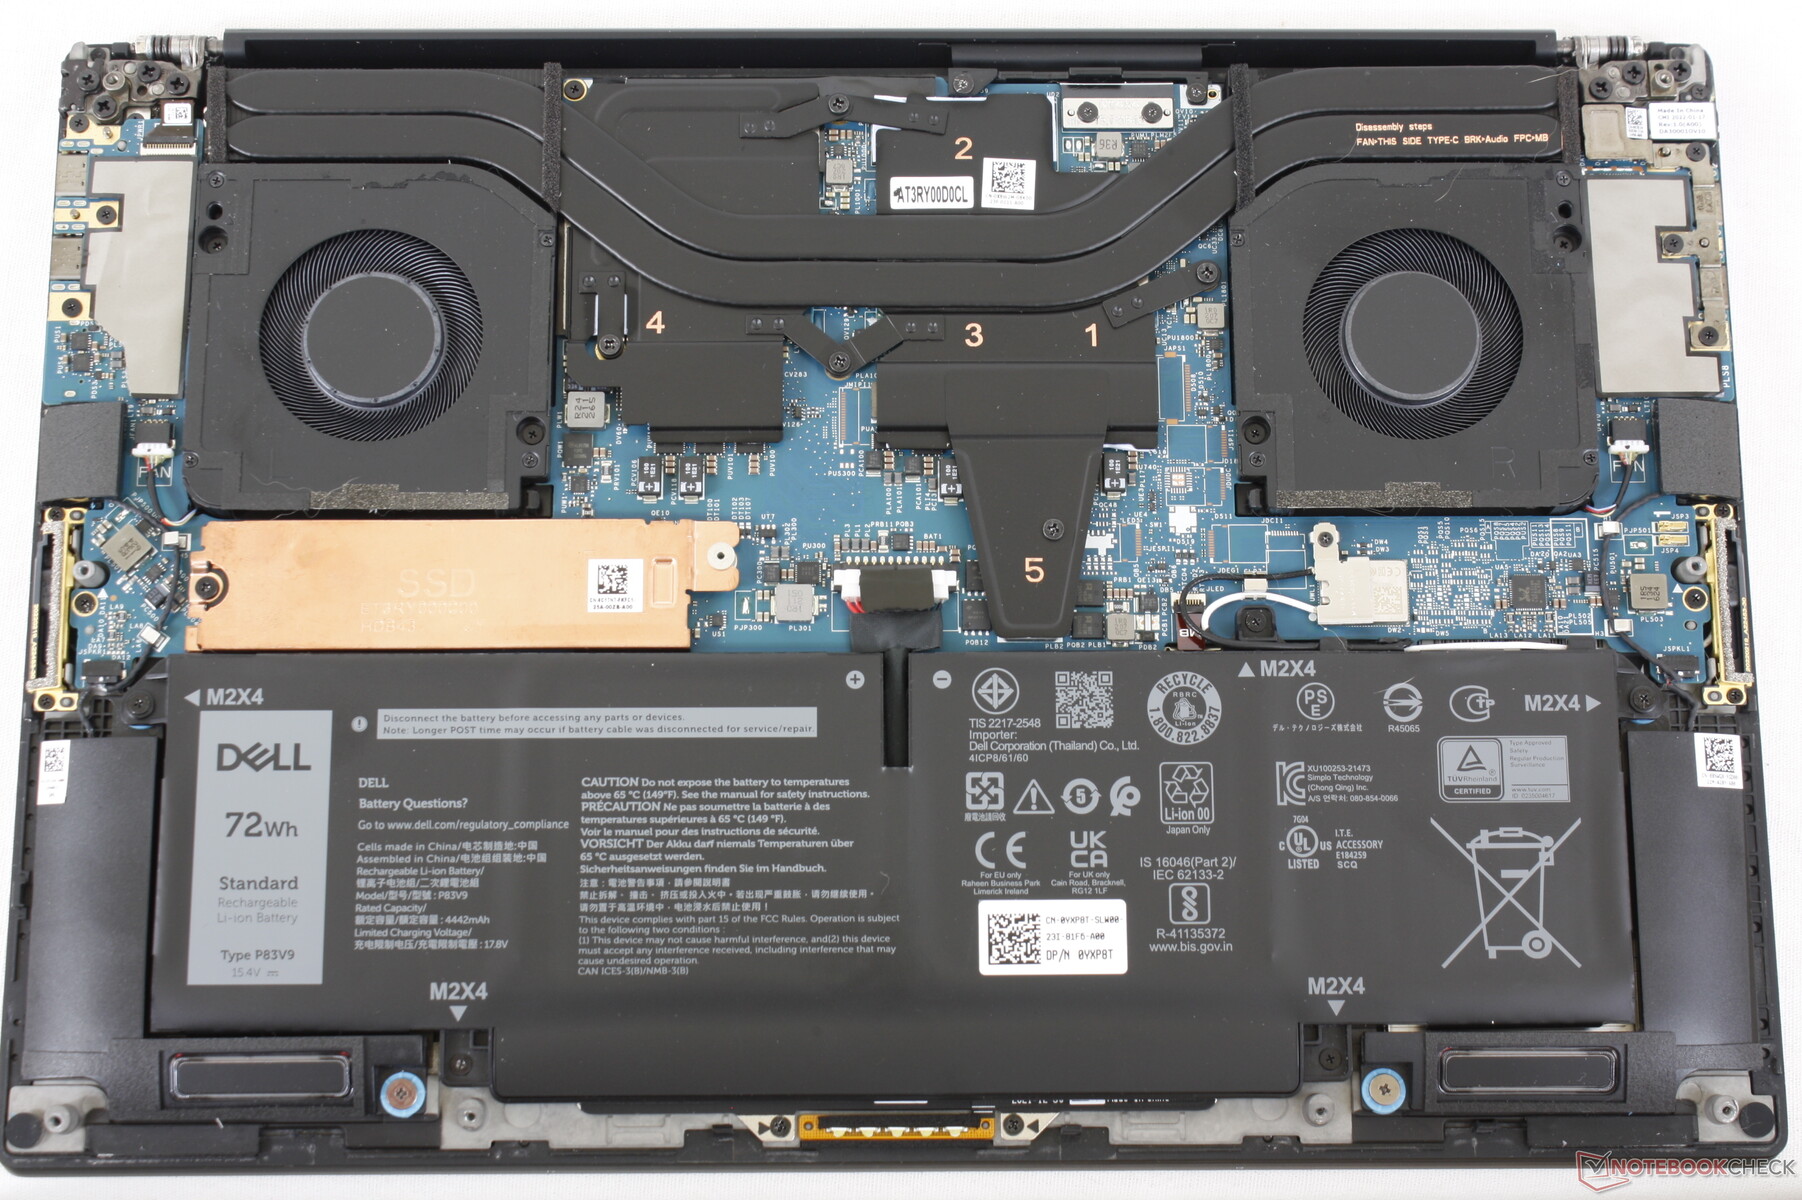
Underhåll
Tillbehör och garanti
Förpackningen innehåller samma USB-C till HDMI och USB-A adapter som på förra årets modell, utöver pappersarbetet och 130 W USB-C AC-adaptern. Dell erbjuder också en mindre 100 W USB-C AC-adapter som bör räcka för konfigurationer utan diskret Nvidia-grafik.
En treårig garanti är standard om den köps från Dell i USA, i likhet med Precision 7000-serien.
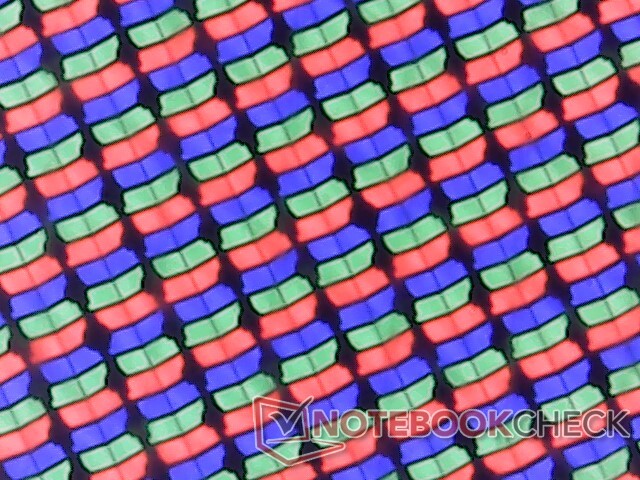
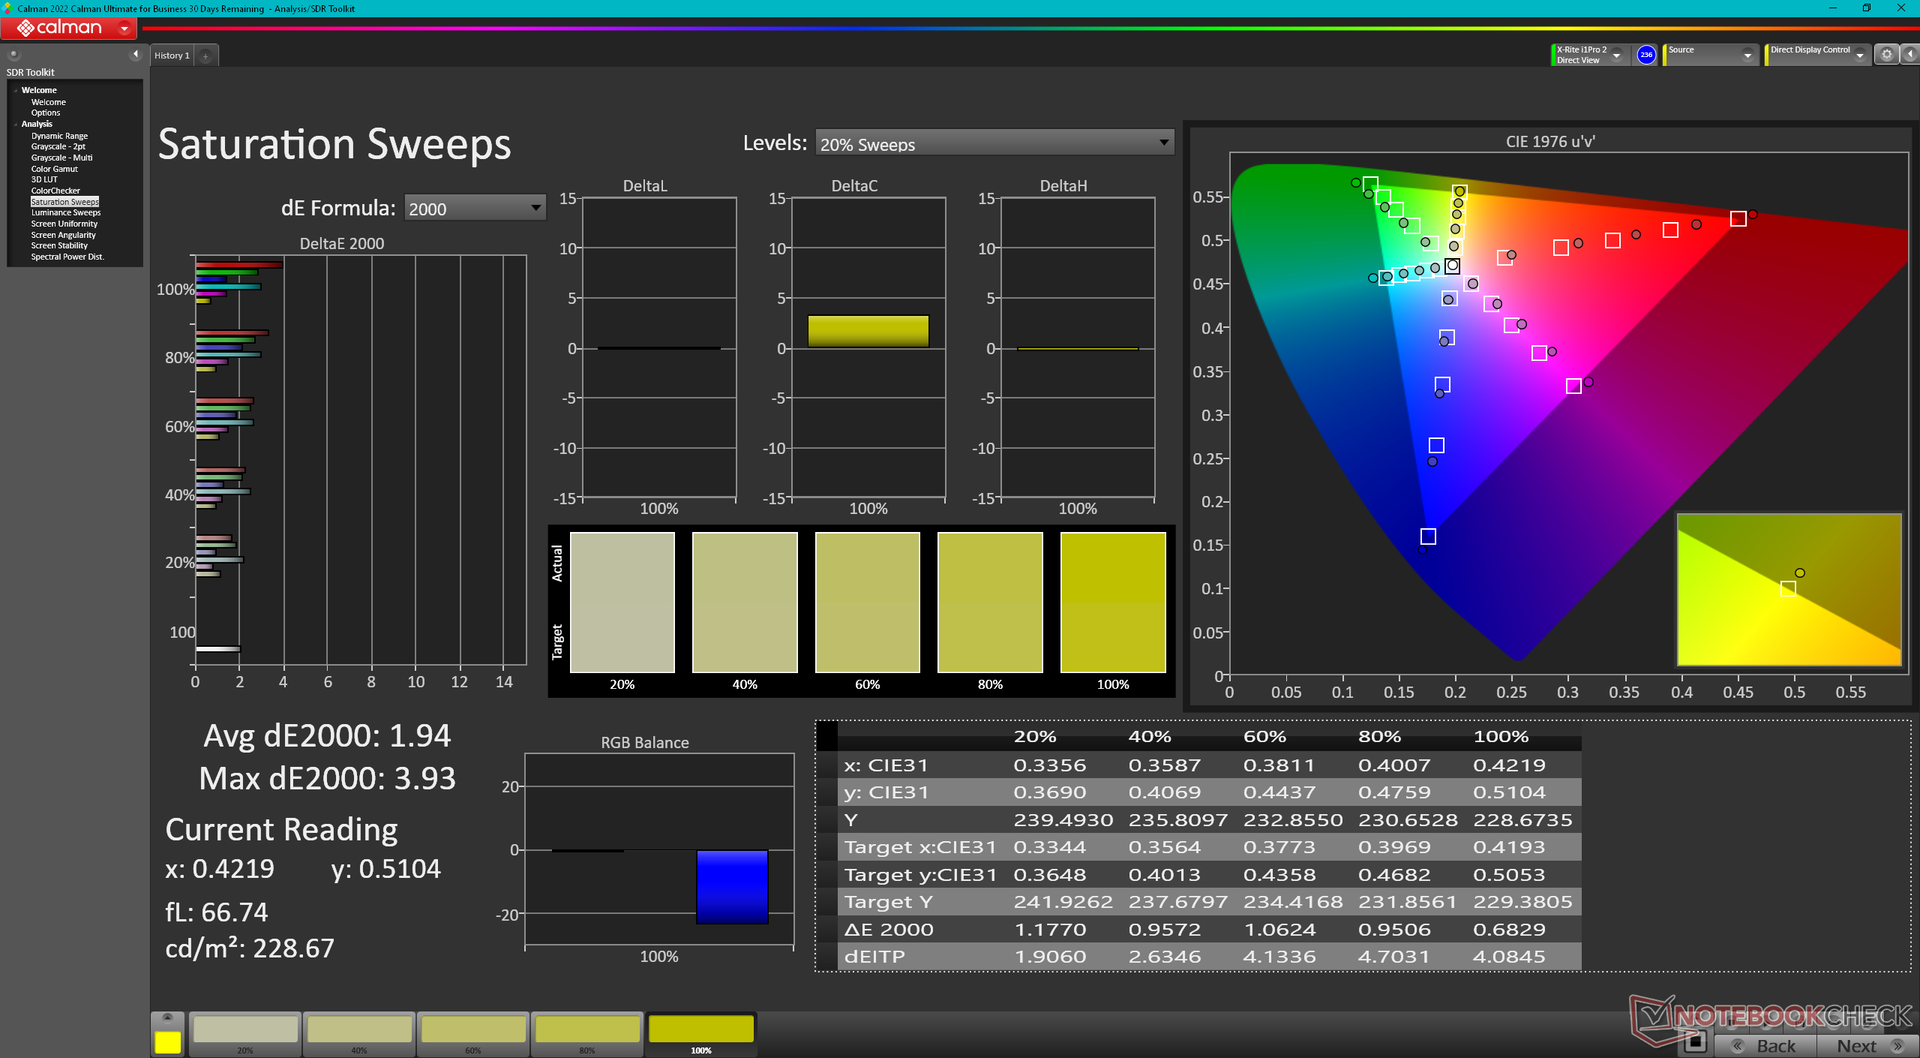
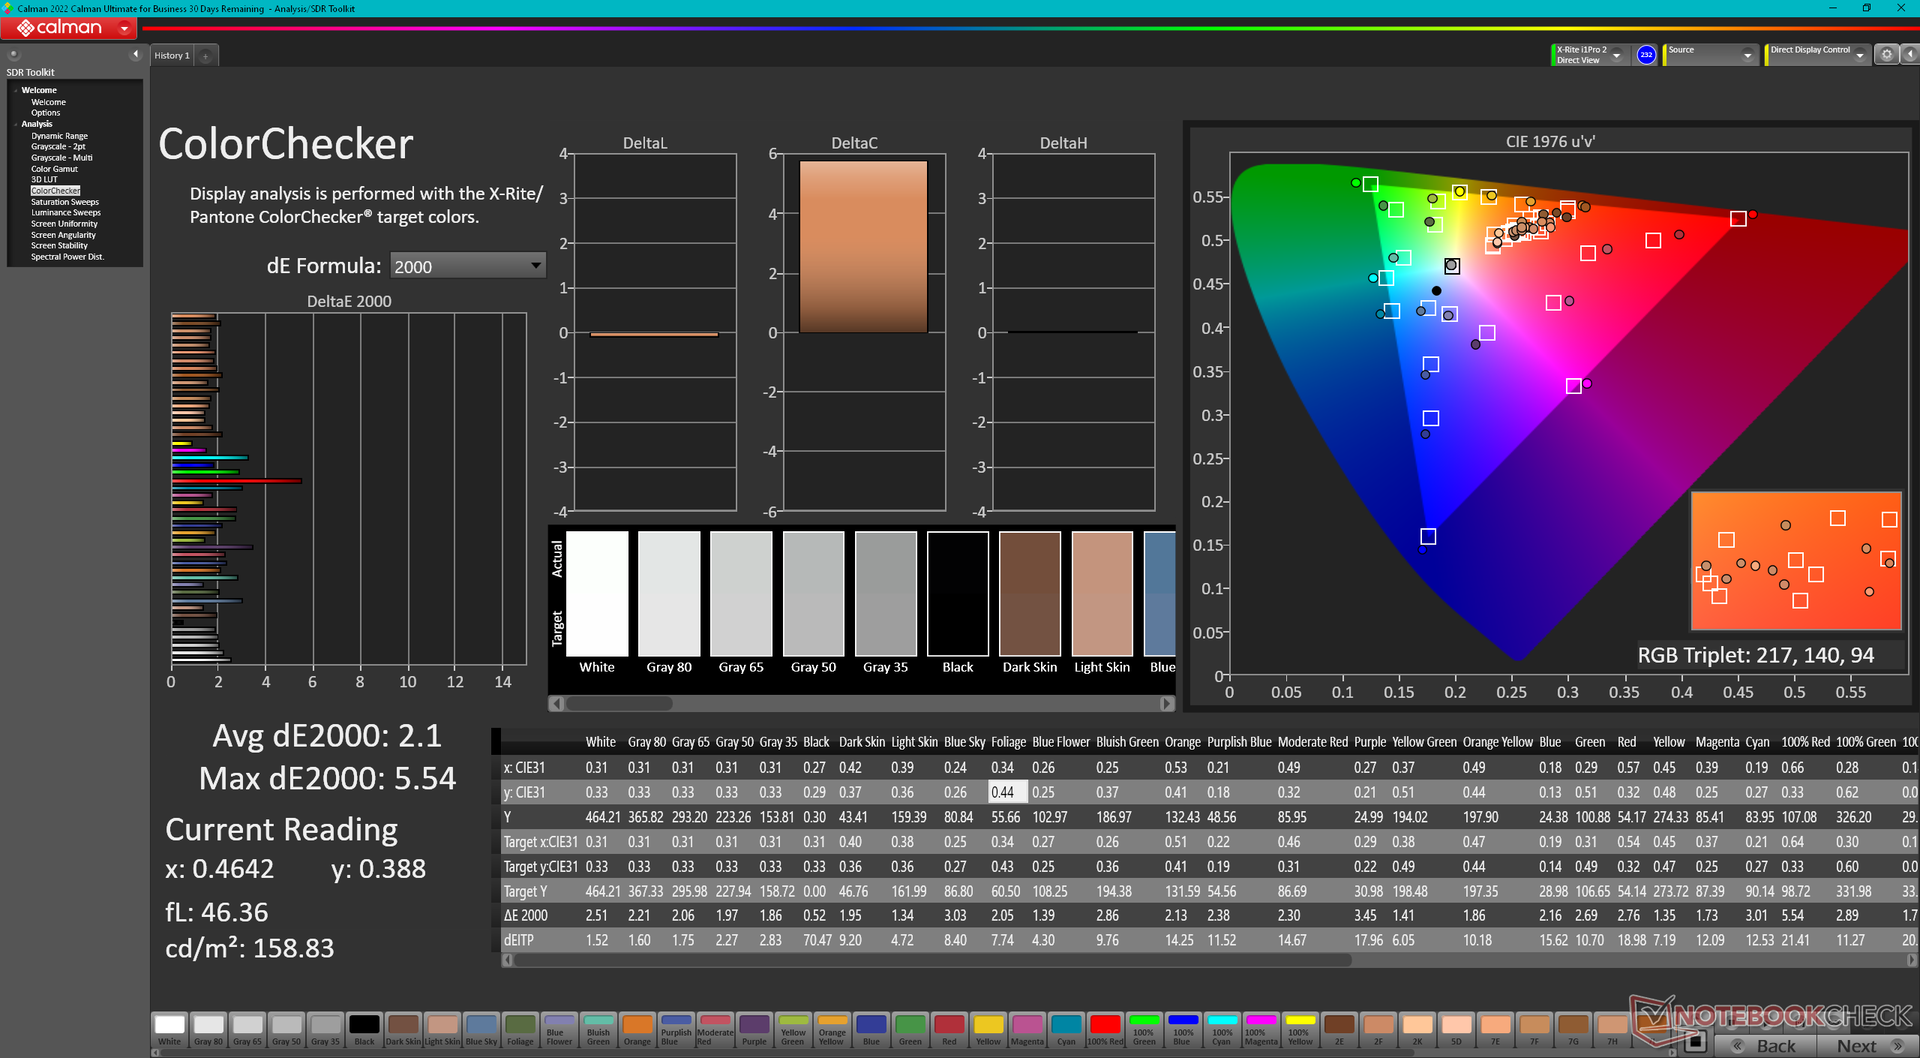
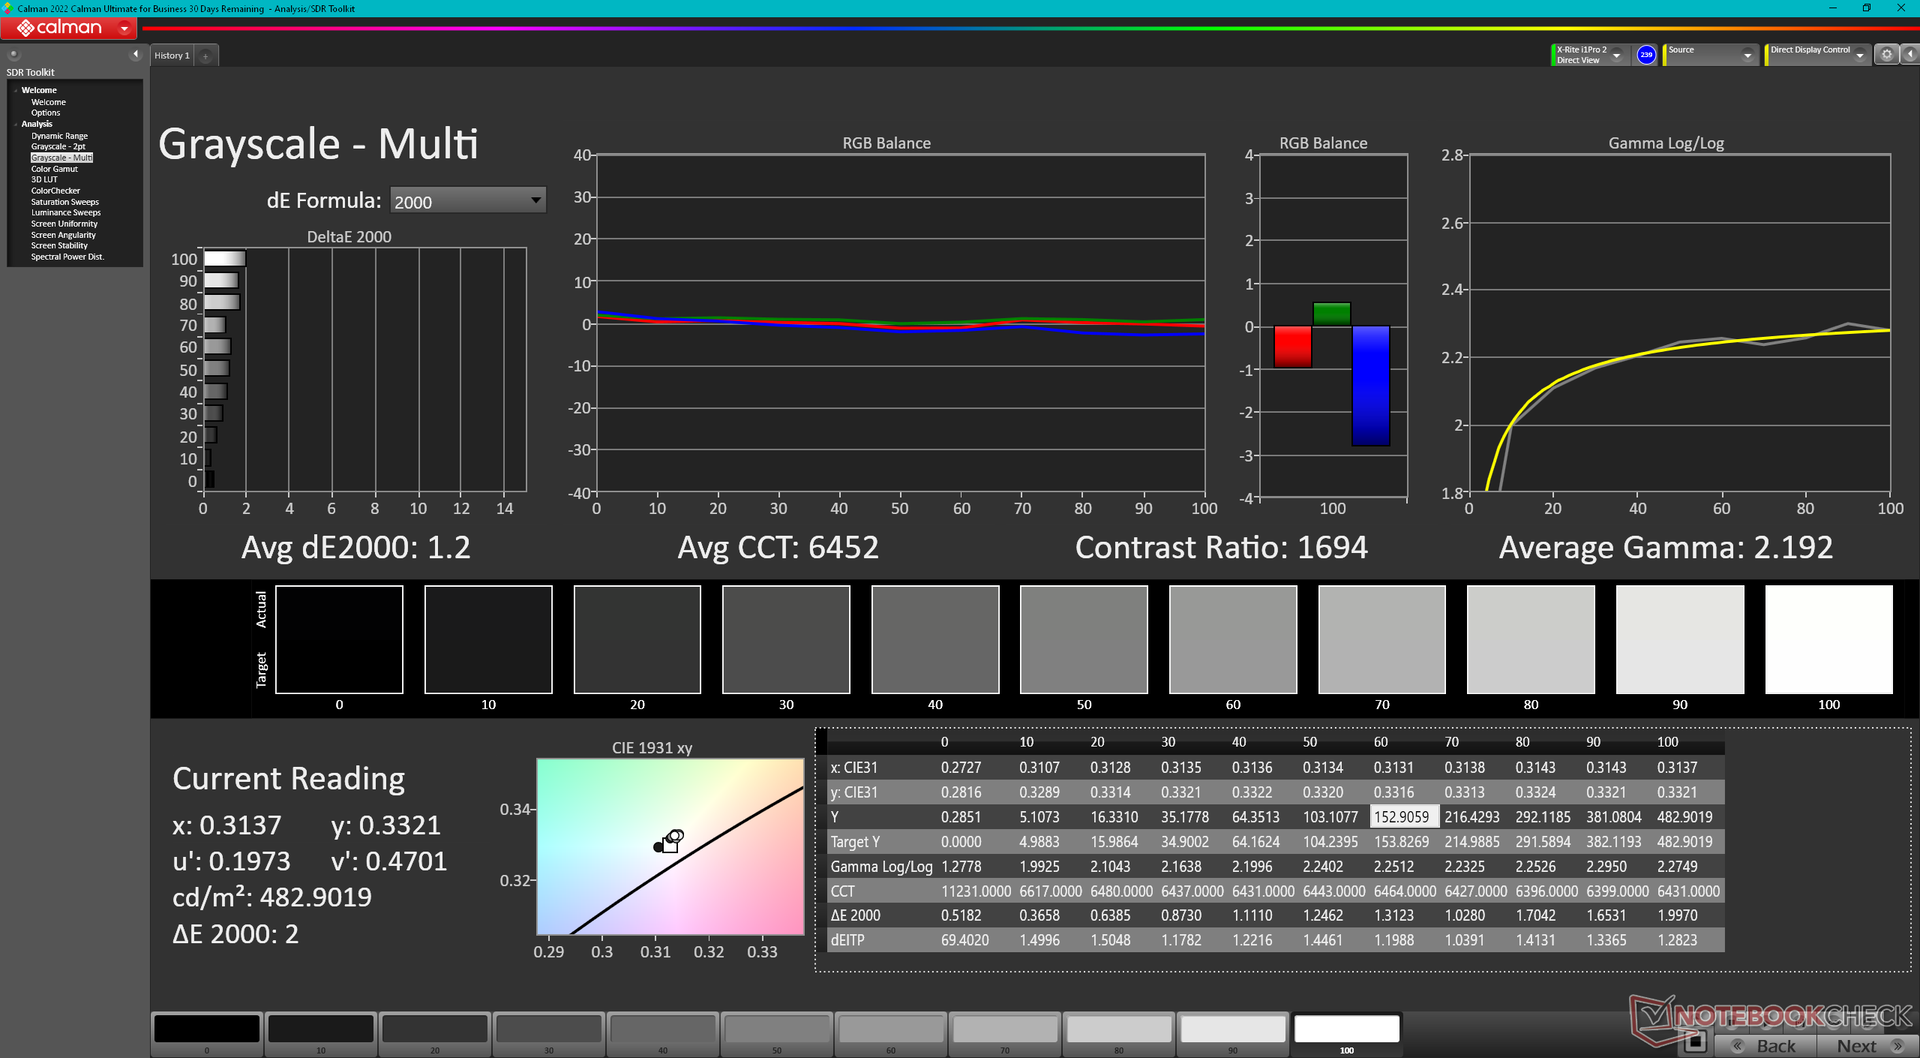
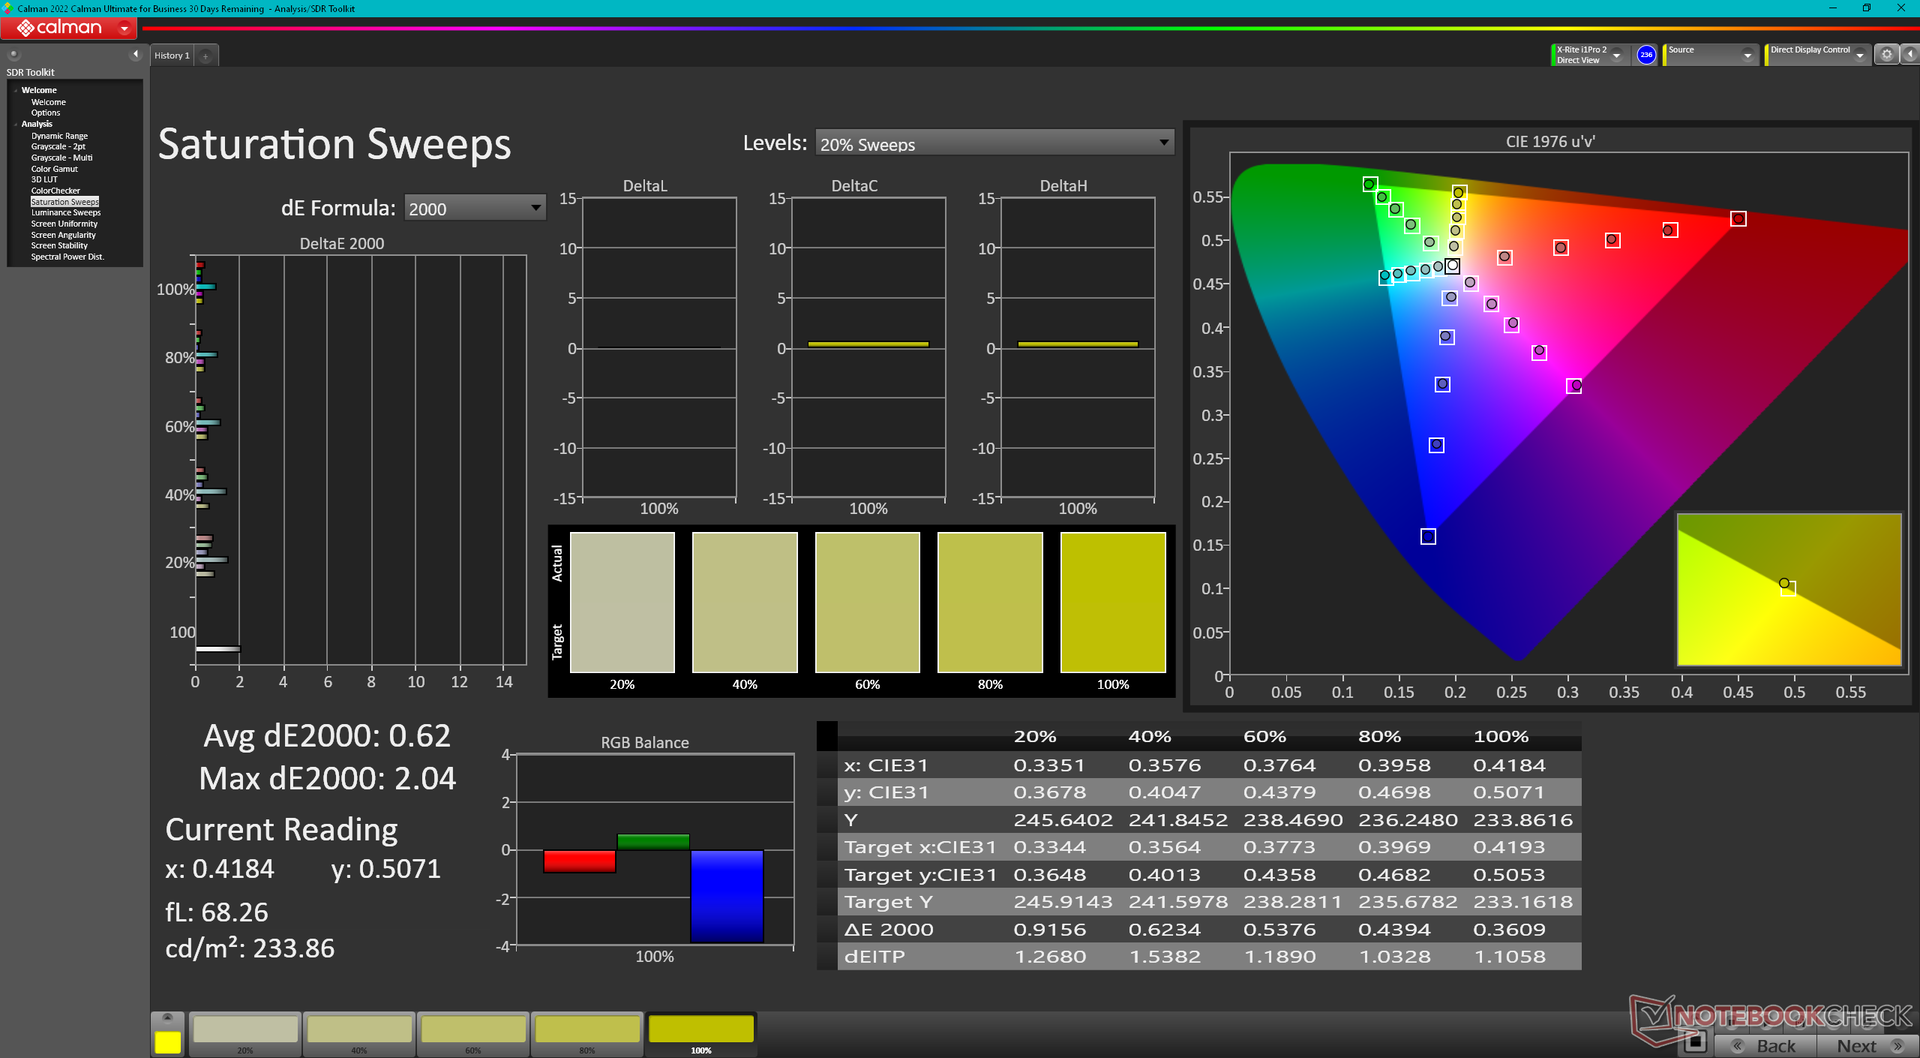
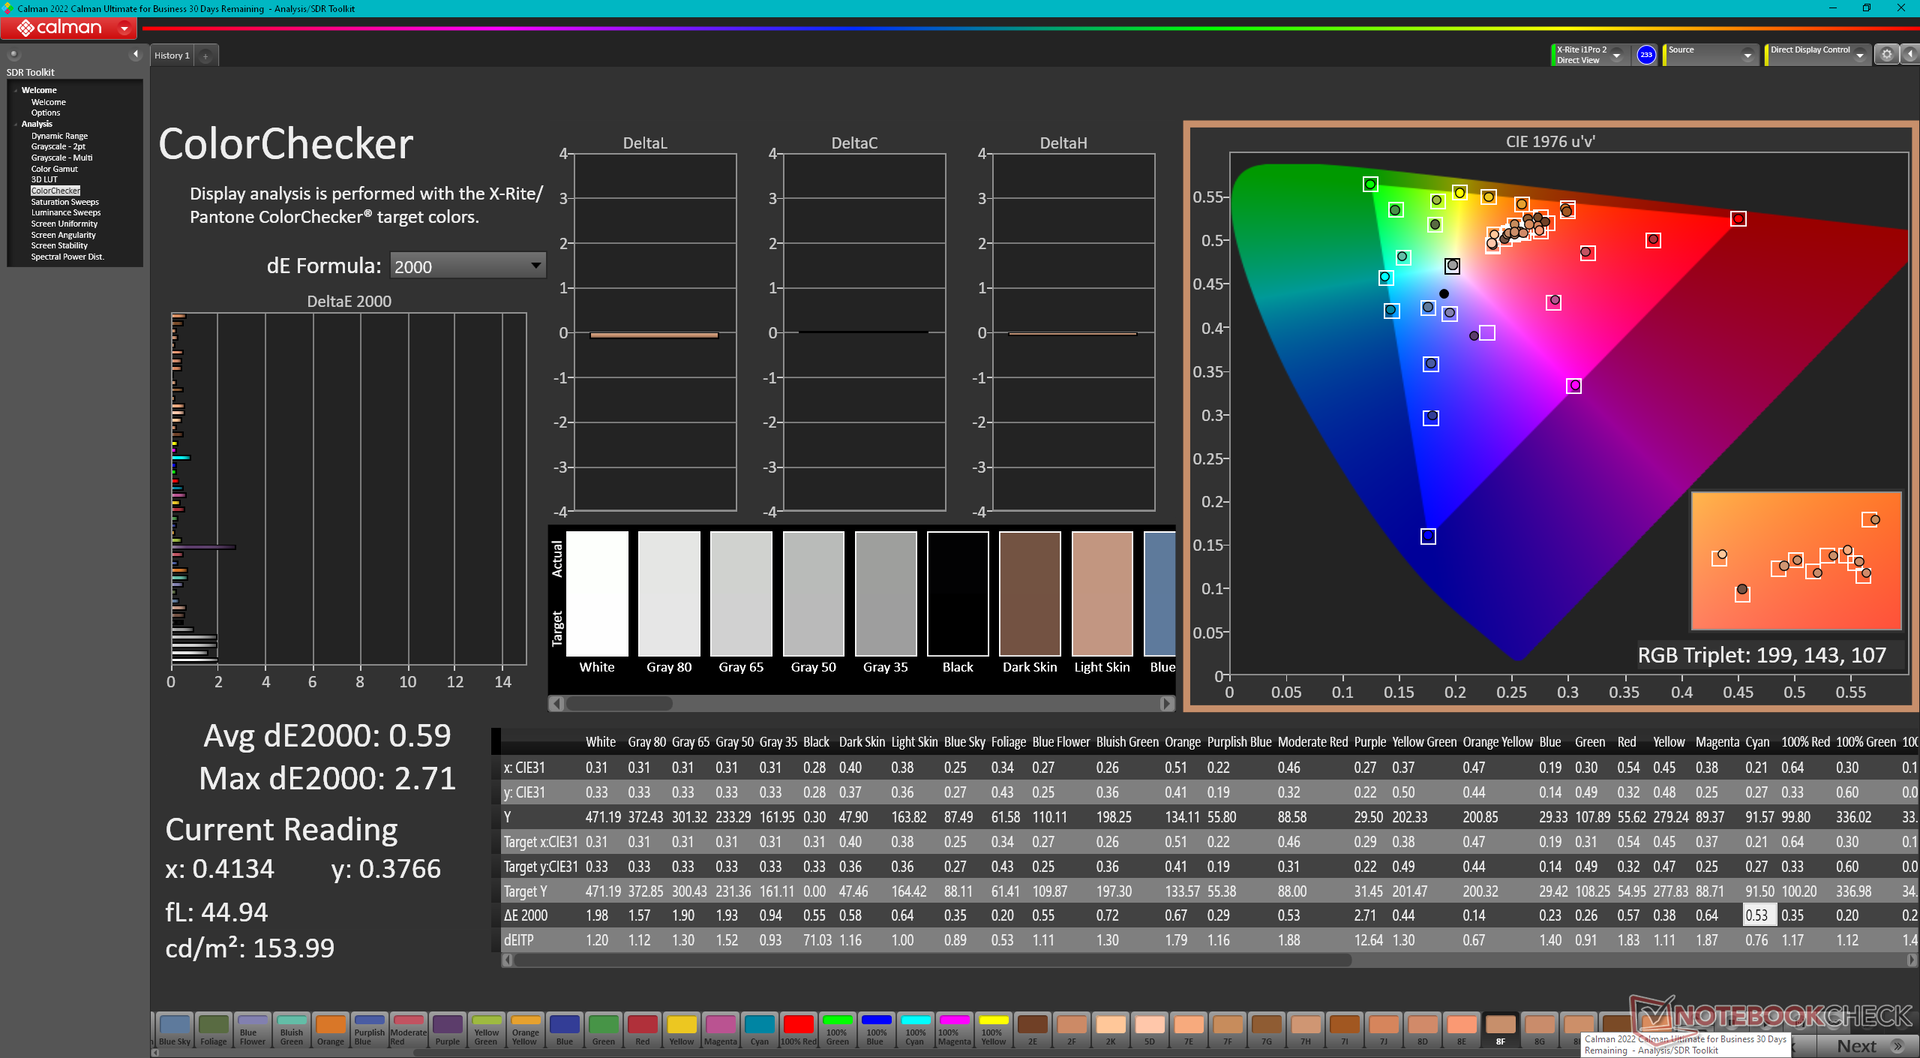
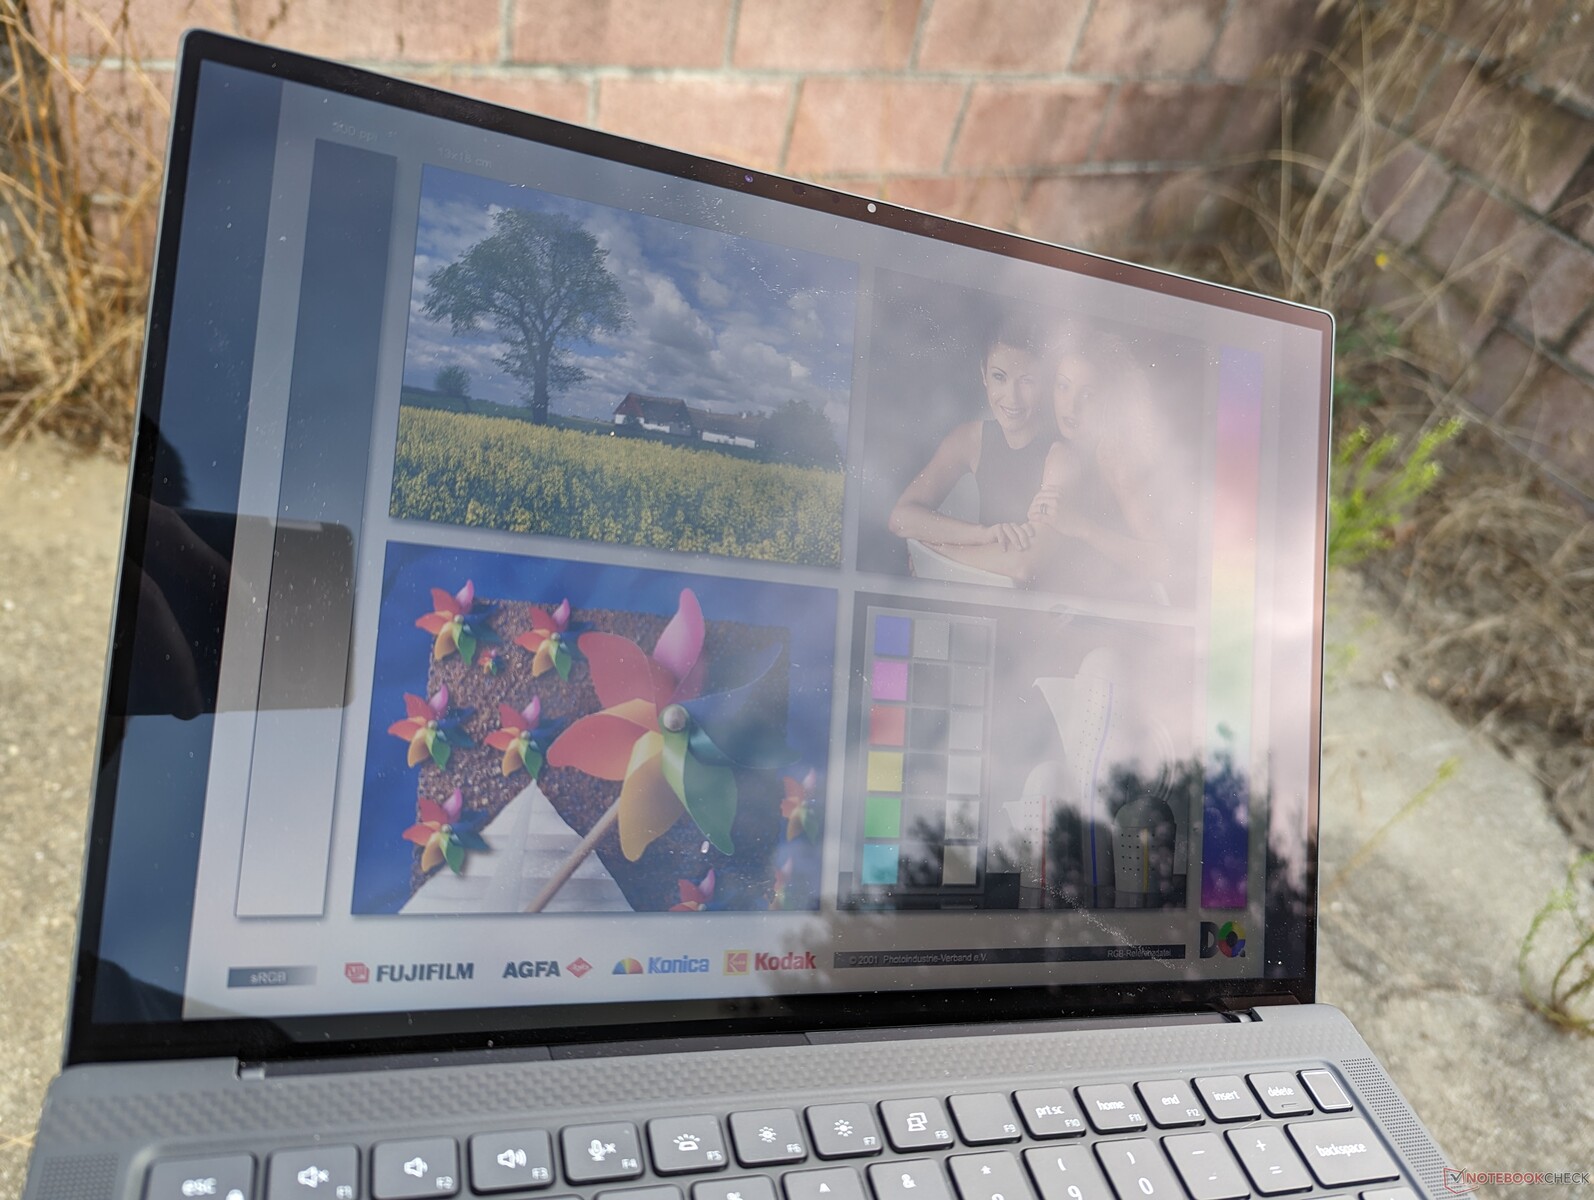
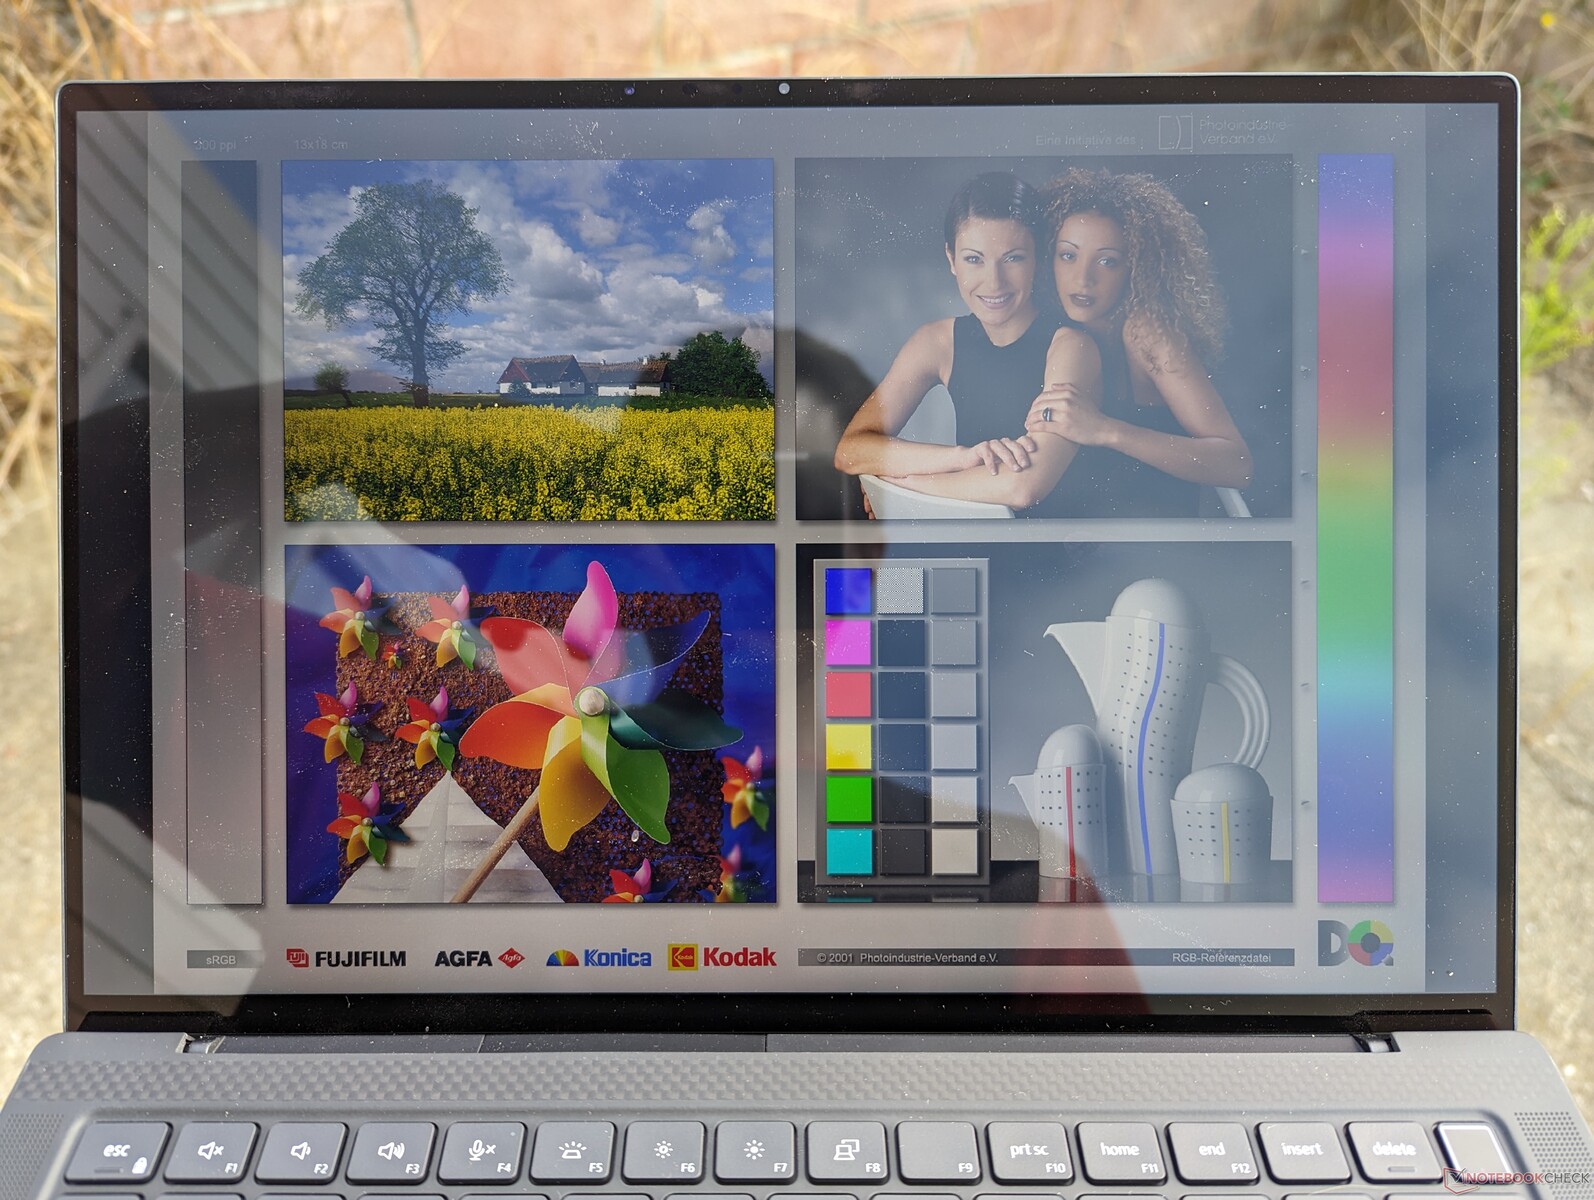
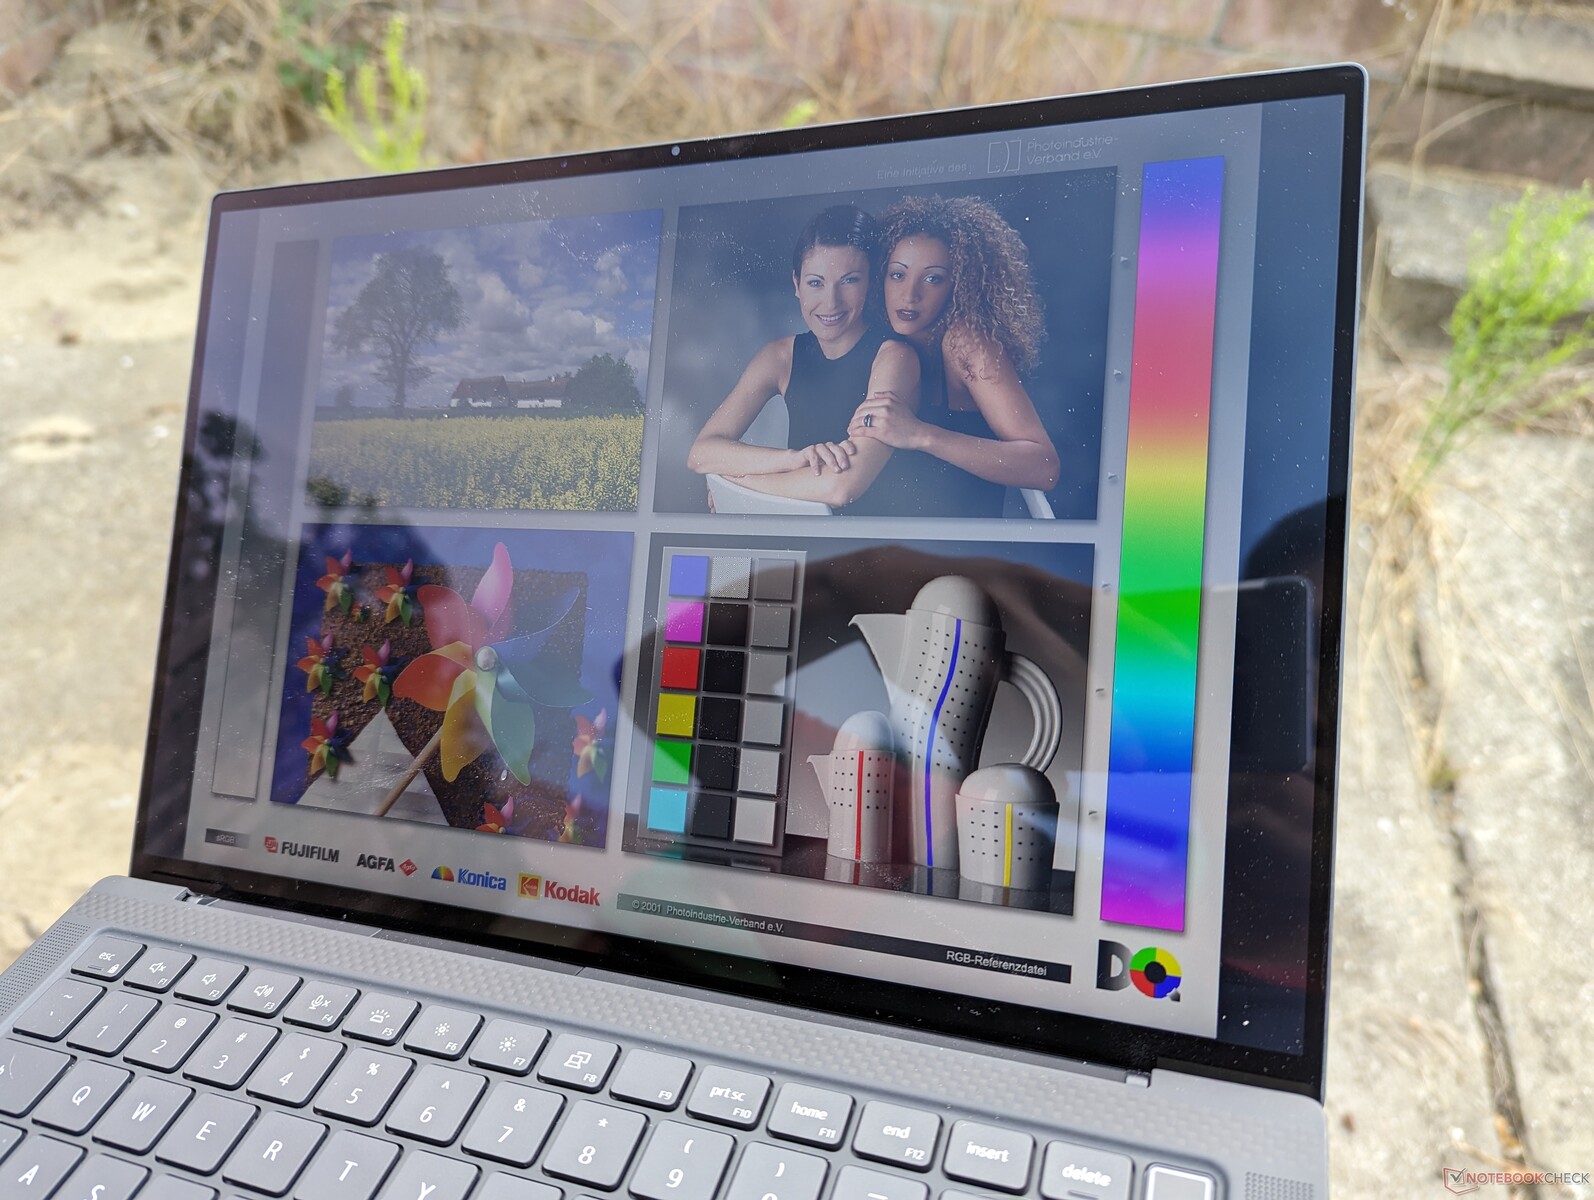
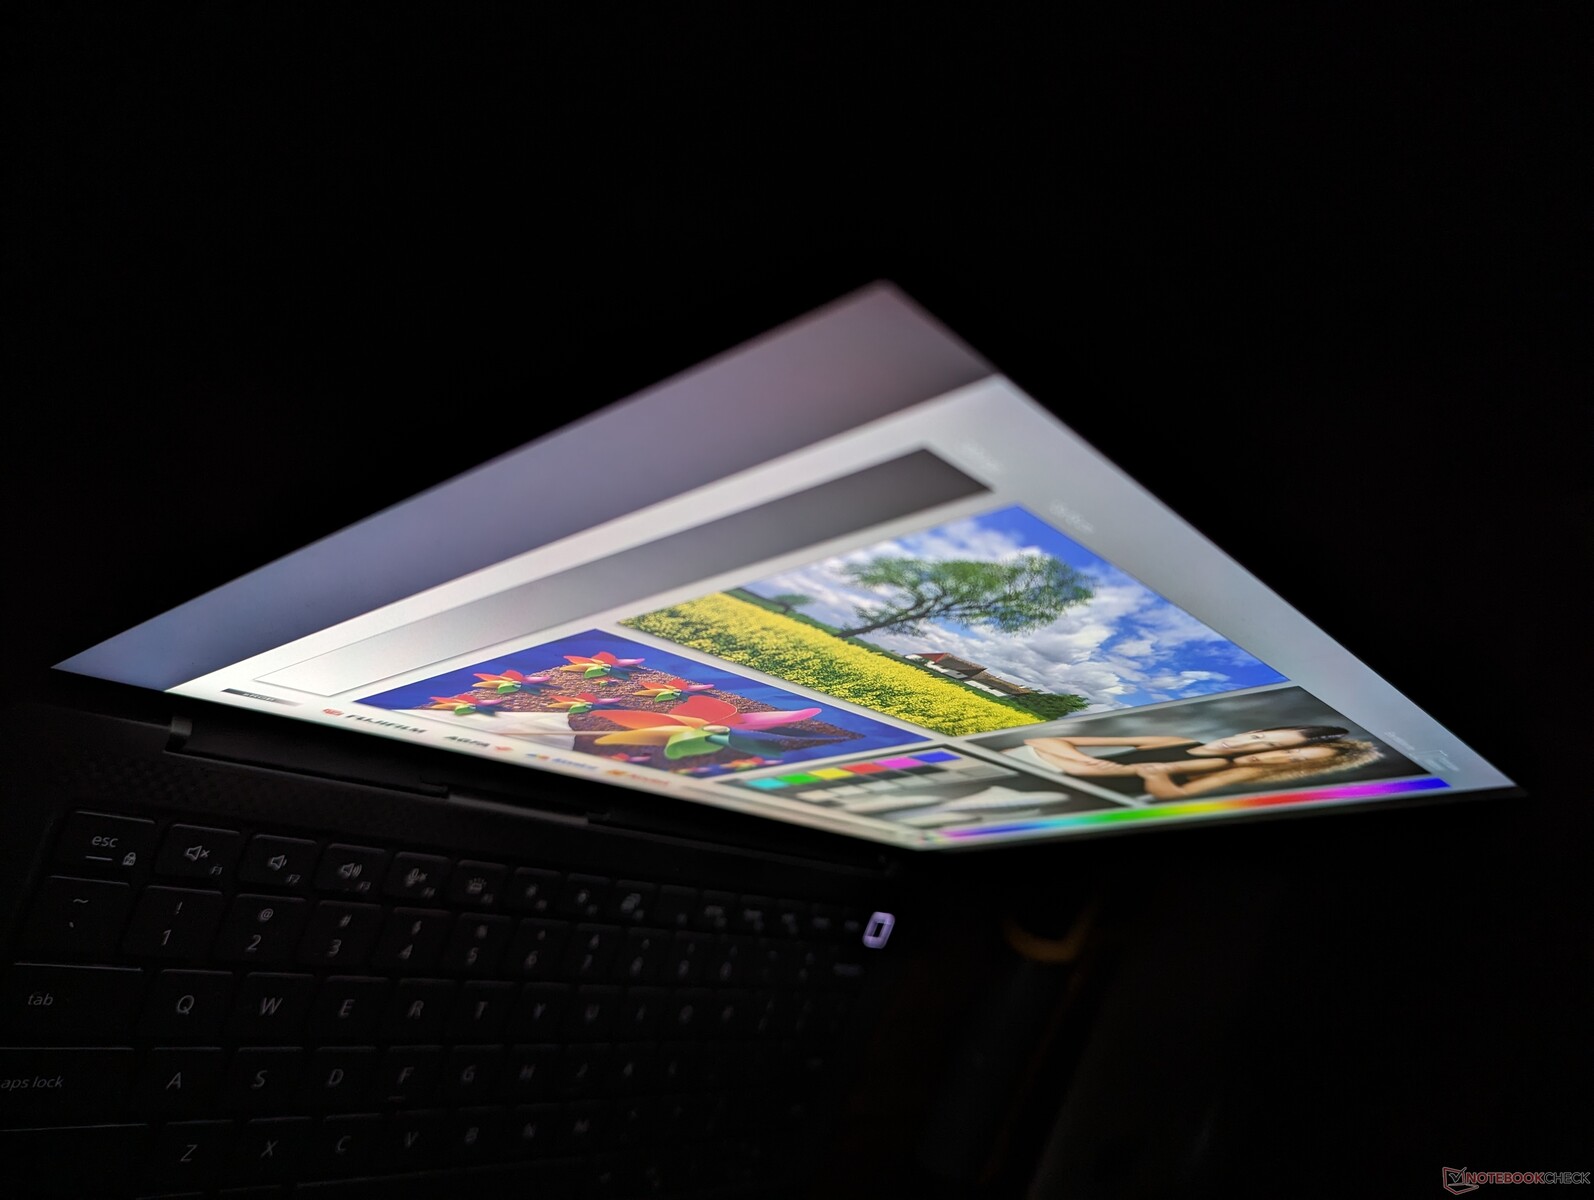
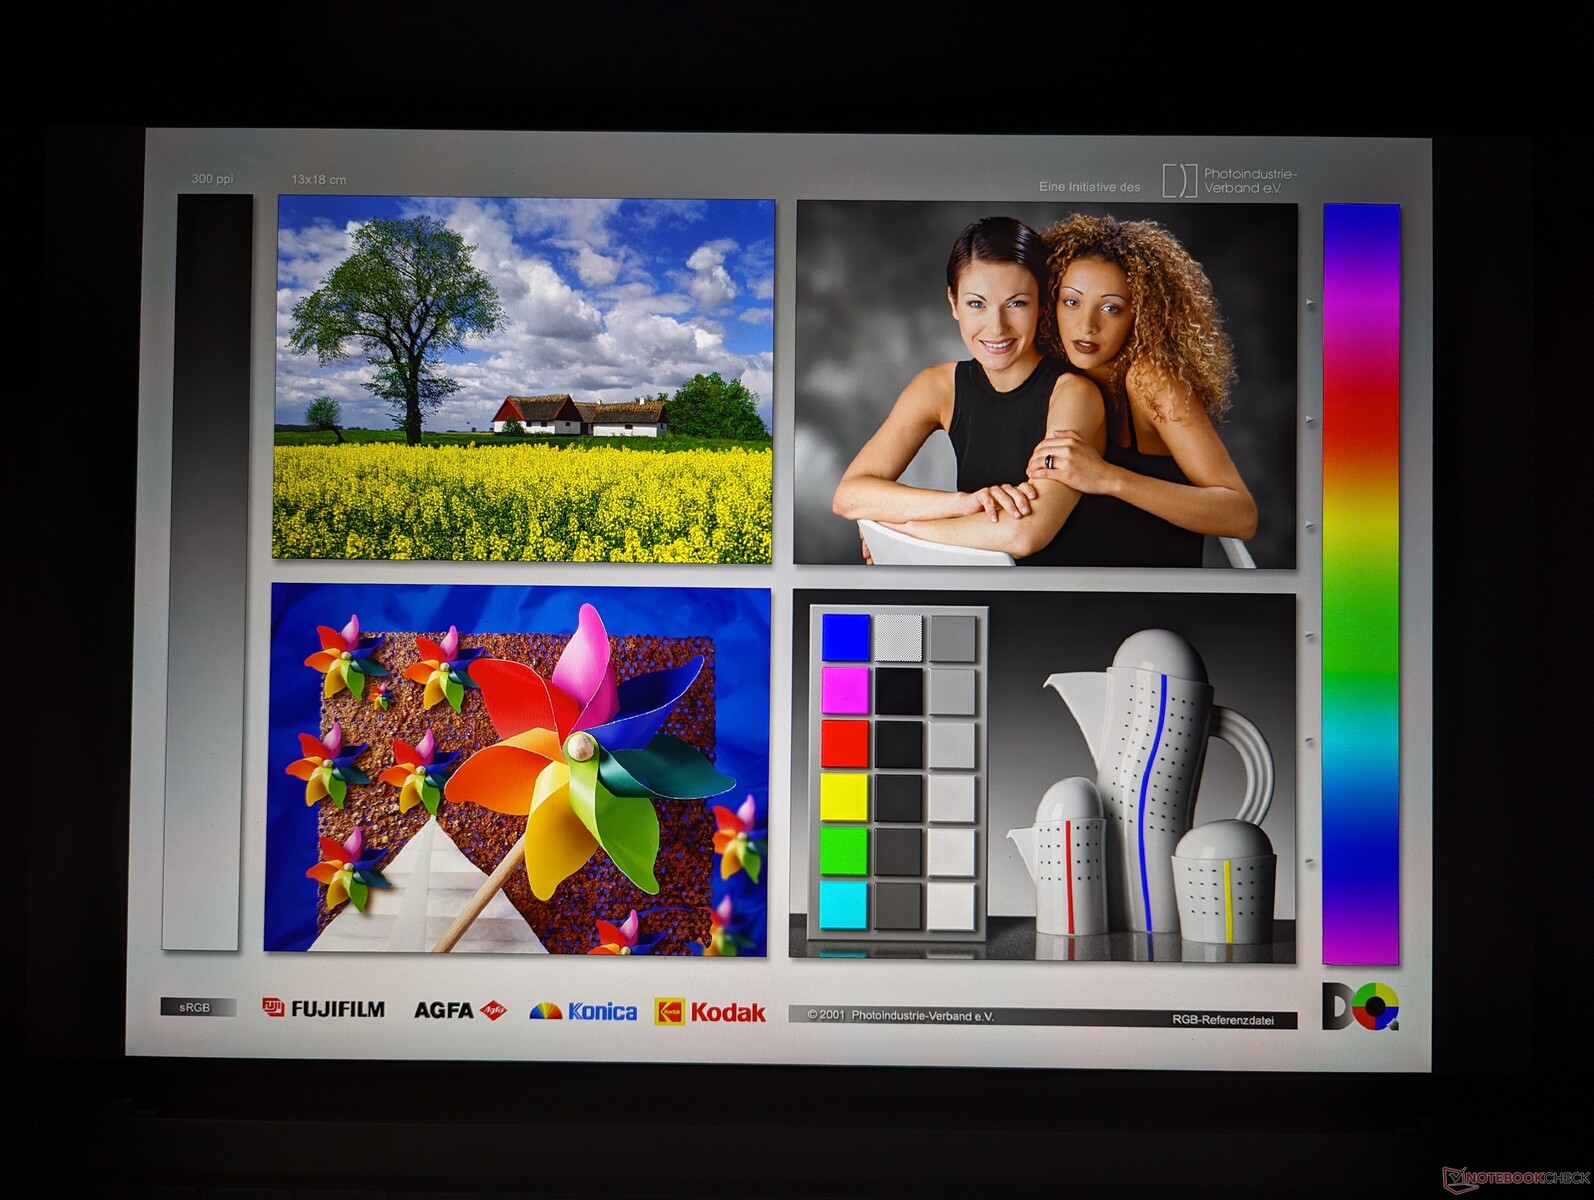
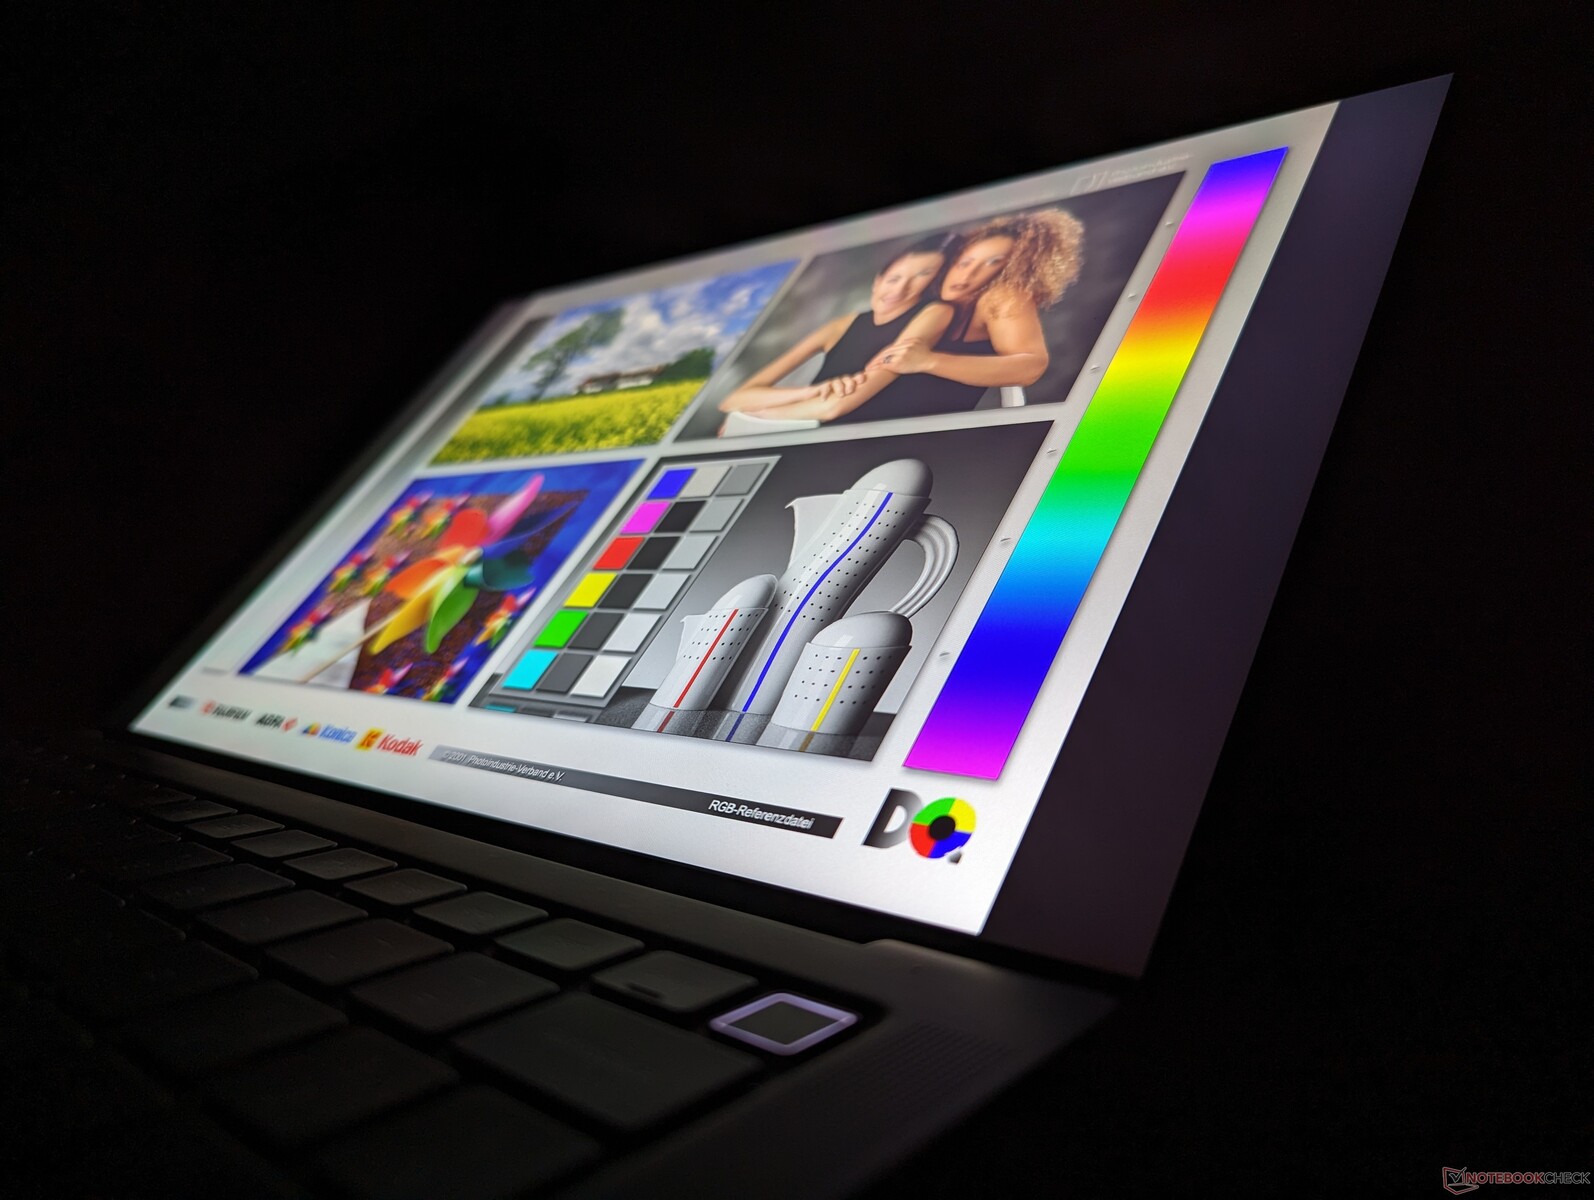
Display - QHD+ med fullständiga sRGB-färger
Vår testenhet levereras med samma AU Optronics B140QAN IPS-panel som fanns på förra årets modell. Dell erbjuder inte några nya panelalternativ för årets uppdatering, vilket innebär att fullständiga DCi-P3-färger eller OLED fortfarande är utom räckhåll.
| |||||||||||||||||||||||||
Distribution av ljusstyrkan: 87 %
Mitt på batteriet: 472.8 cd/m²
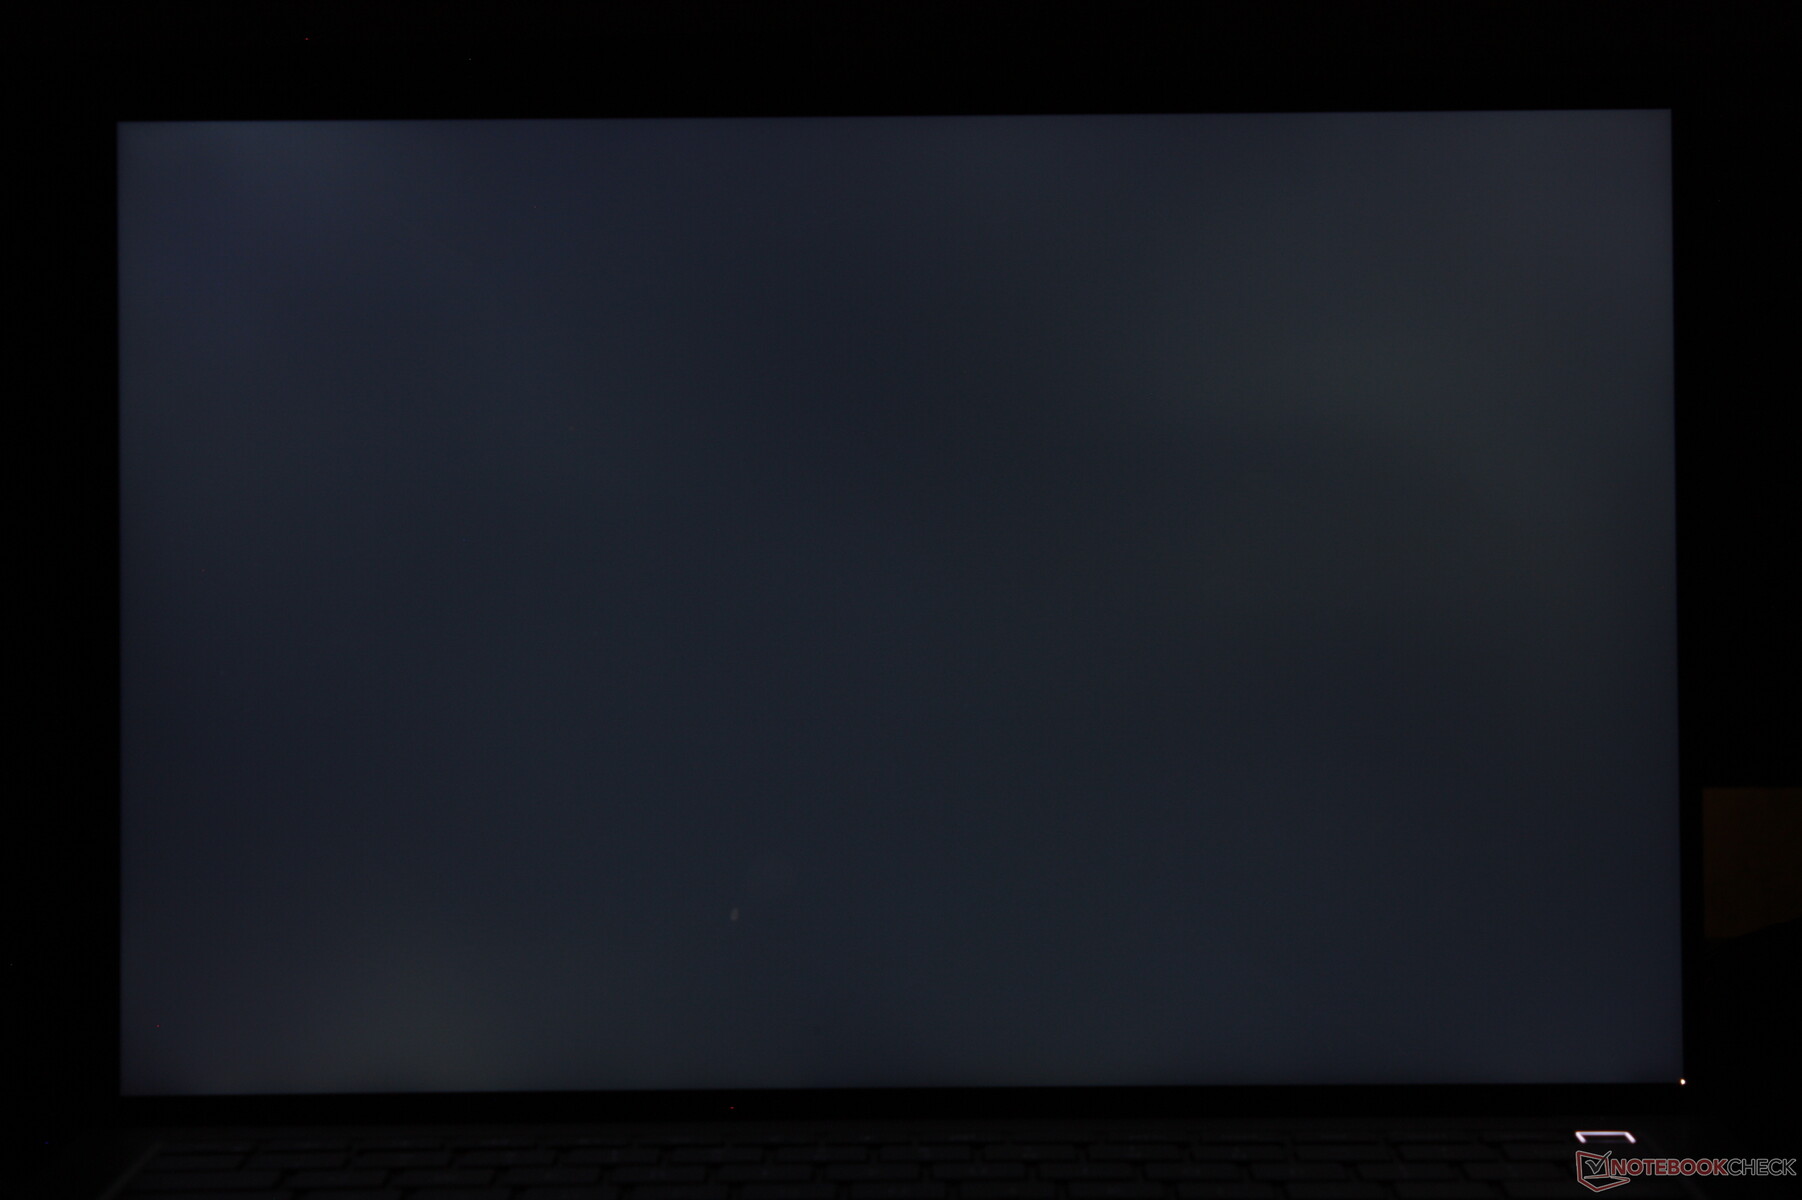
Kontrast: 1351:1 (Svärta: 0.35 cd/m²)
ΔE ColorChecker Calman: 2.1 | ∀{0.5-29.43 Ø4.71}
calibrated: 0.59
ΔE Greyscale Calman: 1.7 | ∀{0.09-98 Ø4.96}
78% AdobeRGB 1998 (Argyll 3D)
99.8% sRGB (Argyll 3D)
77.6% Display P3 (Argyll 3D)
Gamma: 2.26
CCT: 6493 K
| Dell Precision 5480 AU Optronics B140QAN, IPS, 2560x1600, 14" | Dell Precision 5000 5470 AU Optronics B140QAN, IPS, 2560x1600, 14" | Dell Precision 5000 5560 Sharp LQ156R1, IPS, 3840x2400, 15.6" | Lenovo ThinkPad P14s G3 AMD 21J6S05000 LP140WU1-SPB2, IPS LED, 1920x1200, 14" | Lenovo ThinkPad P15v G3 21EM001AGE NE156QUM-N6C, IPS LED, 3840x2160, 15.6" | HP ZBook Firefly 14 G9-6B8A2EA CMN1435, IPS, 1920x1200, 14" | |
|---|---|---|---|---|---|---|
| Display | 1% | 17% | -11% | 15% | -6% | |
| Display P3 Coverage (%) | 77.6 | 79.3 2% | 94.9 22% | 65.9 -15% | 89.9 16% | 69.6 -10% |
| sRGB Coverage (%) | 99.8 | 100 0% | 100 0% | 94.3 -6% | 100 0% | 99.9 0% |
| AdobeRGB 1998 Coverage (%) | 78 | 78.7 1% | 100 28% | 68.2 -13% | 99.9 28% | 71.1 -9% |
| Response Times | -24% | -14% | 13% | -7% | -16% | |
| Response Time Grey 50% / Grey 80% * (ms) | 43.9 ? | 52.4 ? -19% | 47.2 ? -8% | 33.5 ? 24% | 46.7 ? -6% | 56.3 ? -28% |
| Response Time Black / White * (ms) | 25.3 ? | 32.4 ? -28% | 30.4 ? -20% | 24.9 ? 2% | 27.3 ? -8% | 26.2 ? -4% |
| PWM Frequency (Hz) | ||||||
| Screen | -8% | -35% | -13% | -55% | -26% | |
| Brightness middle (cd/m²) | 472.8 | 537 14% | 501.5 6% | 448 -5% | 588 24% | 432 -9% |
| Brightness (cd/m²) | 469 | 518 10% | 467 0% | 422 -10% | 536 14% | 407 -13% |
| Brightness Distribution (%) | 87 | 94 8% | 83 -5% | 85 -2% | 83 -5% | 91 5% |
| Black Level * (cd/m²) | 0.35 | 0.33 6% | 0.44 -26% | 0.23 34% | 0.38 -9% | 0.28 20% |
| Contrast (:1) | 1351 | 1627 20% | 1140 -16% | 1948 44% | 1547 15% | 1543 14% |
| Colorchecker dE 2000 * | 2.1 | 2.97 -41% | 4.73 -125% | 2.5 -19% | 3.9 -86% | 3.1 -48% |
| Colorchecker dE 2000 max. * | 5.54 | 5.33 4% | 8.45 -53% | 3.7 33% | 8.8 -59% | 5.6 -1% |
| Colorchecker dE 2000 calibrated * | 0.59 | 0.88 -49% | 0.51 14% | 1.3 -120% | 1 -69% | 0.8 -36% |
| Greyscale dE 2000 * | 1.7 | 2.4 -41% | 3.6 -112% | 2.9 -71% | 7.1 -318% | 4.5 -165% |
| Gamma | 2.26 97% | 2.06 107% | 2.08 106% | 2.03 108% | 2.12 104% | 2 110% |
| CCT | 6493 100% | 6668 97% | 6447 101% | 6840 95% | 7268 89% | 6528 100% |
| Totalt genomsnitt (program/inställningar) | -10% /
-8% | -11% /
-21% | -4% /
-9% | -16% /
-33% | -16% /
-20% |
* ... mindre är bättre
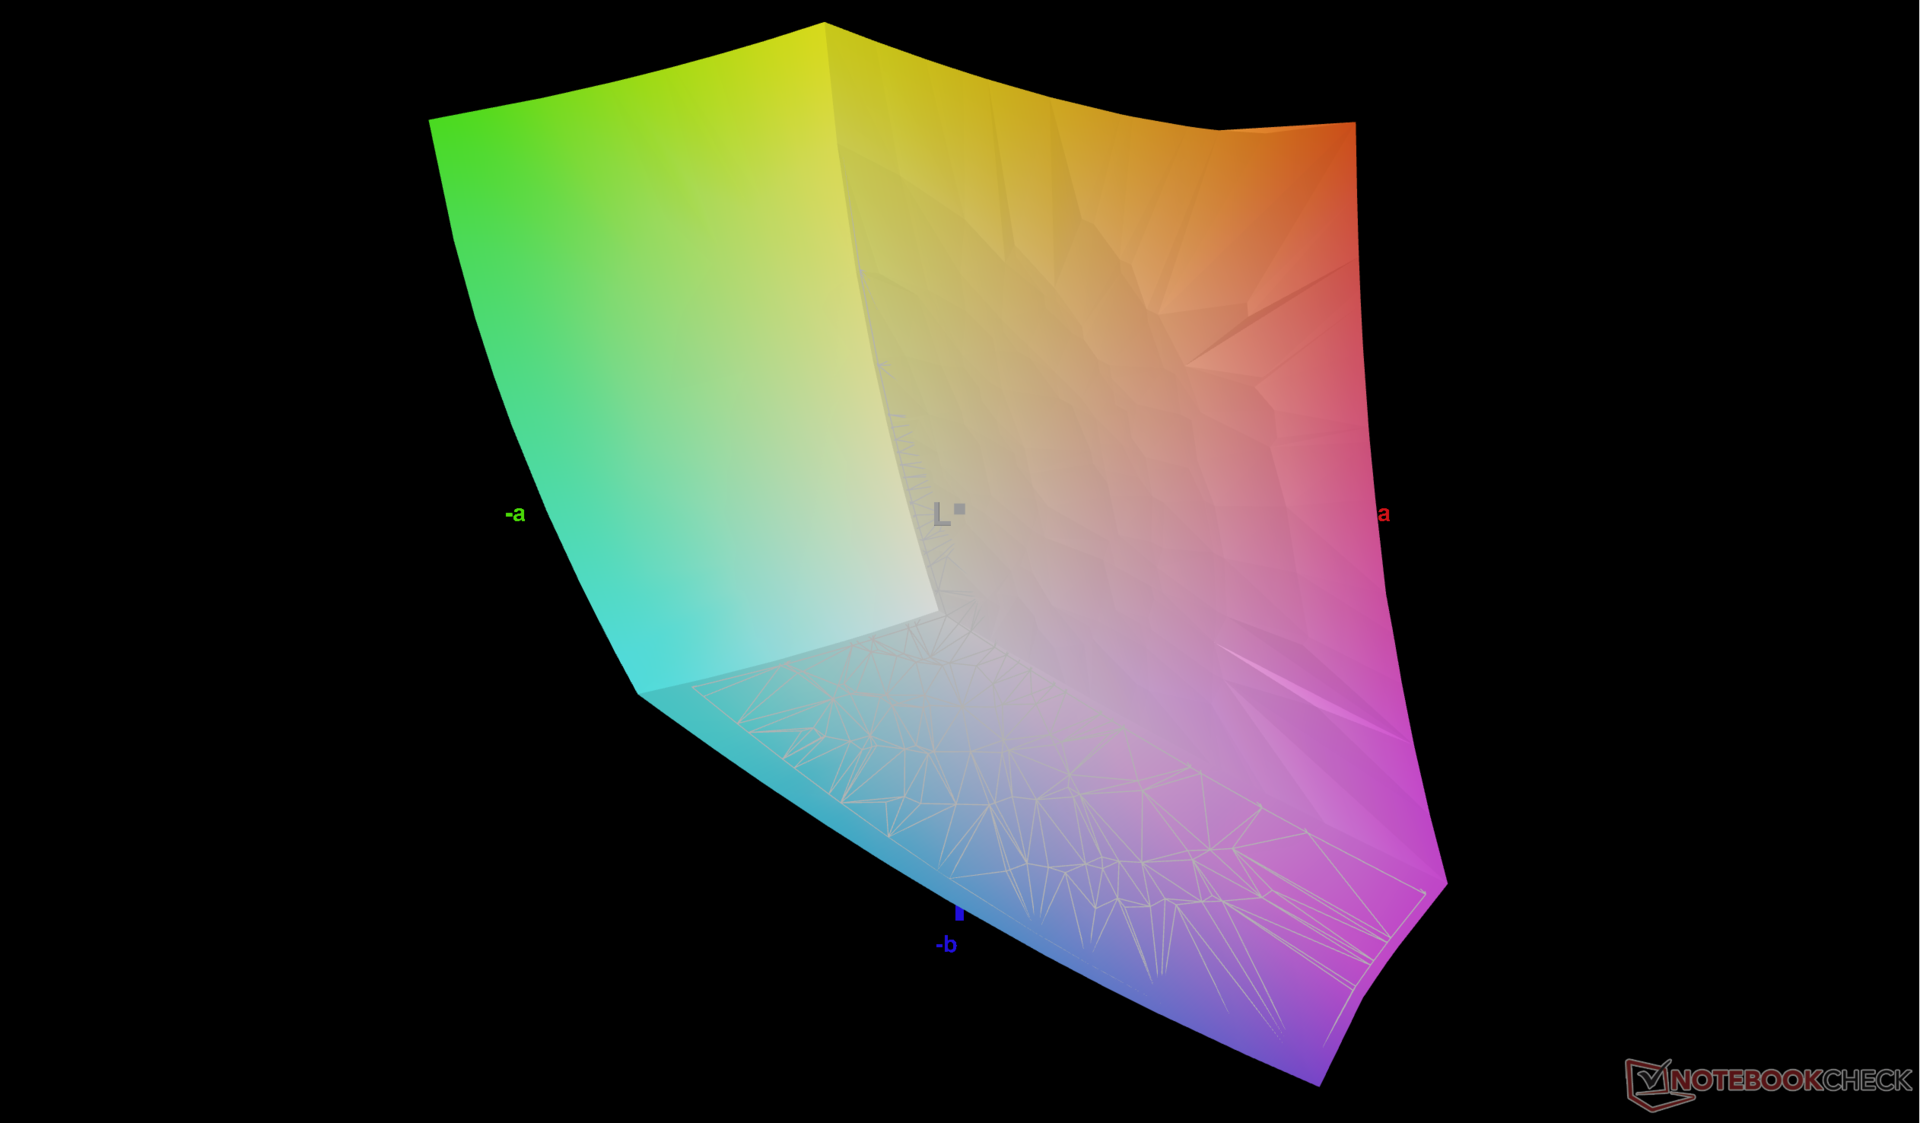
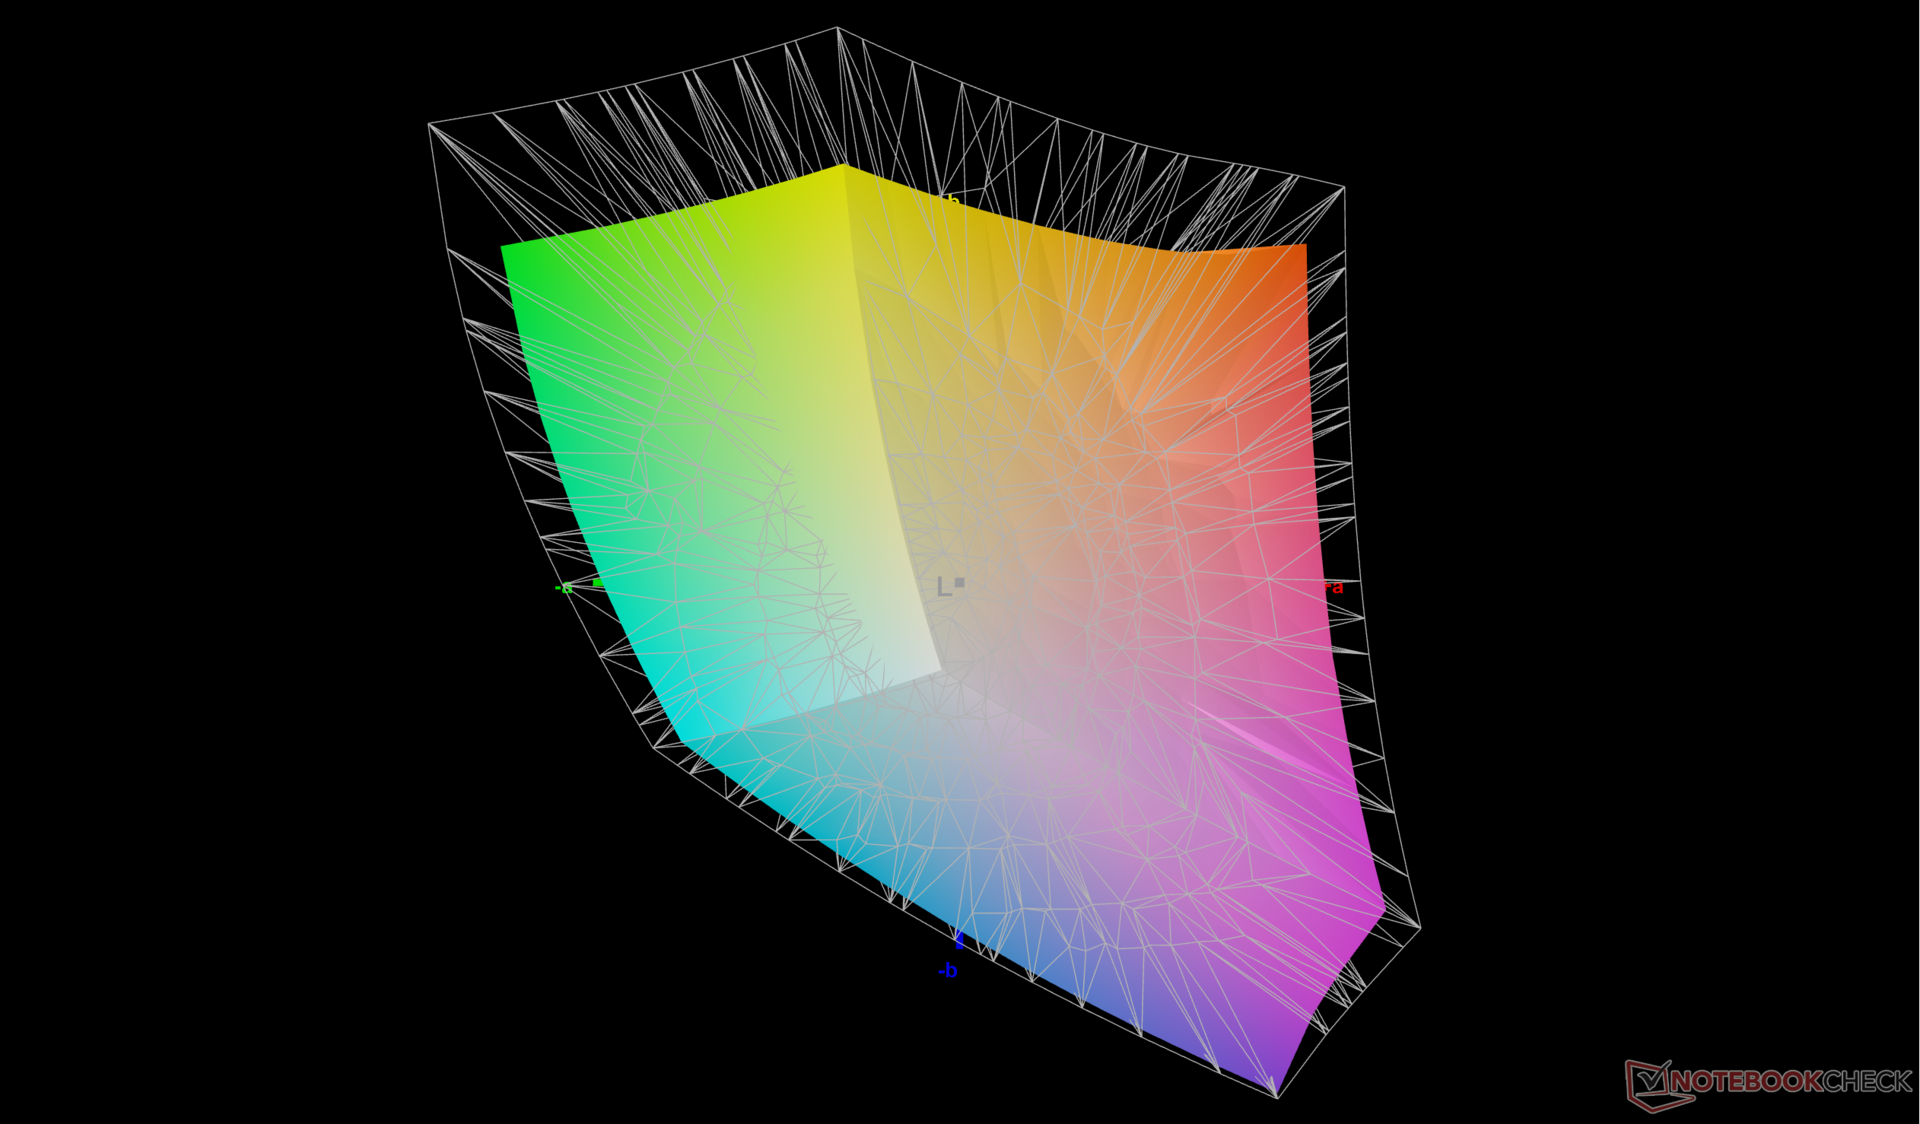
Skärmen är fortfarande välkalibrerad med genomsnittliga deltaE-värden för gråskala och färg på bara 1,7 respektive 2,1. En slutanvändarkalibrering är möjlig men inte nödvändig.

Visa svarstider
| ↔ Svarstid svart till vitt | ||
|---|---|---|
| 25.3 ms ... stiga ↗ och falla ↘ kombinerat | ↗ 12.6 ms stiga | 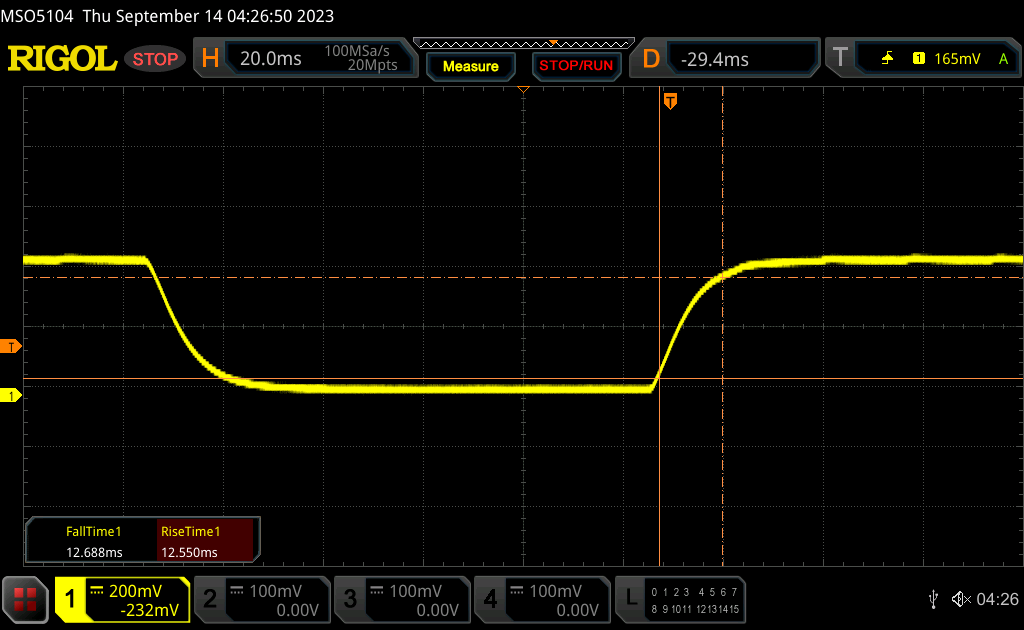 |
| ↘ 12.7 ms hösten | ||
| Skärmen visar relativt långsamma svarsfrekvenser i våra tester och kan vara för långsam för spelare. I jämförelse sträcker sig alla testade enheter från 0.1 (minst) till 240 (maximalt) ms. » 61 % av alla enheter är bättre. Detta innebär att den uppmätta svarstiden är sämre än genomsnittet av alla testade enheter (19.8 ms). | ||
| ↔ Svarstid 50 % grått till 80 % grått | ||
| 43.9 ms ... stiga ↗ och falla ↘ kombinerat | ↗ 19.2 ms stiga | 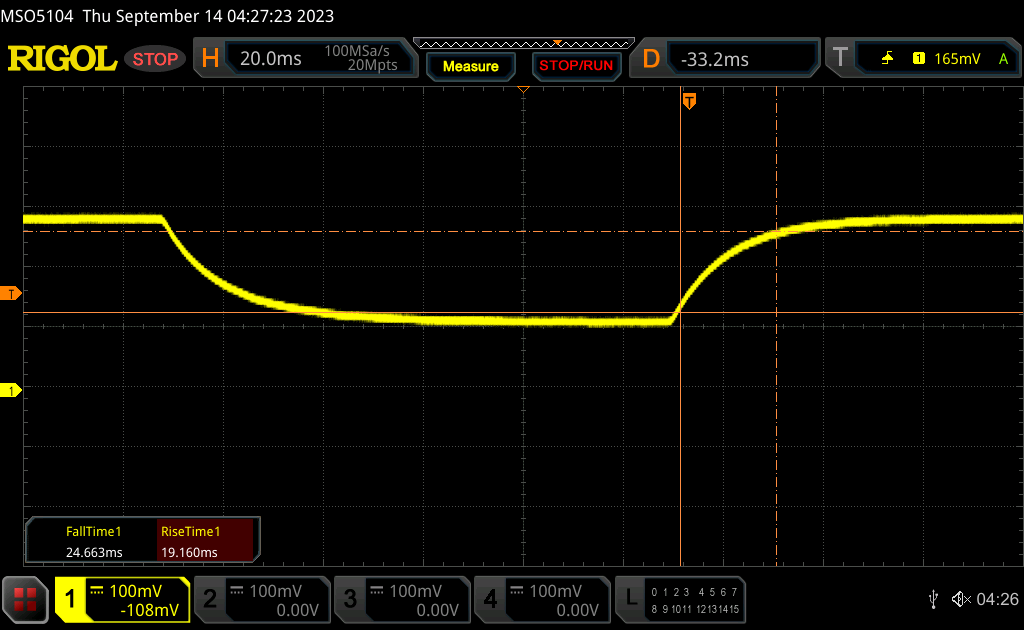 |
| ↘ 24.7 ms hösten | ||
| Skärmen visar långsamma svarsfrekvenser i våra tester och kommer att vara otillfredsställande för spelare. I jämförelse sträcker sig alla testade enheter från 0.165 (minst) till 636 (maximalt) ms. » 73 % av alla enheter är bättre. Detta innebär att den uppmätta svarstiden är sämre än genomsnittet av alla testade enheter (30.9 ms). | ||
Skärmflimmer / PWM (Puls-Width Modulation)
| Skärmflimmer / PWM upptäcktes inte | 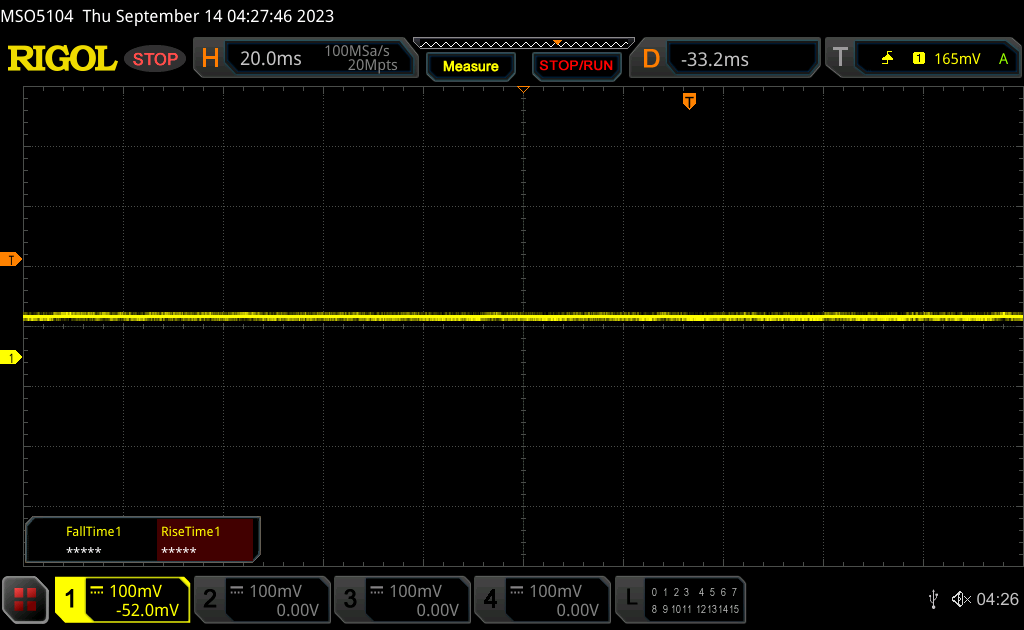 | ||
Som jämförelse: 52 % av alla testade enheter använder inte PWM för att dämpa skärmen. Om PWM upptäcktes mättes ett medelvärde av 7741 (minst: 5 - maximum: 343500) Hz. | |||
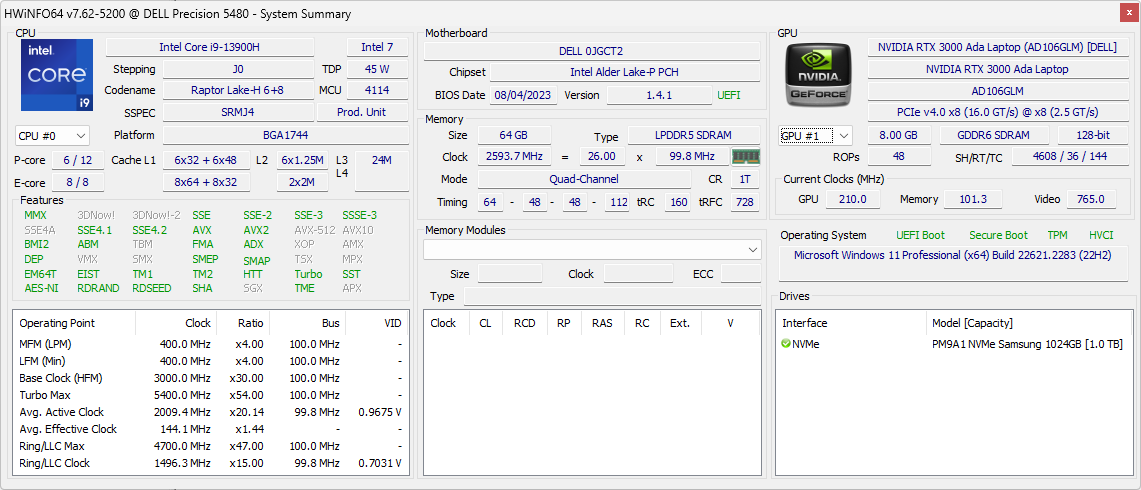
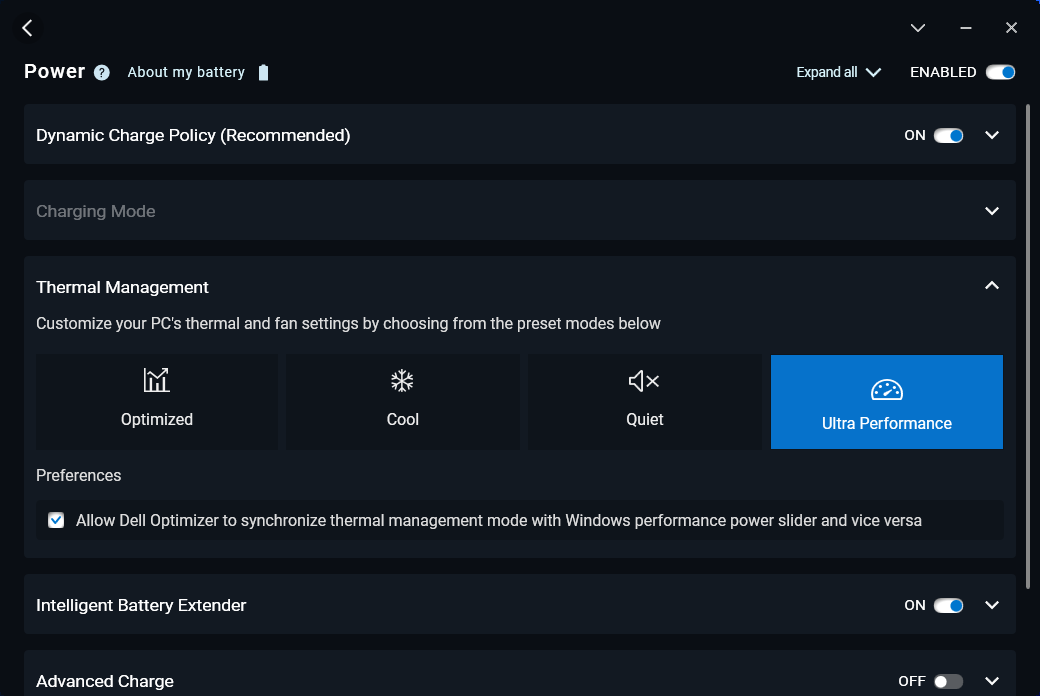
Prestanda - 13:e generationens Raptor Lake-H
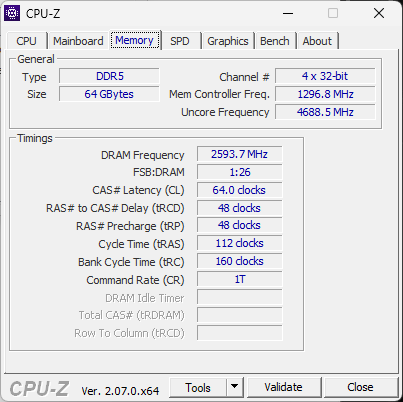
Villkor för testning
Vi ställde in vår enhet på Ultra Performance-läge via Dell Optimizer innan vi körde riktmärkena nedan. Optimizers energiprofiler kan synkroniseras med Windows energiprofiler till skillnad från de flesta andra bärbara datorer.
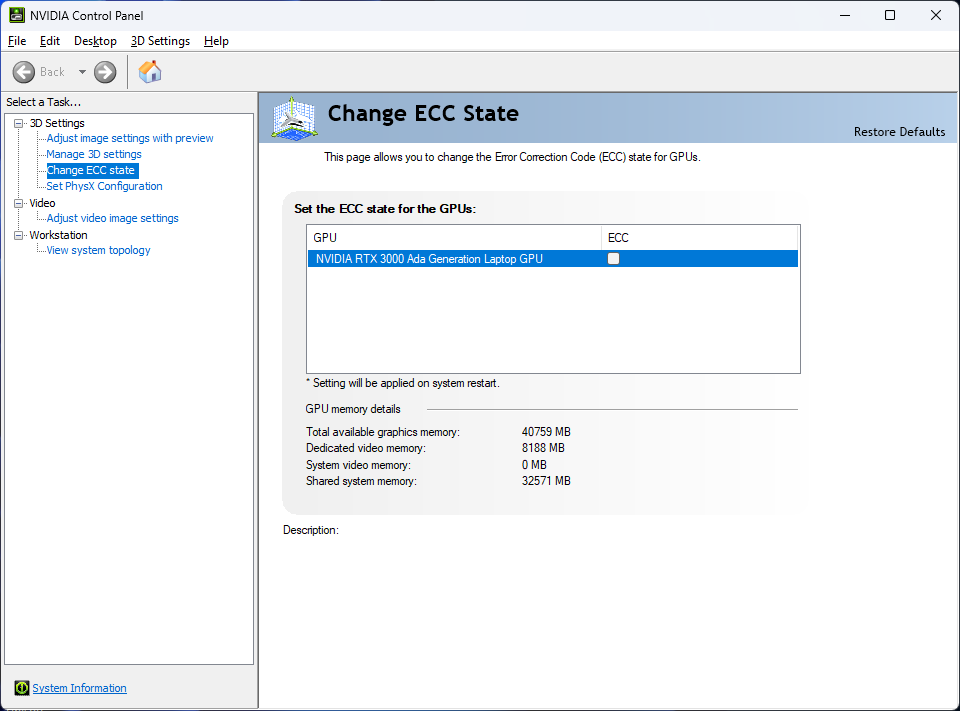
Advanced Optimus, MUX och G-Sync stöds inte på den interna skärmen. VRAM ECC-läget kan slås på eller av via Nvidias kontrollpanel, precis som på andra RTX GPU:er i arbetsstationsklassen från Ada Lovelace-generationen.
Processor
Vår Core i9-13900H ger upp till 25 till 35 procent snabbare multi-thread-prestanda jämfört med Core i9-12900H i förra årets Precision 5470. Den anmärkningsvärda ökningen kan tillskrivas den mer stabila Turbo Boost-prestandan hos Precision 5480 jämfört med Precision 5470, vilket framgår av våra CineBench R15 xT loop-testresultat nedan.
Genomsnittsprestandan är fortfarande långsammare än förväntat för en bärbar dator som drivs av Core i9-13900H, sannolikt på grund av den lilla storleken på Precision 5480. Den större Precision 5680har till exempel samma CPU och presterar ändå cirka 15 procent snabbare.
Cinebench R15 Multi Loop
Cinebench R23: Multi Core | Single Core
Cinebench R20: CPU (Multi Core) | CPU (Single Core)
Cinebench R15: CPU Multi 64Bit | CPU Single 64Bit
Blender: v2.79 BMW27 CPU
7-Zip 18.03: 7z b 4 | 7z b 4 -mmt1
Geekbench 5.5: Multi-Core | Single-Core
HWBOT x265 Benchmark v2.2: 4k Preset
LibreOffice : 20 Documents To PDF
R Benchmark 2.5: Overall mean
* ... mindre är bättre
AIDA64: FP32 Ray-Trace | FPU Julia | CPU SHA3 | CPU Queen | FPU SinJulia | FPU Mandel | CPU AES | CPU ZLib | FP64 Ray-Trace | CPU PhotoWorxx
| Performance rating | |
| Lenovo ThinkPad P15v G3 21EM001AGE | |
| Dell Precision 5480 | |
| Genomsnitt Intel Core i9-13900H | |
| Lenovo ThinkPad P14s G3 AMD 21J6S05000 | |
| Dell Precision 5000 5470 | |
| HP ZBook Firefly 14 G9-6B8A2EA | |
| AIDA64 / FP32 Ray-Trace | |
| Dell Precision 5480 | |
| Genomsnitt Intel Core i9-13900H (6788 - 19557, n=25) | |
| Lenovo ThinkPad P15v G3 21EM001AGE | |
| Dell Precision 5000 5470 | |
| Lenovo ThinkPad P14s G3 AMD 21J6S05000 | |
| HP ZBook Firefly 14 G9-6B8A2EA | |
| AIDA64 / FPU Julia | |
| Lenovo ThinkPad P15v G3 21EM001AGE | |
| Lenovo ThinkPad P14s G3 AMD 21J6S05000 | |
| Dell Precision 5480 | |
| Genomsnitt Intel Core i9-13900H (22551 - 95579, n=25) | |
| Dell Precision 5000 5470 | |
| HP ZBook Firefly 14 G9-6B8A2EA | |
| AIDA64 / CPU SHA3 | |
| Genomsnitt Intel Core i9-13900H (2491 - 4270, n=25) | |
| Dell Precision 5480 | |
| Lenovo ThinkPad P15v G3 21EM001AGE | |
| Dell Precision 5000 5470 | |
| Lenovo ThinkPad P14s G3 AMD 21J6S05000 | |
| HP ZBook Firefly 14 G9-6B8A2EA | |
| AIDA64 / CPU Queen | |
| Dell Precision 5480 | |
| Dell Precision 5000 5470 | |
| Genomsnitt Intel Core i9-13900H (65121 - 120936, n=25) | |
| Lenovo ThinkPad P15v G3 21EM001AGE | |
| Lenovo ThinkPad P14s G3 AMD 21J6S05000 | |
| HP ZBook Firefly 14 G9-6B8A2EA | |
| AIDA64 / FPU SinJulia | |
| Lenovo ThinkPad P15v G3 21EM001AGE | |
| Lenovo ThinkPad P14s G3 AMD 21J6S05000 | |
| Dell Precision 5480 | |
| Genomsnitt Intel Core i9-13900H (6108 - 11631, n=25) | |
| Dell Precision 5000 5470 | |
| HP ZBook Firefly 14 G9-6B8A2EA | |
| AIDA64 / FPU Mandel | |
| Lenovo ThinkPad P15v G3 21EM001AGE | |
| Lenovo ThinkPad P14s G3 AMD 21J6S05000 | |
| Dell Precision 5480 | |
| Genomsnitt Intel Core i9-13900H (11283 - 48474, n=25) | |
| Dell Precision 5000 5470 | |
| HP ZBook Firefly 14 G9-6B8A2EA | |
| AIDA64 / CPU AES | |
| Lenovo ThinkPad P15v G3 21EM001AGE | |
| Genomsnitt Intel Core i9-13900H (3691 - 149377, n=25) | |
| Dell Precision 5480 | |
| Lenovo ThinkPad P14s G3 AMD 21J6S05000 | |
| HP ZBook Firefly 14 G9-6B8A2EA | |
| Dell Precision 5000 5470 | |
| AIDA64 / CPU ZLib | |
| Genomsnitt Intel Core i9-13900H (789 - 1254, n=25) | |
| Dell Precision 5480 | |
| Lenovo ThinkPad P15v G3 21EM001AGE | |
| Lenovo ThinkPad P14s G3 AMD 21J6S05000 | |
| HP ZBook Firefly 14 G9-6B8A2EA | |
| Dell Precision 5000 5470 | |
| AIDA64 / FP64 Ray-Trace | |
| Genomsnitt Intel Core i9-13900H (3655 - 10716, n=25) | |
| Dell Precision 5480 | |
| Lenovo ThinkPad P15v G3 21EM001AGE | |
| Dell Precision 5000 5470 | |
| Lenovo ThinkPad P14s G3 AMD 21J6S05000 | |
| HP ZBook Firefly 14 G9-6B8A2EA | |
| AIDA64 / CPU PhotoWorxx | |
| Dell Precision 5480 | |
| Dell Precision 5000 5470 | |
| HP ZBook Firefly 14 G9-6B8A2EA | |
| Genomsnitt Intel Core i9-13900H (10871 - 50488, n=25) | |
| Lenovo ThinkPad P14s G3 AMD 21J6S05000 | |
| Lenovo ThinkPad P15v G3 21EM001AGE | |
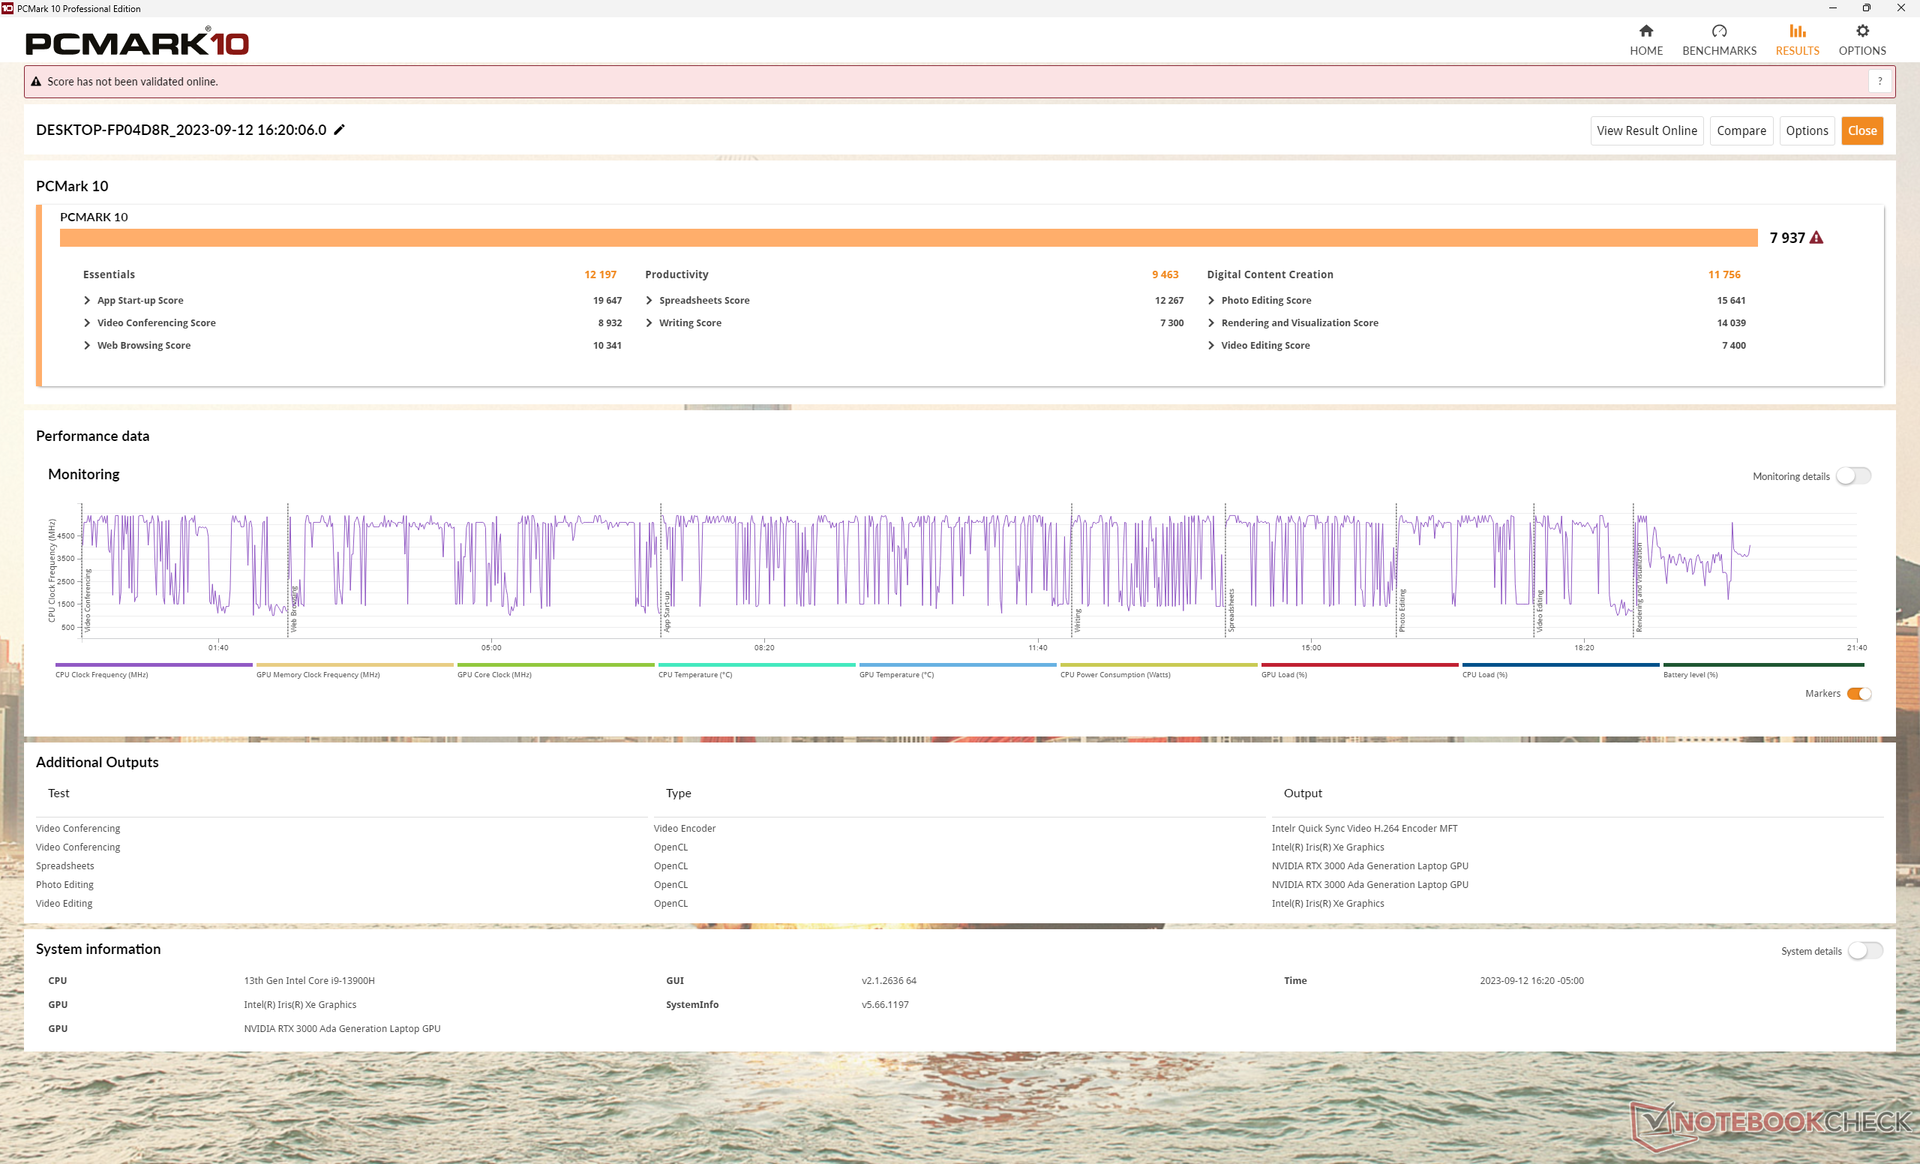
Systemets prestanda
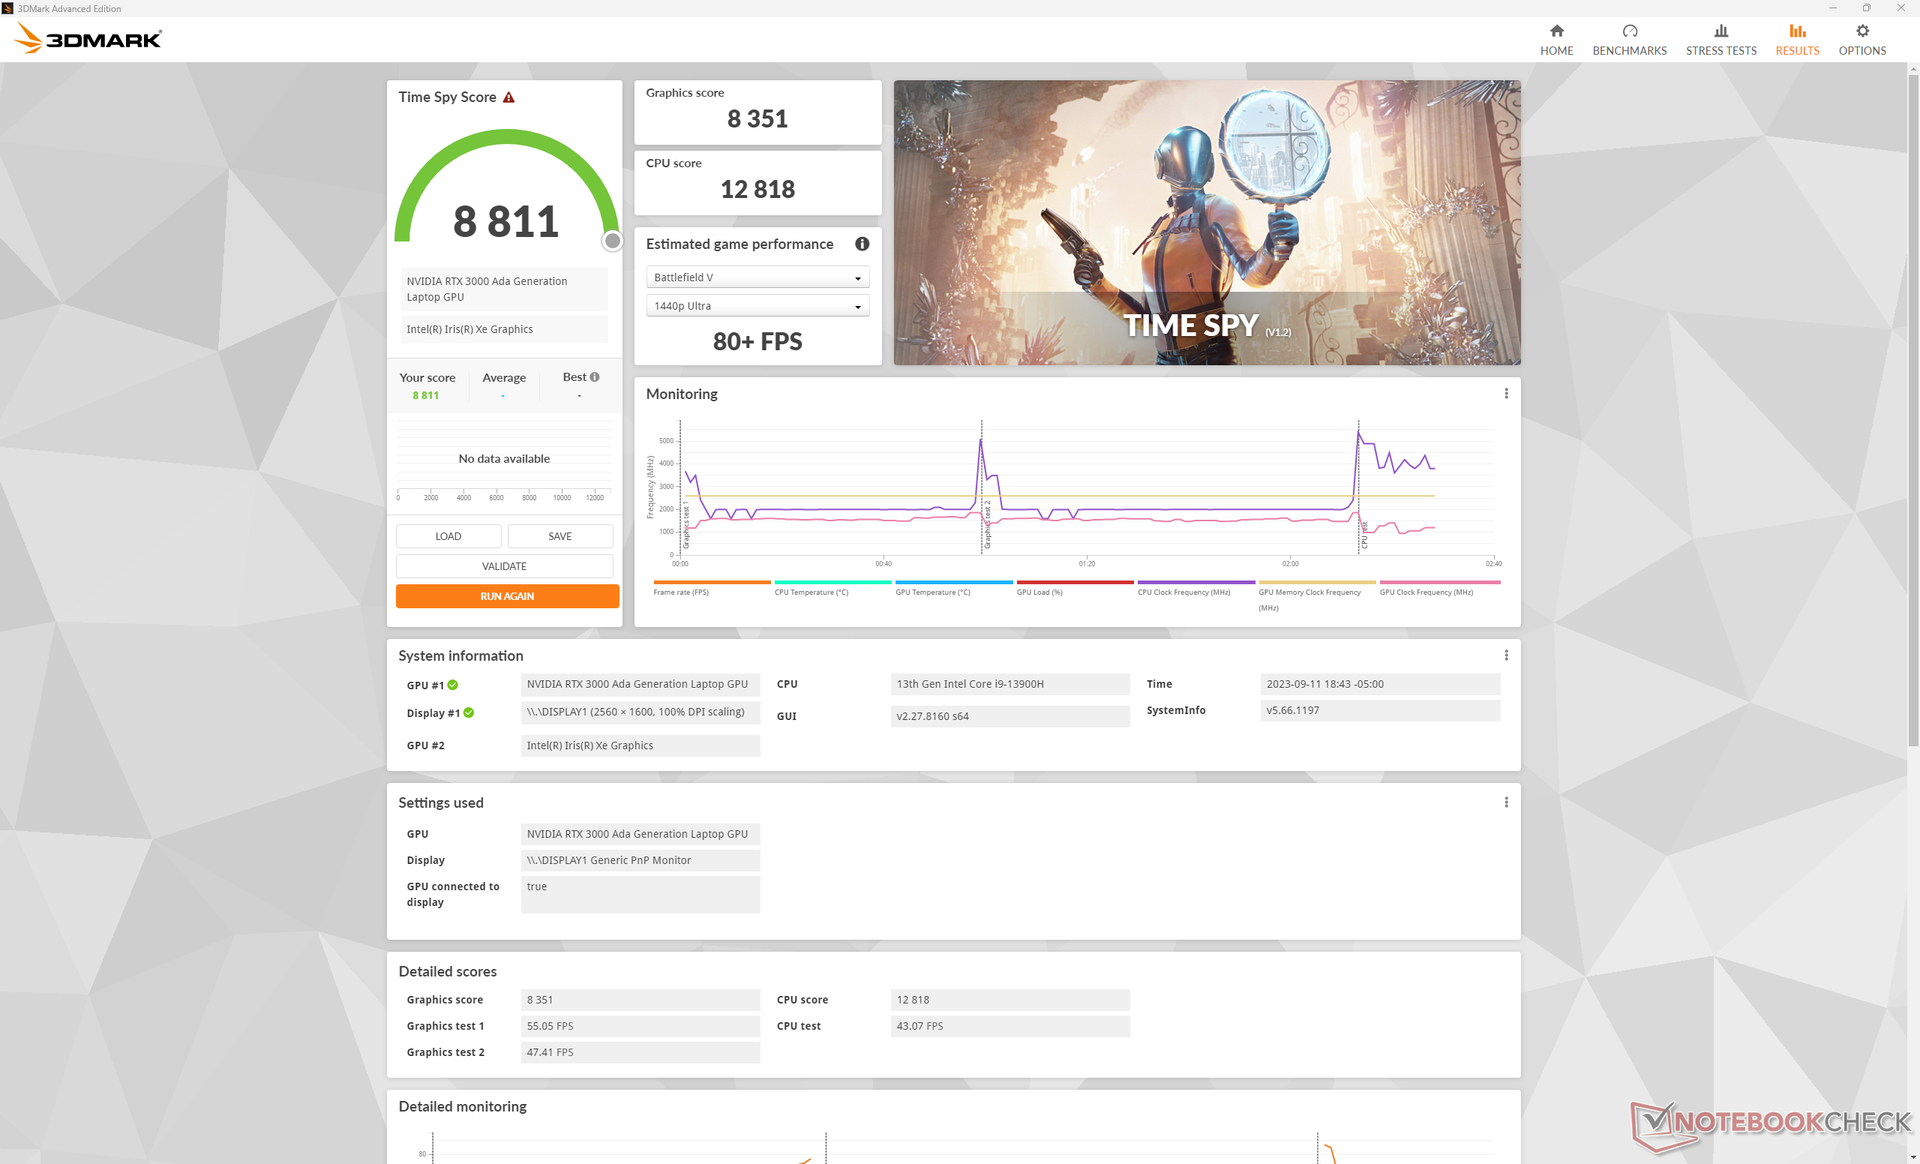
PCMark-resultaten är högre än för andra 14-tums arbetsstationer som vi har testat hittills. Mycket av vinsten kan tillskrivas den nya RTX 3000 Ada GPU som erbjuder betydande prestandafördelar jämfört med förra årets Ampere-alternativ, vilket vårt avsnitt om GPU-prestanda nedan kommer att visa.
CrossMark: Overall | Productivity | Creativity | Responsiveness
| CrossMark / Overall | |
| Dell Precision 5480 | |
| Dell Precision 5000 5470 | |
| HP ZBook Firefly 14 G9-6B8A2EA | |
| Lenovo ThinkPad P15v G3 21EM001AGE | |
| Lenovo ThinkPad P14s G3 AMD 21J6S05000 | |
| CrossMark / Productivity | |
| Dell Precision 5480 | |
| Dell Precision 5000 5470 | |
| HP ZBook Firefly 14 G9-6B8A2EA | |
| Lenovo ThinkPad P15v G3 21EM001AGE | |
| Lenovo ThinkPad P14s G3 AMD 21J6S05000 | |
| CrossMark / Creativity | |
| Dell Precision 5480 | |
| Dell Precision 5000 5470 | |
| HP ZBook Firefly 14 G9-6B8A2EA | |
| Lenovo ThinkPad P15v G3 21EM001AGE | |
| Lenovo ThinkPad P14s G3 AMD 21J6S05000 | |
| CrossMark / Responsiveness | |
| Dell Precision 5480 | |
| Dell Precision 5000 5470 | |
| HP ZBook Firefly 14 G9-6B8A2EA | |
| Lenovo ThinkPad P15v G3 21EM001AGE | |
| Lenovo ThinkPad P14s G3 AMD 21J6S05000 | |
| PCMark 10 Score | 7937 poäng | |
Hjälp | ||
| AIDA64 / Memory Copy | |
| Dell Precision 5480 | |
| Dell Precision 5000 5470 | |
| Genomsnitt Intel Core i9-13900H (37448 - 74486, n=25) | |
| HP ZBook Firefly 14 G9-6B8A2EA | |
| Lenovo ThinkPad P14s G3 AMD 21J6S05000 | |
| Lenovo ThinkPad P15v G3 21EM001AGE | |
| AIDA64 / Memory Read | |
| Dell Precision 5000 5470 | |
| Dell Precision 5480 | |
| HP ZBook Firefly 14 G9-6B8A2EA | |
| Genomsnitt Intel Core i9-13900H (41599 - 75433, n=25) | |
| Lenovo ThinkPad P14s G3 AMD 21J6S05000 | |
| Lenovo ThinkPad P15v G3 21EM001AGE | |
| AIDA64 / Memory Write | |
| Dell Precision 5480 | |
| Genomsnitt Intel Core i9-13900H (36152 - 88505, n=25) | |
| HP ZBook Firefly 14 G9-6B8A2EA | |
| Dell Precision 5000 5470 | |
| Lenovo ThinkPad P14s G3 AMD 21J6S05000 | |
| Lenovo ThinkPad P15v G3 21EM001AGE | |
| AIDA64 / Memory Latency | |
| Lenovo ThinkPad P14s G3 AMD 21J6S05000 | |
| Dell Precision 5000 5470 | |
| Lenovo ThinkPad P15v G3 21EM001AGE | |
| Dell Precision 5480 | |
| Genomsnitt Intel Core i9-13900H (75.8 - 102.3, n=25) | |
| HP ZBook Firefly 14 G9-6B8A2EA | |
* ... mindre är bättre
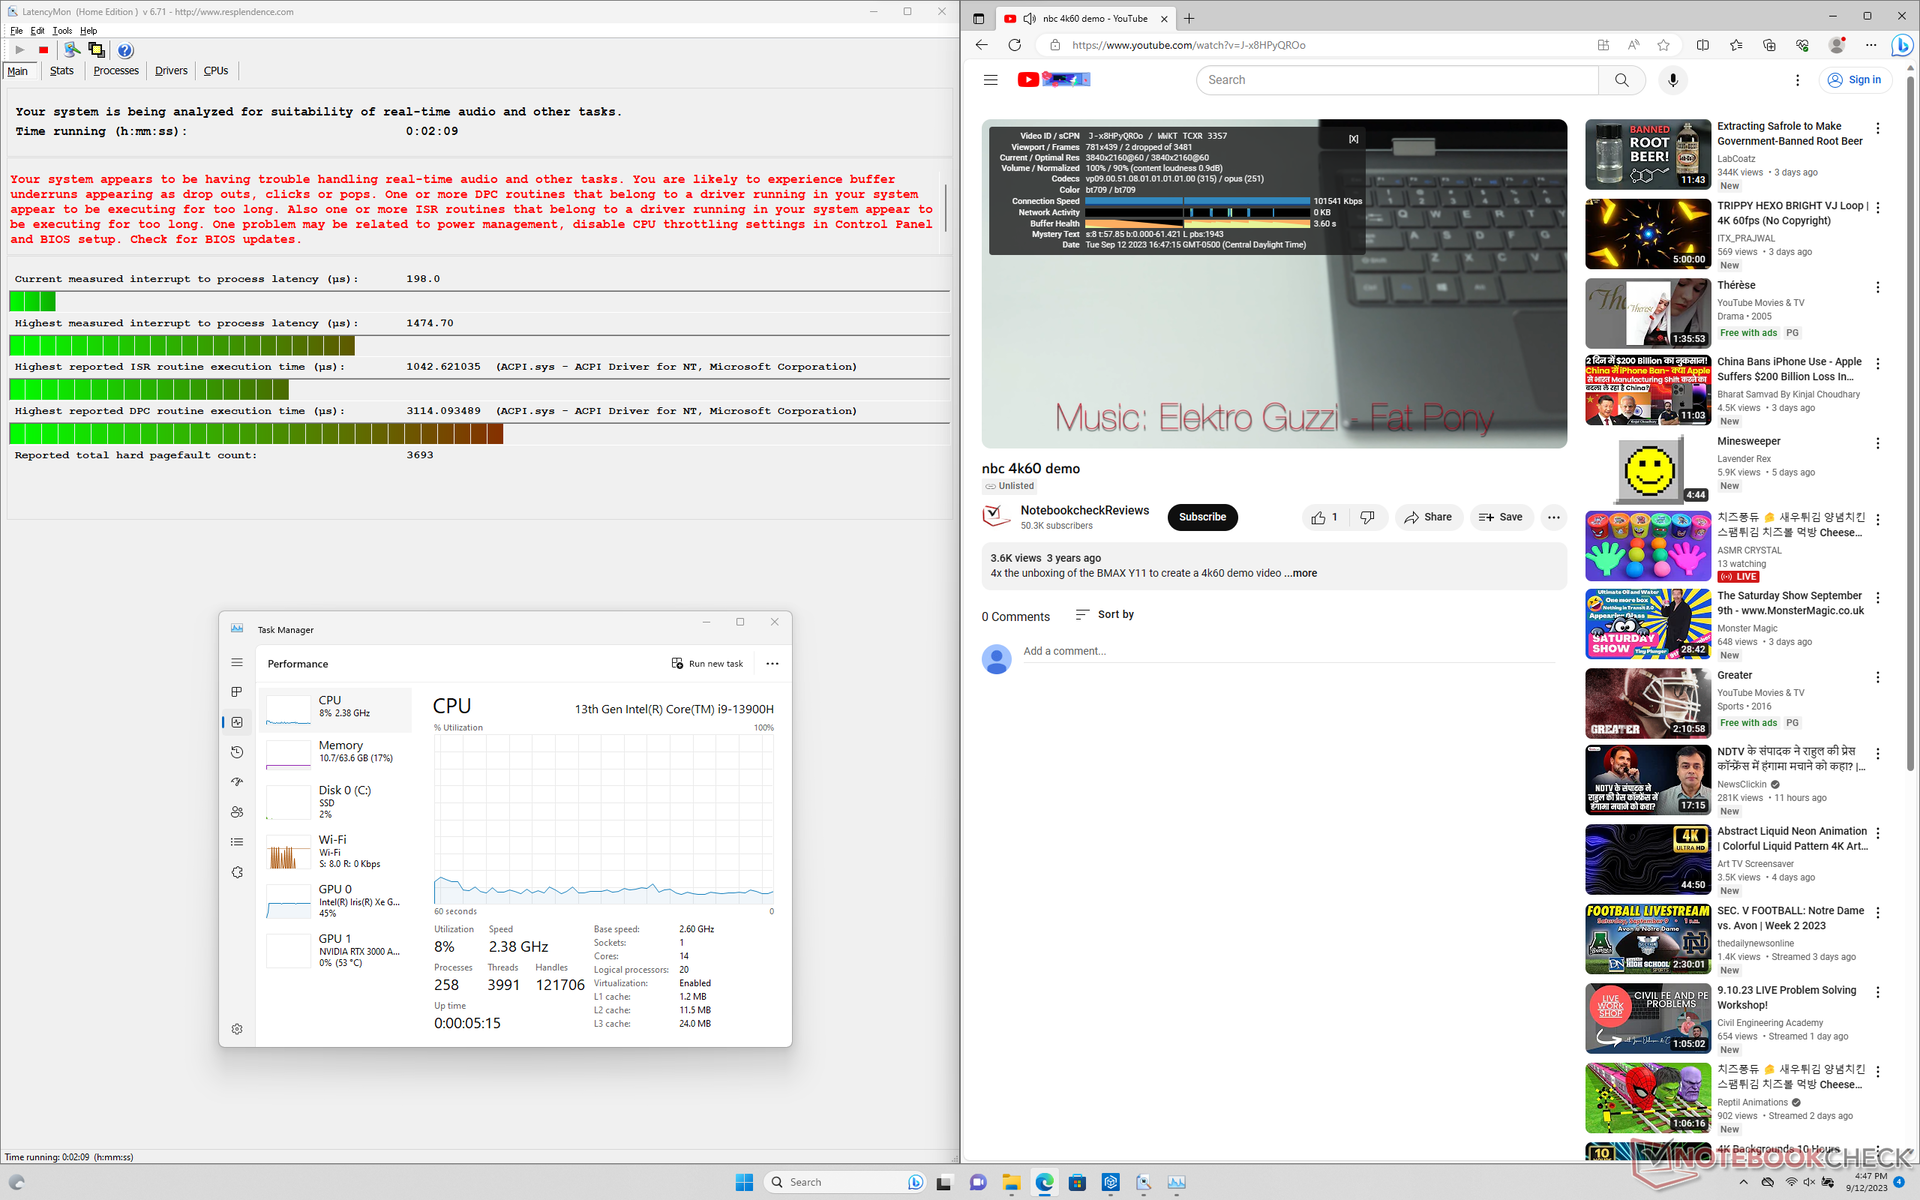
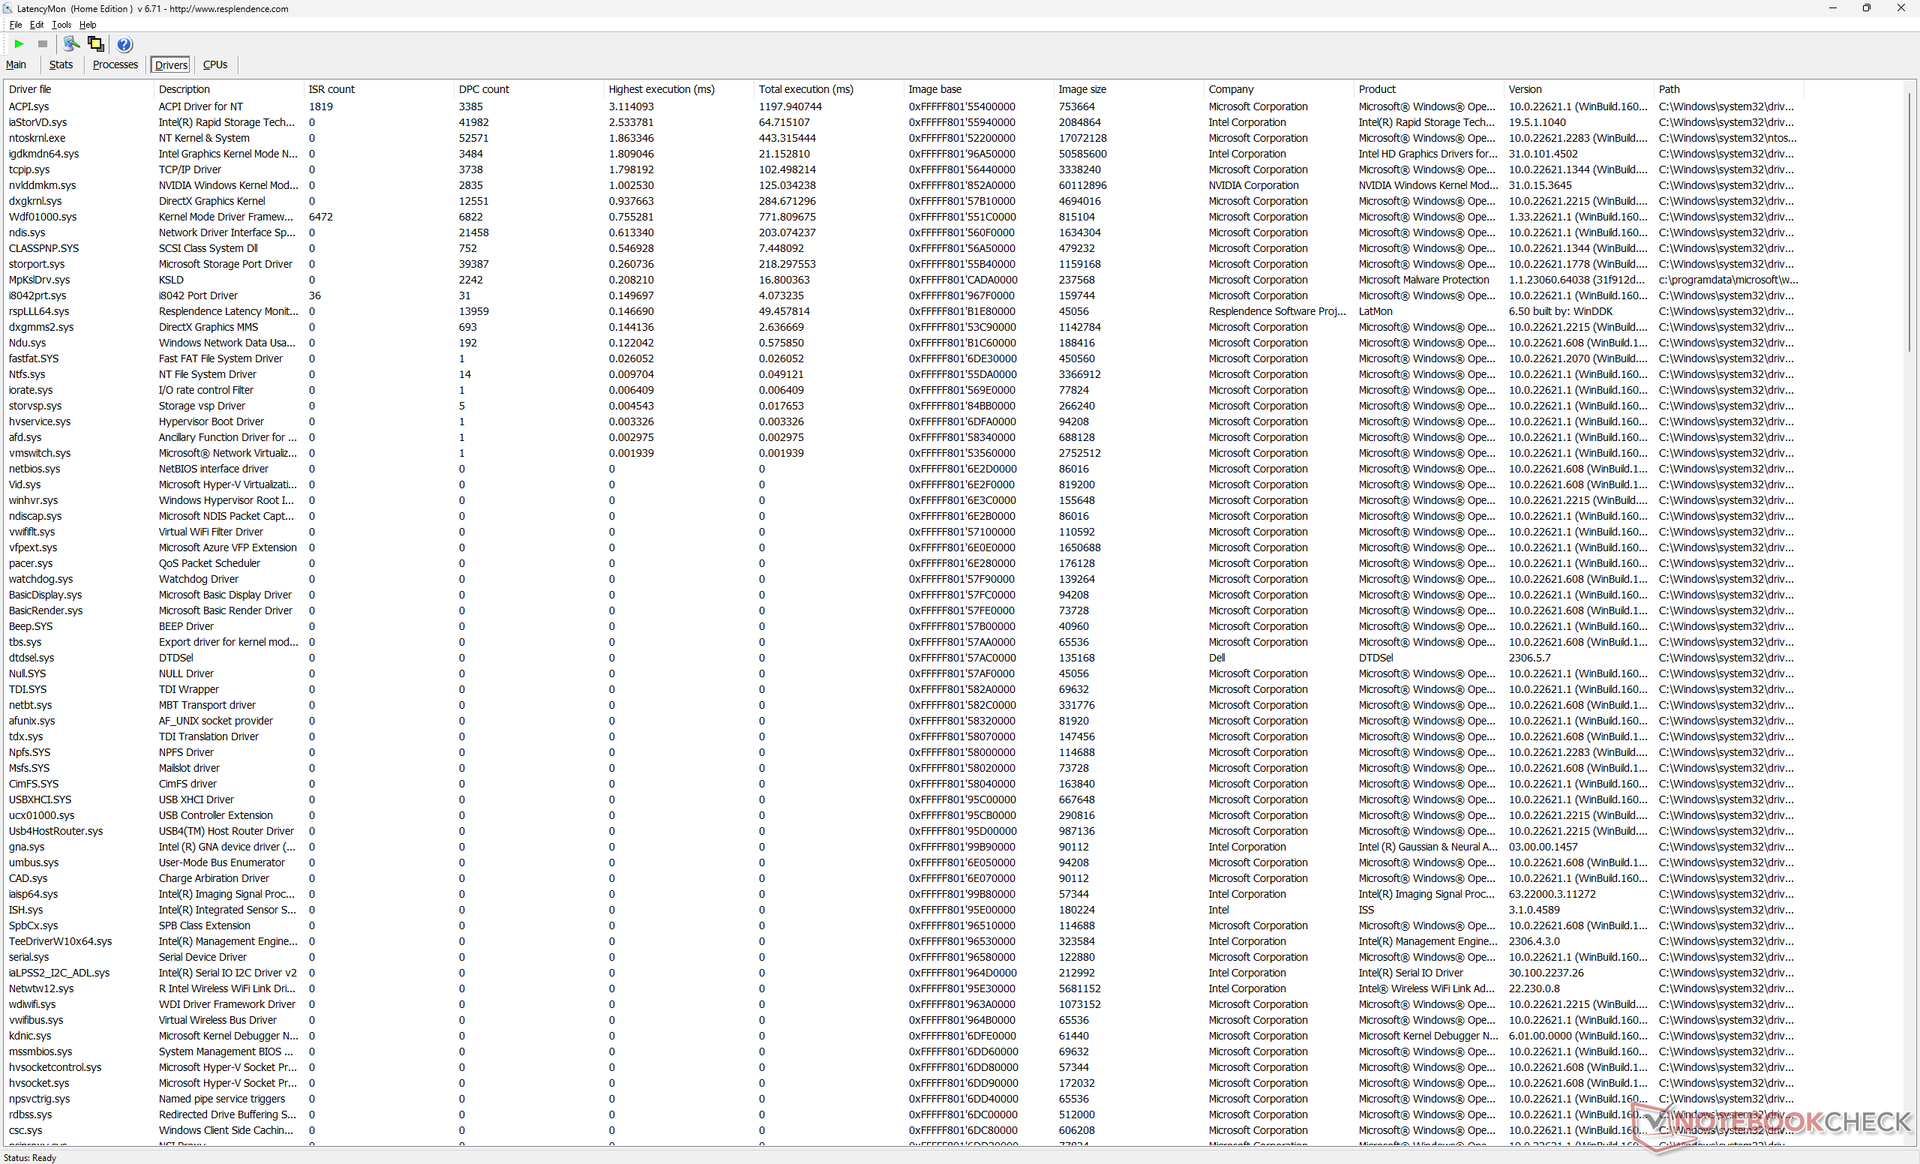
DPC-fördröjning
LatencyMon avslöjar DPC-problem när vi öppnar flera webbläsarflikar på vår hemsida. Vi kan också registrera 2 tappade bildrutor under en minutlång 4K60-video, vilket är olyckligt att se på en mobil arbetsstation.
| DPC Latencies / LatencyMon - interrupt to process latency (max), Web, Youtube, Prime95 | |
| Dell Precision 5480 | |
| Dell Precision 5000 5470 | |
| Lenovo ThinkPad P14s G3 AMD 21J6S05000 | |
| Dell Precision 5000 5560 | |
| Lenovo ThinkPad P15v G3 21EM001AGE | |
* ... mindre är bättre
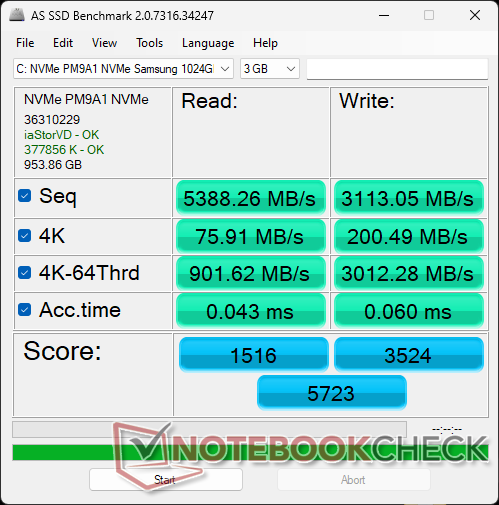
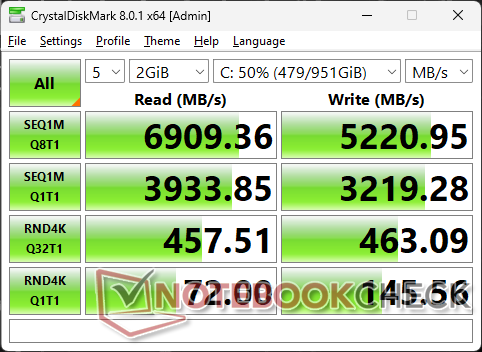
Lagringsenheter
Dell verkar använda Samsung PM9A1 SSD-enheter för de flesta av sina Precision -modeller, inklusive Precision 5470 och 5560. Maximala överföringshastigheter ligger stadigt på ca 6900 MB/s utan några problem med strypning.
Självkrypterande enheter är tillval från Dell, men modellen kan endast stödja en intern SSD.

* ... mindre är bättre
Disk Throttling: DiskSpd Read Loop, Queue Depth 8
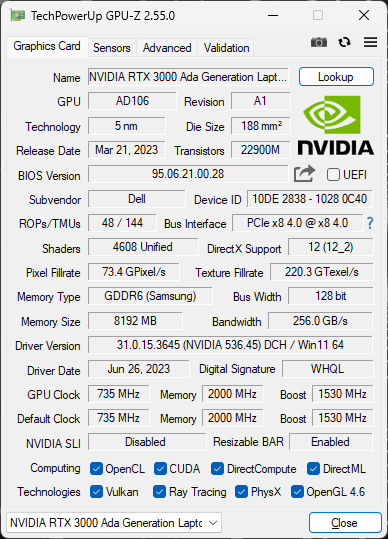
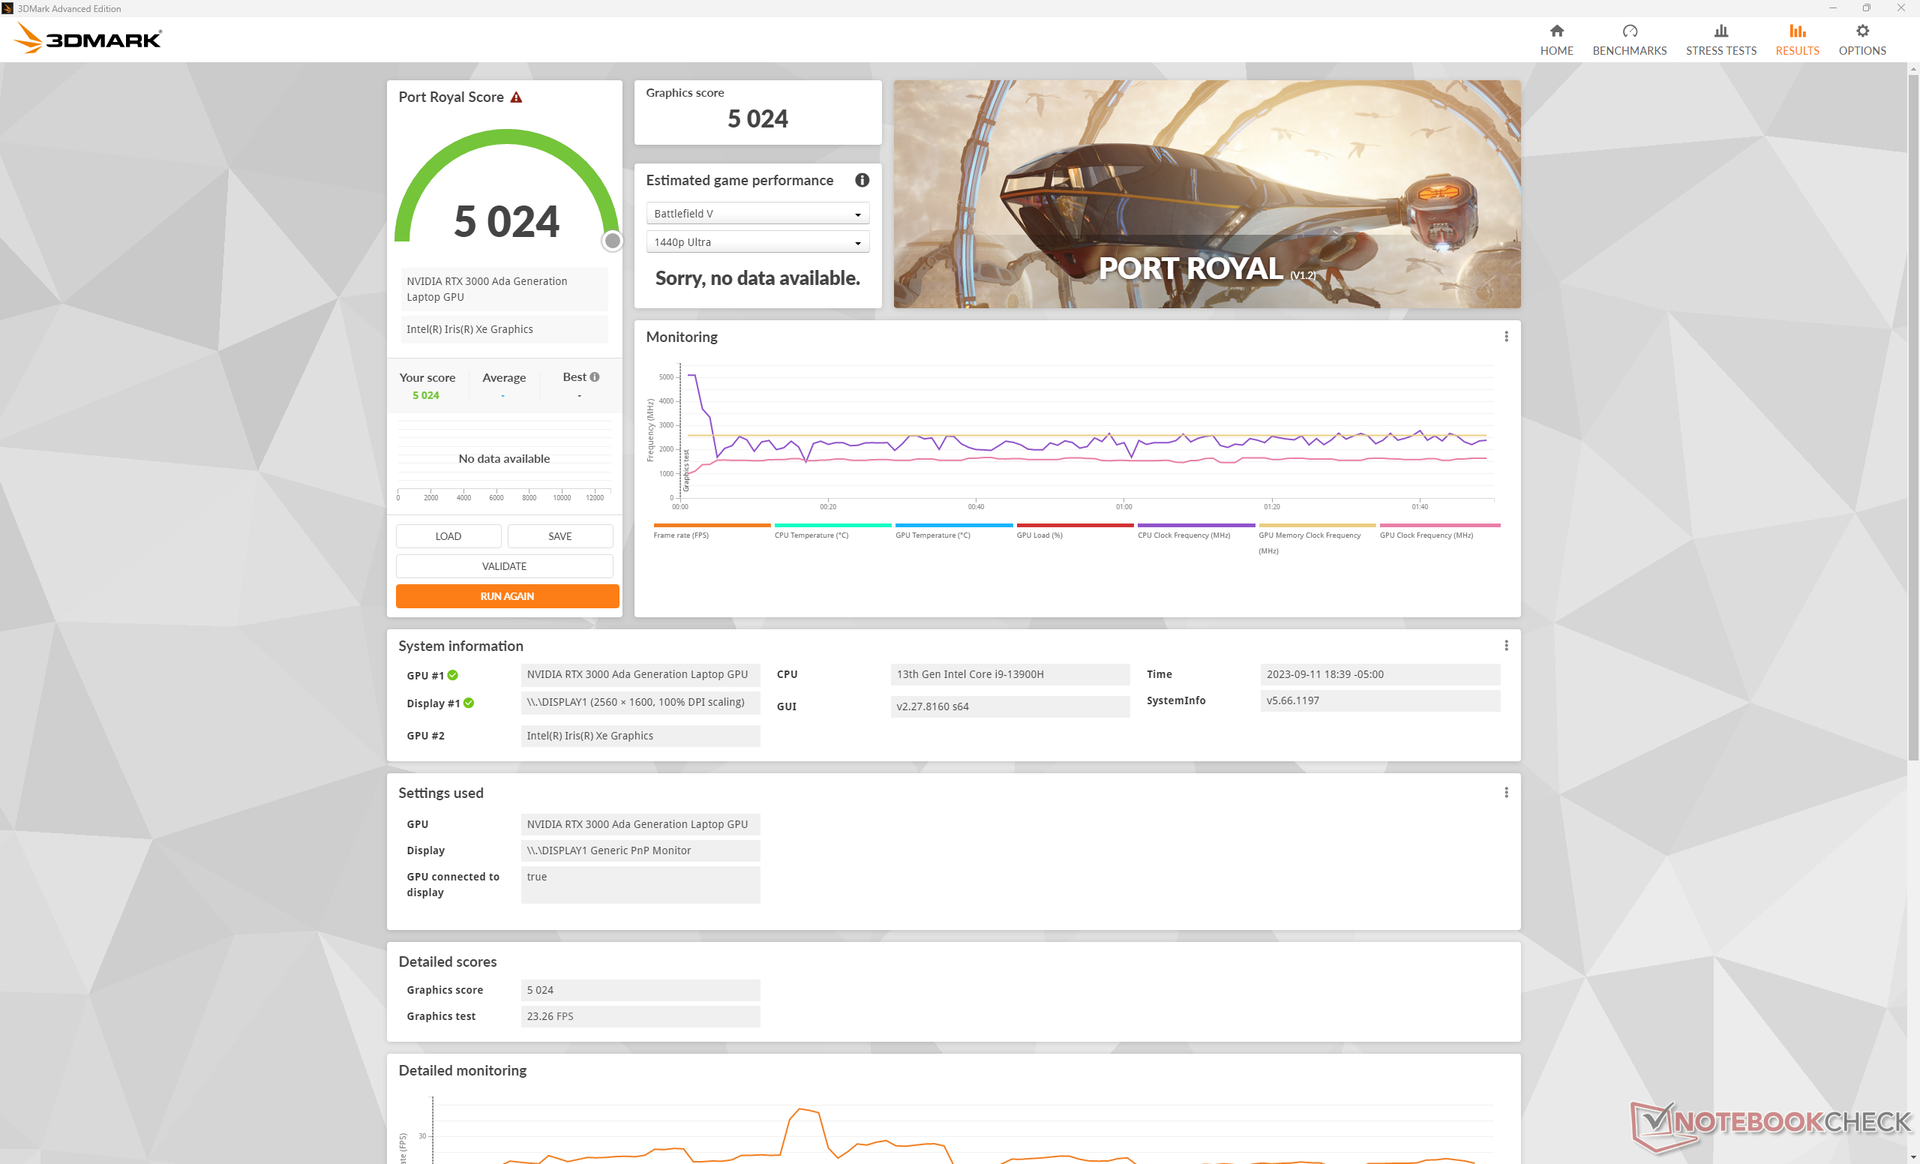
GPU-prestanda
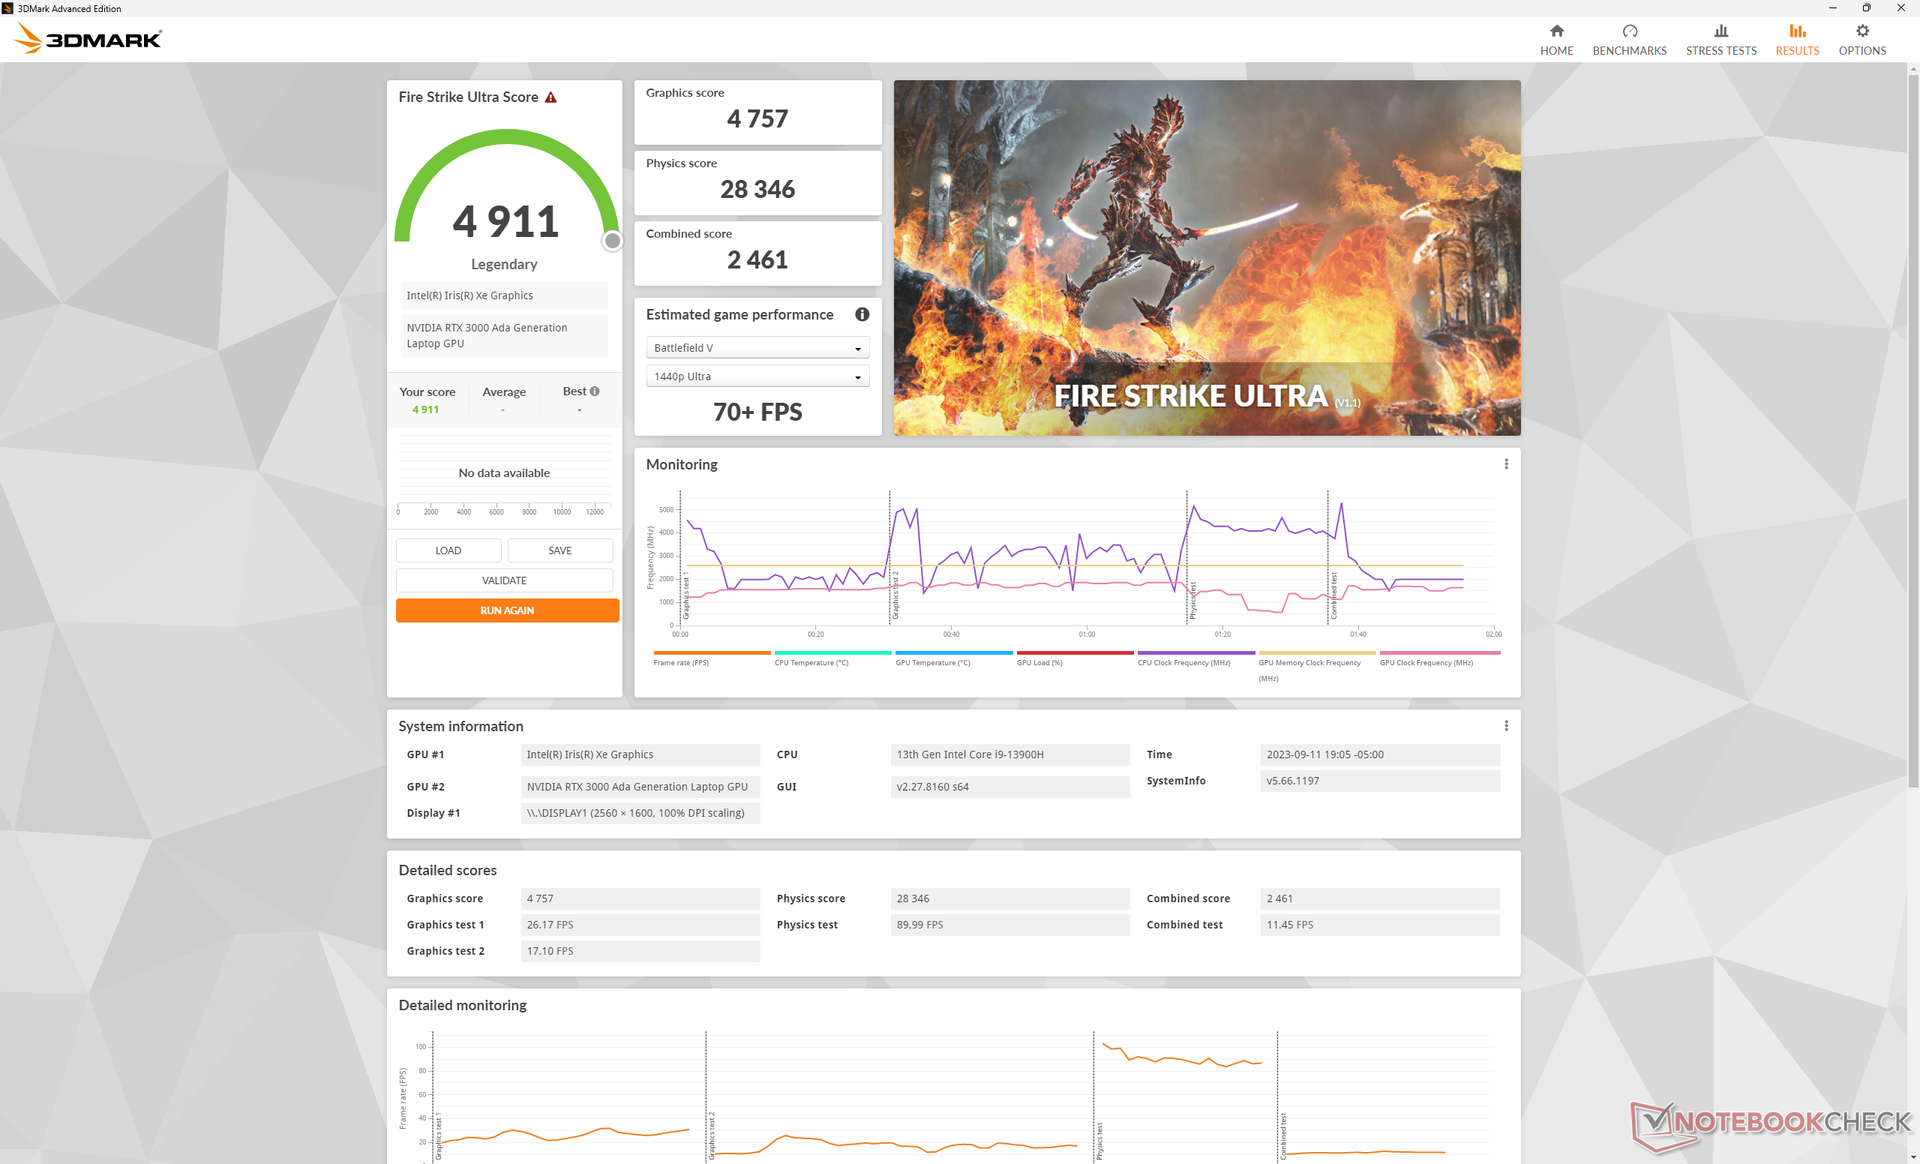
RTX 3000 Ada RTX 3000 Ada är cirka 60 till 80 procent snabbare än RTX A1000 på förra årets Precision 5470 eller cirka 10 till 15 procent snabbare än RTX A3000 som den direkt ersätter. Den nyare GPU:n har en något högre TGP på 50 W medan GPU:n i Precision 5470 var begränsad till 40 W.
Förra generationens RTX A1000 är fortfarande konfigurerbar på Precision 5480, men RTX 3000 Ada rekommenderas starkt för sina betydande prestandaförbättringar. Den nyare Ada GPU:n ligger bara en bit efter den äldre ampere RTX A5500 som finns på mycket större arbetsstationer somHP ZBook Fury 16 G9.
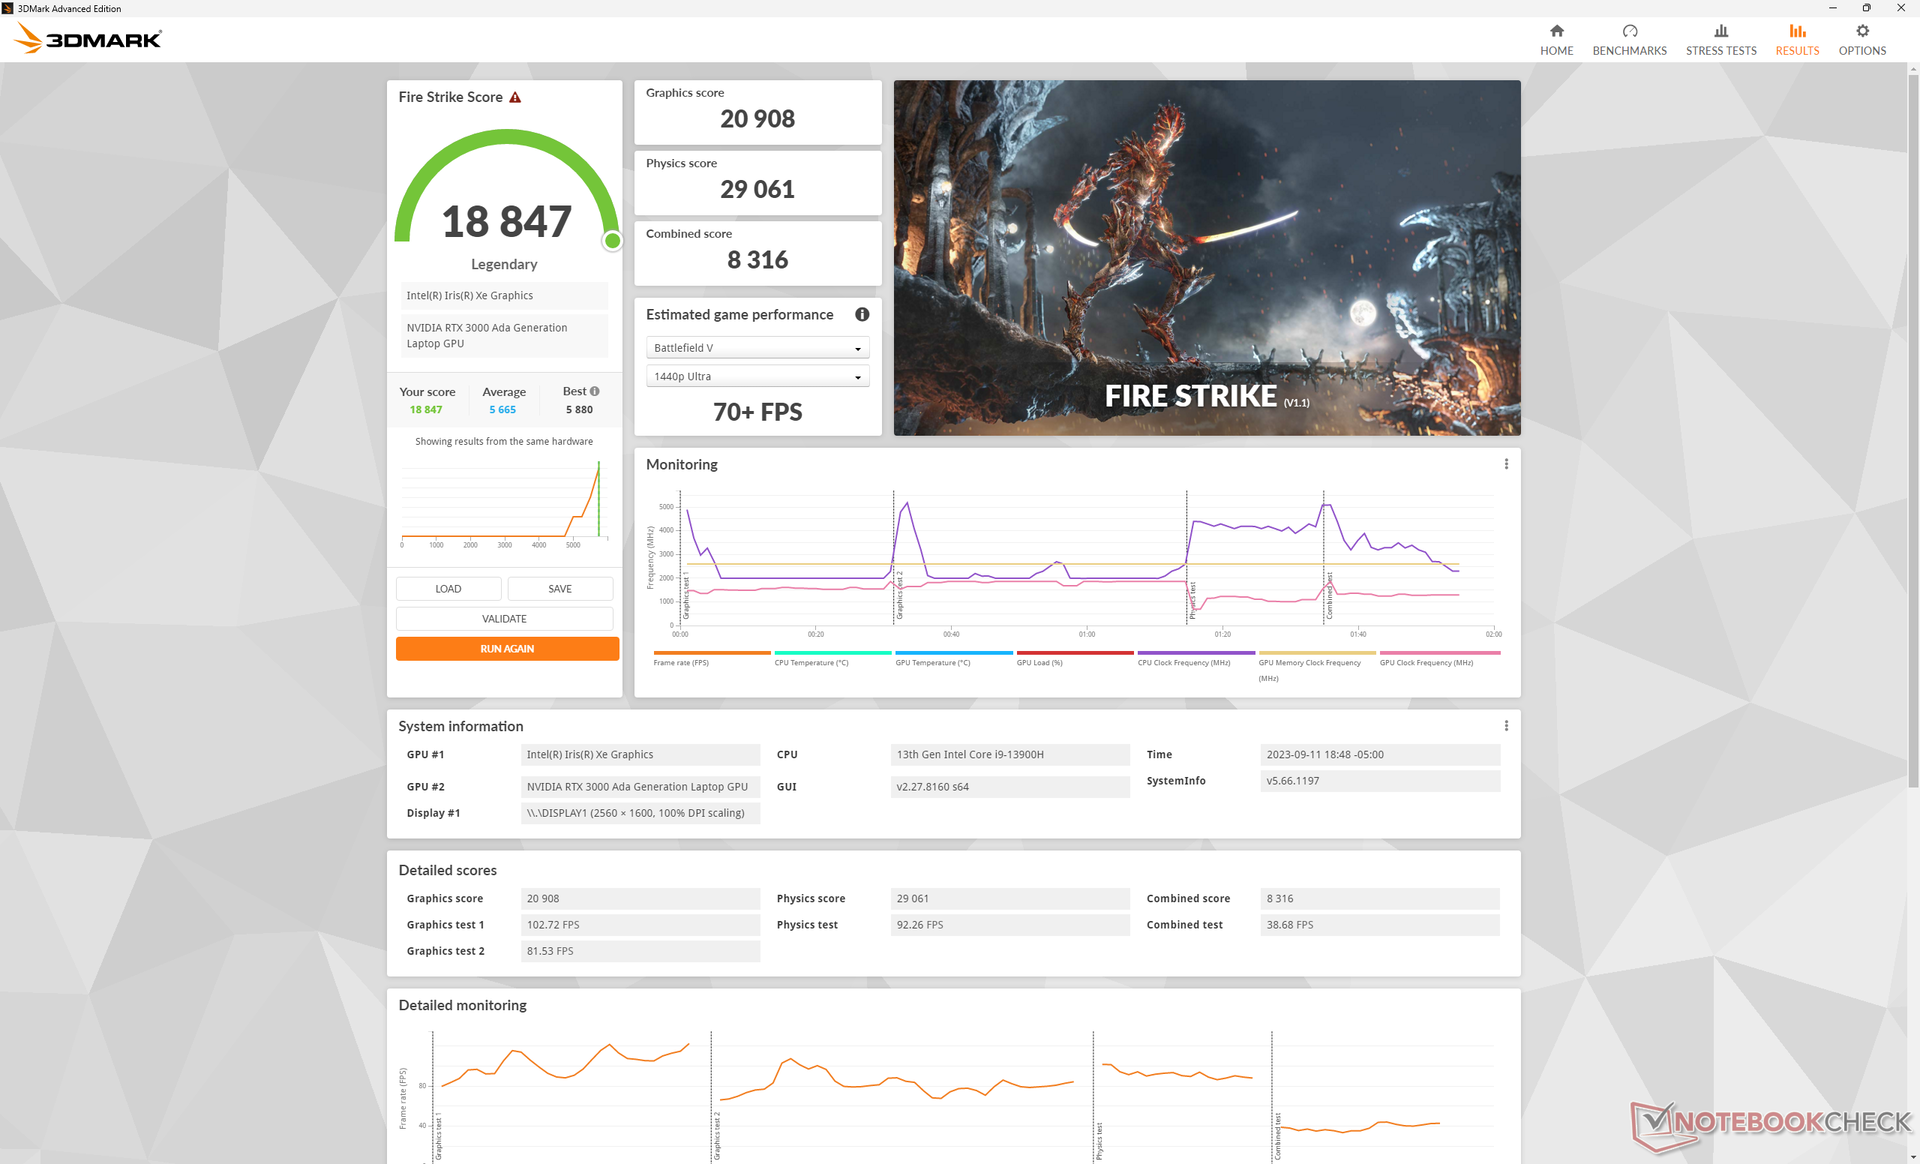
Körning i balanserat läge påverkar CPU-prestandan mer än GPU-prestandan, vilket framgår av våra Fire Strike -resultat i tabellen nedan. Underskotten är relativt små och ligger på ensiffriga procenttal även om man kör i batteriläge.
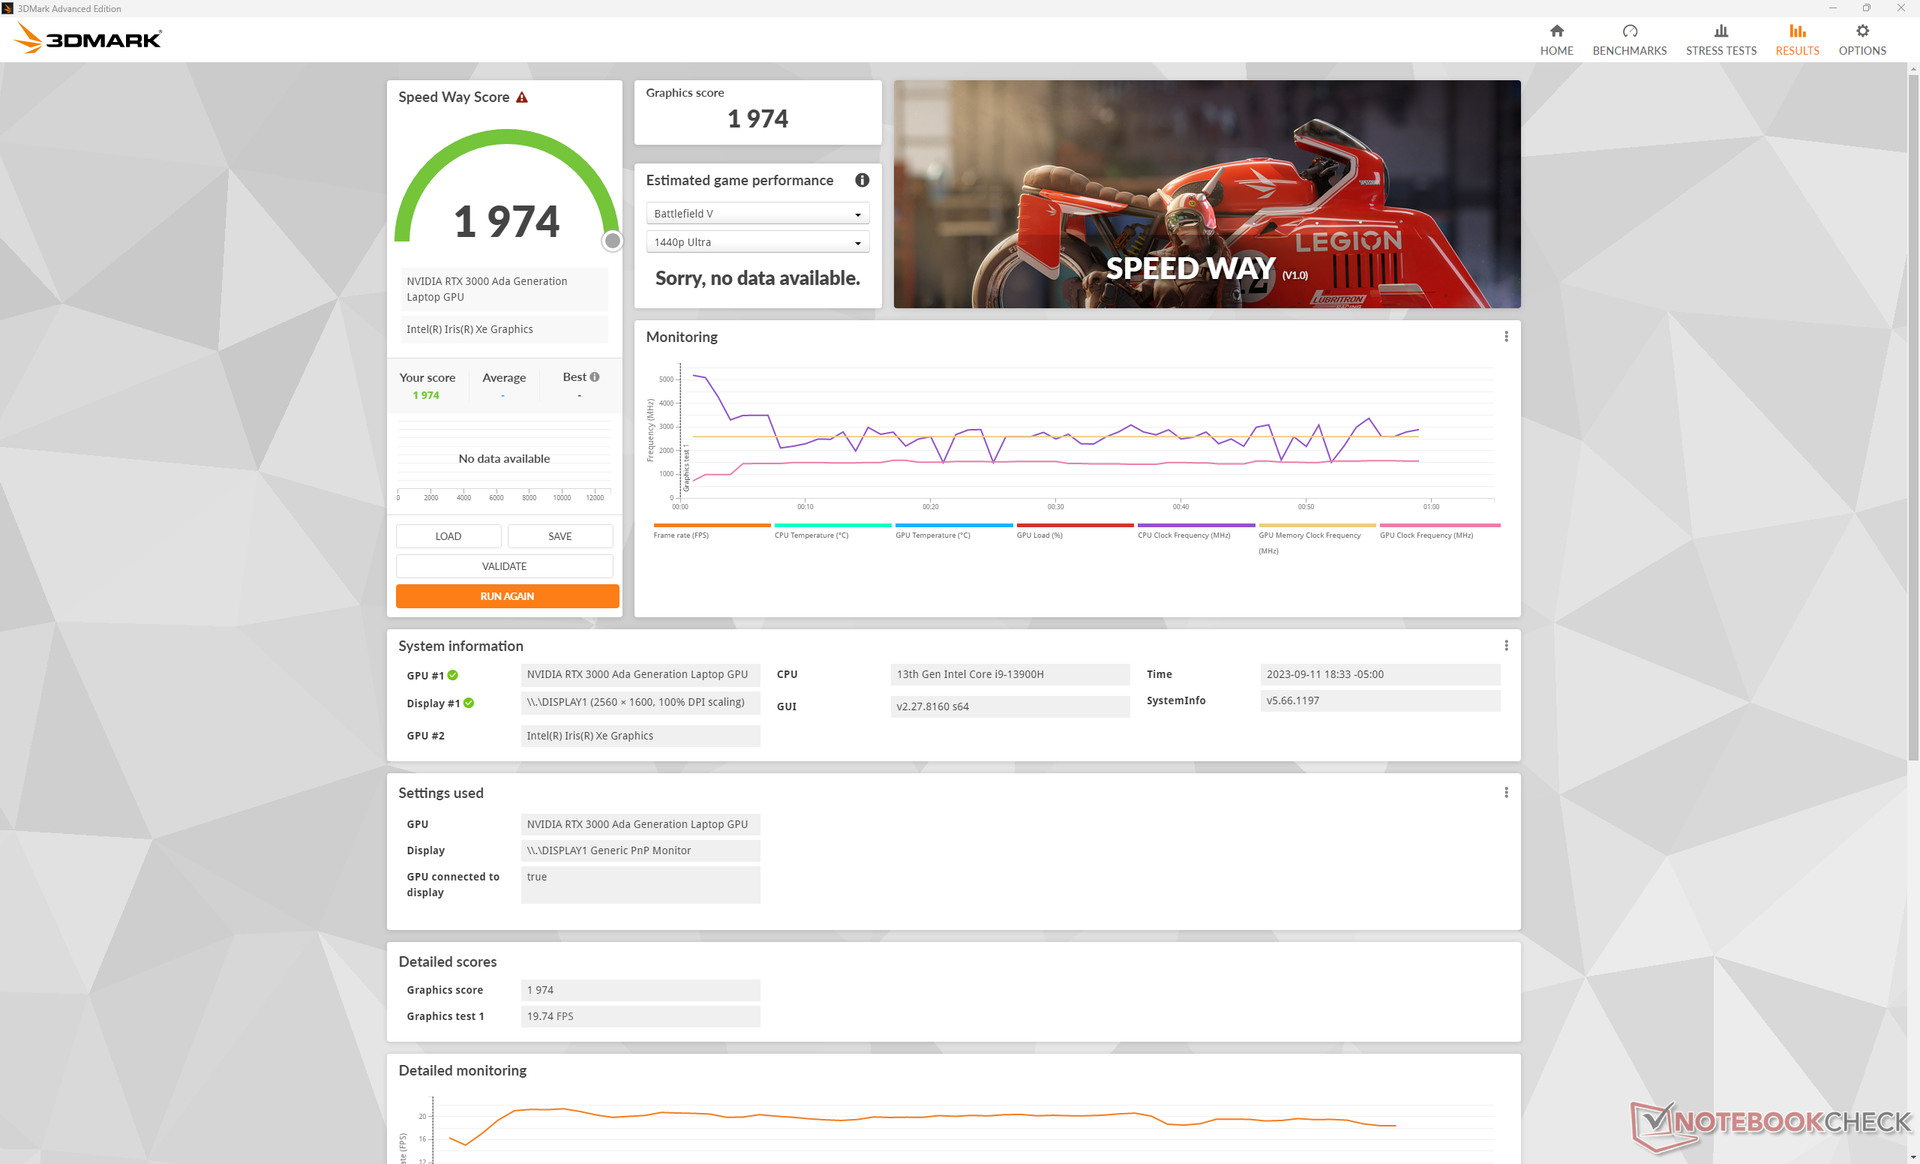
Intressant är att två SpecViewPerf 12-deltester (energi och medicin) alltid kraschade på vår enhet och därför har dessa resultat utelämnats från graferna nedan.
| Kraftprofil | Poäng för fysik | Poäng för grafik | Kombinerat resultat |
| Prestanda-läge | 29061 | 20908 | 8316 |
| Balanserat läge | 26880 (-8%) | 20411 (-2%) | 7633 (-8%) |
| Batteriläge | 27852 (-4%) | 19755 (-6%) | 7569 (-9%) |
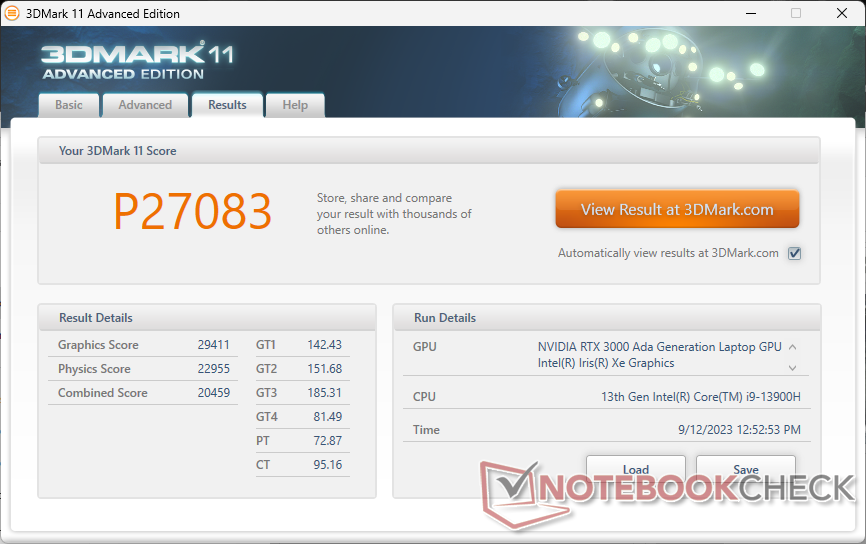
| 3DMark 11 Performance | 27083 poäng | |
| 3DMark Fire Strike Score | 18847 poäng | |
| 3DMark Time Spy Score | 8811 poäng | |
Hjälp | ||
* ... mindre är bättre
Spelprestanda
Spelprestanda är mest lik bärbara datorer som kör på GeForce RTX 4060 som den senaste Inspiron 16 Plus 7630. Vår arbetsstation kan köra krävande titlar som Cyberpunk 2077 i 1080p mycket bra medan native QHD+ kräver lägre inställningar eller DLSS för att hålla bildfrekvenserna flytande.
Witcher 3 FPS Chart
| låg | med. | hög | ultra | |
|---|---|---|---|---|
| GTA V (2015) | 183.2 | 177 | 164.1 | 88.2 |
| The Witcher 3 (2015) | 364.1 | 242.5 | 150.1 | 78.7 |
| Dota 2 Reborn (2015) | 175.7 | 160.8 | 151.5 | 142.9 |
| Final Fantasy XV Benchmark (2018) | 155.1 | 108 | 78.9 | |
| X-Plane 11.11 (2018) | 152 | 126.8 | 102 | |
| Far Cry 5 (2018) | 155 | 116 | 106 | 101 |
| Strange Brigade (2018) | 400 | 191.3 | 160.1 | 140.7 |
| Cyberpunk 2077 1.6 (2022) | 92.3 | 72.4 | 61.2 | 56.2 |
| Tiny Tina's Wonderlands (2022) | 156 | 131.4 | 88 | 69 |
| F1 22 (2022) | 162.7 | 159.6 | 133.4 | 51.1 |
Utsläpp
Buller från systemet
Fläktljud och beteende har inte riktigt förändrats från förra årets modell. Högre belastning motsvarande spel skulle ge ett fläktljud på strax över 50 dB(A) och därmed vara en av de mest högljudda 14-tums arbetsstationerna på marknaden. Intressant nog är detta maxvärde detsamma mellan lägena Balanserad och Prestanda, så det finns få eller inga fördelar med att köra i läget Balanserad när det gäller ljudnivån.
Ljudnivå
| Låg belastning |
| 23.5 / 23.5 / 23.5 dB(A) |
| Hög belastning |
| 39.9 / 51 dB(A) |
 | ||
30 dB tyst 40 dB(A) hörbar 50 dB(A) högt ljud |
||
min: | ||
| Dell Precision 5480 RTX 3000 Ada Generation Laptop, i9-13900H, Samsung PM9A1 MZVL21T0HCLR | Dell Precision 5000 5470 RTX A1000 Laptop GPU, i9-12900H, Samsung PM9A1 MZVL21T0HCLR | Dell Precision 5000 5560 RTX A2000 Laptop GPU, i7-11850H, Samsung PM9A1 MZVL22T0HBLB | Lenovo ThinkPad P14s G3 AMD 21J6S05000 Radeon 680M, R7 PRO 6850U, Samsung PM9A1 MZVL21T0HCLR | HP ZBook Firefly 14 G9-6B8A2EA T550 Laptop GPU, i7-1265U, Micron 3400 1TB MTFDKBA1T0TFH | Lenovo ThinkPad P15v G3 21EM001AGE RTX A2000 Laptop GPU, R7 PRO 6850H, SK Hynix PC711 1TB HFS001TDE9X081N | |
|---|---|---|---|---|---|---|
| Noise | -2% | 11% | 11% | 4% | 9% | |
| av / miljö * (dB) | 23.5 | 23 2% | 23.4 -0% | 22.9 3% | 23.6 -0% | 23.2 1% |
| Idle Minimum * (dB) | 23.5 | 23.3 1% | 23.6 -0% | 22.9 3% | 23.6 -0% | 23.2 1% |
| Idle Average * (dB) | 23.5 | 23.3 1% | 23.6 -0% | 22.9 3% | 23.6 -0% | 23.2 1% |
| Idle Maximum * (dB) | 23.5 | 23.3 1% | 23.6 -0% | 22.9 3% | 23.6 -0% | 23.2 1% |
| Load Average * (dB) | 39.9 | 48.5 -22% | 25.8 35% | 30.8 23% | 42.5 -7% | 35 12% |
| Witcher 3 ultra * (dB) | 50.1 | 48.6 3% | 40.1 20% | 39.4 21% | 42.5 15% | 37.9 24% |
| Load Maximum * (dB) | 51 | 50.4 1% | 41.4 19% | 39.5 23% | 42.5 17% | 37.5 26% |
* ... mindre är bättre
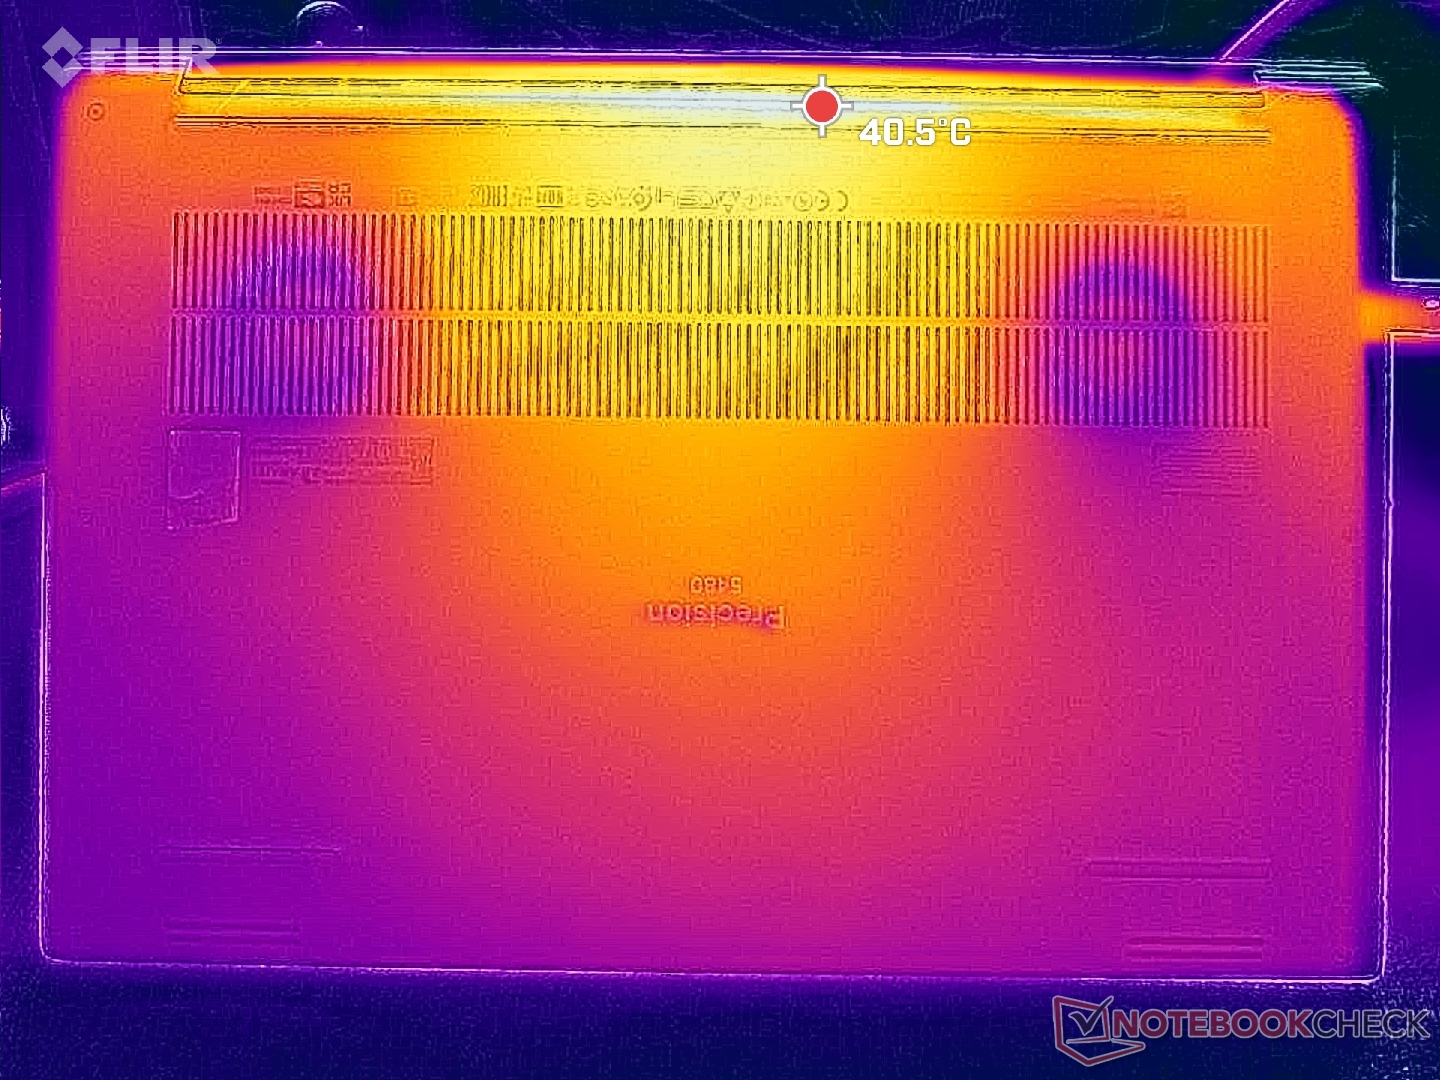
Temperatur
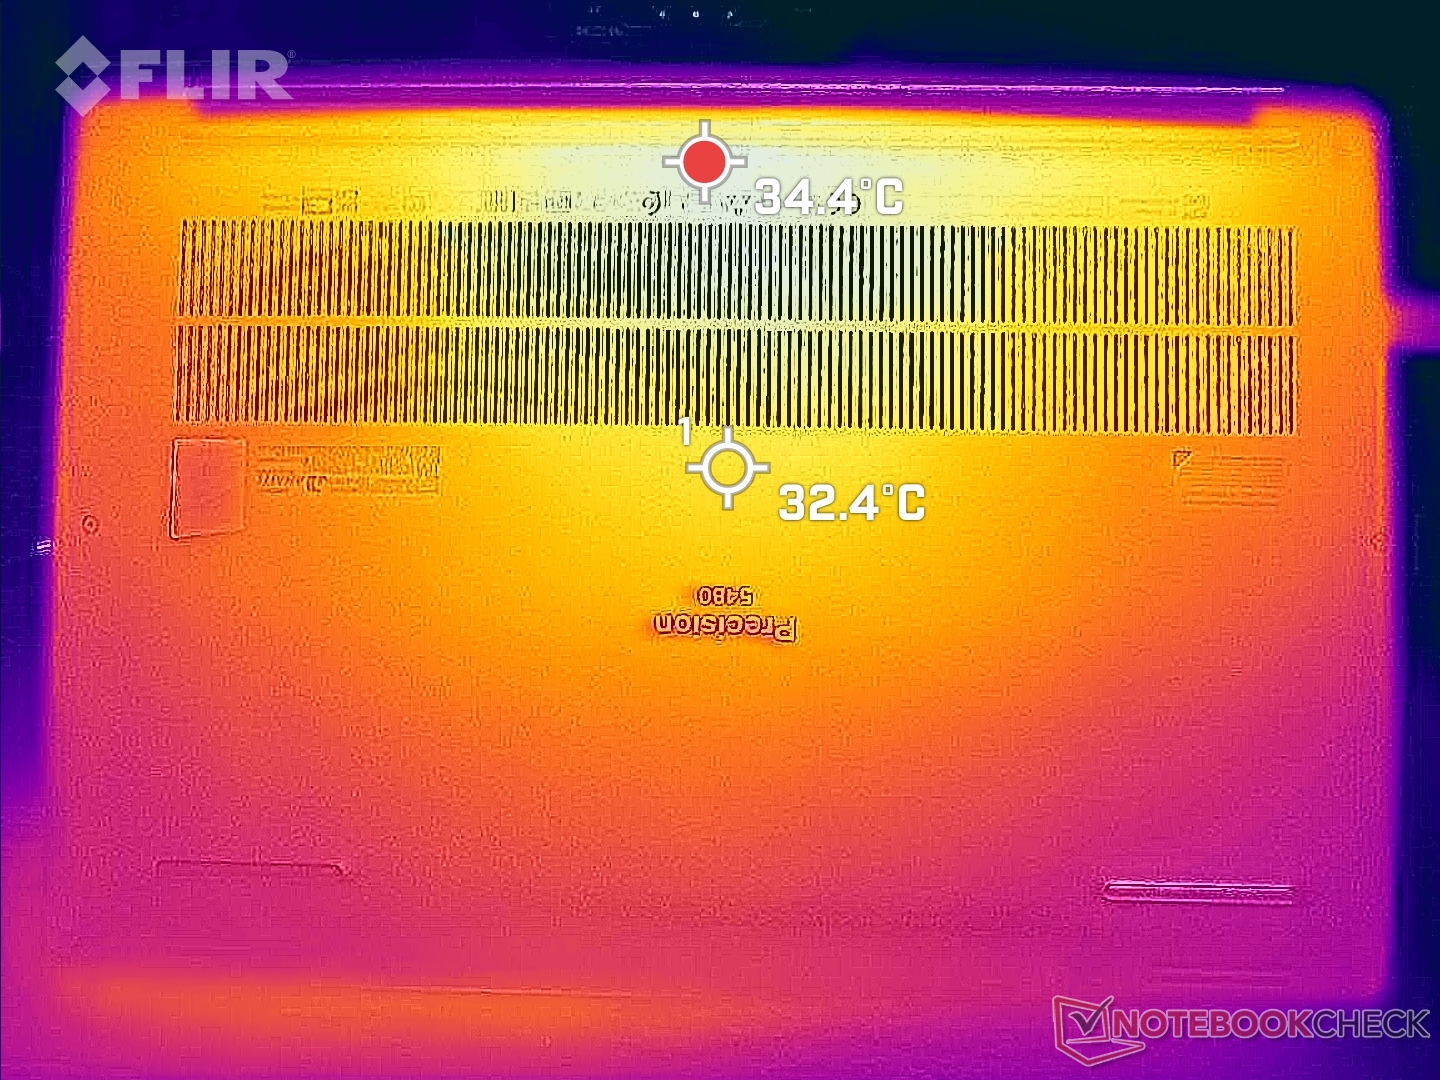
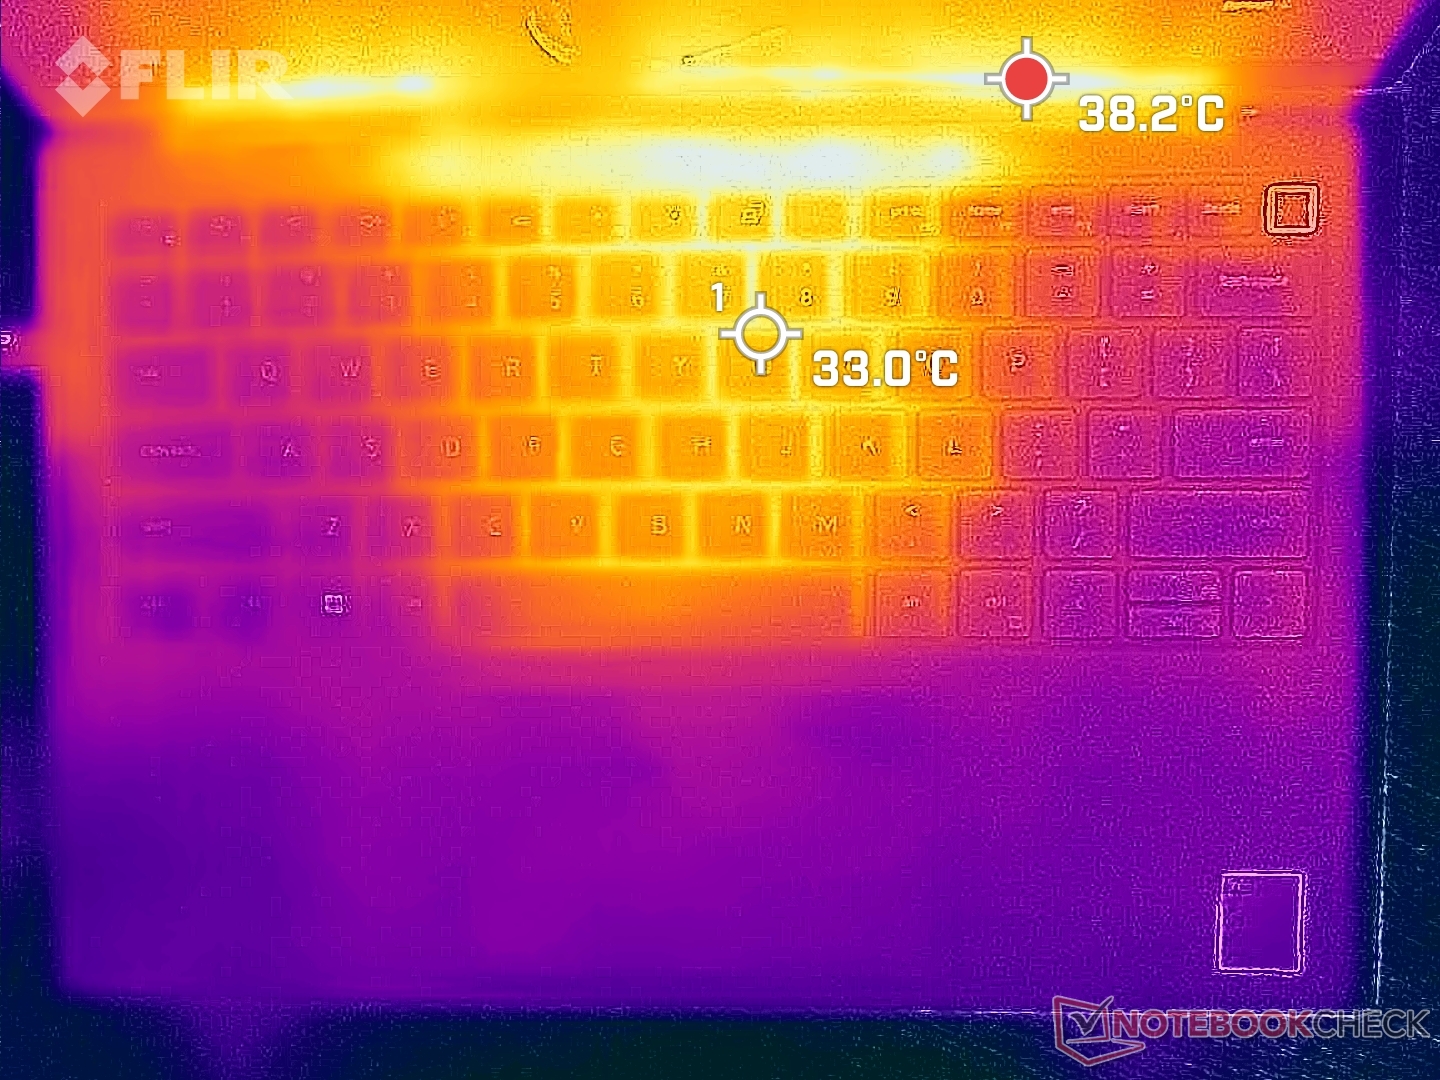
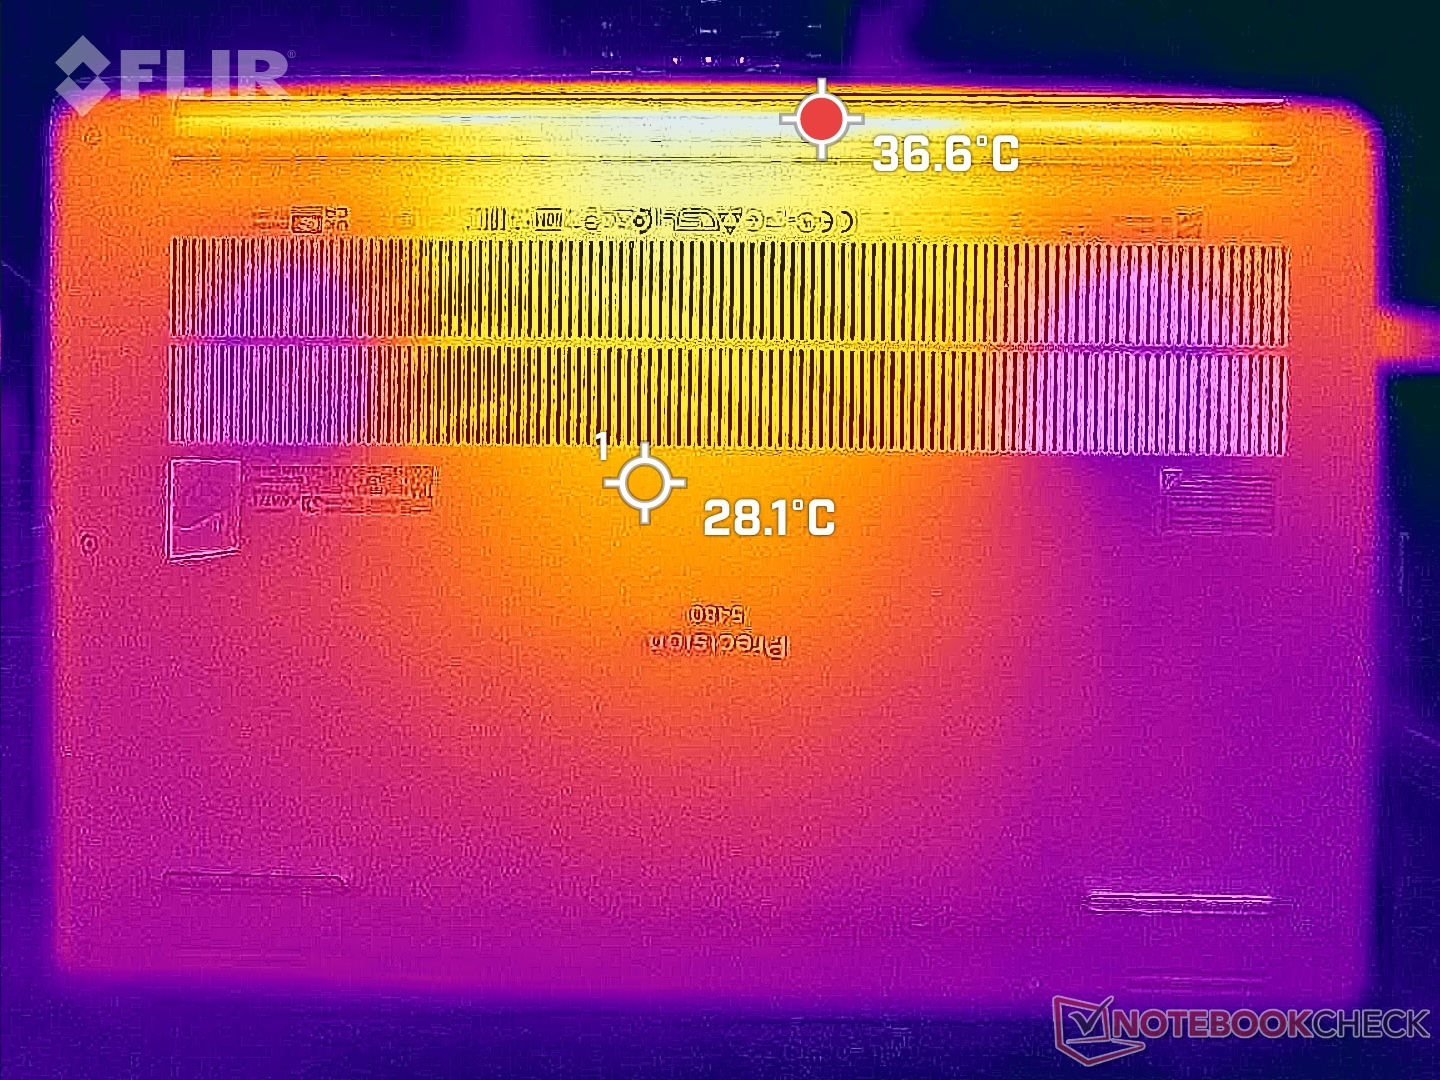
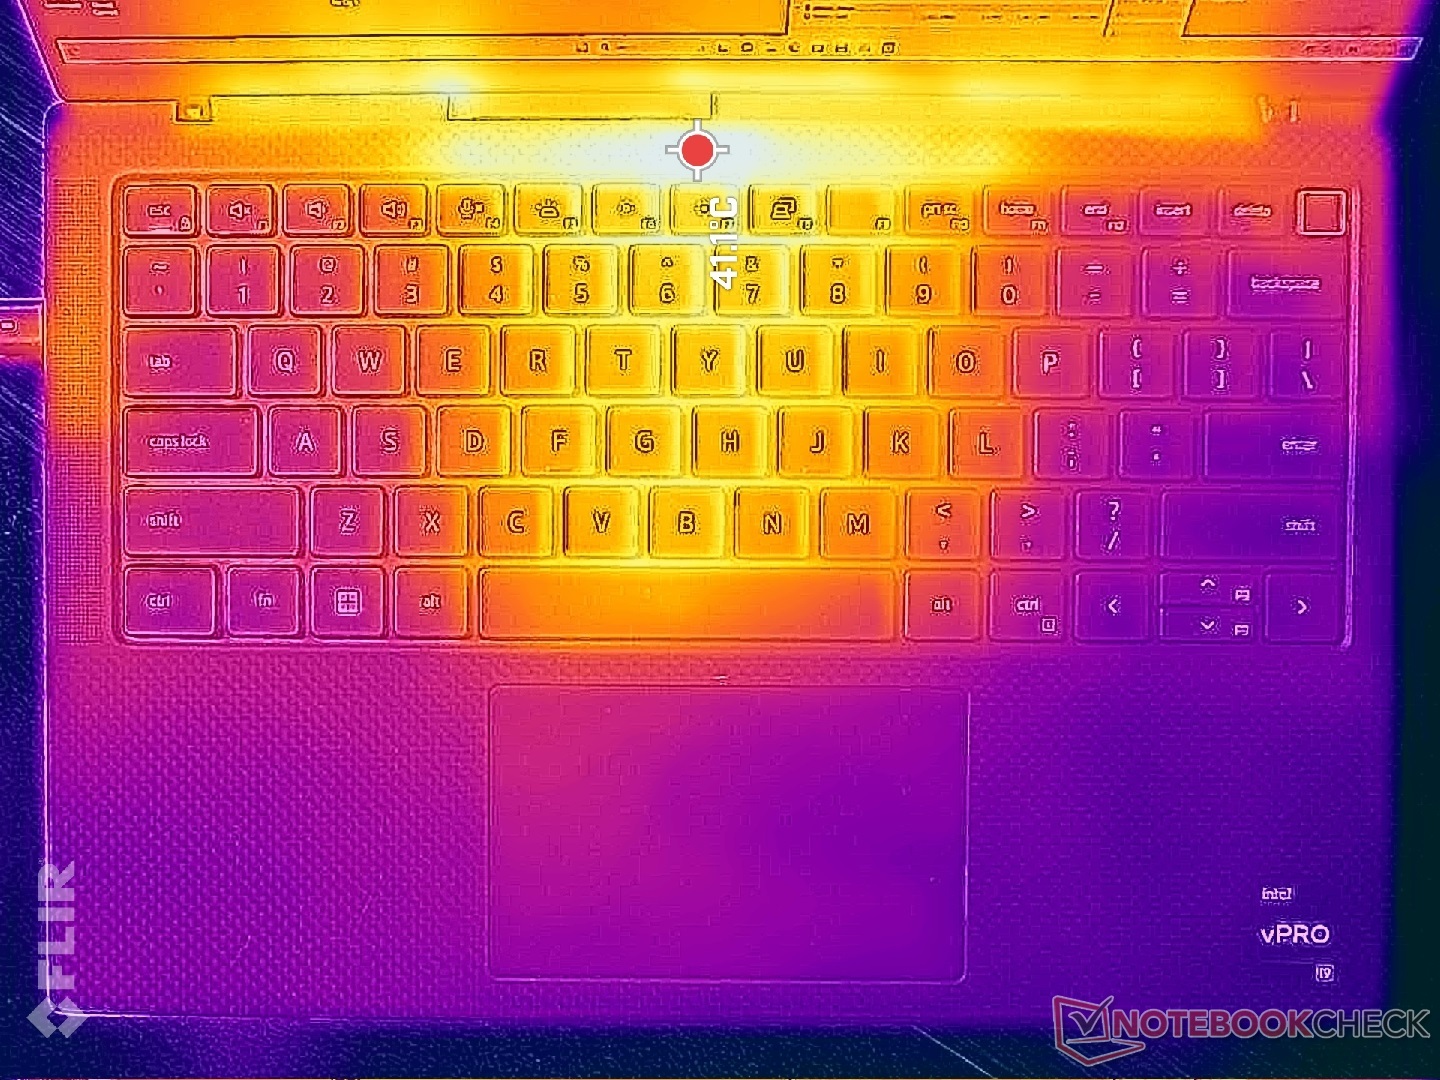
Yttemperaturen är varmare än vanligt nära enhetens mitt vid tomgångskörning på skrivbordet på grund av de inerta fläktarna. Kostnaden för tystnad när man kör enkla belastningar är alltså varma yttemperaturer som kanske eller kanske inte stör vissa användare.
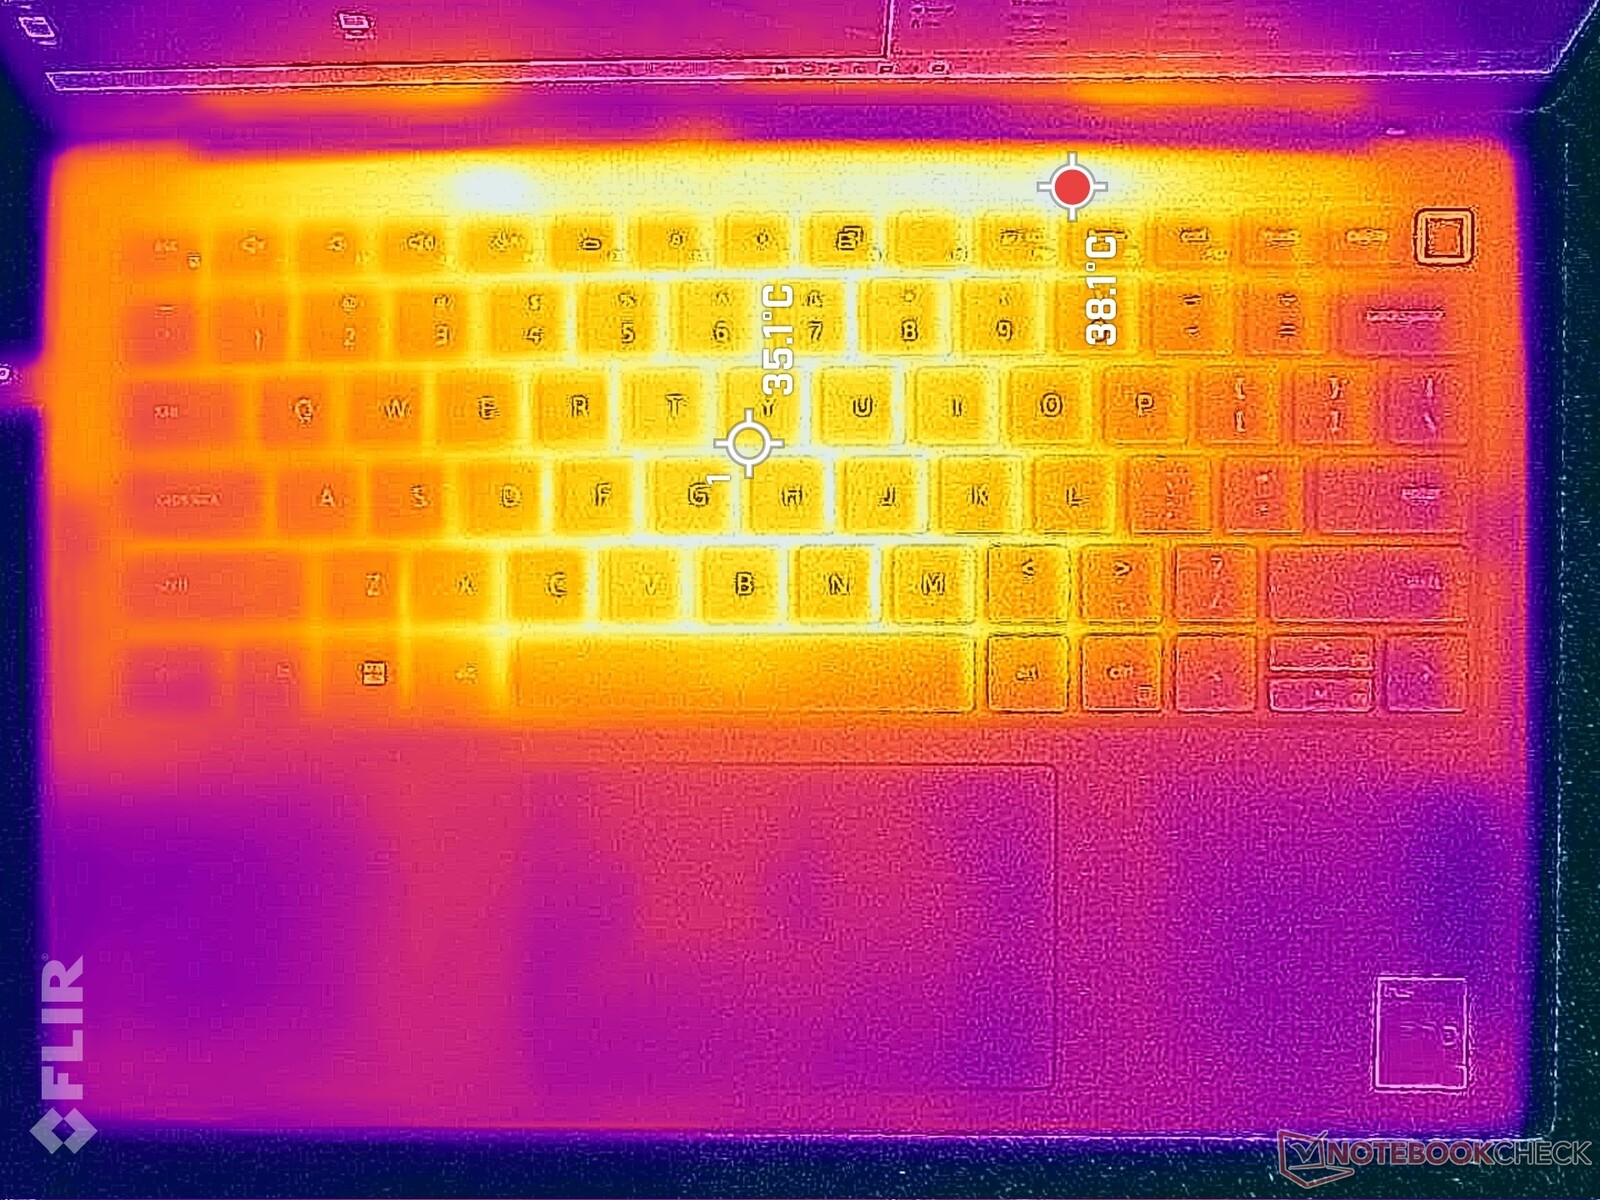
Hot spots kan nå över 40 C på chassits ovansida och undersida när Prime95 och FurMark körs samtidigt. De är koncentrerade nära enhetens baksida och kolfiberhandledsstöden är fortfarande bekväma att ta på, men det mesta av metallbotten kommer att bli mycket varm.
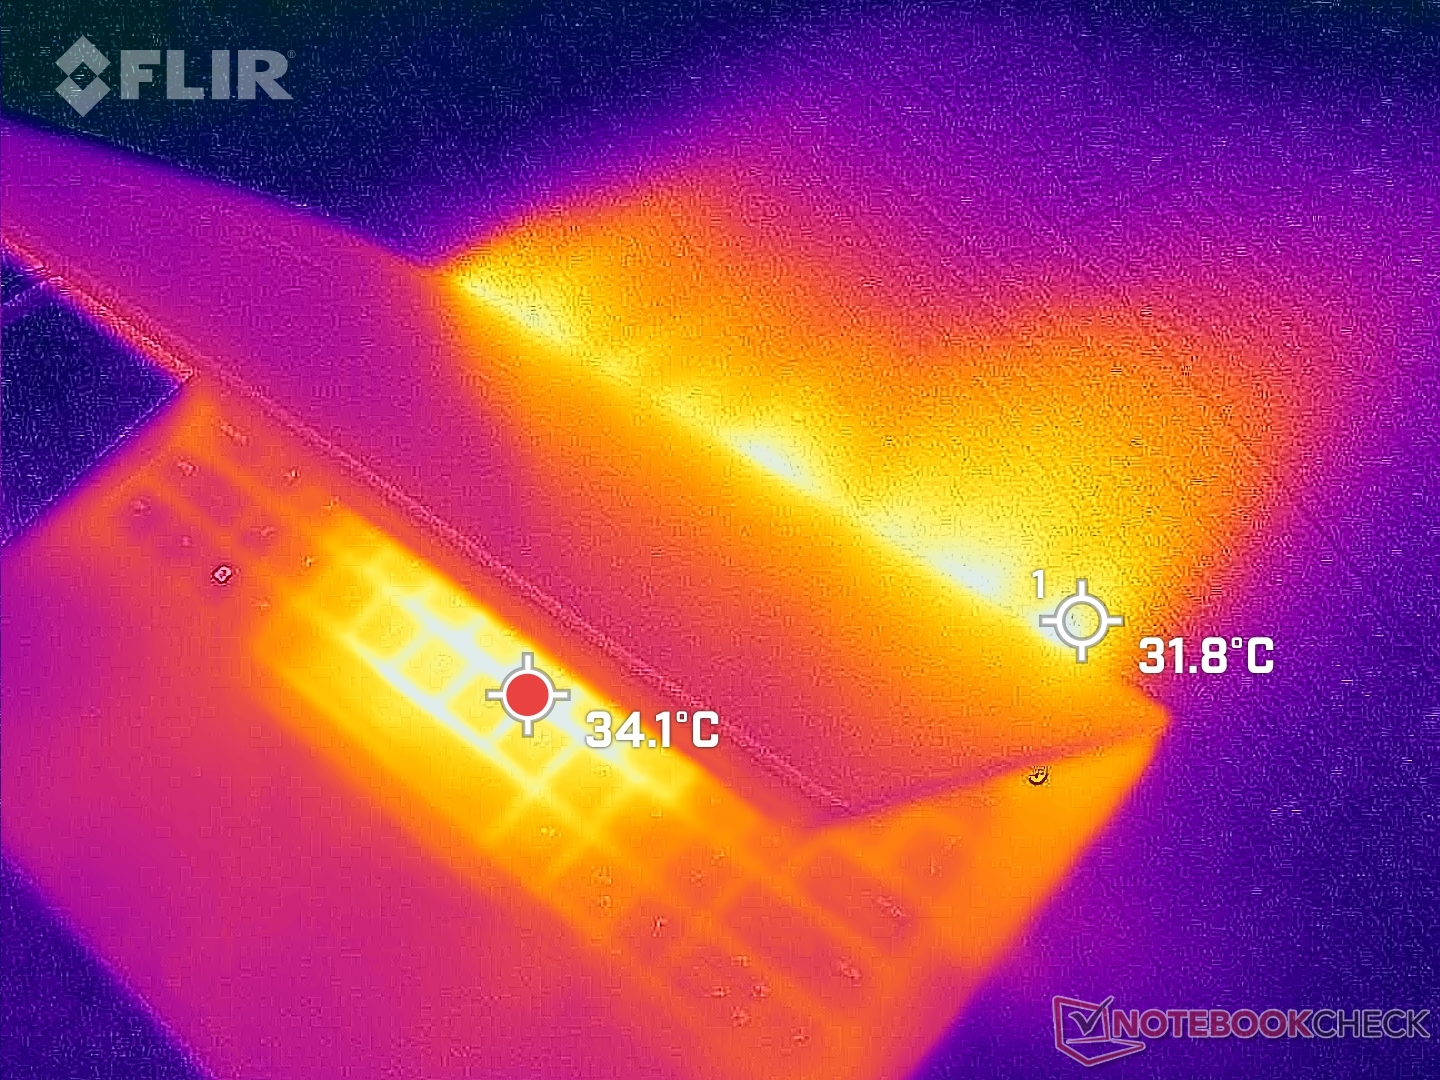
(±) Den maximala temperaturen på ovansidan är 44 °C / 111 F, jämfört med genomsnittet av 38.2 °C / 101 F , allt från 22.2 till 69.8 °C för klassen Workstation.
(+) Botten värms upp till maximalt 38.2 °C / 101 F, jämfört med genomsnittet av 41.1 °C / 106 F
(±) Vid tomgångsbruk är medeltemperaturen för ovansidan 34.2 °C / 94 F, jämfört med enhetsgenomsnittet på 32 °C / ### class_avg_f### F.
(±) När du spelar The Witcher 3 är medeltemperaturen för ovansidan 32 °C / 90 F, jämfört med enhetsgenomsnittet på 32 °C / ## #class_avg_f### F.
(+) Handledsstöden och pekplattan är kallare än hudtemperaturen med maximalt 29.6 °C / 85.3 F och är därför svala att ta på.
(±) Medeltemperaturen för handledsstödsområdet på liknande enheter var 27.8 °C / 82 F (-1.8 °C / -3.3 F).
| Dell Precision 5480 Intel Core i9-13900H, NVIDIA RTX 3000 Ada Generation Laptop | Dell Precision 5000 5470 Intel Core i9-12900H, NVIDIA RTX A1000 Laptop GPU | Dell Precision 5000 5560 Intel Core i7-11850H, NVIDIA RTX A2000 Laptop GPU | Lenovo ThinkPad P14s G3 AMD 21J6S05000 AMD Ryzen 7 PRO 6850U, AMD Radeon 680M | Lenovo ThinkPad P15v G3 21EM001AGE AMD Ryzen 7 PRO 6850H, NVIDIA RTX A2000 Laptop GPU | HP ZBook Firefly 14 G9-6B8A2EA Intel Core i7-1265U, NVIDIA T550 Laptop GPU | |
|---|---|---|---|---|---|---|
| Heat | 9% | -1% | 14% | 7% | 11% | |
| Maximum Upper Side * (°C) | 44 | 41.8 5% | 48.2 -10% | 42.7 3% | 48.7 -11% | 41.2 6% |
| Maximum Bottom * (°C) | 38.2 | 36 6% | 42.6 -12% | 43.1 -13% | 50.5 -32% | 47.9 -25% |
| Idle Upper Side * (°C) | 38.8 | 34.6 11% | 34.8 10% | 25.7 34% | 25 36% | 26.5 32% |
| Idle Bottom * (°C) | 38.6 | 33.6 13% | 35.2 9% | 26.4 32% | 25.4 34% | 27 30% |
* ... mindre är bättre
Stresstest
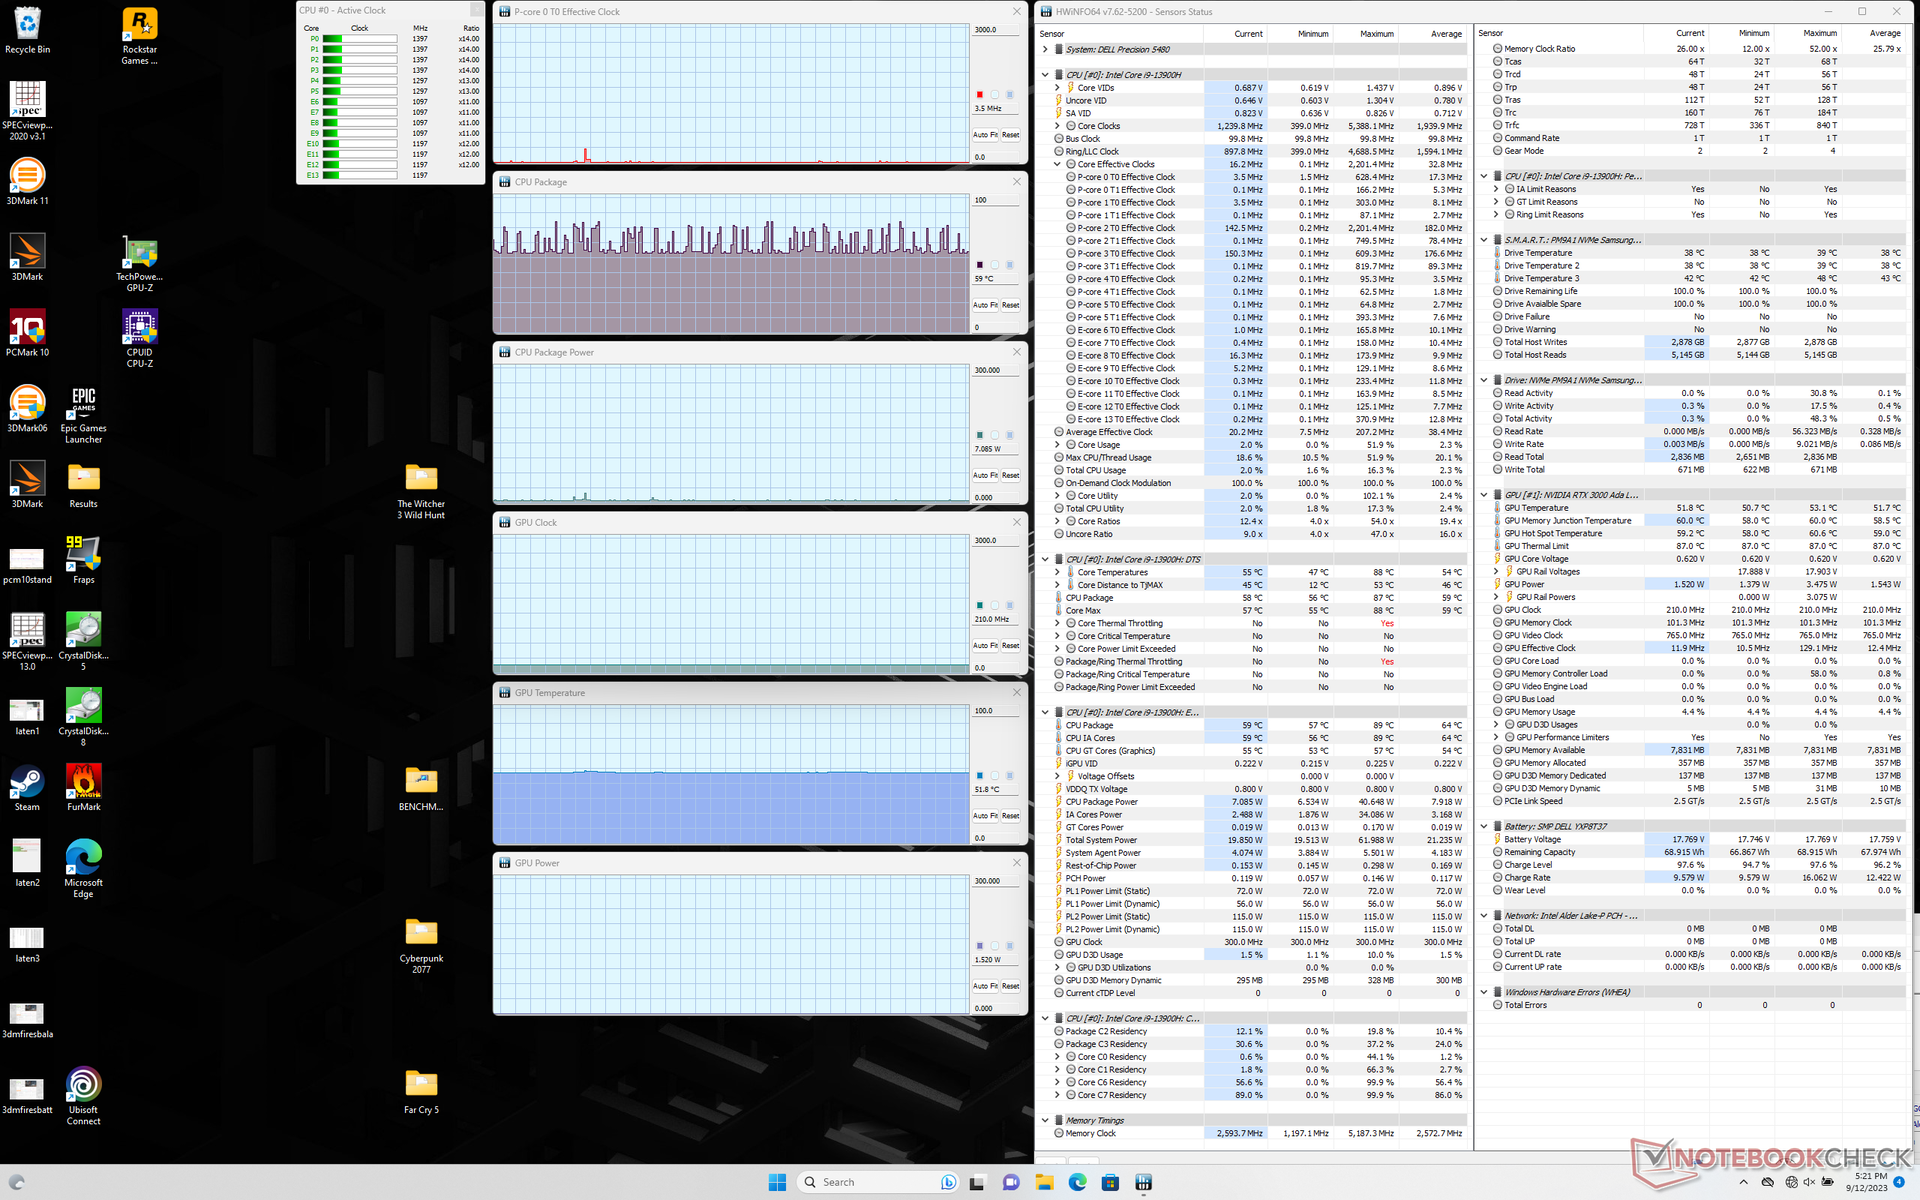
När vi körde Prime95 stress, skulle CPU:n öka till 3,4 GHz, 88 W och 100 C under bara ett par minuter. Till slut stabiliseras den på cirka 2,4 GHz och 51 W för att hålla en något svalare men mer hanterbar kärntemperatur på 93 C. Maximal Turbo Boost är därför inte obegränsad men ändå ganska bra med tanke på den lilla 14-tums formfaktorn.
CPU och GPU stabiliseras på runt 64 C vardera när Witcher 3 körs för att representera hög belastning. Intressant nog ändrades inte detta när man växlade mellan lägena Balanserad och Prestanda, vilket tyder på att läget Balanserad bör vara tillräckligt för de flesta typer av arbetsbelastningar. Observera att GPU-kortets strömförbrukning är högre, cirka 45 W till 50 W jämfört med bara 36 W på förra årets Precision 5470. Kärntemperaturerna skulle ändå vara svalare än på förra årets modell under liknande spelbelastningar.
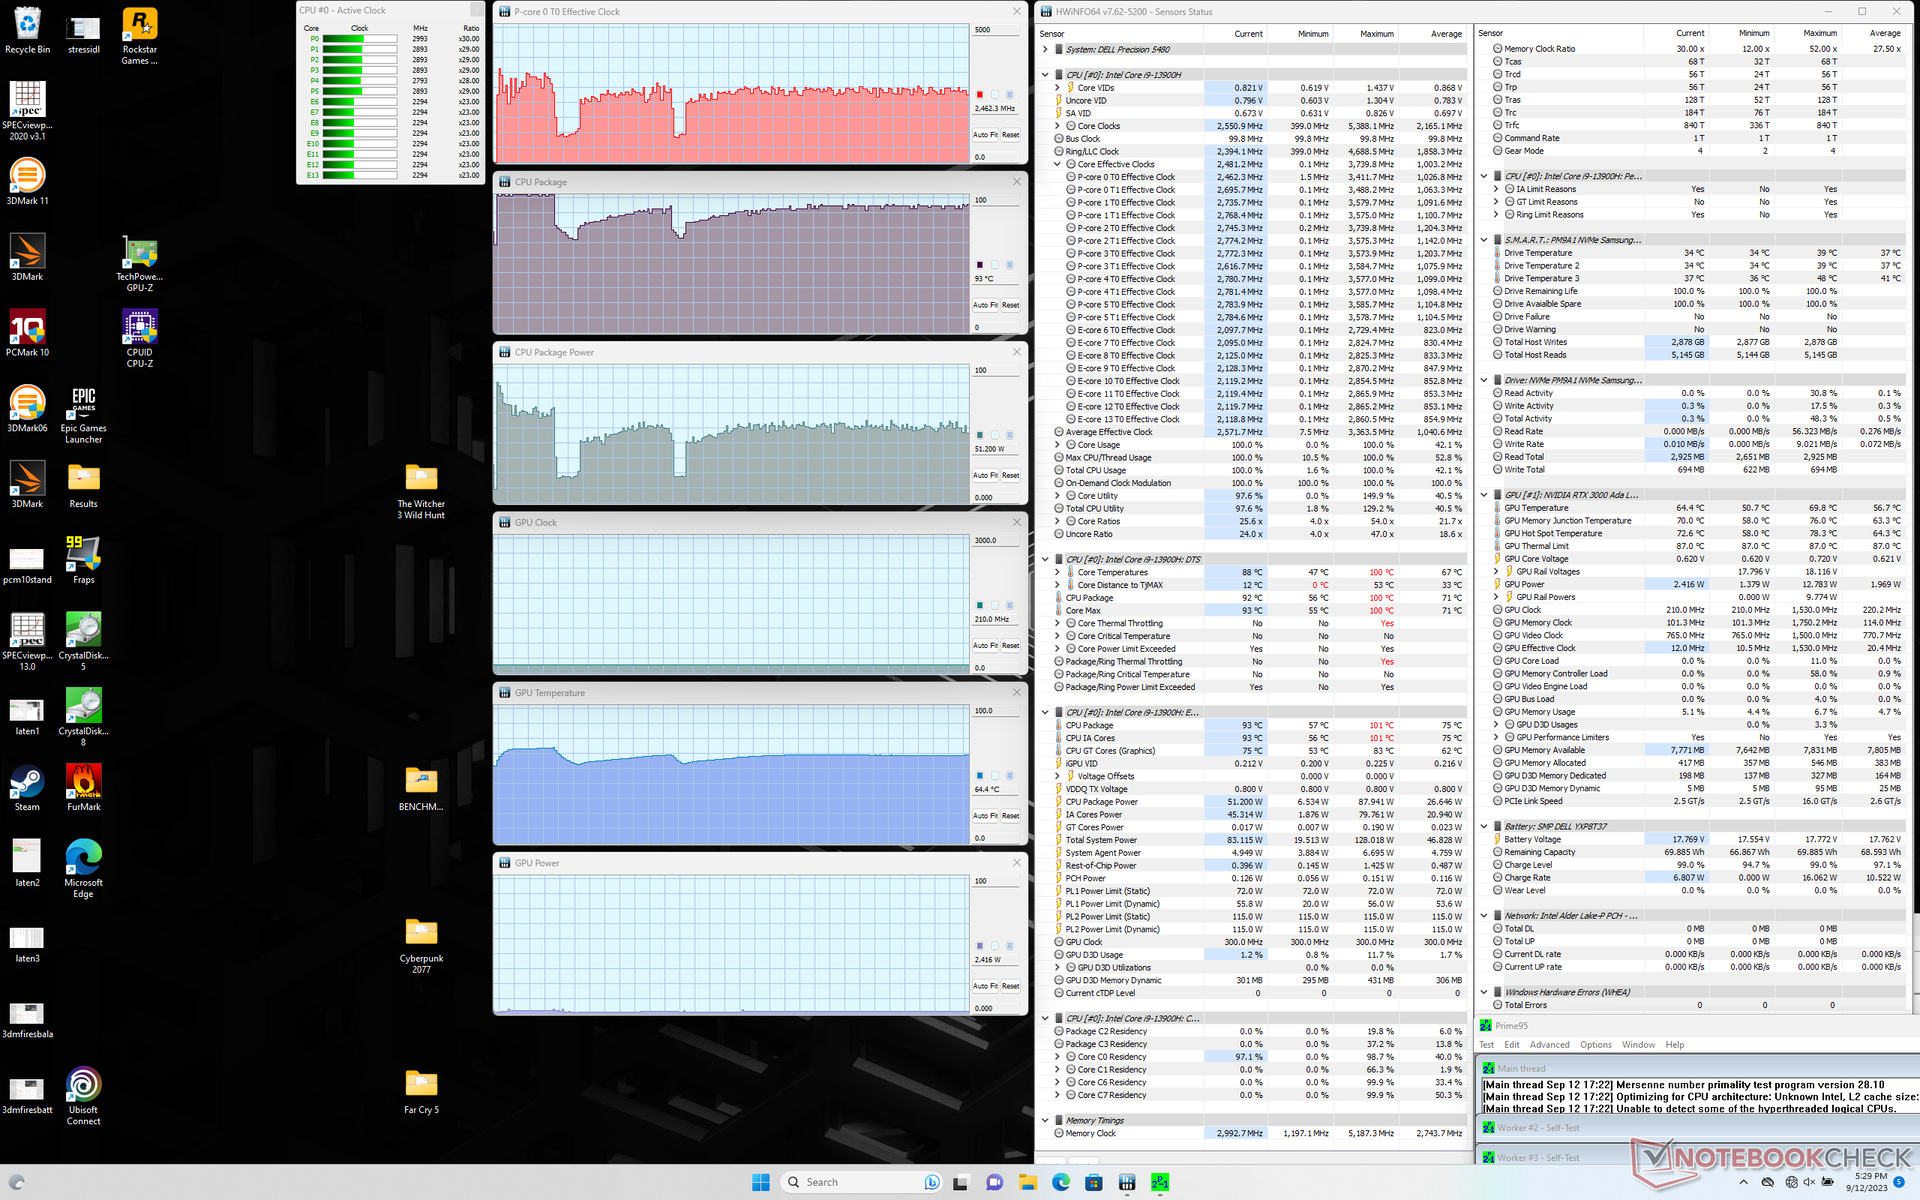
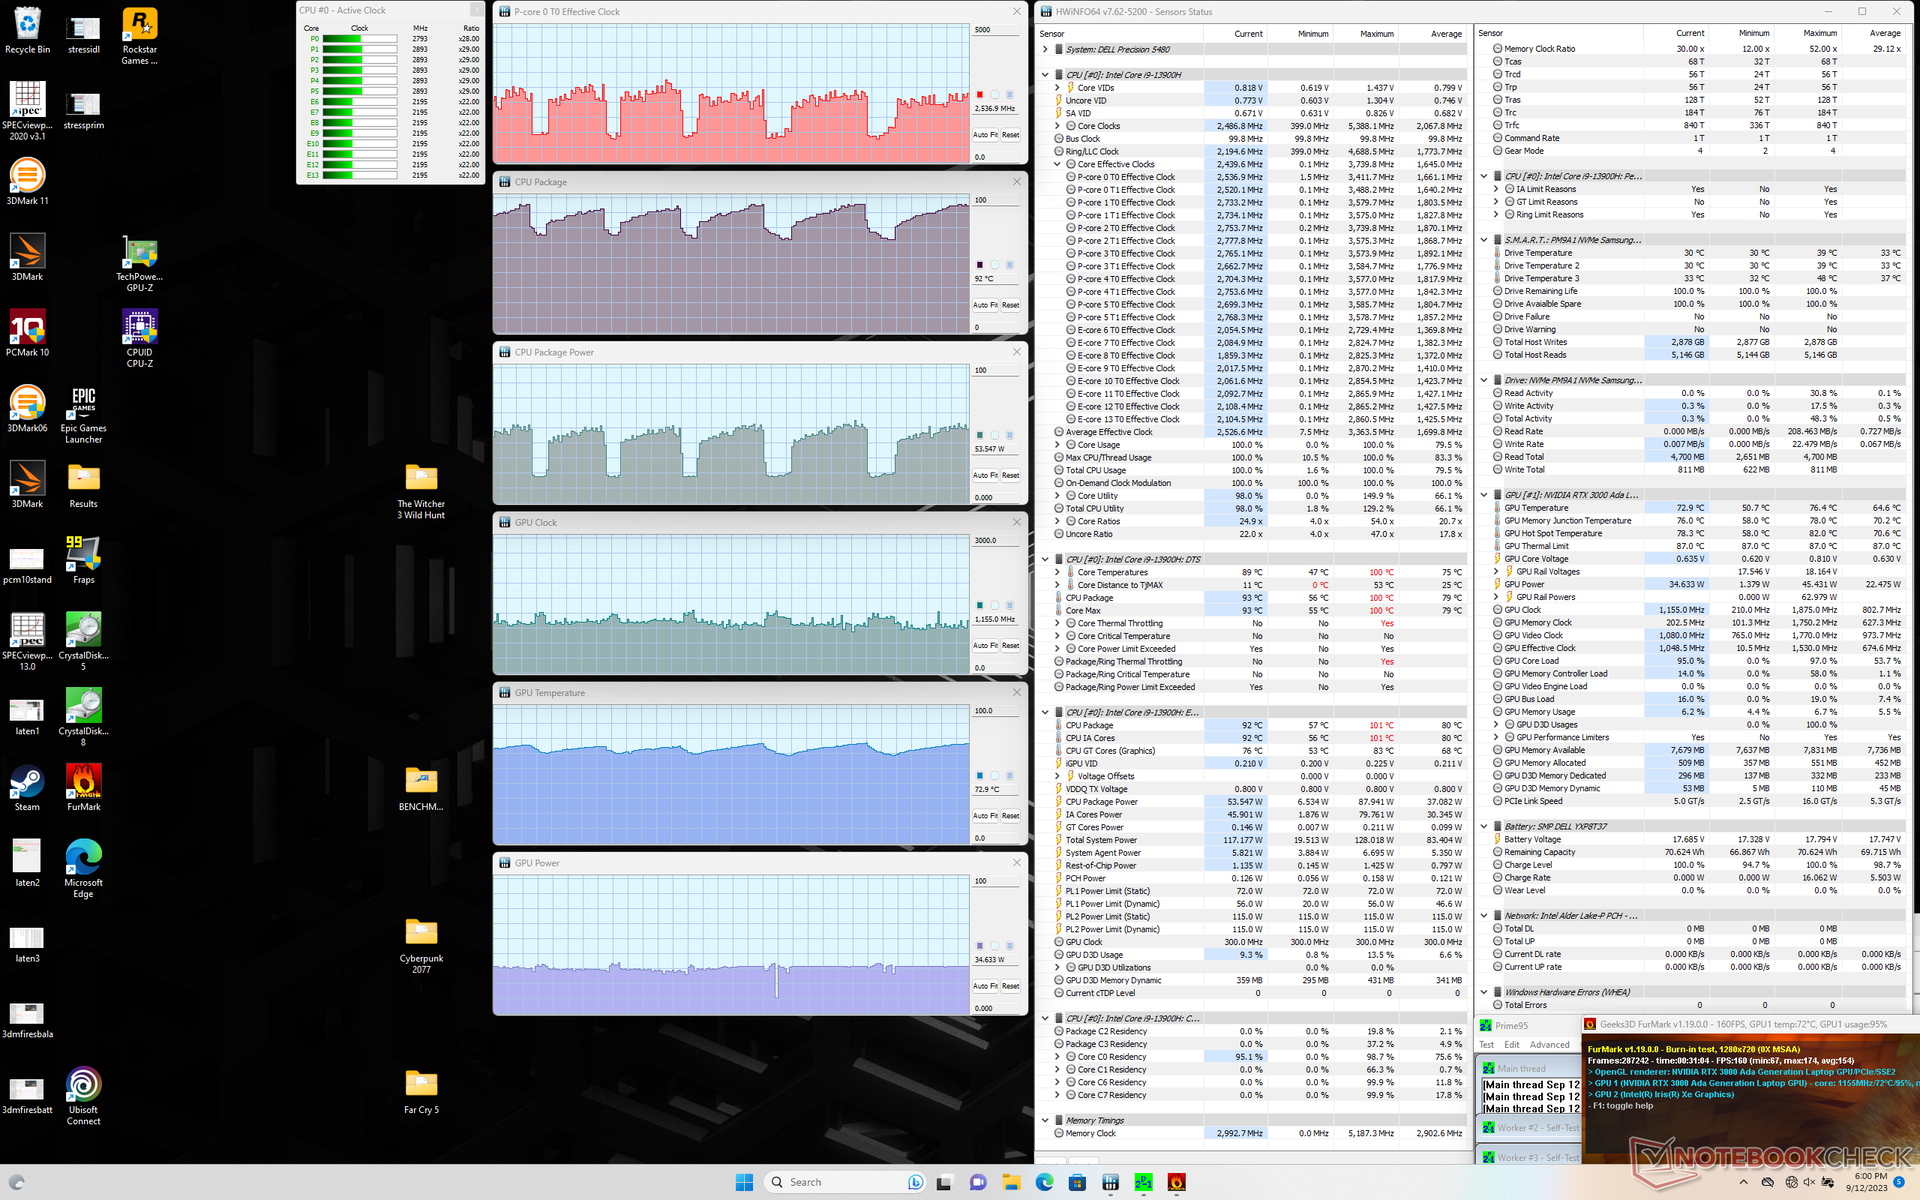
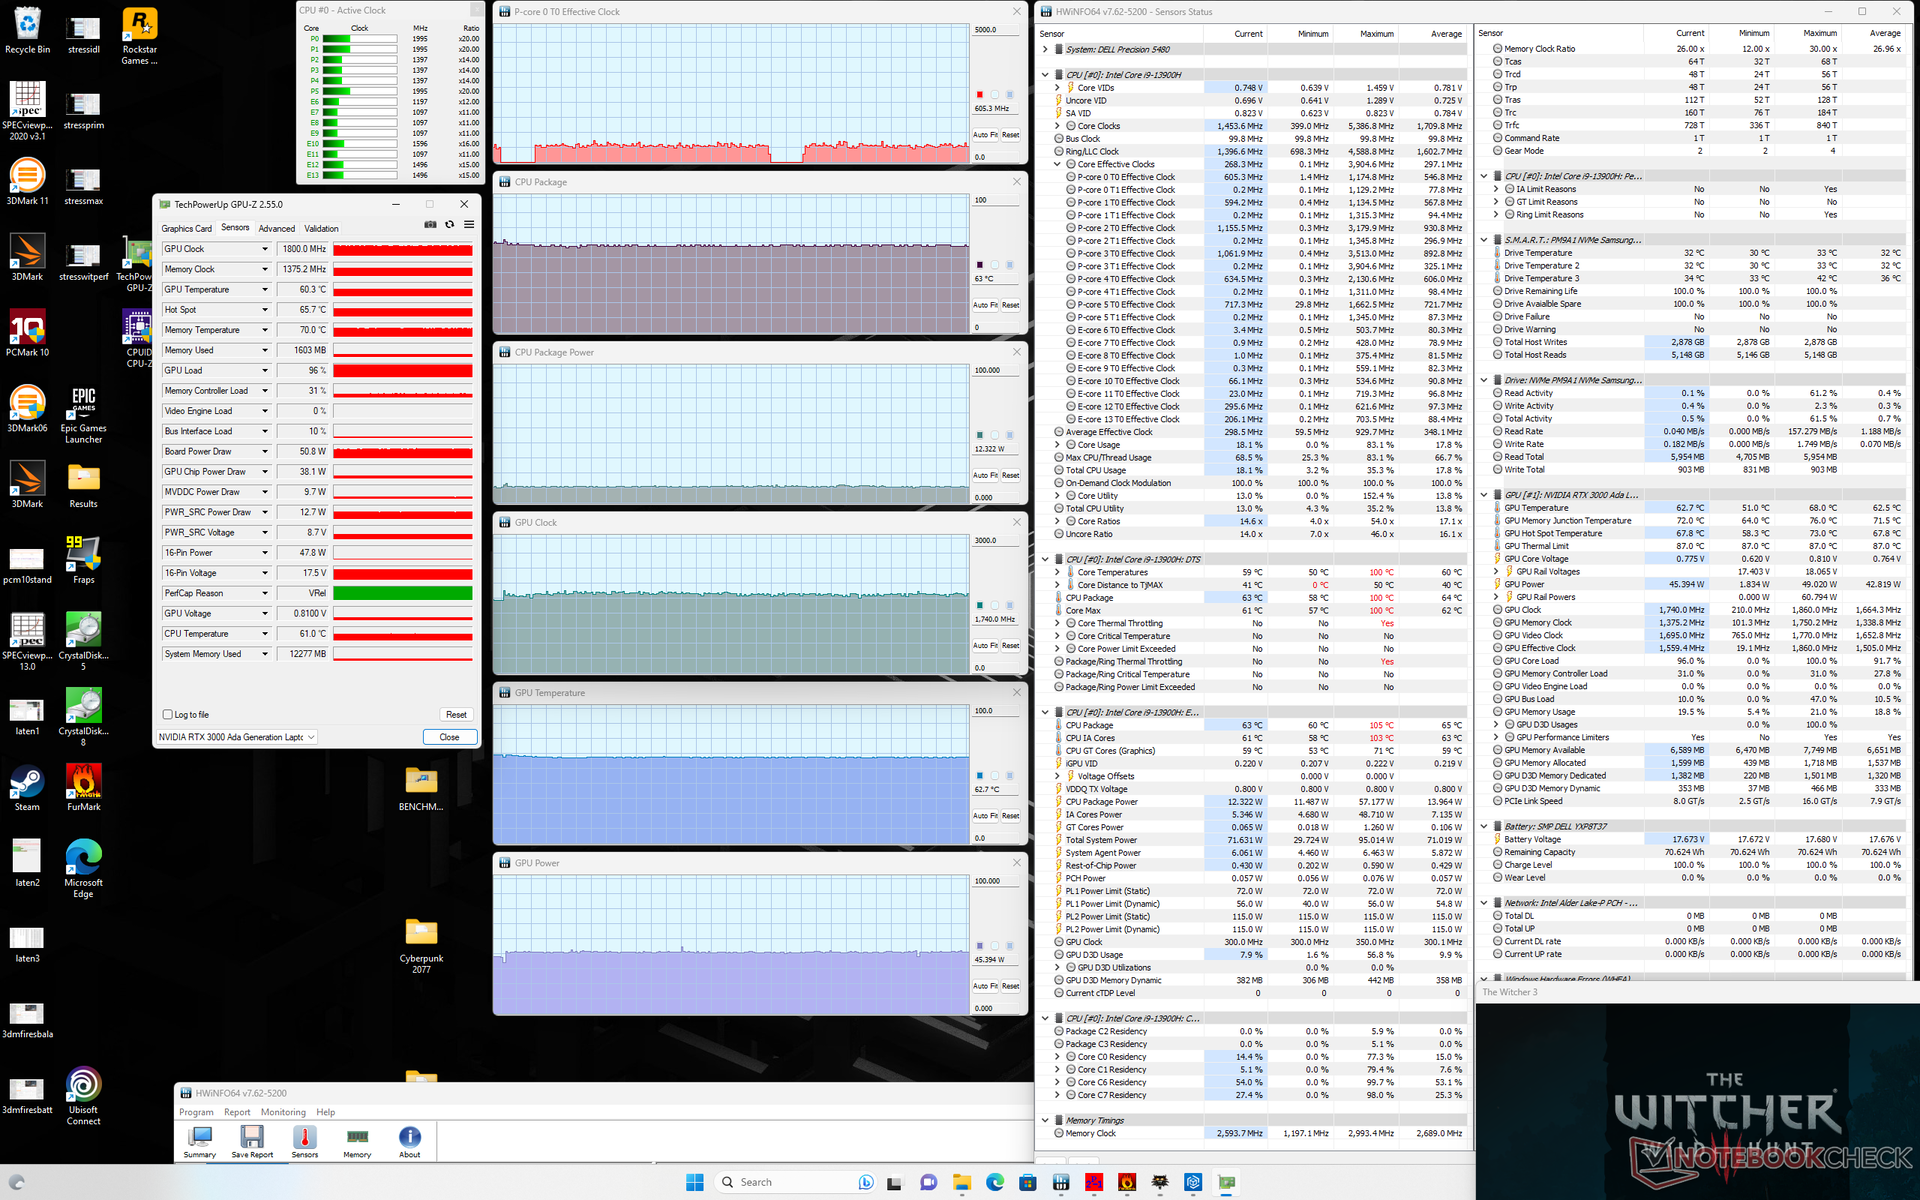
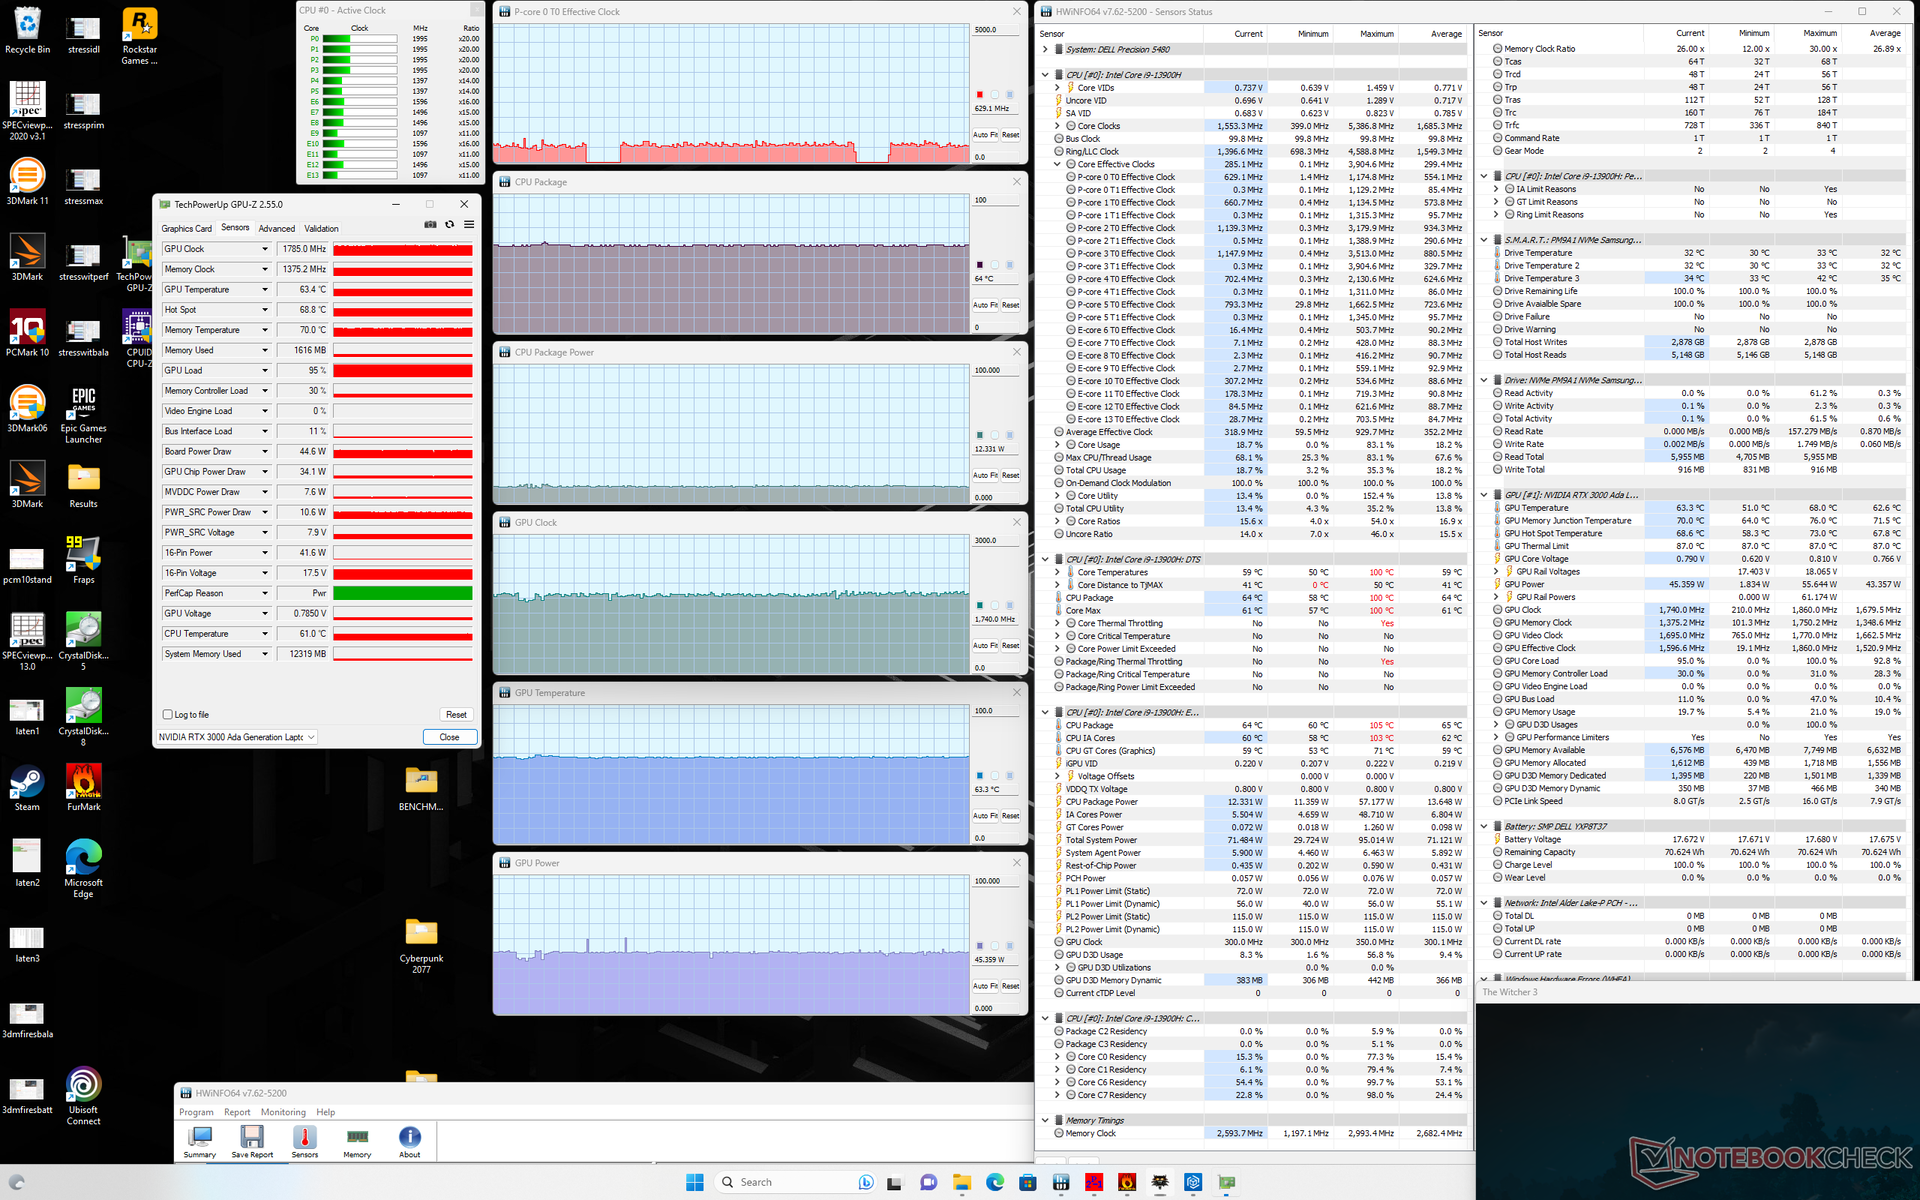
| CPU-klocka (GHz) | GPU-klocka (MHz) | Genomsnittlig CPU-temperatur (°C) | Genomsnittlig GPU-temperatur (°C) | |
| System i viloläge | -- | -- | 59 | 52 |
| Prime95 Stress | 2.5 | -- | 93 | 65 |
| Prime95 + FurMark Stress | 1.0 - 2.6 | 1155 | 69 - 92 | 66 - 73 |
| Witcher 3 Stress (balanserat läge) | 0,6 | 1740 | 63 | 63 |
| Witcher 3 Stress (Performance mode) | 0,6 | 1740 | 64 | 63 |
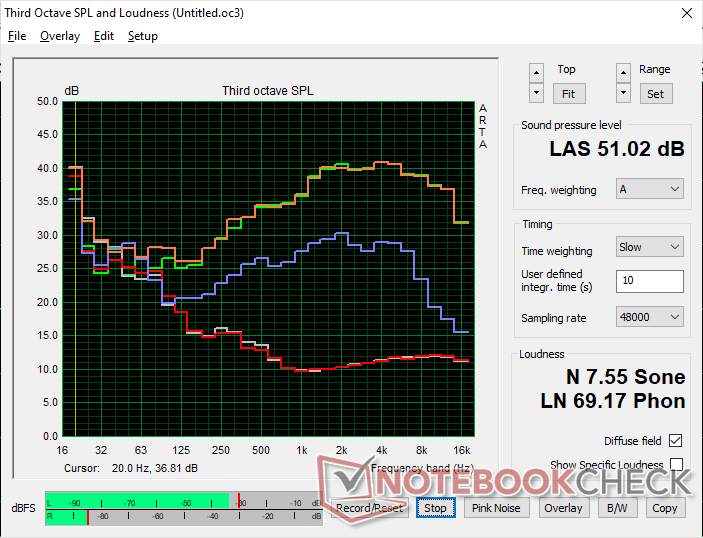
Högtalare
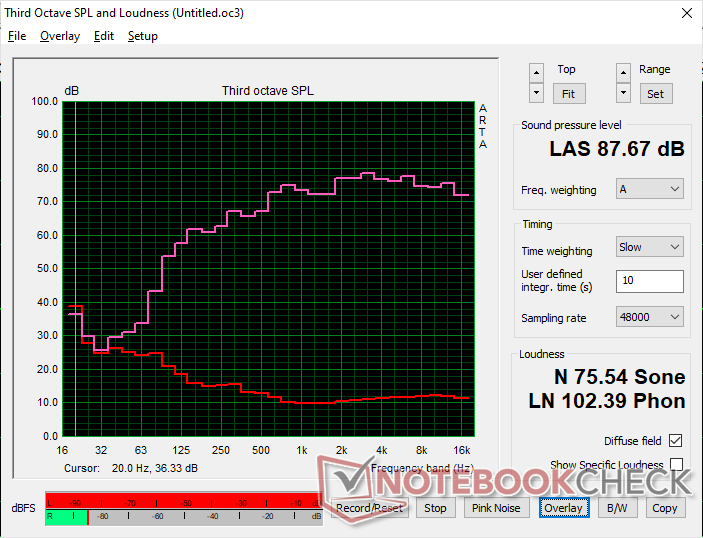
Dell Precision 5480 ljudanalys
(+) | högtalare kan spela relativt högt (87.7 dB)
Bas 100 - 315 Hz
(±) | reducerad bas - i genomsnitt 12.9% lägre än medianen
(±) | linjäriteten för basen är genomsnittlig (7% delta till föregående frekvens)
Mellan 400 - 2000 Hz
(+) | balanserad mellan - endast 2.8% från medianen
(+) | mids är linjära (3.6% delta till föregående frekvens)
Högsta 2 - 16 kHz
(+) | balanserade toppar - endast 2.9% från medianen
(+) | toppar är linjära (2% delta till föregående frekvens)
Totalt 100 - 16 000 Hz
(+) | det totala ljudet är linjärt (9% skillnad mot median)
Jämfört med samma klass
» 4% av alla testade enheter i den här klassen var bättre, 2% liknande, 94% sämre
» Den bästa hade ett delta på 7%, genomsnittet var 17%, sämst var 35%
Jämfört med alla testade enheter
» 3% av alla testade enheter var bättre, 1% liknande, 96% sämre
» Den bästa hade ett delta på 4%, genomsnittet var 23%, sämst var 134%
Apple MacBook Pro 16 2021 M1 Pro ljudanalys
(+) | högtalare kan spela relativt högt (84.7 dB)
Bas 100 - 315 Hz
(+) | bra bas - bara 3.8% från medianen
(+) | basen är linjär (5.2% delta till föregående frekvens)
Mellan 400 - 2000 Hz
(+) | balanserad mellan - endast 1.3% från medianen
(+) | mids är linjära (2.1% delta till föregående frekvens)
Högsta 2 - 16 kHz
(+) | balanserade toppar - endast 1.9% från medianen
(+) | toppar är linjära (2.7% delta till föregående frekvens)
Totalt 100 - 16 000 Hz
(+) | det totala ljudet är linjärt (4.6% skillnad mot median)
Jämfört med samma klass
» 0% av alla testade enheter i den här klassen var bättre, 0% liknande, 100% sämre
» Den bästa hade ett delta på 5%, genomsnittet var 17%, sämst var 45%
Jämfört med alla testade enheter
» 0% av alla testade enheter var bättre, 0% liknande, 100% sämre
» Den bästa hade ett delta på 4%, genomsnittet var 23%, sämst var 134%
Energiförvaltning
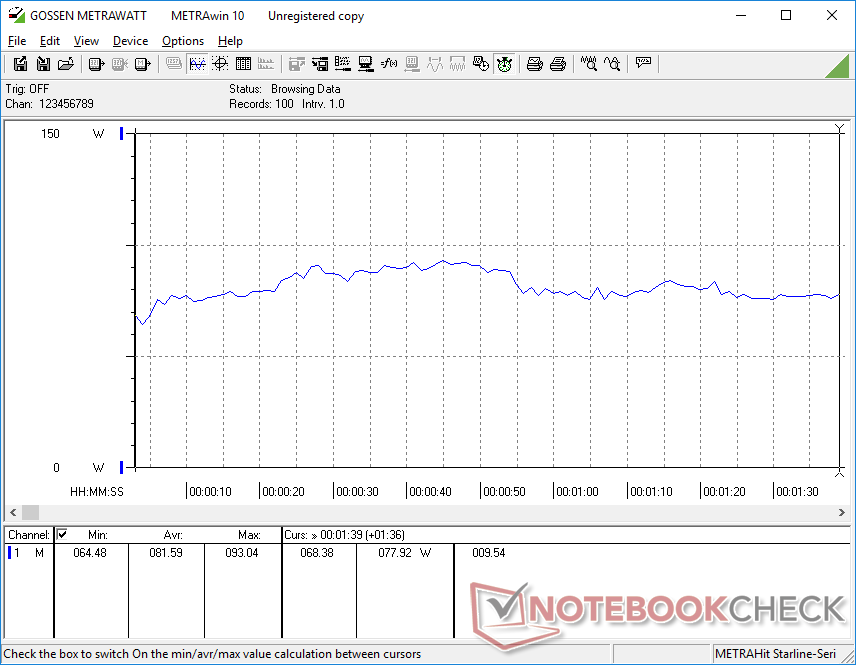
Strömförbrukning
Precision 5480 är mer krävande än den utgående Precision 5470 vid krävande belastningar. Witcher 3 prime95, till exempel, skulle dra cirka 90 W jämfört med 83 W på förra årets modell, men den lilla förbrukningsökningen överskuggas av den betydande prestandaförbättringen som noterades ovan.
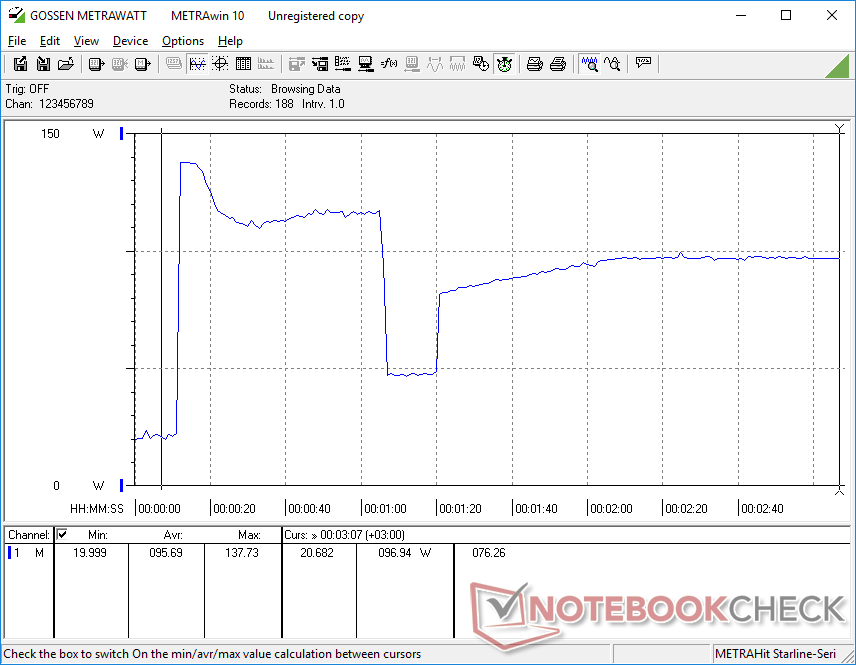
Intressant nog skulle strömförbrukningen vid körning av Prime95 vara över 2x högre än på förra årets modell (98 W vs. 42 W) efter att hänsyn tagits till all prestandastrypning, vilket framgår av diagrammen nedan. Den årliga ökningen av processorprestanda kommer därför till ett mycket högre pris jämfört med ökningen av grafikprestanda.
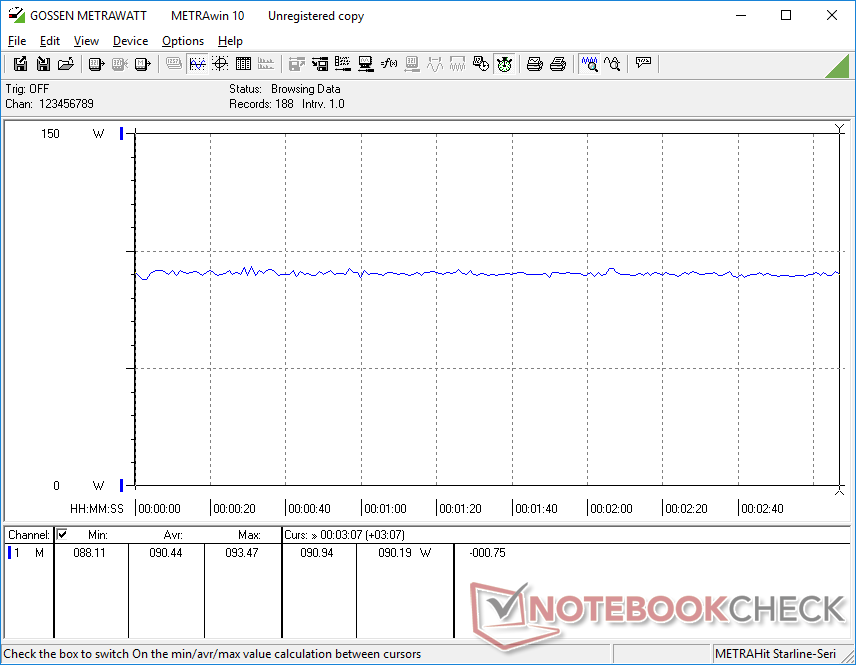
Det är också värt att nämna att vår enhet drog mer ström än förväntat när den bara gick på tomgång på skrivbordet utan några applikationer igång, vilket delvis kan vara orsaken till de generellt varmare yttemperaturerna som nämndes tidigare.
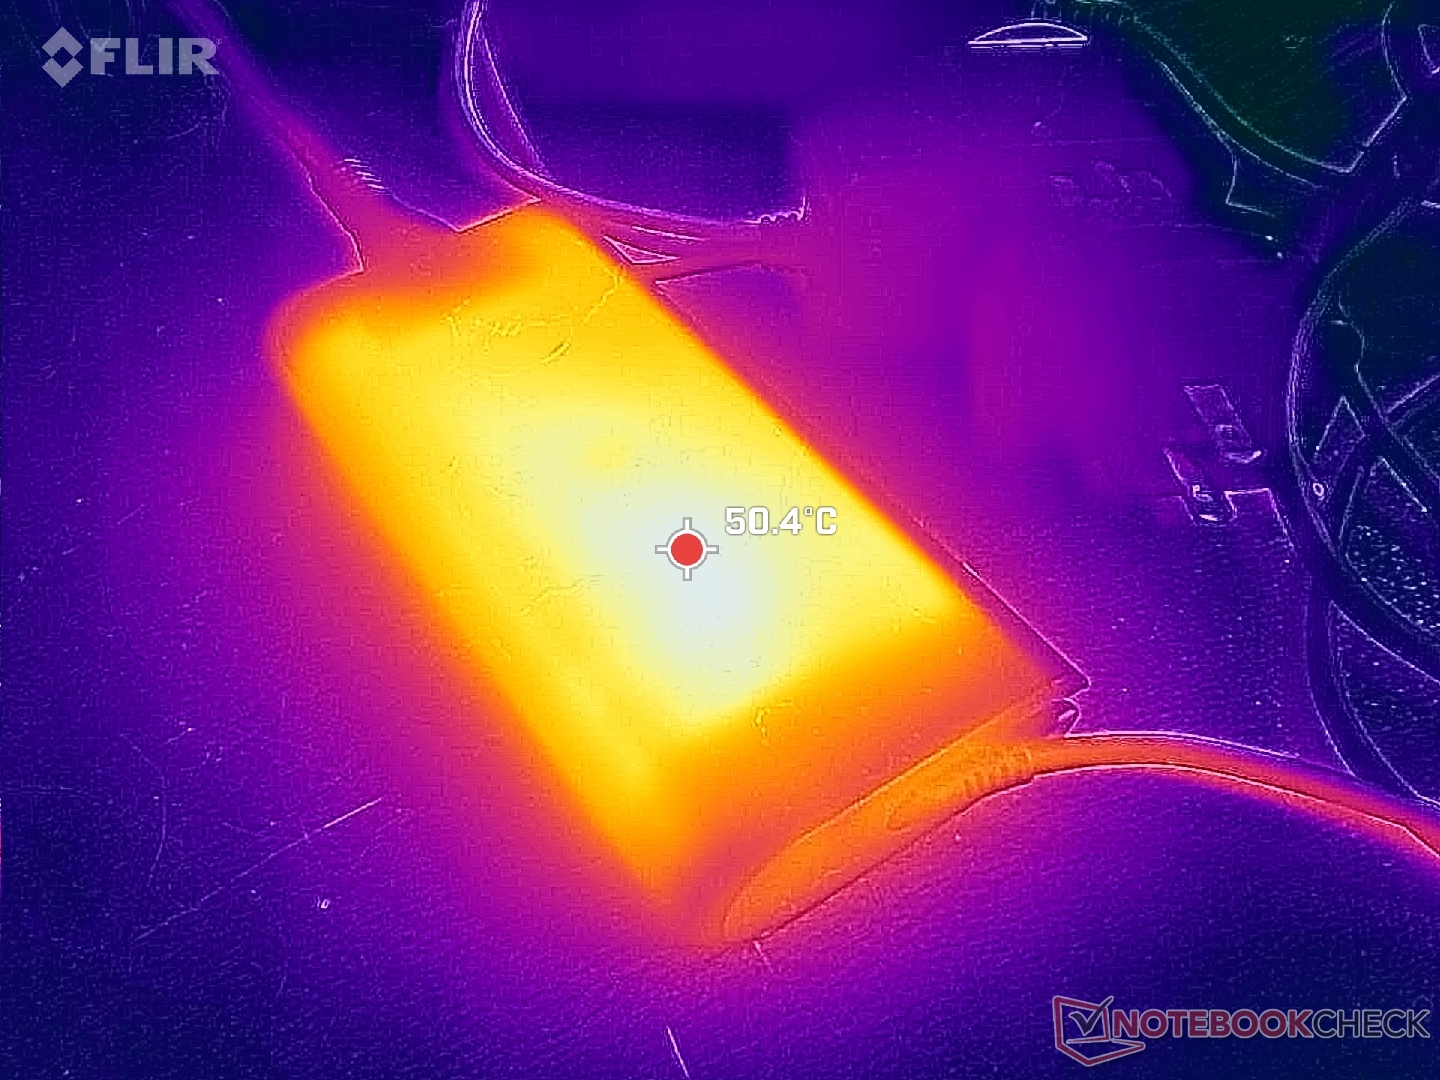
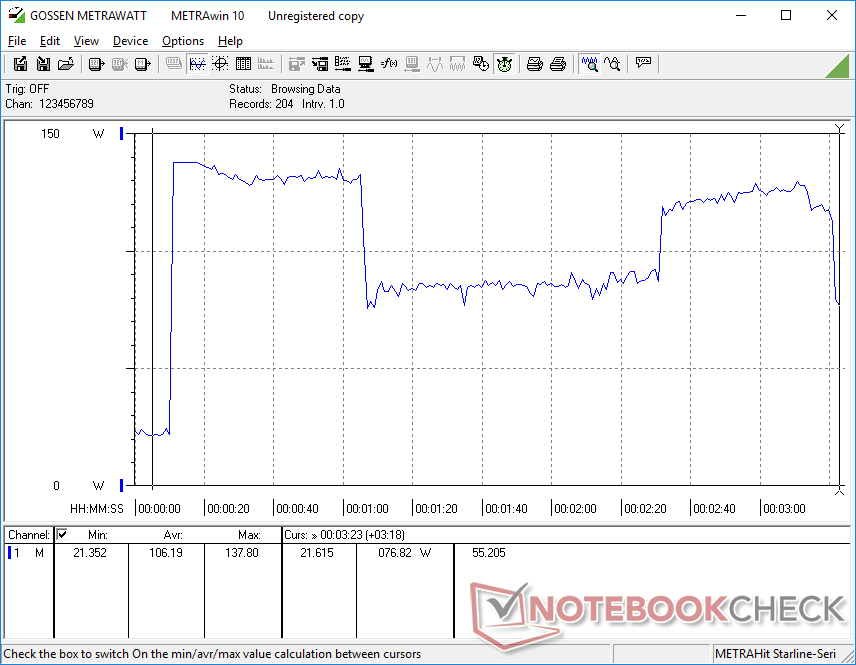
Vi kunde mäta en tillfällig maximal förbrukning på 138 W från den lilla-medium (~14,3 x 6,5 x 2,1 cm) 130 W USB-C AC-adaptern när CPU och GPU är fullt belastade. Denna höga förbrukningshastighet är inte konsekvent eftersom den växlar mellan 76 W och 138 W varje minut eller så, vilket framgår av diagrammet nedan som korrelerar med de cykliska klockfrekvenserna.
| Av/Standby | |
| Låg belastning | |
| Hög belastning |
|
Förklaring:
min: | |
| Dell Precision 5480 i9-13900H, RTX 3000 Ada Generation Laptop, Samsung PM9A1 MZVL21T0HCLR, IPS, 2560x1600, 14" | Dell Precision 5000 5470 i9-12900H, RTX A1000 Laptop GPU, Samsung PM9A1 MZVL21T0HCLR, IPS, 2560x1600, 14" | Dell Precision 5000 5560 i7-11850H, RTX A2000 Laptop GPU, Samsung PM9A1 MZVL22T0HBLB, IPS, 3840x2400, 15.6" | Lenovo ThinkPad P14s G3 AMD 21J6S05000 R7 PRO 6850U, Radeon 680M, Samsung PM9A1 MZVL21T0HCLR, IPS LED, 1920x1200, 14" | Lenovo ThinkPad P15v G3 21EM001AGE R7 PRO 6850H, RTX A2000 Laptop GPU, SK Hynix PC711 1TB HFS001TDE9X081N, IPS LED, 3840x2160, 15.6" | HP ZBook Firefly 14 G9-6B8A2EA i7-1265U, T550 Laptop GPU, Micron 3400 1TB MTFDKBA1T0TFH, IPS, 1920x1200, 14" | |
|---|---|---|---|---|---|---|
| Power Consumption | 25% | 15% | 63% | 24% | 60% | |
| Idle Minimum * (Watt) | 14.9 | 4.3 71% | 6.2 58% | 2.6 83% | 6.3 58% | 4.2 72% |
| Idle Average * (Watt) | 19.5 | 8.9 54% | 13.9 29% | 5 74% | 13.9 29% | 6.5 67% |
| Idle Maximum * (Watt) | 27.2 | 18.9 31% | 23.8 12% | 5.6 79% | 14.5 47% | 7.2 74% |
| Load Average * (Watt) | 81.6 | 94 -15% | 95.7 -17% | 49.7 39% | 82.8 -1% | 47.7 42% |
| Witcher 3 ultra * (Watt) | 90.4 | 83.2 8% | 87 4% | 50.6 44% | 88.8 2% | 42.9 53% |
| Load Maximum * (Watt) | 137.8 | 137.5 -0% | 132.6 4% | 61.1 56% | 124.8 9% | 68.2 51% |
* ... mindre är bättre
Power Consumption Witcher 3 / Stresstest
Power Consumption external Monitor
Batteritid
WLAN-körtiden är något längre än på förra årets modell med cirka 1 till 2 timmar, vilket är ganska bra med tanke på prestandafördelarna från år till år. Under tiden tar laddning från tom till full kapacitet lite mer än 2 timmar.
| Dell Precision 5480 i9-13900H, RTX 3000 Ada Generation Laptop, 72 Wh | Dell Precision 5000 5470 i9-12900H, RTX A1000 Laptop GPU, 72 Wh | Dell Precision 5000 5560 i7-11850H, RTX A2000 Laptop GPU, 86 Wh | Lenovo ThinkPad P14s G3 AMD 21J6S05000 R7 PRO 6850U, Radeon 680M, 52.5 Wh | Lenovo ThinkPad P15v G3 21EM001AGE R7 PRO 6850H, RTX A2000 Laptop GPU, 68 Wh | HP ZBook Firefly 14 G9-6B8A2EA i7-1265U, T550 Laptop GPU, 51 Wh | |
|---|---|---|---|---|---|---|
| Batteridrifttid | 5% | 29% | 17% | 32% | -19% | |
| WiFi v1.3 (h) | 10.9 | 9.6 -12% | 6.3 -42% | 12.2 12% | 6.9 -37% | 8.8 -19% |
| Load (h) | 0.9 | 1.1 22% | 1.8 100% | 1.1 22% | 1.8 100% | |
| Reader / Idle (h) | 14.7 | 12 | ||||
| H.264 (h) | 12 | 10.7 |
För
Emot
Dom - RTX 3000 Ada imponerar
Precision 5480 är en intern förfining av förra årets Precision 5470. CPU-prestandan är snabbare och stabilare än tidigare medan Ada GPU är den verkliga stjärnan och det största skälet att köpa Precision 5480 framför den äldre Precision 5470. Strömförbrukningen kan vara lite högre, men batteritiden har inte förändrats nämnvärt och prestandaökningen kommer att vara väl värd det för krävande användare.
Den kanske största nackdelen med systemet är hur högljutt det kan vara när man trampar på pedalen. Medan prestanda per volym är mycket hög, kommer all denna kraft i ett så litet och portabelt paket till priset av fläktljud. Andra 14-tums arbetsstationer som
Lenovo ThinkPad P14s ellerHP ZBook Firefly 14 G9 är mycket tystare, men du måste offra en stor del av grafikprestandan på vägen.14-tums Precision 5480 är till för kraftfulla on-the-go-användare som vet att de kan utnyttja den snabba RTX 3000 Ada GPU:n till fullo. Annars tenderar alternativen från Lenovo och HP att vara mycket tystare och mer diskreta.
Pris och tillgänglighet
Dell levererar nu sin Precision 5480-arbetsstation från 2070 USD för Core i5-baskonfigurationen utan diskret grafik upp till över 4400 USD för vår Core i7 RTX 3000 Ada-konfiguration.
Dell Precision 5480
- 09/15/2023 v7 (old)
Allen Ngo
Genomskinlighet
Valet av enheter som ska granskas görs av vår redaktion. Testprovet gavs till författaren som ett lån av tillverkaren eller återförsäljaren för denna recension. Långivaren hade inget inflytande på denna recension och inte heller fick tillverkaren en kopia av denna recension innan publiceringen. Det fanns ingen skyldighet att publicera denna recension. Som ett oberoende medieföretag är Notebookcheck inte föremål för auktoritet från tillverkare, återförsäljare eller förlag.
This is how Notebookcheck is testingEvery year, Notebookcheck independently reviews hundreds of laptops and smartphones using standardized procedures to ensure that all results are comparable. We have continuously developed our test methods for around 20 years and set industry standards in the process. In our test labs, high-quality measuring equipment is utilized by experienced technicians and editors. These tests involve a multi-stage validation process. Our complex rating system is based on hundreds of well-founded measurements and benchmarks, which maintains objectivity.
Price comparison

