Lenovo ThinkPad E14 G5 Intel laptop recension: Core i7-1355U vs. Ryzen 7 7730U

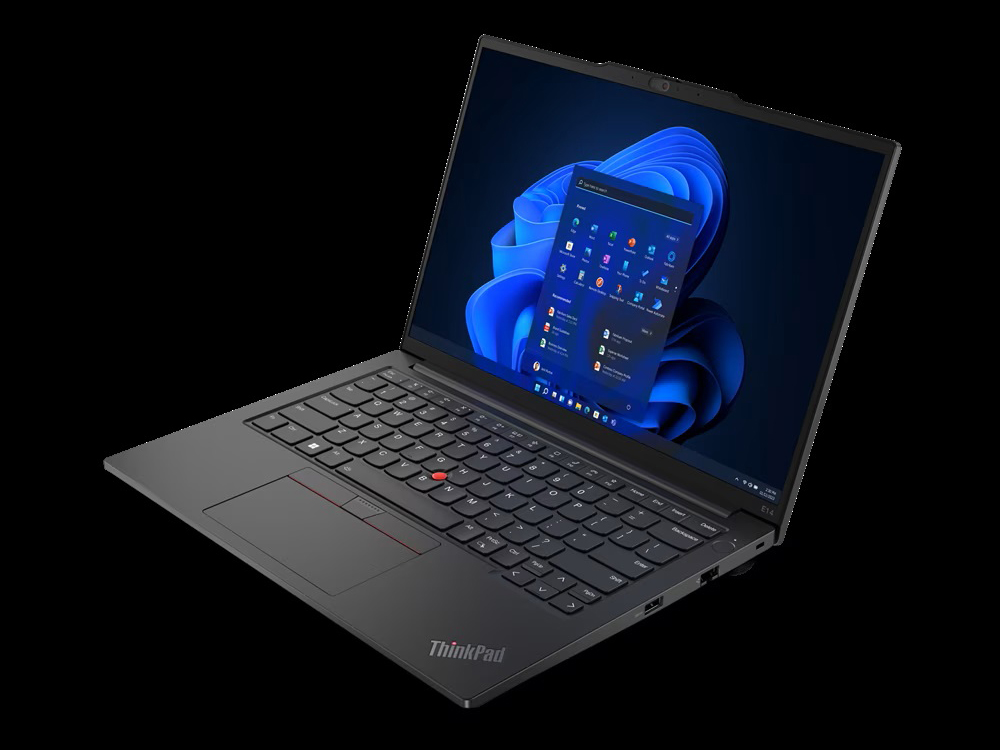
Efter att nyligen ha granskat ThinkPad E14 G5 AMD-versionen är vi nu redo att ta itu med ThinkPad E14 G5 Intel-versionen. Båda versionerna delar samma chassidesign och därför rekommenderar vi att du kollar in vår recension av AMD-versionen för att lära dig mer om de fysiska egenskaperna hos modellen. Ändå finns det några interna skillnader mellan de två som vi kommer att nämna i recensionen nedan.
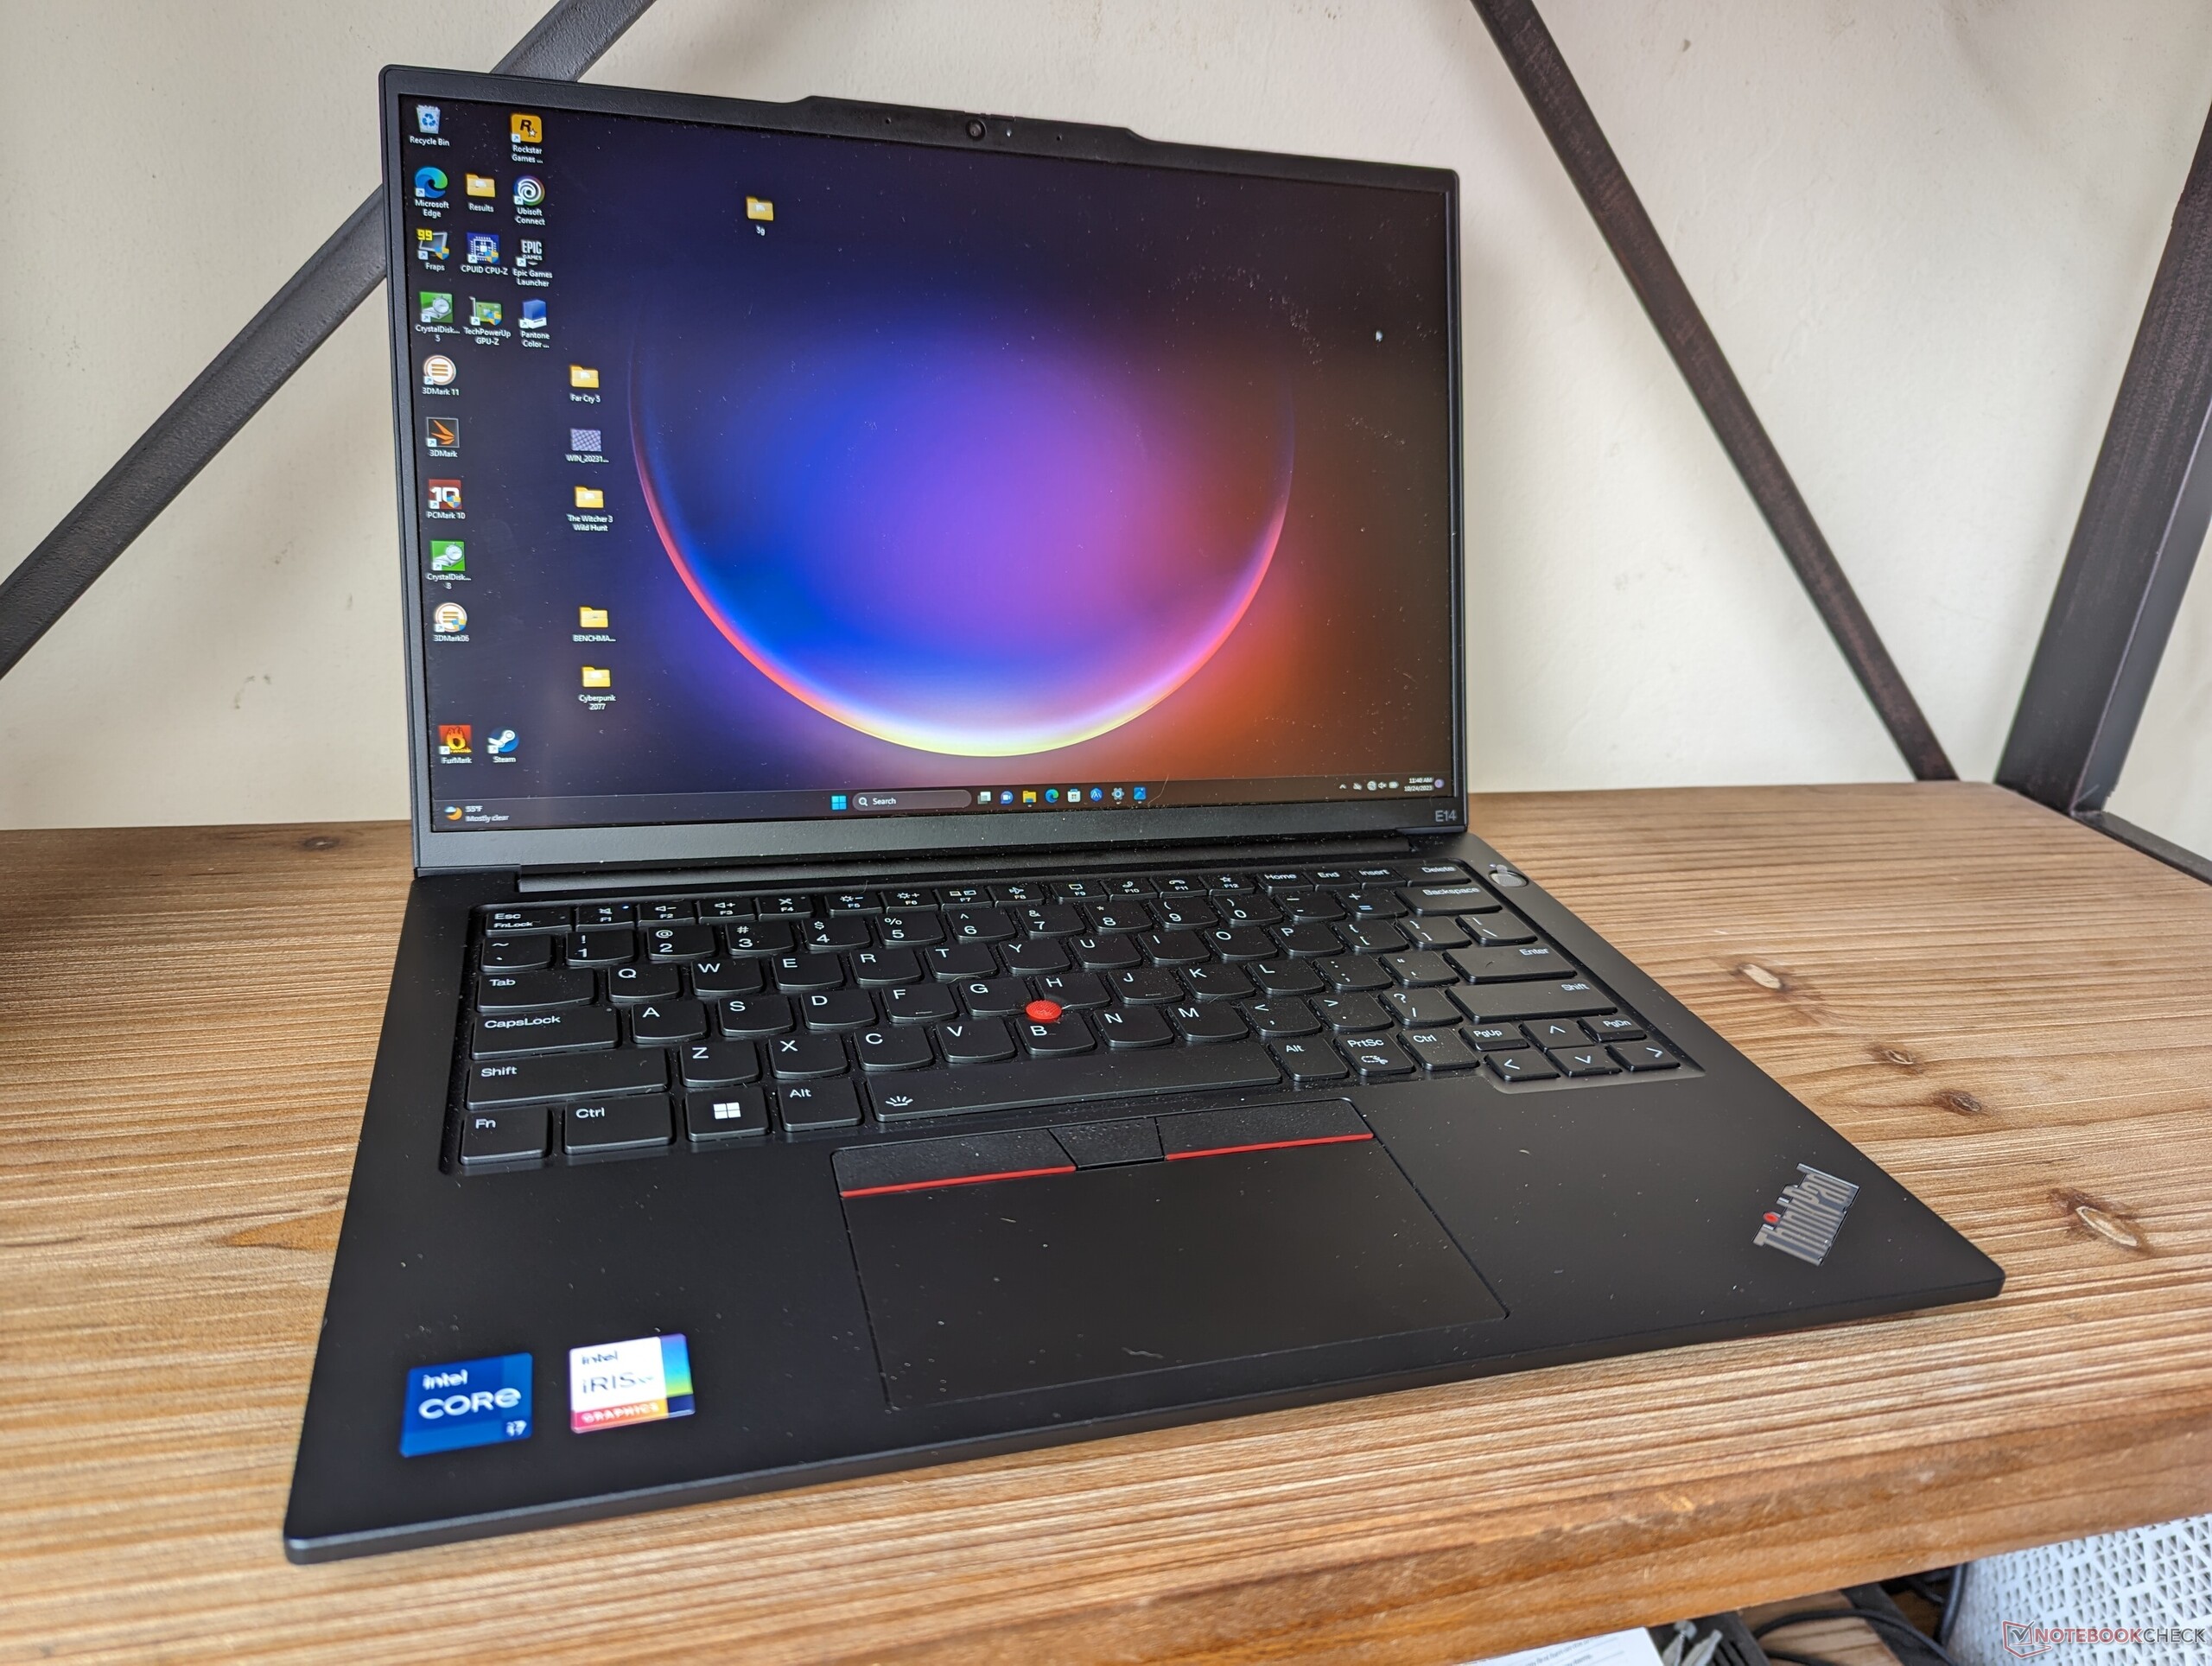
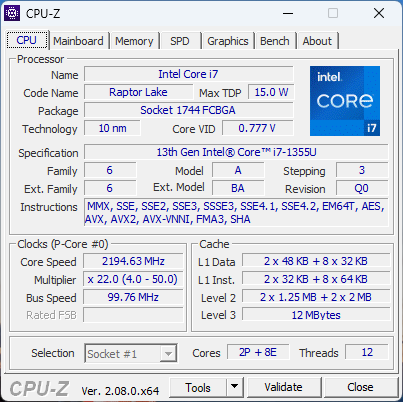
Vår testenhet är en Intel-konfiguration med 13:e generationens Raptor Lake Core i7-1355U CPU och 1200p FHD+-skärm för cirka 915 USD. Andra SKU:er börjar från Core i3-1315U upp till Core i7-13700H med valfri GeForce MX550-grafik och en högre upplöst 2240 x 1400 IPS-skärm. Det konfigurerbara utbudet är bredare än väntat, särskilt för en 14-tums subnotebook.
Alternativ till ThinkPad E14 G5 inkluderar andra business subnotebooks i övre mellanklassen som HP EliteBook 845 eller Dell Latitude 7440.
Fler recensioner av Lenovo:
Potentiella konkurrenter i jämförelse
Gradering | Datum | Modell | Vikt | Höjd | Storlek | Upplösning | Pris |
|---|---|---|---|---|---|---|---|
| 86 % v7 (old) | 10/2023 | Lenovo ThinkPad E14 G5 i7-1355U i7-1355U, Iris Xe G7 96EUs | 1.5 kg | 17.99 mm | 14.00" | 1920x1200 | |
| 88.3 % v7 (old) | 08/2023 | Lenovo ThinkPad E14 G5-21JSS05C00 R7 7730U, Vega 8 | 1.4 kg | 18 mm | 14.00" | 2240x1400 | |
| 90.1 % v7 (old) | 08/2023 | HP EliteBook 845 G10 818N0EA R9 PRO 7940HS, Radeon 780M | 1.5 kg | 17.9 mm | 14.00" | 2560x1600 | |
| 85.3 % v7 (old) | 06/2023 | Asus ZenBook 14 UM3402Y R7 7730U, Vega 8 | 1.4 kg | 16.9 mm | 14.00" | 2880x1800 | |
| 86.6 % v7 (old) | 10/2022 | LG Gram 14Z90Q i5-1240P, Iris Xe G7 80EUs | 980 g | 16.8 mm | 14.00" | 1920x1200 | |
| 90.3 % v7 (old) | 07/2023 | Dell Latitude 7440 i5-1345U, Iris Xe G7 80EUs | 1.2 kg | 17.95 mm | 14.00" | 2560x1600 |
Fall
Det kanske enklaste sättet att skilja mellan ThinkPad E14 G5 Intel- och AMD-versionerna är att leta efter Thunderbolt-logotypen längs den vänstra kanten. AMD-versionerna saknar både Thunderbolt- och USB4-stöd, vilket ger Intel-versionerna övertaget när det gäller dockningsmöjligheter.
Kommunikation
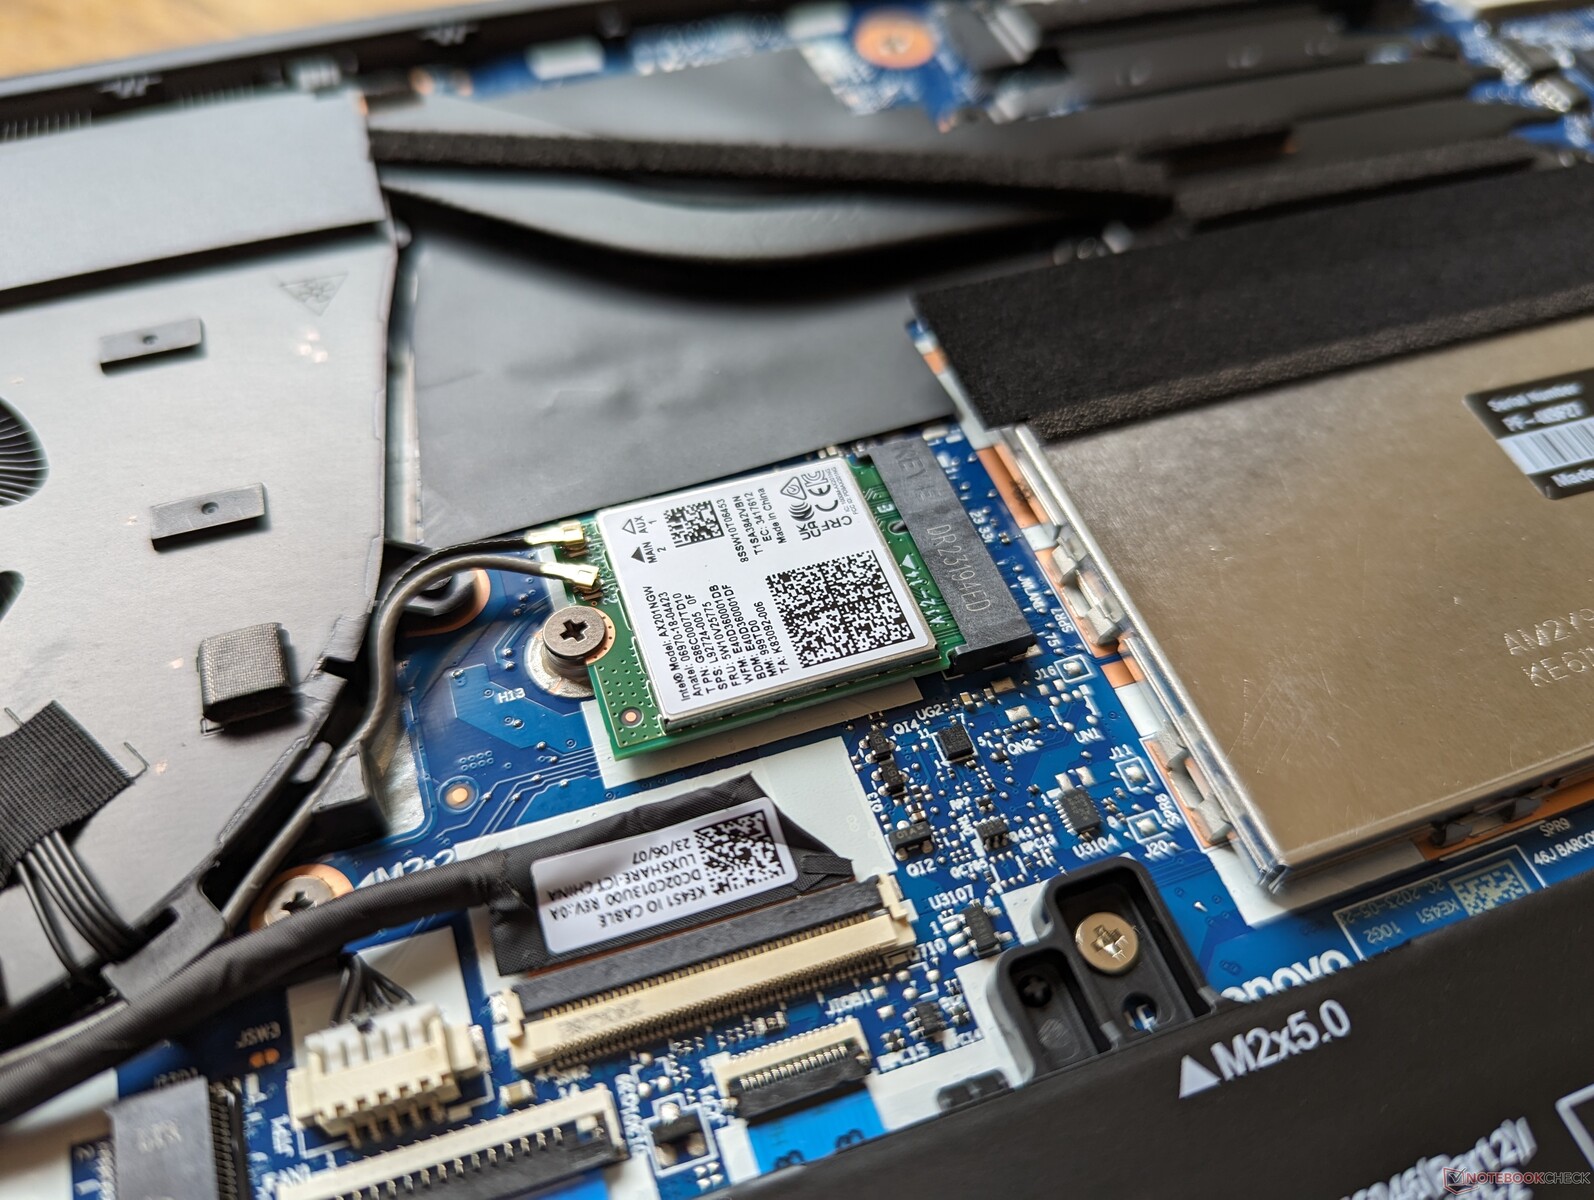
En Intel AX201 ingår för stöd för Wi-Fi 6 och Bluetooth 5.1. Den dyrare AX211 finns som tillval för användare som vill ha Wi-Fi 6E-anslutning.
| Networking | |
| iperf3 transmit AXE11000 | |
| Lenovo ThinkPad E14 G5-21JSS05C00 | |
| Lenovo ThinkPad E14 G5 i7-1355U | |
| Dell Latitude 7440 | |
| Asus ZenBook 14 UM3402Y | |
| iperf3 receive AXE11000 | |
| Lenovo ThinkPad E14 G5-21JSS05C00 | |
| Lenovo ThinkPad E14 G5 i7-1355U | |
| Asus ZenBook 14 UM3402Y | |
| Dell Latitude 7440 | |
| iperf3 transmit AXE11000 6GHz | |
| HP EliteBook 845 G10 818N0EA | |
| Asus ZenBook 14 UM3402Y | |
| Dell Latitude 7440 | |
| iperf3 receive AXE11000 6GHz | |
| HP EliteBook 845 G10 818N0EA | |
| LG Gram 14Z90Q | |
| Asus ZenBook 14 UM3402Y | |
| Dell Latitude 7440 | |
Webbkamera
Sekretessluckan är standard på alla SKU:er, men 1080p-upplösningen och IR-sensorn är tillval. SKU:er i lägre prisklasser kan levereras med en 720p-sensor.


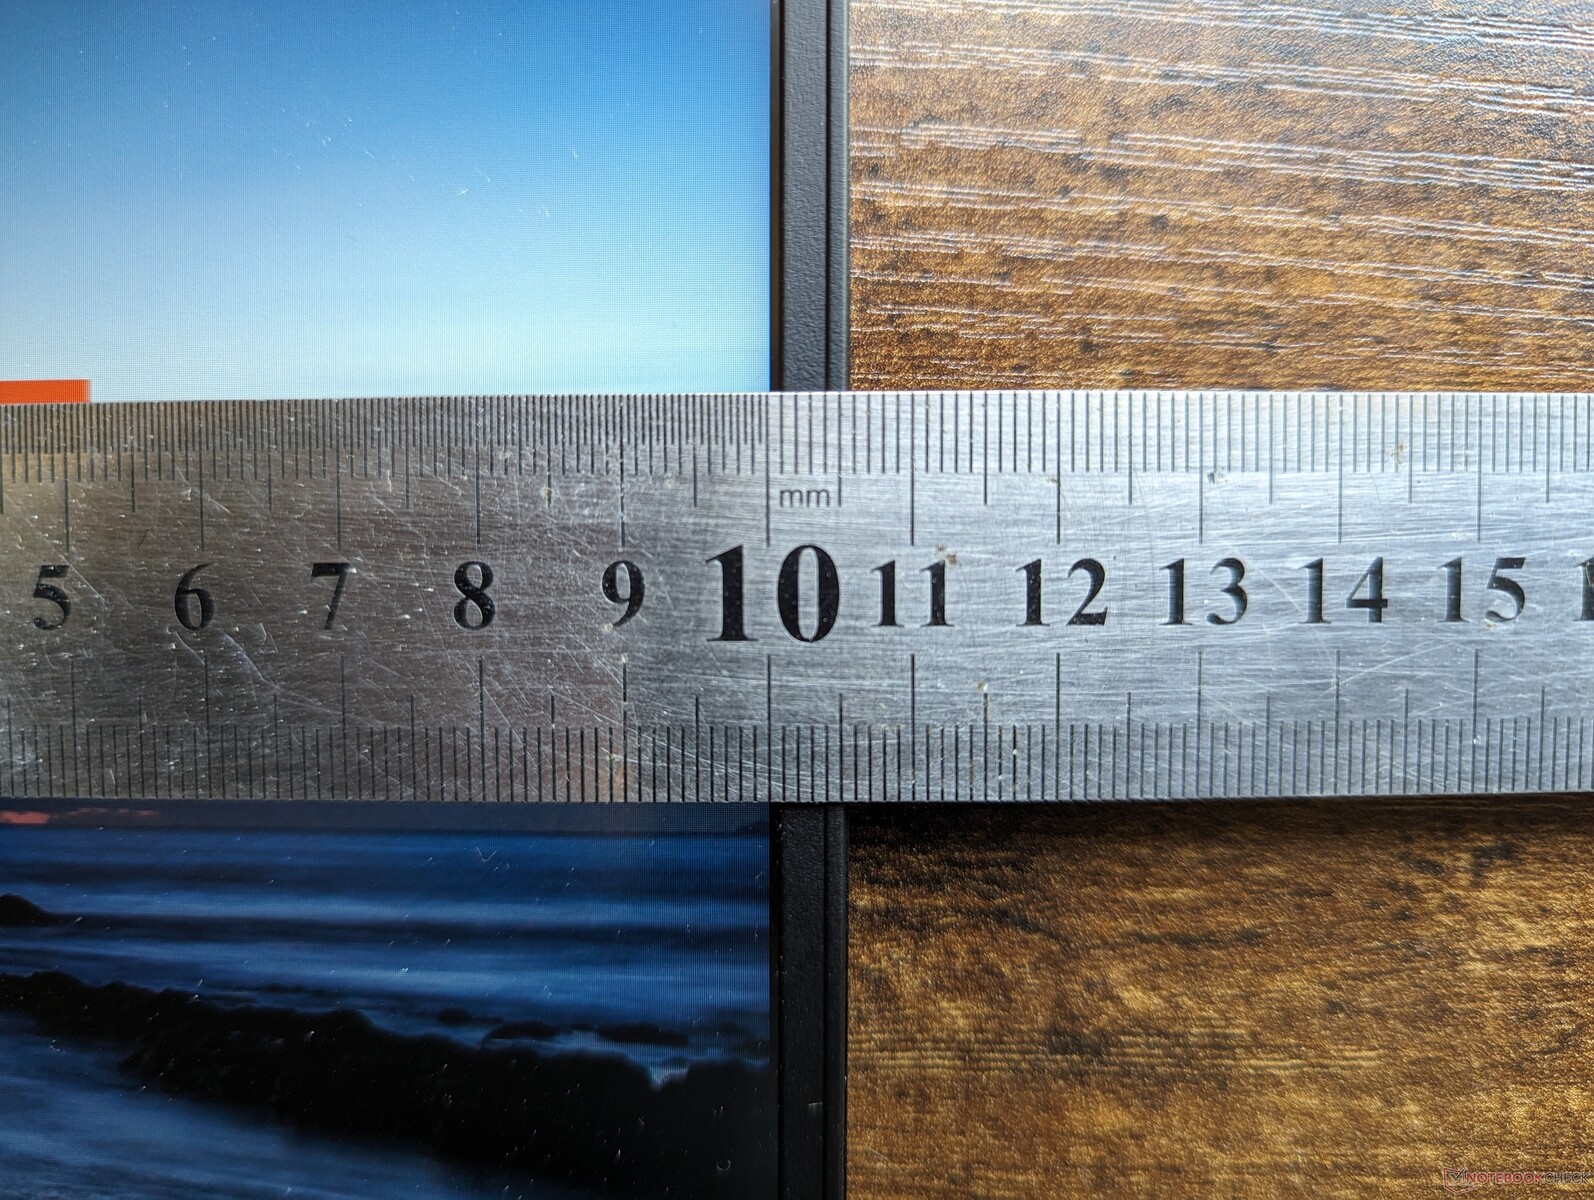
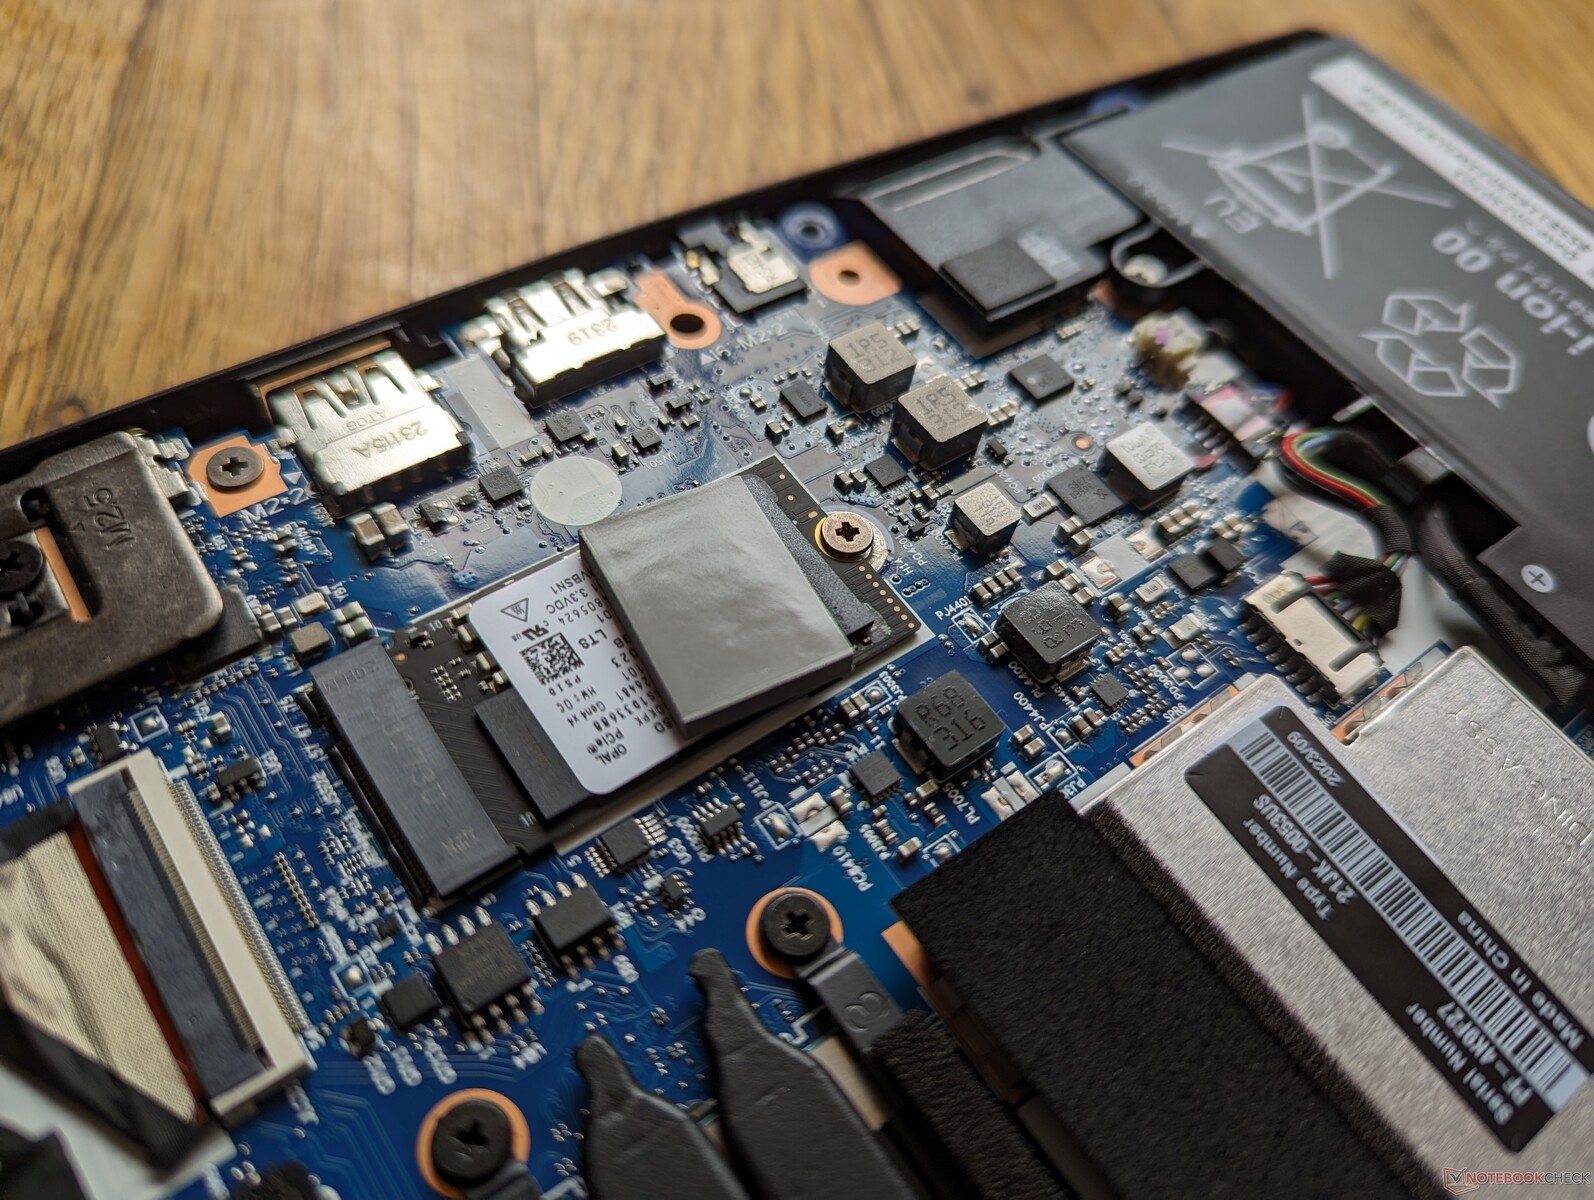
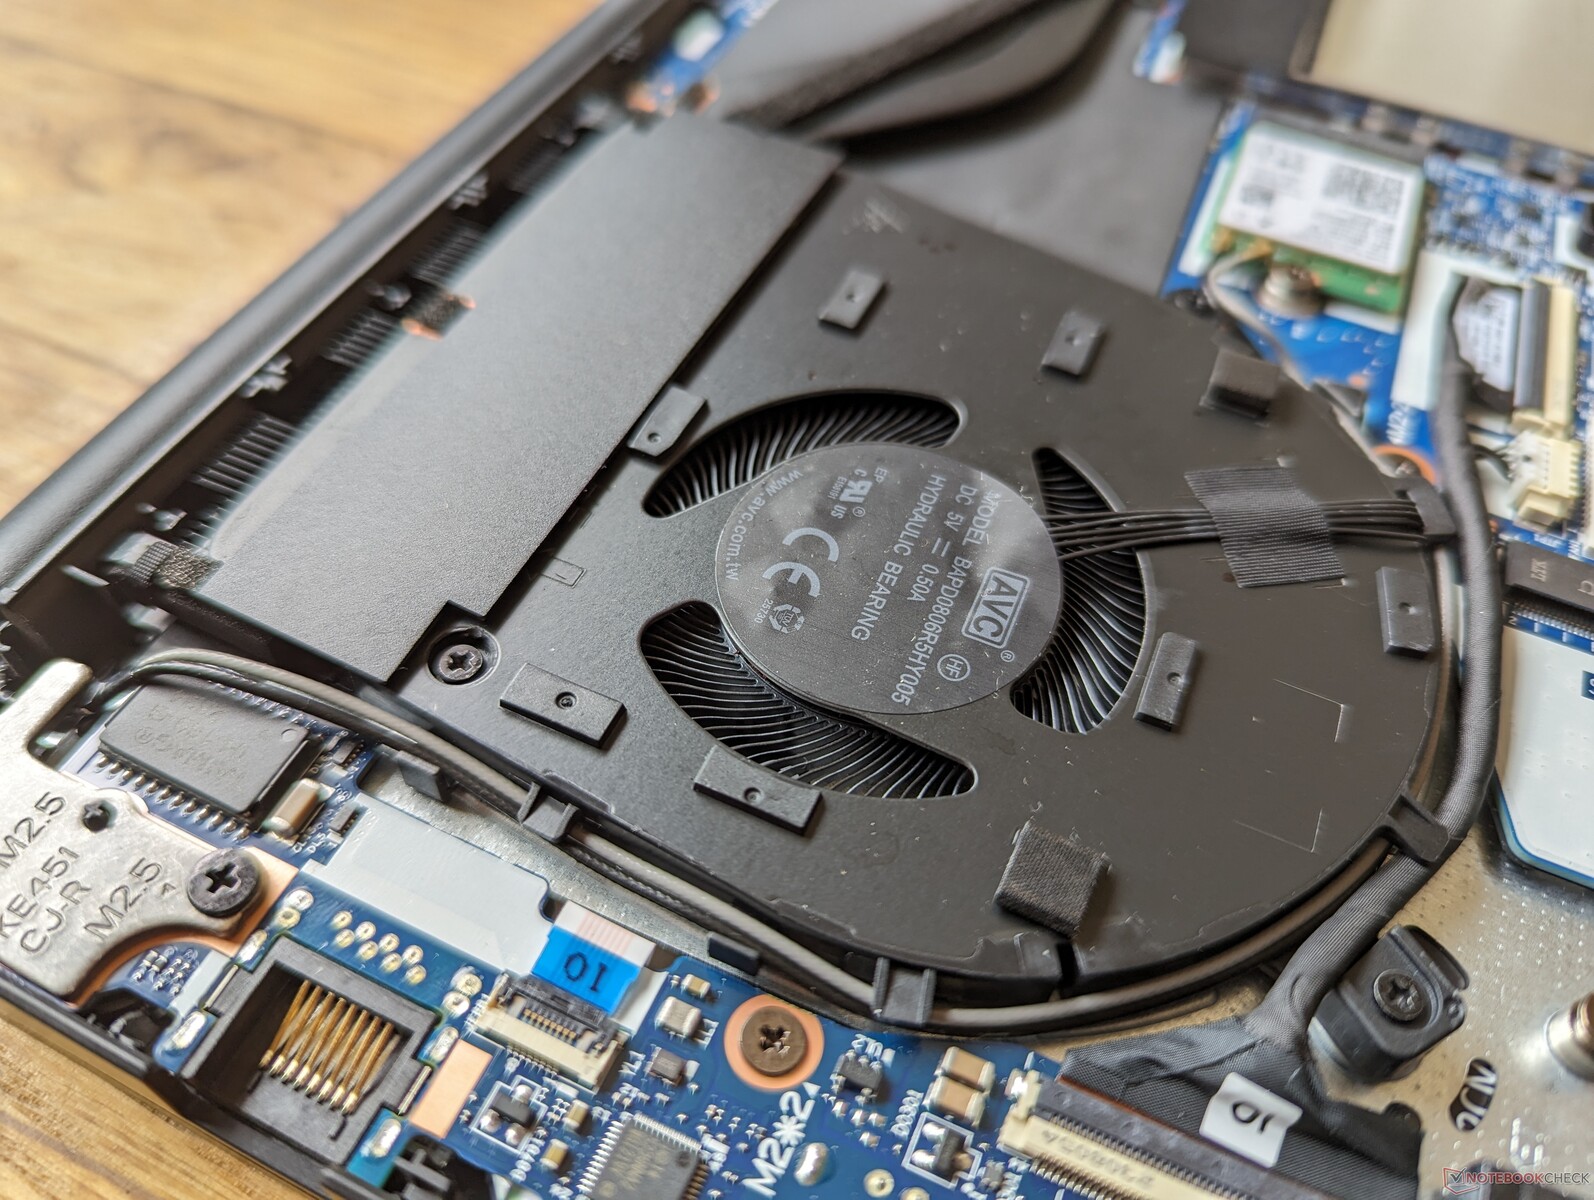
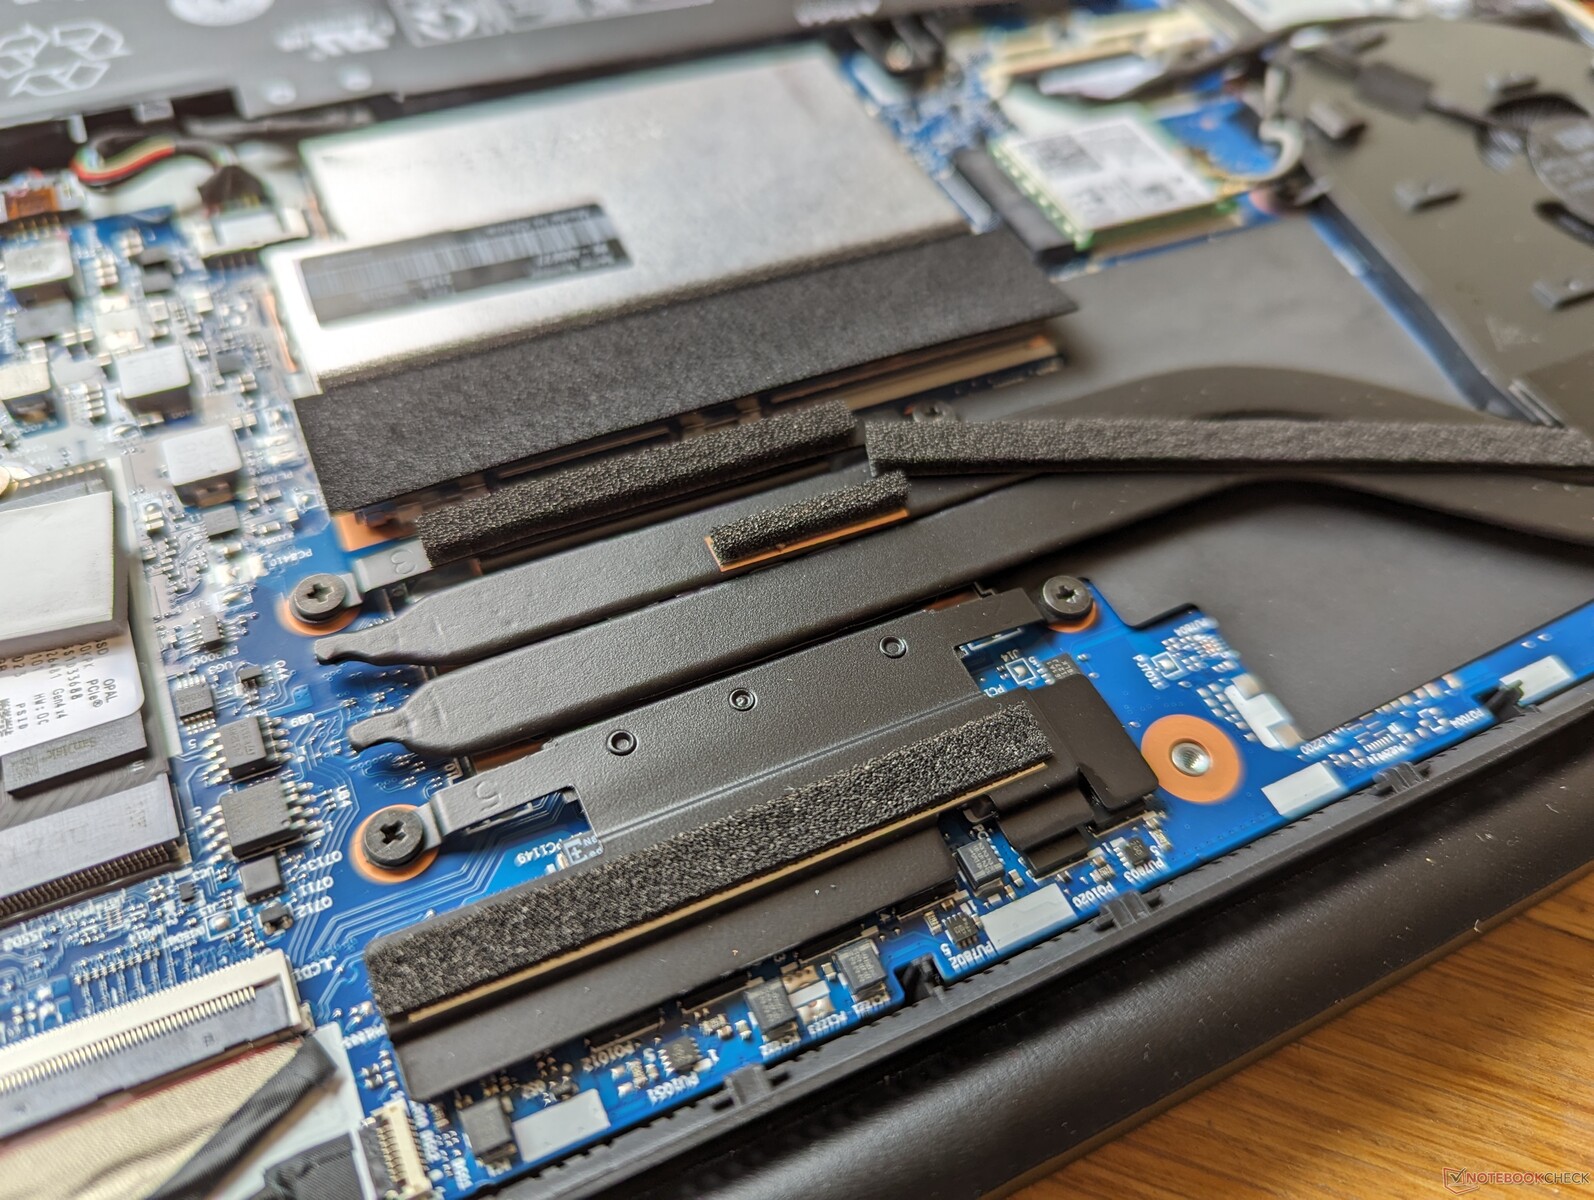
Underhåll
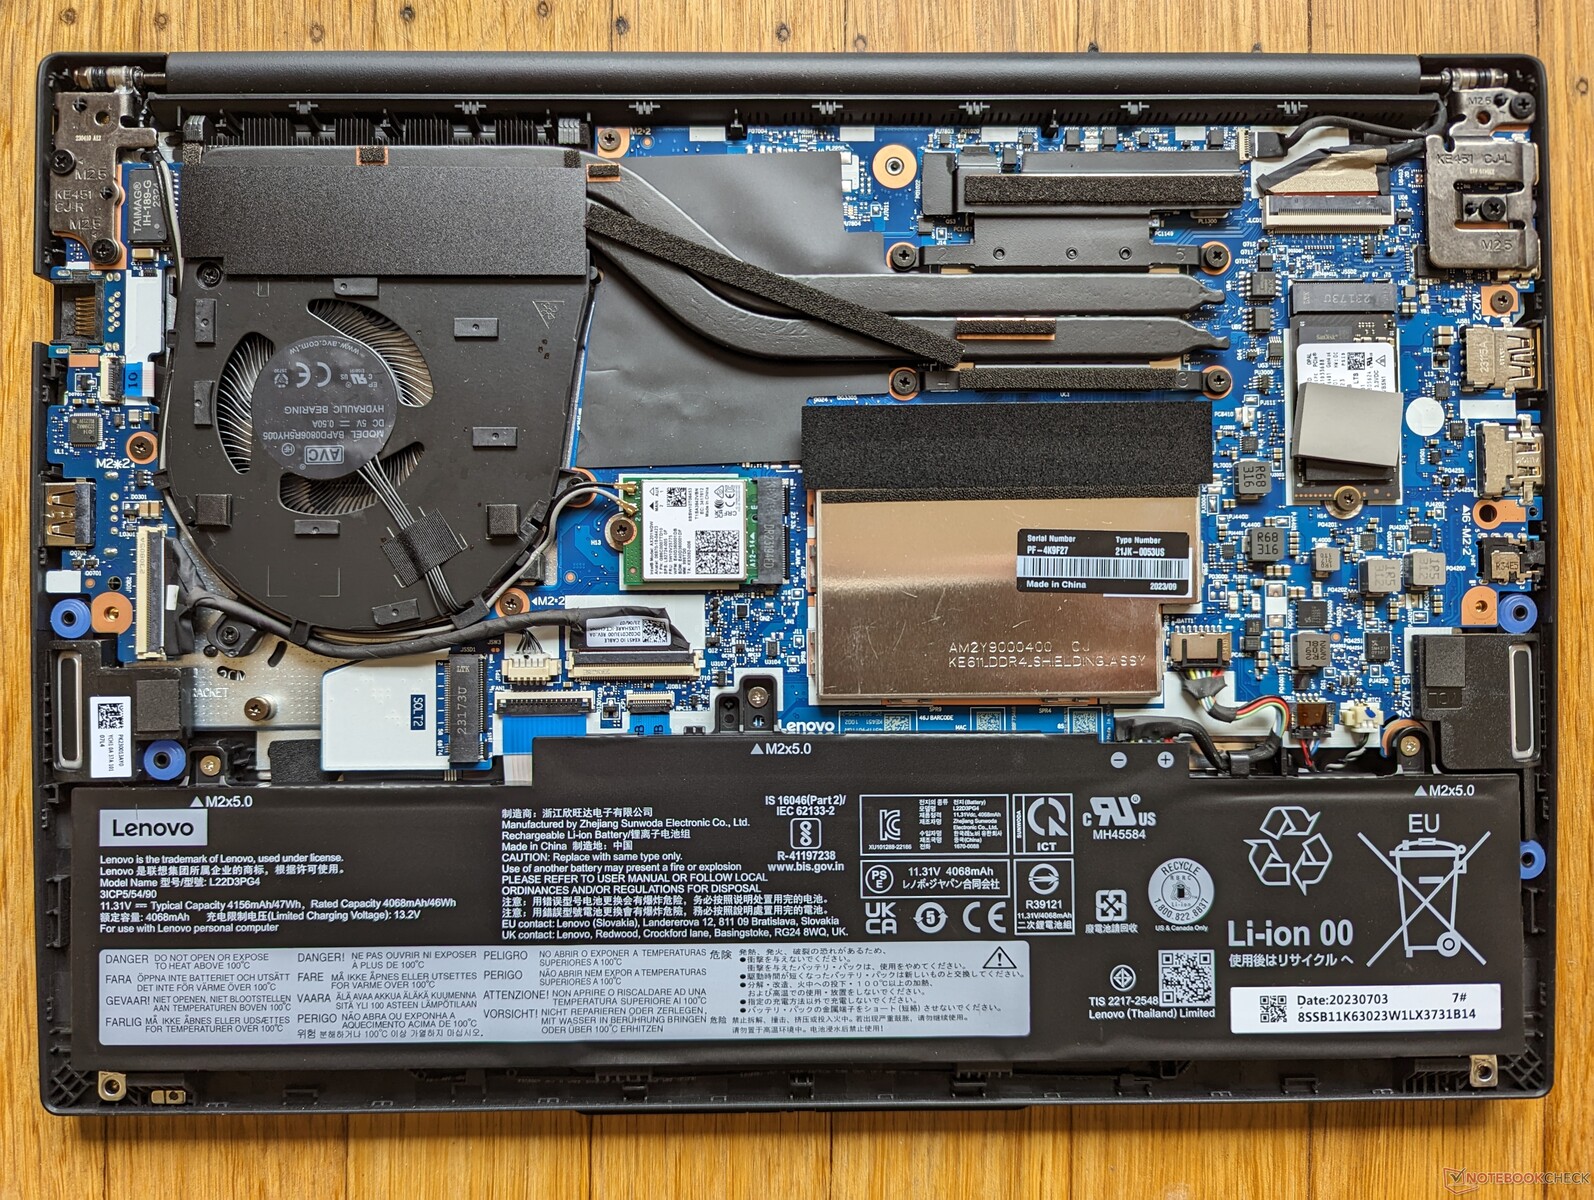
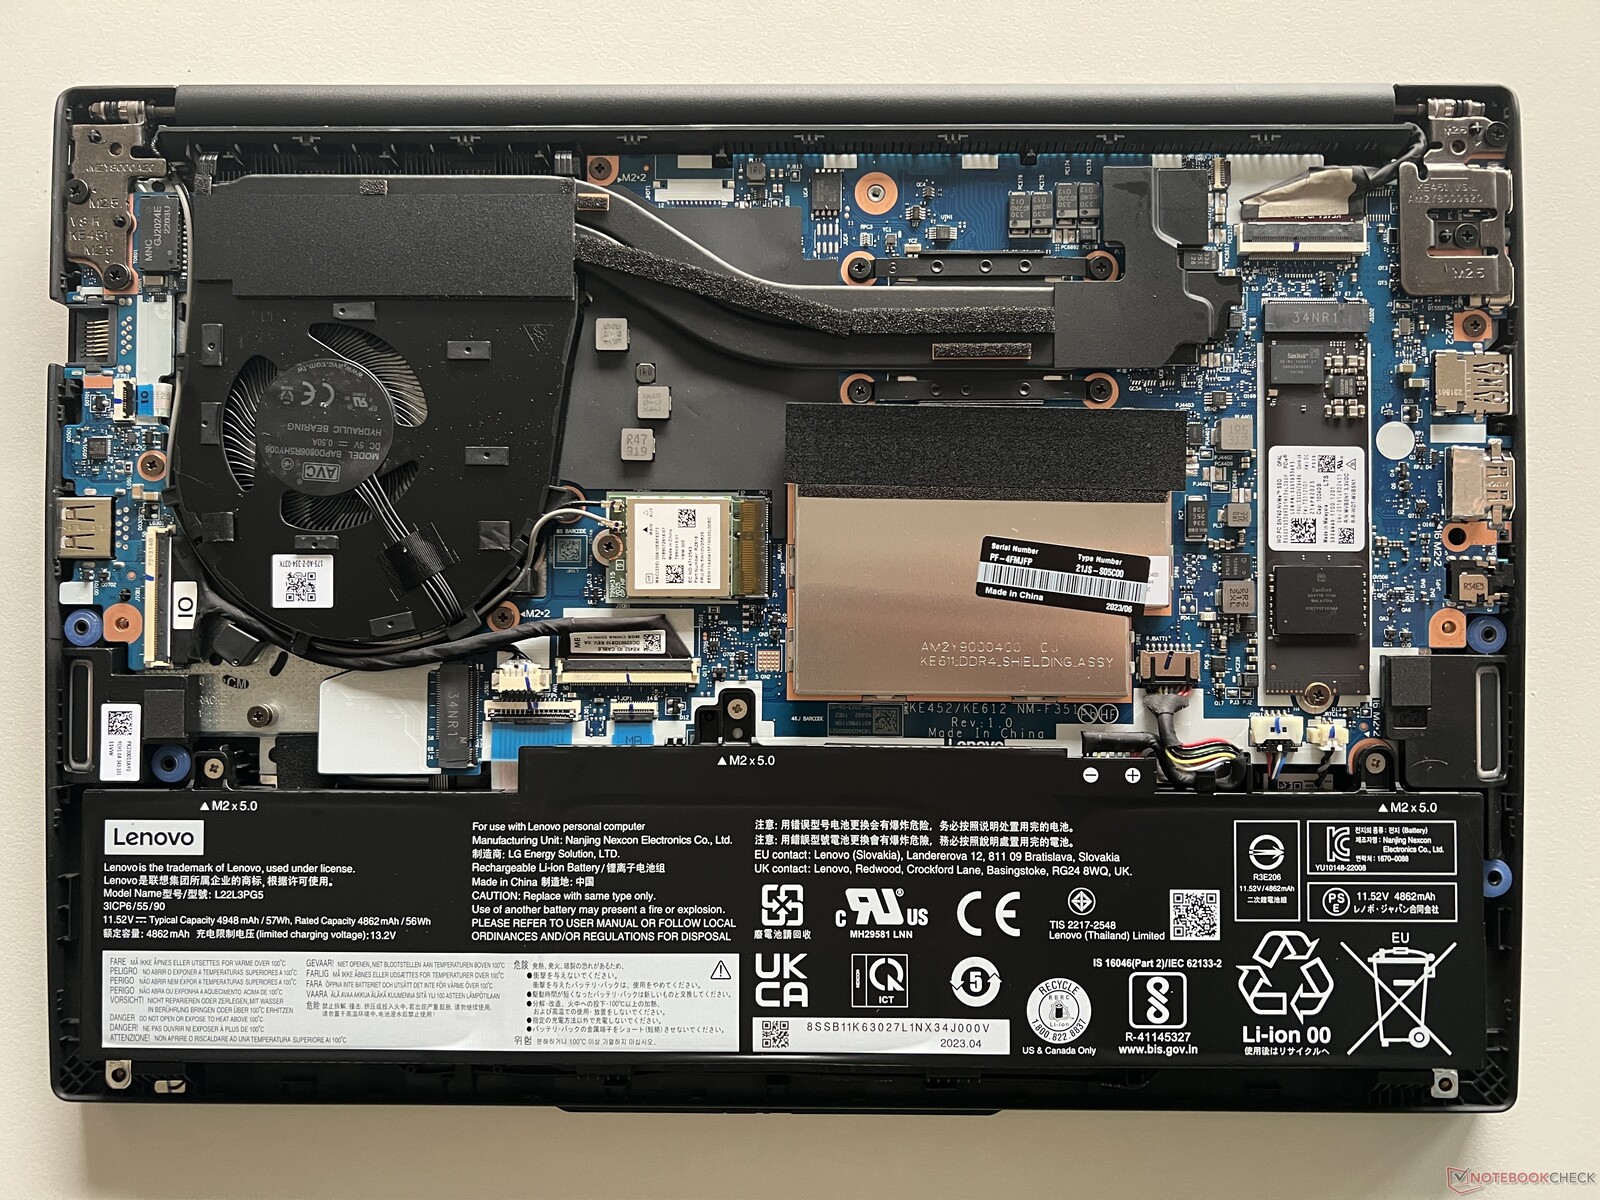
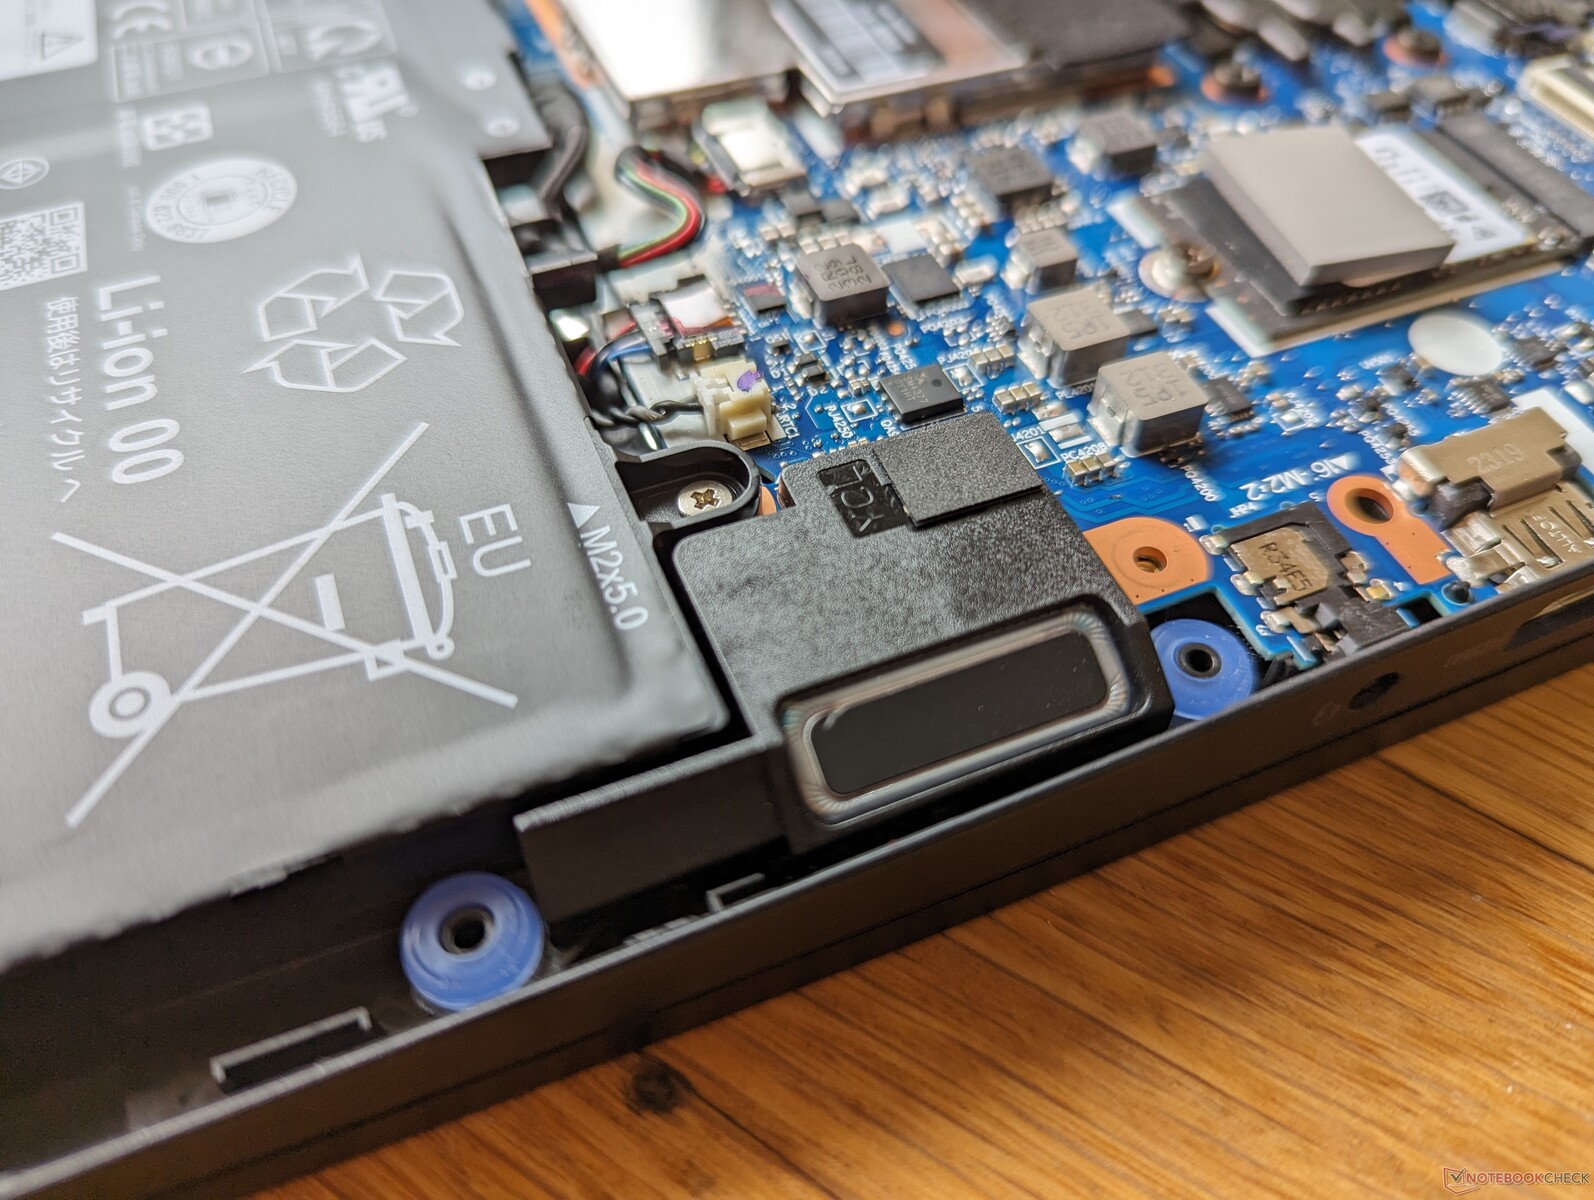
En intressant skillnad mellan Intel- och AMD-versionerna är att Intel-versionen inte stöder M.2 2280 SSD-enheter i full längd, vilket framgår av jämförelsebilderna nedan. Upp till två enheter (PCIe4 x4 + PCIe3 x4) kan fortfarande installeras, men de måste vardera vara upp till 42 mm (2242) långa.
Tillbehör och garanti
Det finns inget extra i förpackningen förutom nätadapter och pappersarbete. En ettårig begränsad tillverkargaranti gäller vid köp i USA.
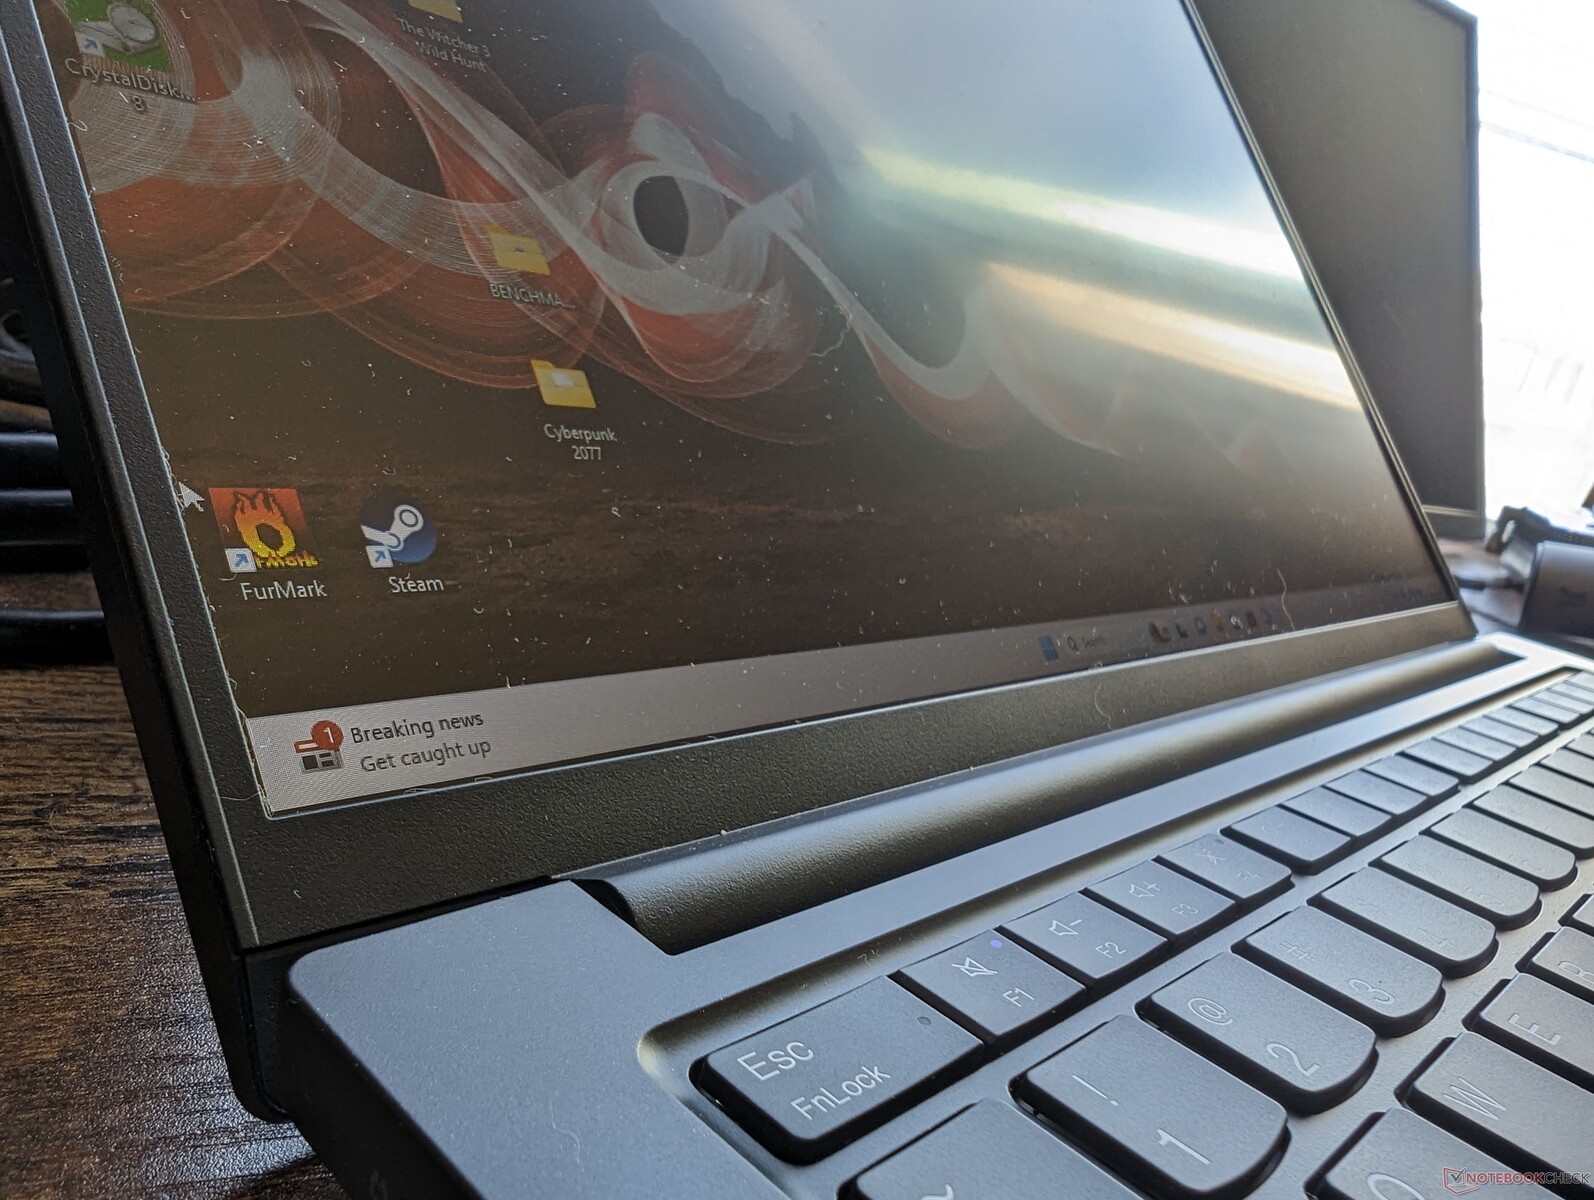
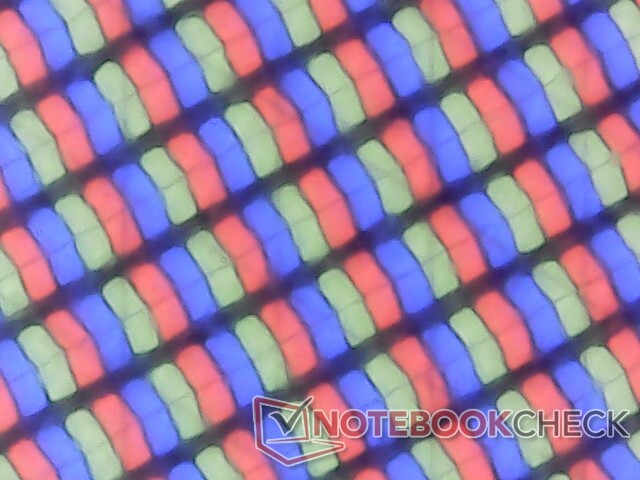
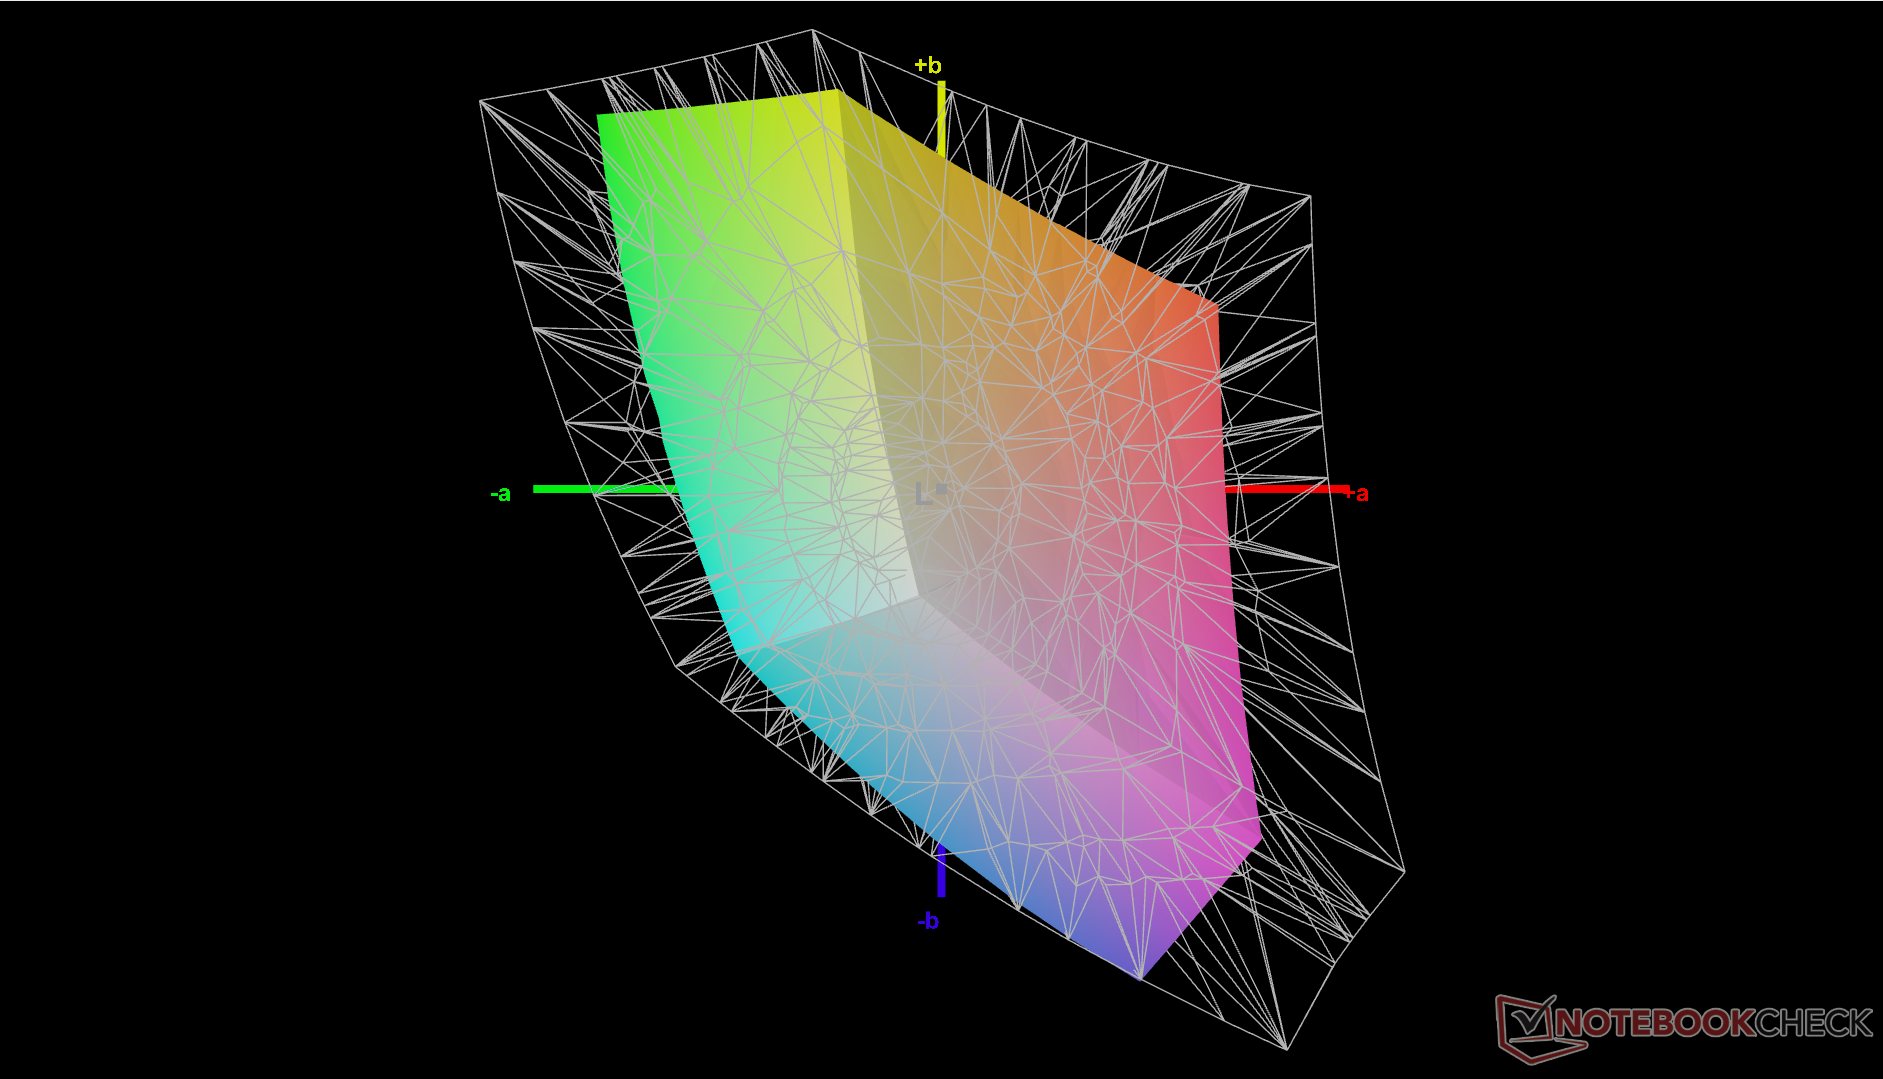
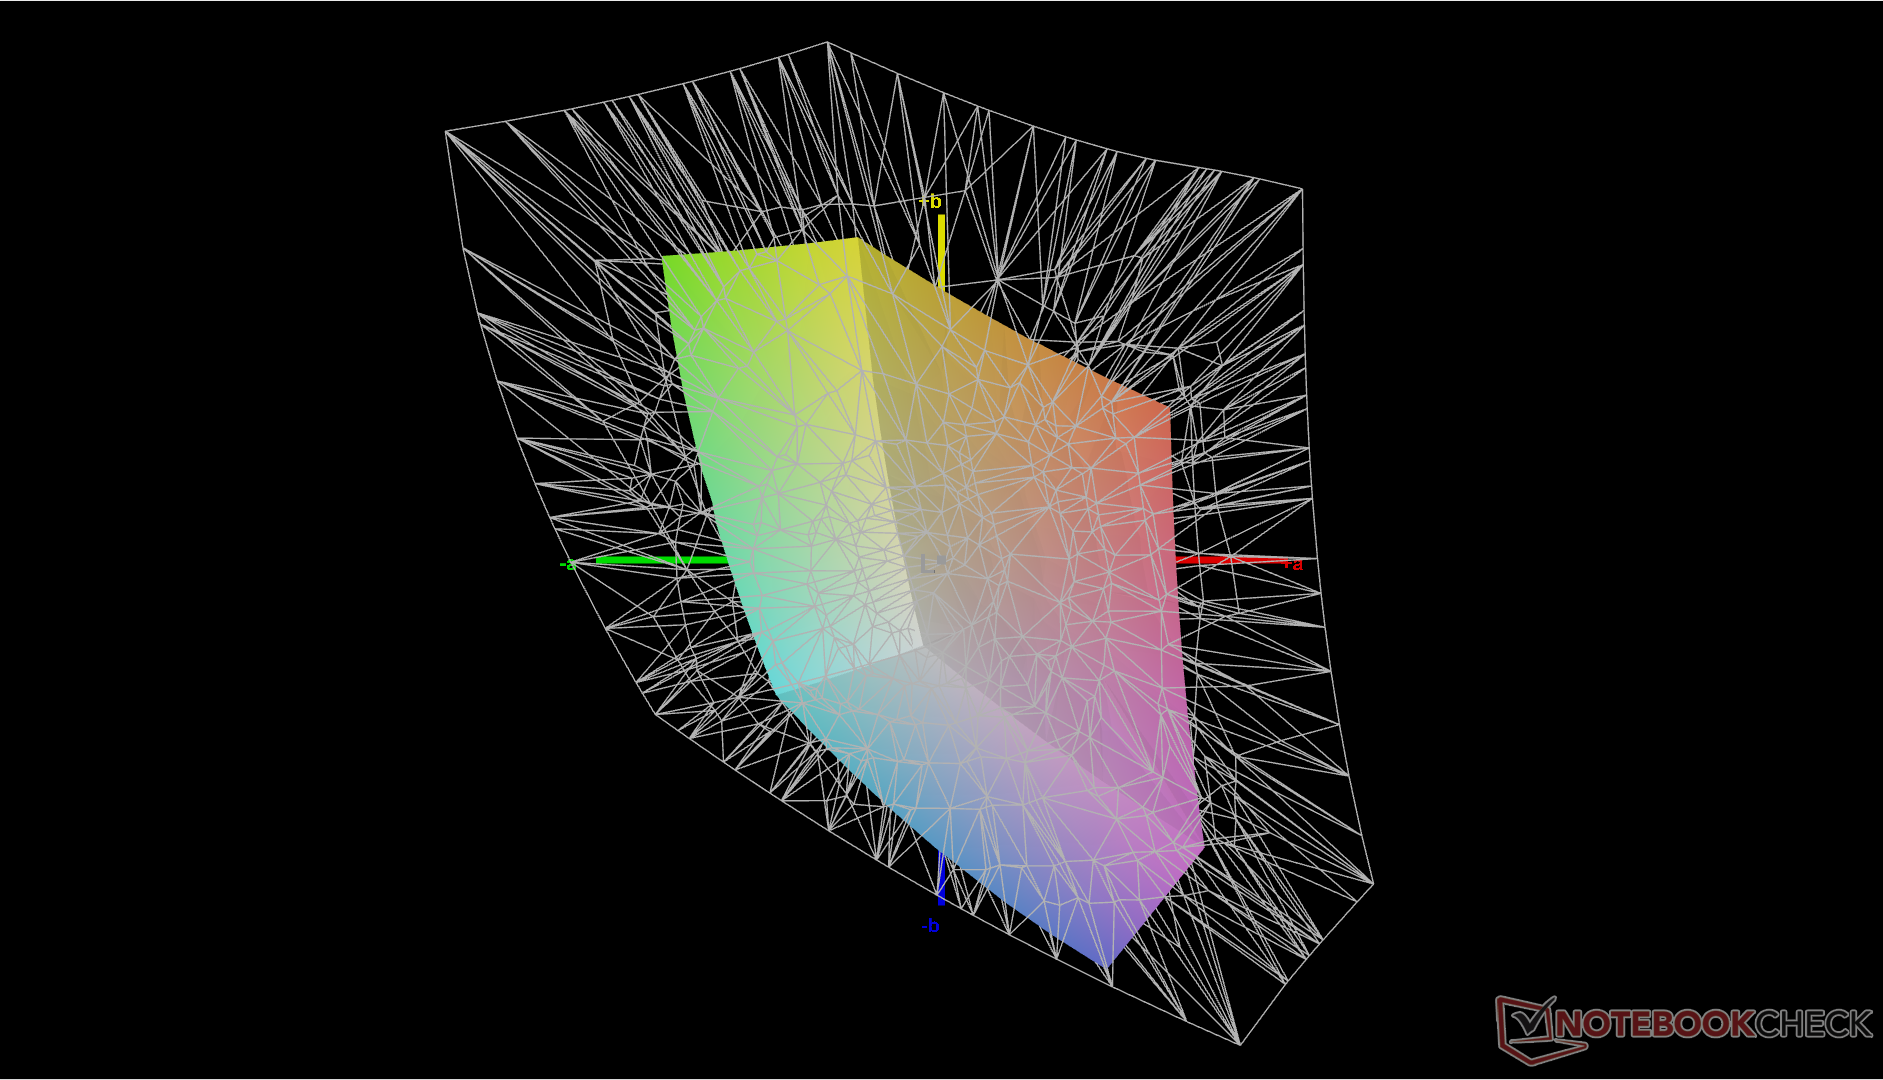
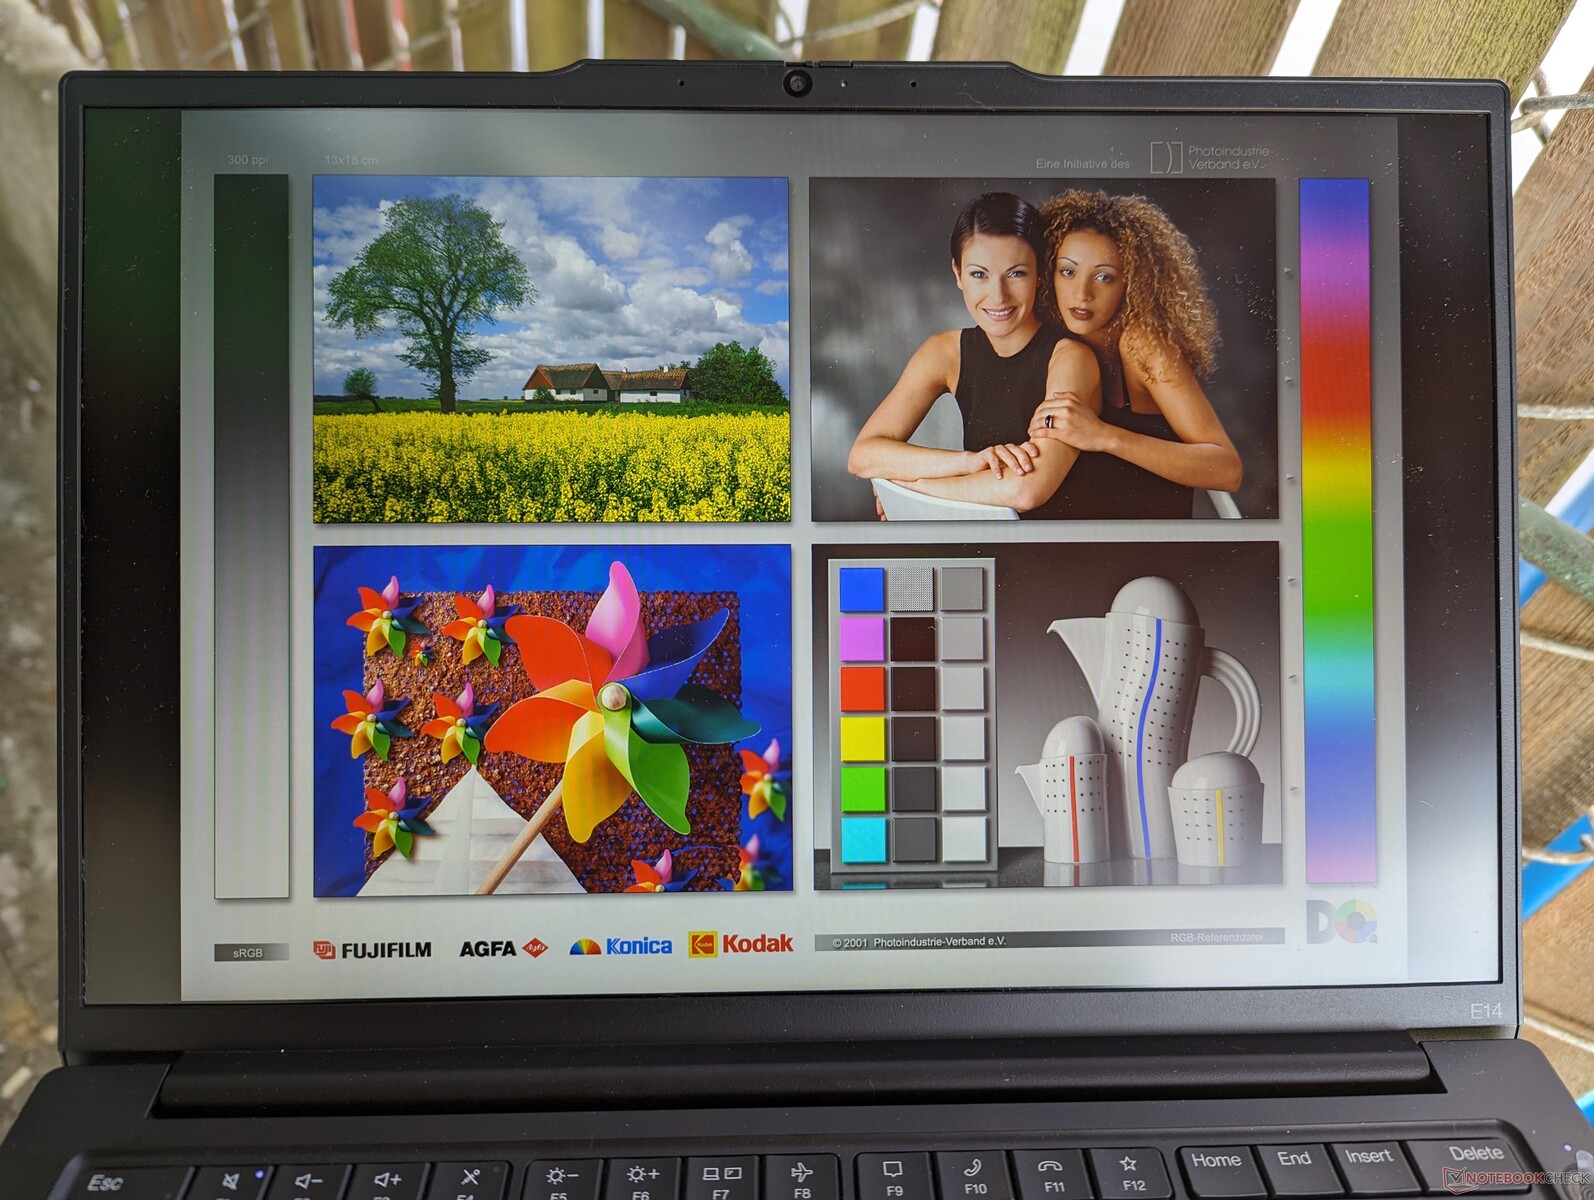
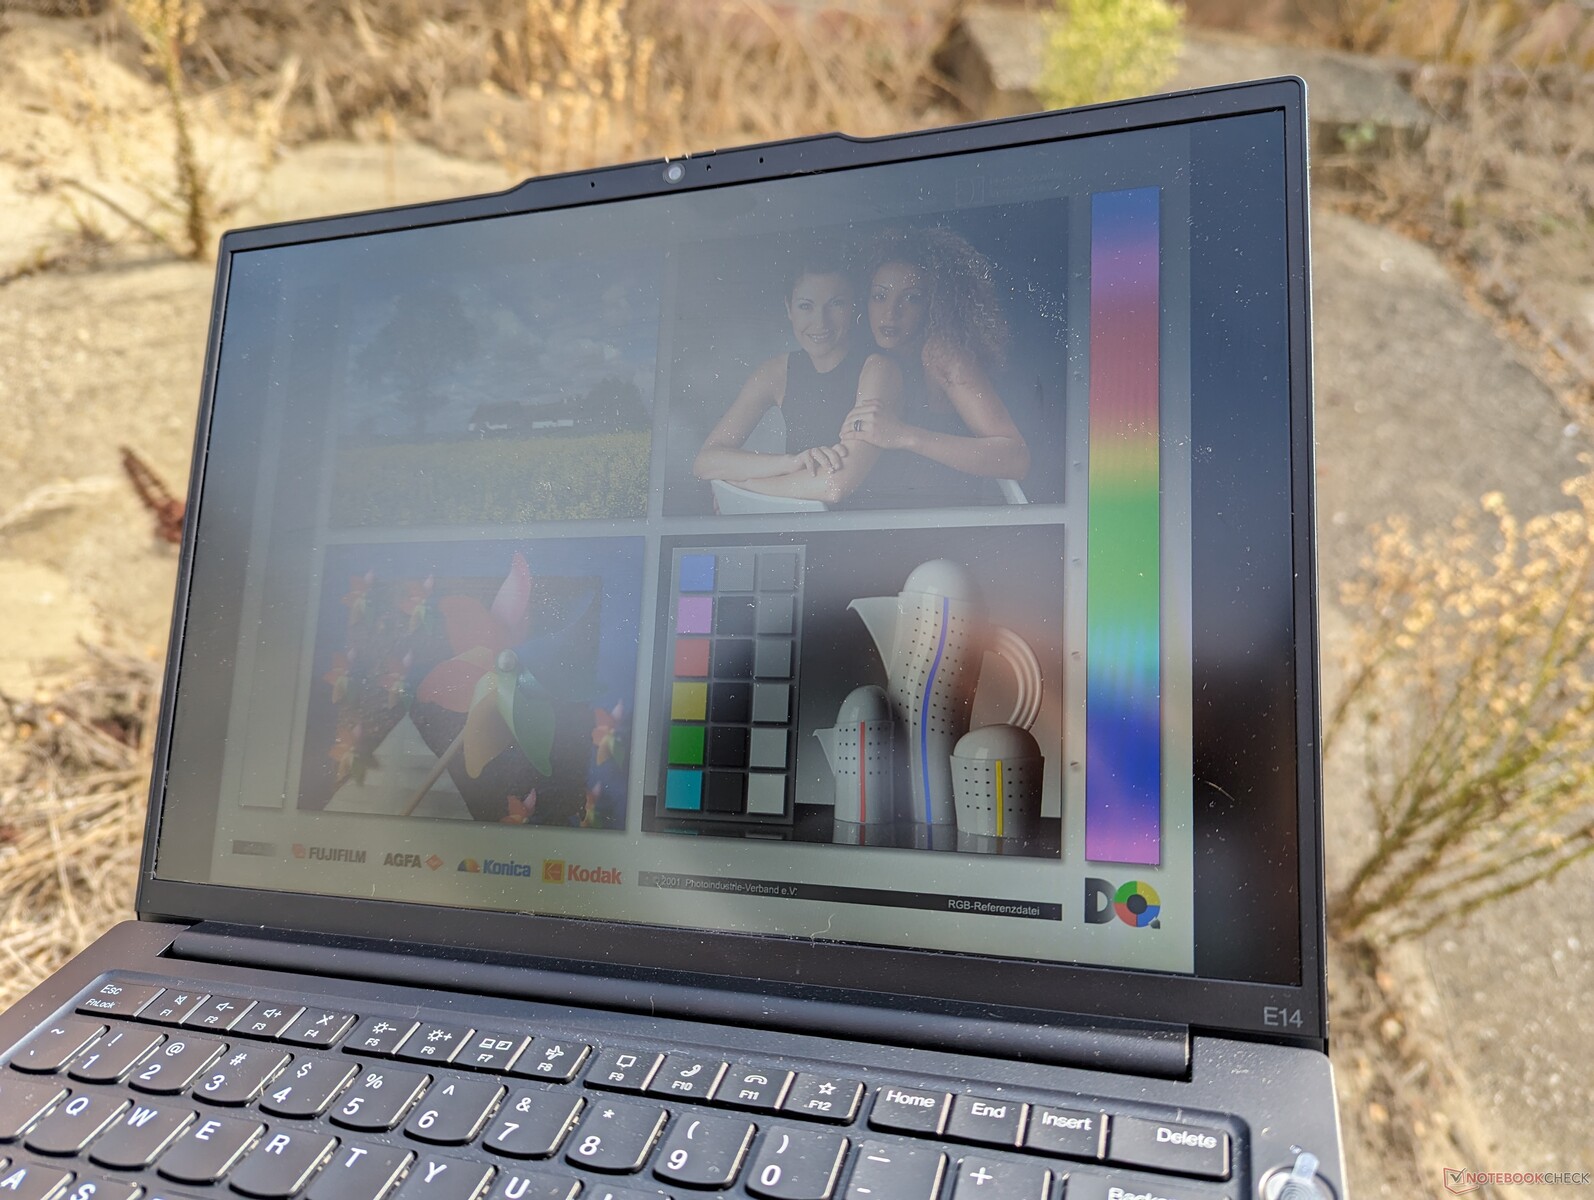
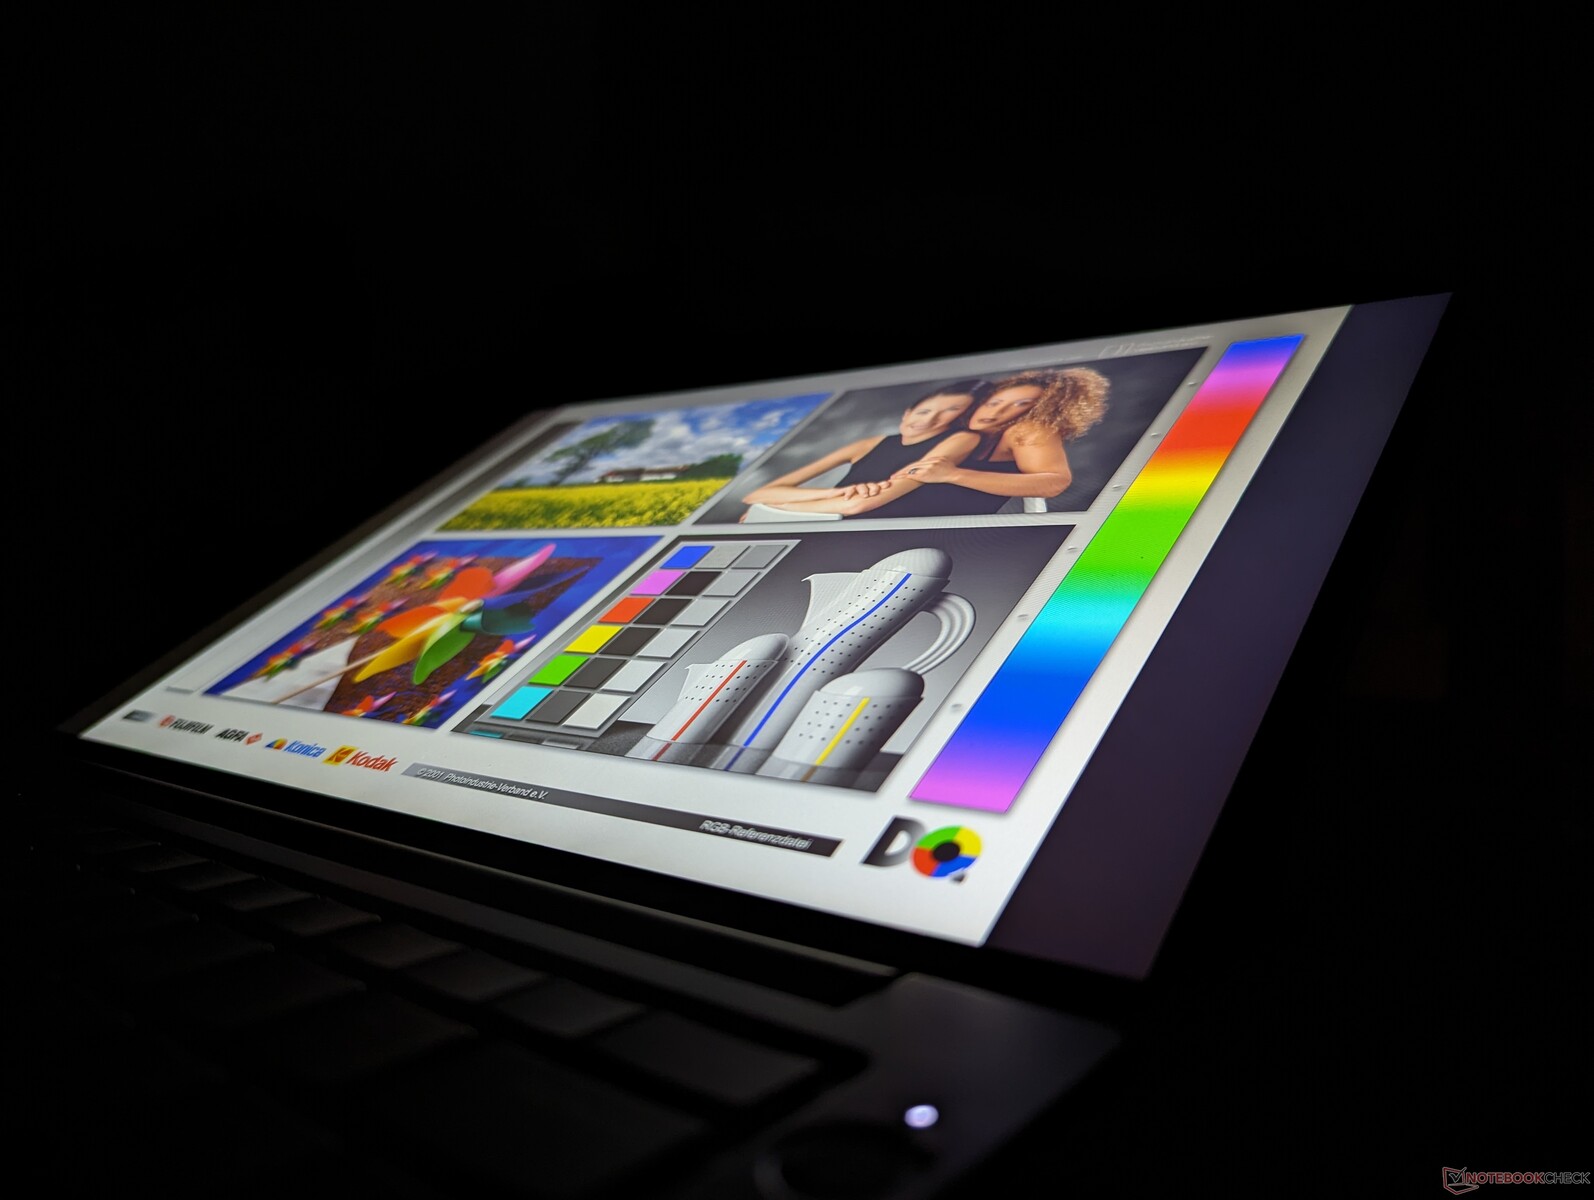
Display
Tre displayalternativ är tillgängliga enligt följande:
- 1920 x 1200, IPS, 60% sRGB, 60 Hz, 300-nits, beröringsfri, matt
- 1920 x 1200, IPS, 60% sRGB, 60 Hz, 300-nits, touch, matt
- 2240 x 1400, IPS, 100% sRGB, 60 Hz, 300-nits, icke-touch, matt
Medan vår AMD-enhet konfigurerades med 1400p-panelen, levereras vår Intel-enhet istället med det fetmarkerade alternativet. Vi rekommenderar 1400p-panelen om dina arbetsbelastningar kräver mer exakta färger och ett högre kontrastförhållande. Annars verkar andra attribut som ljusstyrka och svartvita svarstider vara konsekventa mellan alla alternativ.
| |||||||||||||||||||||||||
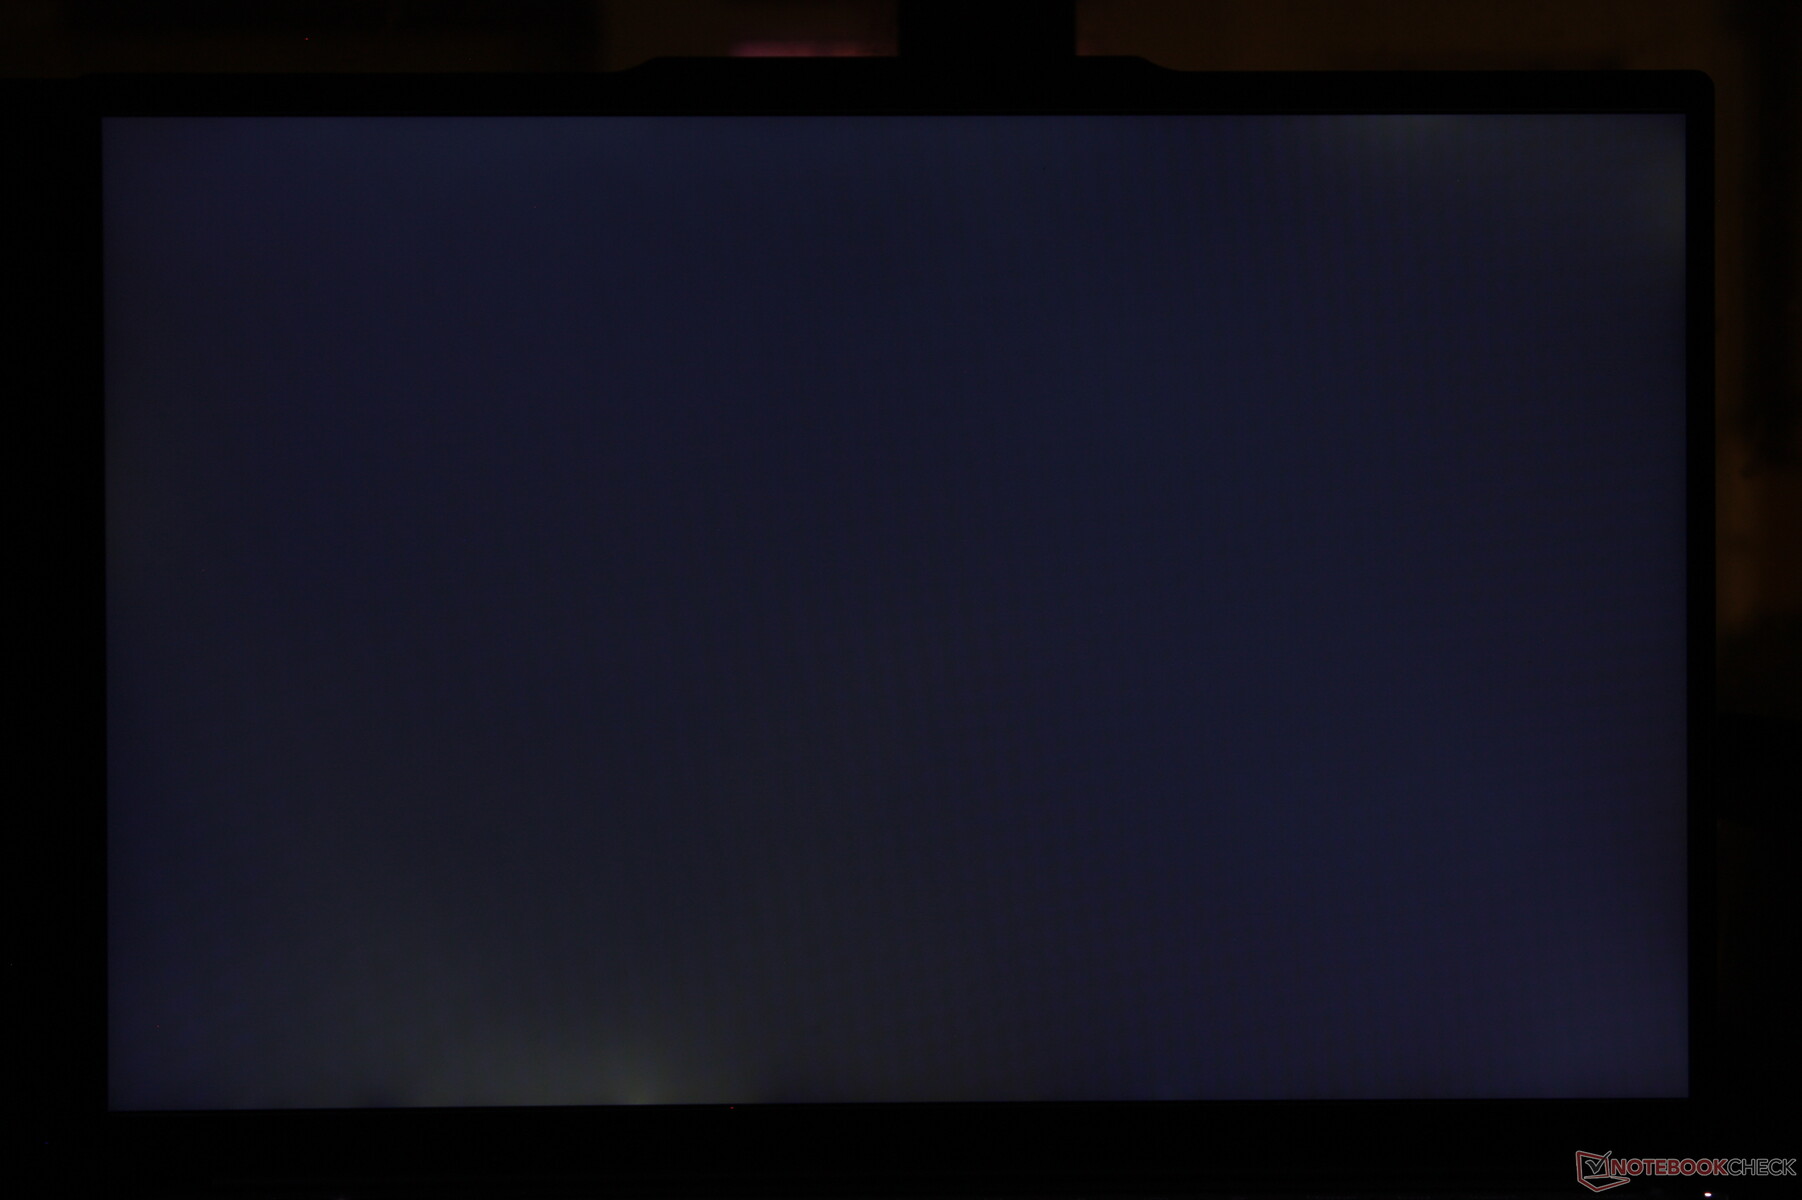
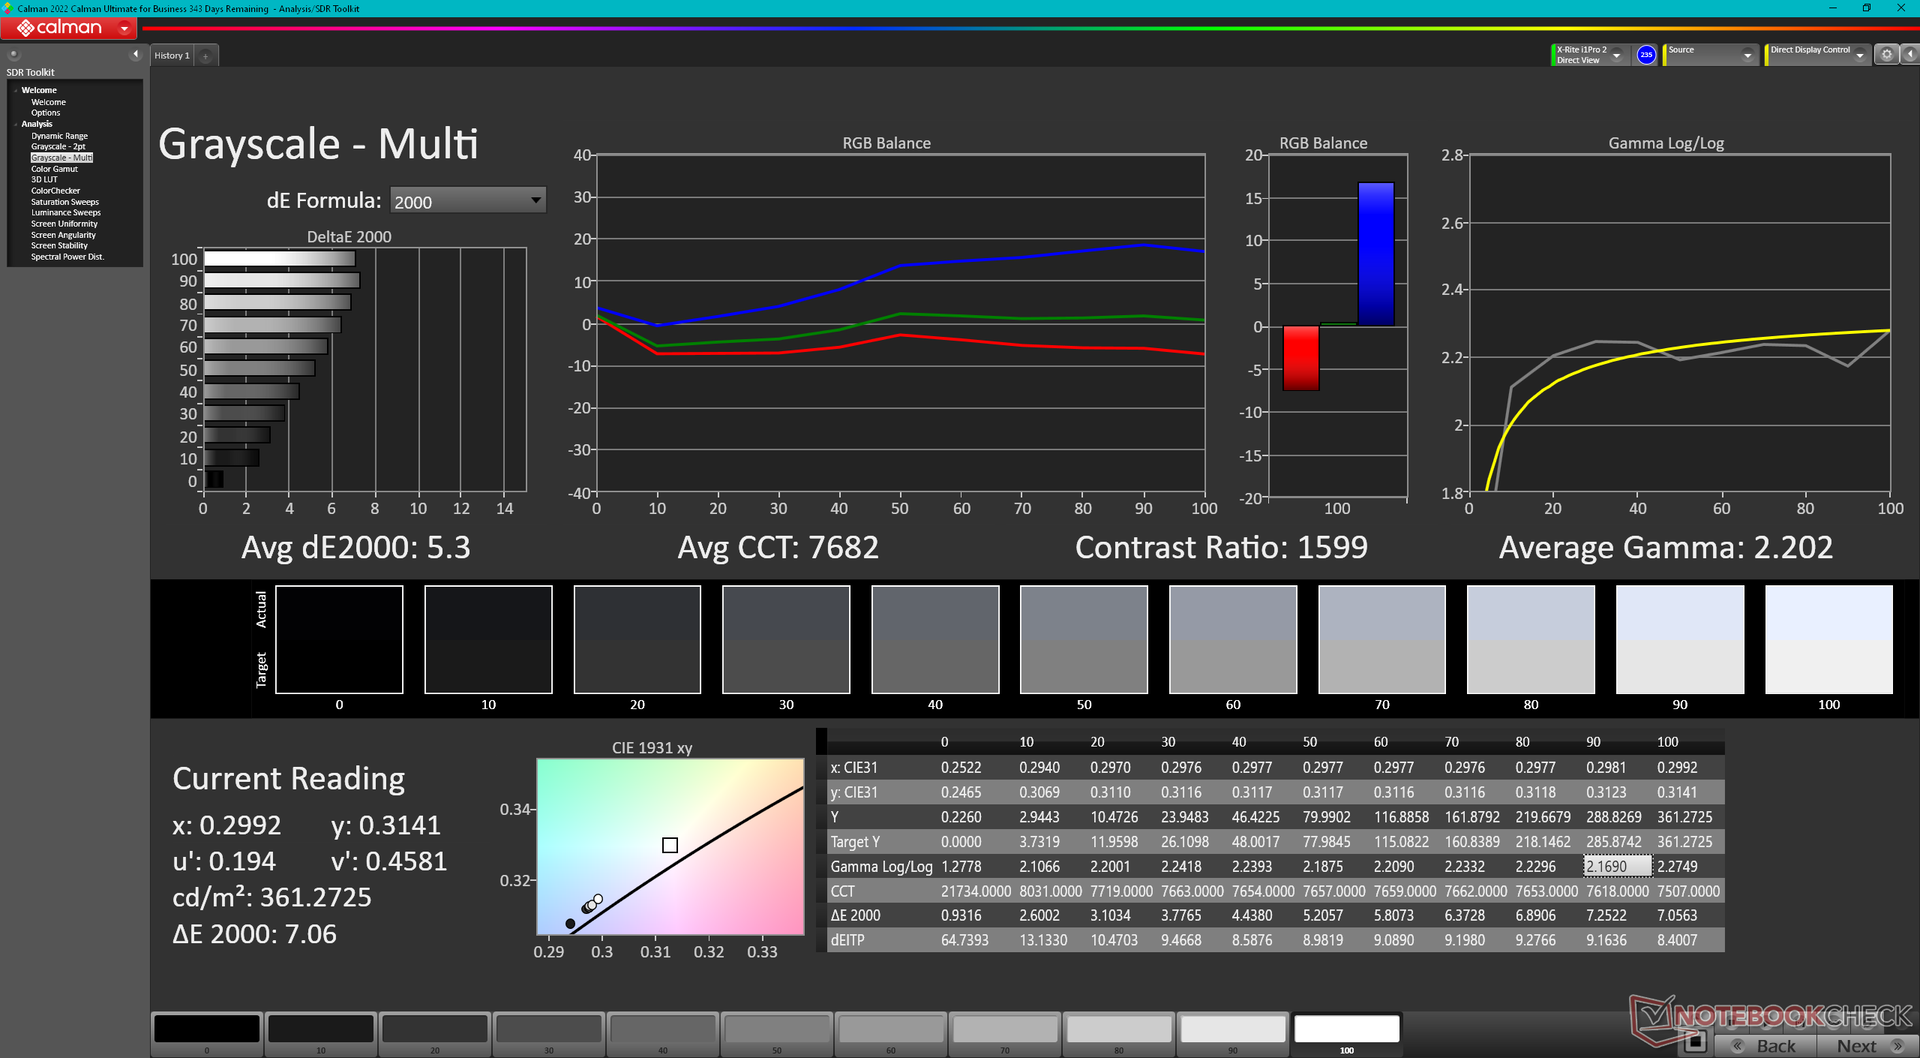
Distribution av ljusstyrkan: 86 %
Mitt på batteriet: 352.3 cd/m²
Kontrast: 1305:1 (Svärta: 0.27 cd/m²)
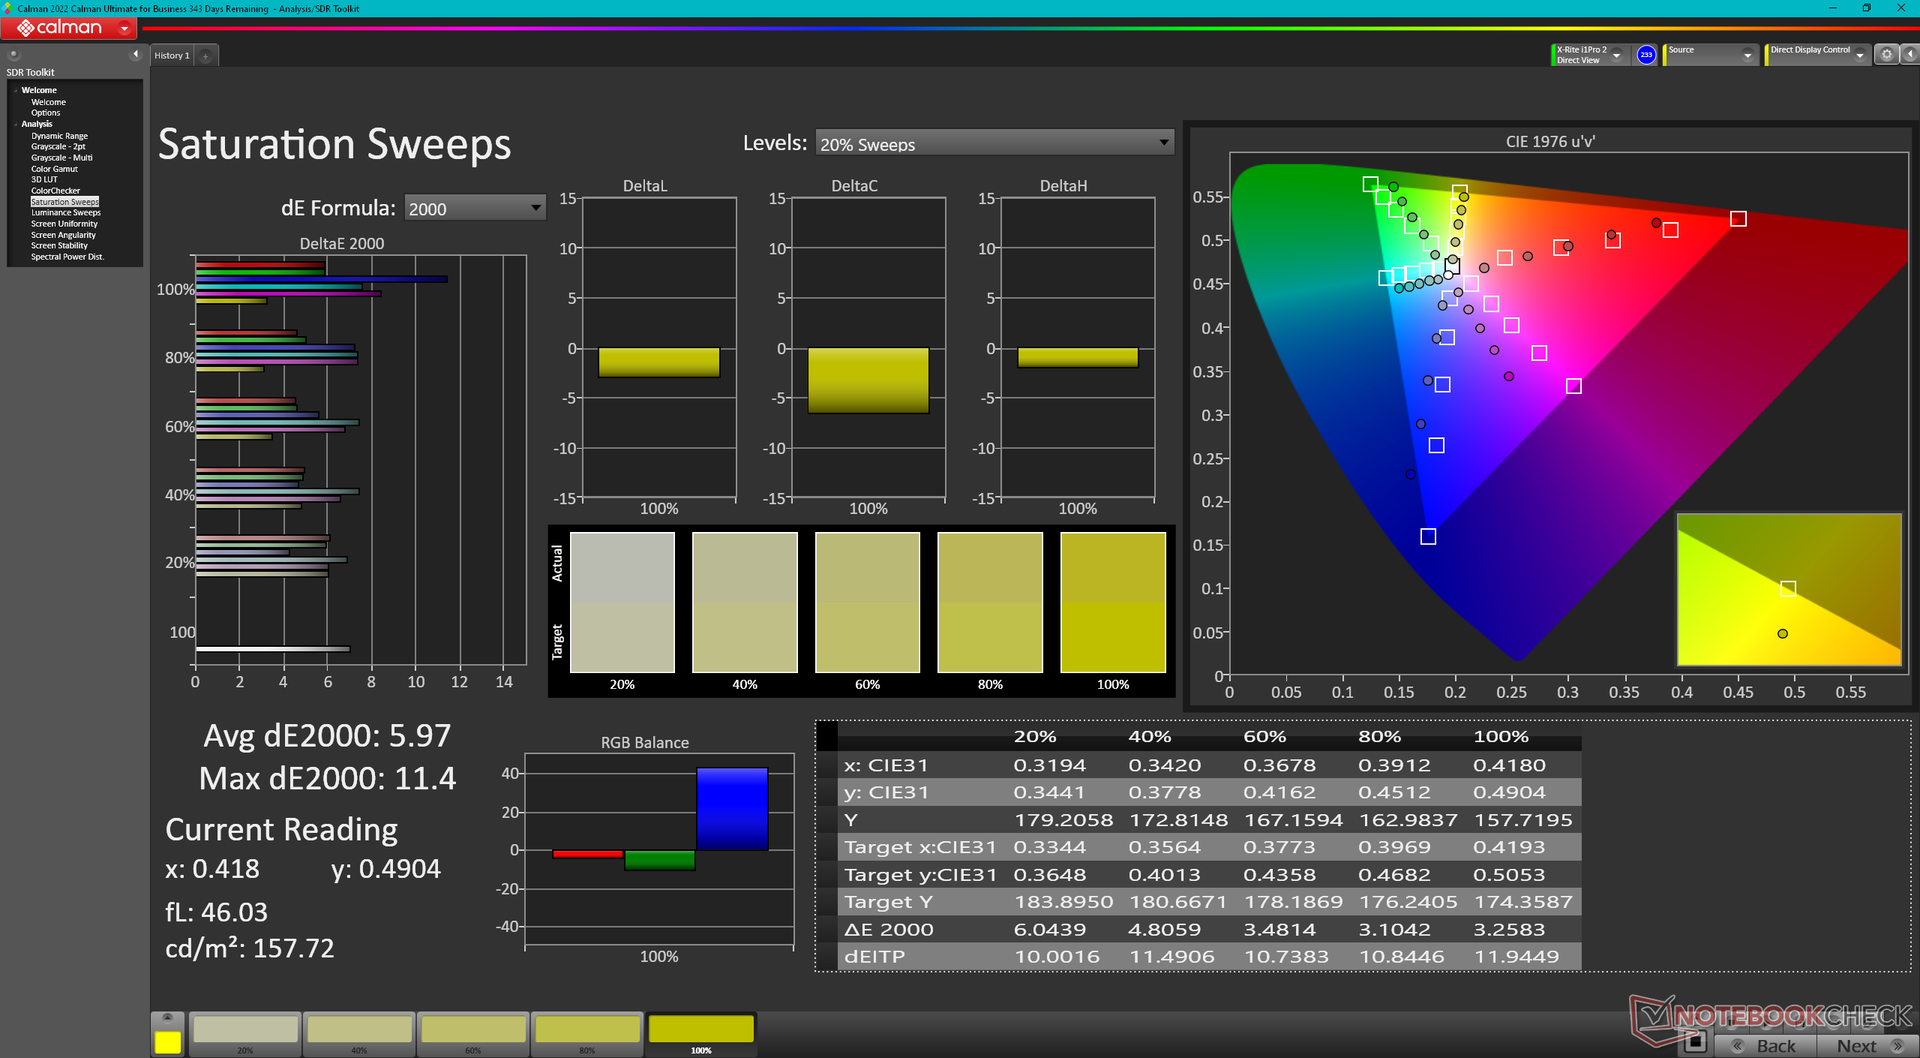
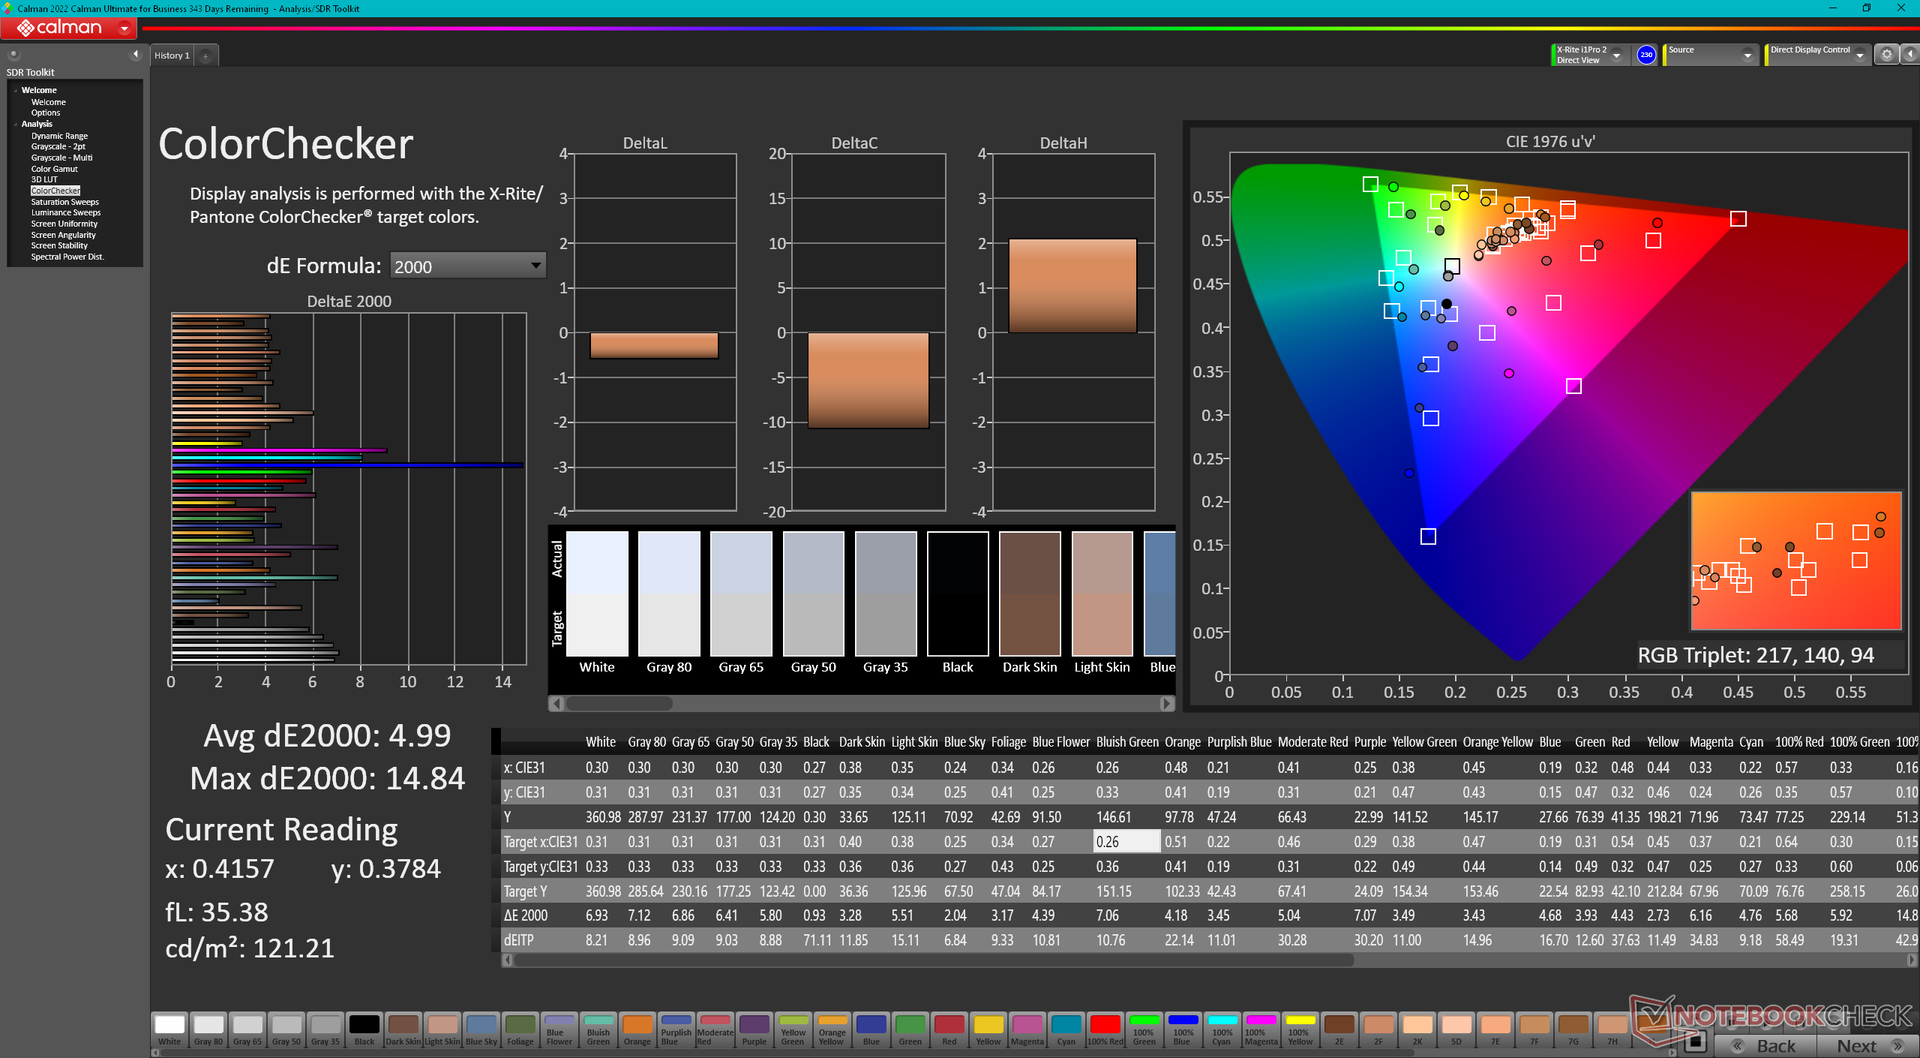
ΔE ColorChecker Calman: 4.99 | ∀{0.5-29.43 Ø4.73}
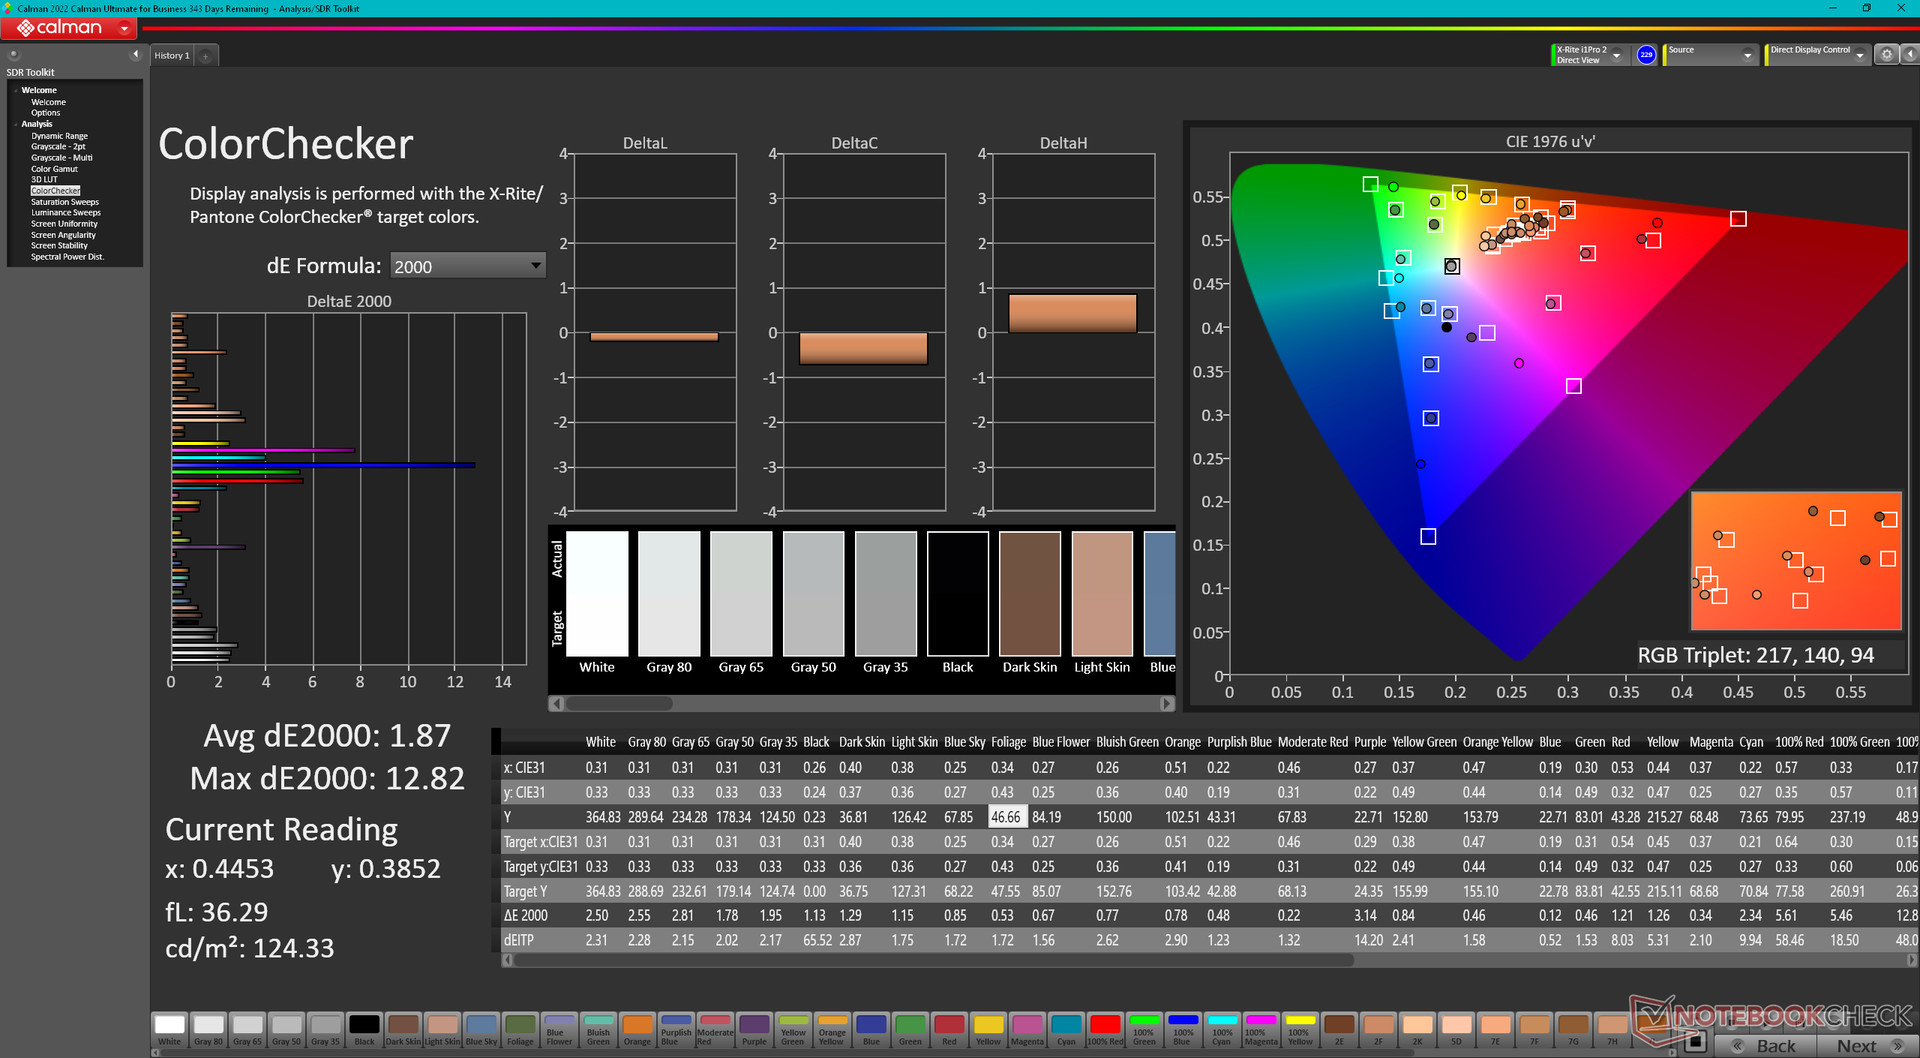
calibrated: 1.87
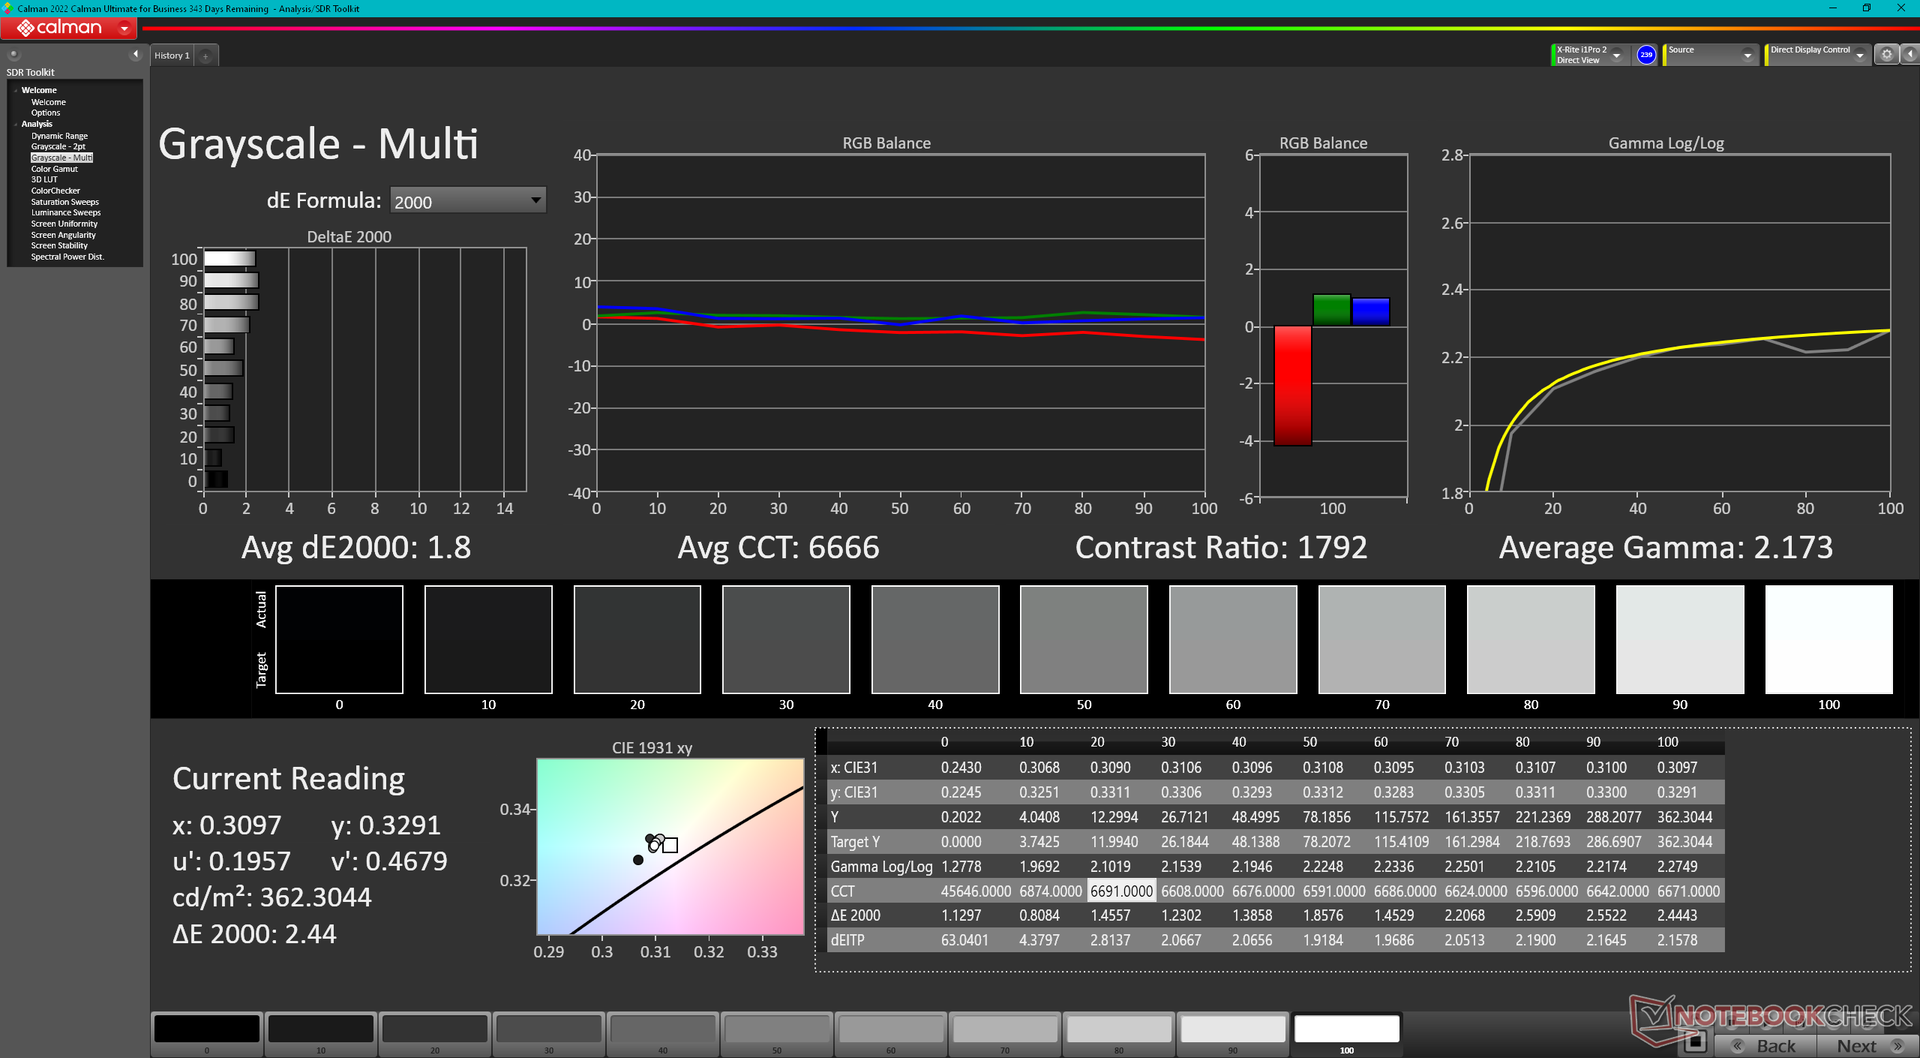
ΔE Greyscale Calman: 5.3 | ∀{0.09-98 Ø4.97}
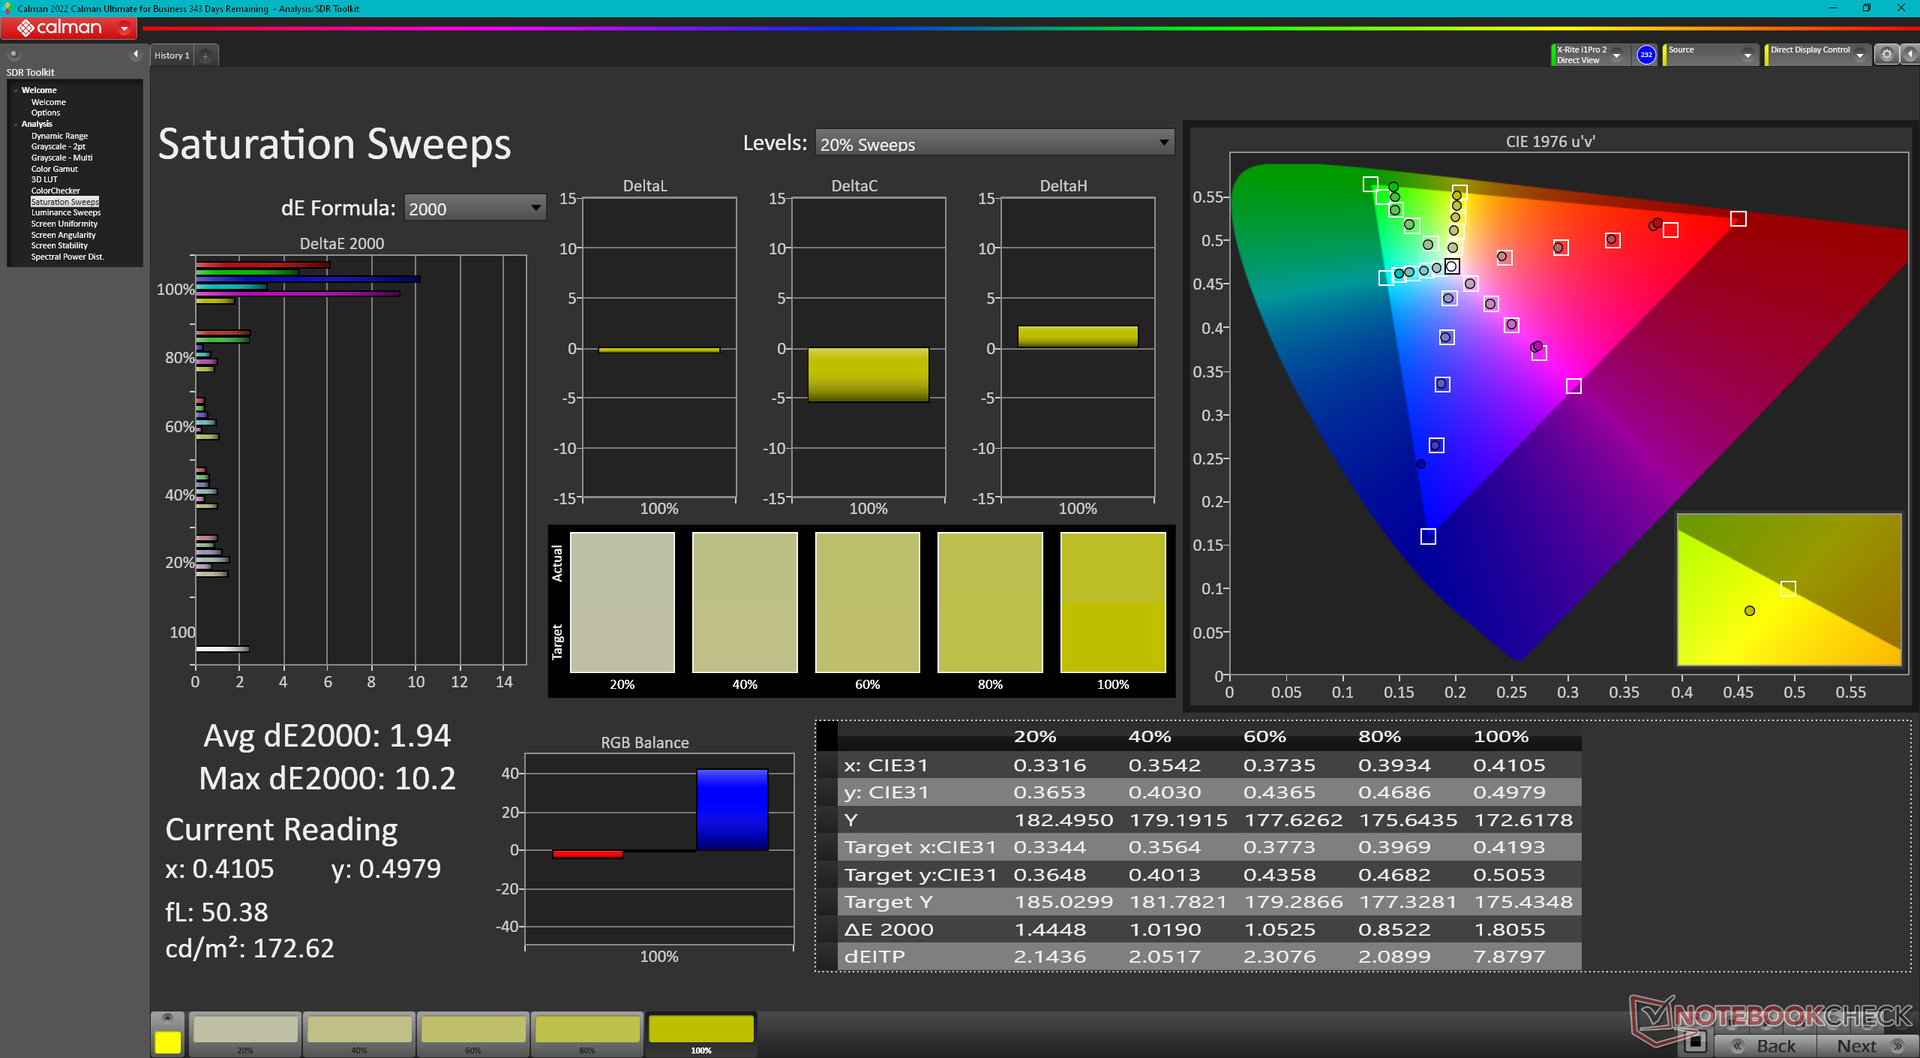
43.3% AdobeRGB 1998 (Argyll 3D)
63% sRGB (Argyll 3D)
41.9% Display P3 (Argyll 3D)
Gamma: 2.2
CCT: 7682 K
| Lenovo ThinkPad E14 G5 i7-1355U R140NW4D R5, IPS, 1920x1200, 14" | Lenovo ThinkPad E14 G5-21JSS05C00 M140NWHE R1, IPS, 2240x1400, 14" | HP EliteBook 845 G10 818N0EA AUO6DA8, IPS, 2560x1600, 14" | Asus ZenBook 14 UM3402Y Samsung ATNA40YK07-1, OLED, 2880x1800, 14" | LG Gram 14Z90Q LG LP140WU1-SPF1, IPS, 1920x1200, 14" | Dell Latitude 7440 AU Optronics B140QAX, IPS, 2560x1600, 14" | |
|---|---|---|---|---|---|---|
| Display | 61% | 97% | 108% | 97% | 72% | |
| Display P3 Coverage (%) | 41.9 | 69.3 65% | 98.3 135% | 99.9 138% | 98.4 135% | 75.4 80% |
| sRGB Coverage (%) | 63 | 97.6 55% | 99.8 58% | 100 59% | 99.9 59% | 99.9 59% |
| AdobeRGB 1998 Coverage (%) | 43.3 | 70.4 63% | 86.2 99% | 98.3 127% | 85.9 98% | 76.2 76% |
| Response Times | -9% | 60% | 94% | -40% | -70% | |
| Response Time Grey 50% / Grey 80% * (ms) | 30.7 ? | 36.3 ? -18% | 12.7 ? 59% | 1.19 ? 96% | 47.5 ? -55% | 56 ? -82% |
| Response Time Black / White * (ms) | 19.6 ? | 19.5 ? 1% | 7.9 ? 60% | 1.62 ? 92% | 24.5 ? -25% | 30.8 ? -57% |
| PWM Frequency (Hz) | 362.3 ? | |||||
| Screen | 33% | 38% | 41% | 14% | 22% | |
| Brightness middle (cd/m²) | 352.3 | 362 3% | 546 55% | 336.6 -4% | 341 -3% | 517.3 47% |
| Brightness (cd/m²) | 344 | 354 3% | 564 64% | 339 -1% | 305 -11% | 488 42% |
| Brightness Distribution (%) | 86 | 91 6% | 86 0% | 98 14% | 87 1% | 88 2% |
| Black Level * (cd/m²) | 0.27 | 0.18 33% | 0.38 -41% | 0.26 4% | 0.34 -26% | |
| Contrast (:1) | 1305 | 2011 54% | 1437 10% | 1312 1% | 1521 17% | |
| Colorchecker dE 2000 * | 4.99 | 2.6 48% | 1.3 74% | 0.84 83% | 3.11 38% | 3.3 34% |
| Colorchecker dE 2000 max. * | 14.84 | 3.7 75% | 5.3 64% | 3.1 79% | 8.29 44% | 7.81 47% |
| Colorchecker dE 2000 calibrated * | 1.87 | 1.1 41% | 1.2 36% | 0.83 56% | 1.02 45% | |
| Greyscale dE 2000 * | 5.3 | 3.3 38% | 1.1 79% | 1.4 74% | 5.3 -0% | 5.6 -6% |
| Gamma | 2.2 100% | 2.28 96% | 2.27 97% | 2.24 98% | 2.037 108% | 2.37 93% |
| CCT | 7682 85% | 6761 96% | 6463 101% | 6439 101% | 7571 86% | 6804 96% |
| Totalt genomsnitt (program/inställningar) | 28% /
33% | 65% /
54% | 81% /
69% | 24% /
24% | 8% /
20% |
* ... mindre är bättre
Skärmen levereras inte förkalibrerad. Om vi kalibrerar panelen själva med en X-Rite kolorimeter skulle vi förbättra de genomsnittliga deltaE-värdena för gråskala och färg från 5,3 och 4,99 till bara 1,8 respektive 1,87. Vår ICM-profil är tillgänglig för gratis nedladdning ovan.
Visa svarstider
| ↔ Svarstid svart till vitt | ||
|---|---|---|
| 19.6 ms ... stiga ↗ och falla ↘ kombinerat | ↗ 9.8 ms stiga | 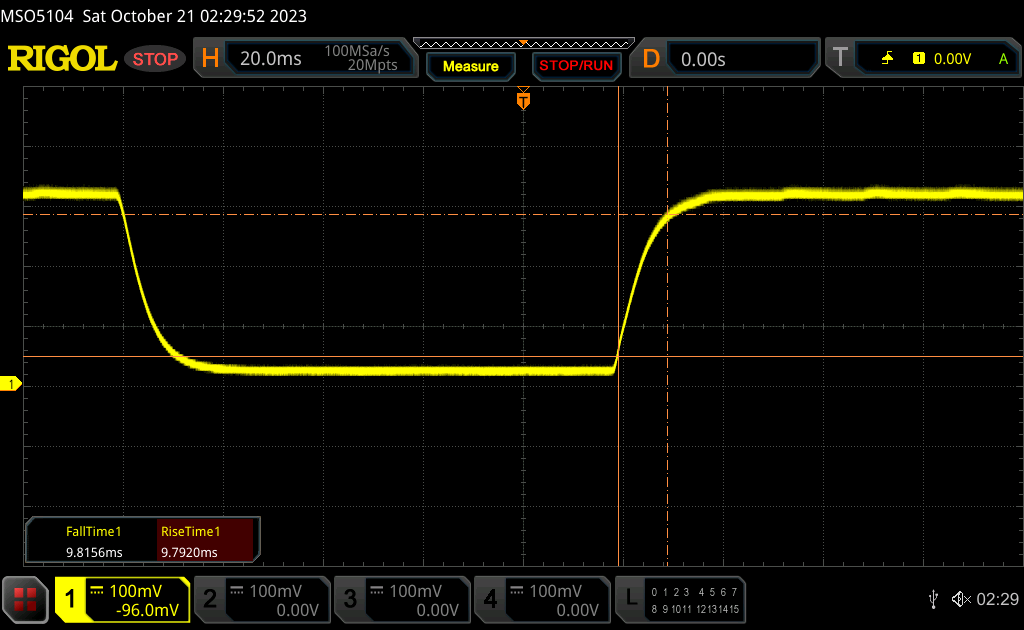 |
| ↘ 9.8 ms hösten | ||
| Skärmen visar bra svarsfrekvens i våra tester, men kan vara för långsam för konkurrenskraftiga spelare. I jämförelse sträcker sig alla testade enheter från 0.1 (minst) till 240 (maximalt) ms. » 43 % av alla enheter är bättre. Det betyder att den uppmätta svarstiden liknar genomsnittet av alla testade enheter (19.9 ms). | ||
| ↔ Svarstid 50 % grått till 80 % grått | ||
| 30.7 ms ... stiga ↗ och falla ↘ kombinerat | ↗ 14.7 ms stiga | 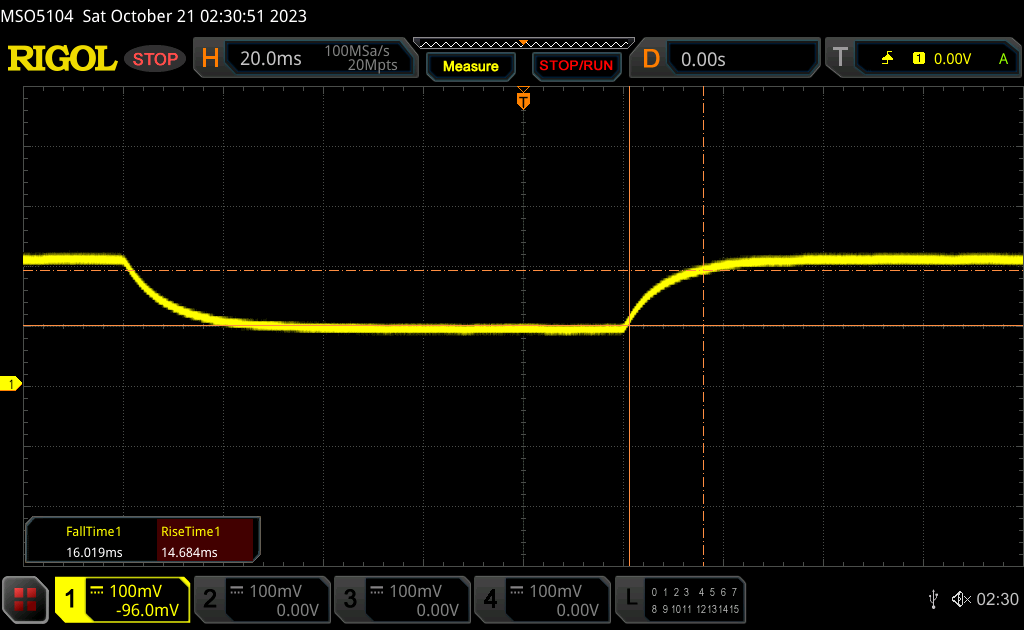 |
| ↘ 16 ms hösten | ||
| Skärmen visar långsamma svarsfrekvenser i våra tester och kommer att vara otillfredsställande för spelare. I jämförelse sträcker sig alla testade enheter från 0.165 (minst) till 636 (maximalt) ms. » 41 % av alla enheter är bättre. Det betyder att den uppmätta svarstiden liknar genomsnittet av alla testade enheter (31.1 ms). | ||
Skärmflimmer / PWM (Puls-Width Modulation)
| Skärmflimmer / PWM upptäcktes inte | 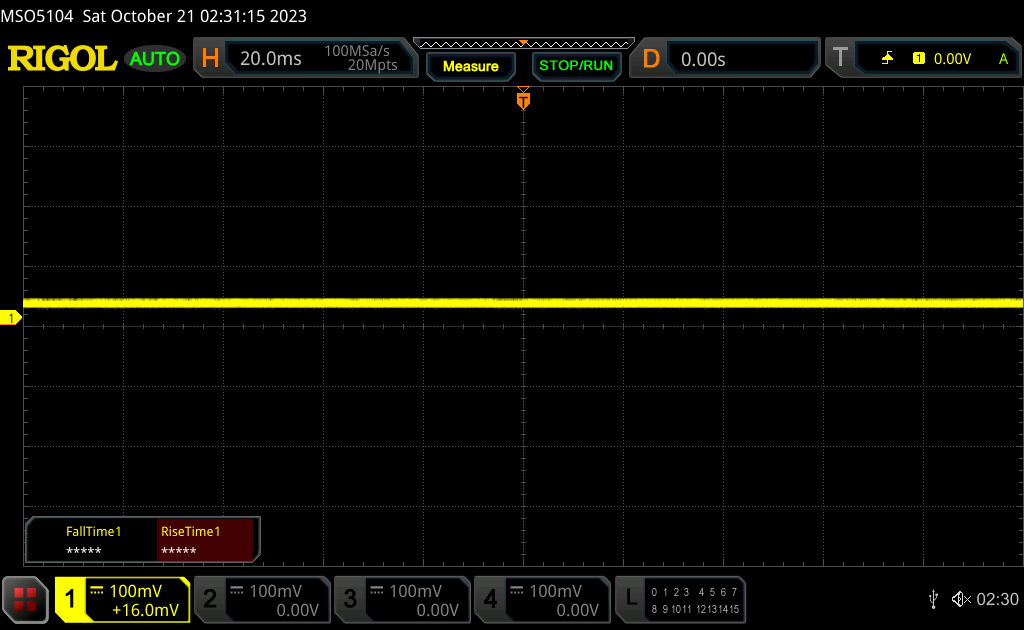 | ||
Som jämförelse: 52 % av alla testade enheter använder inte PWM för att dämpa skärmen. Om PWM upptäcktes mättes ett medelvärde av 7798 (minst: 5 - maximum: 343500) Hz. | |||
Prestanda
Villkor för testning
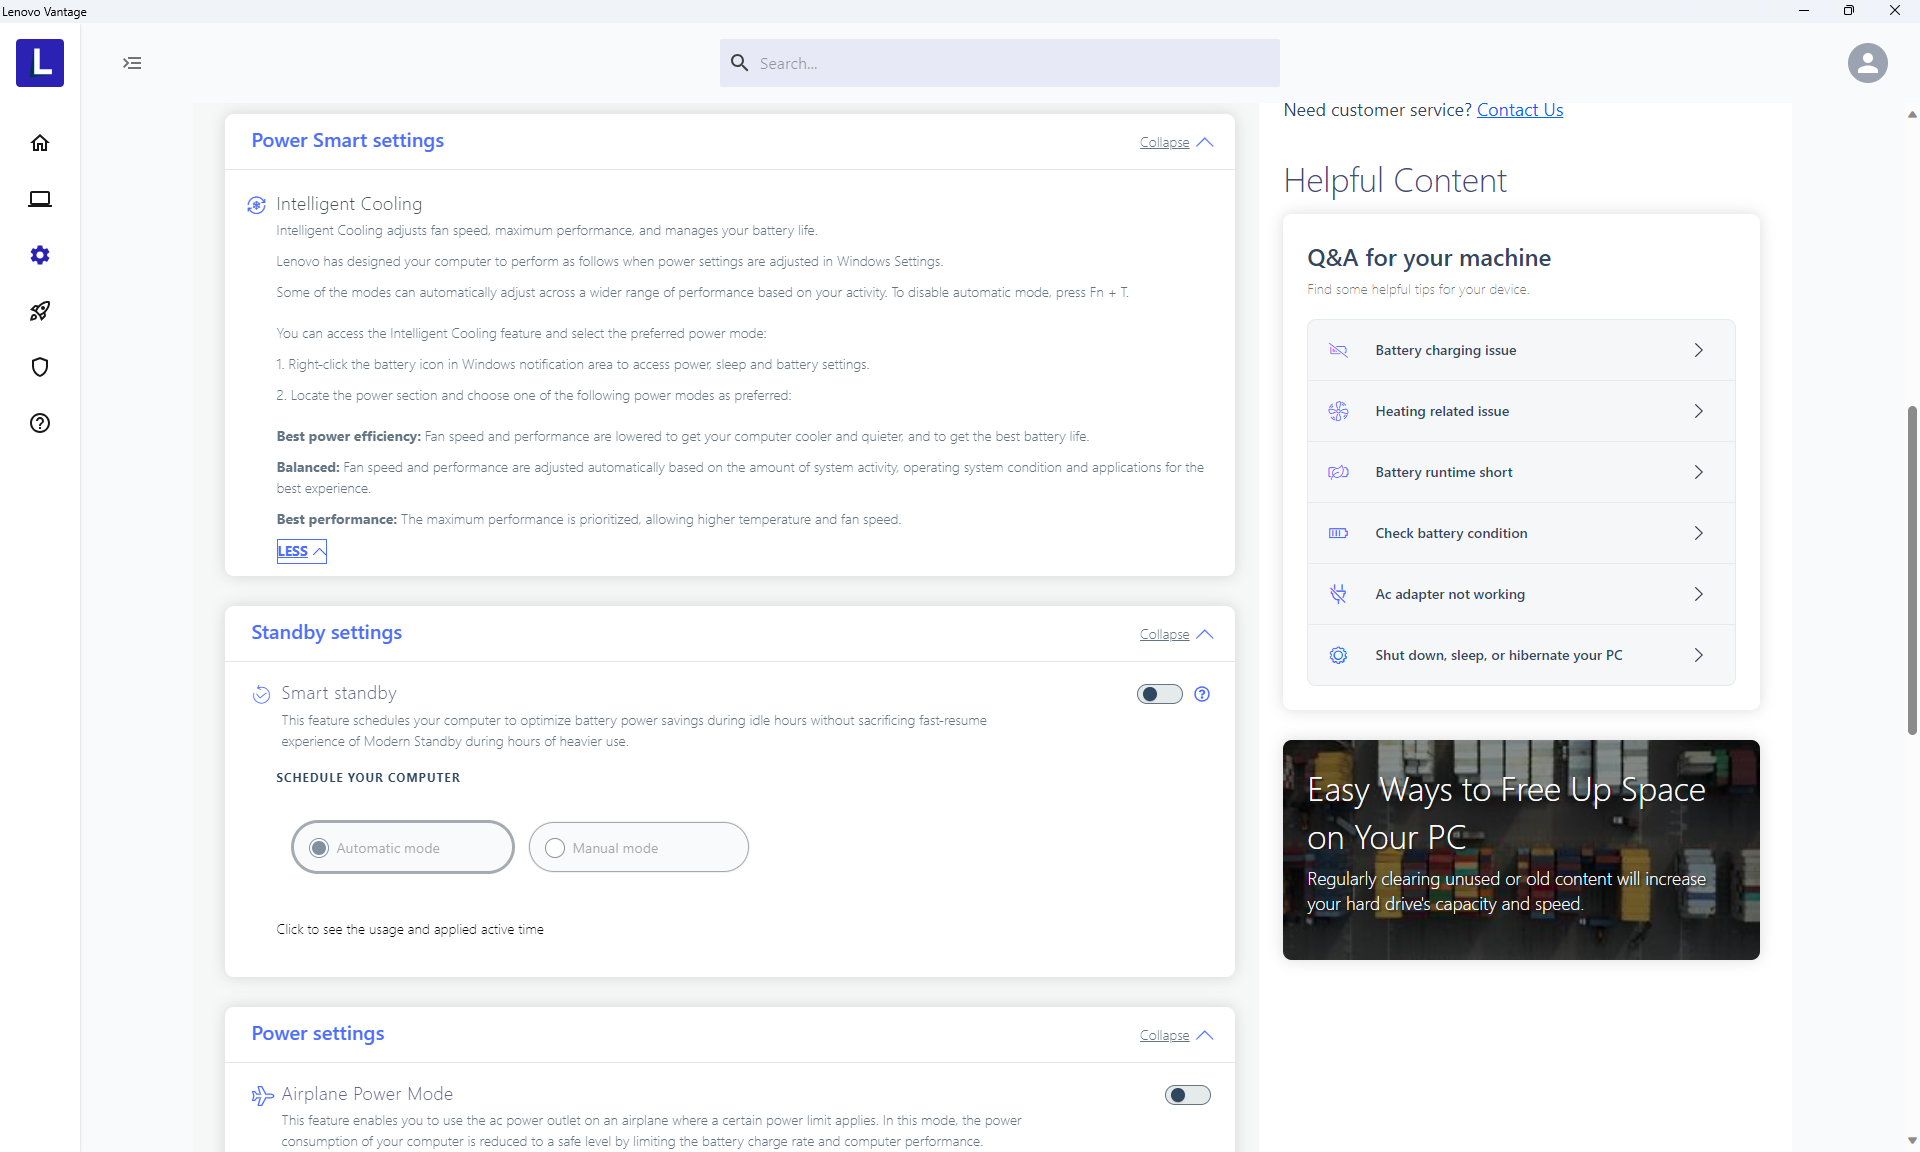
Vi ställde in Windows på prestandaläge före testningen. Lenovo har inte inkluderat några särskilda energiprofiler utan förlitar sig istället på Windows energiprofiler för att minska förvirringen.

Processor
Processorprestanda är svagare än förväntat, cirka 10 till 15 procent långsammare än den genomsnittliga bärbara datorn i vår databas som är utrustad med samma Core i7-1355U. Underskottet kan hänföras till den svaga Turbo Boost-hållbarheten i systemet. När man kör CineBench R15 xT i en loop, till exempel, skulle den ursprungliga poängen på 1539 poäng falla med så mycket som 35 till 40 procent vid den andra loopen, vilket framgår av diagrammet nedan.
Vid jämförelse med Ryzen 7 7730U i den AMD-baserade ThinkPad E14 G5 ger vår Core i7-1355U 25 till 30 procent snabbare enkel trådprestanda men 25 till 30 procent långsammare flertrådsprestanda när strypningen har räknats med.
Cinebench R15 Multi Loop
Cinebench R23: Multi Core | Single Core
Cinebench R20: CPU (Multi Core) | CPU (Single Core)
Cinebench R15: CPU Multi 64Bit | CPU Single 64Bit
Blender: v2.79 BMW27 CPU
7-Zip 18.03: 7z b 4 | 7z b 4 -mmt1
Geekbench 5.5: Multi-Core | Single-Core
HWBOT x265 Benchmark v2.2: 4k Preset
LibreOffice : 20 Documents To PDF
R Benchmark 2.5: Overall mean
* ... mindre är bättre
AIDA64: FP32 Ray-Trace | FPU Julia | CPU SHA3 | CPU Queen | FPU SinJulia | FPU Mandel | CPU AES | CPU ZLib | FP64 Ray-Trace | CPU PhotoWorxx
| Performance rating | |
| HP EliteBook 845 G10 818N0EA | |
| Asus ZenBook 14 UM3402Y | |
| Lenovo ThinkPad E14 G5-21JSS05C00 | |
| Dell Latitude 7440 | |
| Genomsnitt Intel Core i7-1355U | |
| Lenovo ThinkPad E14 G5 i7-1355U | |
| LG Gram 14Z90Q | |
| AIDA64 / FP32 Ray-Trace | |
| HP EliteBook 845 G10 818N0EA | |
| Asus ZenBook 14 UM3402Y | |
| Lenovo ThinkPad E14 G5-21JSS05C00 | |
| Dell Latitude 7440 | |
| Genomsnitt Intel Core i7-1355U (5673 - 8424, n=18) | |
| Lenovo ThinkPad E14 G5 i7-1355U | |
| LG Gram 14Z90Q | |
| AIDA64 / FPU Julia | |
| HP EliteBook 845 G10 818N0EA | |
| Asus ZenBook 14 UM3402Y | |
| Lenovo ThinkPad E14 G5-21JSS05C00 | |
| Dell Latitude 7440 | |
| Genomsnitt Intel Core i7-1355U (29580 - 42706, n=18) | |
| Lenovo ThinkPad E14 G5 i7-1355U | |
| LG Gram 14Z90Q | |
| AIDA64 / CPU SHA3 | |
| HP EliteBook 845 G10 818N0EA | |
| Asus ZenBook 14 UM3402Y | |
| Lenovo ThinkPad E14 G5-21JSS05C00 | |
| Dell Latitude 7440 | |
| Genomsnitt Intel Core i7-1355U (1529 - 2200, n=18) | |
| Lenovo ThinkPad E14 G5 i7-1355U | |
| LG Gram 14Z90Q | |
| AIDA64 / CPU Queen | |
| HP EliteBook 845 G10 818N0EA | |
| Asus ZenBook 14 UM3402Y | |
| Lenovo ThinkPad E14 G5-21JSS05C00 | |
| LG Gram 14Z90Q | |
| Lenovo ThinkPad E14 G5 i7-1355U | |
| Dell Latitude 7440 | |
| Genomsnitt Intel Core i7-1355U (21547 - 66907, n=18) | |
| AIDA64 / FPU SinJulia | |
| HP EliteBook 845 G10 818N0EA | |
| Asus ZenBook 14 UM3402Y | |
| Lenovo ThinkPad E14 G5-21JSS05C00 | |
| Dell Latitude 7440 | |
| Lenovo ThinkPad E14 G5 i7-1355U | |
| Genomsnitt Intel Core i7-1355U (4045 - 5426, n=18) | |
| LG Gram 14Z90Q | |
| AIDA64 / FPU Mandel | |
| HP EliteBook 845 G10 818N0EA | |
| Asus ZenBook 14 UM3402Y | |
| Lenovo ThinkPad E14 G5-21JSS05C00 | |
| Dell Latitude 7440 | |
| Genomsnitt Intel Core i7-1355U (14596 - 21627, n=18) | |
| Lenovo ThinkPad E14 G5 i7-1355U | |
| LG Gram 14Z90Q | |
| AIDA64 / CPU AES | |
| HP EliteBook 845 G10 818N0EA | |
| Asus ZenBook 14 UM3402Y | |
| Lenovo ThinkPad E14 G5-21JSS05C00 | |
| Dell Latitude 7440 | |
| Genomsnitt Intel Core i7-1355U (31432 - 75408, n=18) | |
| Lenovo ThinkPad E14 G5 i7-1355U | |
| LG Gram 14Z90Q | |
| AIDA64 / CPU ZLib | |
| HP EliteBook 845 G10 818N0EA | |
| Asus ZenBook 14 UM3402Y | |
| Lenovo ThinkPad E14 G5-21JSS05C00 | |
| Dell Latitude 7440 | |
| Genomsnitt Intel Core i7-1355U (454 - 684, n=18) | |
| Lenovo ThinkPad E14 G5 i7-1355U | |
| LG Gram 14Z90Q | |
| AIDA64 / FP64 Ray-Trace | |
| HP EliteBook 845 G10 818N0EA | |
| Asus ZenBook 14 UM3402Y | |
| Lenovo ThinkPad E14 G5-21JSS05C00 | |
| Dell Latitude 7440 | |
| Genomsnitt Intel Core i7-1355U (2991 - 4453, n=18) | |
| LG Gram 14Z90Q | |
| Lenovo ThinkPad E14 G5 i7-1355U | |
| AIDA64 / CPU PhotoWorxx | |
| Dell Latitude 7440 | |
| Genomsnitt Intel Core i7-1355U (21800 - 46154, n=18) | |
| HP EliteBook 845 G10 818N0EA | |
| LG Gram 14Z90Q | |
| Lenovo ThinkPad E14 G5 i7-1355U | |
| Asus ZenBook 14 UM3402Y | |
| Lenovo ThinkPad E14 G5-21JSS05C00 | |
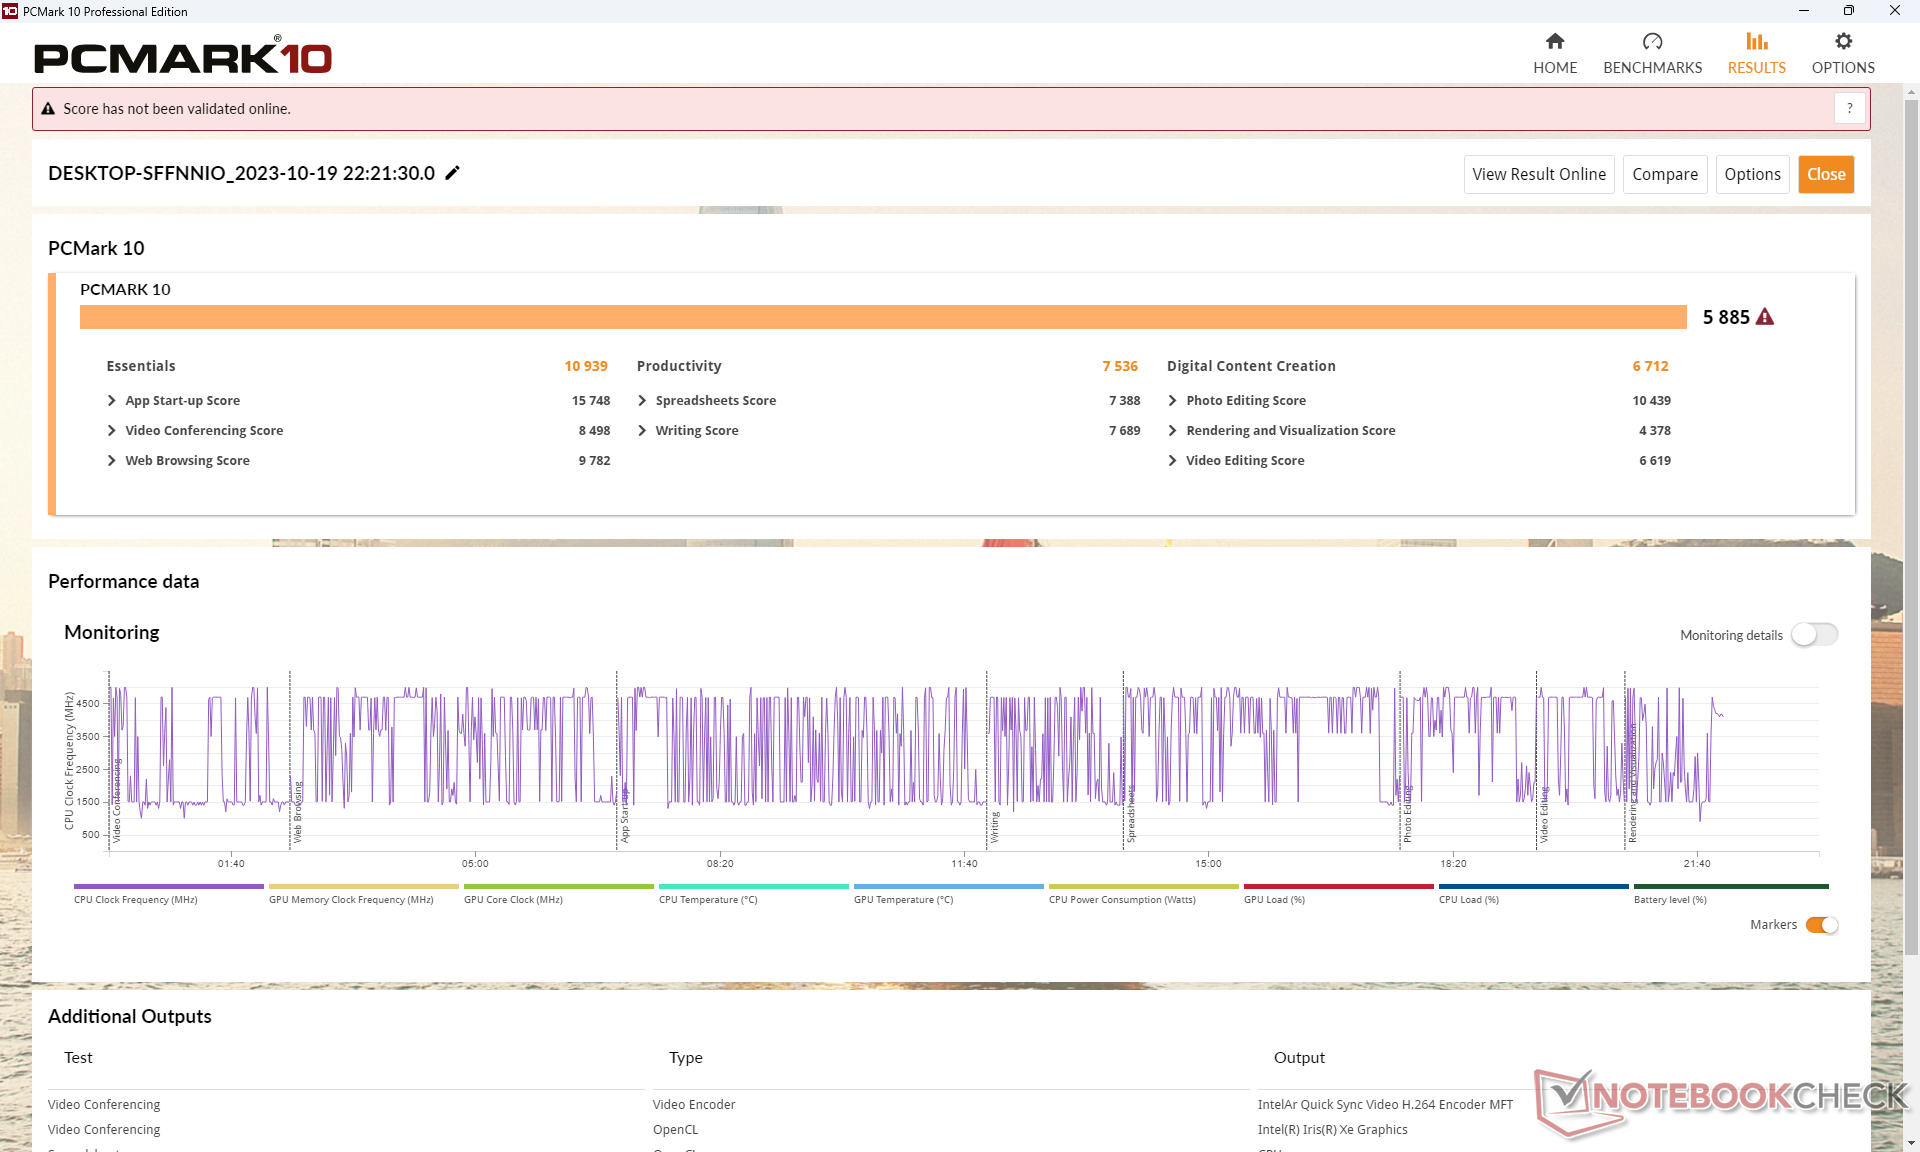
Systemets prestanda
PCMark-resultaten är generellt lägre än för AMD-konfigurationen, särskilt i deltestet Productivity där flertrådsprestanda är viktigast.
CrossMark: Overall | Productivity | Creativity | Responsiveness
| PCMark 10 / Score | |
| HP EliteBook 845 G10 818N0EA | |
| Lenovo ThinkPad E14 G5-21JSS05C00 | |
| Asus ZenBook 14 UM3402Y | |
| Lenovo ThinkPad E14 G5 i7-1355U | |
| Genomsnitt Intel Core i7-1355U, Intel Iris Xe Graphics G7 96EUs (5455 - 5933, n=15) | |
| Dell Latitude 7440 | |
| LG Gram 14Z90Q | |
| PCMark 10 / Essentials | |
| Genomsnitt Intel Core i7-1355U, Intel Iris Xe Graphics G7 96EUs (10203 - 11822, n=15) | |
| Lenovo ThinkPad E14 G5 i7-1355U | |
| Dell Latitude 7440 | |
| Lenovo ThinkPad E14 G5-21JSS05C00 | |
| Asus ZenBook 14 UM3402Y | |
| HP EliteBook 845 G10 818N0EA | |
| LG Gram 14Z90Q | |
| PCMark 10 / Productivity | |
| Asus ZenBook 14 UM3402Y | |
| Lenovo ThinkPad E14 G5-21JSS05C00 | |
| HP EliteBook 845 G10 818N0EA | |
| Lenovo ThinkPad E14 G5 i7-1355U | |
| Genomsnitt Intel Core i7-1355U, Intel Iris Xe Graphics G7 96EUs (6763 - 7536, n=15) | |
| Dell Latitude 7440 | |
| LG Gram 14Z90Q | |
| PCMark 10 / Digital Content Creation | |
| HP EliteBook 845 G10 818N0EA | |
| Lenovo ThinkPad E14 G5 i7-1355U | |
| Genomsnitt Intel Core i7-1355U, Intel Iris Xe Graphics G7 96EUs (5723 - 6712, n=15) | |
| Lenovo ThinkPad E14 G5-21JSS05C00 | |
| Asus ZenBook 14 UM3402Y | |
| Dell Latitude 7440 | |
| LG Gram 14Z90Q | |
| CrossMark / Overall | |
| Genomsnitt Intel Core i7-1355U, Intel Iris Xe Graphics G7 96EUs (1478 - 1643, n=15) | |
| Lenovo ThinkPad E14 G5 i7-1355U | |
| HP EliteBook 845 G10 818N0EA | |
| Asus ZenBook 14 UM3402Y | |
| Lenovo ThinkPad E14 G5-21JSS05C00 | |
| CrossMark / Productivity | |
| Genomsnitt Intel Core i7-1355U, Intel Iris Xe Graphics G7 96EUs (1444 - 1665, n=15) | |
| Lenovo ThinkPad E14 G5 i7-1355U | |
| HP EliteBook 845 G10 818N0EA | |
| Asus ZenBook 14 UM3402Y | |
| Lenovo ThinkPad E14 G5-21JSS05C00 | |
| CrossMark / Creativity | |
| Genomsnitt Intel Core i7-1355U, Intel Iris Xe Graphics G7 96EUs (1563 - 1732, n=15) | |
| Lenovo ThinkPad E14 G5 i7-1355U | |
| HP EliteBook 845 G10 818N0EA | |
| Asus ZenBook 14 UM3402Y | |
| Lenovo ThinkPad E14 G5-21JSS05C00 | |
| CrossMark / Responsiveness | |
| Genomsnitt Intel Core i7-1355U, Intel Iris Xe Graphics G7 96EUs (1217 - 1681, n=15) | |
| Lenovo ThinkPad E14 G5 i7-1355U | |
| HP EliteBook 845 G10 818N0EA | |
| Asus ZenBook 14 UM3402Y | |
| Lenovo ThinkPad E14 G5-21JSS05C00 | |
| PCMark 10 Score | 5885 poäng | |
Hjälp | ||
| AIDA64 / Memory Copy | |
| Dell Latitude 7440 | |
| Genomsnitt Intel Core i7-1355U (35017 - 71600, n=18) | |
| LG Gram 14Z90Q | |
| Asus ZenBook 14 UM3402Y | |
| Lenovo ThinkPad E14 G5 i7-1355U | |
| HP EliteBook 845 G10 818N0EA | |
| Lenovo ThinkPad E14 G5-21JSS05C00 | |
| AIDA64 / Memory Read | |
| LG Gram 14Z90Q | |
| Genomsnitt Intel Core i7-1355U (38551 - 73377, n=18) | |
| Dell Latitude 7440 | |
| Asus ZenBook 14 UM3402Y | |
| Lenovo ThinkPad E14 G5-21JSS05C00 | |
| Lenovo ThinkPad E14 G5 i7-1355U | |
| HP EliteBook 845 G10 818N0EA | |
| AIDA64 / Memory Write | |
| Dell Latitude 7440 | |
| Genomsnitt Intel Core i7-1355U (35910 - 93342, n=18) | |
| LG Gram 14Z90Q | |
| Lenovo ThinkPad E14 G5 i7-1355U | |
| Asus ZenBook 14 UM3402Y | |
| HP EliteBook 845 G10 818N0EA | |
| Lenovo ThinkPad E14 G5-21JSS05C00 | |
| AIDA64 / Memory Latency | |
| LG Gram 14Z90Q | |
| Genomsnitt Intel Core i7-1355U (72.2 - 346, n=18) | |
| Asus ZenBook 14 UM3402Y | |
| HP EliteBook 845 G10 818N0EA | |
| Dell Latitude 7440 | |
| Lenovo ThinkPad E14 G5-21JSS05C00 | |
| Lenovo ThinkPad E14 G5 i7-1355U | |
* ... mindre är bättre
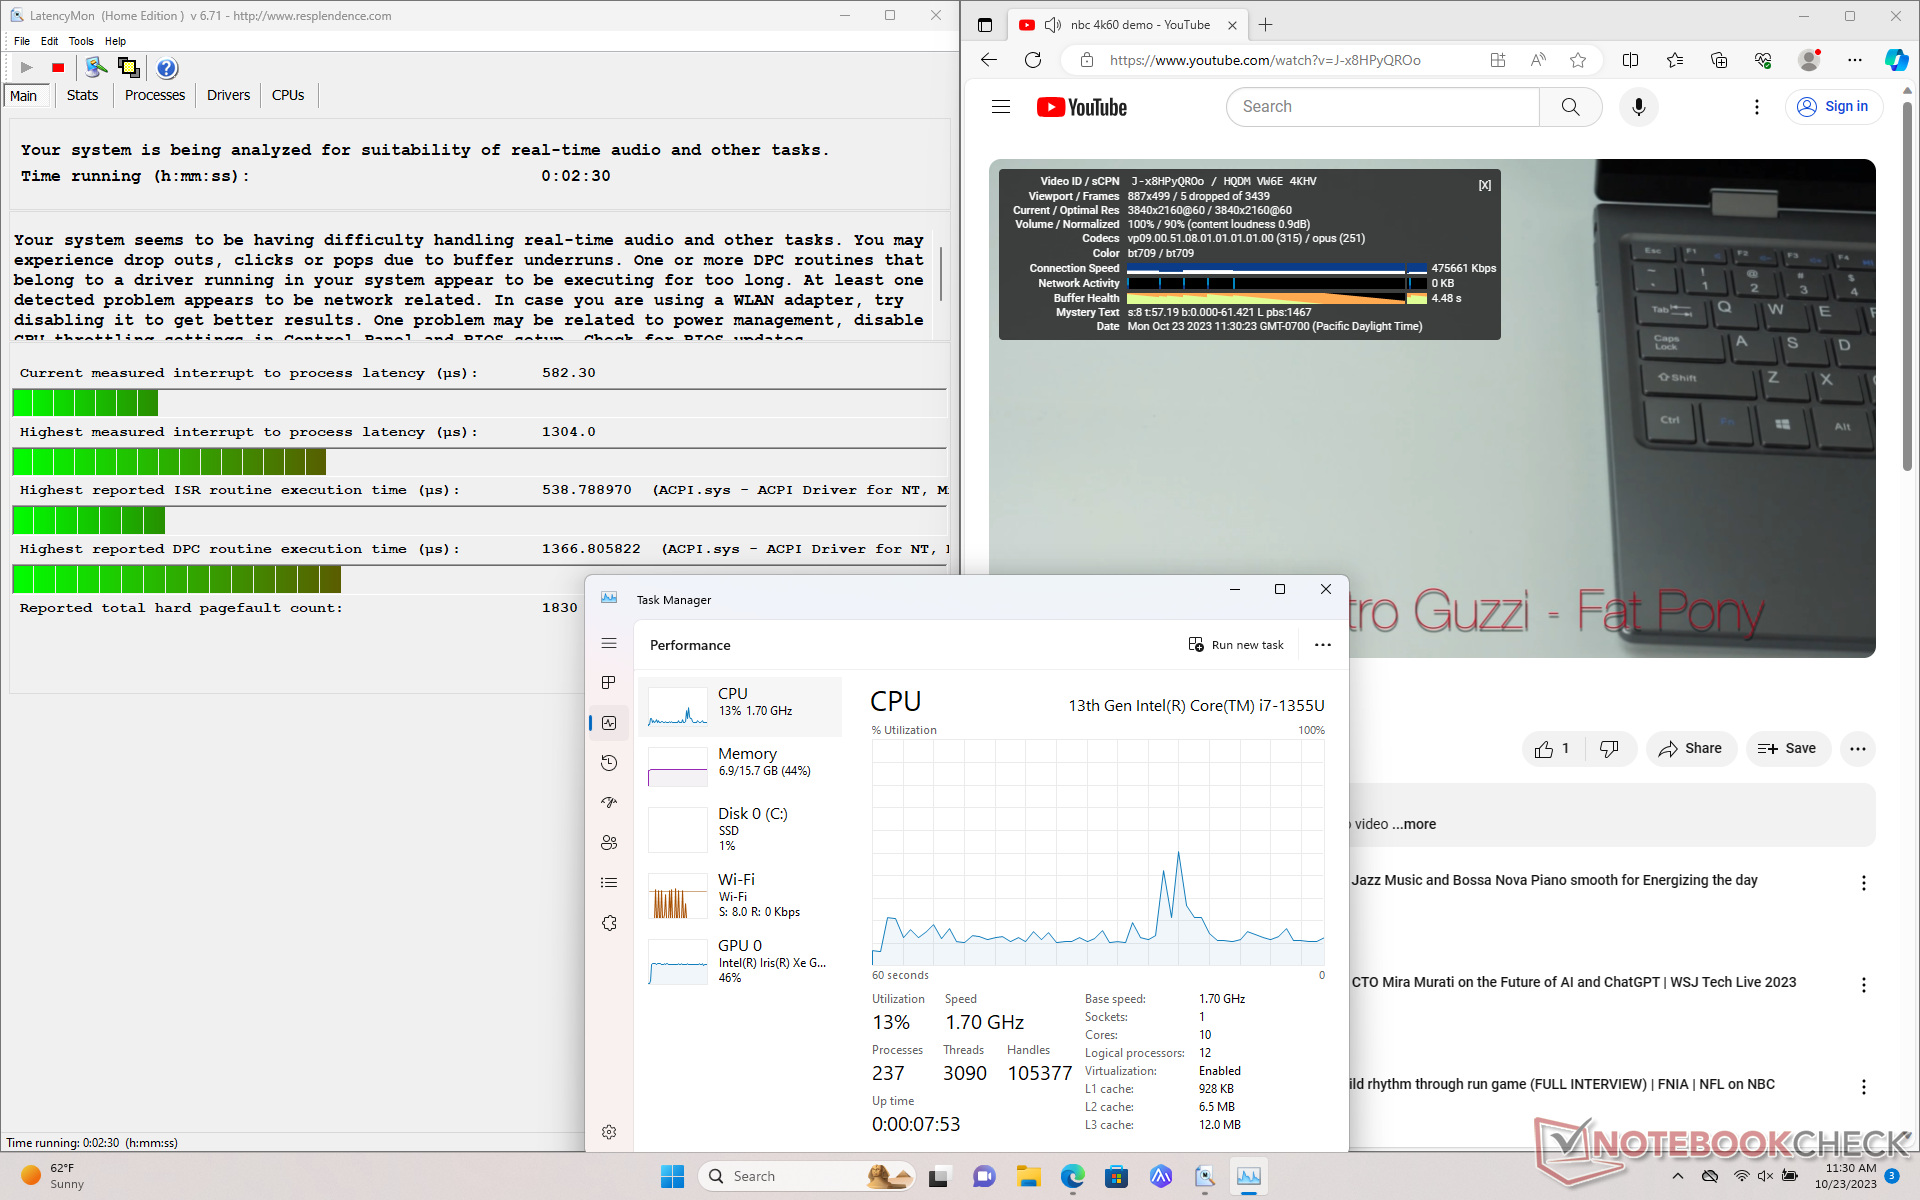
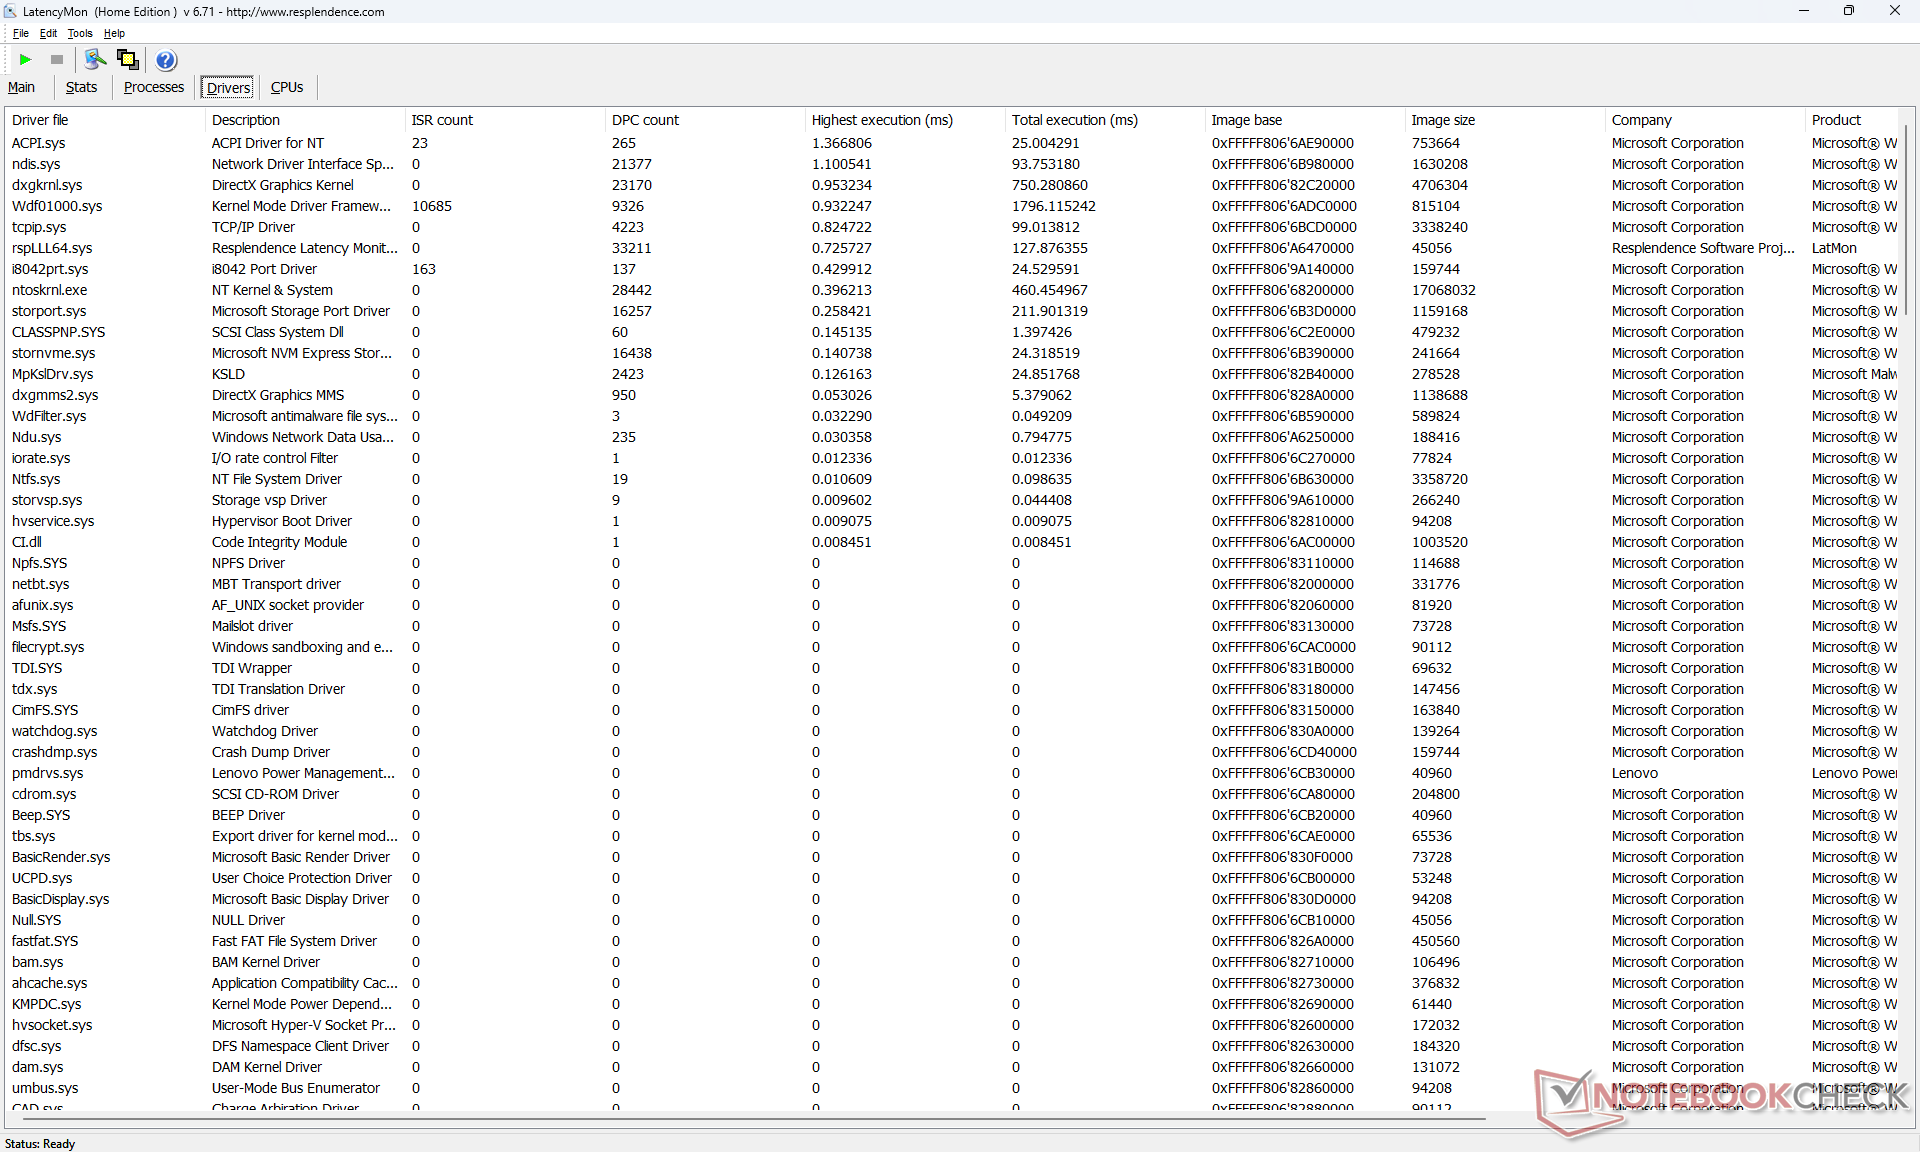
DPC-fördröjning
LatencyMon visar DPC-problem när flera webbläsarflikar öppnas på vår hemsida. 4K-videouppspelning vid 60 FPS är också bristfällig med 5 tappade bildrutor under en 60-sekundersperiod.
| DPC Latencies / LatencyMon - interrupt to process latency (max), Web, Youtube, Prime95 | |
| Asus ZenBook 14 UM3402Y | |
| Lenovo ThinkPad E14 G5-21JSS05C00 | |
| Lenovo ThinkPad E14 G5 i7-1355U | |
| Dell Latitude 7440 | |
| LG Gram 14Z90Q | |
| HP EliteBook 845 G10 818N0EA | |
* ... mindre är bättre
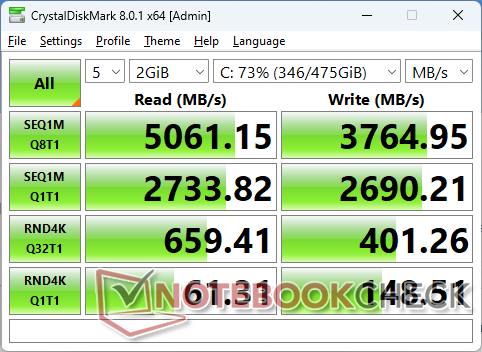
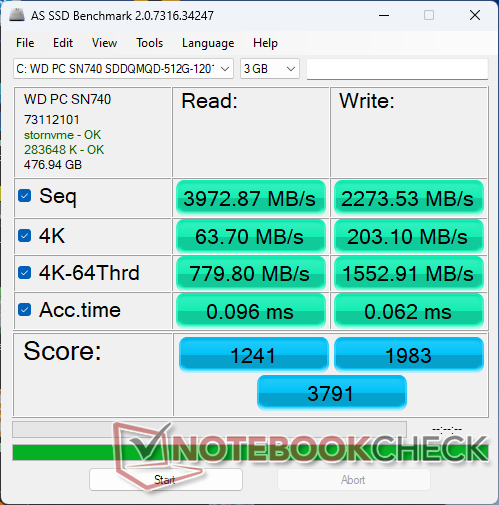
Lagringsenheter
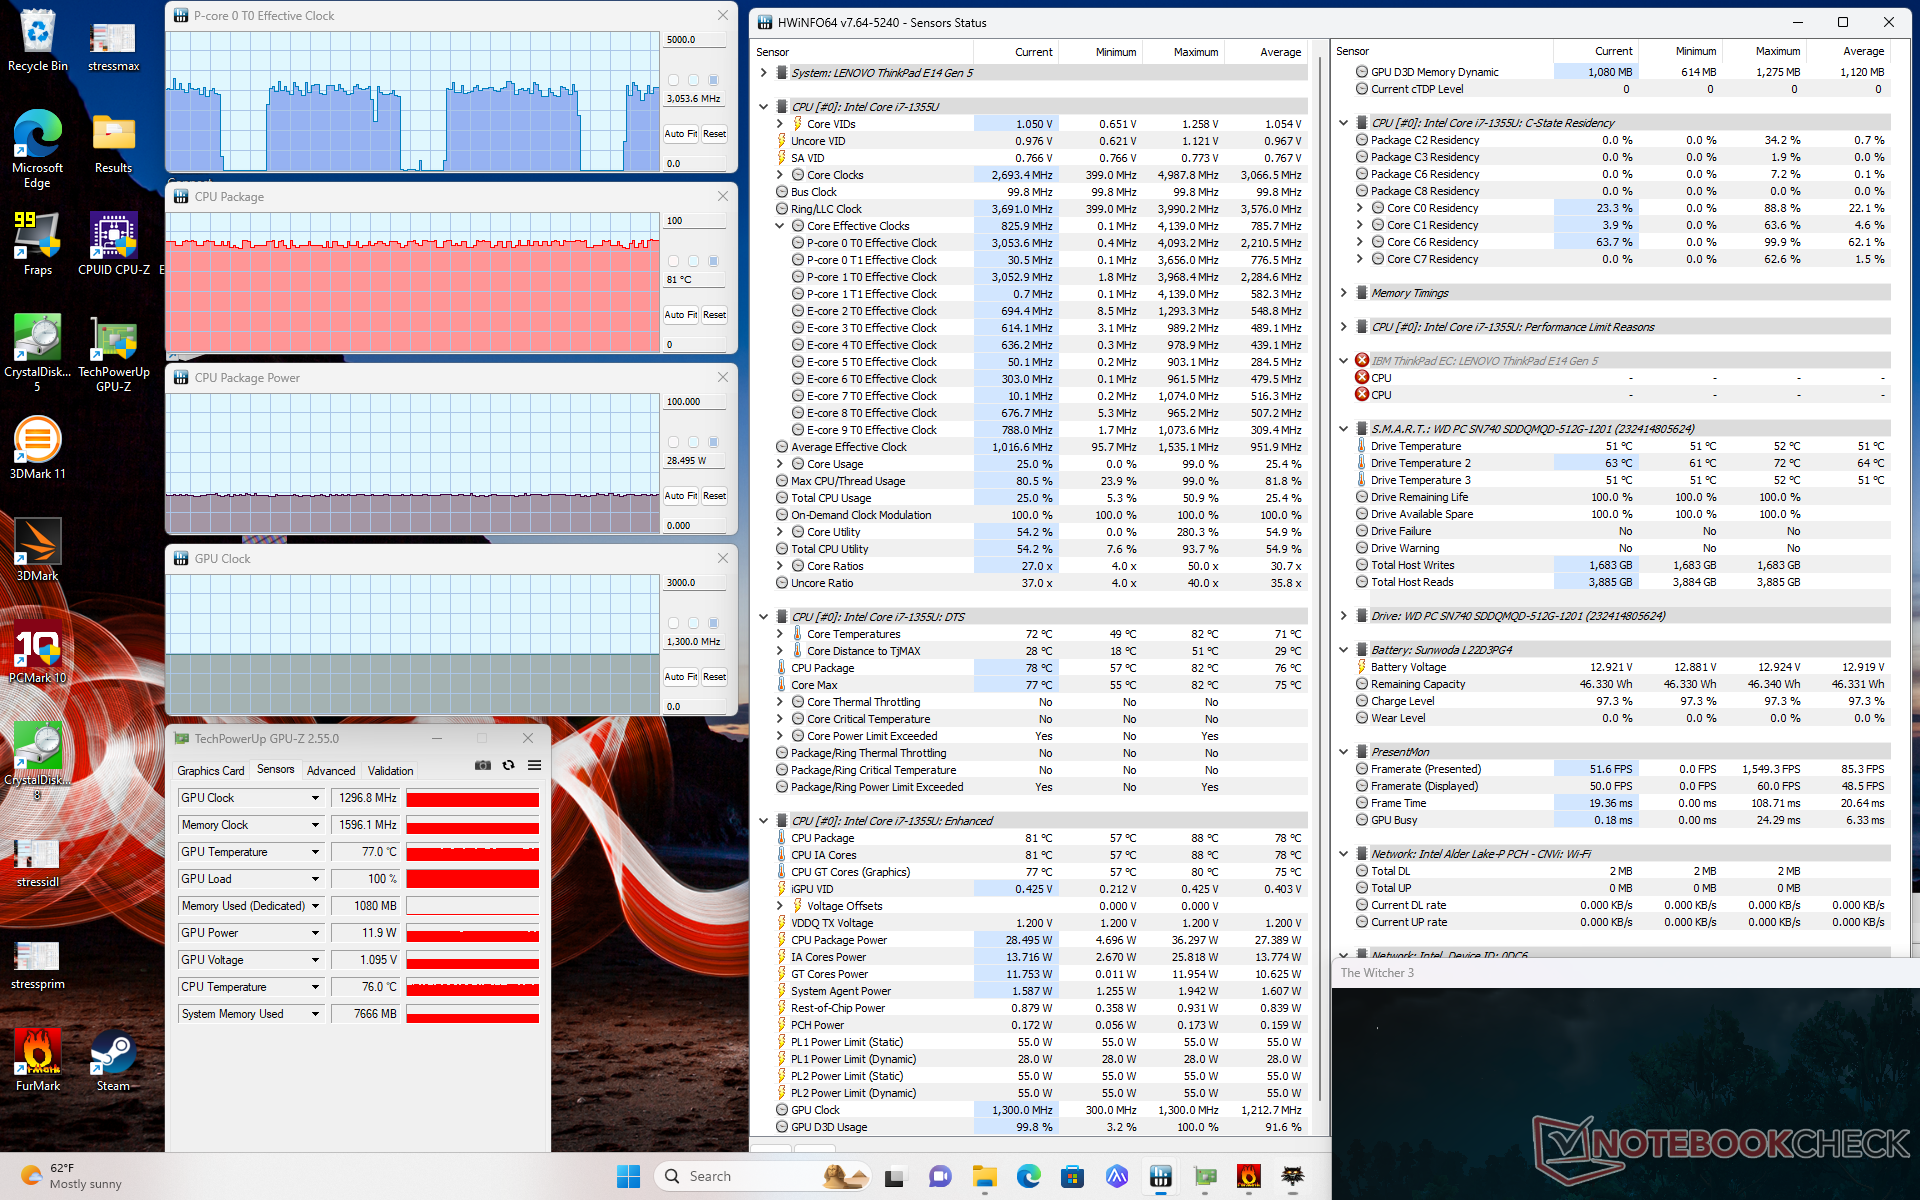
Vår enhet levereras med 42 mm-versionen avWD PC SN740 medan AMD-konfigurationen levereras med 80 mm WD PC SN740. Denna mellanklass PCIe4 x4 NVMe SSD erbjuder läshastigheter på upp till 5000 MB/s men bara i ett par minuter innan strypningen sätter in, vilket visas i grafen nedan.

| Drive Performance rating - Percent | |
| LG Gram 14Z90Q | |
| HP EliteBook 845 G10 818N0EA | |
| Lenovo ThinkPad E14 G5 i7-1355U | |
| Dell Latitude 7440 | |
| Lenovo ThinkPad E14 G5-21JSS05C00 | |
| Asus ZenBook 14 UM3402Y | |
* ... mindre är bättre
Disk Throttling: DiskSpd Read Loop, Queue Depth 8
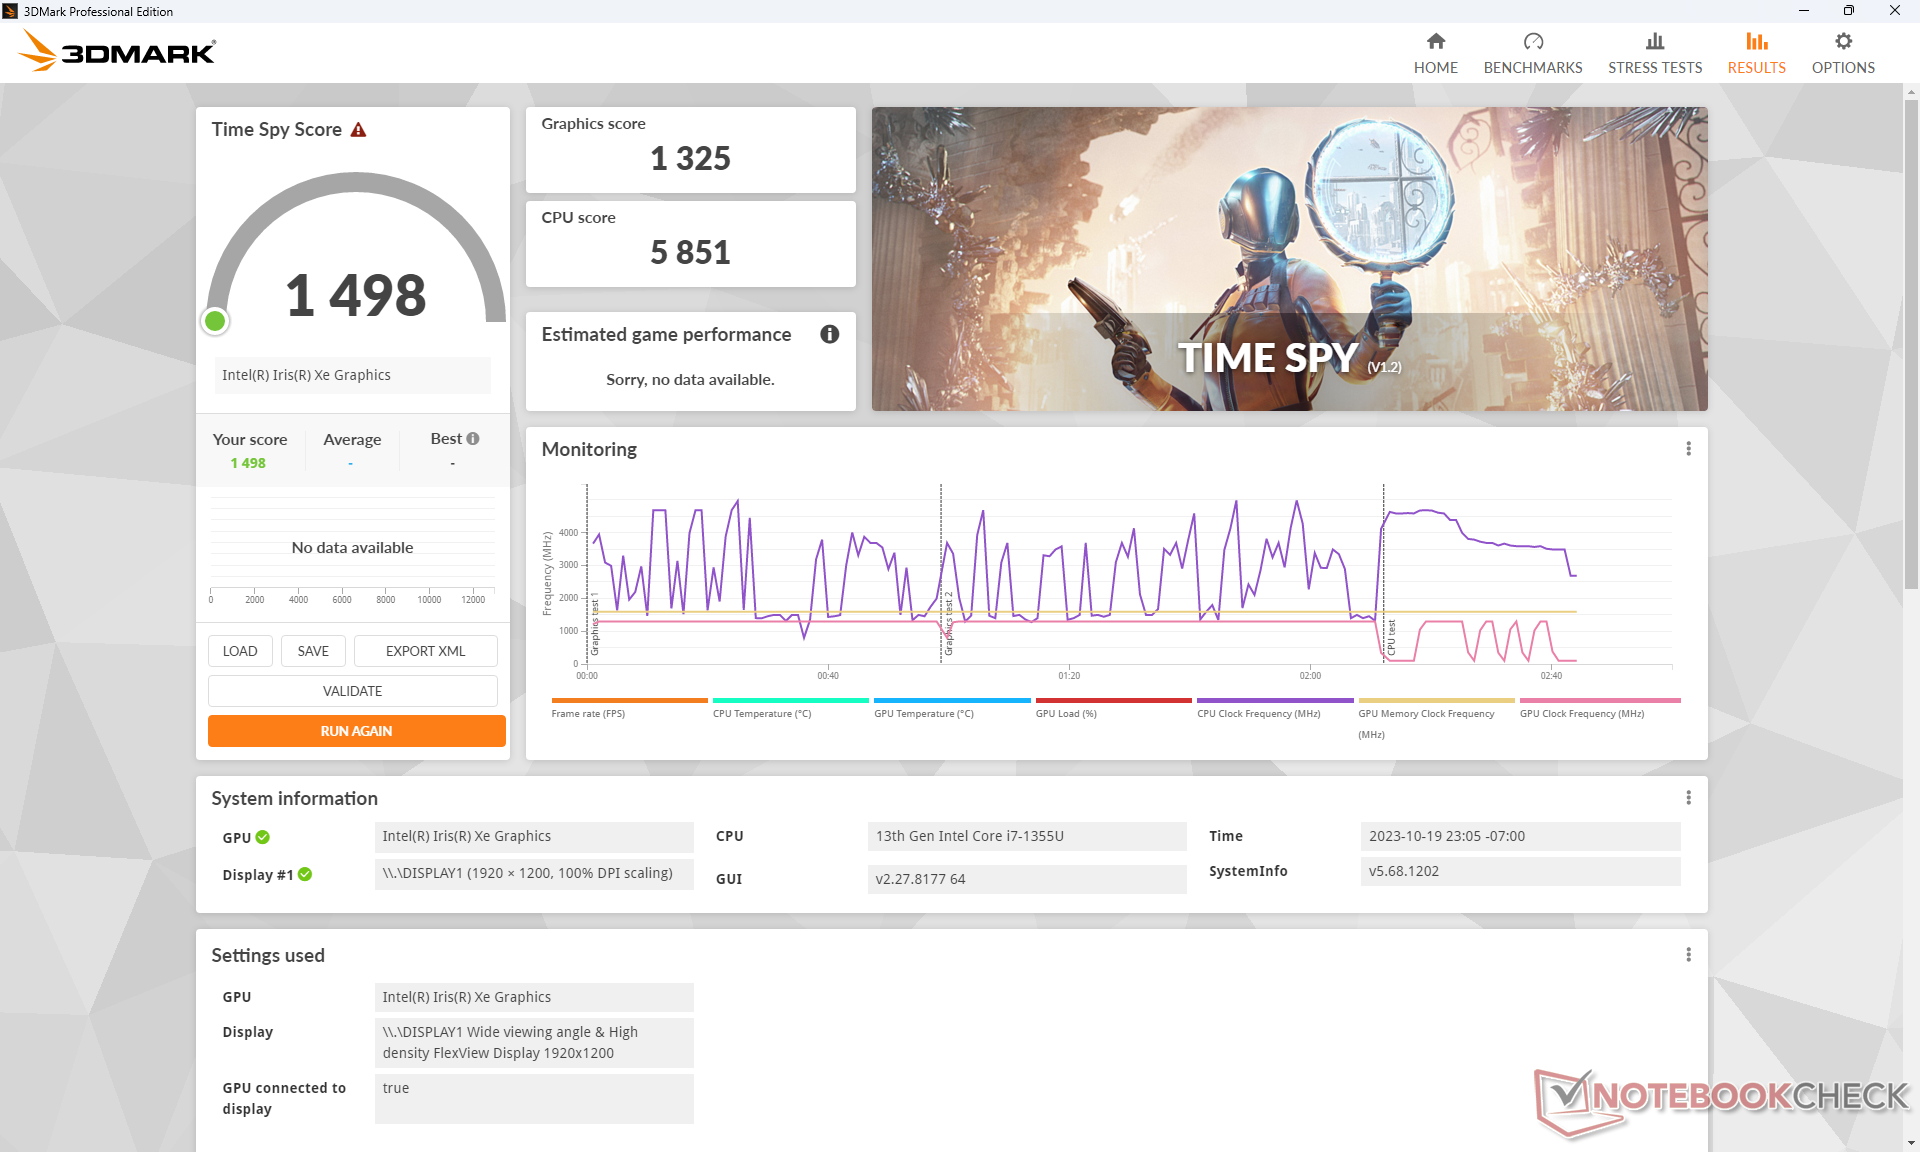
GPU-prestanda
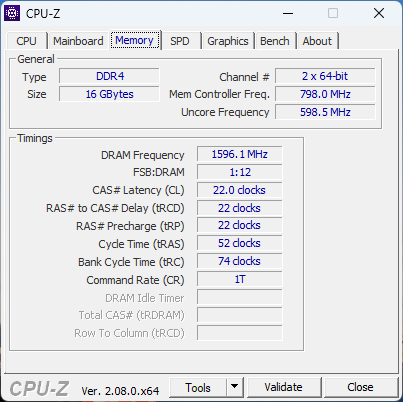
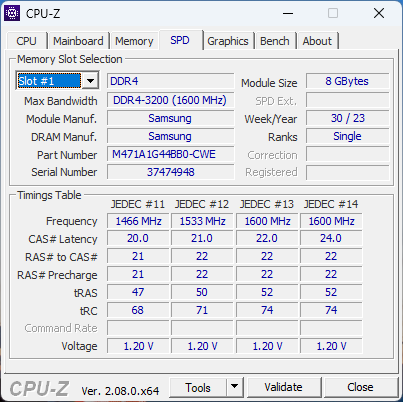
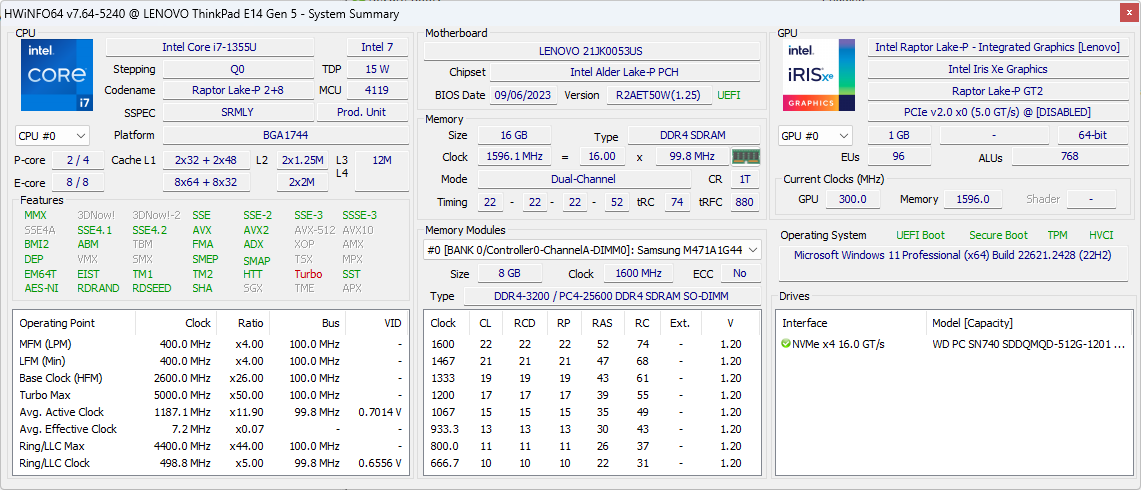
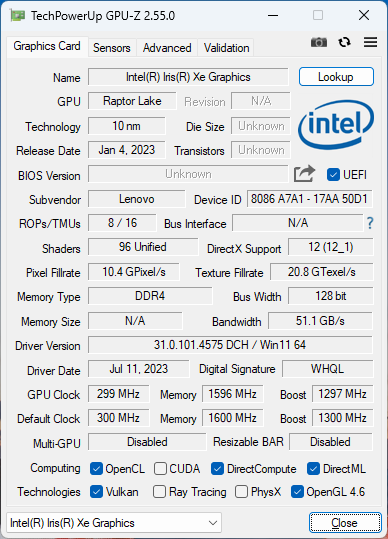
RAM-minnet är långsammare än genomsnittet med bara DDR4-3200, vilket påverkar den integrerade grafikprestandan negativt. Vår Iris Xe 96 EUs är cirka 10 till 15 procent långsammare än den genomsnittliga bärbara datorn i vår databas med samma GPU på grund av den strypande CPU:n och långsamma RAM-minnet. Den övergripande prestandan är ungefär densamma som RX Vega 8 i Ryzen 7 7730U-versionen som ett resultat.
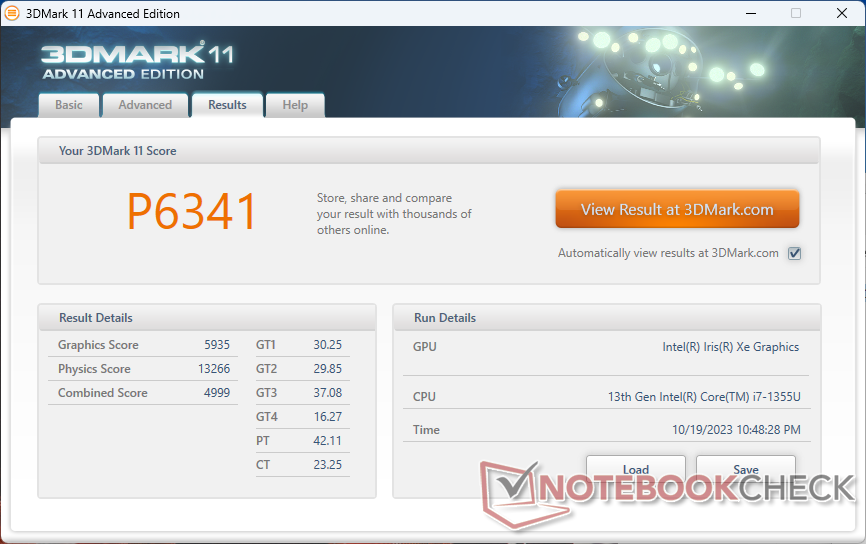
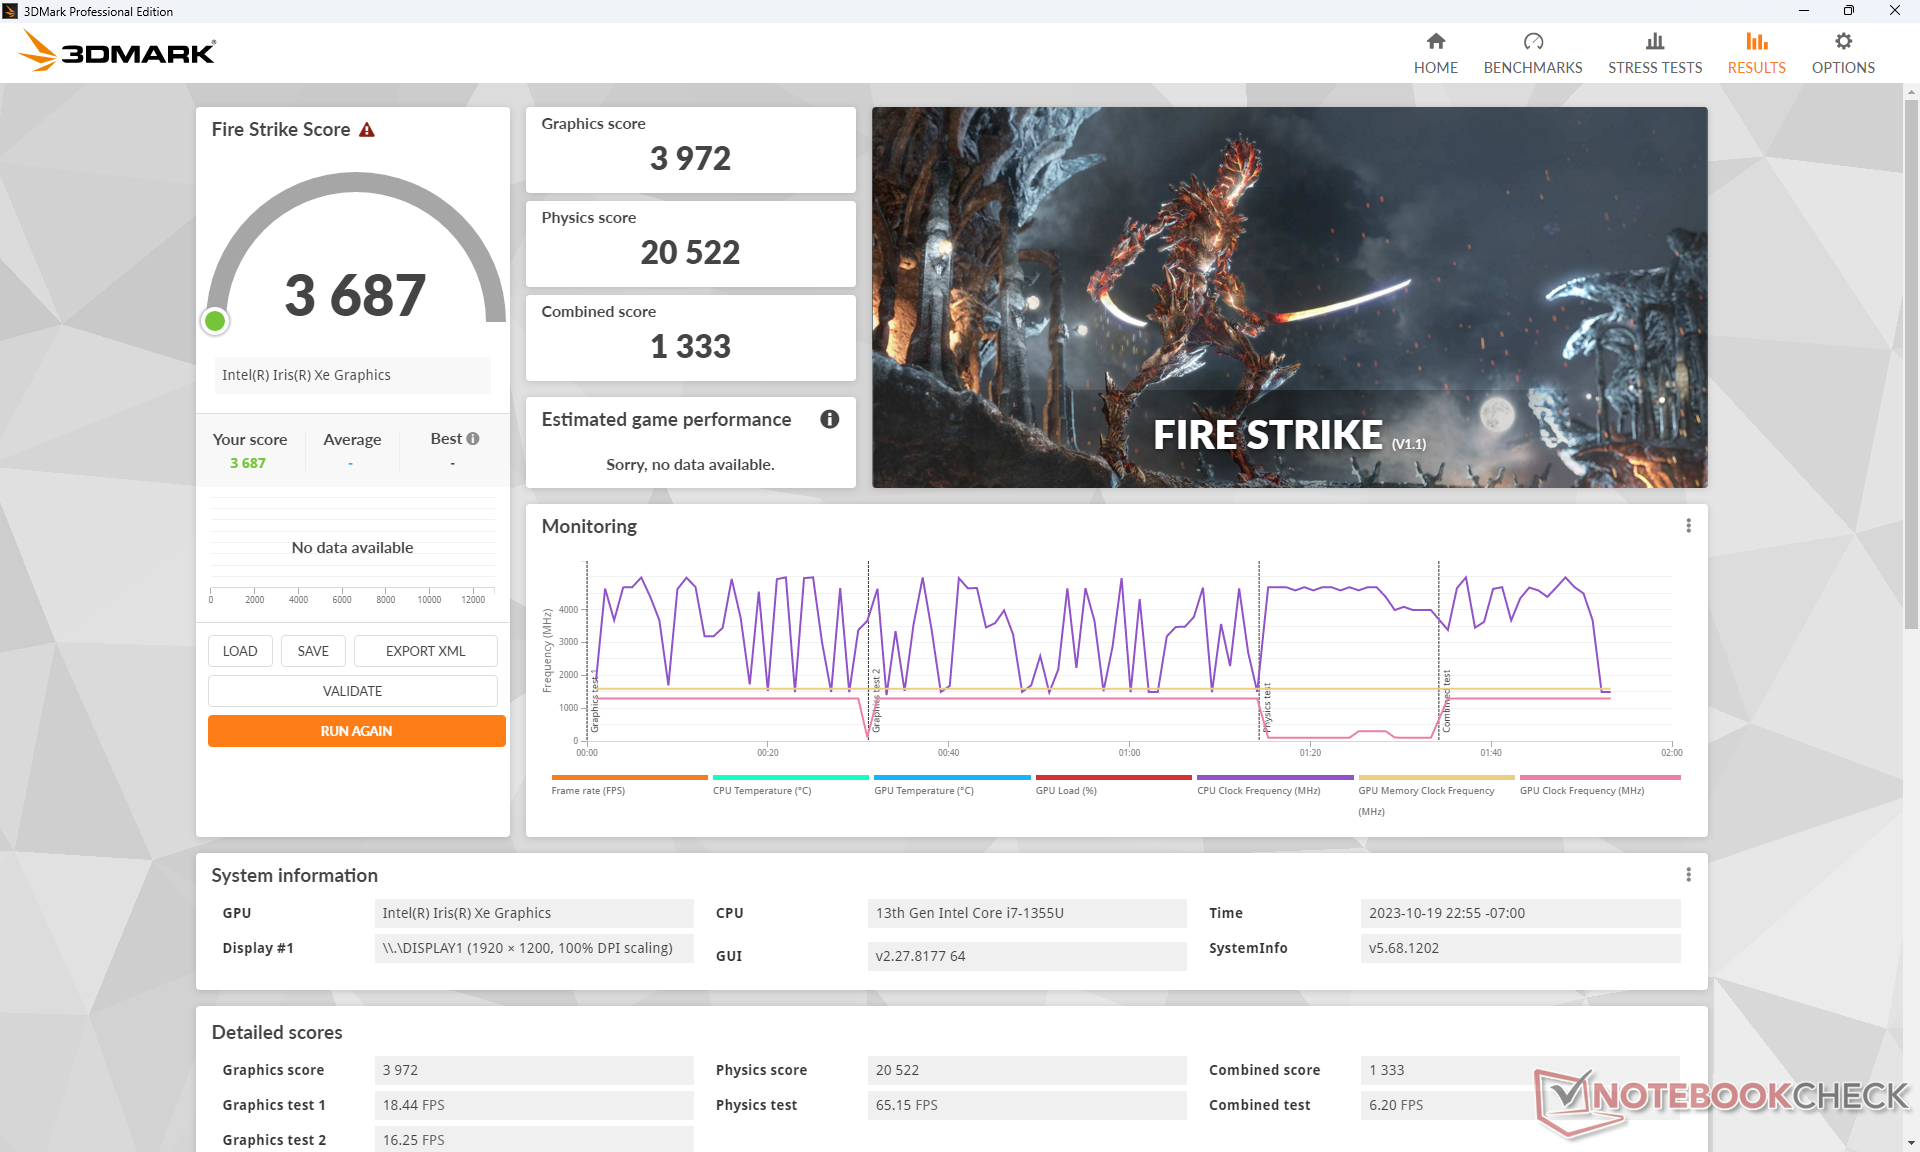
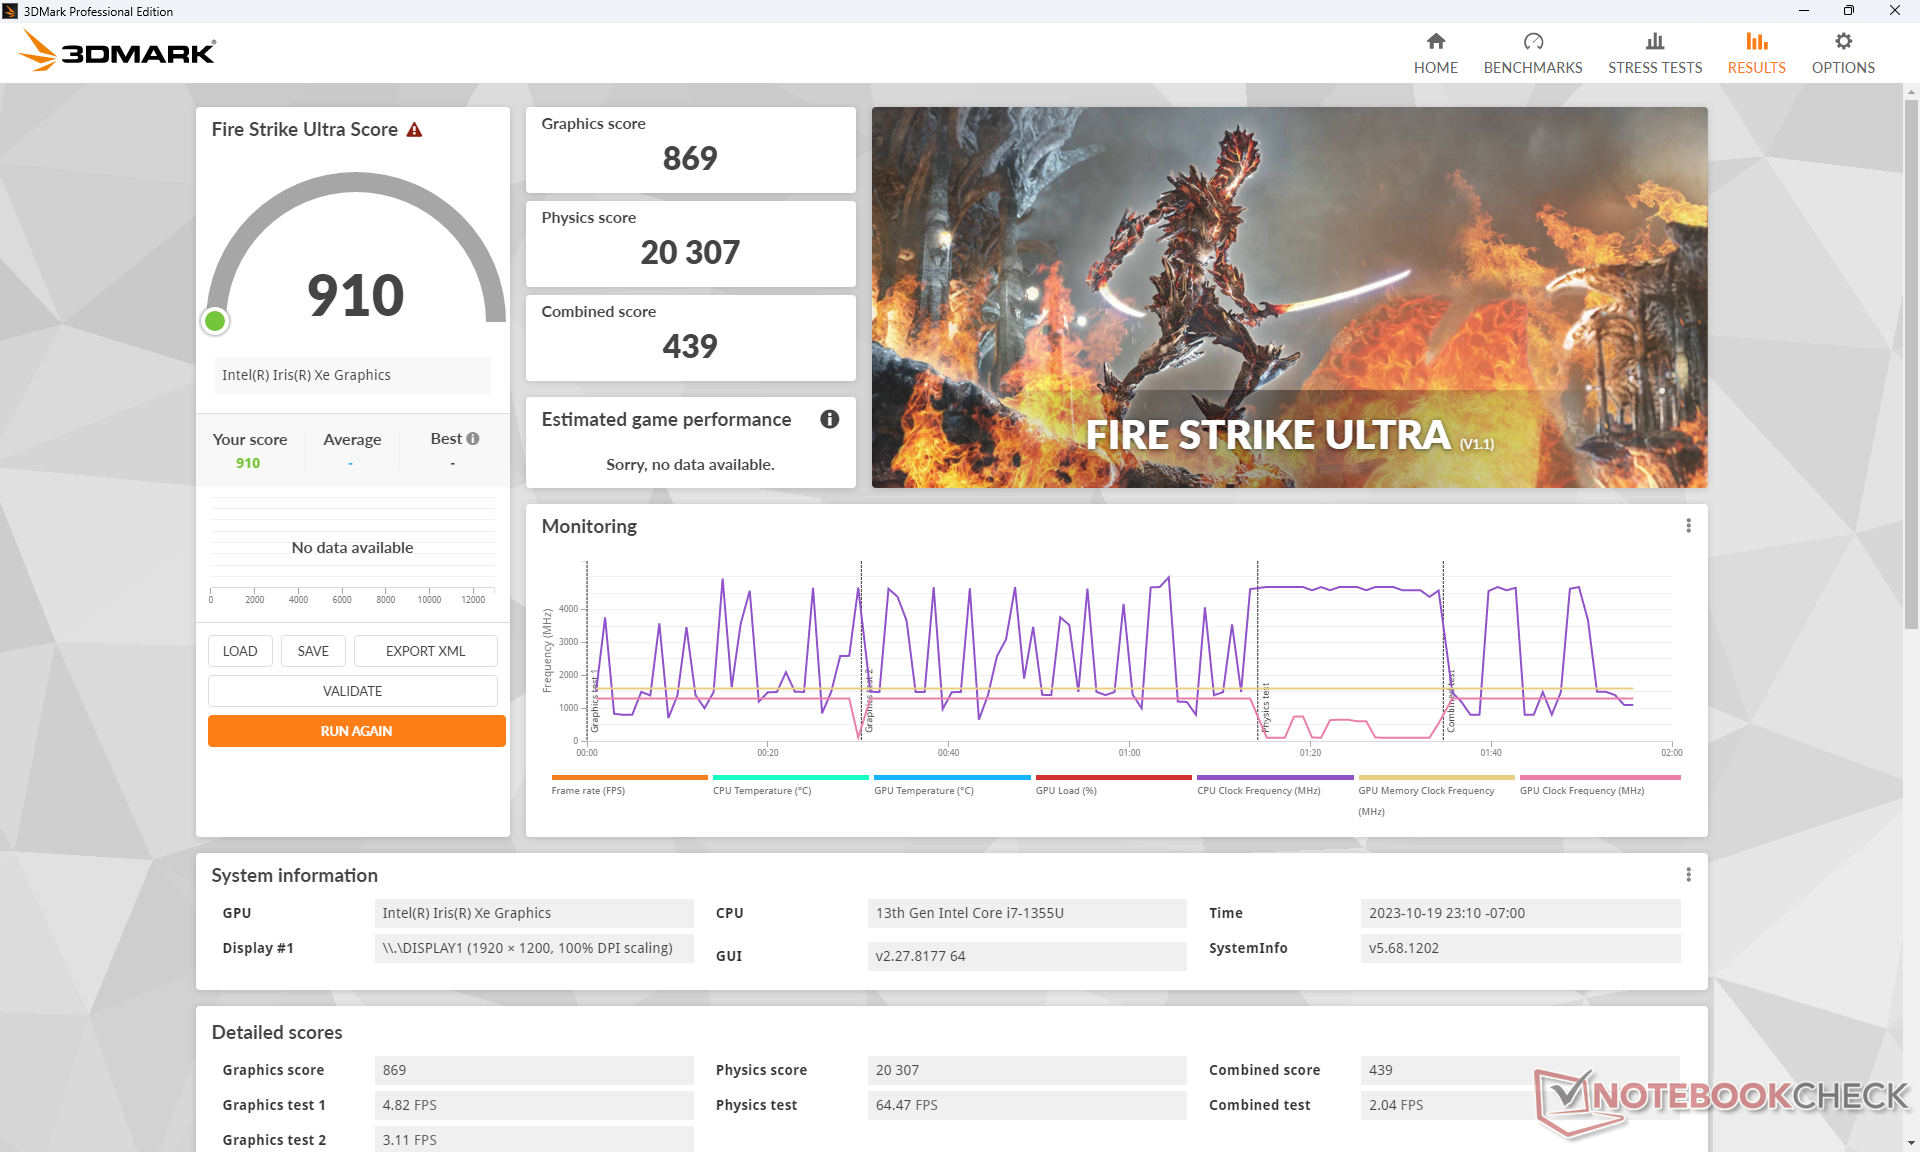
| 3DMark 11 Performance | 6341 poäng | |
| 3DMark Fire Strike Score | 3687 poäng | |
| 3DMark Time Spy Score | 1498 poäng | |
Hjälp | ||
* ... mindre är bättre
| Tiny Tina's Wonderlands | |
| 1280x720 Lowest Preset (DX12) | |
| Dell Inspiron 14 7435 2-in-1 | |
| Genomsnitt Intel Iris Xe Graphics G7 96EUs (25.9 - 67.3, n=32) | |
| Lenovo ThinkPad E14 G5 i7-1355U | |
| 1920x1080 Low Preset (DX12) | |
| Genomsnitt Intel Iris Xe Graphics G7 96EUs (22.3 - 53, n=32) | |
| Dell Inspiron 14 7435 2-in-1 | |
| Dell Latitude 7440 | |
| Lenovo ThinkPad E14 G5 i7-1355U | |
| HP Envy 14-eb0252ng | |
| 1920x1080 Medium Preset (DX12) | |
| Genomsnitt Intel Iris Xe Graphics G7 96EUs (17 - 40.1, n=30) | |
| Dell Latitude 7440 | |
| Lenovo ThinkPad E14 G5 i7-1355U | |
| HP Envy 14-eb0252ng | |
| 1920x1080 High Preset (DX12) | |
| Genomsnitt Intel Iris Xe Graphics G7 96EUs (10.6 - 24.1, n=29) | |
| Dell Latitude 7440 | |
| Lenovo ThinkPad E14 G5 i7-1355U | |
| HP Envy 14-eb0252ng | |
| 1920x1080 Badass Preset (DX12) | |
| Genomsnitt Intel Iris Xe Graphics G7 96EUs (8.4 - 18.4, n=26) | |
| Dell Latitude 7440 | |
| Lenovo ThinkPad E14 G5 i7-1355U | |
Witcher 3 FPS Chart
| låg | med. | hög | ultra | |
|---|---|---|---|---|
| GTA V (2015) | 85.2 | 67 | 13.7 | 5.57 |
| The Witcher 3 (2015) | 74.9 | 48.9 | 24.1 | 12.1 |
| Dota 2 Reborn (2015) | 104.5 | 77.3 | 51.5 | 47.3 |
| Final Fantasy XV Benchmark (2018) | 34.3 | 18.1 | 13.1 | |
| X-Plane 11.11 (2018) | 34.2 | 28.2 | 25.6 | |
| Far Cry 5 (2018) | 40 | 20 | 19 | 18 |
| Strange Brigade (2018) | 74.5 | 28.4 | 24.2 | 19.3 |
| Cyberpunk 2077 1.6 (2022) | 13 | |||
| Tiny Tina's Wonderlands (2022) | 23.8 | 17 | 10.6 | 9.1 |
| F1 22 (2022) | 35.3 | 32.3 | 23.6 | 18.3 |
Utsläpp
Buller från systemet
Fläktljudet mellan AMD- och Intel-versionerna skiljer sig inte mycket åt. Höga belastningar som spel når liknande maxnivåer på strax över 40 dB(A) på varje version medan en liten fläktpuls fortfarande förekommer under lägre belastningar som surfning eller streaming. Fläkten är annars lätt att ignorera vid låg till medelhög belastning.
Ljudnivå
| Låg belastning |
| 23.2 / 23.2 / 23.2 dB(A) |
| Hög belastning |
| 36 / 41 dB(A) |
 | ||
30 dB tyst 40 dB(A) hörbar 50 dB(A) högt ljud |
||
min: | ||
| Lenovo ThinkPad E14 G5 i7-1355U Iris Xe G7 96EUs, i7-1355U, WD PC SN740 512GB SDDQMQD-512G | Lenovo ThinkPad E14 G5-21JSS05C00 Vega 8, R7 7730U, WD PC SN740 SDDPNQD-1T00 | HP EliteBook 845 G10 818N0EA Radeon 780M, R9 PRO 7940HS, SK hynix PC801 HFS001TEJ9X101N | Asus ZenBook 14 UM3402Y Vega 8, R7 7730U, Micron 2400 MTFDKBA512QFM | LG Gram 14Z90Q Iris Xe G7 80EUs, i5-1240P, Samsung PM9A1 MZVL2512HCJQ | Dell Latitude 7440 Iris Xe G7 80EUs, i5-1345U, Samsung MZ9L4512HBLU-00BMV | |
|---|---|---|---|---|---|---|
| Noise | -1% | -7% | -7% | -5% | 9% | |
| av / miljö * (dB) | 23.2 | 24.4 -5% | 25.3 -9% | 22.6 3% | 25 -8% | 22.8 2% |
| Idle Minimum * (dB) | 23.2 | 24.4 -5% | 25.3 -9% | 22.6 3% | 26 -12% | 22.8 2% |
| Idle Average * (dB) | 23.2 | 24.4 -5% | 25.3 -9% | 22.6 3% | 27 -16% | 22.8 2% |
| Idle Maximum * (dB) | 23.2 | 25.7 -11% | 25.3 -9% | 22.6 3% | 28 -21% | 22.8 2% |
| Load Average * (dB) | 36 | 31.8 12% | 34.4 4% | 40.7 -13% | 35 3% | 26.3 27% |
| Witcher 3 ultra * (dB) | 38.5 | 36.7 5% | 43.4 -13% | 46.6 -21% | 36 6% | 30 22% |
| Load Maximum * (dB) | 41 | 41.2 -0% | 43.4 -6% | 52.5 -28% | 36 12% | 38.3 7% |
* ... mindre är bättre
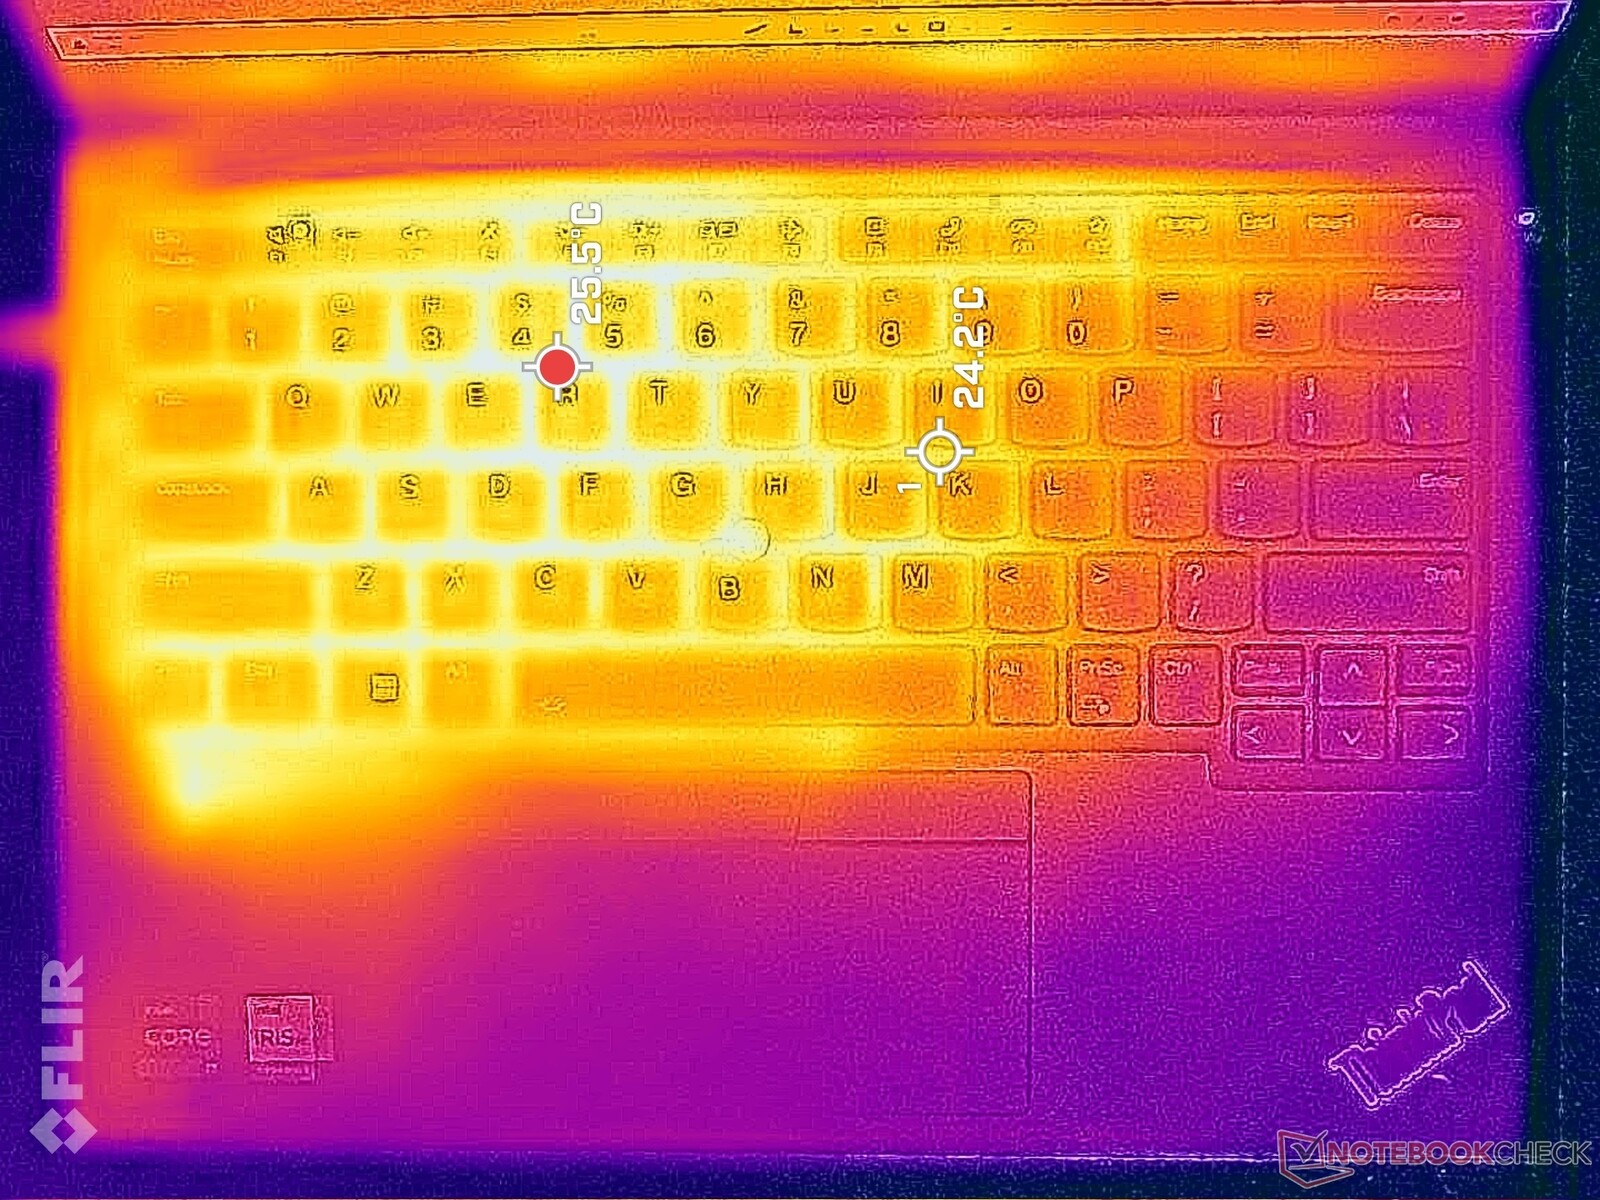
Temperatur
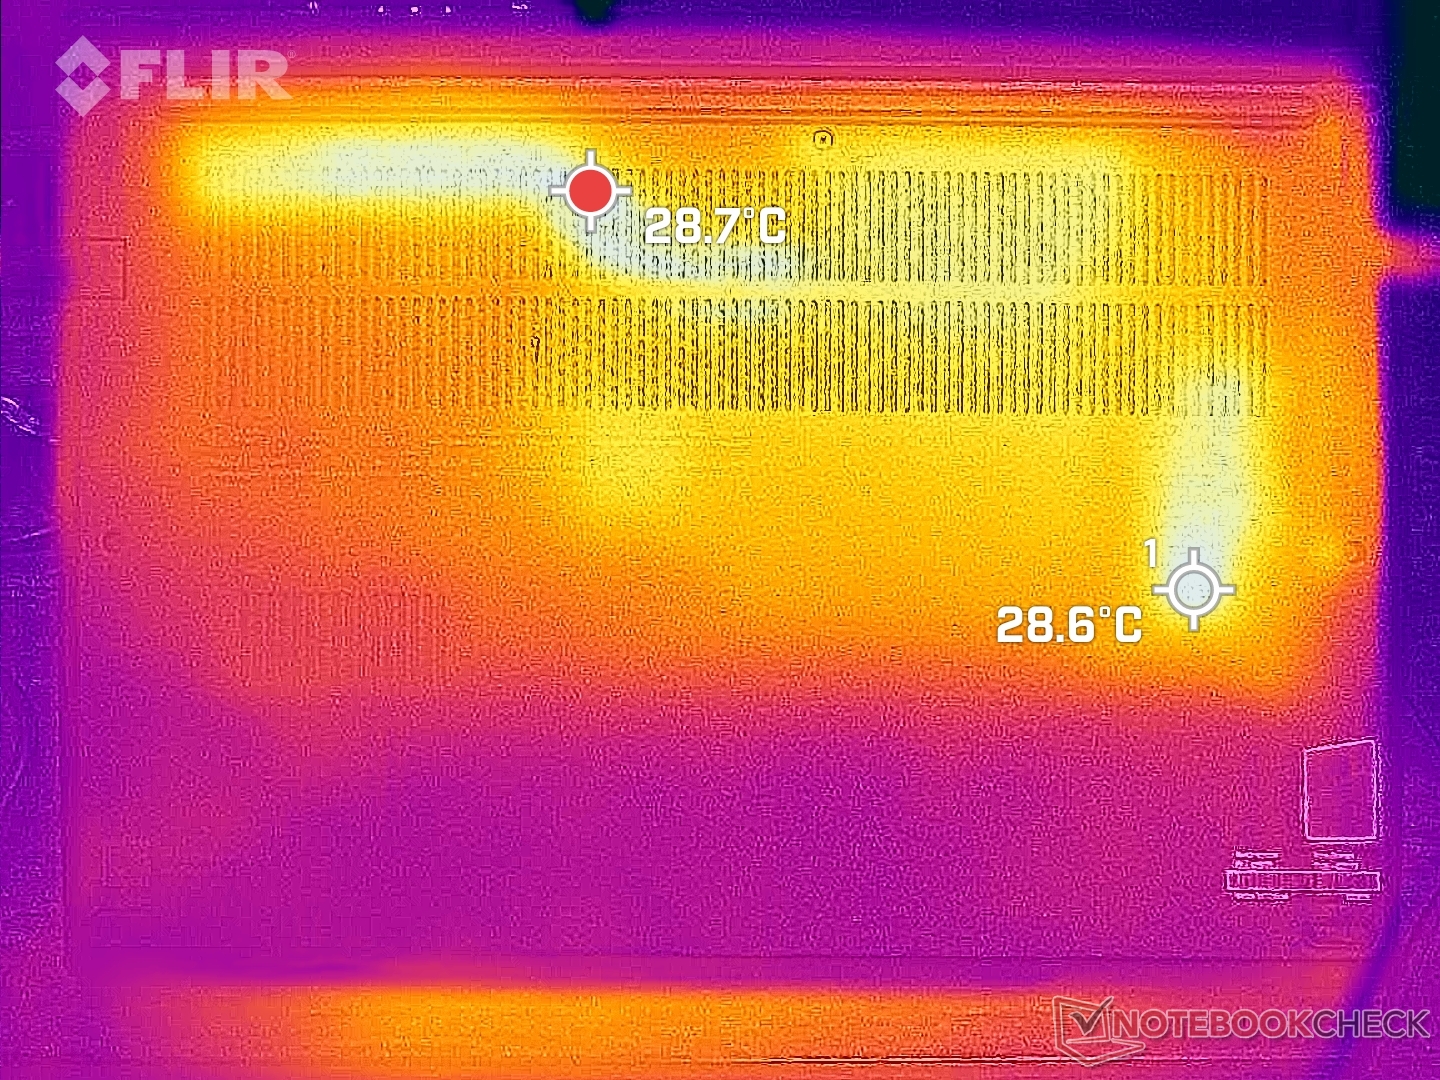
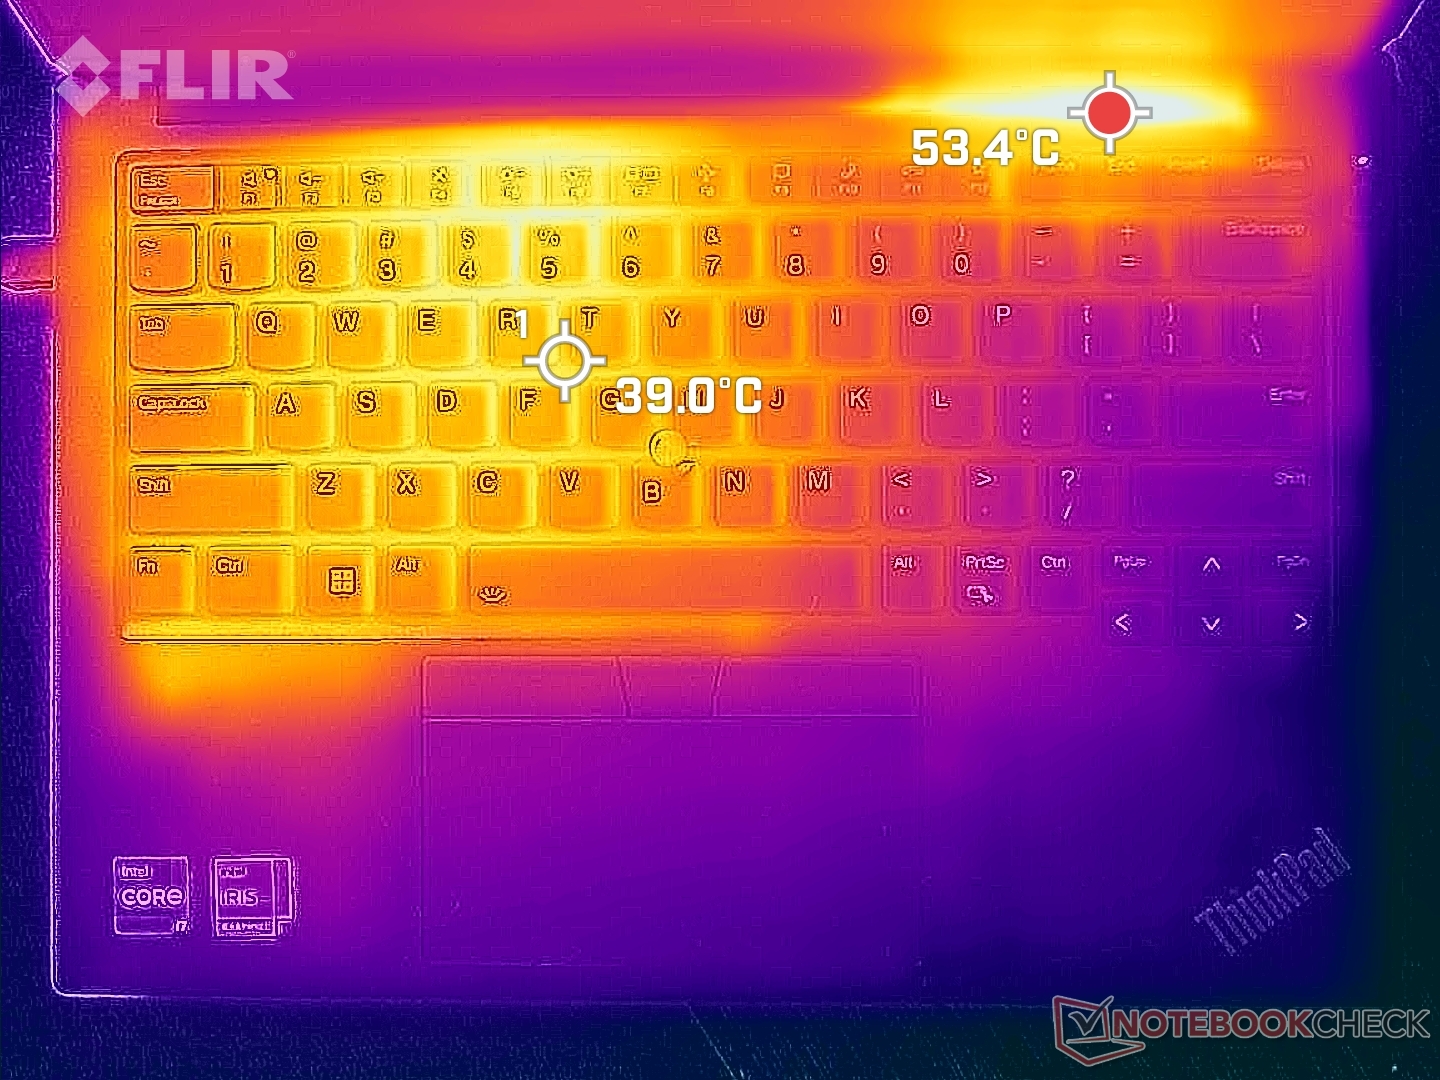
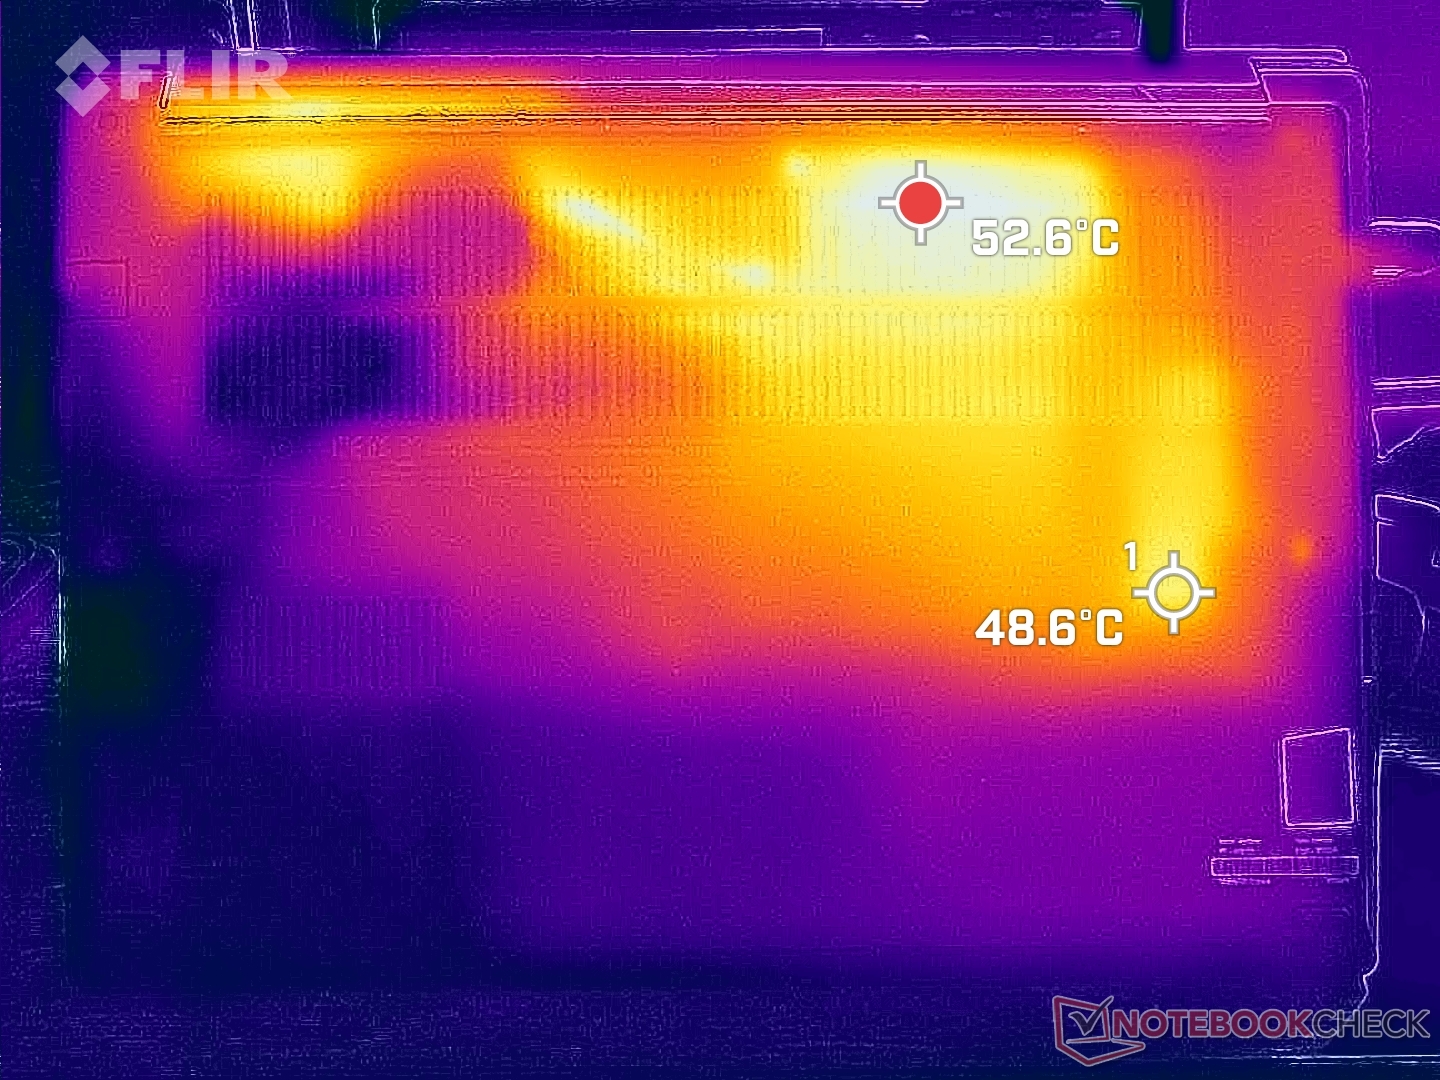
Yttemperaturerna är varmast på den vänstra halvan av chassit och nära de bakre ventilationsgallren. Hot spots på tangentbordet och bottenytorna kan nå upp till 41 C respektive 54 C, vilket liknar vad vi registrerade på AMD-konfigurationen.
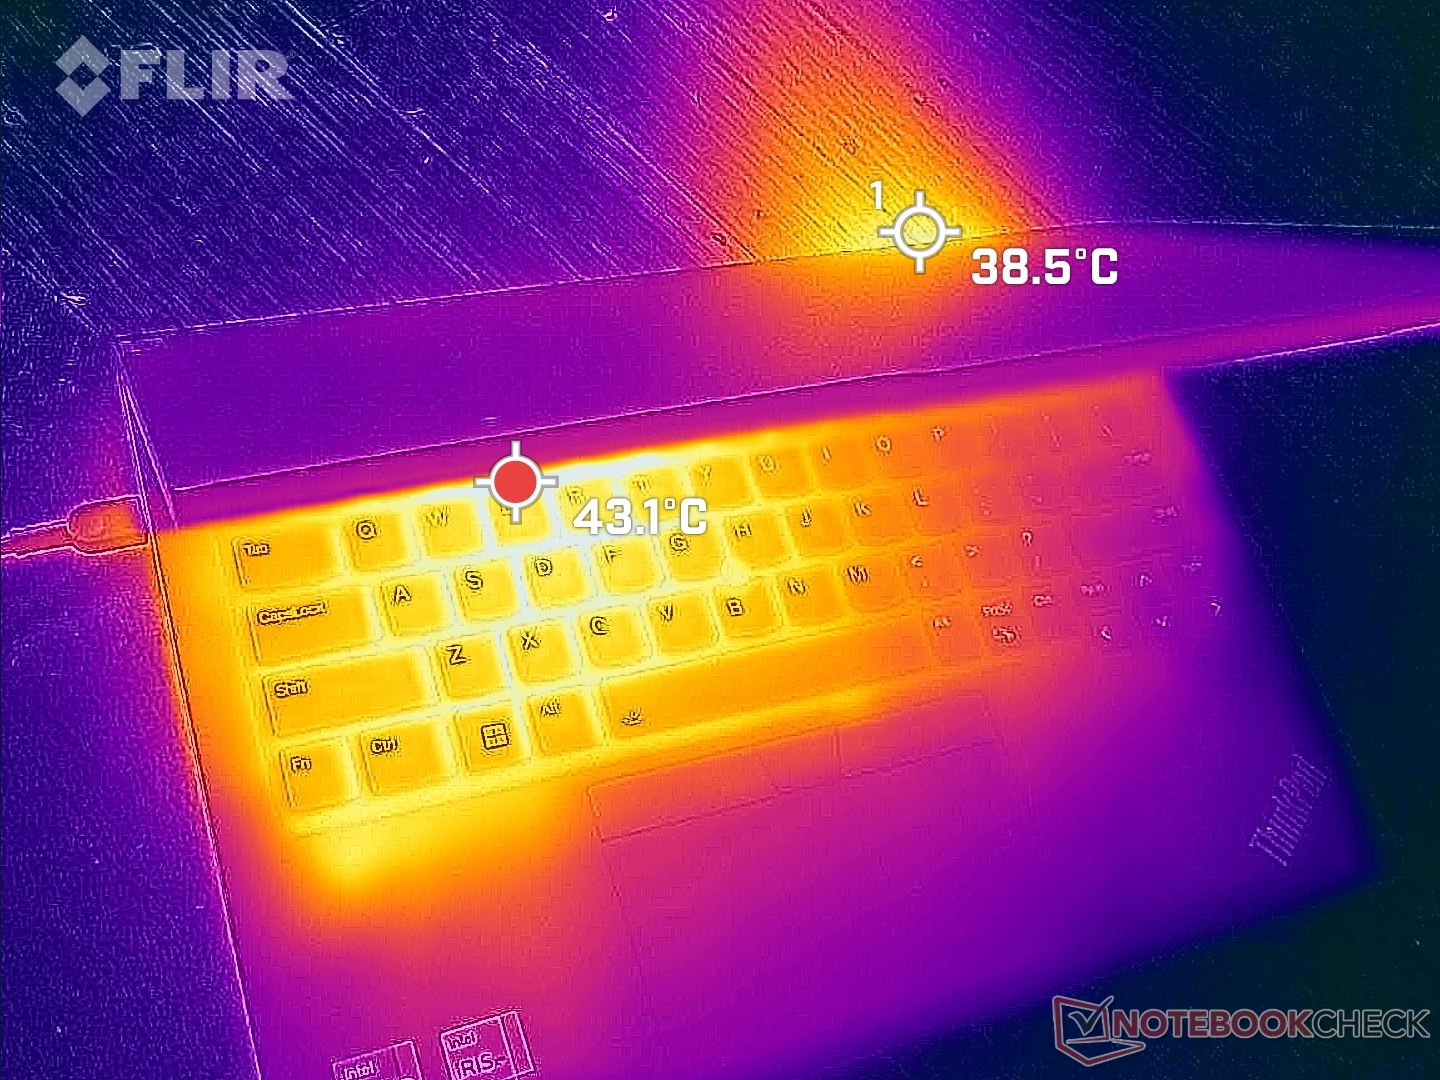
(-) Den maximala temperaturen på ovansidan är 45.4 °C / 114 F, jämfört med genomsnittet av 34.3 °C / 94 F , allt från 21.2 till 62.5 °C för klassen Office.
(-) Botten värms upp till maximalt 50.8 °C / 123 F, jämfört med genomsnittet av 36.8 °C / 98 F
(+) Vid tomgångsbruk är medeltemperaturen för ovansidan 28.8 °C / 84 F, jämfört med enhetsgenomsnittet på 29.5 °C / ### class_avg_f### F.
(+) Handledsstöden och pekplattan är kallare än hudtemperaturen med maximalt 29.8 °C / 85.6 F och är därför svala att ta på.
(-) Medeltemperaturen för handledsstödsområdet på liknande enheter var 27.5 °C / 81.5 F (-2.3 °C / -4.1 F).
| Lenovo ThinkPad E14 G5 i7-1355U Intel Core i7-1355U, Intel Iris Xe Graphics G7 96EUs | Lenovo ThinkPad E14 G5-21JSS05C00 AMD Ryzen 7 7730U, AMD Radeon RX Vega 8 (Ryzen 4000/5000) | HP EliteBook 845 G10 818N0EA AMD Ryzen 9 PRO 7940HS, AMD Radeon 780M | Asus ZenBook 14 UM3402Y AMD Ryzen 7 7730U, AMD Radeon RX Vega 8 (Ryzen 4000/5000) | LG Gram 14Z90Q Intel Core i5-1240P, Intel Iris Xe Graphics G7 80EUs | Dell Latitude 7440 Intel Core i5-1345U, Intel Iris Xe Graphics G7 80EUs | |
|---|---|---|---|---|---|---|
| Heat | 8% | 7% | 10% | 11% | 14% | |
| Maximum Upper Side * (°C) | 45.4 | 42.6 6% | 45.6 -0% | 39.4 13% | 43 5% | 39 14% |
| Maximum Bottom * (°C) | 50.8 | 55.3 -9% | 51.9 -2% | 43.2 15% | 45 11% | 40.6 20% |
| Idle Upper Side * (°C) | 30.2 | 25.8 15% | 26.5 12% | 28.6 5% | 27 11% | 28 7% |
| Idle Bottom * (°C) | 33.4 | 27.4 18% | 27 19% | 30.6 8% | 28 16% | 28.8 14% |
* ... mindre är bättre
Stresstest
CPU-klockfrekvensen och strömförbrukningen när Prime95-stressen initierades skulle öka till 4 GHz respektive 52 W, vilket varade i cirka 30 sekunder och vid en kärntemperatur på 97 C. Processorn skulle sedan cykla mellan 1,6 GHz till 3,9 GHz och 14 W till 43 W därefter för att hålla kärntemperaturen svalare, vilket visas av skärmdumpen nedan. Klockfrekvensbegränsningen är mycket bred, vilket förklarar de långsammare än förväntade CineBench-resultaten som nämns ovan och de varierande strömförbrukningssiffrorna i nästa avsnitt.
Kärntemperaturen skulle ligga runt 80 C när du kör stressiga belastningar jämfört med strax under 70 C på Dell Latitude 7440.
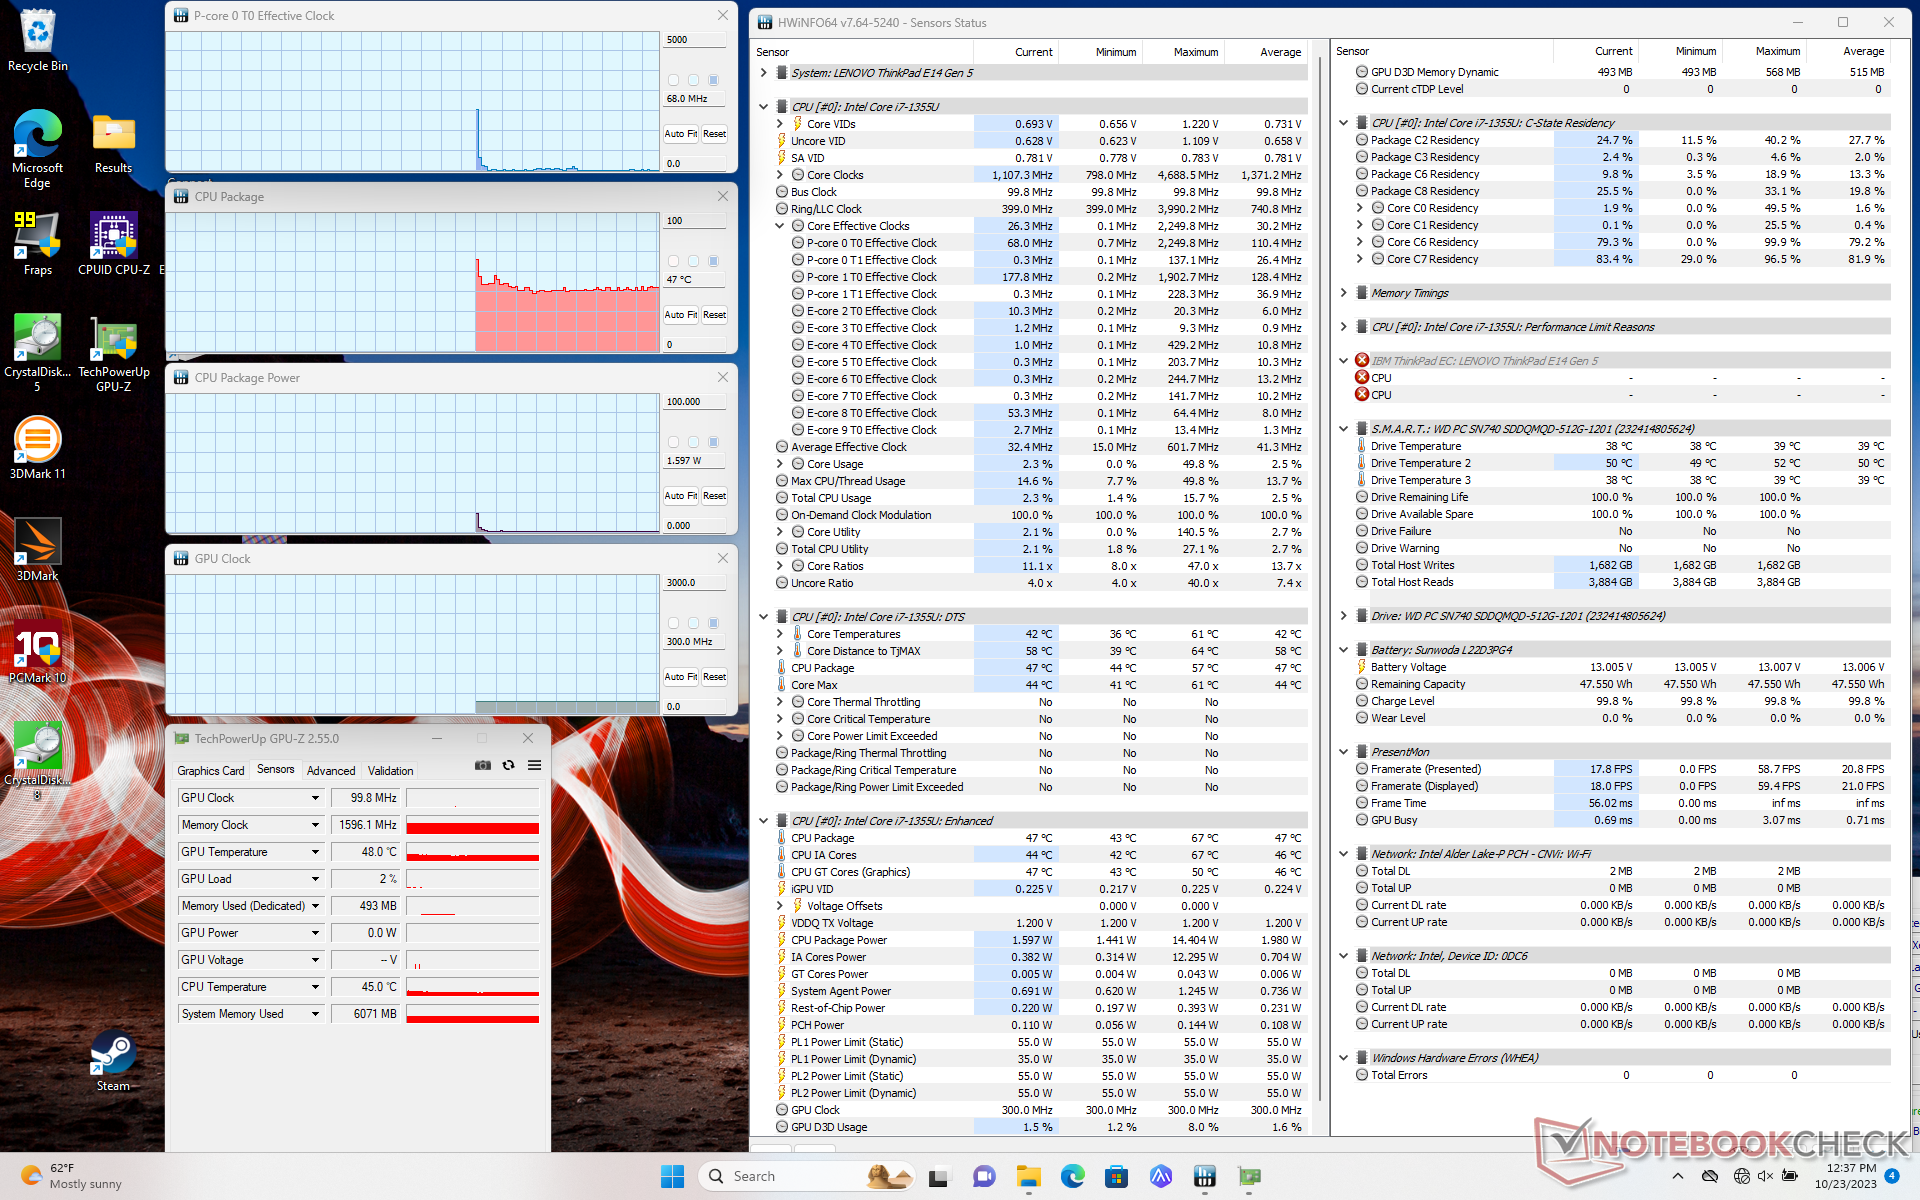
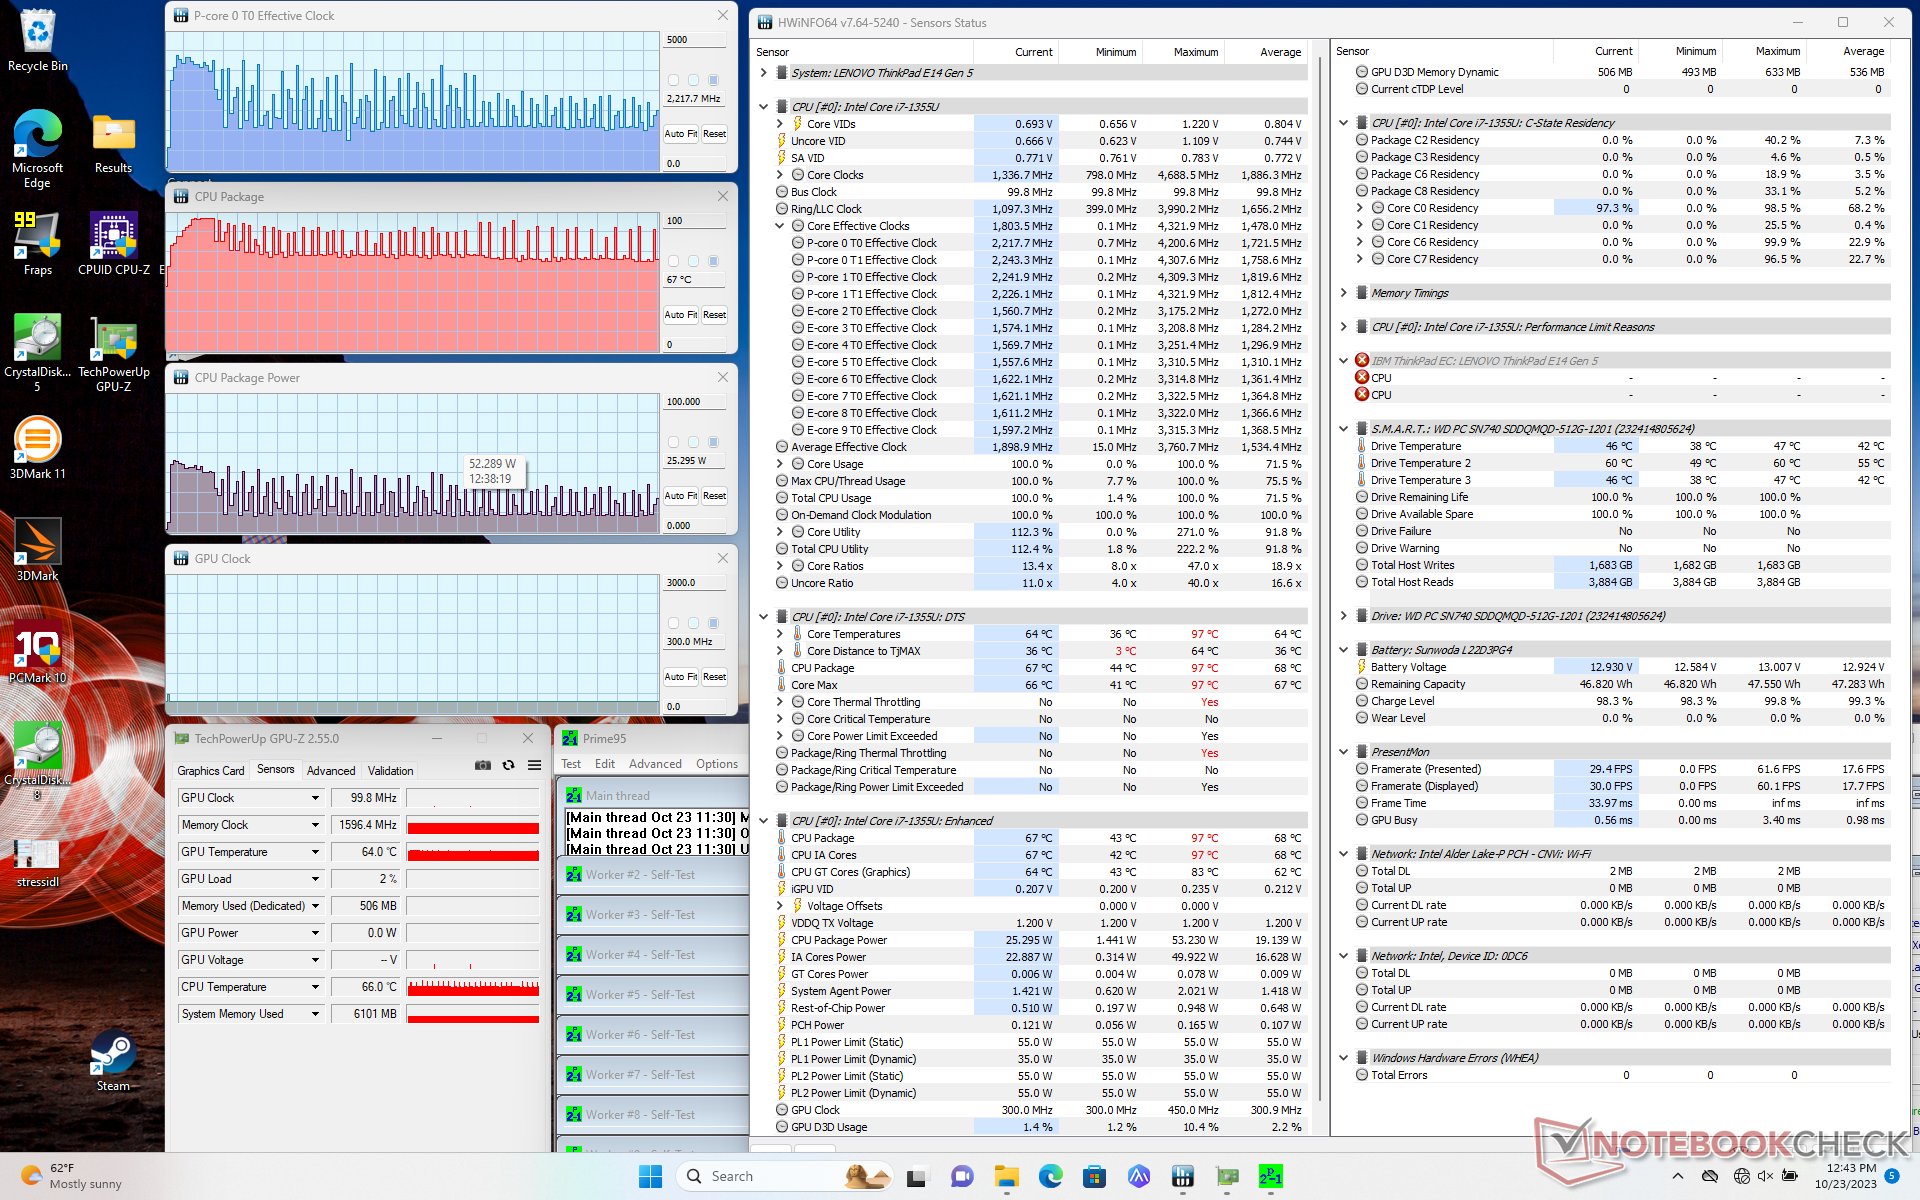
| CPU-klocka (GHz) | GPU-klocka (MHz) | Genomsnittlig CPU-temperatur (°C) | |
| System i viloläge | -- | -- | 47 |
| Prime95 Stress | 1,6 - 3,9 | -- | 70 - 90 |
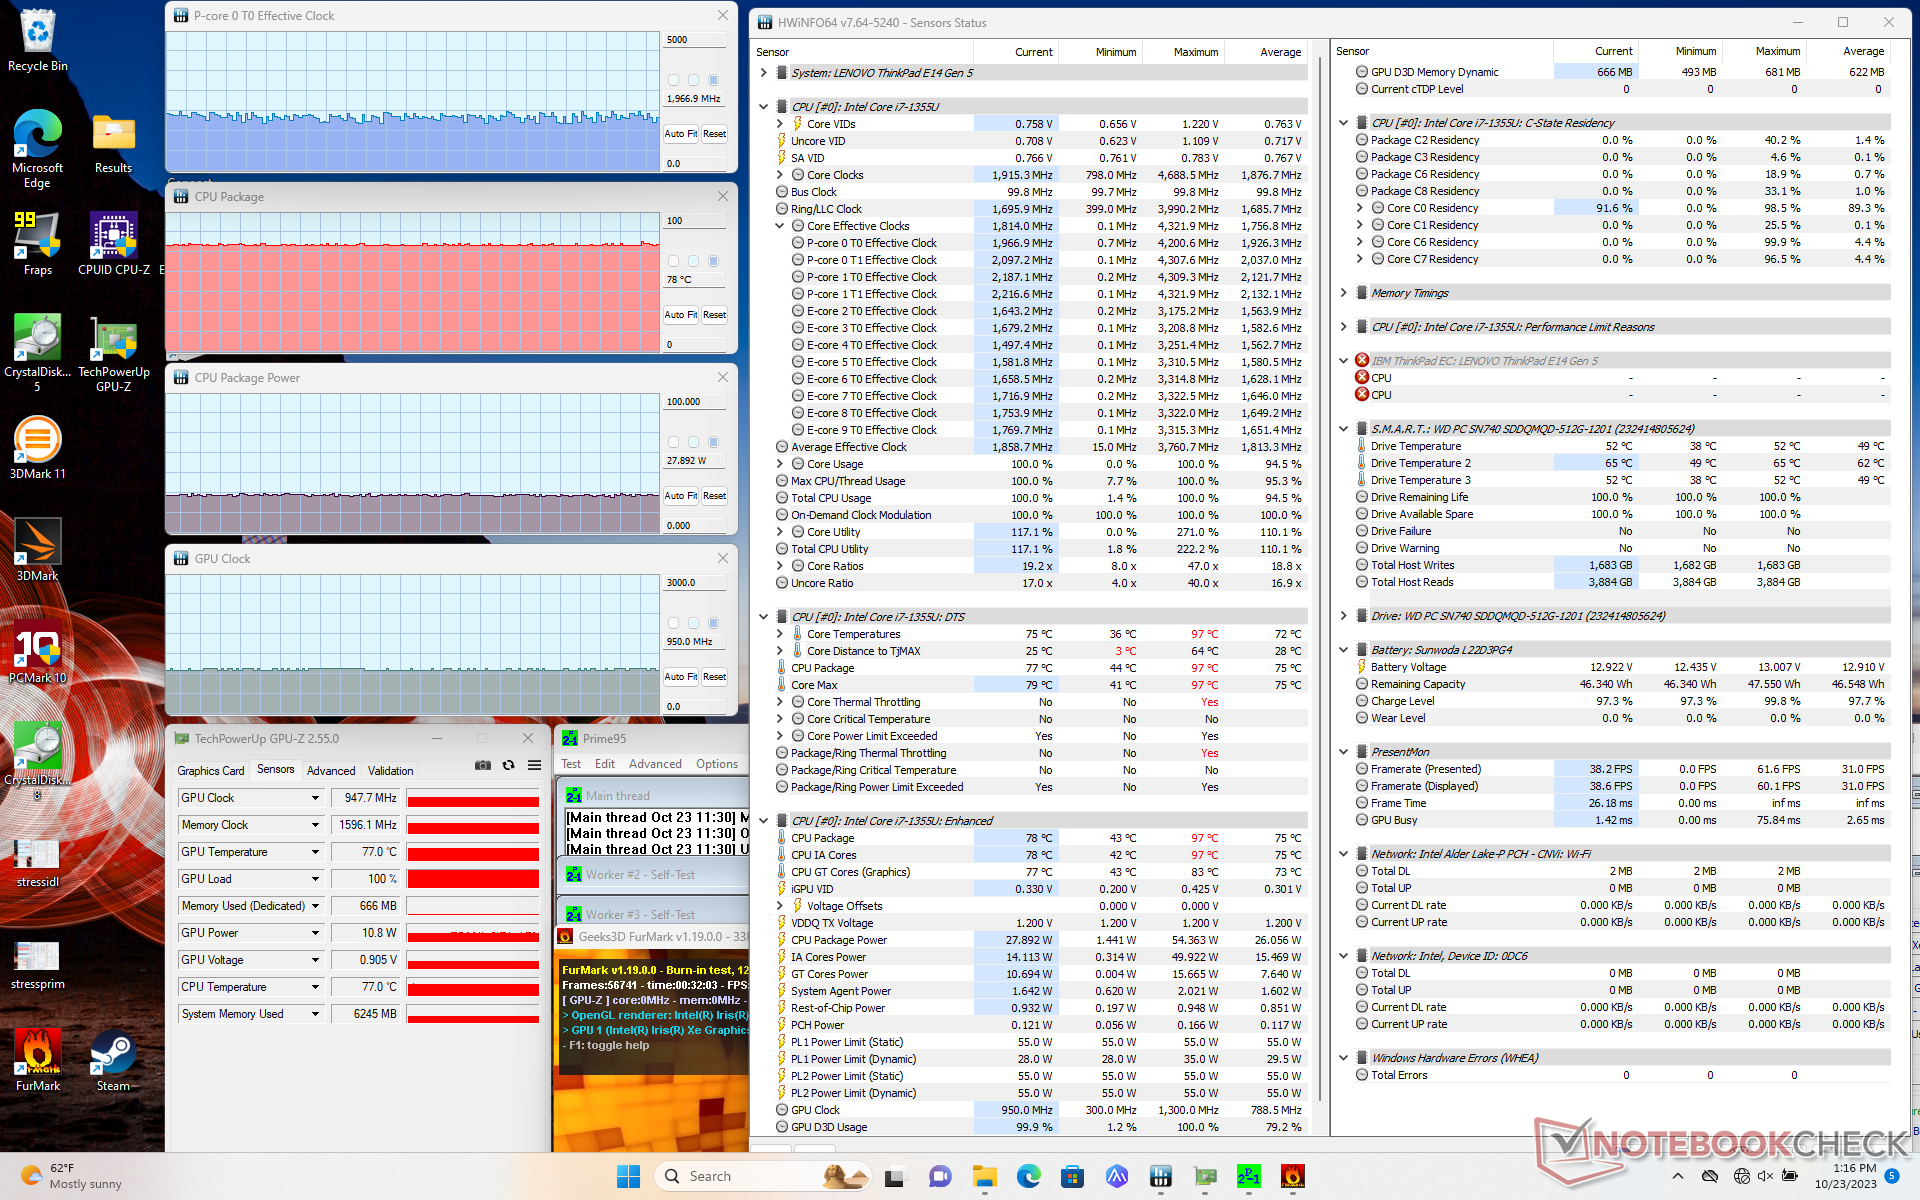
| Prime95 + FurMark Stress | ~2.0 | 950 | 78 |
| Witcher 3 Stress | ~3.0 | 1300 | 81 |
Högtalare
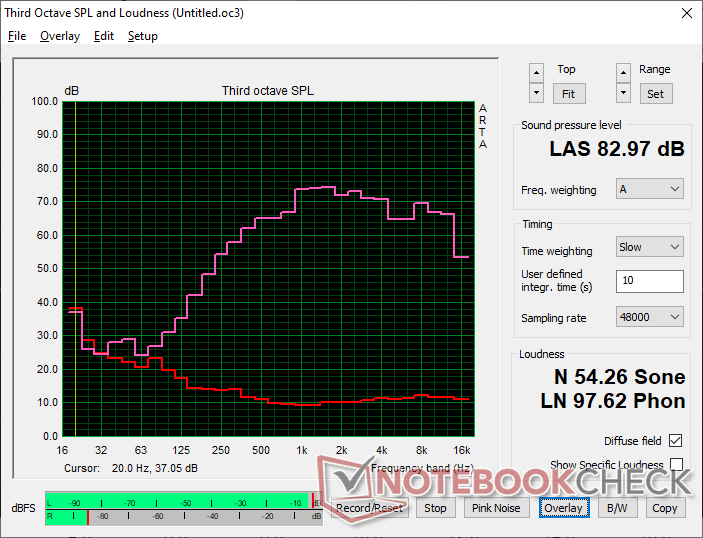
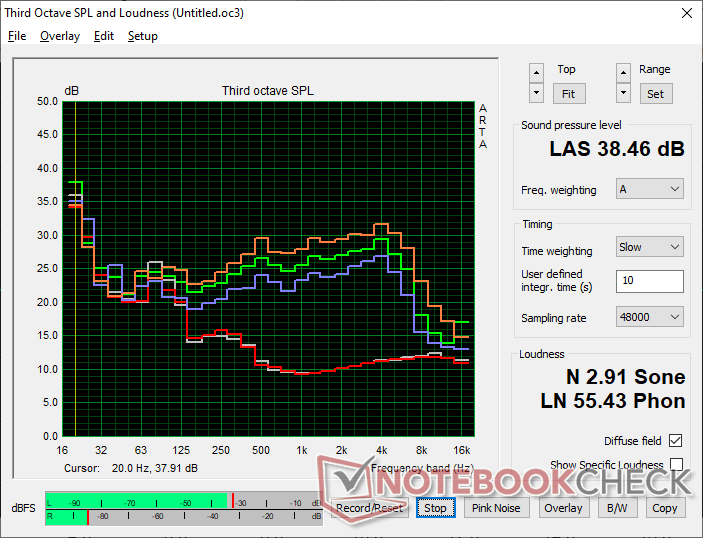
Lenovo ThinkPad E14 G5 i7-1355U ljudanalys
(+) | högtalare kan spela relativt högt (83 dB)
Bas 100 - 315 Hz
(-) | nästan ingen bas - i genomsnitt 20.3% lägre än medianen
(±) | linjäriteten för basen är genomsnittlig (9.6% delta till föregående frekvens)
Mellan 400 - 2000 Hz
(+) | balanserad mellan - endast 4.8% från medianen
(+) | mids är linjära (4.3% delta till föregående frekvens)
Högsta 2 - 16 kHz
(+) | balanserade toppar - endast 3.7% från medianen
(+) | toppar är linjära (4.4% delta till föregående frekvens)
Totalt 100 - 16 000 Hz
(±) | linjäriteten för det totala ljudet är genomsnittlig (16.9% skillnad mot median)
Jämfört med samma klass
» 23% av alla testade enheter i den här klassen var bättre, 7% liknande, 70% sämre
» Den bästa hade ett delta på 7%, genomsnittet var 21%, sämst var 53%
Jämfört med alla testade enheter
» 30% av alla testade enheter var bättre, 8% liknande, 62% sämre
» Den bästa hade ett delta på 4%, genomsnittet var 24%, sämst var 134%
Apple MacBook Pro 16 2021 M1 Pro ljudanalys
(+) | högtalare kan spela relativt högt (84.7 dB)
Bas 100 - 315 Hz
(+) | bra bas - bara 3.8% från medianen
(+) | basen är linjär (5.2% delta till föregående frekvens)
Mellan 400 - 2000 Hz
(+) | balanserad mellan - endast 1.3% från medianen
(+) | mids är linjära (2.1% delta till föregående frekvens)
Högsta 2 - 16 kHz
(+) | balanserade toppar - endast 1.9% från medianen
(+) | toppar är linjära (2.7% delta till föregående frekvens)
Totalt 100 - 16 000 Hz
(+) | det totala ljudet är linjärt (4.6% skillnad mot median)
Jämfört med samma klass
» 0% av alla testade enheter i den här klassen var bättre, 0% liknande, 100% sämre
» Den bästa hade ett delta på 5%, genomsnittet var 17%, sämst var 45%
Jämfört med alla testade enheter
» 0% av alla testade enheter var bättre, 0% liknande, 100% sämre
» Den bästa hade ett delta på 4%, genomsnittet var 24%, sämst var 134%
Energiförvaltning
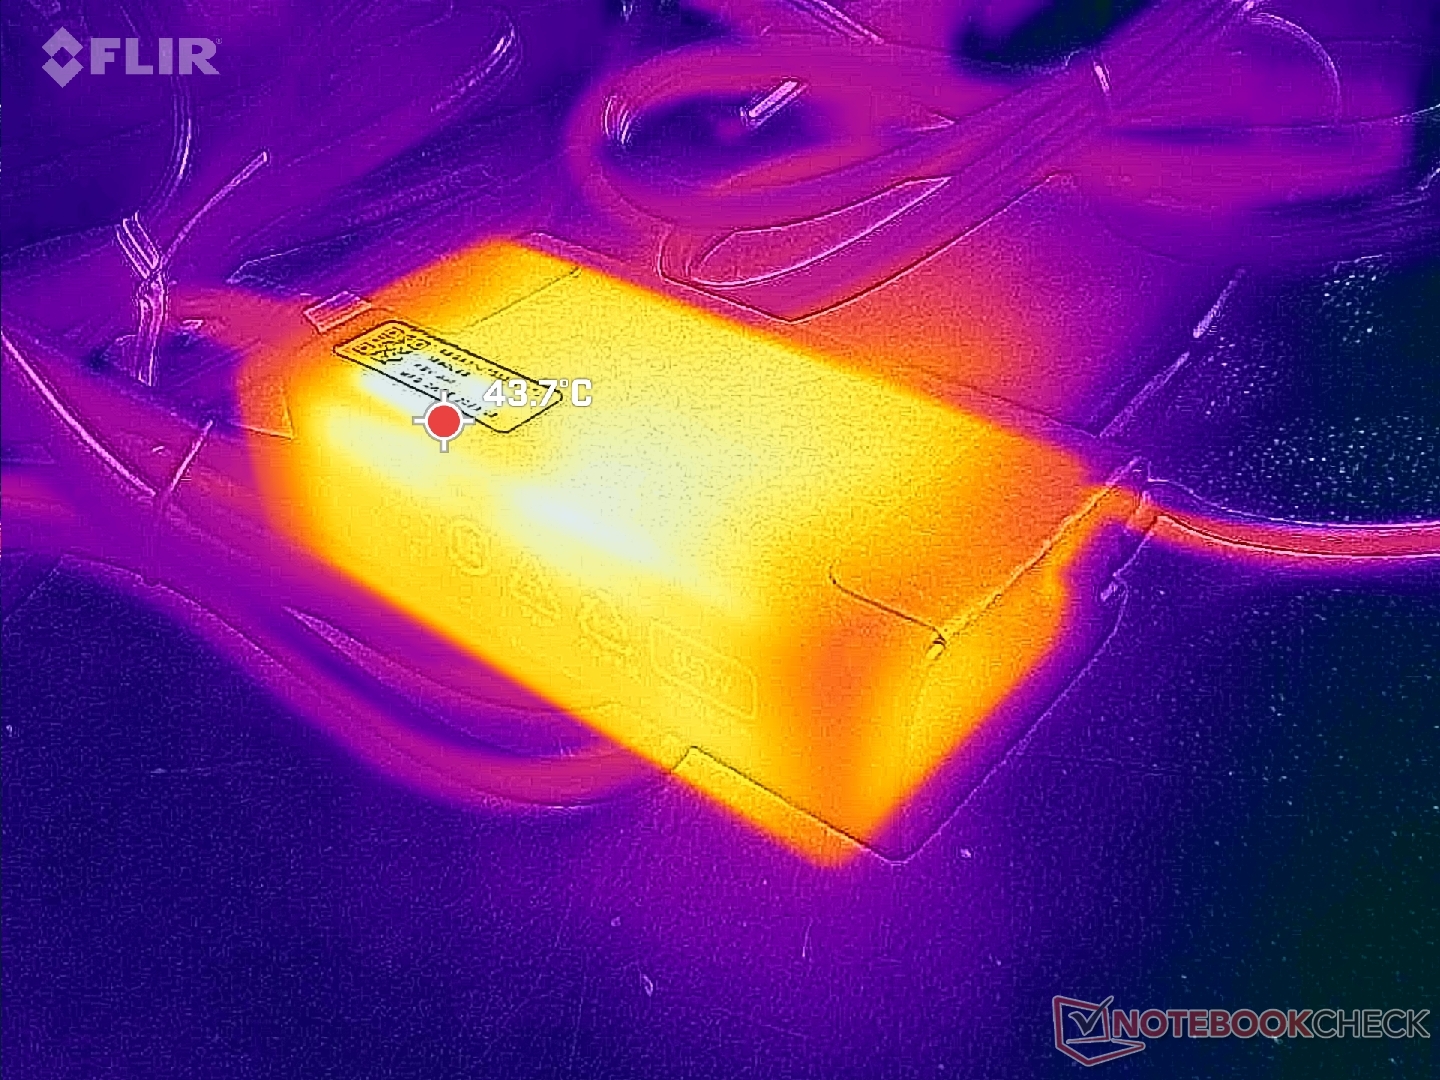
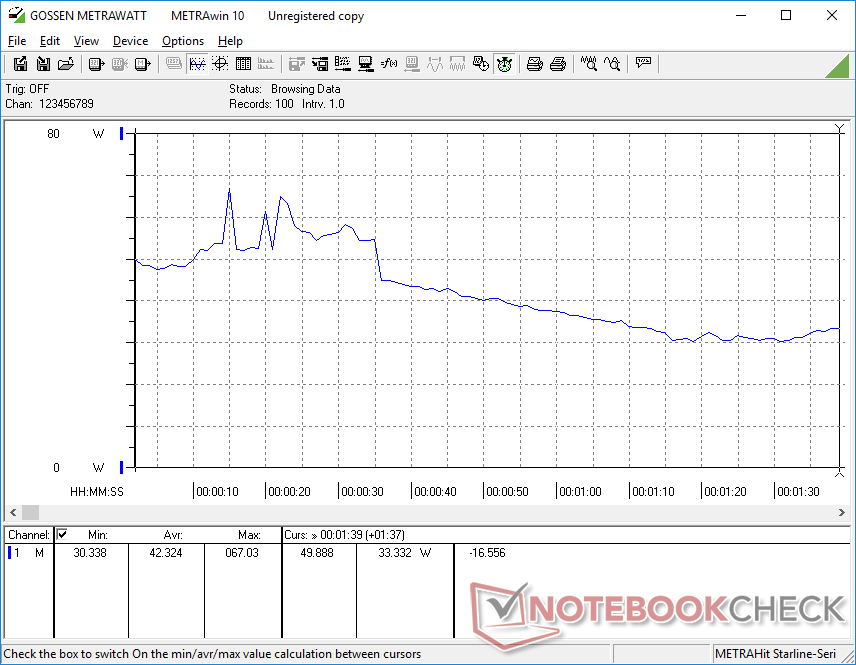
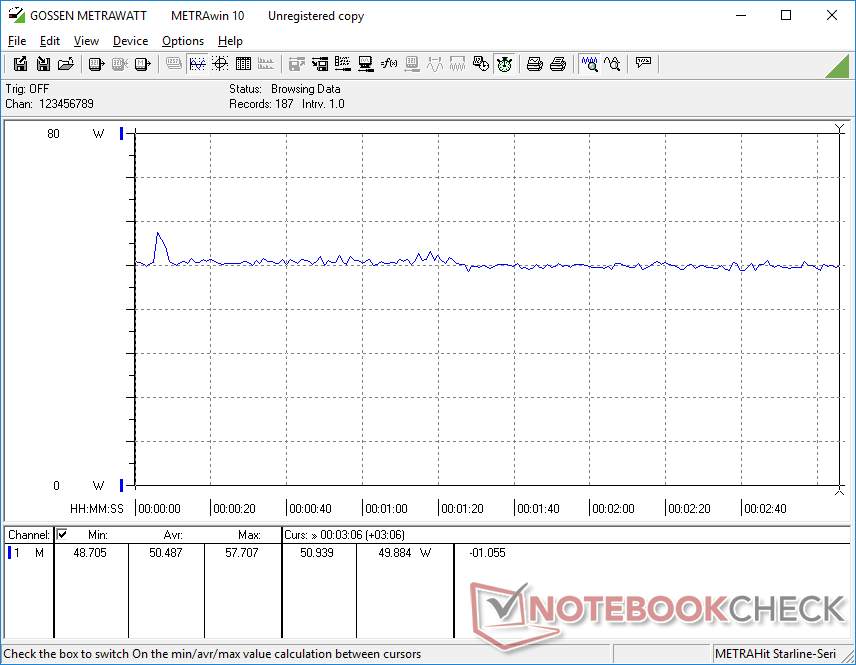
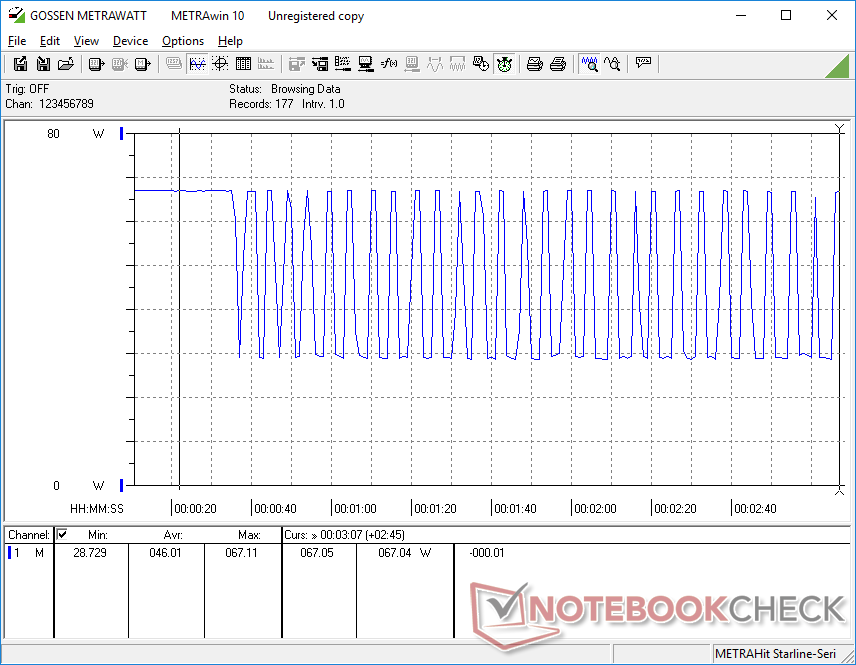
Strömförbrukning
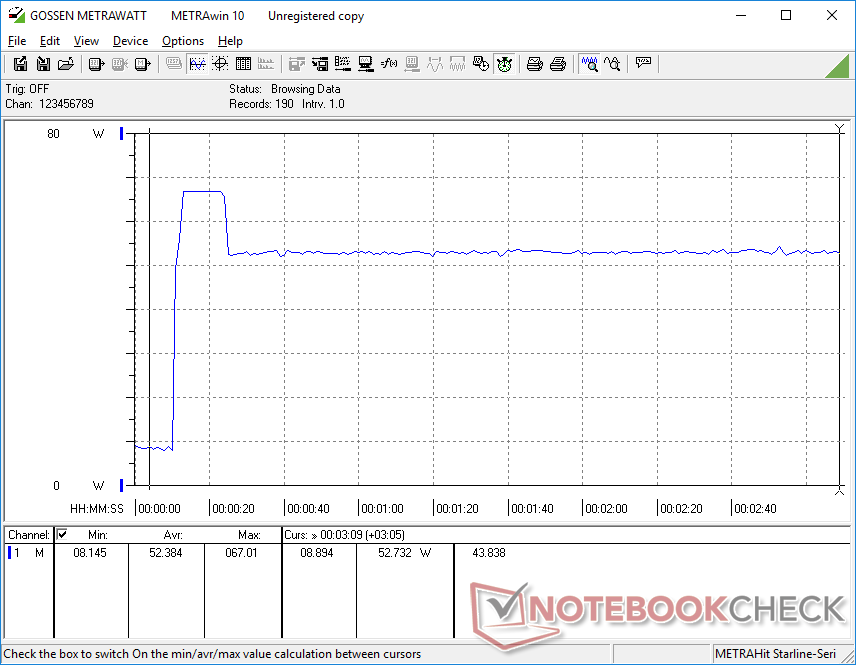
Strömförbrukningen återspeglar den kraftiga CPU-strypningen som nämndes ovan. När man kör Prime95, till exempel, varierar förbrukningen mellan 29 W och 67 W, medan exakt samma test på AMD ThinkPad E14 G5 ger en mer stabil förbrukning på 47 W.
Förbrukningen kan vara så hög som 67 W från den lilla (9 x 4,7 x 2,7 cm) 65 W USB-C AC-adaptern när processorn utnyttjas till 100 procent. Intel-systemet är därför mer strömkrävande än AMD-systemet när Turbo Boost är som snabbast, t.ex. vid multitasking eller start av applikationer. Detta kan också observeras när CineBench R15 xT-riktmärket initieras, vilket visas i jämförelsegrafen nedan. Annars är förbrukningen ungefär densamma mellan de två versionerna när de är på tomgång på skrivbordet eller när de kör mindre krävande belastningar.
| Av/Standby | |
| Låg belastning | |
| Hög belastning |
|
Förklaring:
min: | |
| Lenovo ThinkPad E14 G5 i7-1355U i7-1355U, Iris Xe G7 96EUs, WD PC SN740 512GB SDDQMQD-512G, IPS, 1920x1200, 14" | Lenovo ThinkPad E14 G5-21JSS05C00 R7 7730U, Vega 8, WD PC SN740 SDDPNQD-1T00, IPS, 2240x1400, 14" | HP EliteBook 845 G10 818N0EA R9 PRO 7940HS, Radeon 780M, SK hynix PC801 HFS001TEJ9X101N, IPS, 2560x1600, 14" | Asus ZenBook 14 UM3402Y R7 7730U, Vega 8, Micron 2400 MTFDKBA512QFM, OLED, 2880x1800, 14" | LG Gram 14Z90Q i5-1240P, Iris Xe G7 80EUs, Samsung PM9A1 MZVL2512HCJQ, IPS, 1920x1200, 14" | Dell Latitude 7440 i5-1345U, Iris Xe G7 80EUs, Samsung MZ9L4512HBLU-00BMV, IPS, 2560x1600, 14" | |
|---|---|---|---|---|---|---|
| Power Consumption | -3% | -33% | -42% | -0% | -5% | |
| Idle Minimum * (Watt) | 3.6 | 3.3 8% | 4.3 -19% | 7.9 -119% | 3 17% | 4.5 -25% |
| Idle Average * (Watt) | 6.9 | 7.6 -10% | 10.1 -46% | 8.8 -28% | 6 13% | 6.5 6% |
| Idle Maximum * (Watt) | 7 | 8.9 -27% | 11.2 -60% | 14.7 -110% | 12 -71% | 7.3 -4% |
| Load Average * (Watt) | 42.3 | 47.3 -12% | 64.4 -52% | 46.9 -11% | 40 5% | 52.5 -24% |
| Witcher 3 ultra * (Watt) | 50.5 | 45.1 11% | 59.4 -18% | 44.9 11% | 36.5 28% | 46.2 9% |
| Load Maximum * (Watt) | 67 | 57.8 14% | 66.7 -0% | 65.2 3% | 63 6% | 63 6% |
* ... mindre är bättre
Power Consumption Witcher 3 / Stresstest
Power Consumption external Monitor
Batteritid
Batteriet är mindre för vissa Intel-konfigurationer jämfört med vår AMD-konfiguration (47 Wh vs. 57 Wh) och därför bör användare förvänta sig kortare drifttider om de konfigureras med det mindre alternativet. Vi kan surfa på webben i cirka 5,5 timmar innan den stängs av automatiskt, jämfört med nästan 10 timmar på AMD-versionen.
Laddning från tom till full kapacitet är annars mycket snabb på drygt en timme med den medföljande nätadaptern. Snabbladdning är aktiverat som standard.
| Lenovo ThinkPad E14 G5 i7-1355U i7-1355U, Iris Xe G7 96EUs, 47 Wh | Lenovo ThinkPad E14 G5-21JSS05C00 R7 7730U, Vega 8, 57 Wh | HP EliteBook 845 G10 818N0EA R9 PRO 7940HS, Radeon 780M, 51 Wh | Asus ZenBook 14 UM3402Y R7 7730U, Vega 8, 75 Wh | LG Gram 14Z90Q i5-1240P, Iris Xe G7 80EUs, 72 Wh | Dell Latitude 7440 i5-1345U, Iris Xe G7 80EUs, 57 Wh | |
|---|---|---|---|---|---|---|
| Batteridrifttid | 80% | 44% | 120% | 116% | 136% | |
| WiFi v1.3 (h) | 5.5 | 9.9 80% | 7.9 44% | 12.1 120% | 11.9 116% | 13 136% |
| H.264 (h) | 10.8 | 9.3 | ||||
| Load (h) | 1.2 | 0.9 | 3.4 | 2.8 | 2.7 | |
| Reader / Idle (h) | 18.5 | 28.9 | 23.8 |
För
Emot
Omdöme - Bra men svårare att rekommendera än AMD Ryzen 7-versionen
Vår Intel-enhet konfigurerad med Core i7-processor, 16 GB RAM, 1200p-pekskärm och 512 GB SSD kostar cirka 915 USD jämfört med 865 USD för Ryzen 7-versionen med samma RAM, pekskärm och SSD. Om du väljer AMD-versionen får du snabbare flertrådsprestanda, längre batteritid och stöd för M.2 2280 SSD, medan Intel-versionen ger dig snabbare enkeltrådsprestanda och Thunderbolt-stöd. Andra aspekter som grafikprestanda, yttemperatur och fläktljud är annars mycket lika mellan de två versionerna. Såvida du inte verkligen värdesätter enkeltrådsprestanda och Thunderbolt är AMD-versionen lättare att rekommendera än Intel-versionen för majoriteten av intresserade köpare.
Den Intel-baserade ThinkPad E14 G5 uppvisar brantare strypningsbeteende än sitt billigare Ryzen 7-alternativ.
Några företagscentrerade extrafunktioner som WAN och Smart Card saknas, men det är avsiktligt eftersom ThinkPad E-serien är tänkt att vara ett mer prisvärt alternativ till den avancerade och mycket dyrare ThinkPad T-serien eller X-serien.
Pris och tillgänglighet
Amazon levererar nu ThinkPad E14 Gen 5 som recenserats för $915 USD. Lenovo skickar också samma modell men med extra RAM för drygt $1030.
Lenovo ThinkPad E14 G5 i7-1355U
- 10/26/2023 v7 (old)
Allen Ngo
Genomskinlighet
Valet av enheter som ska granskas görs av vår redaktion. Testprovet gavs till författaren som ett lån av tillverkaren eller återförsäljaren för denna recension. Långivaren hade inget inflytande på denna recension och inte heller fick tillverkaren en kopia av denna recension innan publiceringen. Det fanns ingen skyldighet att publicera denna recension. Som ett oberoende medieföretag är Notebookcheck inte föremål för auktoritet från tillverkare, återförsäljare eller förlag.
This is how Notebookcheck is testingEvery year, Notebookcheck independently reviews hundreds of laptops and smartphones using standardized procedures to ensure that all results are comparable. We have continuously developed our test methods for around 20 years and set industry standards in the process. In our test labs, high-quality measuring equipment is utilized by experienced technicians and editors. These tests involve a multi-stage validation process. Our complex rating system is based on hundreds of well-founded measurements and benchmarks, which maintains objectivity.
Price comparison

