Dell Latitude 7230 Rugged Extreme-tablett recension: En av de bästa skärmarna i sin kategori

Latitude 7230 Rugged Extreme tillkännagavs i Oktober förra året som efterföljare till Latitude 7220 Rugged Extreme. Den introducerar ett uppdaterat chassi med en större skärmstorlek (11,6 tum till 12 tum), snabbare Intel CPU-alternativ (8:e generationen till 12:e generationen) och snabbare anslutningsalternativ (Wi-Fi 6 till 6E, 5G).
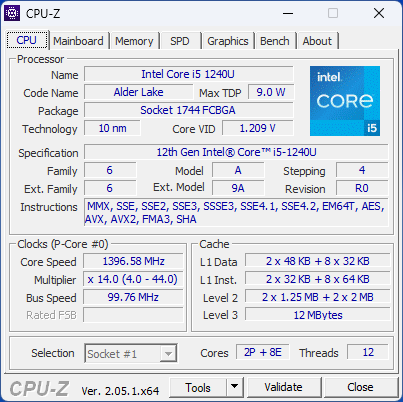
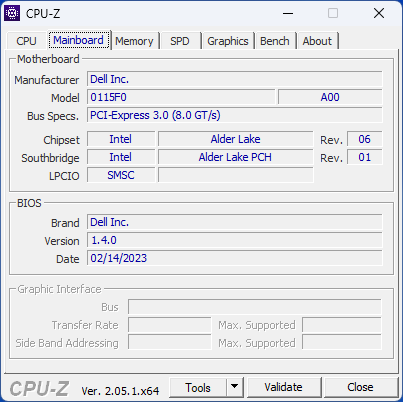
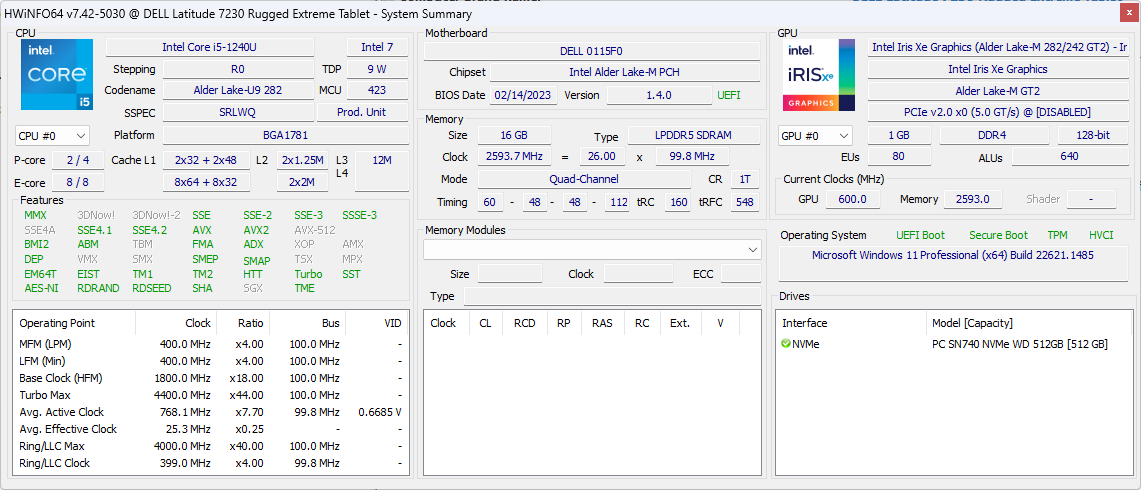
Vår enhet i recensionen i en mellanklass SKU med Core i5-1240U, 16 GB RAM och 512 GB NVMe SSD för cirka 3200 USD. Andra SKU:er finns tillgängliga med den långsammare Core i3-1210U, snabbare i7-1260U, mer RAM eller lagring och andra expansioner. Alla konfigurationer levereras annars med samma 1920 x 1200 IPS-pekskärm med 1200 nit. De fullständiga specifikationerna för Latitude 7230 Rugged Extreme är offentligt tillgängliga via Dell här.
Alternativen är bl.a Acer Enduro T1, den Samsung Galaxy Tab Active-serieneller Panasonic Toughbook FZ-G2-serien.
Fler recensioner av Dell:
Potentiella konkurrenter i jämförelse
Gradering | Datum | Modell | Vikt | Höjd | Storlek | Upplösning | Pris |
|---|---|---|---|---|---|---|---|
| 83.9 % v7 (old) | 04/2023 | Dell Latitude 7230 Rugged Extreme i5-1240U, Iris Xe G7 80EUs | 1.6 kg | 23.9 mm | 12.00" | 1920x1200 | |
v (old) | 05/2022 | Dell Latitude 7330 Rugged Extreme i7-1185G7, Iris Xe G7 96EUs | 2.7 kg | 36.5 mm | 13.30" | 1920x1080 | |
v (old) | 07/2022 | Panasonic Toughbook 40 i7-1185G7, Iris Xe G7 96EUs | 3.9 kg | 53.4 mm | 14.00" | 1920x1080 | |
| 83.8 % v7 (old) | 01/2022 | Getac B360 i7-10710U, UHD Graphics 620 | 2.4 kg | 34.9 mm | 13.30" | 1920x1080 | |
| 82.4 % v7 (old) | 12/2021 | Acer Enduro Urban N3 EUN314 i7-1165G7, Iris Xe G7 96EUs | 1.8 kg | 21.95 mm | 14.00" | 1920x1080 | |
v (old) | 09/2021 | Durabook S14I i7-1165G7, Iris Xe G7 96EUs | 3 kg | 38.1 mm | 14.00" | 1920x1080 |
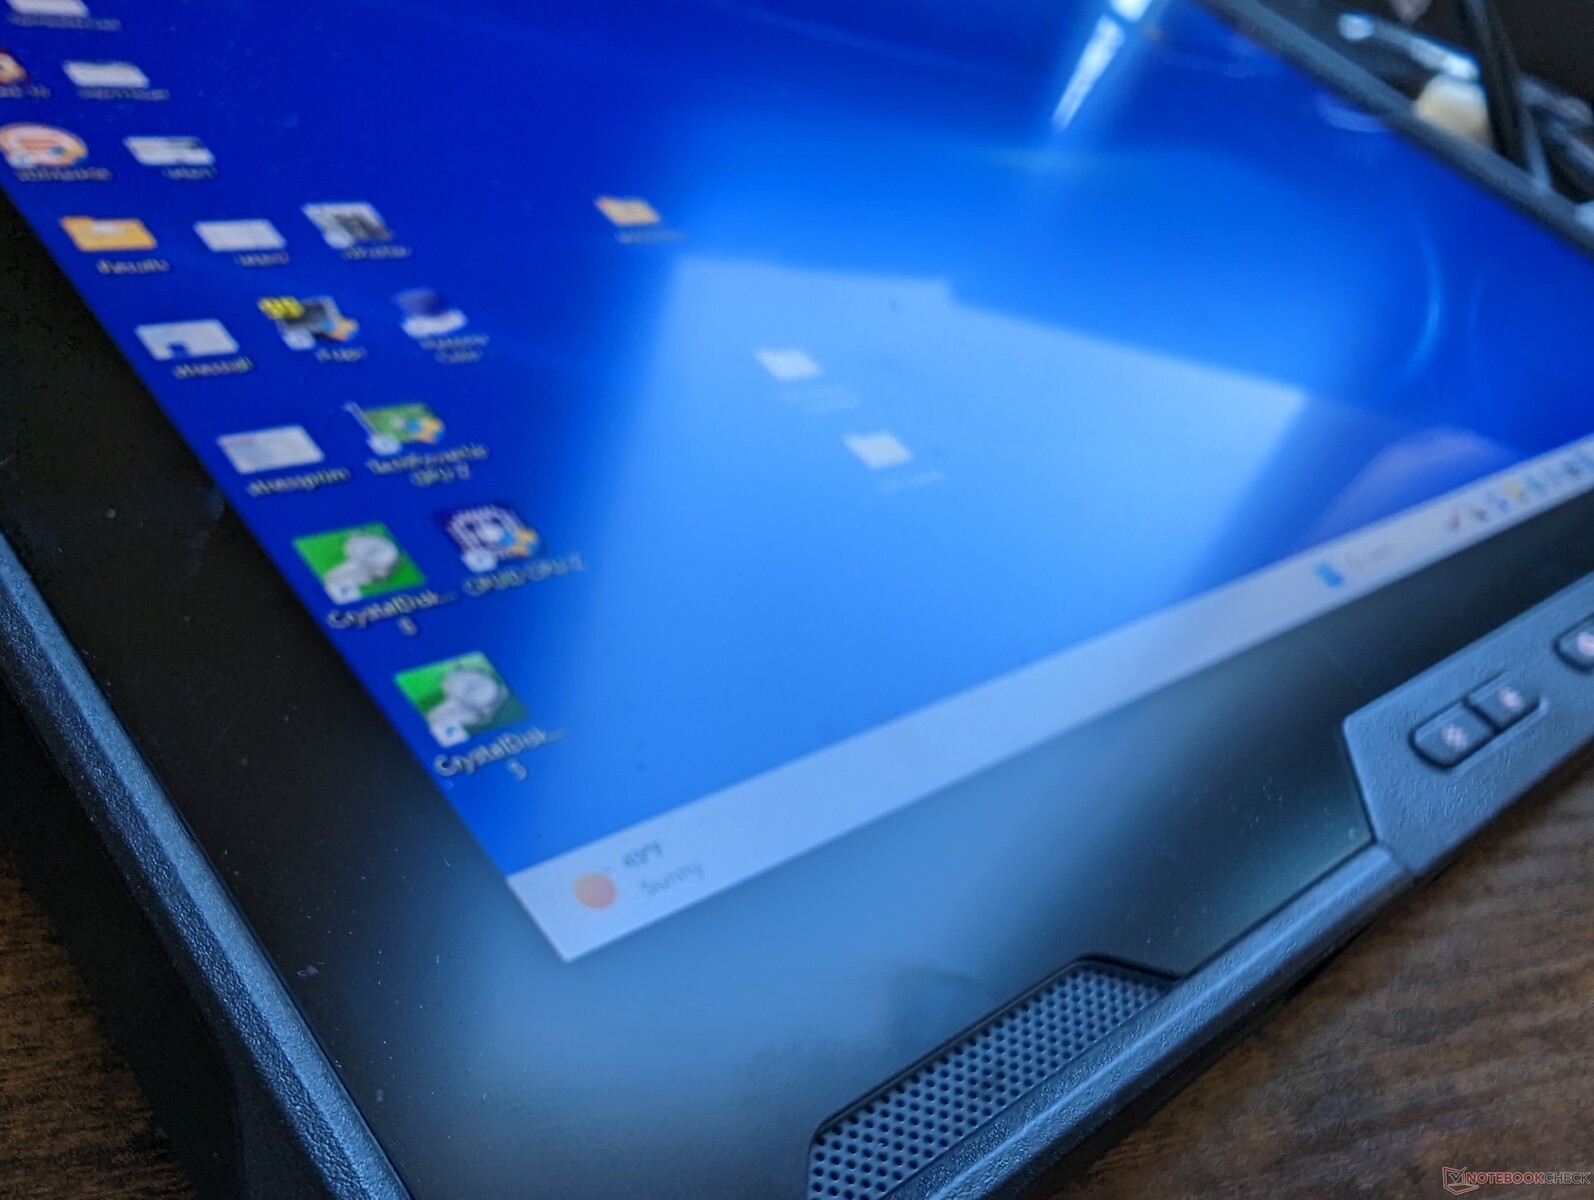
Hölje - Tjockt med relativt smala ramar
Chassit är robust från alla vinklar, särskilt längs de gummerade kanterna och hörnen. Dess svagaste punkt är direkt i mitten av pekskärmen där det märks att den vrider sig när man trycker hårt på den med ett finger. Det är inget stort bekymmer eller något, men all skevhet är ändå värd att nämna.
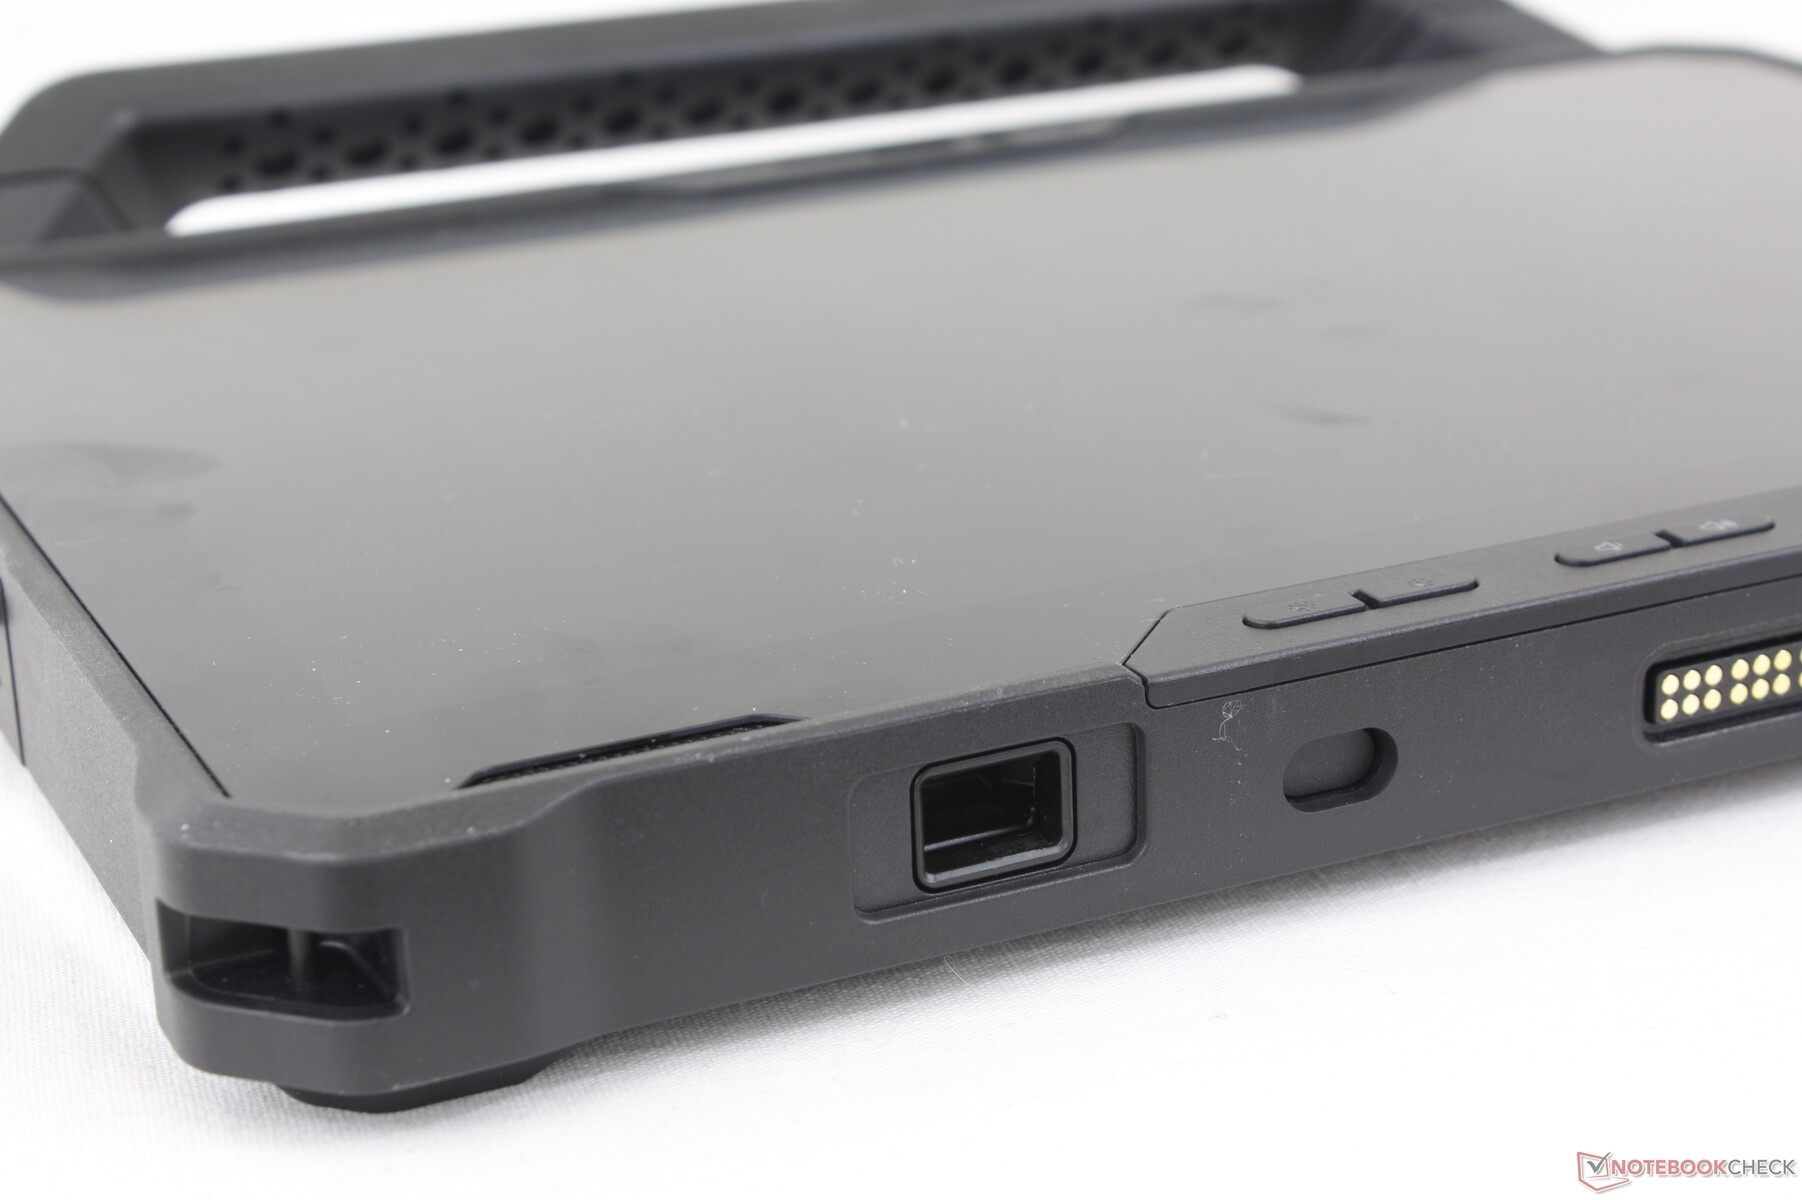
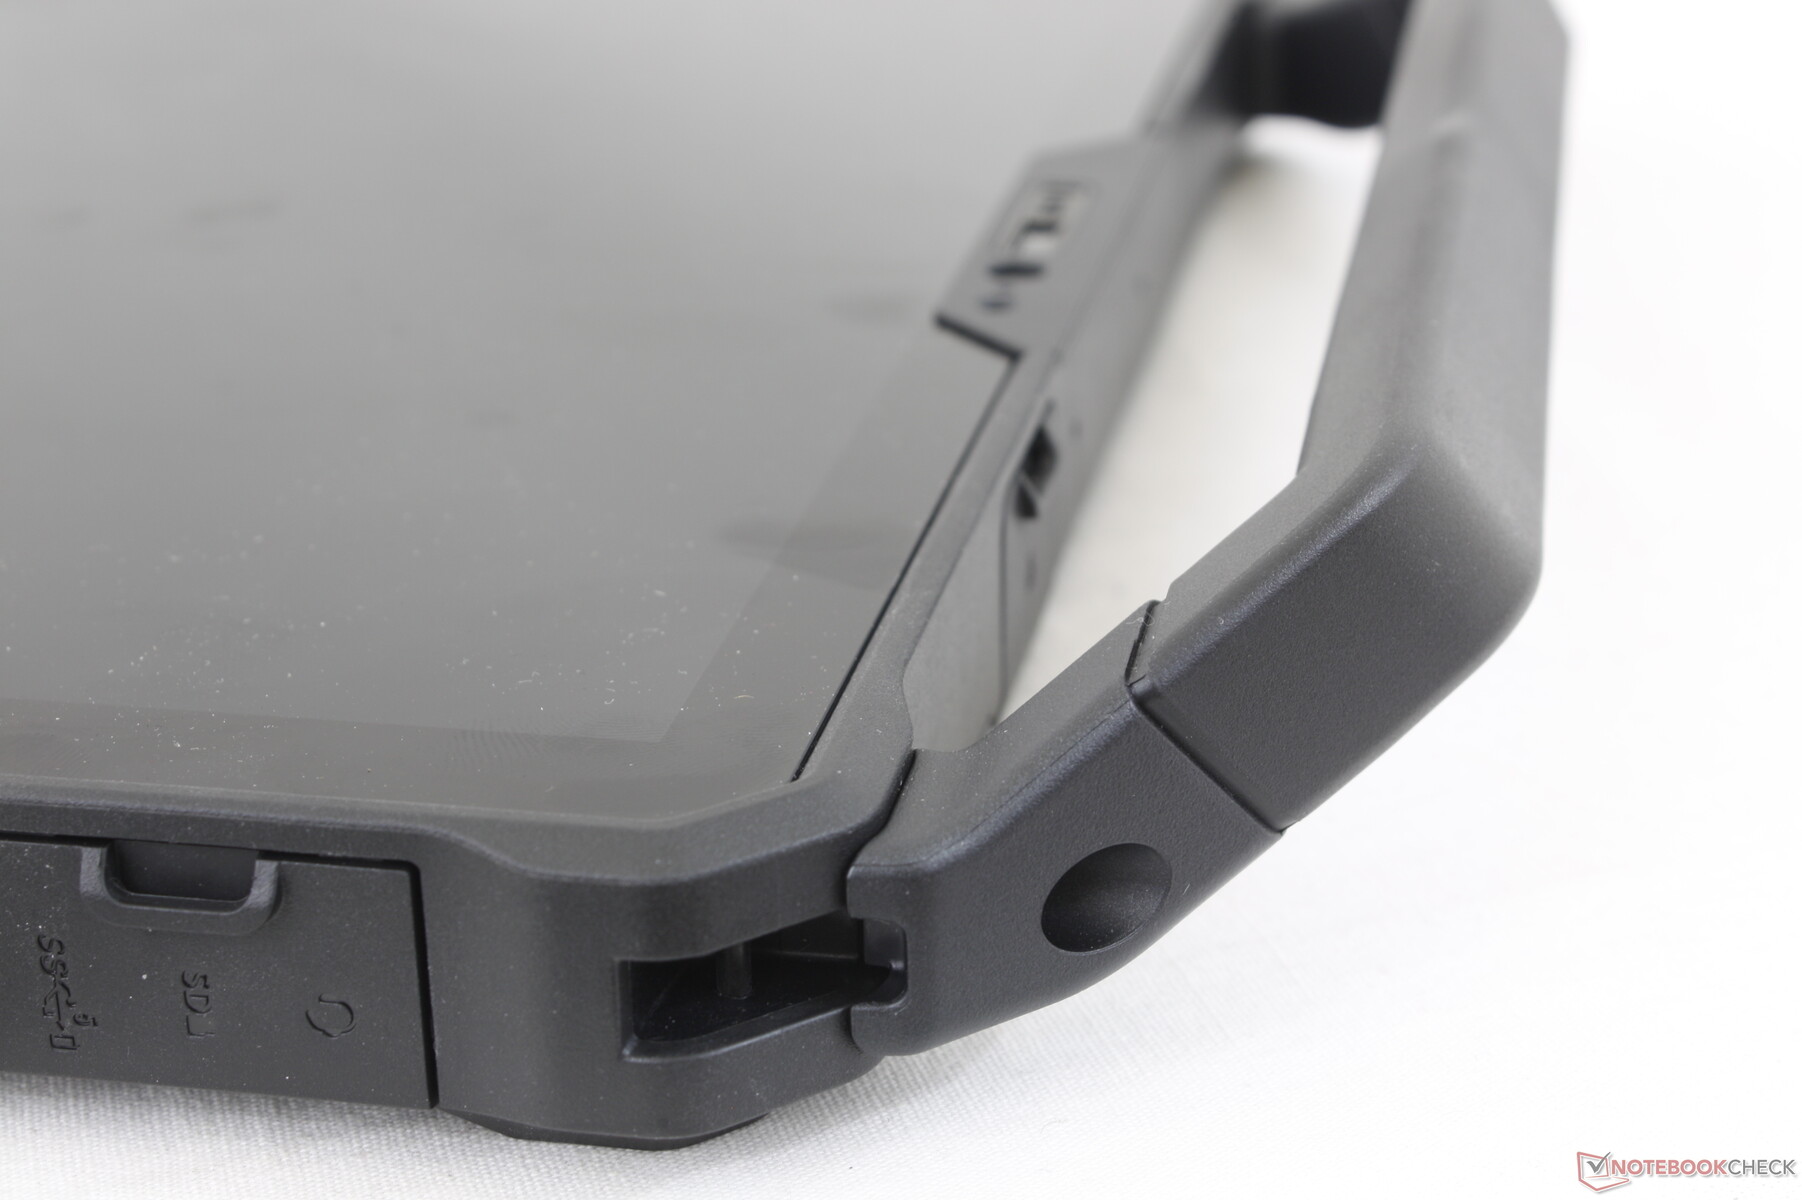
Några irriterande aspekter av fodralet är de pilliga locken för portarna och de svampiga knapparna på framsidan. Portlocken är svåra att greppa medan knappgenomgångarna kunde behöva lite mer eftergivenhet när de trycks in. Den konkurrerande Toughbook FZ-G2 gör det lite bättre i det här avseendet.
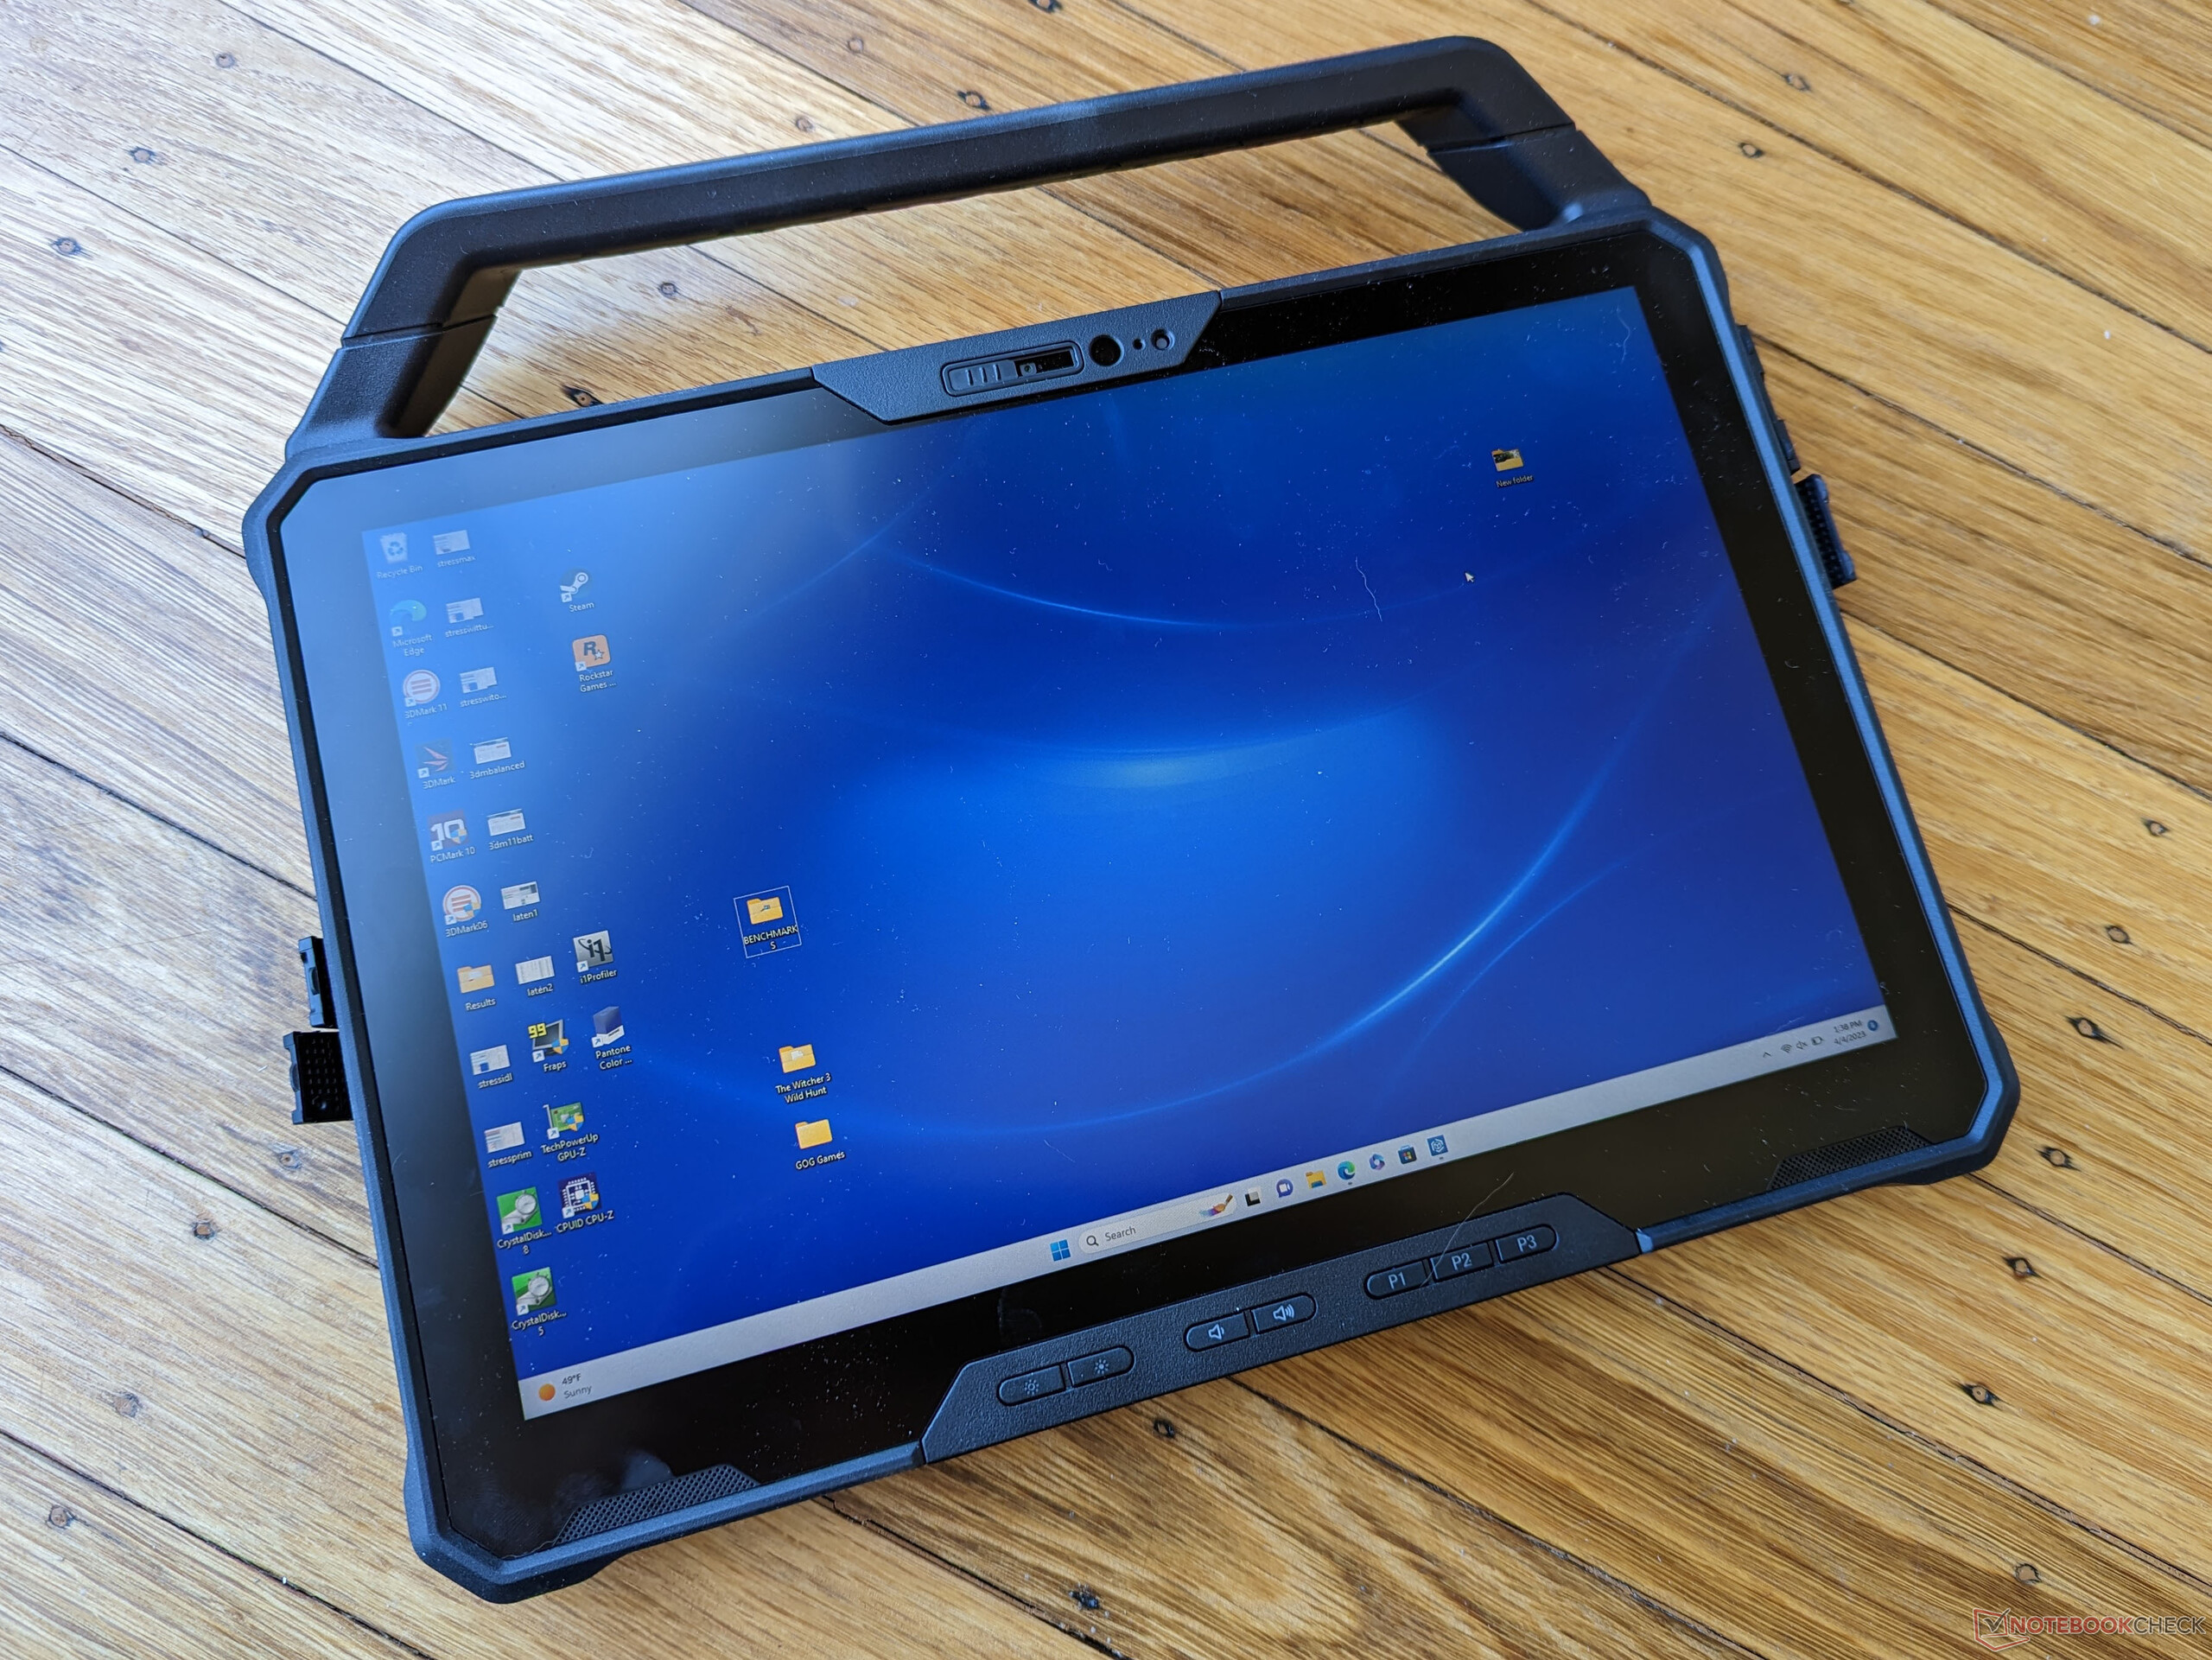
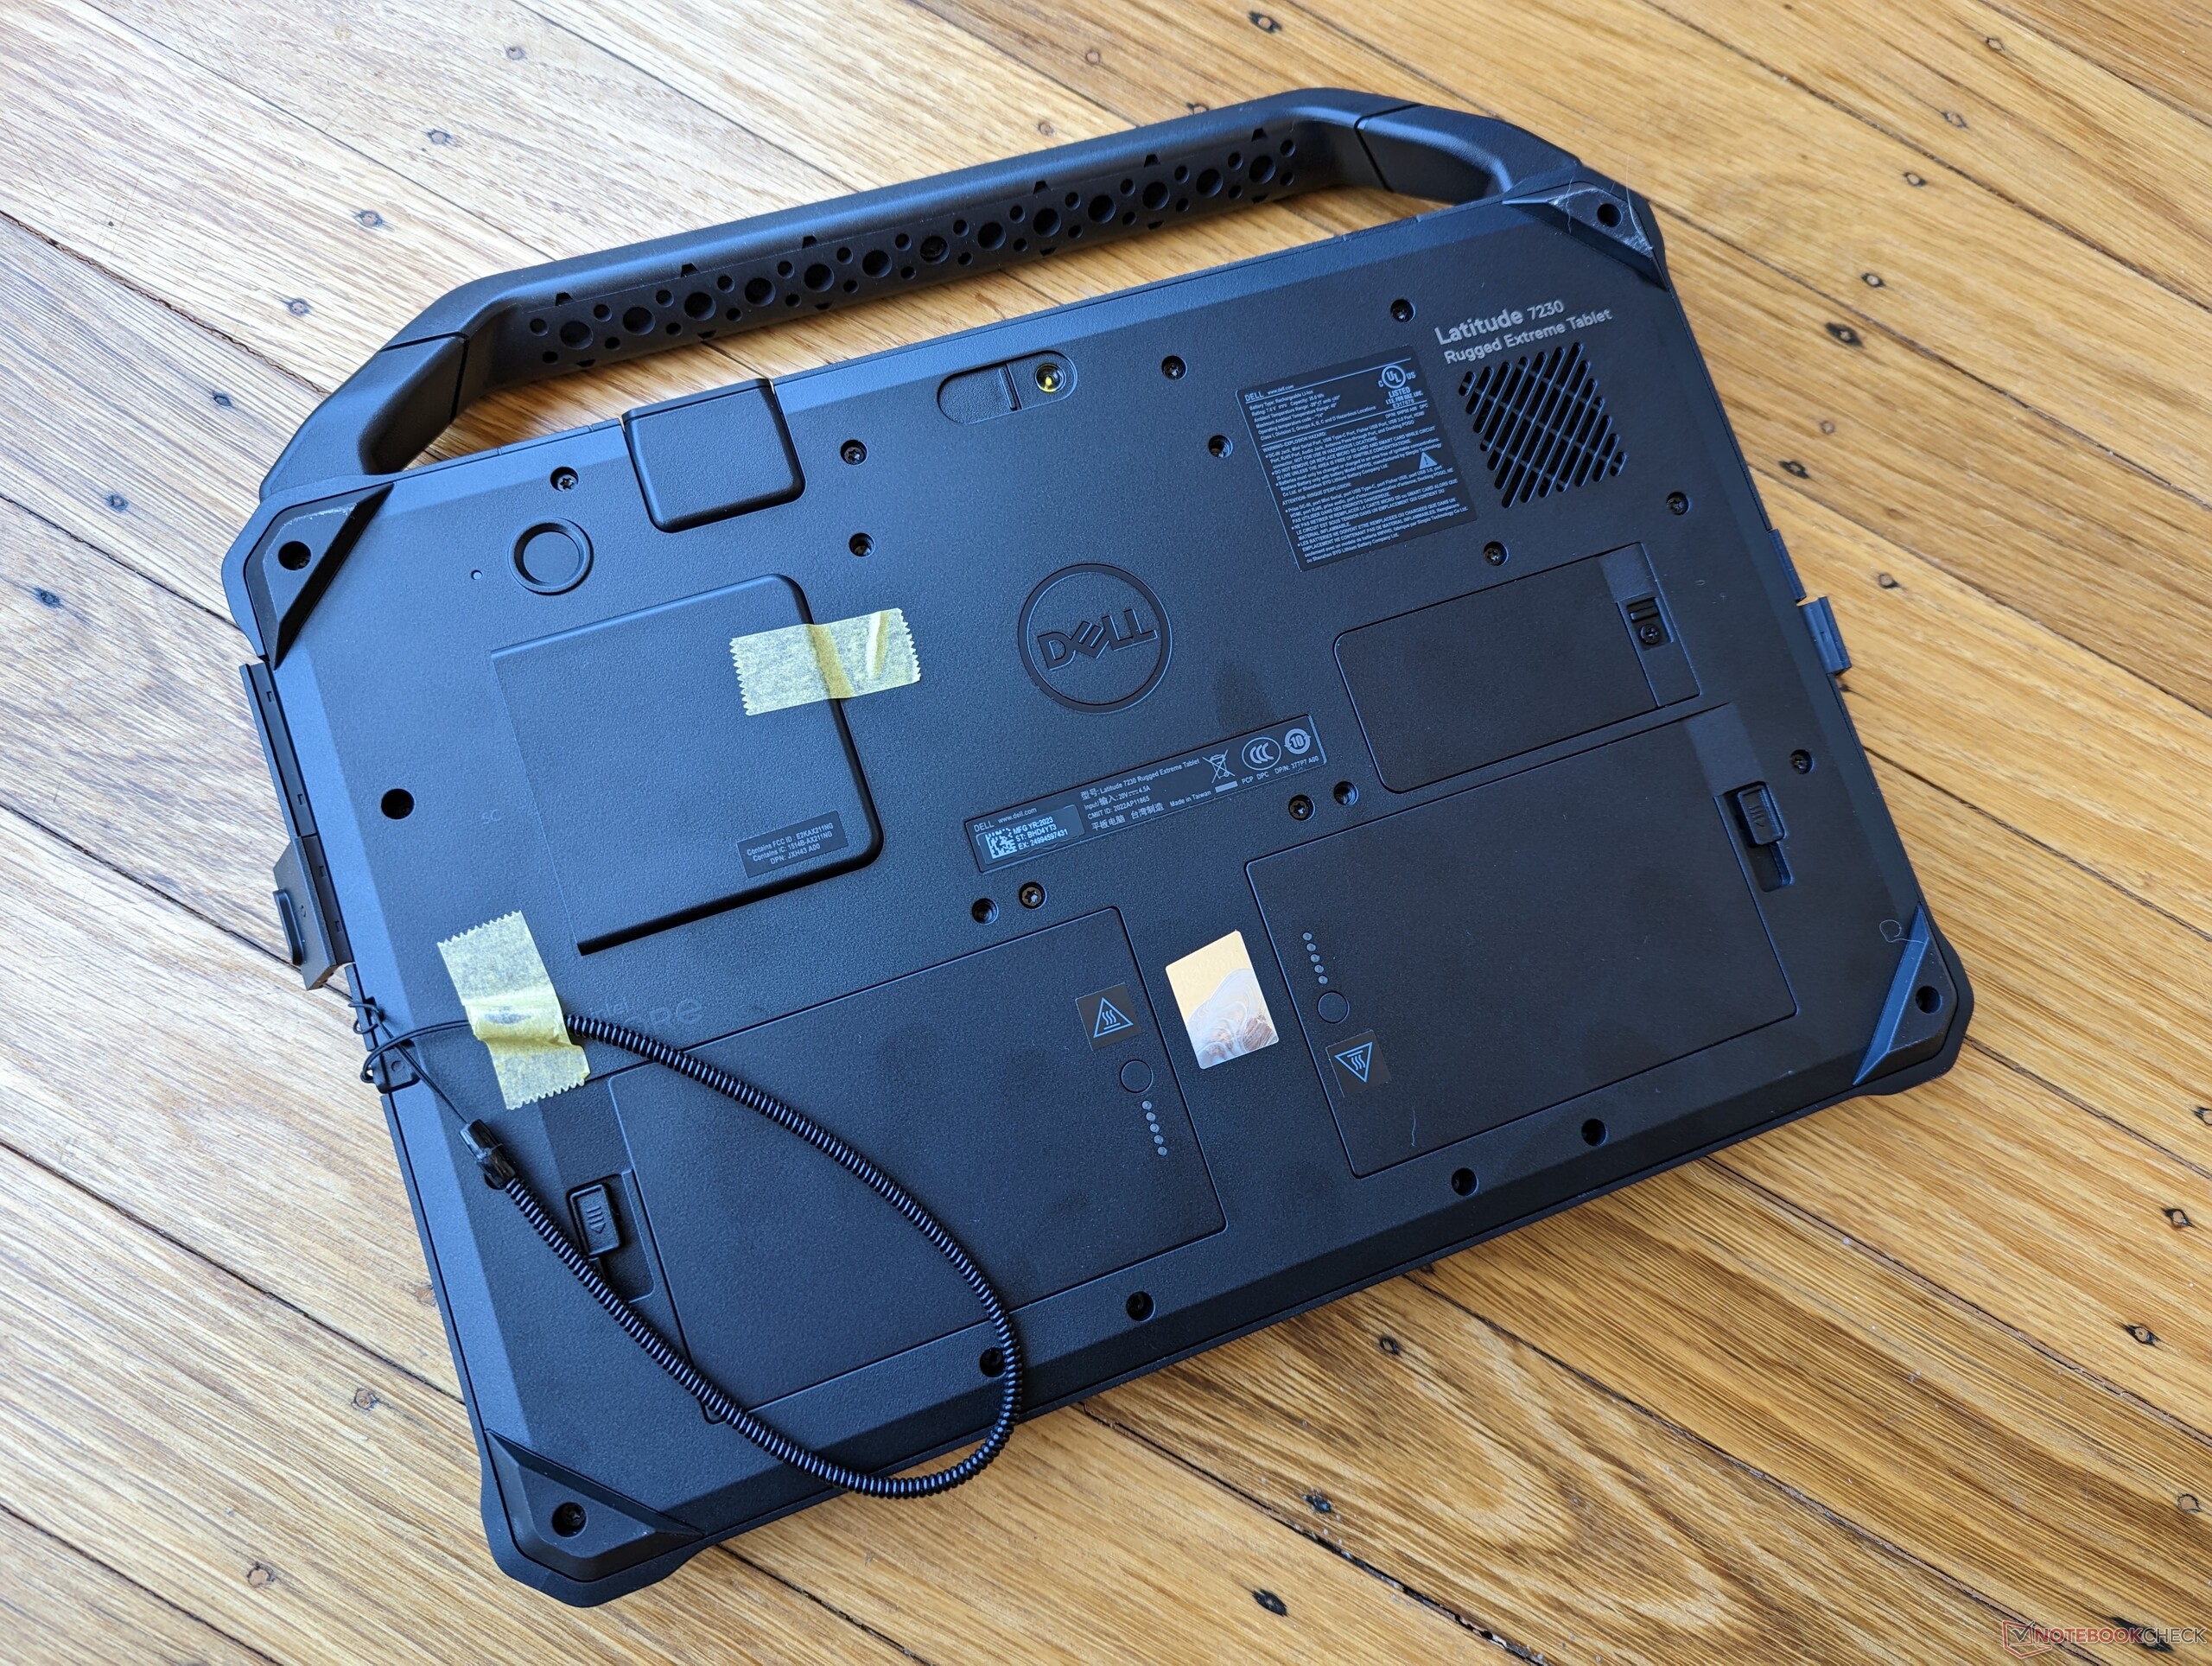
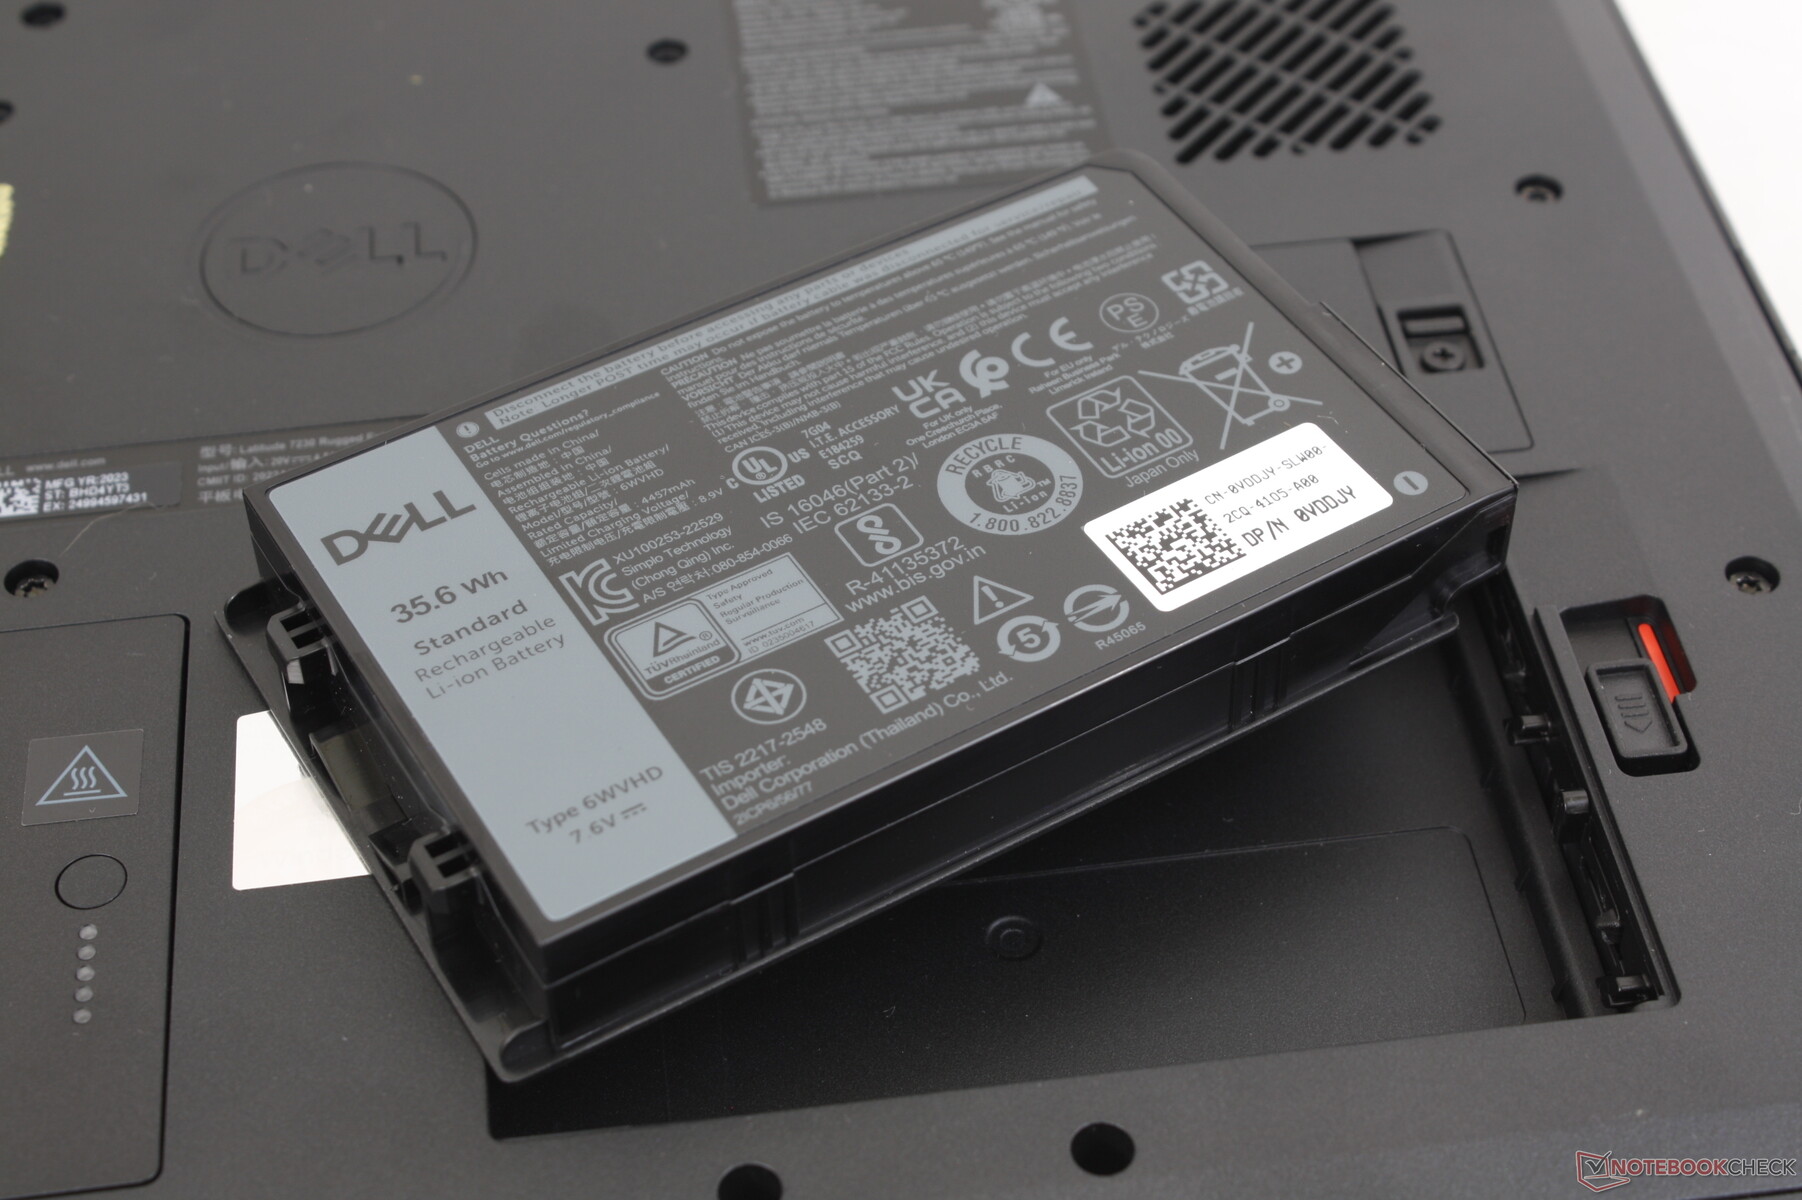
Med en vikt på cirka 1,6 kg inklusive de två utbytbara batterierna är enheten en av de lättare stryktåliga surfplattorna i sin kategori. Längd och bredd ligger bekvämt nog mycket nära DIN A4-standarden när man inte tar hänsyn till det avtagbara bärhandtaget.
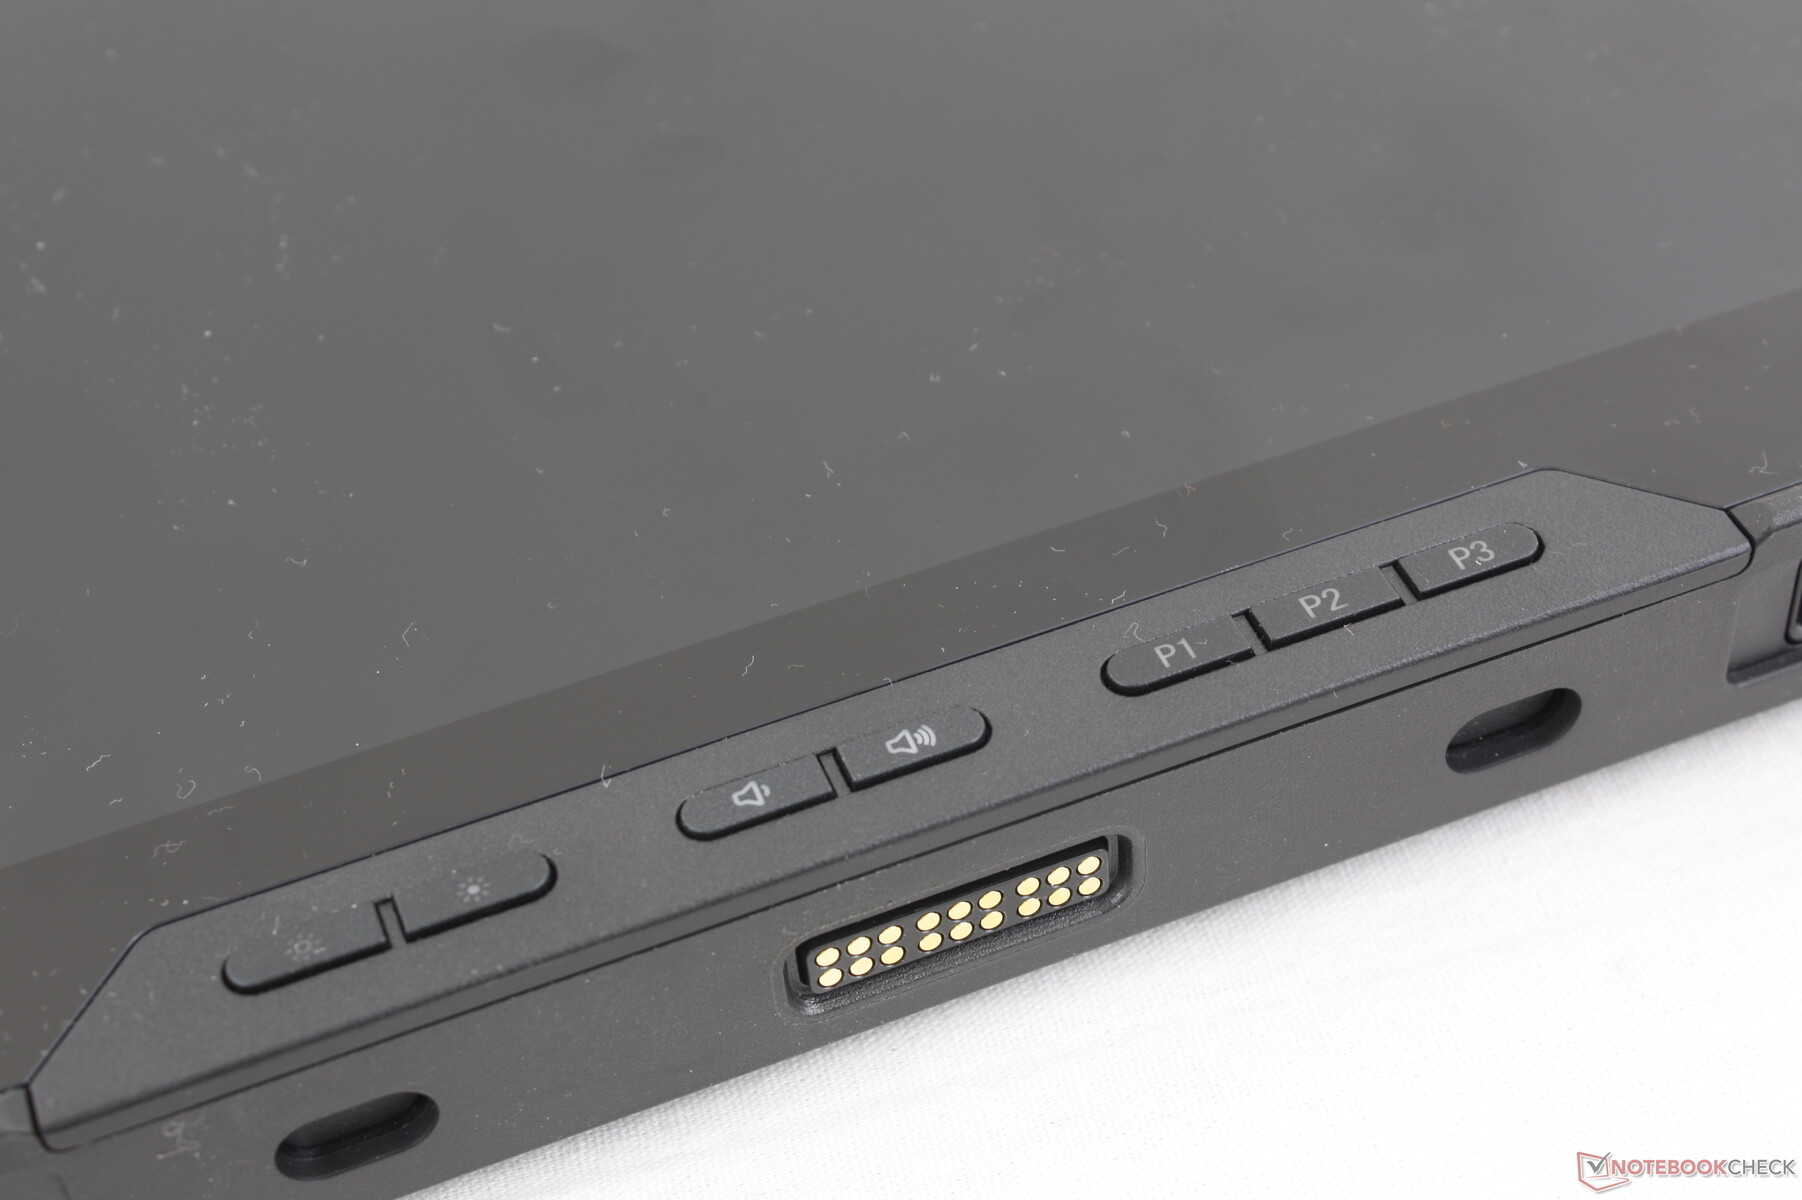
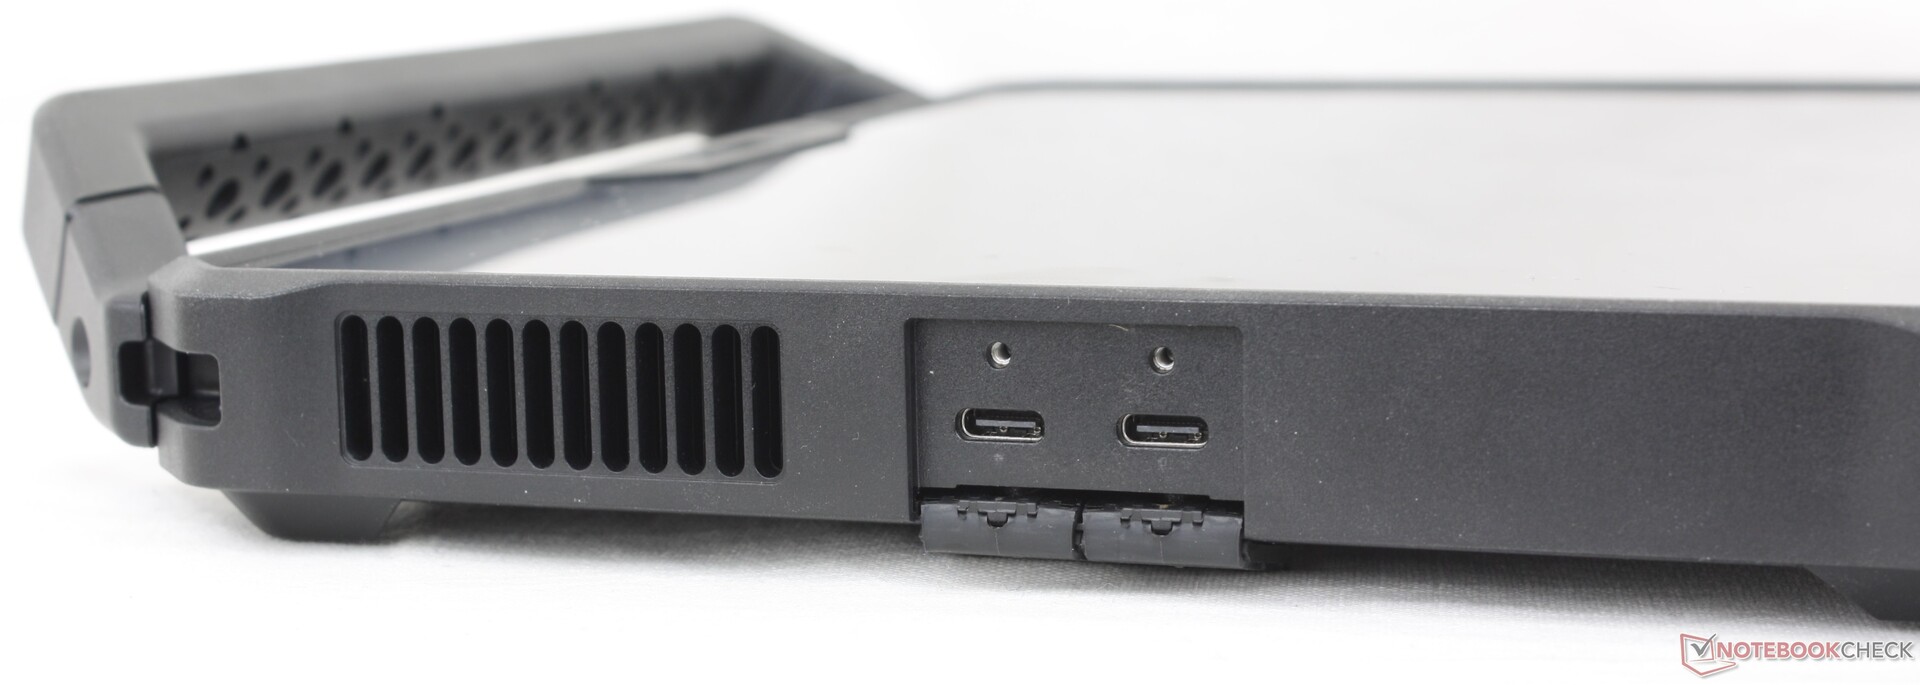
Anslutning - Stöd för 2x Thunderbolt 4
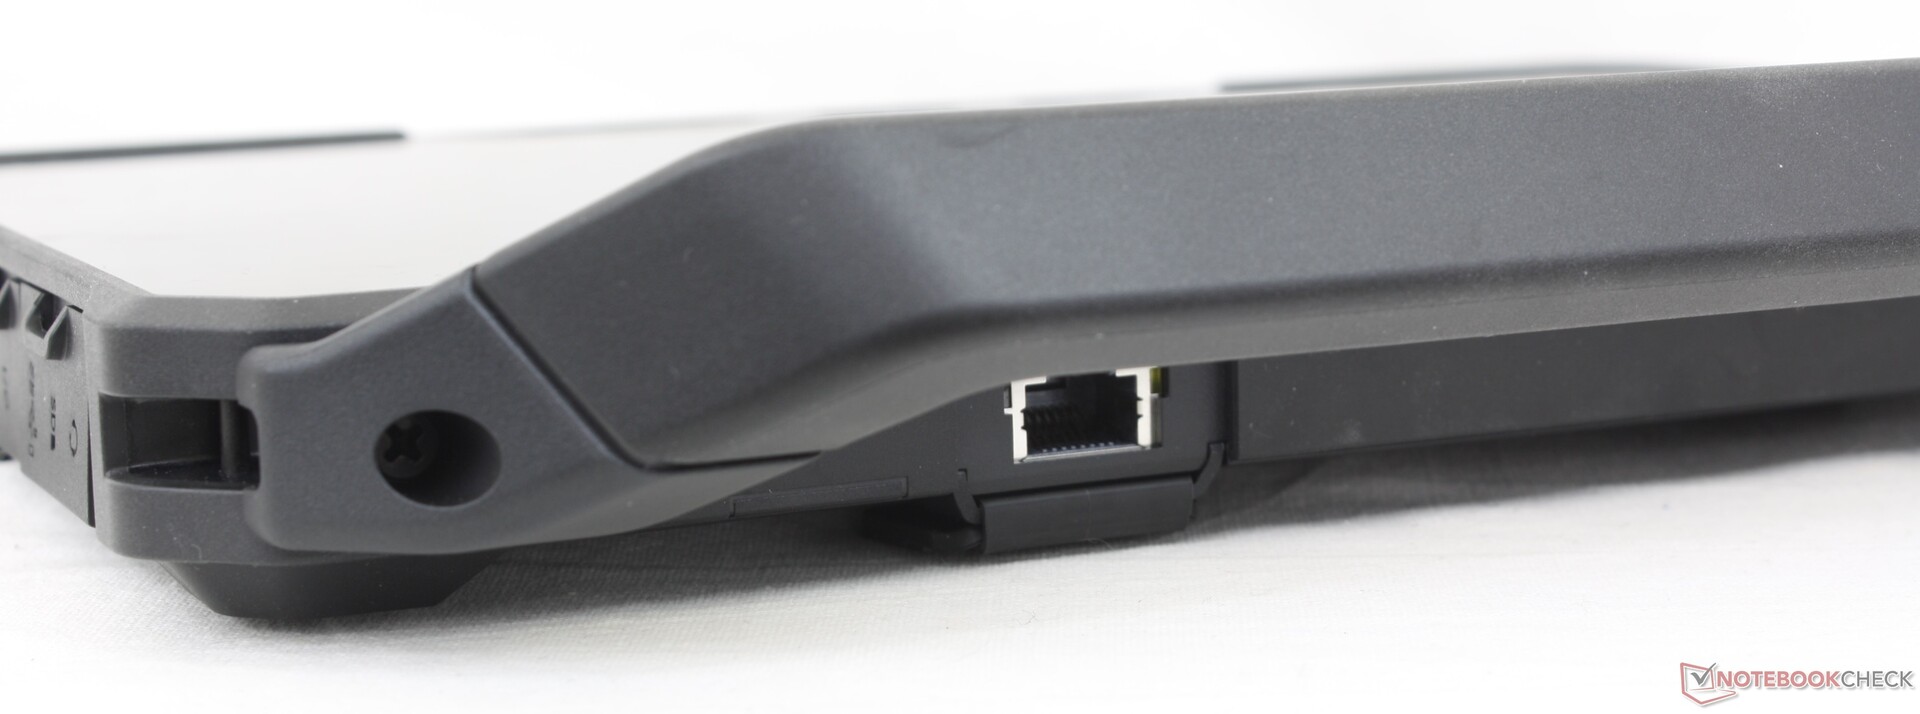
Det finns ett stort urval av integrerade portar att välja mellan. Särskilt de två Thunderbolt 4-portarna är anmärkningsvärda eftersom de ger samma dockningsmöjligheter och stöd för externa bildskärmar som moderna ultrabooks för konsumenter. Tänk dock på att den ena alltid kommer att vara upptagen för laddning.
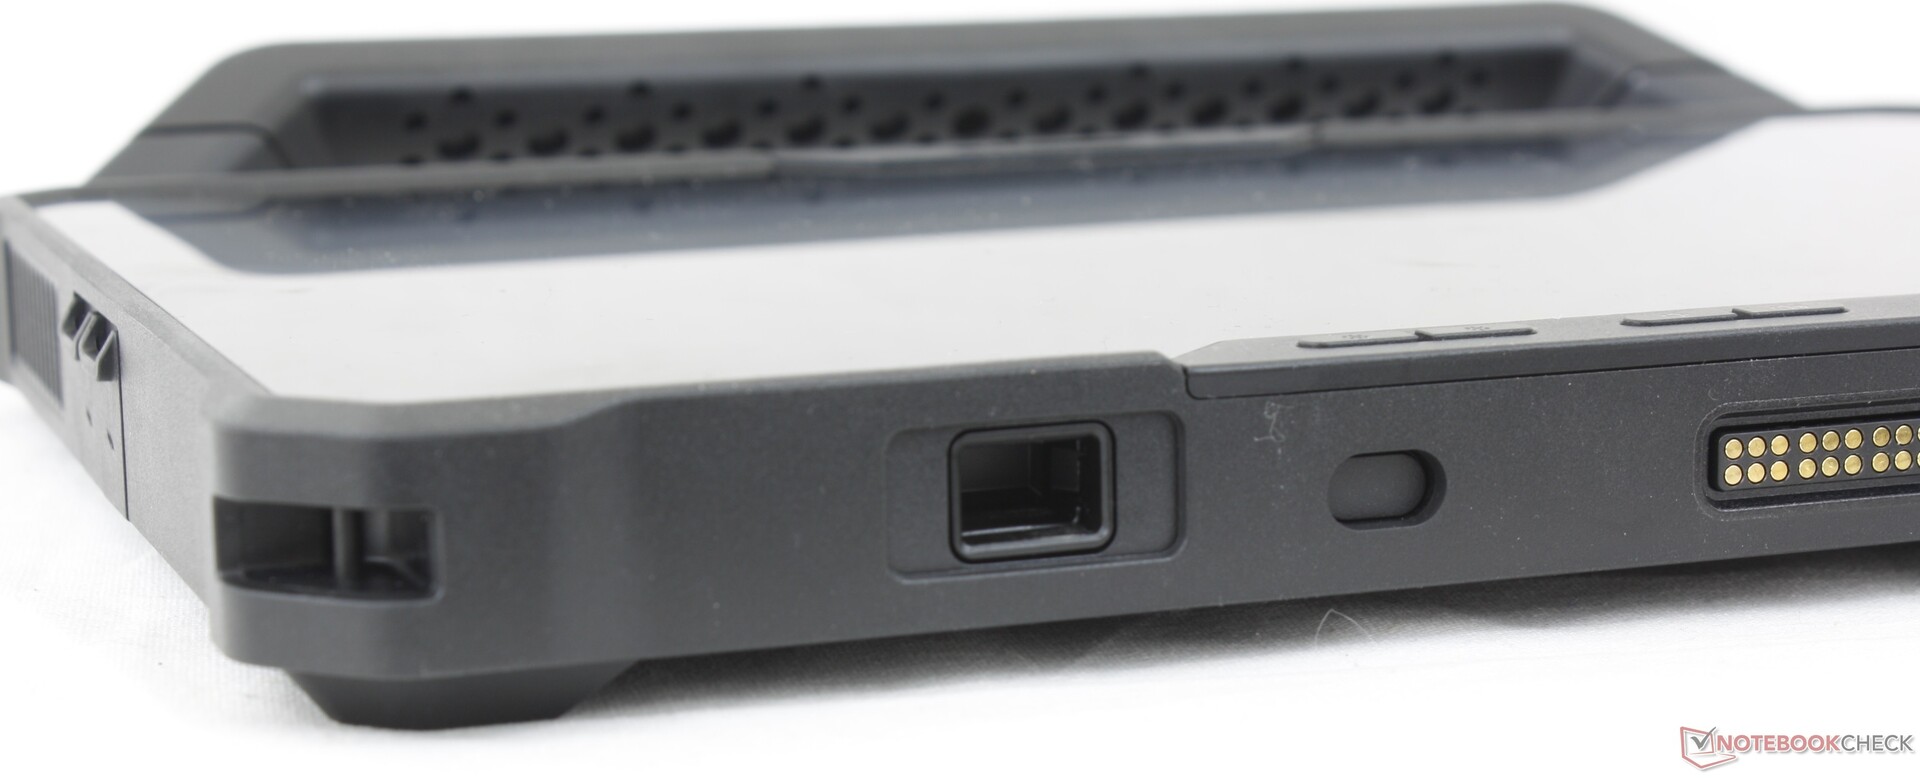
De flesta av de andra portarna är valfria och kan konfigureras vid kassan, inklusive HDMI 2.0, USB-A, RJ-45, RS-232 eller en streckkodsläsare.
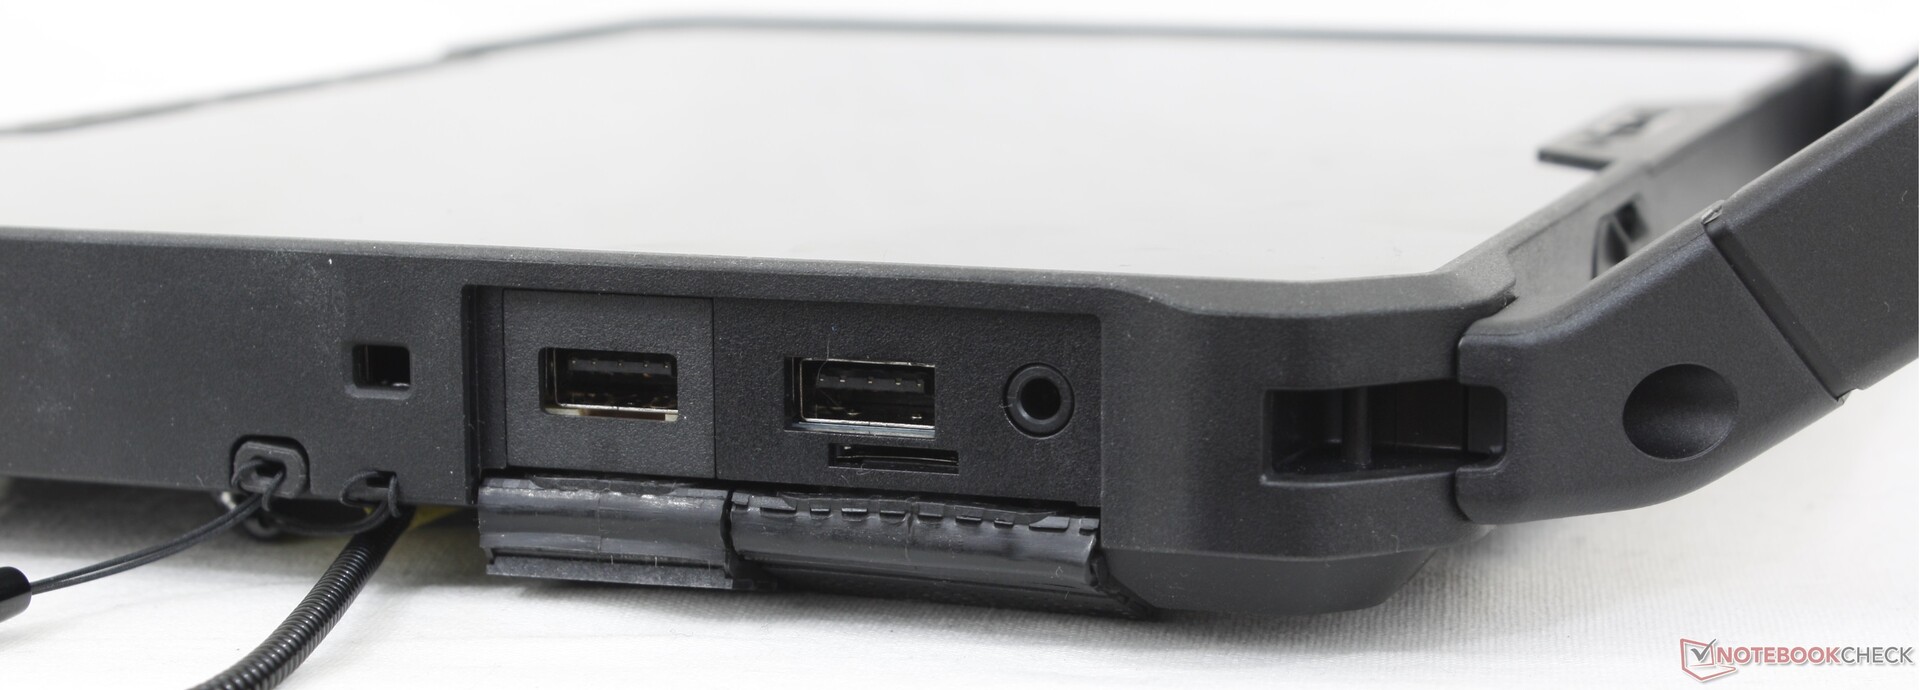
SD-kortläsare
| SD Card Reader | |
| average JPG Copy Test (av. of 3 runs) | |
| Dell Latitude 7330 Rugged Extreme (AV Pro V60) | |
| Dell Latitude 7230 Rugged Extreme (AV Pro V60) | |
| Panasonic Toughbook 40 (AV Pro V60) | |
| Acer Enduro Urban N3 EUN314 (AV Pro V60) | |
| Durabook S14I (Angelbird 128GB AV Pro UHS-II) | |
| maximum AS SSD Seq Read Test (1GB) | |
| Dell Latitude 7330 Rugged Extreme (AV Pro V60) | |
| Dell Latitude 7230 Rugged Extreme (AV Pro V60) | |
| Panasonic Toughbook 40 (AV Pro V60) | |
| Durabook S14I (Angelbird 128GB AV Pro UHS-II) | |
| Acer Enduro Urban N3 EUN314 (AV Pro V60) | |
Kommunikation
Intel AX211 fungerar tillförlitligt när den kopplas ihop med vår testrouter Asus AXE11000 med Wi-Fi 6E-aktivering. Modellen kan konfigureras utan Wi-Fi alls, men vi rekommenderar att du väljer noga eftersom en slutanvändarinstallation på Latitude 7230 Rugged Extreme är mycket mer komplicerad än en typisk ultrabook.
| Networking | |
| iperf3 transmit AX12 | |
| Acer Enduro Urban N3 EUN314 | |
| Durabook S14I | |
| Dell Latitude 7330 Rugged Extreme | |
| Getac B360 | |
| iperf3 receive AX12 | |
| Durabook S14I | |
| Acer Enduro Urban N3 EUN314 | |
| Getac B360 | |
| Dell Latitude 7330 Rugged Extreme | |
| iperf3 transmit AXE11000 | |
| Panasonic Toughbook 40 | |
| Dell Latitude 7230 Rugged Extreme | |
| iperf3 receive AXE11000 | |
| Panasonic Toughbook 40 | |
| Dell Latitude 7230 Rugged Extreme | |
| iperf3 transmit AXE11000 6GHz | |
| Dell Latitude 7230 Rugged Extreme | |
| iperf3 receive AXE11000 6GHz | |
| Dell Latitude 7230 Rugged Extreme | |
Webbkamera
Den bakre webbkameran på 11 MP och den främre webbkameran på 5 MP är båda skarpare än vad som finns på en bärbar dator med klämskal. Varje webbkamera har ett eget fysiskt reglage för sekretess medan den bakre webbkameran har en inbyggd blixt.
Windows Hello stöds med den främre webbkameran.


Underhåll
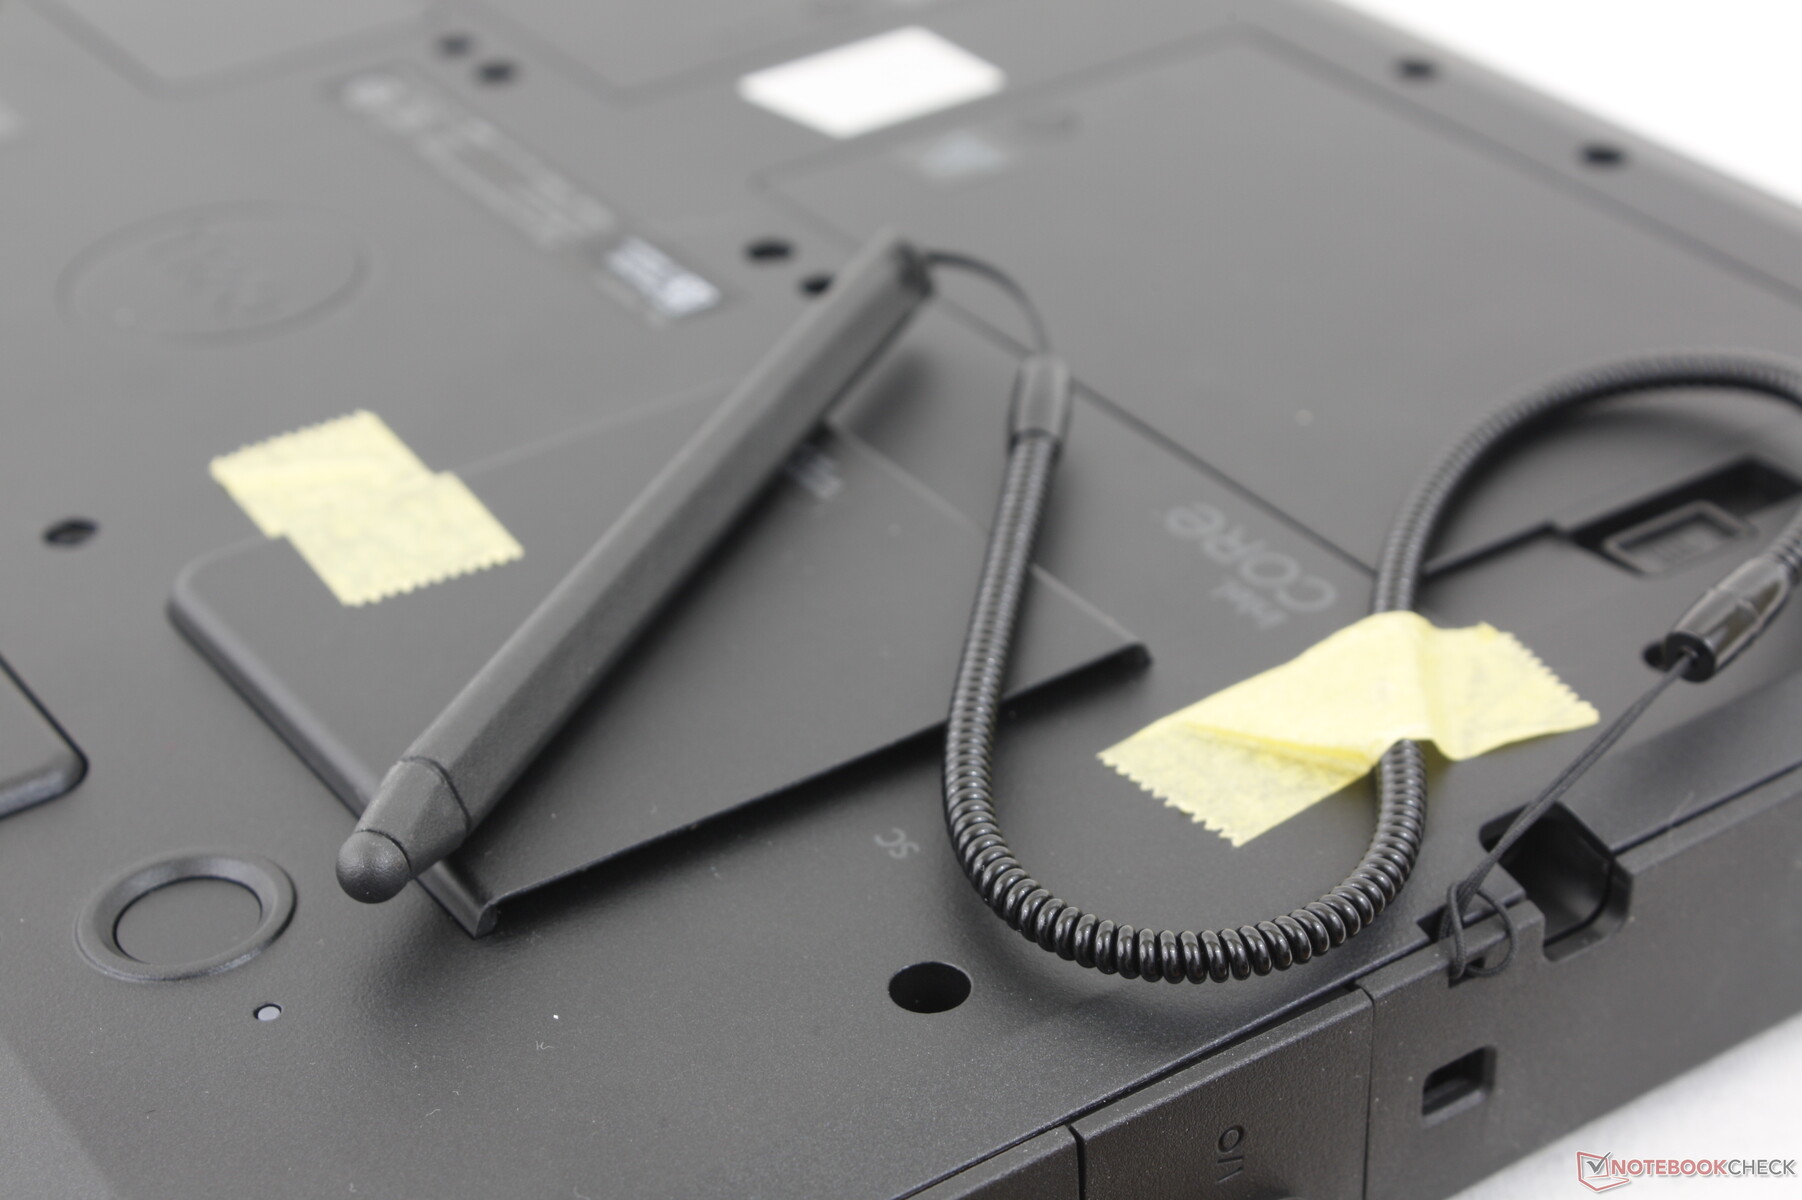
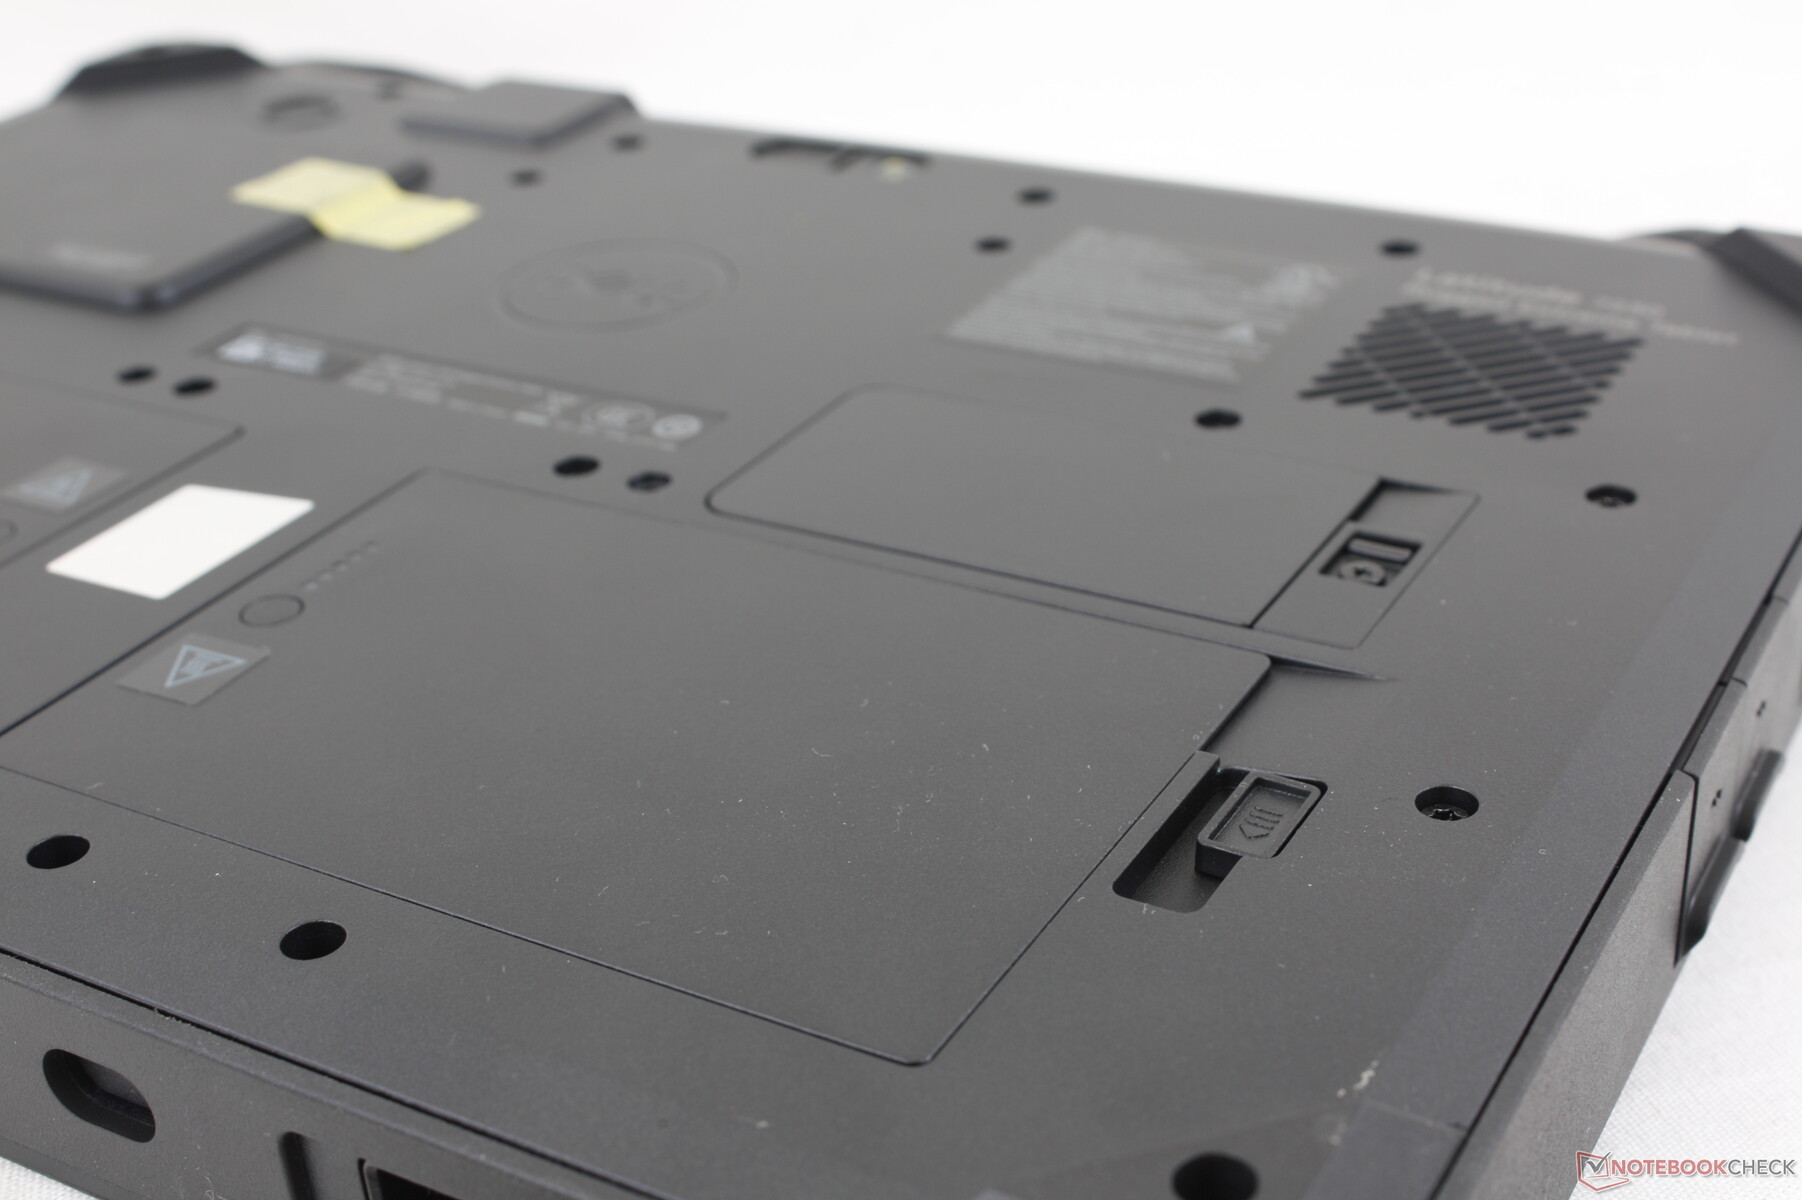
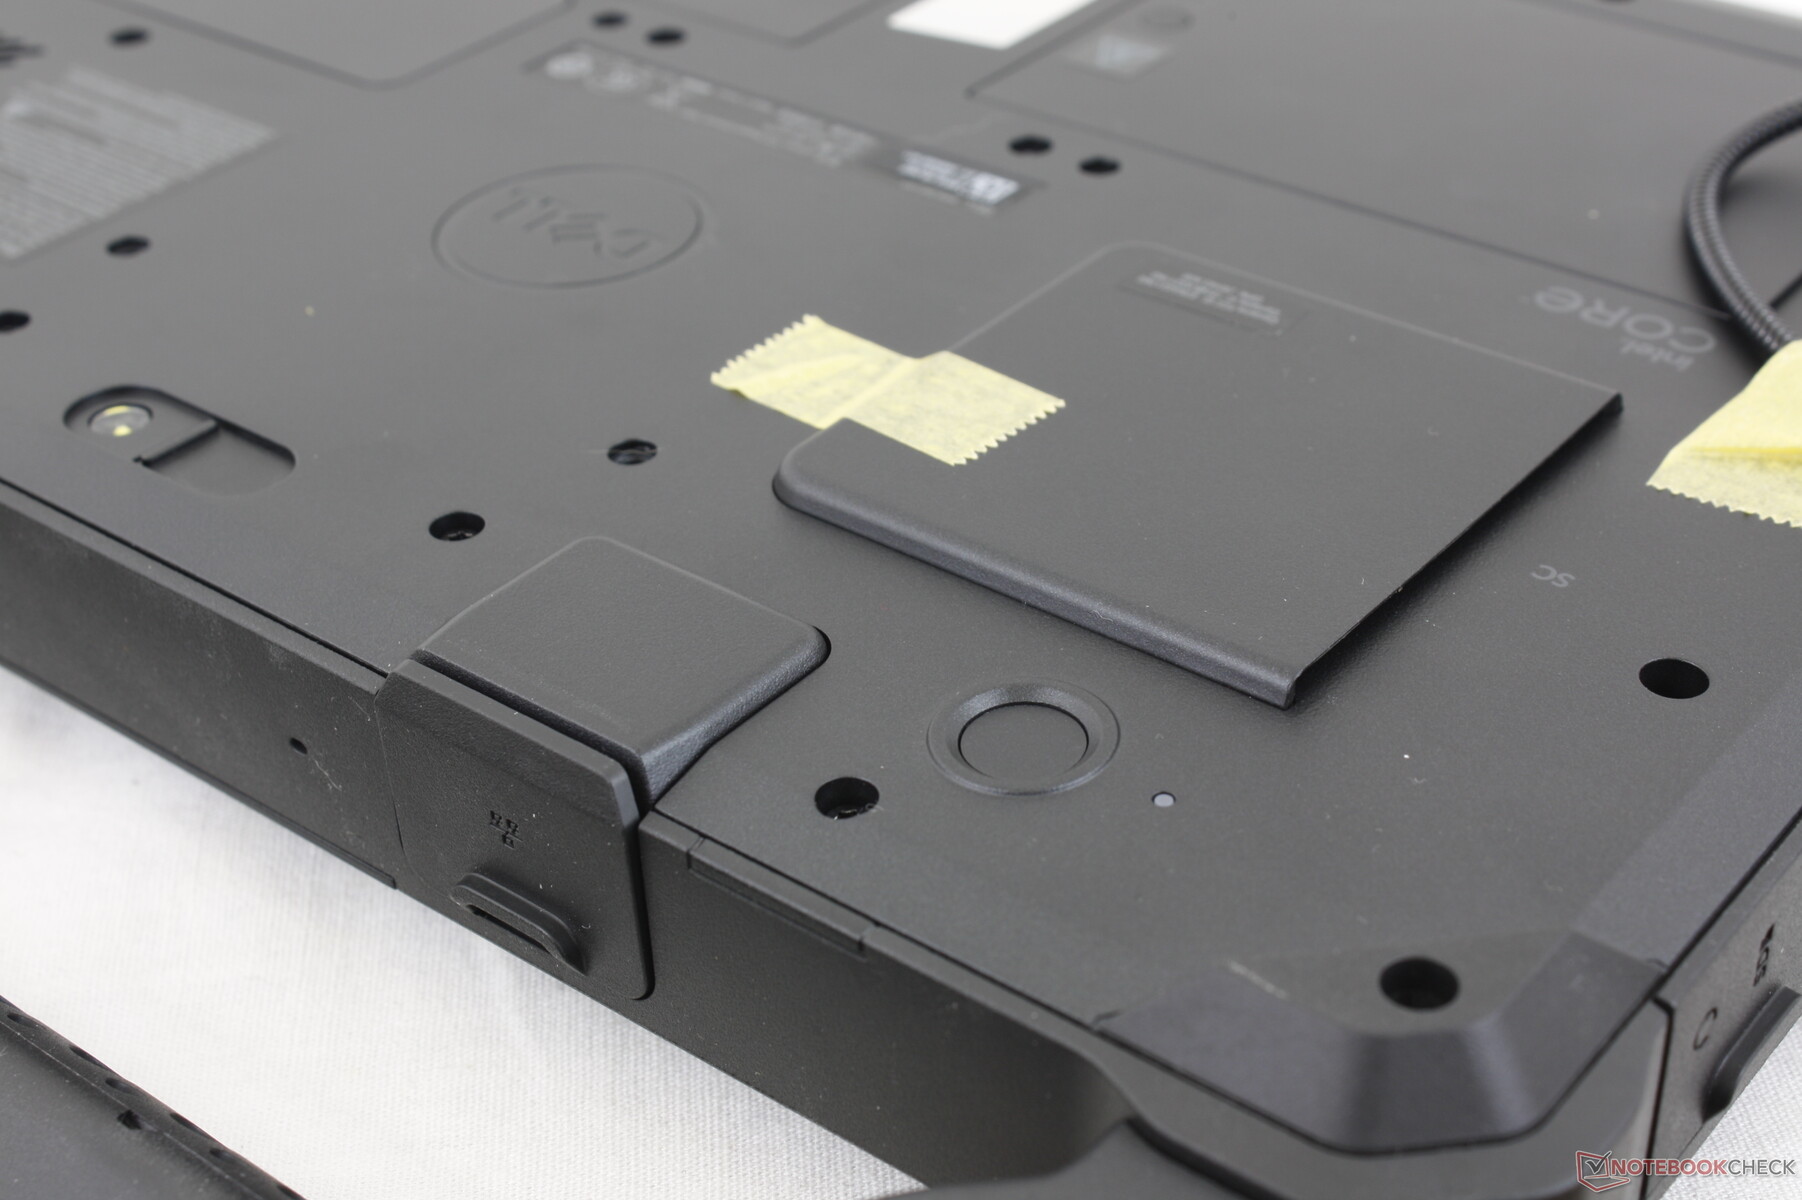
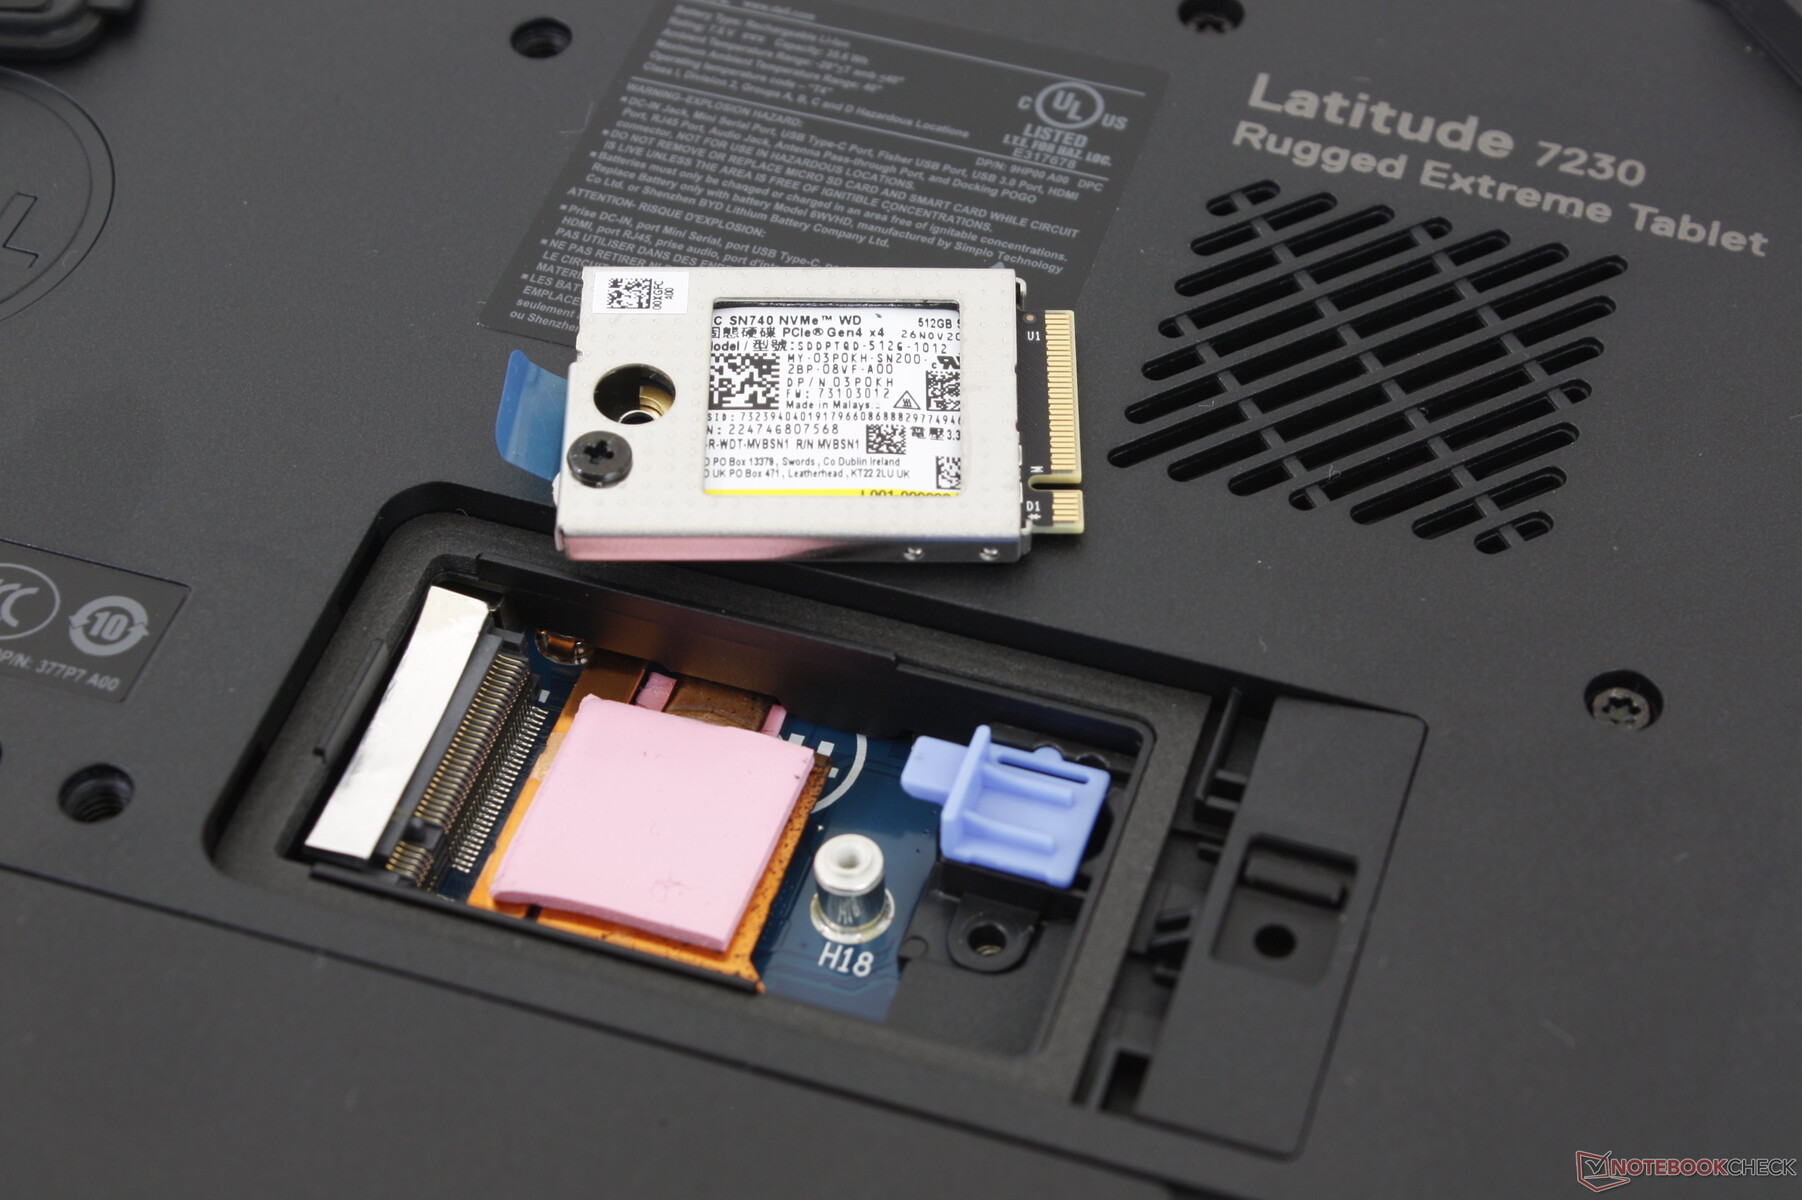
Bakpanelen är fäst med inte mindre än två dussin Torxskruvar. Tack och lov är de två batterierna och det enda M.2 SSD-facket lättare att komma åt. RAM-minne är lödda och kan endast konfigureras vid kassan.
En officiell servicehandbok finns tillgänglig direkt från Dell om ytterligare demontering krävs.
Tillbehör och garanti
Tillbehör som kan fås som tillval är bland annat ett premiumtangentbord, handrem, aktiv penna och många andra. I butikslådan finns en passiv penna och ett styvt bärhandtag redan monterade. En treårig begränsad garanti gäller om den köps i USA.
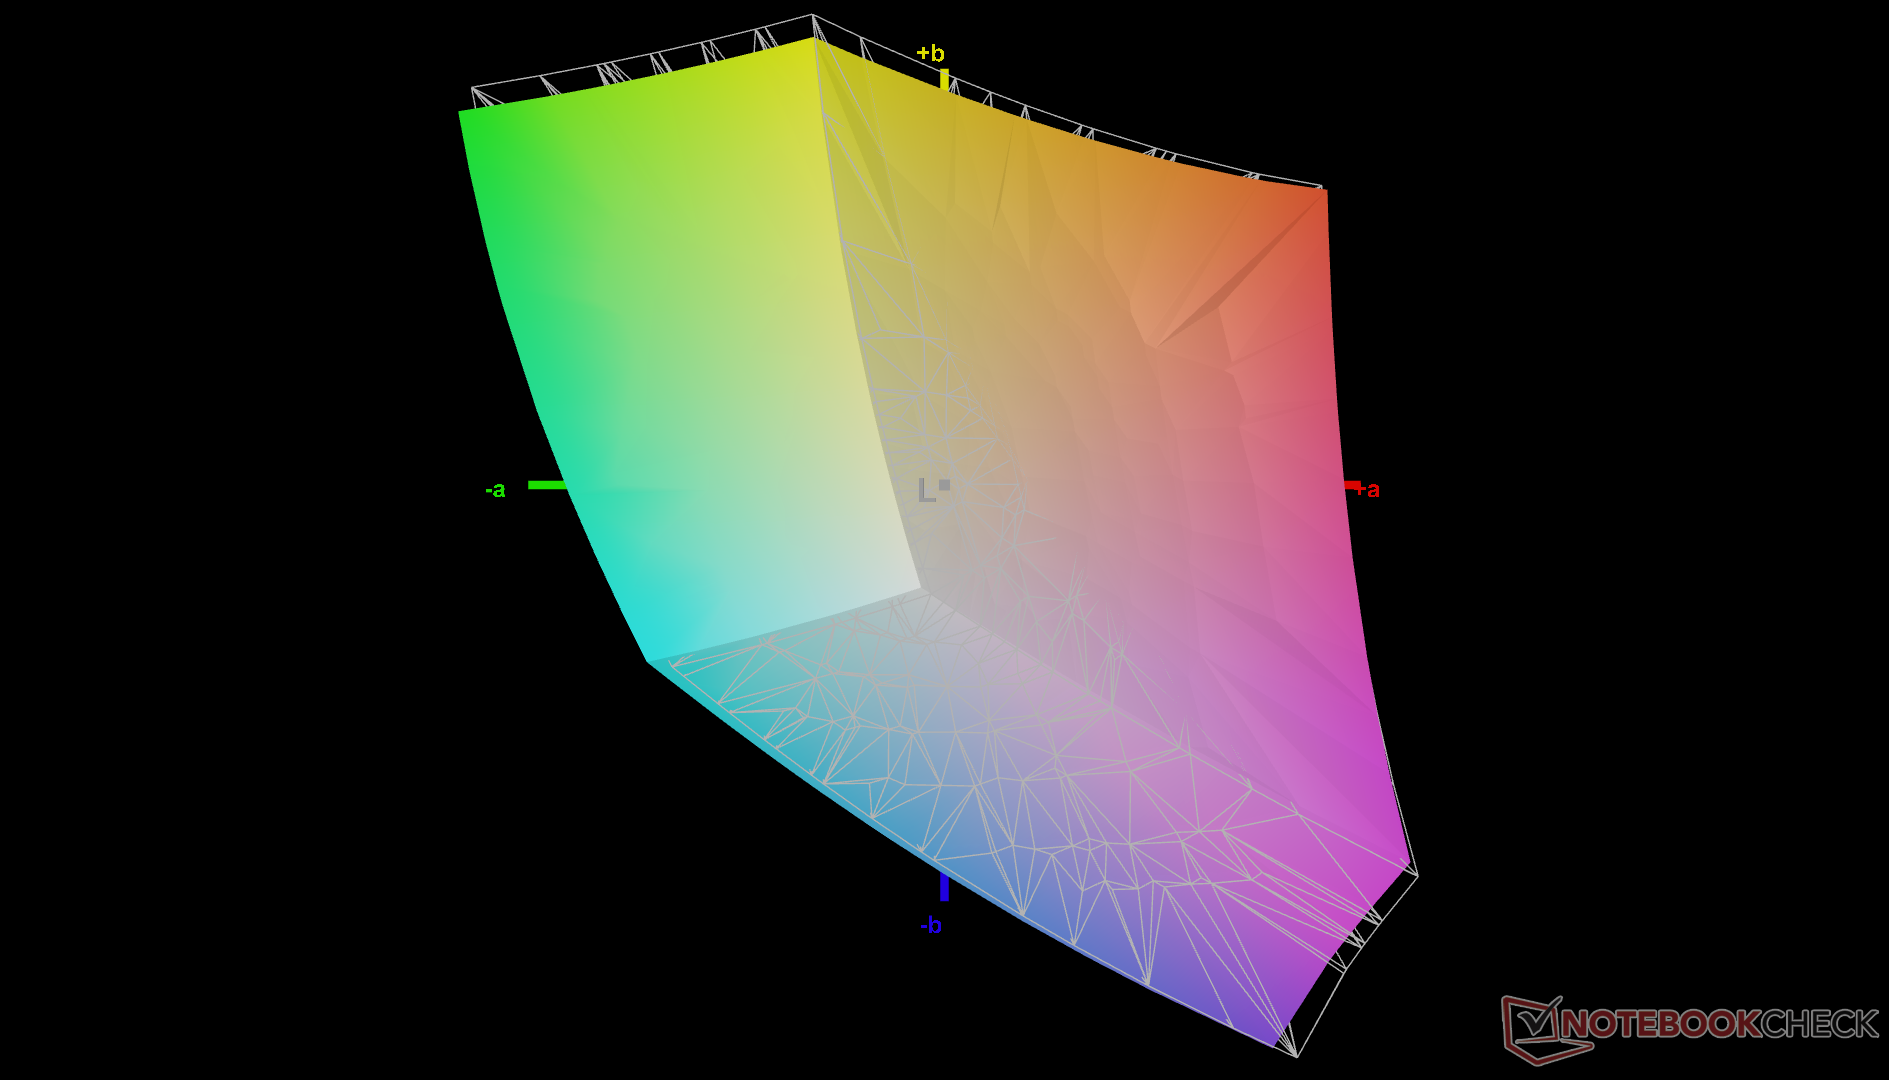
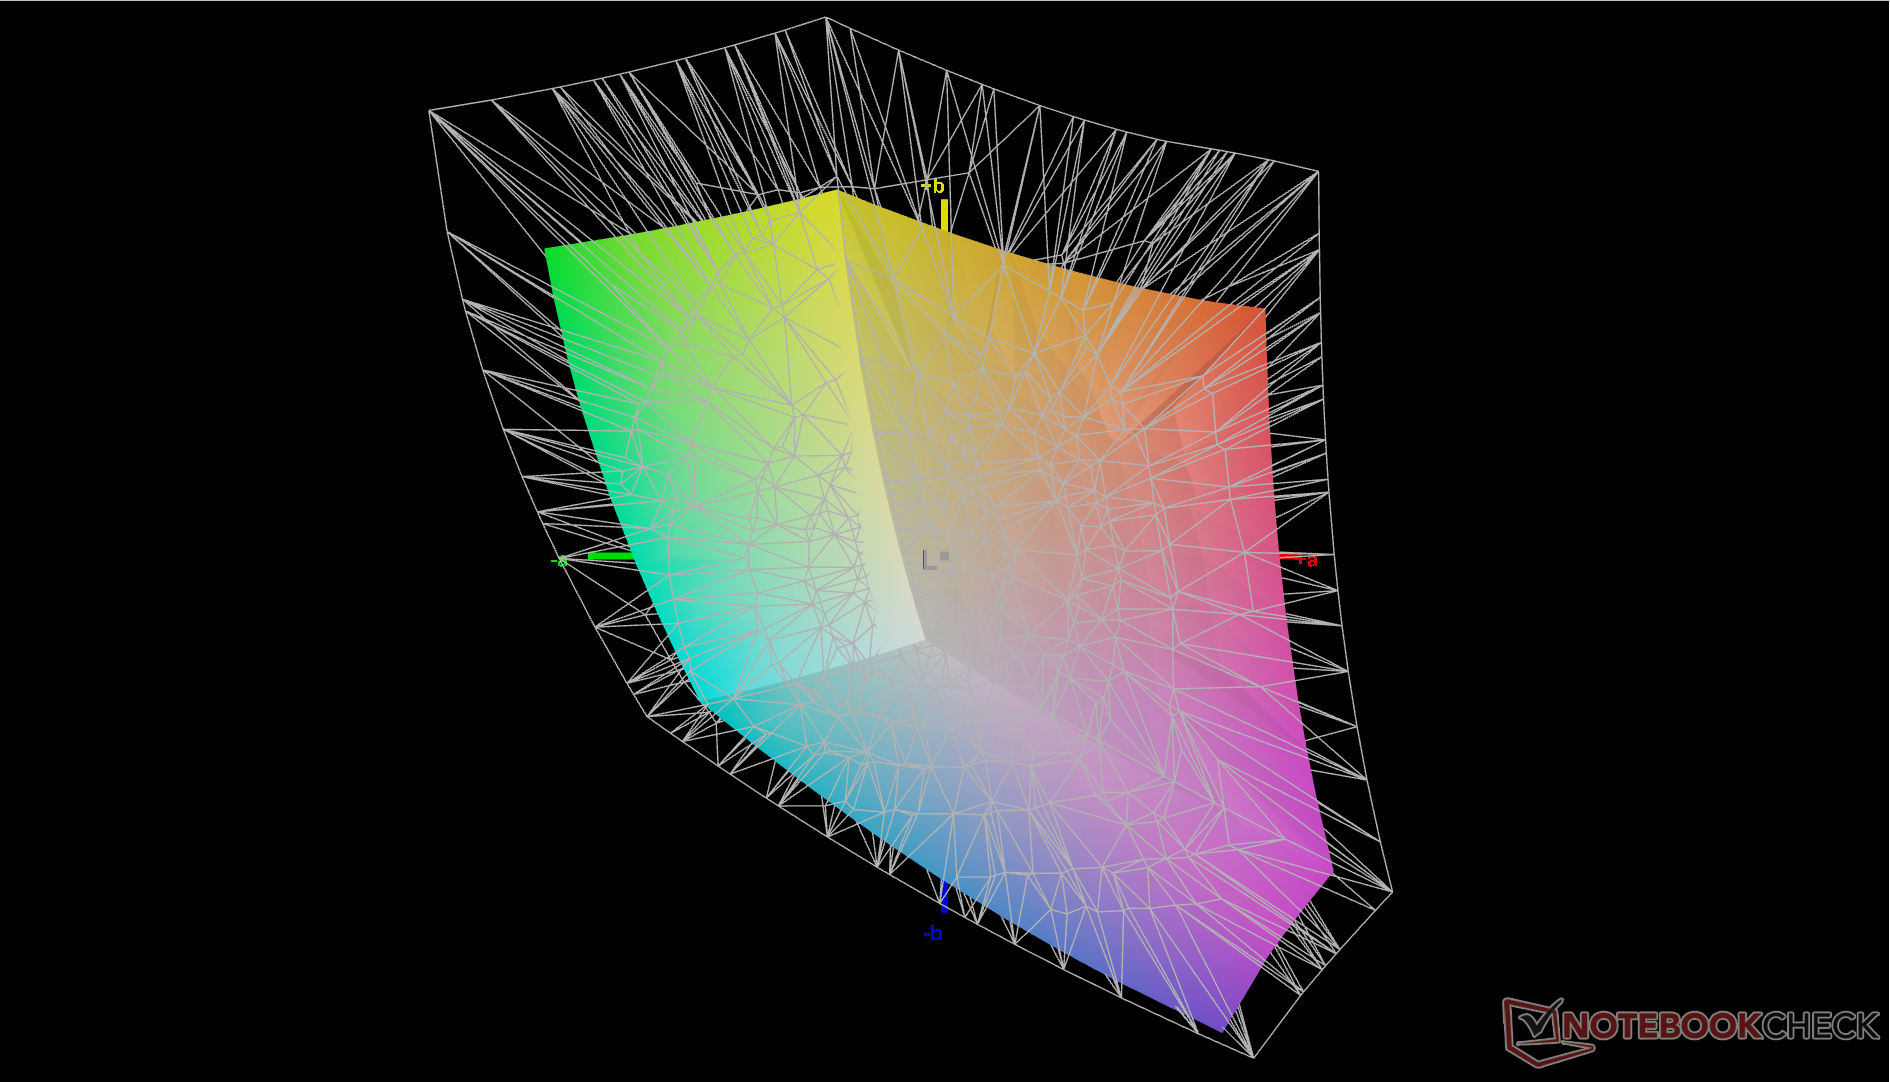
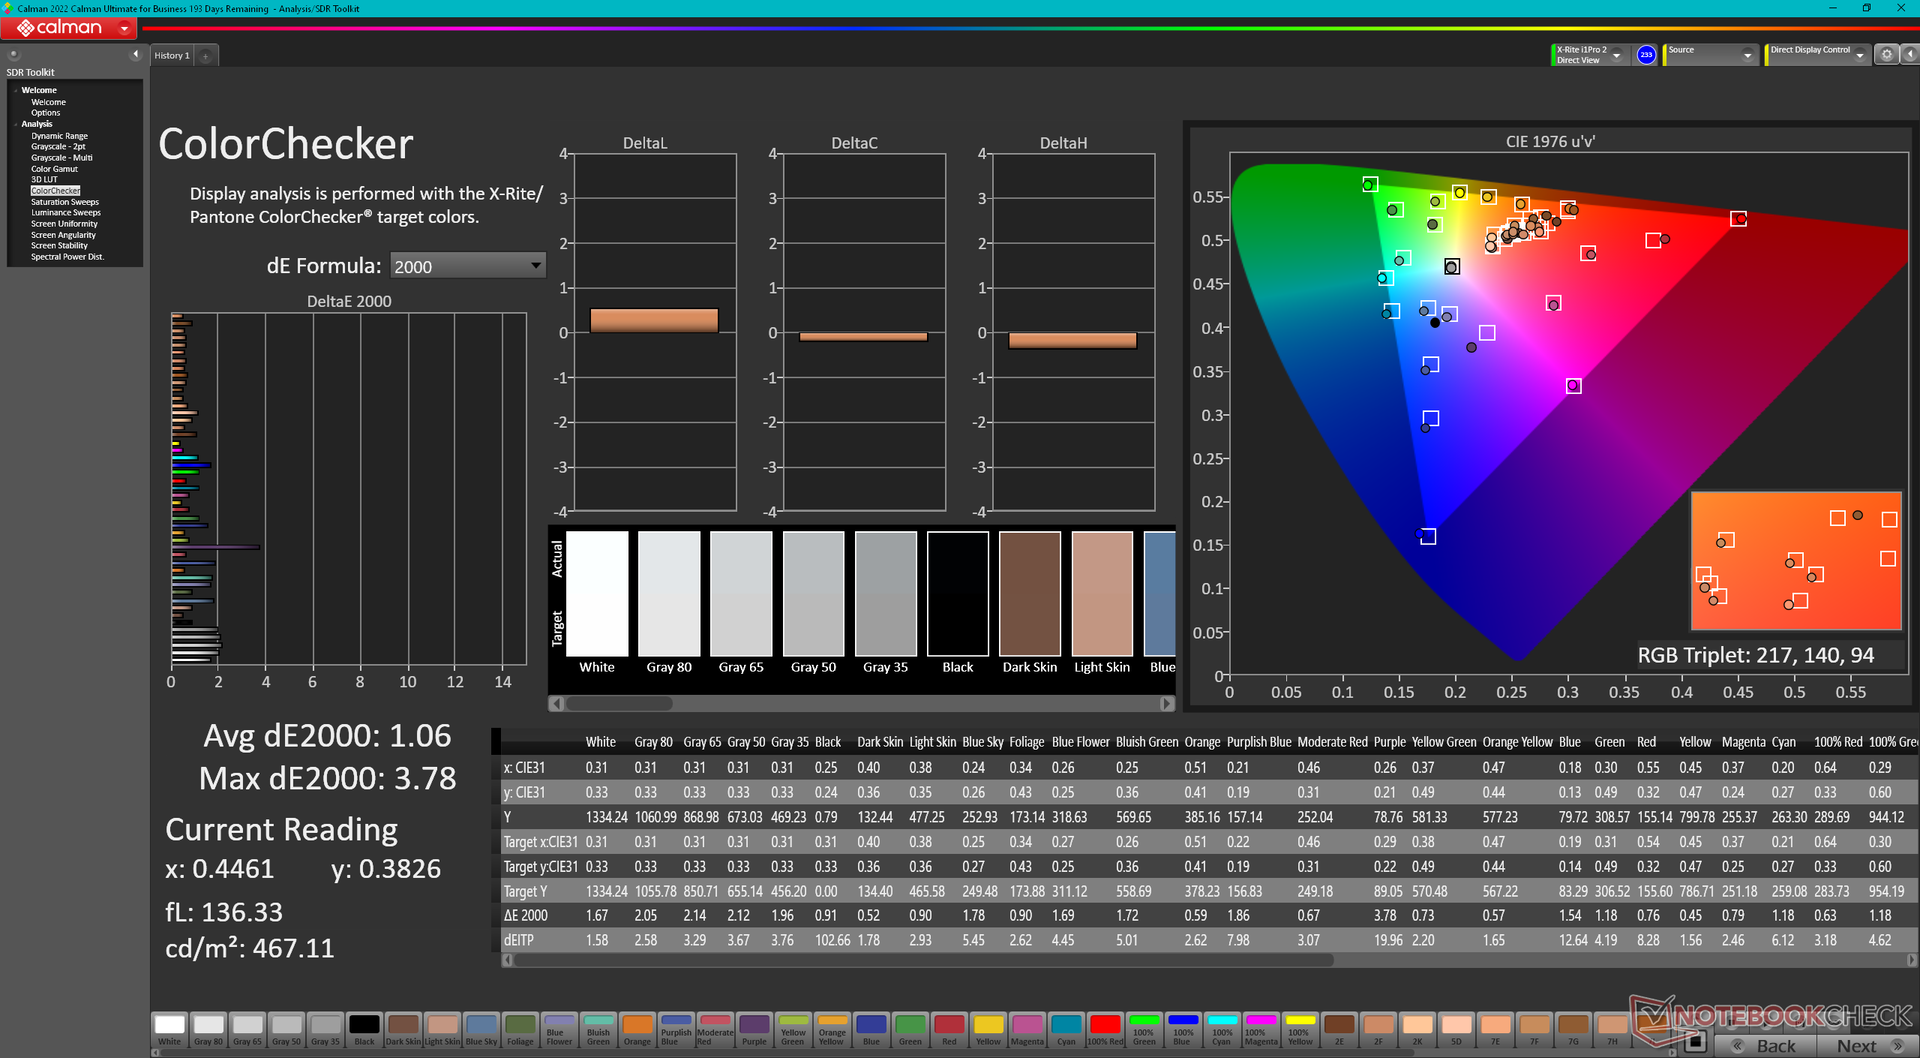
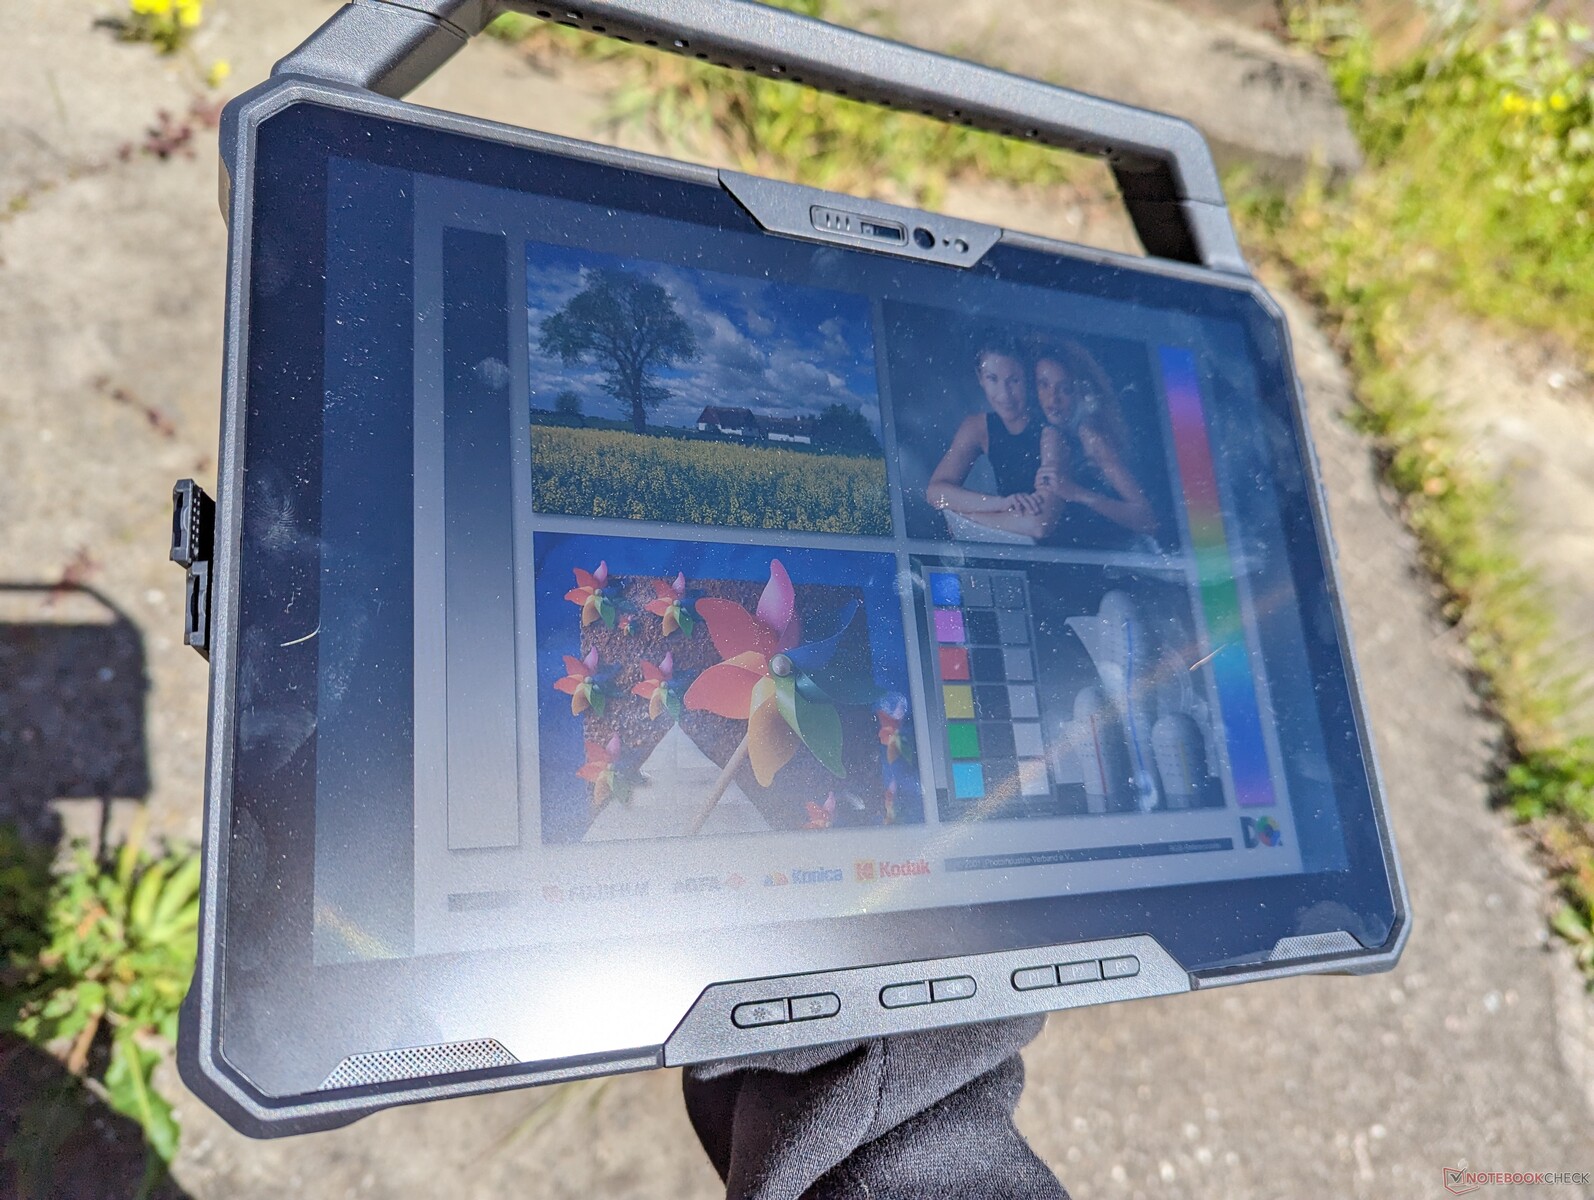
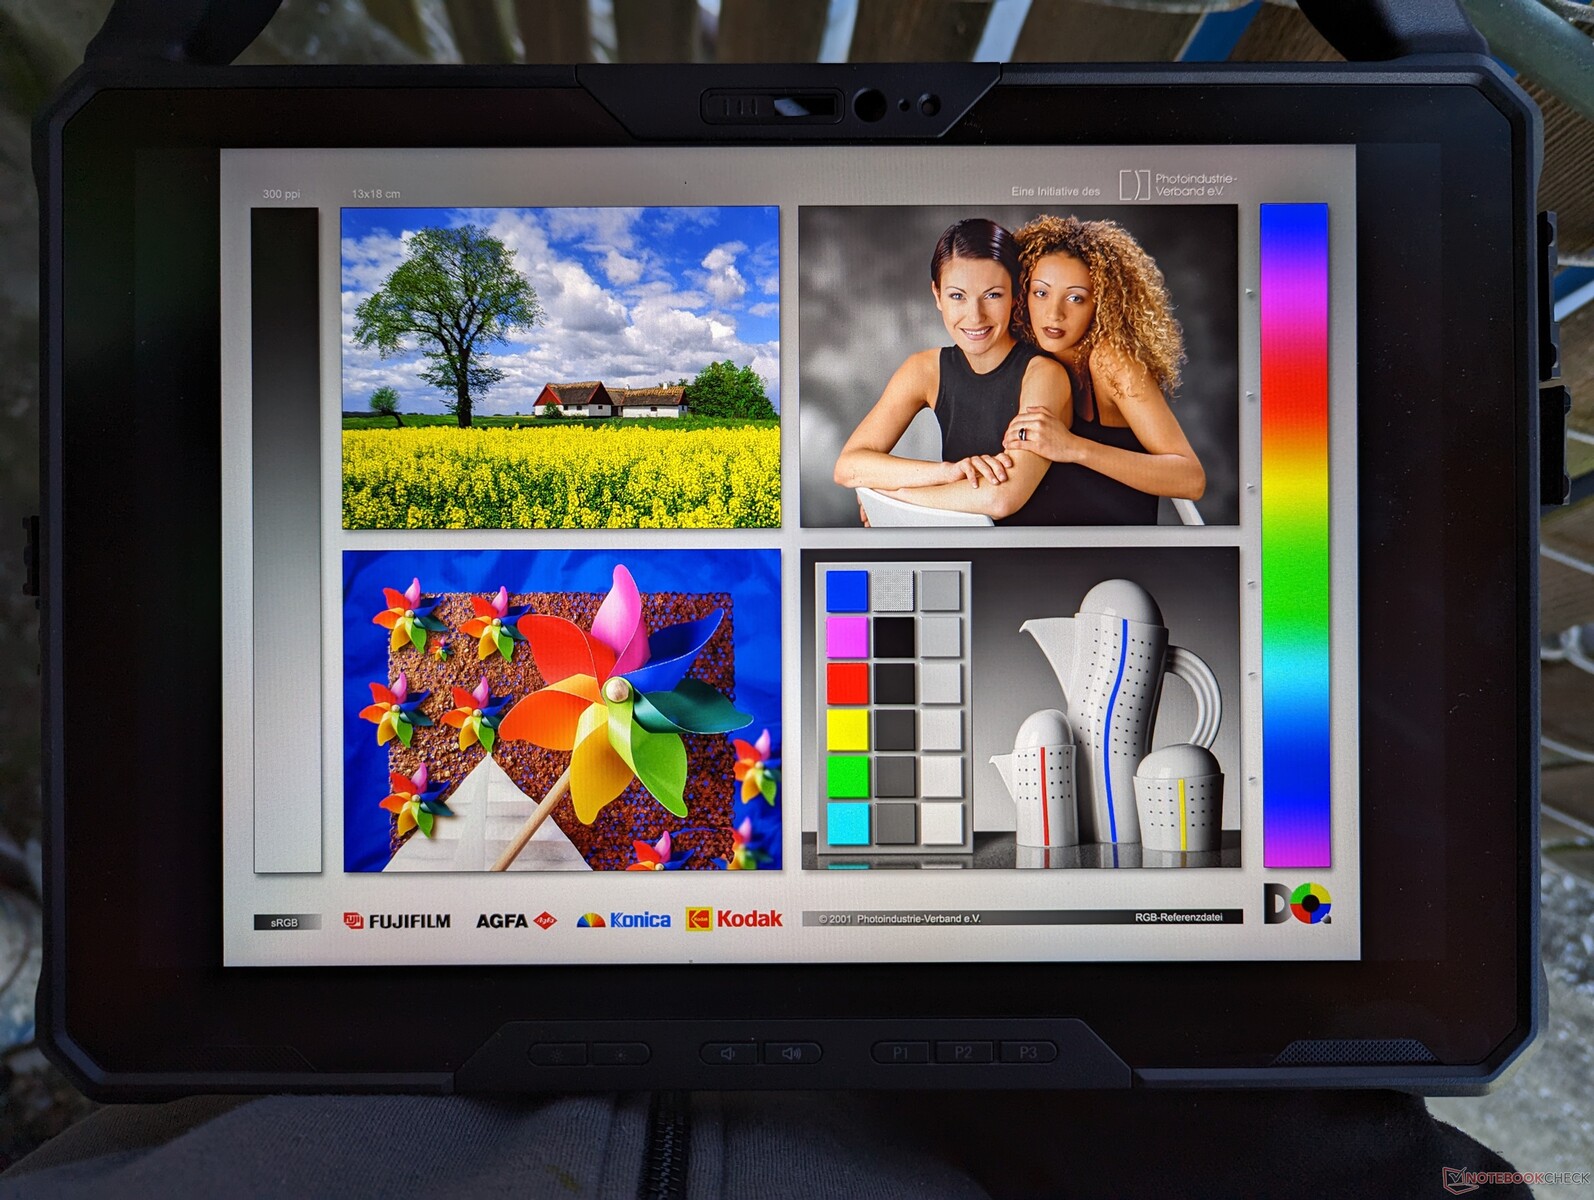
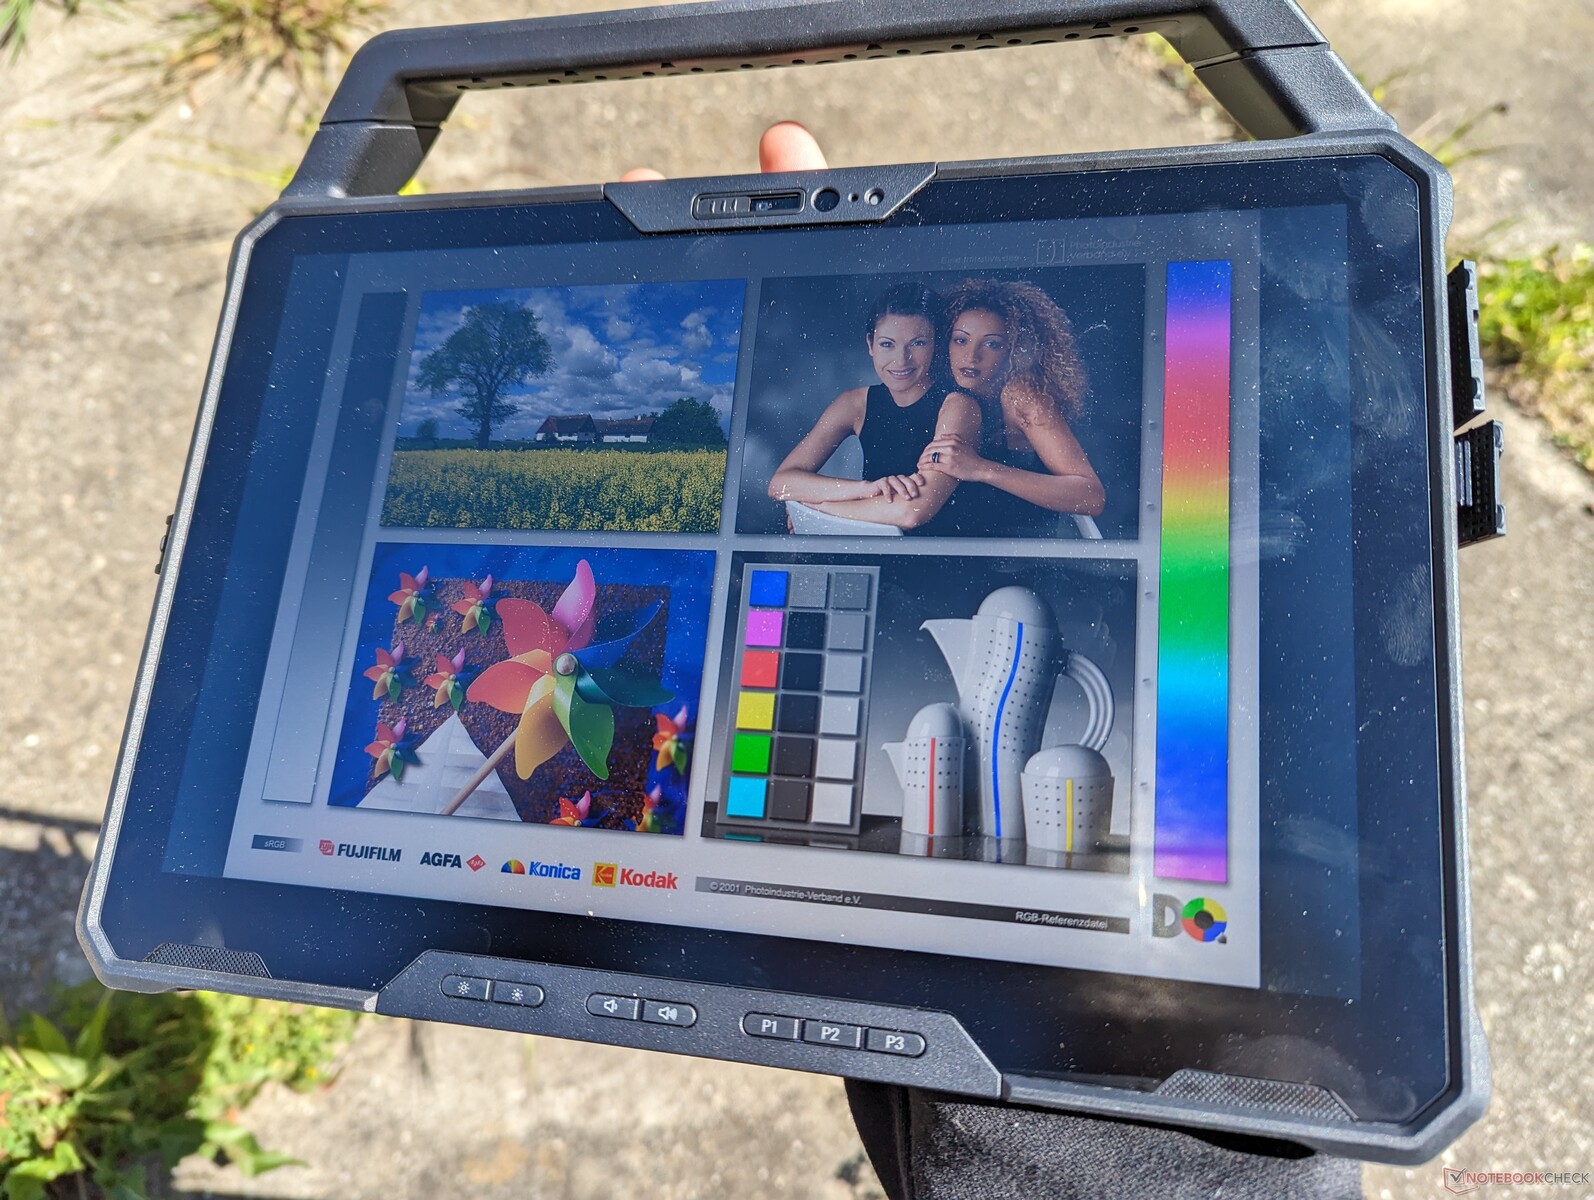
Skärm - 1200 Nits och full sRGB-täckning
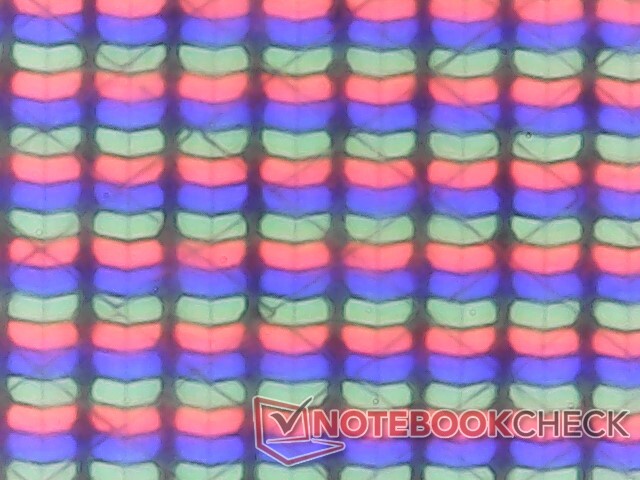
Latitude 7230 Rugged är en av de få enheterna i sin kategori och storlek som erbjuder >95 procent sRGB för mer exakta och levande färger. Svarstiderna för svart-vitt och grått-grått är också rimligt snabba för mindre märkbar ghosting. Det finns ingen pulsbreddsmodulering för ljusstyrning också vilket innebär att du kan använda surfplattan vid mycket låga ljusstyrkor utan att ögonen blir trötta eller märks av flimmer. Detta är en av de bästa skärmarna vi sett på en stryktålig surfplatta.
Den största nackdelen med skärmen är dess kornighet trots de utmärkta färgerna och den ljusa bakgrundsbelysningen. Jämfört med de skarpare skärmarna på surfplattor eller bärbara datorer för konsumenter ligger pekskärmen på Latitude 7230 Rugged under tjockare lager av glas och skydd, vilket i slutändan påverkar bildkvaliteten. För målgruppen är dock superkrispiga bilder vanligtvis inte en prioritet.
| |||||||||||||||||||||||||
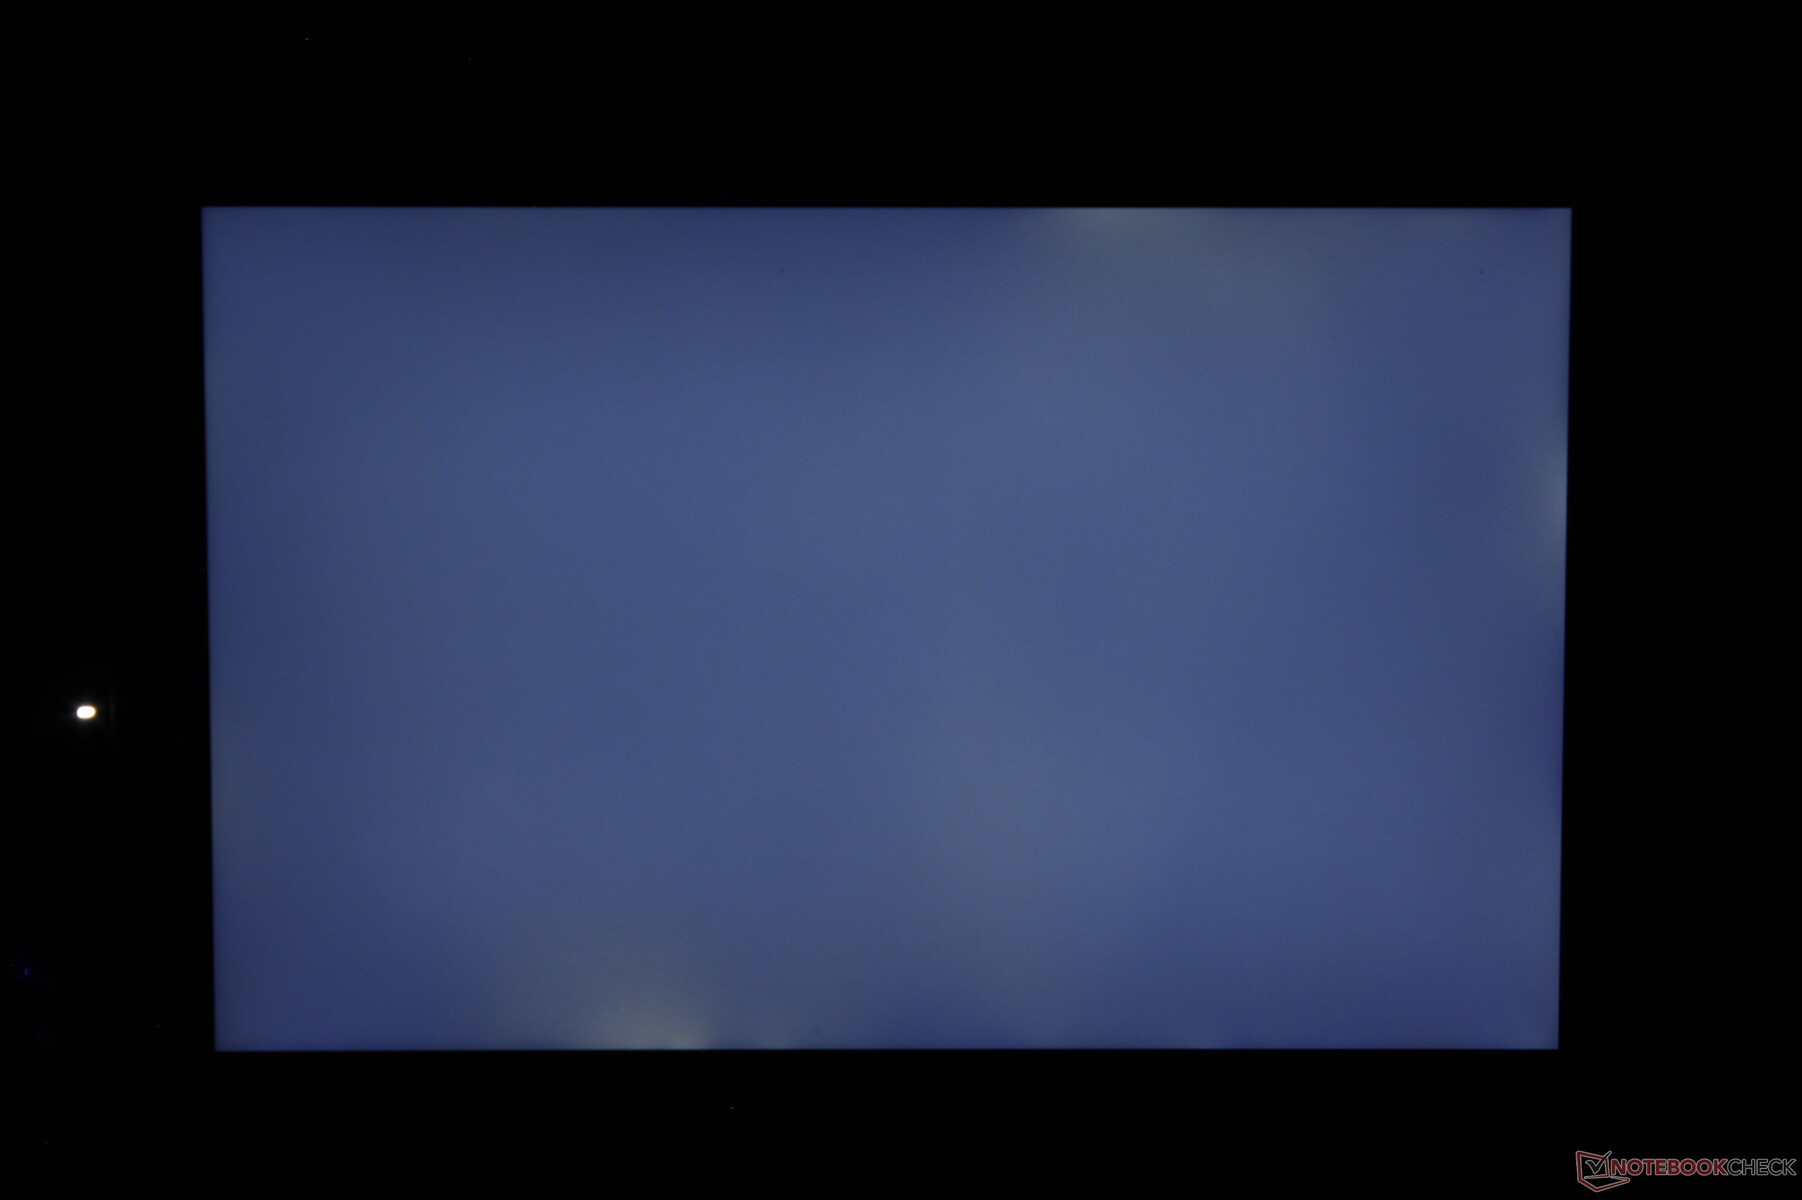
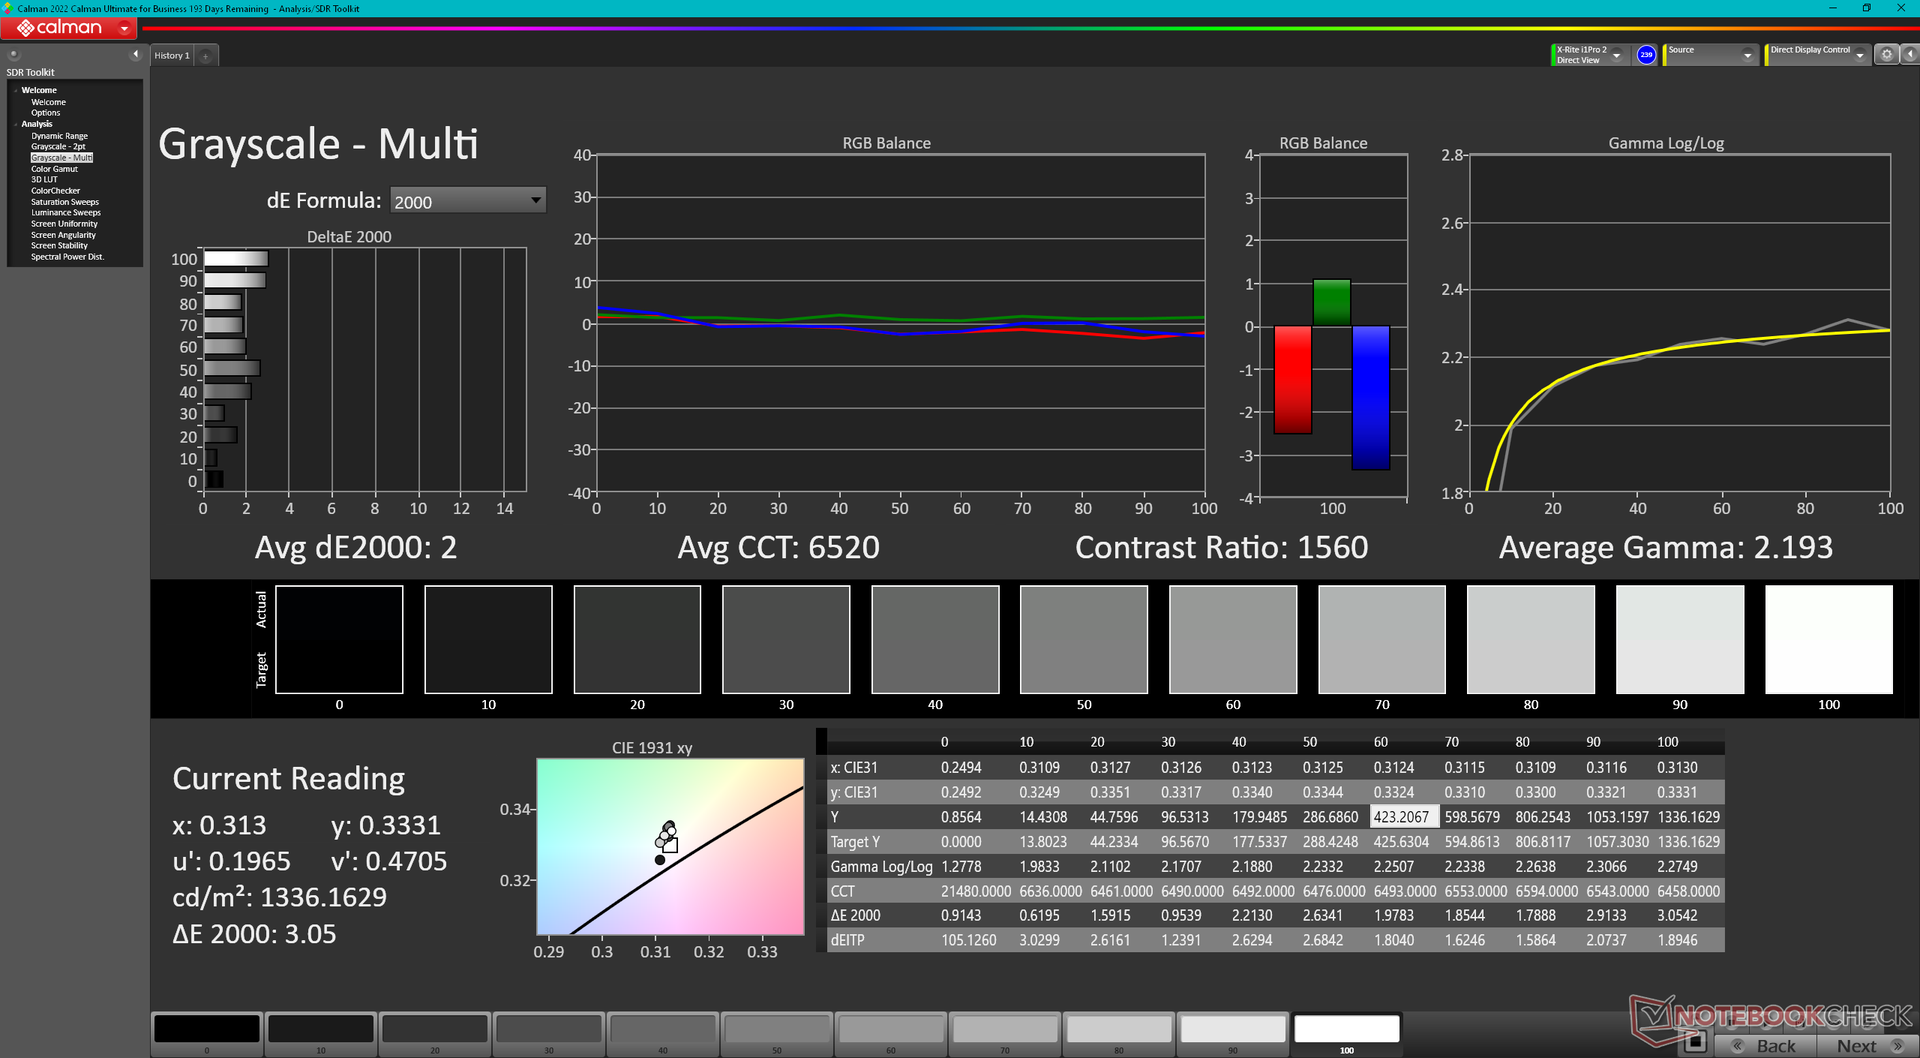
Distribution av ljusstyrkan: 82 %
Mitt på batteriet: 1326.7 cd/m²
Kontrast: 1561:1 (Svärta: 0.85 cd/m²)
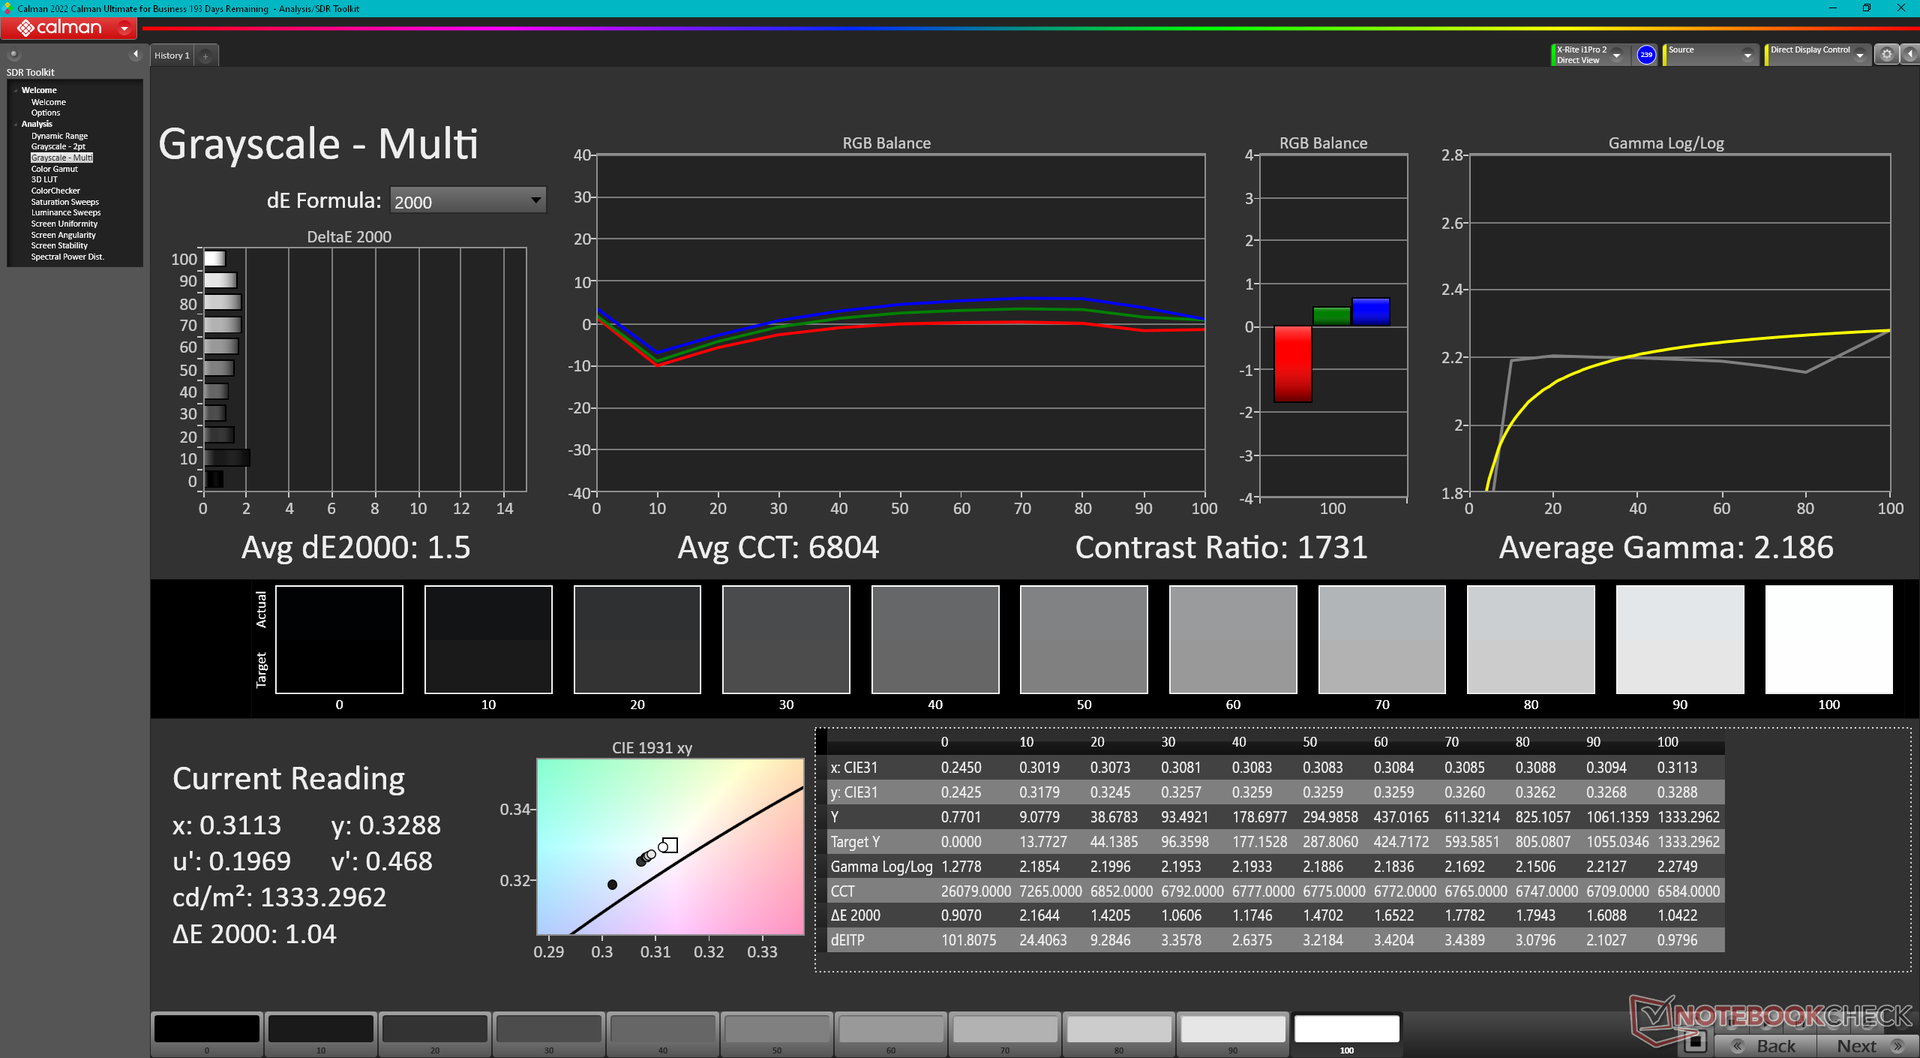
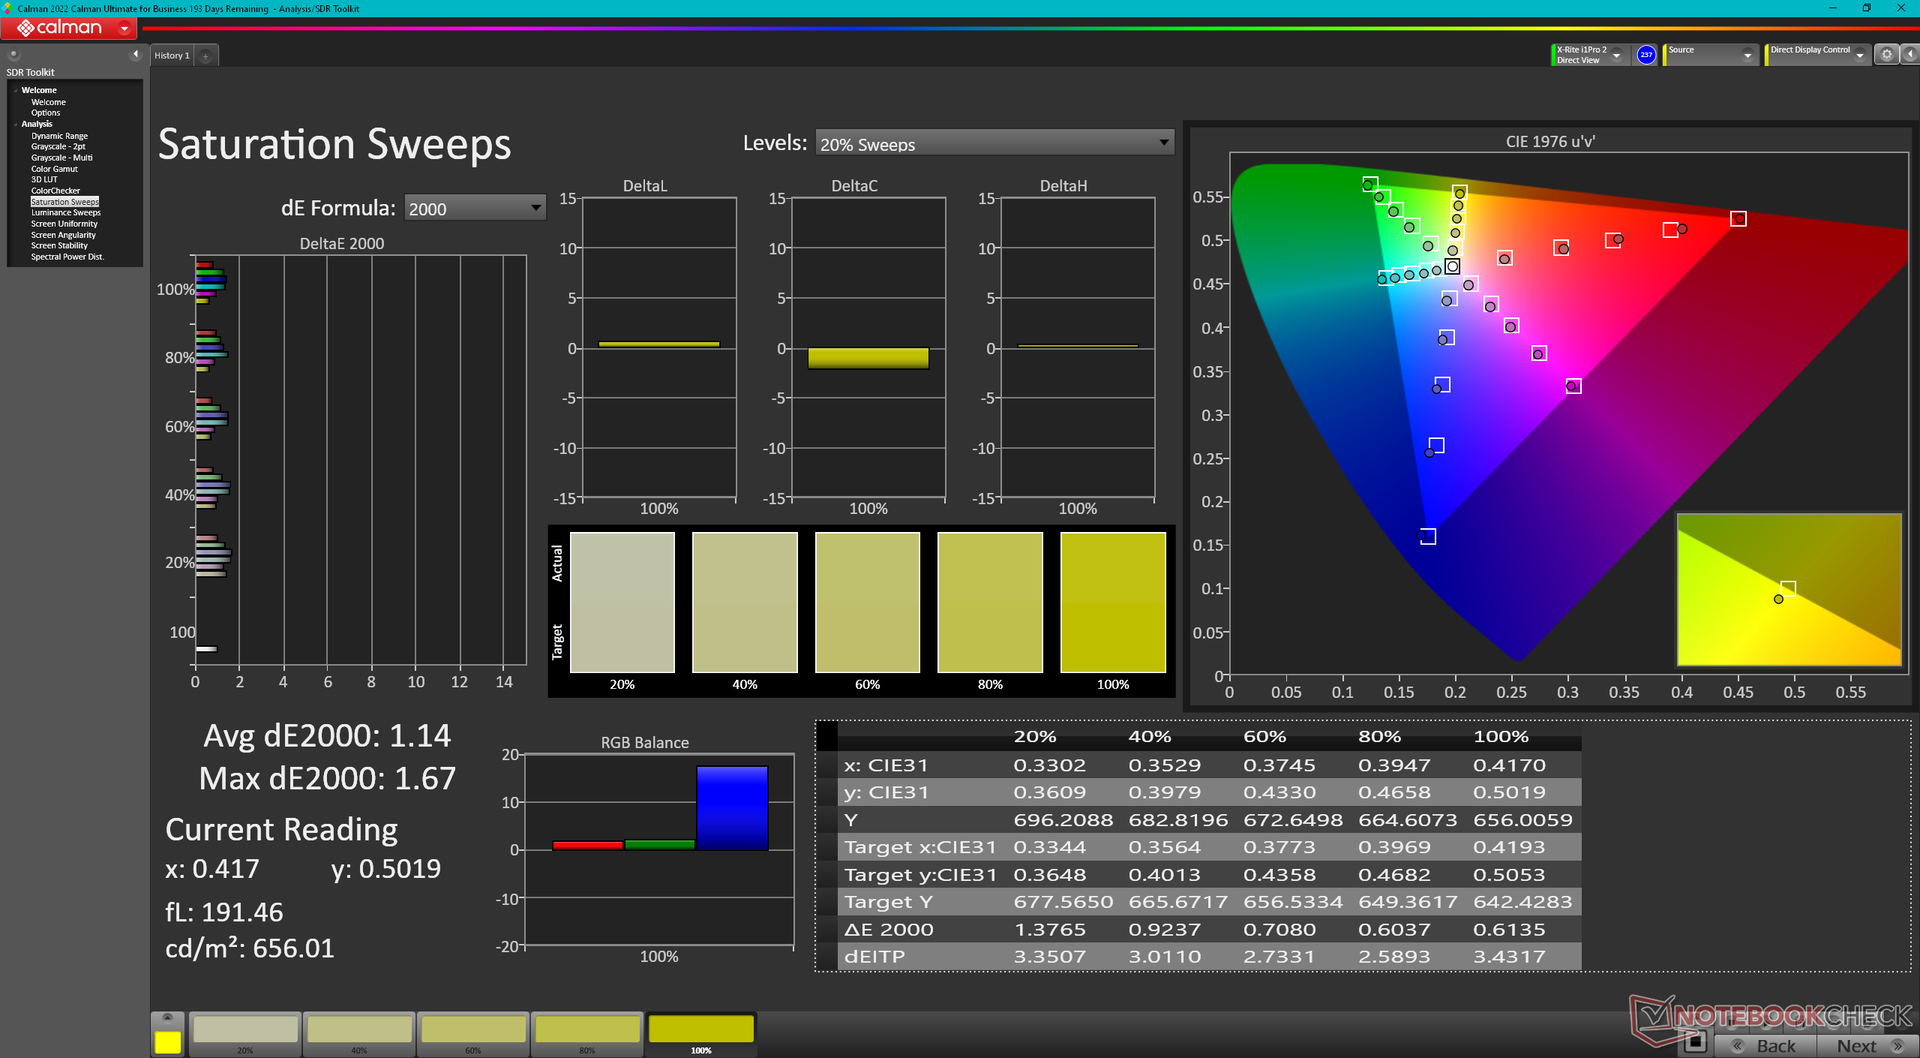
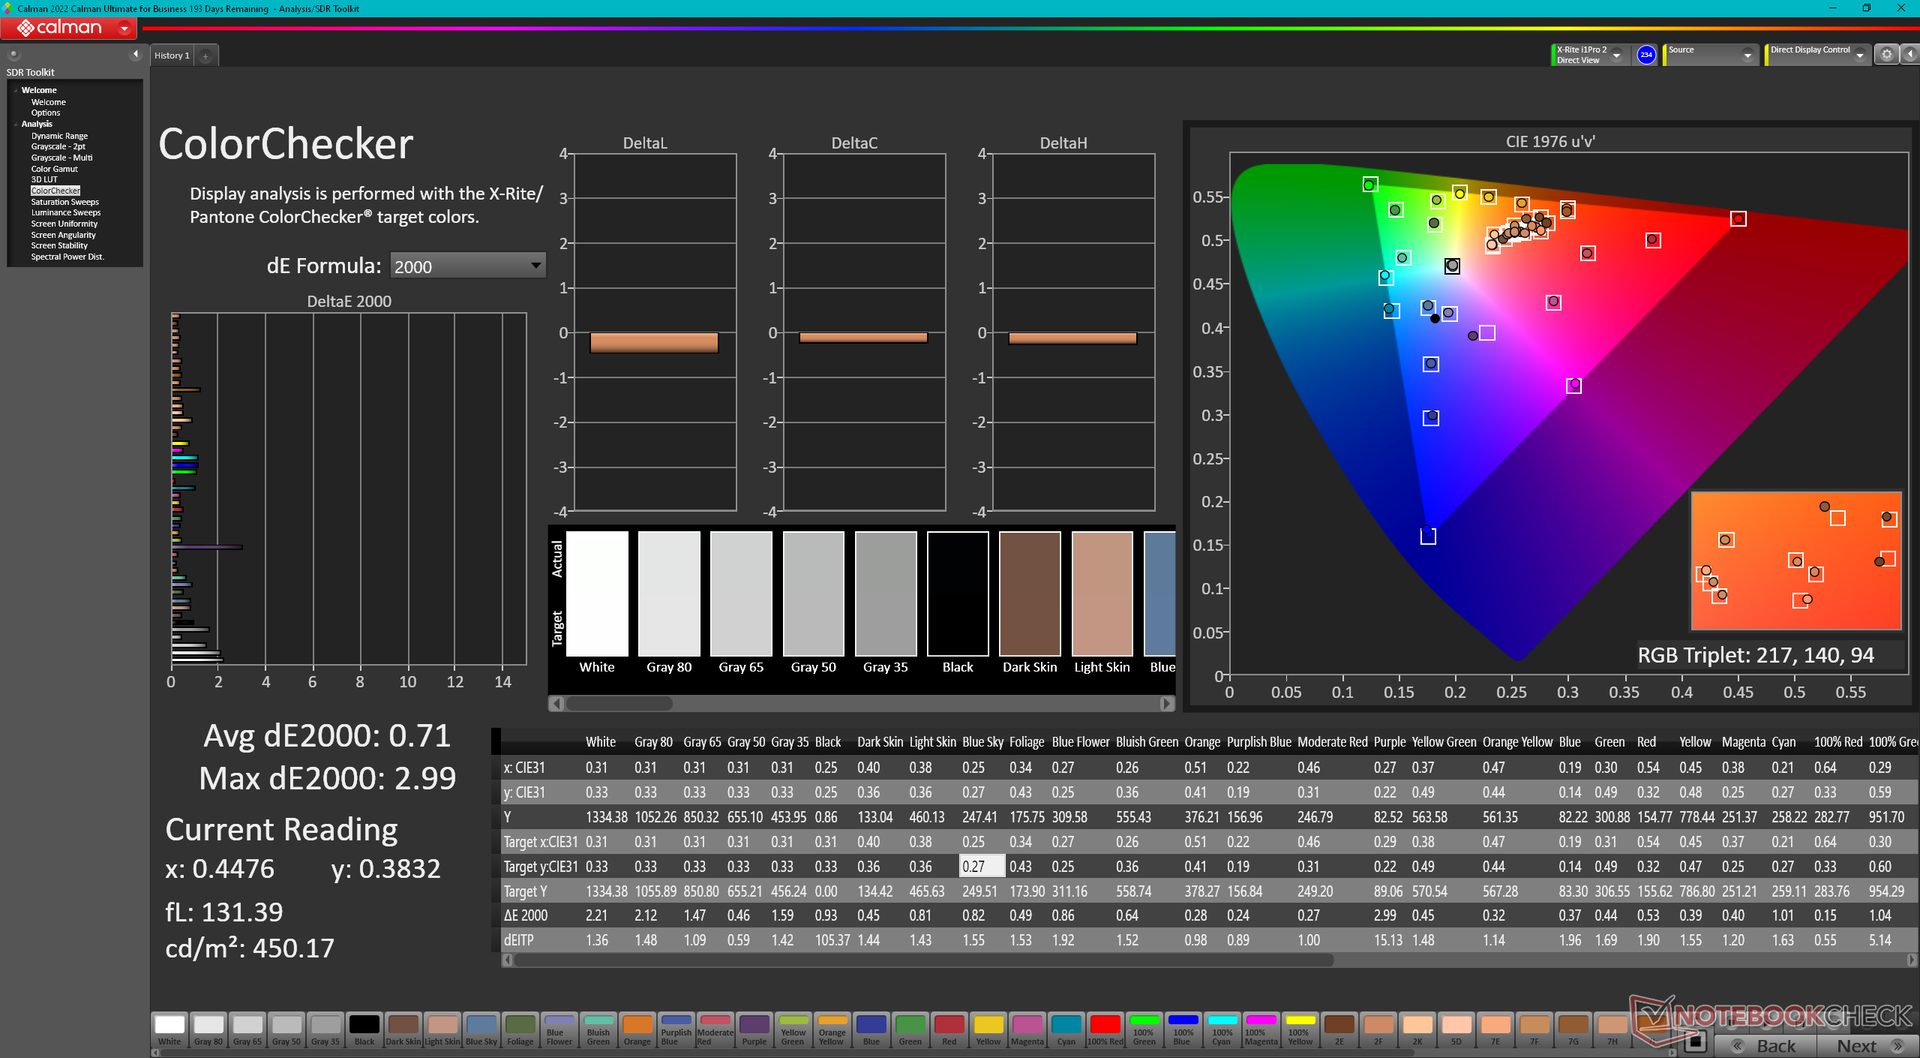
ΔE ColorChecker Calman: 1.06 | ∀{0.5-29.43 Ø4.71}
calibrated: 0.71
ΔE Greyscale Calman: 1.5 | ∀{0.09-98 Ø4.96}
68.4% AdobeRGB 1998 (Argyll 3D)
96.1% sRGB (Argyll 3D)
66.2% Display P3 (Argyll 3D)
Gamma: 2.19
CCT: 6804 K
| Dell Latitude 7230 Rugged Extreme Sharp LQ120N1, IPS, 1920x1200, 12" | Dell Latitude 7330 Rugged Extreme Sharp LQ133M1, IPS, 1920x1080, 13.3" | Panasonic Toughbook 40 InfoVision M140NWF5 R3, IPS, 1920x1080, 14" | Getac B360 AU Optronics AUO572D, IPS, 1920x1080, 13.3" | Acer Enduro Urban N3 EUN314 XR140EA6T, IPS, 1920x1080, 14" | Durabook S14I KD140N0730A01, TN, 1920x1080, 14" | |
|---|---|---|---|---|---|---|
| Display | 1% | -45% | -24% | -4% | -33% | |
| Display P3 Coverage (%) | 66.2 | 67.1 1% | 35.8 -46% | 51.3 -23% | 63.5 -4% | 43.55 -34% |
| sRGB Coverage (%) | 96.1 | 98.2 2% | 53.8 -44% | 72 -25% | 91.9 -4% | 65.4 -32% |
| AdobeRGB 1998 Coverage (%) | 68.4 | 69 1% | 37 -46% | 52.2 -24% | 65.5 -4% | 45 -34% |
| Response Times | -141% | -60% | -58% | -89% | 16% | |
| Response Time Grey 50% / Grey 80% * (ms) | 28.4 ? | 74.4 ? -162% | 50.4 ? -77% | 33 ? -16% | 56 ? -97% | 30.4 ? -7% |
| Response Time Black / White * (ms) | 19.4 ? | 42.4 ? -119% | 27.6 ? -42% | 38.8 ? -100% | 35.2 ? -81% | 11.8 ? 39% |
| PWM Frequency (Hz) | 694.4 ? | 870 ? | 1000 ? | 304.9 ? | ||
| Screen | -16% | -118% | -216% | -154% | -348% | |
| Brightness middle (cd/m²) | 1326.7 | 1414.1 7% | 1284.3 -3% | 1505.6 13% | 487.8 -63% | 1180.7 -11% |
| Brightness (cd/m²) | 1193 | 1282 7% | 1289 8% | 1383 16% | 464 -61% | 1102 -8% |
| Brightness Distribution (%) | 82 | 84 2% | 82 0% | 86 5% | 89 9% | 89 9% |
| Black Level * (cd/m²) | 0.85 | 0.83 2% | 0.89 -5% | 0.95 -12% | 0.48 44% | 1.91 -125% |
| Contrast (:1) | 1561 | 1704 9% | 1443 -8% | 1585 2% | 1016 -35% | 618 -60% |
| Colorchecker dE 2000 * | 1.06 | 1.99 -88% | 4.67 -341% | 9.81 -825% | 6.51 -514% | 13.45 -1169% |
| Colorchecker dE 2000 max. * | 3.78 | 3.75 1% | 19.85 -425% | 16.64 -340% | 11.36 -201% | 22.52 -496% |
| Colorchecker dE 2000 calibrated * | 0.71 | 0.72 -1% | 2.21 -211% | 1.44 -103% | 1.77 -149% | 3.19 -349% |
| Greyscale dE 2000 * | 1.5 | 2.8 -87% | 2.7 -80% | 12 -700% | 7.8 -420% | 15.4 -927% |
| Gamma | 2.19 100% | 2.06 107% | 1.97 112% | 1.98 111% | 2.28 96% | 1.97 112% |
| CCT | 6804 96% | 6775 96% | 6222 104% | 4838 134% | 8102 80% | 21134 31% |
| Color Space (Percent of AdobeRGB 1998) (%) | 41.6 | |||||
| Color Space (Percent of sRGB) (%) | 65.5 | |||||
| Totalt genomsnitt (program/inställningar) | -52% /
-30% | -74% /
-94% | -99% /
-152% | -82% /
-113% | -122% /
-229% |
* ... mindre är bättre
Skärmen är välkalibrerad direkt från förpackningen med genomsnittliga deltaE-värden för gråskala och färg på bara 1,5 respektive 1,06. Att försöka kalibrera den ytterligare själva med en X-Rite-kolorimeter skulle inte förbättra noggrannheten nämnvärt och en slutanvändarkalibrering är därför inte nödvändig.

Visa svarstider
| ↔ Svarstid svart till vitt | ||
|---|---|---|
| 19.4 ms ... stiga ↗ och falla ↘ kombinerat | ↗ 9.7 ms stiga | 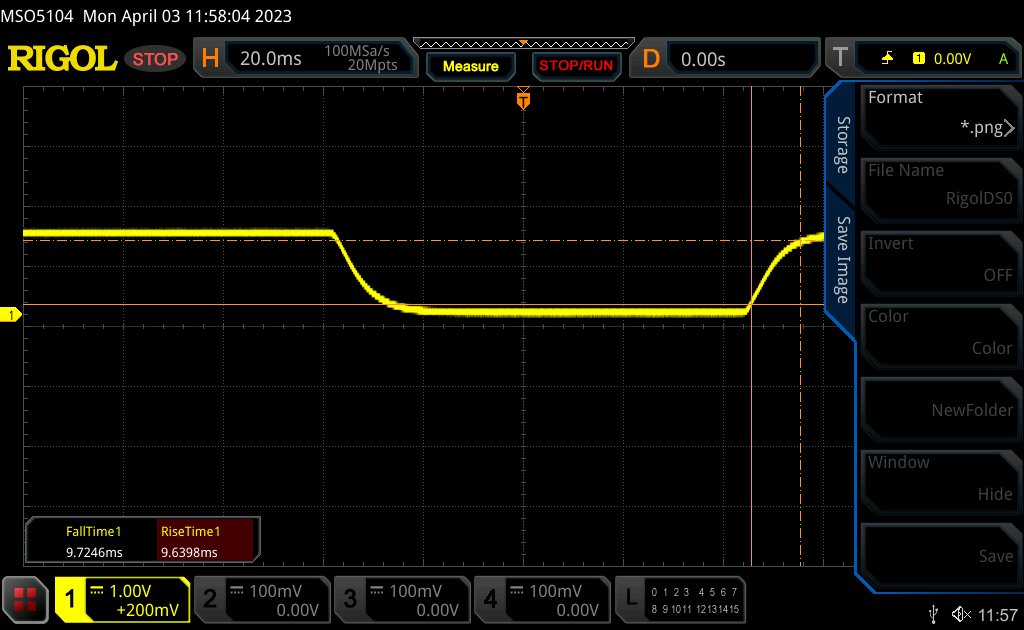 |
| ↘ 9.7 ms hösten | ||
| Skärmen visar bra svarsfrekvens i våra tester, men kan vara för långsam för konkurrenskraftiga spelare. I jämförelse sträcker sig alla testade enheter från 0.1 (minst) till 240 (maximalt) ms. » 43 % av alla enheter är bättre. Det betyder att den uppmätta svarstiden liknar genomsnittet av alla testade enheter (19.8 ms). | ||
| ↔ Svarstid 50 % grått till 80 % grått | ||
| 28.4 ms ... stiga ↗ och falla ↘ kombinerat | ↗ 13.8 ms stiga | 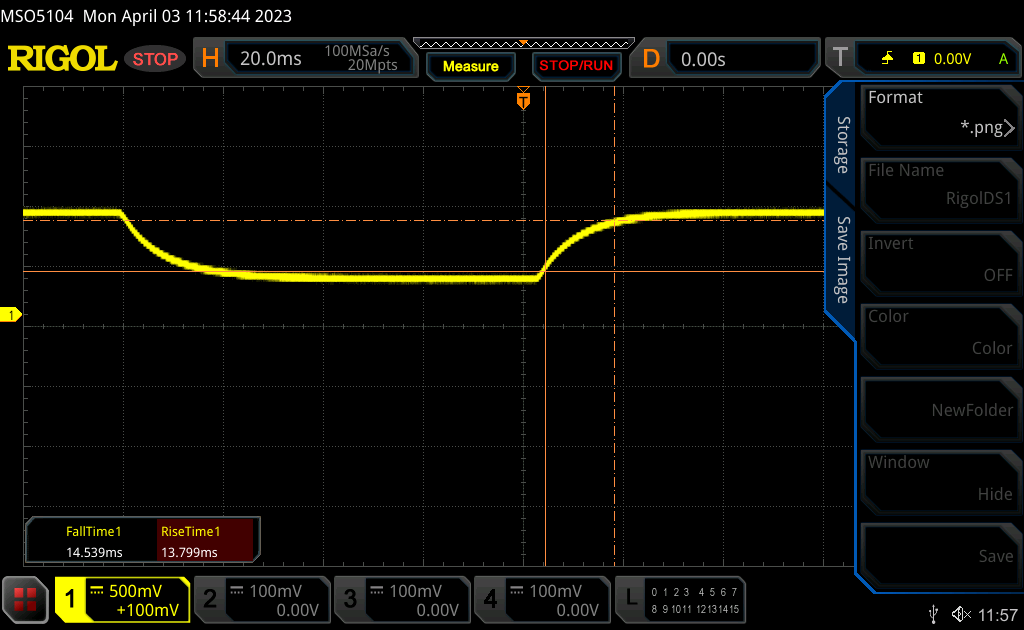 |
| ↘ 14.6 ms hösten | ||
| Skärmen visar relativt långsamma svarsfrekvenser i våra tester och kan vara för långsam för spelare. I jämförelse sträcker sig alla testade enheter från 0.165 (minst) till 636 (maximalt) ms. » 38 % av alla enheter är bättre. Det betyder att den uppmätta svarstiden liknar genomsnittet av alla testade enheter (31 ms). | ||
Skärmflimmer / PWM (Puls-Width Modulation)
| Skärmflimmer / PWM upptäcktes inte |  | ||
Som jämförelse: 52 % av alla testade enheter använder inte PWM för att dämpa skärmen. Om PWM upptäcktes mättes ett medelvärde av 7757 (minst: 5 - maximum: 343500) Hz. | |||
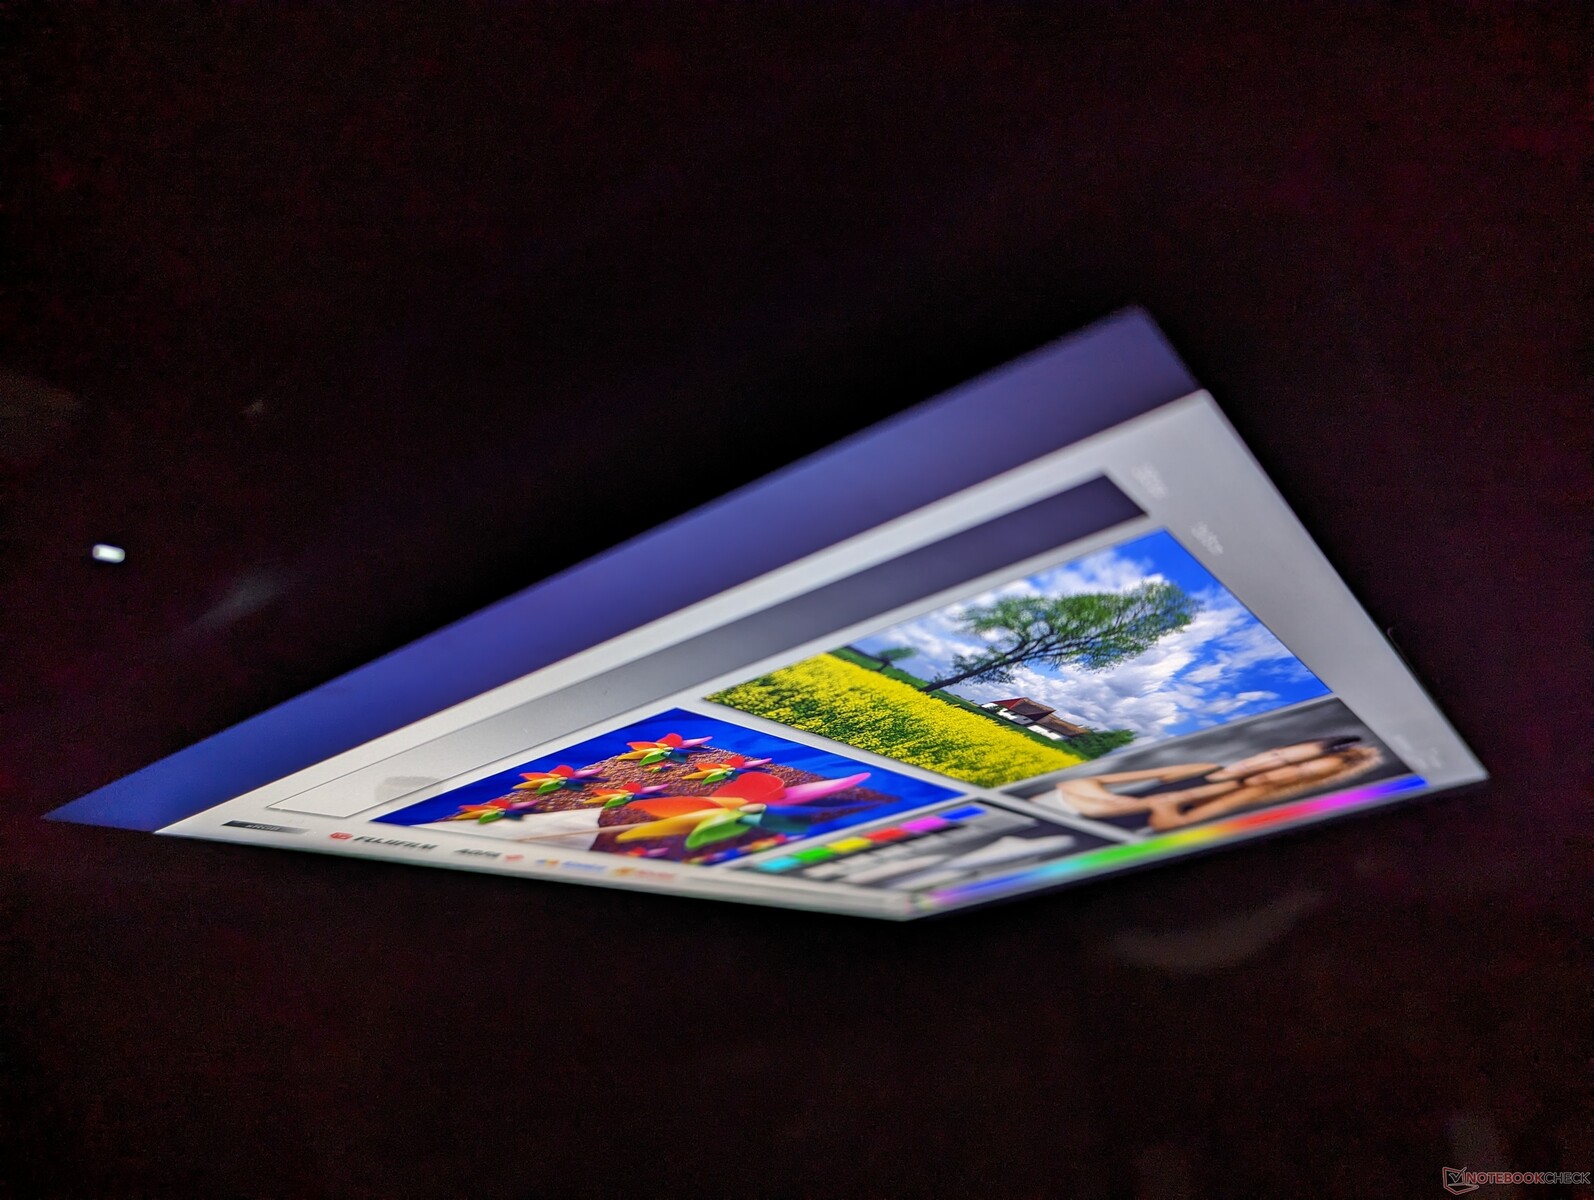
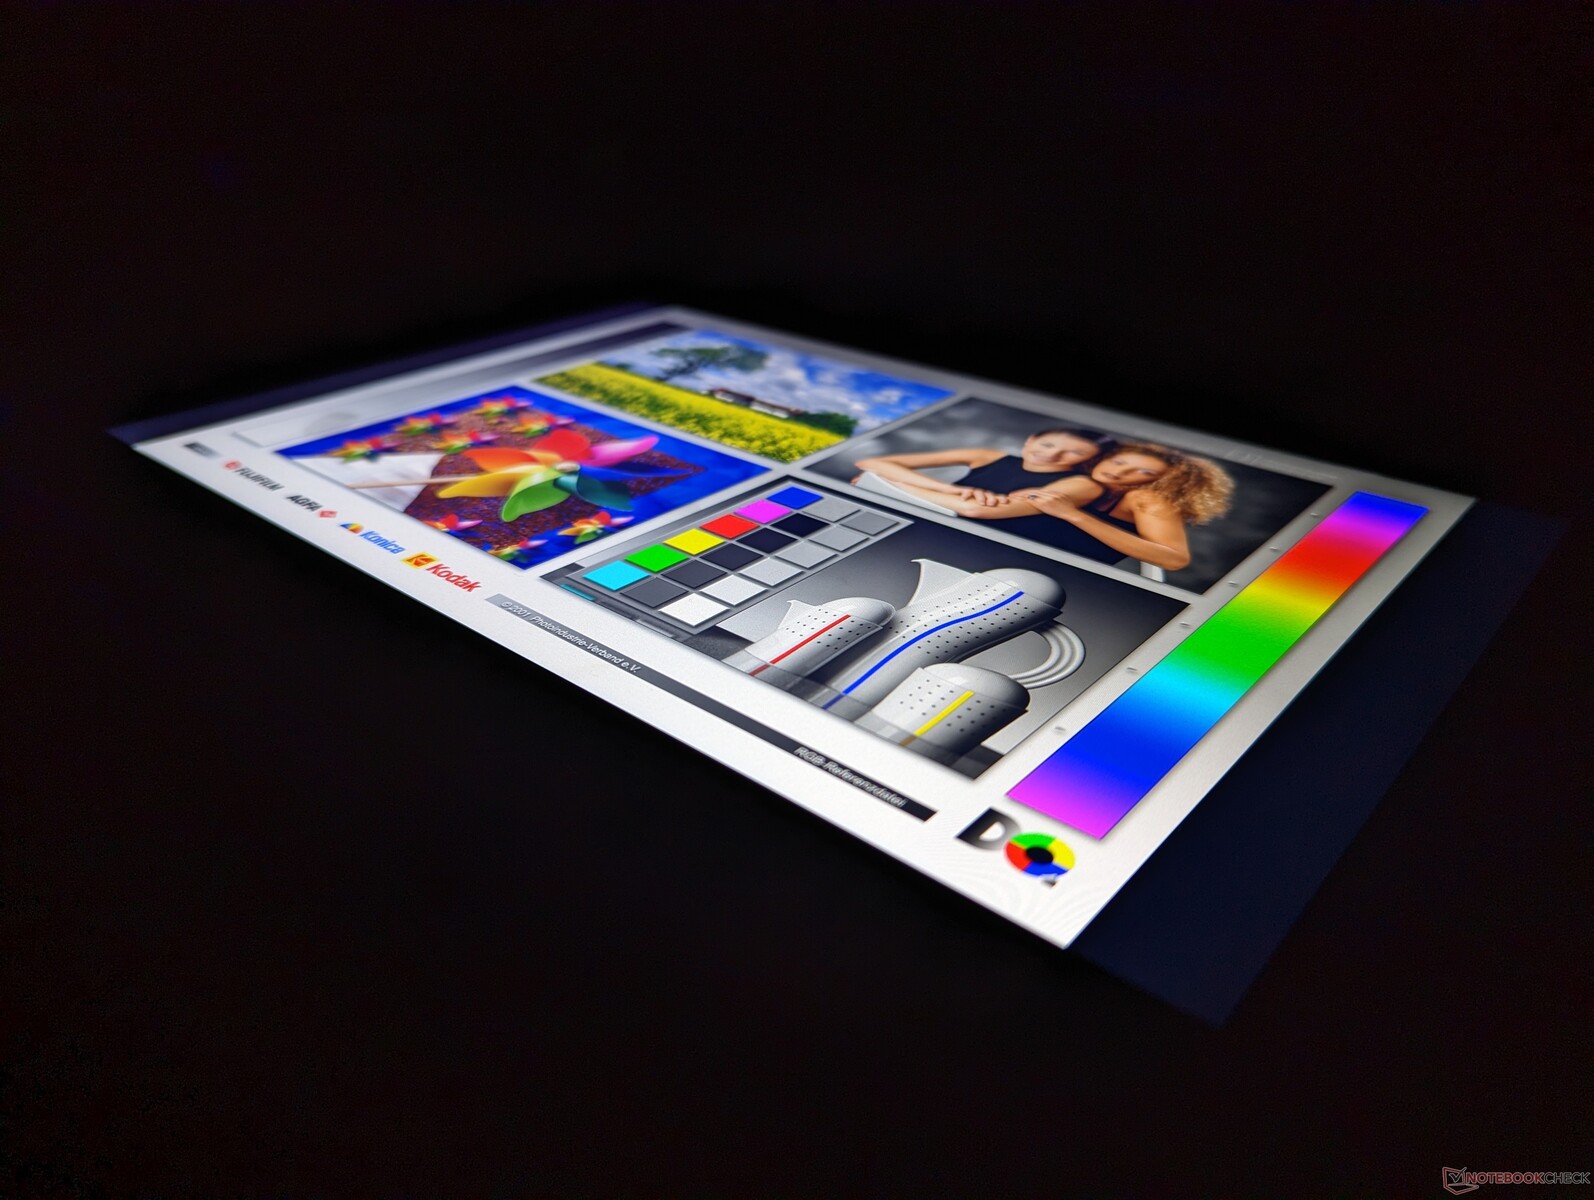
Synligheten utomhus är utmärkt eftersom skärmen är över 1000 nits eller mer än två gånger ljusare än en vanlig surfplatta eller bärbar dator. Viss bländning och urtvättade färger förekommer dock fortfarande, och därför bör direkt solljus undvikas när det är möjligt för att maximera bildkvaliteten.

Prestanda

Provningsförhållanden
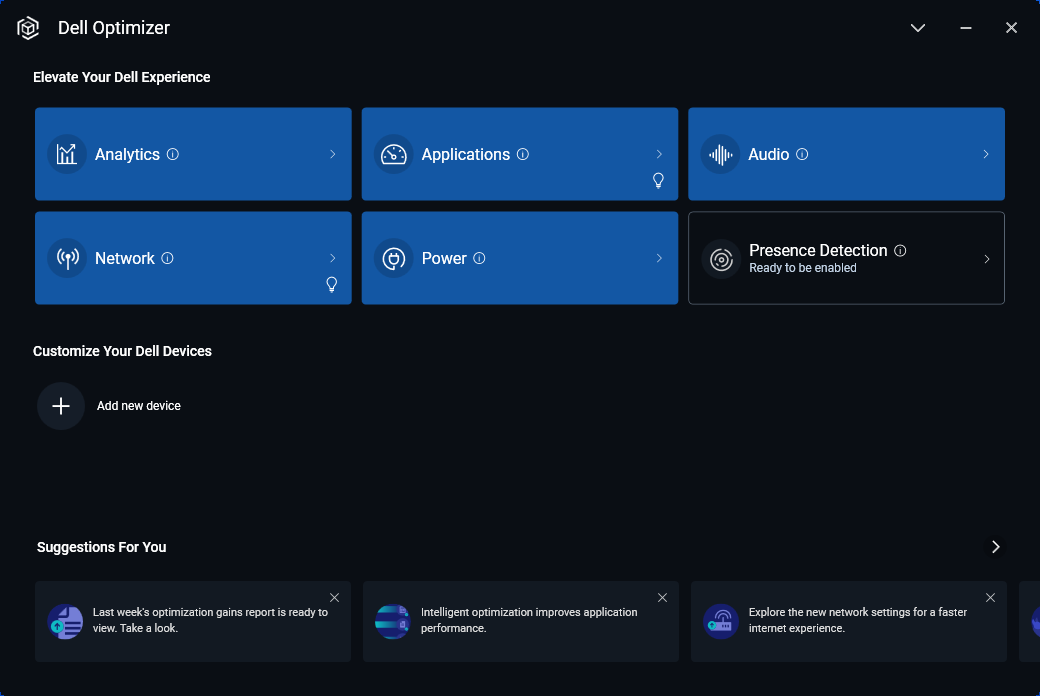
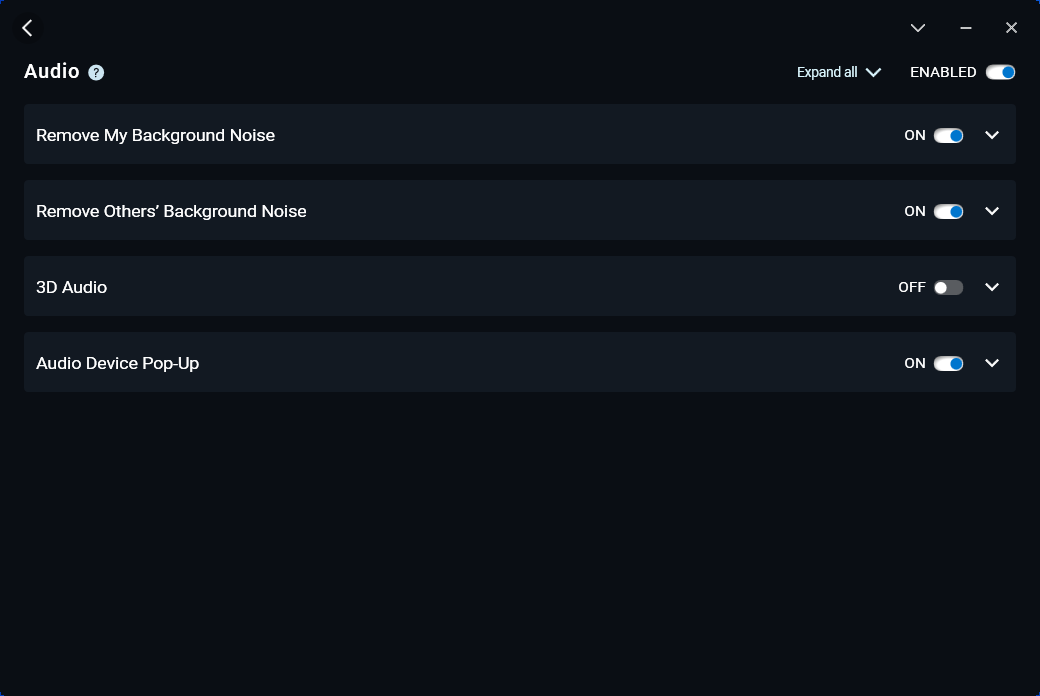
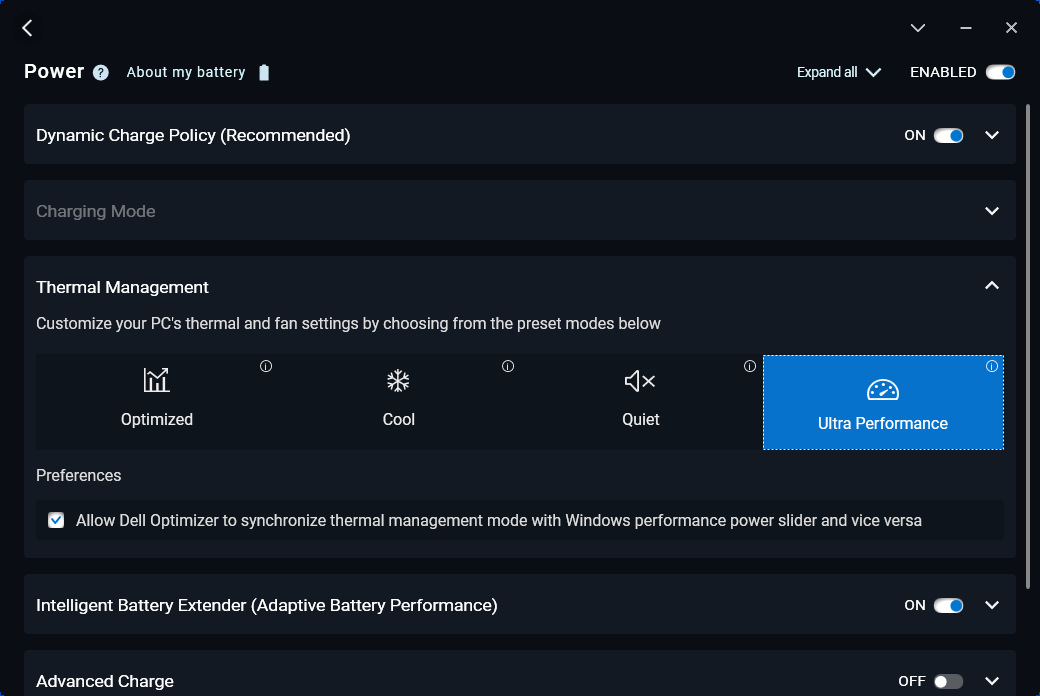
Vi ställde in vår enhet till Ultra Performance-läge via den förinstallerade Dell Optimizer-programvaran innan vi körde några av de följande riktmärkena. Användarna bör vänja sig vid Optimizer eftersom den styr viktiga aspekter av modellen, inklusive strömprofiler, ljud, mikrofon och trådlös anslutning.
Dell Presence Detection stöds inte av modellen.
Processor - lika snabb som Core i7-1260U
CPU-prestanda är utmärkt, särskilt efter den undermåliga Core i7-1260U som vi upplevde på Latitude 7330. Flertrådsprestanda är betydligt snabbare än den populära Core i7-1165G7 eller i7-1185G7 som drev de flesta Ultrabooks och stryktåliga enheter från förr.
Den kanske viktigaste aspekten att ha i åtanke när man väljer mellan Core i5-1240U eller Core i7-1260U är att de råa processorprestanda mellan dem är nästan identiska. Istället skiljer de sig mest i integrerad grafikprestanda. Om du behöver den extra GPU-kraften är Core i7-alternativet bäst. Annars är båda processorerna hals mot hals när det gäller arbetsbelastning från en och flera trådar på CPU:n.
Cinebench R15 Multi Loop
Cinebench R23: Multi Core | Single Core
Cinebench R20: CPU (Multi Core) | CPU (Single Core)
Cinebench R15: CPU Multi 64Bit | CPU Single 64Bit
Blender: v2.79 BMW27 CPU
7-Zip 18.03: 7z b 4 | 7z b 4 -mmt1
Geekbench 5.5: Multi-Core | Single-Core
HWBOT x265 Benchmark v2.2: 4k Preset
LibreOffice : 20 Documents To PDF
R Benchmark 2.5: Overall mean
* ... mindre är bättre
| Blender | |
| v3.3 Classroom HIP/AMD | |
| Lenovo ThinkPad P14s G3 AMD 21J6S05000 | |
| Lenovo ThinkPad P14s G3 AMD 21J6S05000 | |
| v3.3 Classroom OPTIX/RTX | |
| HP ZBook Firefly 14 G9-6B8A2EA | |
| v3.3 Classroom CUDA | |
| HP ZBook Firefly 14 G9-6B8A2EA | |
| v3.3 Classroom CPU | |
| Dell Latitude 7230 Rugged Extreme | |
| HP ProBook 440 G9-5Y3Z3EA | |
| HP ZBook Firefly 14 G9-6B8A2EA | |
| HP EliteBook 840 G9 | |
| Asus ExpertBook B5 Flip B5602FBN | |
| Lenovo ThinkPad P14s G3 AMD 21J6S05000 | |
* ... mindre är bättre
AIDA64: FP32 Ray-Trace | FPU Julia | CPU SHA3 | CPU Queen | FPU SinJulia | FPU Mandel | CPU AES | CPU ZLib | FP64 Ray-Trace | CPU PhotoWorxx
| Performance rating | |
| Dell Latitude 7330 Rugged Extreme | |
| Acer Enduro Urban N3 EUN314 | |
| Dell Latitude 7230 Rugged Extreme | |
| Genomsnitt Intel Core i5-1240U | |
| Panasonic Toughbook 40 | |
| Getac B360 | |
| Durabook S14I | |
| AIDA64 / FP32 Ray-Trace | |
| Dell Latitude 7330 Rugged Extreme | |
| Acer Enduro Urban N3 EUN314 | |
| Dell Latitude 7230 Rugged Extreme | |
| Genomsnitt Intel Core i5-1240U (n=1) | |
| Panasonic Toughbook 40 | |
| Durabook S14I | |
| Getac B360 | |
| AIDA64 / FPU Julia | |
| Dell Latitude 7230 Rugged Extreme | |
| Genomsnitt Intel Core i5-1240U (n=1) | |
| Dell Latitude 7330 Rugged Extreme | |
| Acer Enduro Urban N3 EUN314 | |
| Getac B360 | |
| Panasonic Toughbook 40 | |
| Durabook S14I | |
| AIDA64 / CPU SHA3 | |
| Dell Latitude 7330 Rugged Extreme | |
| Acer Enduro Urban N3 EUN314 | |
| Dell Latitude 7230 Rugged Extreme | |
| Genomsnitt Intel Core i5-1240U (n=1) | |
| Panasonic Toughbook 40 | |
| Durabook S14I | |
| Getac B360 | |
| AIDA64 / CPU Queen | |
| Getac B360 | |
| Dell Latitude 7330 Rugged Extreme | |
| Acer Enduro Urban N3 EUN314 | |
| Durabook S14I | |
| Dell Latitude 7230 Rugged Extreme | |
| Genomsnitt Intel Core i5-1240U (n=1) | |
| Panasonic Toughbook 40 | |
| AIDA64 / FPU SinJulia | |
| Dell Latitude 7330 Rugged Extreme | |
| Acer Enduro Urban N3 EUN314 | |
| Getac B360 | |
| Panasonic Toughbook 40 | |
| Dell Latitude 7230 Rugged Extreme | |
| Genomsnitt Intel Core i5-1240U (n=1) | |
| Durabook S14I | |
| AIDA64 / FPU Mandel | |
| Dell Latitude 7330 Rugged Extreme | |
| Acer Enduro Urban N3 EUN314 | |
| Dell Latitude 7230 Rugged Extreme | |
| Genomsnitt Intel Core i5-1240U (n=1) | |
| Panasonic Toughbook 40 | |
| Durabook S14I | |
| Getac B360 | |
| AIDA64 / CPU AES | |
| Dell Latitude 7330 Rugged Extreme | |
| Acer Enduro Urban N3 EUN314 | |
| Durabook S14I | |
| Dell Latitude 7230 Rugged Extreme | |
| Genomsnitt Intel Core i5-1240U (n=1) | |
| Panasonic Toughbook 40 | |
| Getac B360 | |
| AIDA64 / CPU ZLib | |
| Dell Latitude 7230 Rugged Extreme | |
| Genomsnitt Intel Core i5-1240U (n=1) | |
| Dell Latitude 7330 Rugged Extreme | |
| Acer Enduro Urban N3 EUN314 | |
| Panasonic Toughbook 40 | |
| Getac B360 | |
| Durabook S14I | |
| AIDA64 / FP64 Ray-Trace | |
| Dell Latitude 7330 Rugged Extreme | |
| Acer Enduro Urban N3 EUN314 | |
| Dell Latitude 7230 Rugged Extreme | |
| Genomsnitt Intel Core i5-1240U (n=1) | |
| Panasonic Toughbook 40 | |
| Durabook S14I | |
| Getac B360 | |
| AIDA64 / CPU PhotoWorxx | |
| Dell Latitude 7330 Rugged Extreme | |
| Dell Latitude 7230 Rugged Extreme | |
| Genomsnitt Intel Core i5-1240U (n=1) | |
| Acer Enduro Urban N3 EUN314 | |
| Panasonic Toughbook 40 | |
| Getac B360 | |
| Durabook S14I | |
Systemets prestanda
CrossMark: Overall | Productivity | Creativity | Responsiveness
| PCMark 10 / Score | |
| Dell Latitude 7330 Rugged Extreme | |
| Panasonic Toughbook 40 | |
| Dell Latitude 7230 Rugged Extreme | |
| Genomsnitt Intel Core i5-1240U, Intel Iris Xe Graphics G7 80EUs (n=1) | |
| Durabook S14I | |
| Acer Enduro Urban N3 EUN314 | |
| Getac B360 | |
| PCMark 10 / Essentials | |
| Dell Latitude 7330 Rugged Extreme | |
| Durabook S14I | |
| Dell Latitude 7230 Rugged Extreme | |
| Genomsnitt Intel Core i5-1240U, Intel Iris Xe Graphics G7 80EUs (n=1) | |
| Panasonic Toughbook 40 | |
| Acer Enduro Urban N3 EUN314 | |
| Getac B360 | |
| PCMark 10 / Productivity | |
| Getac B360 | |
| Durabook S14I | |
| Dell Latitude 7330 Rugged Extreme | |
| Panasonic Toughbook 40 | |
| Dell Latitude 7230 Rugged Extreme | |
| Genomsnitt Intel Core i5-1240U, Intel Iris Xe Graphics G7 80EUs (n=1) | |
| Acer Enduro Urban N3 EUN314 | |
| PCMark 10 / Digital Content Creation | |
| Dell Latitude 7330 Rugged Extreme | |
| Panasonic Toughbook 40 | |
| Acer Enduro Urban N3 EUN314 | |
| Dell Latitude 7230 Rugged Extreme | |
| Genomsnitt Intel Core i5-1240U, Intel Iris Xe Graphics G7 80EUs (n=1) | |
| Durabook S14I | |
| Getac B360 | |
| CrossMark / Overall | |
| Dell Latitude 7230 Rugged Extreme | |
| Genomsnitt Intel Core i5-1240U, Intel Iris Xe Graphics G7 80EUs (n=1) | |
| Panasonic Toughbook 40 | |
| CrossMark / Productivity | |
| Dell Latitude 7230 Rugged Extreme | |
| Genomsnitt Intel Core i5-1240U, Intel Iris Xe Graphics G7 80EUs (n=1) | |
| Panasonic Toughbook 40 | |
| CrossMark / Creativity | |
| Dell Latitude 7230 Rugged Extreme | |
| Genomsnitt Intel Core i5-1240U, Intel Iris Xe Graphics G7 80EUs (n=1) | |
| Panasonic Toughbook 40 | |
| CrossMark / Responsiveness | |
| Dell Latitude 7230 Rugged Extreme | |
| Genomsnitt Intel Core i5-1240U, Intel Iris Xe Graphics G7 80EUs (n=1) | |
| Panasonic Toughbook 40 | |
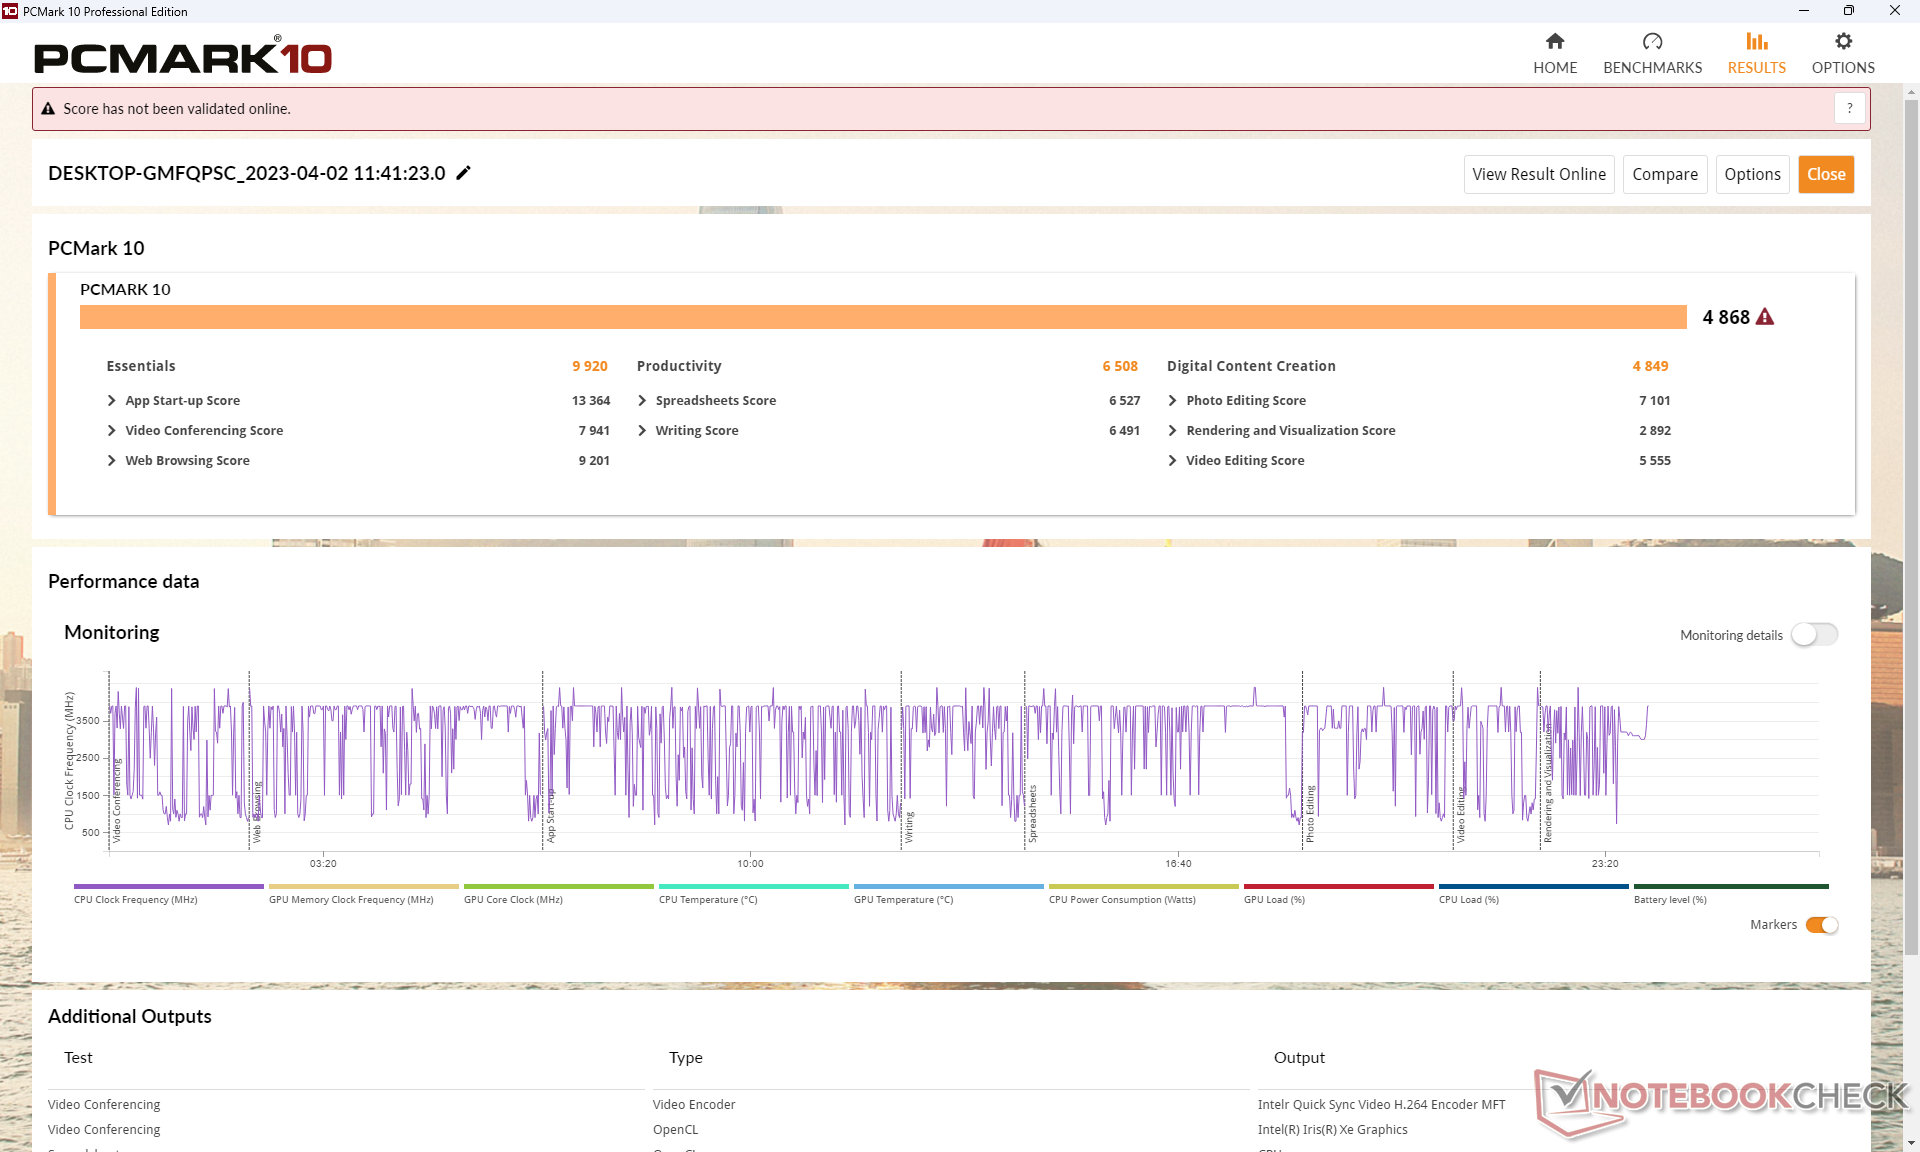
| PCMark 10 Score | 4868 poäng | |
Hjälp | ||
| AIDA64 / Memory Copy | |
| Dell Latitude 7230 Rugged Extreme | |
| Genomsnitt Intel Core i5-1240U (n=1) | |
| Dell Latitude 7330 Rugged Extreme | |
| Acer Enduro Urban N3 EUN314 | |
| Panasonic Toughbook 40 | |
| Getac B360 | |
| Durabook S14I | |
| AIDA64 / Memory Read | |
| Dell Latitude 7330 Rugged Extreme | |
| Dell Latitude 7230 Rugged Extreme | |
| Genomsnitt Intel Core i5-1240U (n=1) | |
| Acer Enduro Urban N3 EUN314 | |
| Panasonic Toughbook 40 | |
| Getac B360 | |
| Durabook S14I | |
| AIDA64 / Memory Write | |
| Dell Latitude 7330 Rugged Extreme | |
| Dell Latitude 7230 Rugged Extreme | |
| Genomsnitt Intel Core i5-1240U (n=1) | |
| Acer Enduro Urban N3 EUN314 | |
| Getac B360 | |
| Panasonic Toughbook 40 | |
| Durabook S14I | |
| AIDA64 / Memory Latency | |
| Dell Latitude 7230 Rugged Extreme | |
| Genomsnitt Intel Core i5-1240U (n=1) | |
| Panasonic Toughbook 40 | |
| Dell Latitude 7330 Rugged Extreme | |
| Acer Enduro Urban N3 EUN314 | |
| Durabook S14I | |
| Getac B360 | |
* ... mindre är bättre
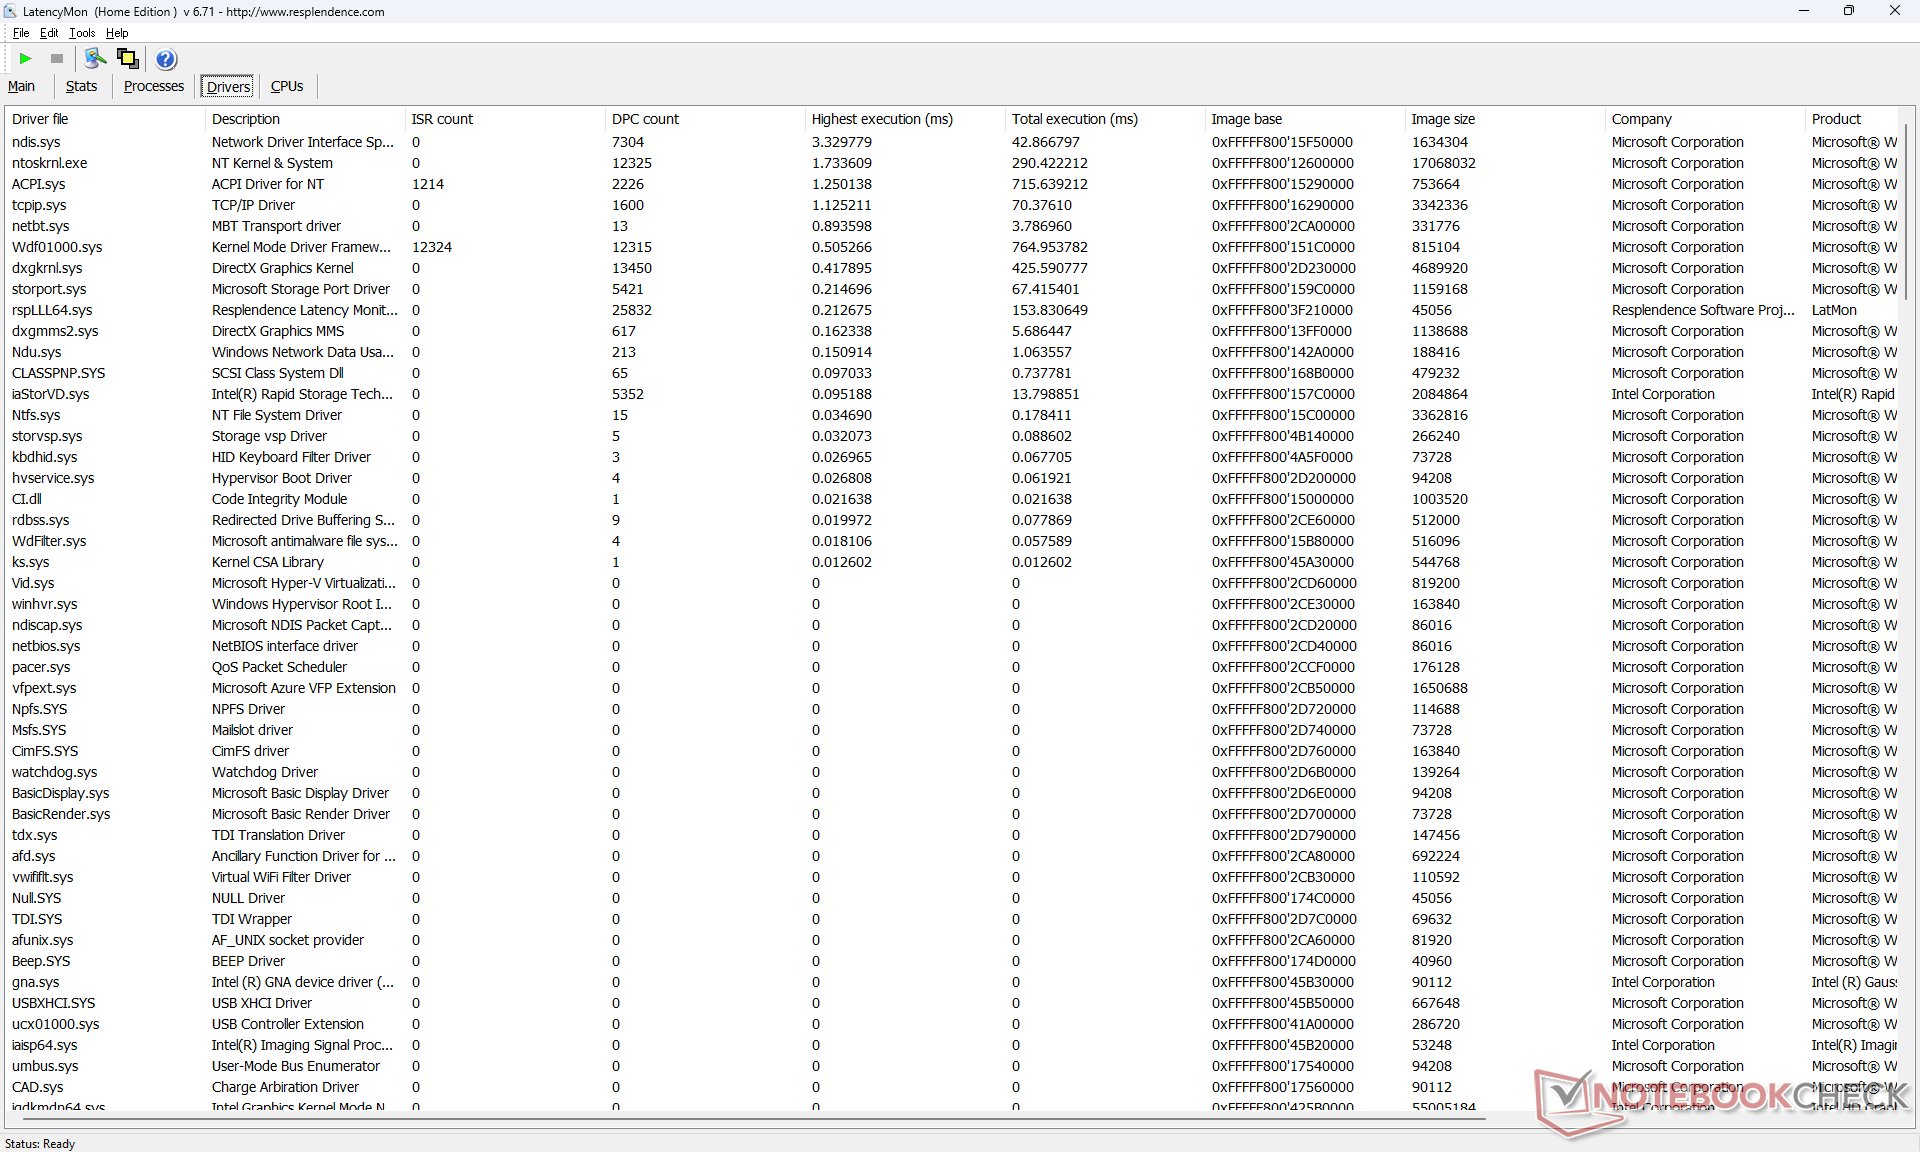
DPC-latenstid
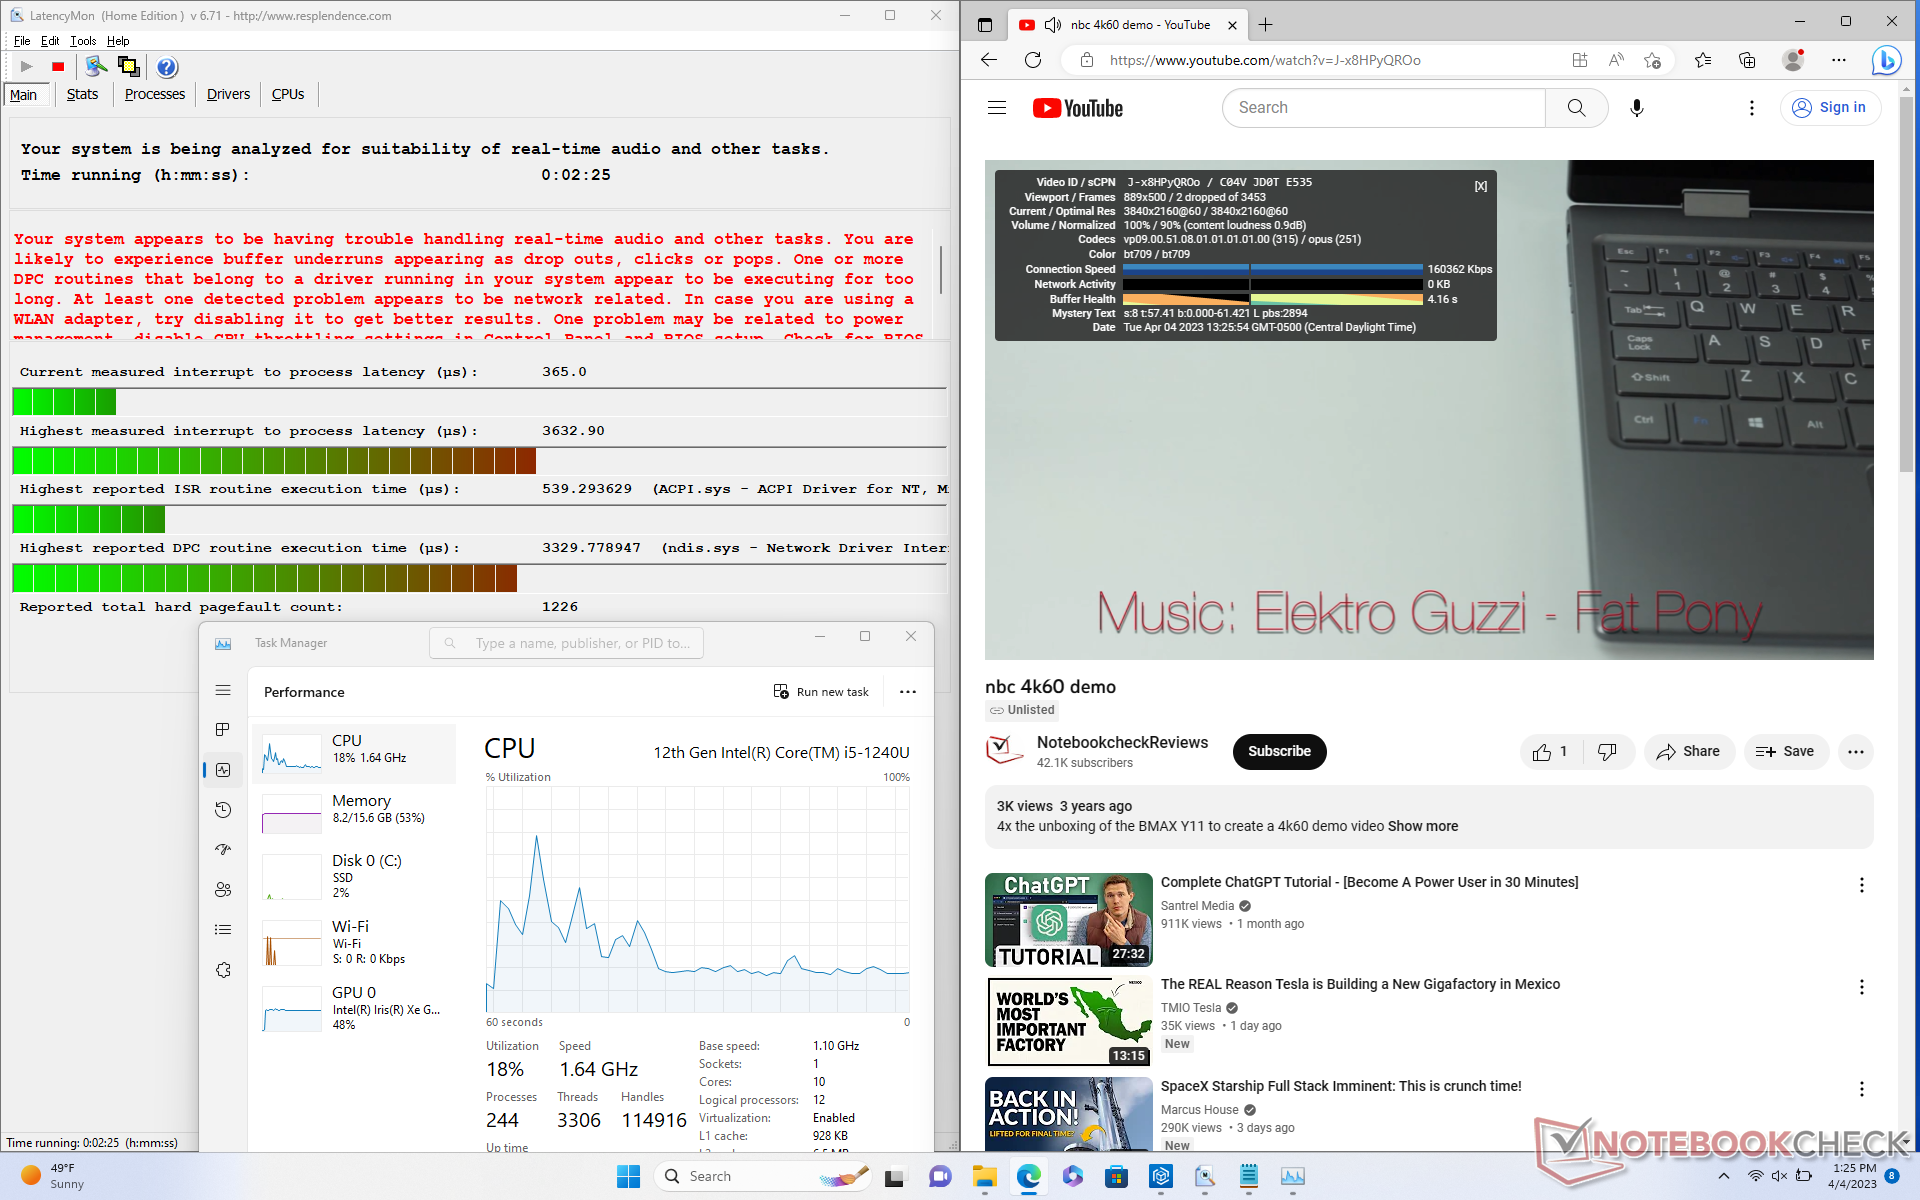
LatencyMon avslöjar DPC-problem när man öppnar flera webbläsarflikar på vår hemsida, vilket är en besvikelse att se på en stryktålig enhet där prestandastabilitet är av största vikt. uppspelning av 4K-video vid 60 FPS är också bristfällig med 2 tappade bilder under vår minutlånga testvideo.
| DPC Latencies / LatencyMon - interrupt to process latency (max), Web, Youtube, Prime95 | |
| Acer Enduro Urban N3 EUN314 | |
| Dell Latitude 7230 Rugged Extreme | |
| Durabook S14I | |
| Panasonic Toughbook 40 | |
| Getac B360 | |
| Dell Latitude 7330 Rugged Extreme | |
* ... mindre är bättre
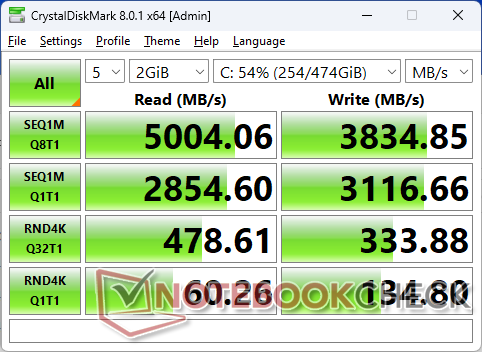
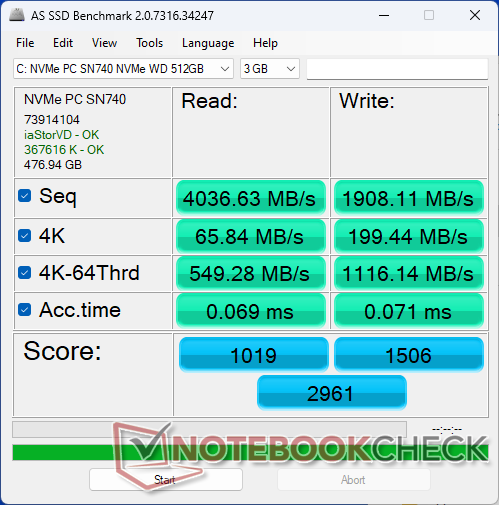
Lagringsenheter
Vår testenhet levereras med en avtagbar WD PC SN740 PCIe4 x4 NVMe-SSD för sekventiella överföringshastigheter på upp till 4800 MB/s. Den maximala prestandan är dock inte hållbar, eftersom överföringshastigheten kan sjunka till så låga som 2300 MB/s efter bara några minuter, vilket framgår av diagrammet nedan.

| Drive Performance rating - Percent | |
| Dell Latitude 7330 Rugged Extreme | |
| Dell Latitude 7230 Rugged Extreme | |
| Acer Enduro Urban N3 EUN314 | |
| Getac B360 | |
| Durabook S14I | |
| Panasonic Toughbook 40 | |
* ... mindre är bättre
Disk Throttling: DiskSpd Read Loop, Queue Depth 8
GPU-prestanda - genomsnittlig Iris Xe 80 EUs
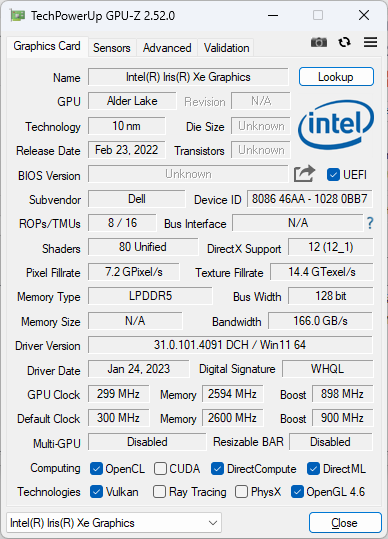
Grafikprestanda underpresterar med cirka 5 till 15 procent jämfört med den genomsnittliga datorn i vår databas som är utrustad med samma integrerade Iris Xe 80 EUs GPU. Den totala prestandan är cirka 30-40 procent långsammare än den vanliga datorn Iris Xe 96 EUs. Lyckligtvis kan modellen konfigureras med Core i7-1260U som kommer med den snabbare Iris Xe 96 EUs för dem som behöver det som tidigare nämnts.
Systemprestandan verkar vara identisk mellan strömprofilerna Optimized och Ultra. Ett 3DMark 11-test på båda strömlägena skulle resultera i nästan samma slutresultat mellan dem.
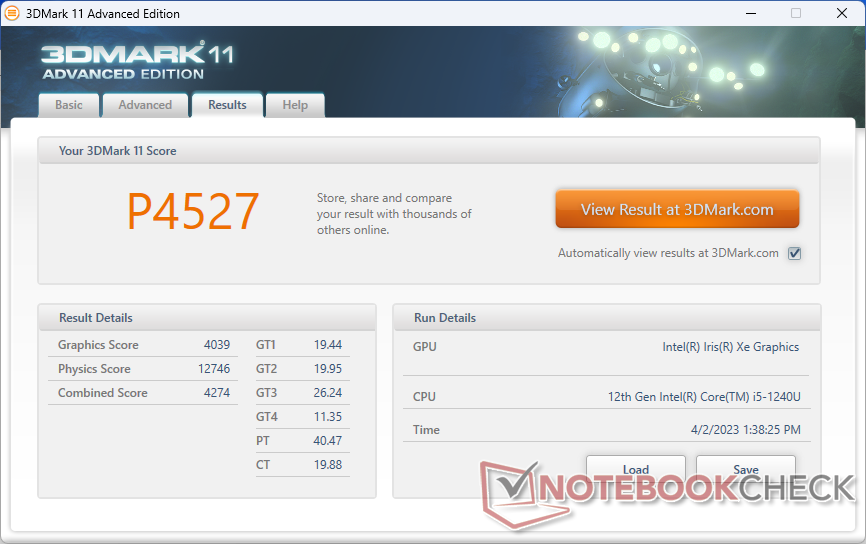
| 3DMark 11 Performance | 4527 poäng | |
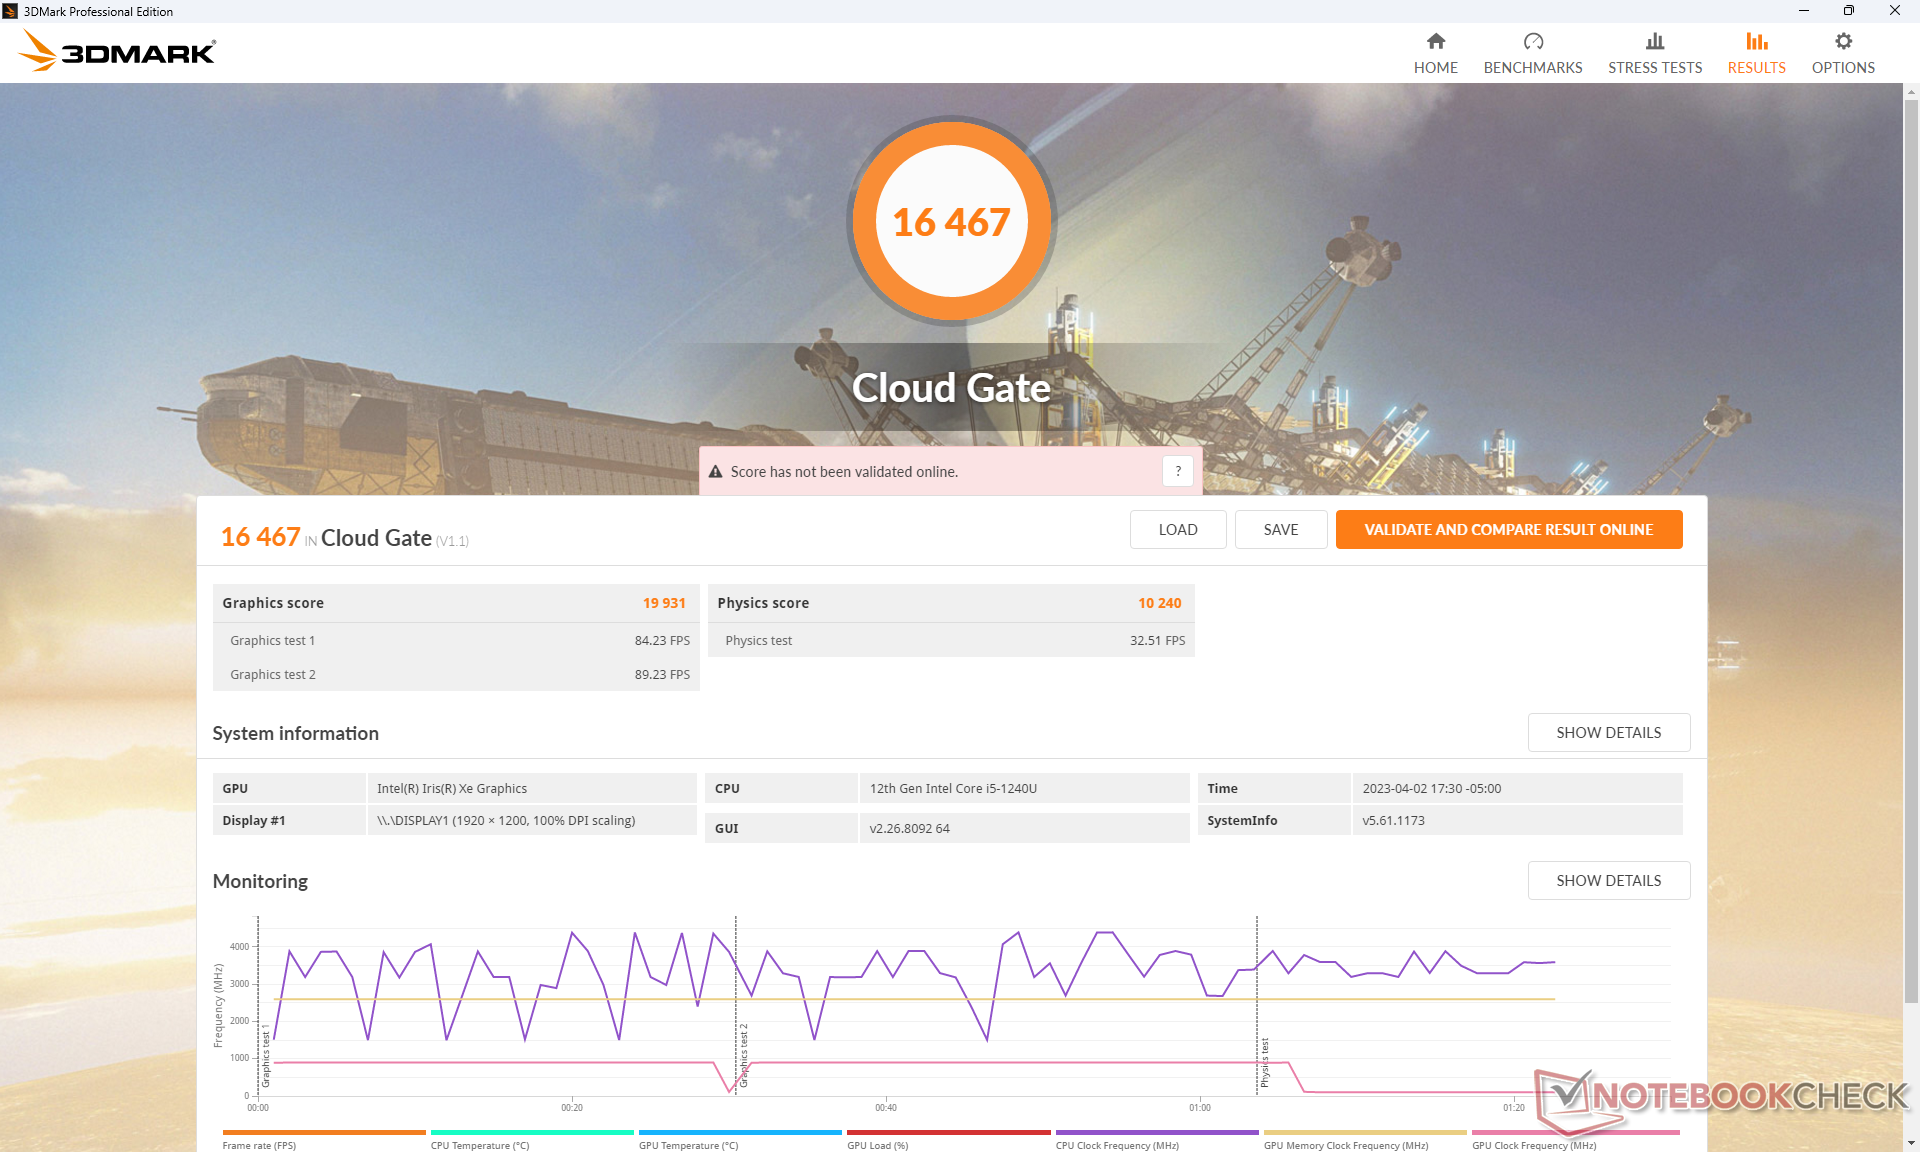
| 3DMark Cloud Gate Standard Score | 16467 poäng | |
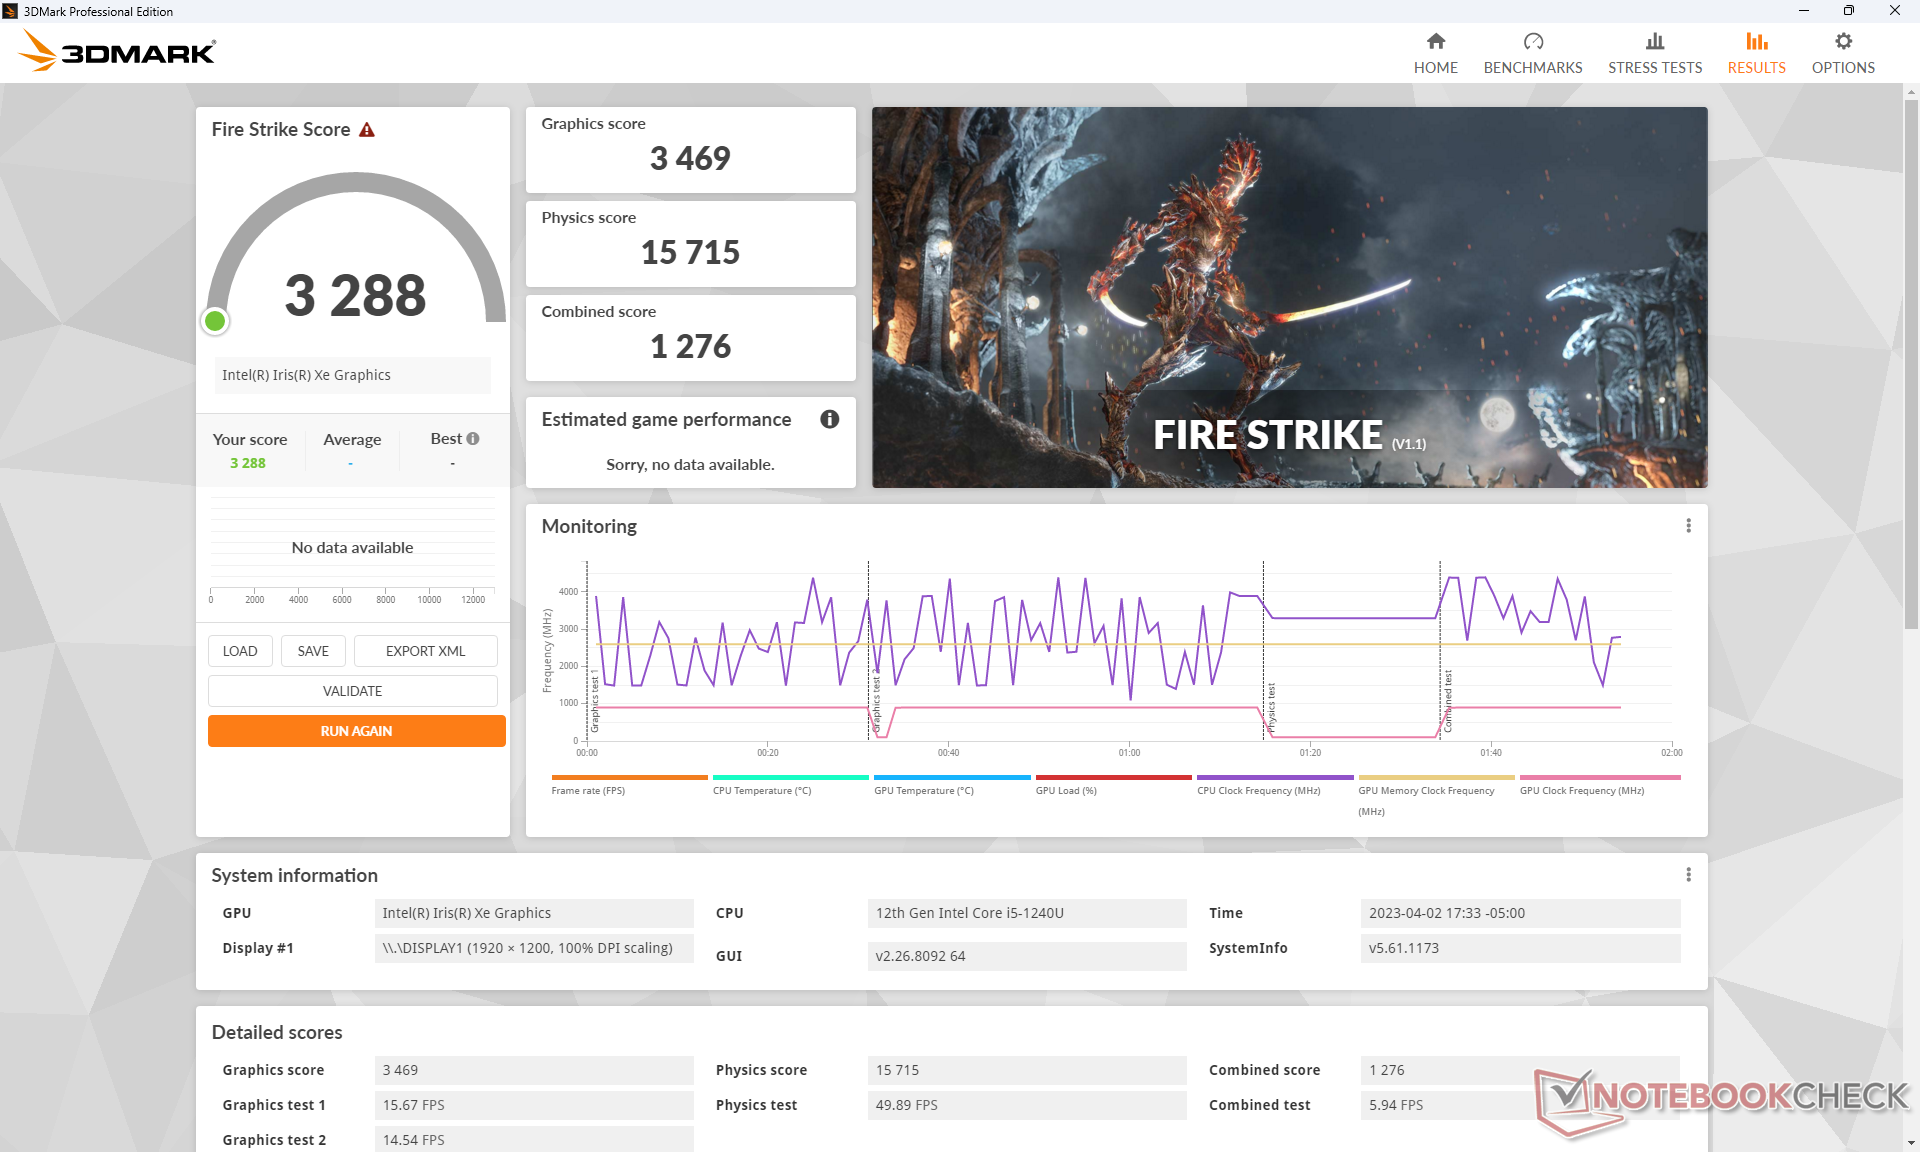
| 3DMark Fire Strike Score | 3288 poäng | |
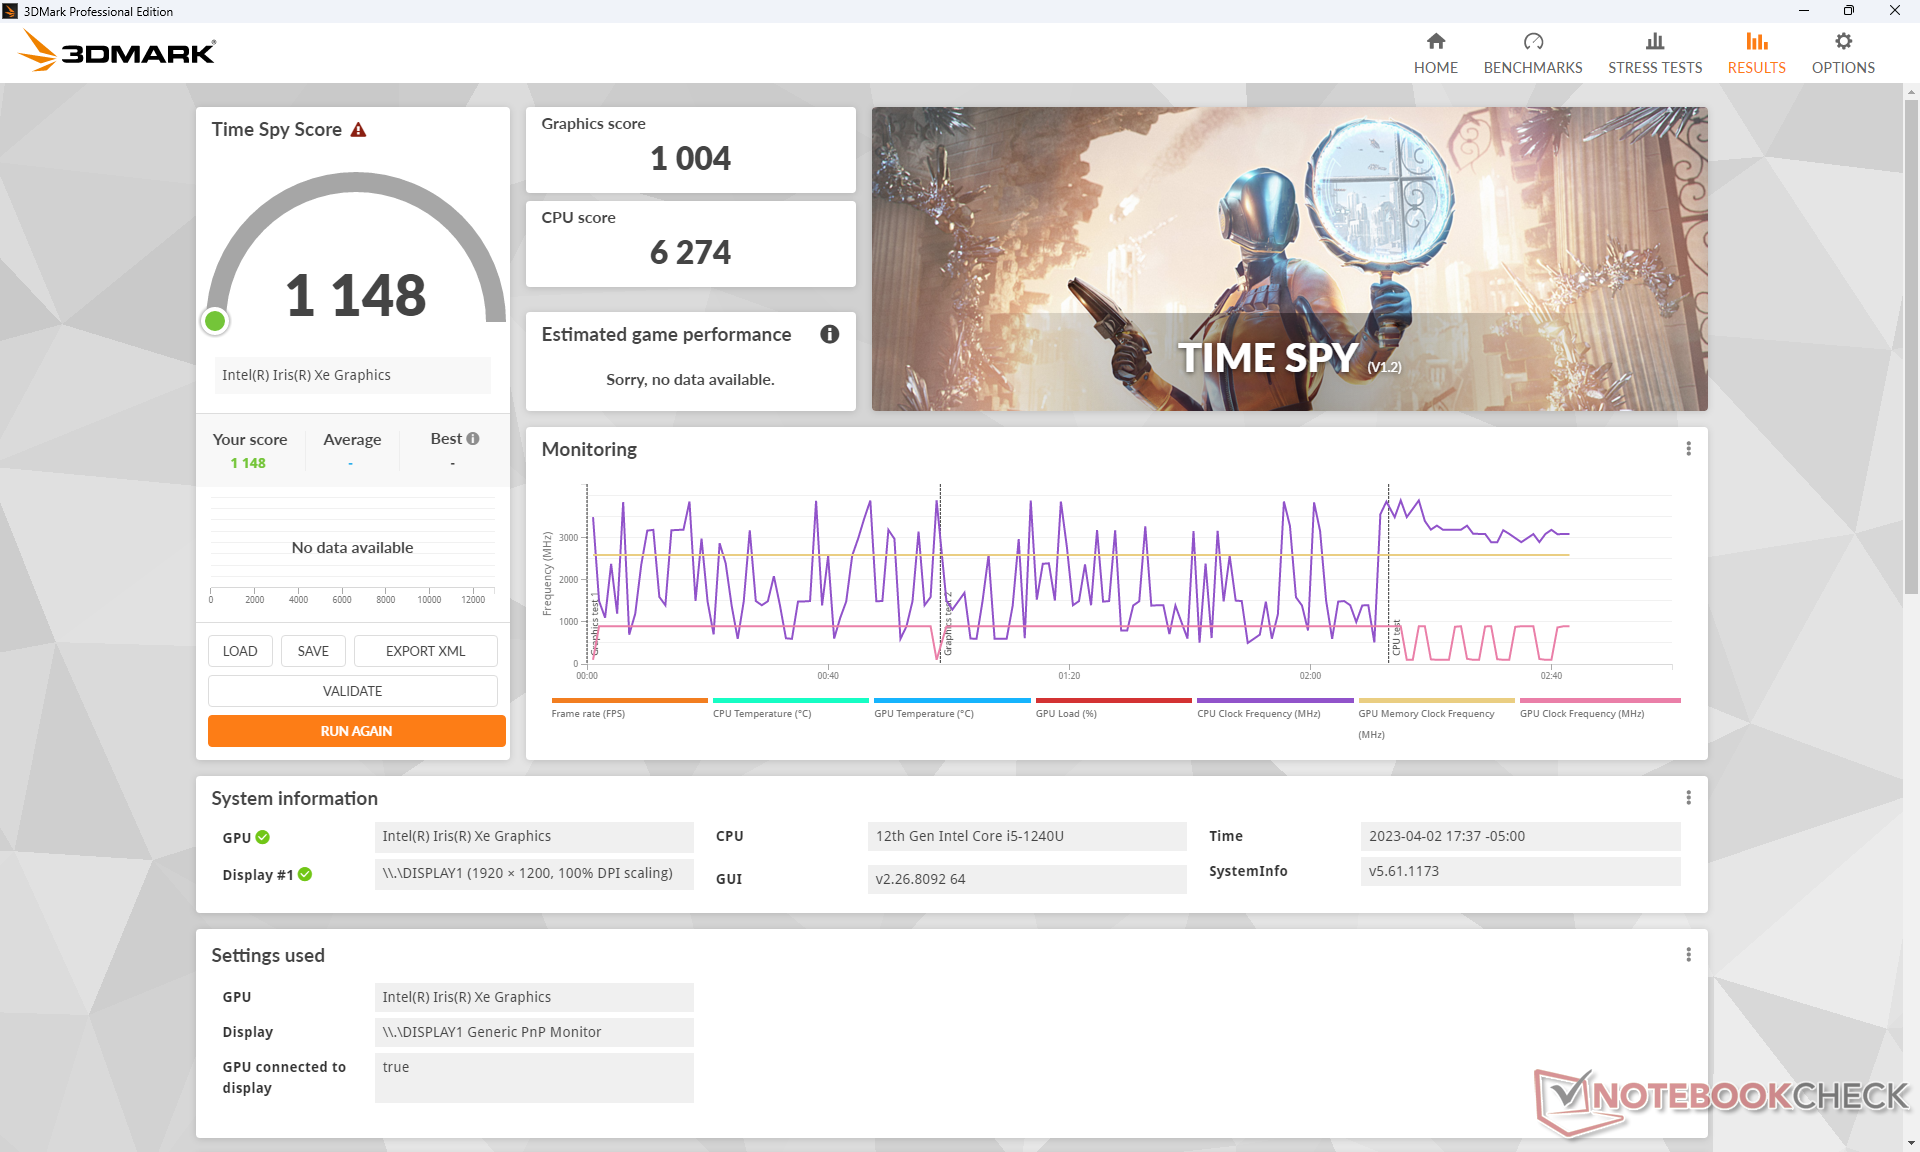
| 3DMark Time Spy Score | 1148 poäng | |
Hjälp | ||
| GTA V - 1920x1080 Highest AA:4xMSAA + FX AF:16x | |
| HP ZBook Firefly 14 G9-6B8A2EA | |
| Lenovo ThinkPad P14s G3 AMD 21J6S05000 | |
| Asus ExpertBook B5 Flip B5602FBN | |
| HP EliteBook 840 G9 | |
| Acer Enduro Urban N3 EUN314 | |
| Dell Latitude 7230 Rugged Extreme | |
| Strange Brigade - 1920x1080 ultra AA:ultra AF:16 | |
| Asus ExpertBook B5 Flip B5602FBN | |
| HP ZBook Firefly 14 G9-6B8A2EA | |
| Lenovo ThinkPad P14s G3 AMD 21J6S05000 | |
| HP EliteBook 840 G9 | |
| Acer Enduro Urban N3 EUN314 | |
| Dell Latitude 7230 Rugged Extreme | |
Witcher 3 FPS Chart
| låg | med. | hög | ultra | |
|---|---|---|---|---|
| GTA V (2015) | 103.3 | 93.3 | 18.5 | 7.79 |
| The Witcher 3 (2015) | 67.3 | 40.9 | 24.1 | 10.6 |
| Dota 2 Reborn (2015) | 98.9 | 77.8 | 50.7 | 45.7 |
| Final Fantasy XV Benchmark (2018) | 31 | 17.3 | 11.8 | |
| X-Plane 11.11 (2018) | 32.6 | 22.6 | 20.6 | |
| Strange Brigade (2018) | 60.2 | 27.4 | 21.4 | 17.9 |
Utsläpp - tyst tills det är högt
Systembrus
Fläktljudet är tyst och i stort sett ohörbart vid låg till medelhög belastning. Att köra den första benchmark-scenen i 3DMark 06 skulle till exempel inte framkalla något fläktljud förrän i slutet av benchmarken.
Fläkten med liten diameter är tyvärr högre ljud än på de flesta bärbara datorer. Om man kör mycket krävande program som spel eller Prime95 kan fläktljudet bli så högt som 43 dB(A), vilket är en av de mest högljudda stryktåliga surfplattor vi har testat. Du måste dock verkligen pressa surfplattan till sin gräns för att nå så höga ljudnivåer.
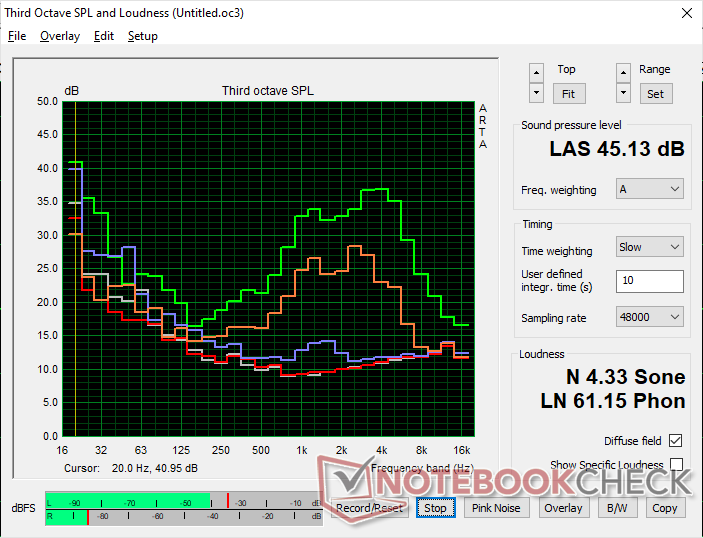
Ljudnivå
| Låg belastning |
| 22.9 / 22.9 / 22.9 dB(A) |
| Hög belastning |
| 24.5 / 43.2 dB(A) |
 | ||
30 dB tyst 40 dB(A) hörbar 50 dB(A) högt ljud |
||
min: | ||
| Dell Latitude 7230 Rugged Extreme Iris Xe G7 80EUs, i5-1240U, WD PC SN740 512GB SDDPMQD-512G-1101 | Dell Latitude 7330 Rugged Extreme Iris Xe G7 96EUs, i7-1185G7 | Panasonic Toughbook 40 Iris Xe G7 96EUs, i7-1185G7, Samsung PM991 MZVLQ1T0HALB | Getac B360 UHD Graphics 620, i7-10710U, Lite-On CA5-8D512 | Acer Enduro Urban N3 EUN314 Iris Xe G7 96EUs, i7-1165G7, Samsung PM991 MZVLQ1T0HALB | Durabook S14I Iris Xe G7 96EUs, i7-1165G7, UDinfo M2P M2P80DE512GBAEP | |
|---|---|---|---|---|---|---|
| Noise | 2% | -13% | 0% | -3% | -18% | |
| av / miljö * (dB) | 22.8 | 22.9 -0% | 22.8 -0% | 24.3 -7% | 23.8 -4% | 25.2 -11% |
| Idle Minimum * (dB) | 22.9 | 23.1 -1% | 26 -14% | 24.5 -7% | 24.1 -5% | 25.2 -10% |
| Idle Average * (dB) | 22.9 | 23.1 -1% | 26 -14% | 24.5 -7% | 24.1 -5% | 25.2 -10% |
| Idle Maximum * (dB) | 22.9 | 23.1 -1% | 26 -14% | 24.6 -7% | 24.1 -5% | 34.5 -51% |
| Load Average * (dB) | 24.5 | 28 -14% | 37.6 -53% | 29.8 -22% | 27.9 -14% | 34.5 -41% |
| Witcher 3 ultra * (dB) | 36 | 31.2 13% | 37.8 -5% | 27.3 24% | 35.7 1% | |
| Load Maximum * (dB) | 43.2 | 36.2 16% | 40.3 7% | 30.8 29% | 38.6 11% | 36.2 16% |
* ... mindre är bättre
Temperatur
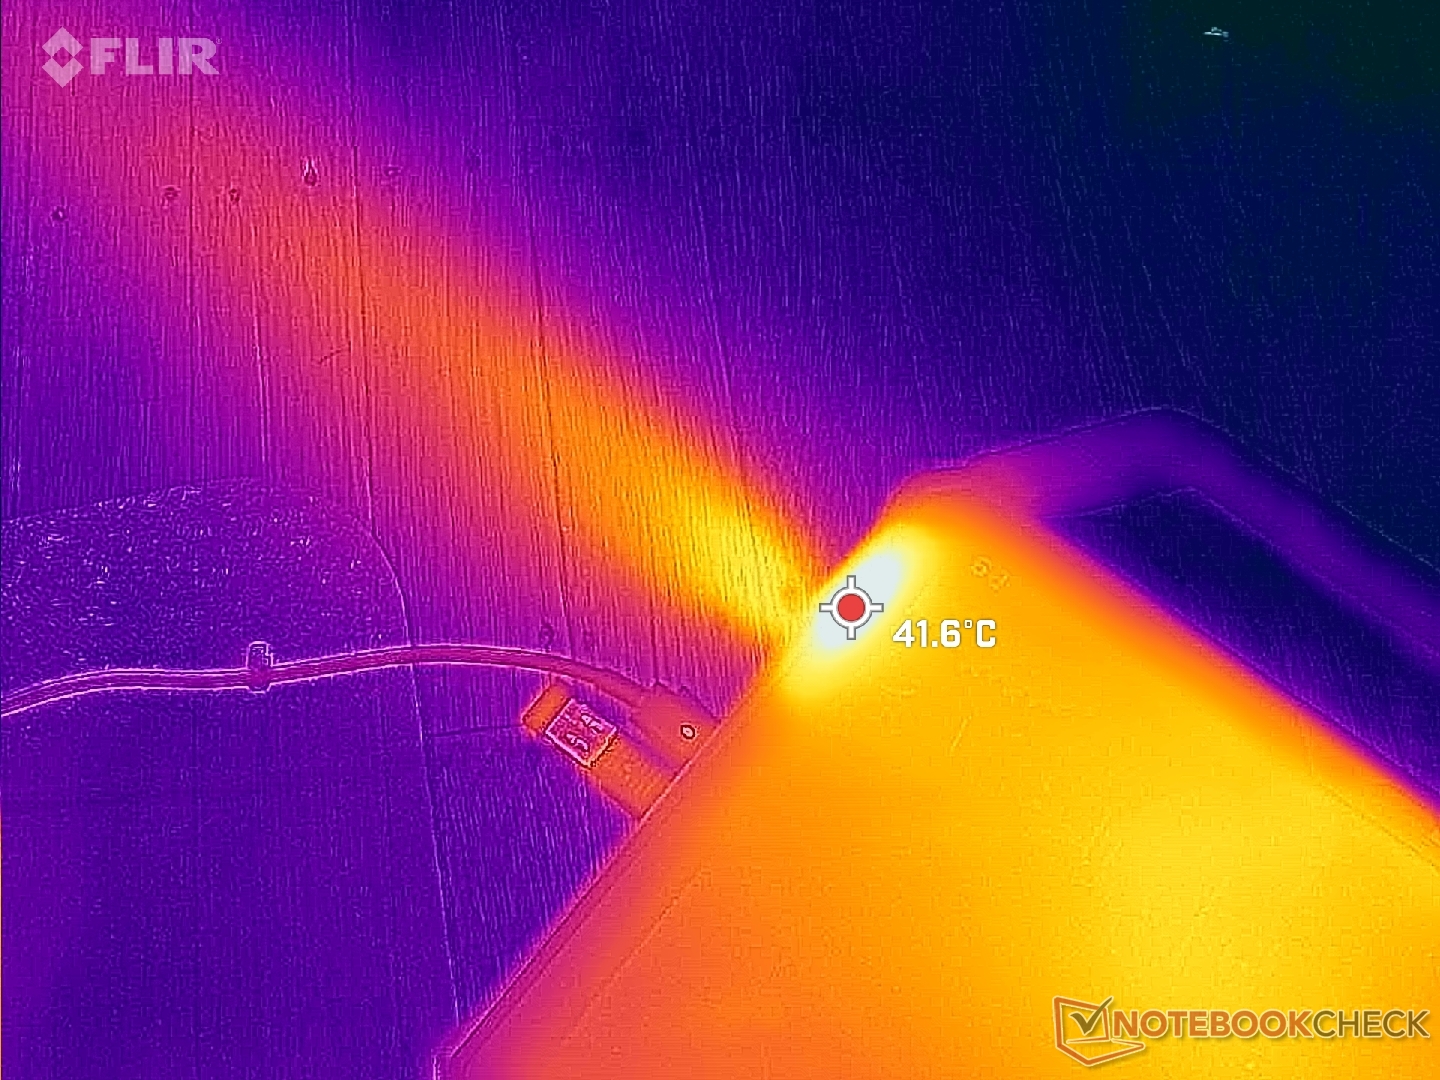
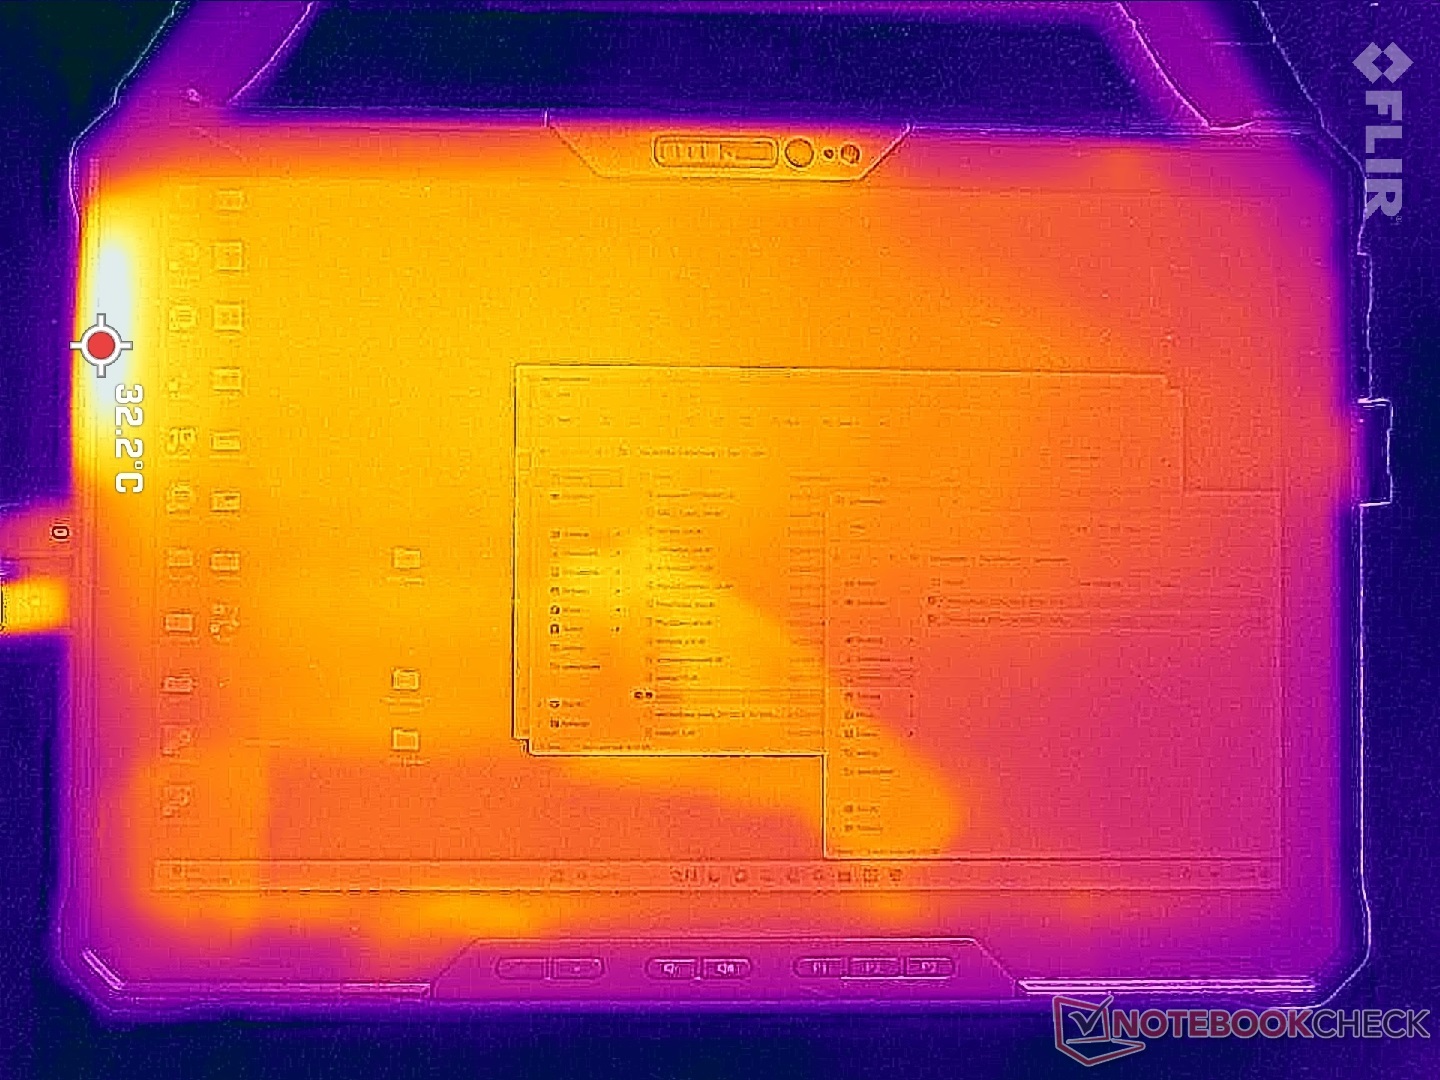
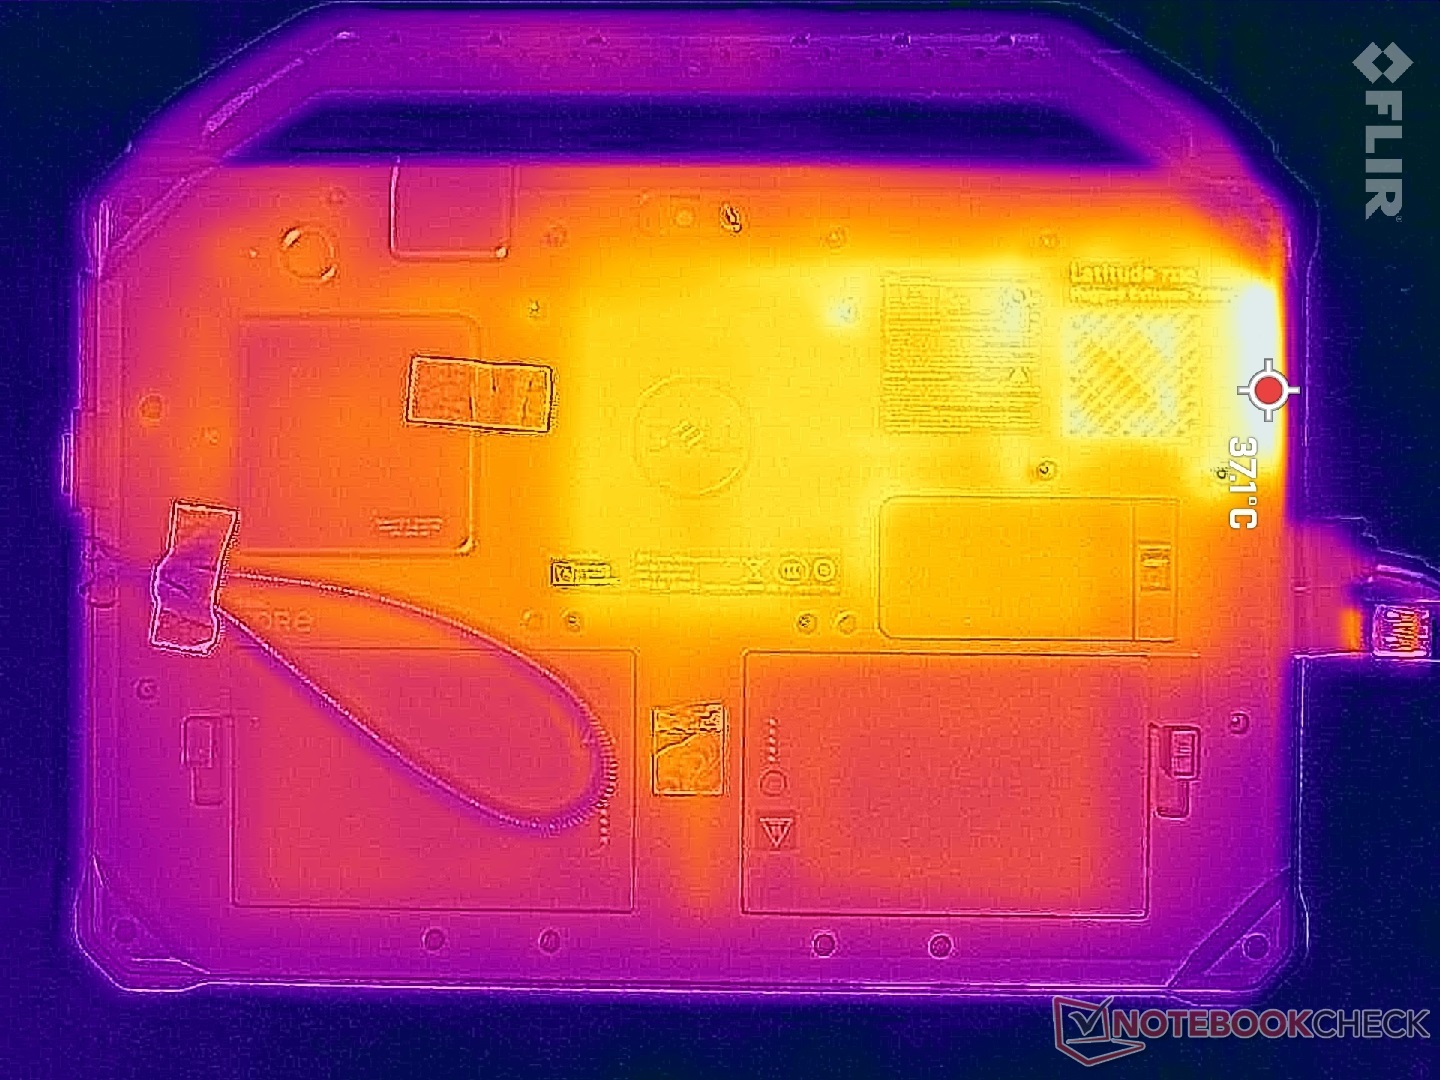
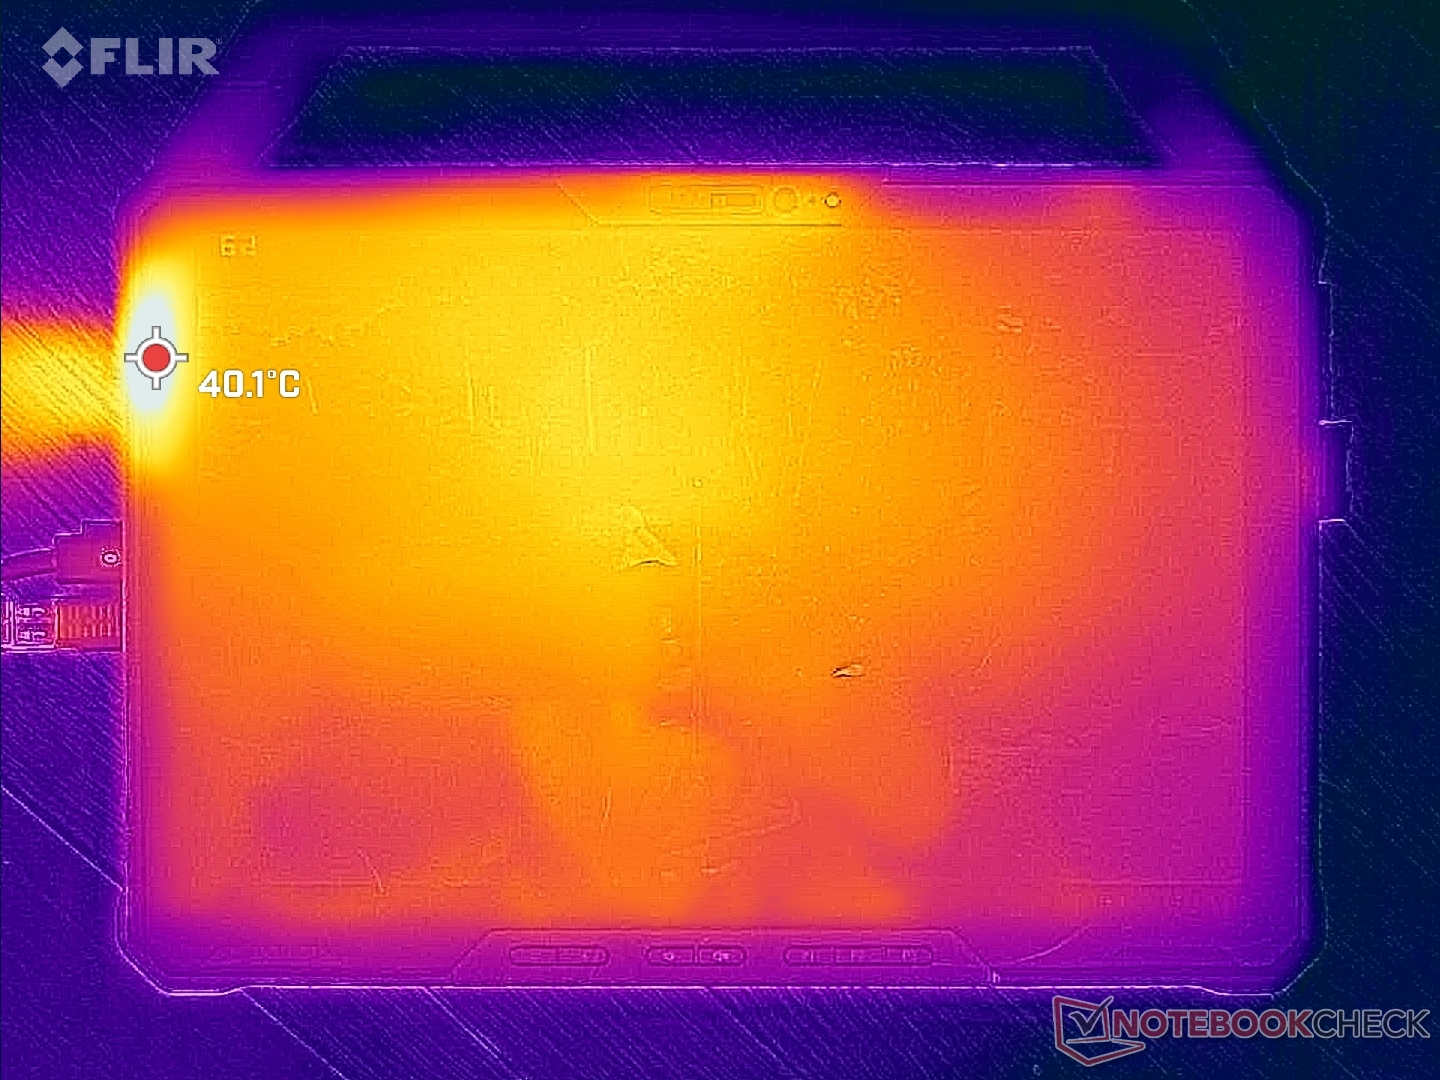
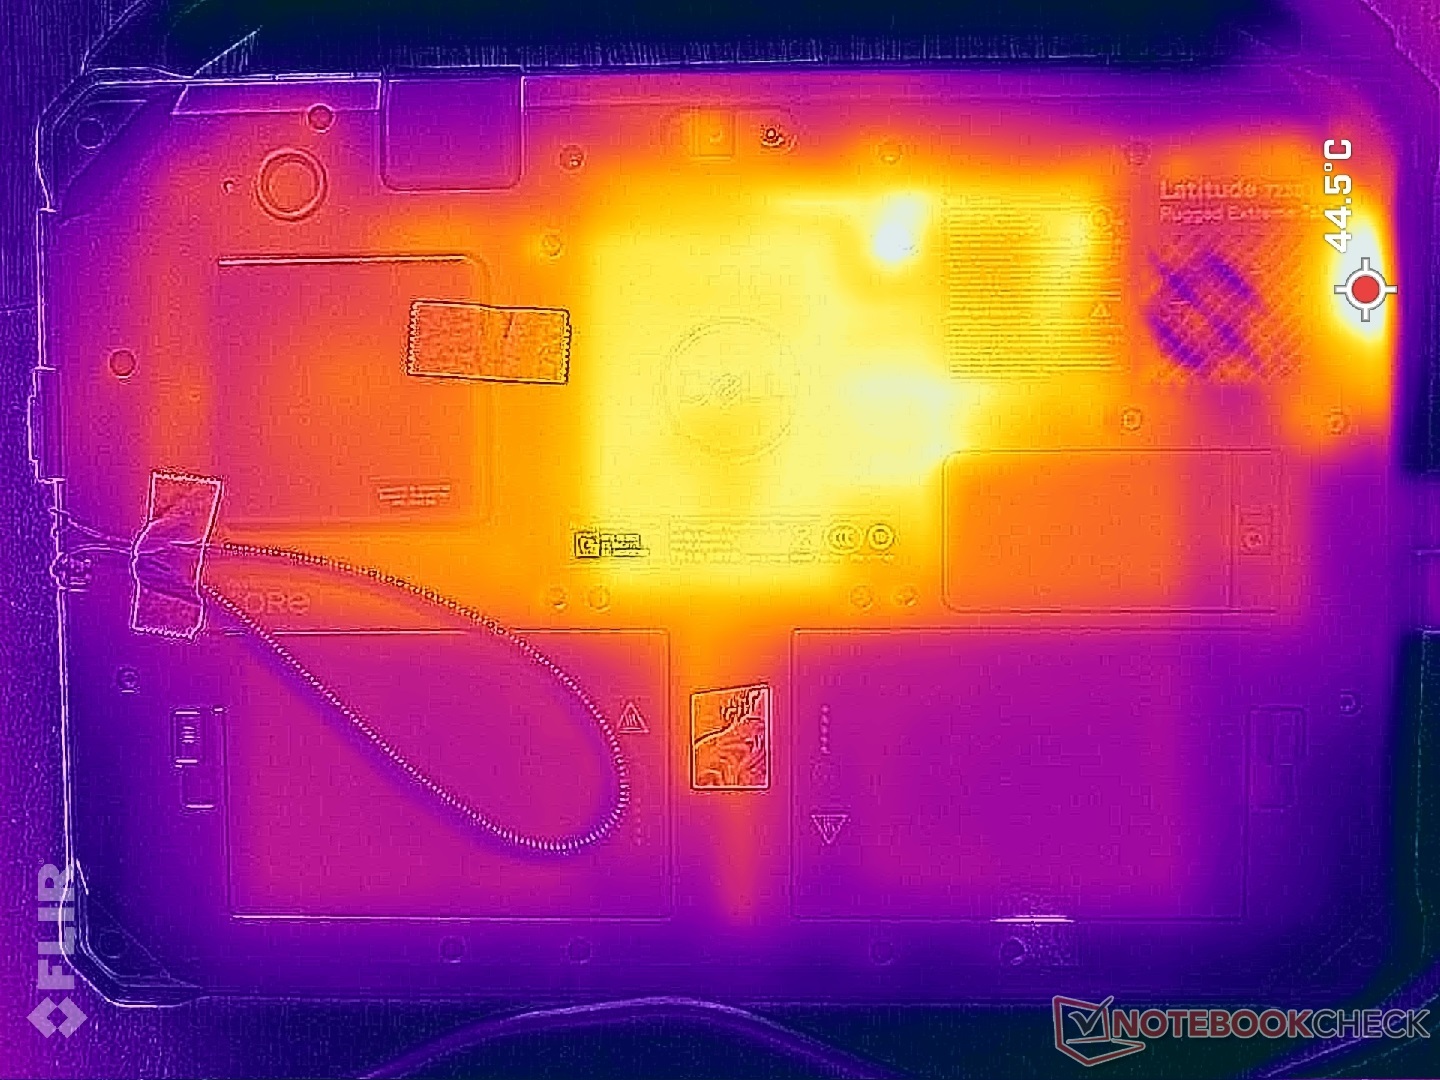
Yttemperaturer är inget problem på grund av den tjocka robusta profilen, precis som på de flesta andra robusta enheter. I värsta fall kan vi registrera en toppnotering på 40 C längs enhetens yttersta kant närmast ventilationsgallren när CPU:n är 100 procent utnyttjad.
(+) Den maximala temperaturen på ovansidan är 32.6 °C / 91 F, jämfört med genomsnittet av 33.7 °C / 93 F , allt från 20.7 till 53.2 °C för klassen Tablet.
(±) Botten värms upp till maximalt 40.2 °C / 104 F, jämfört med genomsnittet av 33.2 °C / 92 F
(+) Vid tomgångsbruk är medeltemperaturen för ovansidan 29 °C / 84 F, jämfört med enhetsgenomsnittet på 30 °C / ### class_avg_f### F.
| Dell Latitude 7230 Rugged Extreme Intel Core i5-1240U, Intel Iris Xe Graphics G7 80EUs | Dell Latitude 7330 Rugged Extreme Intel Core i7-1185G7, Intel Iris Xe Graphics G7 96EUs | Panasonic Toughbook 40 Intel Core i7-1185G7, Intel Iris Xe Graphics G7 96EUs | Getac B360 Intel Core i7-10710U, Intel UHD Graphics 620 | Acer Enduro Urban N3 EUN314 Intel Core i7-1165G7, Intel Iris Xe Graphics G7 96EUs | Durabook S14I Intel Core i7-1165G7, Intel Iris Xe Graphics G7 96EUs | |
|---|---|---|---|---|---|---|
| Heat | 13% | 4% | 10% | -1% | -3% | |
| Maximum Upper Side * (°C) | 32.6 | 34.6 -6% | 35.6 -9% | 33.4 -2% | 37.8 -16% | 36.4 -12% |
| Maximum Bottom * (°C) | 40.2 | 36.6 9% | 40 -0% | 42.6 -6% | 45.8 -14% | 38.6 4% |
| Idle Upper Side * (°C) | 30.6 | 24.8 19% | 28.6 7% | 24.2 21% | 26.4 14% | 32.6 -7% |
| Idle Bottom * (°C) | 35 | 25.2 28% | 29.4 16% | 26.2 25% | 30.2 14% | 33.8 3% |
* ... mindre är bättre
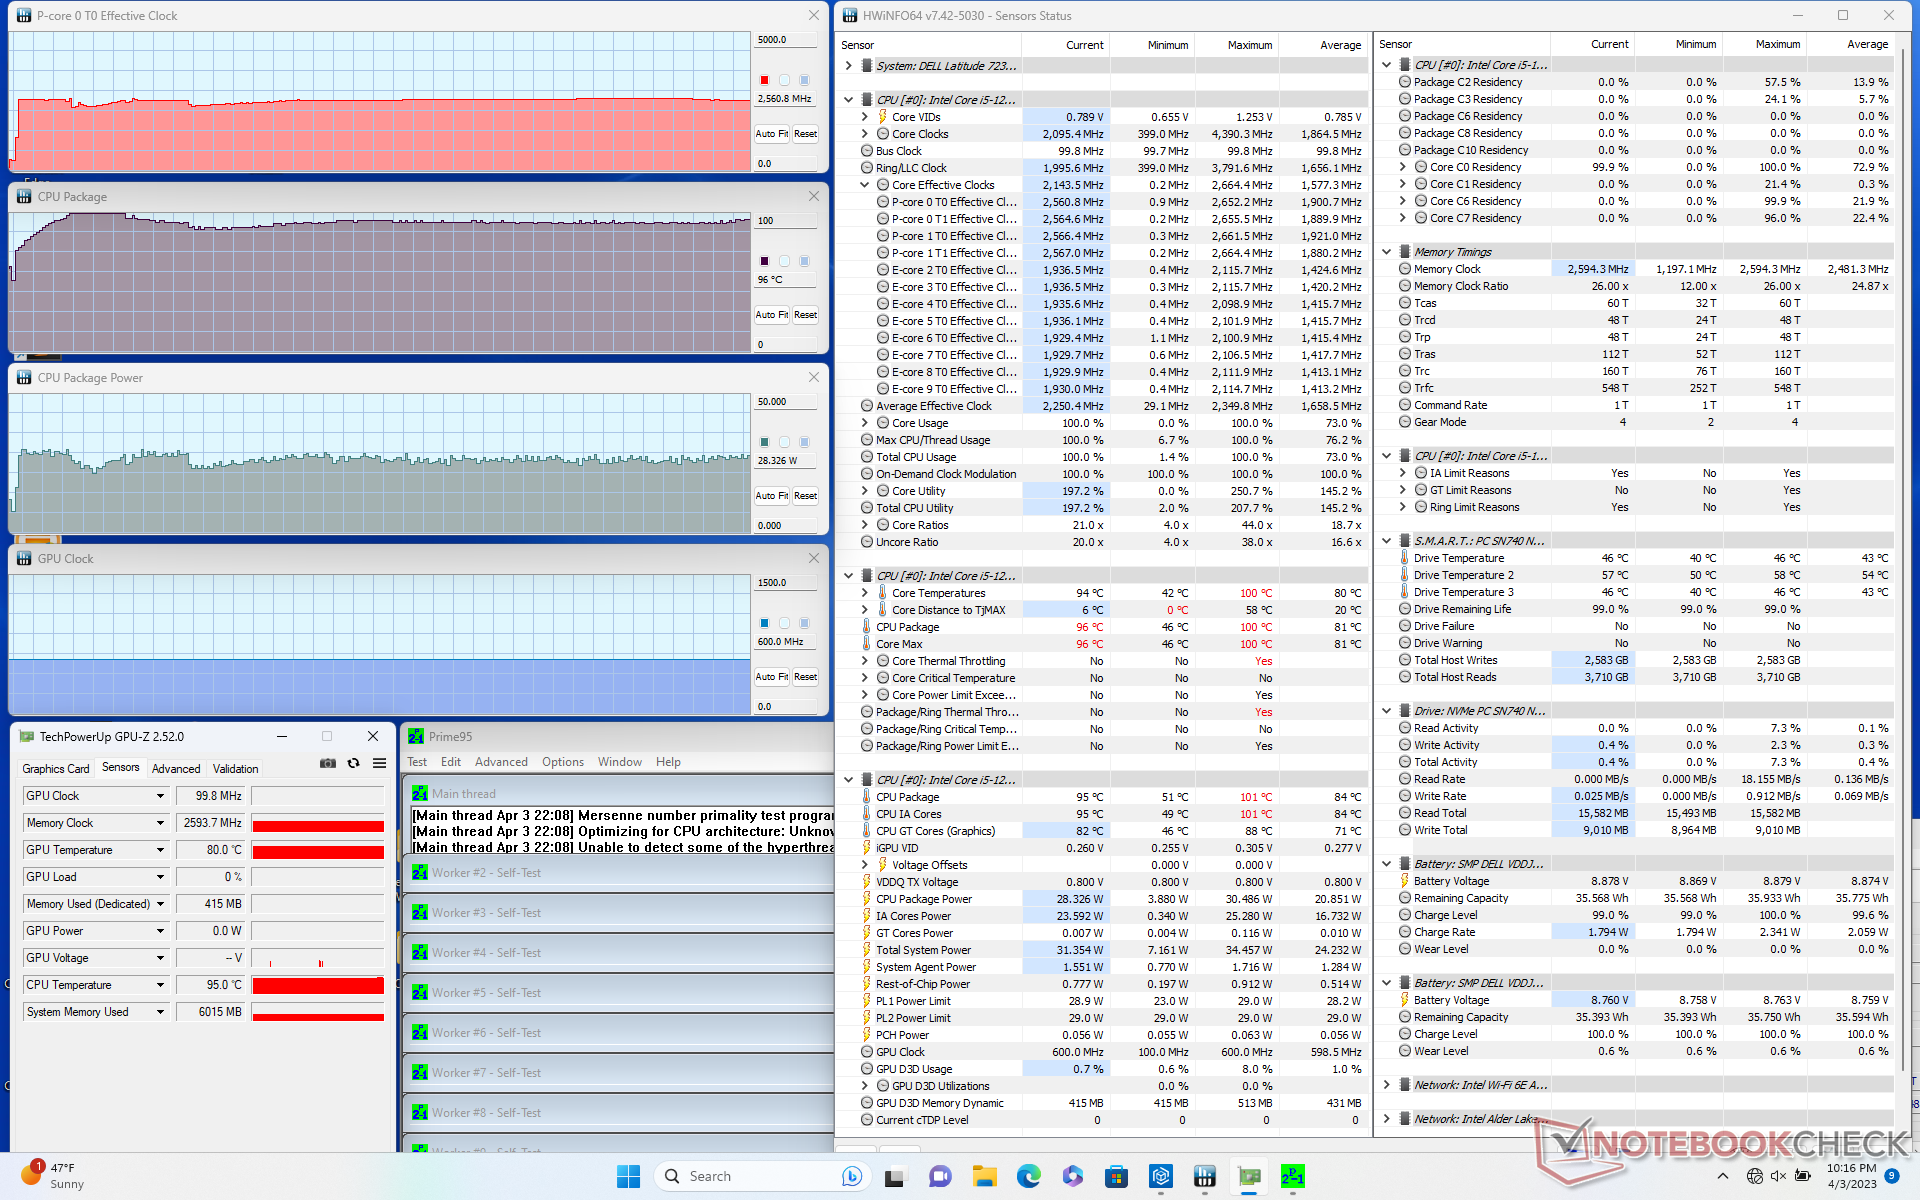
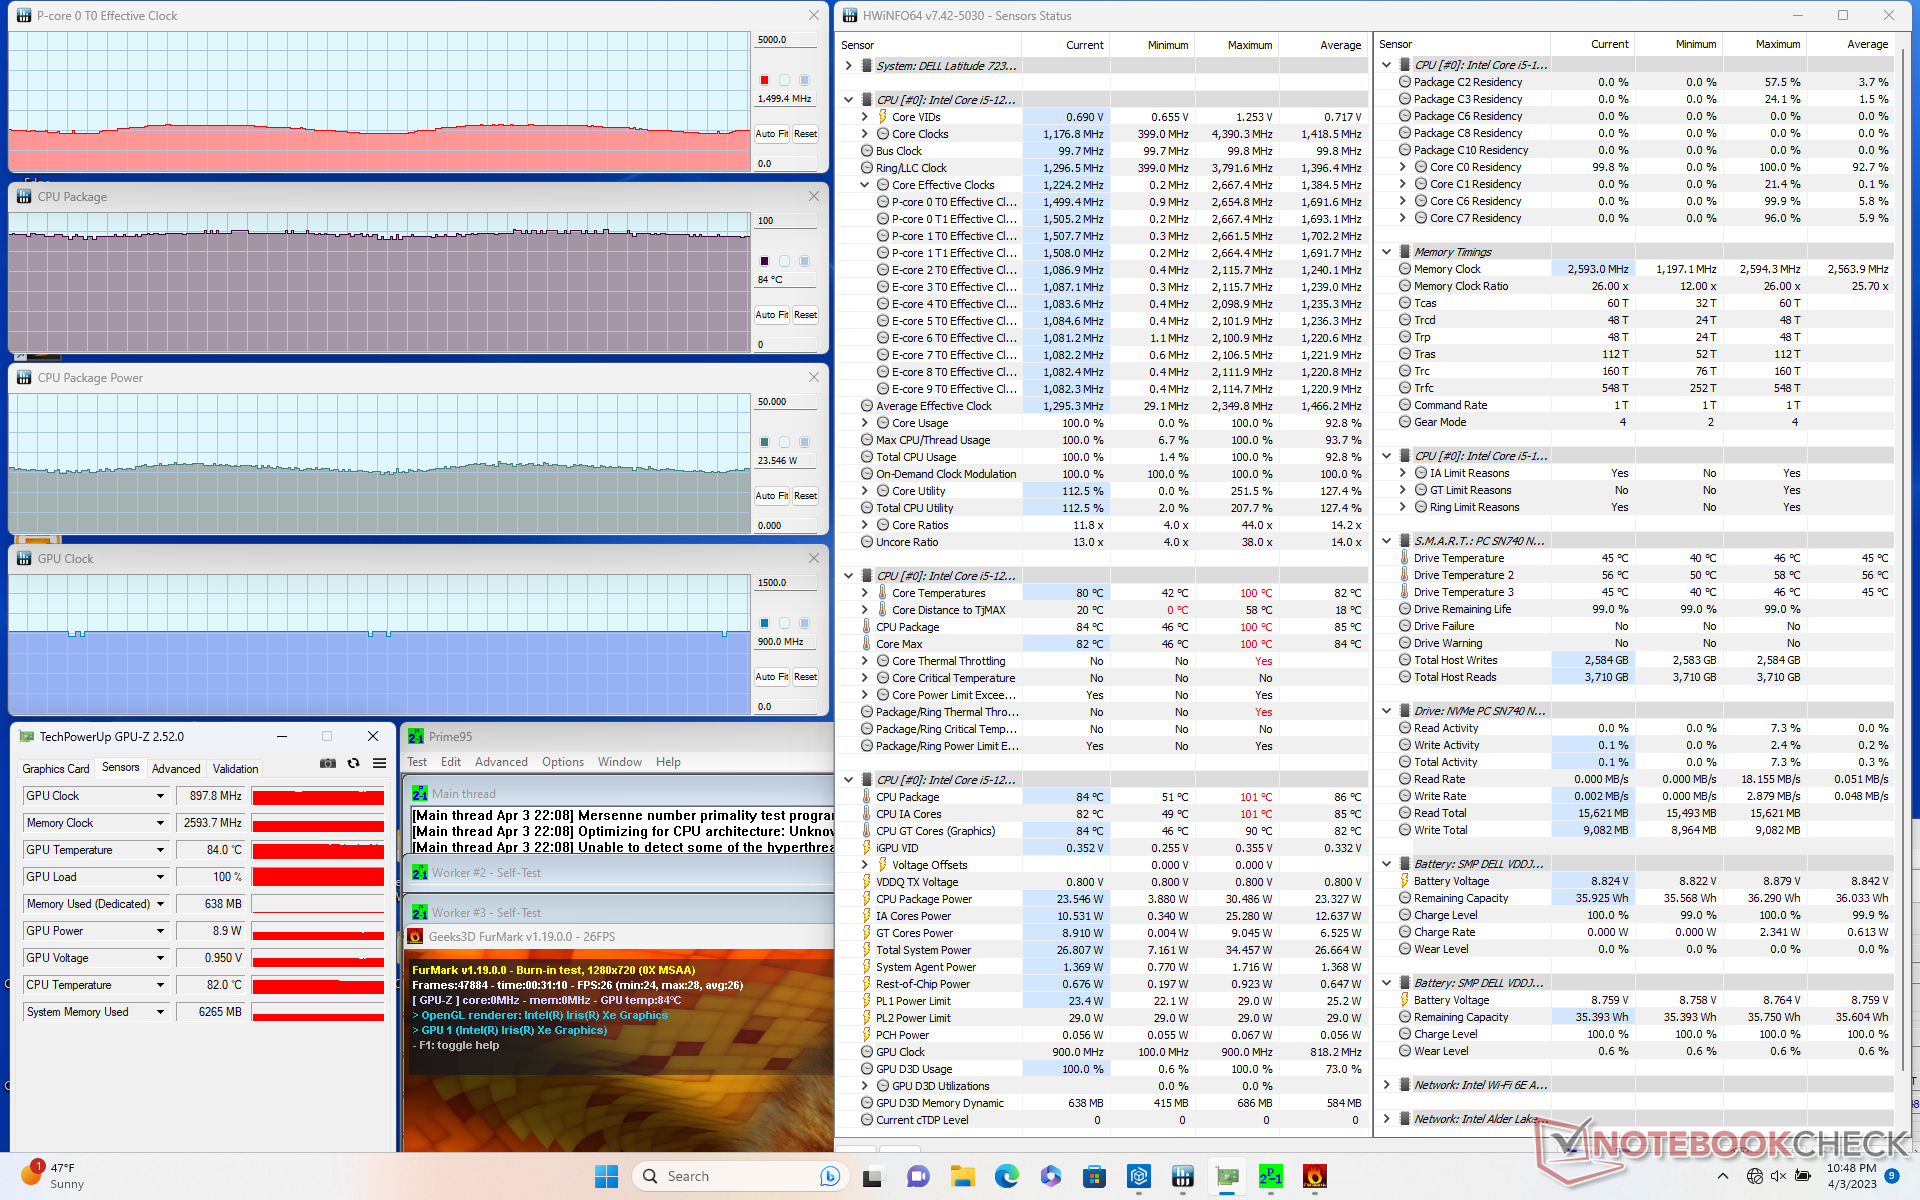
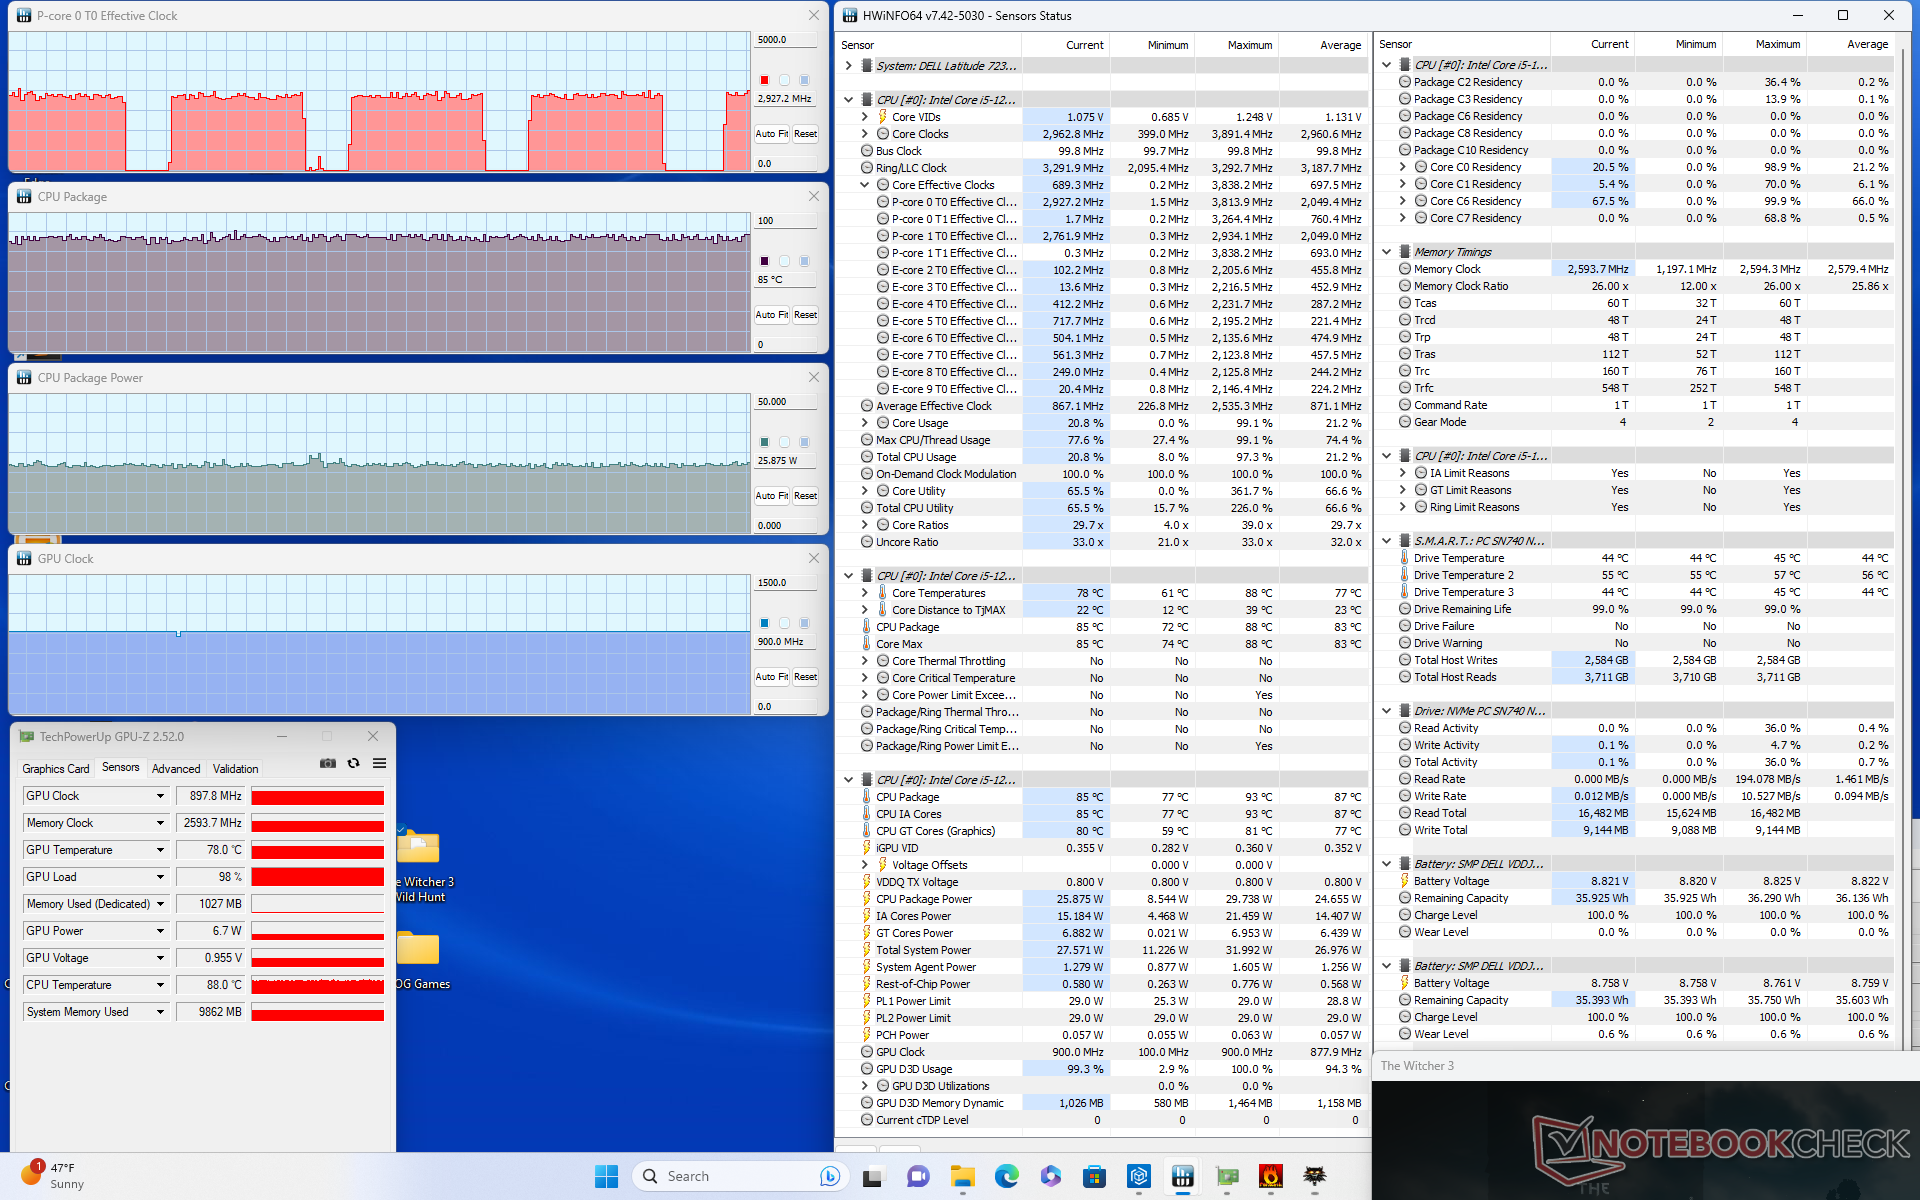
Stresstest
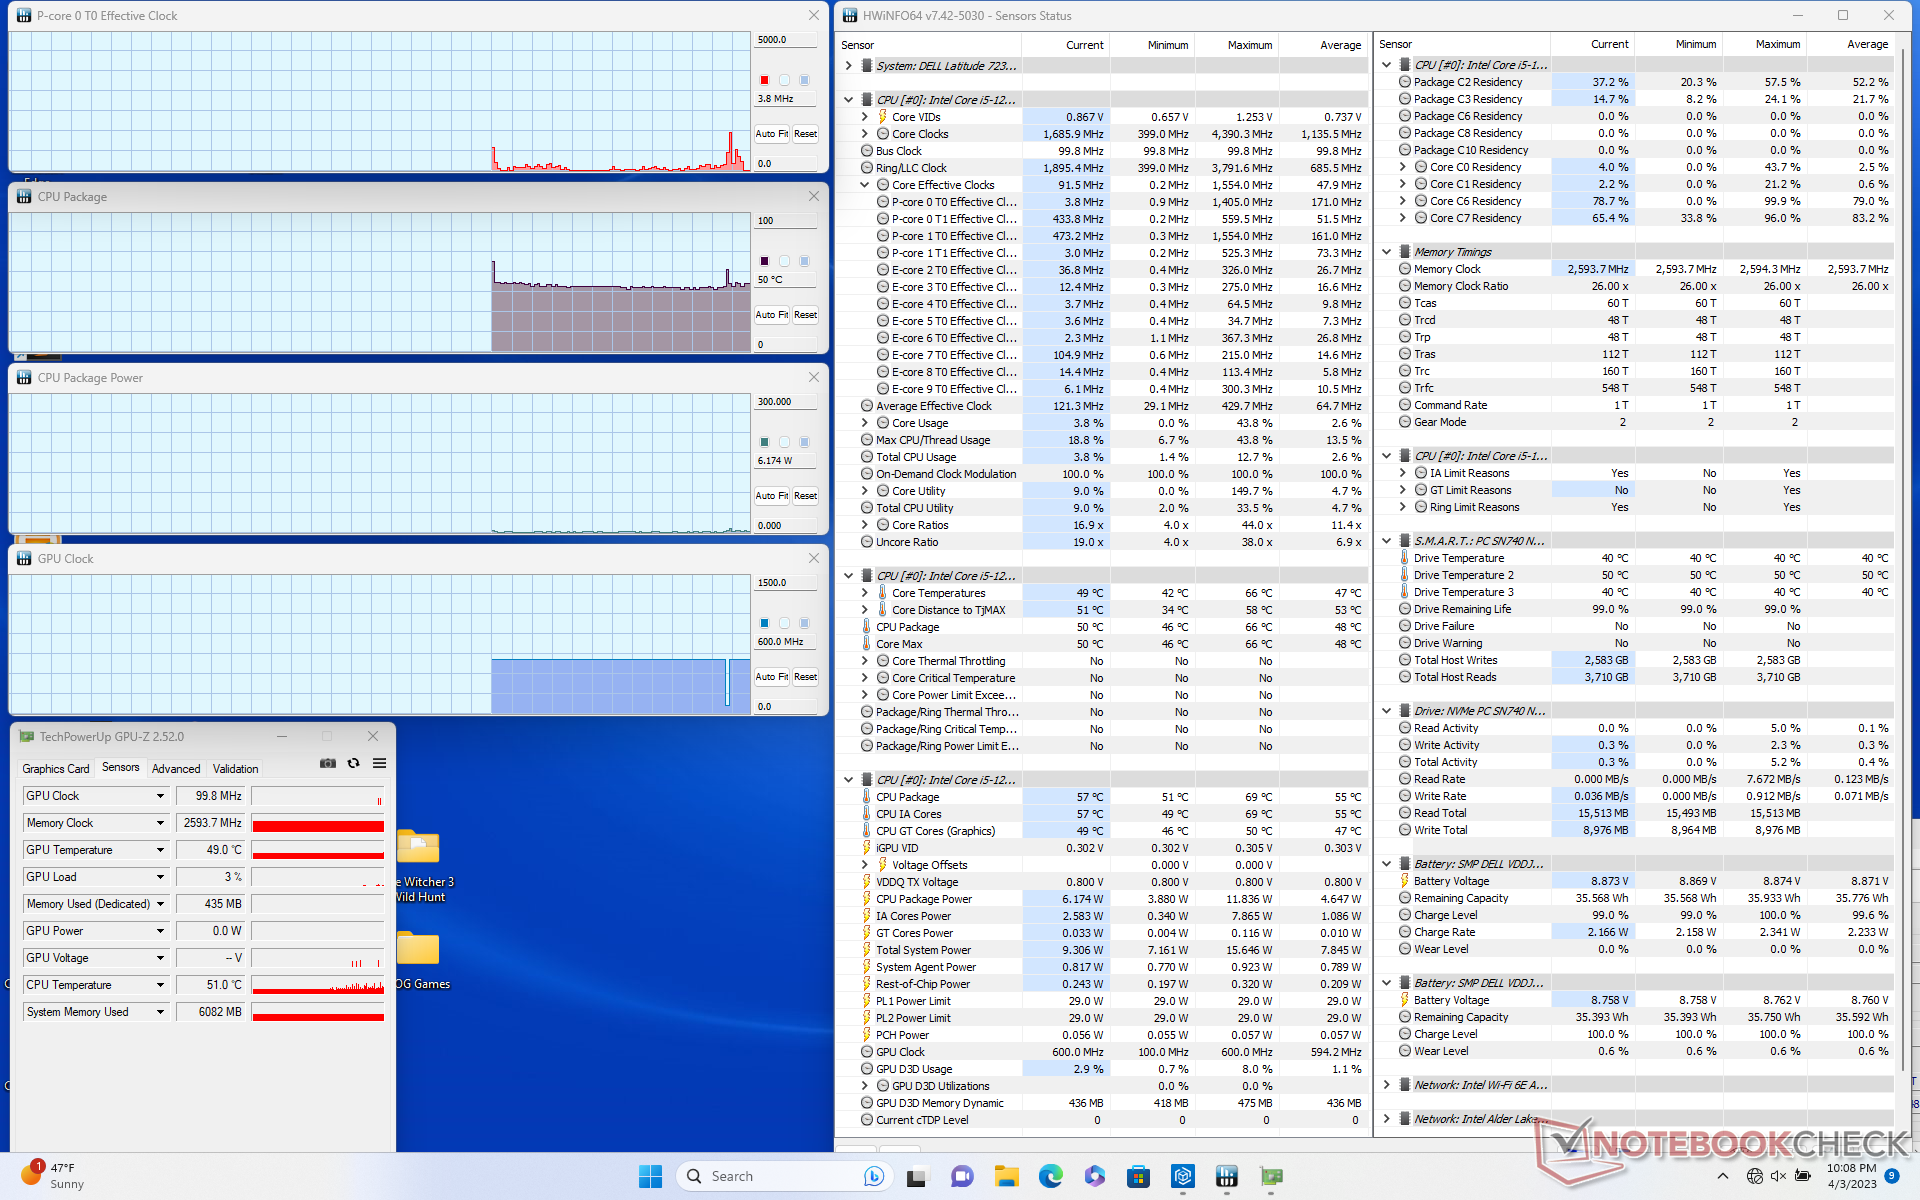
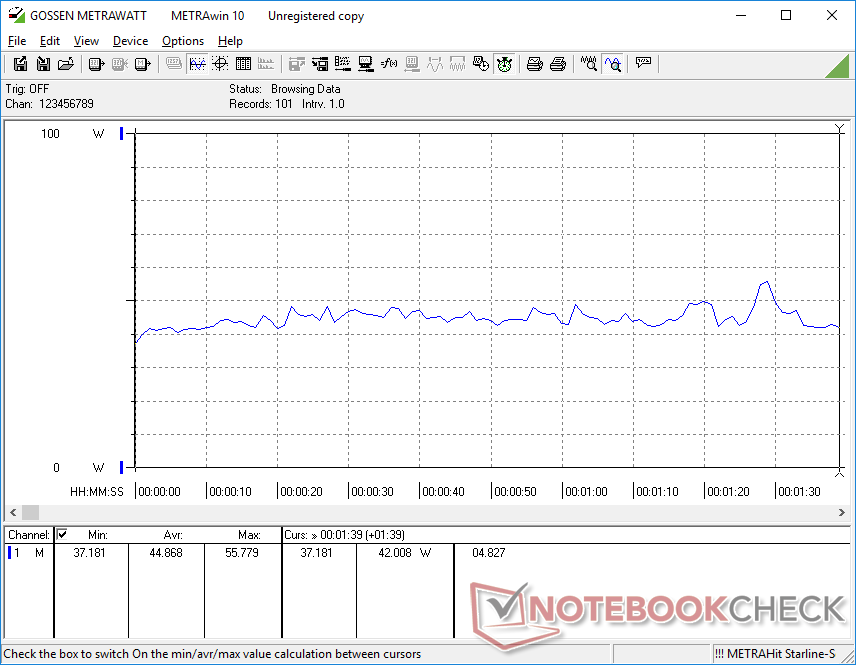
När Prime95 kördes för att stressa CPU:n ökade klockfrekvensen och strömförbrukningen på kortet till 2,6 GHz respektive 30 W, för att sedan sjunka något till 2,5 GHz och 26 W några sekunder senare. Kärnans temperatur skulle stabilisera sig på mycket höga 97 C vilket är varmare än vad vi skulle vilja. Om vi upprepar det här testet på den större Dell Latitude 7330 Rugged skulle det resultera i en mycket svalare kärntemperatur på bara 68 C.
Att köra på batteri påverkar CPU-prestanda något. Ett 3DMark 11-test på batterier skulle ge fysik- och grafikresultat på 10743 respektive 4041 poäng, jämfört med 12765 och 4053 poäng när den är på strömförsörjning.

| CPU-klocka (GHz) | GPU-klocka (MHz) | Genomsnittlig CPU-temperatur (°C) | |
| Systemets tomgång | -- | -- | 50 |
| Prime95 Stress | 2.6 | -- | 96 |
| Prime95 + FurMark Stress | 1,4 - 1,6 | 898 | 84 |
| Witcher 3 Stress (Ultra mode) | ~3,0 | 898 | 85 |
| Witcher 3 Stress (optimerat läge) | ~1,7 | 898 | 83 |
Högtalare
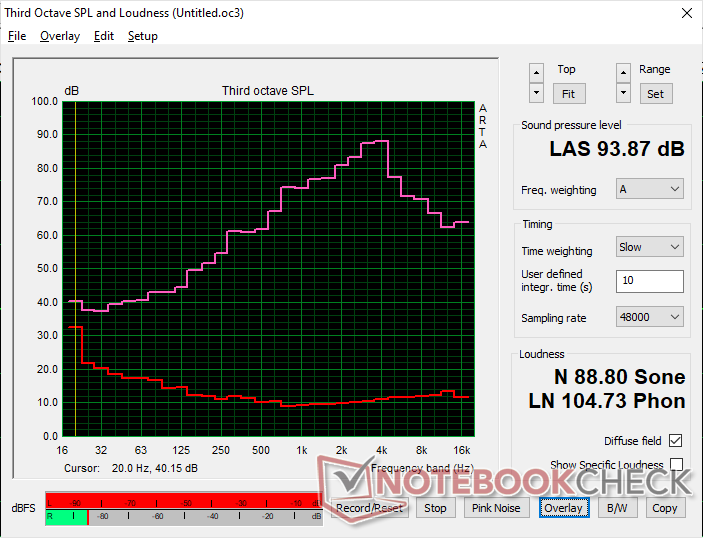
Dell Latitude 7230 Rugged Extreme ljudanalys
(+) | högtalare kan spela relativt högt (93.9 dB)
Bas 100 - 315 Hz
(-) | nästan ingen bas - i genomsnitt 19.9% lägre än medianen
(+) | basen är linjär (5.2% delta till föregående frekvens)
Mellan 400 - 2000 Hz
(±) | högre mellan - i genomsnitt 6.5% högre än median
(+) | mids är linjära (4.5% delta till föregående frekvens)
Högsta 2 - 16 kHz
(±) | högre toppar - i genomsnitt 8.4% högre än medianen
(±) | linjäriteten för toppar är genomsnittlig (7% delta till föregående frekvens)
Totalt 100 - 16 000 Hz
(±) | linjäriteten för det totala ljudet är genomsnittlig (19.4% skillnad mot median)
Jämfört med samma klass
» 54% av alla testade enheter i den här klassen var bättre, 7% liknande, 39% sämre
» Den bästa hade ett delta på 7%, genomsnittet var 20%, sämst var 129%
Jämfört med alla testade enheter
» 48% av alla testade enheter var bättre, 7% liknande, 45% sämre
» Den bästa hade ett delta på 4%, genomsnittet var 23%, sämst var 134%
Apple MacBook Pro 16 2021 M1 Pro ljudanalys
(+) | högtalare kan spela relativt högt (84.7 dB)
Bas 100 - 315 Hz
(+) | bra bas - bara 3.8% från medianen
(+) | basen är linjär (5.2% delta till föregående frekvens)
Mellan 400 - 2000 Hz
(+) | balanserad mellan - endast 1.3% från medianen
(+) | mids är linjära (2.1% delta till föregående frekvens)
Högsta 2 - 16 kHz
(+) | balanserade toppar - endast 1.9% från medianen
(+) | toppar är linjära (2.7% delta till föregående frekvens)
Totalt 100 - 16 000 Hz
(+) | det totala ljudet är linjärt (4.6% skillnad mot median)
Jämfört med samma klass
» 0% av alla testade enheter i den här klassen var bättre, 0% liknande, 100% sämre
» Den bästa hade ett delta på 5%, genomsnittet var 17%, sämst var 45%
Jämfört med alla testade enheter
» 0% av alla testade enheter var bättre, 0% liknande, 100% sämre
» Den bästa hade ett delta på 4%, genomsnittet var 23%, sämst var 134%
Energiförvaltning
Effektförbrukning
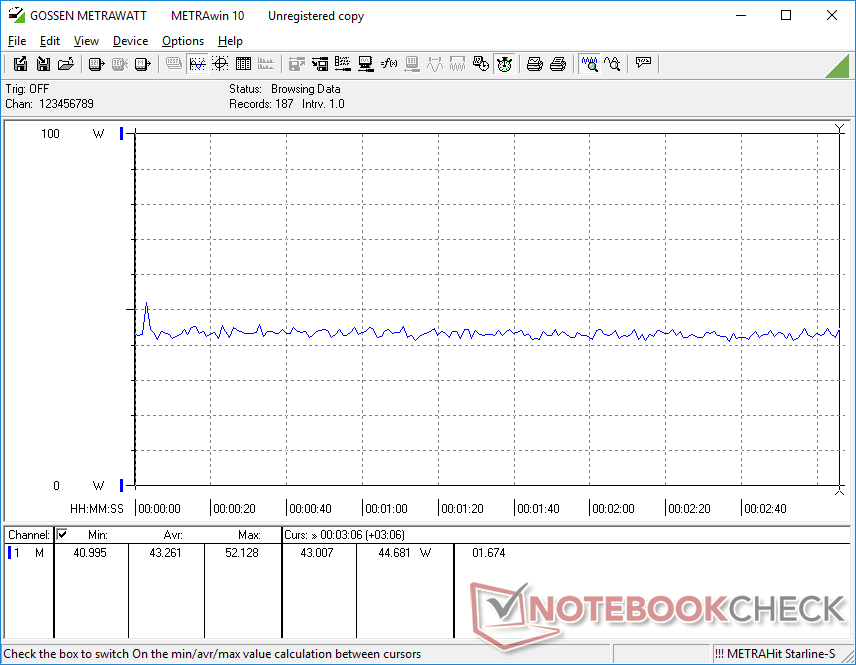
Strömförbrukningen är i stort sett densamma som för andra stryktåliga enheter med äldre 11:e generationens CPU:er, t.ex. Dell Latitude 7330 Rugged Extreme eller Panasonic Toughbook 40. Prestanda per watt kan dock vara mycket annorlunda. Mer specifikt kan vår Latitude 7230 Rugged erbjuda 40 till 50 procent snabbare processorprestanda än Core i7-1185G7 iDell Latitude 7330 Rugged utan att behöva förbruka mer ström. Å andra sidan är GPU-prestandan 30 till 40 procent långsammare.
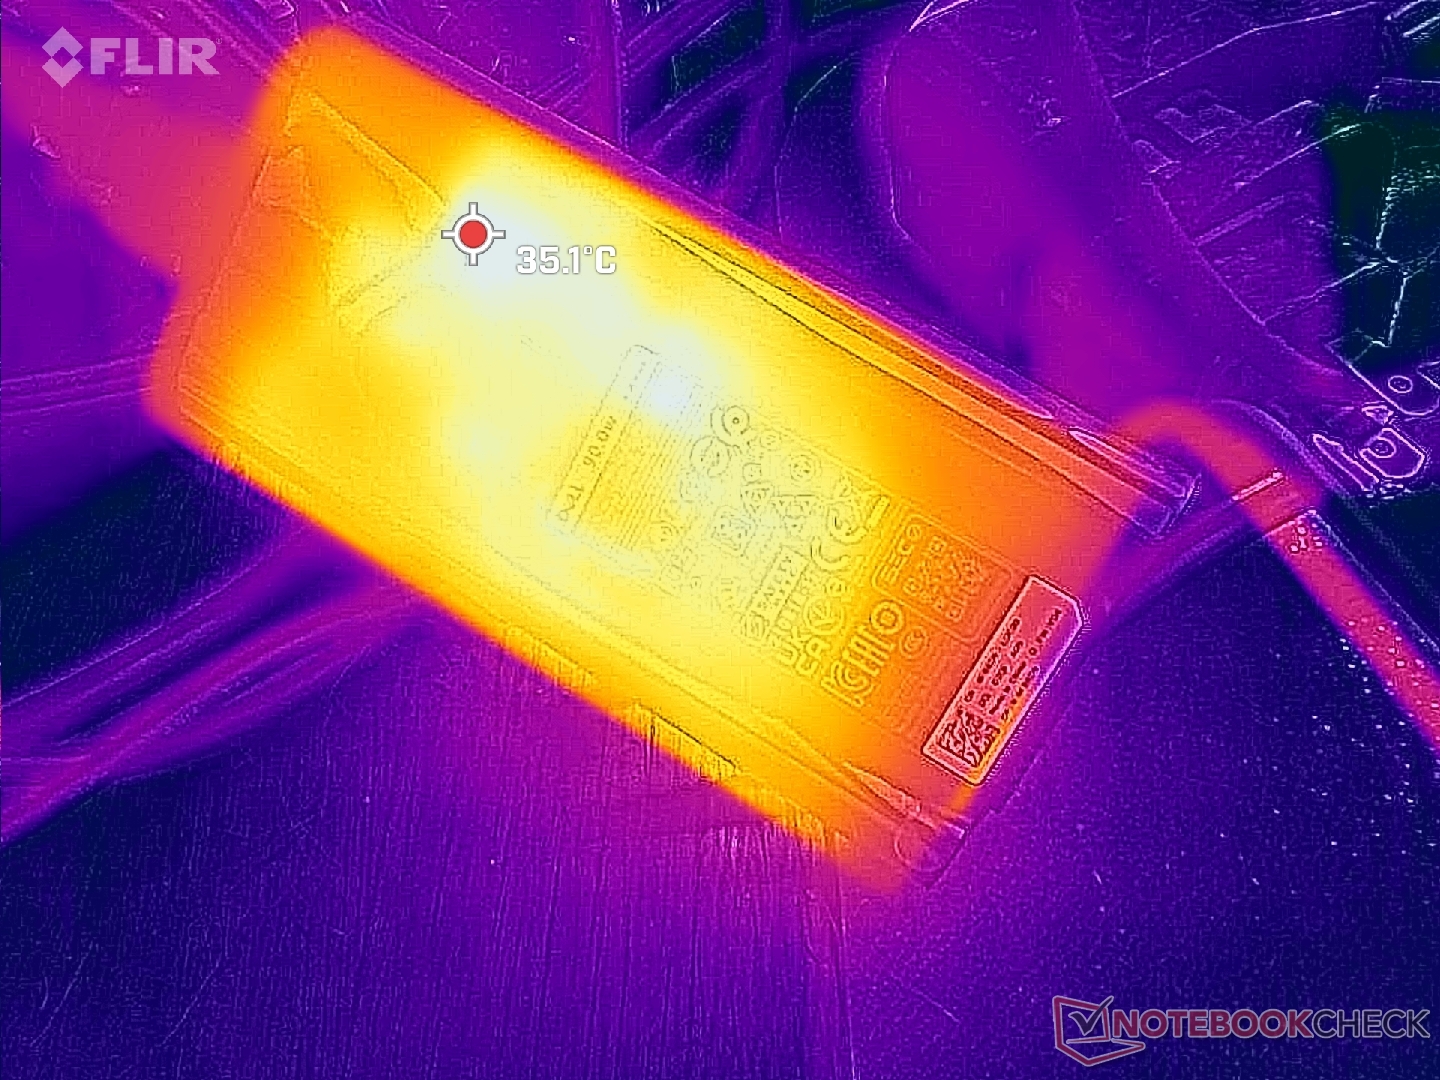
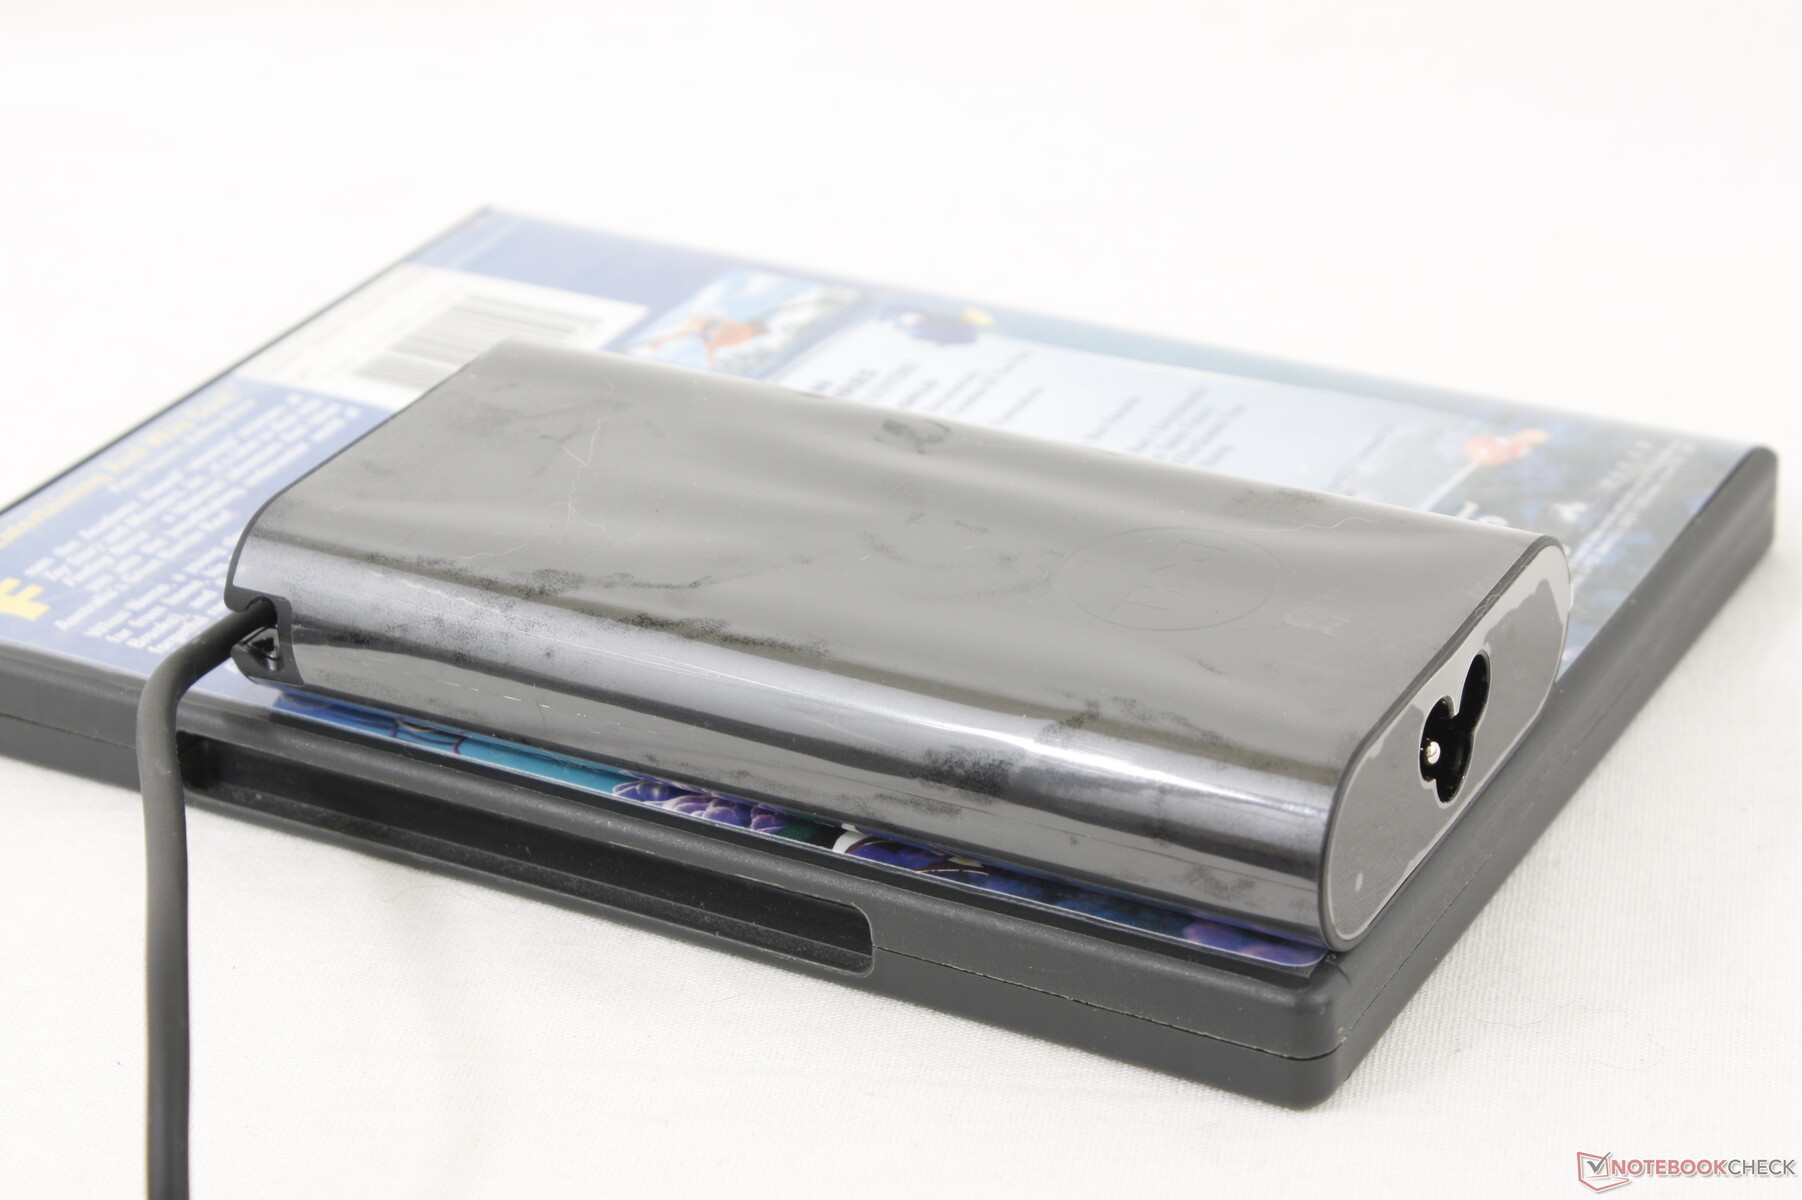
Vi kan registrera ett maximalt uttag på 55 W från den små-medelstora (~13 x 6,5 x 2,3 cm) 90 W USB-C AC-adaptern. Denna maximala avläsning är relativt låg jämfört med många Core i7-alternativ eftersom vår Core i5 har en lägre Turbo Boost-gräns. Observera att modellen levereras med samma nätadapter som finns på vissa bärbara XPS-datorer.
| Av/Standby | |
| Låg belastning | |
| Hög belastning |
|
Förklaring:
min: | |
| Dell Latitude 7230 Rugged Extreme i5-1240U, Iris Xe G7 80EUs, WD PC SN740 512GB SDDPMQD-512G-1101, IPS, 1920x1200, 12" | Dell Latitude 7330 Rugged Extreme i7-1185G7, Iris Xe G7 96EUs, , IPS, 1920x1080, 13.3" | Panasonic Toughbook 40 i7-1185G7, Iris Xe G7 96EUs, Samsung PM991 MZVLQ1T0HALB, IPS, 1920x1080, 14" | Getac B360 i7-10710U, UHD Graphics 620, Lite-On CA5-8D512, IPS, 1920x1080, 13.3" | Acer Enduro Urban N3 EUN314 i7-1165G7, Iris Xe G7 96EUs, Samsung PM991 MZVLQ1T0HALB, IPS, 1920x1080, 14" | Durabook S14I i7-1165G7, Iris Xe G7 96EUs, UDinfo M2P M2P80DE512GBAEP, TN, 1920x1080, 14" | |
|---|---|---|---|---|---|---|
| Power Consumption | -9% | -15% | -5% | 25% | -25% | |
| Idle Minimum * (Watt) | 6.5 | 4.1 37% | 4.9 25% | 5.4 17% | 3.8 42% | 6.8 -5% |
| Idle Average * (Watt) | 8.9 | 11.7 -31% | 12.3 -38% | 12.2 -37% | 8 10% | 16.4 -84% |
| Idle Maximum * (Watt) | 14.3 | 11.8 17% | 14 2% | 12.6 12% | 8.7 39% | 16.9 -18% |
| Load Average * (Watt) | 44.9 | 48.5 -8% | 54 -20% | 39.1 13% | 34.6 23% | 39.2 13% |
| Witcher 3 ultra * (Watt) | 43.2 | 44.3 -3% | 46.3 -7% | 36.5 16% | 35.4 18% | |
| Load Maximum * (Watt) | 54.8 | 91 -66% | 83.6 -53% | 81.8 -49% | 45.4 17% | 73.1 -33% |
* ... mindre är bättre
Power Consumption Witcher 3 / Stresstest
Power Consumption external Monitor
Batteritid - 3,5 timmar vid extrem användning
Upp till två utbytbara batterier stöds. WLAN-driftstiden är nästan 13 timmar när båda batterierna (36 Wh x2) är installerade. Å andra sidan bör körning av krävande belastningar på maximal ljusstyrka räcka i cirka 3,5 timmar.
Att ladda båda batterierna från tomt till fullt är tyvärr ganska långsamt, 4 till 5 timmar jämfört med 1,5 till 2 timmar på de flesta Ultrabooks.
| Dell Latitude 7230 Rugged Extreme i5-1240U, Iris Xe G7 80EUs, 72 Wh | Dell Latitude 7330 Rugged Extreme i7-1185G7, Iris Xe G7 96EUs, 107 Wh | Panasonic Toughbook 40 i7-1185G7, Iris Xe G7 96EUs, 136 Wh | Getac B360 i7-10710U, UHD Graphics 620, 46 Wh | Acer Enduro Urban N3 EUN314 i7-1165G7, Iris Xe G7 96EUs, 50.3 Wh | Durabook S14I i7-1165G7, Iris Xe G7 96EUs, 50 Wh | |
|---|---|---|---|---|---|---|
| Batteridrifttid | 38% | 46% | -38% | -51% | -58% | |
| WiFi v1.3 (h) | 13 | 18 38% | 19 46% | 8.1 -38% | 6.4 -51% | 5.5 -58% |
| Load (h) | 3.6 |
För
Emot
Bedömning - mestadels ett hemkörningsresultat
De utmärkande egenskaperna hos Latitude 7230 Rugged Extreme är dess fullständiga sRGB-täckning, snabba CPU-prestanda och låga vikt jämfört med andra stryktåliga surfplattor. De flesta alternativ har sämre färger och tjockare ramar i jämförelse.
Vi skulle vilja se förbättringar av portkåporna och knapparna på framsidan som är för hala respektive små. Dessa blir ännu svårare att hantera om du råkar bära handskar.
Den utmärkta batteritiden, den superblanka skärmen och den fullständiga sRGB-täckningen hos Latitude 7230 Rugged Extreme sätter standarden för framtida stryktåliga surfplattor.
Potentiella köpare bör komma ihåg att den billigare Core i5-1240U presterar på samma sätt som Core i7-1260U när det gäller CPU-prestanda. Användare bör alltså bara välja den senare om den snabbare grafikprestandan behövs. Räkna med att fläktljudet kommer att vara högre än vanligt om du planerar att köra mer krävande uppgifter på modellen.
Pris och tillgänglighet
Dell levererar nu Latitude 7230 Rugged Extreme från 2 700 USD för baskonfigurationen till över 5 000 USD om den är fullt konfigurerad. Vår granskningsenhet säljs för cirka 3200 dollar.
Dell Latitude 7230 Rugged Extreme
- 04/07/2023 v7 (old)
Allen Ngo
Genomskinlighet
Valet av enheter som ska granskas görs av vår redaktion. Testprovet gavs till författaren som ett lån av tillverkaren eller återförsäljaren för denna recension. Långivaren hade inget inflytande på denna recension och inte heller fick tillverkaren en kopia av denna recension innan publiceringen. Det fanns ingen skyldighet att publicera denna recension. Som ett oberoende medieföretag är Notebookcheck inte föremål för auktoritet från tillverkare, återförsäljare eller förlag.
This is how Notebookcheck is testingEvery year, Notebookcheck independently reviews hundreds of laptops and smartphones using standardized procedures to ensure that all results are comparable. We have continuously developed our test methods for around 20 years and set industry standards in the process. In our test labs, high-quality measuring equipment is utilized by experienced technicians and editors. These tests involve a multi-stage validation process. Our complex rating system is based on hundreds of well-founded measurements and benchmarks, which maintains objectivity.
Price comparison

