Test: Dell Latitude 14 5411 - Kontorslaptop med kraftfull GPU (Sammanfattning)
Testgrupp
Gradering | Datum | Modell | Vikt | Höjd | Storlek | Upplösning | Pris |
|---|---|---|---|---|---|---|---|
| 82.6 % v7 (old) | 02/2021 | Dell Latitude 14 5411-WJ40N i7-10850H, GeForce MX250 | 1.5 kg | 21 mm | 14.00" | 1920x1080 | |
| 85.3 % v7 (old) | 08/2020 | Lenovo Yoga Slim 7-14ARE R7 4800U, Vega 8 | 1.4 kg | 14.9 mm | 14.00" | 1920x1080 | |
| 84.5 % v7 (old) | 09/2020 | Honor MagicBook Pro (AMD) R5 4600H, Vega 6 | 1.7 kg | 16.9 mm | 16.10" | 1920x1080 | |
| 82.5 % v7 (old) | 12/2020 | MSI Prestige 14 Evo A11M-005 i7-1185G7, Iris Xe G7 96EUs | 1.2 kg | 16 mm | 14.00" | 1920x1080 | |
| 85.4 % v7 (old) | Dynabook Portégé X40-G-10K i5-10210U, UHD Graphics 620 | 1.3 kg | 16.9 mm | 14.00" | 1920x1080 |
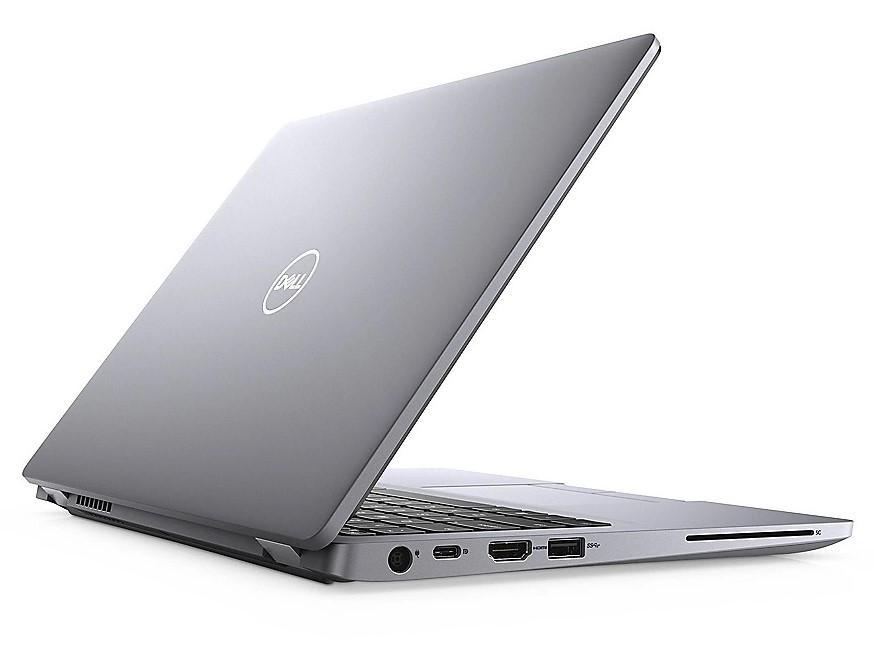
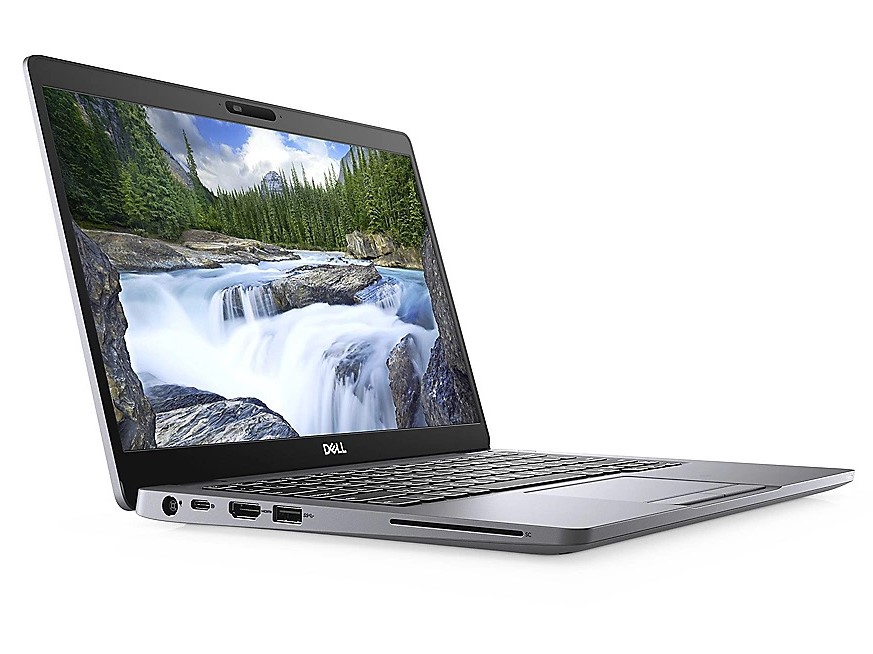
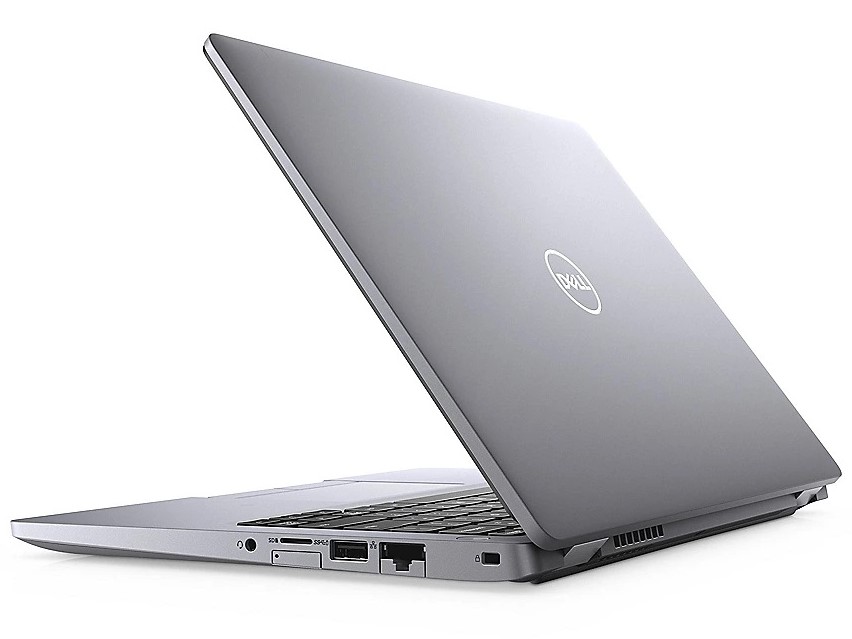
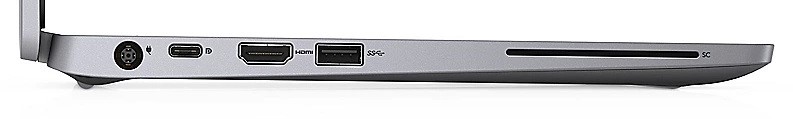
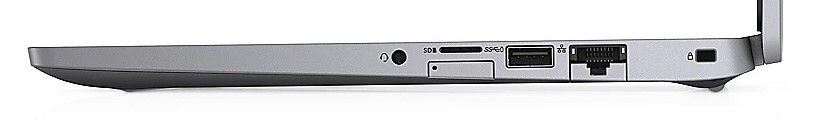
Portkonfiguration
| SD Card Reader | |
| average JPG Copy Test (av. of 3 runs) | |
| Dell Latitude 14 5411-WJ40N (Toshiba Exceria Pro M501 microSDXC 64GB) | |
| Dynabook Portégé X40-G-10K (Toshiba Exceria Pro M501 microSDXC 64GB) | |
| Genomsnitt av klass Office (19.8 - 198.5, n=22, senaste 2 åren) | |
| Lenovo Yoga Slim 7-14ARE (Toshiba Exceria Pro M501 64 GB UHS-II) | |
| maximum AS SSD Seq Read Test (1GB) | |
| Dell Latitude 14 5411-WJ40N (Toshiba Exceria Pro M501 microSDXC 64GB) | |
| Dynabook Portégé X40-G-10K (Toshiba Exceria Pro M501 microSDXC 64GB) | |
| Genomsnitt av klass Office (27.4 - 249, n=21, senaste 2 åren) | |
| Lenovo Yoga Slim 7-14ARE (Toshiba Exceria Pro M501 64 GB UHS-II) | |
| Networking | |
| iperf3 transmit AX12 | |
| Dell Latitude 14 5411-WJ40N | |
| Dynabook Portégé X40-G-10K | |
| Lenovo Yoga Slim 7-14ARE | |
| Genomsnitt Intel Wi-Fi 6 AX201 (49.8 - 1775, n=324) | |
| MSI Prestige 14 Evo A11M-005 | |
| Honor MagicBook Pro (AMD) | |
| iperf3 receive AX12 | |
| Dynabook Portégé X40-G-10K | |
| Dell Latitude 14 5411-WJ40N | |
| Lenovo Yoga Slim 7-14ARE | |
| Genomsnitt Intel Wi-Fi 6 AX201 (136 - 1743, n=324) | |
| MSI Prestige 14 Evo A11M-005 | |
| Honor MagicBook Pro (AMD) | |
| |||||||||||||||||||||||||
Distribution av ljusstyrkan: 86 %
Mitt på batteriet: 251 cd/m²
Kontrast: 1113:1 (Svärta: 0.23 cd/m²)
ΔE ColorChecker Calman: 5.76 | ∀{0.5-29.43 Ø4.71}
ΔE Greyscale Calman: 4 | ∀{0.09-98 Ø4.96}
56% sRGB (Argyll 1.6.3 3D)
36% AdobeRGB 1998 (Argyll 1.6.3 3D)
38.67% AdobeRGB 1998 (Argyll 3D)
56.2% sRGB (Argyll 3D)
37.43% Display P3 (Argyll 3D)
Gamma: 2.52
CCT: 6182 K
| Dell Latitude 14 5411-WJ40N AU Optronics AUO463D, IPS, 1920x1080, 14" | Lenovo Yoga Slim 7-14ARE AU Optronics B140HAN06.8, IPS, 1920x1080, 14" | Honor MagicBook Pro (AMD) N161HCA-EA3, IPS, 1920x1080, 16.1" | MSI Prestige 14 Evo A11M-005 AUO B140HAN06.2 (AUO623D), IPS-Level, 1920x1080, 14" | Dynabook Portégé X40-G-10K Toshiba TOS508F, IPS, 1920x1080, 14" | |
|---|---|---|---|---|---|
| Display | 86% | 61% | 81% | 75% | |
| Display P3 Coverage (%) | 37.43 | 71.7 92% | 67.5 80% | 68.8 84% | 66.1 77% |
| sRGB Coverage (%) | 56.2 | 99.3 77% | 69.7 24% | 99.4 77% | 96.1 71% |
| AdobeRGB 1998 Coverage (%) | 38.67 | 72.9 89% | 69.7 80% | 70.9 83% | 68 76% |
| Response Times | -79% | -52% | -113% | -56% | |
| Response Time Grey 50% / Grey 80% * (ms) | 31 ? | 45.6 ? -47% | 37.6 ? -21% | 59.6 ? -92% | 39 ? -26% |
| Response Time Black / White * (ms) | 14 ? | 29.6 ? -111% | 25.6 ? -83% | 32.8 ? -134% | 26 ? -86% |
| PWM Frequency (Hz) | 25250 ? | 24000 ? | |||
| Screen | 32% | 54% | 38% | 27% | |
| Brightness middle (cd/m²) | 256 | 399.6 56% | 337 32% | 293 14% | 408 59% |
| Brightness (cd/m²) | 236 | 385 63% | 312 32% | 277 17% | 372 58% |
| Brightness Distribution (%) | 86 | 89 3% | 89 3% | 89 3% | 85 -1% |
| Black Level * (cd/m²) | 0.23 | 0.37 -61% | 0.2 13% | 0.18 22% | 0.44 -91% |
| Contrast (:1) | 1113 | 1080 -3% | 1685 51% | 1628 46% | 927 -17% |
| Colorchecker dE 2000 * | 5.76 | 3.2 44% | 0.8 86% | 2.95 49% | 2.73 53% |
| Colorchecker dE 2000 max. * | 20.65 | 6.44 69% | 1.1 95% | 6.03 71% | 5.61 73% |
| Greyscale dE 2000 * | 4 | 4.7 -18% | 1 75% | 4.2 -5% | 4.13 -3% |
| Gamma | 2.52 87% | 2.21 100% | 2.2 100% | 2.099 105% | 2.46 89% |
| CCT | 6182 105% | 7184 90% | 6538 99% | 6622 98% | 5862 111% |
| Color Space (Percent of AdobeRGB 1998) (%) | 36 | 66.3 84% | 63.8 77% | 71 97% | 62 72% |
| Color Space (Percent of sRGB) (%) | 56 | 99.5 78% | 99.5 78% | 93 66% | 96 71% |
| Colorchecker dE 2000 calibrated * | 1.73 | 0.7 | 0.9 | ||
| Totalt genomsnitt (program/inställningar) | 13% /
28% | 21% /
41% | 2% /
27% | 15% /
26% |
* ... mindre är bättre
Visa svarstider
| ↔ Svarstid svart till vitt | ||
|---|---|---|
| 14 ms ... stiga ↗ och falla ↘ kombinerat | ↗ 4 ms stiga | 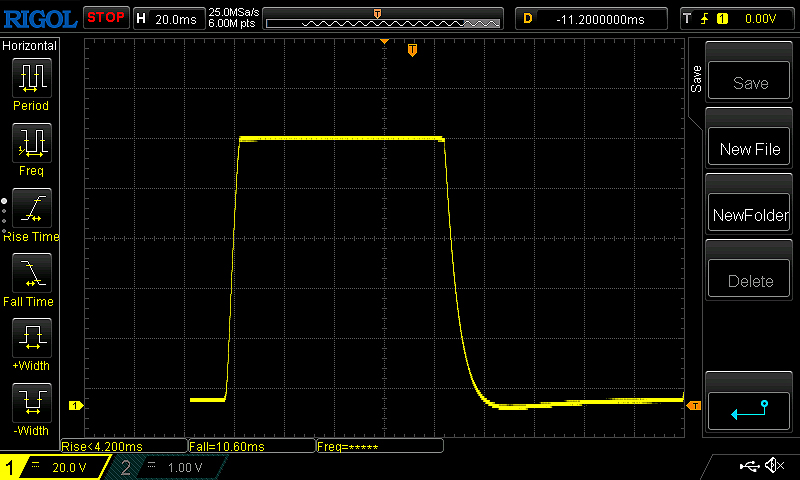 |
| ↘ 10 ms hösten | ||
| Skärmen visar bra svarsfrekvens i våra tester, men kan vara för långsam för konkurrenskraftiga spelare. I jämförelse sträcker sig alla testade enheter från 0.1 (minst) till 240 (maximalt) ms. » 34 % av alla enheter är bättre. Det betyder att den uppmätta svarstiden är bättre än genomsnittet av alla testade enheter (19.8 ms). | ||
| ↔ Svarstid 50 % grått till 80 % grått | ||
| 31 ms ... stiga ↗ och falla ↘ kombinerat | ↗ 9 ms stiga | 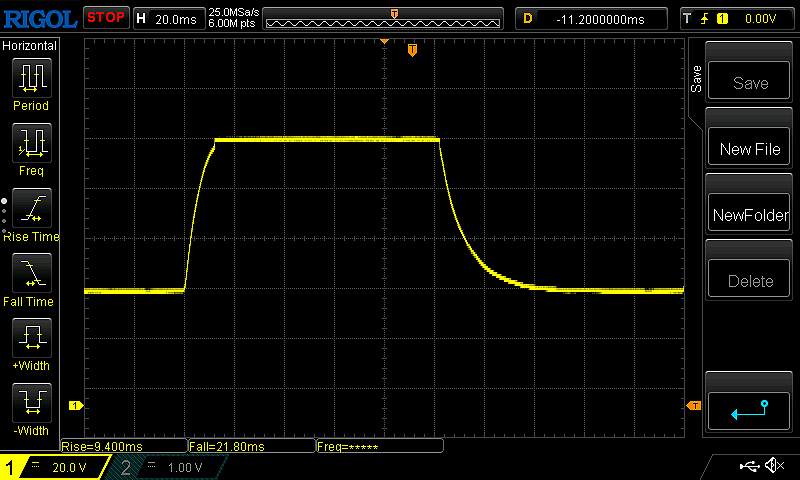 |
| ↘ 22 ms hösten | ||
| Skärmen visar långsamma svarsfrekvenser i våra tester och kommer att vara otillfredsställande för spelare. I jämförelse sträcker sig alla testade enheter från 0.165 (minst) till 636 (maximalt) ms. » 42 % av alla enheter är bättre. Det betyder att den uppmätta svarstiden liknar genomsnittet av alla testade enheter (31 ms). | ||
Skärmflimmer / PWM (Puls-Width Modulation)
| Skärmflimmer / PWM upptäcktes inte |  | ||
Som jämförelse: 52 % av alla testade enheter använder inte PWM för att dämpa skärmen. Om PWM upptäcktes mättes ett medelvärde av 7757 (minst: 5 - maximum: 343500) Hz. | |||
Cinebench R15: CPU Single 64Bit | CPU Multi 64Bit
Blender: v2.79 BMW27 CPU
7-Zip 18.03: 7z b 4 -mmt1 | 7z b 4
Geekbench 5.5: Single-Core | Multi-Core
HWBOT x265 Benchmark v2.2: 4k Preset
LibreOffice : 20 Documents To PDF
R Benchmark 2.5: Overall mean
| Cinebench R20 / CPU (Single Core) | |
| Genomsnitt av klass Office (345 - 816, n=75, senaste 2 åren) | |
| MSI Prestige 14 Evo A11M-005 | |
| Dell Latitude 14 5411-WJ40N | |
| Genomsnitt Intel Core i7-10850H (n=1) | |
| Lenovo Yoga Slim 7-14ARE | |
| Honor MagicBook Pro (AMD) | |
| Dynabook Portégé X40-G-10K | |
| Cinebench R20 / CPU (Multi Core) | |
| Genomsnitt av klass Office (648 - 8840, n=75, senaste 2 åren) | |
| Honor MagicBook Pro (AMD) | |
| Lenovo Yoga Slim 7-14ARE | |
| Dell Latitude 14 5411-WJ40N | |
| Genomsnitt Intel Core i7-10850H (n=1) | |
| MSI Prestige 14 Evo A11M-005 | |
| Dynabook Portégé X40-G-10K | |
| Cinebench R15 / CPU Single 64Bit | |
| Genomsnitt av klass Office (99.5 - 316, n=77, senaste 2 åren) | |
| MSI Prestige 14 Evo A11M-005 | |
| Dell Latitude 14 5411-WJ40N | |
| Genomsnitt Intel Core i7-10850H (n=1) | |
| Lenovo Yoga Slim 7-14ARE | |
| Honor MagicBook Pro (AMD) | |
| Dynabook Portégé X40-G-10K | |
| Cinebench R15 / CPU Multi 64Bit | |
| Genomsnitt av klass Office (250 - 3380, n=77, senaste 2 åren) | |
| Lenovo Yoga Slim 7-14ARE | |
| Honor MagicBook Pro (AMD) | |
| Dell Latitude 14 5411-WJ40N | |
| Genomsnitt Intel Core i7-10850H (n=1) | |
| MSI Prestige 14 Evo A11M-005 | |
| Dynabook Portégé X40-G-10K | |
| Blender / v2.79 BMW27 CPU | |
| Dynabook Portégé X40-G-10K | |
| MSI Prestige 14 Evo A11M-005 | |
| Dell Latitude 14 5411-WJ40N | |
| Genomsnitt Intel Core i7-10850H (n=1) | |
| Honor MagicBook Pro (AMD) | |
| Genomsnitt av klass Office (158 - 1940, n=76, senaste 2 åren) | |
| Lenovo Yoga Slim 7-14ARE | |
| 7-Zip 18.03 / 7z b 4 -mmt1 | |
| Genomsnitt av klass Office (3387 - 6469, n=77, senaste 2 åren) | |
| Dell Latitude 14 5411-WJ40N | |
| Genomsnitt Intel Core i7-10850H (n=1) | |
| MSI Prestige 14 Evo A11M-005 | |
| Lenovo Yoga Slim 7-14ARE | |
| Dynabook Portégé X40-G-10K | |
| Honor MagicBook Pro (AMD) | |
| 7-Zip 18.03 / 7z b 4 | |
| Lenovo Yoga Slim 7-14ARE | |
| Genomsnitt av klass Office (7098 - 76886, n=77, senaste 2 åren) | |
| Honor MagicBook Pro (AMD) | |
| Dell Latitude 14 5411-WJ40N | |
| Genomsnitt Intel Core i7-10850H (n=1) | |
| MSI Prestige 14 Evo A11M-005 | |
| Dynabook Portégé X40-G-10K | |
| Geekbench 5.5 / Single-Core | |
| Genomsnitt av klass Office (811 - 2175, n=73, senaste 2 åren) | |
| MSI Prestige 14 Evo A11M-005 | |
| Dell Latitude 14 5411-WJ40N | |
| Genomsnitt Intel Core i7-10850H (n=1) | |
| Lenovo Yoga Slim 7-14ARE | |
| Lenovo Yoga Slim 7-14ARE | |
| Honor MagicBook Pro (AMD) | |
| Dynabook Portégé X40-G-10K | |
| Geekbench 5.5 / Multi-Core | |
| Genomsnitt av klass Office (1483 - 16999, n=73, senaste 2 åren) | |
| Lenovo Yoga Slim 7-14ARE | |
| Lenovo Yoga Slim 7-14ARE | |
| Honor MagicBook Pro (AMD) | |
| Dell Latitude 14 5411-WJ40N | |
| Genomsnitt Intel Core i7-10850H (n=1) | |
| MSI Prestige 14 Evo A11M-005 | |
| Dynabook Portégé X40-G-10K | |
| HWBOT x265 Benchmark v2.2 / 4k Preset | |
| Genomsnitt av klass Office (2.21 - 26, n=76, senaste 2 åren) | |
| Lenovo Yoga Slim 7-14ARE | |
| Honor MagicBook Pro (AMD) | |
| Dell Latitude 14 5411-WJ40N | |
| Genomsnitt Intel Core i7-10850H (n=1) | |
| MSI Prestige 14 Evo A11M-005 | |
| Dynabook Portégé X40-G-10K | |
| LibreOffice / 20 Documents To PDF | |
| Dynabook Portégé X40-G-10K | |
| Honor MagicBook Pro (AMD) | |
| Lenovo Yoga Slim 7-14ARE | |
| Genomsnitt av klass Office (39.9 - 102.3, n=76, senaste 2 åren) | |
| MSI Prestige 14 Evo A11M-005 | |
| Dell Latitude 14 5411-WJ40N | |
| Genomsnitt Intel Core i7-10850H (n=1) | |
| R Benchmark 2.5 / Overall mean | |
| Dynabook Portégé X40-G-10K | |
| Honor MagicBook Pro (AMD) | |
| Lenovo Yoga Slim 7-14ARE | |
| Dell Latitude 14 5411-WJ40N | |
| Genomsnitt Intel Core i7-10850H (n=1) | |
| MSI Prestige 14 Evo A11M-005 | |
| Genomsnitt av klass Office (0.393 - 0.888, n=76, senaste 2 åren) | |
* ... mindre är bättre
| PCMark 10 Score | 4725 poäng | |
Hjälp | ||
| DPC Latencies / LatencyMon - interrupt to process latency (max), Web, Youtube, Prime95 | |
| Dell Latitude 14 5411-WJ40N | |
| Dynabook Portégé X40-G-10K | |
| Lenovo Yoga Slim 7-14ARE | |
| Honor MagicBook Pro (AMD) | |
| MSI Prestige 14 Evo A11M-005 | |
* ... mindre är bättre
| Dell Latitude 14 5411-WJ40N SK Hynix PC611 512GB | Lenovo Yoga Slim 7-14ARE Samsung SSD PM981a MZVLB512HBJQ | Honor MagicBook Pro (AMD) WDC PC SN730 SDBPNTY-512G | MSI Prestige 14 Evo A11M-005 Phison 512GB SM280512GKBB4S-E162 | Dynabook Portégé X40-G-10K Samsung SSD PM981a MZVLB256HBHQ | Genomsnitt SK Hynix PC611 512GB | Genomsnitt av klass Office | |
|---|---|---|---|---|---|---|---|
| CrystalDiskMark 5.2 / 6 | 23% | 2% | 43% | -5% | -1% | 48% | |
| Write 4K (MB/s) | 125.9 | 146.1 16% | 156.9 25% | 248.4 97% | 149.1 18% | 124.6 ? -1% | 153.2 ? 22% |
| Read 4K (MB/s) | 42.45 | 47.18 11% | 48.81 15% | 56.4 33% | 45.53 7% | 42.2 ? -1% | 73.4 ? 73% |
| Write Seq (MB/s) | 2064 | 2896 40% | 1050 -49% | 2513 22% | 1845 -11% | 2059 ? 0% | 2531 ? 23% |
| Read Seq (MB/s) | 1627 | 2754 69% | 2517 55% | 2250 38% | 1359 -16% | 1622 ? 0% | 3292 ? 102% |
| Write 4K Q32T1 (MB/s) | 419.8 | 425.8 1% | 408.7 -3% | 589 40% | 302.2 -28% | 416 ? -1% | 431 ? 3% |
| Read 4K Q32T1 (MB/s) | 382.1 | 514 35% | 504 32% | 696 82% | 382.2 0% | 380 ? -1% | 516 ? 35% |
| Write Seq Q32T1 (MB/s) | 2729 | 2989 10% | 1087 -60% | 2515 -8% | 2351 -14% | 2717 ? 0% | 4178 ? 53% |
| Read Seq Q32T1 (MB/s) | 3441 | 3568 4% | 3407 -1% | 4915 43% | 3527 2% | 3442 ? 0% | 6043 ? 76% |
| AS SSD | 5% | 23% | 27% | -24% | -18% | 8% | |
| Seq Read (MB/s) | 2681 | 1658 -38% | 2749 3% | 3760 40% | 2421 -10% | 2377 ? -11% | 4326 ? 61% |
| Seq Write (MB/s) | 1430 | 2464 72% | 2348 64% | 2335 63% | 1316 -8% | 1458 ? 2% | 2771 ? 94% |
| 4K Read (MB/s) | 49.22 | 59.5 21% | 44.22 -10% | 66.8 36% | 49.42 0% | 48.3 ? -2% | 58.1 ? 18% |
| 4K Write (MB/s) | 118 | 128.6 9% | 140.5 19% | 184.3 56% | 120.5 2% | 117.8 ? 0% | 162.6 ? 38% |
| 4K-64 Read (MB/s) | 1139 | 1576 38% | 1450 27% | 1801 58% | 648 -43% | 1053 ? -8% | 958 ? -16% |
| 4K-64 Write (MB/s) | 1488 | 1986 33% | 2346 58% | 1754 18% | 601 -60% | 1102 ? -26% | 1643 ? 10% |
| Access Time Read * (ms) | 0.057 | 0.049 14% | 0.079 -39% | 0.135 -137% | 0.061 -7% | 0.057 ? -0% | 0.08448 ? -48% |
| Access Time Write * (ms) | 0.031 | 0.087 -181% | 0.027 13% | 0.018 42% | 0.034 -10% | 0.0635 ? -105% | 0.05931 ? -91% |
| Score Read (Points) | 1456 | 1802 24% | 1769 21% | 2244 54% | 940 -35% | 1339 ? -8% | 1449 ? 0% |
| Score Write (Points) | 1749 | 2361 35% | 2721 56% | 2172 24% | 853 -51% | 1365 ? -22% | 2083 ? 19% |
| Score Total (Points) | 3895 | 5133 32% | 5376 38% | 5500 41% | 2233 -43% | 3352 ? -14% | 4207 ? 8% |
| Totalt genomsnitt (program/inställningar) | 14% /
13% | 13% /
14% | 35% /
34% | -15% /
-16% | -10% /
-10% | 28% /
25% |
* ... mindre är bättre

DiskSpd Read Loop, Queue Depth 8
| 3DMark 11 - 1280x720 Performance GPU | |
| Genomsnitt av klass Office (2551 - 18313, n=72, senaste 2 åren) | |
| MSI Prestige 14 Evo A11M-005 | |
| Lenovo Yoga Slim 7-14ARE | |
| Dell Latitude 14 5411-WJ40N | |
| Honor MagicBook Pro (AMD) | |
| Genomsnitt NVIDIA GeForce MX250 (3585 - 4942, n=29) | |
| Dynabook Portégé X40-G-10K | |
| 3DMark | |
| 1920x1080 Fire Strike Graphics | |
| Genomsnitt av klass Office (736 - 21871, n=75, senaste 2 åren) | |
| MSI Prestige 14 Evo A11M-005 | |
| Lenovo Yoga Slim 7-14ARE | |
| Dell Latitude 14 5411-WJ40N | |
| Genomsnitt NVIDIA GeForce MX250 (2939 - 3885, n=29) | |
| Honor MagicBook Pro (AMD) | |
| Dynabook Portégé X40-G-10K | |
| 1280x720 Cloud Gate Standard Graphics | |
| Genomsnitt av klass Office (11640 - 118515, n=38, senaste 2 åren) | |
| MSI Prestige 14 Evo A11M-005 | |
| Lenovo Yoga Slim 7-14ARE | |
| Dell Latitude 14 5411-WJ40N | |
| Genomsnitt NVIDIA GeForce MX250 (13805 - 23863, n=25) | |
| Dynabook Portégé X40-G-10K | |
| 2560x1440 Time Spy Graphics | |
| Genomsnitt av klass Office (493 - 6679, n=70, senaste 2 åren) | |
| MSI Prestige 14 Evo A11M-005 | |
| Lenovo Yoga Slim 7-14ARE | |
| Dell Latitude 14 5411-WJ40N | |
| Genomsnitt NVIDIA GeForce MX250 (881 - 1169, n=22) | |
| Honor MagicBook Pro (AMD) | |
| 3DMark 06 Standard Score | 28611 poäng | |
| 3DMark 11 Performance | 5052 poäng | |
| 3DMark Cloud Gate Standard Score | 15697 poäng | |
| 3DMark Fire Strike Score | 3541 poäng | |
| 3DMark Time Spy Score | 1308 poäng | |
Hjälp | ||
| The Witcher 3 | |
| 1024x768 Low Graphics & Postprocessing | |
| MSI Prestige 14 Evo A11M-005 | |
| Genomsnitt av klass Office (32.2 - 135, n=3, senaste 2 åren) | |
| Lenovo Yoga Slim 7-14ARE | |
| Genomsnitt NVIDIA GeForce MX250 (47.4 - 70, n=24) | |
| Honor MagicBook Pro (AMD) | |
| Dell Latitude 14 5411-WJ40N | |
| 1366x768 Medium Graphics & Postprocessing | |
| MSI Prestige 14 Evo A11M-005 | |
| Genomsnitt av klass Office (44.7 - 90.4, n=3, senaste 2 åren) | |
| Dell Latitude 14 5411-WJ40N | |
| Genomsnitt NVIDIA GeForce MX250 (30 - 40, n=27) | |
| 1920x1080 High Graphics & Postprocessing (Nvidia HairWorks Off) | |
| Genomsnitt av klass Office (23.7 - 53.4, n=3, senaste 2 åren) | |
| MSI Prestige 14 Evo A11M-005 | |
| Lenovo Yoga Slim 7-14ARE | |
| Dell Latitude 14 5411-WJ40N | |
| Genomsnitt NVIDIA GeForce MX250 (16.3 - 23.1, n=27) | |
| Honor MagicBook Pro (AMD) | |
| 1920x1080 Ultra Graphics & Postprocessing (HBAO+) | |
| Genomsnitt av klass Office (14.8 - 28.1, n=3, senaste 2 åren) | |
| MSI Prestige 14 Evo A11M-005 | |
| Lenovo Yoga Slim 7-14ARE | |
| Genomsnitt NVIDIA GeForce MX250 (9 - 16, n=24) | |
| Far Cry 5 - 1280x720 Low Preset AA:T | |
| Genomsnitt av klass Office (38 - 99, n=13, senaste 2 åren) | |
| Genomsnitt NVIDIA GeForce MX250 (38 - 45, n=3) | |
| Honor MagicBook Pro (AMD) | |
| Dota 2 Reborn | |
| 1280x720 min (0/3) fastest | |
| Dell Latitude 14 5411-WJ40N | |
| Genomsnitt av klass Office (32.2 - 174.1, n=77, senaste 2 åren) | |
| Genomsnitt NVIDIA GeForce MX250 (71 - 131, n=21) | |
| Honor MagicBook Pro (AMD) | |
| Lenovo Yoga Slim 7-14ARE | |
| MSI Prestige 14 Evo A11M-005 | |
| Dynabook Portégé X40-G-10K | |
| 1366x768 med (1/3) | |
| Dell Latitude 14 5411-WJ40N | |
| Genomsnitt NVIDIA GeForce MX250 (21.8 - 109, n=21) | |
| Honor MagicBook Pro (AMD) | |
| Genomsnitt av klass Office (31.2 - 152, n=77, senaste 2 åren) | |
| Lenovo Yoga Slim 7-14ARE | |
| MSI Prestige 14 Evo A11M-005 | |
| Dynabook Portégé X40-G-10K | |
| 1920x1080 high (2/3) | |
| Dell Latitude 14 5411-WJ40N | |
| Genomsnitt NVIDIA GeForce MX250 (8.6 - 77.4, n=21) | |
| Genomsnitt av klass Office (16.2 - 143.3, n=77, senaste 2 åren) | |
| Lenovo Yoga Slim 7-14ARE | |
| MSI Prestige 14 Evo A11M-005 | |
| Honor MagicBook Pro (AMD) | |
| Dynabook Portégé X40-G-10K | |
| Final Fantasy XV Benchmark - 1280x720 Lite Quality | |
| Genomsnitt av klass Office (16.5 - 171.2, n=73, senaste 2 åren) | |
| Dell Latitude 14 5411-WJ40N | |
| Lenovo Yoga Slim 7-14ARE | |
| Genomsnitt NVIDIA GeForce MX250 (33.7 - 41, n=5) | |
| X-Plane 11.11 - 1280x720 low (fps_test=1) | |
| Dell Latitude 14 5411-WJ40N | |
| Genomsnitt NVIDIA GeForce MX250 (18.8 - 73.6, n=17) | |
| MSI Prestige 14 Evo A11M-005 | |
| Genomsnitt av klass Office (20.7 - 105.6, n=73, senaste 2 åren) | |
| Honor MagicBook Pro (AMD) | |
| Lenovo Yoga Slim 7-14ARE | |
| Dynabook Portégé X40-G-10K | |
| låg | med. | hög | ultra | |
|---|---|---|---|---|
| The Witcher 3 (2015) | 50 | 36 | 21 | |
| Dota 2 Reborn (2015) | 129 | 109 | 75.5 | 67.5 |
| Final Fantasy XV Benchmark (2018) | 41 | 19 | ||
| X-Plane 11.11 (2018) | 73.6 | 57 | 52.6 |
Ljudnivå
| Låg belastning |
| 25 / 25 / 30.5 dB(A) |
| Hög belastning |
| 45.3 / 46.1 dB(A) |
 | ||
30 dB tyst 40 dB(A) hörbar 50 dB(A) högt ljud |
||
min: | ||
(±) Den maximala temperaturen på ovansidan är 44.7 °C / 112 F, jämfört med genomsnittet av 34.3 °C / 94 F , allt från 21.2 till 62.5 °C för klassen Office.
(-) Botten värms upp till maximalt 46.3 °C / 115 F, jämfört med genomsnittet av 36.8 °C / 98 F
(+) Vid tomgångsbruk är medeltemperaturen för ovansidan 24.3 °C / 76 F, jämfört med enhetsgenomsnittet på 29.5 °C / ### class_avg_f### F.
(+) Handledsstöden och pekplattan är kallare än hudtemperaturen med maximalt 27.8 °C / 82 F och är därför svala att ta på.
(±) Medeltemperaturen för handledsstödsområdet på liknande enheter var 27.5 °C / 81.5 F (-0.3 °C / -0.5 F).
Dell Latitude 14 5411-WJ40N ljudanalys
(±) | högtalarljudstyrkan är genomsnittlig men bra (74.8 dB)
Bas 100 - 315 Hz
(-) | nästan ingen bas - i genomsnitt 20.6% lägre än medianen
(±) | linjäriteten för basen är genomsnittlig (8.5% delta till föregående frekvens)
Mellan 400 - 2000 Hz
(+) | balanserad mellan - endast 4.6% från medianen
(+) | mids är linjära (6.5% delta till föregående frekvens)
Högsta 2 - 16 kHz
(+) | balanserade toppar - endast 4.4% från medianen
(+) | toppar är linjära (4.7% delta till föregående frekvens)
Totalt 100 - 16 000 Hz
(±) | linjäriteten för det totala ljudet är genomsnittlig (17% skillnad mot median)
Jämfört med samma klass
» 24% av alla testade enheter i den här klassen var bättre, 7% liknande, 68% sämre
» Den bästa hade ett delta på 7%, genomsnittet var 21%, sämst var 53%
Jämfört med alla testade enheter
» 31% av alla testade enheter var bättre, 8% liknande, 61% sämre
» Den bästa hade ett delta på 4%, genomsnittet var 23%, sämst var 134%
Apple MacBook 12 (Early 2016) 1.1 GHz ljudanalys
(+) | högtalare kan spela relativt högt (83.6 dB)
Bas 100 - 315 Hz
(±) | reducerad bas - i genomsnitt 11.3% lägre än medianen
(±) | linjäriteten för basen är genomsnittlig (14.2% delta till föregående frekvens)
Mellan 400 - 2000 Hz
(+) | balanserad mellan - endast 2.4% från medianen
(+) | mids är linjära (5.5% delta till föregående frekvens)
Högsta 2 - 16 kHz
(+) | balanserade toppar - endast 2% från medianen
(+) | toppar är linjära (4.5% delta till föregående frekvens)
Totalt 100 - 16 000 Hz
(+) | det totala ljudet är linjärt (10.2% skillnad mot median)
Jämfört med samma klass
» 7% av alla testade enheter i den här klassen var bättre, 2% liknande, 90% sämre
» Den bästa hade ett delta på 5%, genomsnittet var 18%, sämst var 53%
Jämfört med alla testade enheter
» 5% av alla testade enheter var bättre, 1% liknande, 94% sämre
» Den bästa hade ett delta på 4%, genomsnittet var 23%, sämst var 134%
| Av/Standby | |
| Låg belastning | |
| Hög belastning |
|
Förklaring:
min: | |
| Battery Runtime - WiFi Websurfing | |
| Genomsnitt av klass Office (3.83 - 31.5, n=77, senaste 2 åren) | |
| Lenovo Yoga Slim 7-14ARE | |
| Honor MagicBook Pro (AMD) | |
| Dell Latitude 14 5411-WJ40N | |
| Dynabook Portégé X40-G-10K | |
| MSI Prestige 14 Evo A11M-005 | |
För
Emot
Omdöme - Massor av prestanda i ett kompakt hölje

Läs den fullständiga versionen av den här recensionen på engelska här.
Dell Latitude 14 5411 passar bra för den som inte vill vara utan avancerade företagsfunktioner som Smart Card-läsare och möjlighet att lägga till WWAN. Den konfiguration vi testade kom med en Core i7-10850H CPU: en kraftfull processor som åtminstone kan hålla samma nivå som rivalerna från AMD när det kommer till enkelkärnig prestanda. Tack vare bra servicemöjligheter går det också att installera mer RAM eller en WWAN-modul i efterhand.
Dell Latitude 14 5411 har en kraftfull CPU i ett kompakt hölje. Men skärmen kunde varit en aning bättre.
Latitude 14 ser lite kraftigare ut jämfört med konkurrenterna och har framför allt en lite sämre skärm. I synnerhet har andra enheter högre ljusstyrka och ett bredare färgomfång. Som så ofta är fallet med Dells Latitude-enheter får den också kämpa med hög latens. Men den som letar efter en kraftfull CPU i en kompakt laptop kan nog ändå bli nöjd med Dell Latitude 14 5411.
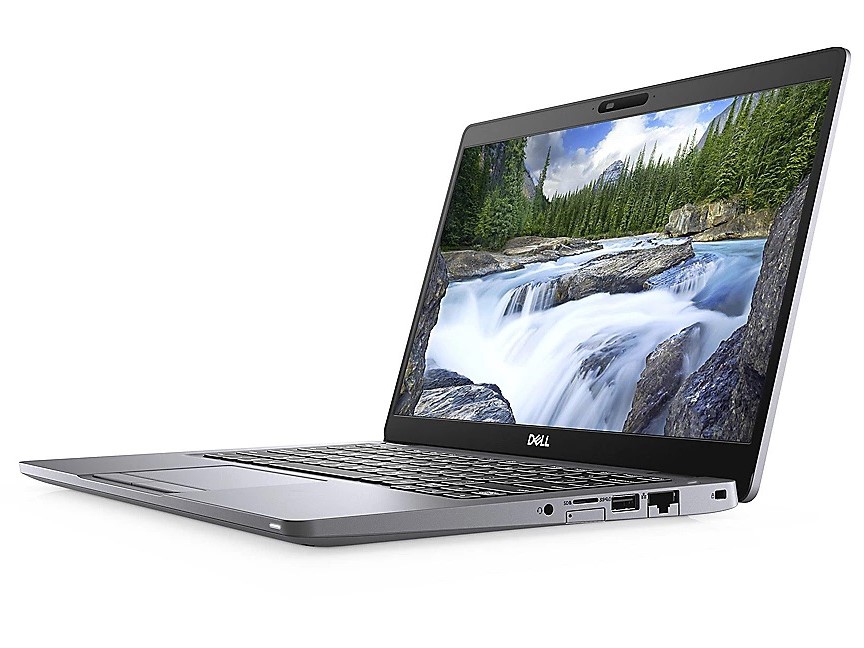
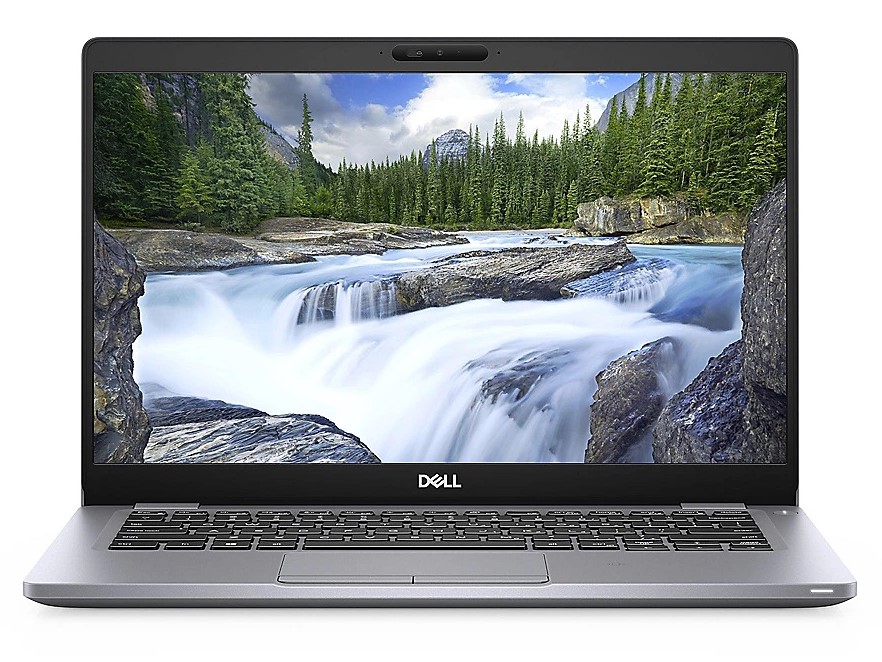
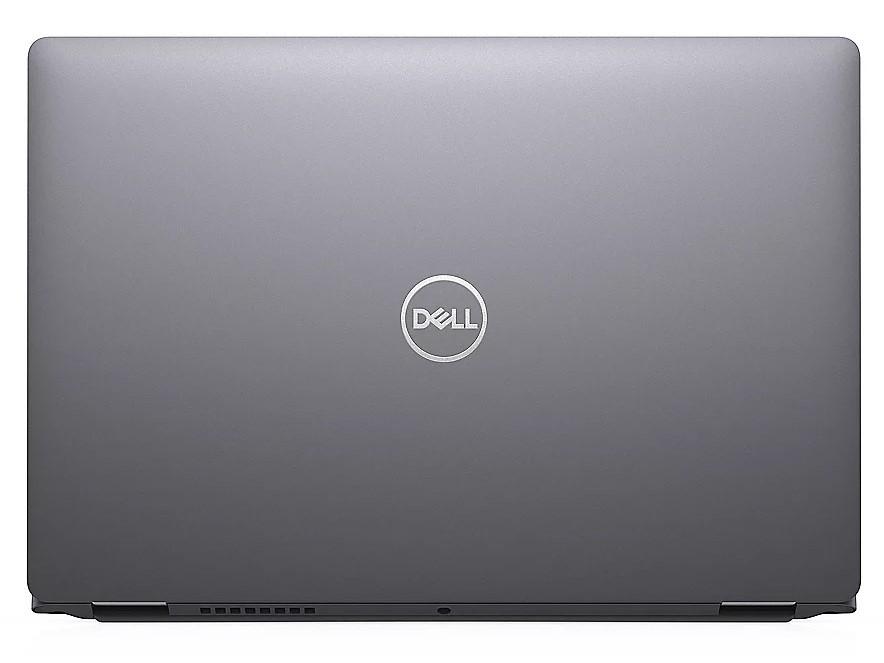
Dell Latitude 14 5411-WJ40N
- 02/15/2021 v7 (old)
Mike Wobker
Price comparison
