Beelink SEi8 recension: Ovanlig Core i3-8109U för en ny minidator
Beelink håller på att bli ett viktigt alternativ till Intel NUC-serien med sitt växande utbud av minidatorer. Den senaste SER4, till exempel, har visat sig vara lika snabb som många Intel NUC-modeller med 11:e generationens Core U-seriens CPU:er samtidigt som den kostar hundratals dollar mindre
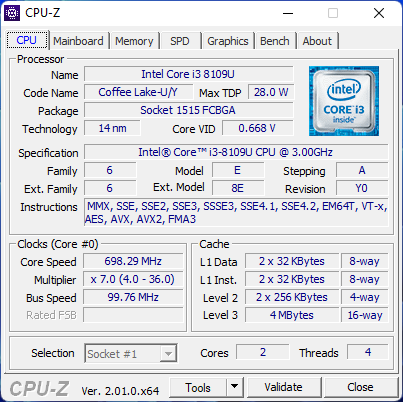
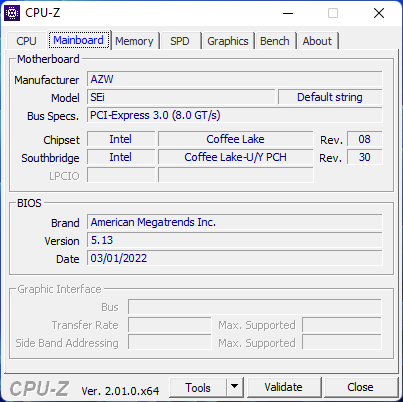
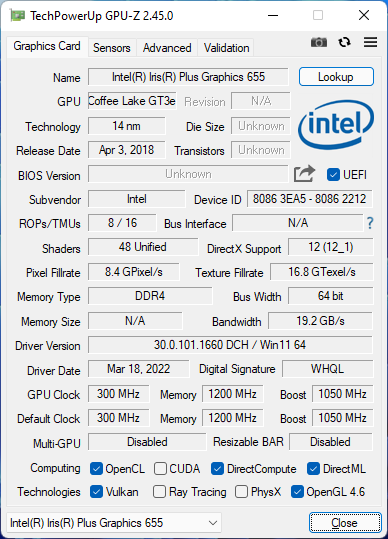
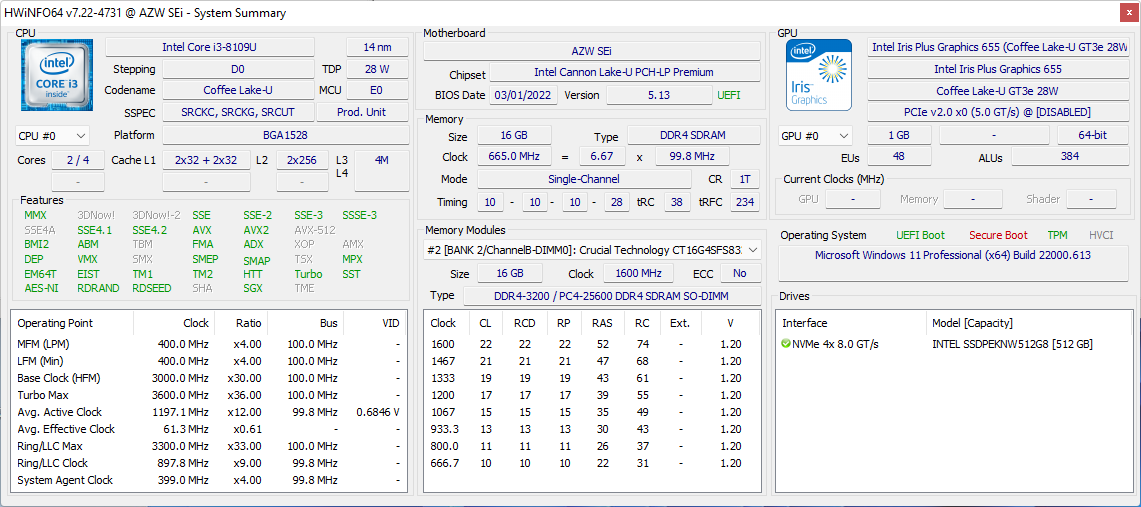
SEi8 kommer med en äldre 8:e generationens Core i3-8109U eller Core i5-8259U medan förra årets SEi10 istället kommer med 10:e generationens Core U-serie alternativ. Den äldre Core i3 gör modellen ännu mer prisvärd och ett attraktivt alternativ till Core i3-drivna Intel NUCs
Beelink levererar för närvarande sEi8 från 320 USD med 8 GB RAM eller 380 USD med 16 GB RAM. Om den konfigureras med Core i5-8279U ökar priset till 400 USD
Fler recensioner av Beelink:
Potentiella konkurrenter i jämförelse
Gradering | Datum | Modell | Vikt | Höjd | Storlek | Upplösning | Pris |
|---|---|---|---|---|---|---|---|
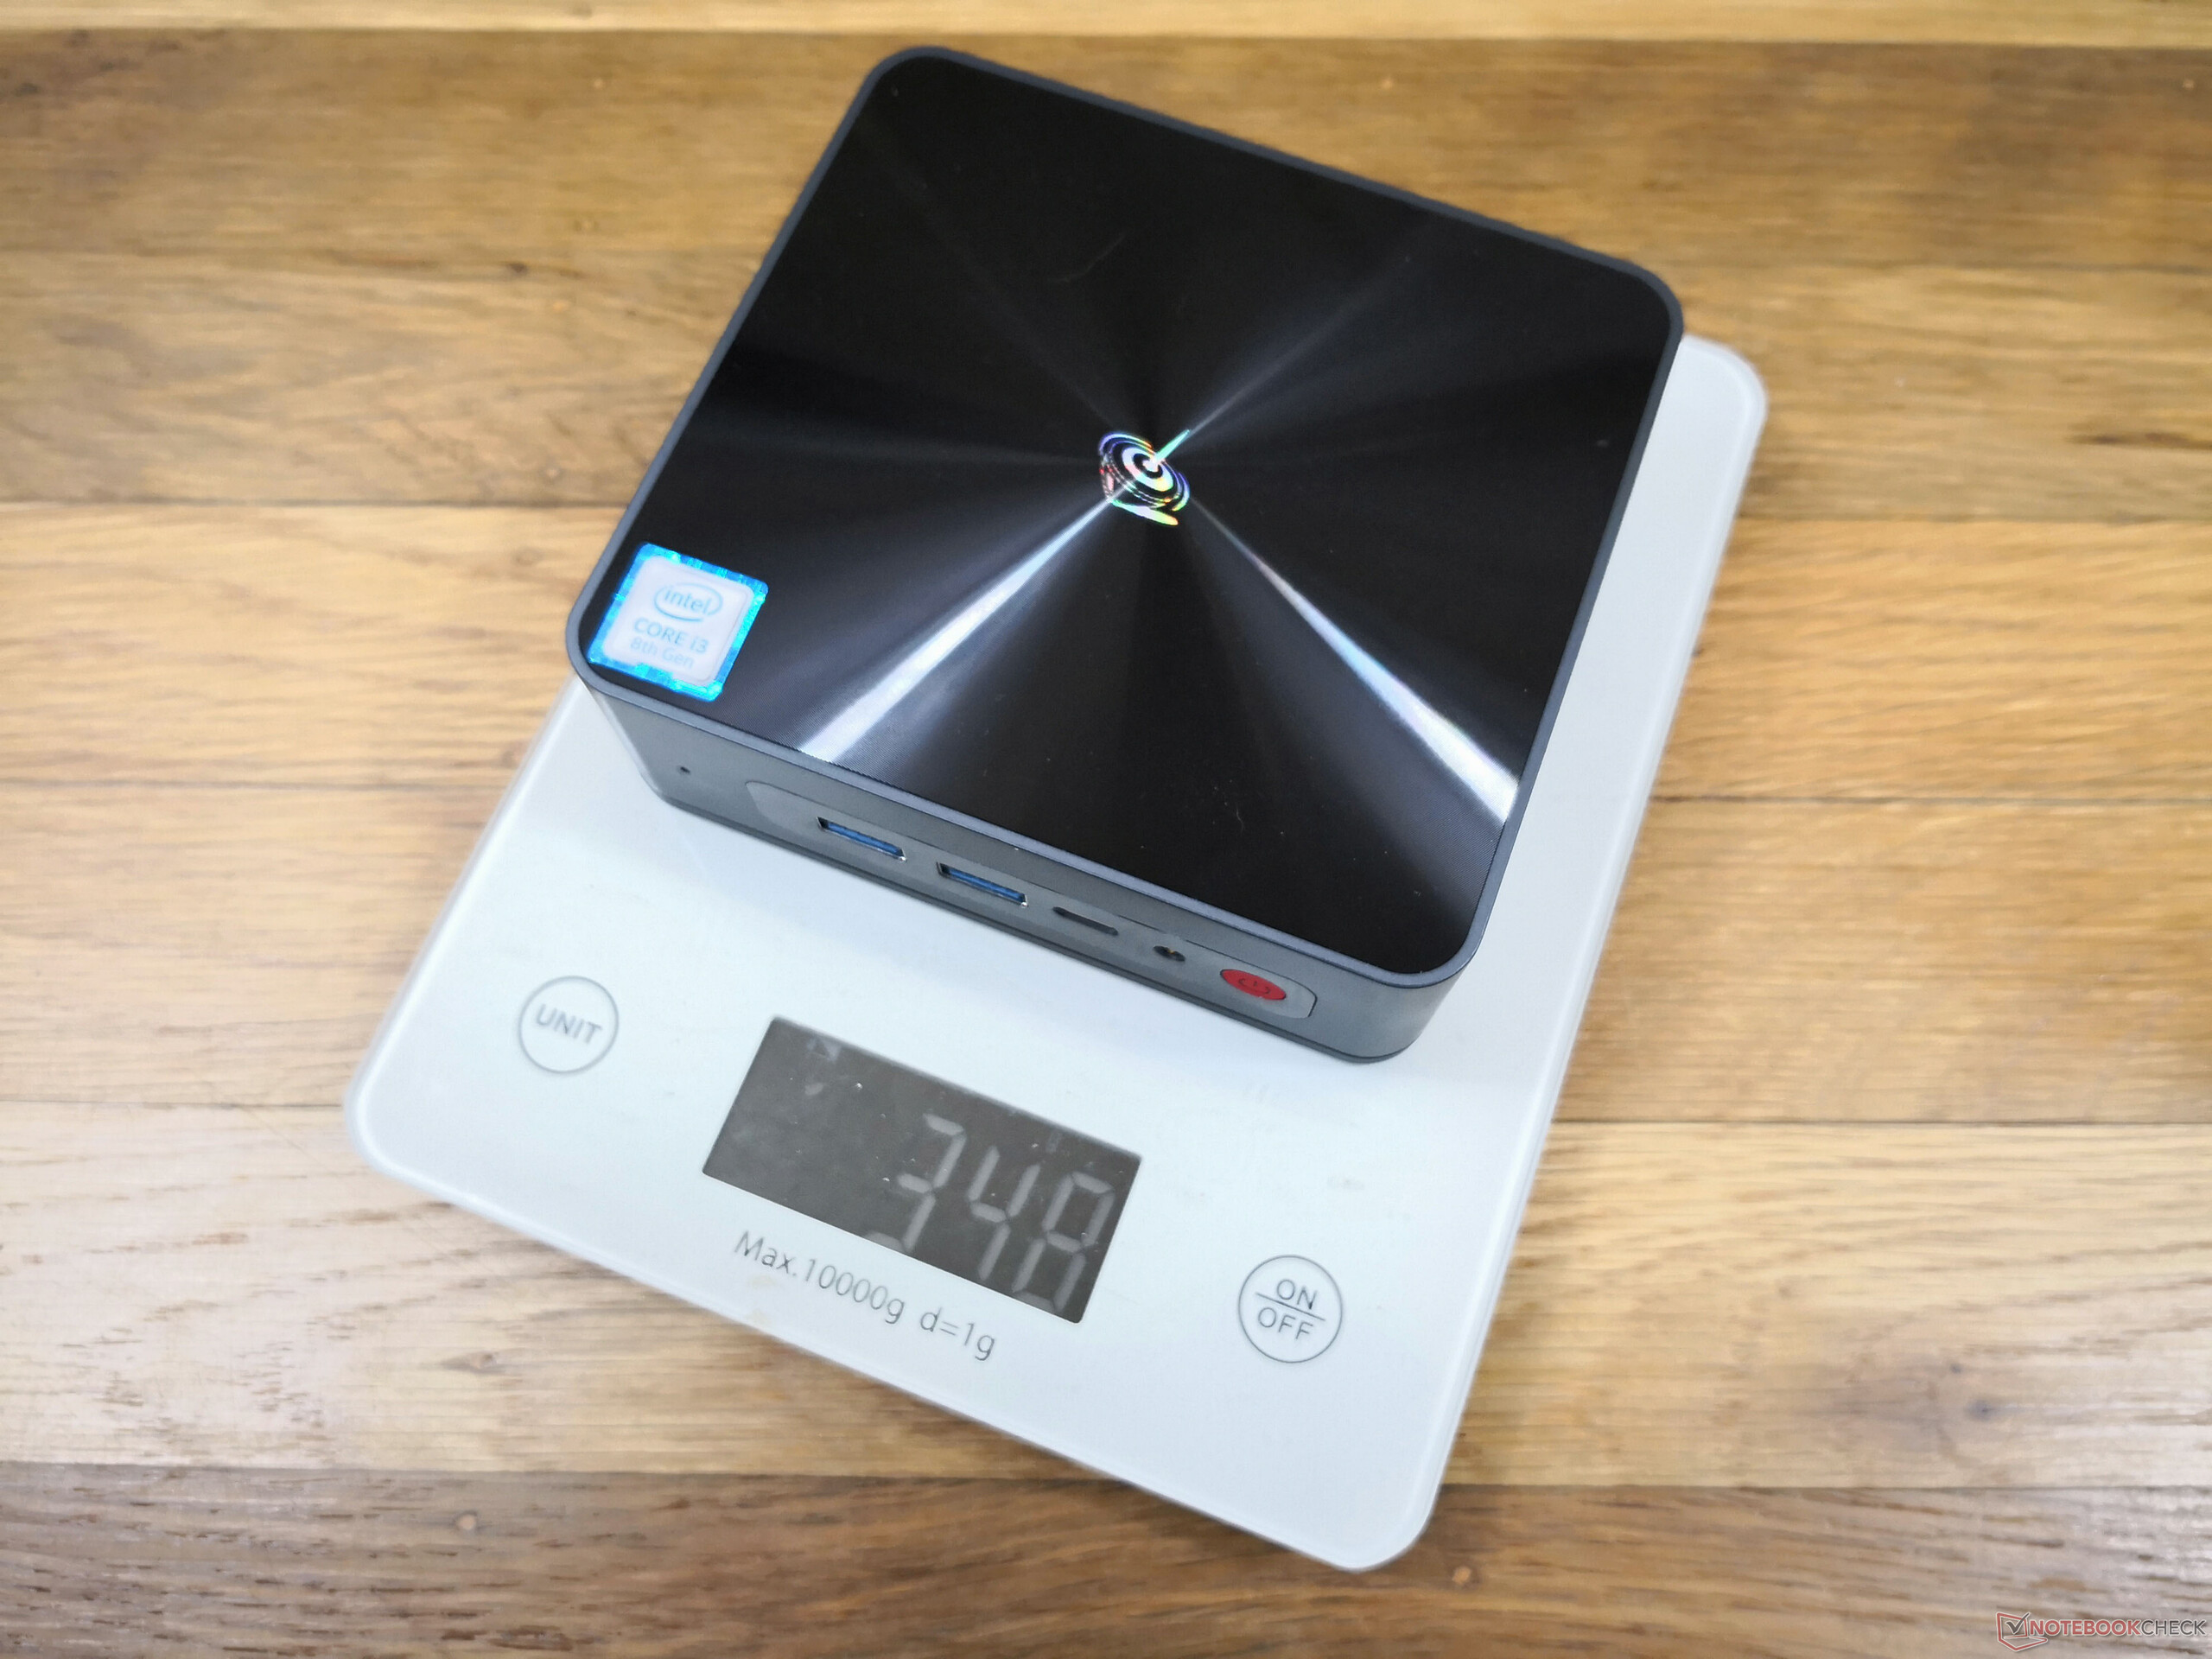
v (old) | 04/2022 | Beelink SEi8 i3-8109U, Iris Plus Graphics 655 | 346 g | 41 mm | x | ||
v (old) | 12/2020 | Beelink SEi10 i3-1005G1, UHD Graphics G1 (Ice Lake 32 EU) | 350 g | 41 mm | x | ||
v (old) | 04/2022 | Beelink SER4 R7 4800U, Vega 8 | 494 g | 40 mm | x | ||
v (old) | Intel NUC11TNKi5 i5-1135G7, Iris Xe G7 80EUs | 504 g | 37 mm | x | |||
v (old) | 11/2018 | Intel NUC8i7BE i7-8559U, Iris Plus Graphics 655 | 683 g | 51 mm | x | ||
v (old) | GMK NucBox 2 i5-8259U, Iris Plus Graphics 655 | 430 g | 50 mm | x |
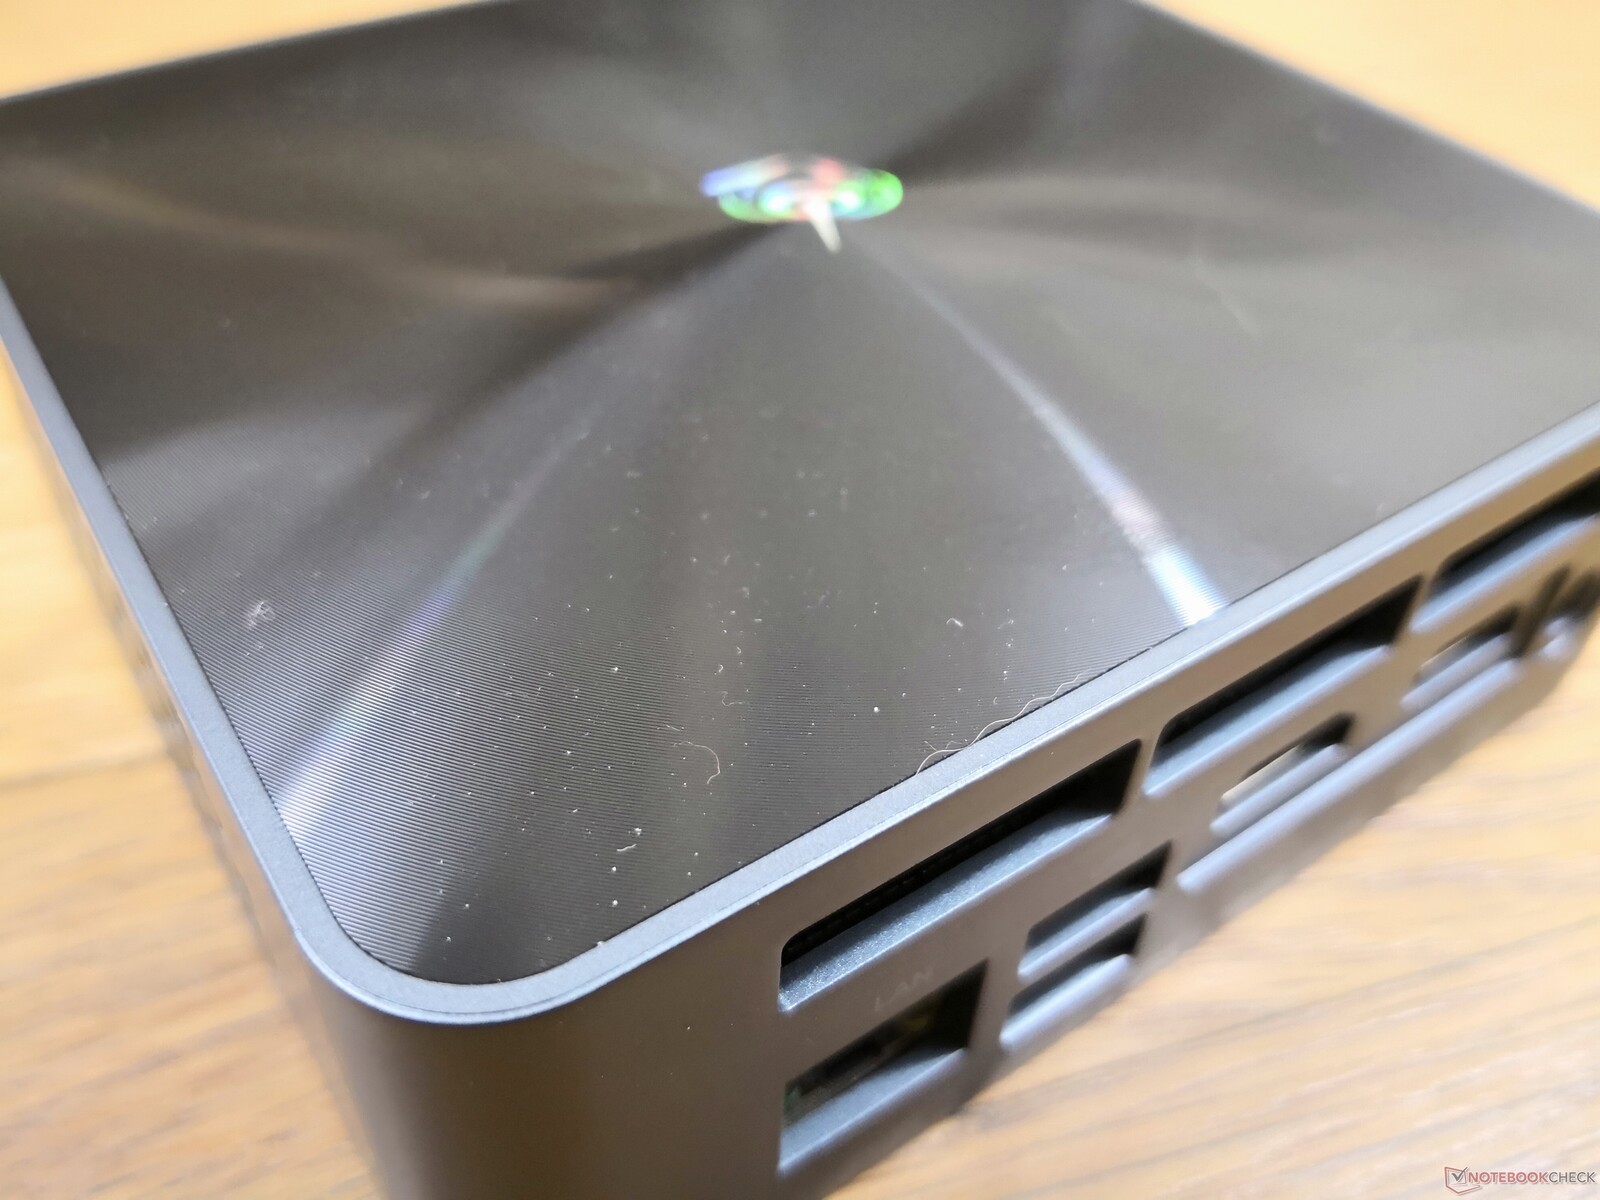
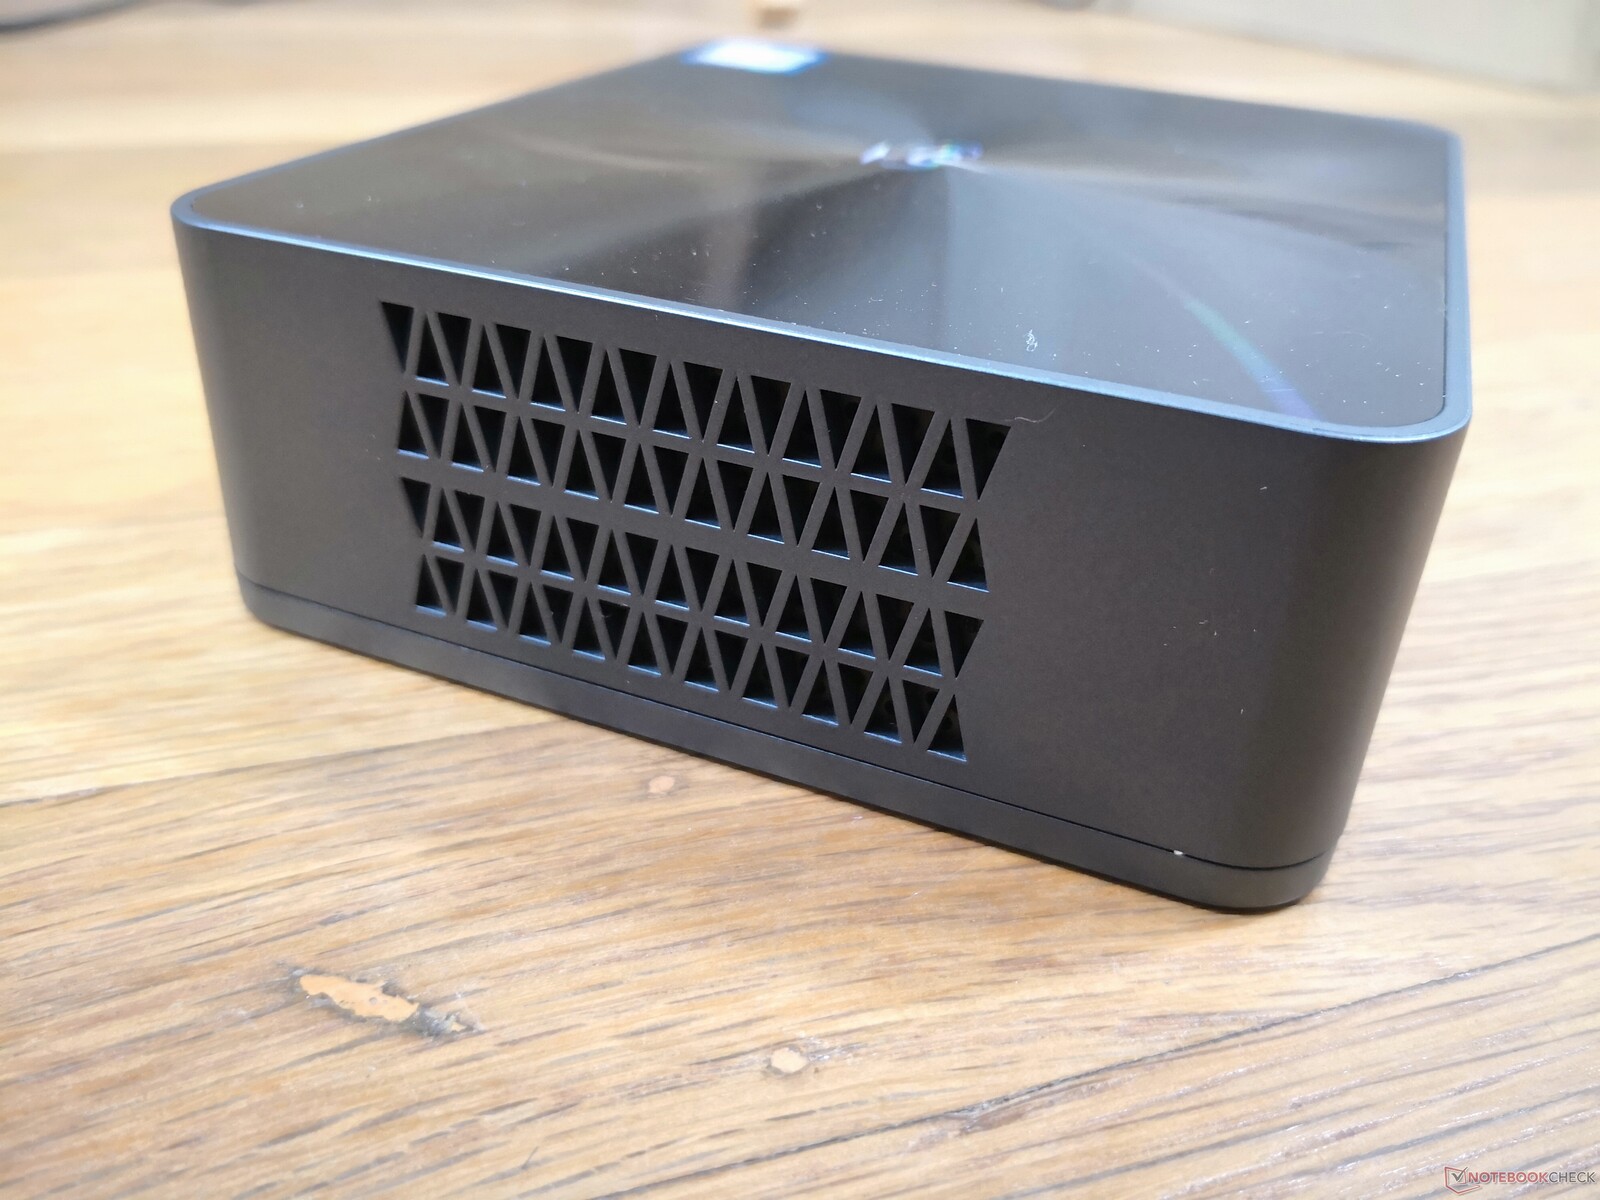
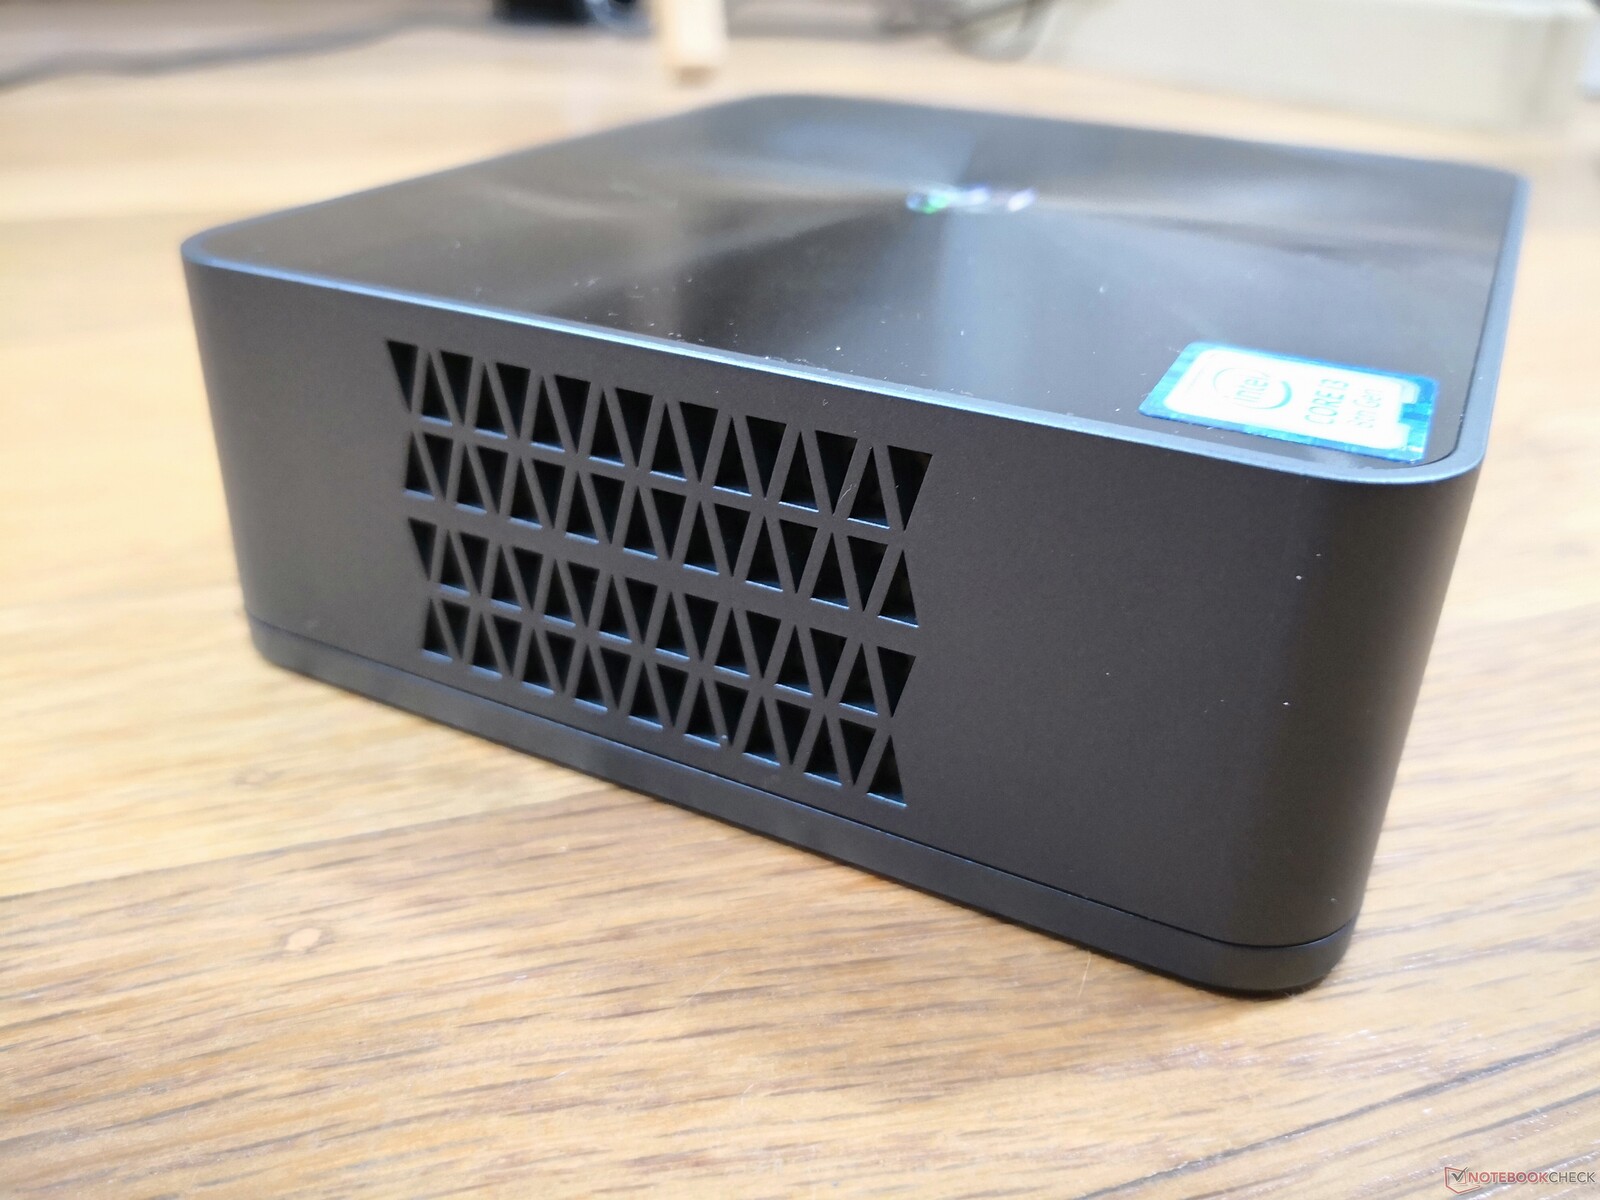
Fall
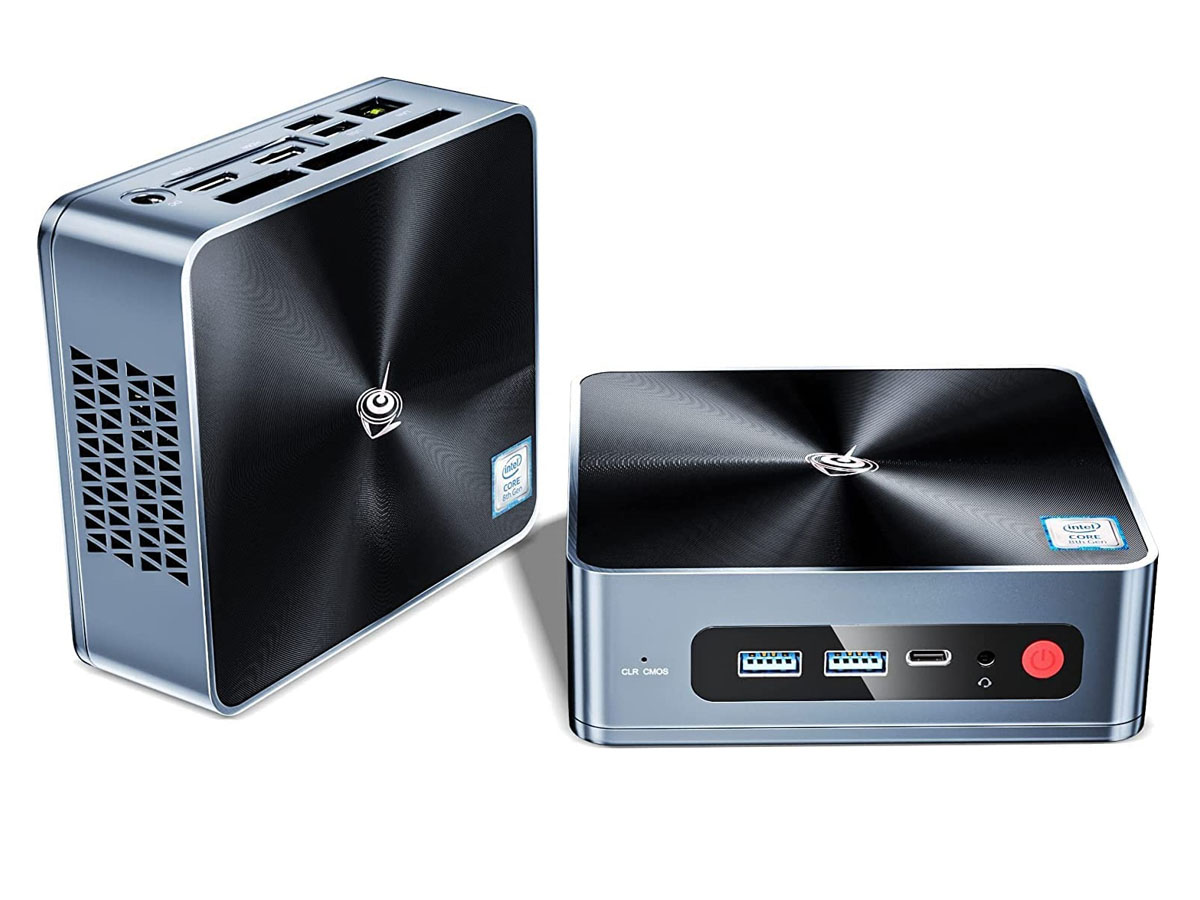
Det yttre chassit är identiskt med SEi10. Designen är anmärkningsvärd eftersom den är ungefär lika stor som en Intel NUC men väger 30 procent mindre. Chassimaterialet är fortfarande styvt, men inte alls lika tjockt eller robust som en NUC.
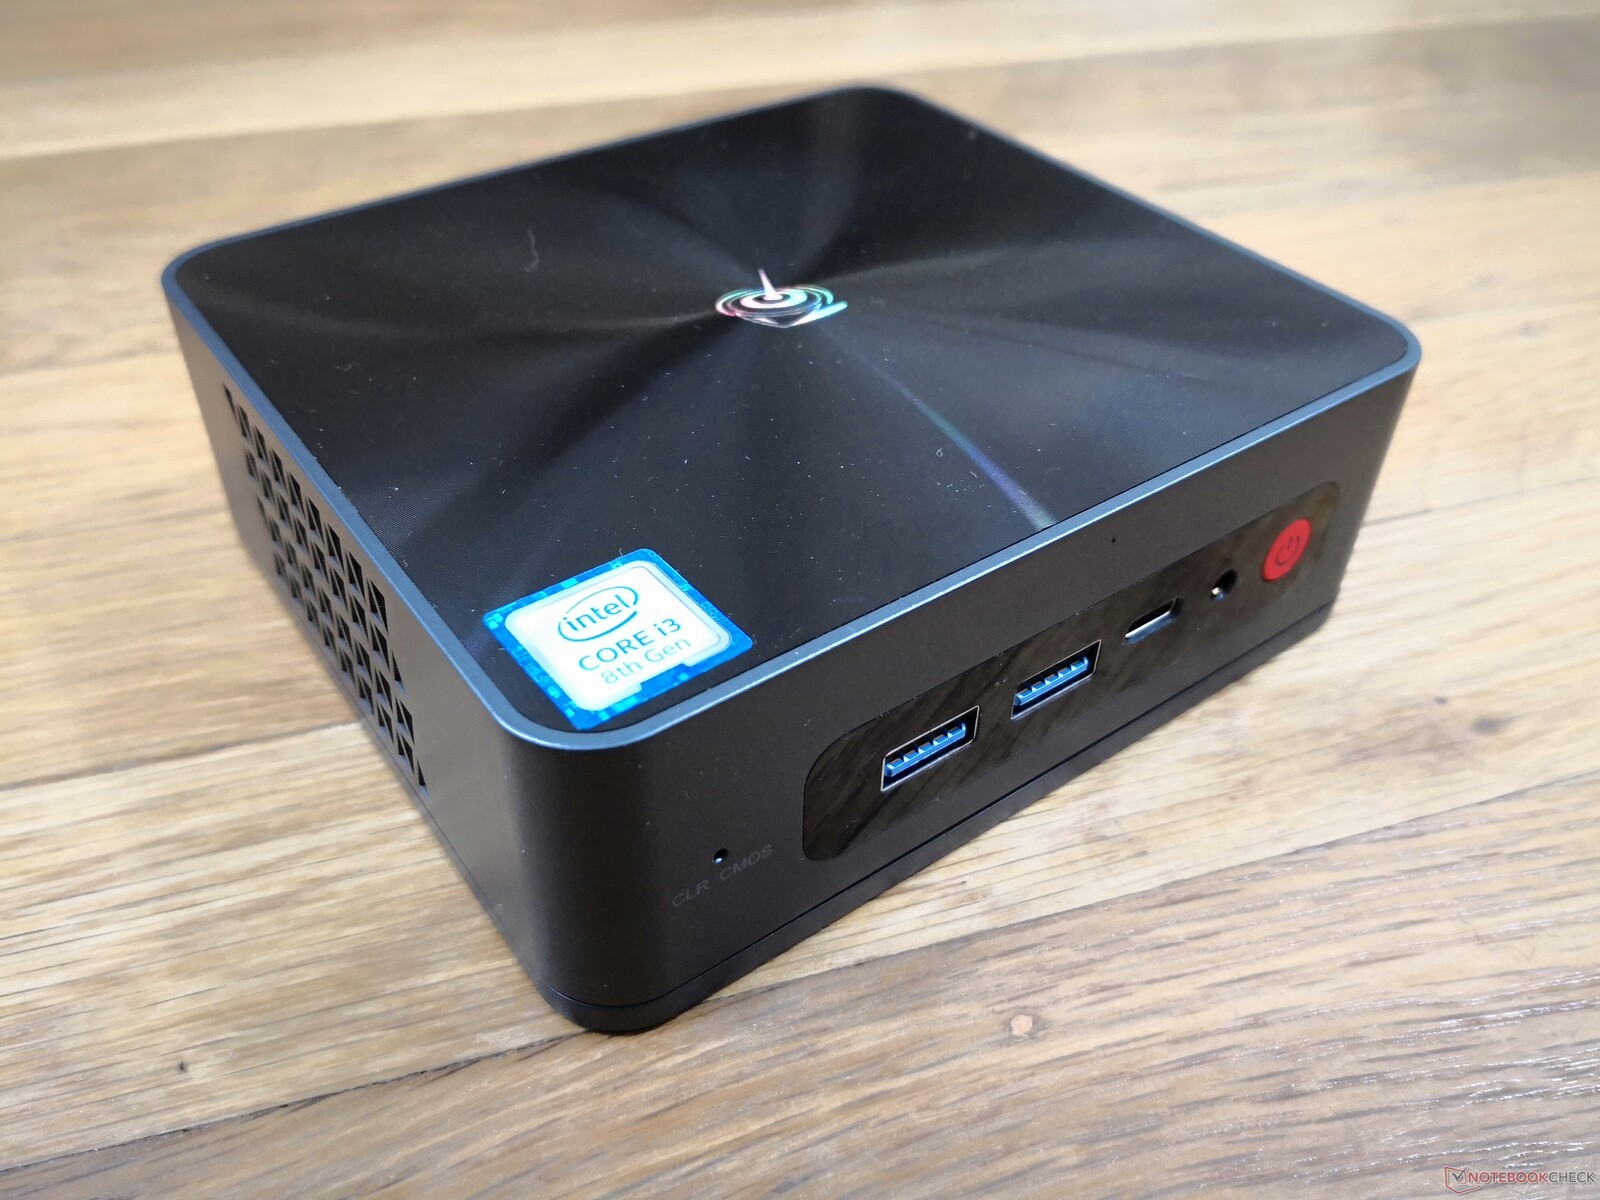
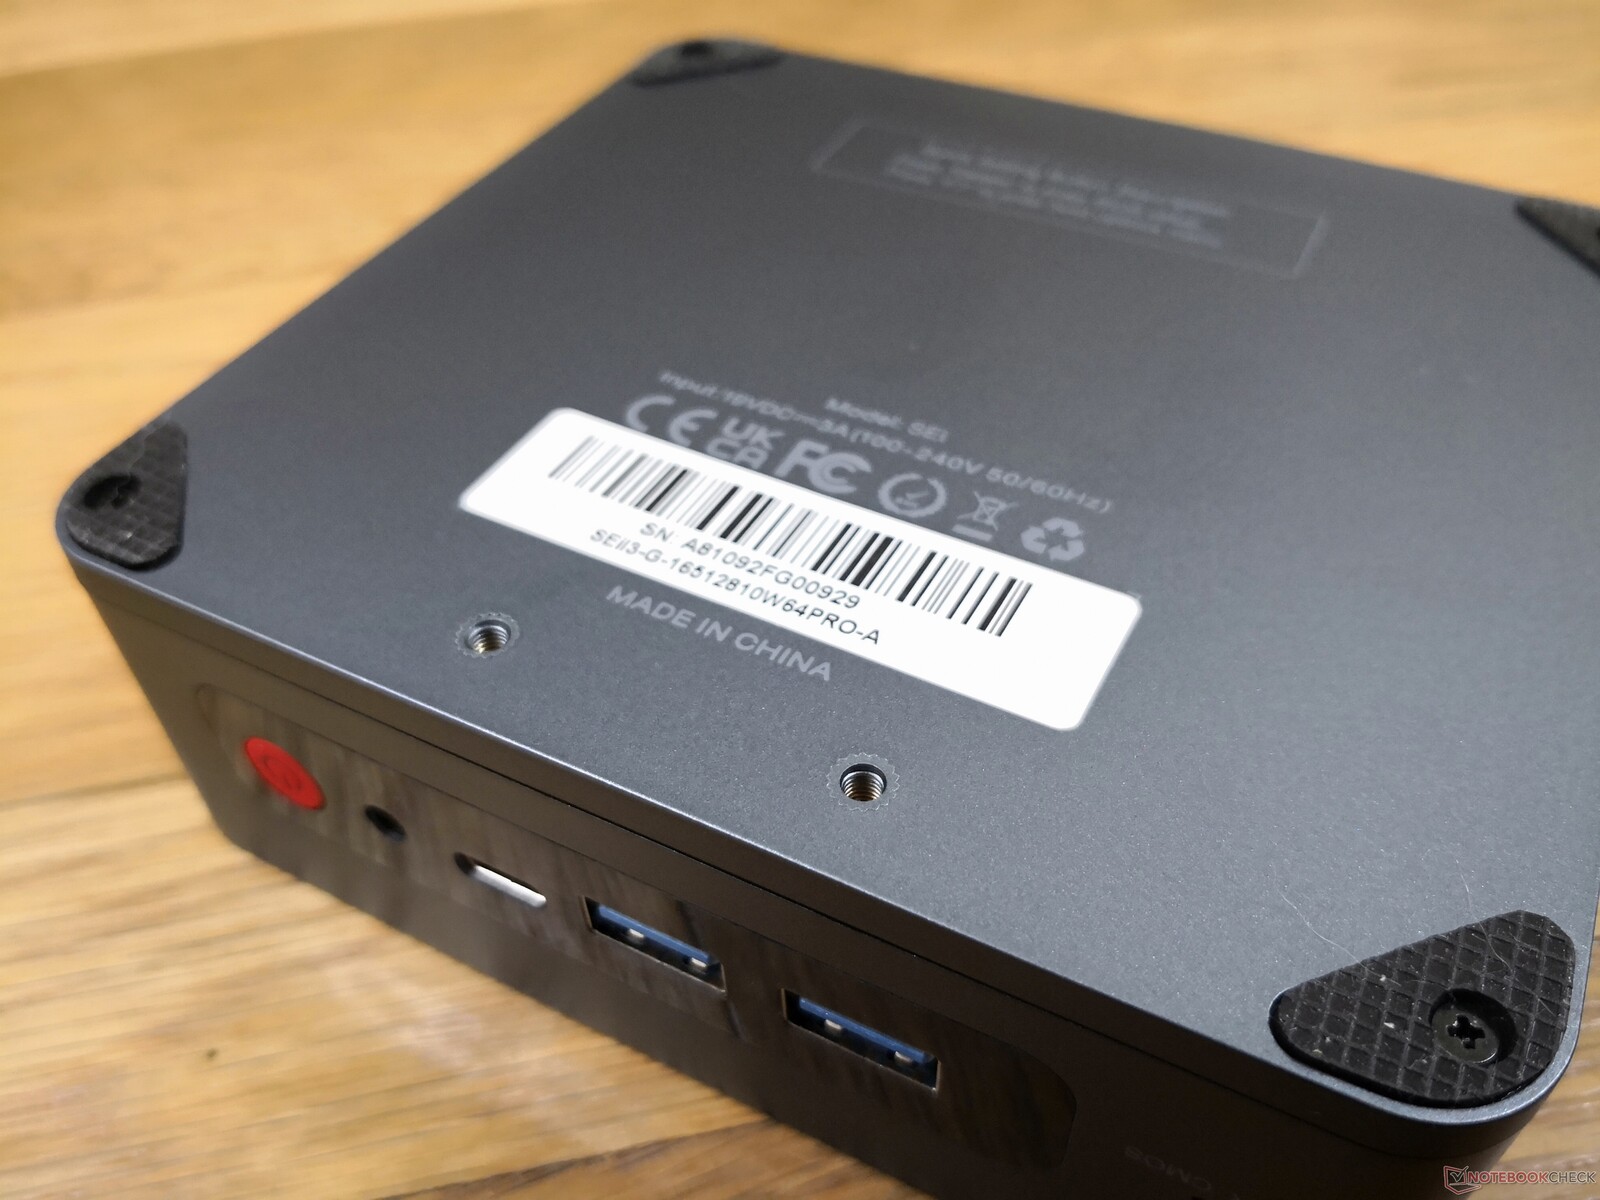
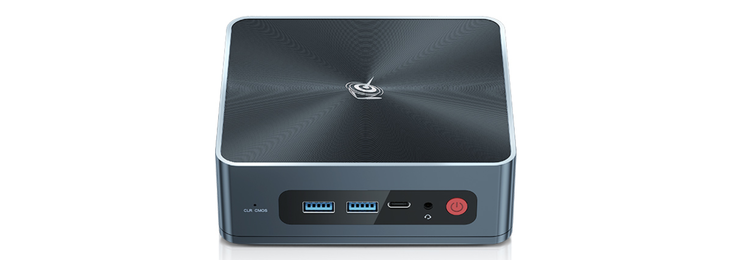
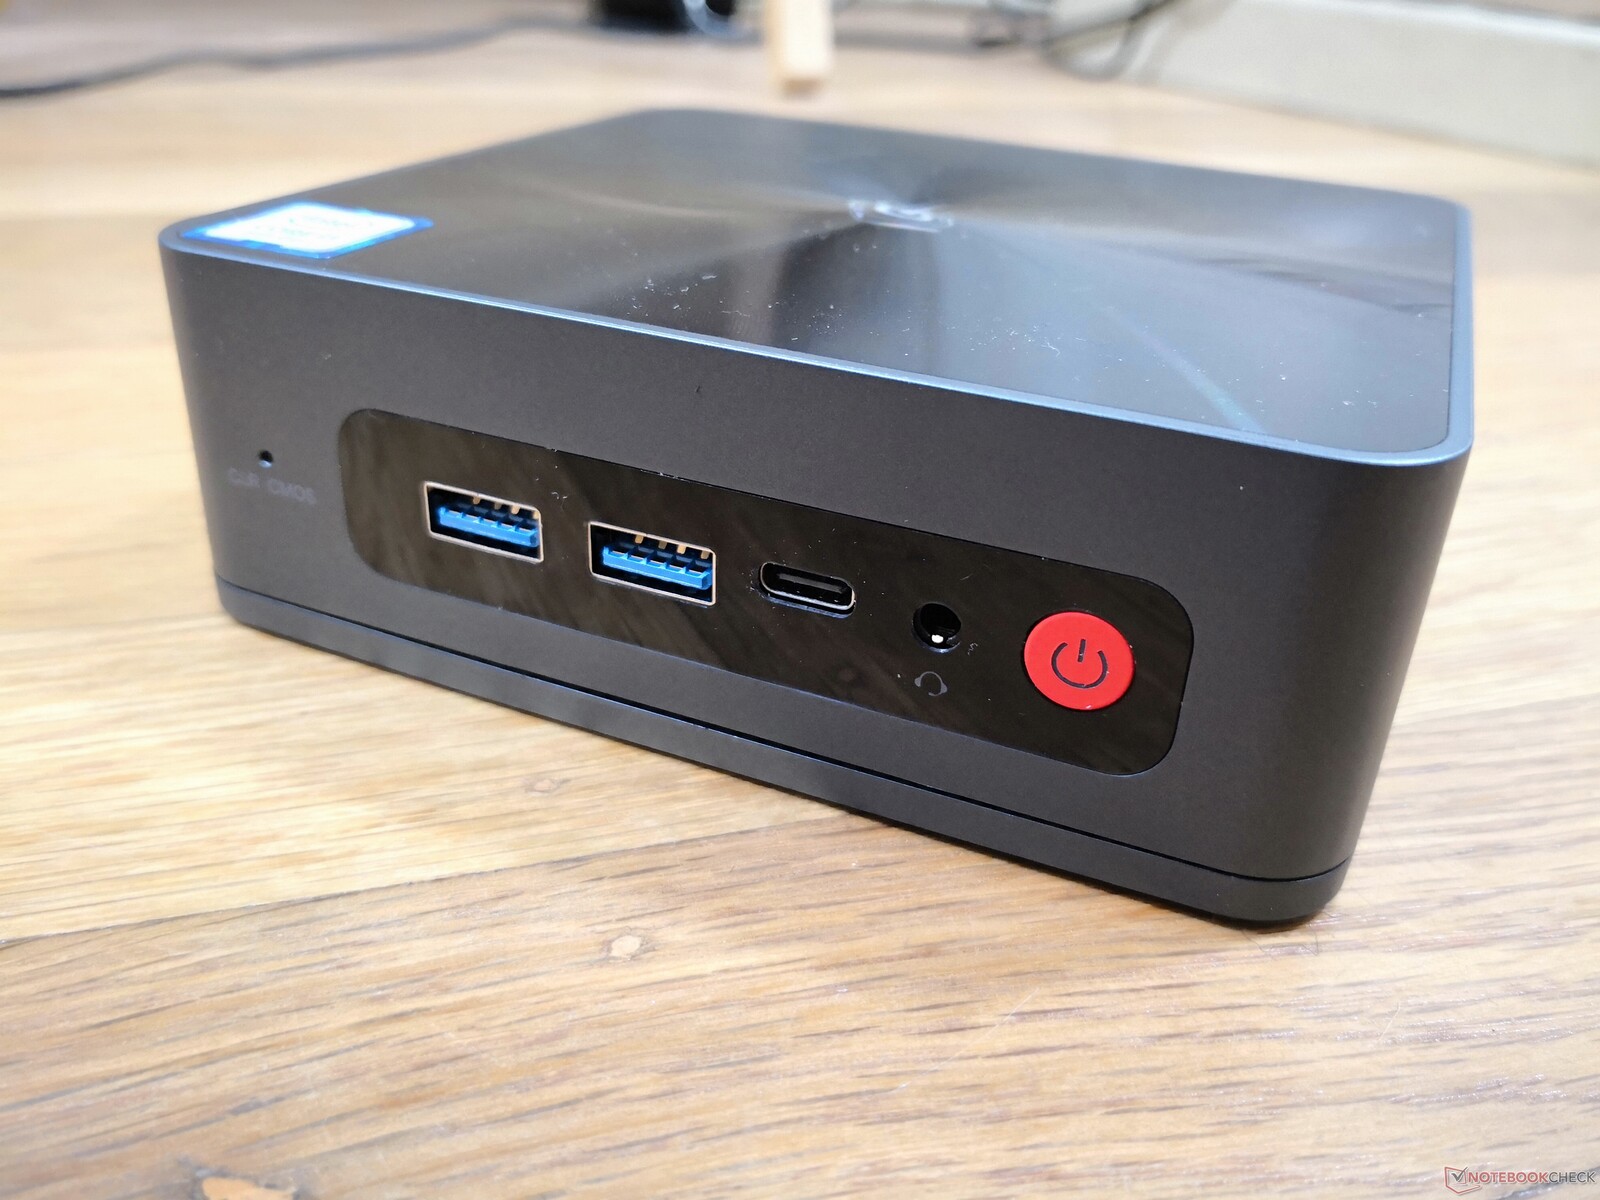
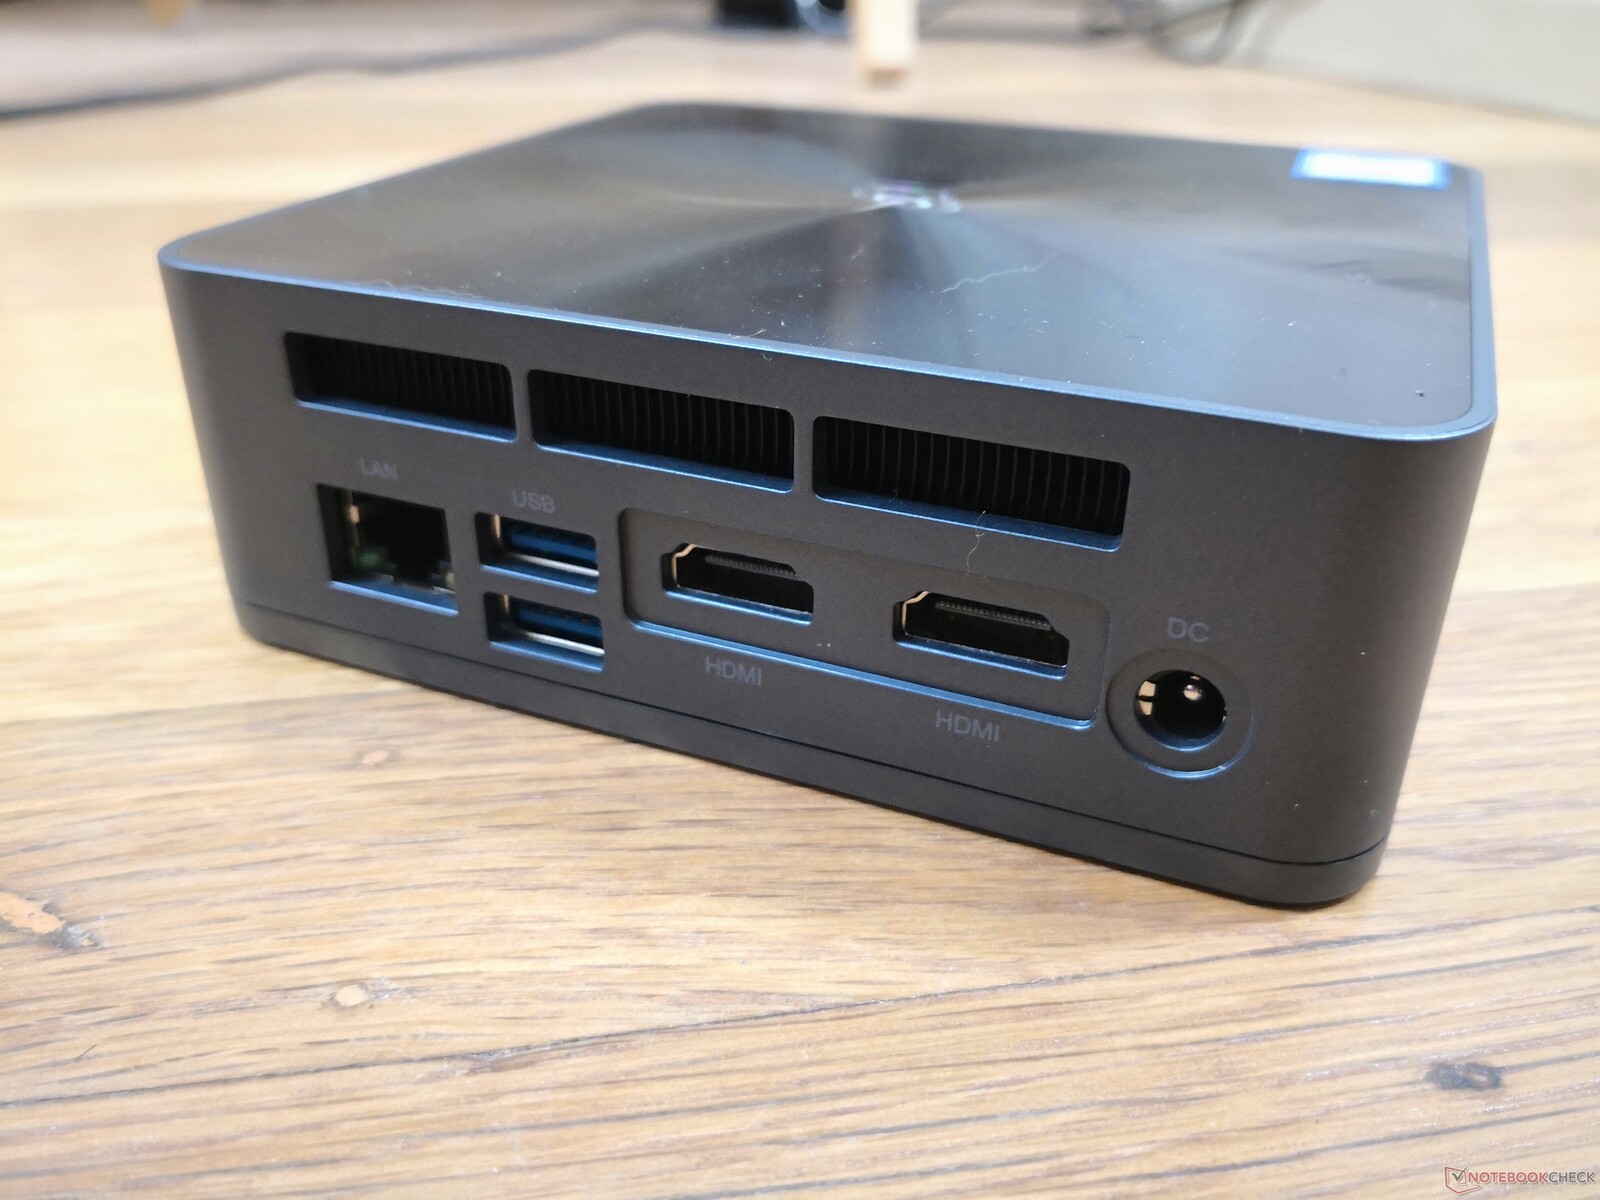
Anslutningsmöjligheter
Portalternativen är identiska med SEi10 förutom att Thunderbolt inte stöds och att det inte längre finns någon integrerad SD-kortläsare. Vi kan bekräfta att USB-C-porten fortfarande stöder DisplayPort, men den kan inte användas för att driva minidatorn till skillnad från SER4.
Kommunikation
Inbyggda trådbundna och trådlösa kommunikationsmoduler, jämför testdata för nätverk med konkurrenter, tillgängliga alternativa lösningar (5G/LTE), oregelbundenheter (radiomottagning)?
| Networking | |
| iperf3 transmit AX12 | |
| Intel NUC11TNKi5 | |
| Beelink SER4 | |
| Beelink SEi10 | |
| Intel NUC8i7BE | |
| GMK NucBox 2 | |
| Beelink SEi8 | |
| iperf3 receive AX12 | |
| Intel NUC11TNKi5 | |
| Beelink SEi10 | |
| Beelink SER4 | |
| GMK NucBox 2 | |
| Intel NUC8i7BE | |
| Beelink SEi8 | |
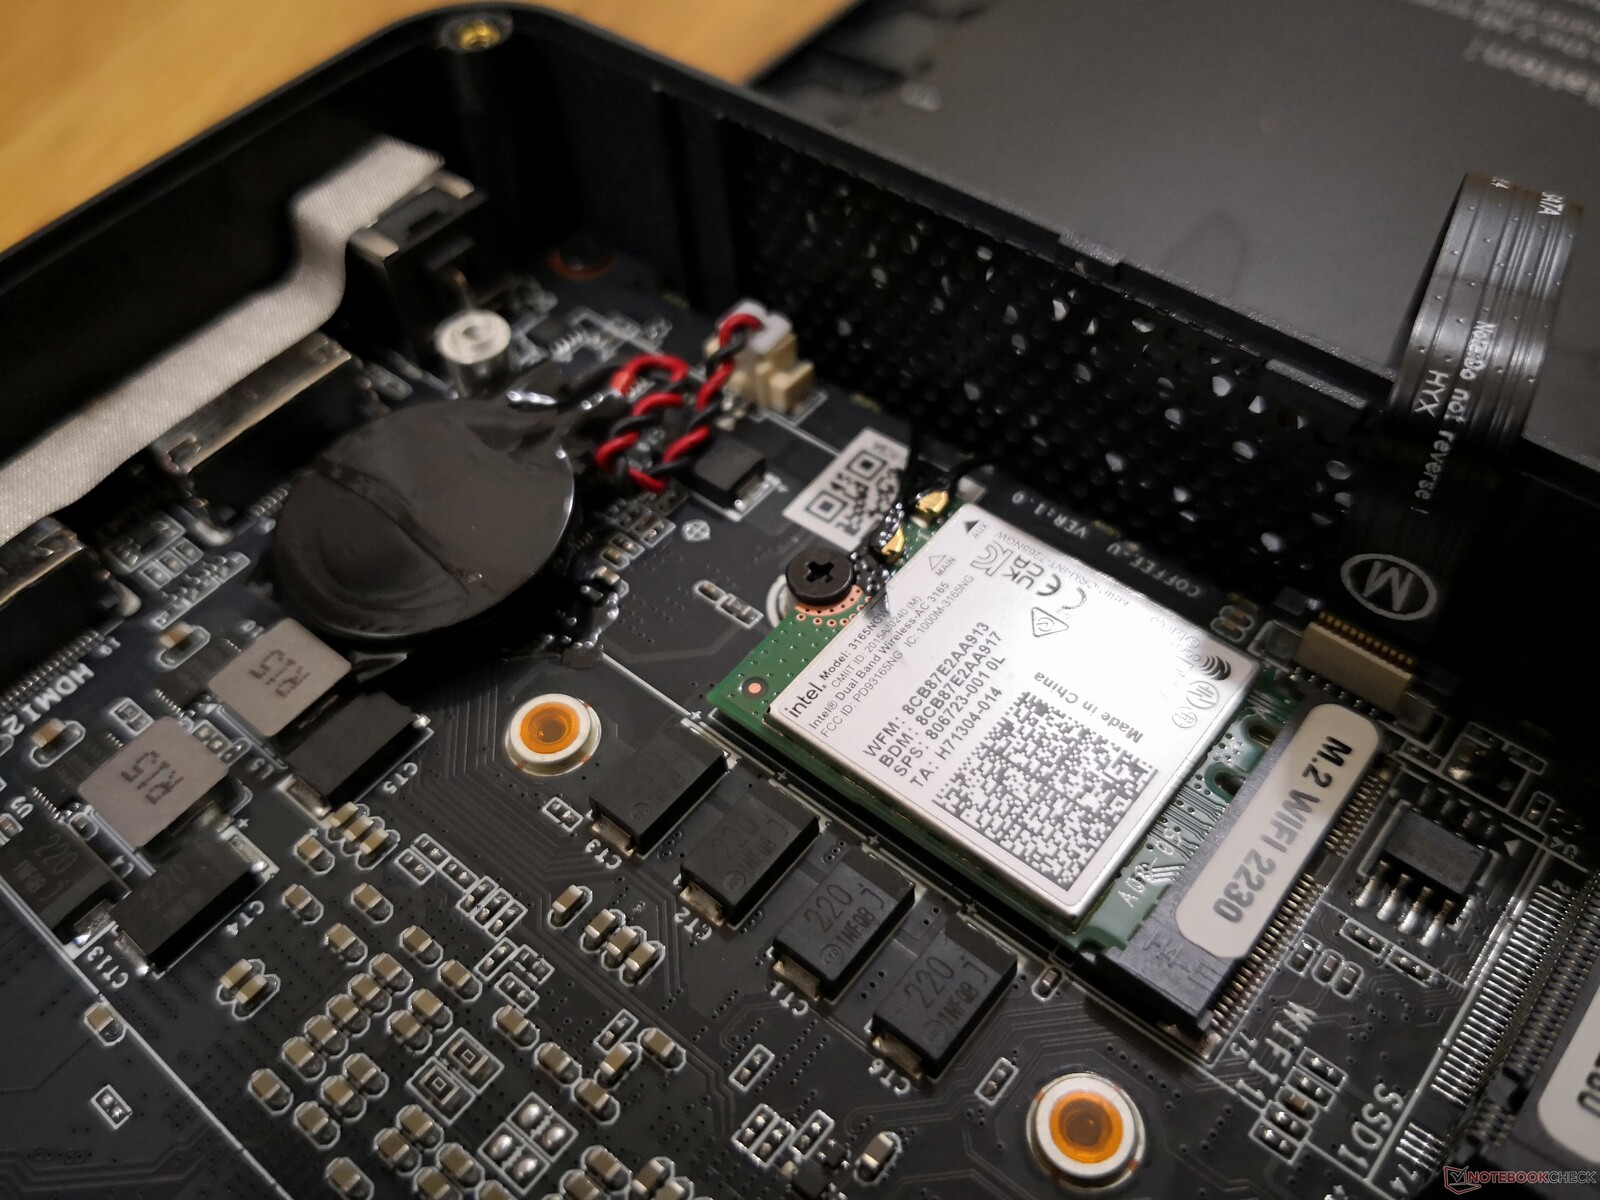
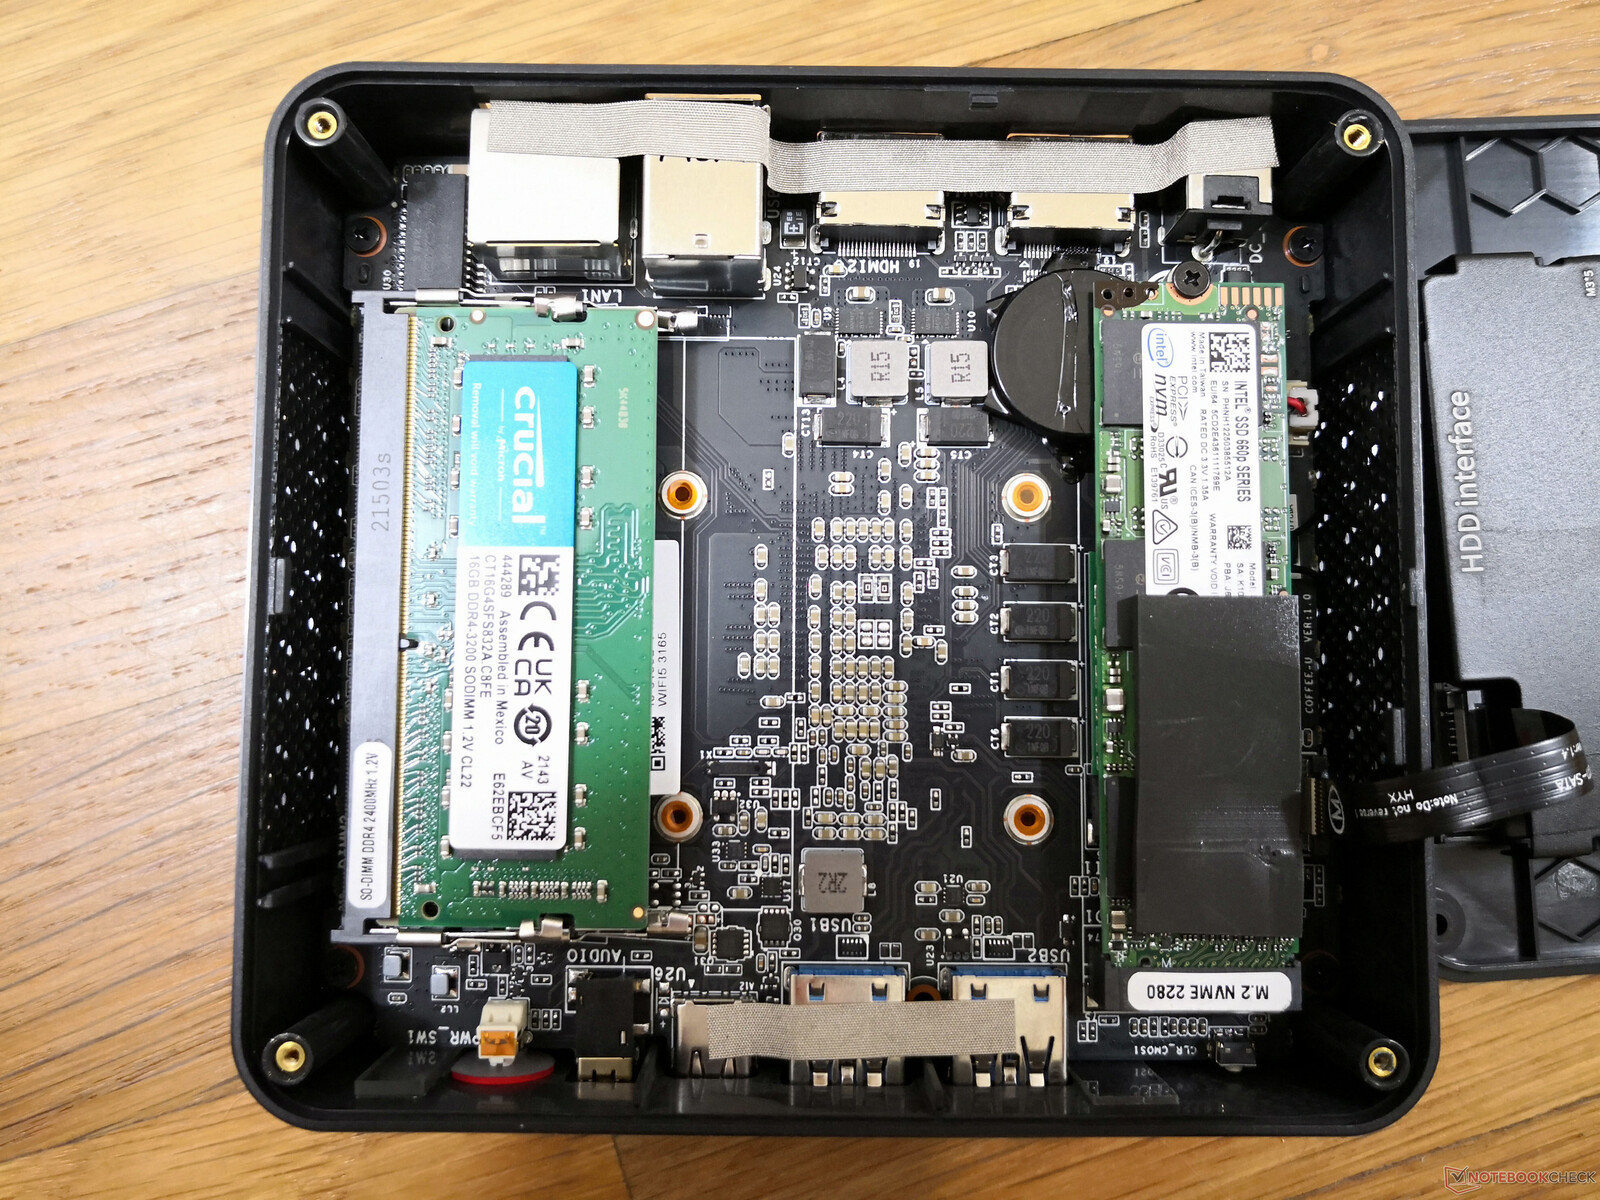
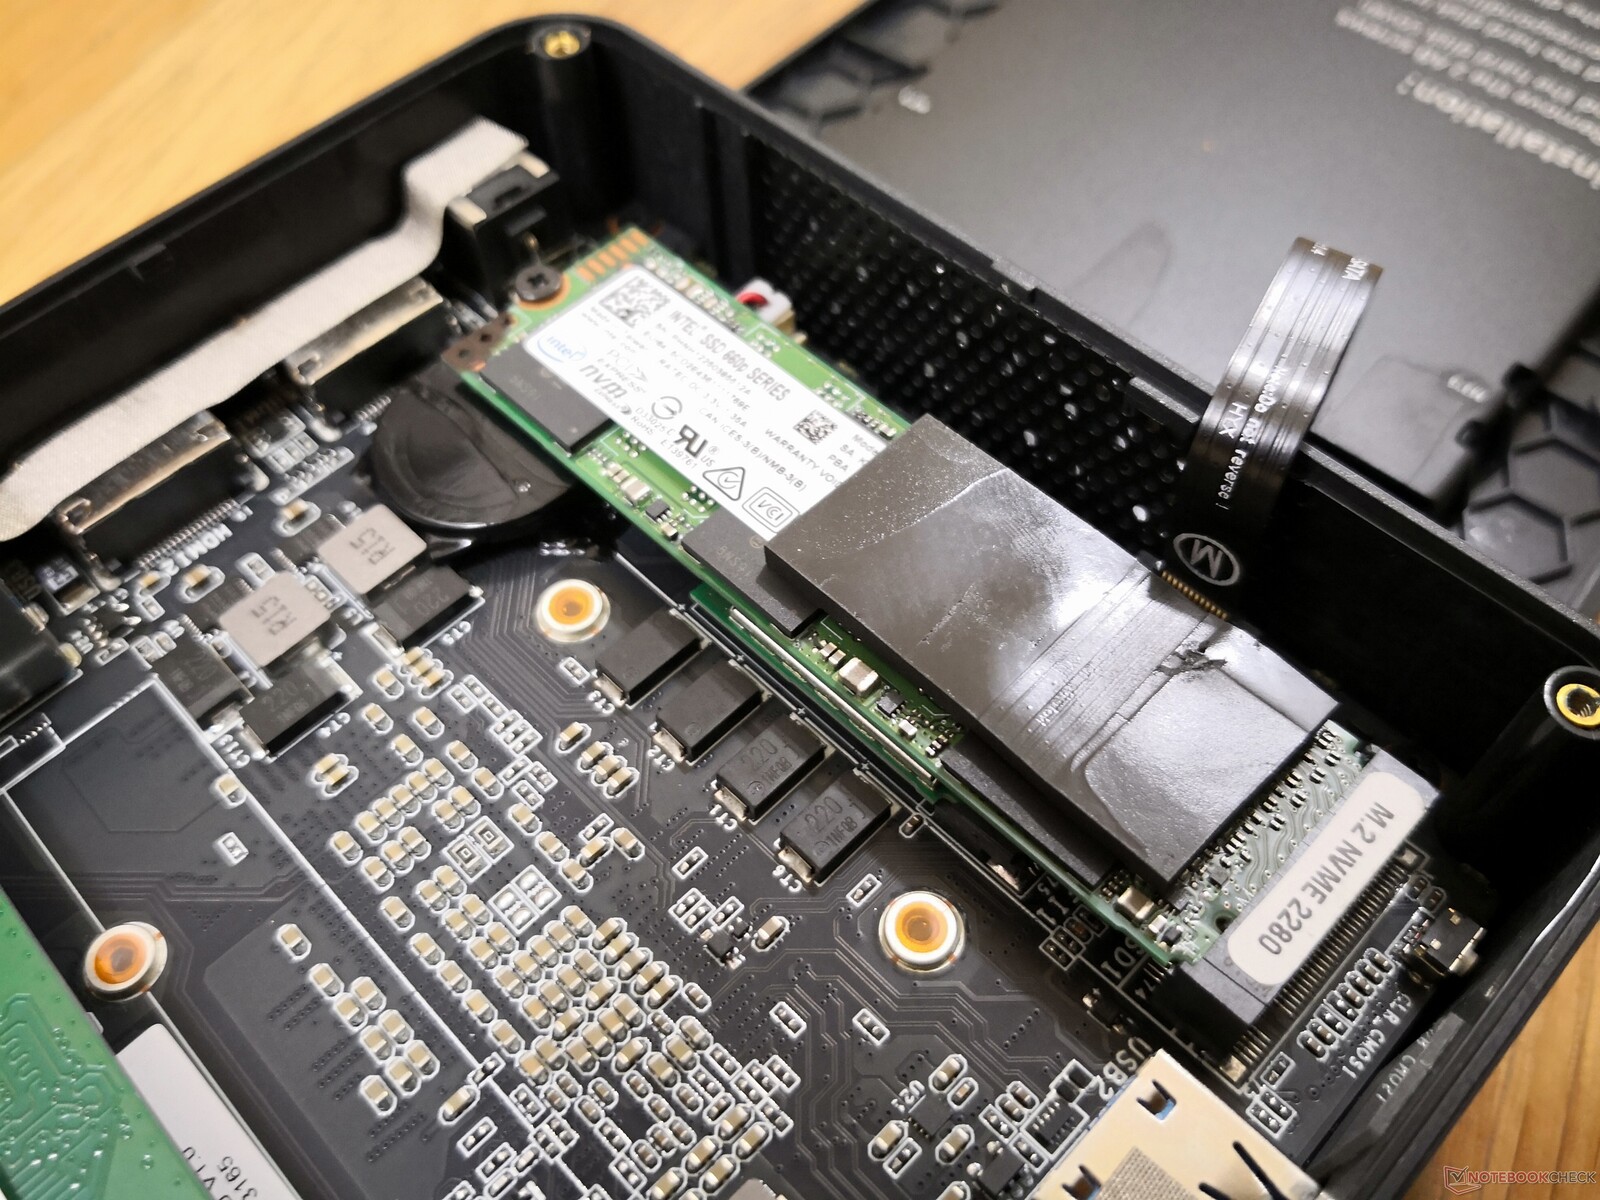
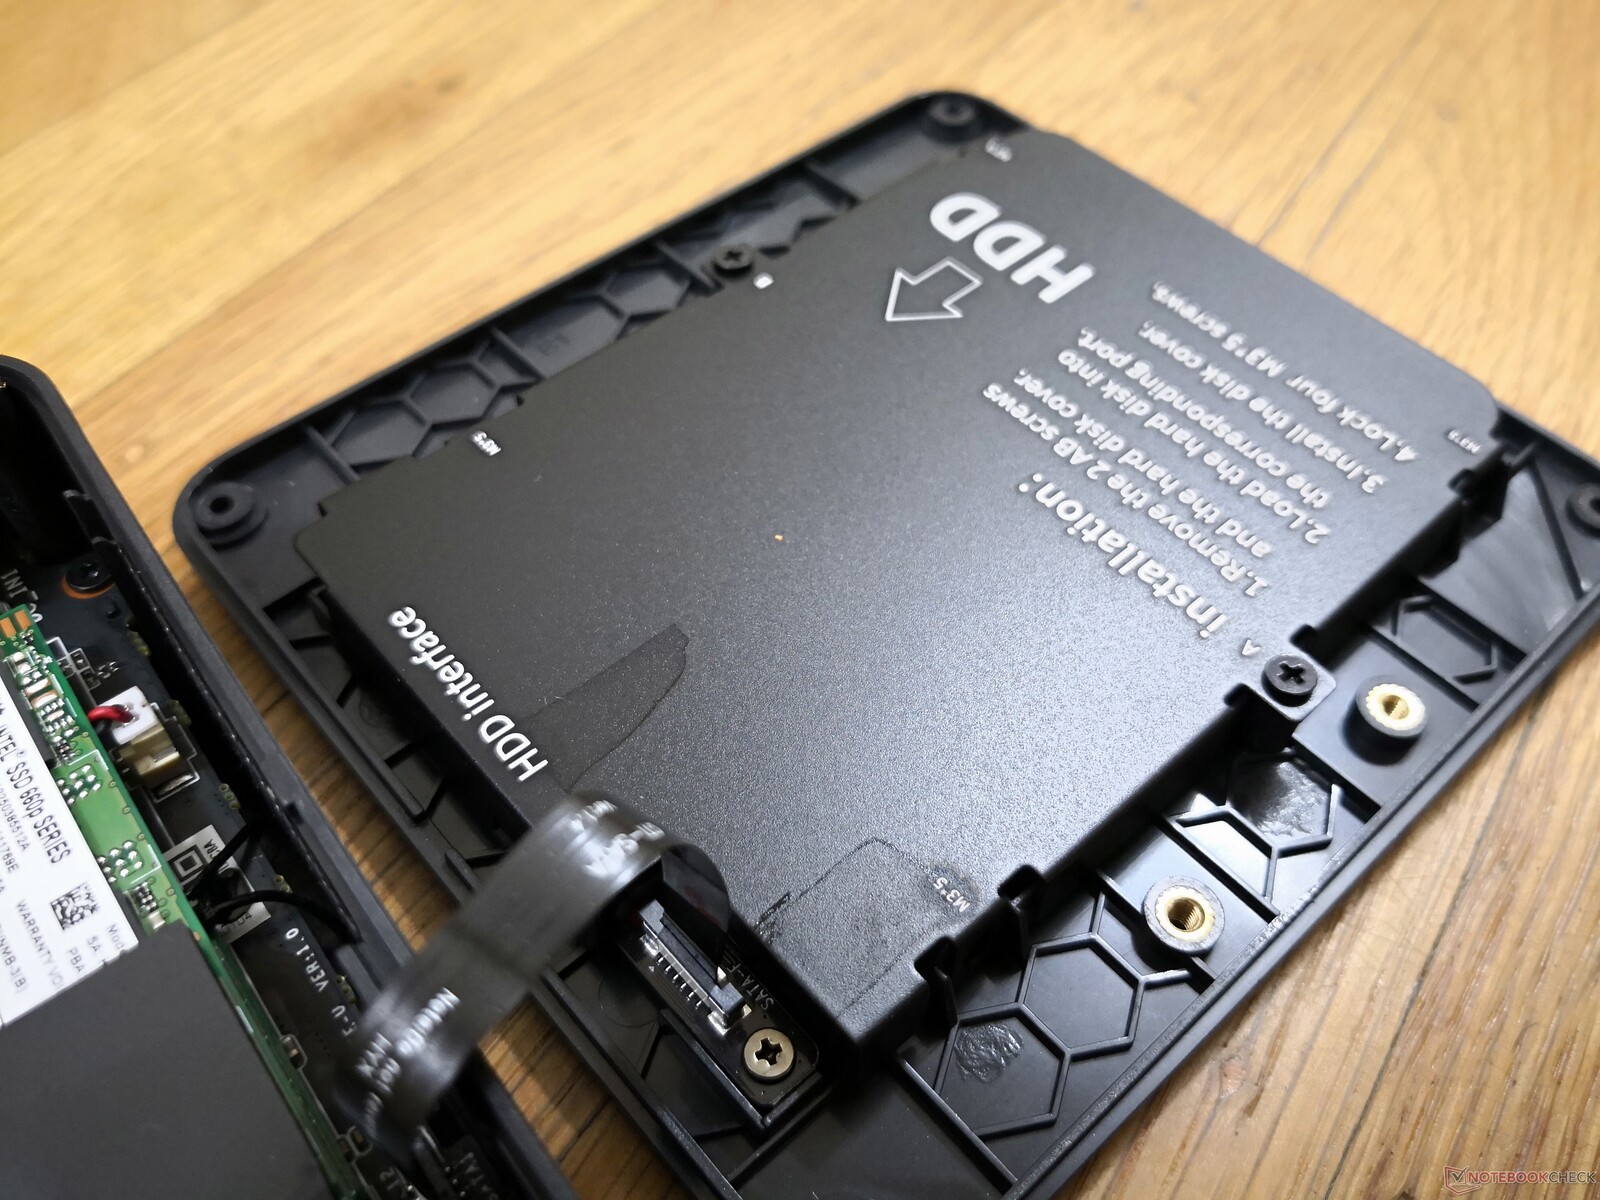
Underhåll
Moderkortet i SEi8 skiljer sig något från moderkortet i SEi10. M.2 SSD-platsen är till exempel nu vänd åt motsatt håll medan BIOS-batteriet nu är mer lättillgängligt.
Tillbehör och garanti
I förpackningen ingår ytterligare skruvar, en handbok och ett avtagbart VESA-fäste. Det kan vara svårt att begära garanti eftersom det kan innebära att produkten skickas utomlands. Endast en basgaranti på ett år tillhandahålls till skillnad från de tre åren på de flesta Intel NUCs.
Prestanda
Provningsförhållanden
Vår enhet ställdes in i Windows Performance-läge innan vi körde de nedanstående riktmärkena.
Processor
Den råa CPU-prestandan ligger mellan Celeron- och Atom-serierna och den högre Core i5 U-serien. Kanske framför allt är den märkbart snabbare än den konkurrerande Ryzen 3 3200U och passivt kylda Core i3-10100Y som finns i Microsoft Surface Go 3. Surface Go 3-processorn fick mycket kritik för sin långsamma prestanda jämfört med Surface Pro
Beelink erbjuder SEi8 med Core i5-8279U som en uppgradering, vilket skulle ge ungefär 20 procent snabbare prestanda för entrådiga enheter och mer än dubbelt så hög prestanda för flertrådiga enheter jämfört med vår Core i3-8109U.
Cinebench R15 Multi Loop
Cinebench R23: Multi Core | Single Core
Cinebench R15: CPU Multi 64Bit | CPU Single 64Bit
Blender: v2.79 BMW27 CPU
7-Zip 18.03: 7z b 4 | 7z b 4 -mmt1
Geekbench 5.5: Multi-Core | Single-Core
HWBOT x265 Benchmark v2.2: 4k Preset
LibreOffice : 20 Documents To PDF
R Benchmark 2.5: Overall mean
| Cinebench R20 / CPU (Multi Core) | |
| Beelink SER4 | |
| Intel NUC11TNKi5 | |
| Apple MacBook Pro 13 2019 i5 4TB3 | |
| Intel NUC8i7BE | |
| Acer Swift 3 SF314-42-R27B | |
| GMK NucBox 2 | |
| Beelink SEi10 | |
| Beelink U59 | |
| Beelink SEi8 | |
| Genomsnitt Intel Core i3-8109U (n=1) | |
| Microsoft Surface Go 3 Core i3 | |
| HP 255 G7 159P1EA | |
| GMK NucBox 3 | |
| Chuwi LapBook Plus | |
| Teclast Tbook 16 Power | |
| Cinebench R20 / CPU (Single Core) | |
| Intel NUC11TNKi5 | |
| Beelink SER4 | |
| Intel NUC8i7BE | |
| Acer Swift 3 SF314-42-R27B | |
| Apple MacBook Pro 13 2019 i5 4TB3 | |
| Beelink SEi10 | |
| GMK NucBox 2 | |
| Beelink SEi8 | |
| Genomsnitt Intel Core i3-8109U (n=1) | |
| Microsoft Surface Go 3 Core i3 | |
| HP 255 G7 159P1EA | |
| Beelink U59 | |
| GMK NucBox 3 | |
| Chuwi LapBook Plus | |
| Teclast Tbook 16 Power | |
| Cinebench R23 / Multi Core | |
| Beelink SER4 | |
| Intel NUC11TNKi5 | |
| GMK NucBox 2 | |
| Beelink U59 | |
| Beelink SEi8 | |
| Genomsnitt Intel Core i3-8109U (n=1) | |
| HP 255 G7 159P1EA | |
| Microsoft Surface Go 3 Core i3 | |
| GMK NucBox 3 | |
| Teclast Tbook 16 Power | |
| Cinebench R23 / Single Core | |
| Intel NUC11TNKi5 | |
| Beelink SER4 | |
| GMK NucBox 2 | |
| Beelink SEi8 | |
| Genomsnitt Intel Core i3-8109U (n=1) | |
| Microsoft Surface Go 3 Core i3 | |
| HP 255 G7 159P1EA | |
| Beelink U59 | |
| GMK NucBox 3 | |
| Teclast Tbook 16 Power | |
| Cinebench R15 / CPU Multi 64Bit | |
| Beelink SER4 | |
| Intel NUC8i7BE | |
| Intel NUC11TNKi5 | |
| Apple MacBook Pro 13 2019 i5 4TB3 | |
| Apple MacBook Pro 13 2019 i5 4TB3 | |
| GMK NucBox 2 | |
| Acer Swift 3 SF314-42-R27B | |
| Beelink SEi10 | |
| Beelink U59 | |
| HP 255 G7 159P1EA | |
| Genomsnitt Intel Core i3-8109U (324 - 381, n=2) | |
| Beelink SEi8 | |
| Microsoft Surface Go 3 Core i3 | |
| GMK NucBox 3 | |
| Teclast Tbook 16 Power | |
| Chuwi LapBook Plus | |
| Cinebench R15 / CPU Single 64Bit | |
| Intel NUC11TNKi5 | |
| Intel NUC8i7BE | |
| Beelink SER4 | |
| Apple MacBook Pro 13 2019 i5 4TB3 | |
| Apple MacBook Pro 13 2019 i5 4TB3 | |
| Acer Swift 3 SF314-42-R27B | |
| Beelink SEi10 | |
| GMK NucBox 2 | |
| Genomsnitt Intel Core i3-8109U (124.3 - 153, n=2) | |
| HP 255 G7 159P1EA | |
| Beelink SEi8 | |
| Microsoft Surface Go 3 Core i3 | |
| Beelink U59 | |
| GMK NucBox 3 | |
| Chuwi LapBook Plus | |
| Teclast Tbook 16 Power | |
| Blender / v2.79 BMW27 CPU | |
| Teclast Tbook 16 Power | |
| Chuwi LapBook Plus | |
| GMK NucBox 3 | |
| Microsoft Surface Go 3 Core i3 | |
| Beelink U59 | |
| HP 255 G7 159P1EA | |
| Beelink SEi8 | |
| Genomsnitt Intel Core i3-8109U (n=1) | |
| Beelink SEi10 | |
| Acer Swift 3 SF314-42-R27B | |
| GMK NucBox 2 | |
| Intel NUC8i7BE | |
| Intel NUC8i7BE | |
| Apple MacBook Pro 13 2019 i5 4TB3 | |
| Intel NUC11TNKi5 | |
| Beelink SER4 | |
| 7-Zip 18.03 / 7z b 4 | |
| Beelink SER4 | |
| Intel NUC8i7BE | |
| Intel NUC8i7BE | |
| Intel NUC11TNKi5 | |
| Apple MacBook Pro 13 2019 i5 4TB3 | |
| GMK NucBox 2 | |
| Acer Swift 3 SF314-42-R27B | |
| Beelink U59 | |
| Beelink SEi10 | |
| Beelink SEi8 | |
| Genomsnitt Intel Core i3-8109U (n=1) | |
| HP 255 G7 159P1EA | |
| Microsoft Surface Go 3 Core i3 | |
| GMK NucBox 3 | |
| Chuwi LapBook Plus | |
| 7-Zip 18.03 / 7z b 4 -mmt1 | |
| Intel NUC8i7BE | |
| Intel NUC8i7BE | |
| Intel NUC11TNKi5 | |
| Beelink SER4 | |
| Apple MacBook Pro 13 2019 i5 4TB3 | |
| Beelink SEi10 | |
| Acer Swift 3 SF314-42-R27B | |
| GMK NucBox 2 | |
| Beelink SEi8 | |
| Genomsnitt Intel Core i3-8109U (n=1) | |
| Microsoft Surface Go 3 Core i3 | |
| HP 255 G7 159P1EA | |
| Beelink U59 | |
| GMK NucBox 3 | |
| Chuwi LapBook Plus | |
| Geekbench 5.5 / Multi-Core | |
| Beelink SER4 | |
| Intel NUC11TNKi5 | |
| Intel NUC8i7BE | |
| GMK NucBox 2 | |
| Acer Swift 3 SF314-42-R27B | |
| Beelink SEi10 | |
| Microsoft Surface Go 3 Core i3 | |
| Beelink SEi8 | |
| Genomsnitt Intel Core i3-8109U (n=1) | |
| HP 255 G7 159P1EA | |
| GMK NucBox 3 | |
| Teclast Tbook 16 Power | |
| Geekbench 5.5 / Single-Core | |
| Intel NUC11TNKi5 | |
| Beelink SER4 | |
| Beelink SEi10 | |
| Acer Swift 3 SF314-42-R27B | |
| Microsoft Surface Go 3 Core i3 | |
| GMK NucBox 2 | |
| Beelink SEi8 | |
| Genomsnitt Intel Core i3-8109U (n=1) | |
| HP 255 G7 159P1EA | |
| Intel NUC8i7BE | |
| GMK NucBox 3 | |
| Teclast Tbook 16 Power | |
| HWBOT x265 Benchmark v2.2 / 4k Preset | |
| Beelink SER4 | |
| Intel NUC11TNKi5 | |
| Apple MacBook Pro 13 2019 i5 4TB3 | |
| Intel NUC8i7BE | |
| Intel NUC8i7BE | |
| GMK NucBox 2 | |
| Acer Swift 3 SF314-42-R27B | |
| Beelink SEi10 | |
| Beelink SEi8 | |
| Genomsnitt Intel Core i3-8109U (n=1) | |
| Beelink U59 | |
| Microsoft Surface Go 3 Core i3 | |
| HP 255 G7 159P1EA | |
| GMK NucBox 3 | |
| Chuwi LapBook Plus | |
| Teclast Tbook 16 Power | |
| LibreOffice / 20 Documents To PDF | |
| Teclast Tbook 16 Power | |
| GMK NucBox 3 | |
| Microsoft Surface Go 3 Core i3 | |
| Beelink U59 | |
| HP 255 G7 159P1EA | |
| Beelink SEi8 | |
| Genomsnitt Intel Core i3-8109U (n=1) | |
| GMK NucBox 2 | |
| Beelink SER4 | |
| Acer Swift 3 SF314-42-R27B | |
| Beelink SEi10 | |
| Intel NUC11TNKi5 | |
| R Benchmark 2.5 / Overall mean | |
| Teclast Tbook 16 Power | |
| GMK NucBox 3 | |
| Beelink U59 | |
| Microsoft Surface Go 3 Core i3 | |
| Beelink SEi8 | |
| Genomsnitt Intel Core i3-8109U (n=1) | |
| HP 255 G7 159P1EA | |
| GMK NucBox 2 | |
| Beelink SEi10 | |
| Acer Swift 3 SF314-42-R27B | |
| Intel NUC8i7BE | |
| Intel NUC11TNKi5 | |
| Beelink SER4 | |
Cinebench R23: Multi Core | Single Core
Cinebench R15: CPU Multi 64Bit | CPU Single 64Bit
Blender: v2.79 BMW27 CPU
7-Zip 18.03: 7z b 4 | 7z b 4 -mmt1
Geekbench 5.5: Multi-Core | Single-Core
HWBOT x265 Benchmark v2.2: 4k Preset
LibreOffice : 20 Documents To PDF
R Benchmark 2.5: Overall mean
* ... mindre är bättre
AIDA64: FP32 Ray-Trace | FPU Julia | CPU SHA3 | CPU Queen | FPU SinJulia | FPU Mandel | CPU AES | CPU ZLib | FP64 Ray-Trace | CPU PhotoWorxx
| Performance rating | |
| Beelink SER4 | |
| Intel NUC11TNKi5 | |
| Intel NUC8i7BE -1! | |
| GMK NucBox 2 | |
| Beelink SEi8 | |
| AIDA64 / FP32 Ray-Trace | |
| Beelink SER4 | |
| Intel NUC11TNKi5 | |
| Intel NUC8i7BE | |
| GMK NucBox 2 | |
| Beelink SEi8 | |
| AIDA64 / FPU Julia | |
| Beelink SER4 | |
| Intel NUC11TNKi5 | |
| Intel NUC8i7BE | |
| GMK NucBox 2 | |
| Beelink SEi8 | |
| AIDA64 / CPU SHA3 | |
| Intel NUC11TNKi5 | |
| Beelink SER4 | |
| GMK NucBox 2 | |
| Beelink SEi8 | |
| AIDA64 / CPU Queen | |
| Beelink SER4 | |
| Intel NUC8i7BE | |
| Intel NUC11TNKi5 | |
| GMK NucBox 2 | |
| Beelink SEi8 | |
| AIDA64 / FPU SinJulia | |
| Beelink SER4 | |
| Intel NUC8i7BE | |
| Intel NUC11TNKi5 | |
| GMK NucBox 2 | |
| Beelink SEi8 | |
| AIDA64 / FPU Mandel | |
| Beelink SER4 | |
| Intel NUC11TNKi5 | |
| Intel NUC8i7BE | |
| GMK NucBox 2 | |
| Beelink SEi8 | |
| AIDA64 / CPU AES | |
| Intel NUC11TNKi5 | |
| Beelink SER4 | |
| Intel NUC8i7BE | |
| GMK NucBox 2 | |
| Beelink SEi8 | |
| AIDA64 / CPU ZLib | |
| Beelink SER4 | |
| Intel NUC11TNKi5 | |
| Intel NUC8i7BE | |
| GMK NucBox 2 | |
| Beelink SEi8 | |
| AIDA64 / FP64 Ray-Trace | |
| Beelink SER4 | |
| Intel NUC11TNKi5 | |
| Intel NUC8i7BE | |
| GMK NucBox 2 | |
| Beelink SEi8 | |
| AIDA64 / CPU PhotoWorxx | |
| Beelink SER4 | |
| Intel NUC8i7BE | |
| Intel NUC11TNKi5 | |
| Beelink SEi8 | |
| GMK NucBox 2 | |
Systemets prestanda
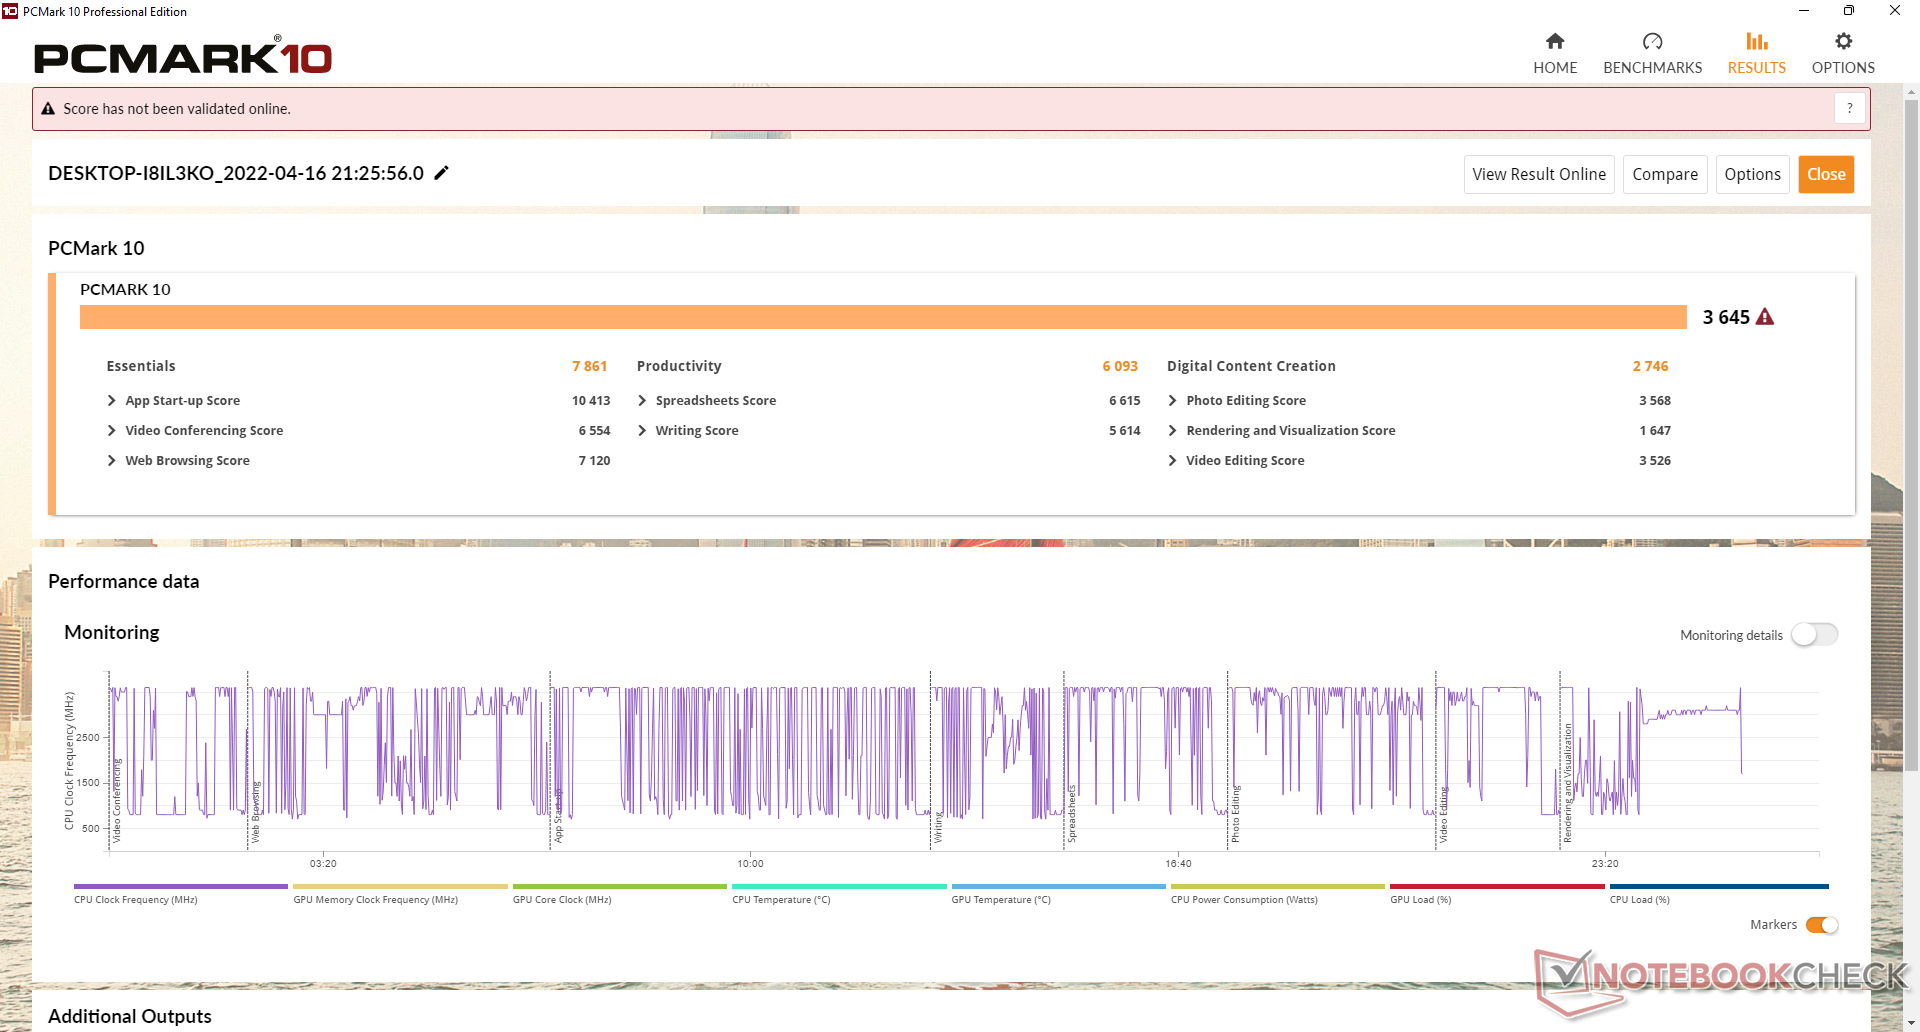
PCMark-resultaten är något bättre än SEi10, vilket sannolikt beror på den snabbare integrerade Iris-grafiken i SEi8. Vi upplevde inga problem med att köra Windows 11 Pro på vår testenhet bortsett från enstaka fördröjningar när vi startade program eller under måttlig multitasking.
| PCMark 10 / Score | |
| Beelink SER4 | |
| Intel NUC8i7BE | |
| Intel NUC11TNKi5 | |
| GMK NucBox 2 | |
| Beelink SEi8 | |
| Beelink SEi10 | |
| PCMark 10 / Essentials | |
| Beelink SER4 | |
| Intel NUC11TNKi5 | |
| Intel NUC8i7BE | |
| GMK NucBox 2 | |
| Beelink SEi8 | |
| Beelink SEi10 | |
| PCMark 10 / Productivity | |
| Beelink SER4 | |
| Intel NUC8i7BE | |
| GMK NucBox 2 | |
| Intel NUC11TNKi5 | |
| Beelink SEi8 | |
| Beelink SEi10 | |
| PCMark 10 / Digital Content Creation | |
| Beelink SER4 | |
| Intel NUC11TNKi5 | |
| Intel NUC8i7BE | |
| GMK NucBox 2 | |
| Beelink SEi8 | |
| Beelink SEi10 | |
| PCMark 10 Score | 3645 poäng | |
Hjälp | ||
| AIDA64 / Memory Copy | |
| Intel NUC8i7BE | |
| GMK NucBox 2 | |
| Beelink SER4 | |
| Beelink SEi8 | |
| Intel NUC11TNKi5 | |
| AIDA64 / Memory Read | |
| Intel NUC8i7BE | |
| Beelink SER4 | |
| GMK NucBox 2 | |
| Beelink SEi8 | |
| Intel NUC11TNKi5 | |
| AIDA64 / Memory Write | |
| Intel NUC8i7BE | |
| GMK NucBox 2 | |
| Beelink SER4 | |
| Intel NUC11TNKi5 | |
| Beelink SEi8 | |
| AIDA64 / Memory Latency | |
| Beelink SER4 | |
| Intel NUC11TNKi5 | |
| Beelink SEi8 | |
| GMK NucBox 2 | |
| Intel NUC8i7BE | |
* ... mindre är bättre
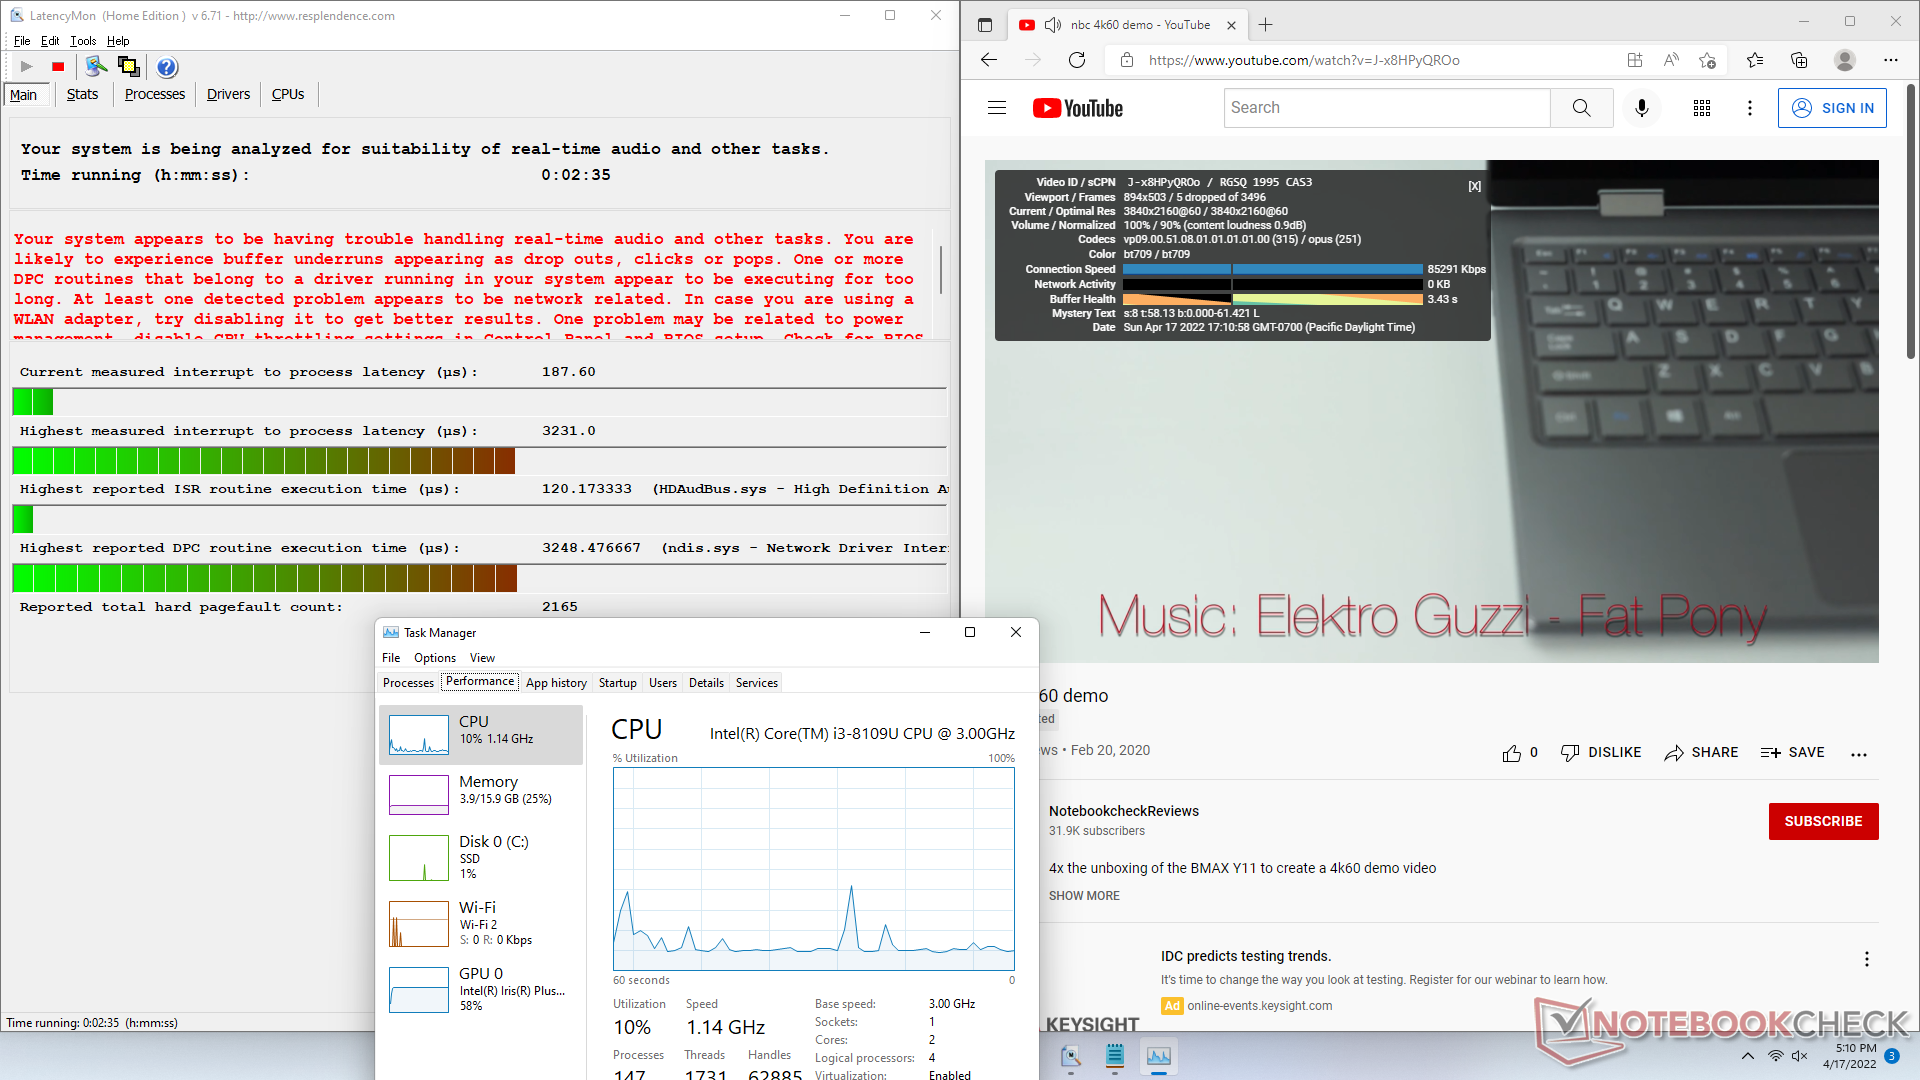
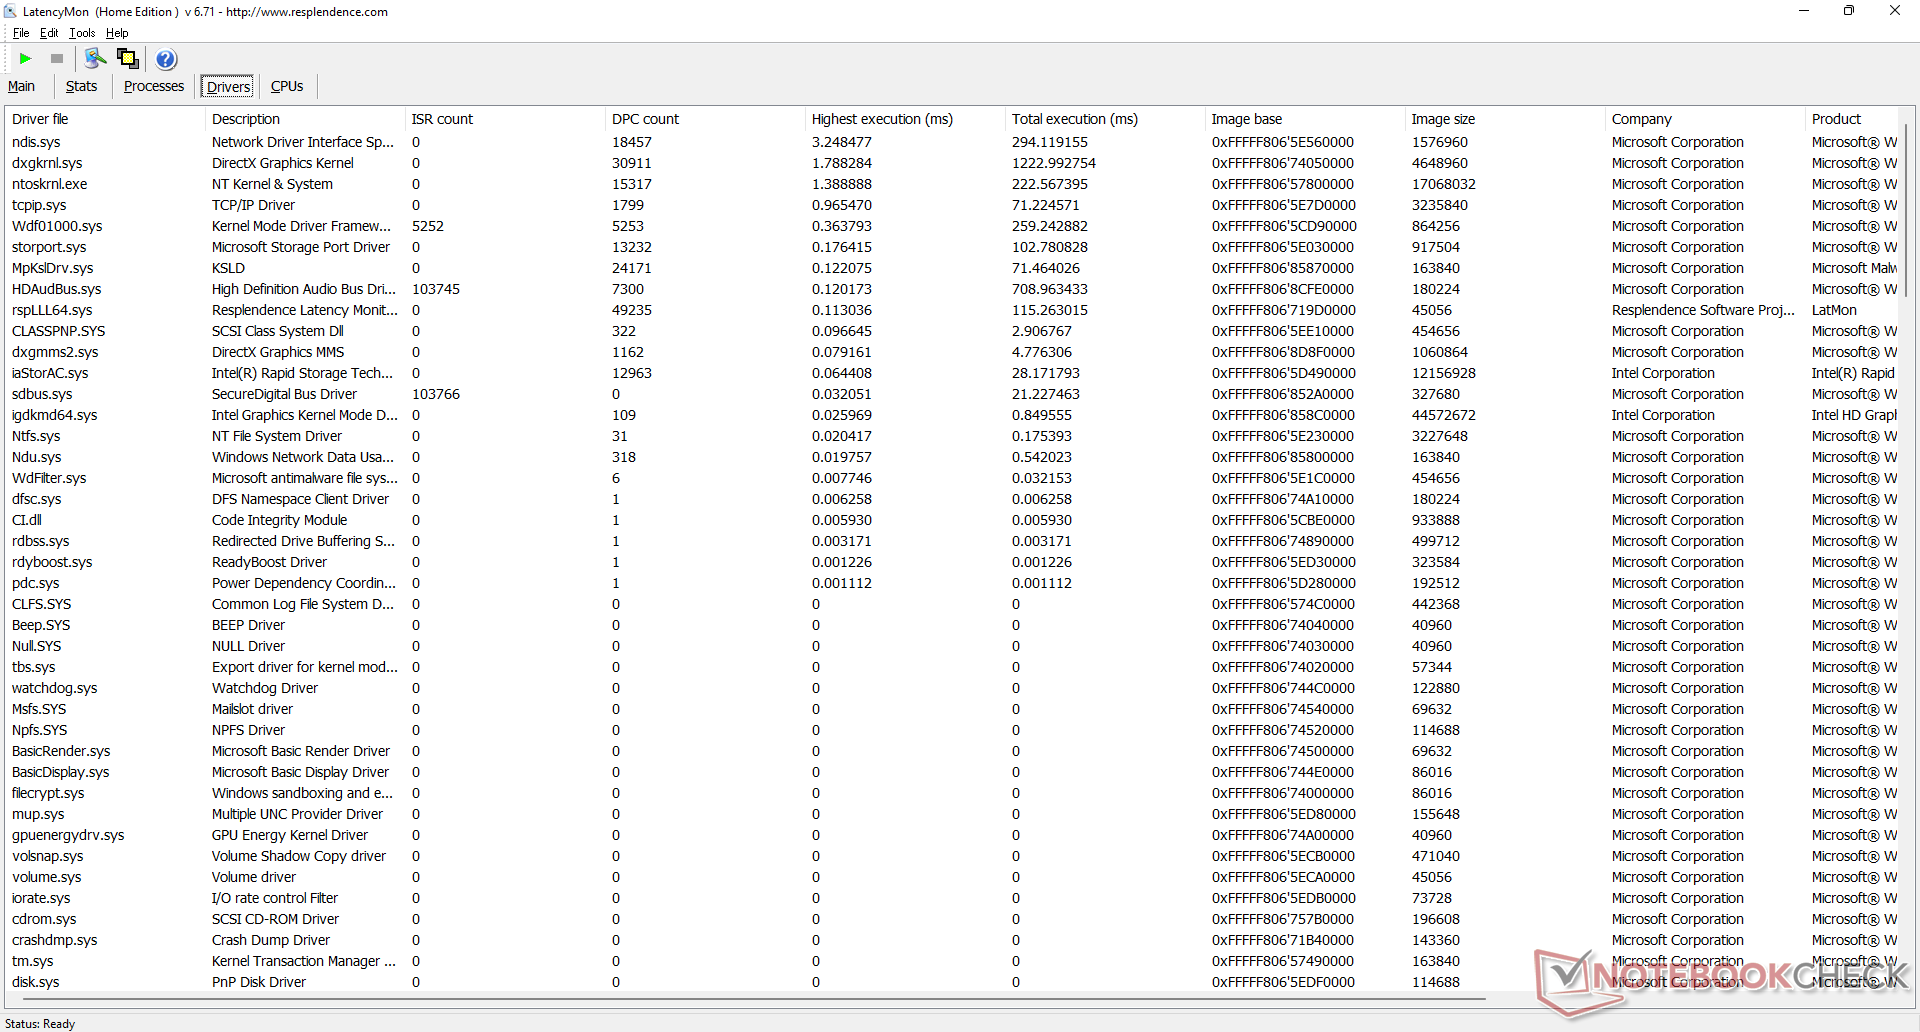
DPC-latenstid
LatencyMon avslöjar DPC-problem när du öppnar flera webbläsarflikar på vår hemsida. uppspelning av 4K-video är mestadels smidig med endast 5 tappade bilder under vårt minutlånga videotest.
| DPC Latencies / LatencyMon - interrupt to process latency (max), Web, Youtube, Prime95 | |
| Beelink SEi8 | |
| Beelink SEi10 | |
| GMK NucBox 2 | |
| Intel NUC11TNKi5 | |
| Beelink SER4 | |
* ... mindre är bättre
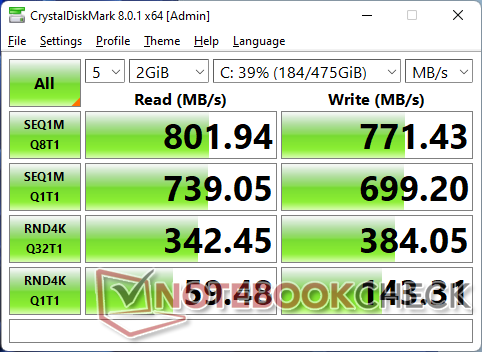
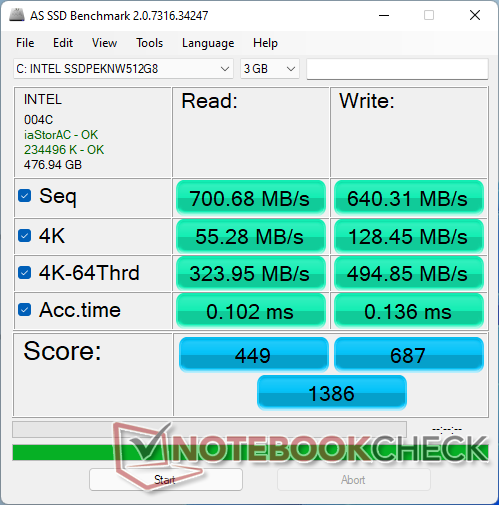
Lagringsenheter
Vår enhet är konfigurerad med ett budgetformat 512 GB Intel 660p NVMe SSD. Även om enheten i sig klarar av sekventiell läs- och skrivhastighet på upp till 1 500 MB/s respektive 1 000 MB/s, kan vi bara registrera maximalt 800 MB/s på vår SEi8.

| Drive Performance rating - Percent | |
| Beelink SER4 | |
| GMK NucBox 2 | |
| Beelink SEi8 | |
| Beelink SEi10 | |
| Intel NUC11TNKi5 | |
| DiskSpd | |
| seq read | |
| GMK NucBox 2 | |
| Beelink SER4 | |
| Beelink SEi10 | |
| Beelink SEi8 | |
| Intel NUC11TNKi5 | |
| seq write | |
| GMK NucBox 2 | |
| Beelink SER4 | |
| Beelink SEi10 | |
| Beelink SEi8 | |
| Intel NUC11TNKi5 | |
| seq q8 t1 read | |
| GMK NucBox 2 | |
| Beelink SEi10 | |
| Beelink SER4 | |
| Beelink SEi8 | |
| Intel NUC11TNKi5 | |
| seq q8 t1 write | |
| GMK NucBox 2 | |
| Beelink SER4 | |
| Beelink SEi10 | |
| Beelink SEi8 | |
| Intel NUC11TNKi5 | |
| 4k q1 t1 read | |
| Beelink SER4 | |
| Beelink SEi8 | |
| Beelink SEi10 | |
| GMK NucBox 2 | |
| Intel NUC11TNKi5 | |
| 4k q1 t1 write | |
| Beelink SER4 | |
| Beelink SEi10 | |
| GMK NucBox 2 | |
| Beelink SEi8 | |
| Intel NUC11TNKi5 | |
| 4k q32 t16 read | |
| Beelink SEi10 | |
| Beelink SEi8 | |
| Beelink SER4 | |
| GMK NucBox 2 | |
| Intel NUC11TNKi5 | |
| 4k q32 t16 write | |
| Beelink SER4 | |
| GMK NucBox 2 | |
| Beelink SEi8 | |
| Beelink SEi10 | |
| Intel NUC11TNKi5 | |
| AS SSD | |
| Score Total | |
| Beelink SER4 | |
| GMK NucBox 2 | |
| Beelink SEi8 | |
| Beelink SEi10 | |
| Intel NUC11TNKi5 | |
| Score Read | |
| GMK NucBox 2 | |
| Beelink SER4 | |
| Beelink SEi10 | |
| Beelink SEi8 | |
| Intel NUC11TNKi5 | |
| Score Write | |
| Beelink SER4 | |
| Beelink SEi8 | |
| GMK NucBox 2 | |
| Intel NUC11TNKi5 | |
| Beelink SEi10 | |
| Seq Read | |
| GMK NucBox 2 | |
| Beelink SER4 | |
| Beelink SEi10 | |
| Beelink SEi8 | |
| Intel NUC11TNKi5 | |
| Seq Write | |
| GMK NucBox 2 | |
| Beelink SER4 | |
| Beelink SEi8 | |
| Intel NUC11TNKi5 | |
| Beelink SEi10 | |
| 4K Read | |
| Beelink SER4 | |
| Beelink SEi8 | |
| GMK NucBox 2 | |
| Beelink SEi10 | |
| Intel NUC11TNKi5 | |
| 4K Write | |
| Beelink SER4 | |
| GMK NucBox 2 | |
| Beelink SEi8 | |
| Beelink SEi10 | |
| Intel NUC11TNKi5 | |
| 4K-64 Read | |
| GMK NucBox 2 | |
| Beelink SEi10 | |
| Beelink SEi8 | |
| Beelink SER4 | |
| Intel NUC11TNKi5 | |
| 4K-64 Write | |
| Beelink SER4 | |
| Beelink SEi8 | |
| GMK NucBox 2 | |
| Intel NUC11TNKi5 | |
| Beelink SEi10 | |
| Access Time Read | |
| Intel NUC11TNKi5 | |
| Beelink SEi8 | |
| Beelink SER4 | |
| Beelink SEi10 | |
| GMK NucBox 2 | |
| Access Time Write | |
| Beelink SEi10 | |
| GMK NucBox 2 | |
| Intel NUC11TNKi5 | |
| Beelink SER4 | |
| Beelink SEi8 | |
* ... mindre är bättre
Disk Throttling: DiskSpd Read Loop, Queue Depth 8
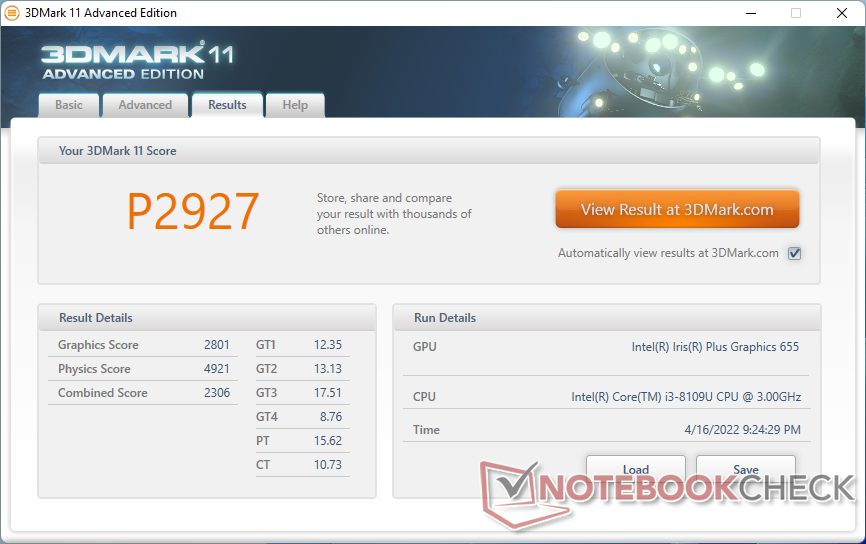
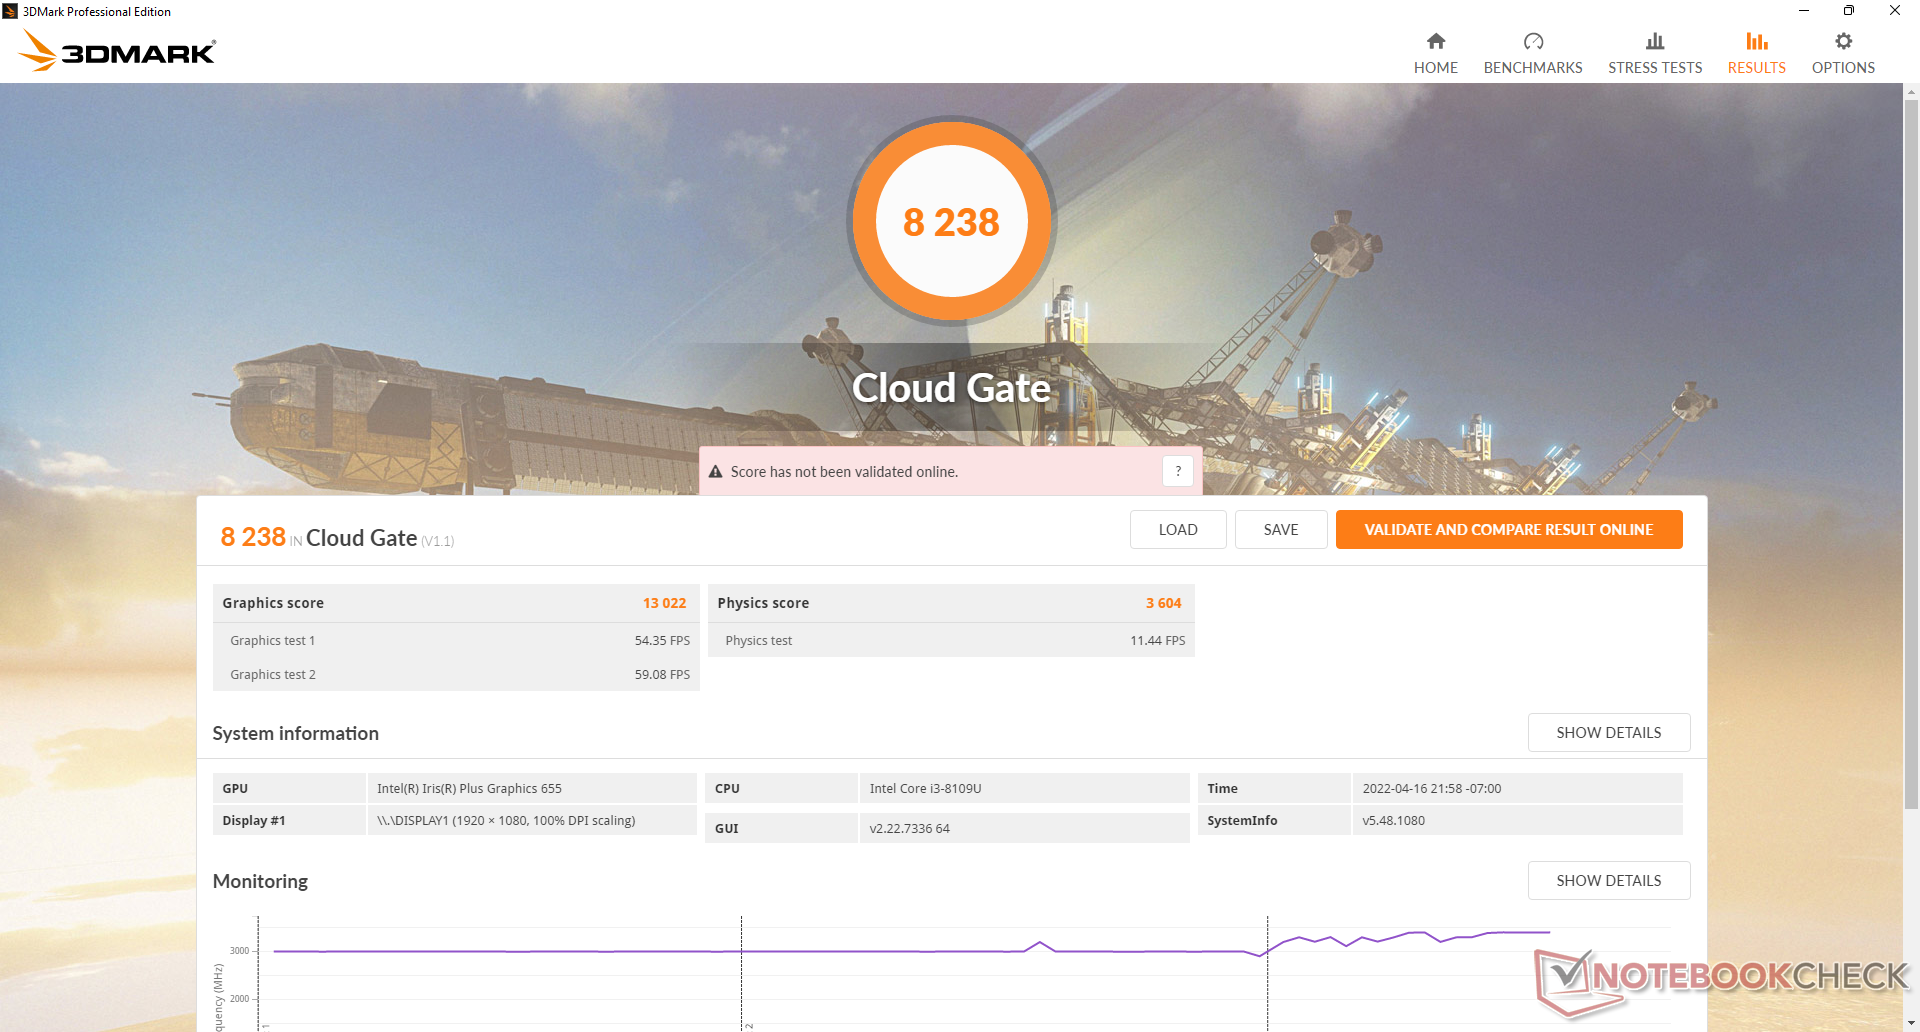
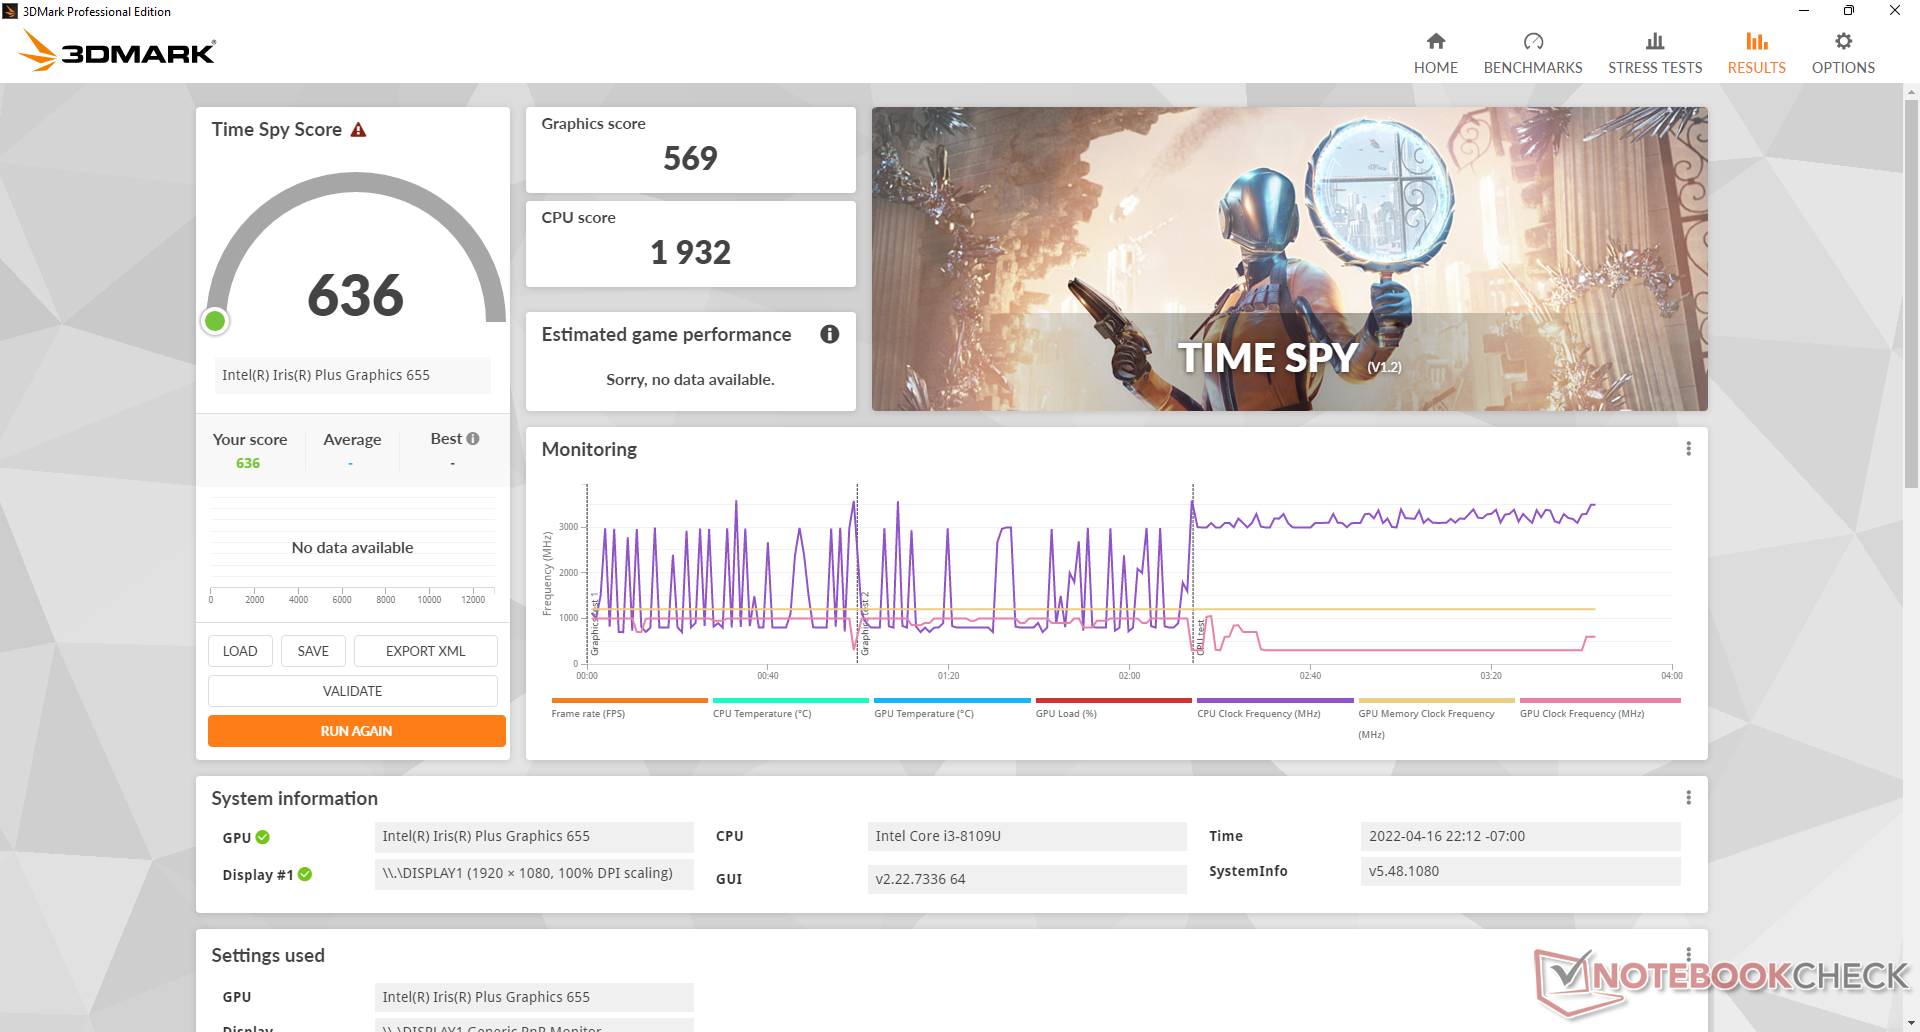
GPU-prestanda
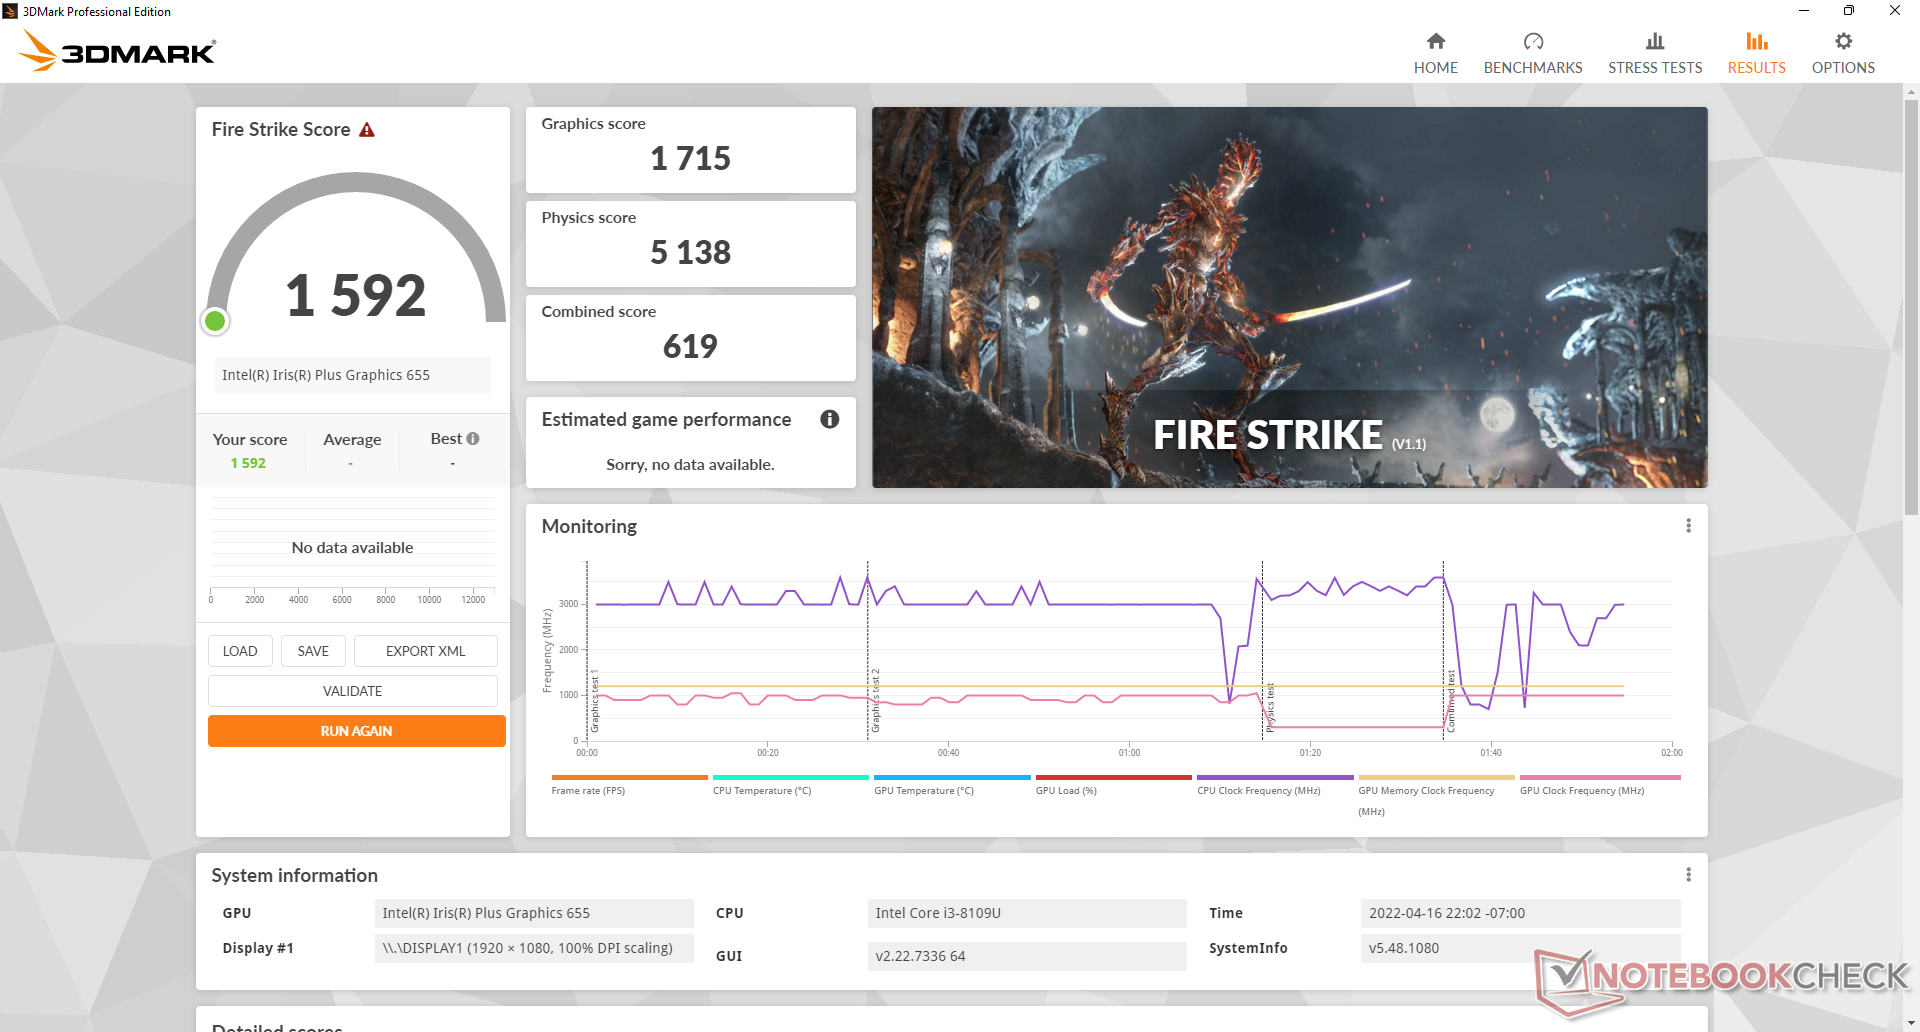
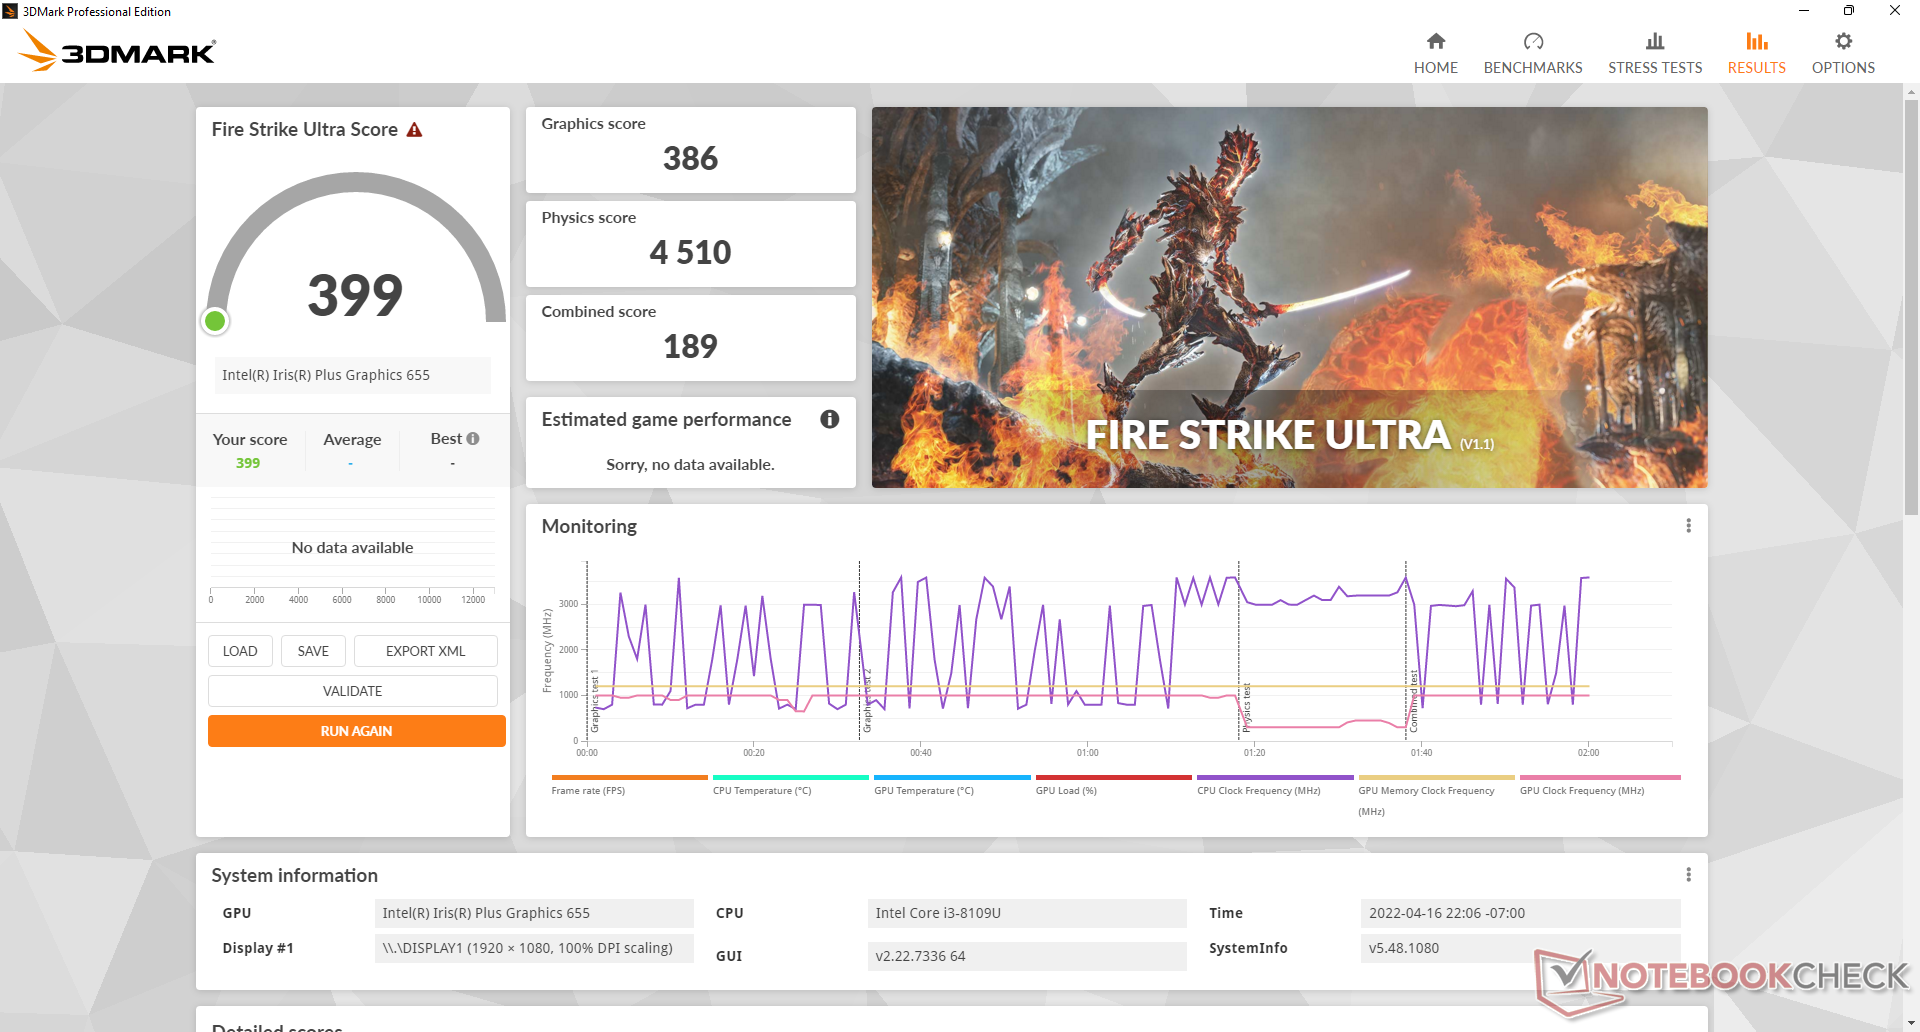
Rå grafikprestanda från Iris Plus 655 är ungefär 40-50 procent snabbare än den genomsnittliga UHD Graphics 620 som finns i många äldre Intel-drivna minidatorer före 10:e generationen Ice Lake. Prestandaförstärkningen är respektabel för uppgifter som streaming och uppspelning av 4K-video, men den är långt ifrån tillräcklig för speländamål Witcher 3, till exempel, skulle ha problem med att starta på vår testenhet även efter att ha uppdaterat alla Windows- och grafikdrivrutiner
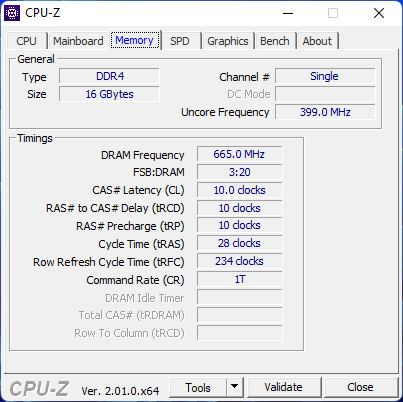
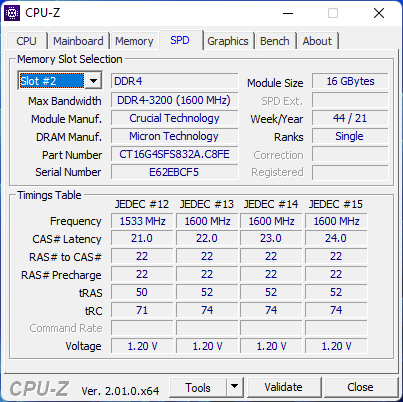
Eftersom vår testenhet endast levererades med enkelkanalsminne kommer resultaten sannolikt att vara snabbare än vad vi har registrerat nedan om den konfigureras med dubbelkanalsminne i stället.
| 3DMark | |
| 1280x720 Cloud Gate Standard Graphics | |
| VAIO SX12 VJS124X1011P | |
| Beelink SER4 | |
| Intel NUC11TNKi5 | |
| Acer Swift 3 SF314-42-R27B | |
| Intel NUC8i7BE | |
| GMK NucBox 2 | |
| Genomsnitt Intel Iris Plus Graphics 655 (6498 - 16698, n=9) | |
| Beelink SEi8 | |
| HP 255 G7 159P1EA | |
| Genomsnitt Intel UHD Graphics 620 (6205 - 16400, n=225) | |
| Beelink SEi10 | |
| Beelink U59 | |
| Chuwi LapBook Plus | |
| GMK NucBox 3 | |
| Teclast Tbook 16 Power | |
| 1920x1080 Fire Strike Graphics | |
| VAIO SX12 VJS124X1011P | |
| Beelink SER4 | |
| Intel NUC11TNKi5 | |
| Acer Swift 3 SF314-42-R27B | |
| Intel NUC8i7BE | |
| GMK NucBox 2 | |
| Genomsnitt Intel Iris Plus Graphics 655 (920 - 2260, n=9) | |
| Beelink SEi8 | |
| HP 255 G7 159P1EA | |
| Genomsnitt Intel UHD Graphics 620 (557 - 2608, n=213) | |
| Beelink SEi10 | |
| Beelink U59 | |
| GMK NucBox 3 | |
| 2560x1440 Time Spy Graphics | |
| VAIO SX12 VJS124X1011P | |
| Beelink SER4 | |
| Intel NUC11TNKi5 | |
| Acer Swift 3 SF314-42-R27B | |
| Intel NUC8i7BE | |
| GMK NucBox 2 | |
| Genomsnitt Intel Iris Plus Graphics 655 (301 - 633, n=10) | |
| Beelink SEi8 | |
| HP 255 G7 159P1EA | |
| Genomsnitt Intel UHD Graphics 620 (299 - 797, n=88) | |
| Beelink SEi10 | |
| Beelink U59 | |
| Chuwi LapBook Plus | |
| GMK NucBox 3 | |
| 3DMark 11 - 1280x720 Performance GPU | |
| Beelink SER4 | |
| VAIO SX12 VJS124X1011P | |
| Intel NUC11TNKi5 | |
| Acer Swift 3 SF314-42-R27B | |
| Intel NUC8i7BE | |
| GMK NucBox 2 | |
| Beelink SEi8 | |
| Genomsnitt Intel Iris Plus Graphics 655 (1365 - 3081, n=8) | |
| HP 255 G7 159P1EA | |
| Genomsnitt Intel UHD Graphics 620 (1144 - 3432, n=244) | |
| Beelink SEi10 | |
| Microsoft Surface Go 3 Core i3 | |
| Beelink U59 | |
| Chuwi LapBook Plus | |
| GMK NucBox 3 | |
| Teclast Tbook 16 Power | |
| 3DMark 11 Performance | 2927 poäng | |
| 3DMark Cloud Gate Standard Score | 8238 poäng | |
| 3DMark Fire Strike Score | 1592 poäng | |
| 3DMark Time Spy Score | 636 poäng | |
Hjälp | ||
| Final Fantasy XV Benchmark | |
| 1280x720 Lite Quality | |
| Beelink SER4 | |
| Intel NUC11TNKi5 | |
| GMK NucBox 2 | |
| Intel NUC8i7BE | |
| Beelink SEi8 | |
| Genomsnitt Intel Iris Plus Graphics 655 (9.11 - 18.1, n=8) | |
| Beelink U59 | |
| GMK NucBox 3 | |
| 1920x1080 Standard Quality | |
| Beelink SER4 | |
| Intel NUC11TNKi5 | |
| GMK NucBox 2 | |
| Genomsnitt Intel Iris Plus Graphics 655 (7.88 - 9.73, n=4) | |
| Beelink SEi8 | |
| 1920x1080 High Quality | |
| Beelink SER4 | |
| Intel NUC11TNKi5 | |
| Beelink SEi8 | |
| GMK NucBox 2 | |
| Genomsnitt Intel Iris Plus Graphics 655 (5.25 - 6.55, n=4) | |
| X-Plane 11.11 | |
| 1280x720 low (fps_test=1) | |
| Beelink SER4 | |
| Intel NUC11TNKi5 | |
| Intel NUC8i7BE | |
| Acer Swift 3 SF314-42-R27B | |
| Genomsnitt Intel Iris Plus Graphics 655 (13.8 - 42.8, n=7) | |
| GMK NucBox 2 | |
| Beelink SEi8 | |
| HP 255 G7 159P1EA | |
| Beelink U59 | |
| Microsoft Surface Go 3 Core i3 | |
| GMK NucBox 3 | |
| 1920x1080 med (fps_test=2) | |
| Beelink SER4 | |
| Intel NUC11TNKi5 | |
| Acer Swift 3 SF314-42-R27B | |
| Intel NUC8i7BE | |
| Genomsnitt Intel Iris Plus Graphics 655 (9.75 - 29.5, n=7) | |
| GMK NucBox 2 | |
| Beelink SEi8 | |
| HP 255 G7 159P1EA | |
| Beelink U59 | |
| Microsoft Surface Go 3 Core i3 | |
| GMK NucBox 3 | |
| 1920x1080 high (fps_test=3) | |
| Beelink SER4 | |
| Intel NUC11TNKi5 | |
| Acer Swift 3 SF314-42-R27B | |
| Intel NUC8i7BE | |
| GMK NucBox 2 | |
| Genomsnitt Intel Iris Plus Graphics 655 (8.55 - 25.1, n=7) | |
| Beelink SEi8 | |
| HP 255 G7 159P1EA | |
| Beelink U59 | |
| Microsoft Surface Go 3 Core i3 | |
| GMK NucBox 3 | |
| låg | med. | hög | ultra | |
|---|---|---|---|---|
| Dota 2 Reborn (2015) | 94.4 | 34.6 | 25.3 | 22.7 |
| Final Fantasy XV Benchmark (2018) | 16.6 | 8.8 | 6.08 | |
| X-Plane 11.11 (2018) | 22.4 | 15 | 12.3 |
Utsläpp
Systembrus
Fläktljudet är till stor del binärt i den meningen att varvtalen tenderar att fluktuera mellan minimum och maximum med mycket små steg däremellan. Med andra ord, räkna med att fläkten går från tyst till bullrig ganska ofta när du multitaskar eller startar program. Det är inte lika illa som på den kraftfullare Beelink GTi11-serien eller SER4, men växlingarna i fläktljudet är ändå mer märkbara och frekventa jämfört med en NUC.
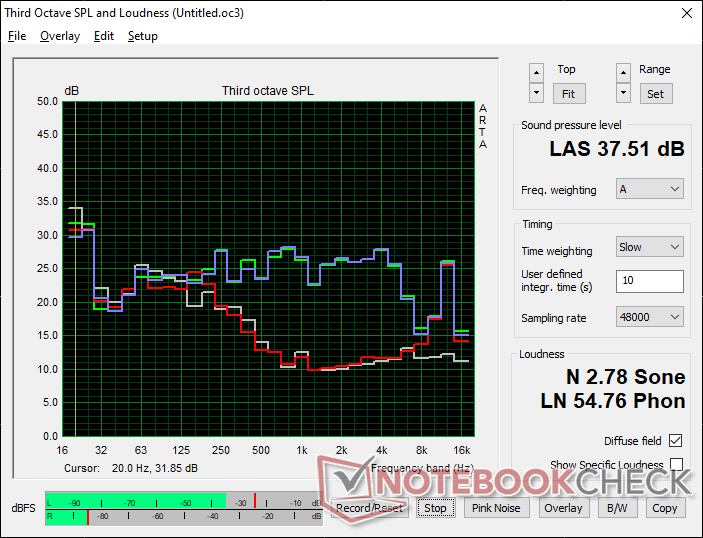
Ljudnivå
| Låg belastning |
| 26.5 / 26.5 / 31.1 dB(A) |
| Hög belastning |
| 37.7 / 37.5 dB(A) |
 | ||
30 dB tyst 40 dB(A) hörbar 50 dB(A) högt ljud |
||
min: | ||
| Beelink SEi8 Iris Plus Graphics 655, i3-8109U, Intel SSD 660p SSDPEKNW512G8 | Beelink SEi10 UHD Graphics G1 (Ice Lake 32 EU), i3-1005G1, Silicon Motion AZW 256G M.2280 NVMe 4X 200725 D | Beelink SER4 Vega 8, R7 4800U, Intel SSD 660p SSDPEKNW512G8 | Intel NUC11TNKi5 Iris Xe G7 80EUs, i5-1135G7, Transcend M.2 SSD 430S TS512GMTS430S | Intel NUC8i7BE Iris Plus Graphics 655, i7-8559U | GMK NucBox 2 Iris Plus Graphics 655, i5-8259U, Netac S930E8/256GPN | |
|---|---|---|---|---|---|---|
| Noise | -17% | -11% | -18% | -9% | 5% | |
| av / miljö * (dB) | 24.5 | 27.5 -12% | 23.4 4% | 24.8 -1% | 28.7 -17% | 25.6 -4% |
| Idle Minimum * (dB) | 26.5 | 30.9 -17% | 33.2 -25% | 35.6 -34% | 28.7 -8% | 25.7 3% |
| Idle Average * (dB) | 26.5 | 33.5 -26% | 33.2 -25% | 35.6 -34% | 29.3 -11% | 25.7 3% |
| Idle Maximum * (dB) | 31.1 | 33.5 -8% | 33.2 -7% | 35.6 -14% | 31.8 -2% | 25.7 17% |
| Load Average * (dB) | 37.7 | 38.5 -2% | 38.6 -2% | 36.2 4% | 39 -3% | 35.3 6% |
| Load Maximum * (dB) | 37.5 | 51.6 -38% | 40.8 -9% | 47.6 -27% | 41.4 -10% | 35.1 6% |
| Witcher 3 ultra * (dB) | 39.2 | 38 | 39 |
* ... mindre är bättre
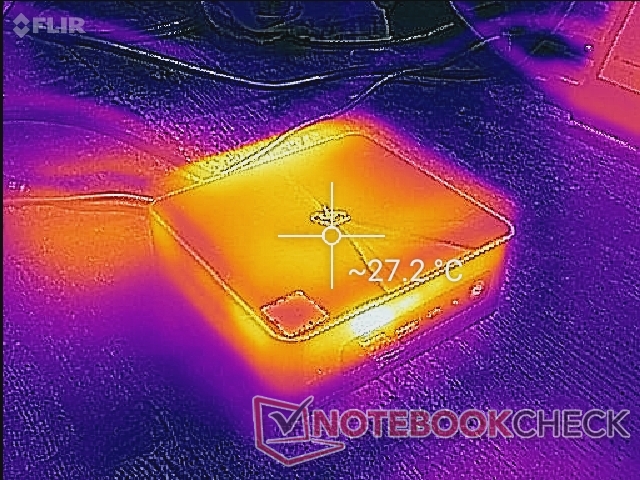
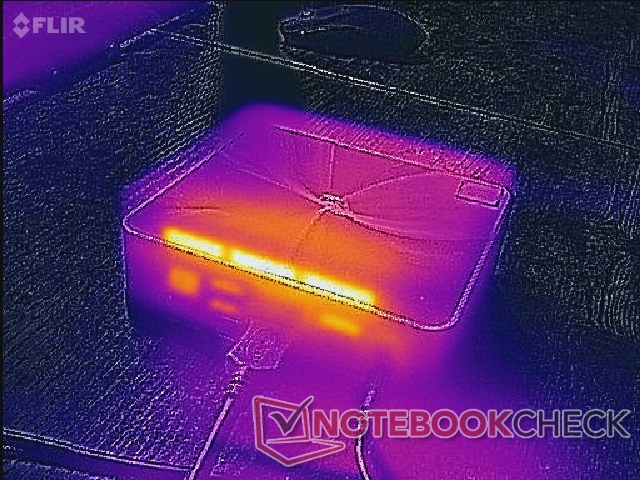
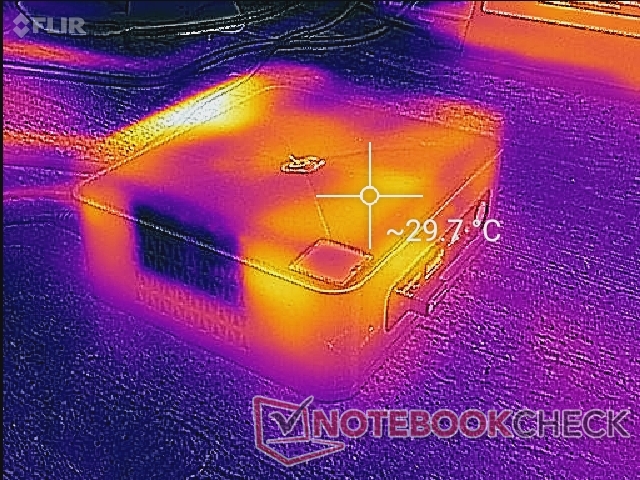
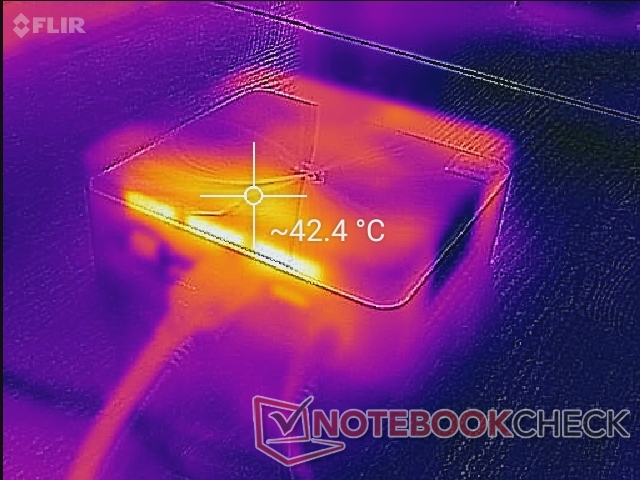
Temperatur
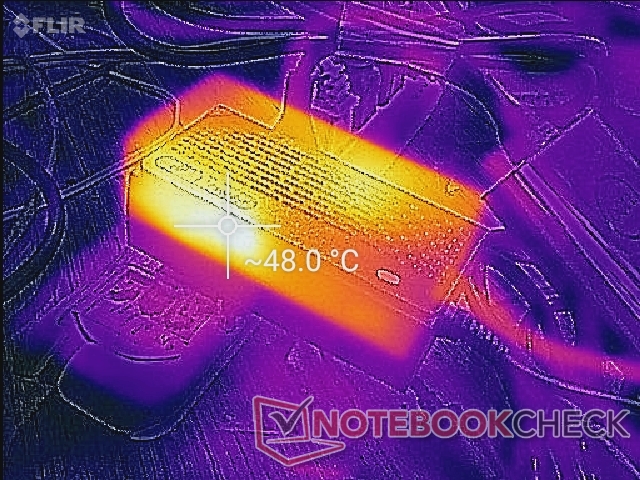
Till skillnad från den kraftfullare SER4 har SEi8 inga ventilationsgaller på ovansidan, vilket gör att användare kan placera papper och andra föremål på ovansidan utan att det påverkar kylningen. Luftintagsventilerna finns endast längs chassits två sidor. Hotspoten kan nå över 42 C på ovansidan närmast baksidan och intill avgasgallren.
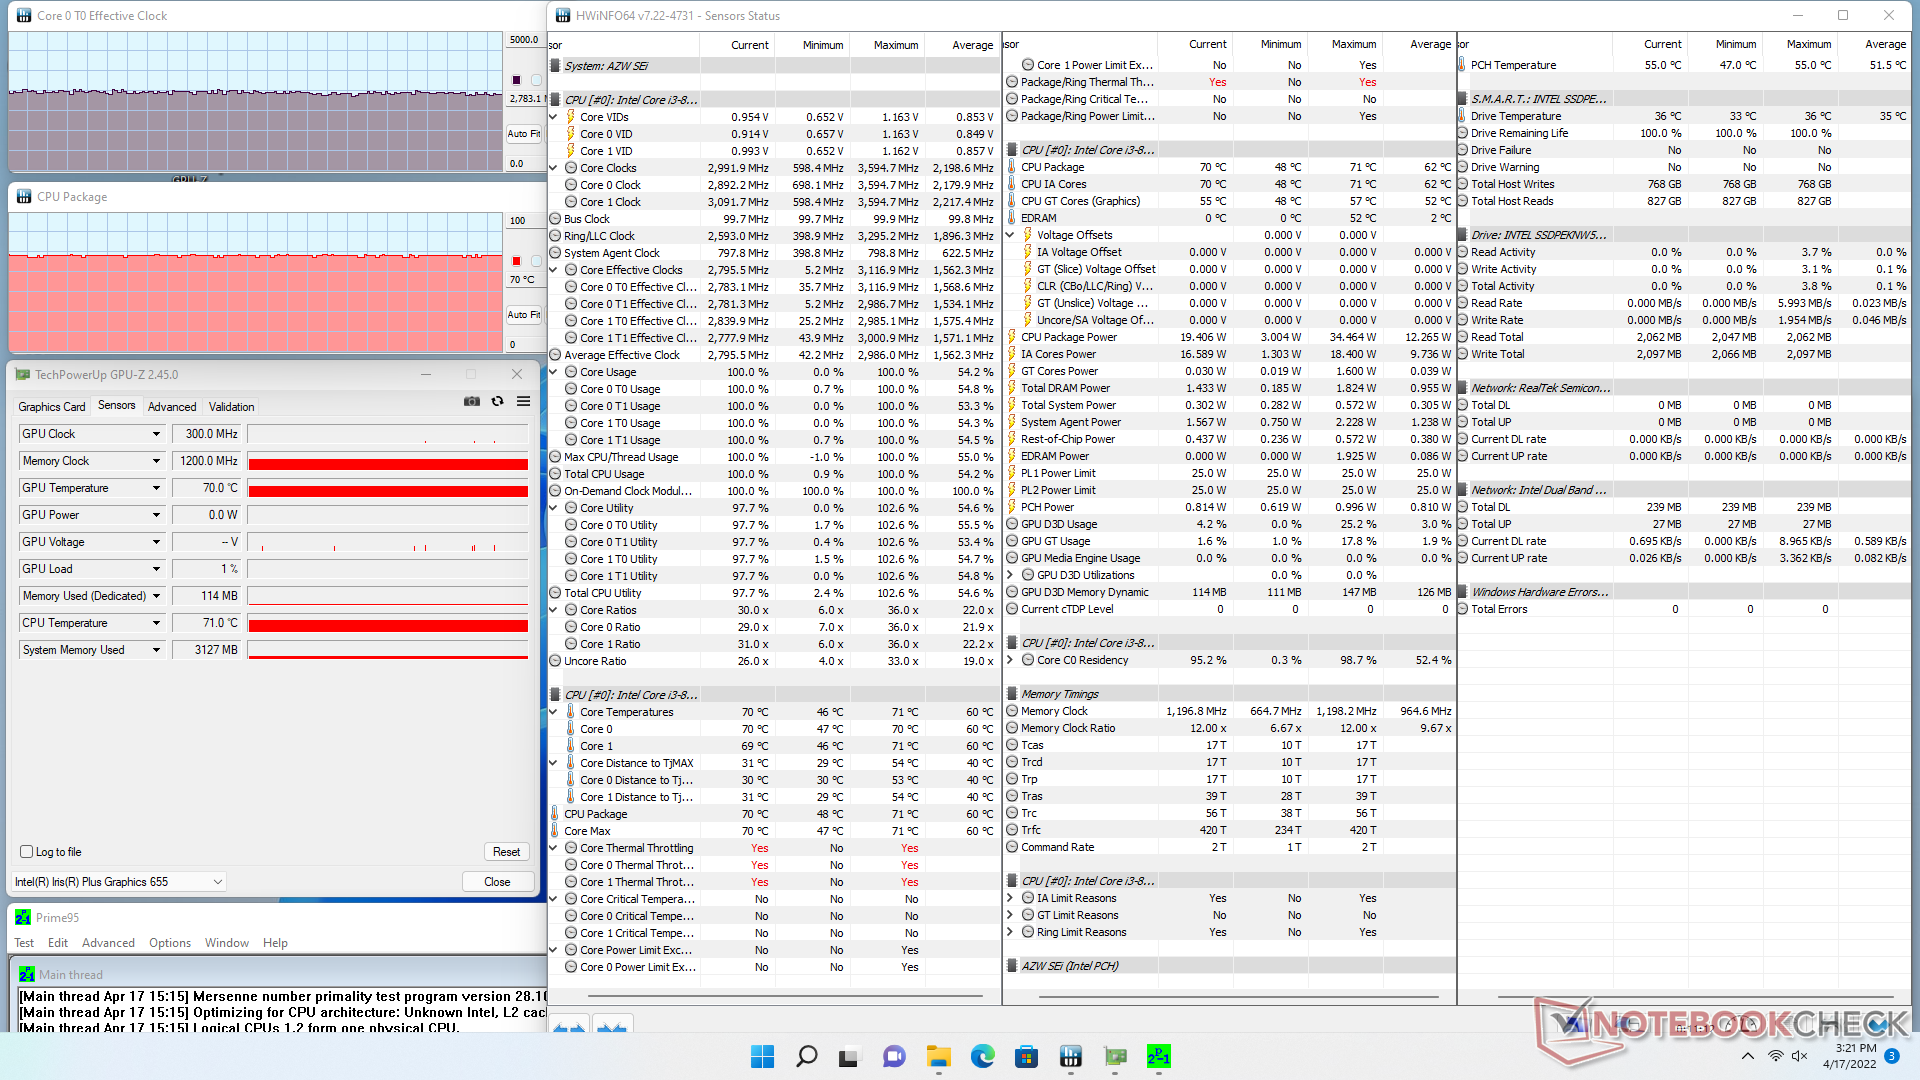
Stresstest
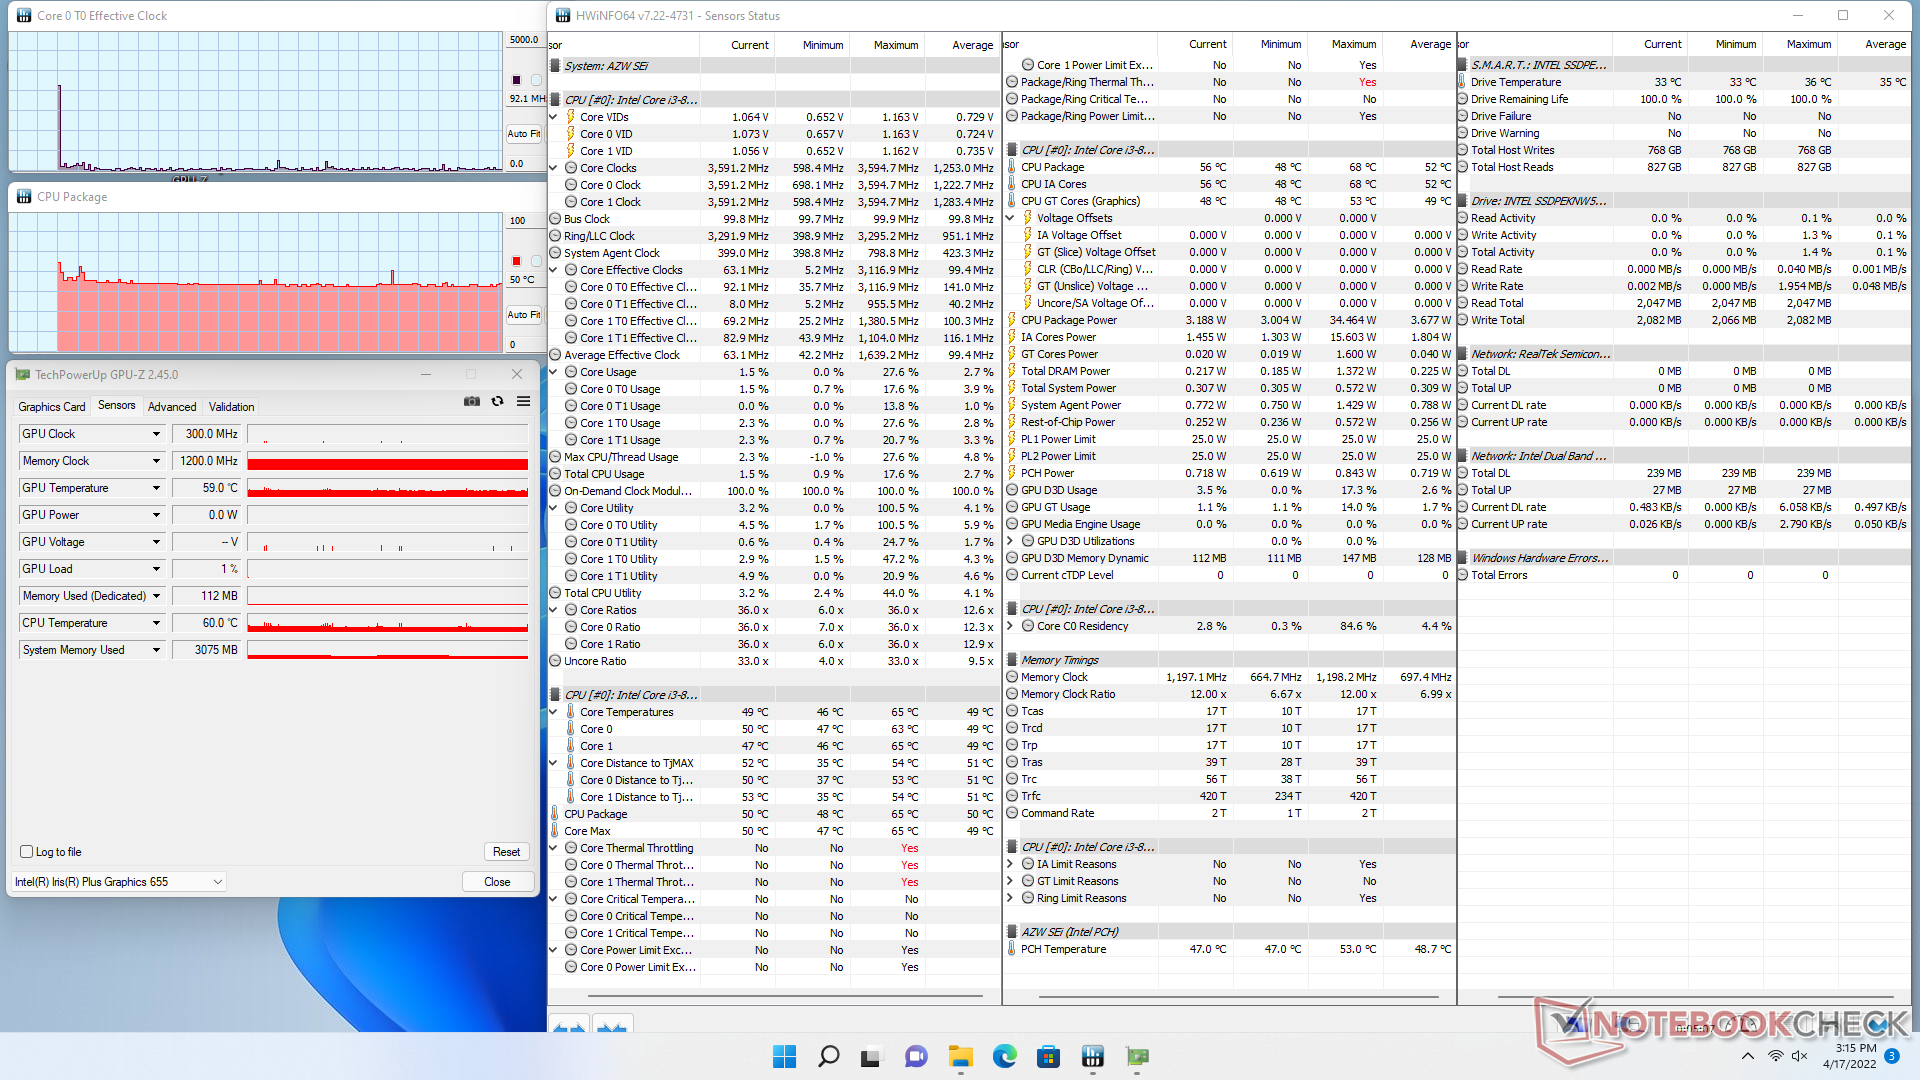
När Prime95 kördes ökade CPU:n till 2,9 GHz innan den stabiliserades på 2,8 GHz och 70 C. CPU-paketets effekt var också så hög som 34,4 W i början av testet innan den sjönk och stabiliserades på 19,4 W. När samma test kördes på SEi10 med den nyare 10:e generationens Core i3-1005G1 skulle ge både högre klockfrekvenser och kärntemperaturer på 3,4 GHz respektive 90 C.
| CPU-klocka (GHz) | GPU-klocka (MHz) | Genomsnittlig CPU-temperatur (°C) | |
| Systemets tomgång | -- | -- | 50 |
| Prime95 Stress | 2.8 | -- | 70 |
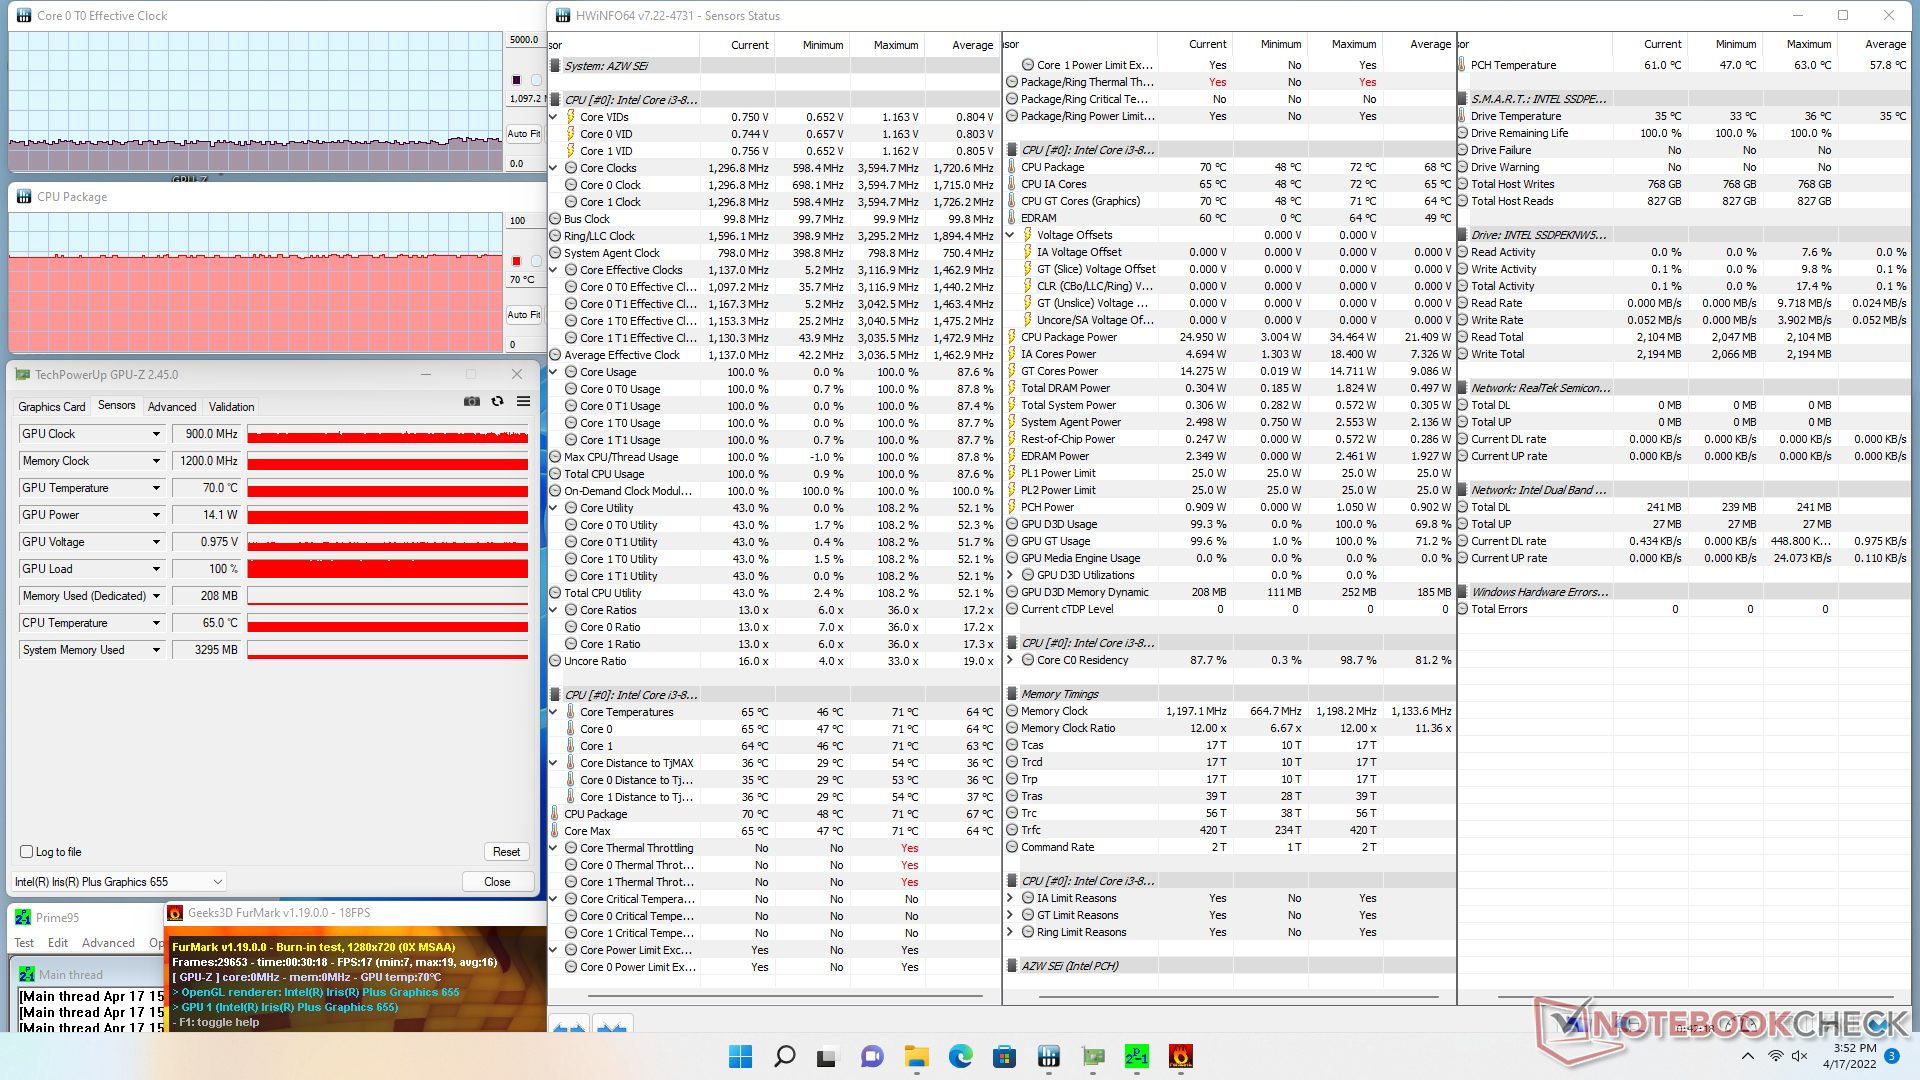
| Prime95 + FurMark Stress | 1,1 | 900 | 70 |
Energiförvaltning
Effektförbrukning
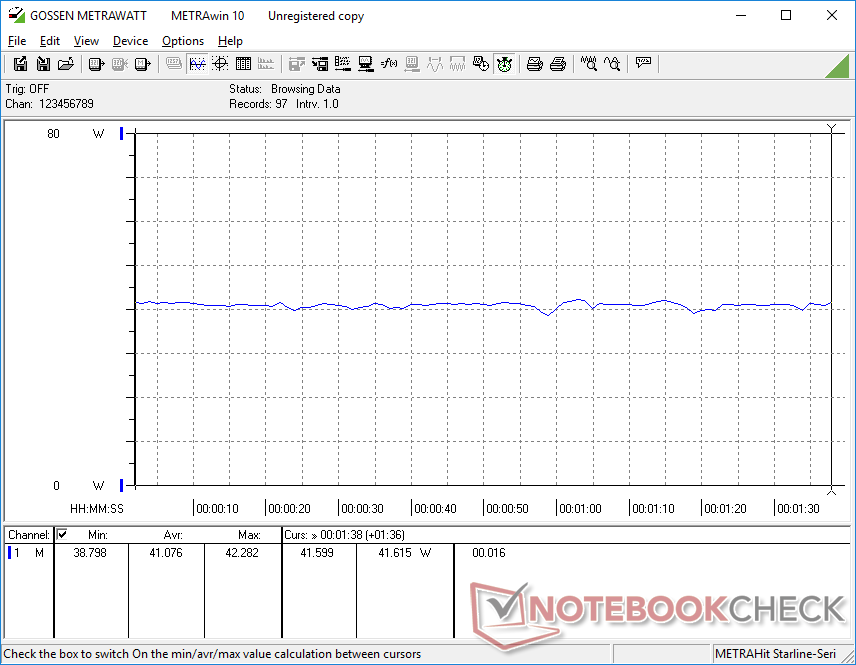
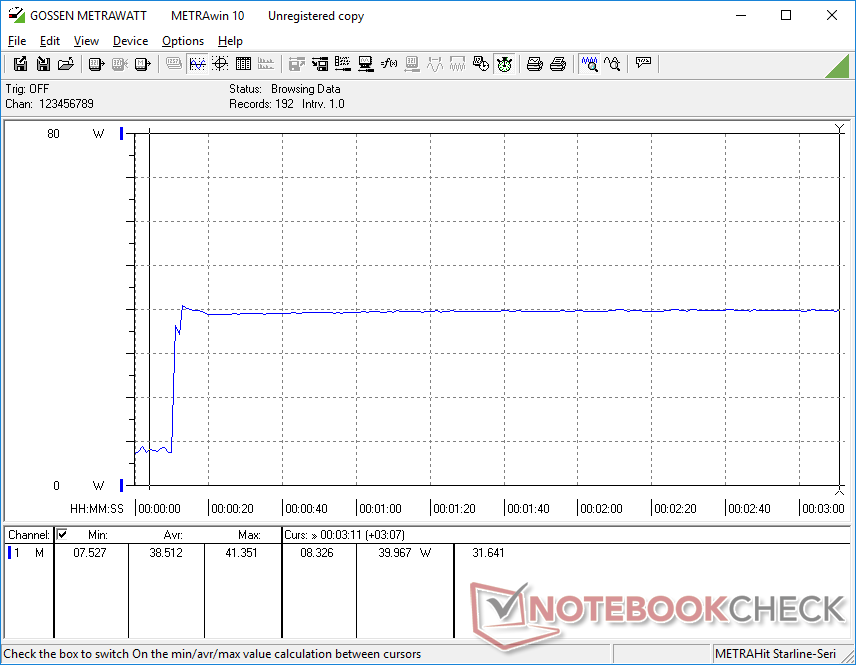
SEi8 förbrukar ungefär lika mycket ström som NUC 11 med nyare 11:e generationens CPU:er trots prestandafördelarna med 11:e generationens CPU-serie. Detta beror på att den 8:e generationens serie är mycket mindre optimerad, särskilt när det gäller integrerad grafikprestanda. För högre prestanda per watt bör användare överväga SEi8 med Core i5-8279U eller SEi10-serien istället.
Räkna med att systemet förbrukar drygt 40 W när det körs krävande belastningar.

| Av/Standby | |
| Låg belastning | |
| Hög belastning |
|
Förklaring:
min: | |
| Beelink SEi8 i3-8109U, Iris Plus Graphics 655, Intel SSD 660p SSDPEKNW512G8, , x, | Beelink SEi10 i3-1005G1, UHD Graphics G1 (Ice Lake 32 EU), Silicon Motion AZW 256G M.2280 NVMe 4X 200725 D, , x, | Beelink SER4 R7 4800U, Vega 8, Intel SSD 660p SSDPEKNW512G8, , x, | Intel NUC11TNKi5 i5-1135G7, Iris Xe G7 80EUs, Transcend M.2 SSD 430S TS512GMTS430S, , x, | Intel NUC8i7BE i7-8559U, Iris Plus Graphics 655, , , x, | GMK NucBox 2 i5-8259U, Iris Plus Graphics 655, Netac S930E8/256GPN, , x, | |
|---|---|---|---|---|---|---|
| Power Consumption | 16% | 32% | -47% | 4% | 3% | |
| Idle Minimum * (Watt) | 7.5 | 6.3 16% | 4.1 45% | 11.5 -53% | 2.7 64% | 6.1 19% |
| Idle Average * (Watt) | 7.6 | 6.6 13% | 4.1 46% | 12.4 -63% | 3.1 59% | 6.8 11% |
| Idle Maximum * (Watt) | 9.2 | 6.7 27% | 4.6 50% | 12.9 -40% | 6.3 32% | 7.3 21% |
| Load Average * (Watt) | 41.1 | 25.9 37% | 35.6 13% | 40.7 1% | 59.7 -45% | 46.3 -13% |
| Load Maximum * (Watt) | 41.4 | 46.7 -13% | 39.9 4% | 73.5 -78% | 78 -88% | 50.7 -22% |
| Witcher 3 ultra * (Watt) | 35.6 | 43.9 | 47.2 |
* ... mindre är bättre
Power Consumption Witcher 3 / Stresstest
För
Emot
Dom
Precis som de flesta andra minidatorer från Beelink är det låga priset på SEi8 den största fördelen jämfört med konkurrenterna. En fullt utrustad SEi8 med Core i3-3109U CPU, 16 GB RAM, licensierat Windows 11 Pro och 256 GB NVMe SSD säljs för cirka 380 USD medan en barebones Intel NUC8I3BEK med exakt samma processor men i en barebones-konfiguration kan hittas online för 350 USD.
För att vara en fyra år gammal processor är Core i3-8109U precis tillräckligt snabb för grundläggande HTPC-tillämpningar som surfning, streaming, OS-navigering och lätt multitasking utan de konstanta avmattningar som ofta upplevs på svagare Celeron- eller Atom-baserade lösningar. Om du försöker gå så billigt som möjligt och samtidigt minimera påverkan på användarupplevelsen bör SEi8 Core i3 vara nära toppen av din lista. Att gå upp till SEi8 Core i5 kommer att öka prestandan avsevärt utan alltför stor prisökning för användare som behöver en snabbare processor med längre ben och mer multitaskingpotential.
Noterbara nackdelar med Intel NUC är bland annat tunnare chassimaterial, långsammare WLAN-modul, kortare garanti, mer frekventa fläktpulseringar, ingen SD-kortläsare och mer begränsade BIOS-alternativ. Tack och lov är dessa nedskärningar inte tillräckliga för att vara en deal breaker för målgruppen budget-HTPC-uppsättning.
Pris och tillgänglighet
Beelink levererar nu SEi8 i flera olika konfigurationer från 319 USD. Alternativt kan användarna beställa på från Amazon för 359 USD.
Price comparison

