Recension av Schenker Vision 14 - Massiv prestandauppgradering med Core i7-12700H
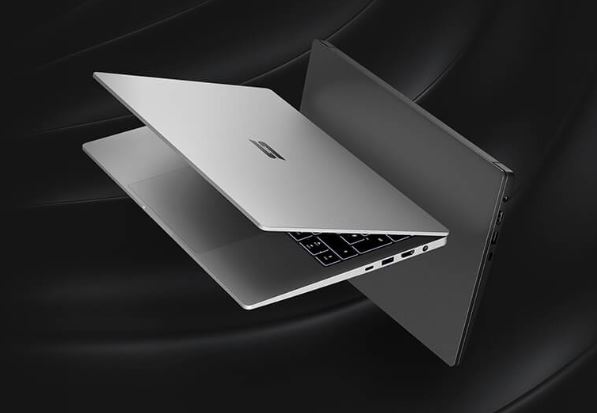
Förra året släppte Schenker en mycket spännande bärbar 14-tumsdator som briljerar med extrem bärbarhet tack vare sin låga vikt på strax över 1 kg, kallad Vision 14, samtidigt som den inte kompromissar när det gäller ett bra portval eller prestanda. Tidigare i år var enheten uppdaterad med en Intel Tiger Lake-H35-processor, inklusive en effektivare kylningslösning med flytande metall och en dedikerad GeForce RTX 3050 Ti GPU-alternativ. Våra största invändningar mot den ovannämnda bärbara datorn var den 11:e generationens Intel-processorens mediokra prestanda och den relativt korta batteritiden.
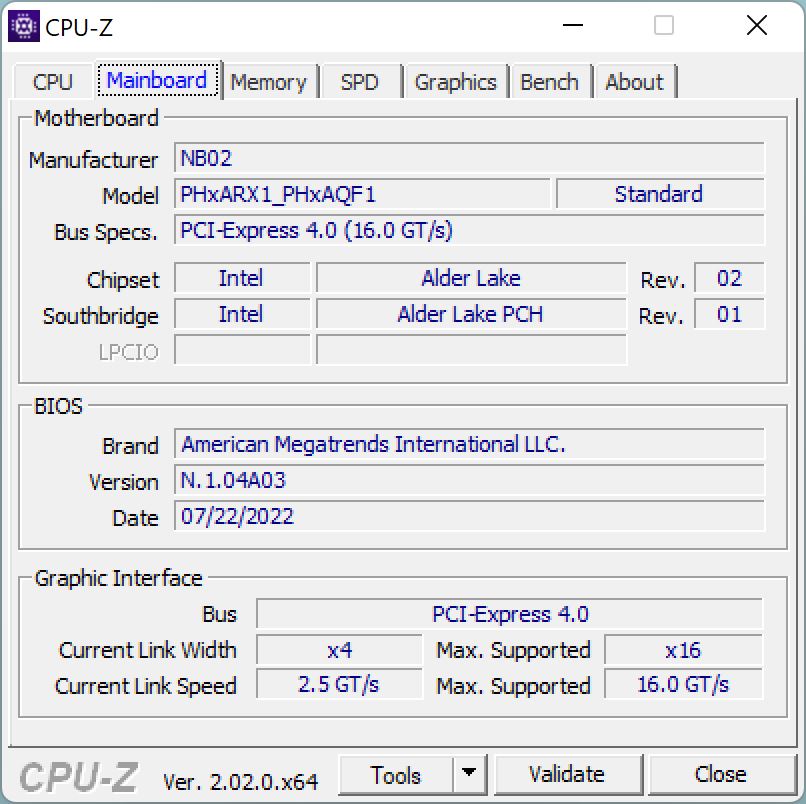
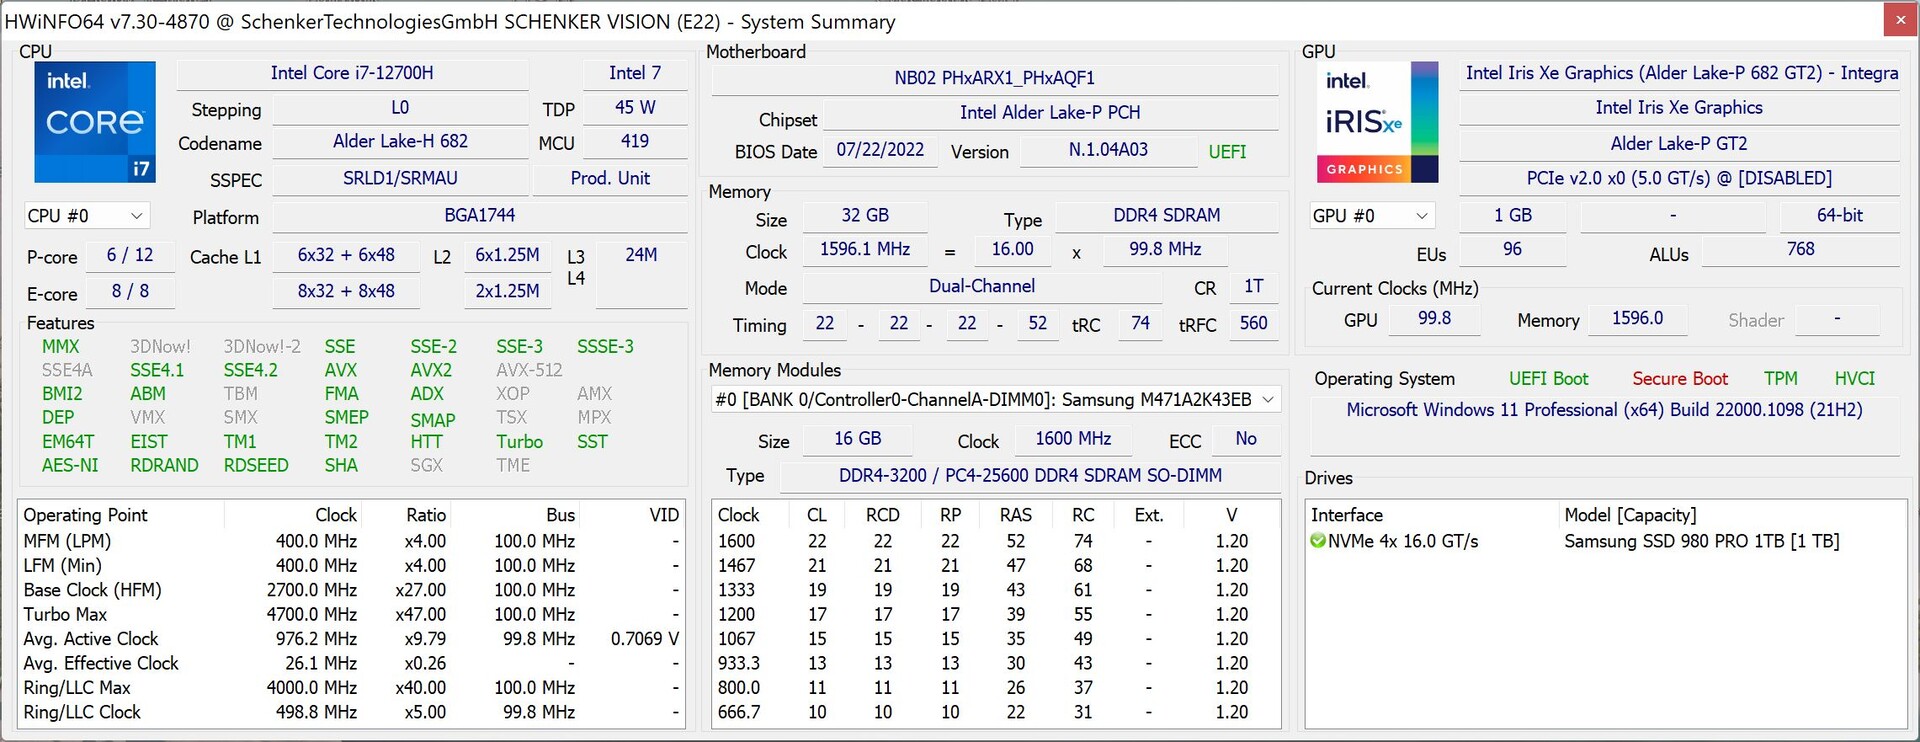
Även om Schenker tillkännagav Vision 14 refresh för ett par månader sedan fick vi först nu chansen att granska den på grund av problem med leveranskedjan. I motsats till vårt första intryck är den nya enheten en ganska stor uppgradering som också kommer med ett massivt 99-Wh-batterialternativ och som krävde vissa ändringar av den interiöra layouten. Dessutom har den äldre fyrkärniga processorn från generationen Tiger Lake ersatts av en uppdaterad Alder Lake-modell. Till skillnad från de flesta andra enheter i den här kategorin valde Schenker inte en Alder Lake-P-processor (28 W TDP) utan valde i stället en 45-watt-processor Core i7-12700H.
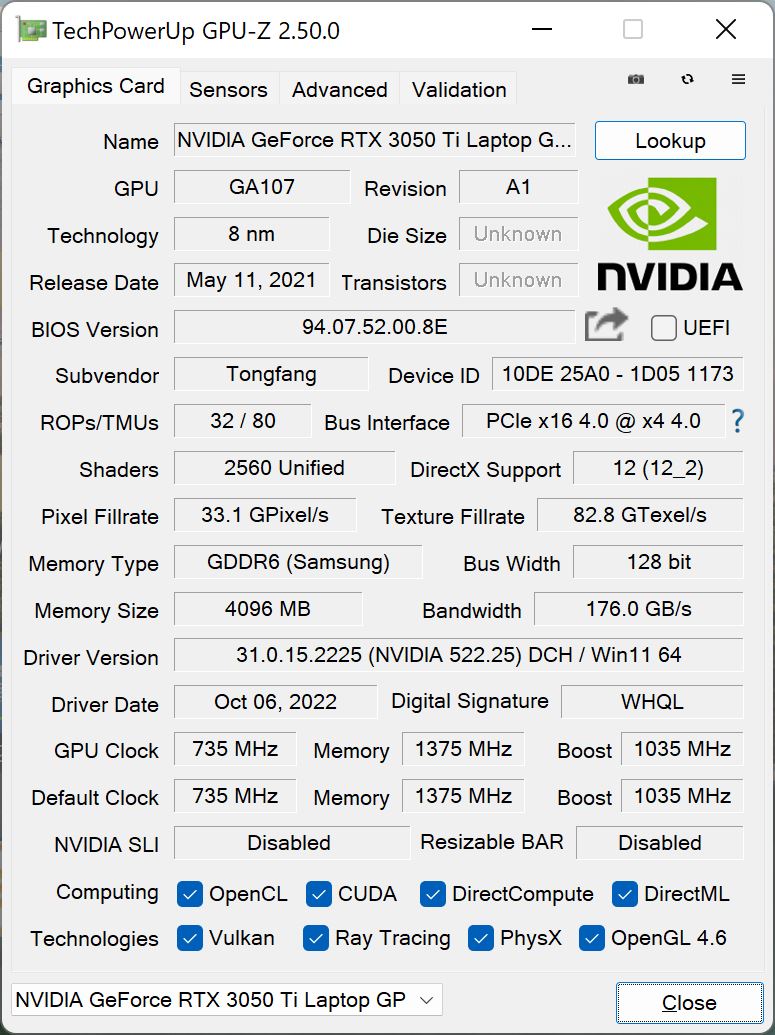
Vi fick två versioner av Vision 14 av Schenker, en med och en utan den dedikerade GPU:n GeForce. Eftersom de i övrigt är identiska (Core i7-12700H, 3K-panel, 99-Wh-batteri) kommer vi att lista de små skillnaderna i den här recensionen i stället för att granska båda enheterna separat. Den nya Vision 14 med iGPU börjar på ~1659 USD, medan RTX 3050 Ti-modellen kan köpas från cirka 1931 USD. Modellerna kan konfigureras med ett stort antal tillgängliga RAM- och SSD-alternativ; vår testenhet levereras med 32 GB RAM och en 1 TB PCIe-4.0 SSD (Samsung 980 Pro) för cirka 2200 USD.
Potentiella konkurrenter i jämförelse
Gradering | Datum | Modell | Vikt | Höjd | Storlek | Upplösning | Pris |
|---|---|---|---|---|---|---|---|
| 88.8 % v7 (old) | 10/2022 | Schenker Vision 14 2022 RTX 3050 Ti i7-12700H, GeForce RTX 3050 Ti Laptop GPU | 1.3 kg | 16.6 mm | 14.00" | 2880x1800 | |
| 90.3 % v7 (old) | 09/2022 | Huawei MateBook X Pro 2022 i7-1260P, Iris Xe G7 96EUs | 1.3 kg | 15.6 mm | 14.20" | 3120x2080 | |
| 90.6 % v7 (old) | 05/2022 | Lenovo Yoga 9i 14 2022 i7-1260P i7-1260P, Iris Xe G7 96EUs | 1.4 kg | 15.25 mm | 14.00" | 3840x2400 | |
| 87.2 % v7 (old) | 09/2022 | Dell Inspiron 14 Plus 7420 i7-12700H, GeForce RTX 3050 4GB Laptop GPU | 1.7 kg | 18.87 mm | 14.00" | 2240x1400 | |
| 86.3 % v7 (old) | 07/2022 | Asus Vivobook Pro 14 M3401QC-KM007T R5 5600H, GeForce RTX 3050 4GB Laptop GPU | 1.5 kg | 19 mm | 14.00" | 2880x1800 | |
| 92.7 % v7 (old) | 11/2021 | Apple MacBook Pro 14 2021 M1 Pro Entry M1 Pro 8-Core, M1 Pro 14-Core GPU | 1.6 kg | 15.5 mm | 14.20" | 3024x1964 |
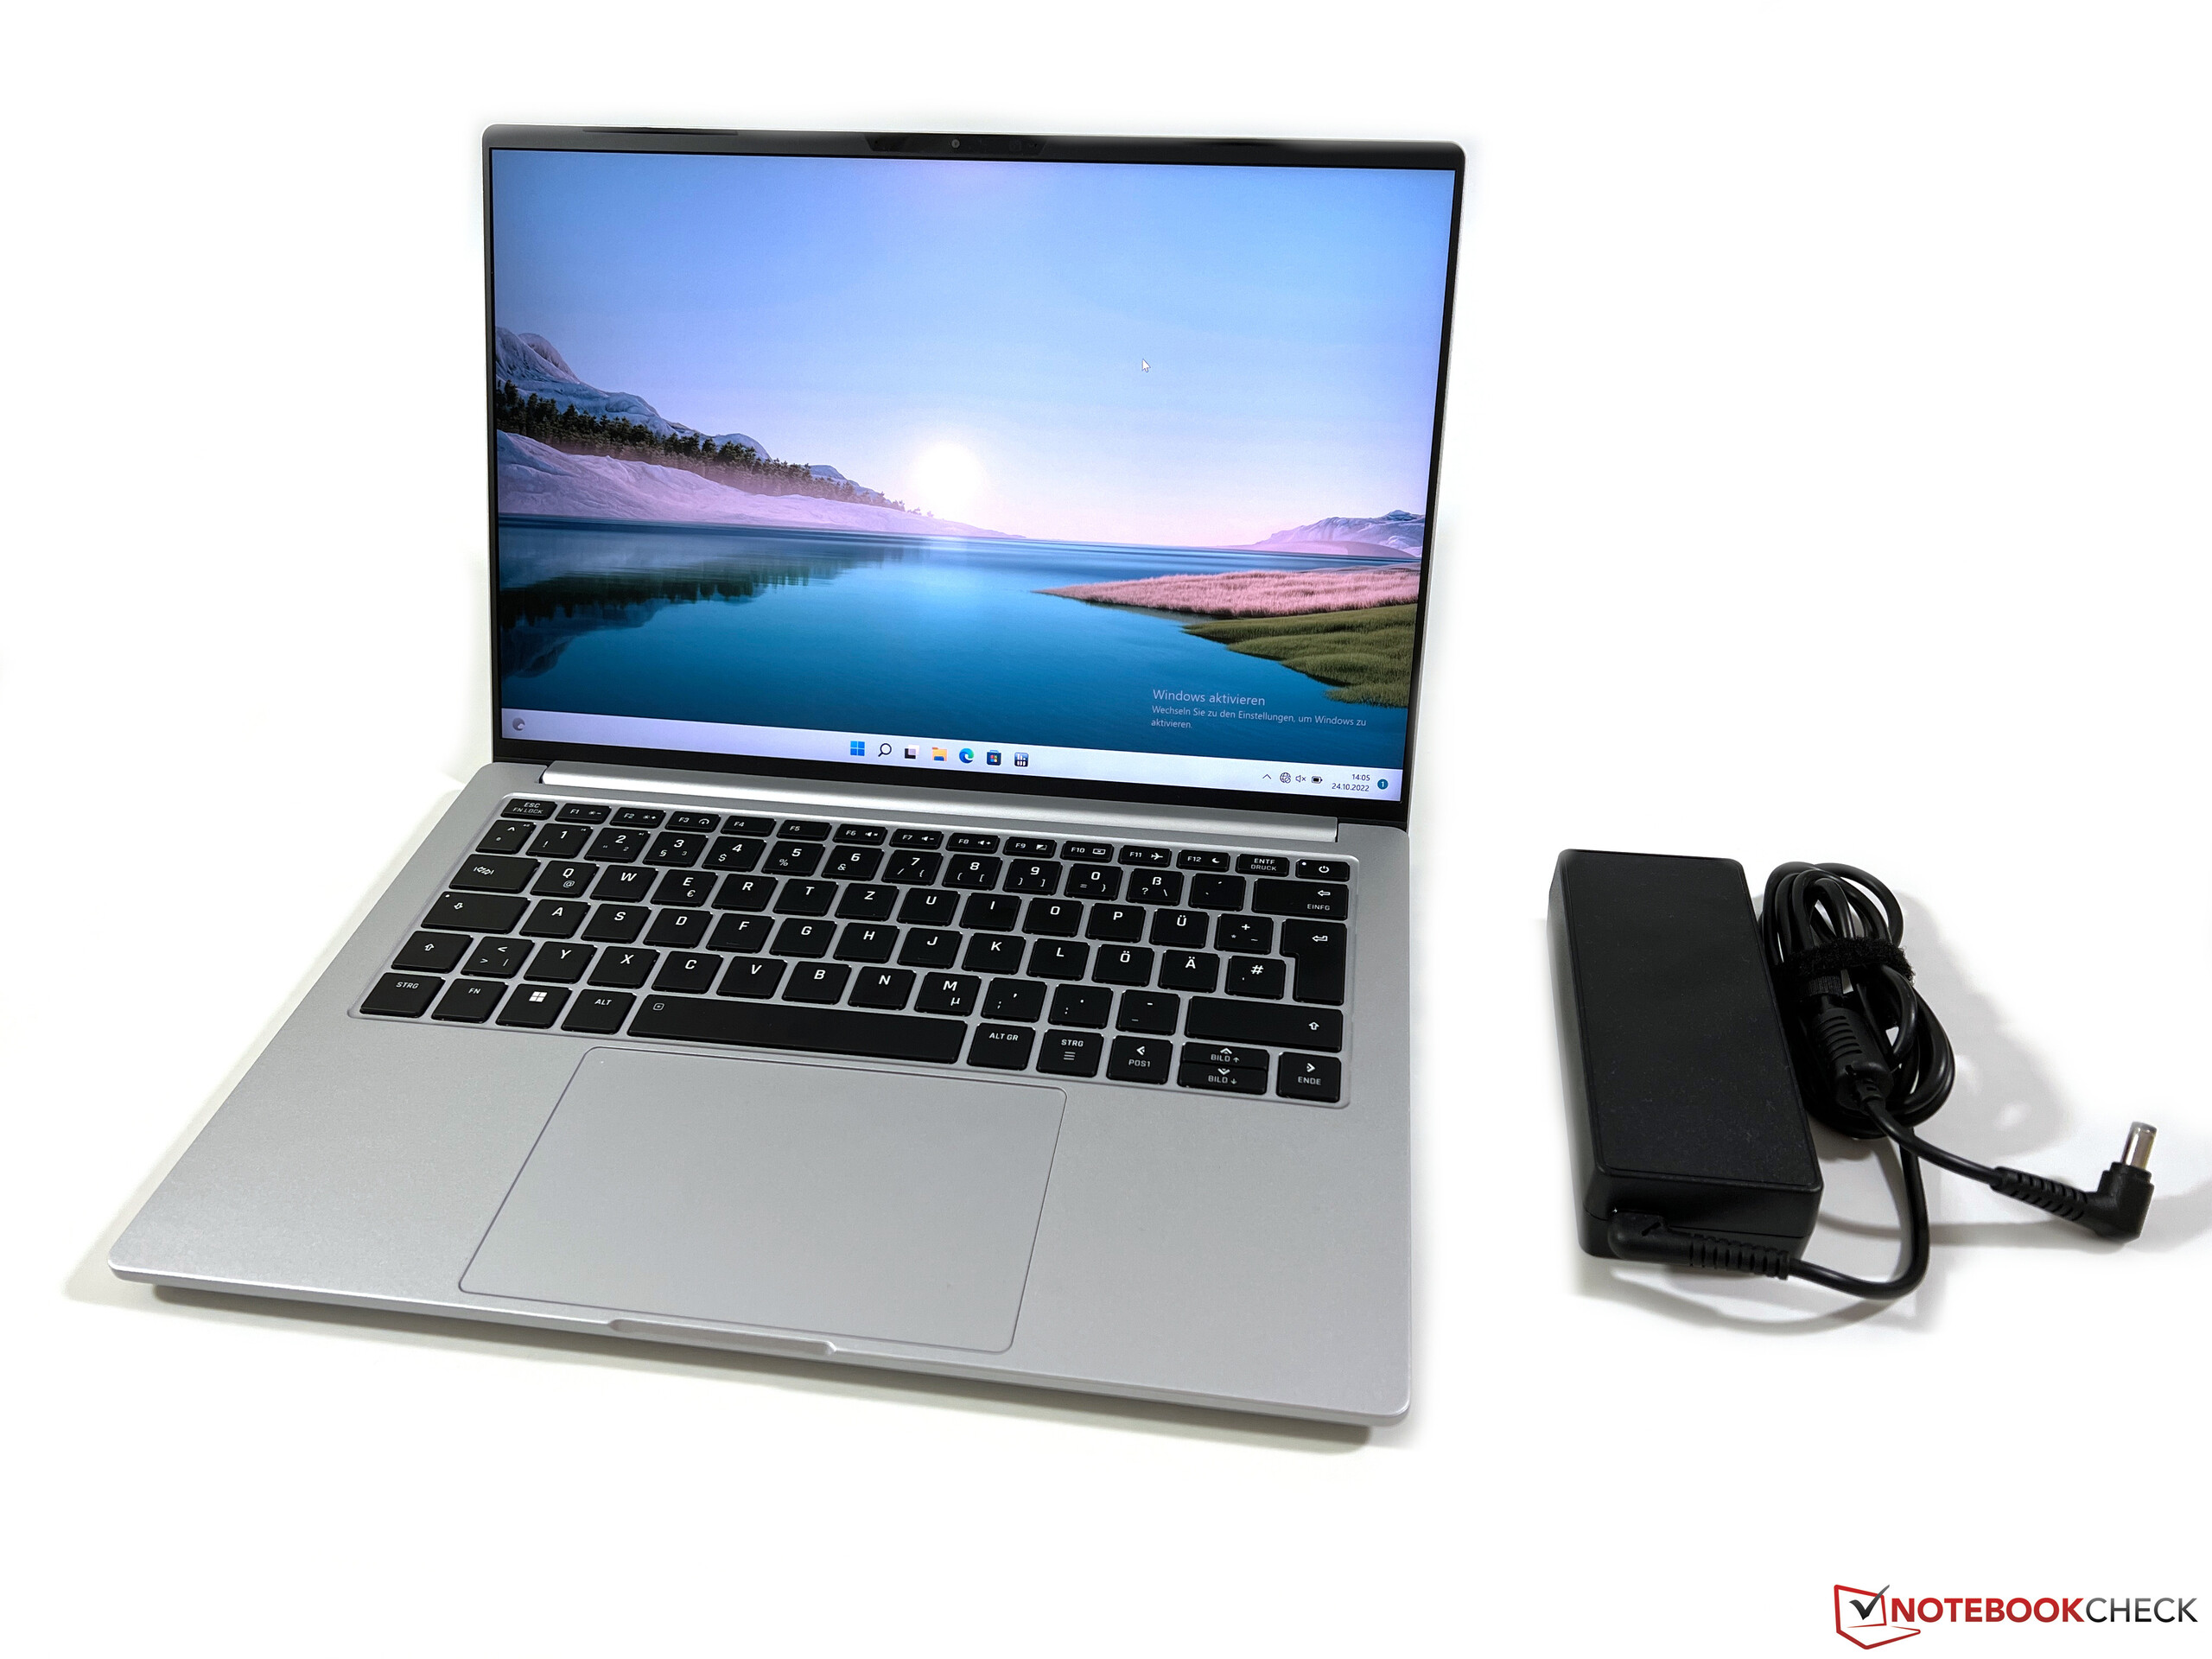
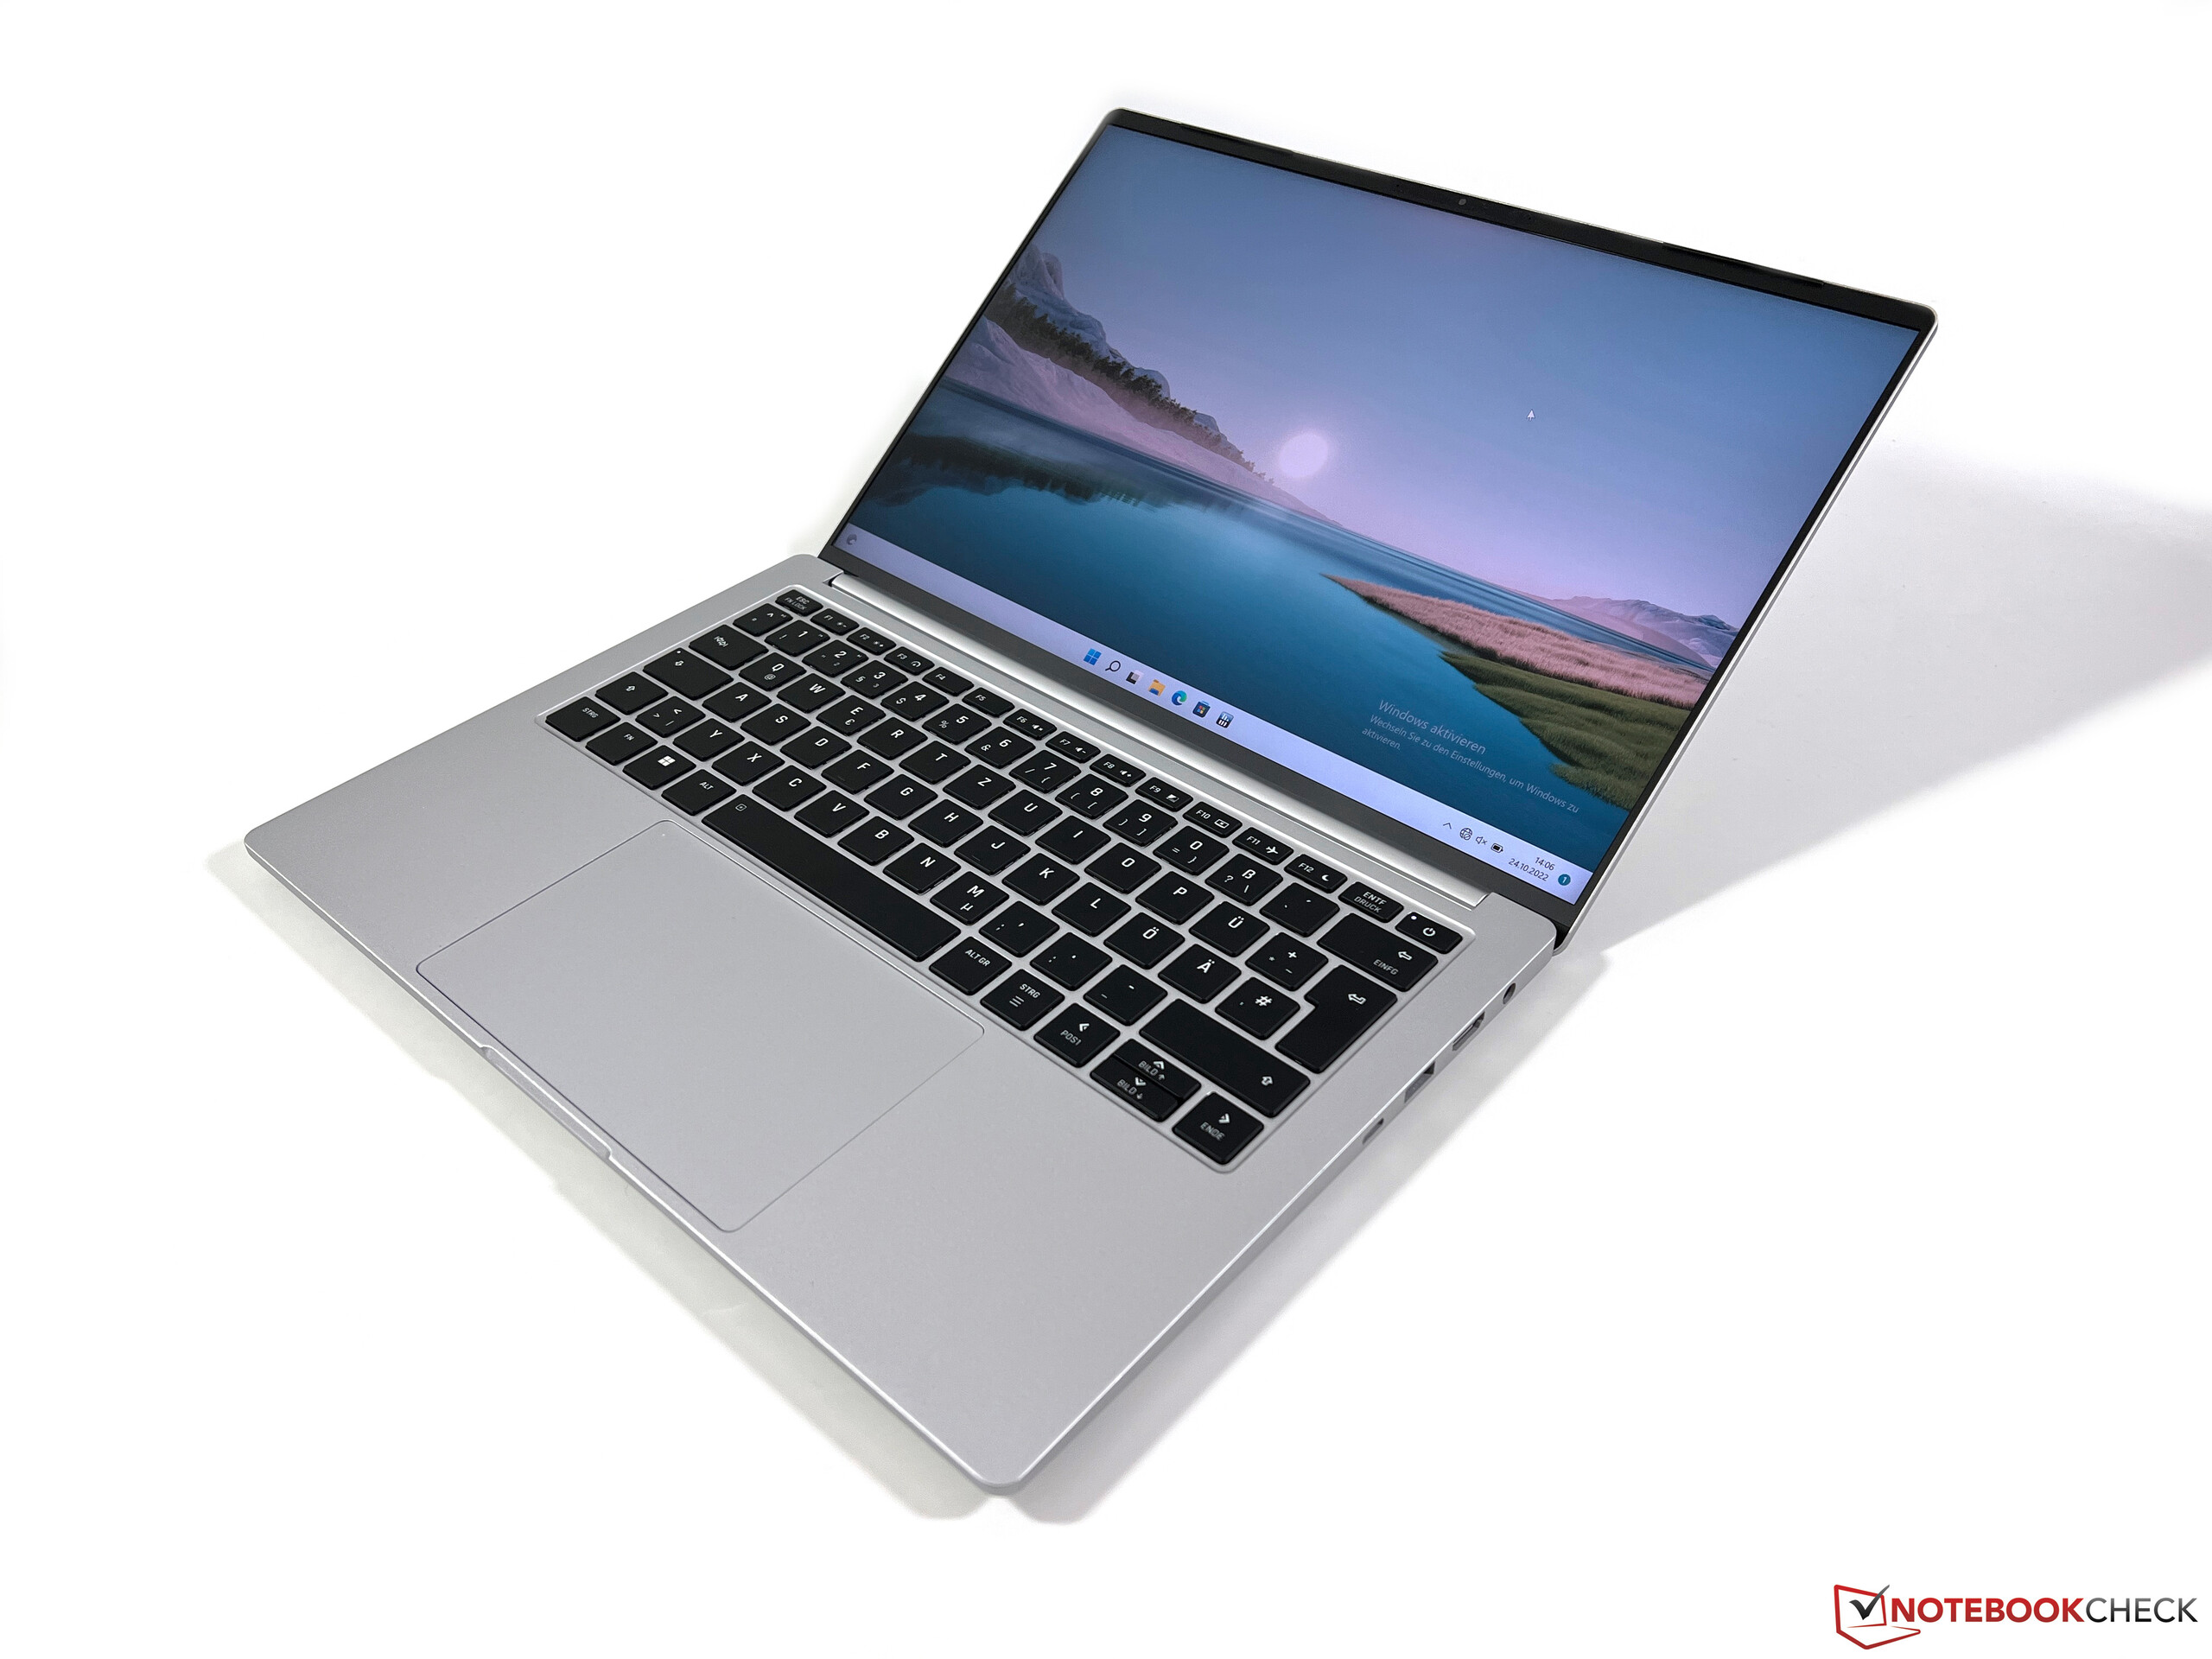
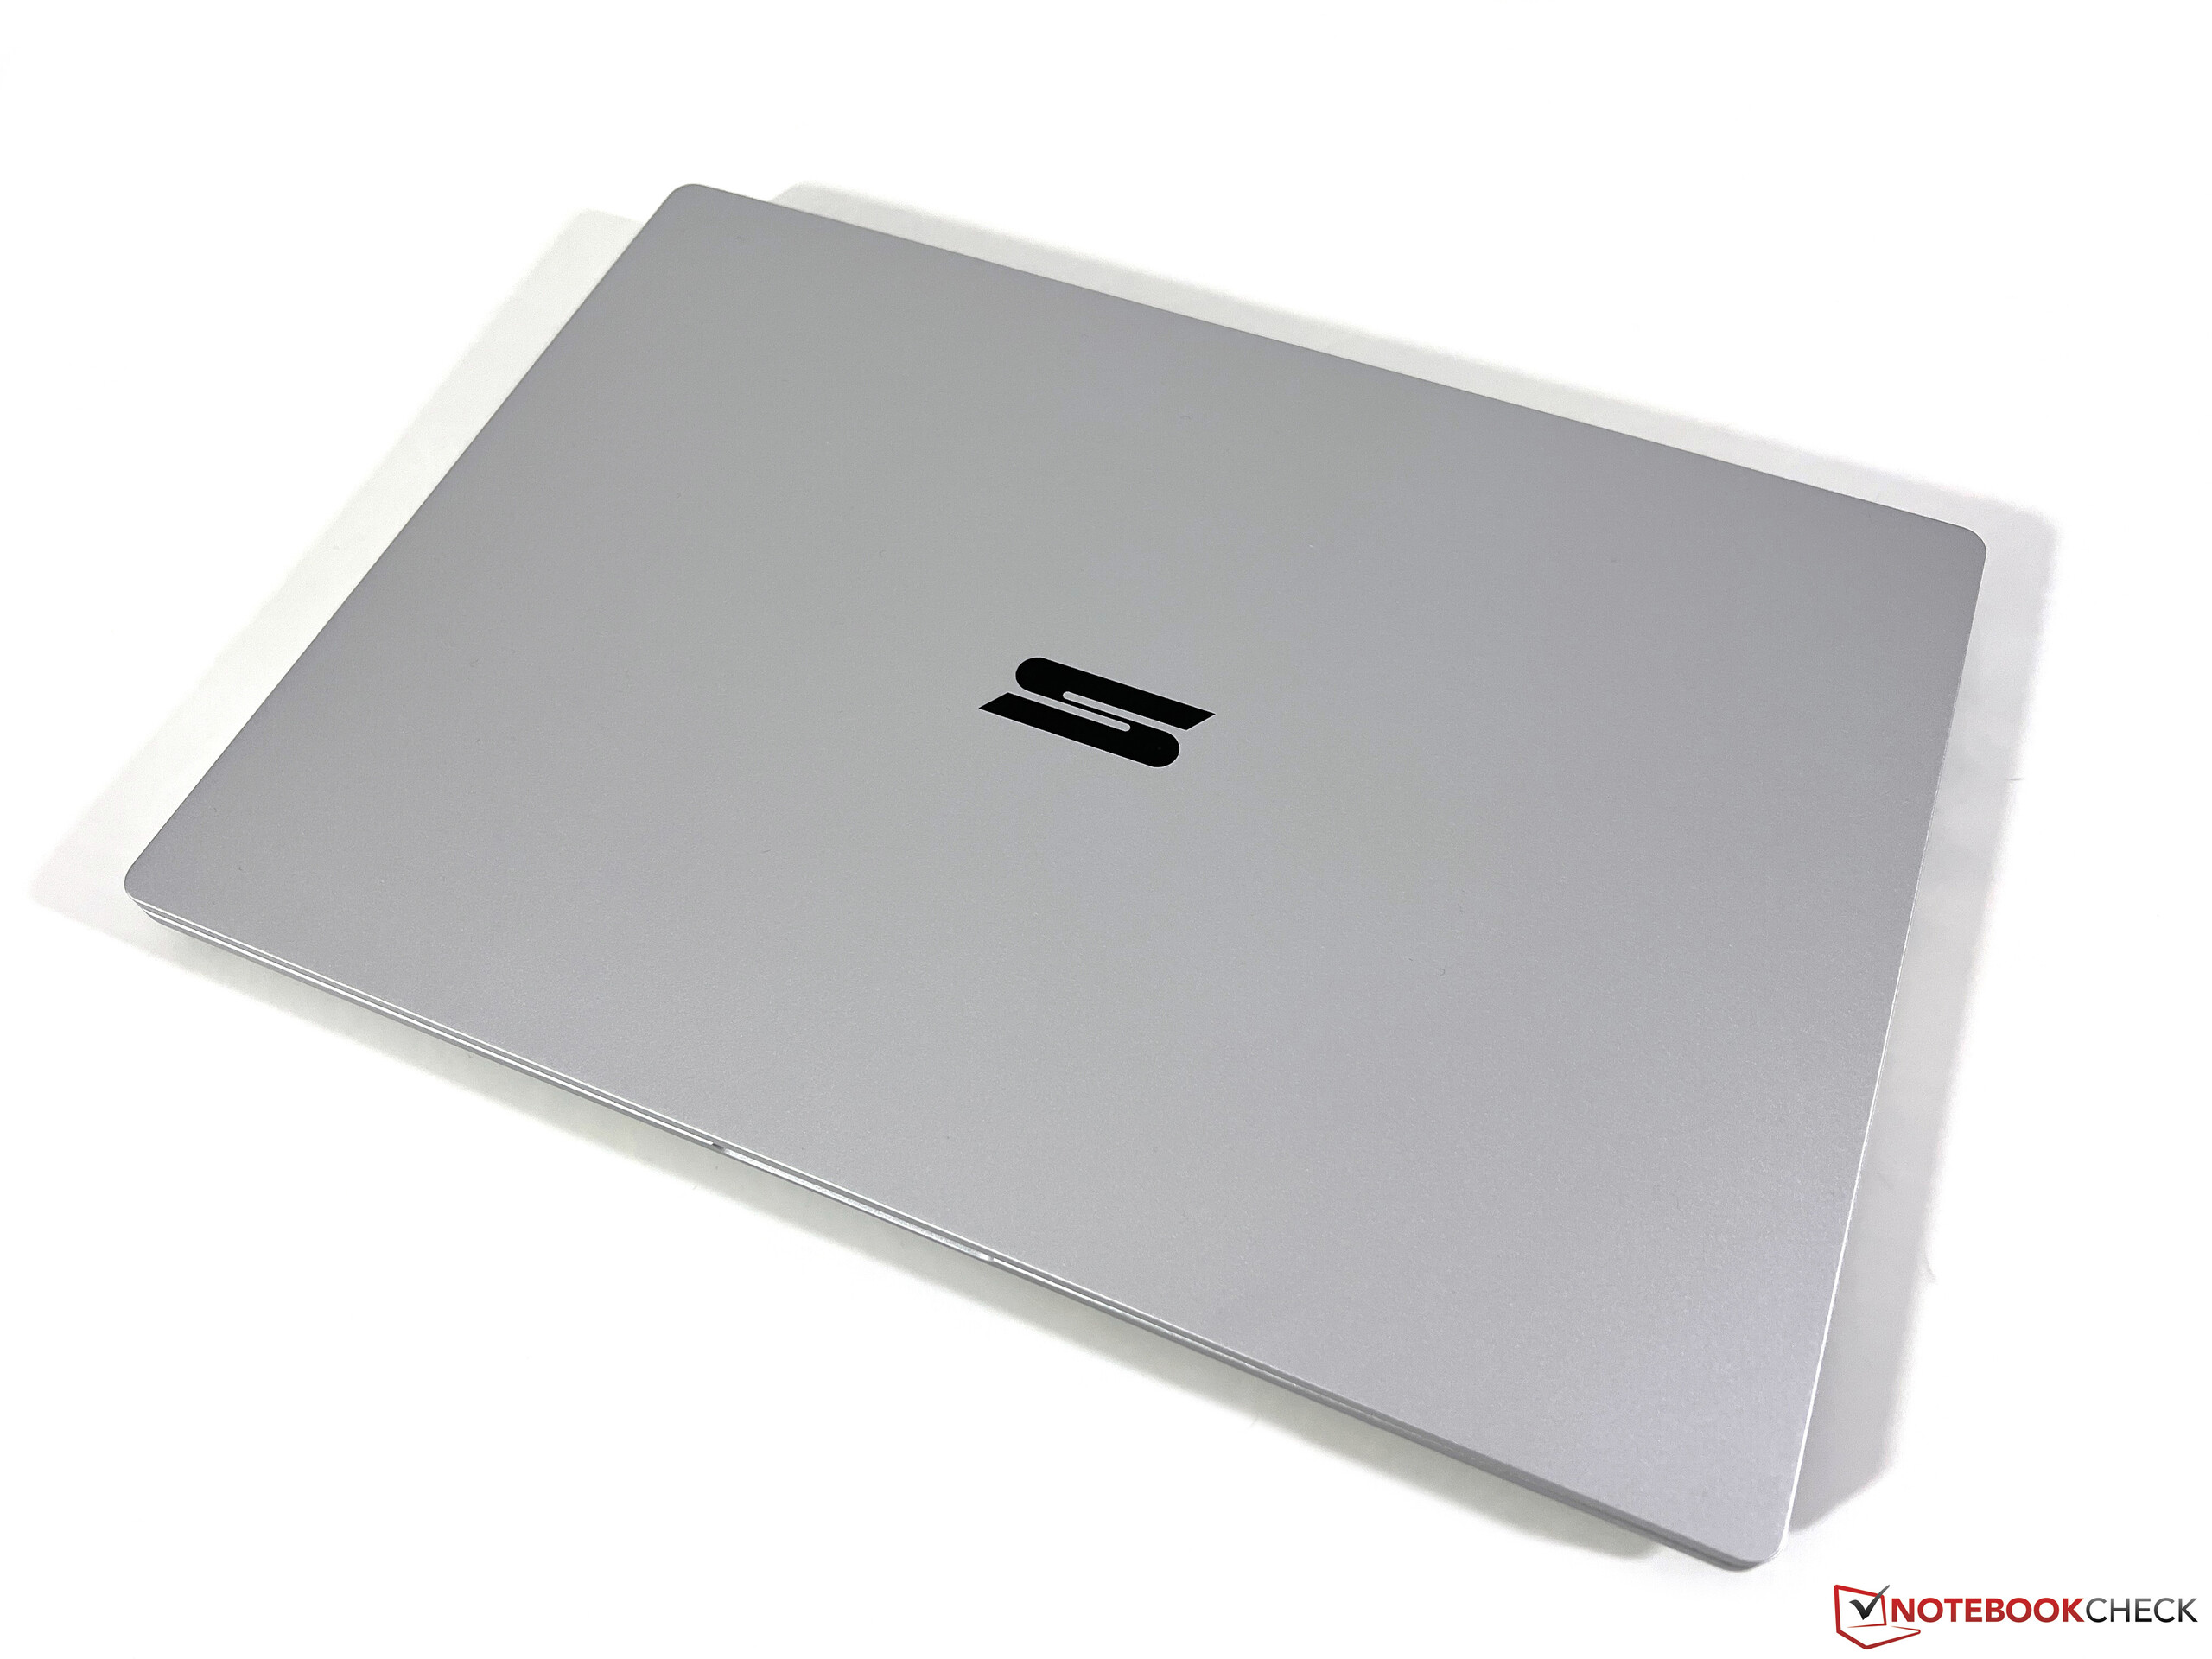
Hölje - Magnesium Vision 14 i två färger
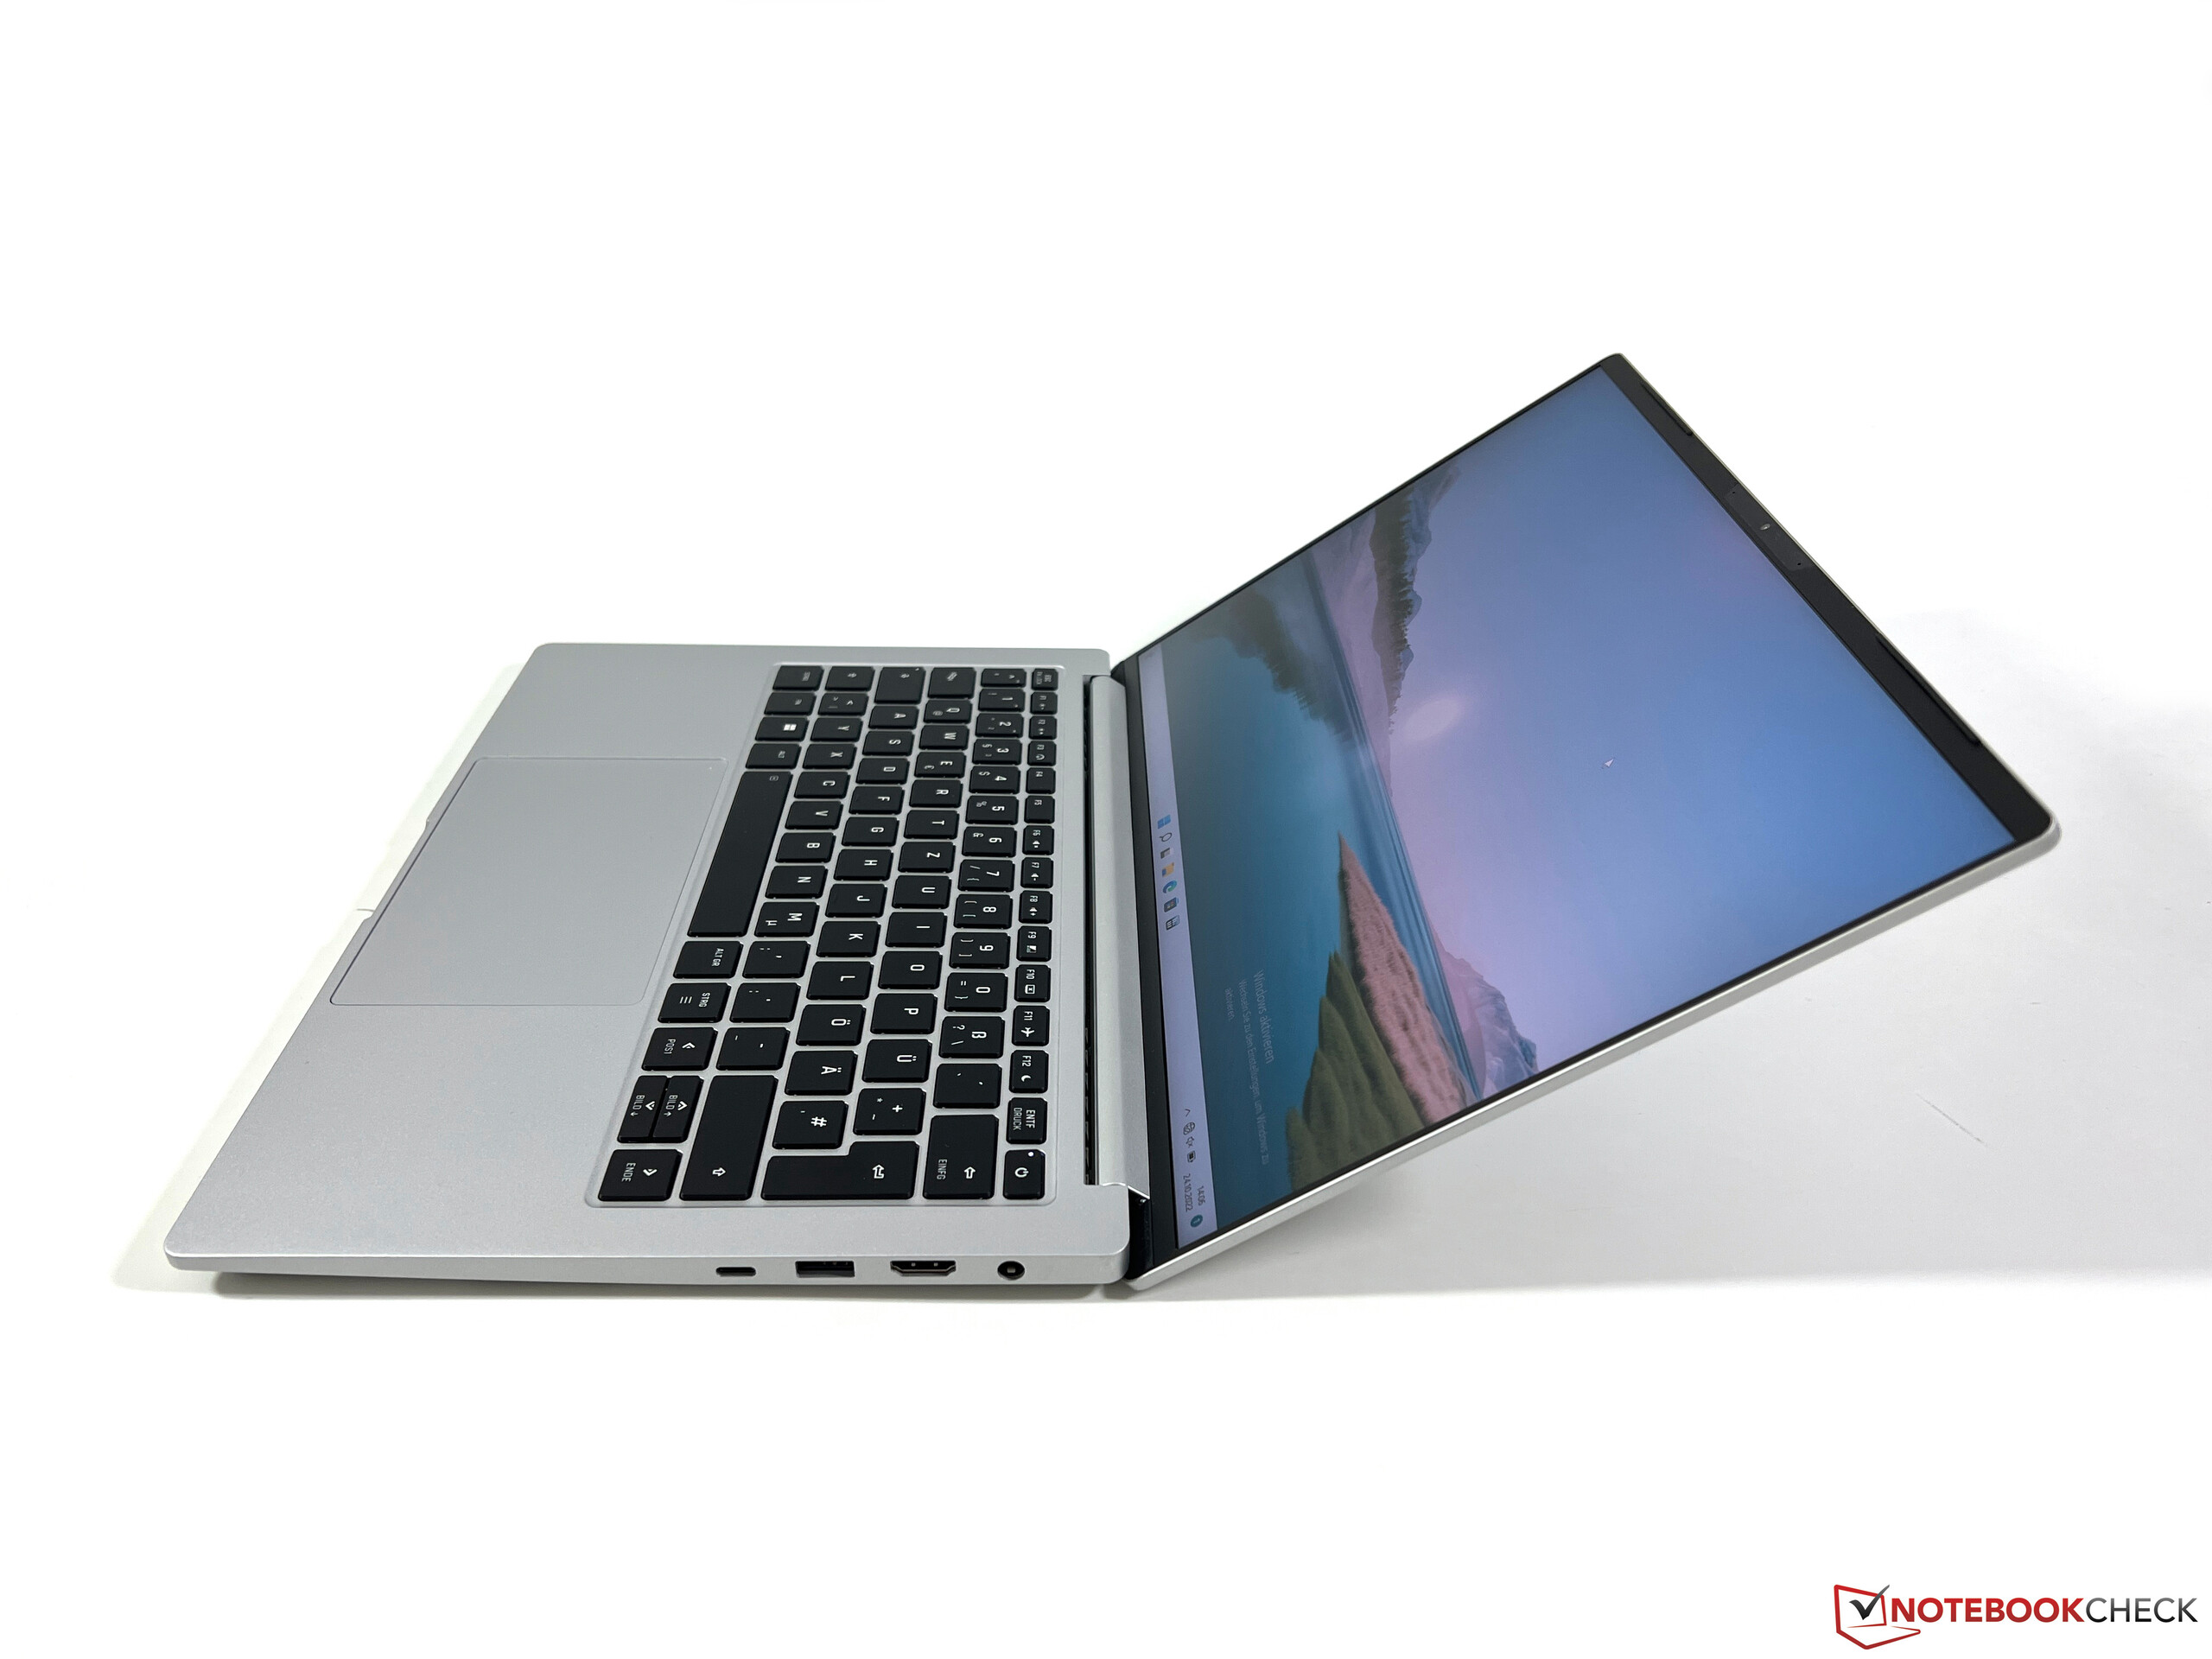
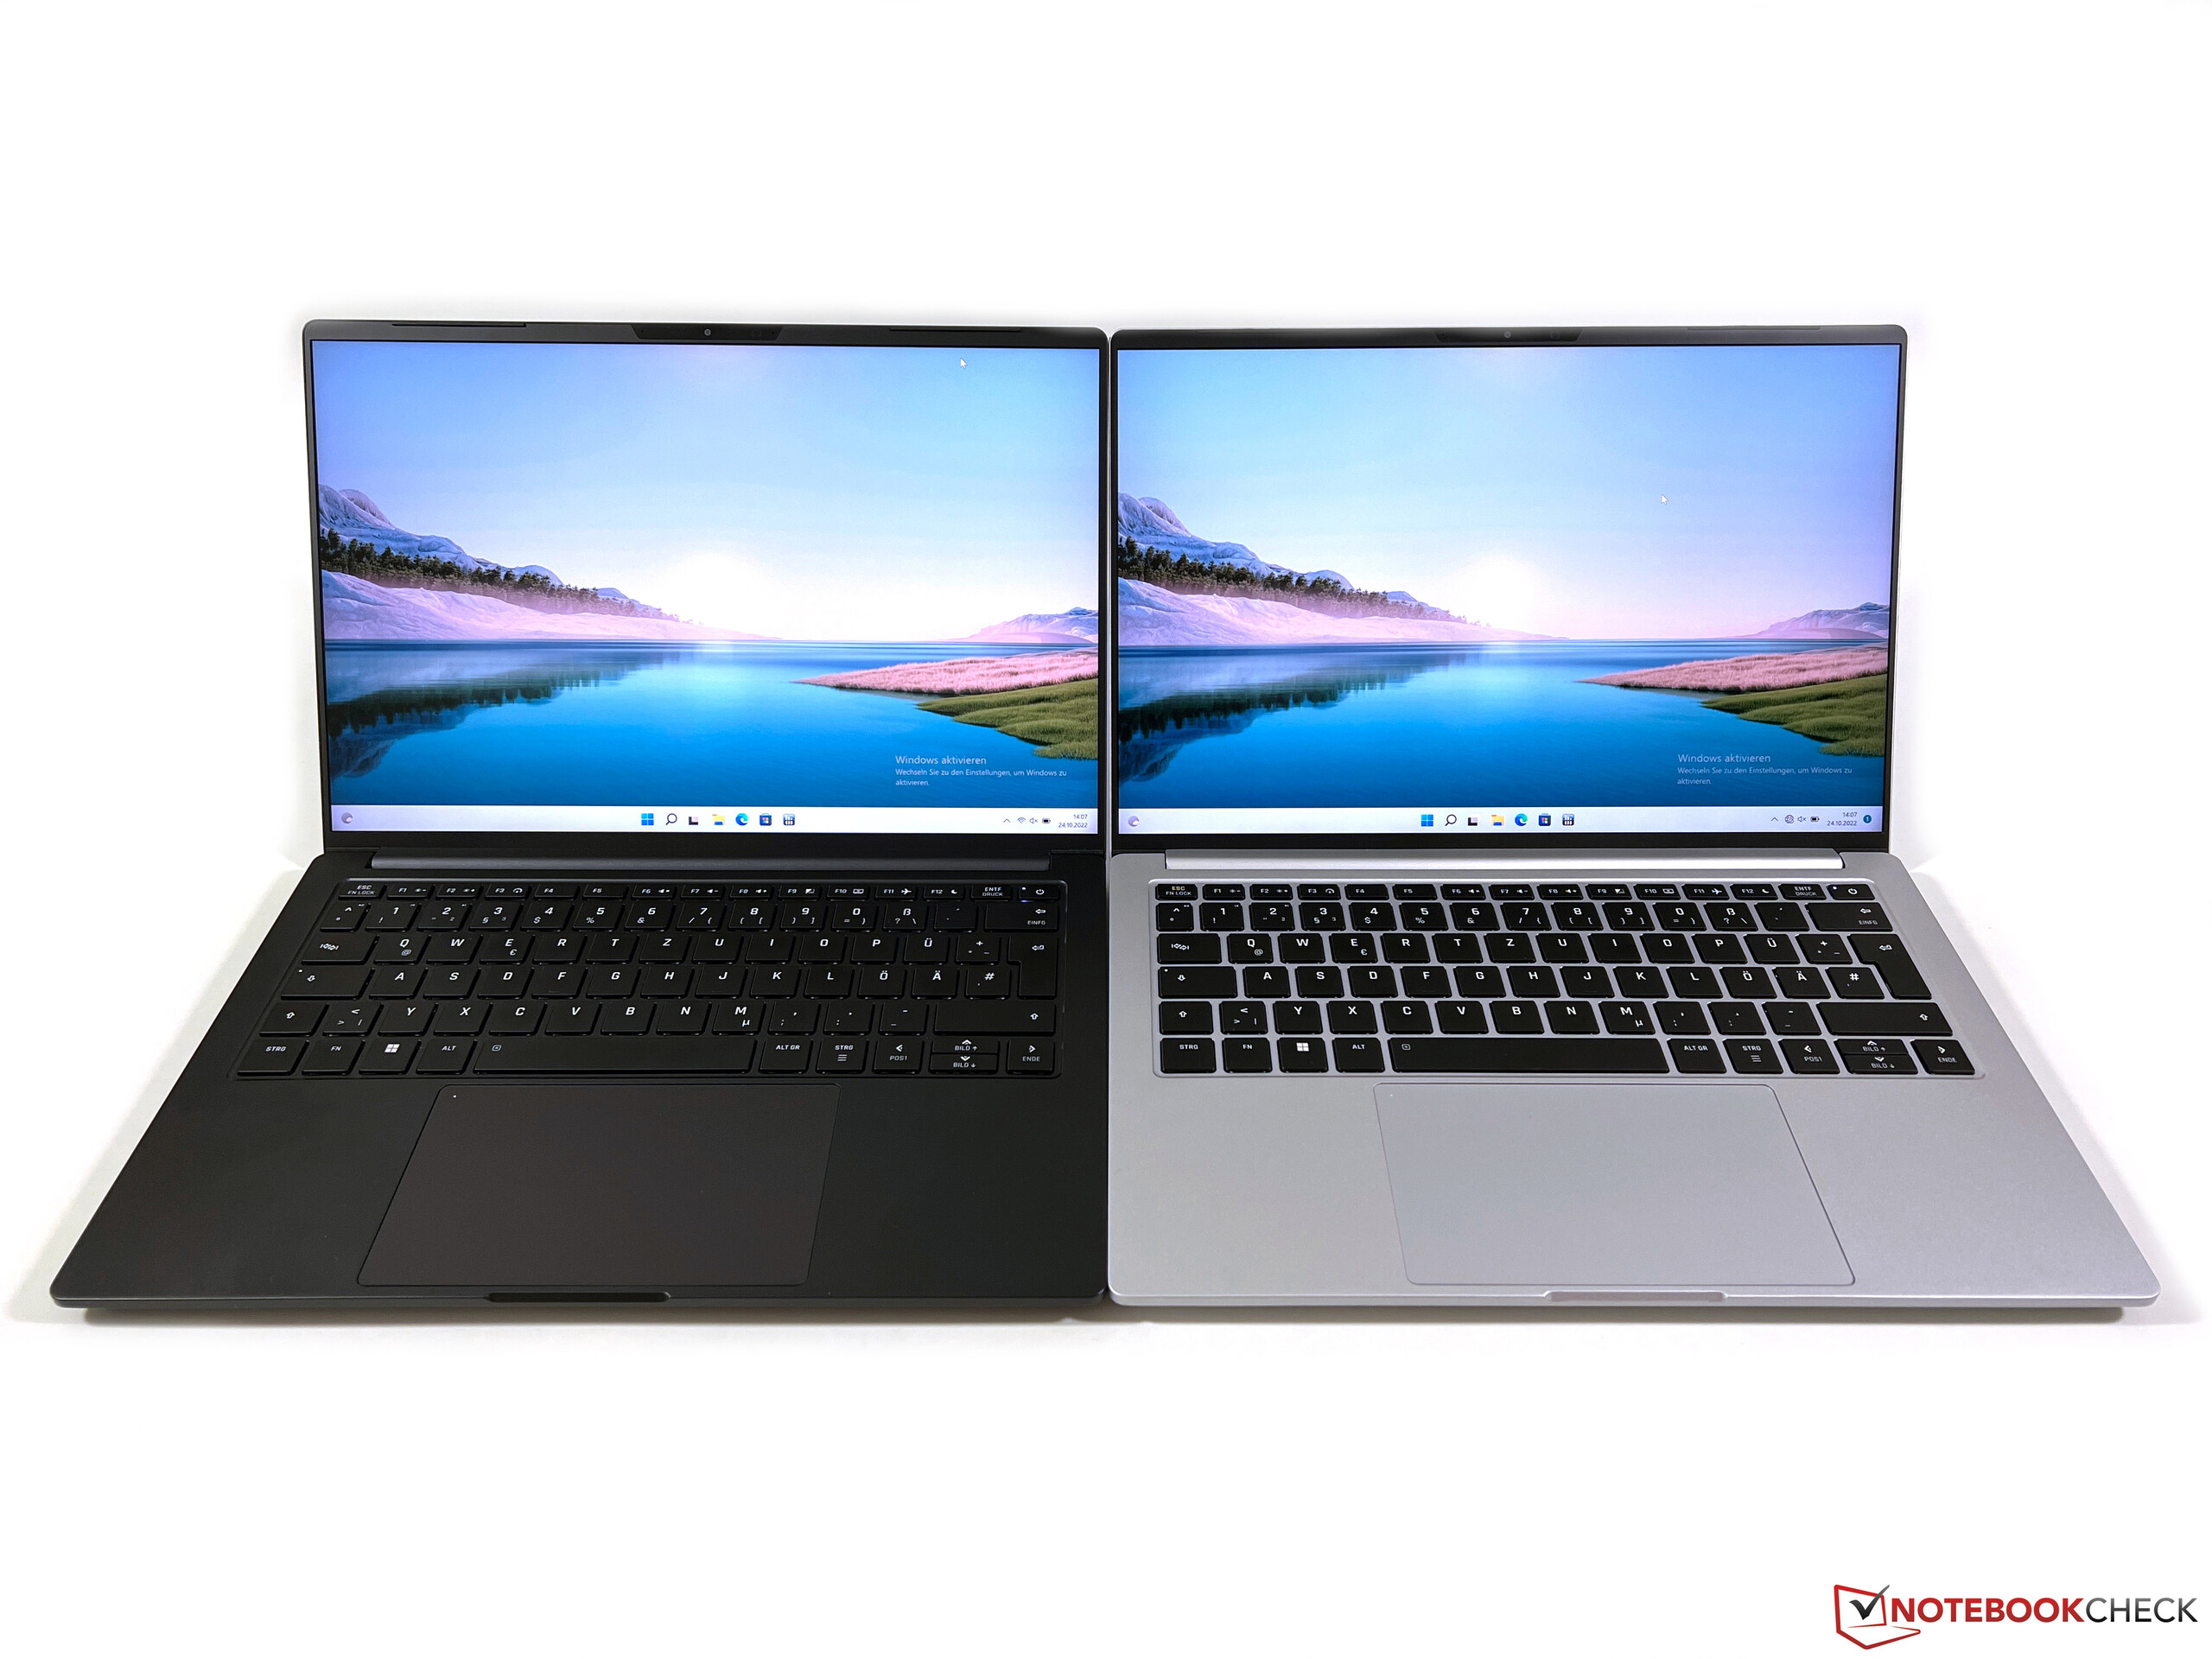
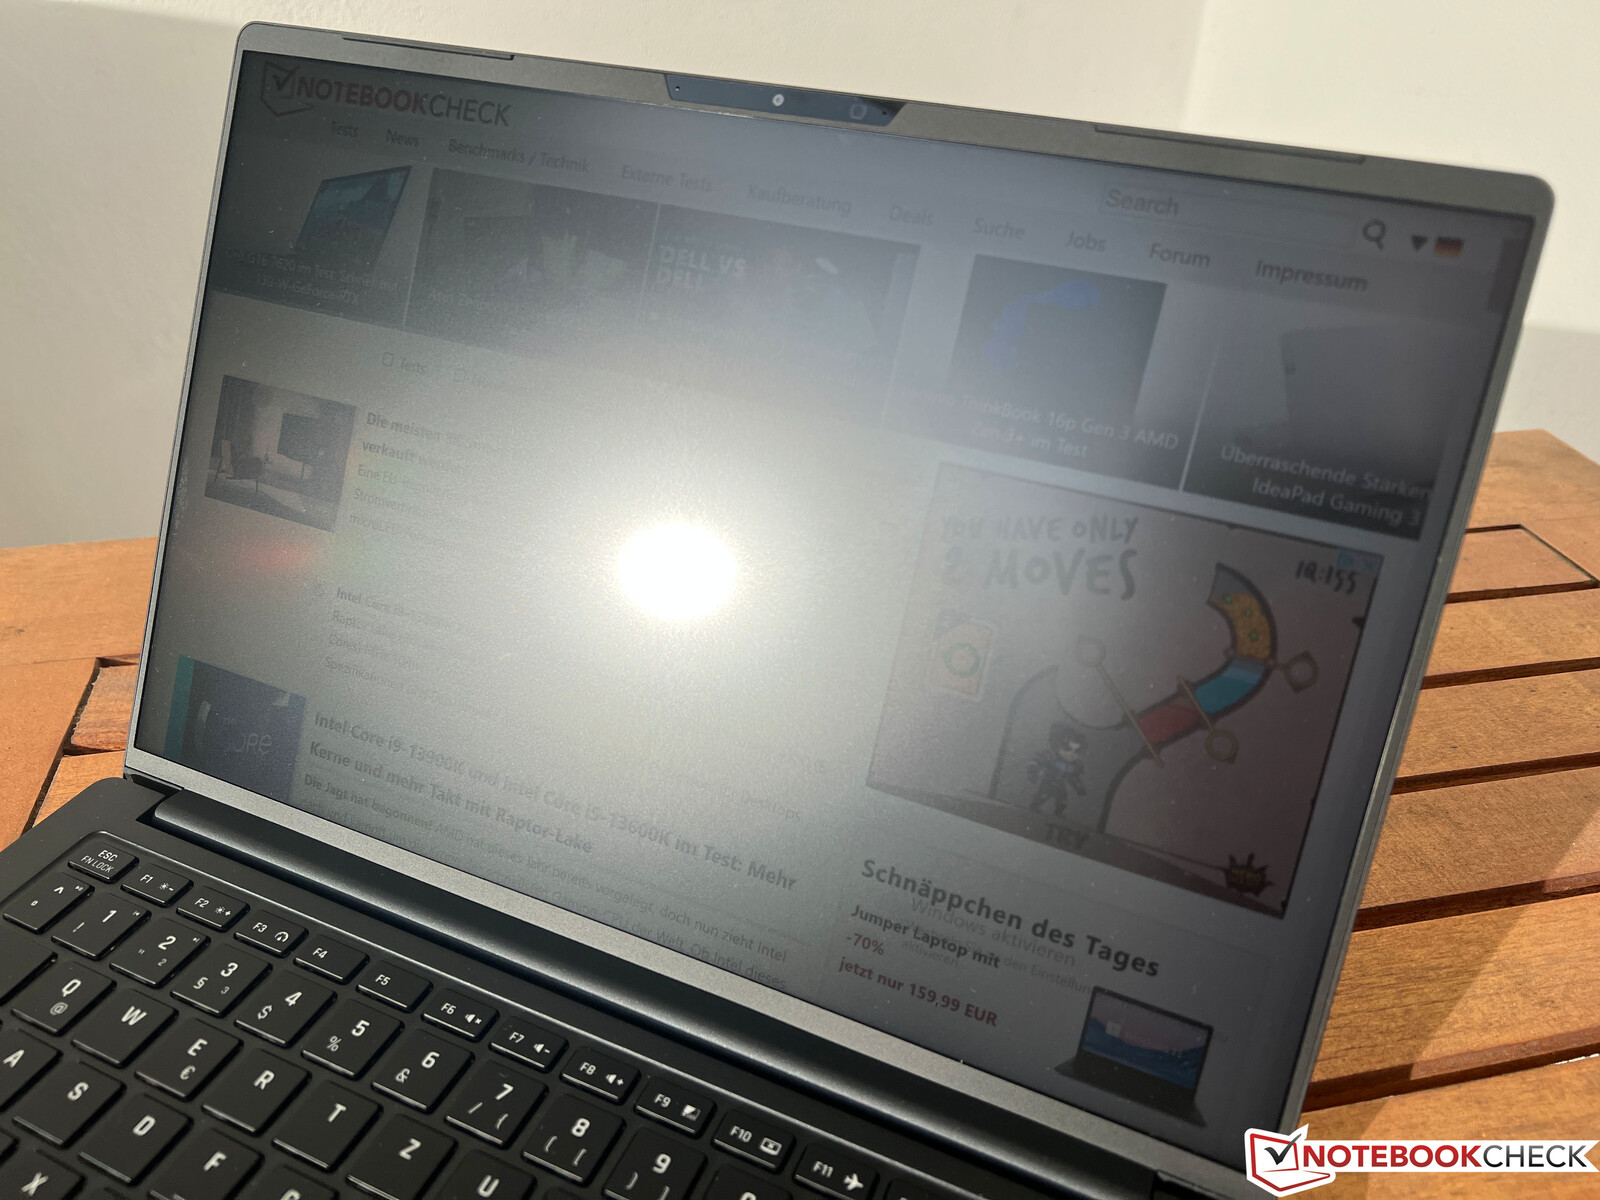
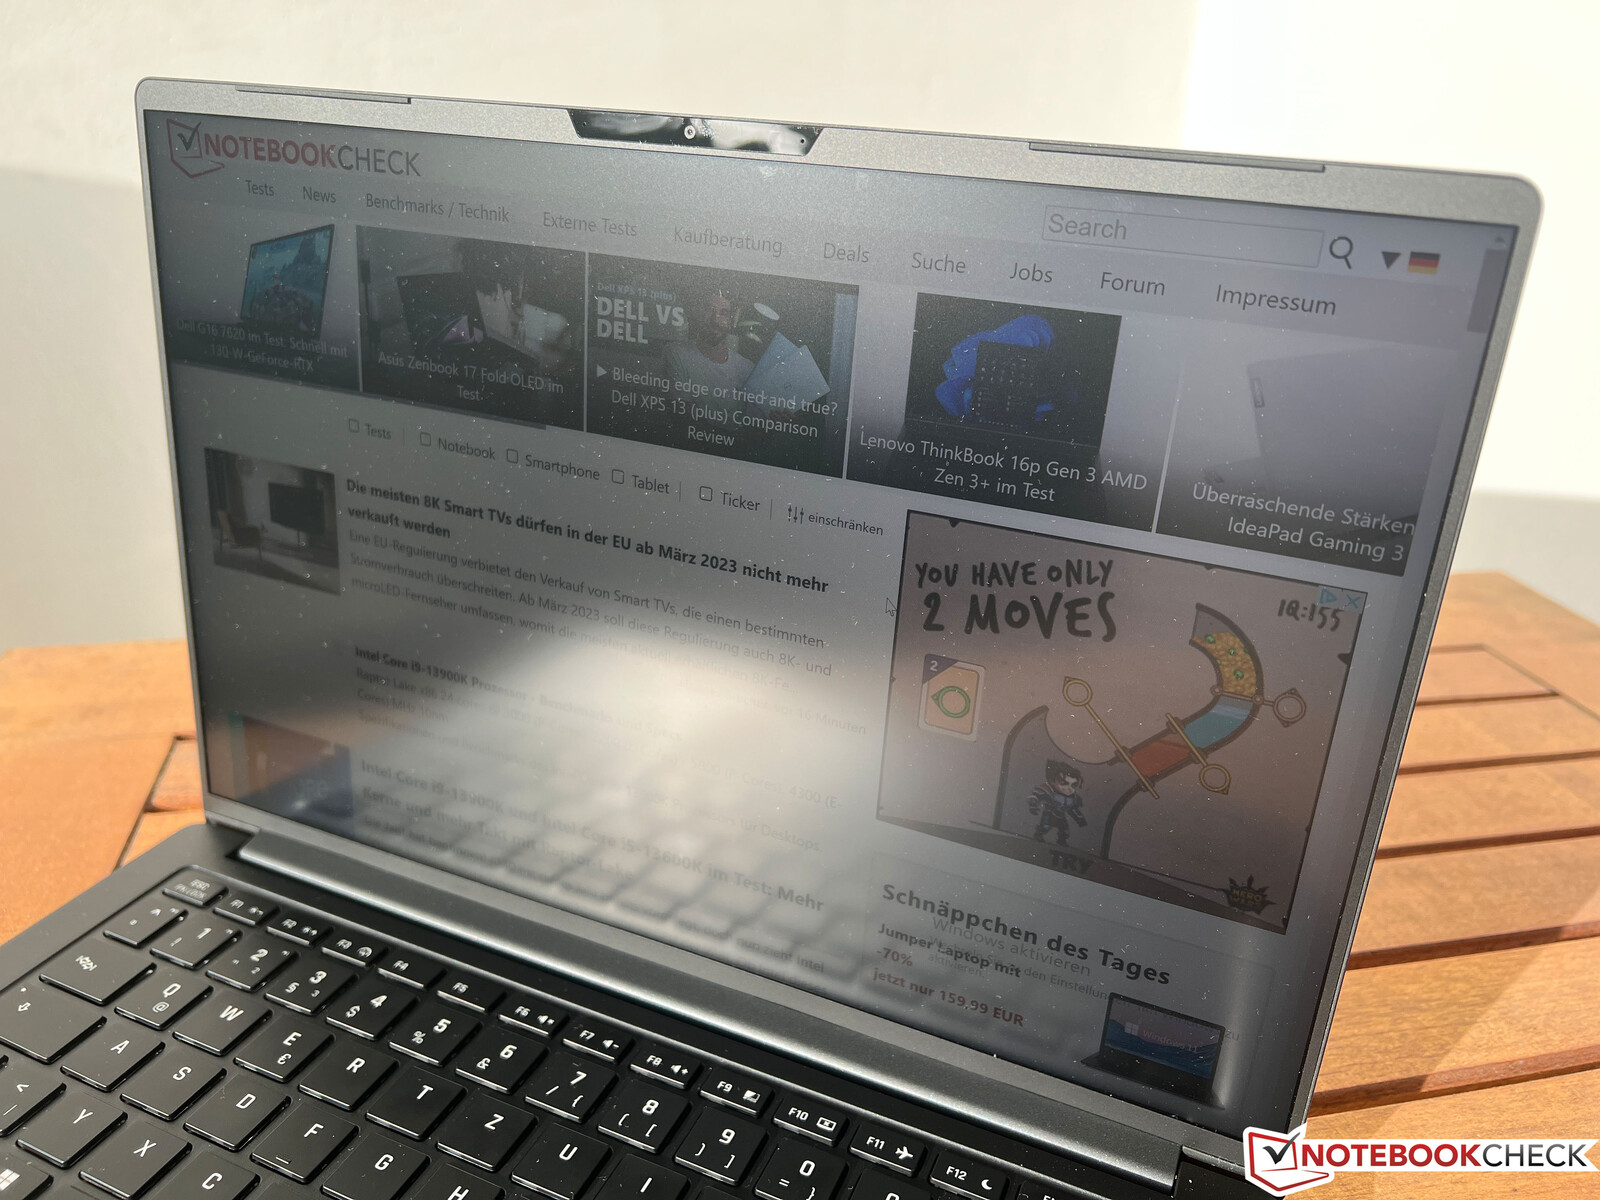
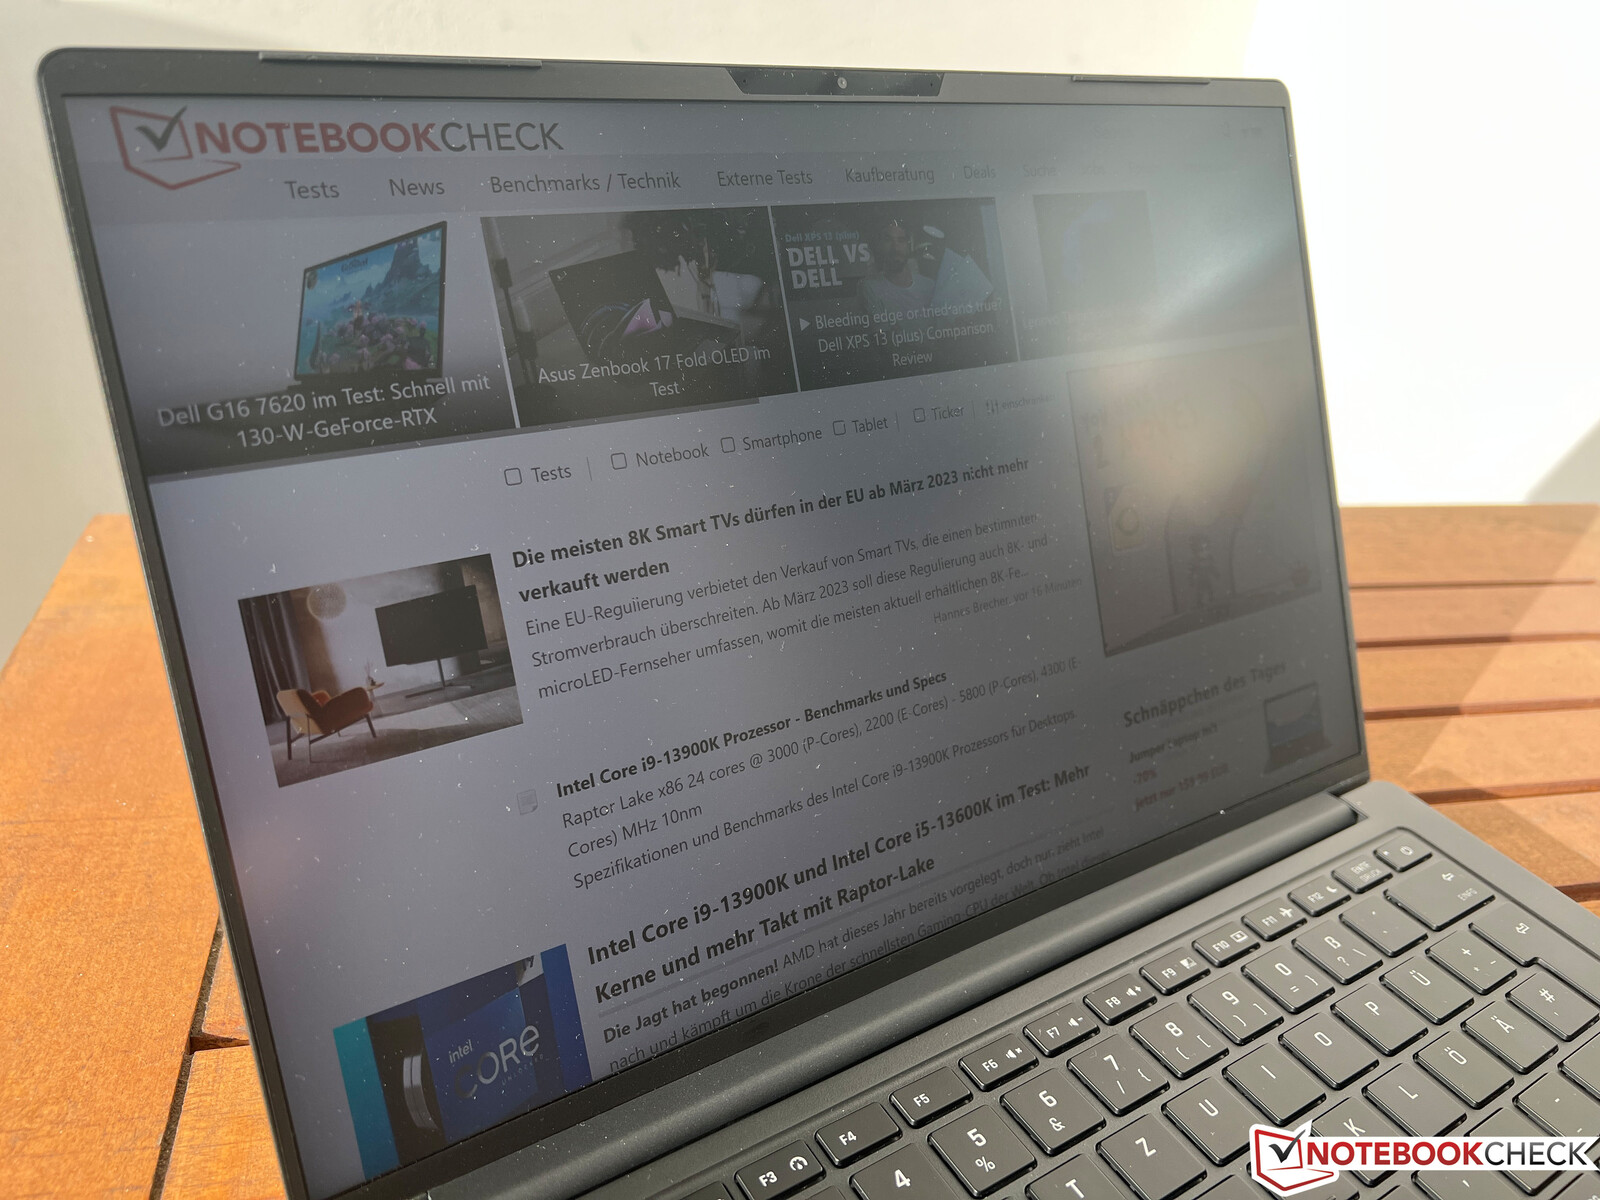
Den övergripande utformningen av Schenker Vision 14 har förblivit oförändrad och det finns svarta och silverfärgade modeller. Skärmkanten består av plast, medan de övriga delarna (lock, basenhet) är tillverkade av en magnesiumlegering. Styvheten fortsätter att vara utmärkt, men skärmen är mycket tunn, vilket gör den ganska flexibel, vilket framgår av de förvrängningar som uppstår när man utövar ett fokuserat tryck på baksidan av locket. Vid daglig användning finns det inga begränsningar.
Gångjärnet är fortfarande en svaghet hos Vision 14. Även om gångjärnets fasthet har förbättrats (~0,32 Nm jämfört med 0,25 Nm på föregångaren) enligt Schenker, finns det fortfarande en märkbar vinglighet när man justerar vinkeln (upp till 160 grader). Det är möjligt att öppna skärmen med en hand på både den nya och den gamla modellen. Den silverfärgade versionen är mindre mottaglig för fingeravtryck och fett än den svarta modellen vid daglig användning.
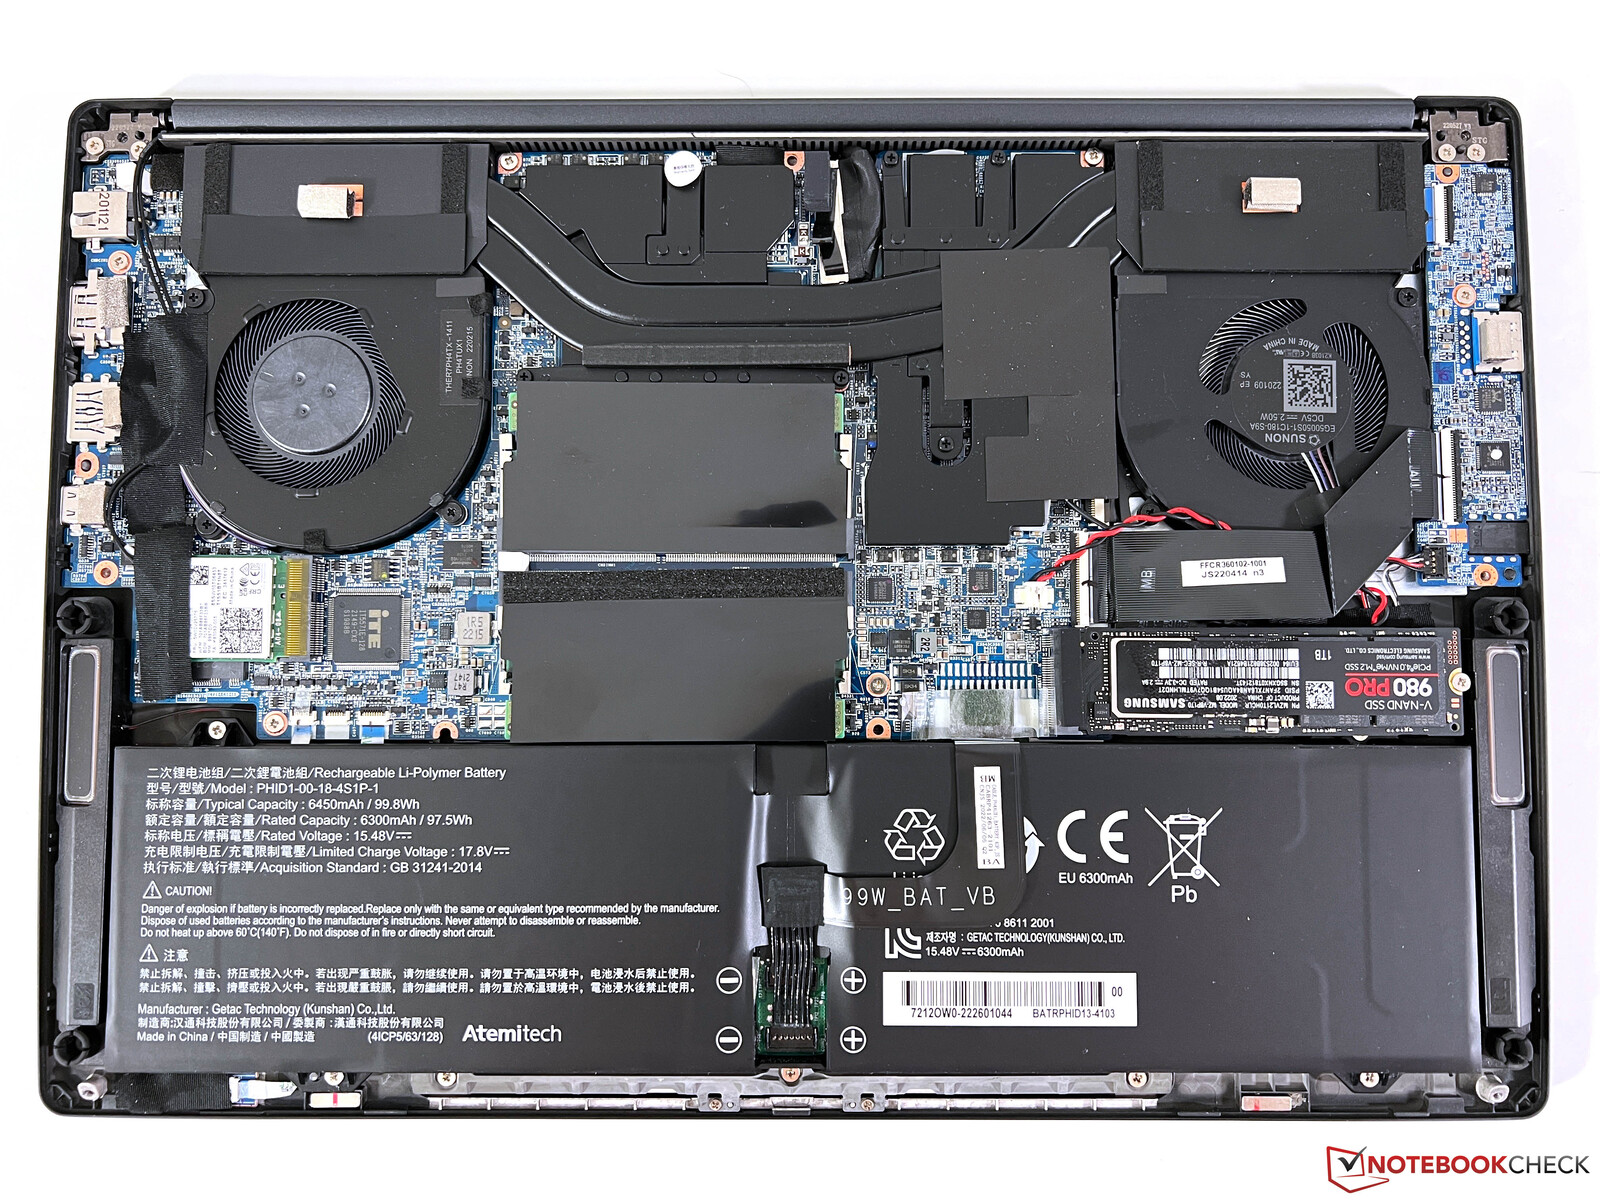
Med ett 99-Wh-batteri och ett GeForce RTX 3050 Ti väger vår testenhet 1310 g (~2.89 lbs) mer än föregångare med nästan 200 g (~0,44 lbs), vilket gör den till den tyngsta skevheten i Vision 14. Den lättare 53-Wh-modellen (~1,1 kg / ~2,43 lbs). Med 1269 g (~2,80 lbs) är 99-Wh-varianten av Vision 14 utan RTX 3050 Ti bara marginellt lättare. Samtidigt är de nya 99-Wh-modellerna också tjockare med 1 mm (16,6 vs 15,6 mm / 0,65 vs 0,61 tum).
Jämförelsevis väger till och med den högsta konfigurationen av vår testenhet betydligt mindre än andra enheter i vår jämförelse med dedikerade grafikkort. Med 513 g (~1,13 lbs) är den medföljande nätadaptern relativt tung.
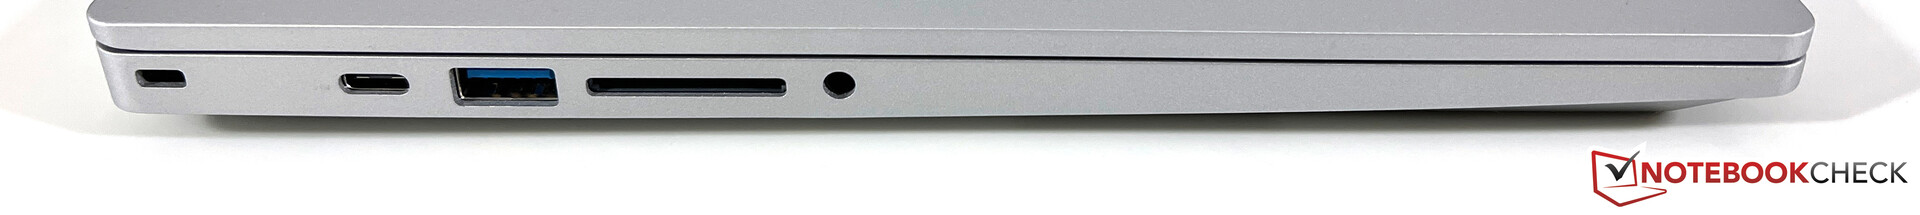
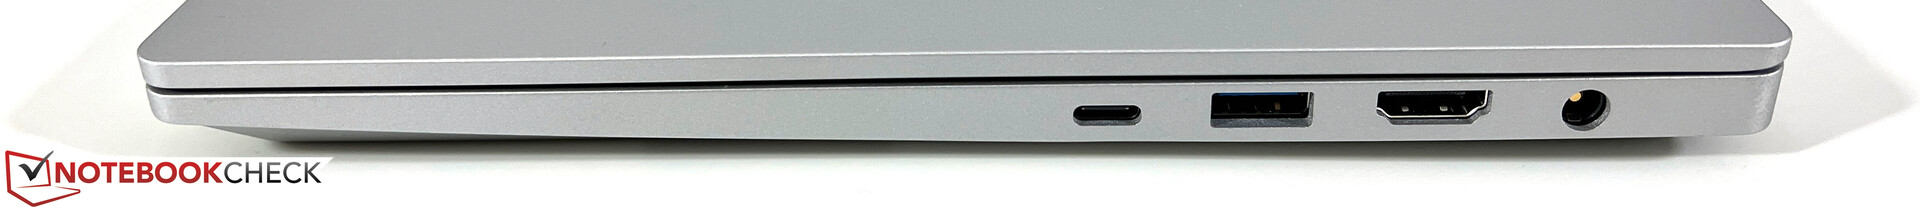
Anslutningar - Vision 14 med Thunderbolt 4 och kortläsare
Det har inte skett några förändringar när det gäller anslutningsmöjligheterna, vilket innebär att användarna fortsätter att dra nytta av samma generösa portval som inkluderar Thunderbolt 4. En fullstor kortläsare finns också tillgänglig. Schenker använder fortfarande Intel AX201 Wi-Fi-modulen, som når bra överföringshastigheter i våra tester. Eftersom antennkonfigurationen i Vision 14 inte stöder 6 GHz-nätverk är Wi-Fi 6E-moduler (som AX211) inte tillgängliga.
| SD Card Reader | |
| average JPG Copy Test (av. of 3 runs) | |
| Apple MacBook Pro 14 2021 M1 Pro Entry (AV PRO V60) | |
| Schenker Vision 14 (Angelbird AV Pro V60) | |
| Genomsnitt av klass Subnotebook (23.7 - 188, n=9, senaste 2 åren) | |
| Schenker Vision 14 2022 RTX 3050 Ti | |
| Asus Vivobook Pro 14 M3401QC-KM007T (AV Pro SD microSD 128 GB V60) | |
| Dell Inspiron 14 Plus 7420 (AV PRO microSD 128 GB V60) | |
| maximum AS SSD Seq Read Test (1GB) | |
| Genomsnitt av klass Subnotebook (24.9 - 195, n=8, senaste 2 åren) | |
| Schenker Vision 14 (Angelbird AV Pro V60) | |
| Schenker Vision 14 2022 RTX 3050 Ti | |
| Asus Vivobook Pro 14 M3401QC-KM007T (AV Pro SD microSD 128 GB V60) | |
| Dell Inspiron 14 Plus 7420 (AV PRO microSD 128 GB V60) | |
Webbkamera
Webbkamerans sensor har uppgraderats från den äldre 720p-versionen till en 1080p-version. Detta förbättrar bildskärpan något, samtidigt som färgavvikelserna är ganska låga överlag.


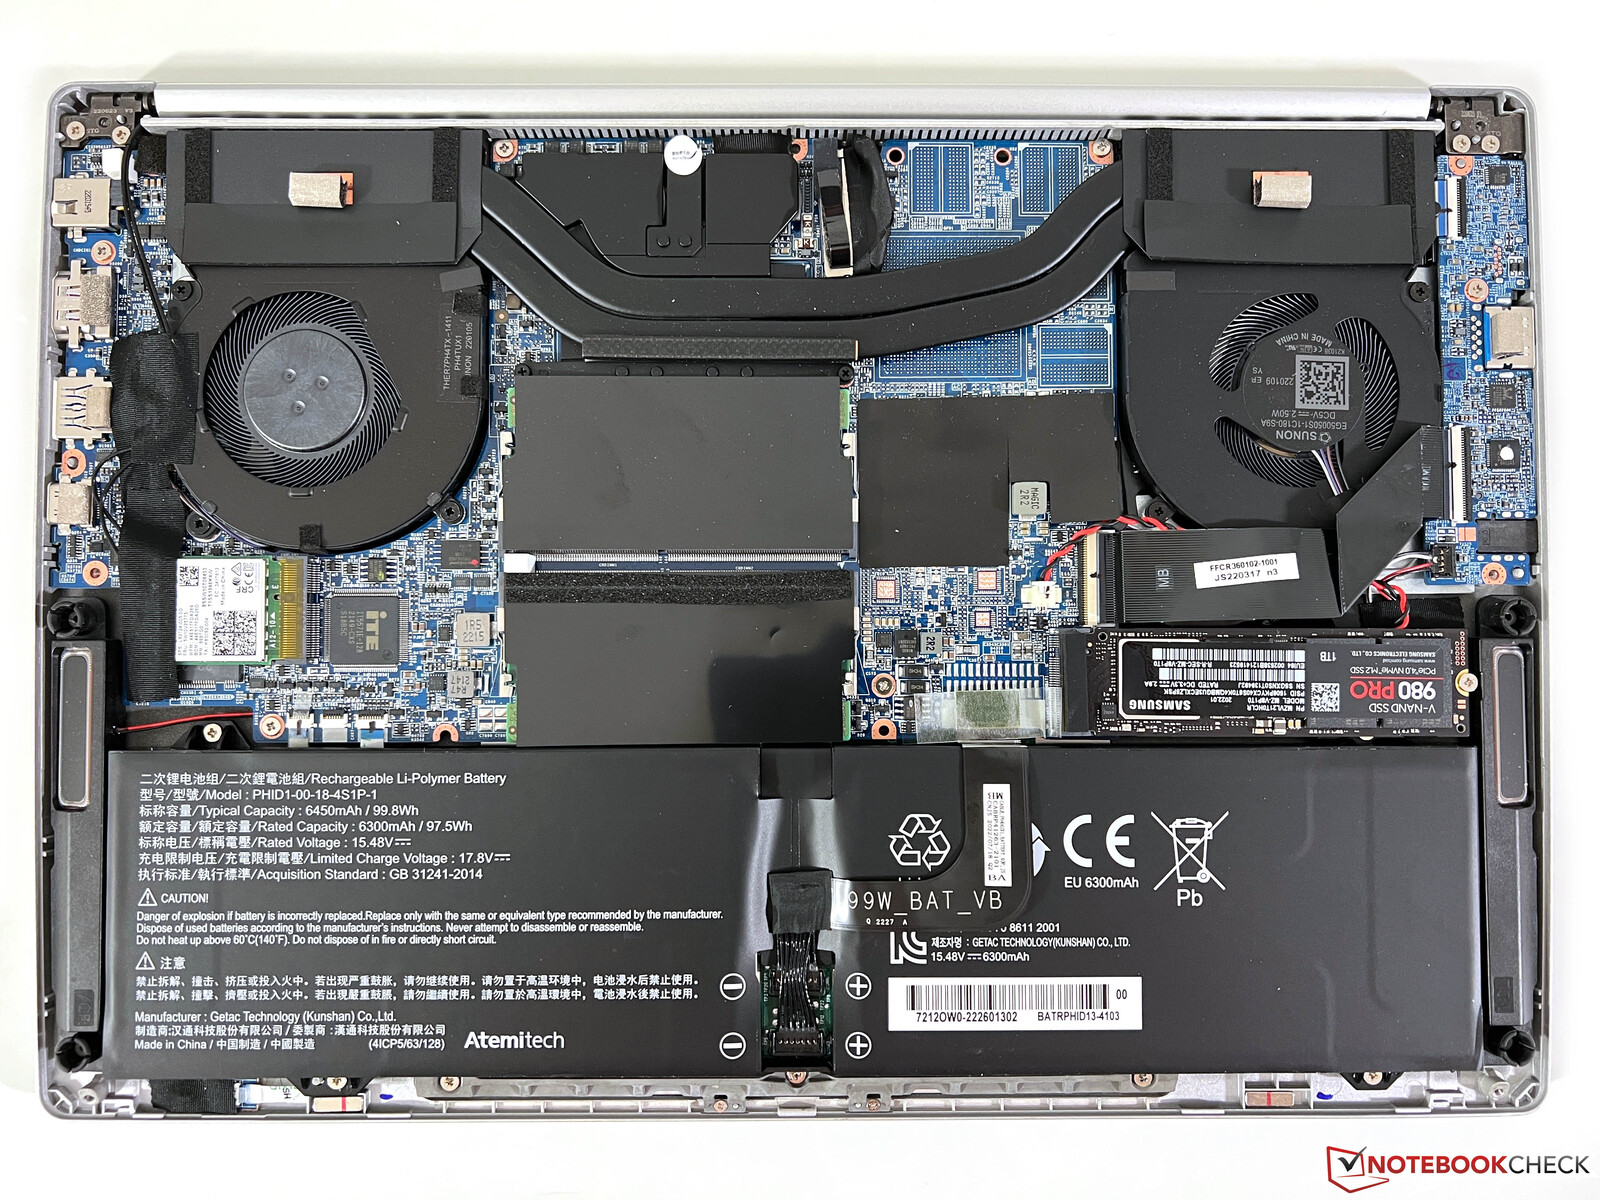
Underhåll
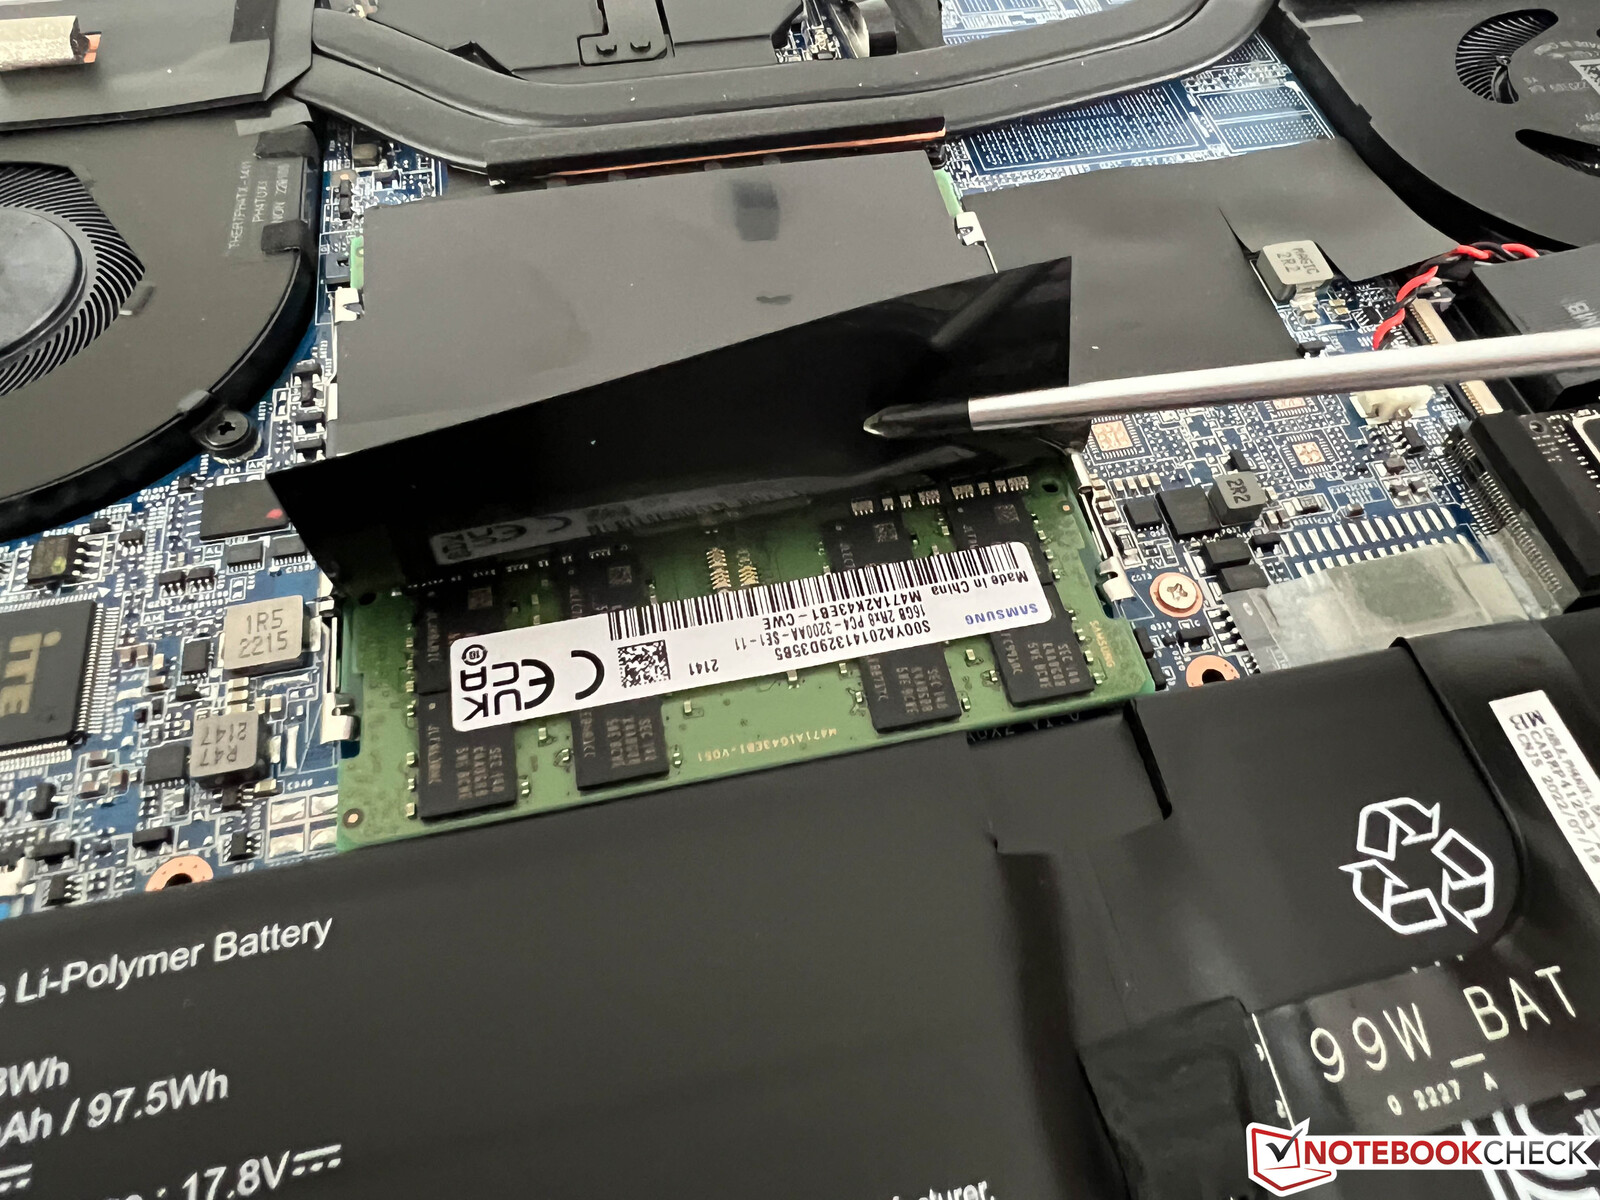
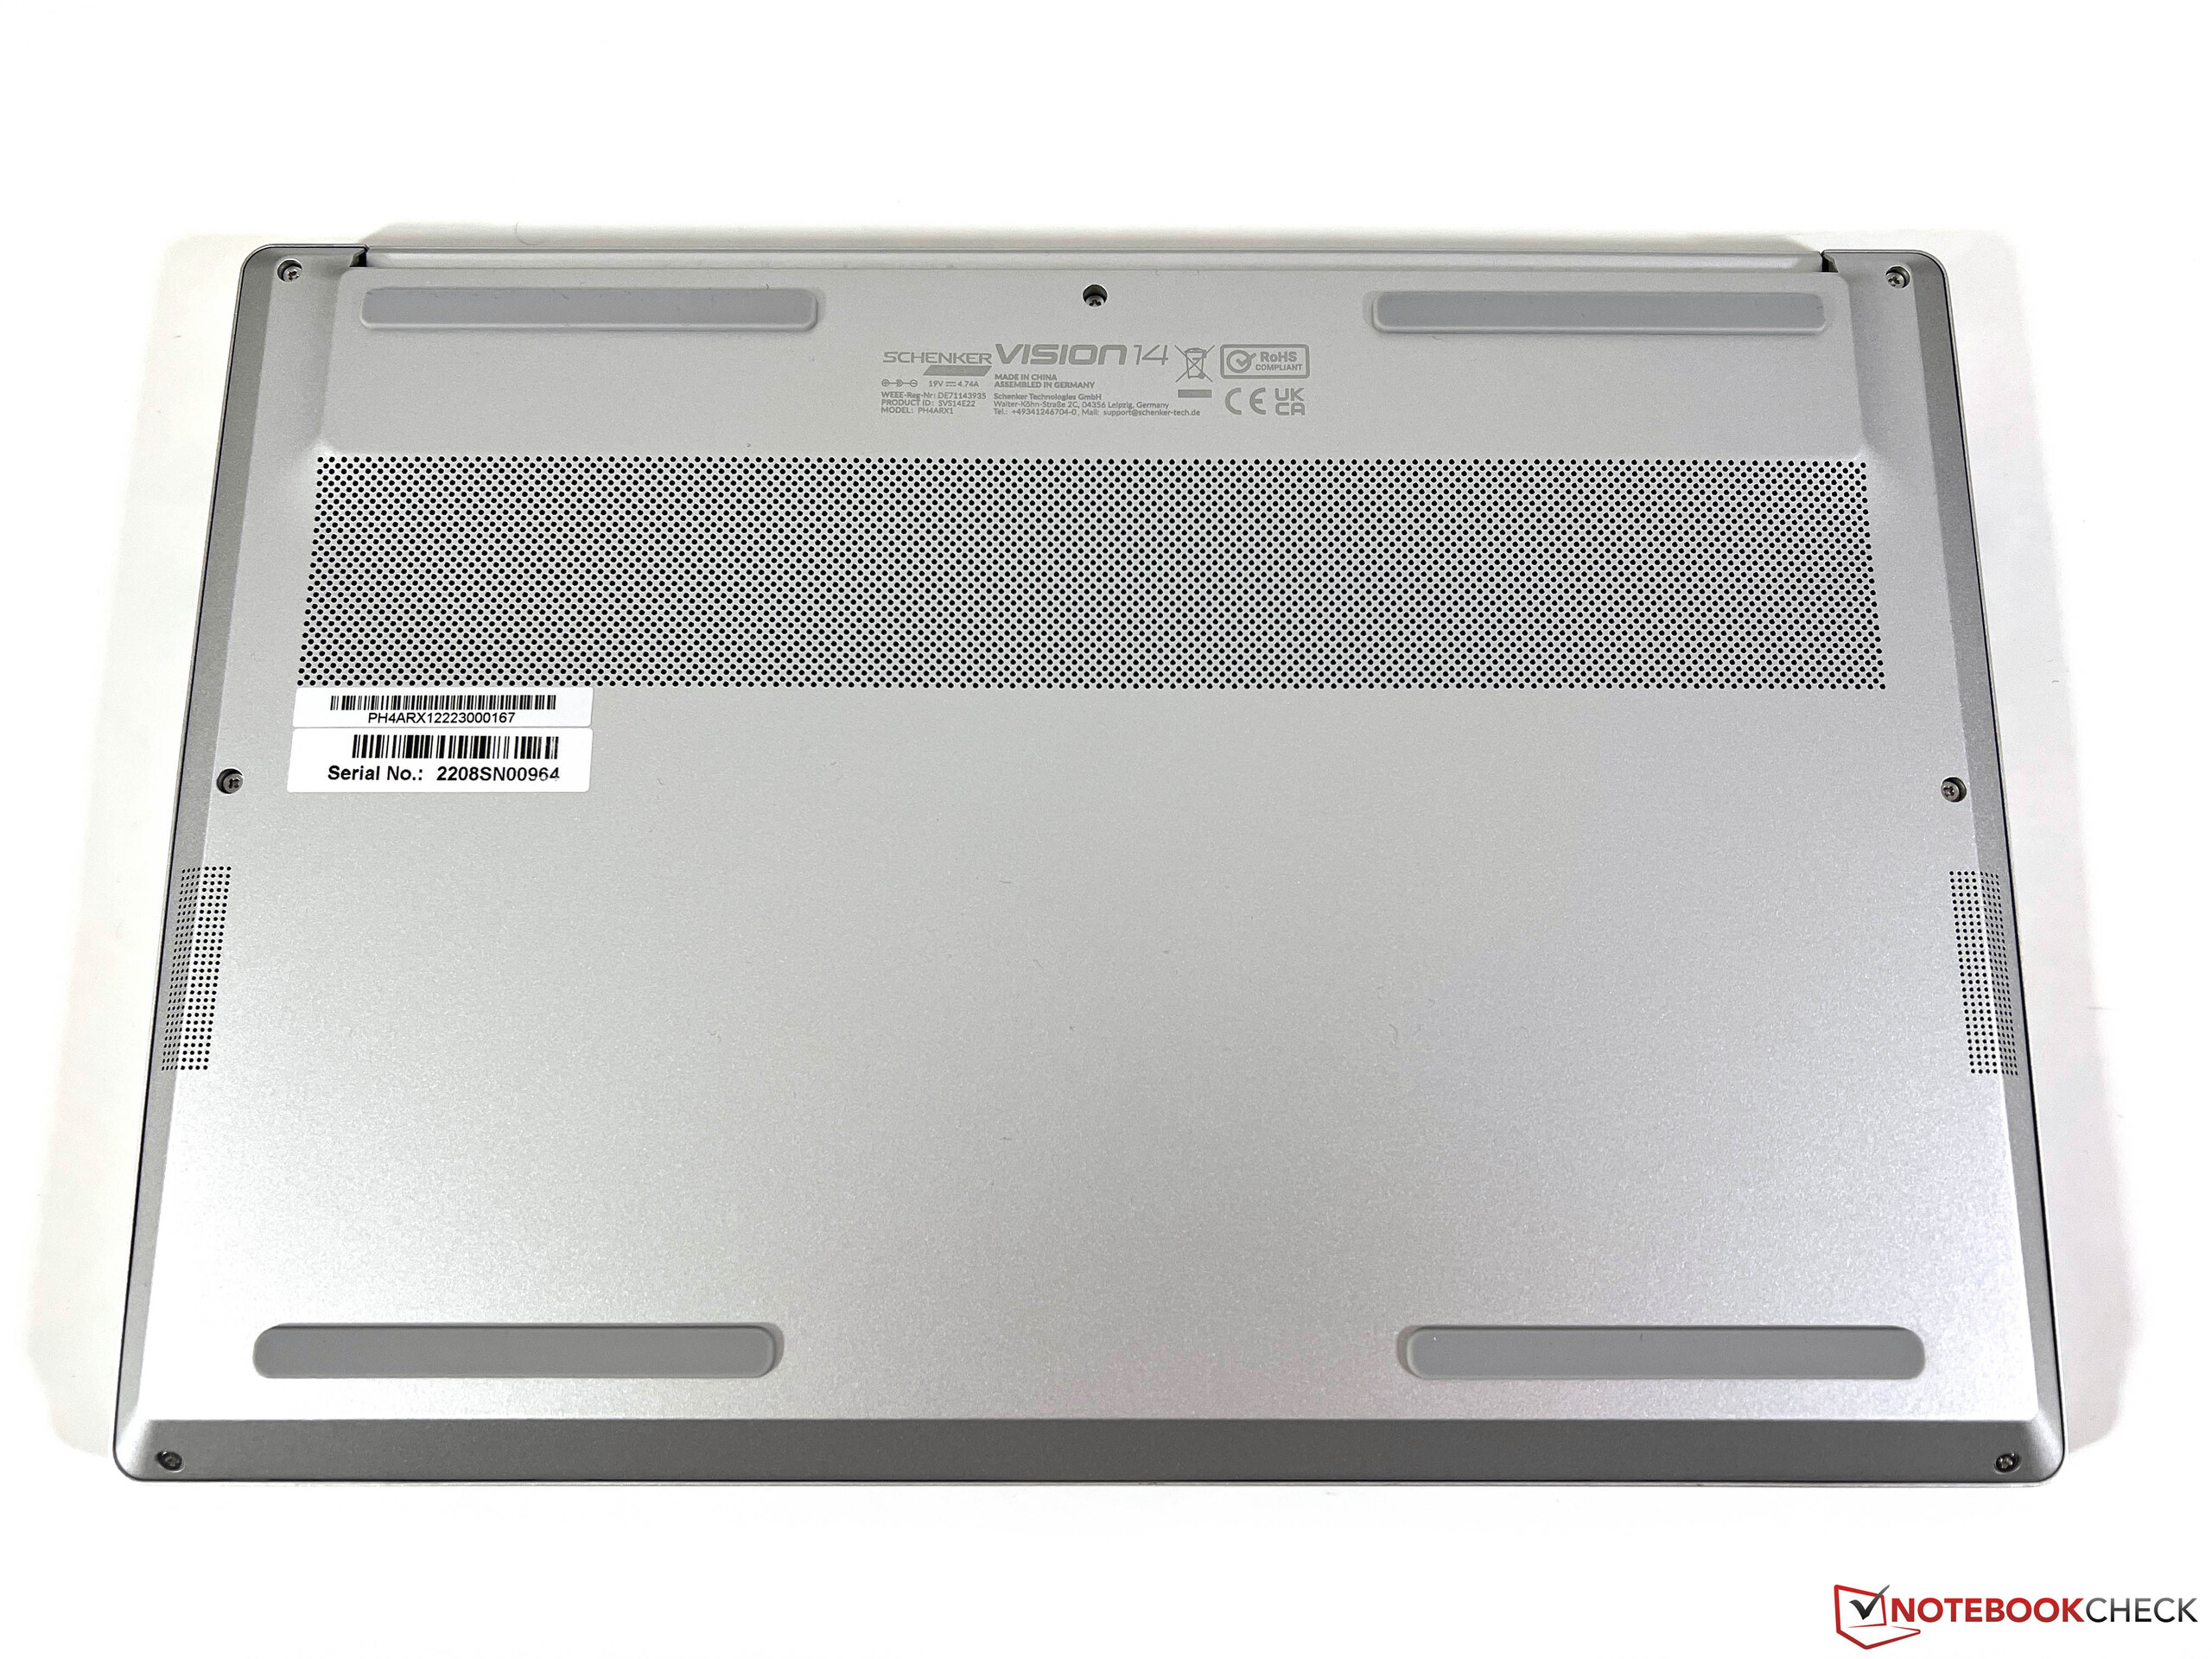
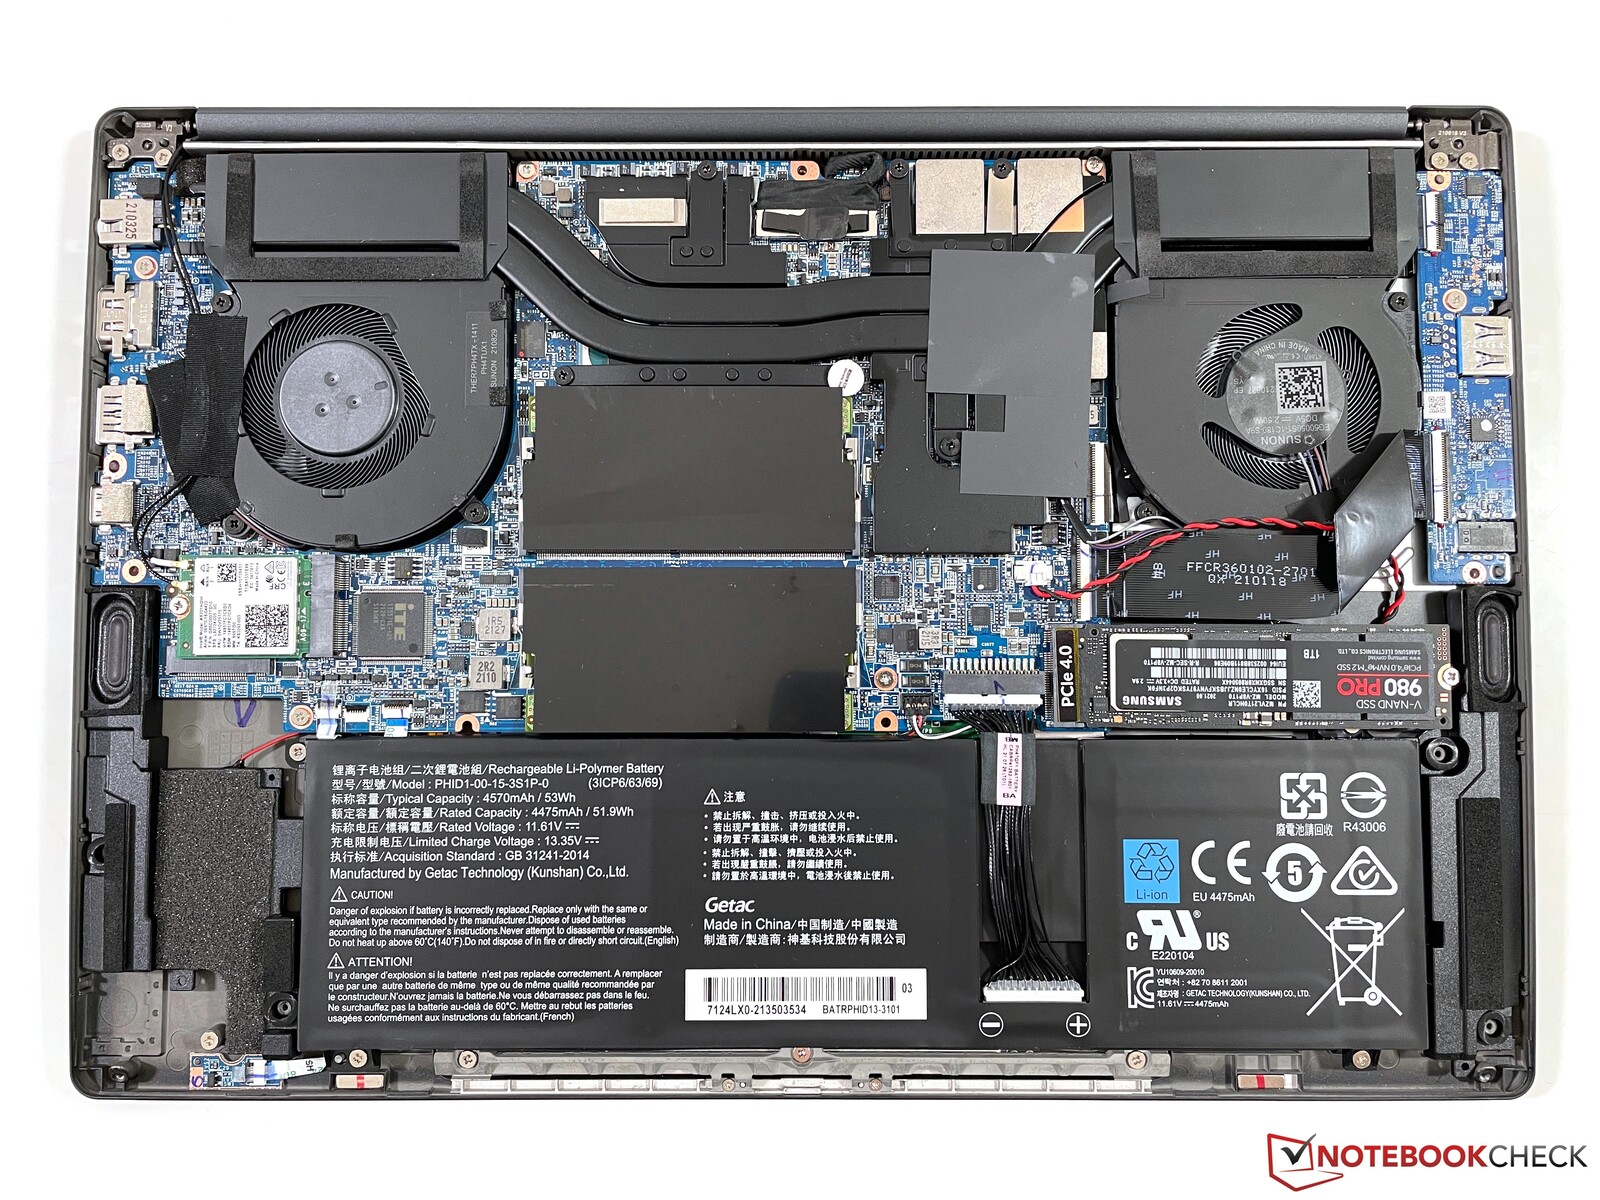
Bottenplattan kan enkelt tas bort för att omedelbart avslöja den nya 99-Wh på insidan samt flera samtidiga ändringar av moderkortet och högtalarna. Detta innebär att det nya batteriet inte passar tidigare Vision 14-modeller. Det bör noteras att den sekundära M.2-2280-platsen inte är tillgänglig på modeller med det större batteriet. RAM-minnet och Wi-Fi-modulen kan fortfarande uppgraderas.
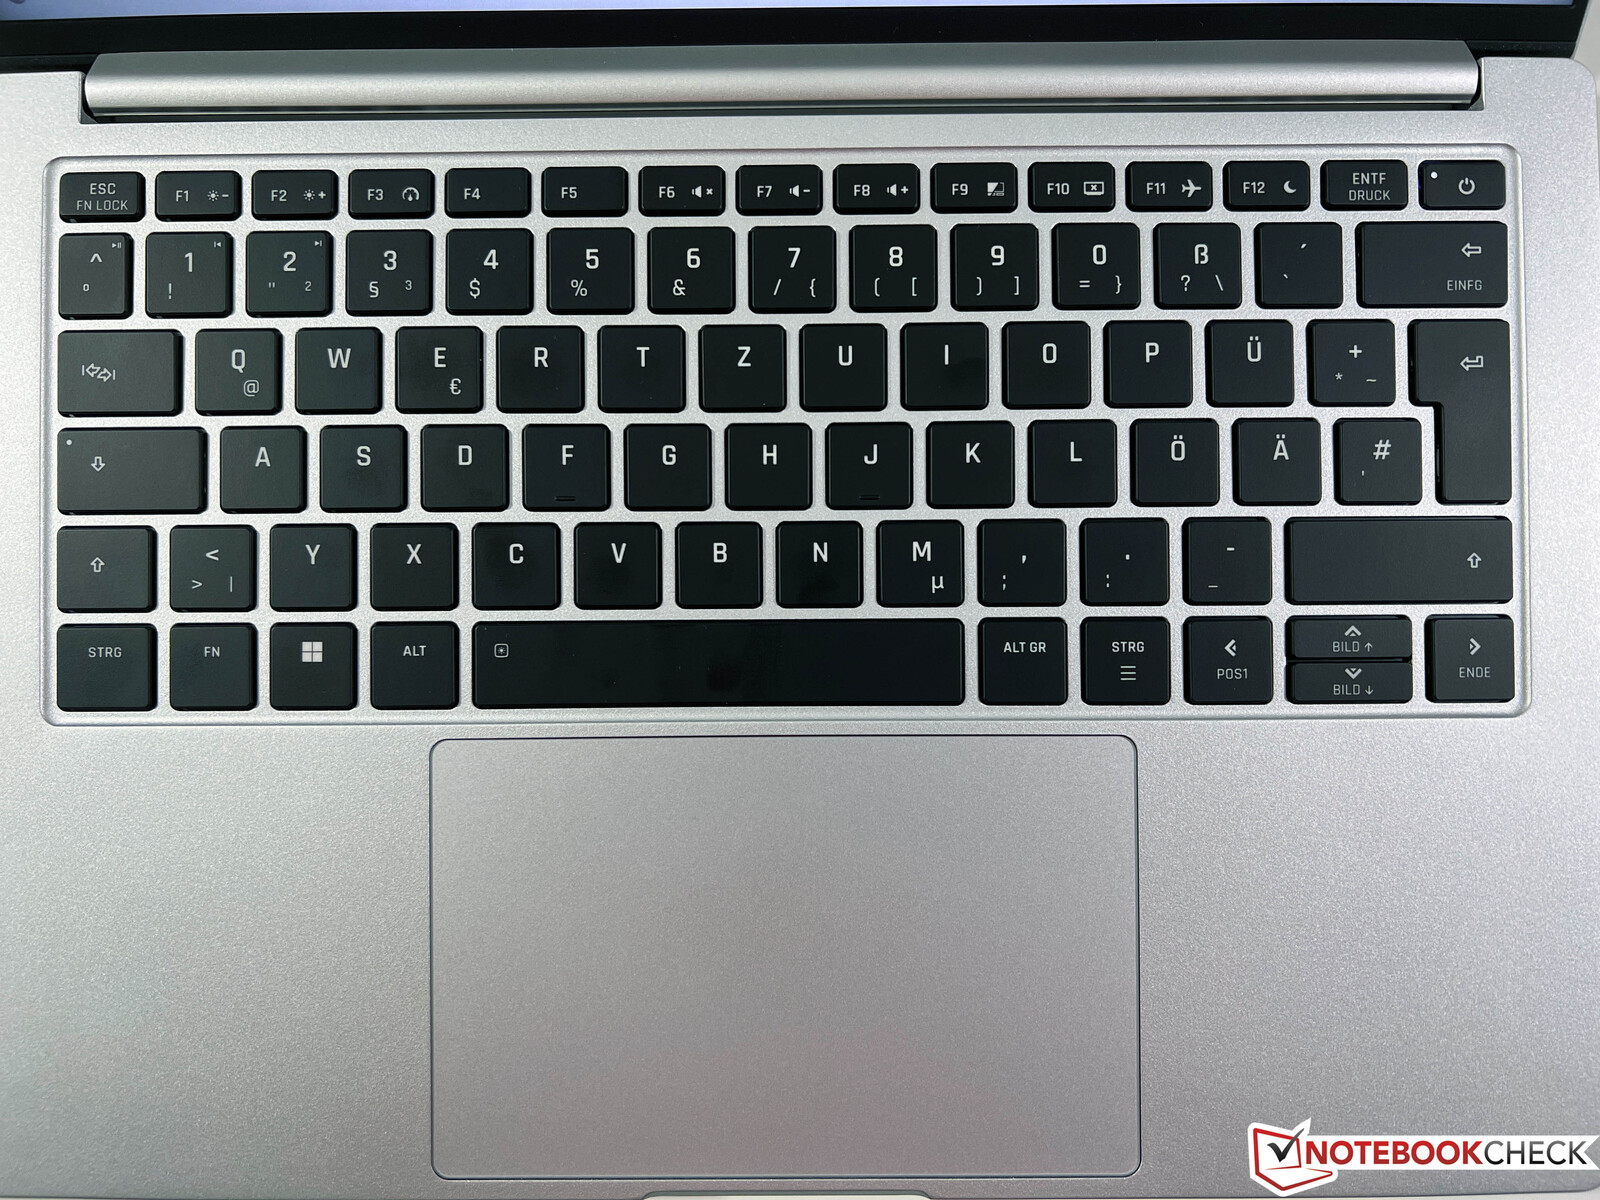
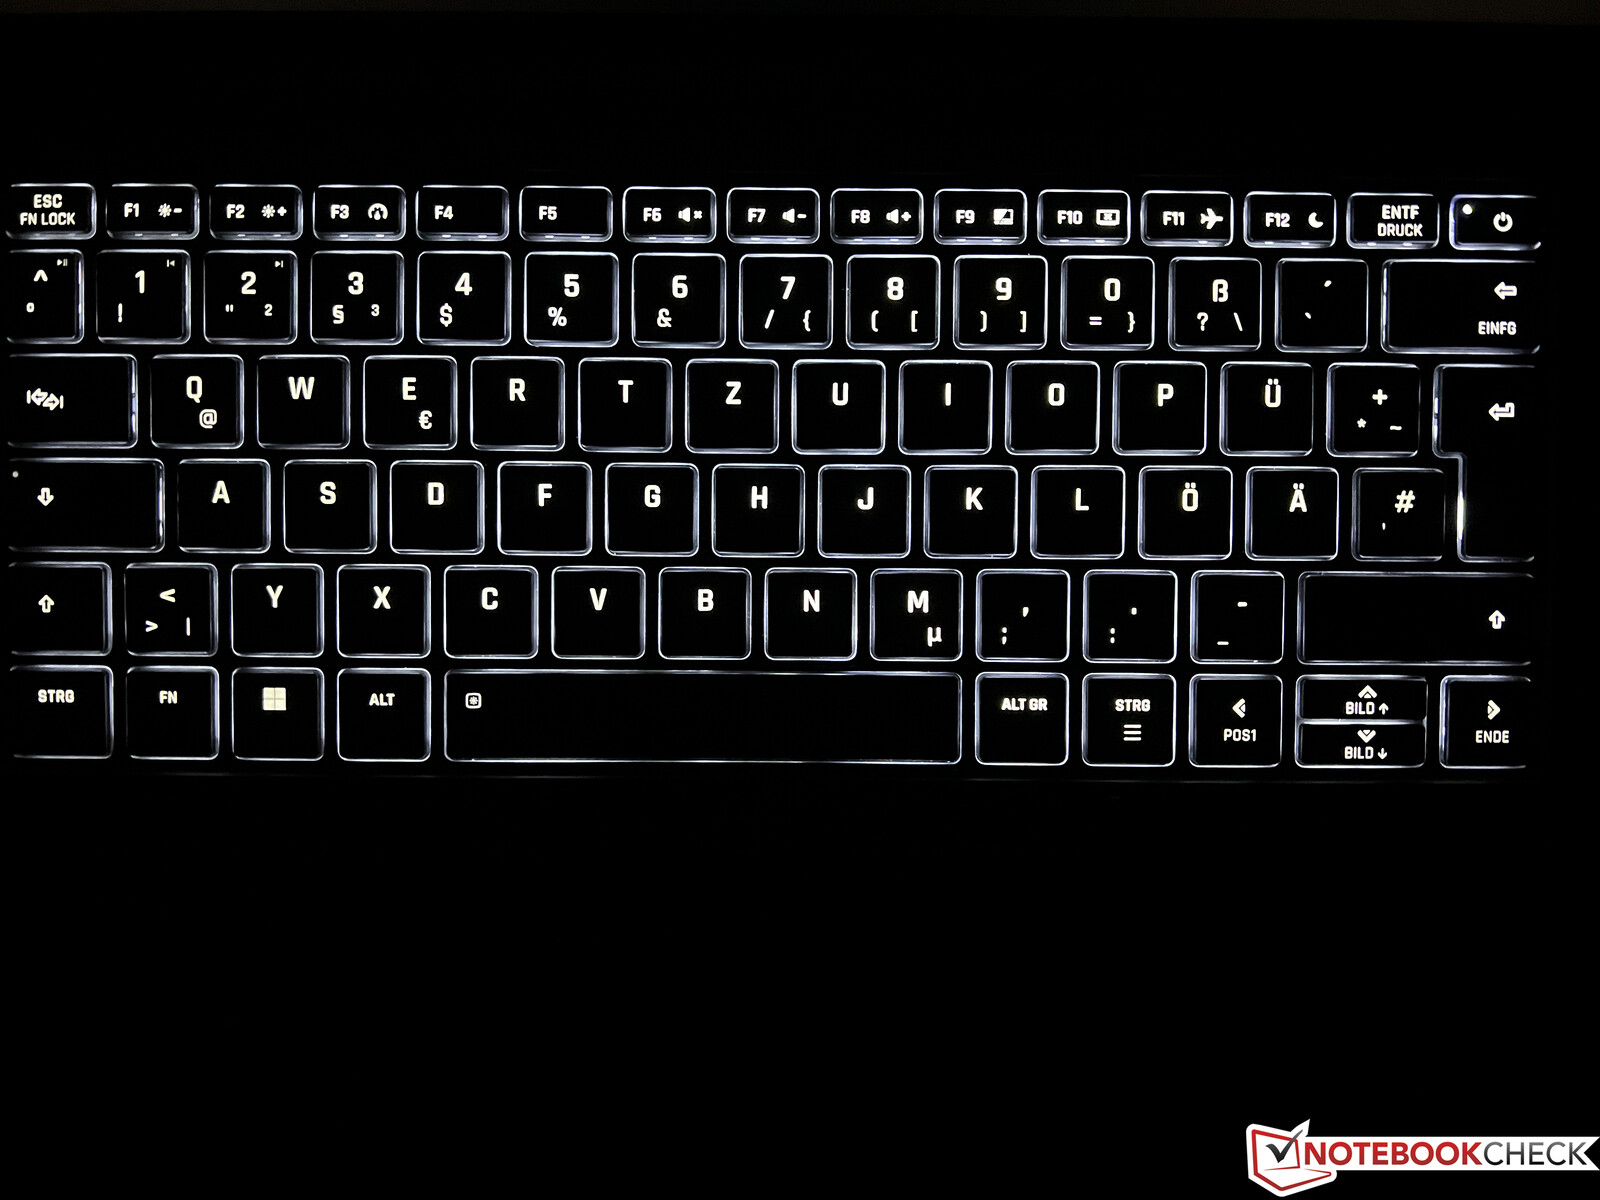
Inmatningsenheter - Bakgrundsbelyst tangentbord och pekplatta av glas
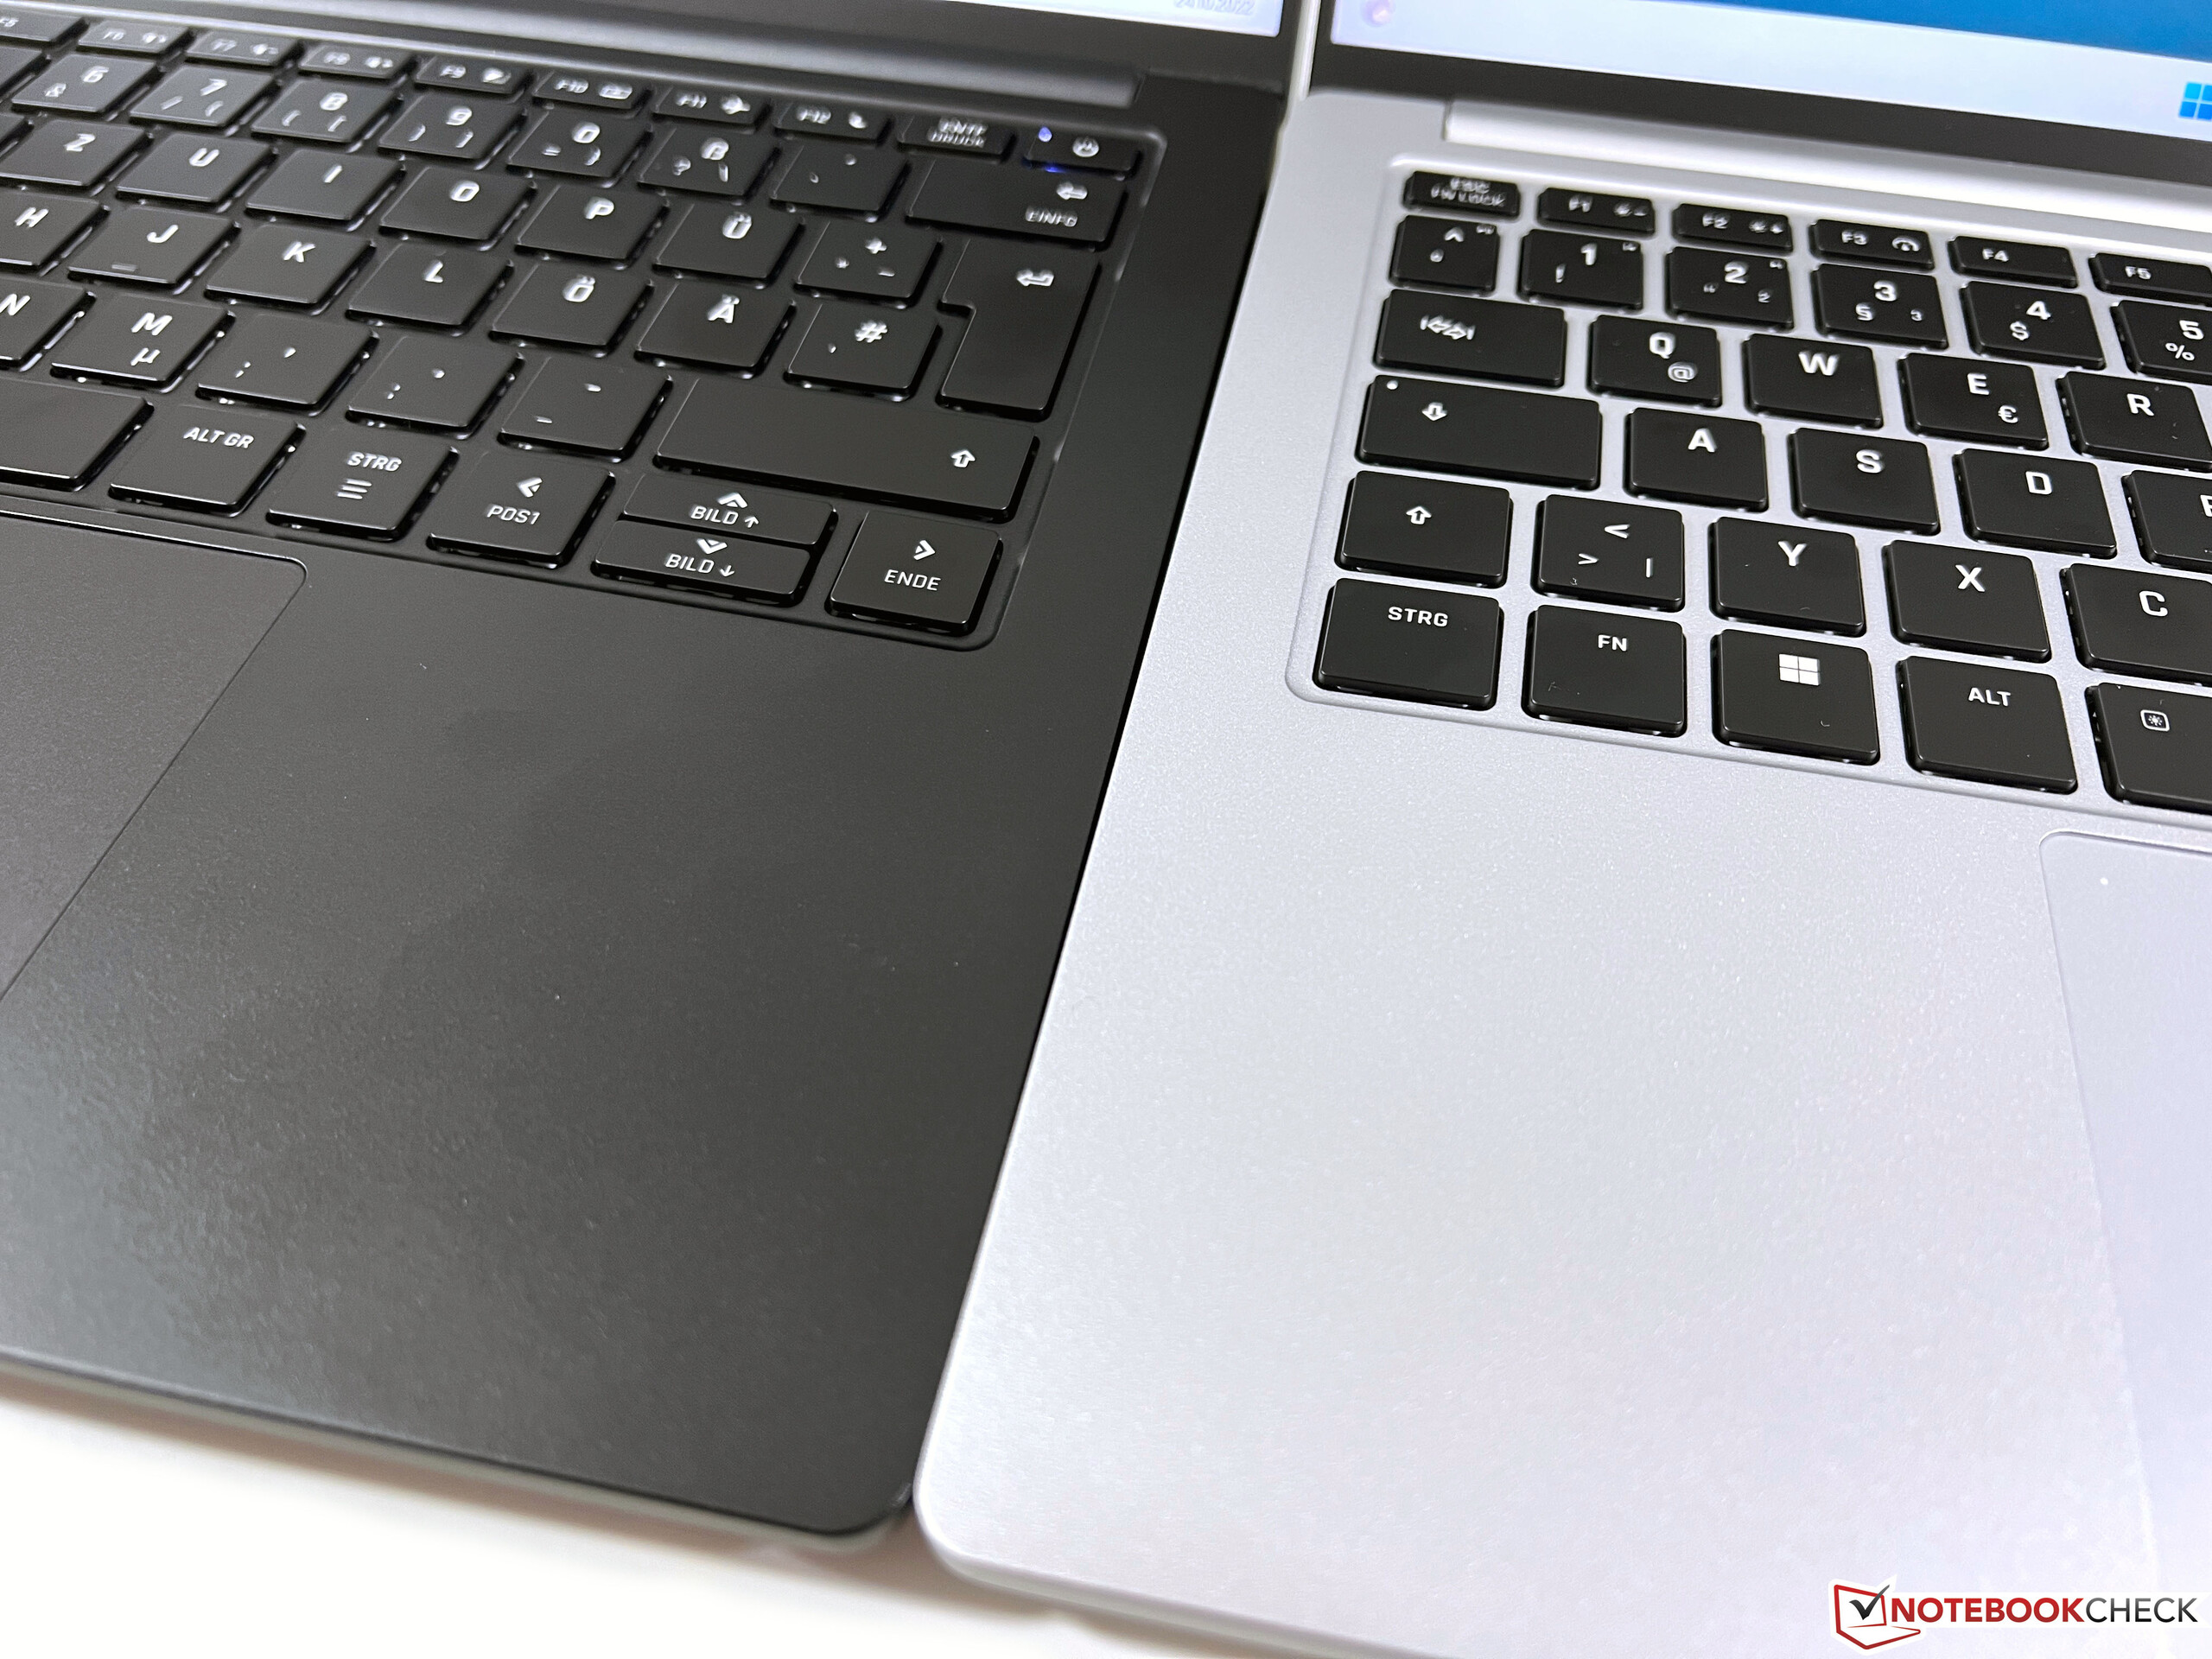
Inmatningsenheterna förblir oförändrade jämfört med tidigare modell. Det bakgrundsbelysta tangentbordet ger en bekväm skrivupplevelse med tyst tangentskrammel. Glaspekplattan (13 x 8 cm / 5,12 x 3,15 tum) är också bra, men dess klick är mycket högljudda.
Skärm - Vision 14 har fortfarande 3K IPS och 90 Hz
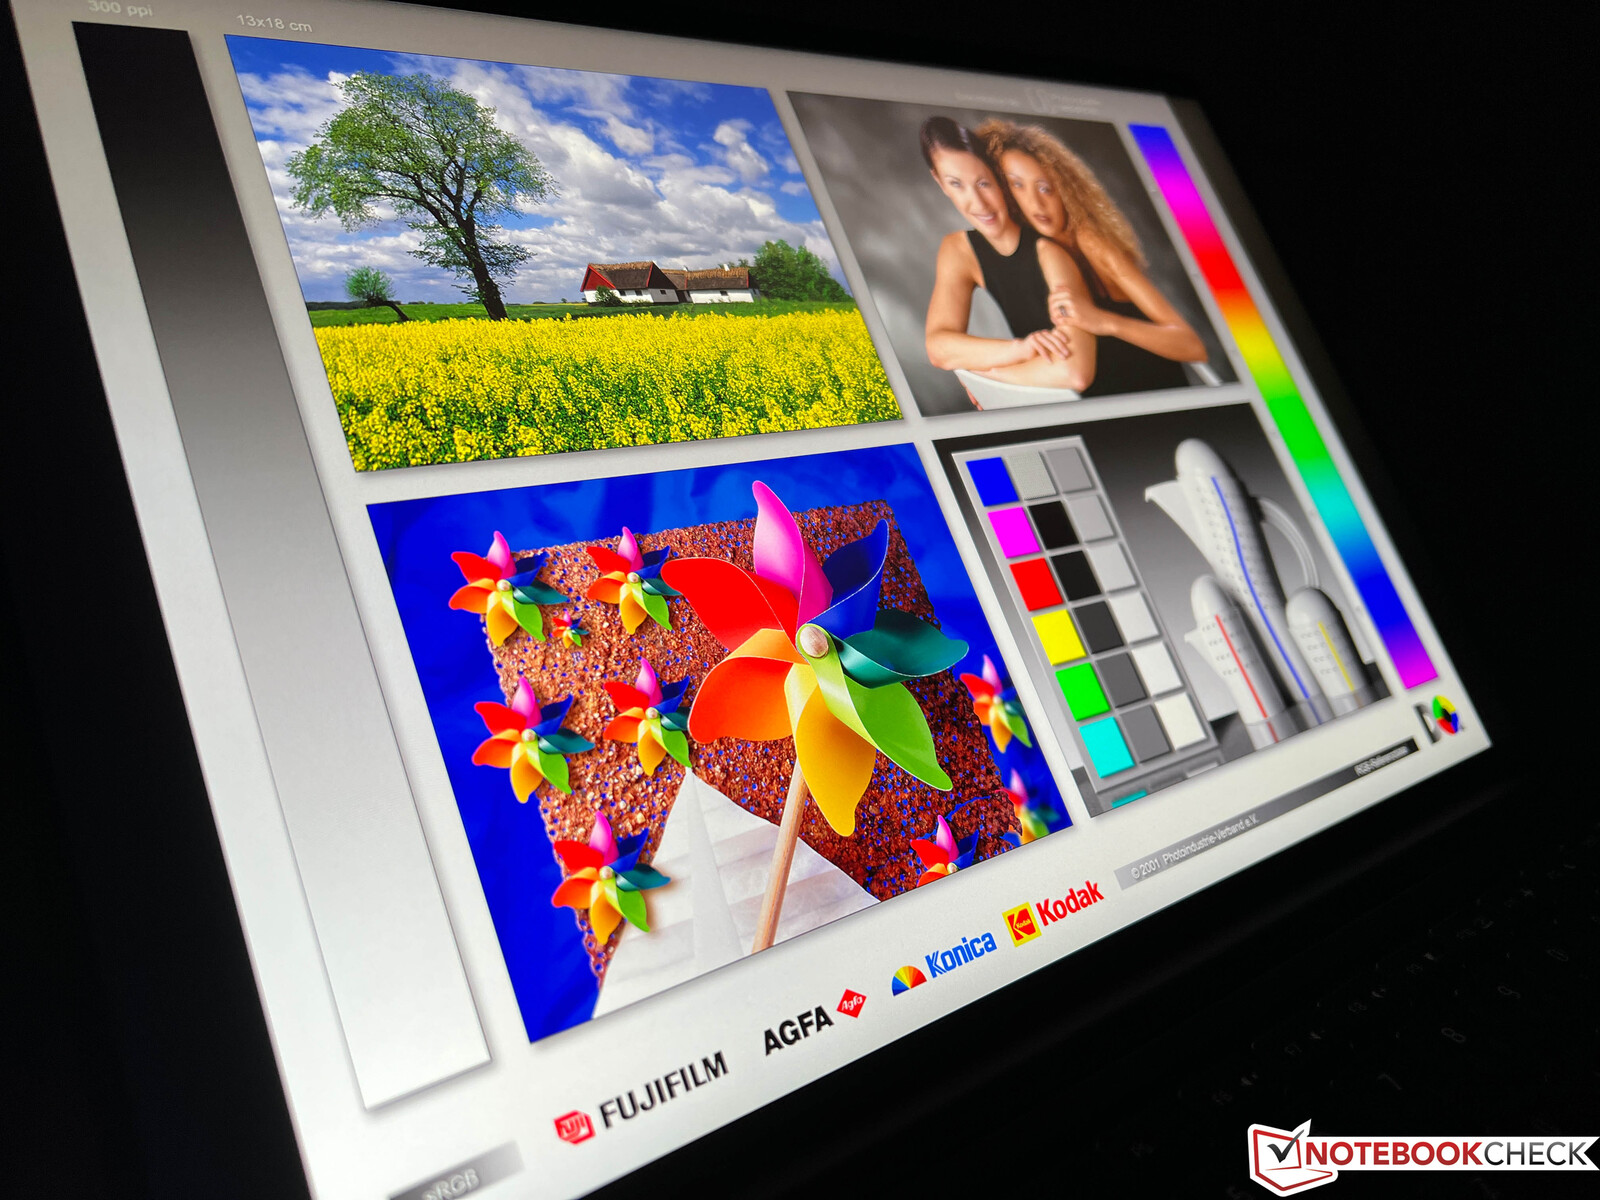
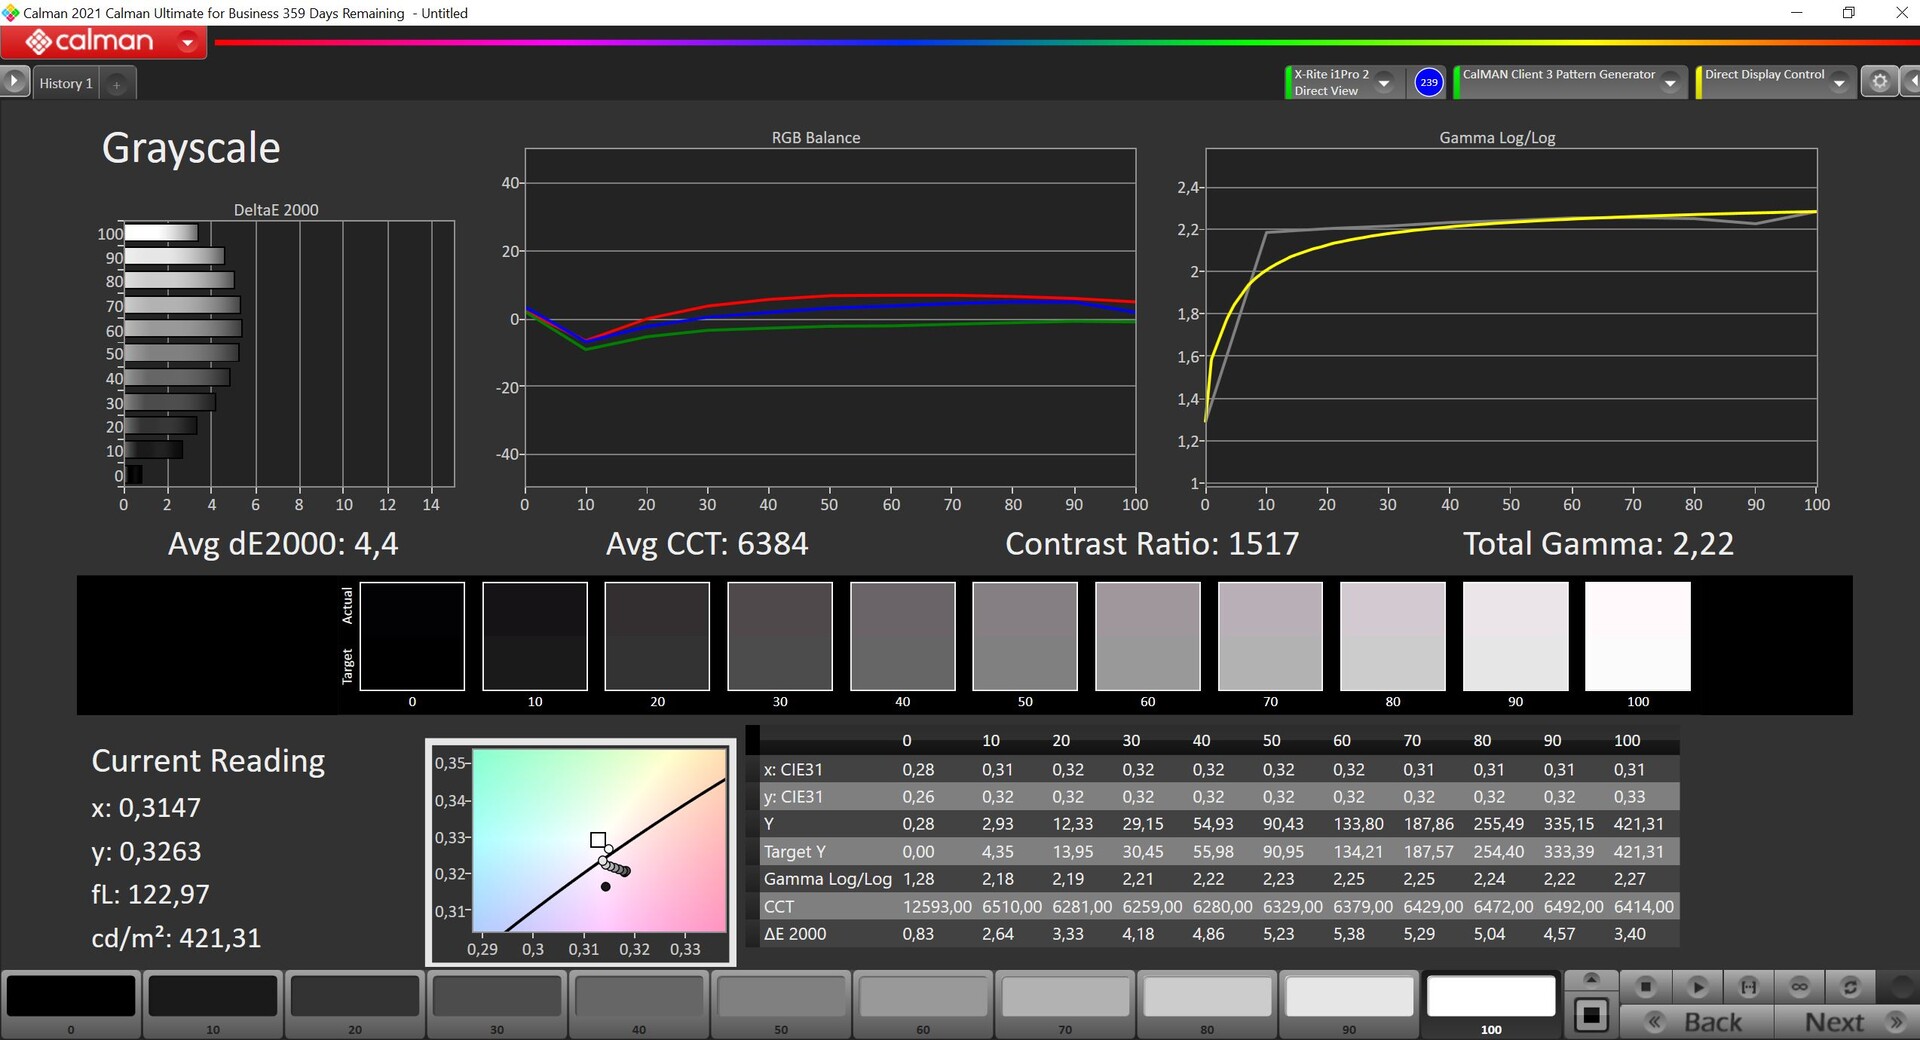
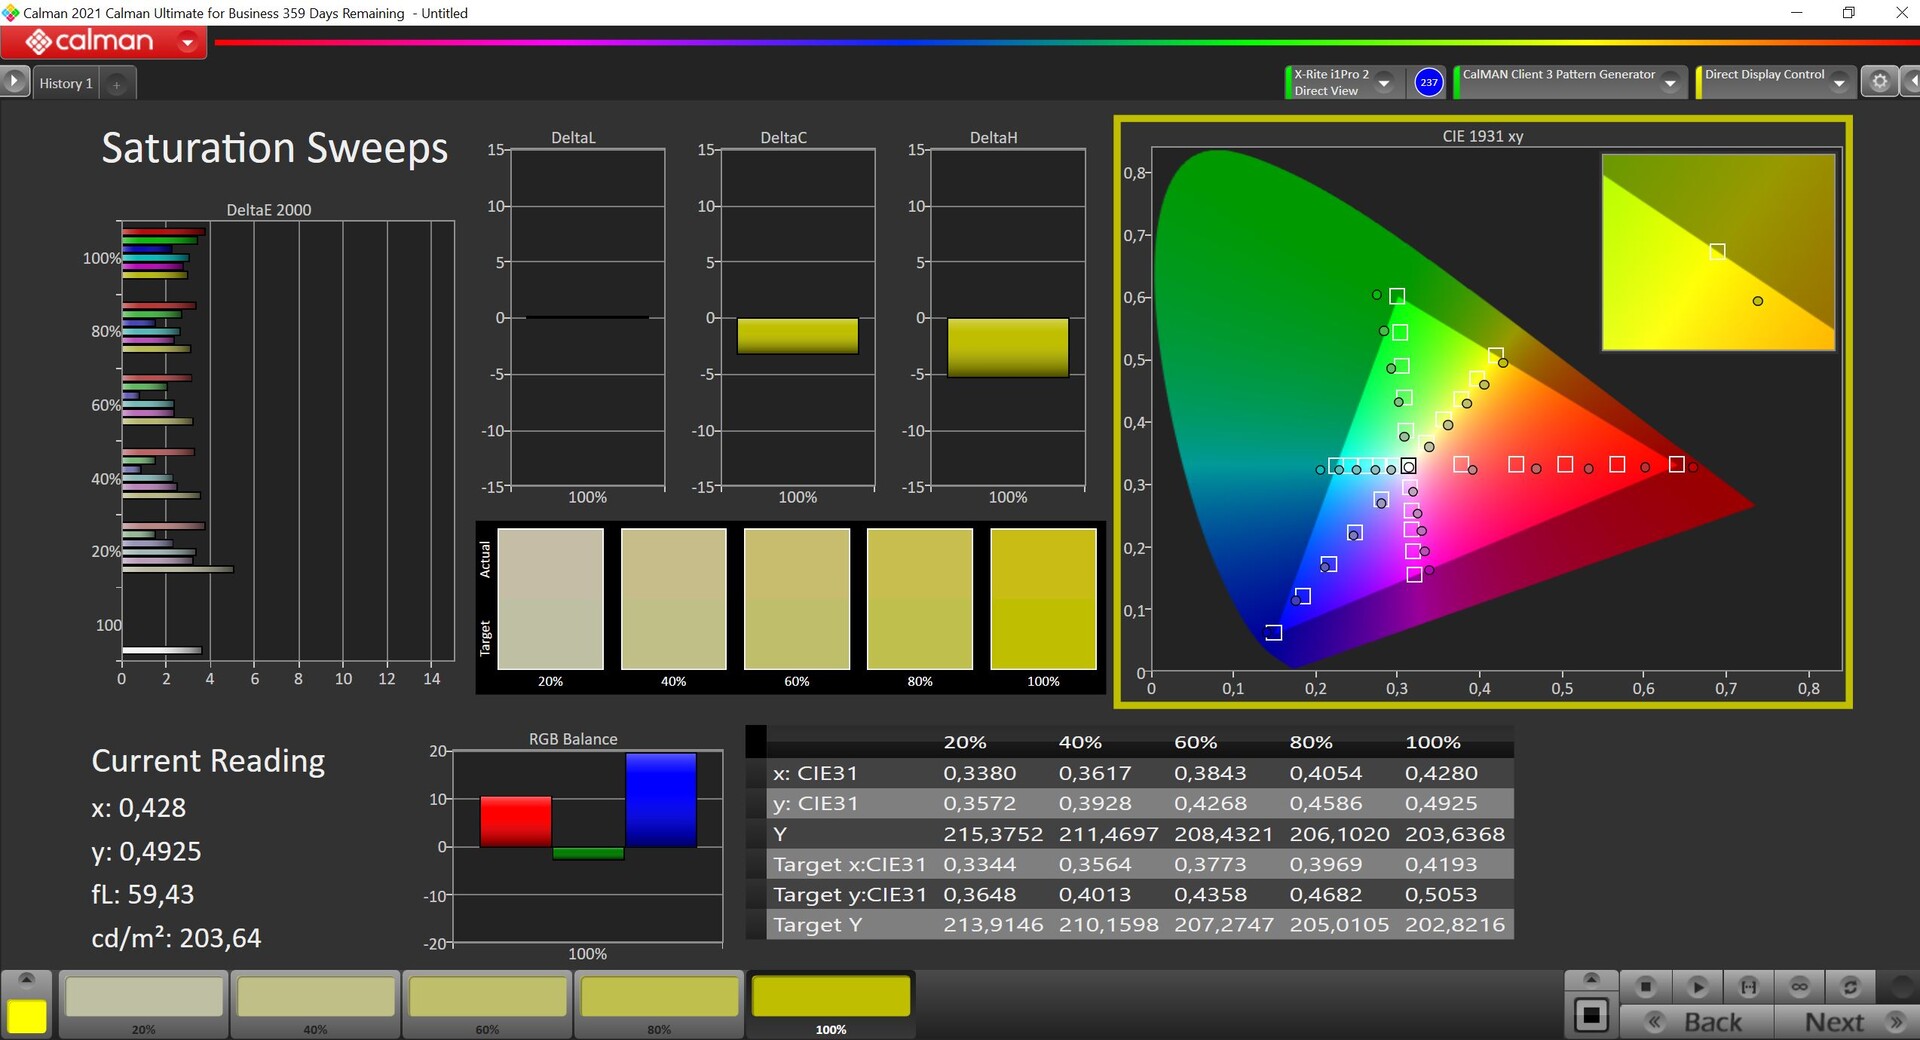
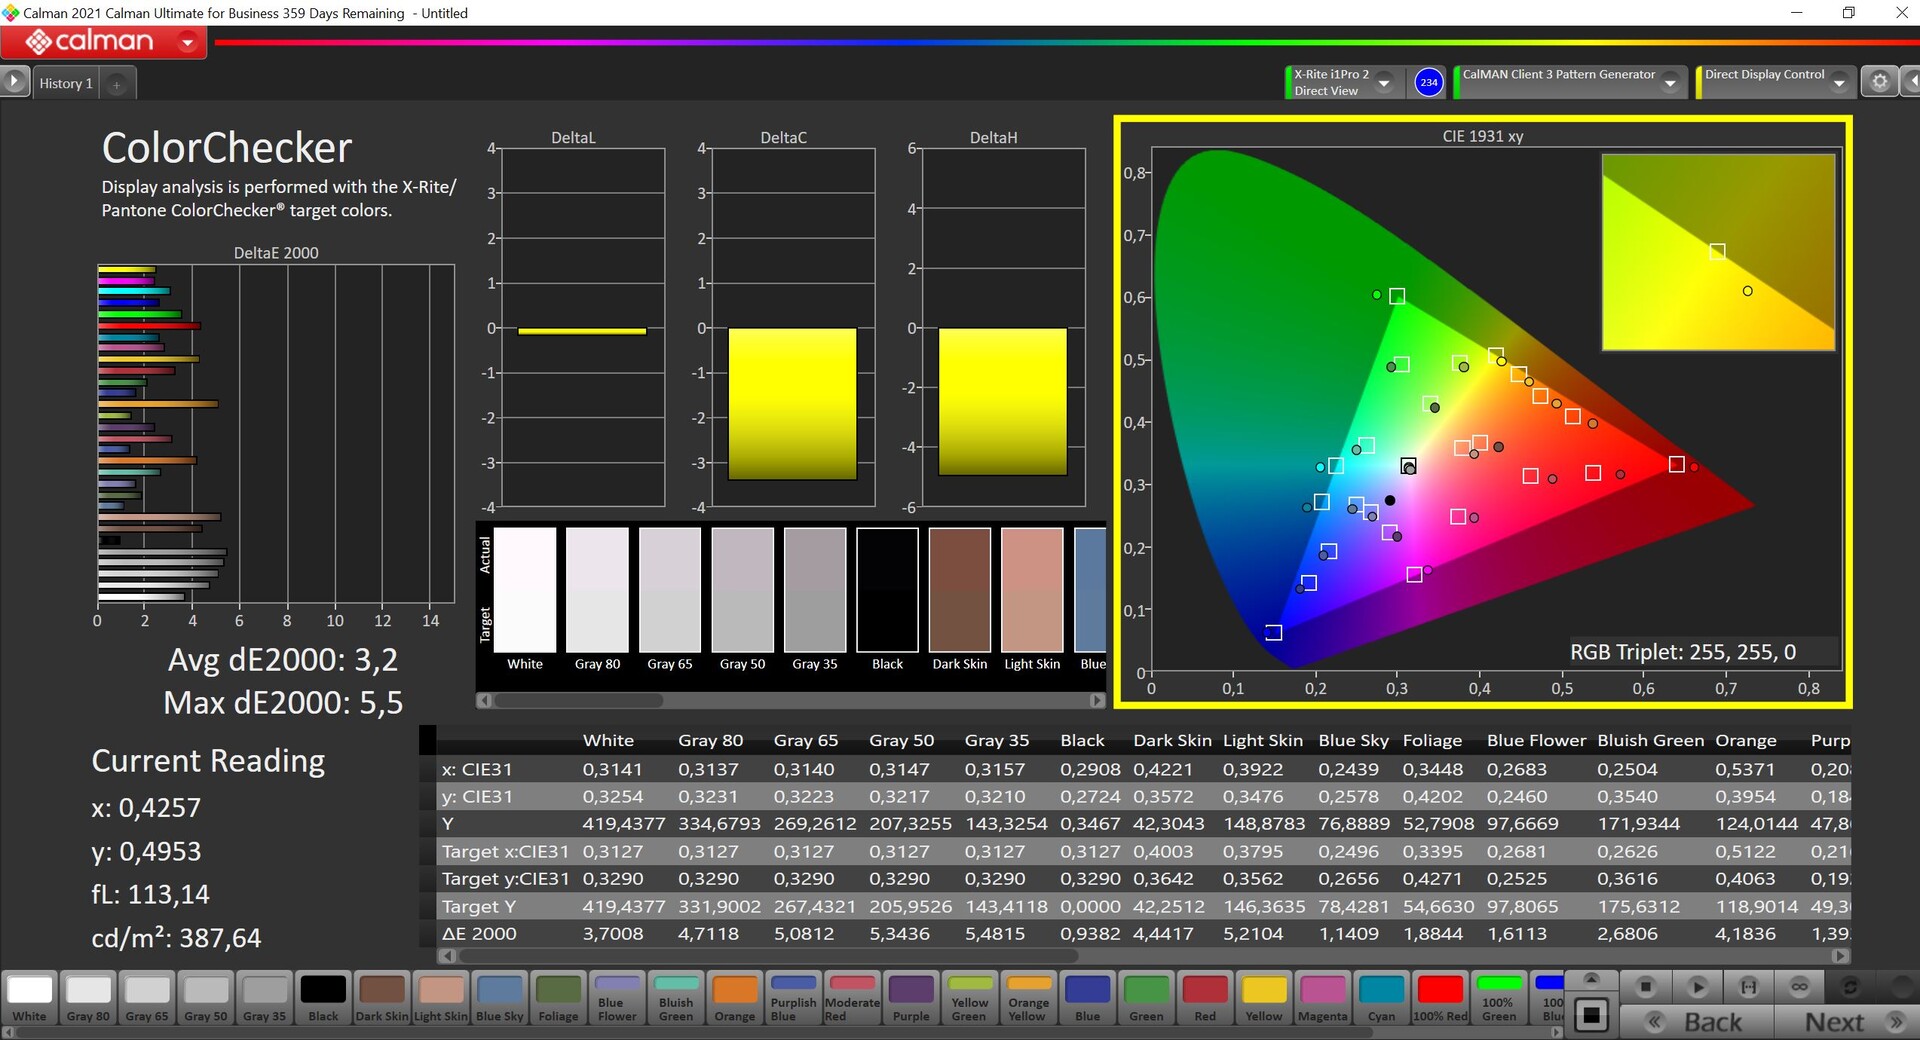
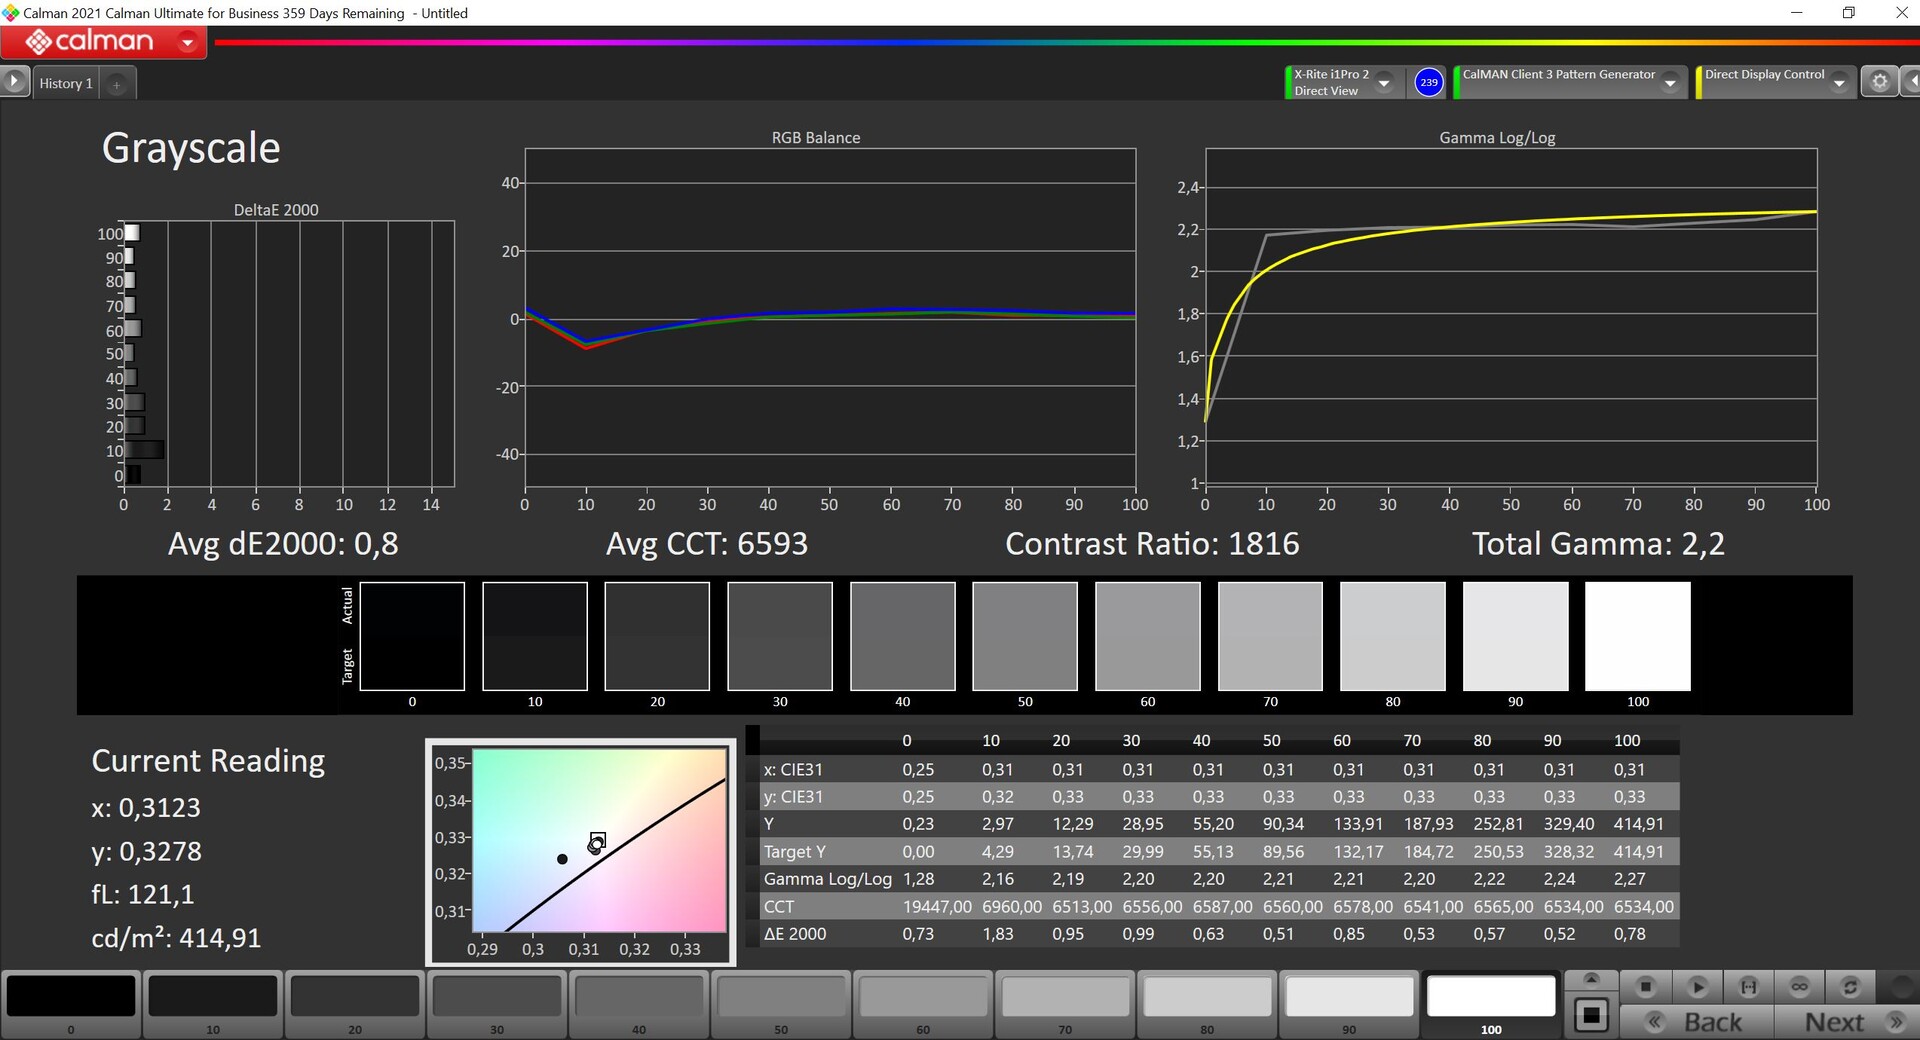
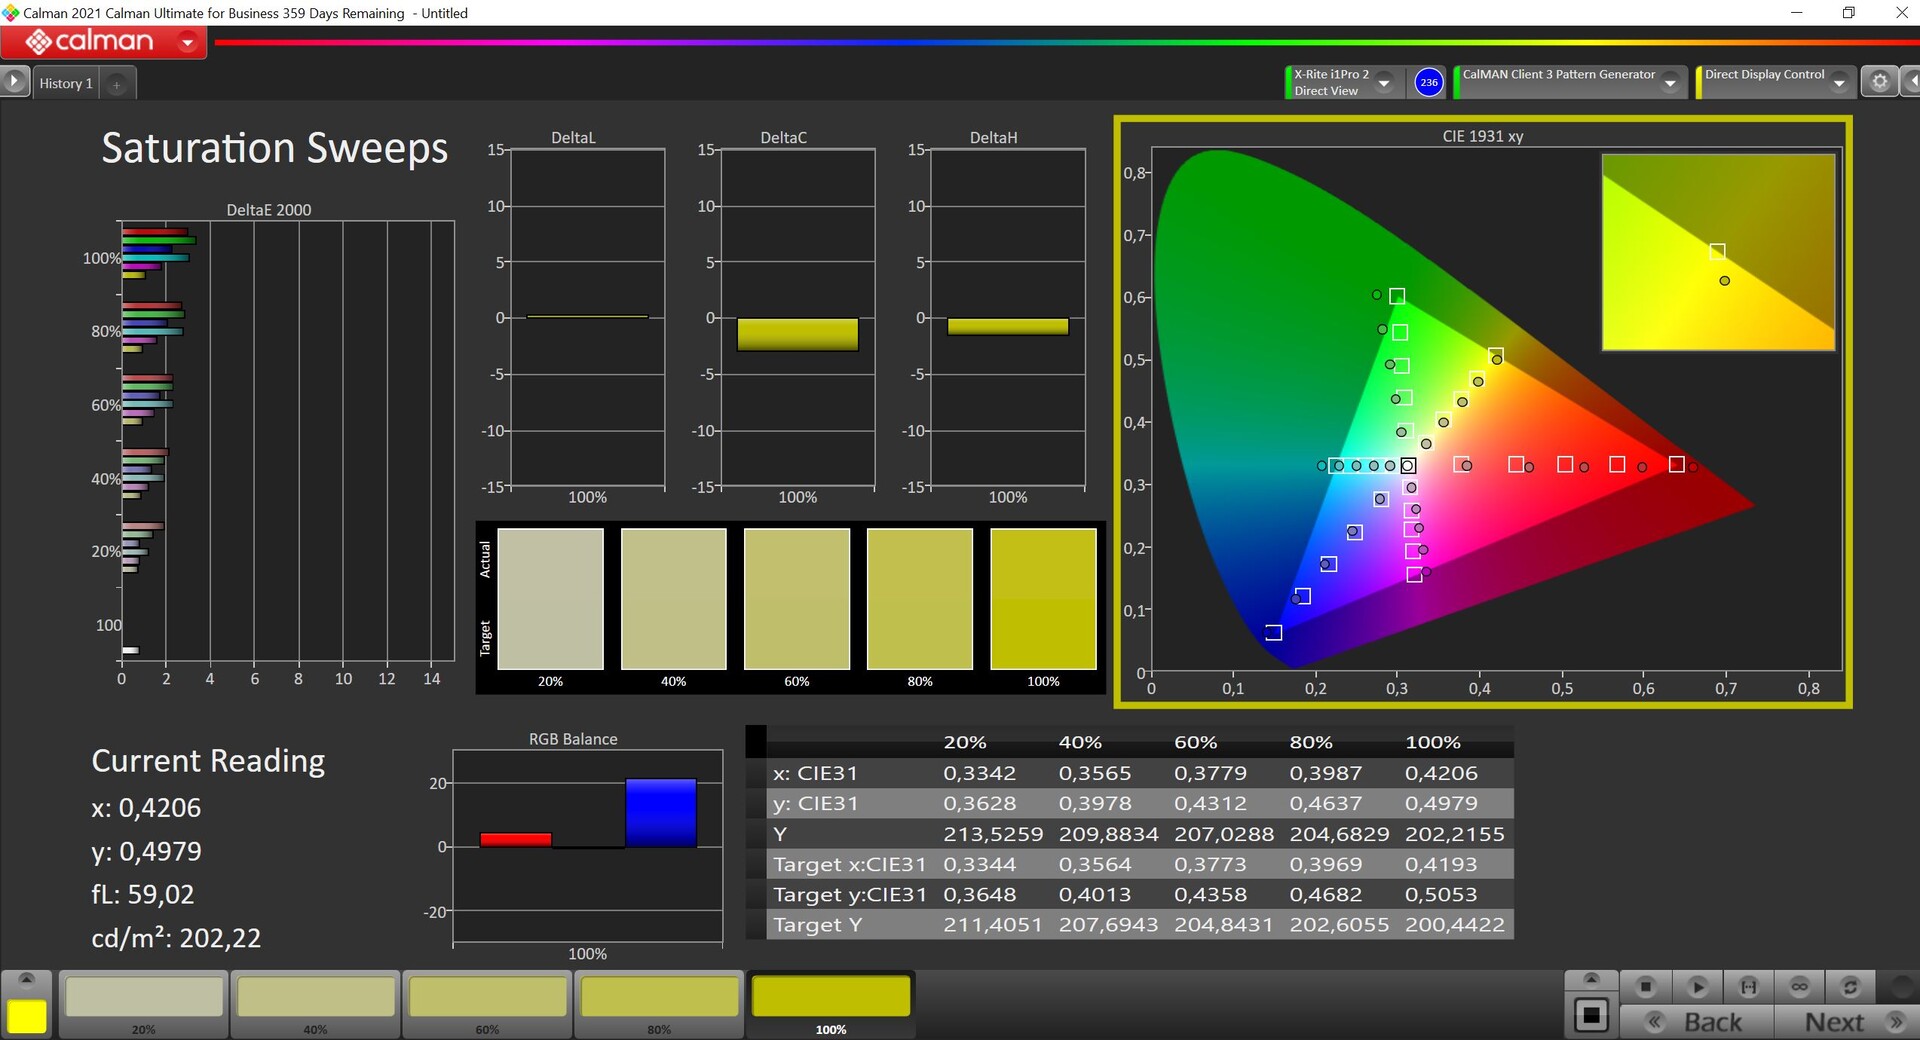
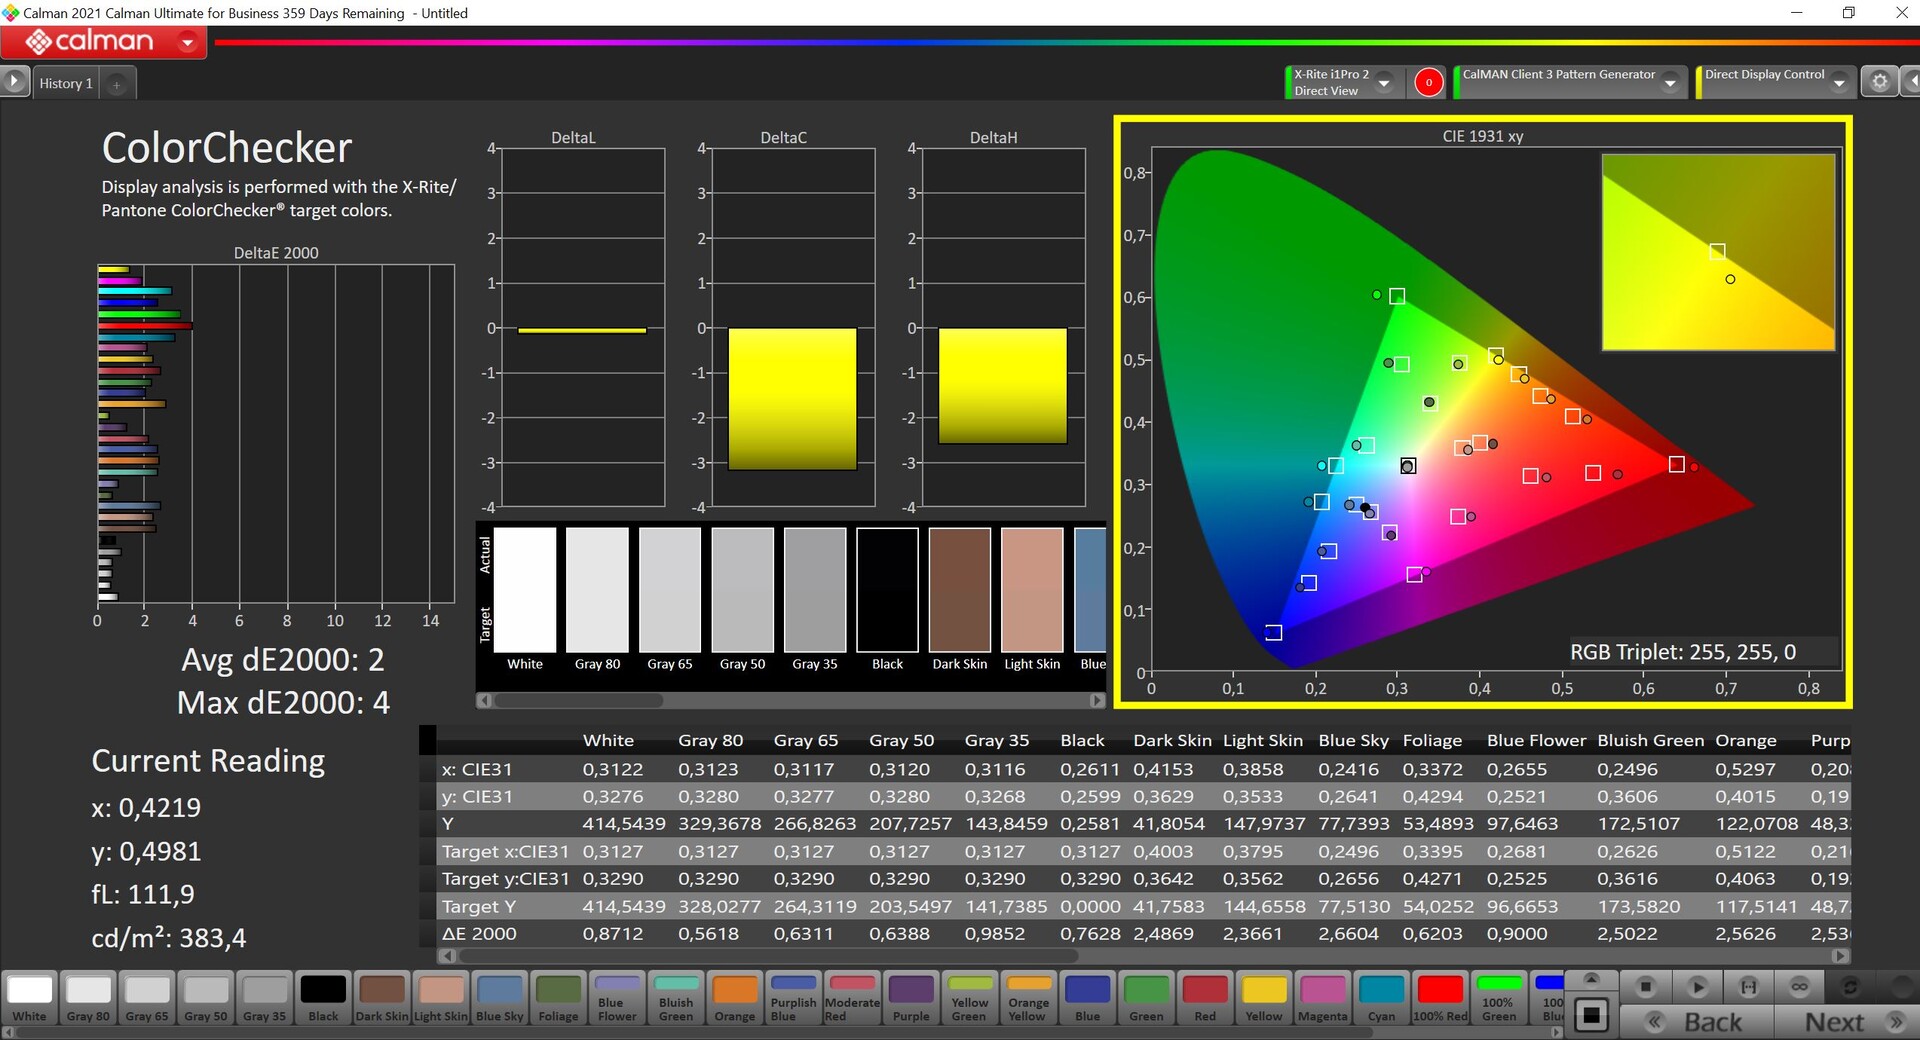
Det finns inte mycket att säga om skärmen, eftersom tillverkaren fortfarande använder samma matta 3K-panel (16:10, 2880 x 1800 pixlar). Skärmkvaliteten är utmärkt och ljusa områden ser inte korniga ut trots det matta lagret. I vår professionella CalMAN-programvaruanalys klarar sig panelen också bra. Den når en genomsnittlig ljusstyrka på ~415 nits och ett bra kontrastförhållande på 1500:1. Från fabrik finns det en svag toning, även om vi kunde åtgärda detta genom vår kalibrering. Med en fullständig sRGB-täckning är fotoredigering också möjlig. Panelen är inte beroende av PWM.
| |||||||||||||||||||||||||
Distribution av ljusstyrkan: 89 %
Mitt på batteriet: 424 cd/m²
Kontrast: 1504:1 (Svärta: 0.28 cd/m²)
ΔE ColorChecker Calman: 3.2 | ∀{0.5-29.43 Ø4.71}
calibrated: 2
ΔE Greyscale Calman: 4.4 | ∀{0.09-98 Ø4.96}
75.3% AdobeRGB 1998 (Argyll 3D)
97.4% sRGB (Argyll 3D)
74.1% Display P3 (Argyll 3D)
Gamma: 2.22
CCT: 6384 K
| Schenker Vision 14 2022 RTX 3050 Ti MNE007ZA1-1, IPS, 2880x1800, 14" | Schenker Vision 14 MNE007ZA1, IPS, 2880x1800, 14" | Huawei MateBook X Pro 2022 TMX1422, IPS, 3120x2080, 14.2" | Lenovo Yoga 9i 14 2022 i7-1260P LEN140WQUXGA, OLED, 3840x2400, 14" | Dell Inspiron 14 Plus 7420 InfoVision 140NWHE, IPS, 2240x1400, 14" | Asus Vivobook Pro 14 M3401QC-KM007T SAMSUNG: SDC4171, OLED, 2880x1800, 14" | Apple MacBook Pro 14 2021 M1 Pro Entry Mini-LED, 3024x1964, 14.2" | |
|---|---|---|---|---|---|---|---|
| Display | 0% | 15% | 22% | -4% | 21% | 34% | |
| Display P3 Coverage (%) | 74.1 | 74.3 0% | 94.6 28% | 98.7 33% | 68.8 -7% | 99.41 34% | 99.3 34% |
| sRGB Coverage (%) | 97.4 | 97.6 0% | 99.5 2% | 99.8 2% | 99.3 2% | 99.94 3% | |
| AdobeRGB 1998 Coverage (%) | 75.3 | 75.7 1% | 86.5 15% | 98.5 31% | 69.5 -8% | 94.79 26% | |
| Response Times | -28% | 1% | 86% | -31% | 85% | -132% | |
| Response Time Grey 50% / Grey 80% * (ms) | 31.5 ? | 40.4 ? -28% | 25.4 ? 19% | 2.8 ? 91% | 32.8 ? -4% | 3 ? 90% | 58.4 ? -85% |
| Response Time Black / White * (ms) | 14.5 ? | 18.4 ? -27% | 17.1 ? -18% | 2.8 ? 81% | 22.8 ? -57% | 3 ? 79% | 40.4 ? -179% |
| PWM Frequency (Hz) | 239.2 ? | 360 | 14880 | ||||
| Screen | 11% | 31% | 3006% | 5% | 53% | 439% | |
| Brightness middle (cd/m²) | 421 | 407 -3% | 603 43% | 361 -14% | 331.1 -21% | 384 -9% | 489 16% |
| Brightness (cd/m²) | 416 | 407 -2% | 586 41% | 362 -13% | 326 -22% | 385 -7% | 479 15% |
| Brightness Distribution (%) | 89 | 94 6% | 91 2% | 98 10% | 85 -4% | 98 10% | 94 6% |
| Black Level * (cd/m²) | 0.28 | 0.25 11% | 0.39 -39% | 0.001 100% | 0.29 -4% | 0.07 75% | 0.01 96% |
| Contrast (:1) | 1504 | 1628 8% | 1546 3% | 361000 23903% | 1142 -24% | 5486 265% | 48900 3151% |
| Colorchecker dE 2000 * | 3.2 | 2.6 19% | 1.1 66% | 2.8 13% | 2.23 30% | 1.75 45% | 0.8 75% |
| Colorchecker dE 2000 max. * | 5.5 | 4.4 20% | 2.2 60% | 5.8 -5% | 5.44 1% | 3.41 38% | 1.3 76% |
| Colorchecker dE 2000 calibrated * | 2 | 2 -0% | 1.2 40% | 0.63 68% | 2.32 -16% | ||
| Greyscale dE 2000 * | 4.4 | 2.7 39% | 1.5 66% | 1.9 57% | 3.6 18% | 1.06 76% | 1.1 75% |
| Gamma | 2.22 99% | 2.18 101% | 2.17 101% | 2.16 102% | 2.21 100% | 2.39 92% | 2.24 98% |
| CCT | 6384 102% | 6316 103% | 6549 99% | 6181 105% | 6022 108% | 6440 101% | |
| Totalt genomsnitt (program/inställningar) | -6% /
3% | 16% /
23% | 1038% /
1868% | -10% /
-2% | 53% /
51% | 114% /
298% |
* ... mindre är bättre
Visa svarstider
| ↔ Svarstid svart till vitt | ||
|---|---|---|
| 14.5 ms ... stiga ↗ och falla ↘ kombinerat | ↗ 4.7 ms stiga | 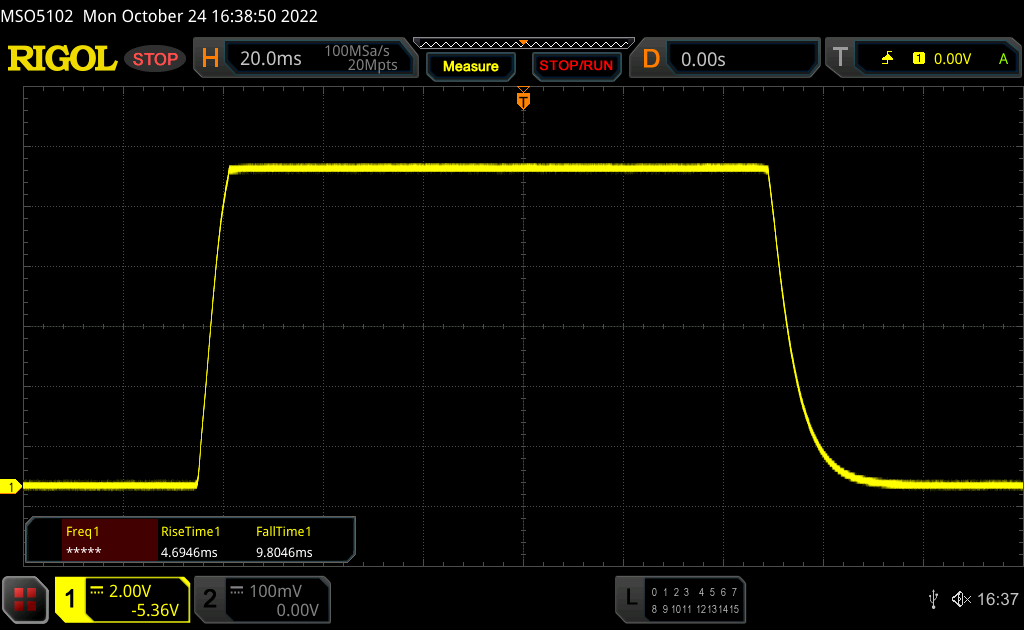 |
| ↘ 9.8 ms hösten | ||
| Skärmen visar bra svarsfrekvens i våra tester, men kan vara för långsam för konkurrenskraftiga spelare. I jämförelse sträcker sig alla testade enheter från 0.1 (minst) till 240 (maximalt) ms. » 36 % av alla enheter är bättre. Det betyder att den uppmätta svarstiden är bättre än genomsnittet av alla testade enheter (19.8 ms). | ||
| ↔ Svarstid 50 % grått till 80 % grått | ||
| 31.5 ms ... stiga ↗ och falla ↘ kombinerat | ↗ 14 ms stiga | 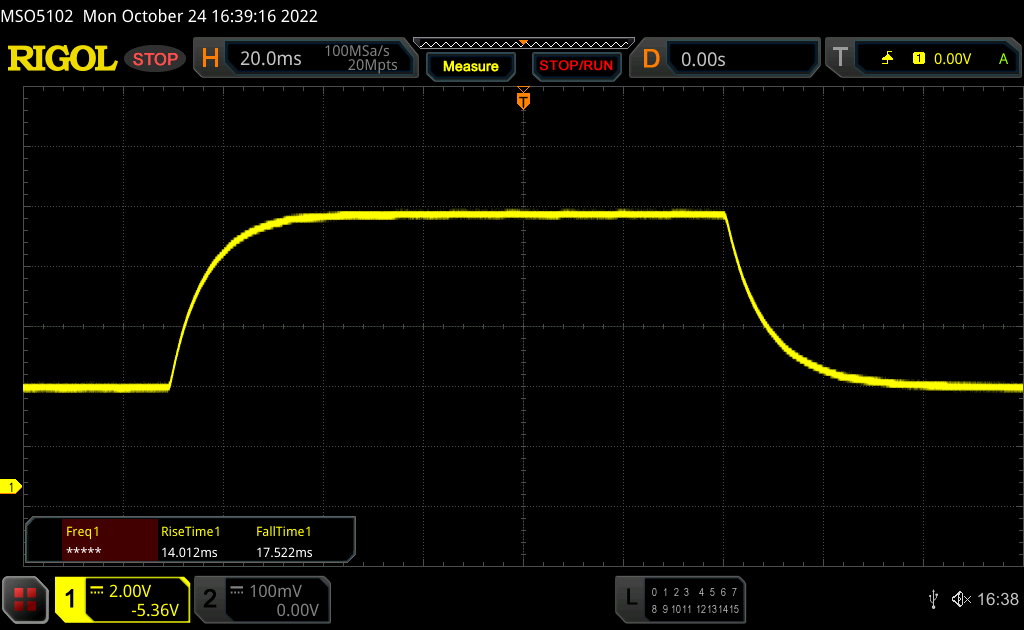 |
| ↘ 17.5 ms hösten | ||
| Skärmen visar långsamma svarsfrekvenser i våra tester och kommer att vara otillfredsställande för spelare. I jämförelse sträcker sig alla testade enheter från 0.165 (minst) till 636 (maximalt) ms. » 43 % av alla enheter är bättre. Det betyder att den uppmätta svarstiden liknar genomsnittet av alla testade enheter (30.9 ms). | ||
Skärmflimmer / PWM (Puls-Width Modulation)
| Skärmflimmer / PWM upptäcktes inte |  | ||
Som jämförelse: 52 % av alla testade enheter använder inte PWM för att dämpa skärmen. Om PWM upptäcktes mättes ett medelvärde av 7748 (minst: 5 - maximum: 343500) Hz. | |||
Prestanda - Alder Lake-H & GeForce RTX 3050 Ti
Provningsförhållanden
Det finns återigen två basprofiler med tre underprofiler vardera som är tillgängliga i den förinstallerade Control Center-programvaran (tyst och prestanda). Det är bekvämt att växla mellan basprofilerna med hjälp av F3-tangenten. I följande tabell listas prestandadata för olika strömprofiler.
| Profil | CPU Stress | GPU Stress | Kombinerad CPU+GPU Stress | Max. fläktljud |
|---|---|---|---|---|
| Tyst 20 dB | 10 watt | 20 watt | CPU: 10 wattGPU : 20 watt |
32,5 dB(A) |
| Tyst 30 dB | 13 watt | 25 watt | CPU: 13 wattGPU : 25 watt |
40 dB(A) |
| Tyst 40 dB | 15 watt | 35 watt | CPU: 15 wattGPU : 35 watt |
45,8 dB(A) |
| Prestanda balanserad | 60 -> 20 watt | 45 watt | CPU: 20 wattGPU : 40 watt |
45,8 dB(A) |
| Prestanda Enthusiast | 60 -> 40 watt | 45 watt | CPU: 25 wattGPU : 35 watt |
48,8 dB(A) |
| Prestanda Overboost | 60 -> 45 watt | 45 watt | CPU: 25 wattGPU : 35 watt |
51,1 dB(A) |
Det finns två märkbara skillnader mellan vår testenhet och den äldre modell. Medan den äldre Tiger Lake Core i7-11370H var begränsad till 46 watt, har den nyare Core i7-12700H tillgång till upp till 60 W. Samtidigt har den nya RTX 3050 Ti nu nöja sig med 45 watt (35 watt TGP + 10 watt Dynamic Boost), medan upp till 50 watt var tillgängligt för GPU:n på den äldre modellen.
Eftersom Performance Enthusiast-profilen erbjuder de bästa kompromisserna totalt sett, valde vi den för våra tester. I några av de följande avsnitten (och särskilt i avsnittet om systemljud) kommer vi att titta närmare på andra profiler också, även om användare kanske vill välja en av de svagare profilerna för att dra nytta av tystare fläktljud i kravlösa vardagsscenrio.
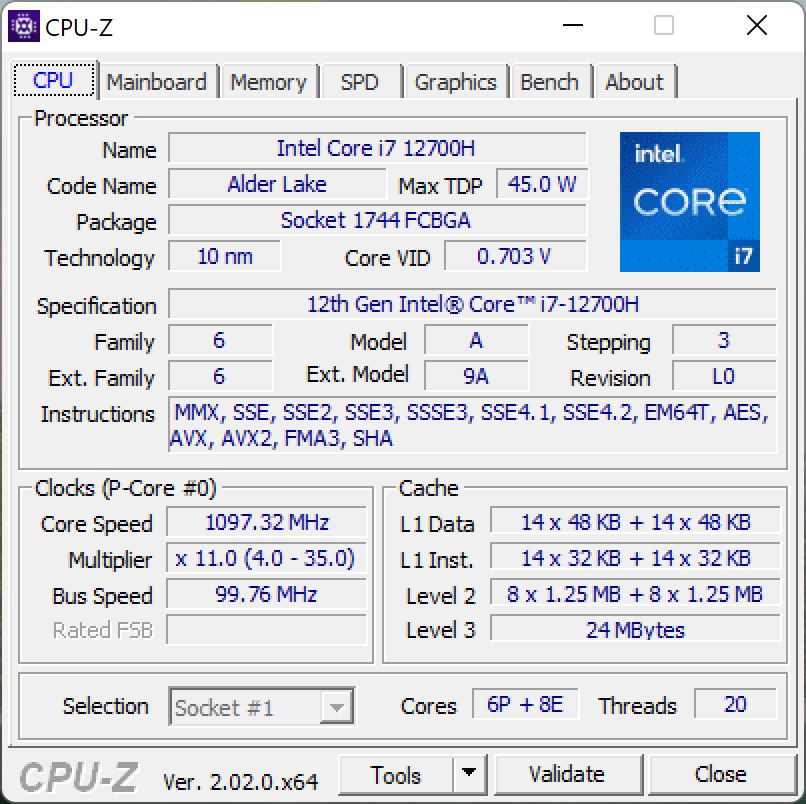
Processor - Intel Core i7-12700H
Core i7-12700H är en 45-watt-processor med 6 prestandakärnor och 8 effektivitetskärnor, vilket gör att den kan bearbeta upp till 20 trådar samtidigt. TDP-gränserna (60/40 watt) hålls stadigt och prestandan är överlag utmärkt. De äldre Core i7-11370H halkar inte bara efter betydligt i flertrådstesterna (den nyare modellen är i princip dubbelt så snabb här), utan även i enkeltrådstesterna tack vare de nya prestandakärnorna.
Cinebench R15 Multi Loop
Nu till frågan om Core i7-12700H är mer meningsfull vid dessa TDP-värden än en Alder Lake-P-processor som t.ex Core i7-1260P (med 4 prestandakärnor). Svaret är entydigt ja, eftersom antalet prestandakärnor är det som i slutändan spelar roll. Som vi vet blir prestandakärnorna mer och mer ineffektiva vid högre klockfrekvenser. Även om fördelningen av den tillgängliga TDP mellan fler prestandakärnor resulterar i något lägre klockfrekvenser, resulterar det också i lägre temperaturer som i sin tur gynnar prestandan. Dessutom kompenserar de två extra kärnorna mer än väl för de något lägre klockfrekvenserna. Även om detta också skulle vara fallet för en Core i7-1280P (samma kärnkonfiguration som i7-12700H), erbjuder OEM inte Alder Lake-P-kretsar för barebone-versionen av Vision 14 med dubbla kylrör.
Fördelen med Core i7-12700H blir mycket tydlig i en jämförelse med Lenovo Yoga 9i 14, som kör Core i7-1260P med en mycket liknande TDP på 64/38 watt. Oavsett detta överträffar Core i7-12700H den dramatiskt i flertrådstesterna (~18 % i vår CB R15-multislinga). Med detta sagt bör det noteras att Core i7-12700H inte kan släppa loss sin fulla potential här, vilket skulle kräva över 120 watt för de maximala klockfrekvenserna för alla kärnor. CPU-prestandan i iGPU-versionen av Vision 14 är identisk.
I batteriläge är processorn begränsad till 45 och därefter 40 watt, vilket innebär att prestandanivån förblir ganska hög. Prestandaförlusten blir mer betydande vid batterinivåer under 20 %. Fler processorjämförelser finns i vår tekniska sektion.
Cinebench R23: Multi Core | Single Core
Cinebench R20: CPU (Multi Core) | CPU (Single Core)
Cinebench R15: CPU Multi 64Bit | CPU Single 64Bit
Blender: v2.79 BMW27 CPU
7-Zip 18.03: 7z b 4 | 7z b 4 -mmt1
Geekbench 5.5: Multi-Core | Single-Core
HWBOT x265 Benchmark v2.2: 4k Preset
LibreOffice : 20 Documents To PDF
R Benchmark 2.5: Overall mean
| CPU Performance rating | |
| Genomsnitt Intel Core i7-12700H | |
| Dell Inspiron 14 Plus 7420 | |
| Schenker Vision 14 2022 RTX 3050 Ti | |
| Apple MacBook Pro 14 2021 M1 Pro Entry -8! | |
| Genomsnitt av klass Subnotebook | |
| Lenovo Yoga 9i 14 2022 i7-1260P | |
| Huawei MateBook X Pro 2022 | |
| Asus Vivobook Pro 14 M3401QC-KM007T | |
| Schenker Vision 14 | |
| Cinebench R23 / Multi Core | |
| Genomsnitt Intel Core i7-12700H (4032 - 19330, n=64) | |
| Schenker Vision 14 2022 RTX 3050 Ti | |
| Dell Inspiron 14 Plus 7420 | |
| Genomsnitt av klass Subnotebook (1555 - 21812, n=60, senaste 2 åren) | |
| Lenovo Yoga 9i 14 2022 i7-1260P | |
| Apple MacBook Pro 14 2021 M1 Pro Entry | |
| Huawei MateBook X Pro 2022 | |
| Asus Vivobook Pro 14 M3401QC-KM007T | |
| Schenker Vision 14 | |
| Cinebench R23 / Single Core | |
| Lenovo Yoga 9i 14 2022 i7-1260P | |
| Dell Inspiron 14 Plus 7420 | |
| Genomsnitt Intel Core i7-12700H (778 - 1826, n=63) | |
| Genomsnitt av klass Subnotebook (358 - 2213, n=61, senaste 2 åren) | |
| Schenker Vision 14 2022 RTX 3050 Ti | |
| Huawei MateBook X Pro 2022 | |
| Apple MacBook Pro 14 2021 M1 Pro Entry | |
| Schenker Vision 14 | |
| Asus Vivobook Pro 14 M3401QC-KM007T | |
| Cinebench R20 / CPU (Multi Core) | |
| Genomsnitt Intel Core i7-12700H (1576 - 7407, n=64) | |
| Schenker Vision 14 2022 RTX 3050 Ti | |
| Dell Inspiron 14 Plus 7420 | |
| Genomsnitt av klass Subnotebook (579 - 8541, n=57, senaste 2 åren) | |
| Lenovo Yoga 9i 14 2022 i7-1260P | |
| Huawei MateBook X Pro 2022 | |
| Asus Vivobook Pro 14 M3401QC-KM007T | |
| Schenker Vision 14 | |
| Cinebench R20 / CPU (Single Core) | |
| Schenker Vision 14 2022 RTX 3050 Ti | |
| Dell Inspiron 14 Plus 7420 | |
| Genomsnitt Intel Core i7-12700H (300 - 704, n=64) | |
| Huawei MateBook X Pro 2022 | |
| Genomsnitt av klass Subnotebook (128 - 832, n=57, senaste 2 åren) | |
| Lenovo Yoga 9i 14 2022 i7-1260P | |
| Schenker Vision 14 | |
| Asus Vivobook Pro 14 M3401QC-KM007T | |
| Cinebench R15 / CPU Multi 64Bit | |
| Genomsnitt Intel Core i7-12700H (1379 - 2916, n=70) | |
| Dell Inspiron 14 Plus 7420 | |
| Schenker Vision 14 2022 RTX 3050 Ti | |
| Genomsnitt av klass Subnotebook (327 - 3345, n=57, senaste 2 åren) | |
| Huawei MateBook X Pro 2022 | |
| Huawei MateBook X Pro 2022 | |
| Lenovo Yoga 9i 14 2022 i7-1260P | |
| Asus Vivobook Pro 14 M3401QC-KM007T | |
| Apple MacBook Pro 14 2021 M1 Pro Entry | |
| Schenker Vision 14 | |
| Schenker Vision 14 | |
| Cinebench R15 / CPU Single 64Bit | |
| Genomsnitt av klass Subnotebook (72.4 - 322, n=57, senaste 2 åren) | |
| Schenker Vision 14 2022 RTX 3050 Ti | |
| Dell Inspiron 14 Plus 7420 | |
| Genomsnitt Intel Core i7-12700H (113 - 263, n=65) | |
| Huawei MateBook X Pro 2022 | |
| Lenovo Yoga 9i 14 2022 i7-1260P | |
| Schenker Vision 14 | |
| Asus Vivobook Pro 14 M3401QC-KM007T | |
| Apple MacBook Pro 14 2021 M1 Pro Entry | |
| Blender / v2.79 BMW27 CPU | |
| Schenker Vision 14 | |
| Genomsnitt av klass Subnotebook (159 - 2271, n=58, senaste 2 åren) | |
| Asus Vivobook Pro 14 M3401QC-KM007T | |
| Huawei MateBook X Pro 2022 | |
| Lenovo Yoga 9i 14 2022 i7-1260P | |
| Schenker Vision 14 2022 RTX 3050 Ti | |
| Dell Inspiron 14 Plus 7420 | |
| Genomsnitt Intel Core i7-12700H (168 - 732, n=63) | |
| 7-Zip 18.03 / 7z b 4 | |
| Genomsnitt Intel Core i7-12700H (22844 - 73067, n=63) | |
| Dell Inspiron 14 Plus 7420 | |
| Schenker Vision 14 2022 RTX 3050 Ti | |
| Lenovo Yoga 9i 14 2022 i7-1260P | |
| Genomsnitt av klass Subnotebook (11668 - 77867, n=57, senaste 2 åren) | |
| Huawei MateBook X Pro 2022 | |
| Asus Vivobook Pro 14 M3401QC-KM007T | |
| Schenker Vision 14 | |
| 7-Zip 18.03 / 7z b 4 -mmt1 | |
| Schenker Vision 14 2022 RTX 3050 Ti | |
| Genomsnitt Intel Core i7-12700H (2743 - 5972, n=63) | |
| Dell Inspiron 14 Plus 7420 | |
| Genomsnitt av klass Subnotebook (2643 - 6699, n=59, senaste 2 åren) | |
| Schenker Vision 14 | |
| Huawei MateBook X Pro 2022 | |
| Asus Vivobook Pro 14 M3401QC-KM007T | |
| Lenovo Yoga 9i 14 2022 i7-1260P | |
| Geekbench 5.5 / Multi-Core | |
| Dell Inspiron 14 Plus 7420 | |
| Genomsnitt Intel Core i7-12700H (5144 - 13745, n=64) | |
| Schenker Vision 14 2022 RTX 3050 Ti | |
| Genomsnitt av klass Subnotebook (2557 - 17218, n=49, senaste 2 åren) | |
| Lenovo Yoga 9i 14 2022 i7-1260P | |
| Huawei MateBook X Pro 2022 | |
| Apple MacBook Pro 14 2021 M1 Pro Entry | |
| Asus Vivobook Pro 14 M3401QC-KM007T | |
| Schenker Vision 14 | |
| Geekbench 5.5 / Single-Core | |
| Genomsnitt av klass Subnotebook (726 - 2224, n=49, senaste 2 åren) | |
| Schenker Vision 14 2022 RTX 3050 Ti | |
| Apple MacBook Pro 14 2021 M1 Pro Entry | |
| Lenovo Yoga 9i 14 2022 i7-1260P | |
| Huawei MateBook X Pro 2022 | |
| Genomsnitt Intel Core i7-12700H (803 - 1851, n=64) | |
| Dell Inspiron 14 Plus 7420 | |
| Schenker Vision 14 | |
| Asus Vivobook Pro 14 M3401QC-KM007T | |
| HWBOT x265 Benchmark v2.2 / 4k Preset | |
| Genomsnitt Intel Core i7-12700H (4.67 - 21.8, n=64) | |
| Dell Inspiron 14 Plus 7420 | |
| Schenker Vision 14 2022 RTX 3050 Ti | |
| Genomsnitt av klass Subnotebook (0.97 - 25.1, n=57, senaste 2 åren) | |
| Lenovo Yoga 9i 14 2022 i7-1260P | |
| Huawei MateBook X Pro 2022 | |
| Asus Vivobook Pro 14 M3401QC-KM007T | |
| Schenker Vision 14 | |
| LibreOffice / 20 Documents To PDF | |
| Asus Vivobook Pro 14 M3401QC-KM007T | |
| Genomsnitt av klass Subnotebook (39.9 - 220, n=56, senaste 2 åren) | |
| Dell Inspiron 14 Plus 7420 | |
| Schenker Vision 14 | |
| Lenovo Yoga 9i 14 2022 i7-1260P | |
| Genomsnitt Intel Core i7-12700H (34.2 - 95.3, n=63) | |
| Schenker Vision 14 2022 RTX 3050 Ti | |
| Huawei MateBook X Pro 2022 | |
| R Benchmark 2.5 / Overall mean | |
| Asus Vivobook Pro 14 M3401QC-KM007T | |
| Schenker Vision 14 | |
| Genomsnitt av klass Subnotebook (0.4024 - 1.456, n=58, senaste 2 åren) | |
| Lenovo Yoga 9i 14 2022 i7-1260P | |
| Huawei MateBook X Pro 2022 | |
| Dell Inspiron 14 Plus 7420 | |
| Genomsnitt Intel Core i7-12700H (0.4441 - 1.052, n=63) | |
| Schenker Vision 14 2022 RTX 3050 Ti | |
* ... mindre är bättre
AIDA64: FP32 Ray-Trace | FPU Julia | CPU SHA3 | CPU Queen | FPU SinJulia | FPU Mandel | CPU AES | CPU ZLib | FP64 Ray-Trace | CPU PhotoWorxx
| Performance rating | |
| Genomsnitt Intel Core i7-12700H | |
| Schenker Vision 14 2022 RTX 3050 Ti | |
| Dell Inspiron 14 Plus 7420 | |
| Genomsnitt av klass Subnotebook | |
| Asus Vivobook Pro 14 M3401QC-KM007T | |
| Huawei MateBook X Pro 2022 | |
| Lenovo Yoga 9i 14 2022 i7-1260P | |
| AIDA64 / FP32 Ray-Trace | |
| Genomsnitt av klass Subnotebook (1135 - 32888, n=58, senaste 2 åren) | |
| Schenker Vision 14 2022 RTX 3050 Ti | |
| Dell Inspiron 14 Plus 7420 | |
| Genomsnitt Intel Core i7-12700H (2585 - 17957, n=64) | |
| Asus Vivobook Pro 14 M3401QC-KM007T | |
| Lenovo Yoga 9i 14 2022 i7-1260P | |
| Huawei MateBook X Pro 2022 | |
| AIDA64 / FPU Julia | |
| Asus Vivobook Pro 14 M3401QC-KM007T | |
| Genomsnitt av klass Subnotebook (5218 - 123315, n=58, senaste 2 åren) | |
| Schenker Vision 14 2022 RTX 3050 Ti | |
| Dell Inspiron 14 Plus 7420 | |
| Genomsnitt Intel Core i7-12700H (12439 - 90760, n=64) | |
| Huawei MateBook X Pro 2022 | |
| Lenovo Yoga 9i 14 2022 i7-1260P | |
| AIDA64 / CPU SHA3 | |
| Genomsnitt av klass Subnotebook (444 - 5287, n=58, senaste 2 åren) | |
| Genomsnitt Intel Core i7-12700H (833 - 4242, n=64) | |
| Schenker Vision 14 2022 RTX 3050 Ti | |
| Dell Inspiron 14 Plus 7420 | |
| Asus Vivobook Pro 14 M3401QC-KM007T | |
| Lenovo Yoga 9i 14 2022 i7-1260P | |
| Huawei MateBook X Pro 2022 | |
| AIDA64 / CPU Queen | |
| Genomsnitt Intel Core i7-12700H (57923 - 103202, n=63) | |
| Dell Inspiron 14 Plus 7420 | |
| Schenker Vision 14 2022 RTX 3050 Ti | |
| Huawei MateBook X Pro 2022 | |
| Asus Vivobook Pro 14 M3401QC-KM007T | |
| Genomsnitt av klass Subnotebook (10579 - 95002, n=48, senaste 2 åren) | |
| Lenovo Yoga 9i 14 2022 i7-1260P | |
| AIDA64 / FPU SinJulia | |
| Genomsnitt Intel Core i7-12700H (3249 - 9939, n=64) | |
| Asus Vivobook Pro 14 M3401QC-KM007T | |
| Schenker Vision 14 2022 RTX 3050 Ti | |
| Dell Inspiron 14 Plus 7420 | |
| Genomsnitt av klass Subnotebook (744 - 18418, n=58, senaste 2 åren) | |
| Huawei MateBook X Pro 2022 | |
| Lenovo Yoga 9i 14 2022 i7-1260P | |
| AIDA64 / FPU Mandel | |
| Asus Vivobook Pro 14 M3401QC-KM007T | |
| Genomsnitt av klass Subnotebook (3341 - 65433, n=58, senaste 2 åren) | |
| Dell Inspiron 14 Plus 7420 | |
| Schenker Vision 14 2022 RTX 3050 Ti | |
| Genomsnitt Intel Core i7-12700H (7135 - 44760, n=64) | |
| Huawei MateBook X Pro 2022 | |
| Lenovo Yoga 9i 14 2022 i7-1260P | |
| AIDA64 / CPU AES | |
| Asus Vivobook Pro 14 M3401QC-KM007T | |
| Genomsnitt Intel Core i7-12700H (31839 - 144360, n=64) | |
| Schenker Vision 14 2022 RTX 3050 Ti | |
| Dell Inspiron 14 Plus 7420 | |
| Huawei MateBook X Pro 2022 | |
| Genomsnitt av klass Subnotebook (638 - 96917, n=58, senaste 2 åren) | |
| Lenovo Yoga 9i 14 2022 i7-1260P | |
| AIDA64 / CPU ZLib | |
| Genomsnitt Intel Core i7-12700H (305 - 1171, n=64) | |
| Schenker Vision 14 2022 RTX 3050 Ti | |
| Dell Inspiron 14 Plus 7420 | |
| Genomsnitt av klass Subnotebook (164.9 - 1379, n=58, senaste 2 åren) | |
| Lenovo Yoga 9i 14 2022 i7-1260P | |
| Huawei MateBook X Pro 2022 | |
| Asus Vivobook Pro 14 M3401QC-KM007T | |
| AIDA64 / FP64 Ray-Trace | |
| Genomsnitt av klass Subnotebook (610 - 17495, n=58, senaste 2 åren) | |
| Schenker Vision 14 2022 RTX 3050 Ti | |
| Dell Inspiron 14 Plus 7420 | |
| Genomsnitt Intel Core i7-12700H (1437 - 9692, n=64) | |
| Asus Vivobook Pro 14 M3401QC-KM007T | |
| Lenovo Yoga 9i 14 2022 i7-1260P | |
| Huawei MateBook X Pro 2022 | |
| AIDA64 / CPU PhotoWorxx | |
| Genomsnitt av klass Subnotebook (6569 - 85600, n=58, senaste 2 åren) | |
| Huawei MateBook X Pro 2022 | |
| Dell Inspiron 14 Plus 7420 | |
| Genomsnitt Intel Core i7-12700H (12863 - 52207, n=64) | |
| Schenker Vision 14 2022 RTX 3050 Ti | |
| Lenovo Yoga 9i 14 2022 i7-1260P | |
| Asus Vivobook Pro 14 M3401QC-KM007T | |
Systemets prestanda
Vision 14:s subjektiva intryck av att vara mycket lyhörd bekräftas av våra syntetiska benchmarks. Under våra tester stötte vi inte på några problem. Schenkers beslut att inte använda DDR5 RAM-minne (av kostnadsskäl, enligt tillverkaren) påverkar inte den dagliga användningen.
CrossMark: Overall | Productivity | Creativity | Responsiveness
| PCMark 10 / Score | |
| Genomsnitt av klass Subnotebook (4920 - 9939, n=46, senaste 2 åren) | |
| Genomsnitt Intel Core i7-12700H, NVIDIA GeForce RTX 3050 Ti Laptop GPU (6623 - 7075, n=5) | |
| Dell Inspiron 14 Plus 7420 | |
| Schenker Vision 14 2022 RTX 3050 Ti | |
| Huawei MateBook X Pro 2022 | |
| Schenker Vision 14 | |
| Asus Vivobook Pro 14 M3401QC-KM007T | |
| Lenovo Yoga 9i 14 2022 i7-1260P | |
| PCMark 10 / Essentials | |
| Lenovo Yoga 9i 14 2022 i7-1260P | |
| Huawei MateBook X Pro 2022 | |
| Schenker Vision 14 2022 RTX 3050 Ti | |
| Genomsnitt av klass Subnotebook (8552 - 11646, n=46, senaste 2 åren) | |
| Genomsnitt Intel Core i7-12700H, NVIDIA GeForce RTX 3050 Ti Laptop GPU (9540 - 10970, n=5) | |
| Dell Inspiron 14 Plus 7420 | |
| Asus Vivobook Pro 14 M3401QC-KM007T | |
| Schenker Vision 14 | |
| PCMark 10 / Productivity | |
| Genomsnitt av klass Subnotebook (5435 - 16606, n=46, senaste 2 åren) | |
| Genomsnitt Intel Core i7-12700H, NVIDIA GeForce RTX 3050 Ti Laptop GPU (8530 - 9555, n=5) | |
| Dell Inspiron 14 Plus 7420 | |
| Schenker Vision 14 | |
| Huawei MateBook X Pro 2022 | |
| Schenker Vision 14 2022 RTX 3050 Ti | |
| Asus Vivobook Pro 14 M3401QC-KM007T | |
| Lenovo Yoga 9i 14 2022 i7-1260P | |
| PCMark 10 / Digital Content Creation | |
| Genomsnitt av klass Subnotebook (5722 - 13779, n=46, senaste 2 åren) | |
| Genomsnitt Intel Core i7-12700H, NVIDIA GeForce RTX 3050 Ti Laptop GPU (8855 - 9542, n=5) | |
| Schenker Vision 14 2022 RTX 3050 Ti | |
| Dell Inspiron 14 Plus 7420 | |
| Asus Vivobook Pro 14 M3401QC-KM007T | |
| Lenovo Yoga 9i 14 2022 i7-1260P | |
| Schenker Vision 14 | |
| Huawei MateBook X Pro 2022 | |
| CrossMark / Overall | |
| Huawei MateBook X Pro 2022 | |
| Genomsnitt Intel Core i7-12700H, NVIDIA GeForce RTX 3050 Ti Laptop GPU (1654 - 1872, n=5) | |
| Dell Inspiron 14 Plus 7420 | |
| Lenovo Yoga 9i 14 2022 i7-1260P | |
| Genomsnitt av klass Subnotebook (365 - 2356, n=60, senaste 2 åren) | |
| Schenker Vision 14 2022 RTX 3050 Ti | |
| Schenker Vision 14 | |
| Apple MacBook Pro 14 2021 M1 Pro Entry | |
| Asus Vivobook Pro 14 M3401QC-KM007T | |
| CrossMark / Productivity | |
| Huawei MateBook X Pro 2022 | |
| Genomsnitt Intel Core i7-12700H, NVIDIA GeForce RTX 3050 Ti Laptop GPU (1595 - 1792, n=5) | |
| Schenker Vision 14 2022 RTX 3050 Ti | |
| Dell Inspiron 14 Plus 7420 | |
| Lenovo Yoga 9i 14 2022 i7-1260P | |
| Genomsnitt av klass Subnotebook (364 - 2277, n=60, senaste 2 åren) | |
| Schenker Vision 14 | |
| Asus Vivobook Pro 14 M3401QC-KM007T | |
| Apple MacBook Pro 14 2021 M1 Pro Entry | |
| CrossMark / Creativity | |
| Apple MacBook Pro 14 2021 M1 Pro Entry | |
| Dell Inspiron 14 Plus 7420 | |
| Genomsnitt av klass Subnotebook (372 - 2743, n=60, senaste 2 åren) | |
| Huawei MateBook X Pro 2022 | |
| Genomsnitt Intel Core i7-12700H, NVIDIA GeForce RTX 3050 Ti Laptop GPU (1699 - 1993, n=5) | |
| Lenovo Yoga 9i 14 2022 i7-1260P | |
| Schenker Vision 14 2022 RTX 3050 Ti | |
| Schenker Vision 14 | |
| Asus Vivobook Pro 14 M3401QC-KM007T | |
| CrossMark / Responsiveness | |
| Huawei MateBook X Pro 2022 | |
| Genomsnitt Intel Core i7-12700H, NVIDIA GeForce RTX 3050 Ti Laptop GPU (1383 - 1768, n=5) | |
| Lenovo Yoga 9i 14 2022 i7-1260P | |
| Schenker Vision 14 2022 RTX 3050 Ti | |
| Schenker Vision 14 | |
| Dell Inspiron 14 Plus 7420 | |
| Genomsnitt av klass Subnotebook (312 - 1854, n=60, senaste 2 åren) | |
| Asus Vivobook Pro 14 M3401QC-KM007T | |
| Apple MacBook Pro 14 2021 M1 Pro Entry | |
| PCMark 10 Score | 6623 poäng | |
Hjälp | ||
| AIDA64 / Memory Copy | |
| Genomsnitt av klass Subnotebook (14554 - 131023, n=58, senaste 2 åren) | |
| Huawei MateBook X Pro 2022 | |
| Dell Inspiron 14 Plus 7420 | |
| Genomsnitt Intel Core i7-12700H (25615 - 80511, n=64) | |
| Schenker Vision 14 2022 RTX 3050 Ti | |
| Asus Vivobook Pro 14 M3401QC-KM007T | |
| AIDA64 / Memory Read | |
| Genomsnitt av klass Subnotebook (15948 - 127174, n=58, senaste 2 åren) | |
| Huawei MateBook X Pro 2022 | |
| Dell Inspiron 14 Plus 7420 | |
| Genomsnitt Intel Core i7-12700H (25586 - 79442, n=64) | |
| Asus Vivobook Pro 14 M3401QC-KM007T | |
| Schenker Vision 14 2022 RTX 3050 Ti | |
| AIDA64 / Memory Write | |
| Genomsnitt av klass Subnotebook (15709 - 135141, n=58, senaste 2 åren) | |
| Huawei MateBook X Pro 2022 | |
| Dell Inspiron 14 Plus 7420 | |
| Genomsnitt Intel Core i7-12700H (23679 - 88660, n=64) | |
| Schenker Vision 14 2022 RTX 3050 Ti | |
| Asus Vivobook Pro 14 M3401QC-KM007T | |
| AIDA64 / Memory Latency | |
| Dell Inspiron 14 Plus 7420 | |
| Huawei MateBook X Pro 2022 | |
| Genomsnitt av klass Subnotebook (6.1 - 159.9, n=56, senaste 2 åren) | |
| Schenker Vision 14 2022 RTX 3050 Ti | |
| Asus Vivobook Pro 14 M3401QC-KM007T | |
| Genomsnitt Intel Core i7-12700H (76.2 - 133.9, n=62) | |
* ... mindre är bättre
DPC-latenstid
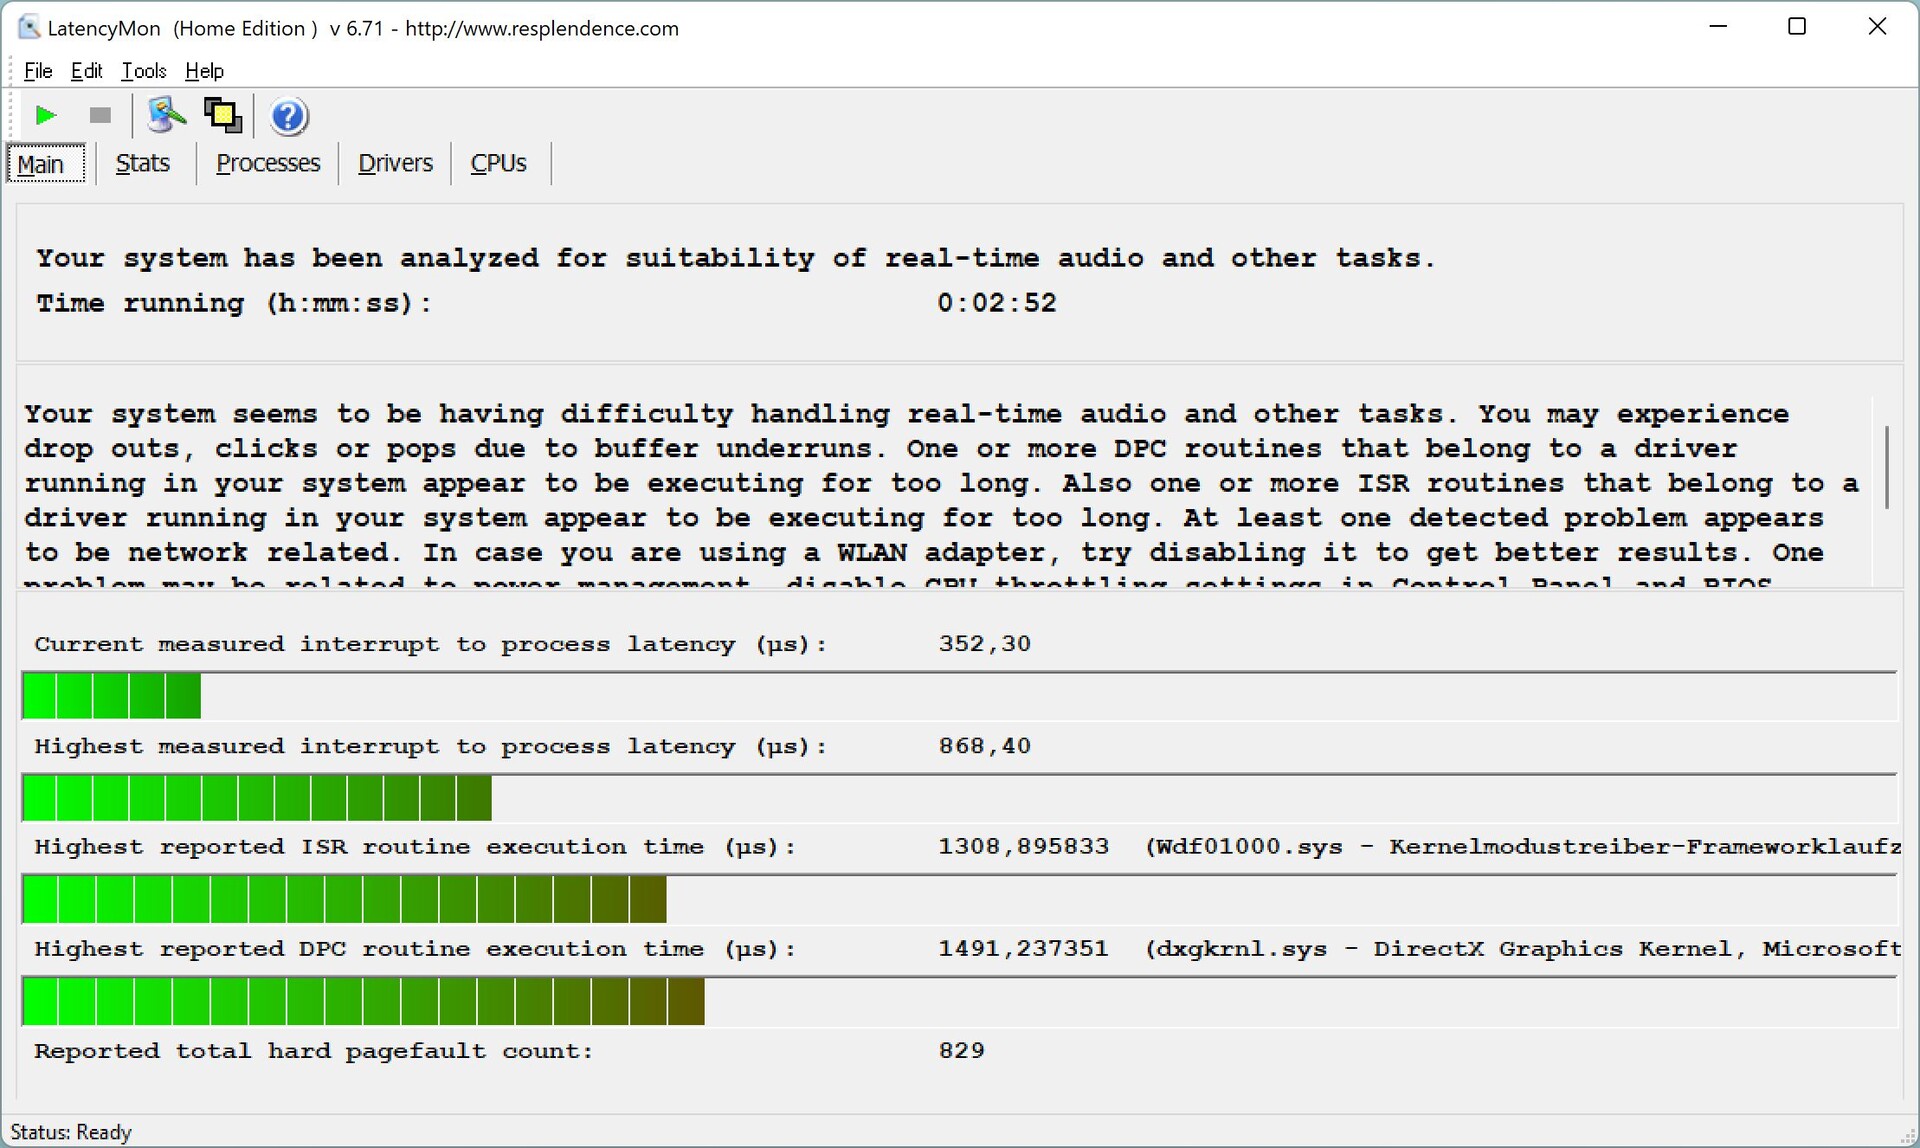
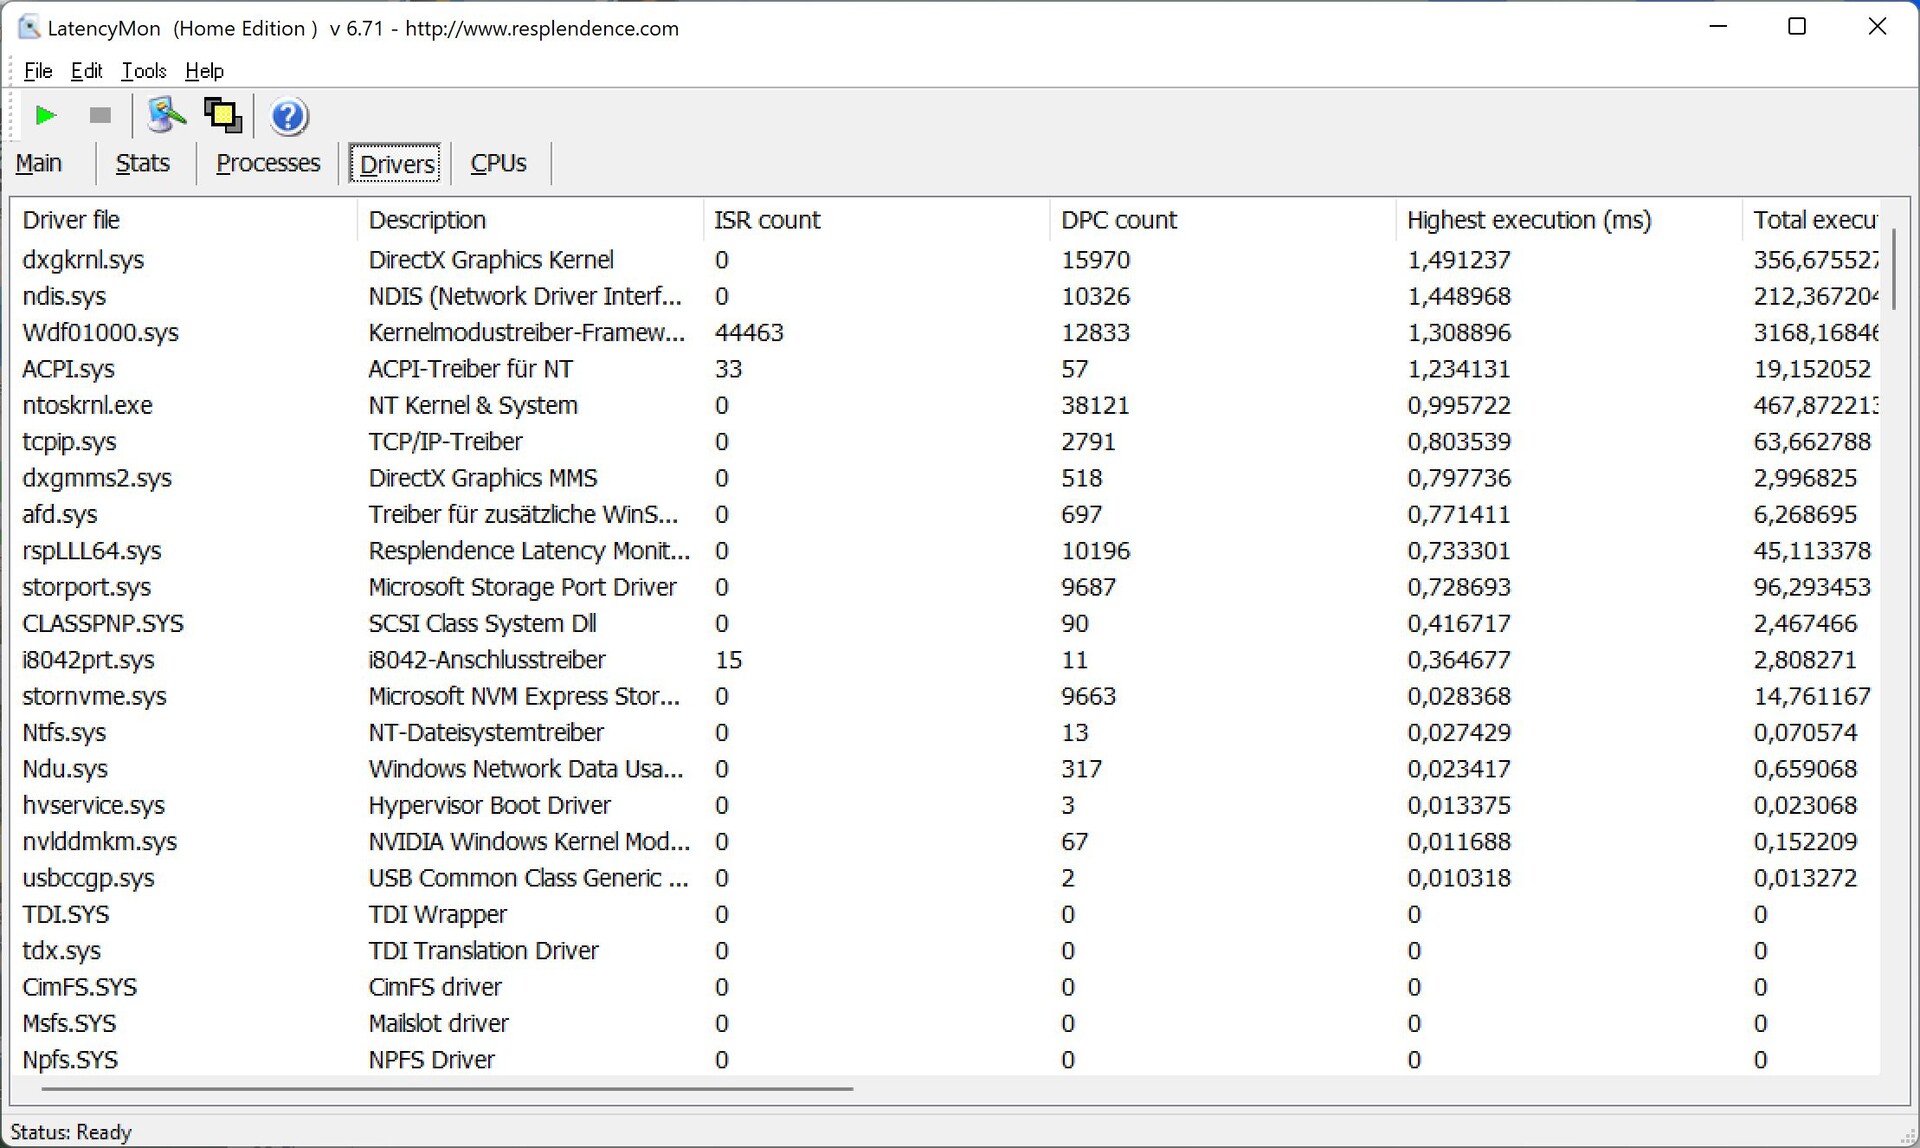
Vision 14 uppvisar en något ökad latens i vårt standardiserade latenstest med den aktuella BIOS-versionen, vilket gör den till ett suboptimalt val för realtidsprogram. Inga ramar tappades under uppspelning av 4K-video på YouTube.
| DPC Latencies / LatencyMon - interrupt to process latency (max), Web, Youtube, Prime95 | |
| Asus Vivobook Pro 14 M3401QC-KM007T | |
| Lenovo Yoga 9i 14 2022 i7-1260P | |
| Huawei MateBook X Pro 2022 | |
| Schenker Vision 14 2022 RTX 3050 Ti | |
| Dell Inspiron 14 Plus 7420 | |
* ... mindre är bättre
Lagringslösning
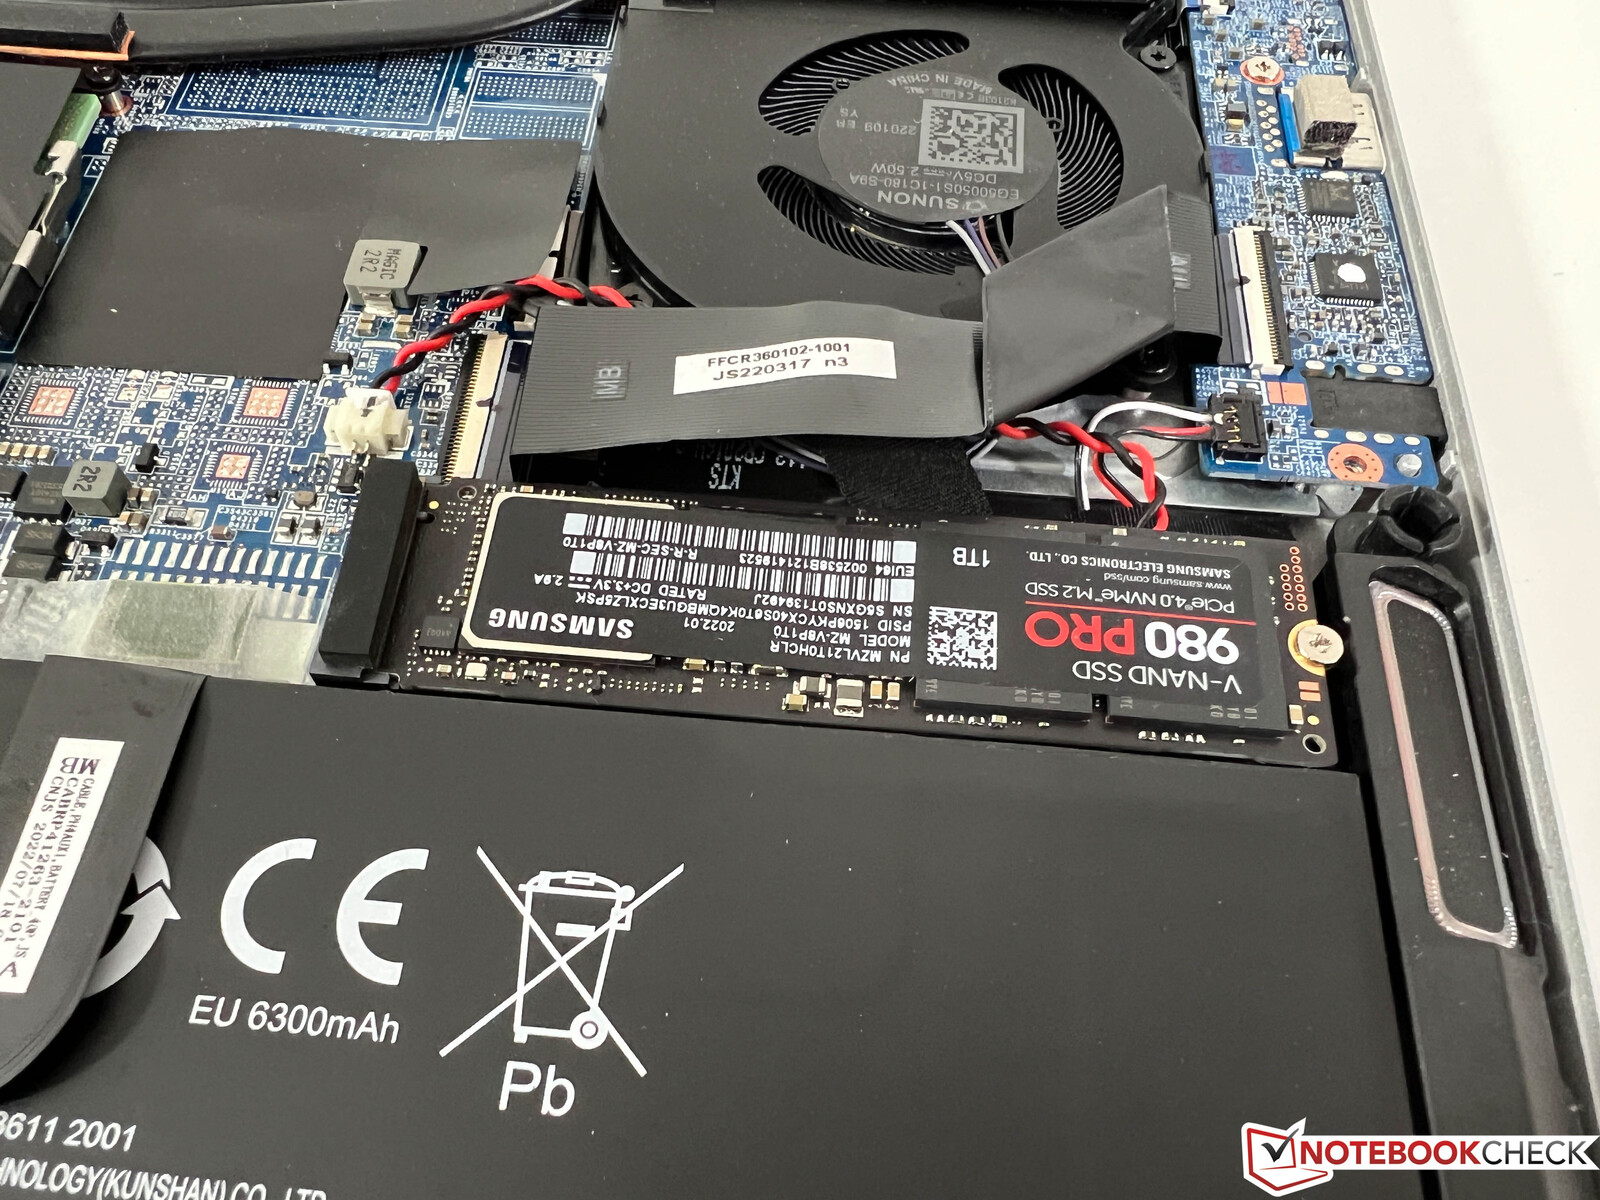
Som tidigare nämnts innebär valet av det större 99-Wh-batteriet att det inte finns något sekundärt M.2-2280-fack. Vår testenhet är utrustad med Samsung Pro 1 TB, som når överföringshastigheter på upp till 7 GB/s, vilket gör den till en av de snabbaste enheterna som finns tillgängliga idag. Det finns inga termiska problem heller och prestandan förblir helt jämn även under kontinuerlig belastning. Fler SSD-jämförelser finns här.

* ... mindre är bättre
Disk Throttling: DiskSpd Read Loop, Queue Depth 8
GPU-prestanda
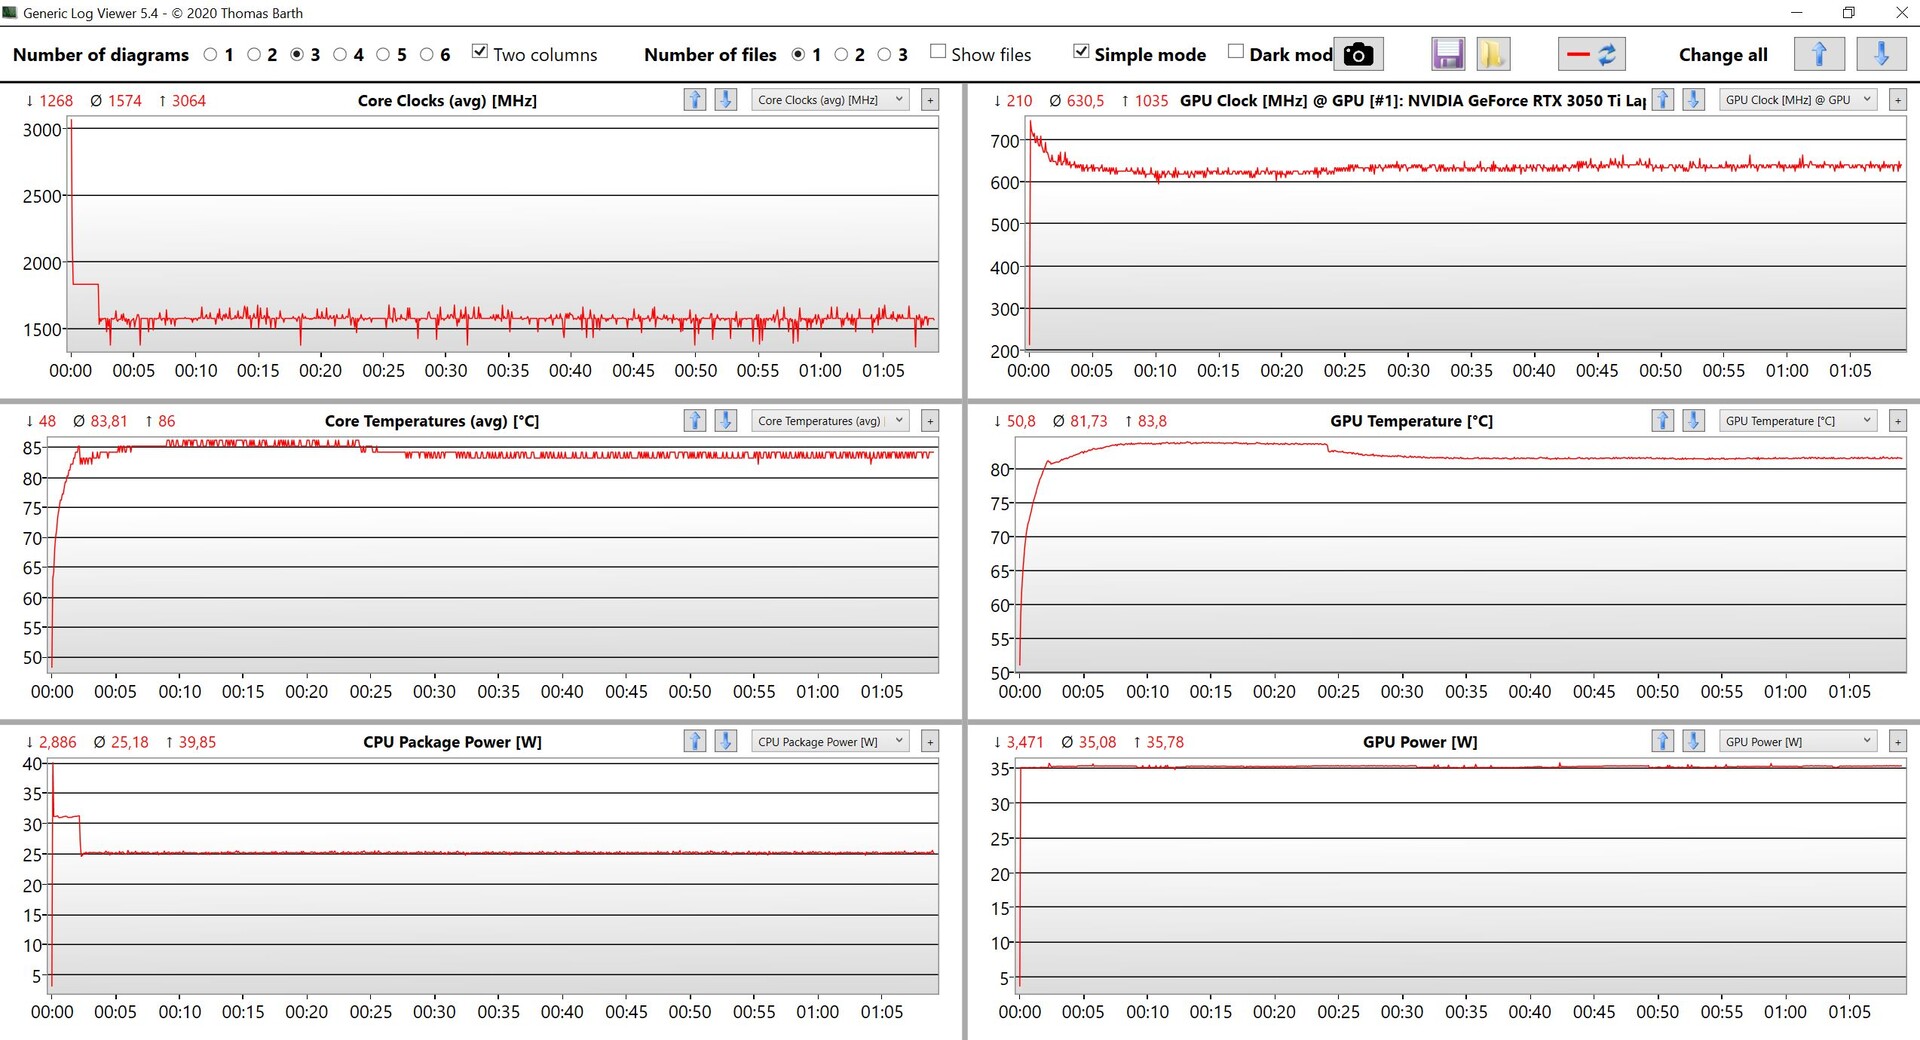
Vision 14 använder fortfarande den populära Nvidia GeForce RTX 3050 Ti med en TGP på 35 watt (och ytterligare 10 watt Dynamic Boost från processorn). Nvidia RTX 3050 Ti har en TGP på 35-80 watt, vilket innebär att vår testmodell använder en svagare version av chipet. Benchmarking av Vision 14 återspeglar detta med resultat som är något undermåliga för denna GPU.
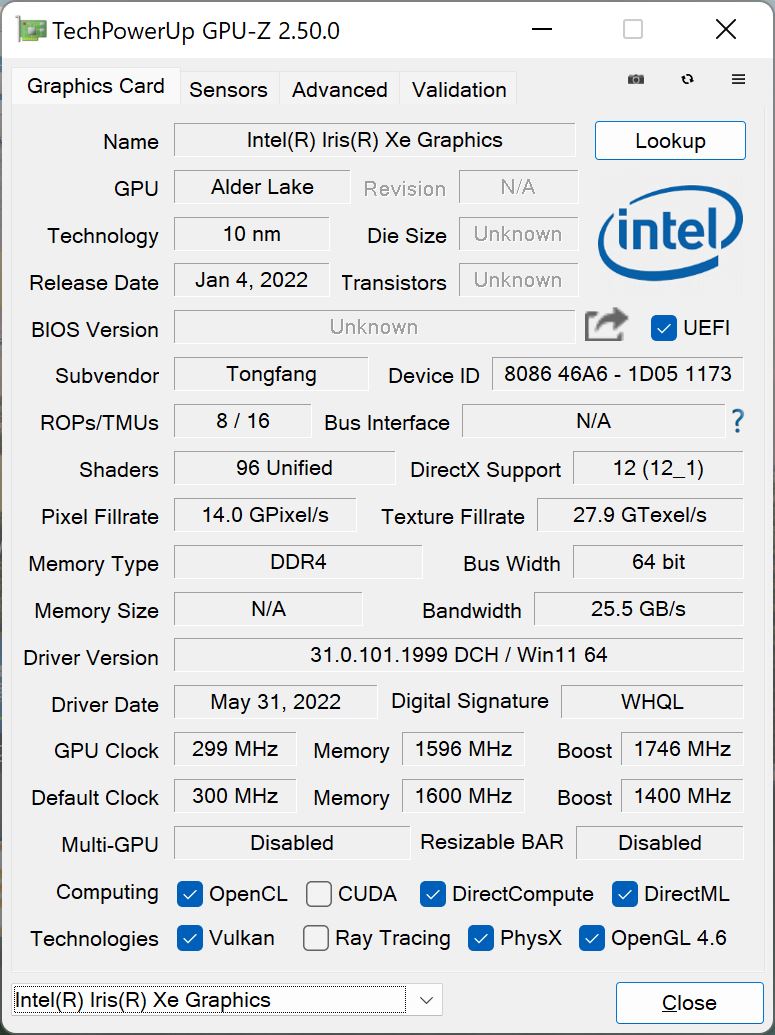
Jämfört med föregångare med RTX 3050 Tikan den senaste Vision 14 säkra ett litet försprång och landar på samma nivå som M1 Pro GPU i basmodellen Apple MacBook Pro 14. När man väljer iGPU-versionen av Vision 14 kan man välja Intels Iris Xe Graphics G7 med 96 EUs används i stället, vilket resulterar i en betydligt långsammare GPU-prestanda, vilket framgår av konkurrenternas Lenovo Yoga 9i 14 och Huawei MateBook X Pro.
GPU-prestandan förblir konsekvent även vid kontinuerlig belastning, även om den lider ganska mycket i batteriläge (~ 75 %). Fler GPU-jämförelser finns här.
| 3DMark 11 Performance | 16439 poäng | |
| 3DMark Fire Strike Score | 11233 poäng | |
| 3DMark Time Spy Score | 5098 poäng | |
Hjälp | ||
| Blender / v3.3 Classroom OPTIX/RTX | |
| Dell Inspiron 14 Plus 7420 | |
| Asus VivoBook Pro 16X OLED N7600PC-L2026X | |
| Schenker Vision 14 2022 RTX 3050 Ti | |
| Genomsnitt NVIDIA GeForce RTX 3050 Ti Laptop GPU (48 - 60, n=7) | |
| Dell Precision 7670 | |
| Lenovo ThinkBook 16p G3 ARH | |
| Genomsnitt av klass Subnotebook (n=1senaste 2 åren) | |
| Blender / v3.3 Classroom CUDA | |
| Asus VivoBook Pro 16X OLED N7600PC-L2026X | |
| Dell Inspiron 14 Plus 7420 | |
| Schenker Vision 14 2022 RTX 3050 Ti | |
| Genomsnitt NVIDIA GeForce RTX 3050 Ti Laptop GPU (83 - 104, n=7) | |
| Dell Precision 7670 | |
| Lenovo ThinkBook 16p G3 ARH | |
| Blender / v3.3 Classroom CPU | |
| Asus VivoBook Pro 16X OLED N7600PC-L2026X | |
| Huawei MateBook X Pro 2022 | |
| Lenovo ThinkPad T14 G3-21CF004NGE | |
| Genomsnitt av klass Subnotebook (241 - 861, n=60, senaste 2 åren) | |
| Dell Inspiron 14 Plus 7420 | |
| Schenker Vision 14 2022 RTX 3050 Ti | |
| Genomsnitt NVIDIA GeForce RTX 3050 Ti Laptop GPU (379 - 557, n=7) | |
| Lenovo ThinkBook 16p G3 ARH | |
| Dell Precision 7670 | |
* ... mindre är bättre
Spelprestanda
Eftersom spelprestanda fortfarande i första hand bestäms av den GeForce RTX 3050 Tiäven om vissa benchmarkresultat visar på fördelarna med den snabbare processorn, finns det bara små skillnader mellan den nya och den nya äldre Vision 14 särskilt vid mycket höga kvalitetsinställningar. Många moderna titlar körs smidigt även vid höga eller maximala detaljer, även om grafikinställningarna måste sänkas i mycket krävande titlar som Cyberpunk 2077 eller F1 2022 för att uppnå jämna bildfrekvenser.
| Cyberpunk 2077 1.6 | |
| 1920x1080 High Preset | |
| Genomsnitt NVIDIA GeForce RTX 3050 Ti Laptop GPU (39 - 51.5, n=9) | |
| Dell Inspiron 14 Plus 7420 | |
| Schenker Vision 14 2022 RTX 3050 Ti | |
| 1920x1080 Ultra Preset | |
| Genomsnitt NVIDIA GeForce RTX 3050 Ti Laptop GPU (31 - 50.5, n=9) | |
| Dell Inspiron 14 Plus 7420 | |
| Schenker Vision 14 2022 RTX 3050 Ti | |
Witcher 3 FPS Graph
Spelprestanda förblir konsekvent under kontinuerlig stress, eftersom vår Witcher 3 visar. Det kan dock vara värt att testa om de tystare strömprofilerna kan ge tillräcklig spelprestanda beroende på spelet. I batteriläget minskar spelprestandan avsevärt och detaljerna måste minskas drastiskt för att spelen ska förbli spelbara.
| låg | med. | hög | ultra | QHD | |
|---|---|---|---|---|---|
| GTA V (2015) | 170.6 | 163.3 | 121 | 67.5 | 48.4 |
| The Witcher 3 (2015) | 249 | 264 | 92 | 44.2 | |
| Dota 2 Reborn (2015) | 148.1 | 121.9 | 114.4 | 109.1 | |
| Final Fantasy XV Benchmark (2018) | 130.6 | 71 | 50.1 | 36.2 | |
| X-Plane 11.11 (2018) | 112.4 | 99.6 | 82.3 | ||
| Far Cry 5 (2018) | 121 | 87 | 79 | 75 | 53 |
| Strange Brigade (2018) | 259 | 126.9 | 100.8 | 86 | 63 |
| F1 2021 (2021) | 223 | 148 | 120.8 | 59.2 | 41 |
| Cyberpunk 2077 1.6 (2022) | 56 | 49 | 40 | 31 | 20 |
| F1 22 (2022) | 136.1 | 124.8 | 93 | 28 | 16.1 |
Utsläpp - Vision 14 blir för högljudd
Systembrus
Jämfört med den tidigare modellen har inget förändrats när det gäller kylningslösningen. Vision 14 använder fortfarande två fläktar och två heatpipes. Även om vissa av resultaten har skiftat något, så matchar de i huvudsak resultaten från äldre modell. Våra resultat från olika scenarion finns i följande tabell. Vi märkte inget elektroniskt brus.
| Profil | Cinebench R23 Multi | Witcher 3 Ultra | Stresstest |
|---|---|---|---|
| Tyst 20 dB | 26 dB(A) | 32,5 dB(A) | 32,5 dB(A) |
| Tyst 30 dB | 26 dB(A) | 40 dB(A) | 40 dB(A) |
| Tyst 40 dB | 27,8 dB(A) | 45,8 dB(A) | 45,8 dB(A) |
| Prestanda Balanserad | 29,2 dB(A) | 45,8 dB(A) | 45,8 dB(A) |
| Prestanda Enthusiast | 46 dB(A) | 48.2dB(A) | 48.8 dB(A) |
| Performance Overboost | 48,2 dB(A) | 51,1 dB(A) | 51,1 dB(A) |
Ljudnivå
| Låg belastning |
| 24.4 / 24.4 / 27.8 dB(A) |
| Hög belastning |
| 43.3 / 48.8 dB(A) |
 | ||
30 dB tyst 40 dB(A) hörbar 50 dB(A) högt ljud |
||
min: | ||
| Schenker Vision 14 2022 RTX 3050 Ti GeForce RTX 3050 Ti Laptop GPU, i7-12700H, Samsung SSD 980 Pro 1TB MZ-V8P1T0BW | Huawei MateBook X Pro 2022 Iris Xe G7 96EUs, i7-1260P, Silicon Motion PCIe-8 SSD 1TB | Lenovo Yoga 9i 14 2022 i7-1260P Iris Xe G7 96EUs, i7-1260P, Samsung PM9A1 MZVL21T0HCLR | Dell Inspiron 14 Plus 7420 GeForce RTX 3050 4GB Laptop GPU, i7-12700H, SK Hynix BC711 512GB HFM512GD3GX013N | Asus Vivobook Pro 14 M3401QC-KM007T GeForce RTX 3050 4GB Laptop GPU, R5 5600H, Intel SSD 670p SSDPEKNU512GZ | Apple MacBook Pro 14 2021 M1 Pro Entry M1 Pro 14-Core GPU, M1 Pro 8-Core, Apple SSD AP0512 | Schenker Vision 14 GeForce RTX 3050 Ti Laptop GPU, i7-11370H, Samsung SSD 980 Pro 1TB MZ-V8P1T0BW | |
|---|---|---|---|---|---|---|---|
| Noise | 12% | 6% | 1% | -11% | 12% | 2% | |
| av / miljö * (dB) | 24.4 | 23.5 4% | 24.1 1% | 23.2 5% | 25.4 -4% | 24.8 -2% | 24.3 -0% |
| Idle Minimum * (dB) | 24.4 | 23.5 4% | 24.1 1% | 23.2 5% | 25.4 -4% | 24.8 -2% | 24.3 -0% |
| Idle Average * (dB) | 24.4 | 23.5 4% | 24.1 1% | 23.2 5% | 25.4 -4% | 24.8 -2% | 24.3 -0% |
| Idle Maximum * (dB) | 27.8 | 25.9 7% | 30 -8% | 23.2 17% | 30.9 -11% | 24.8 11% | 25.9 7% |
| Load Average * (dB) | 43.3 | 33.8 22% | 39.4 9% | 47.5 -10% | 56 -29% | 27.8 36% | 43.3 -0% |
| Witcher 3 ultra * (dB) | 48.2 | 35.4 27% | 39.4 18% | 51.7 -7% | 27.8 42% | 44.6 7% | |
| Load Maximum * (dB) | 48.8 | 40.6 17% | 39.4 19% | 51.7 -6% | 56 -15% | 49.5 -1% | 49.5 -1% |
* ... mindre är bättre
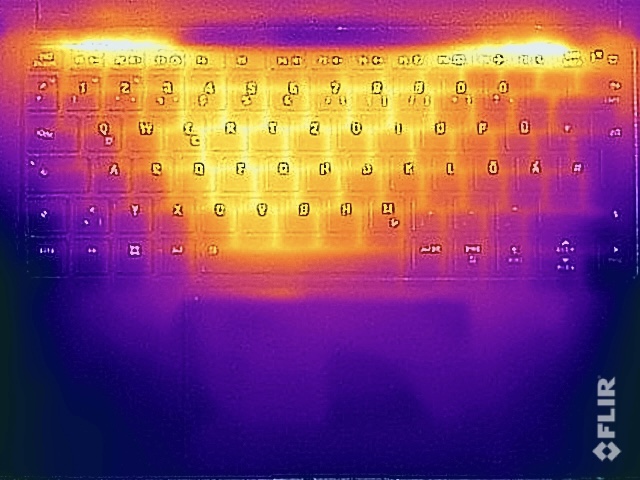
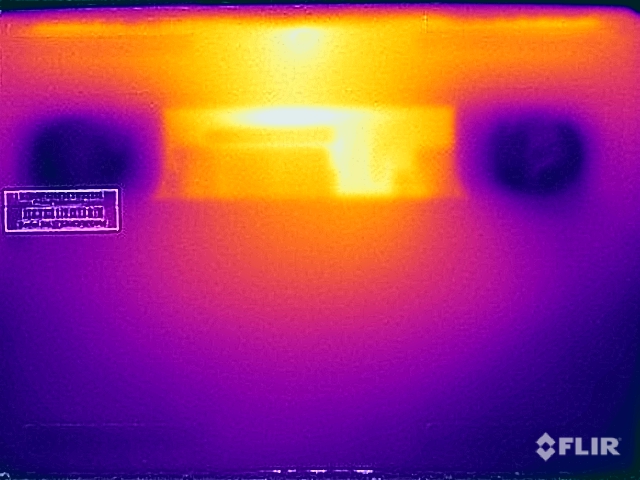
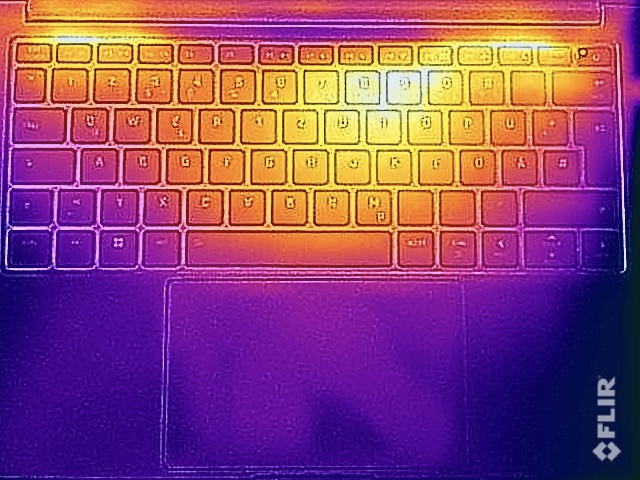
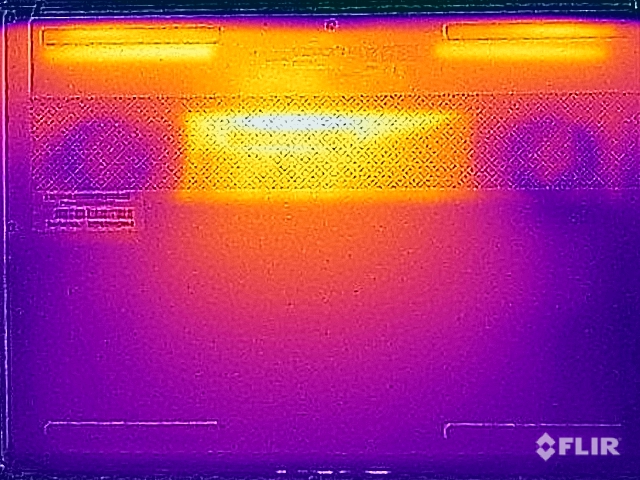
Temperatur
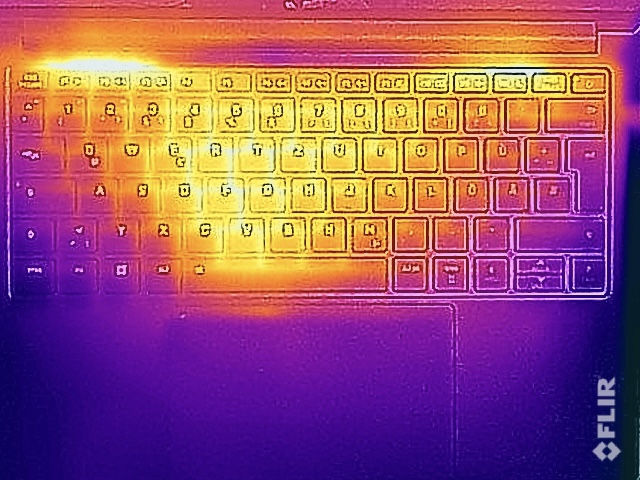
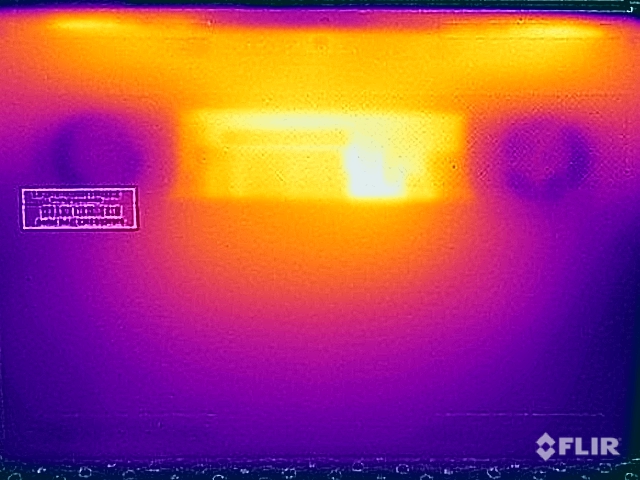
Det finns också slående likheter med föregångaren när det gäller yttemperaturerna. Under tomgång och när man utför kravlösa uppgifter förblir temperaturerna låga, medan det centrala området ovanför tangentbordet och det nedre centrala området kan nå nära mycket varma 50 °C respektive över 50 °C. Vi avråder från att använda den bärbara datorn i knät i dessa scenarier. Med endast upp till 45 °C (113 °F) under belastning förblir iGPU-versionen betydligt svalare.
Under vårt stresstest ligger grafikkortet konstant på 35 watt, medan processorn till en början förbrukar cirka 31 watt innan den stabiliseras på 25 watt efter några minuter. Den fulla prestandan är fortfarande tillgänglig direkt efter stresstestet.
(-) Den maximala temperaturen på ovansidan är 48.4 °C / 119 F, jämfört med genomsnittet av 35.9 °C / 97 F , allt från 21.4 till 59 °C för klassen Subnotebook.
(-) Botten värms upp till maximalt 57.1 °C / 135 F, jämfört med genomsnittet av 39.2 °C / 103 F
(+) Vid tomgångsbruk är medeltemperaturen för ovansidan 26.6 °C / 80 F, jämfört med enhetsgenomsnittet på 30.8 °C / ### class_avg_f### F.
(-) När du spelar The Witcher 3 är medeltemperaturen för ovansidan 40.8 °C / 105 F, jämfört med enhetsgenomsnittet på 30.8 °C / ## #class_avg_f### F.
(+) Handledsstöden och pekplattan är kallare än hudtemperaturen med maximalt 28.5 °C / 83.3 F och är därför svala att ta på.
(±) Medeltemperaturen för handledsstödsområdet på liknande enheter var 28.2 °C / 82.8 F (-0.3 °C / -0.5 F).
| Schenker Vision 14 2022 RTX 3050 Ti Intel Core i7-12700H, NVIDIA GeForce RTX 3050 Ti Laptop GPU | Huawei MateBook X Pro 2022 Intel Core i7-1260P, Intel Iris Xe Graphics G7 96EUs | Lenovo Yoga 9i 14 2022 i7-1260P Intel Core i7-1260P, Intel Iris Xe Graphics G7 96EUs | Dell Inspiron 14 Plus 7420 Intel Core i7-12700H, NVIDIA GeForce RTX 3050 4GB Laptop GPU | Asus Vivobook Pro 14 M3401QC-KM007T AMD Ryzen 5 5600H, NVIDIA GeForce RTX 3050 4GB Laptop GPU | Apple MacBook Pro 14 2021 M1 Pro Entry Apple M1 Pro 8-Core, Apple M1 Pro 14-Core GPU | Schenker Vision 14 Intel Core i7-11370H, NVIDIA GeForce RTX 3050 Ti Laptop GPU | |
|---|---|---|---|---|---|---|---|
| Heat | 8% | 4% | 14% | -7% | 16% | -2% | |
| Maximum Upper Side * (°C) | 48.4 | 43.1 11% | 47.5 2% | 40 17% | 42.3 13% | 46.8 3% | 49.7 -3% |
| Maximum Bottom * (°C) | 57.1 | 42 26% | 52.2 9% | 36.4 36% | 49.6 13% | 40.9 28% | 56 2% |
| Idle Upper Side * (°C) | 28.1 | 29.4 -5% | 27.1 4% | 27 4% | 34.2 -22% | 24.2 14% | 28.8 -2% |
| Idle Bottom * (°C) | 29 | 29.4 -1% | 28.5 2% | 29.2 -1% | 37.9 -31% | 24.2 17% | 30.6 -6% |
* ... mindre är bättre
Högtalare
På grund av det stora batteriet måste två nya högtalarmoduler användas. Det finns dock ingen märkbar skillnad, och ljudkvaliteten är fortfarande en av Vision 14:s svagheter. Högtalarna låter väldigt tunna och kan inte konkurrera med högtalarna på andra bärbara multimediebärbara datorer.
Schenker Vision 14 2022 RTX 3050 Ti ljudanalys
(±) | högtalarljudstyrkan är genomsnittlig men bra (81.9 dB)
Bas 100 - 315 Hz
(-) | nästan ingen bas - i genomsnitt 20.6% lägre än medianen
(±) | linjäriteten för basen är genomsnittlig (9% delta till föregående frekvens)
Mellan 400 - 2000 Hz
(±) | högre mellan - i genomsnitt 6.7% högre än median
(+) | mids är linjära (5.8% delta till föregående frekvens)
Högsta 2 - 16 kHz
(+) | balanserade toppar - endast 4.3% från medianen
(+) | toppar är linjära (4.9% delta till föregående frekvens)
Totalt 100 - 16 000 Hz
(±) | linjäriteten för det totala ljudet är genomsnittlig (20.4% skillnad mot median)
Jämfört med samma klass
» 65% av alla testade enheter i den här klassen var bättre, 8% liknande, 26% sämre
» Den bästa hade ett delta på 5%, genomsnittet var 18%, sämst var 53%
Jämfört med alla testade enheter
» 54% av alla testade enheter var bättre, 8% liknande, 38% sämre
» Den bästa hade ett delta på 4%, genomsnittet var 23%, sämst var 134%
Apple MacBook Pro 14 2021 M1 Pro Entry ljudanalys
(+) | högtalare kan spela relativt högt (84.9 dB)
Bas 100 - 315 Hz
(+) | bra bas - bara 4.3% från medianen
(+) | basen är linjär (5.9% delta till föregående frekvens)
Mellan 400 - 2000 Hz
(+) | balanserad mellan - endast 1.1% från medianen
(+) | mids är linjära (1.9% delta till föregående frekvens)
Högsta 2 - 16 kHz
(+) | balanserade toppar - endast 2.9% från medianen
(+) | toppar är linjära (3% delta till föregående frekvens)
Totalt 100 - 16 000 Hz
(+) | det totala ljudet är linjärt (5.6% skillnad mot median)
Jämfört med samma klass
» 2% av alla testade enheter i den här klassen var bättre, 1% liknande, 97% sämre
» Den bästa hade ett delta på 5%, genomsnittet var 17%, sämst var 45%
Jämfört med alla testade enheter
» 0% av alla testade enheter var bättre, 0% liknande, 100% sämre
» Den bästa hade ett delta på 4%, genomsnittet var 23%, sämst var 134%
Energihantering - Högre körtider tack vare 99-Wh-batteriet
Energiförbrukning
Även om energiförbrukningen har förbättrats något jämfört med den äldre modellär Vision 14:s förbrukning på mer än 11 watt fortfarande inte särskilt effektiv, vilket beror på 3K-panelen. Vi uppmätte en maximal förbrukning på 110 watt (som sjunker och stabiliseras på ~93 watt efter några minuter). Eftersom batterikapaciteten inte förändrades under testet verkar den medföljande 90-watts nätadaptern ha några dolda reserver. Att ladda och driva enheten med en USB-C-laddare (minst 65 watt) är i allmänhet möjligt, 90-watt-modeller kommer då troligen inte att kunna nå Vision 14:s fulla prestandapotential eller tvingas tillgripa batteriet under full belastning.
| Av/Standby | |
| Låg belastning | |
| Hög belastning |
|
Förklaring:
min: | |
| Schenker Vision 14 2022 RTX 3050 Ti i7-12700H, GeForce RTX 3050 Ti Laptop GPU, Samsung SSD 980 Pro 1TB MZ-V8P1T0BW, IPS, 2880x1800, 14" | Huawei MateBook X Pro 2022 i7-1260P, Iris Xe G7 96EUs, Silicon Motion PCIe-8 SSD 1TB, IPS, 3120x2080, 14.2" | Lenovo Yoga 9i 14 2022 i7-1260P i7-1260P, Iris Xe G7 96EUs, Samsung PM9A1 MZVL21T0HCLR, OLED, 3840x2400, 14" | Dell Inspiron 14 Plus 7420 i7-12700H, GeForce RTX 3050 4GB Laptop GPU, SK Hynix BC711 512GB HFM512GD3GX013N, IPS, 2240x1400, 14" | Asus Vivobook Pro 14 M3401QC-KM007T R5 5600H, GeForce RTX 3050 4GB Laptop GPU, Intel SSD 670p SSDPEKNU512GZ, OLED, 2880x1800, 14" | Apple MacBook Pro 14 2021 M1 Pro Entry M1 Pro 8-Core, M1 Pro 14-Core GPU, Apple SSD AP0512, Mini-LED, 3024x1964, 14.2" | Schenker Vision 14 i7-11370H, GeForce RTX 3050 Ti Laptop GPU, Samsung SSD 980 Pro 1TB MZ-V8P1T0BW, IPS, 2880x1800, 14" | Genomsnitt NVIDIA GeForce RTX 3050 Ti Laptop GPU | Genomsnitt av klass Subnotebook | |
|---|---|---|---|---|---|---|---|---|---|
| Power Consumption | 6% | 16% | -19% | 13% | 27% | -7% | -23% | 42% | |
| Idle Minimum * (Watt) | 7.5 | 6.5 13% | 7.1 5% | 6.3 16% | 6.6 12% | 2.9 61% | 6.7 11% | 8.2 ? -9% | 3.71 ? 51% |
| Idle Average * (Watt) | 10.4 | 13.7 -32% | 10 4% | 10.3 1% | 9.6 8% | 11.6 -12% | 12.6 -21% | 12.6 ? -21% | 6.54 ? 37% |
| Idle Maximum * (Watt) | 11.4 | 14.4 -26% | 10.8 5% | 20 -75% | 7.3 36% | 11.9 -4% | 15.4 -35% | 17.2 ? -51% | 7.89 ? 31% |
| Load Average * (Watt) | 83.3 | 64.6 22% | 64 23% | 106.2 -27% | 73 12% | 49.5 41% | 85.7 -3% | 92 ? -10% | 42.1 ? 49% |
| Witcher 3 ultra * (Watt) | 92.7 | 57.2 38% | 47.7 49% | 96.1 -4% | 74.4 20% | 58.2 37% | 83 10% | ||
| Load Maximum * (Watt) | 110.3 | 90.9 18% | 97 12% | 136.5 -24% | 119 -8% | 68.5 38% | 110.9 -1% | 139.1 ? -26% | 65.1 ? 41% |
* ... mindre är bättre
Power Consumption Witcher 3 / Stress Test
Power Consumption external Monitor
Batteritid
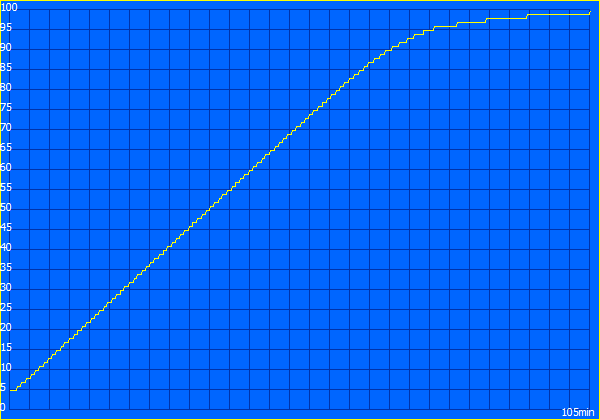
Med 99 Wh erbjuder det nya batteriet nästan dubbelt så stor kapacitet, vilket föga förvånande resulterar i en betydligt förbättrad batteritid. Medan föregångaren bara kunde hålla mellan 4,5-5,5 timmar i vårt Wi-Fi-test beroende på ljusstyrkan, når den nya modellen 8-10 timmar och 11 timmars videouppspelning vid en ljusstyrka på 150 nits (cirka 36 % maximal ljusstyrka i fallet med vår testenhet). Även om dessa resultat är bra visar de också att 3K-panelen helt enkelt inte är särskilt effektiv. En enhet med så här mycket batterikapacitet hade annars kunnat nå ännu bättre driftstider.
När enheten är påslagen tar laddningsprocessen 105 minuter, och 50 % av batteriet är tillgängligt redan efter 36 minuter. Vision 14:s iGPU-modell når i stort sett samma resultat med en avvikelse på några få minuter.
| Schenker Vision 14 2022 RTX 3050 Ti i7-12700H, GeForce RTX 3050 Ti Laptop GPU, 99.8 Wh | Huawei MateBook X Pro 2022 i7-1260P, Iris Xe G7 96EUs, 60 Wh | Lenovo Yoga 9i 14 2022 i7-1260P i7-1260P, Iris Xe G7 96EUs, 75 Wh | Dell Inspiron 14 Plus 7420 i7-12700H, GeForce RTX 3050 4GB Laptop GPU, 64 Wh | Asus Vivobook Pro 14 M3401QC-KM007T R5 5600H, GeForce RTX 3050 4GB Laptop GPU, 63 Wh | Apple MacBook Pro 14 2021 M1 Pro Entry M1 Pro 8-Core, M1 Pro 14-Core GPU, 69.9 Wh | Schenker Vision 14 i7-11370H, GeForce RTX 3050 Ti Laptop GPU, 53 Wh | Genomsnitt av klass Subnotebook | |
|---|---|---|---|---|---|---|---|---|
| Batteridrifttid | -26% | -8% | -43% | -8% | 9% | -39% | 24% | |
| H.264 (h) | 11.1 | 7.6 -32% | 12.6 14% | 15 35% | 6.8 -39% | 15.3 ? 38% | ||
| WiFi v1.3 (h) | 10.1 | 7.5 -26% | 8.6 -15% | 7.2 -29% | 9.5 -6% | 13.6 35% | 5.5 -46% | 14.1 ? 40% |
| Load (h) | 2.1 | 1.7 -19% | 1.6 -24% | 0.9 -57% | 1.9 -10% | 1.2 -43% | 1.4 -33% | 1.998 ? -5% |
| Reader / Idle (h) | 11.9 | 11.5 | 28.6 ? |
För
Emot
Slutsats - Vision 14 med betydande förbättringar
Med den senaste versionen av Vision 14 tar Schenker itu med båda våra viktigaste kritikpunkter mot föregångaren. Den nya Alder Lake-H45-processorn erbjuder mycket mer prestanda än det äldre Tiger Lake -chippet, vilket gör Vision 14 till en av de snabbaste modellerna i sin enhetsklass. På samma sätt har RTX 3050 Ti presterar hyfsat bra, även om utvecklingen på det här området har varit få på ett tag, vilket gör oss ännu mer förväntansfulla inför de kommande RTX 4000 GPU:erna.
Tack vare det nya 99-Wh-batteriet ökar också batteritiderna dramatiskt, även om detta sker på bekostnad av en cirka 0,44 lbs högre vikt, en tjocklek som ökat med 1 mm (~0,04 tum) och den sekundära M.2-2280 SSD-platsen. Även om den lättare versionen med det mindre 53-Wh-batteriet fortfarande finns tillgänglig måste den konfigureras med den dedikerade GeForce GPU:n. För användare utan behov av långa körtider är den lättare modellen fortfarande en enkel rekommendation.
Tack vare Core i7-12700H och 99 Wh-batteriet är nya Vision 14 inte längre lika begränsad när det gäller CPU-prestanda eller batteritid. Även om 14-tumschassit är något tyngre och marginellt tjockare gör kombinationen av bra prestanda, ett stort antal portar, bra servicemöjligheter och en tjusig 3K-skärm med 90 Hz att Vision 14 blir en extremt spännande och riktigt bra bärbar 14-tumsdator.
Vision 14 behåller sitt mycket lilla fotavtryck, tillräckliga portalternativ, RAM-platser och flyttbara Wi-Fi-modul trots sitt något tjockare och tyngre chassi. Även om inkompatibiliteten med moderna 6 GHz-nätverk (Wi-Fi 6E) är en nackdel kommer användarna troligen inte att begränsas av detta på ett tag. Dessutom är luckans gångjärn inte lika täta jämfört med konkurrenterna, vilket resulterar i ganska betydande vinglighet. Även om 90-watts nätadaptern är för svag nominellt sett, verkar den vara tillräcklig för toppförbrukningen på 110 W. Dessutom kommer användarna fortfarande att behöva brottas med höga yttemperaturer och högljudda fläktar vid hög belastning eller vid spelande. Detta är helt enkelt ett resultat av mycket högpresterande komponenter i ett kompakt chassi.
Konkurrenter med liknande prestandaegenskaper och dedikerade GPU:er är betydligt tyngre än Vision 14 och detta är i huvudsak den maximala prestanda som för närvarande finns tillgänglig i den här lilla formfaktorn. Vision 14 med RTX 3050 Ti är dock inte direkt ett fynd, eftersom priset är ungefär detsamma som för den nuvarande MacBook Pro 14 (om än med mindre RAM-minne och mindre lagringsutrymme). Den senare är troligen ett bättre val för användare som inte är beroende av Windows på grund av mini-LED-panelen, det effektiva M1 Pro-chippet och den utmärkta högtalaruppsättningen. Samtidigt är Dell Inspiron 14 Plus 7420 - även om den är märkbart tyngre och tjockare - ett mycket billigare alternativ.
Pris och tillgänglighet
Schenker Vision 14 kan konfigureras på på Bestware.com från 1659 euro (~1659 USD).https://bestware.com/de/schenker-vision-14-e22.html
Schenker Vision 14 2022 RTX 3050 Ti
- 10/25/2022 v7 (old)
Andreas Osthoff
Price comparison

