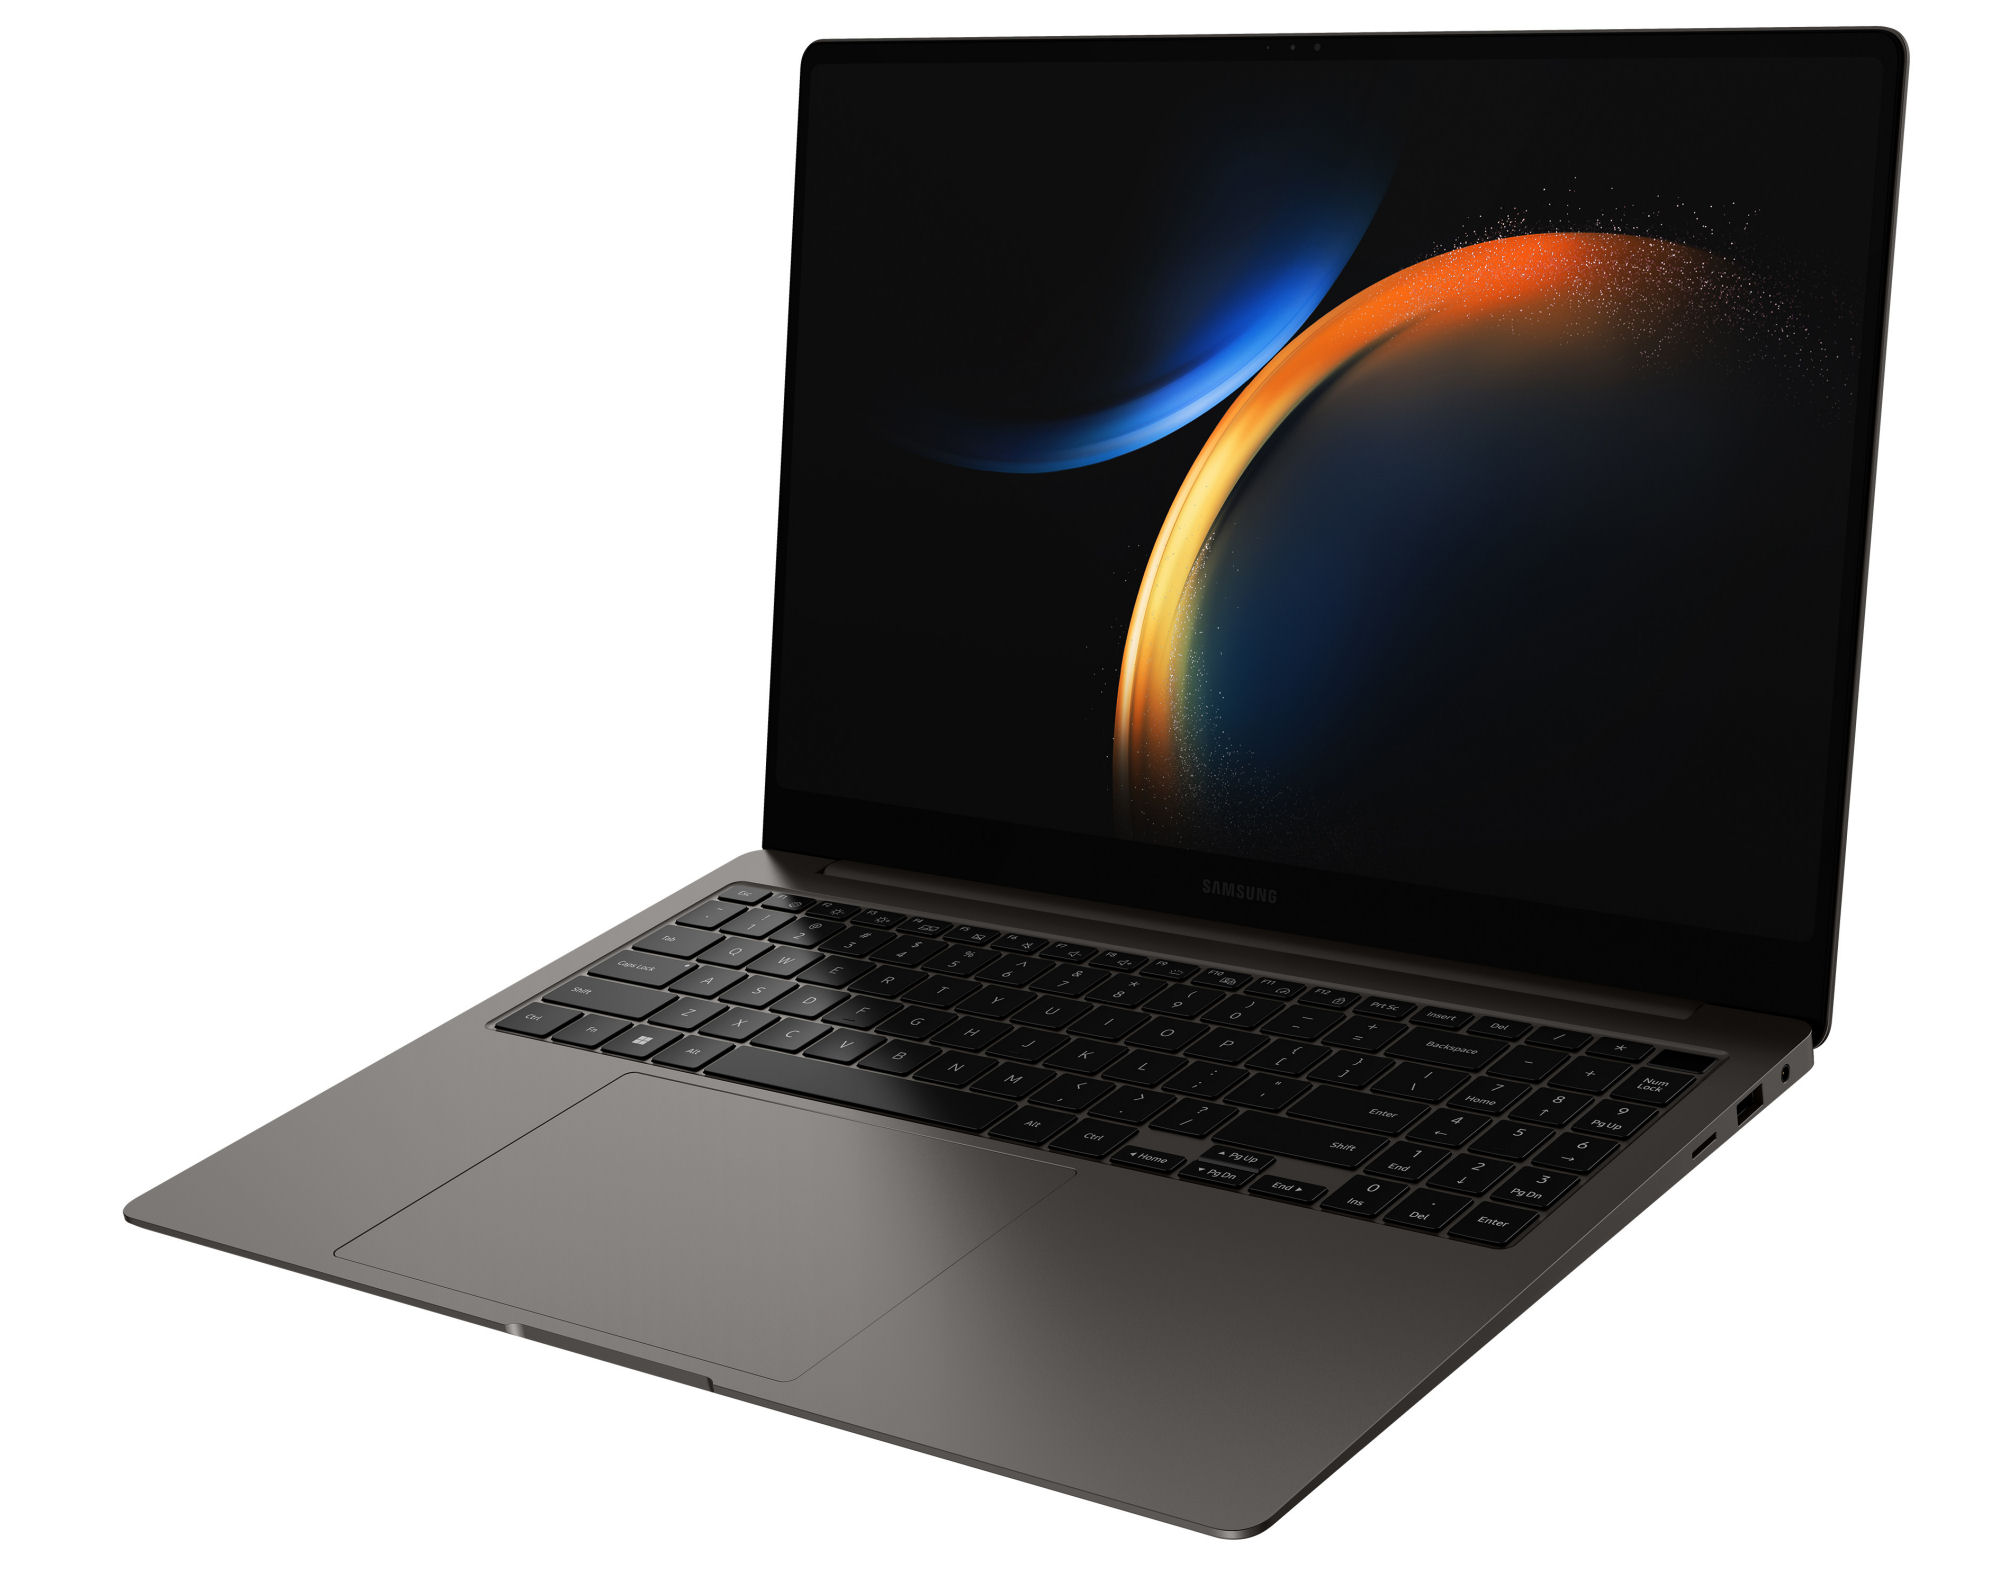
Samsung Galaxy Book3 Ultra 16 recension: Uthållig 16-tums ultrabook med RTX 4050

Med Galaxy Book 3 Ultra 16 presenterar Samsung en kombination av bärbar dator för spel, arbetsstation och bärbar dator för kreativa arbetare, med fokus på mobilitet, ergonomi och låg energiförbrukning. Hög prestanda krävs inte: denCore i7-13700H och GeForce RTX 4050 bromsas av konservativa energigränsvärden, nämligen en låg TGP (60 watt). Ett nätaggregat på 100 watt täcker alla hårdvarukrav.
Bland konkurrenterna finns enheter som t.ex.Schenker Vision 16 Pro, den LG Gram 17, den Dell XPS 15 9520, den Asus VivoBook Pro 16X OLED, den Acer Swift X SFX16-52G och Lenovo ThinkBook 16p G3 ARH.
Potentiella konkurrenter i jämförelse
Gradering | Datum | Modell | Vikt | Höjd | Storlek | Upplösning | Pris |
|---|---|---|---|---|---|---|---|
| 89.4 % v7 (old) | 04/2023 | Samsung Galaxy Book3 Ultra 16 i7-13700H, GeForce RTX 4050 Laptop GPU | 1.8 kg | 16.5 mm | 16.00" | 2880x1800 | |
| 87.8 % v7 (old) | 11/2022 | Schenker Vision 16 Pro RTX 3070 Ti i7-12700H, GeForce RTX 3070 Ti Laptop GPU | 1.7 kg | 17.1 mm | 16.00" | 2560x1600 | |
| 86.4 % v7 (old) | 03/2023 | LG Gram 17Z90Q-E.AD78G i7-1260P, GeForce RTX 2050 Mobile | 1.4 kg | 17.8 mm | 17.00" | 2560x1600 | |
| 87.9 % v7 (old) | 10/2022 | Lenovo ThinkBook 16p G3 ARH R9 6900HX, GeForce RTX 3060 Laptop GPU | 2.1 kg | 19.5 mm | 16.00" | 2560x1600 | |
| 89.5 % v7 (old) | 05/2022 | Dell XPS 15 9520 RTX 3050 Ti i7-12700H, GeForce RTX 3050 Ti Laptop GPU | 1.9 kg | 18 mm | 15.60" | 3456x2160 | |
| 83.7 % v7 (old) | 11/2022 | Asus VivoBook Pro 16X OLED N7600PC-L2026X i7-11370H, GeForce RTX 3050 4GB Laptop GPU | 2 kg | 18.9 mm | 16.00" | 3840x2400 | |
| 86.4 % v7 (old) | 11/2022 | Acer Swift X SFX16-52G-77RX i7-1260P, A370M | 1.8 kg | 21.2 mm | 16.00" | 2560x1600 |
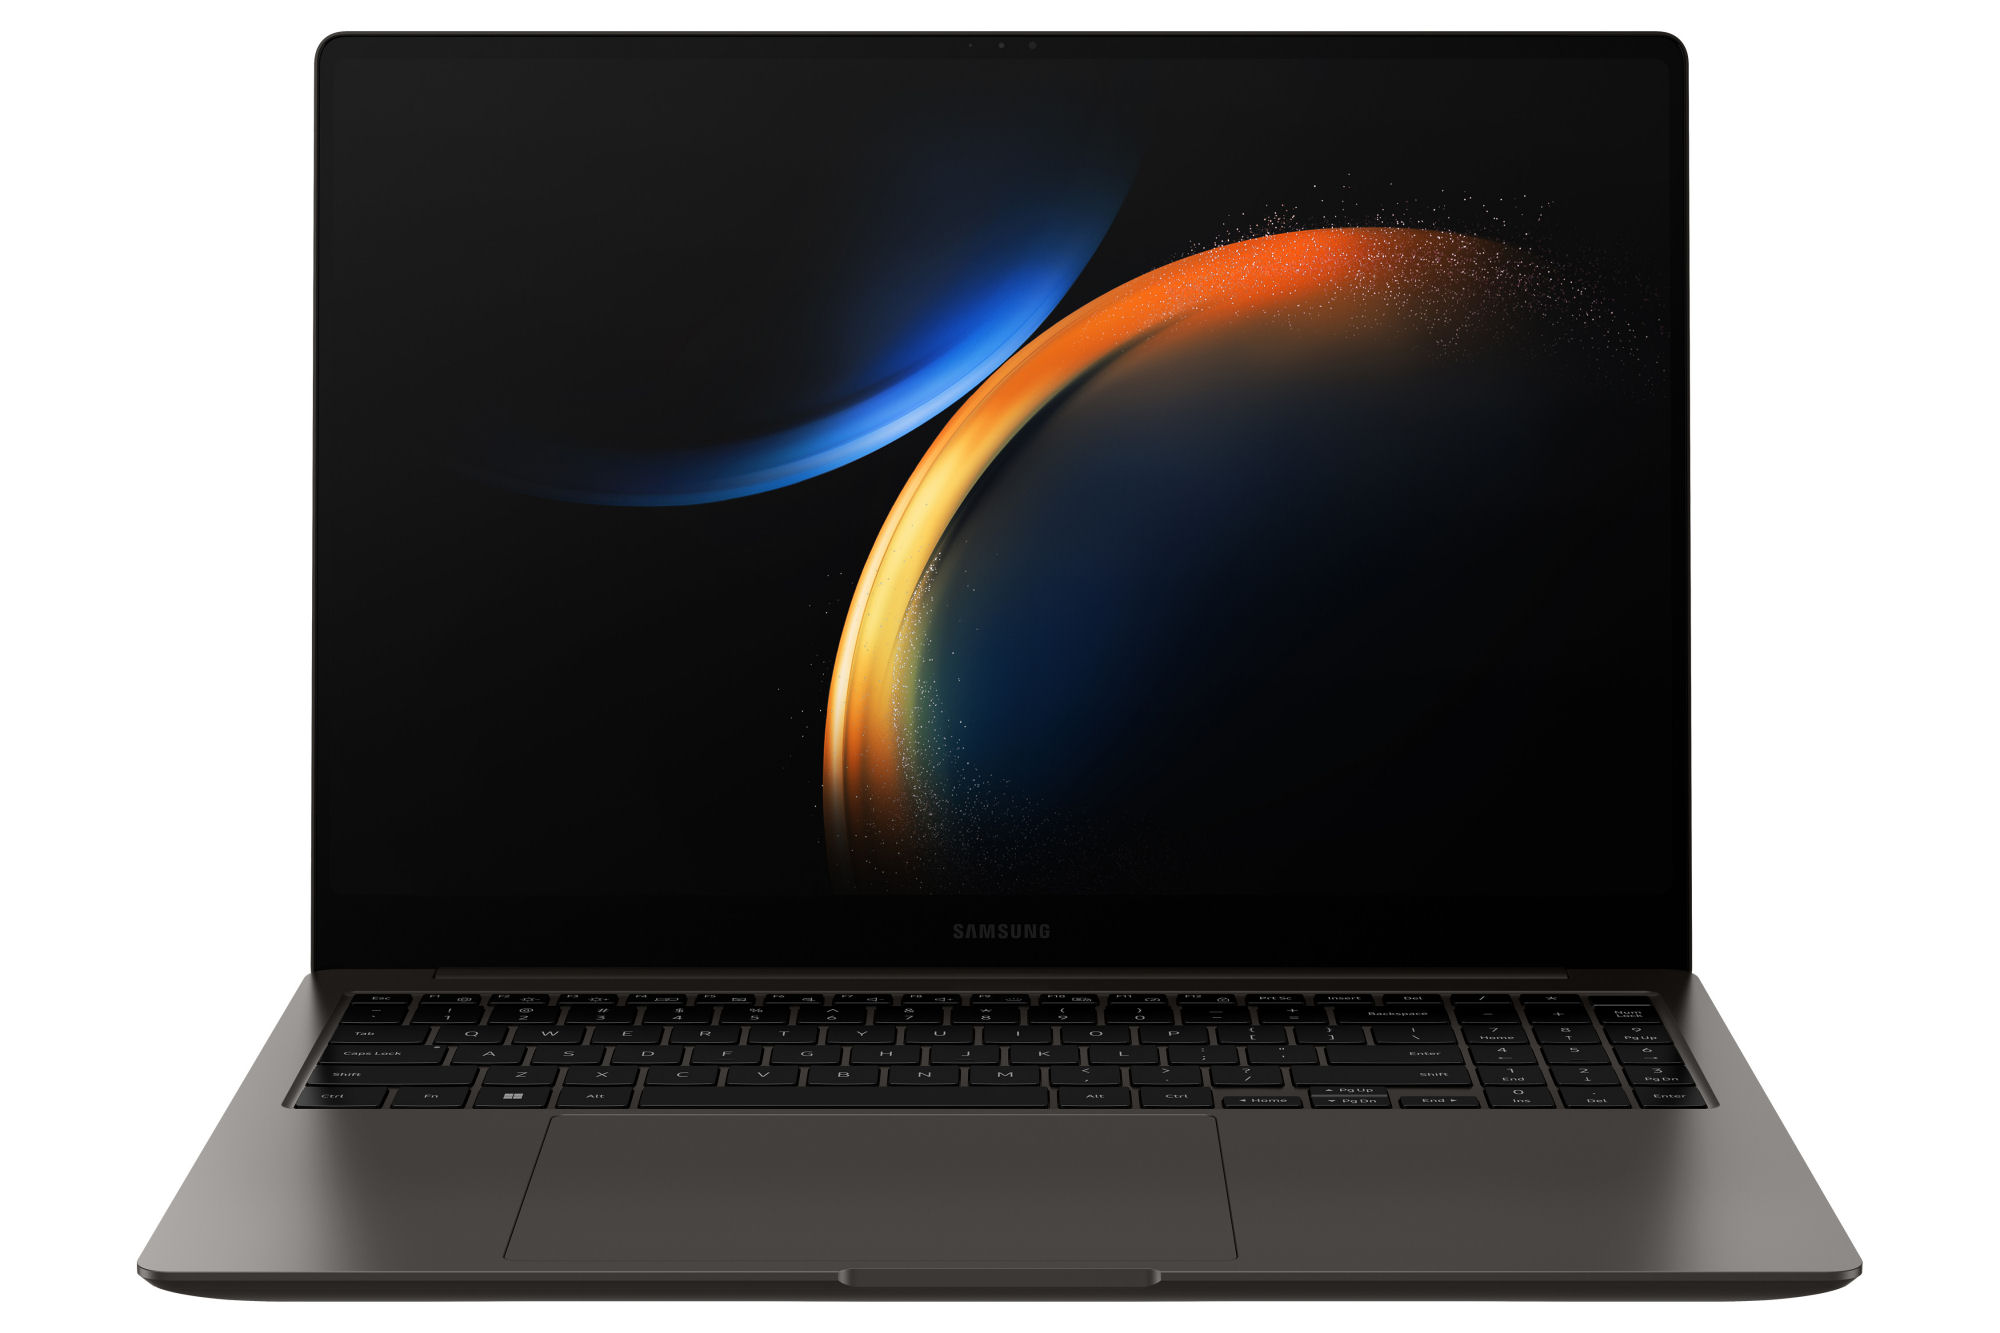
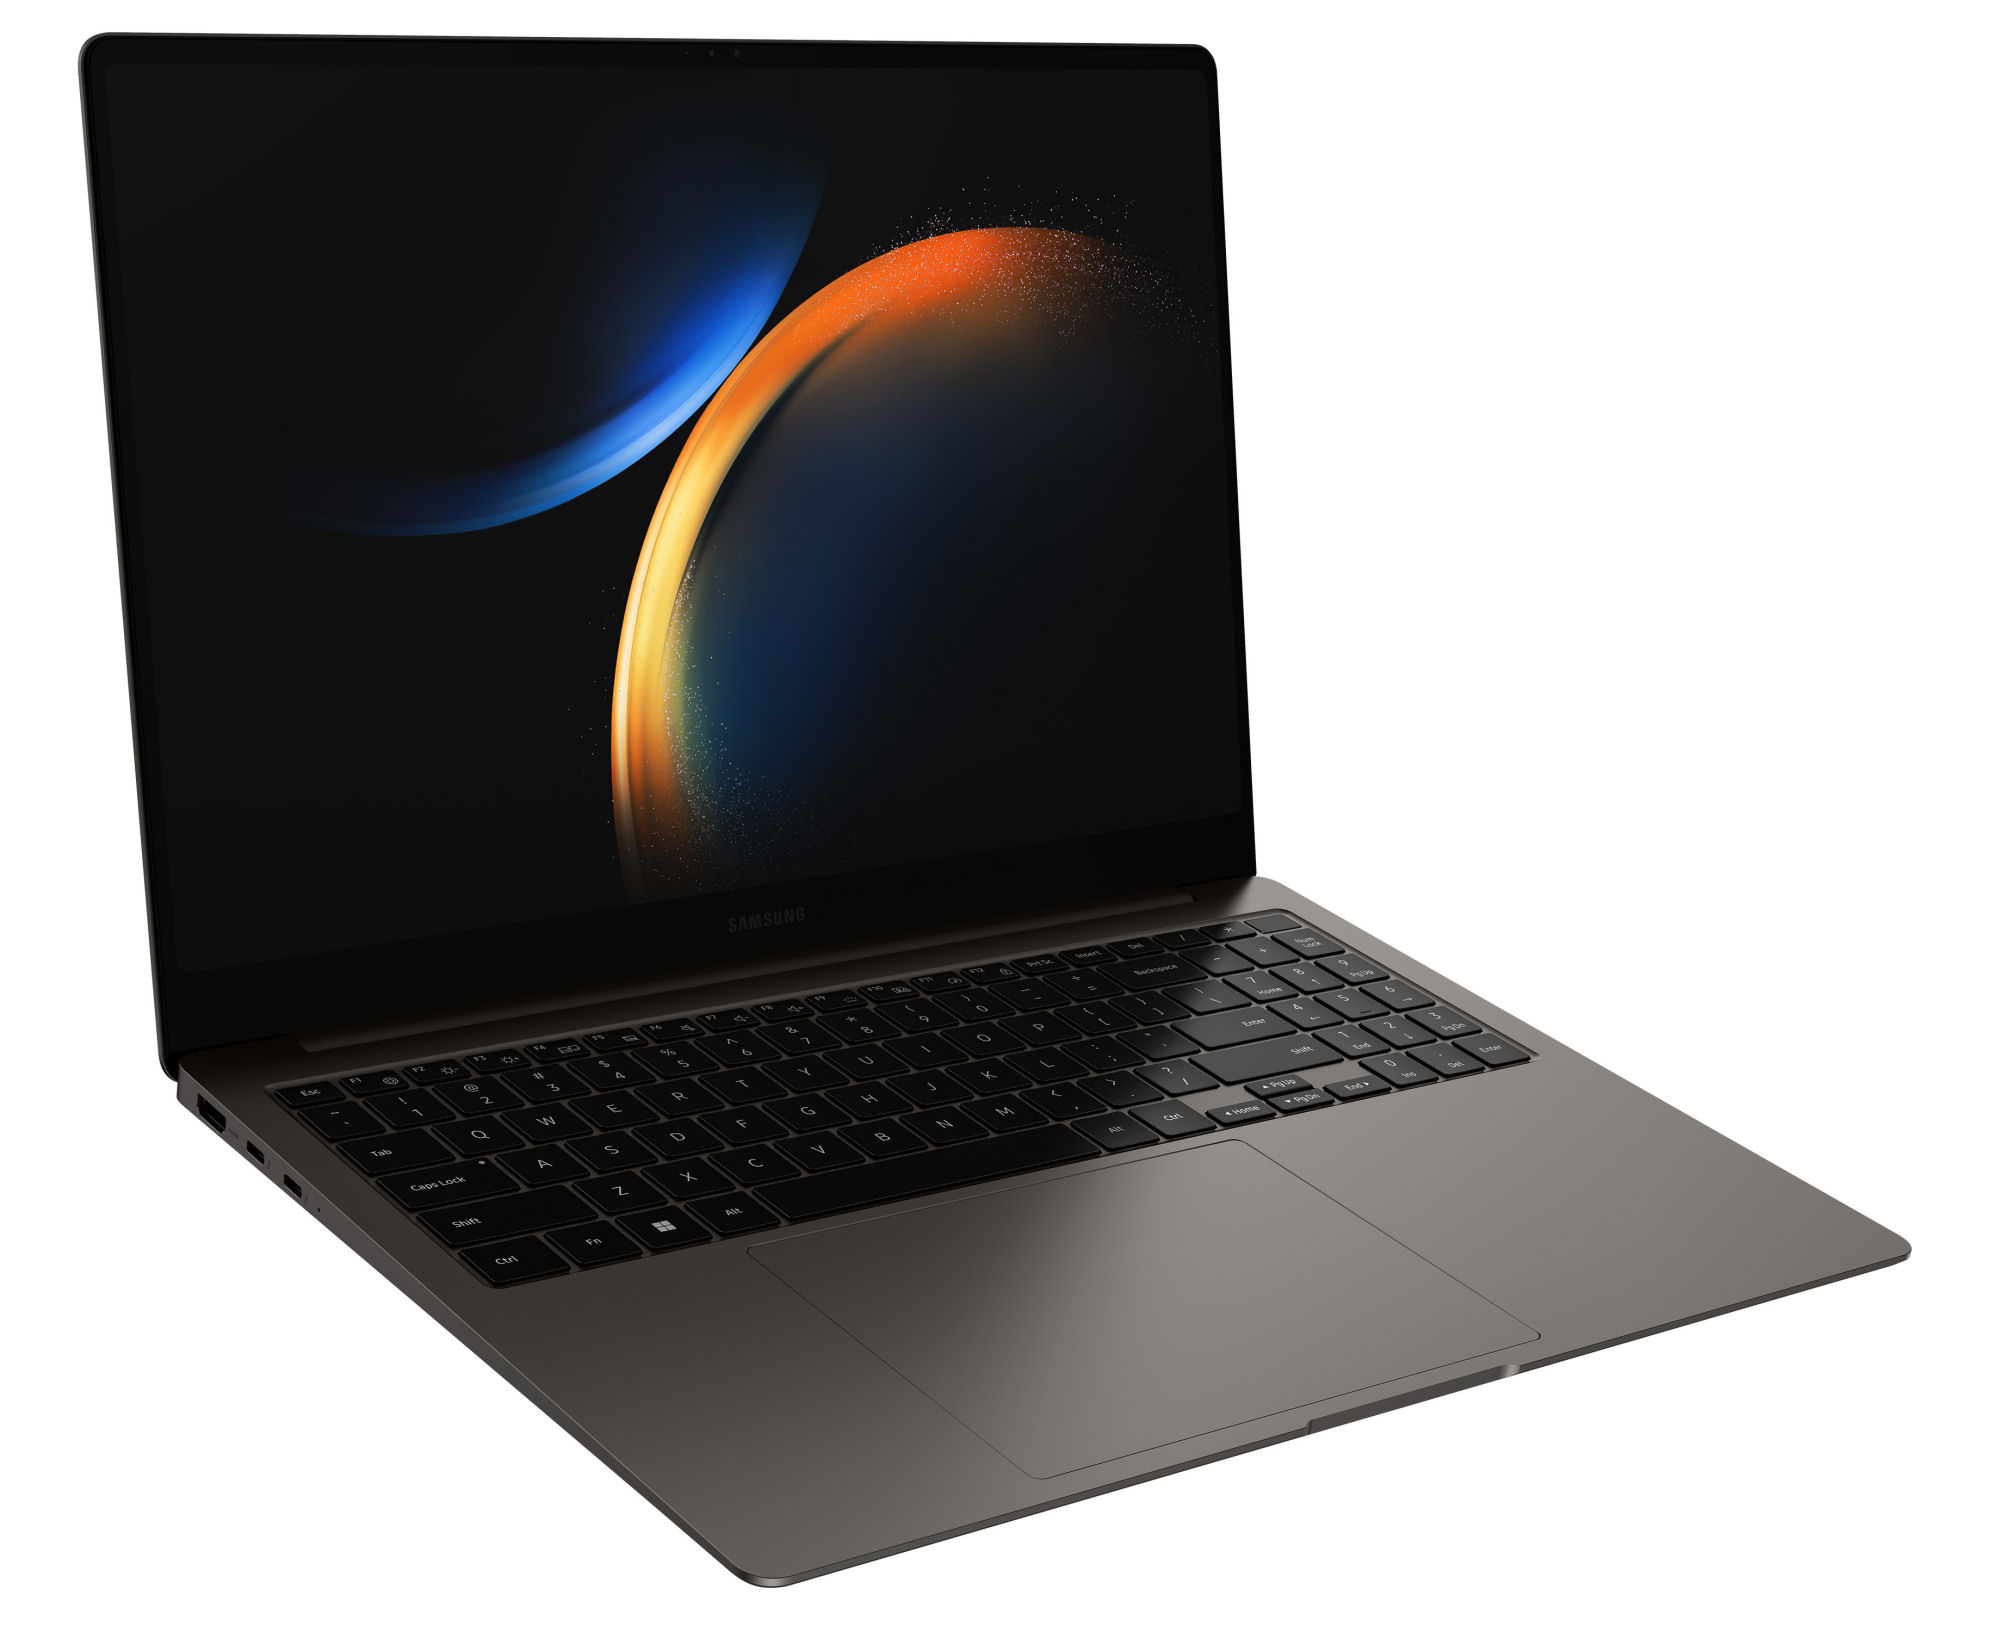
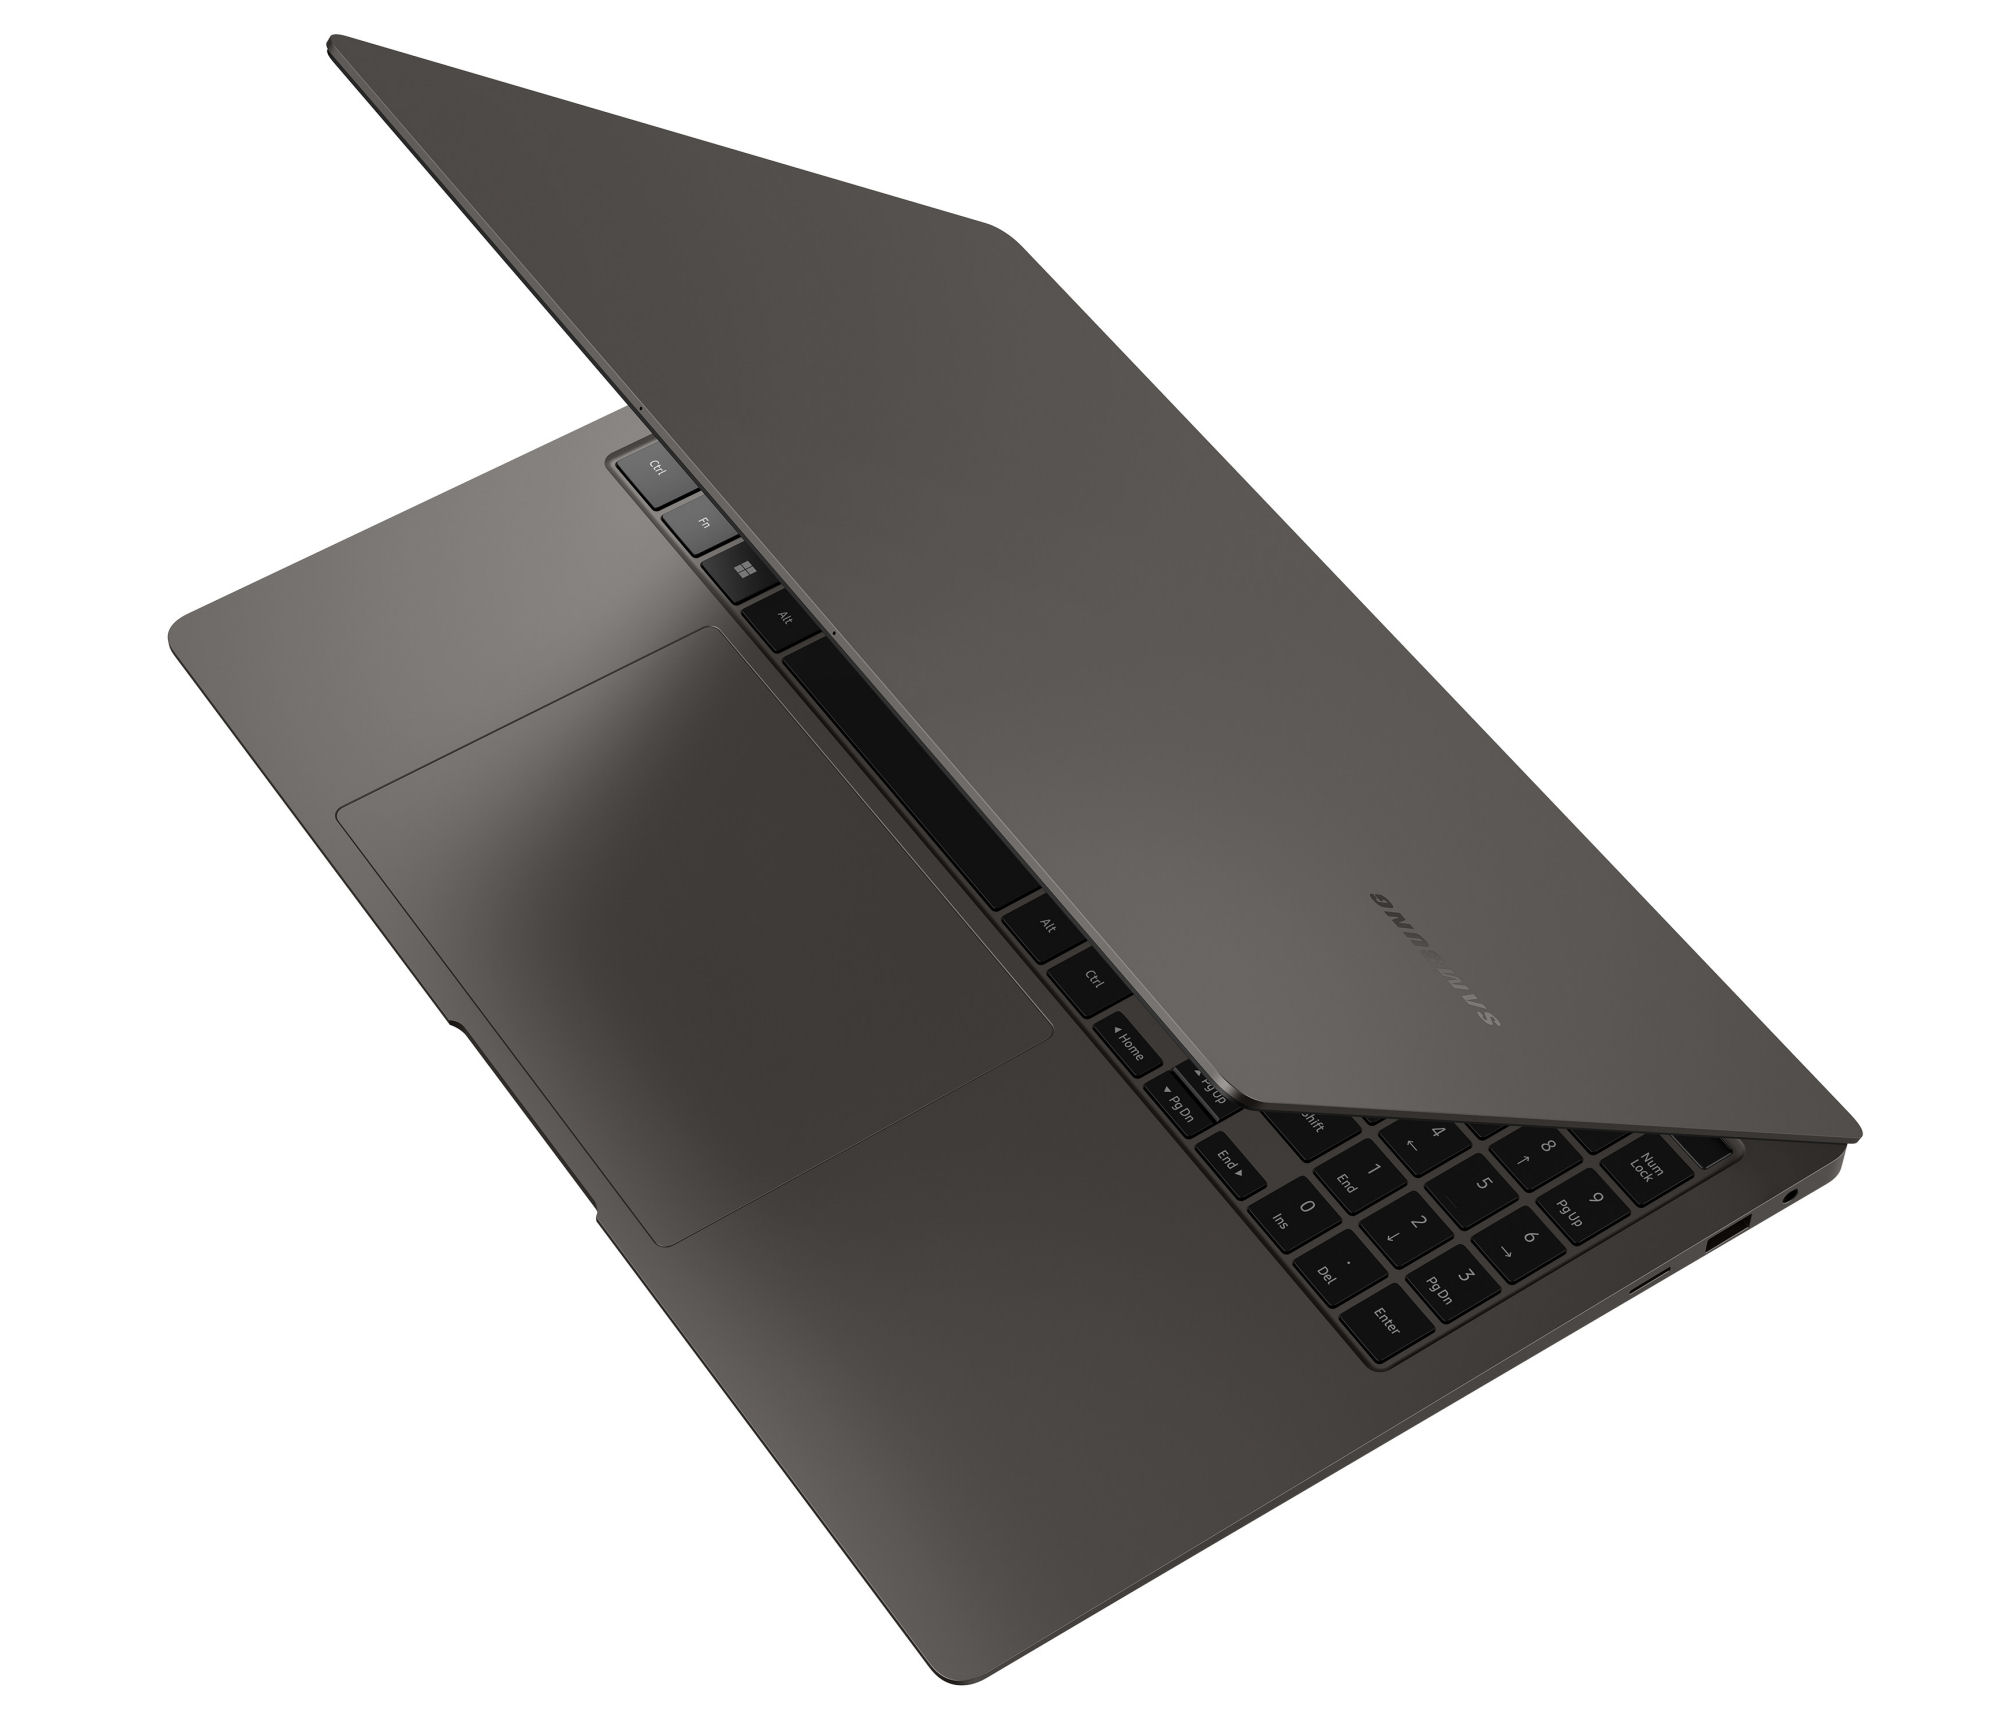
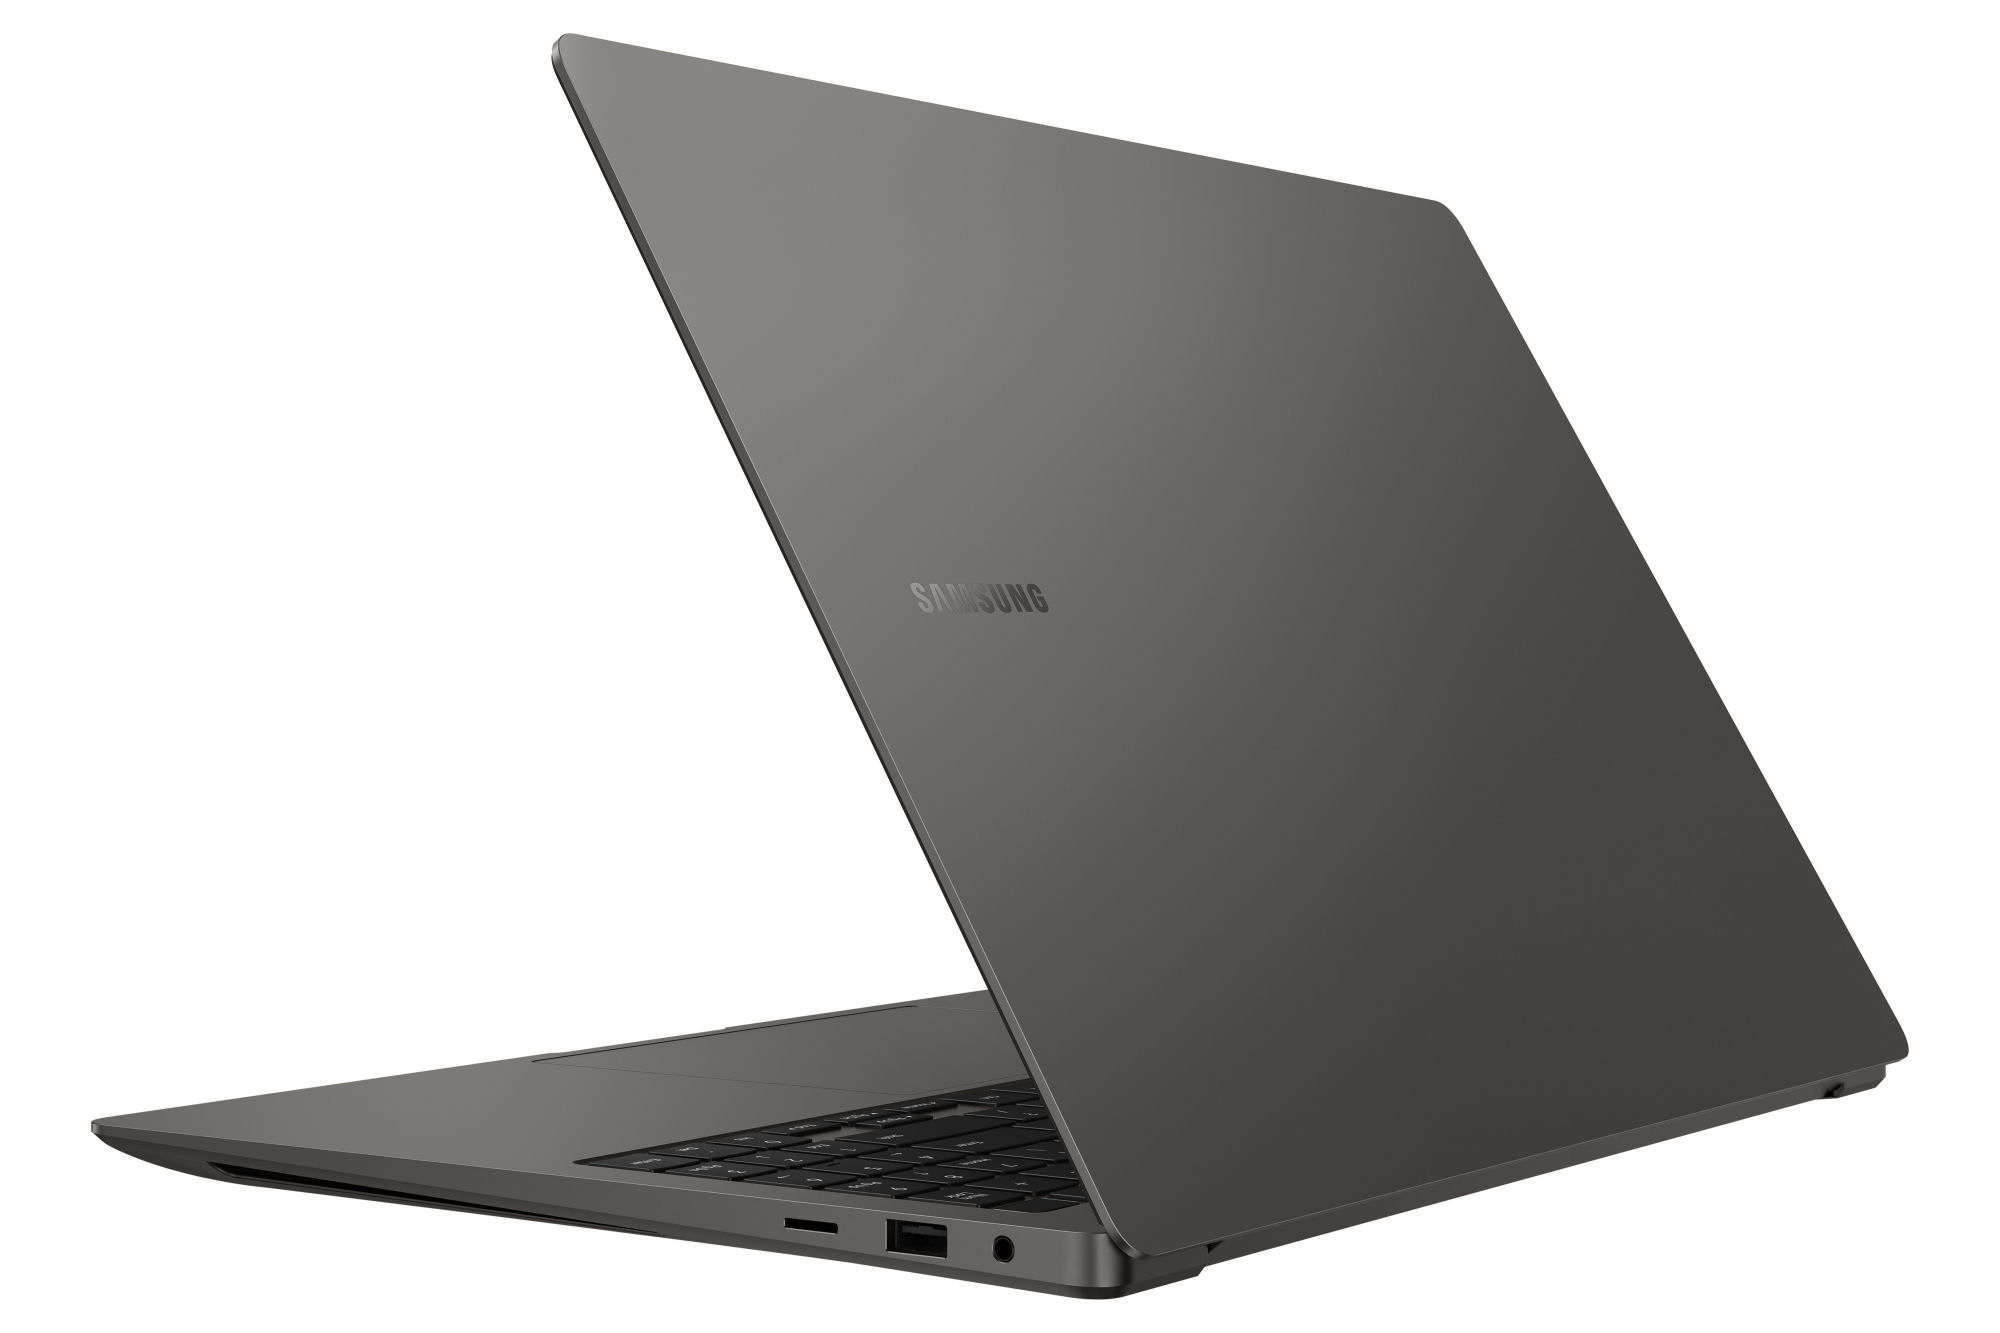
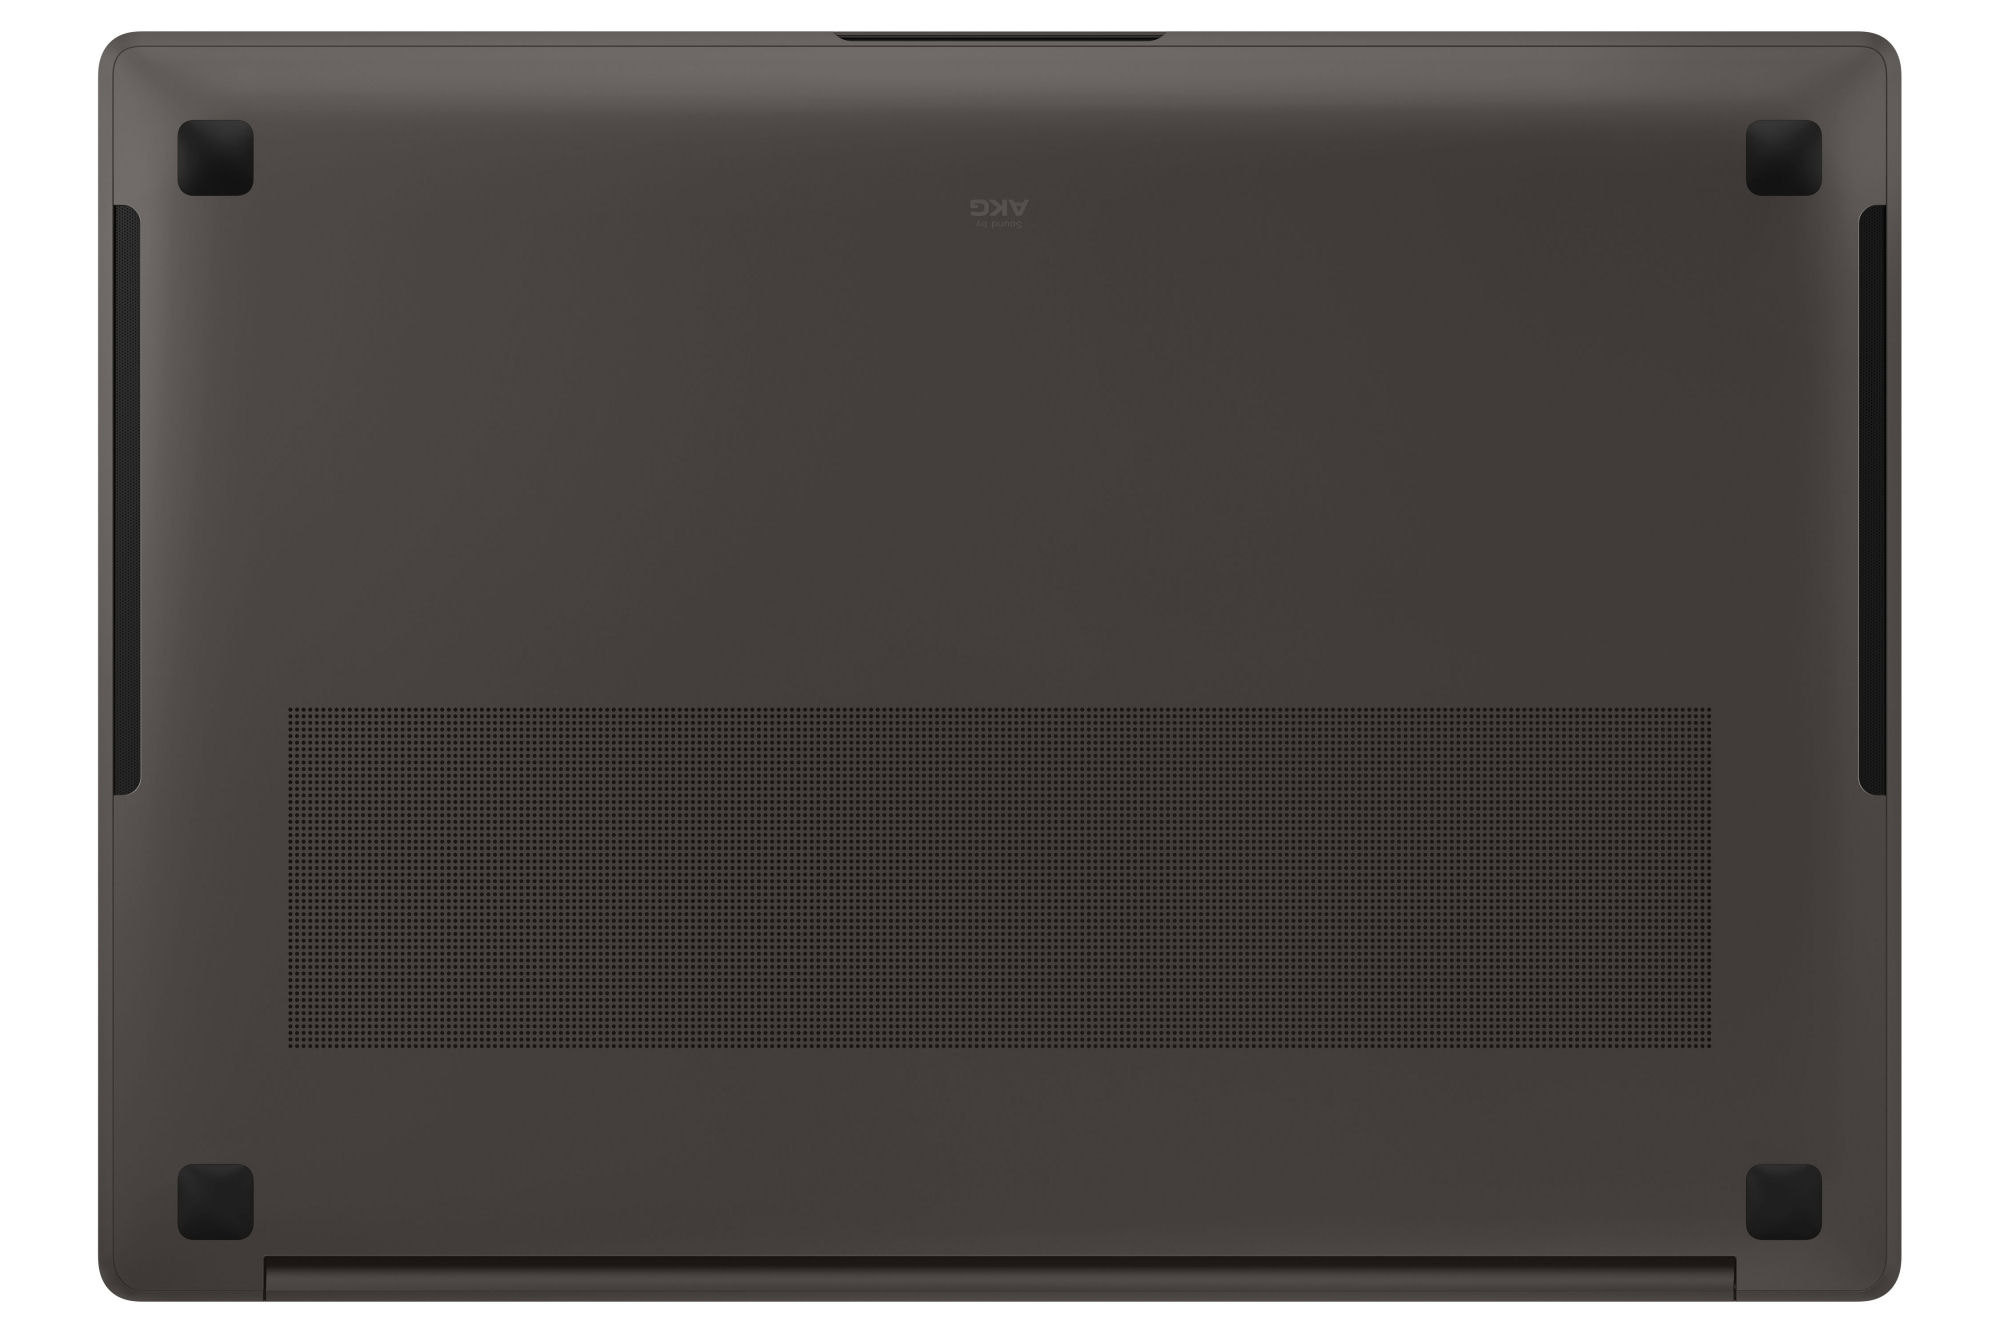
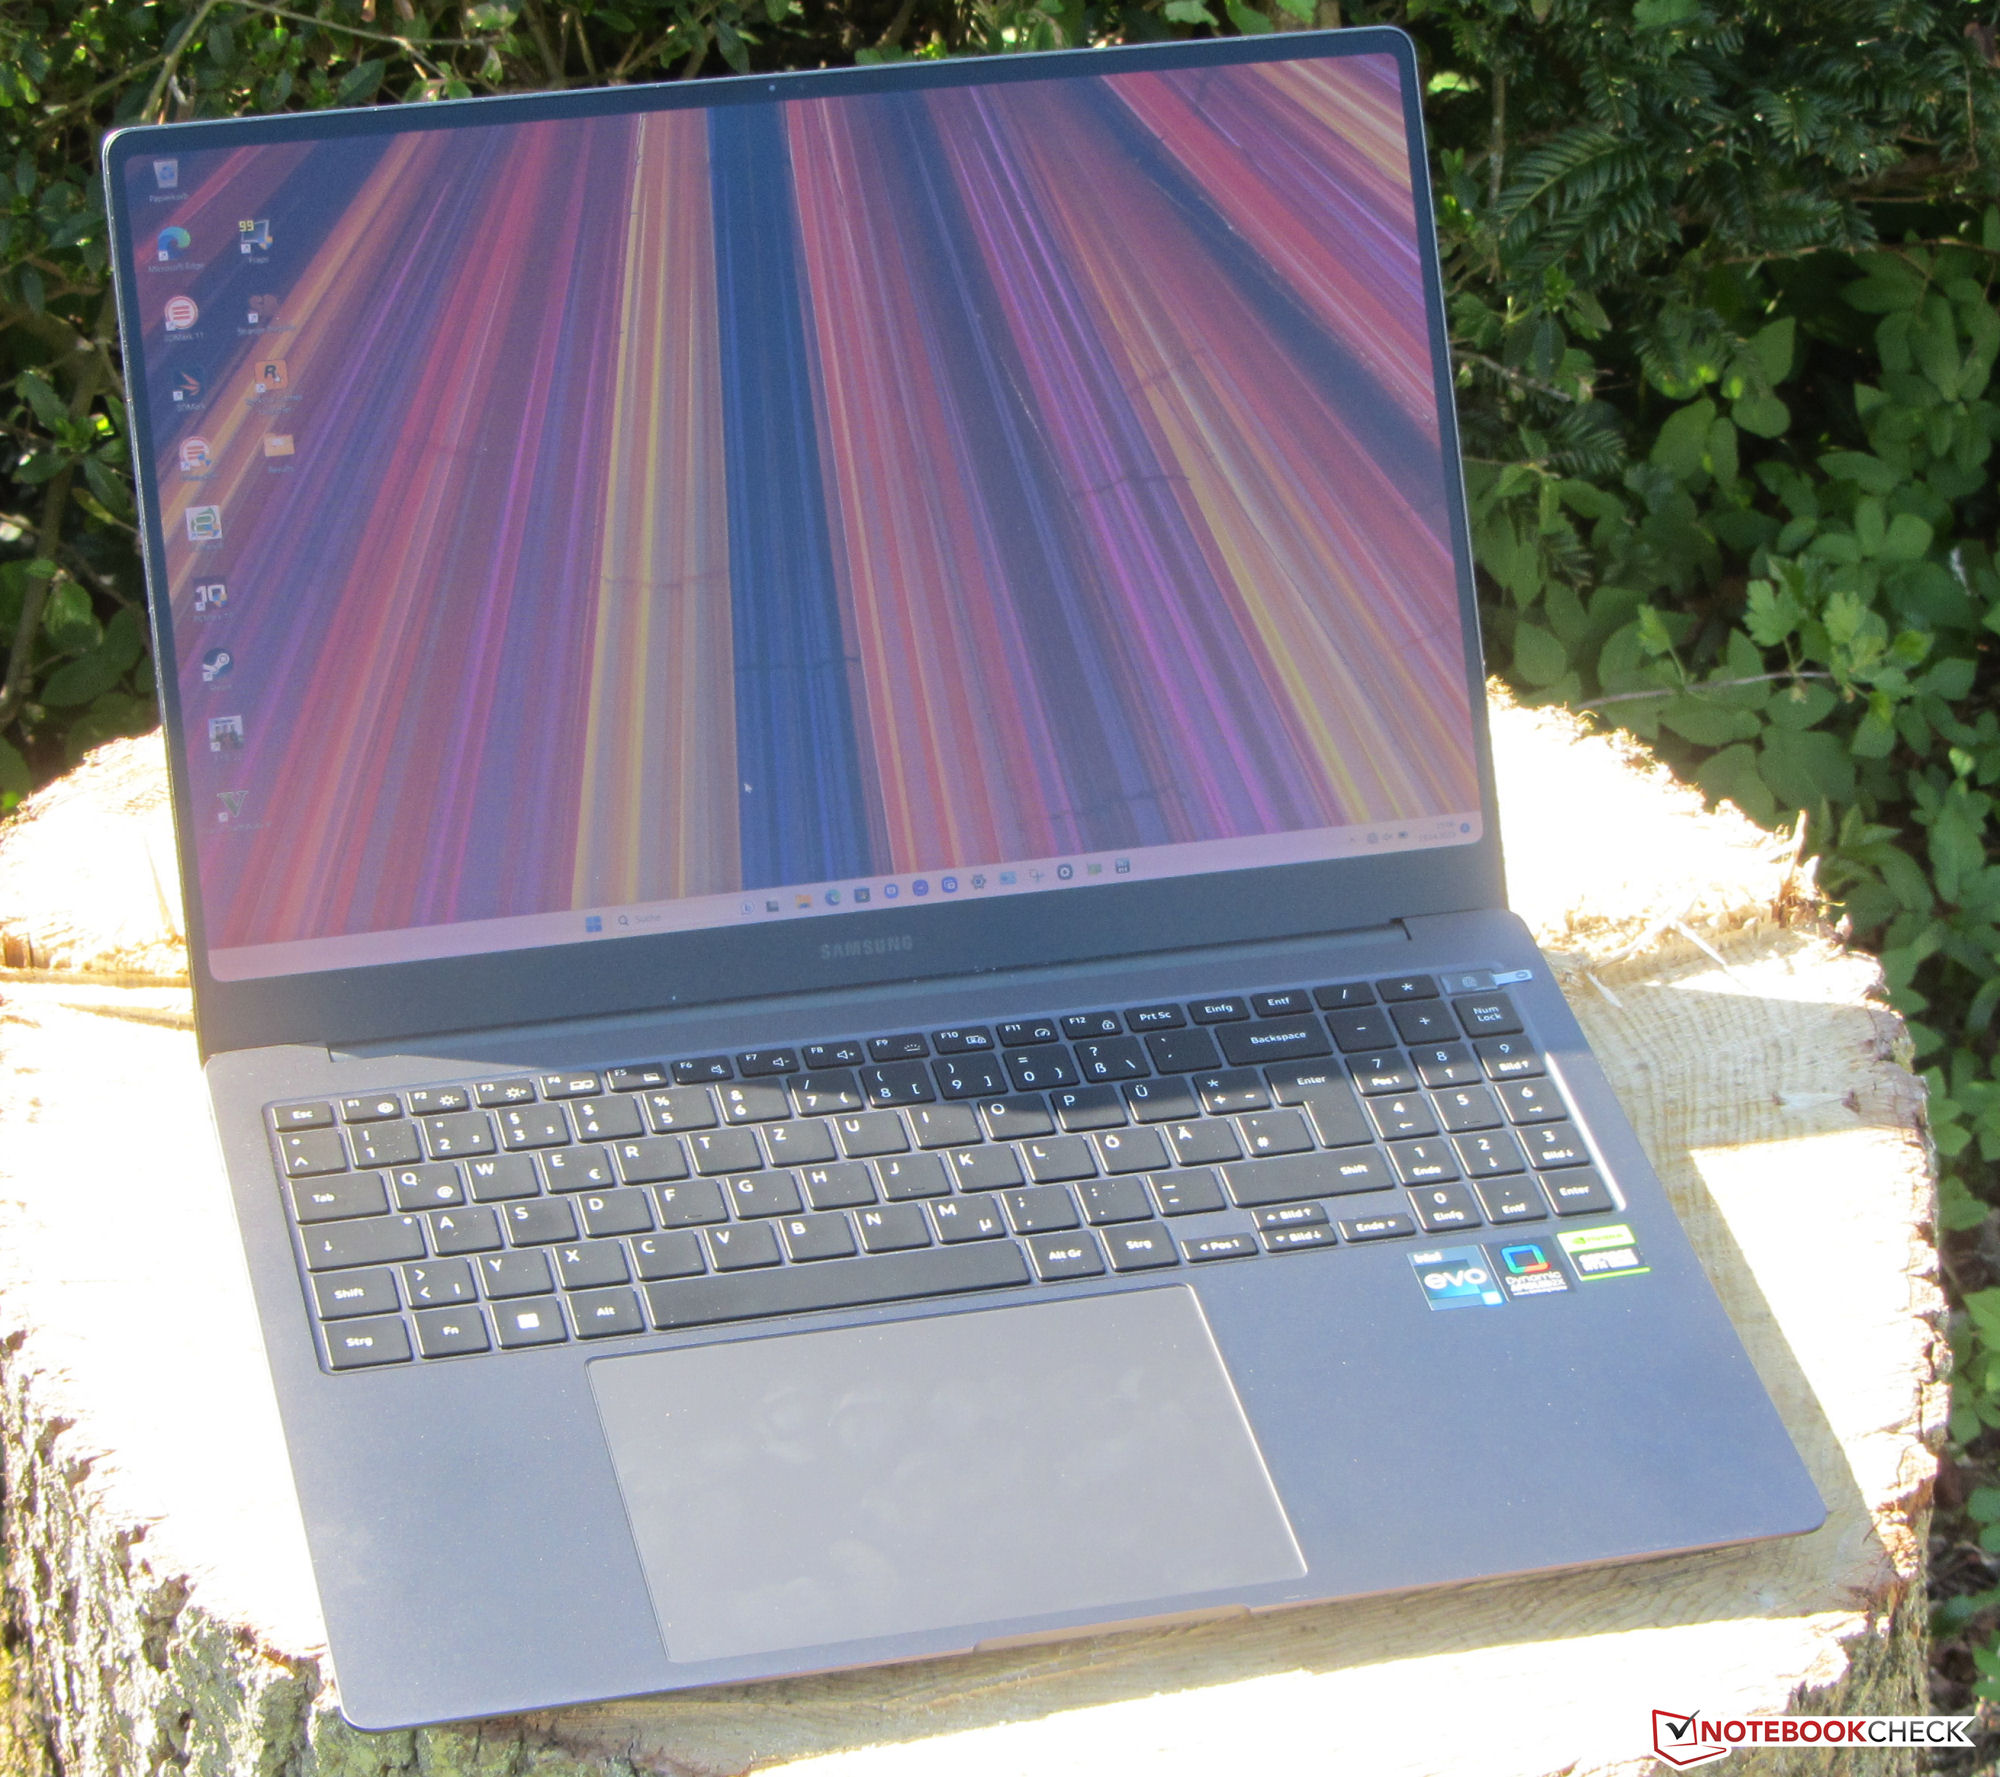
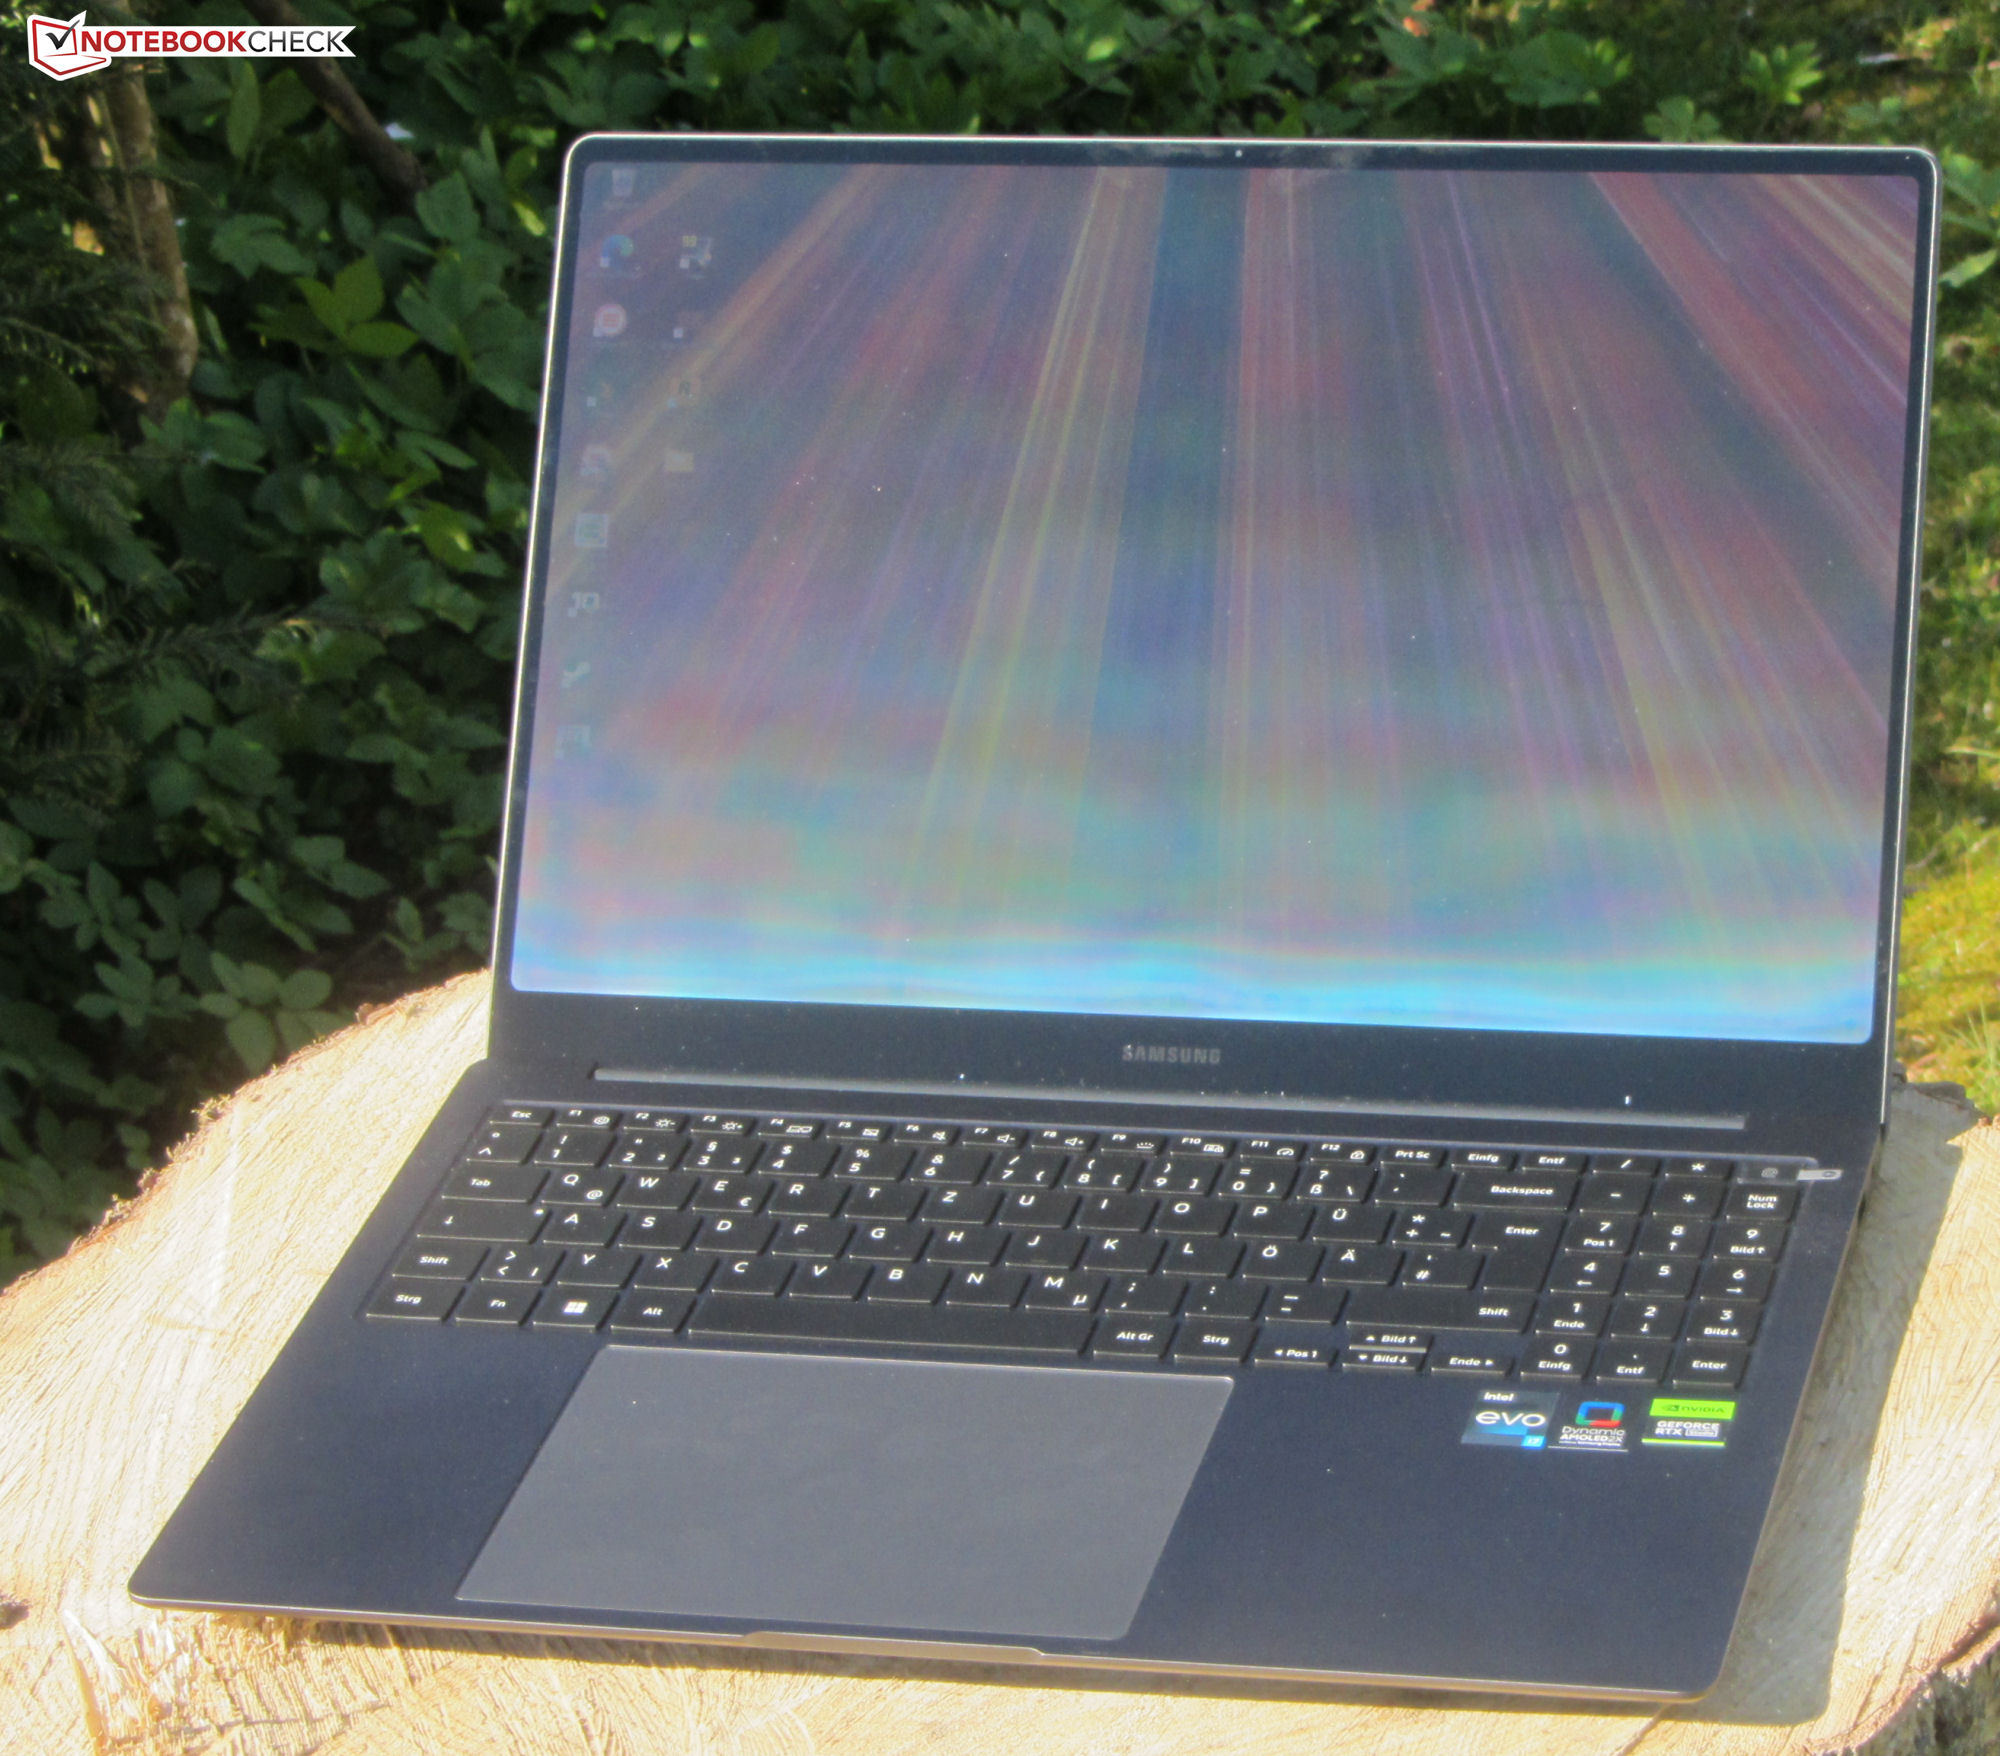
Hölje - Ett elegant aluminiumchassi för Galaxy
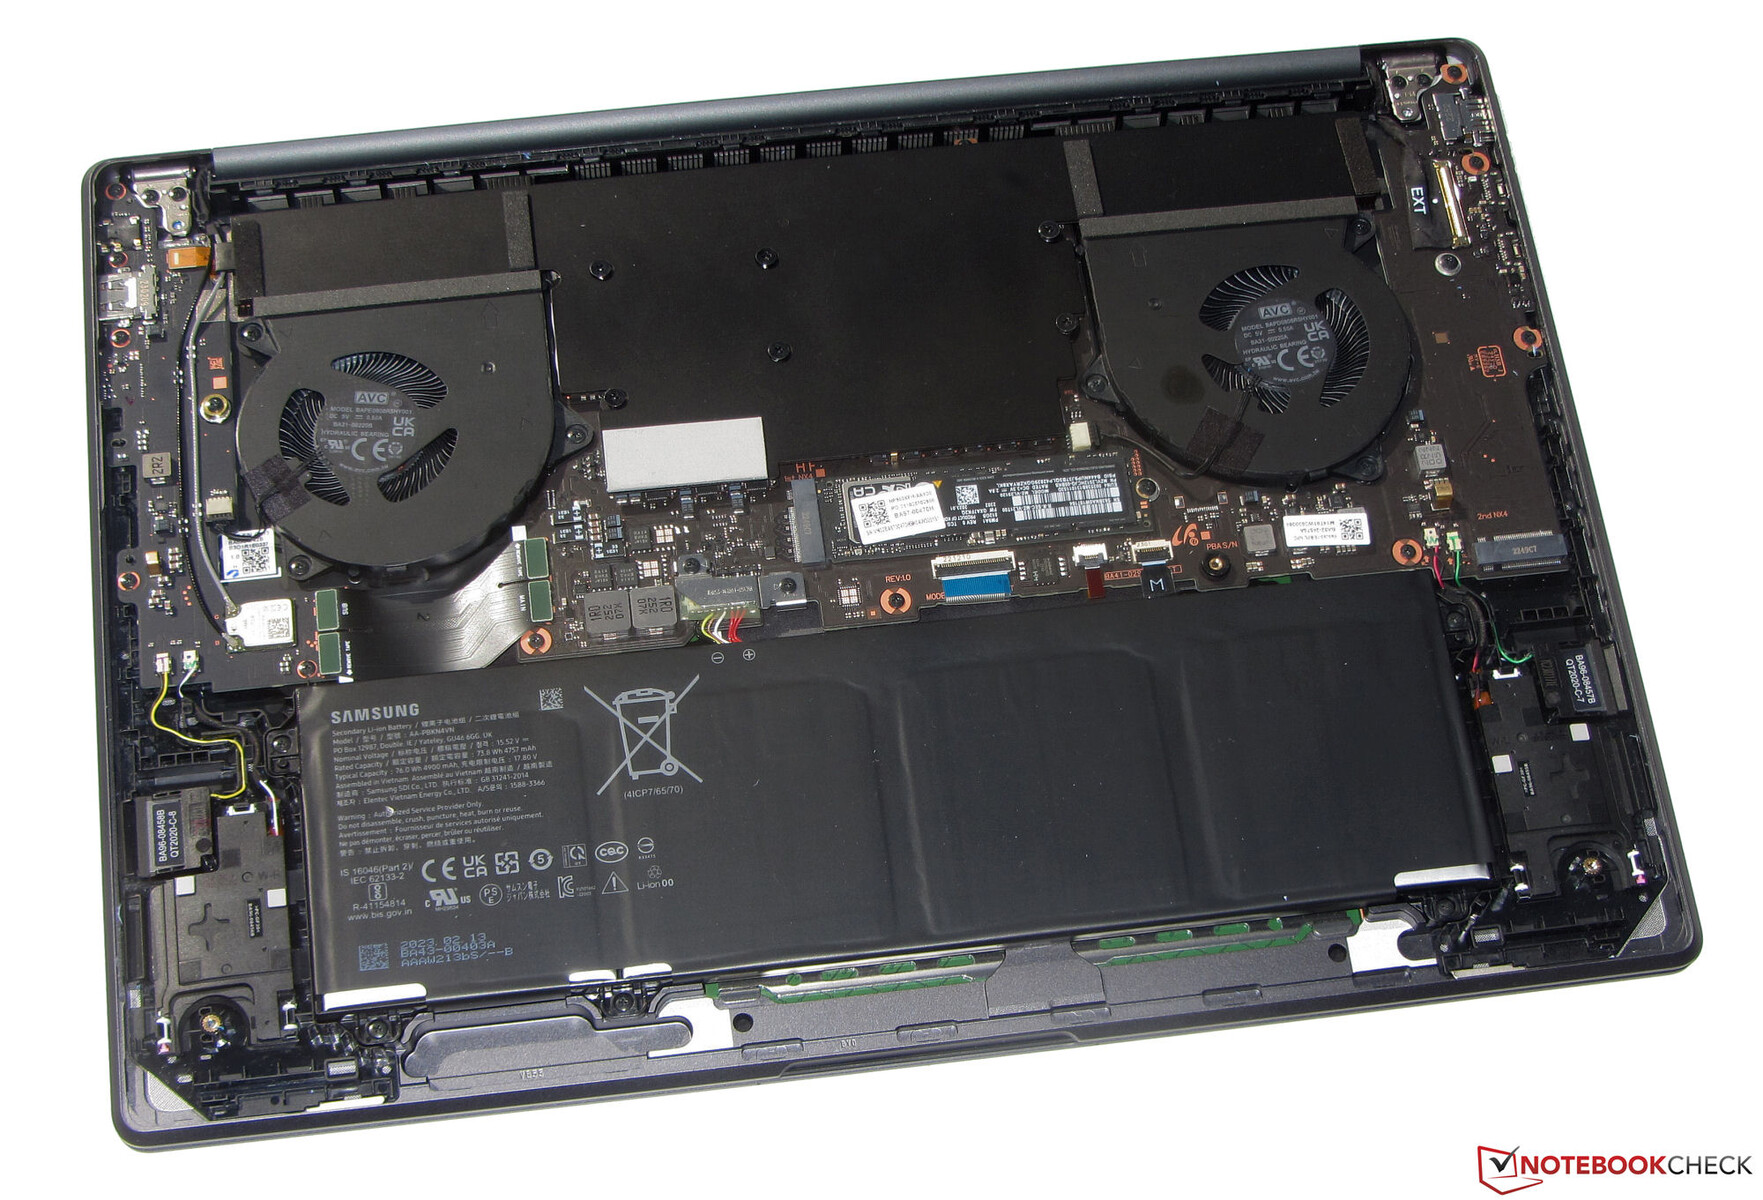
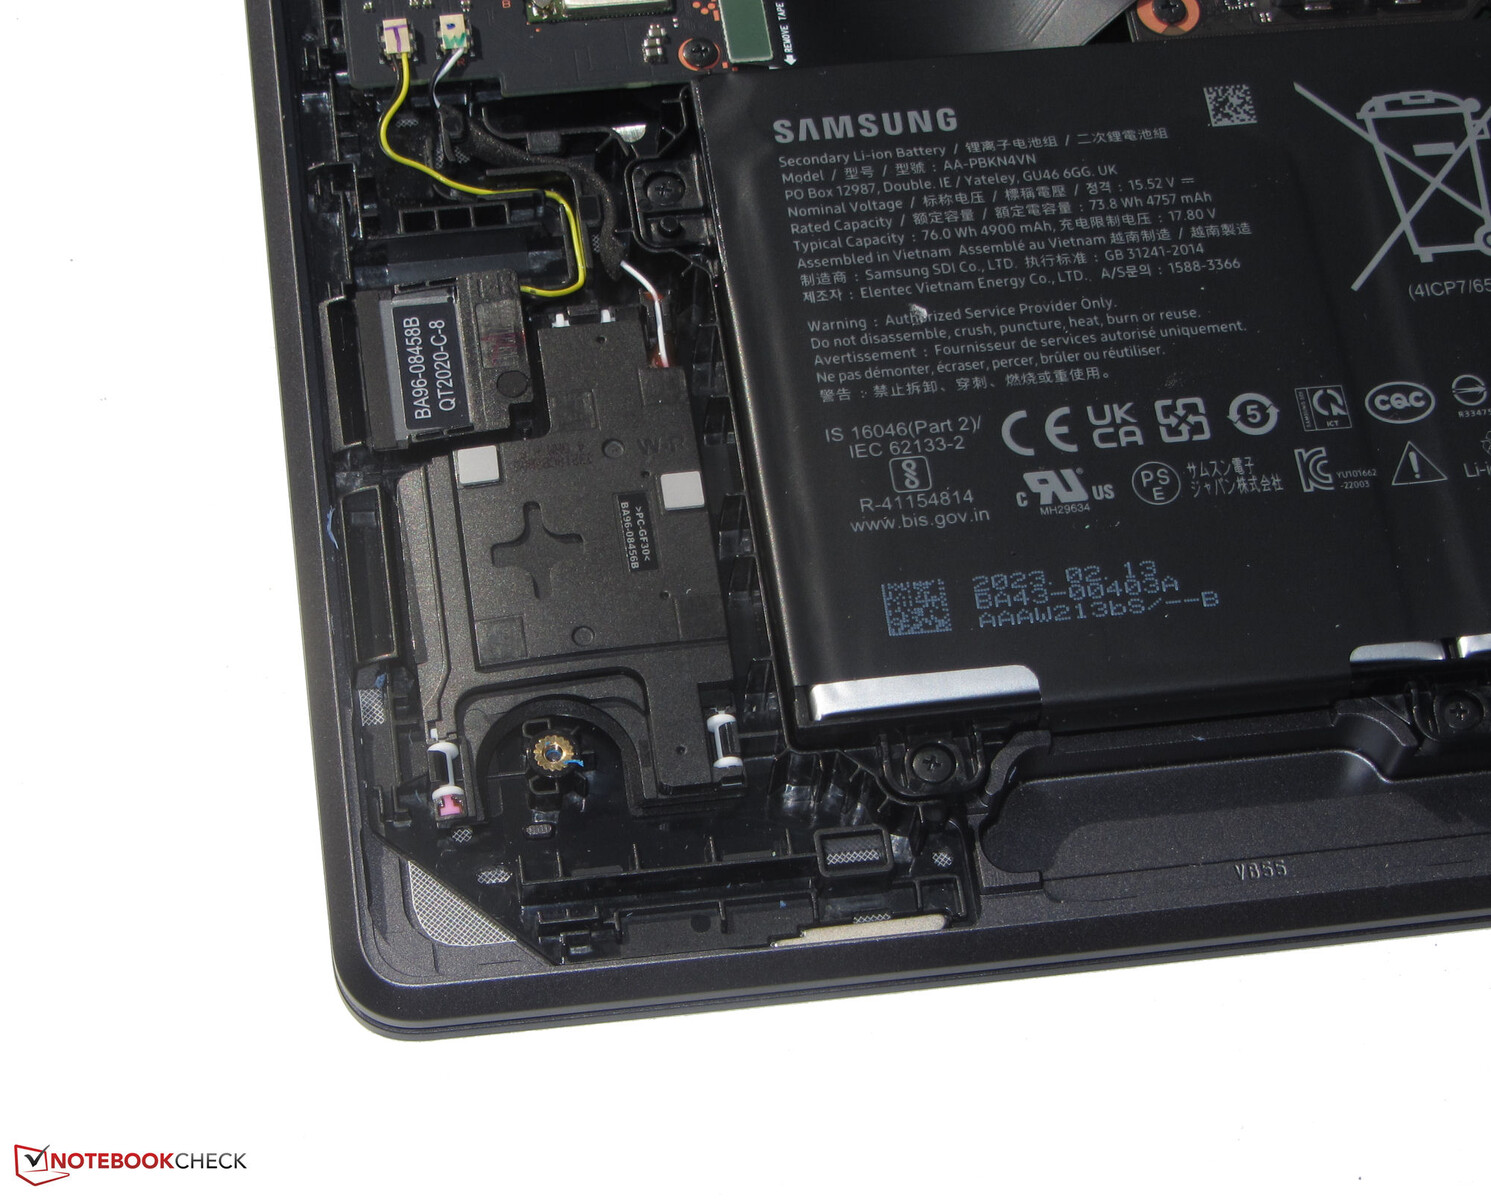
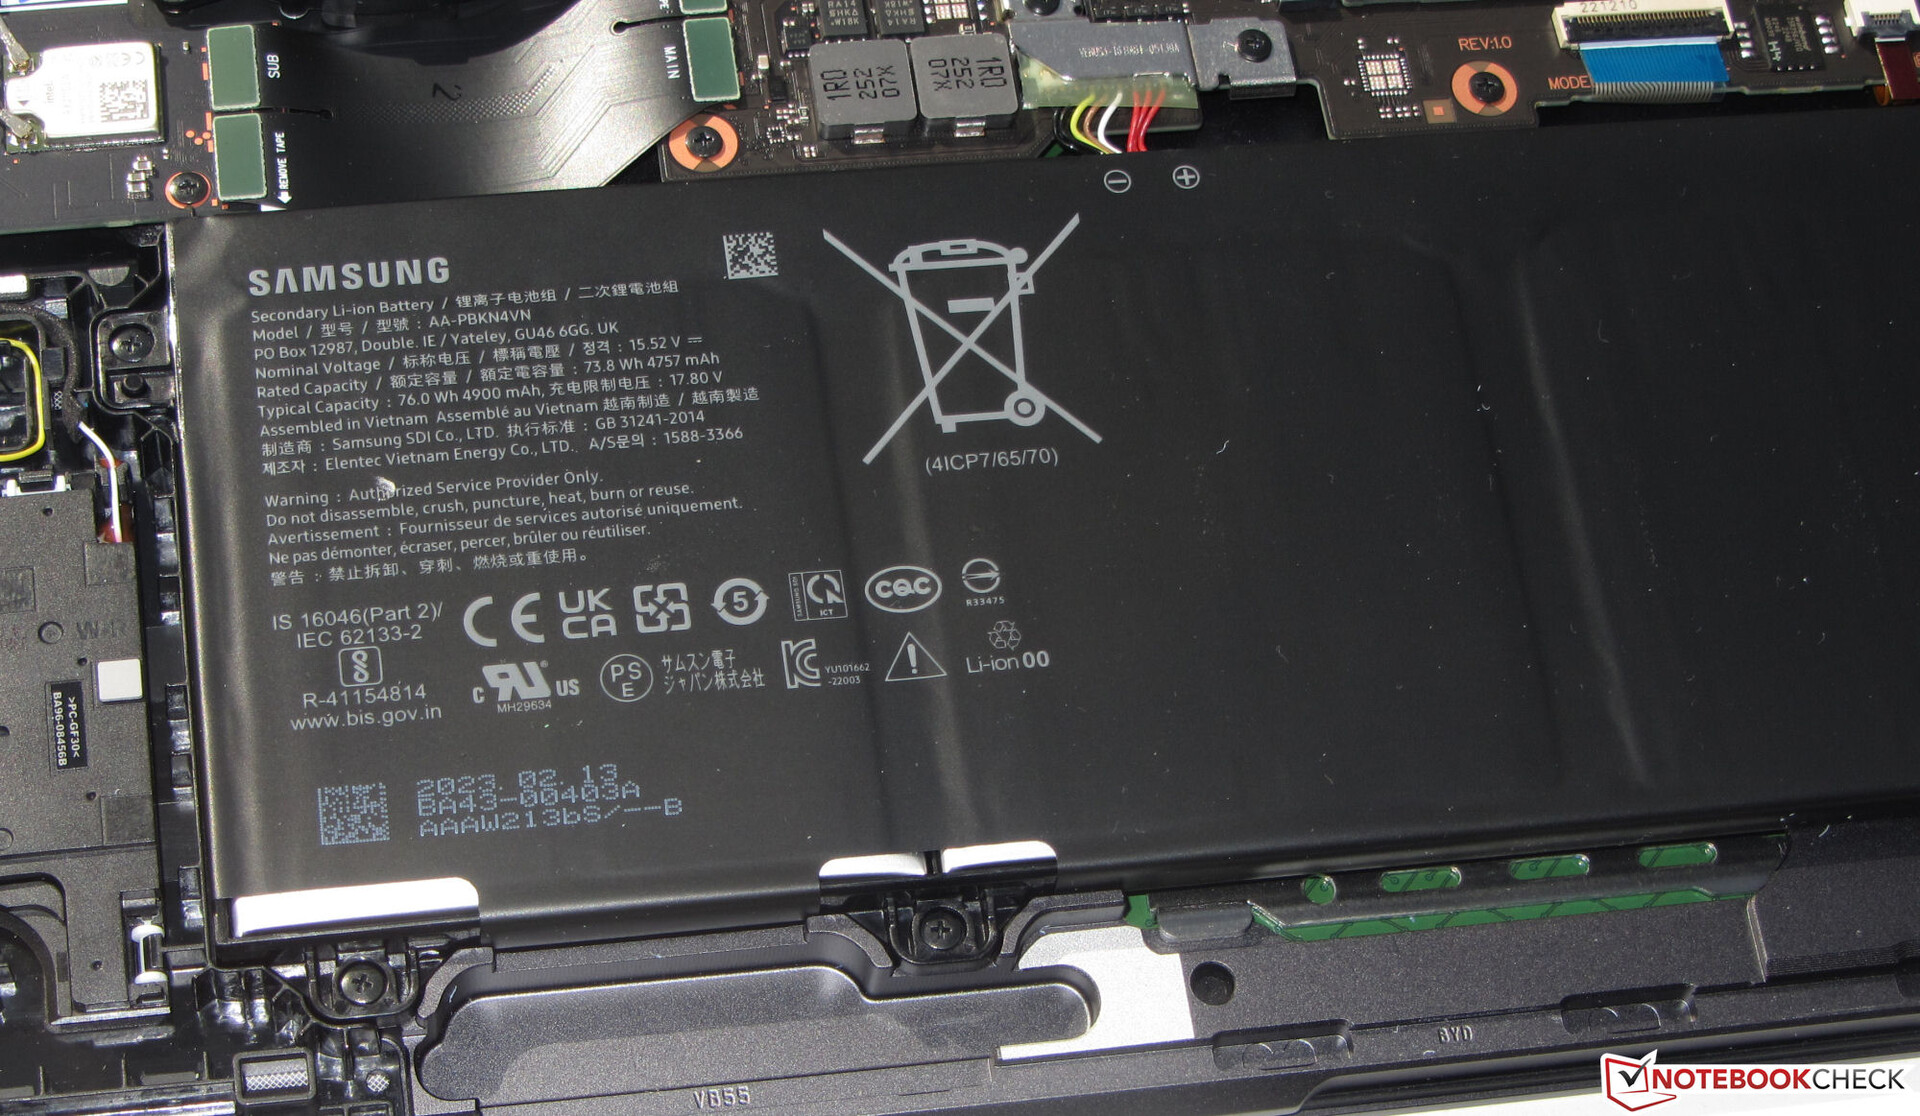
Samsung använder ett grå-svart (grafit) aluminiumhölje med släta, matta ytor. Den chic-eleganta datorn har inga iögonfallande designfunktioner och behöver inte heller några sådana. Batteriet (skruvat, inte limmat) och de andra interna komponenterna är tillgängliga efter att man tagit bort bottenskalet.
Den bärbara datorn är av bra utförande. Spaltmåtten är jämna och inga materialutsprång finns att hitta. Basenheten och locket kan endast vridas i mycket liten utsträckning. Gångjärnen håller locket stadigt på plats och den maximala öppningsvinkeln är cirka 125 grader. Öppning med en hand är möjlig.

Galaxy Book3 tillhör i grunden kategorin kompakta och lätta bärbara datorer. Den hamnar dock i mitten av jämförelsefältet. Dess direkta konkurrent, den Schenker Vision 16 Pro, är lite mer kompakt och lättare. Ingen bärbar dator kan mäta sig med den låga vikten (1,4 kg) hos LG Gram 17.
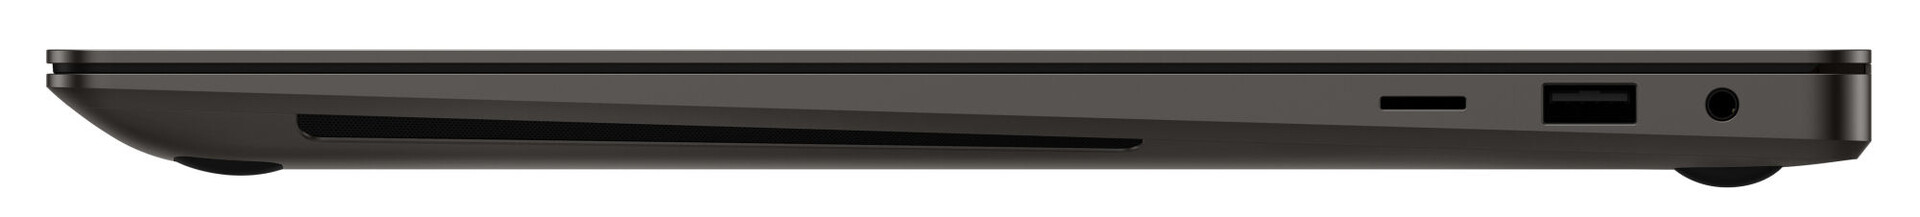
Utrustning - Samsung installerar Thunderbolt 4 i Ultra 16
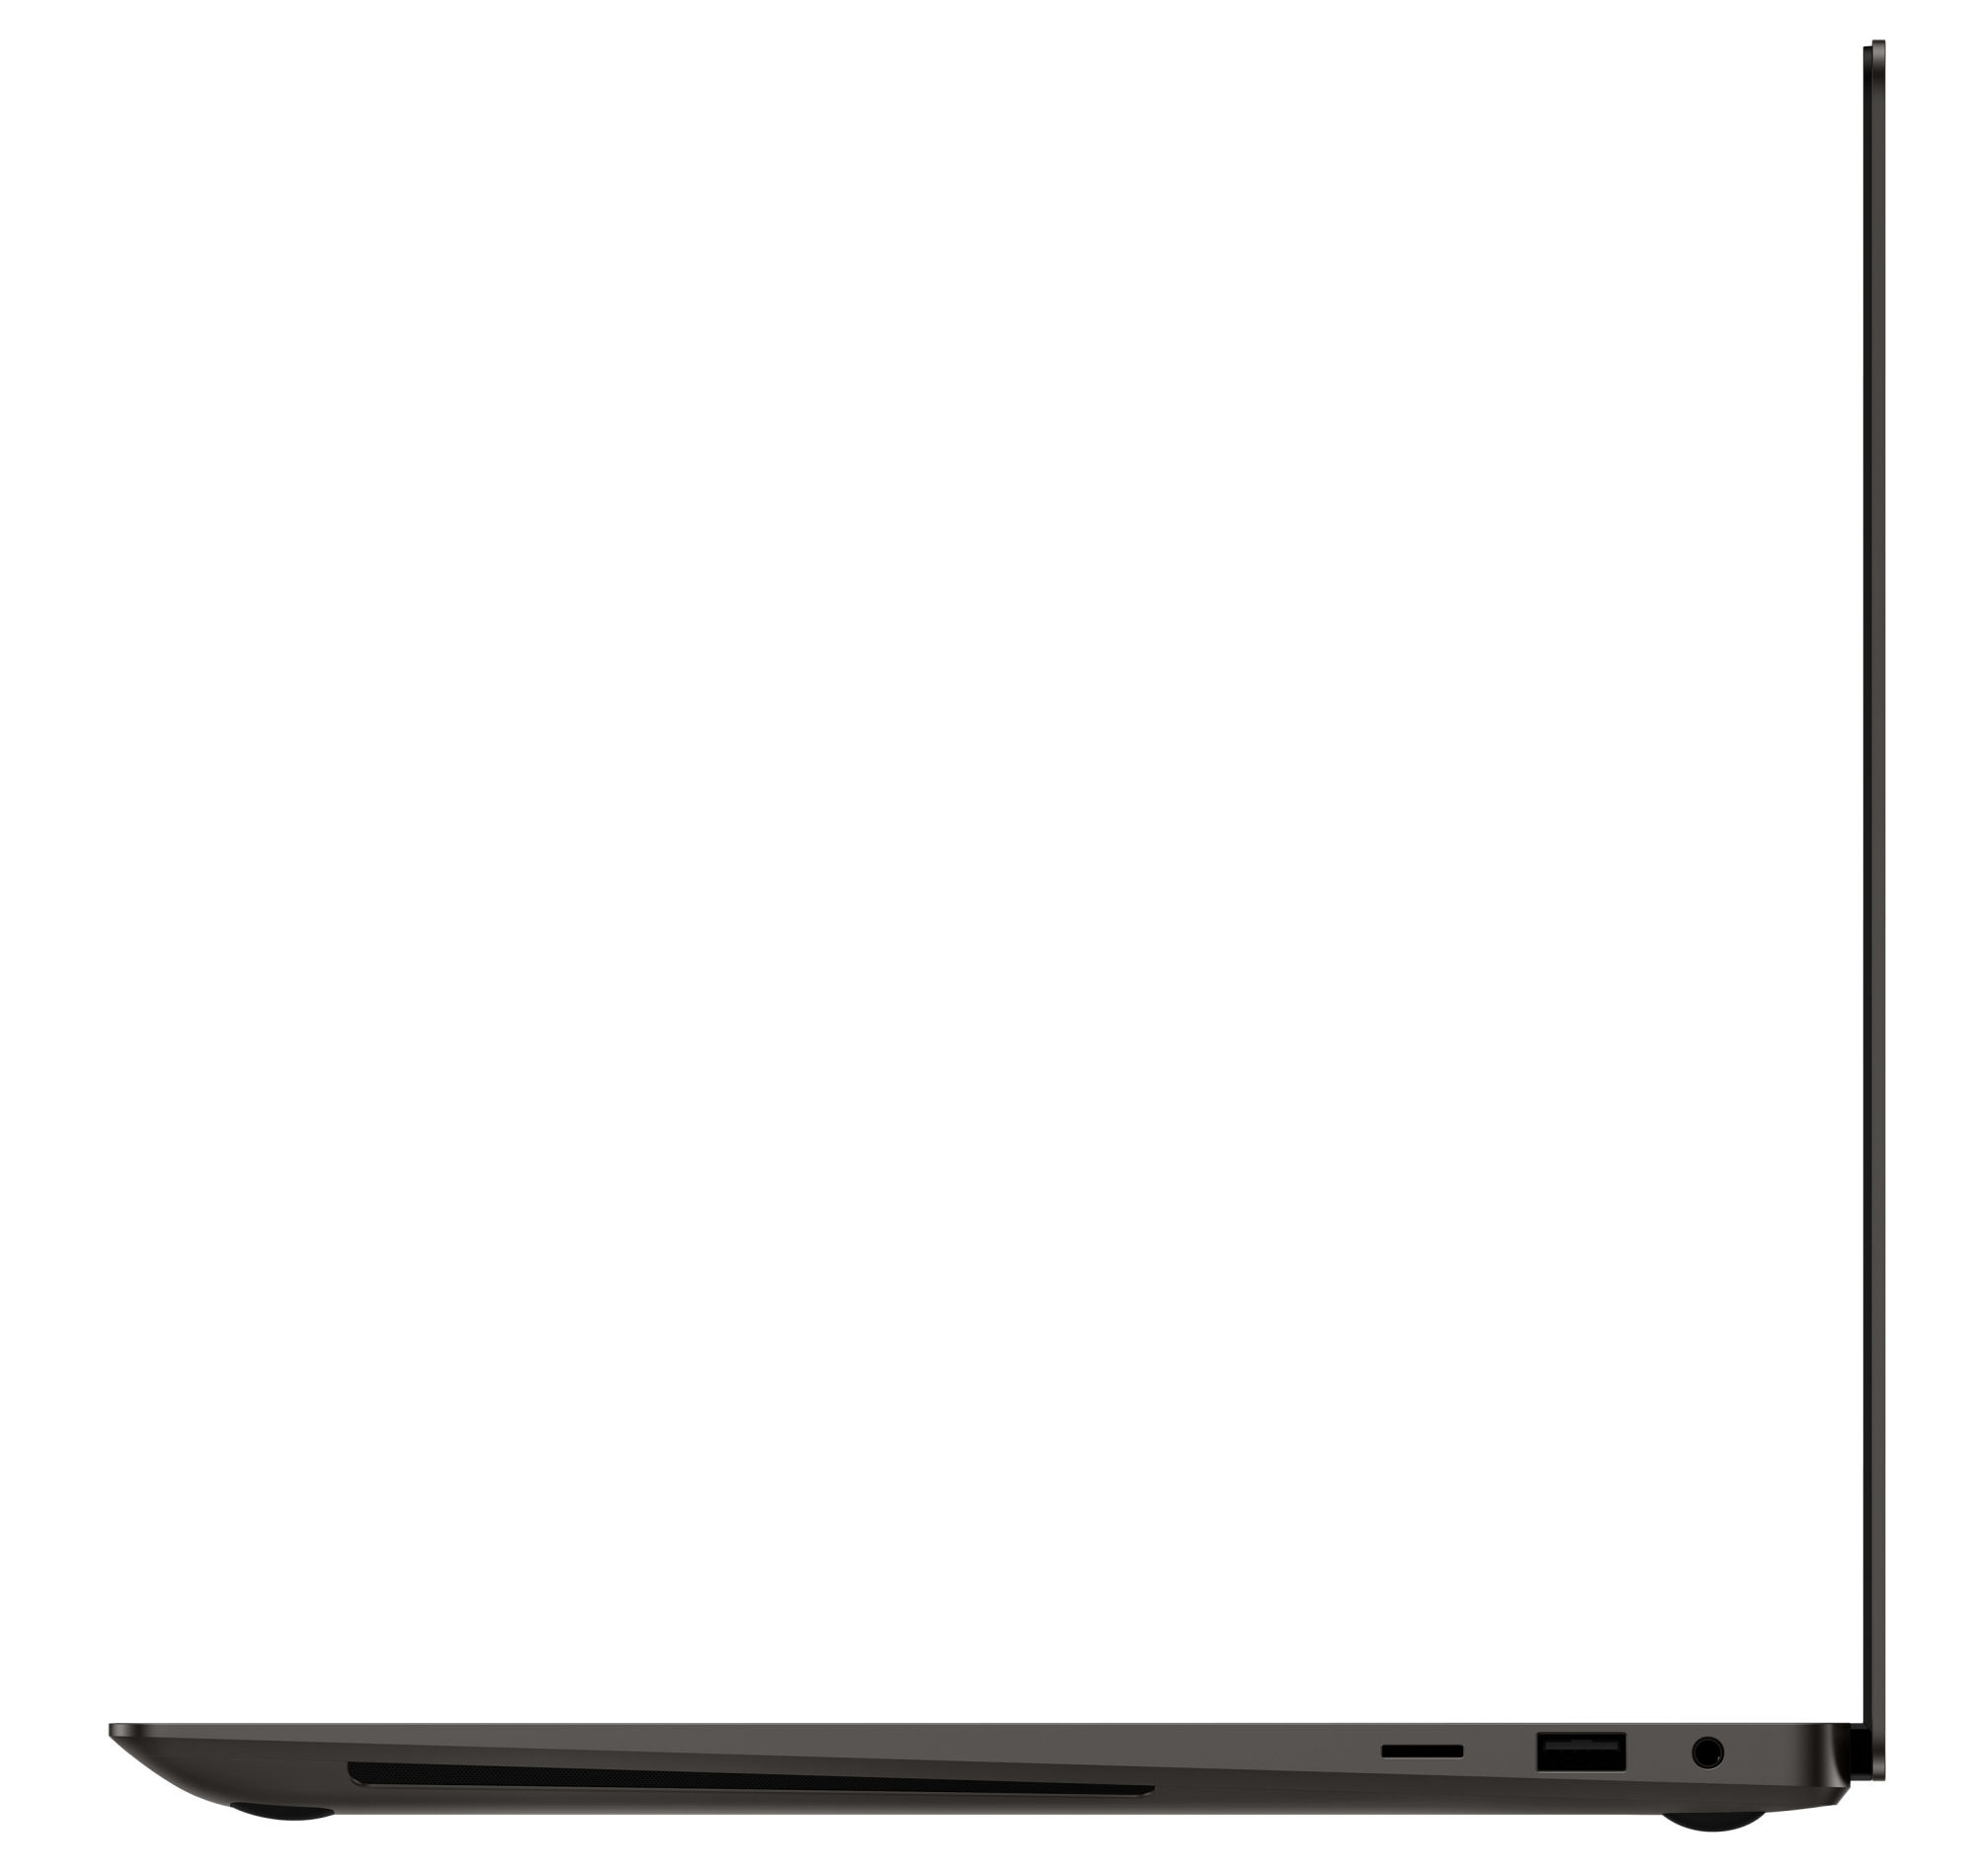
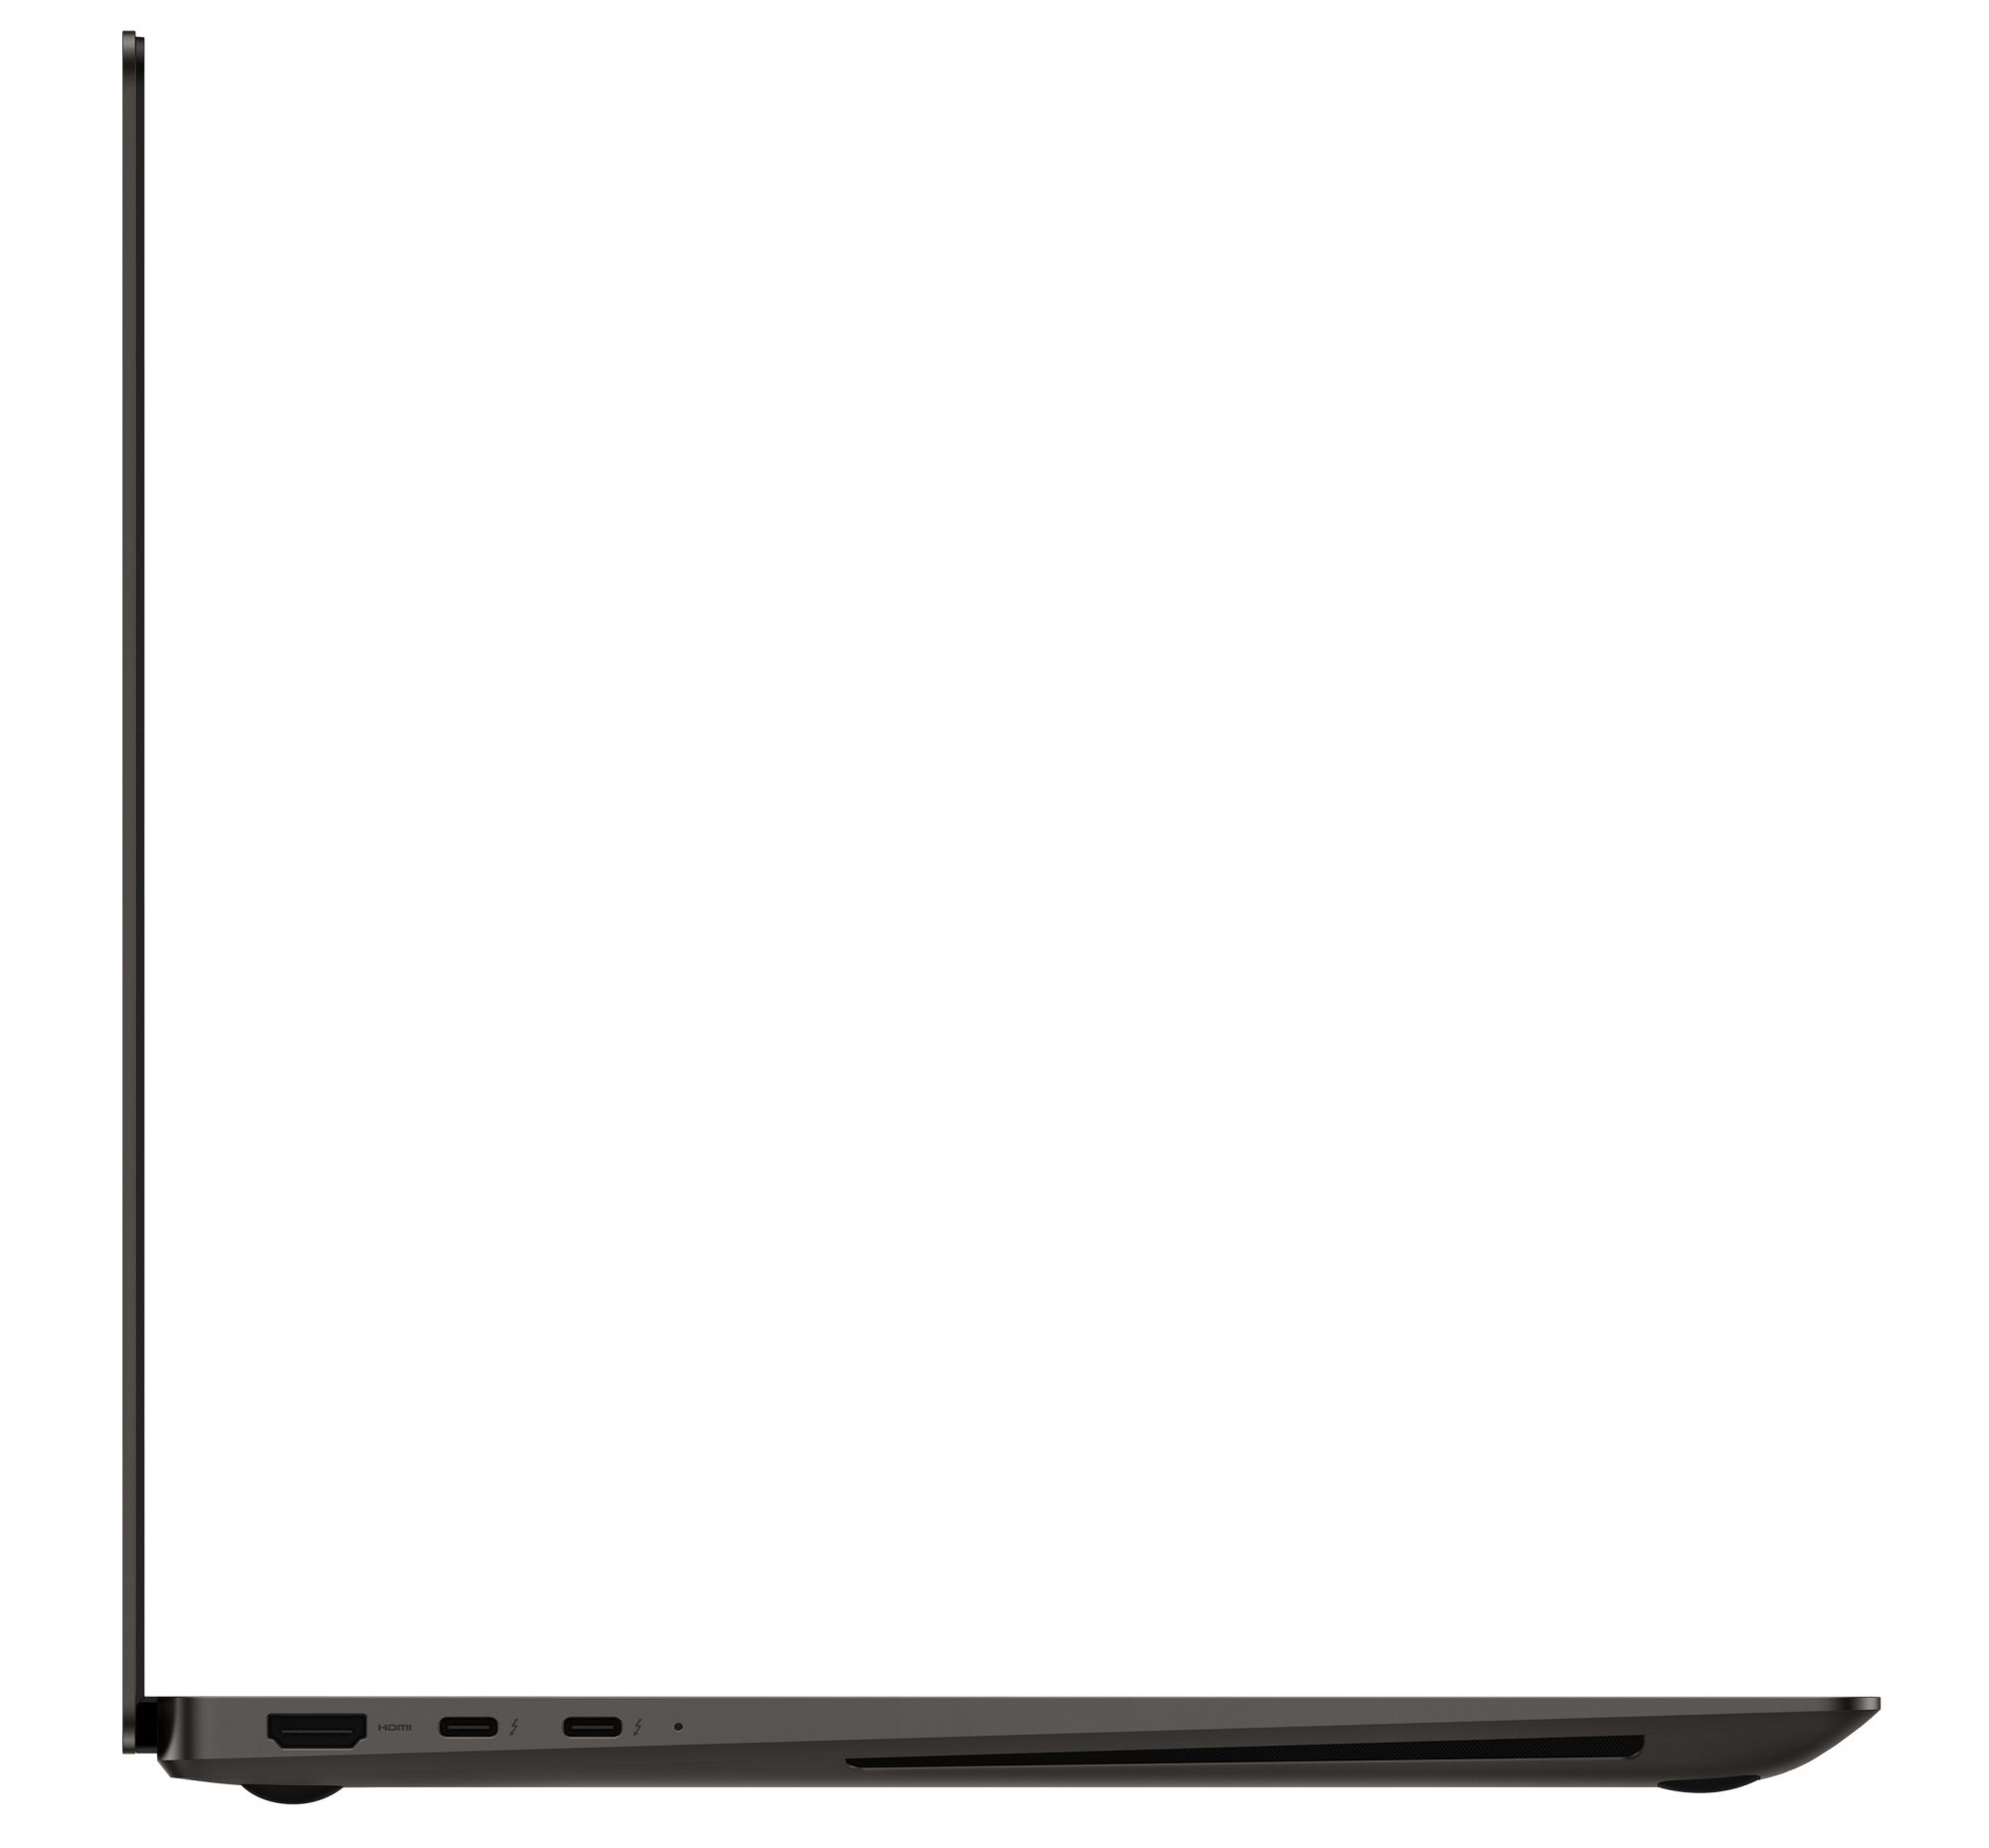
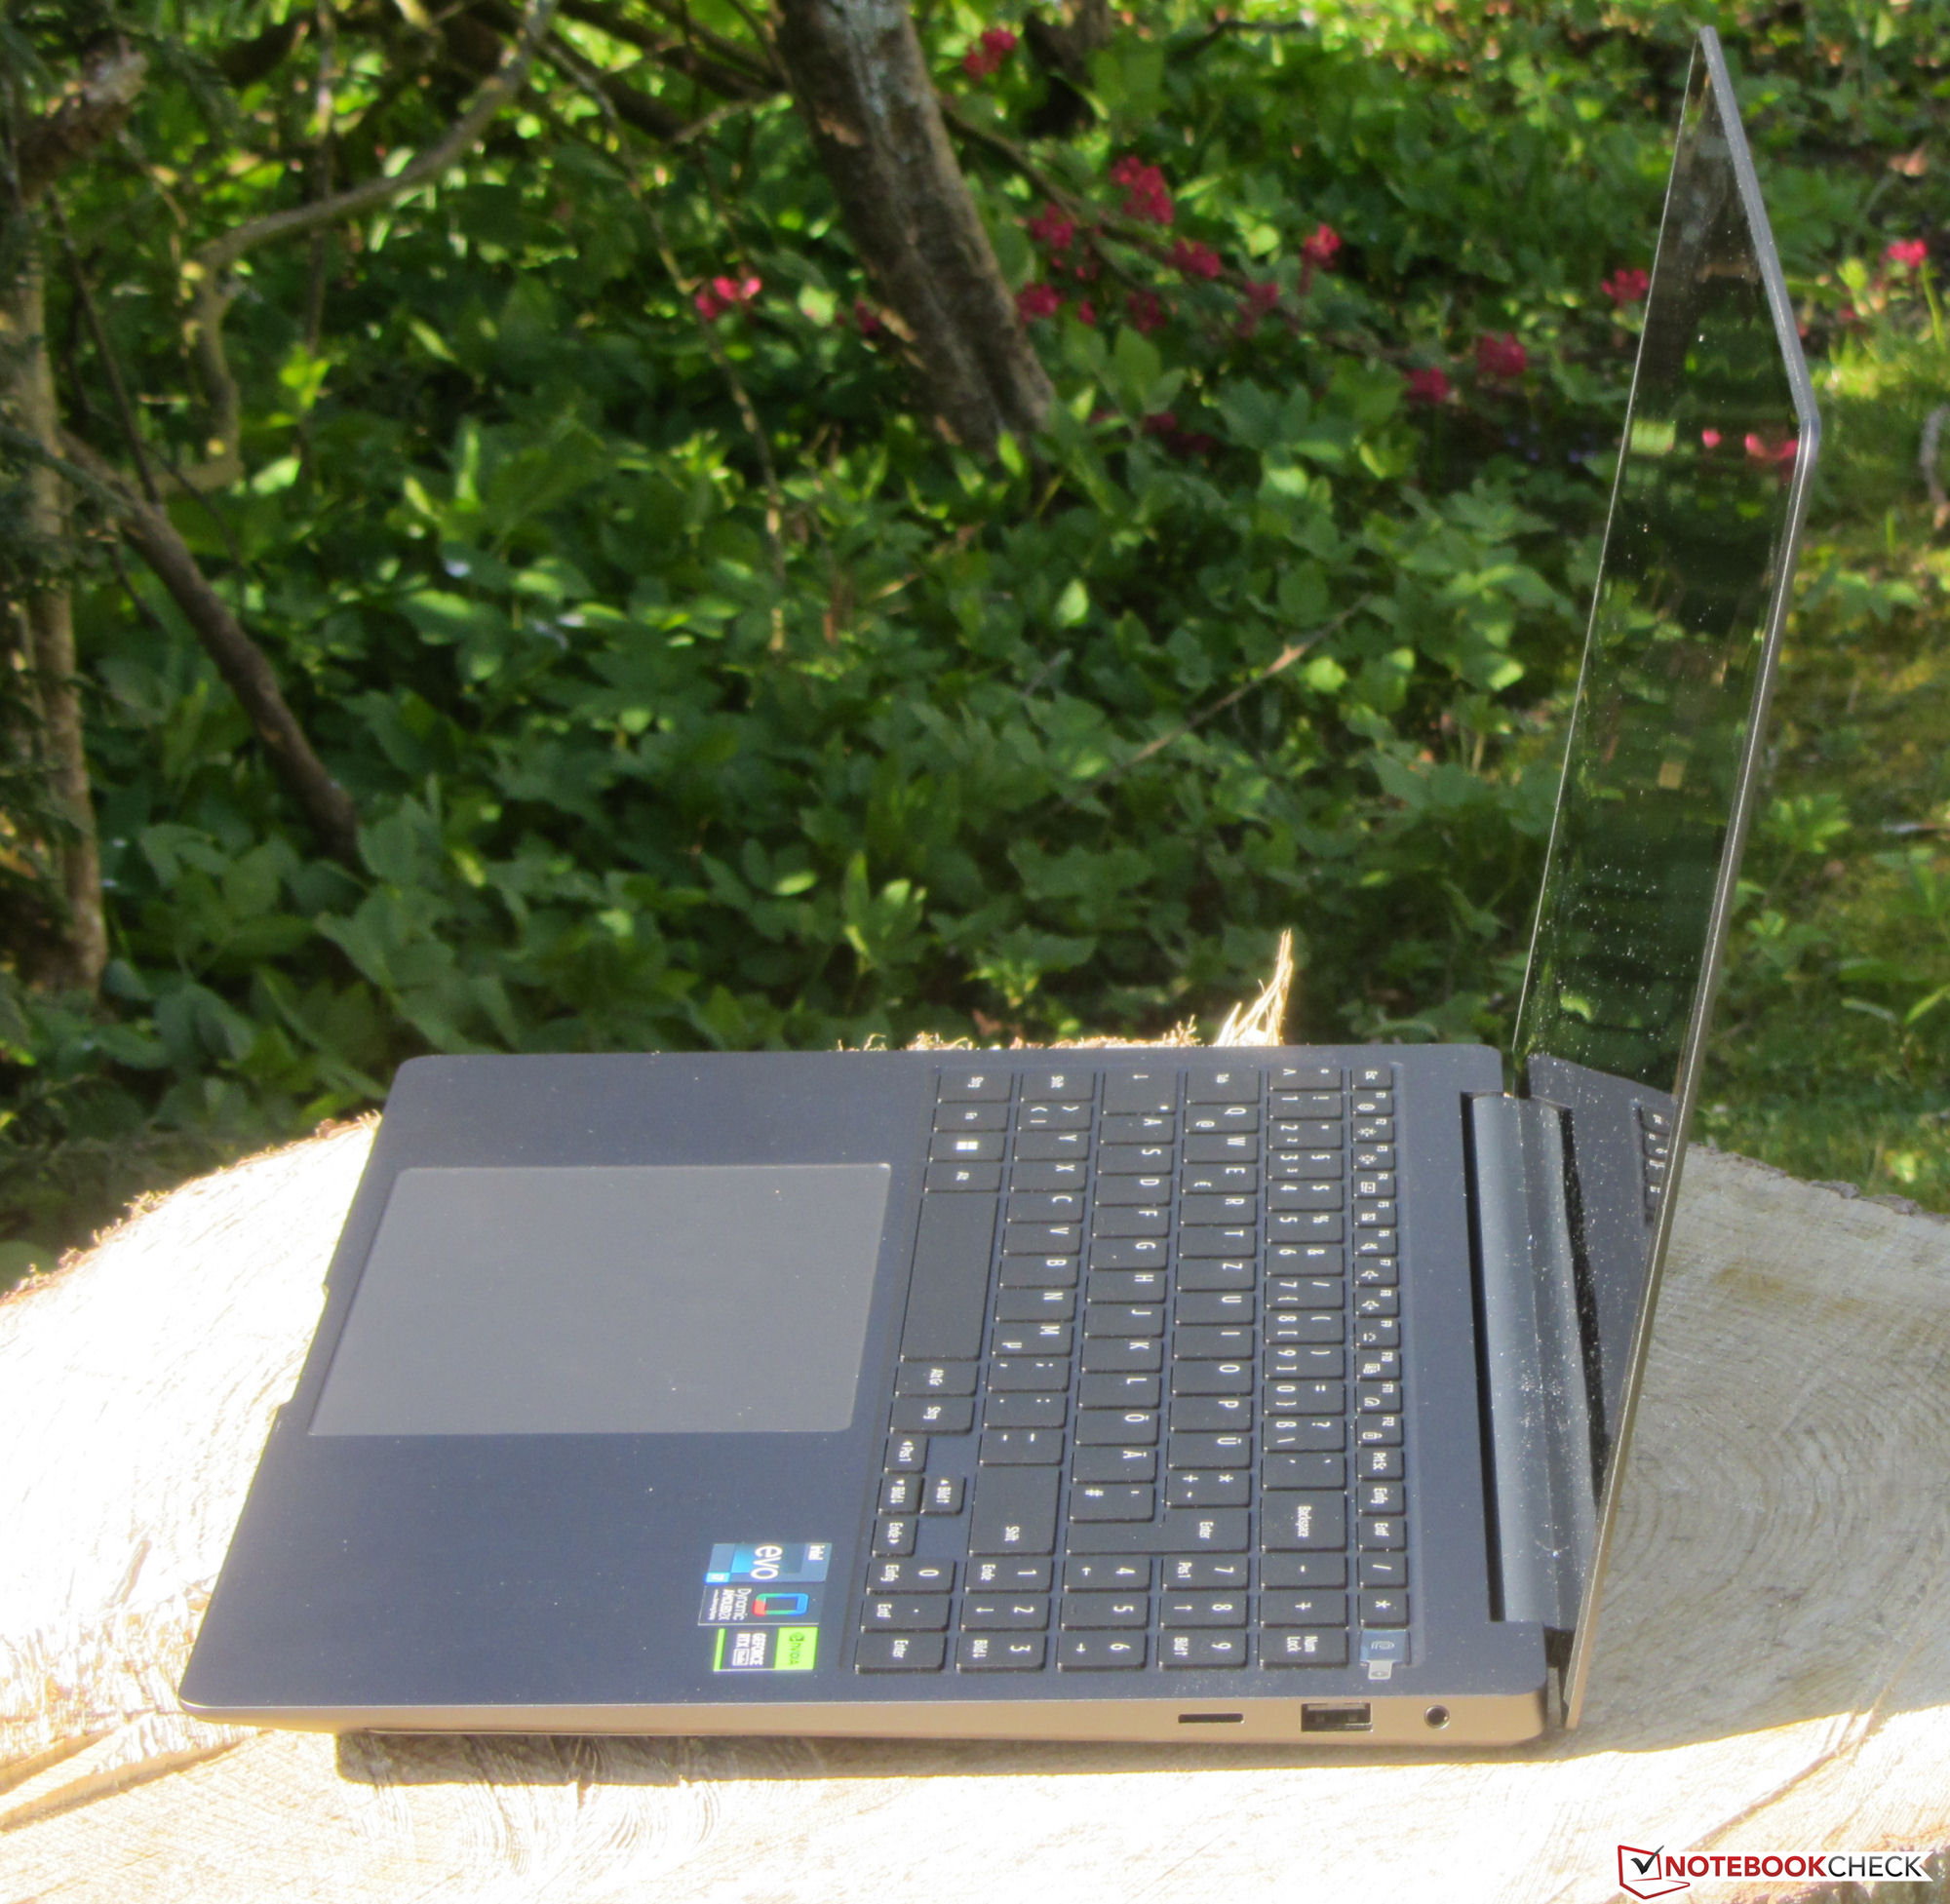
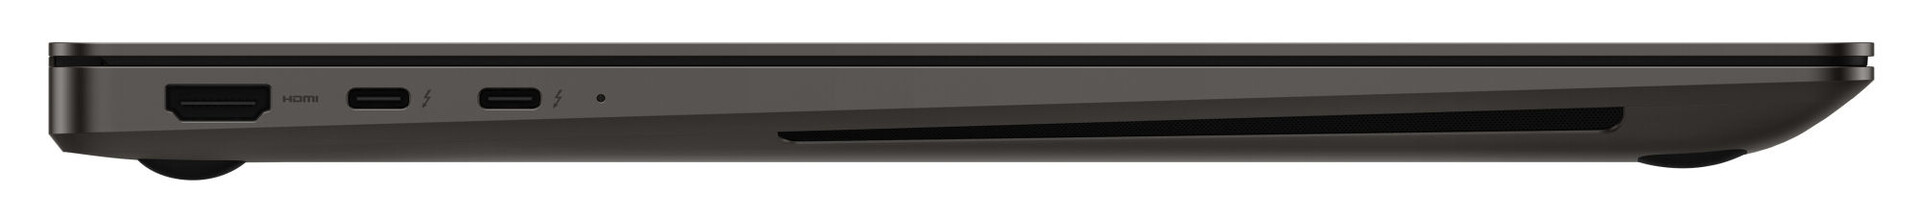
Den bärbara datorn har en USB-A-port (USB 3.2 Gen 1) och två USB-C-portar (Thunderbolt 4). Den sistnämnda kan förse den bärbara datorn med ström (Power Delivery) och även ge ut DisplayPort. Det finns totalt tre videoutgångar (2x DP, 1x HDMI). Saknade portar kan läggas till med en dockningsstation.
Portarna är placerade i de bakre områdena på höger och vänster sida, så utrymmet bredvid handflatsstödet förblir fritt från kablar. En nackdel: alla videoutgångar och strömanslutningar finns på vänster sida. Att installera Thunderbolt 4 på båda sidorna hade varit vettigt här.
SD-kortläsare
MicroSD-minneskortläsaren (referenskort: AV PRO microSD 128 GB V60) hör till de medelstarka modellerna med en maximal överföringshastighet på 74 MB/s (överföring av 250 jpg-bildfiler på cirka 5 MB vardera) och 83 MB/s (kopiering av stora datablock).
| SD Card Reader | |
| average JPG Copy Test (av. of 3 runs) | |
| Dell XPS 15 9520 RTX 3050 Ti (Toshiba Exceria Pro SDXC 64 GB UHS-II) | |
| Genomsnitt av klass Multimedia (23 - 531, n=37, senaste 2 åren) | |
| Schenker Vision 16 Pro RTX 3070 Ti (AV Pro V60) | |
| Lenovo ThinkBook 16p G3 ARH (AV PRO microSD 128 GB V60) | |
| LG Gram 17Z90Q-E.AD78G (AV Pro SD microSD 128 GB V60) | |
| Samsung Galaxy Book3 Ultra 16 (AV PRO microSD 128 GB V60) | |
| Asus VivoBook Pro 16X OLED N7600PC-L2026X | |
| maximum AS SSD Seq Read Test (1GB) | |
| Genomsnitt av klass Multimedia (37.3 - 1455, n=36, senaste 2 åren) | |
| Dell XPS 15 9520 RTX 3050 Ti (Toshiba Exceria Pro SDXC 64 GB UHS-II) | |
| LG Gram 17Z90Q-E.AD78G (AV Pro SD microSD 128 GB V60) | |
| Lenovo ThinkBook 16p G3 ARH (AV PRO microSD 128 GB V60) | |
| Samsung Galaxy Book3 Ultra 16 (AV PRO microSD 128 GB V60) | |
| Schenker Vision 16 Pro RTX 3070 Ti (AV Pro V60) | |
| Asus VivoBook Pro 16X OLED N7600PC-L2026X | |
Kommunikation
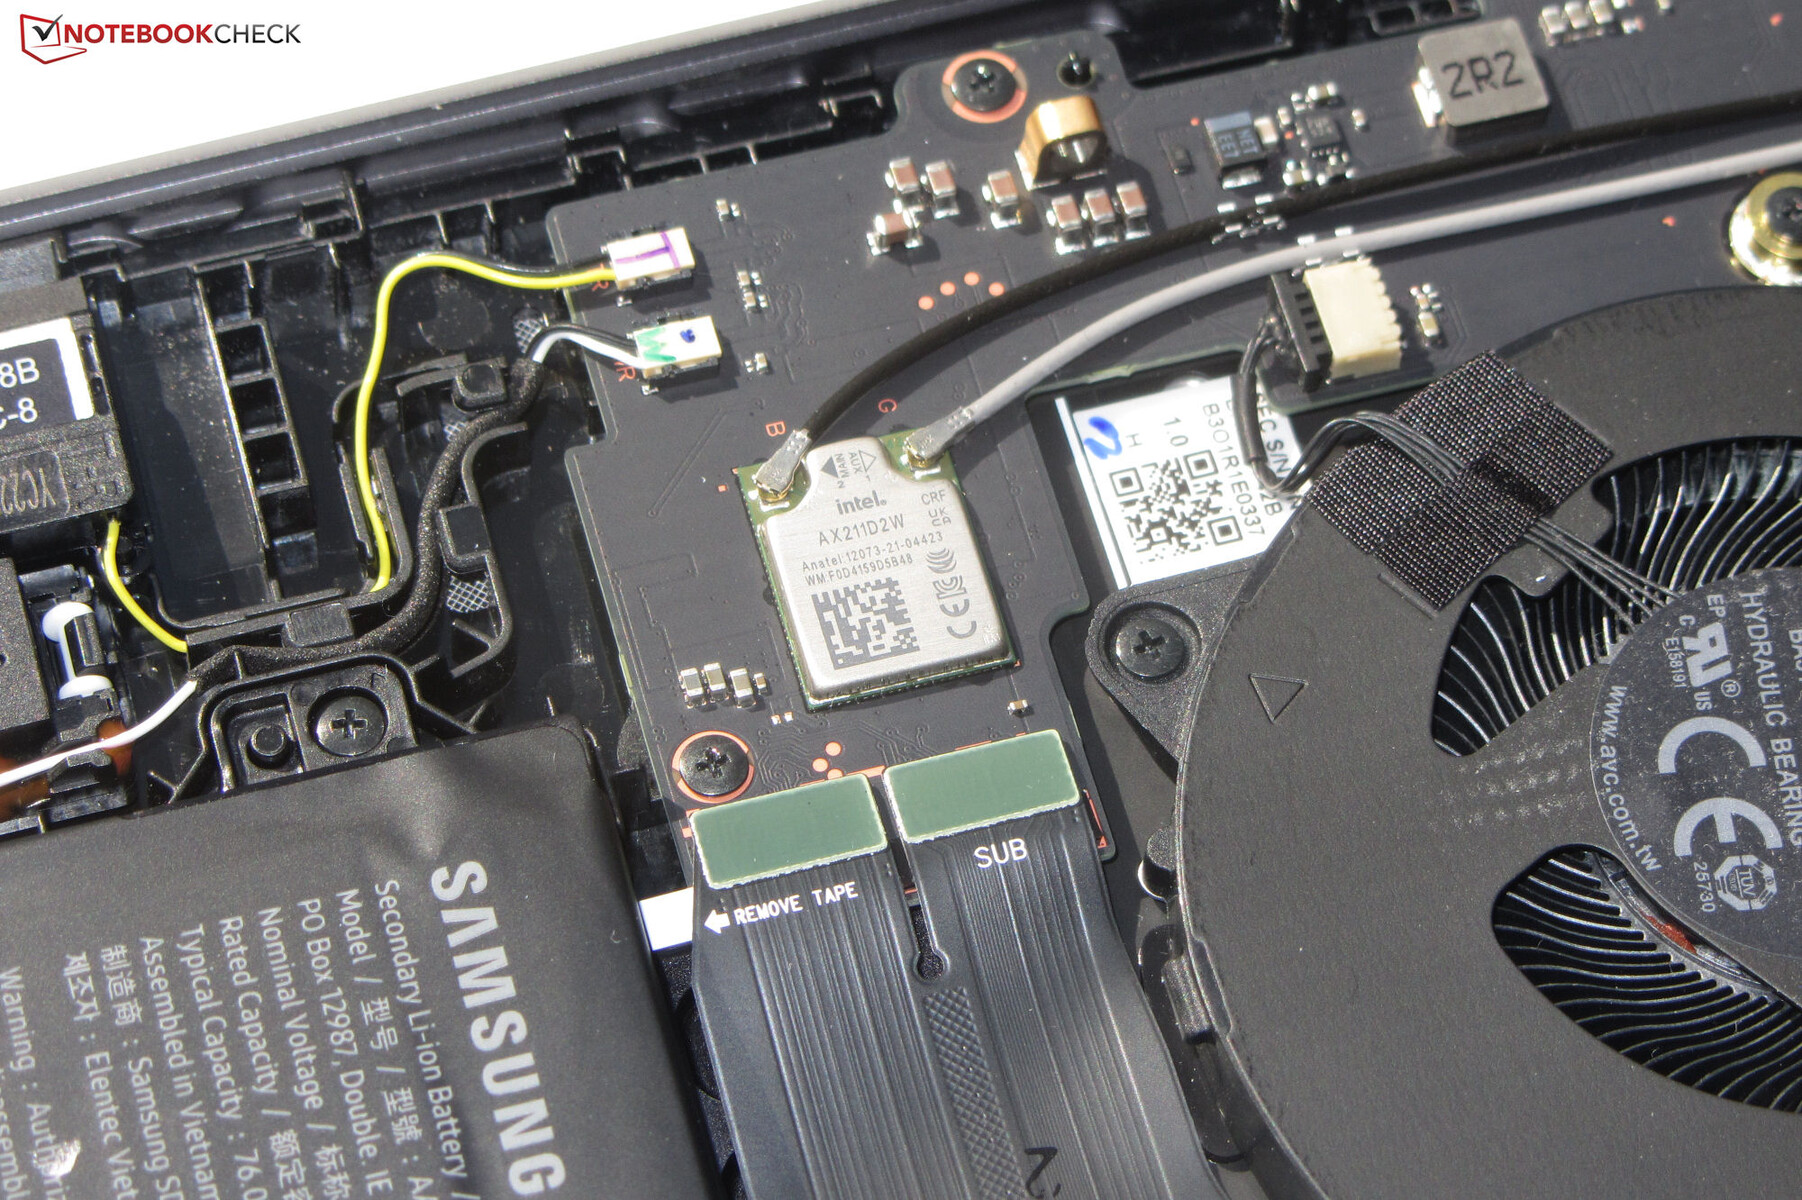
Utmärkta WiFi-datahastigheter uppnås under optimala förhållanden (inga WLAN-enheter i närheten, litet avstånd mellan bärbar dator och serverdator). Samsungs bärbara dator har ett WiFi 6E-chip (Intel AX211) ombord. Det finns ingen Ethernet-plats.
Webbkamera
Webbkameran (2,1 MP, max. 1 920 x 1 080) har ingen mekanisk slutare. Kvalitativt sett är det standard. Färgnoggrannheten är ett problem, eftersom målet (DeltaE mindre än 3) missas med en färgavvikelse på nästan 8.


Tillbehör
Förutom de vanliga dokumenten (garantiinformation, snabbstartguide) levereras den bärbara datorn inte med några andra tillbehör.
Underhåll
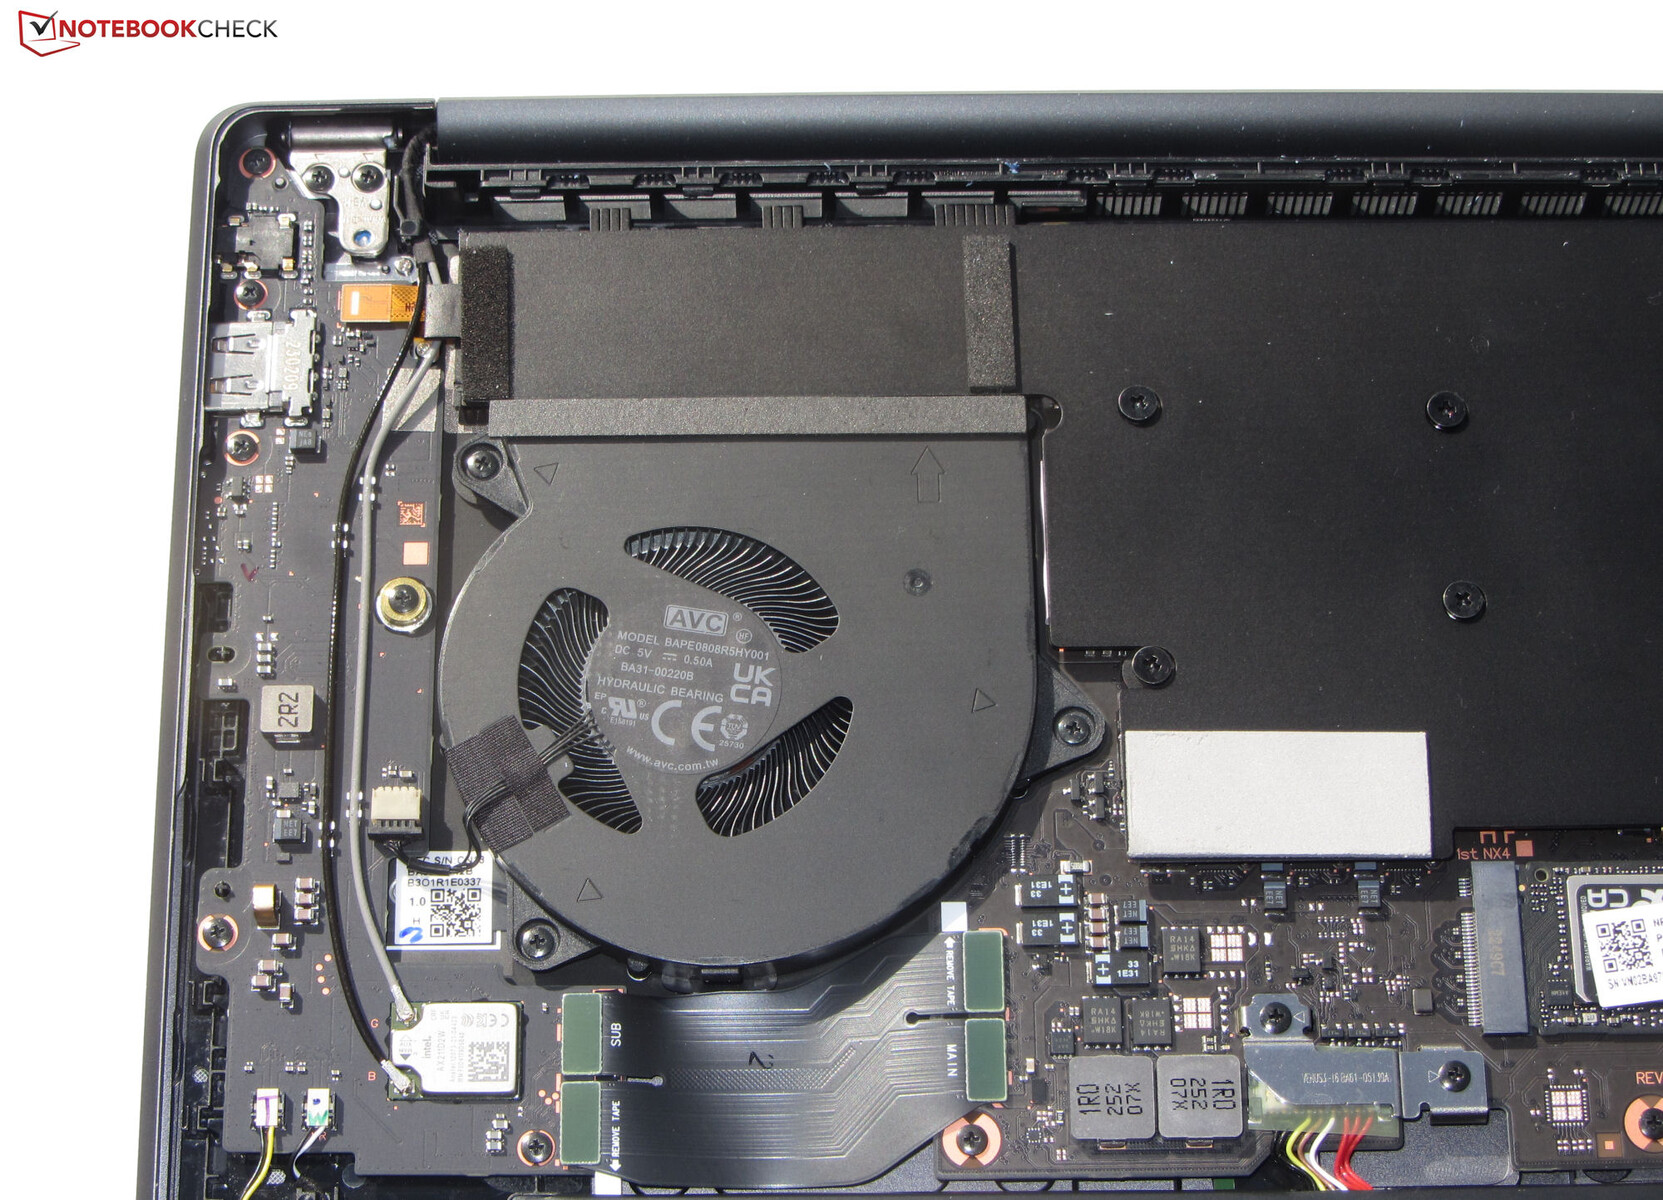
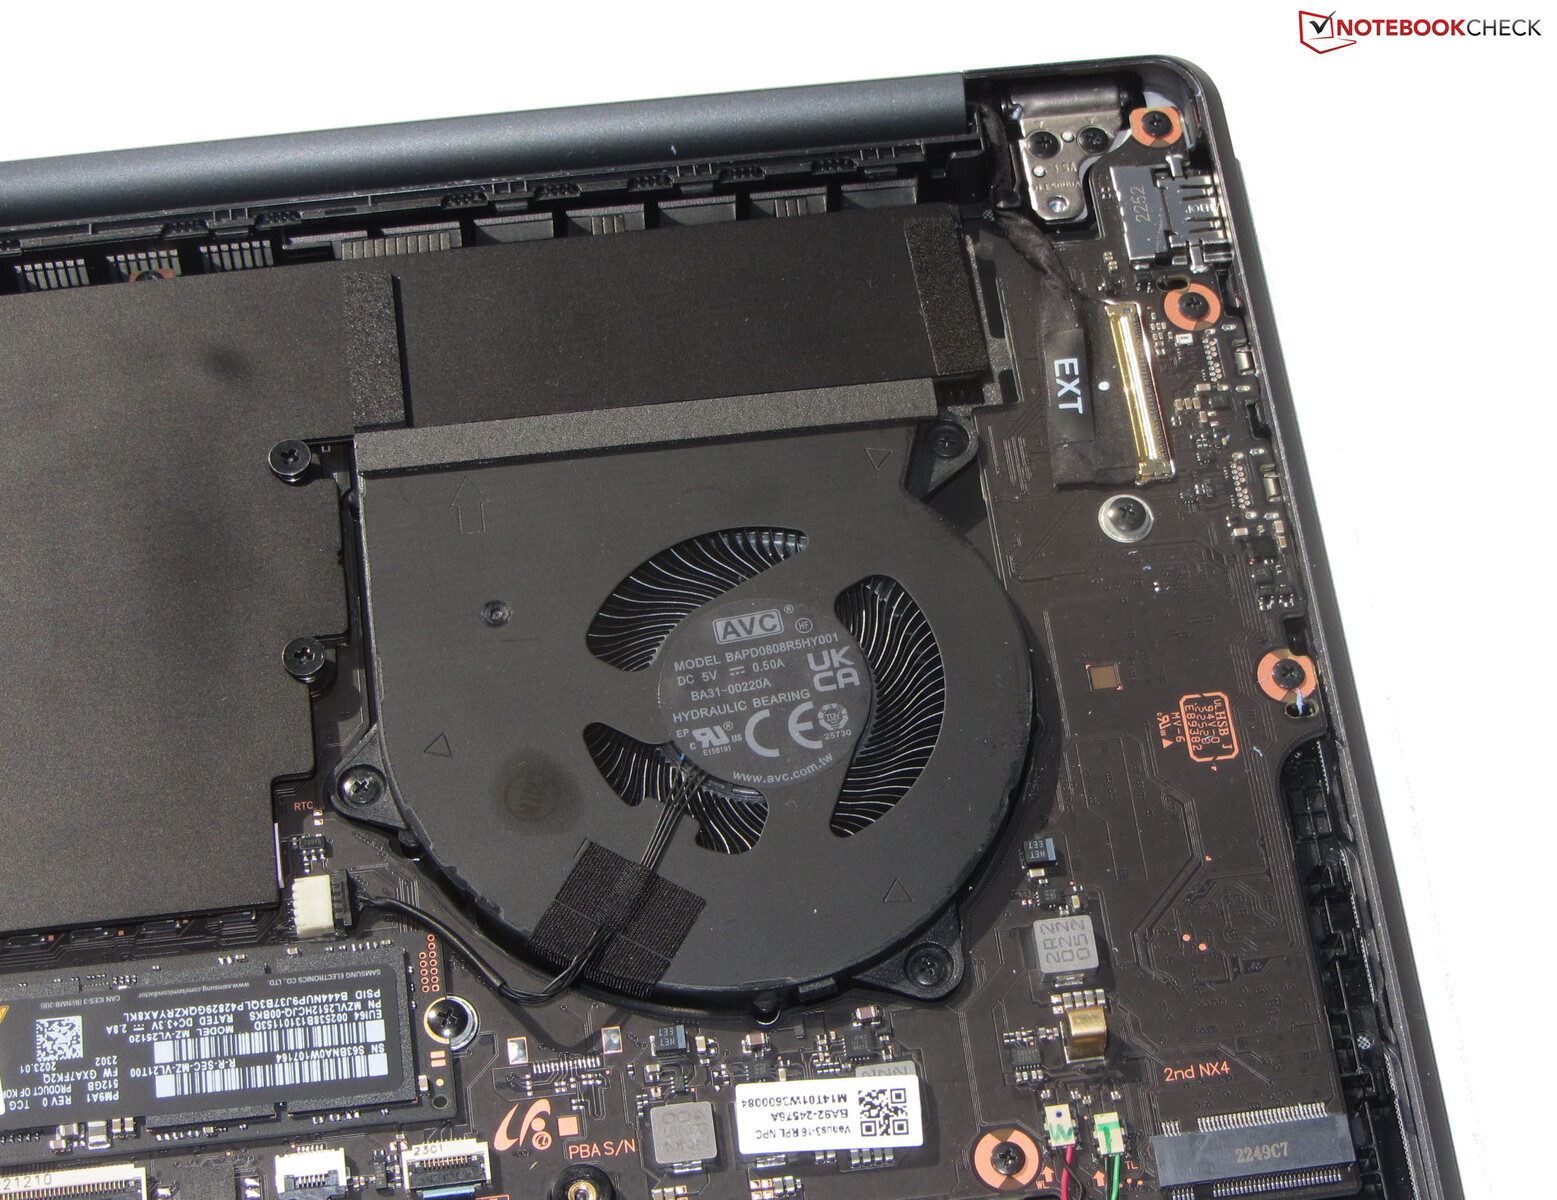
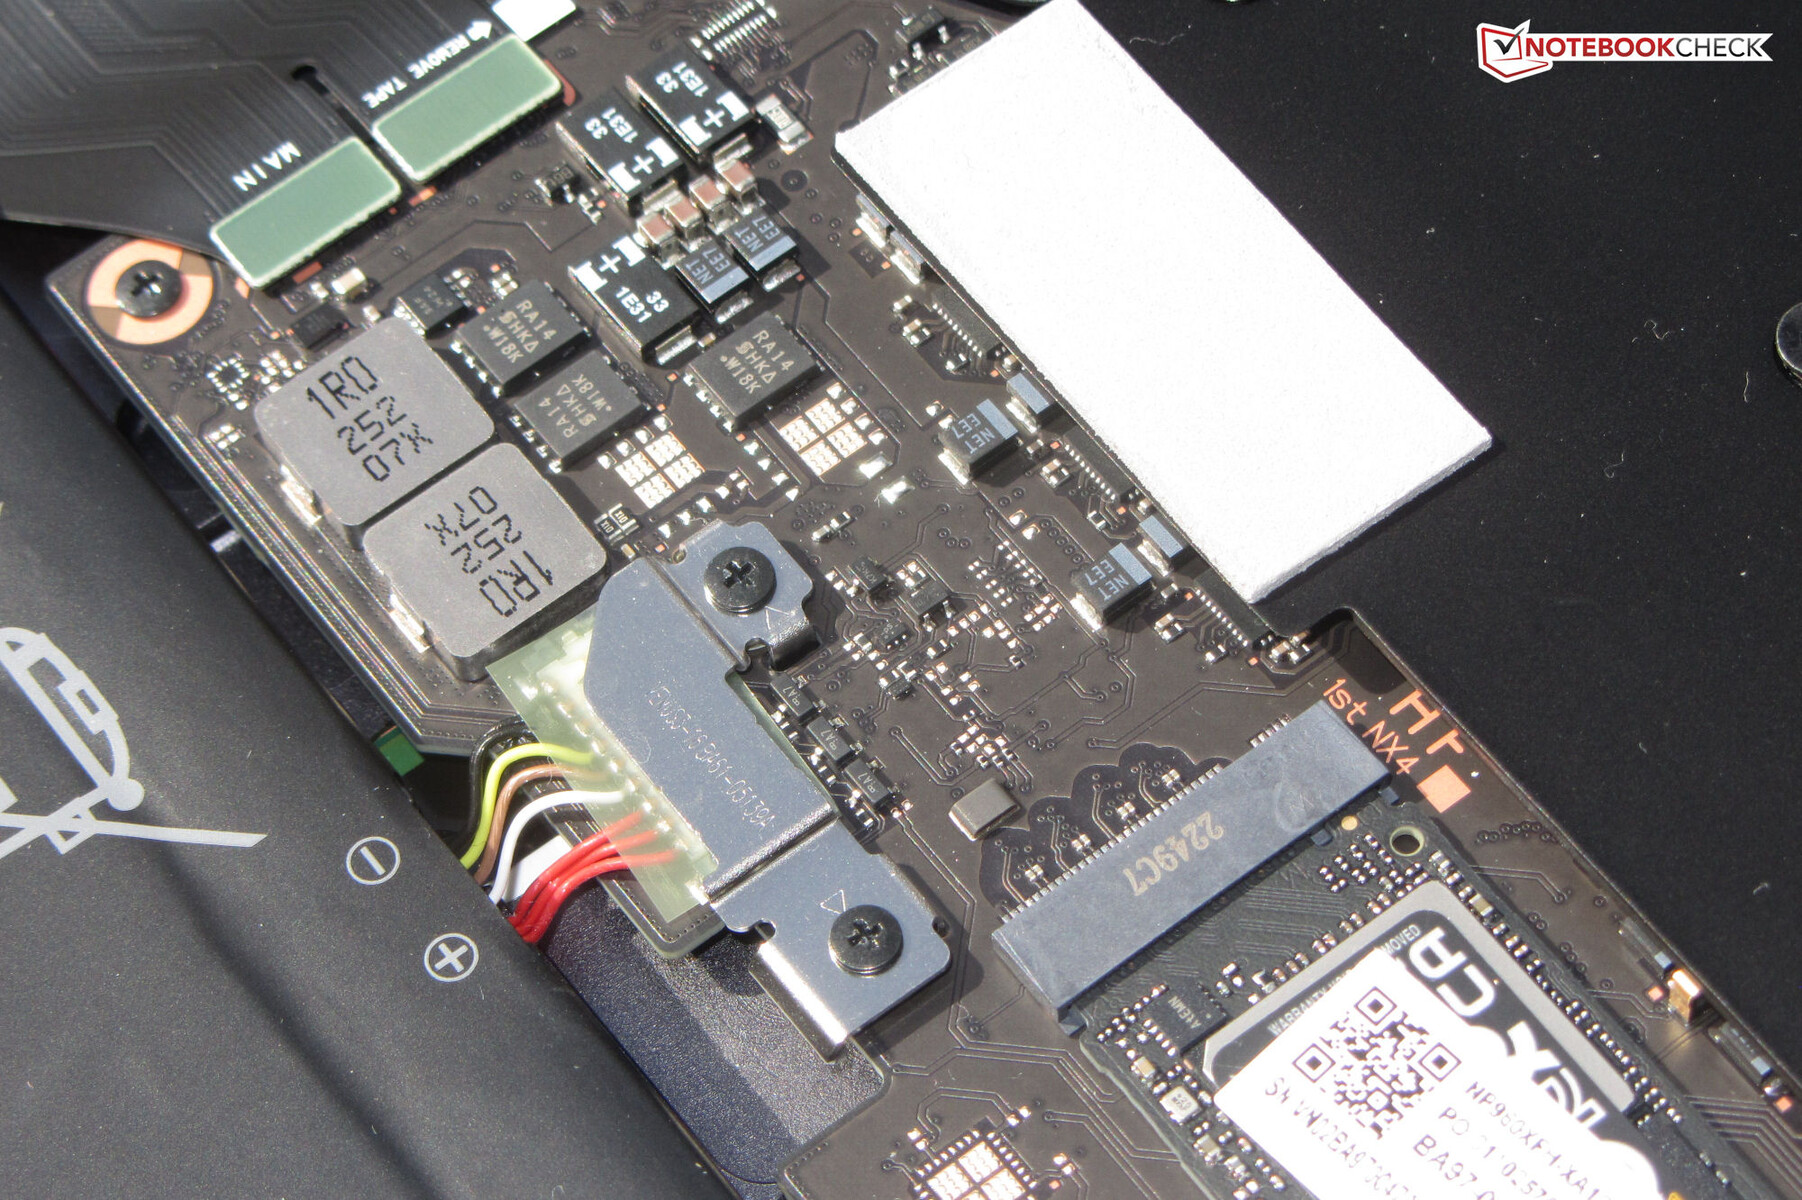
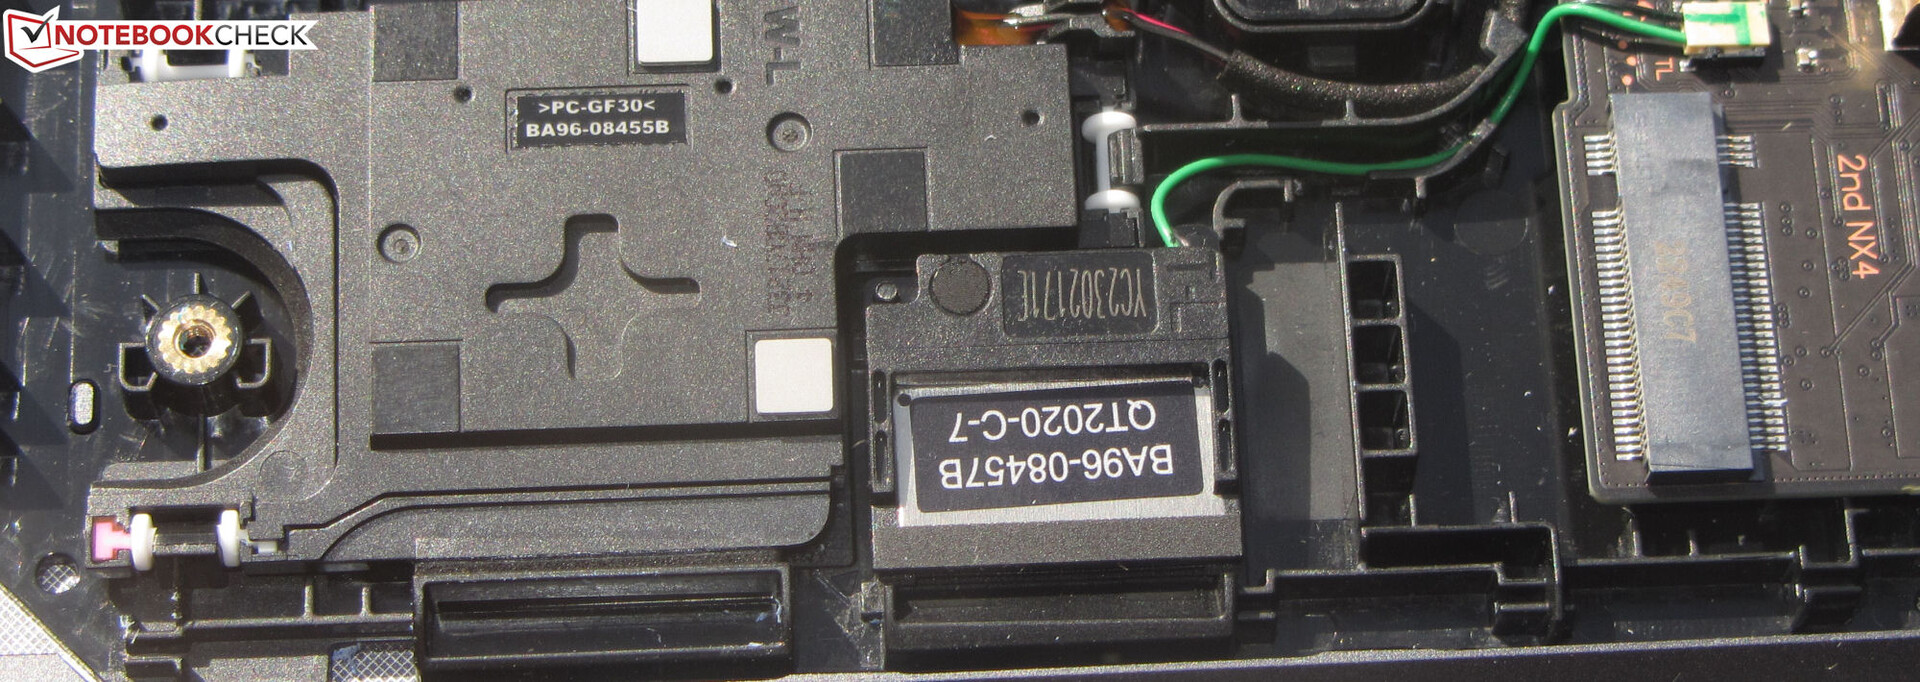
För att demontera bottenskyddet måste du ta bort alla skruvar som är dolda under de fyra gummifötterna (insatta, inte fastlimmade). Därefter bör du vara försiktig (!) när du tar bort bottenkåpan, som sitter mycket hårt och kan skadas. Vi rekommenderar att du använder en platt spatel. Därefter kan man komma åt SSD:n (PCIe 4, M.2-2280), den andra SSD-platsen, fläktarna, högtalarna och batteriet.
Garanti
Samsung ger 16-tummaren en tvåårig garanti i Tyskland. En förlängning med ett eller två år kostar 79 euro respektive 149 euro. Dessa villkor kan skilja sig åt i andra länder, så köpare bör dubbelkolla innan de köper.
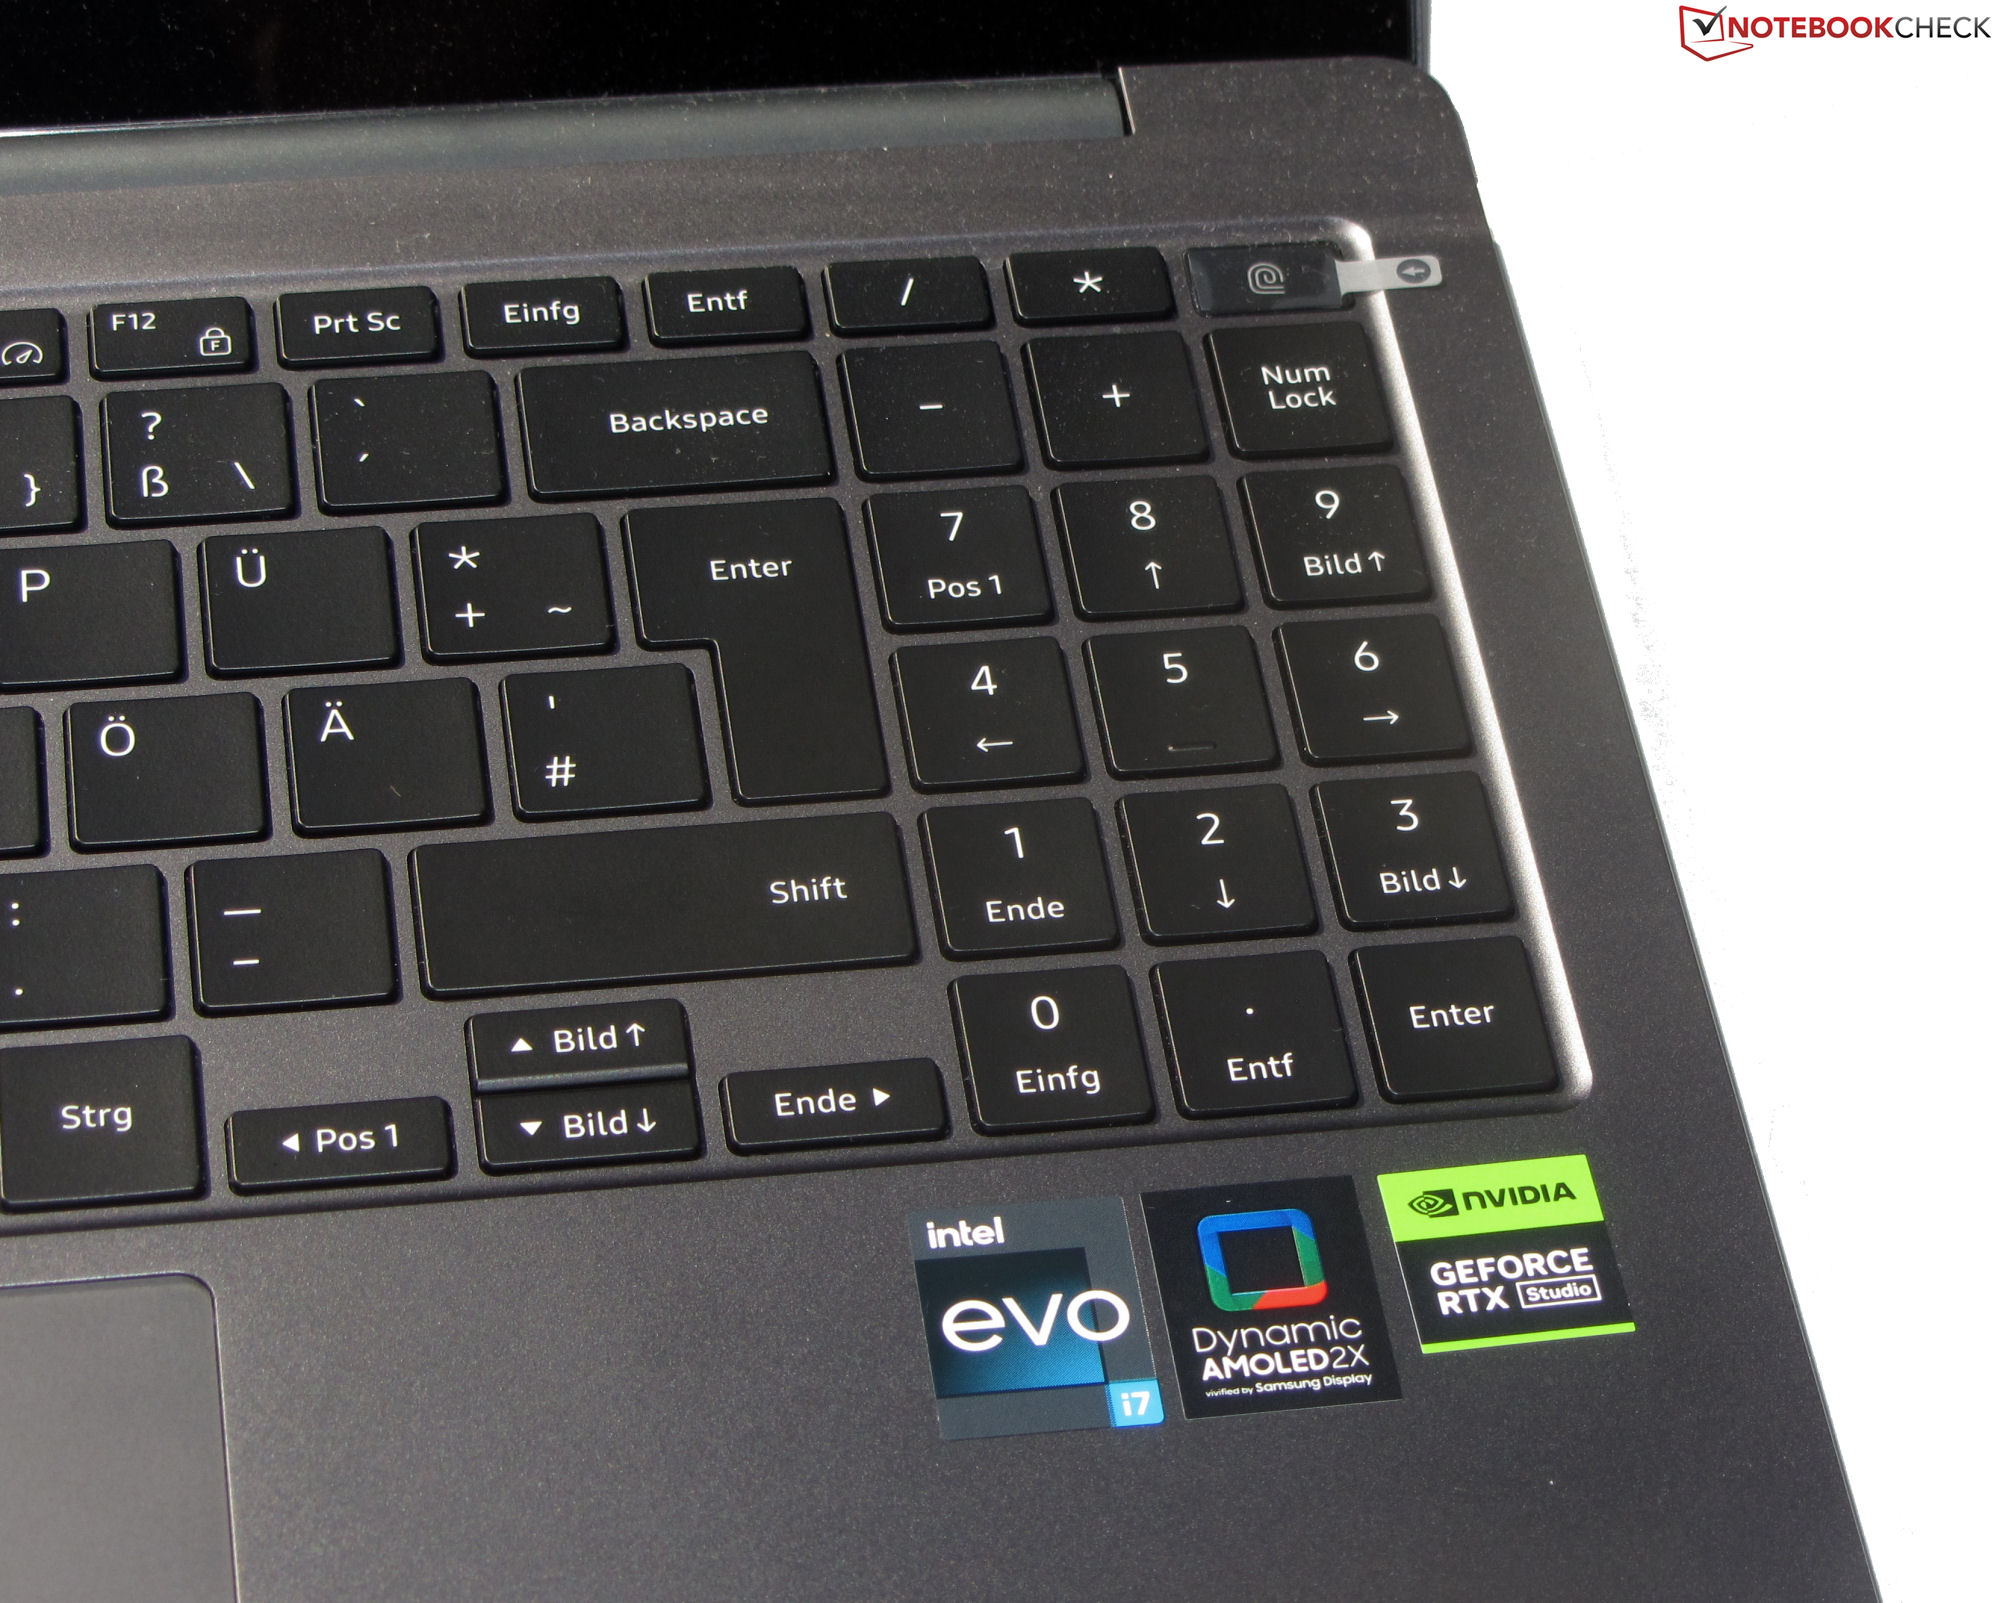
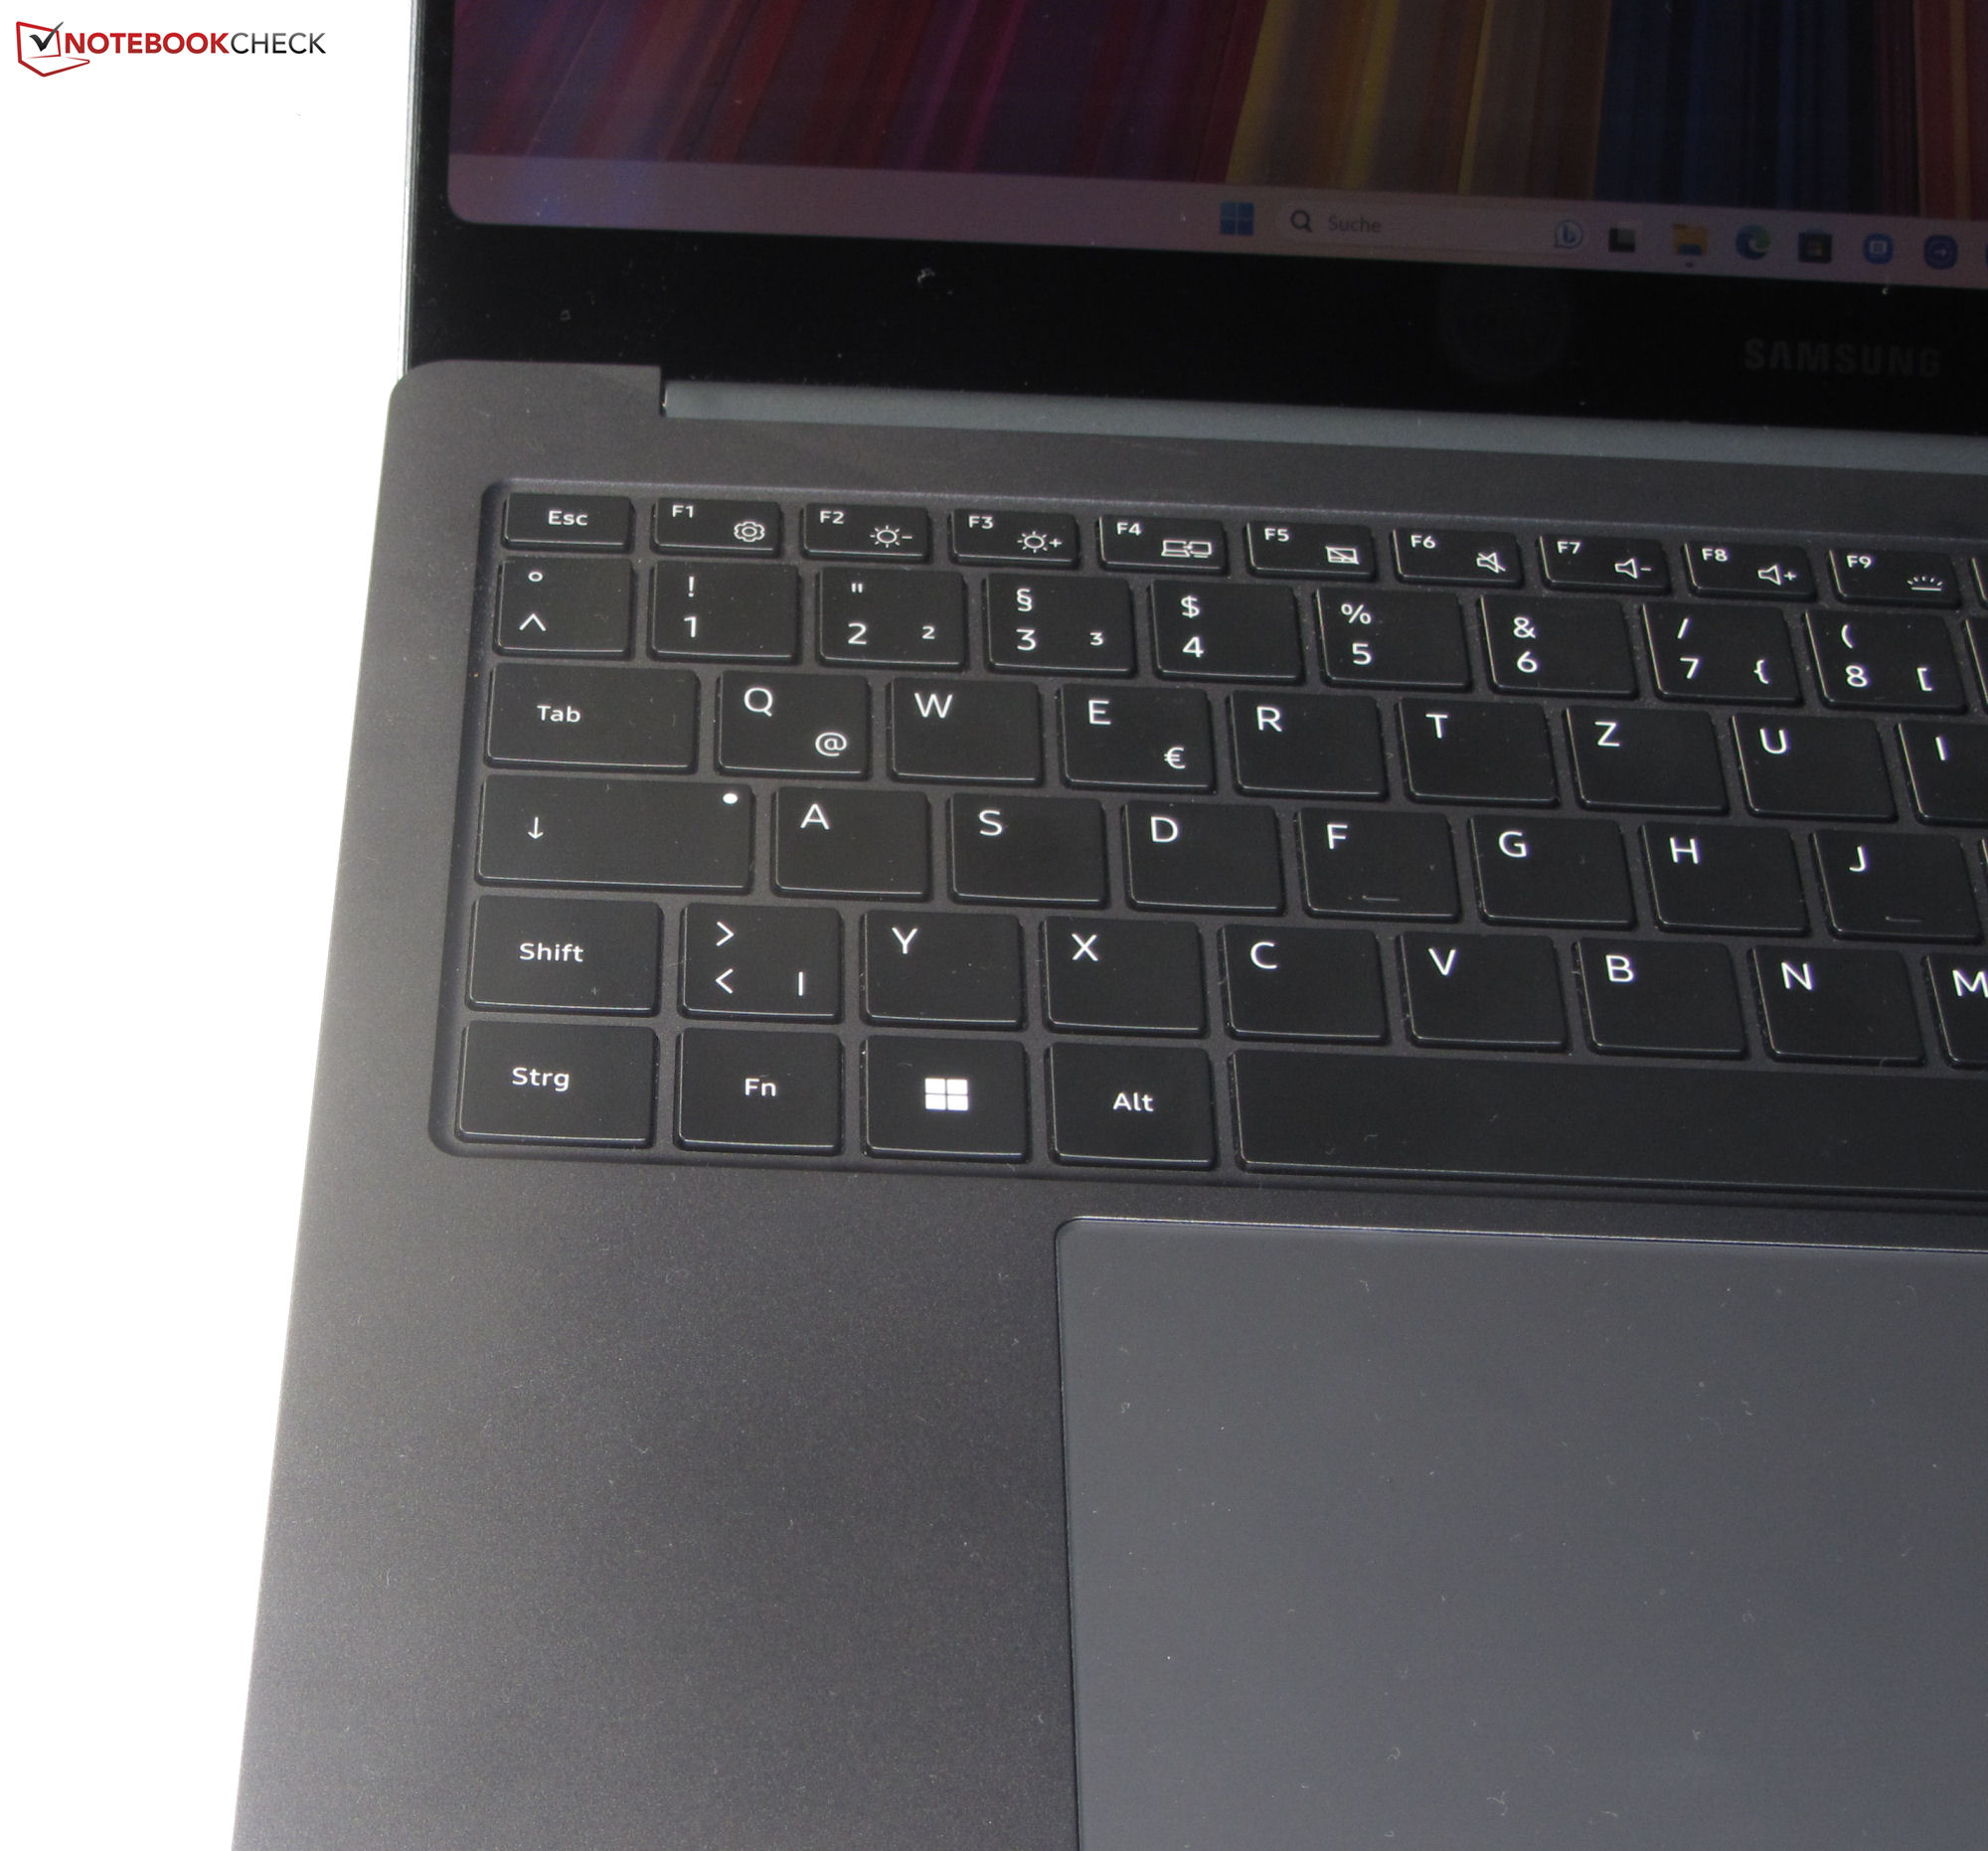
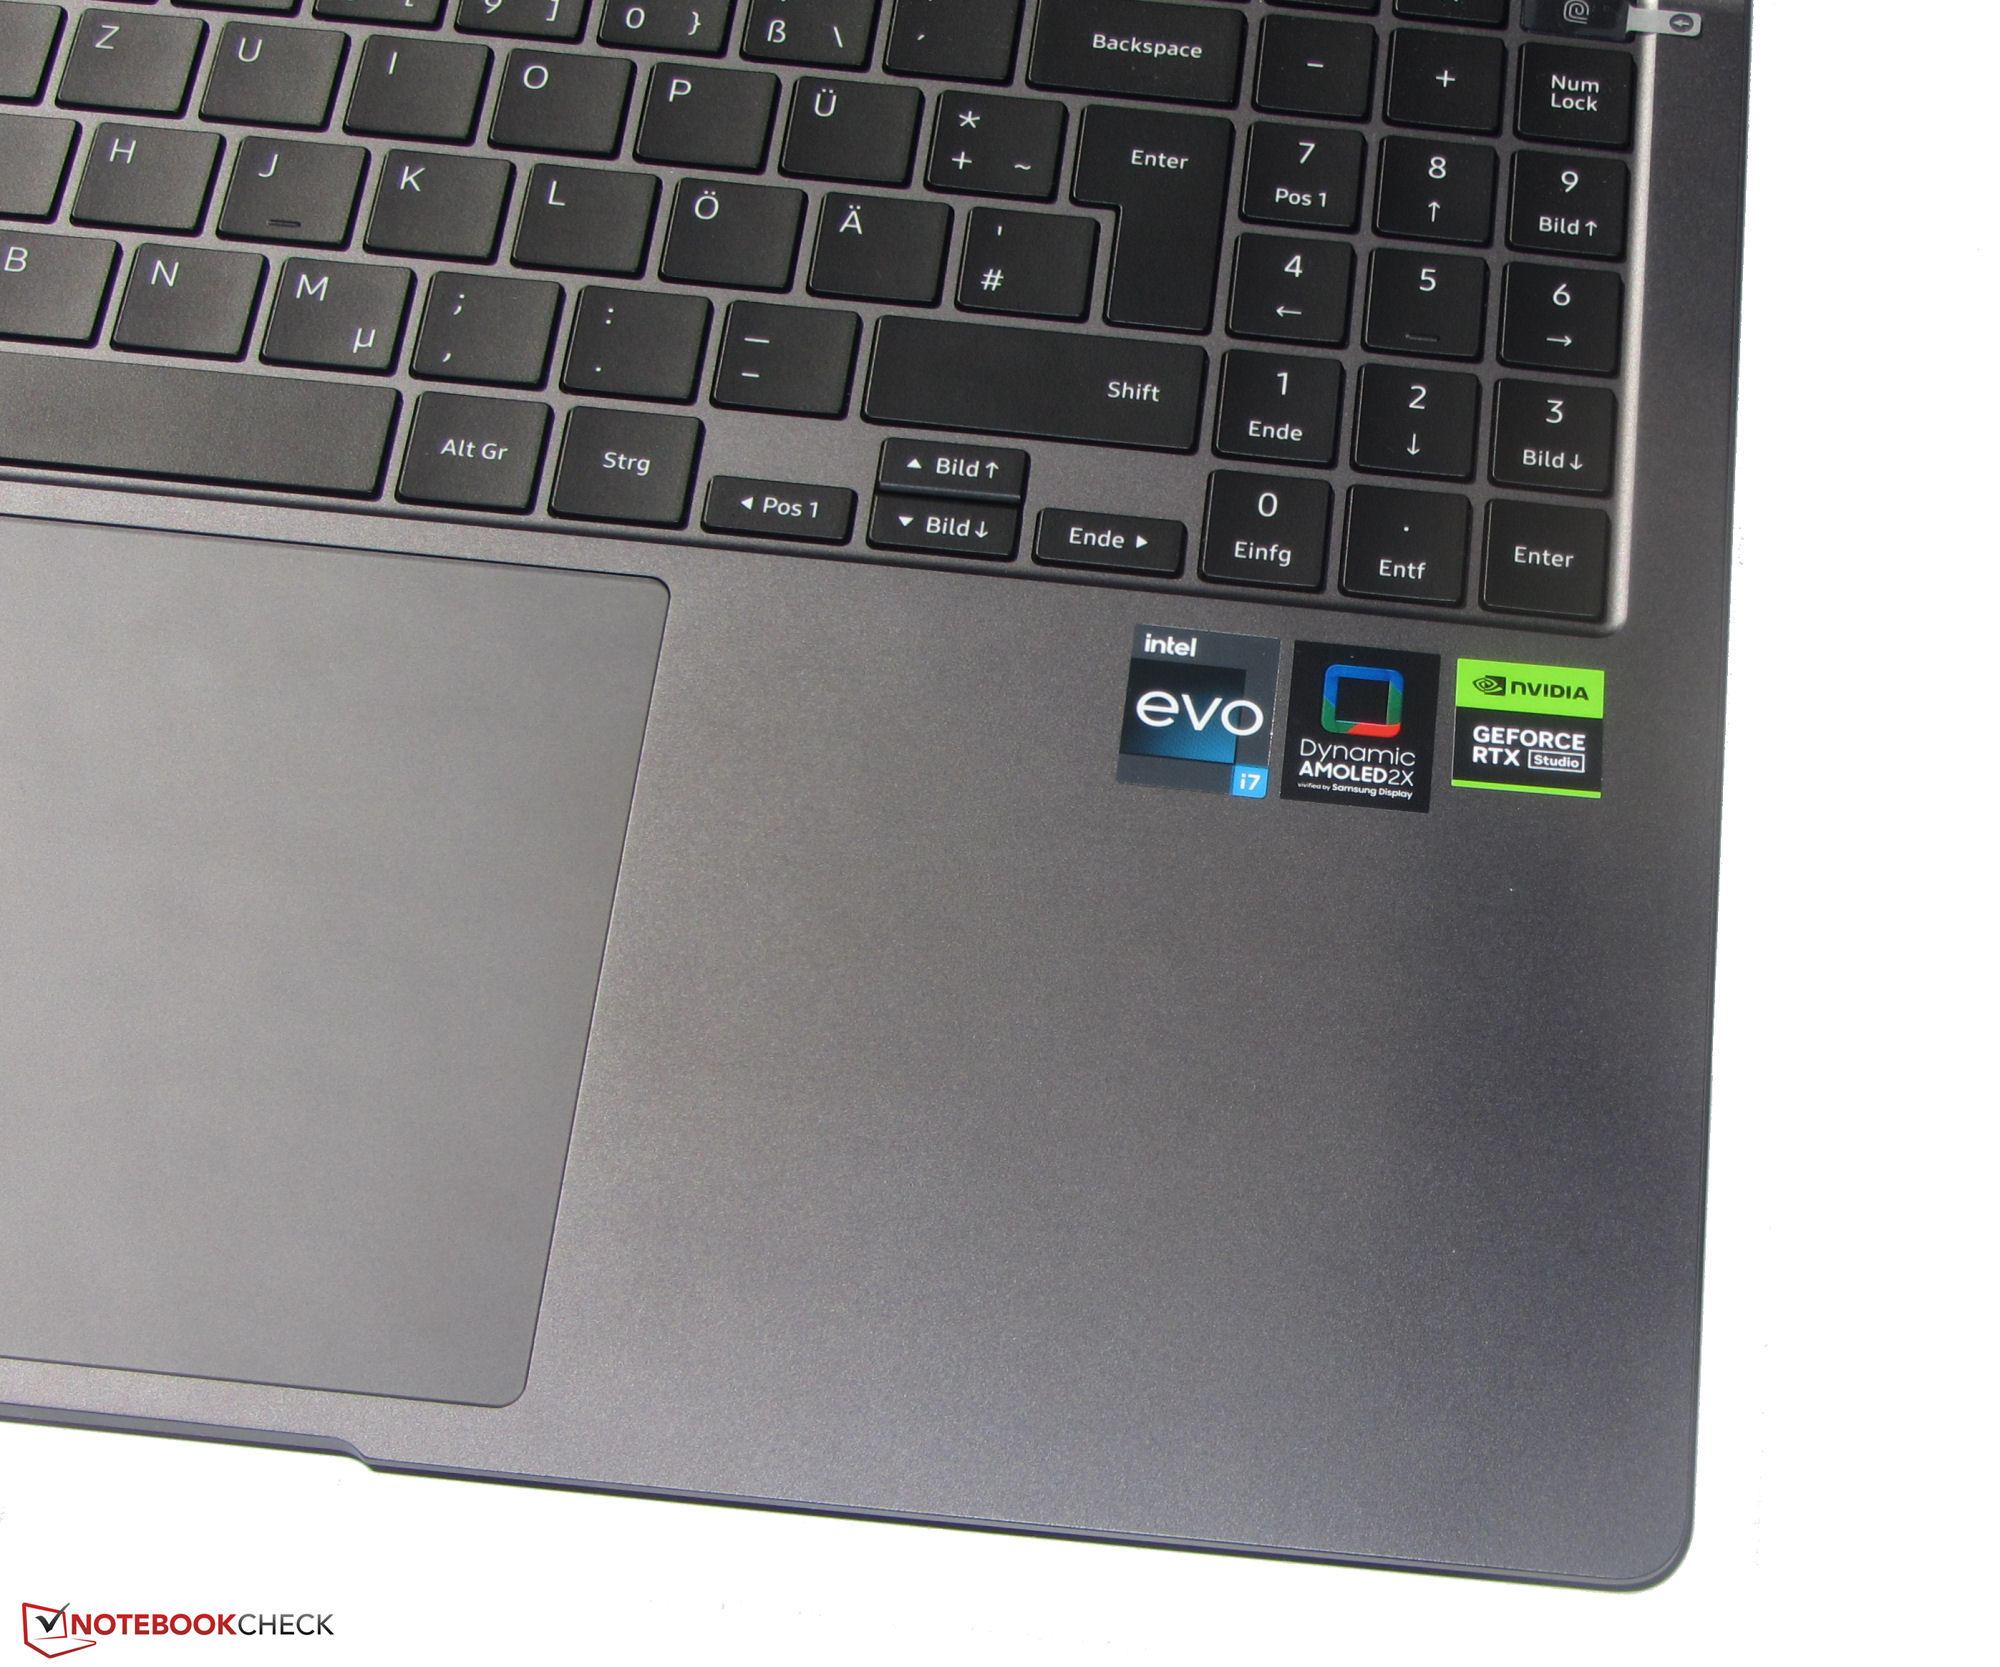
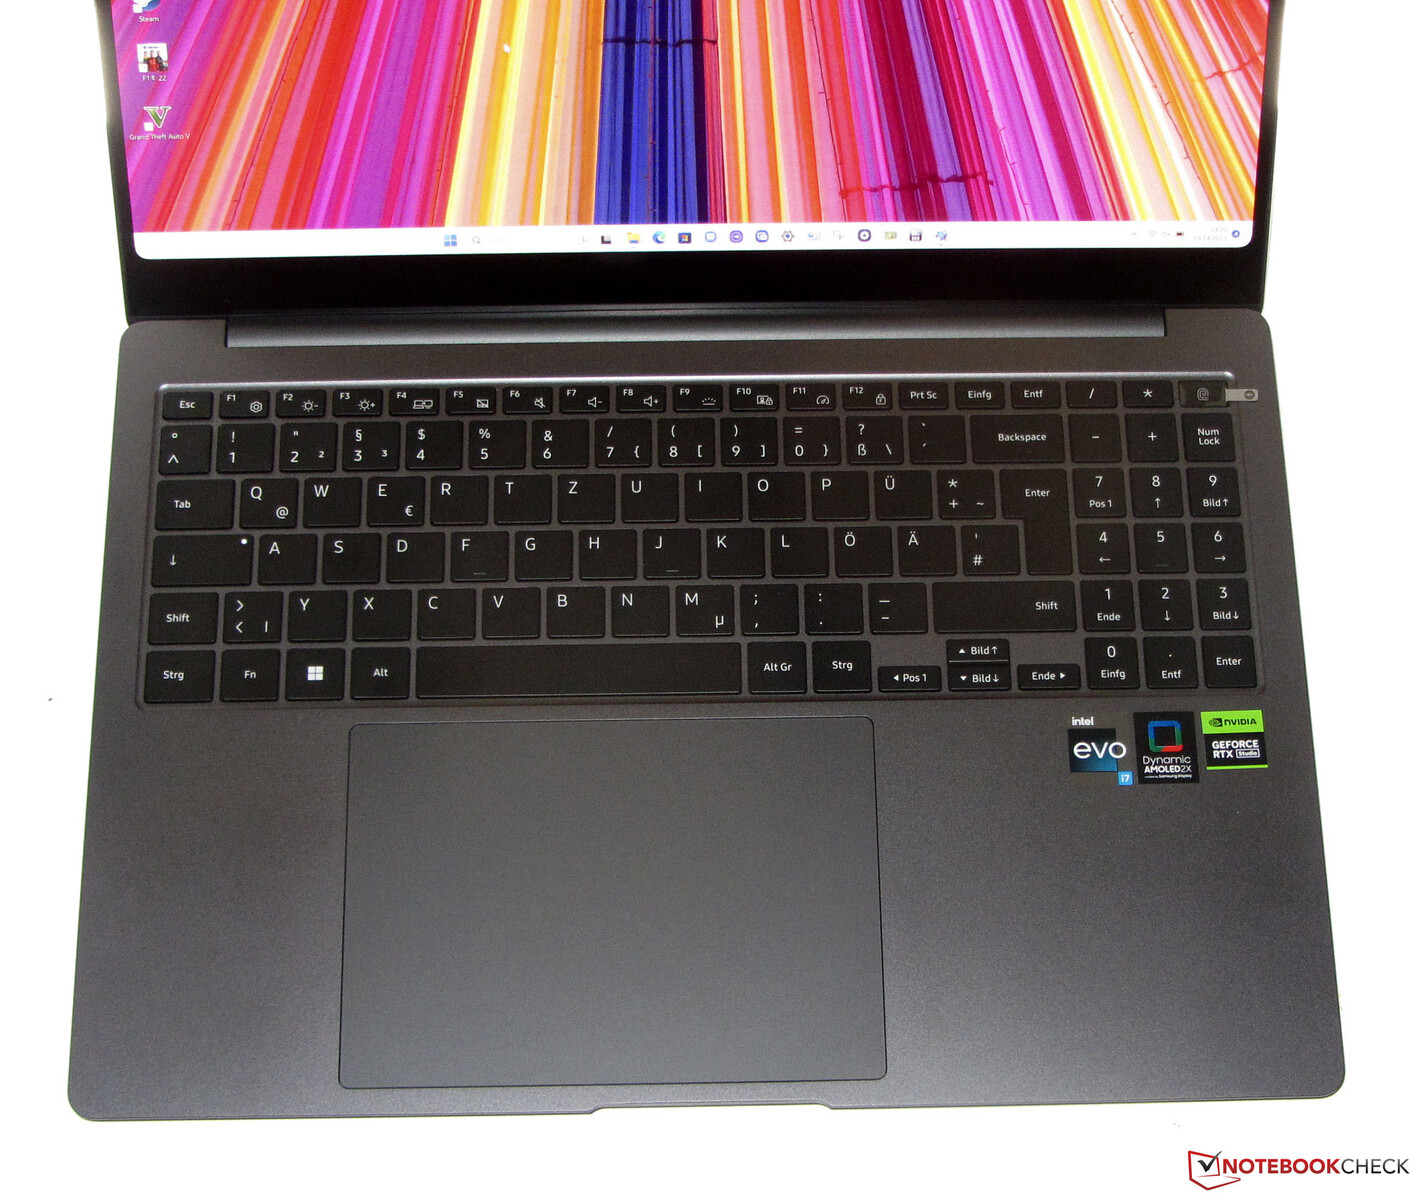
Inmatningsenheter - Galaxy Book3 har ett bakgrundsbelyst tangentbord
Tangentbord
NP960XFH har ett bakgrundsbelyst chiclet-tangentbord med numreringsblock. De mjuka, lätt konkava tangenterna har kort slaglängd och en tydlig tryckpunkt. Tangentmotståndet är acceptabelt. Tangentbordet viker sig något vid tryck, men det är ingen anledning till oro. Bakgrundsbelysningen i tre steg styrs via en funktionstangent. På det hela taget levererar Samsung ett tangentbord som lämpar sig för daglig användning.
Pekplatta
ClickPad mäter cirka 15,1 x 10,8 cm. En storlek mindre hade också räckt: Om WASD-tangenterna används med vänster hand vilar hela tummen på plattan. Den senare måste alltså stängas av i ett sådant fall. Annars är den släta ytan mycket gynnsam för fingerglidning och swiping. Den reagerar på inmatningar i hörnen, erbjuder korta resor och en tydlig tryckpunkt.
Skärm - AMOLED i 16:10-format
Den stora 16-tumsskärmen (2880x1800) i ett arbetsvänligt 16:10-format har ett utmärkt svartvärde och korta svarstider, vilket är typiskt för OLED-skärmar. Skärmens ljusstyrka överstiger målet, även om denThinkBook 16p G3 ARH har en mycket ljusare skärm.
OLED-panelens svagheter: den har en reflekterande yta och flimrar vid en ljusstyrka på ≤ 100 procent med en frekvens på 240 Hz. Flimmern är relaterat till panelens ljusstyrningsreglering.
| |||||||||||||||||||||||||
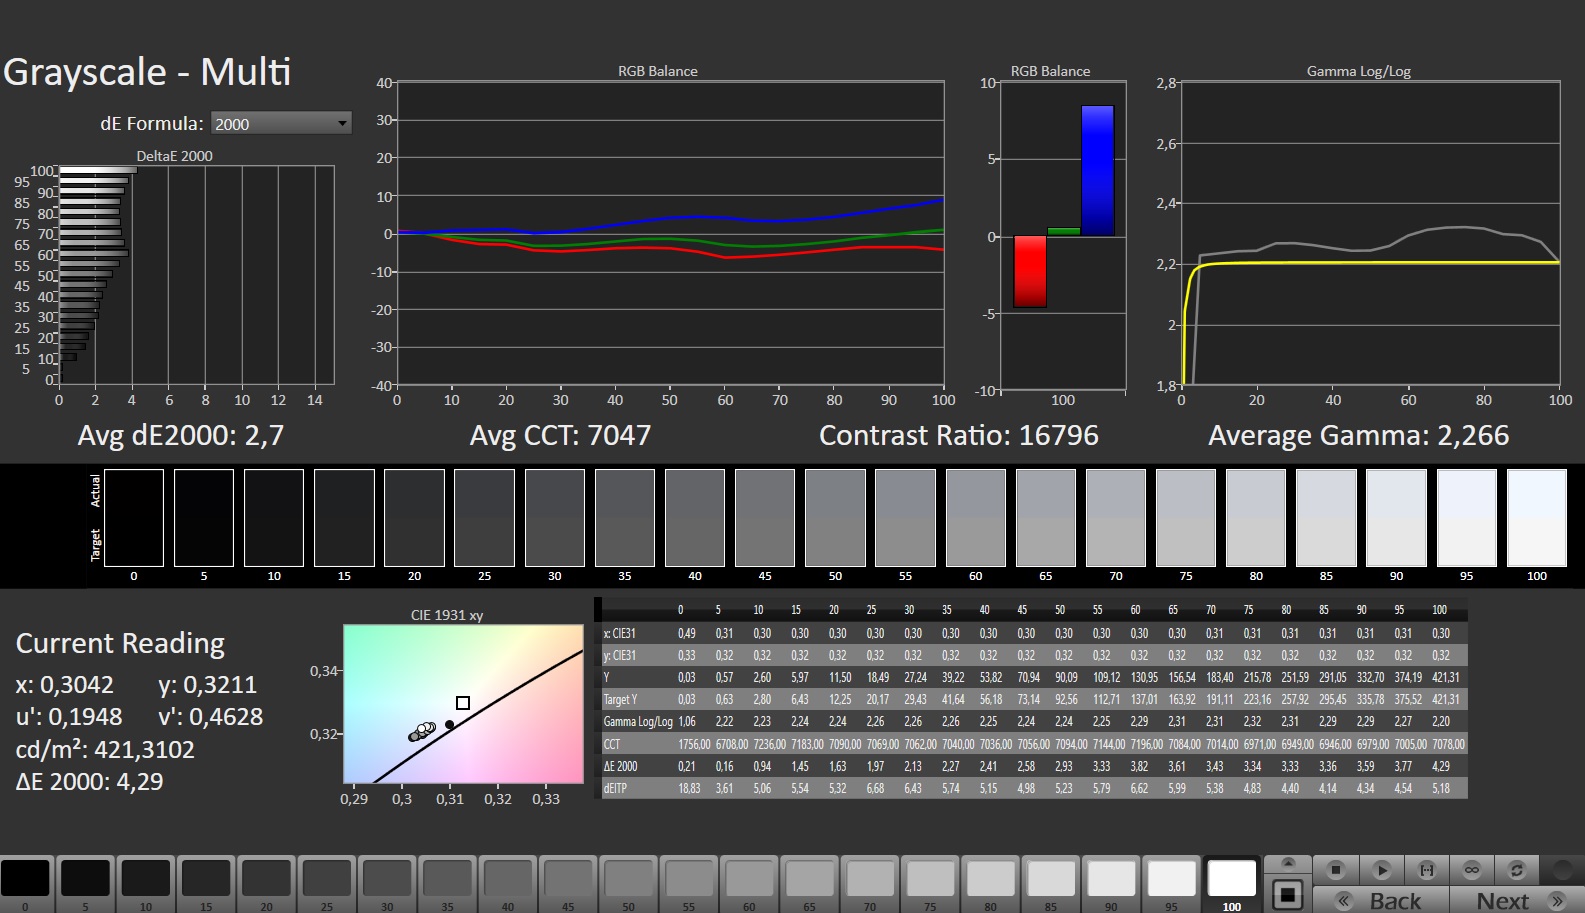
Distribution av ljusstyrkan: 93 %
Mitt på batteriet: 400 cd/m²
Kontrast: 13333:1 (Svärta: 0.03 cd/m²)
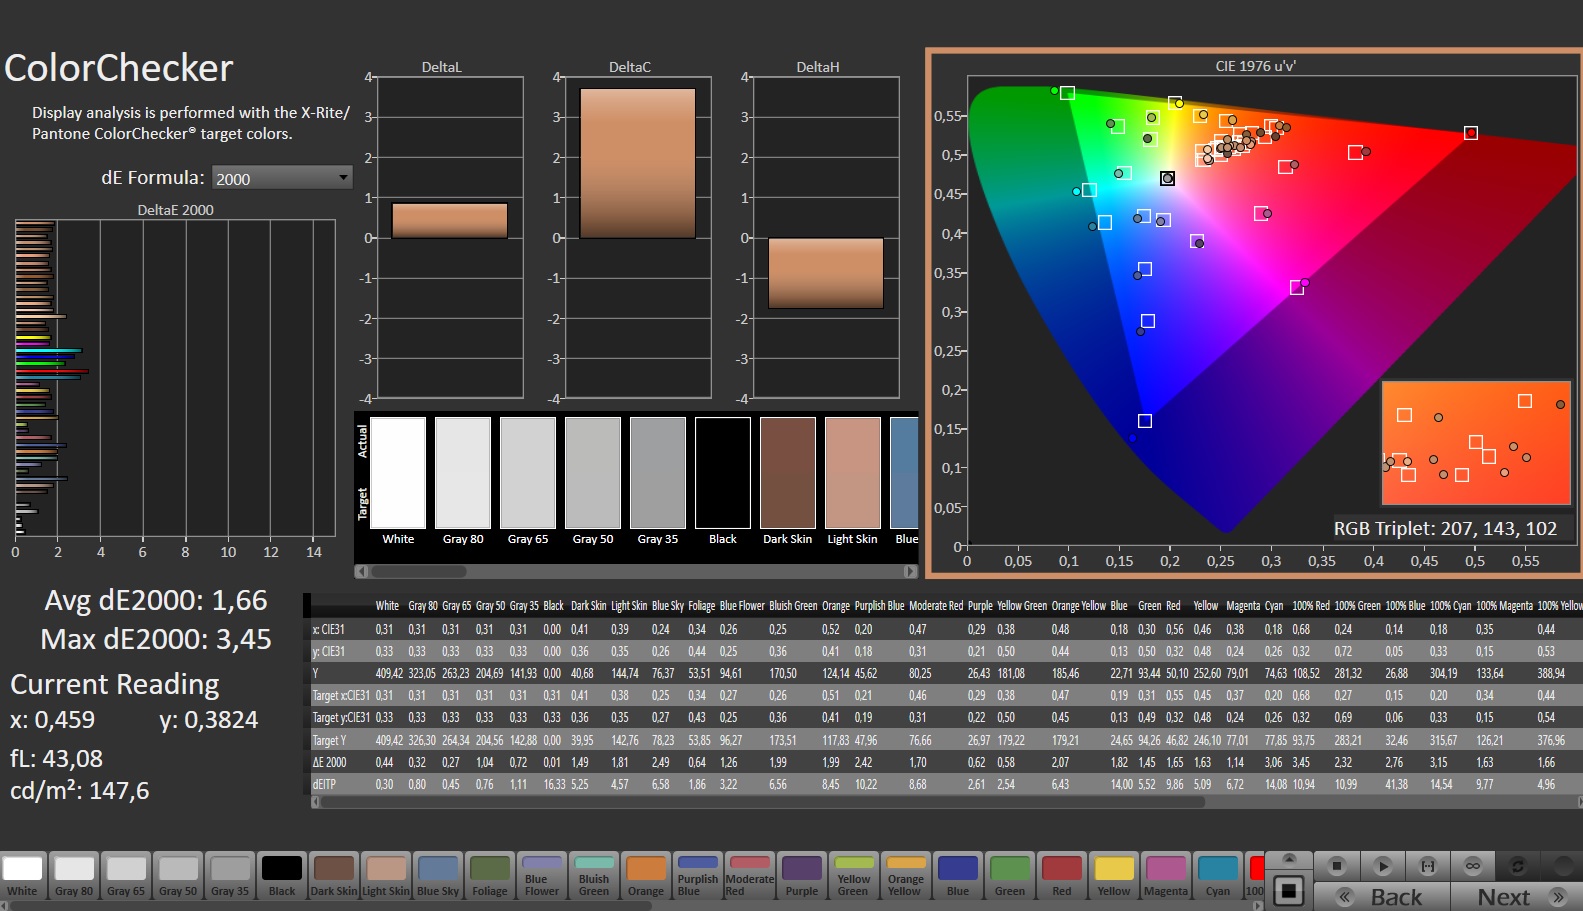
ΔE ColorChecker Calman: 2.3 | ∀{0.5-29.43 Ø4.71}
calibrated: 1.66
ΔE Greyscale Calman: 2.7 | ∀{0.09-98 Ø4.96}
96.3% AdobeRGB 1998 (Argyll 3D)
100% sRGB (Argyll 3D)
99.9% Display P3 (Argyll 3D)
Gamma: 2.266
CCT: 7047 K
| Samsung Galaxy Book3 Ultra 16 Samsung ATNA60CL03-0, AMOLED, 2880x1800, 16" | Schenker Vision 16 Pro RTX 3070 Ti N160QDM-NZ1, IPS, 2560x1600, 16" | LG Gram 17Z90Q-E.AD78G LG Display LP170WQ1-SPF2, IPS, 2560x1600, 17" | Lenovo ThinkBook 16p G3 ARH BOE CQ NE160QDM-NY1, IPS, 2560x1600, 16" | Dell XPS 15 9520 RTX 3050 Ti Samsung 156XG01, OLED, 3456x2160, 15.6" | Asus VivoBook Pro 16X OLED N7600PC-L2026X Samsung ATNA60YV02-0, OLED, 3840x2400, 16" | Acer Swift X SFX16-52G-77RX B160QAN02.M, IPS-LED, 2560x1600, 16" | |
|---|---|---|---|---|---|---|---|
| Display | -20% | -8% | -19% | -4% | 1% | -15% | |
| Display P3 Coverage (%) | 99.9 | 68.7 -31% | 92.2 -8% | 69.8 -30% | 97.8 -2% | 99.9 0% | 76.4 -24% |
| sRGB Coverage (%) | 100 | 96.7 -3% | 98.66 -1% | 98.2 -2% | 99.9 0% | 100 0% | 100 0% |
| AdobeRGB 1998 Coverage (%) | 96.3 | 70 -27% | 82.98 -14% | 71.4 -26% | 86 -11% | 98.05 2% | 76.6 -20% |
| Response Times | -2021% | -3068% | -2354% | -240% | -156% | -4422% | |
| Response Time Grey 50% / Grey 80% * (ms) | 0.49 ? | 14.3 ? -2818% | 22 ? -4390% | 15.6 ? -3084% | 1.9 ? -288% | 1 -104% | 33 ? -6635% |
| Response Time Black / White * (ms) | 0.65 ? | 8.6 ? -1223% | 12 ? -1746% | 11.2 ? -1623% | 1.9 ? -192% | 2 ? -208% | 15 ? -2208% |
| PWM Frequency (Hz) | 240 ? | 59.52 ? | 247 ? | ||||
| Screen | -140% | -125% | -186% | -32% | 8% | -108% | |
| Brightness middle (cd/m²) | 400 | 364 -9% | 391 -2% | 532.8 33% | 381.4 -5% | 383 -4% | 411 3% |
| Brightness (cd/m²) | 399 | 347 -13% | 358 -10% | 519 30% | 384 -4% | 390 -2% | 378 -5% |
| Brightness Distribution (%) | 93 | 89 -4% | 84 -10% | 94 1% | 95 2% | 96 3% | 83 -11% |
| Black Level * (cd/m²) | 0.03 | 0.3 -900% | 0.29 -867% | 0.55 -1733% | 0.027 10% | 0.29 -867% | |
| Contrast (:1) | 13333 | 1213 -91% | 1348 -90% | 969 -93% | 14185 6% | 1417 -89% | |
| Colorchecker dE 2000 * | 2.3 | 3.3 -43% | 3.52 -53% | 1.32 43% | 4.34 -89% | 2.29 -0% | 2.18 5% |
| Colorchecker dE 2000 max. * | 4.15 | 6.6 -59% | 6.06 -46% | 3.97 4% | 9.24 -123% | 3.47 16% | 4.84 -17% |
| Colorchecker dE 2000 calibrated * | 1.66 | 2.5 -51% | 1.43 14% | 1.59 4% | 1.48 11% | ||
| Greyscale dE 2000 * | 2.7 | 5.2 -93% | 4.27 -58% | 1.8 33% | 2 26% | 1.84 32% | 2.68 1% |
| Gamma | 2.266 97% | 2.14 103% | 2.3 96% | 2.64 83% | 2.13 103% | 2.32 95% | 2.43 91% |
| CCT | 7047 92% | 6331 103% | 7203 90% | 6761 96% | 6210 105% | 6308 103% | 6717 97% |
| Totalt genomsnitt (program/inställningar) | -727% /
-383% | -1067% /
-520% | -853% /
-460% | -92% /
-62% | -49% /
-19% | -1515% /
-704% |
* ... mindre är bättre
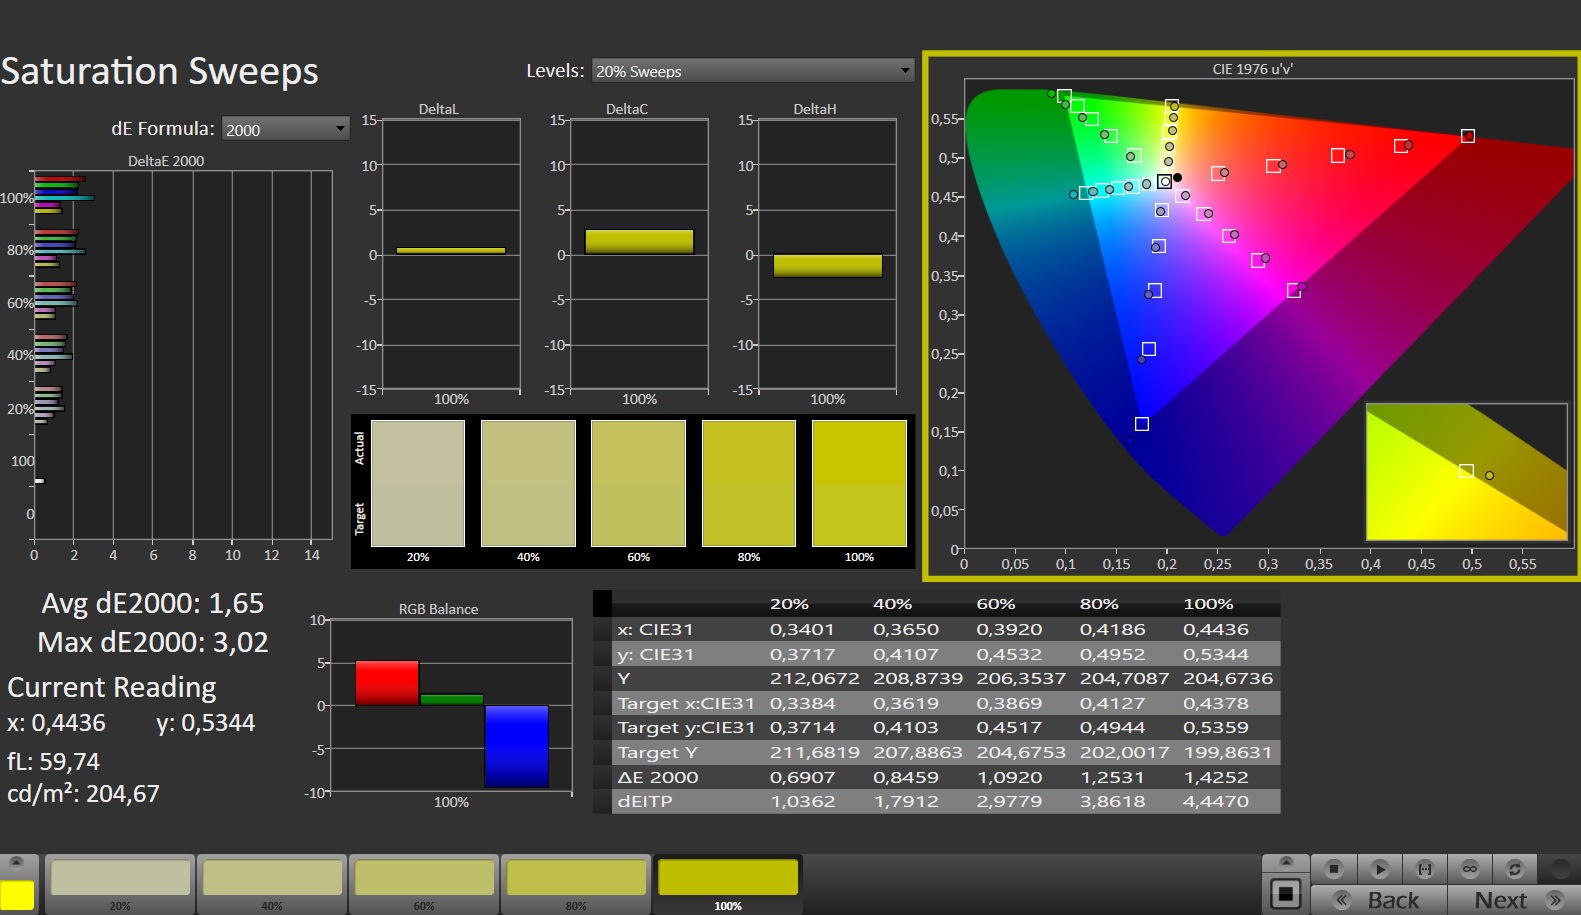
Skärmen har en bra färgåtergivning redan i levererat skick: Med en avvikelse på 2,3 är målet (DeltaE < 3) uppfyllt. Kalibrering minskar värdet till 1,66 och säkerställer mer balanserade gråskalanivåer
Färgtrogenheten är en självklarhet: sRGB- och DCI-P3-färgrymden återges fullständigt och Adobe RGB-rymden nästan helt. Skärmen kan justeras till ett av de tre utrymmena via de förinstallerade inställningarna i Samsungs programvara. Vi använde standardinställningen "Vivid (AMOLED native)" här.

Visa svarstider
| ↔ Svarstid svart till vitt | ||
|---|---|---|
| 0.65 ms ... stiga ↗ och falla ↘ kombinerat | ↗ 0.37 ms stiga |  |
| ↘ 0.28 ms hösten | ||
| Skärmen visar väldigt snabba svarsfrekvenser i våra tester och borde vara mycket väl lämpad för fartfyllt spel. I jämförelse sträcker sig alla testade enheter från 0.1 (minst) till 240 (maximalt) ms. » 2 % av alla enheter är bättre. Det betyder att den uppmätta svarstiden är bättre än genomsnittet av alla testade enheter (19.8 ms). | ||
| ↔ Svarstid 50 % grått till 80 % grått | ||
| 0.49 ms ... stiga ↗ och falla ↘ kombinerat | ↗ 0.26 ms stiga |  |
| ↘ 0.23 ms hösten | ||
| Skärmen visar väldigt snabba svarsfrekvenser i våra tester och borde vara mycket väl lämpad för fartfyllt spel. I jämförelse sträcker sig alla testade enheter från 0.165 (minst) till 636 (maximalt) ms. » 1 % av alla enheter är bättre. Det betyder att den uppmätta svarstiden är bättre än genomsnittet av alla testade enheter (31 ms). | ||
Skärmflimmer / PWM (Puls-Width Modulation)
| Skärmflimmer / PWM upptäckt | 240 Hz | ≤ 100 % ljusstyrka inställning |  |
Displayens bakgrundsbelysning flimrar vid 240 Hz (i värsta fall, t.ex. med PWM) Flimrande upptäckt vid en ljusstyrkeinställning på 100 % och lägre. Det ska inte finnas något flimmer eller PWM över denna ljusstyrkeinställning. Frekvensen för 240 Hz är relativt låg, så känsliga användare kommer sannolikt att märka flimmer och uppleva ansträngda ögon vid den angivna ljusstyrkeinställningen och nedan. Som jämförelse: 52 % av alla testade enheter använder inte PWM för att dämpa skärmen. Om PWM upptäcktes mättes ett medelvärde av 7757 (minst: 5 - maximum: 343500) Hz. | |||
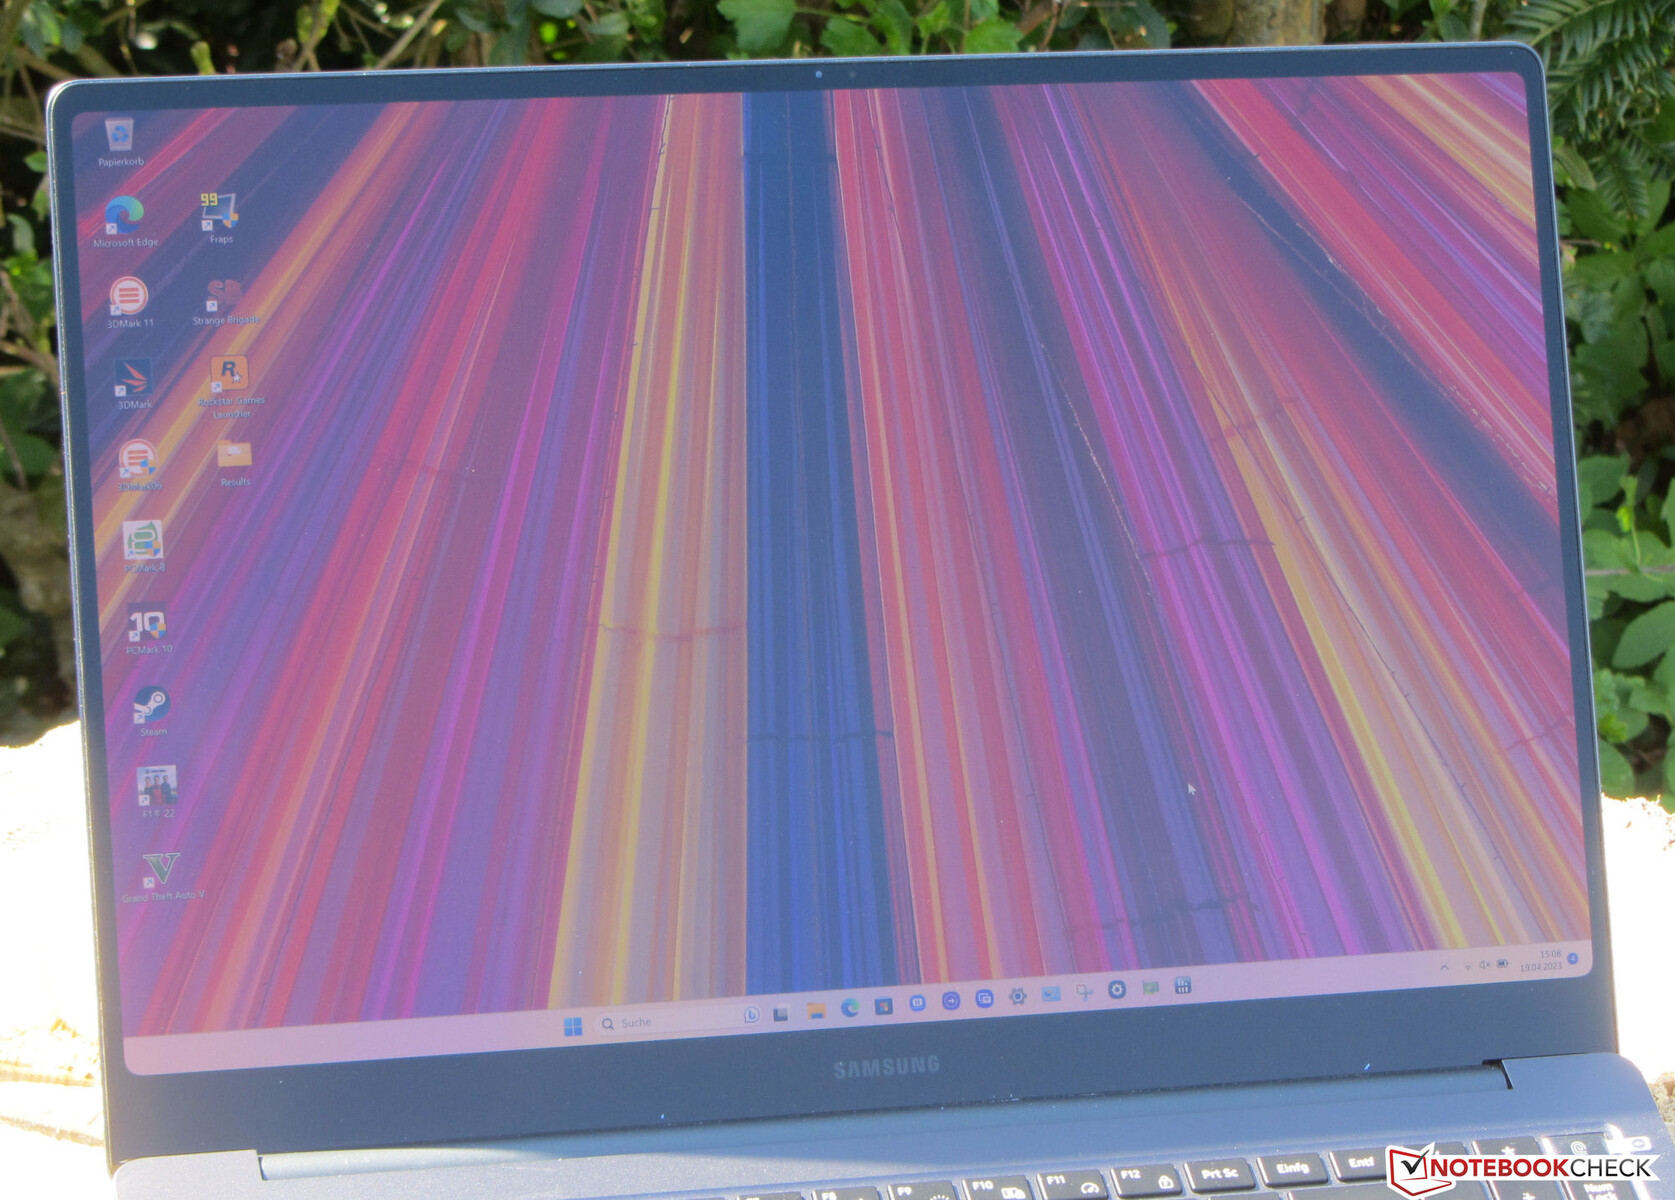
Den stabila panelen med betraktningsvinkel kan läsas från vilken position som helst. Det är svårt att läsa utomhus på grund av den reflekterande displayytan.
Föreställning - Alder Lake och Ada Lovelace ombord
Med sina Galaxy Book3 Ultra 16-modeller erbjuder Samsung en serie bärbara datorer för spelare och kreativa arbetare. Certifieringen GeForce RTX Studio bör garantera hög datorkraft, anpassade drivrutiner, bra programvarustöd och lämplig färgrymdstäckning på skärmen
Låg effektversioner av grafikprocessorerna RTX 4050 eller RTX 4070 används, medan processorerna kommer från Intel (Raptor Lake). Den här varianten är baserad på RTX 4050 och är instegsmodellen till ett pris på cirka 2 400 US-dollar.
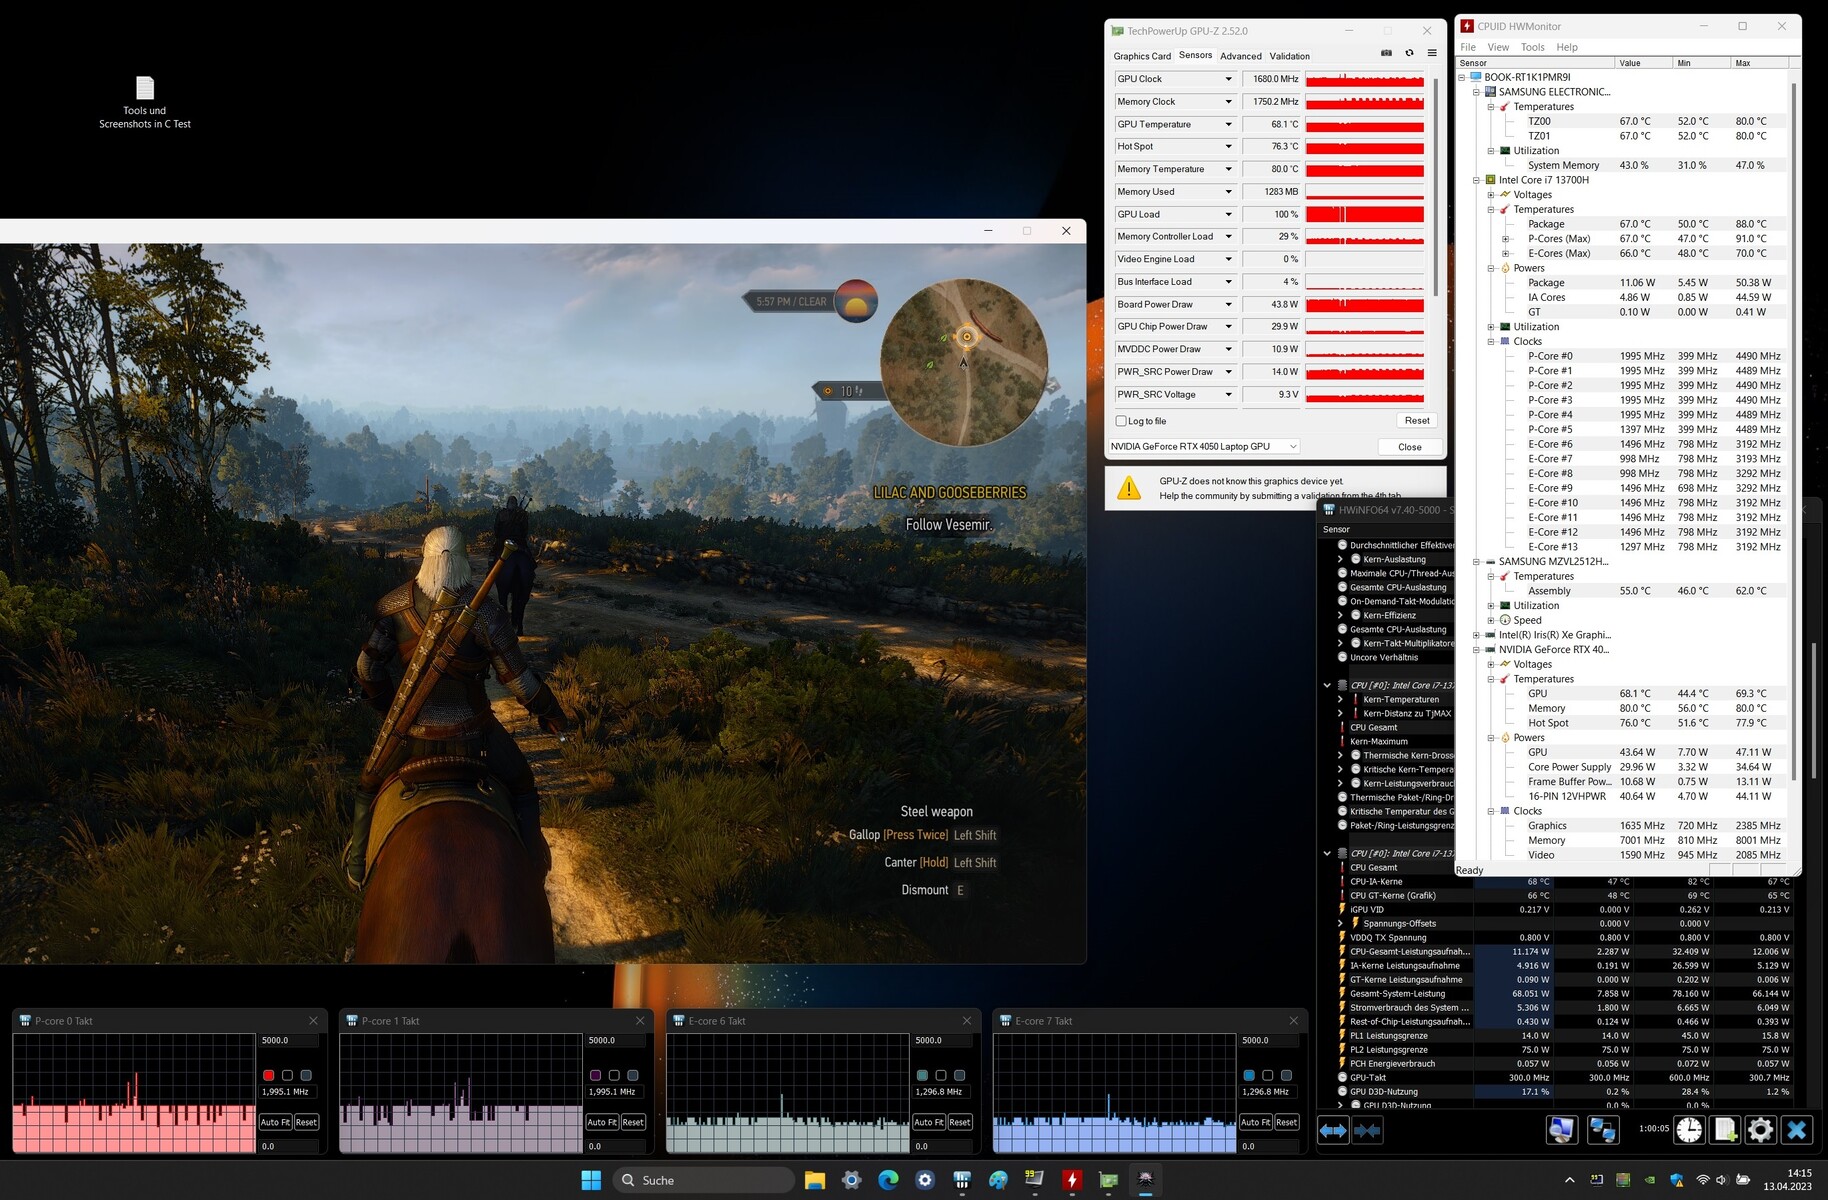
Provningsförhållanden
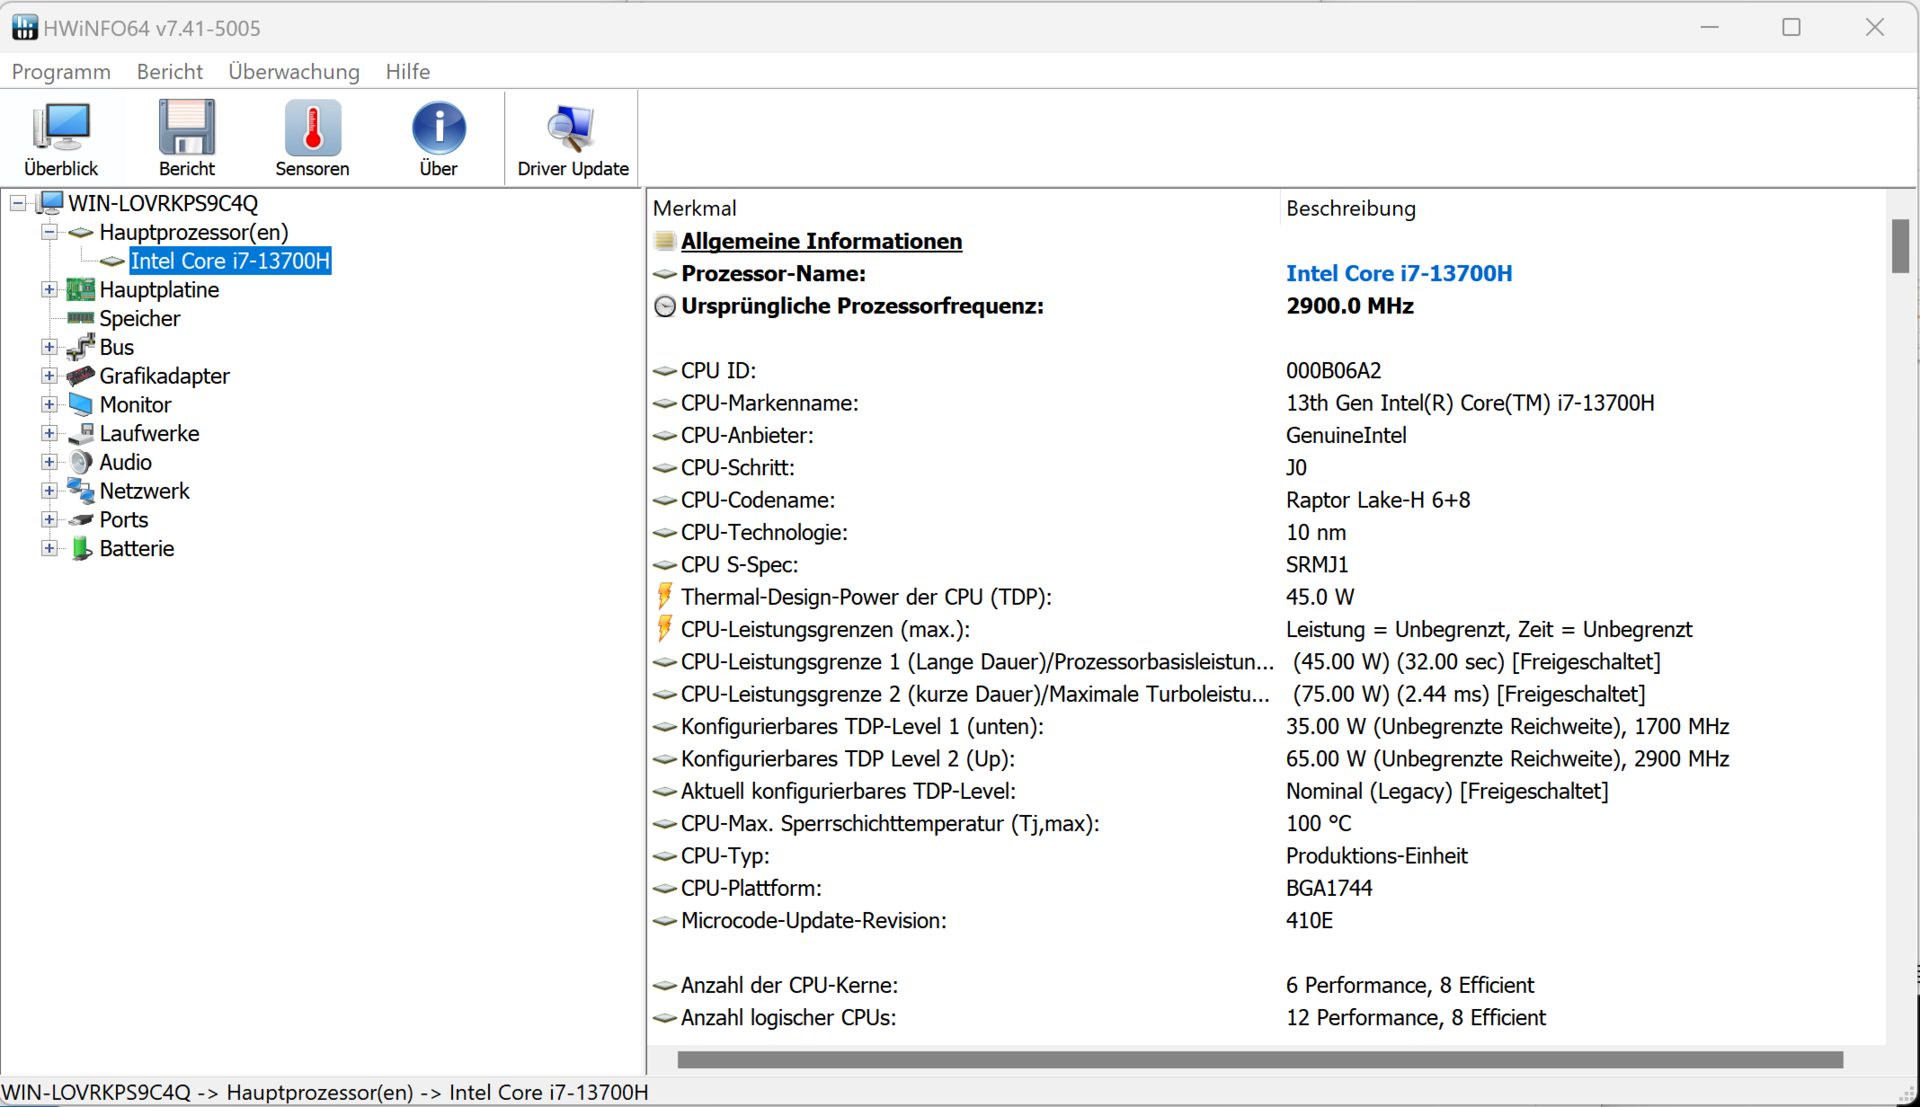
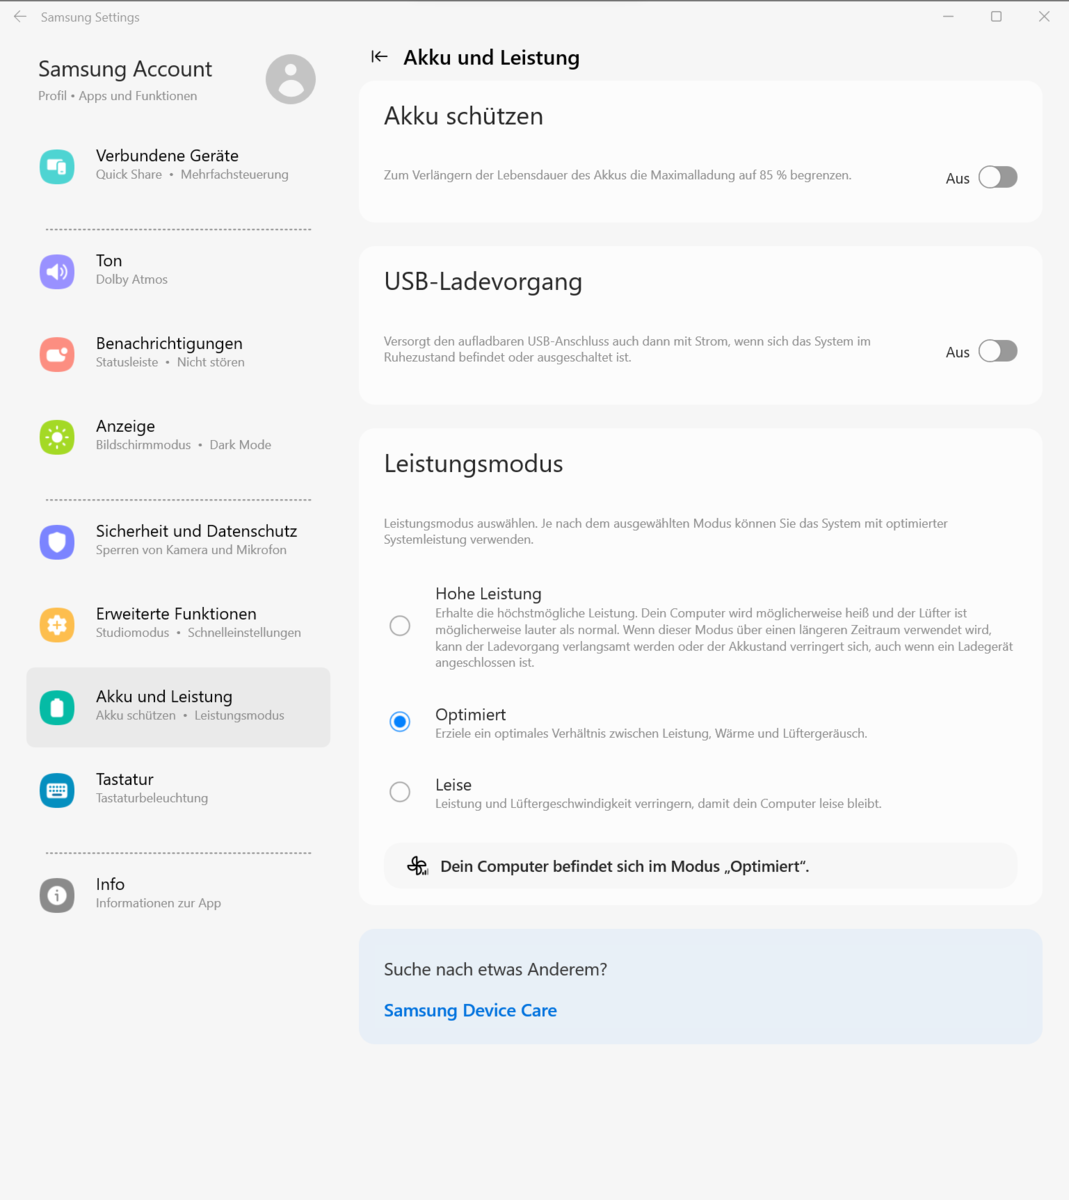
Den bärbara datorn har tre tillverkarspecifika prestandalägen (se tabell), som kan växlas mellan via tangentkombinationen "Fn" + "F11" (eller via Samsungs mjukvaruinställningar i den bärbara datorns kontrollcenter). Lägena "Optimized" (benchmarks) och "Silent" (batteritester) användes.
| Hög prestanda | Optimerad | Silent | |
|---|---|---|---|
| Effektbegränsning 1 (HWInfo) | 70 watt | 45 watt | 30 watt |
| Effektbegränsning 2 (HWInfo) | 75 watt | 75 watt | 75 watt |
| TGP RTX 4050 | 60 watt | ~ 40 - 45 watt | 20 watt |
| Buller (Witcher 3 ) | 48 dB(A) | 39 dB(A) | 34 dB(A) |
| Prestanda (Witcher 3 ) | ~ 73 fps | ~ 60 fps | ~ 20 fps |
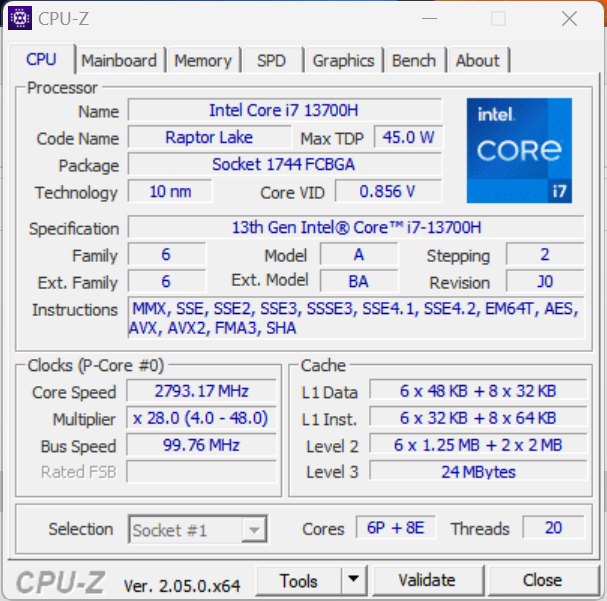
Processor
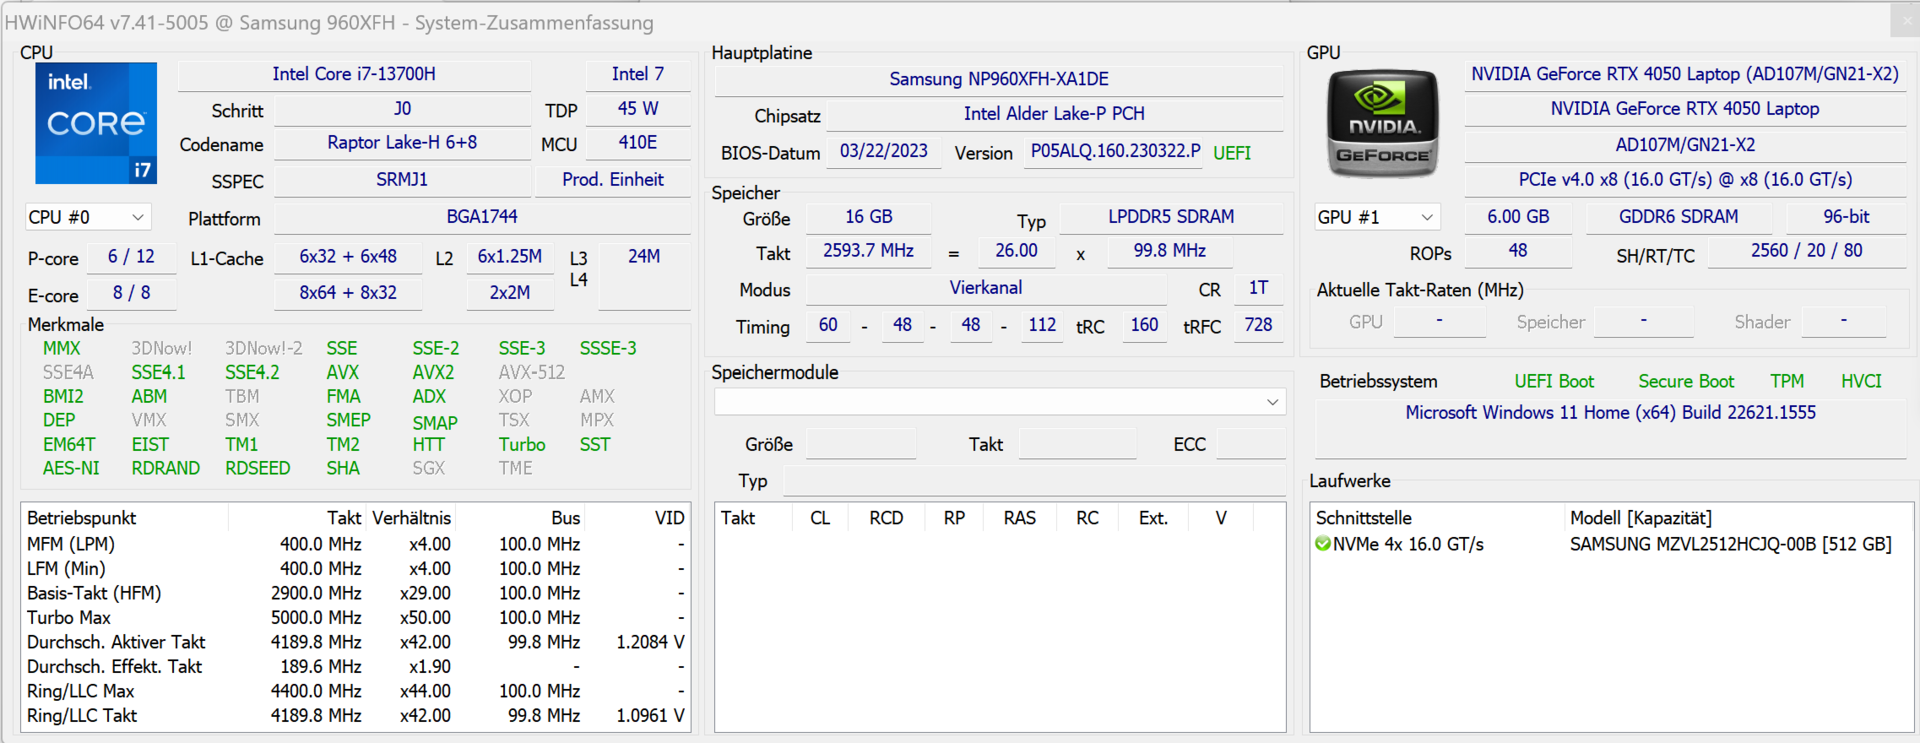
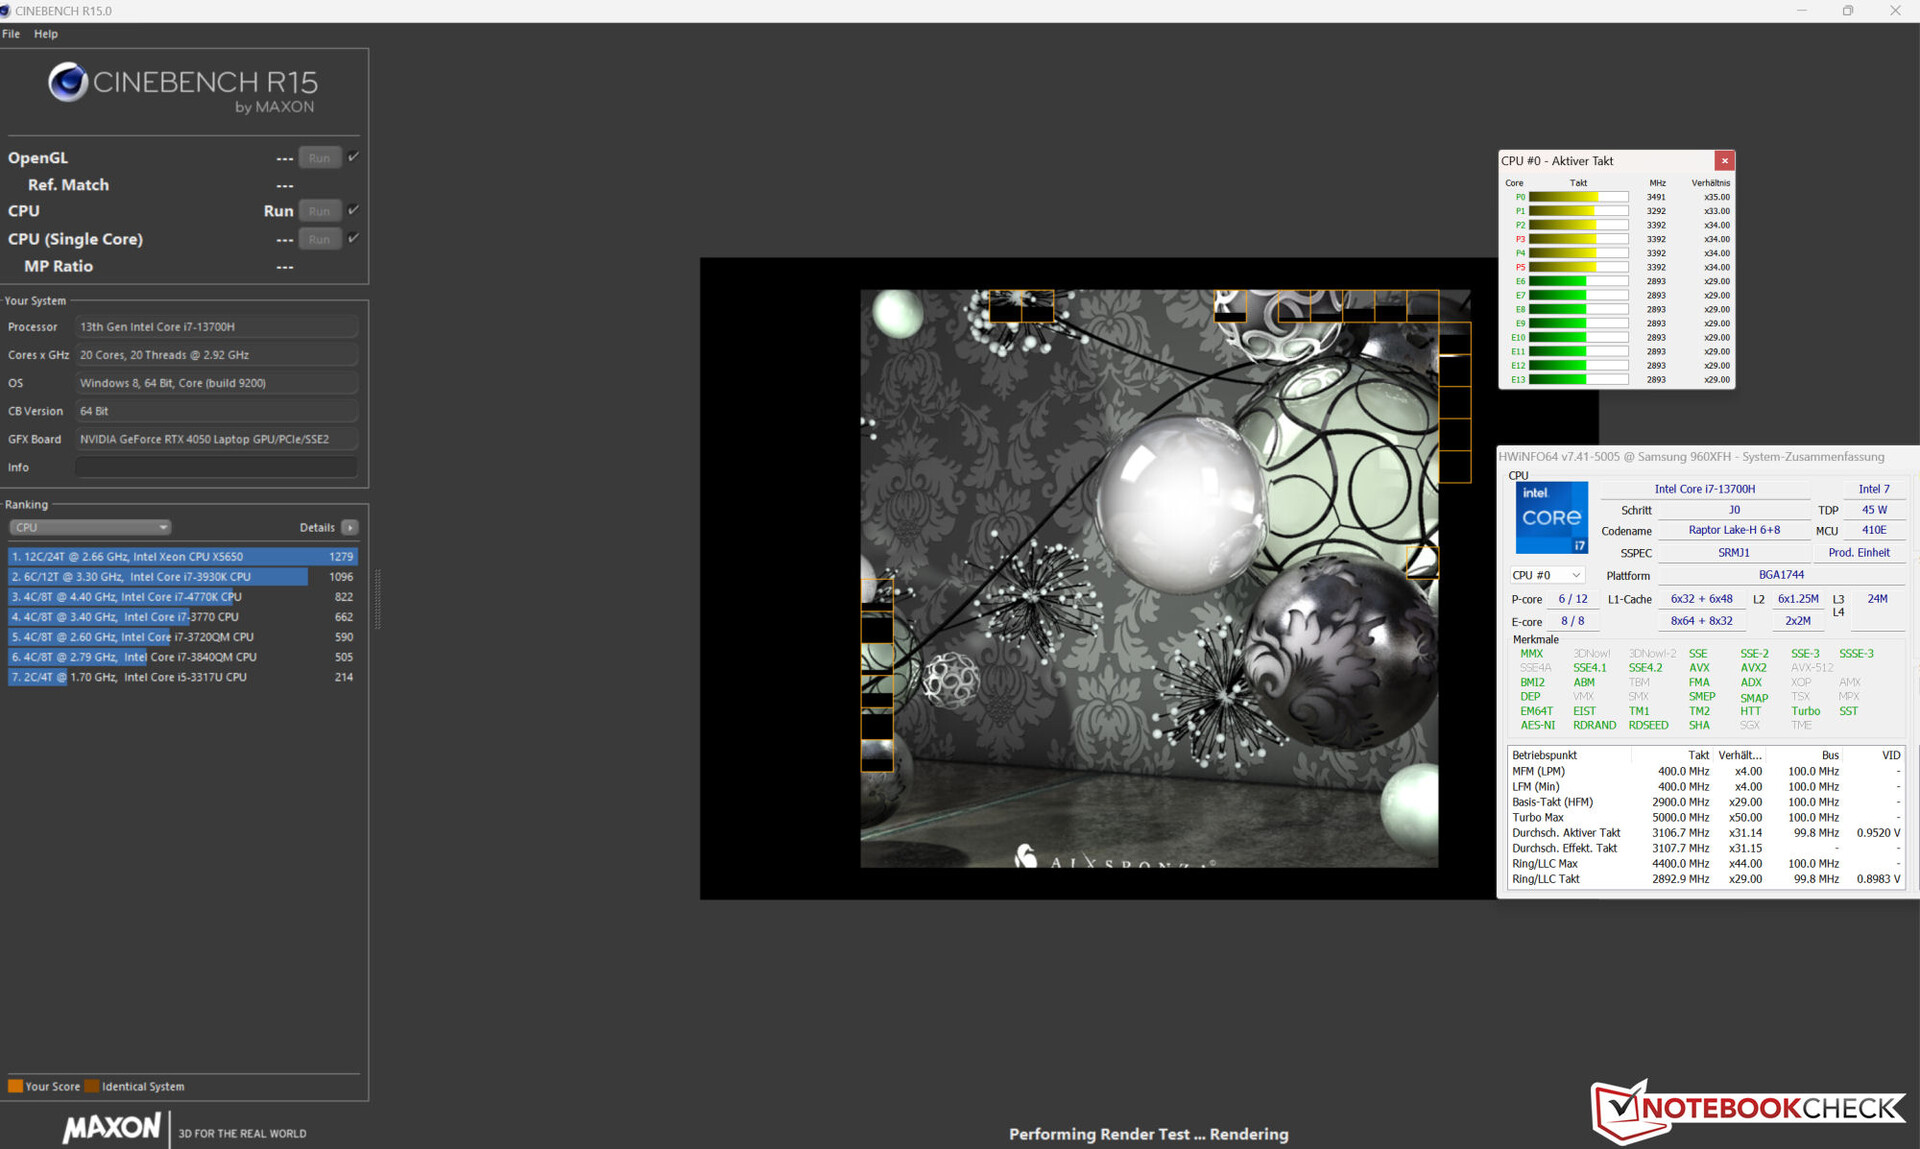
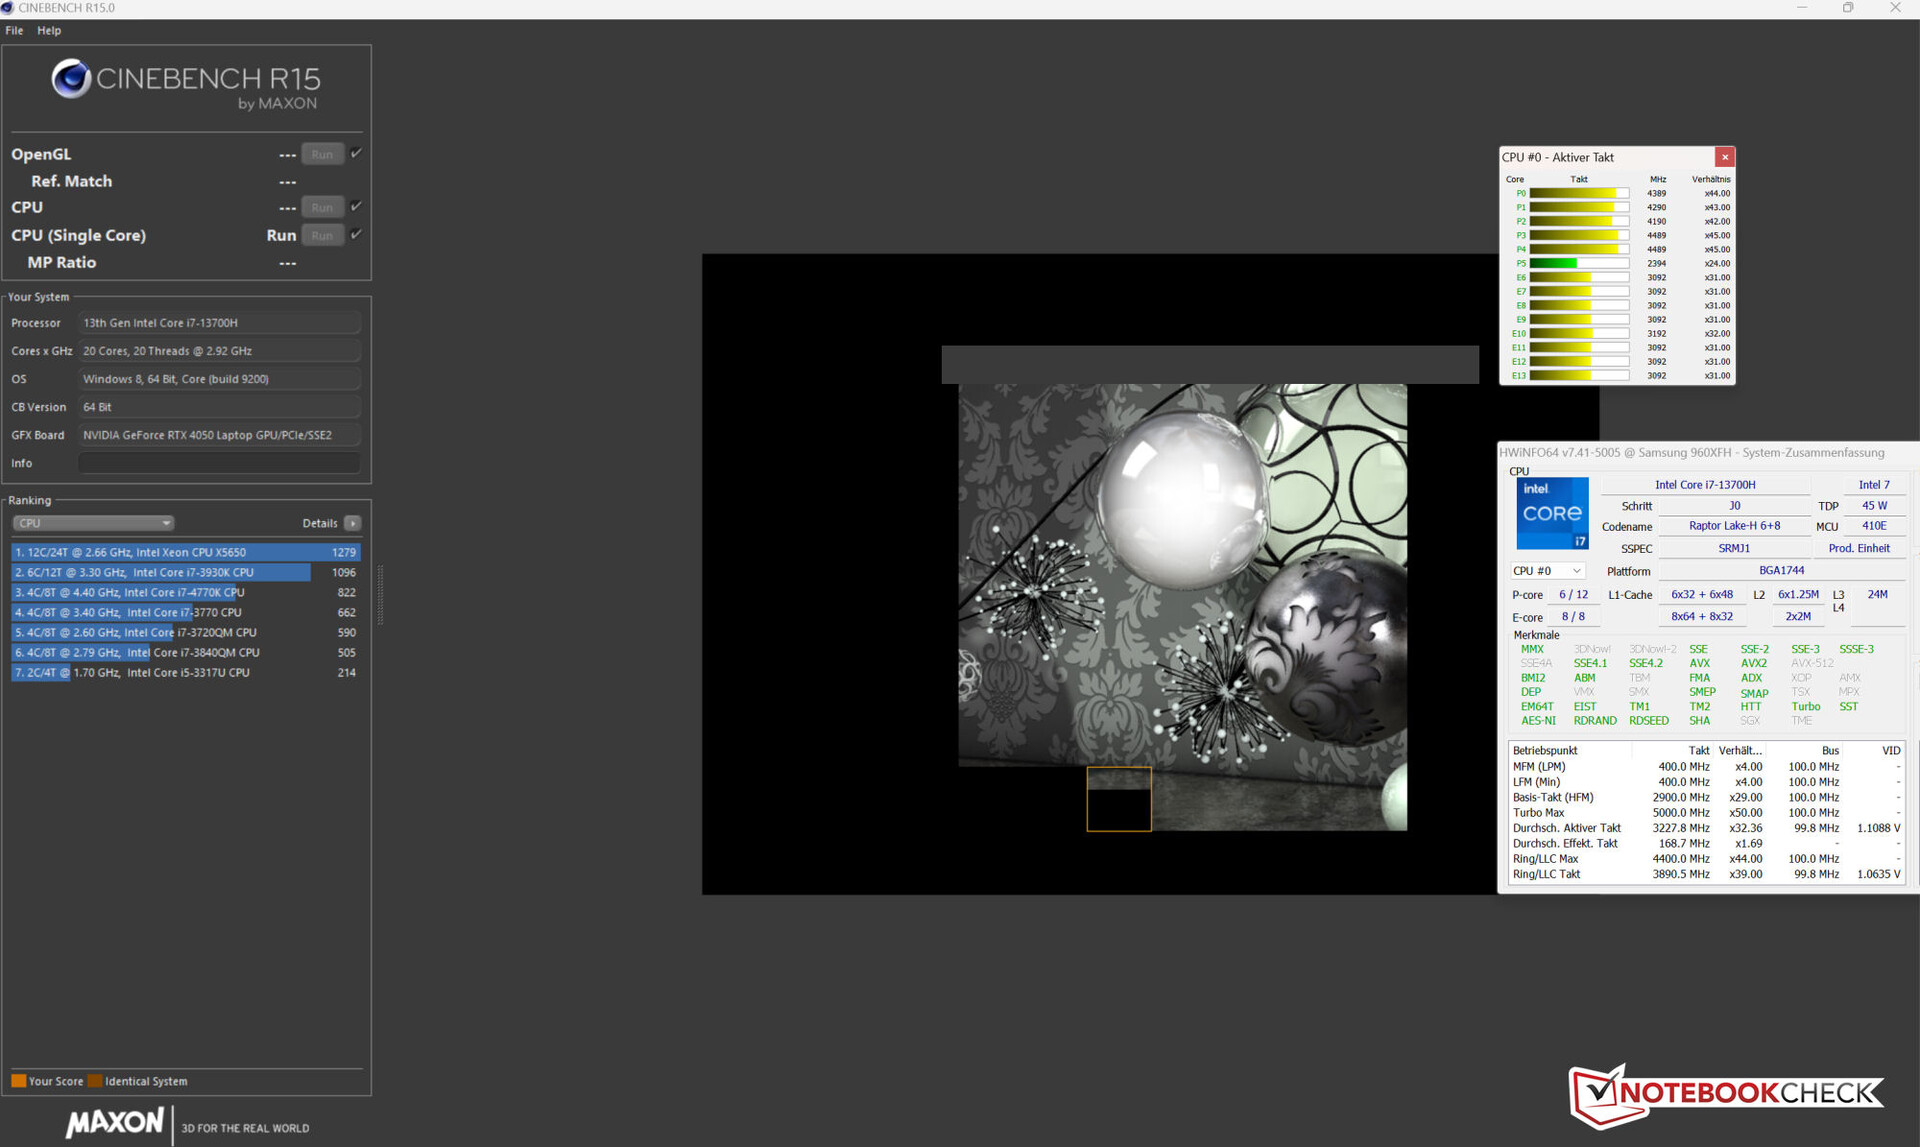
The Core i7-13700H (Raptor Lake) består av åtta effektiva kärnor (ingen hyperthreading, 1,8-3,7 GHz) och sex prestandakärnor (hyperthreading, 2,4-5 GHz). Detta motsvarar totalt 20 logiska CPU-kärnor.
Prestandalägena "High Performance" och "Optimized" ger benchmarkresultat som ligger ungefär på samma nivå som det CPU-genomsnitt som fastställts hittills. Profilen "Silent" pressar ner dessa värden långt, men ger ändå mer än tillräckligt med prestanda för daglig användning
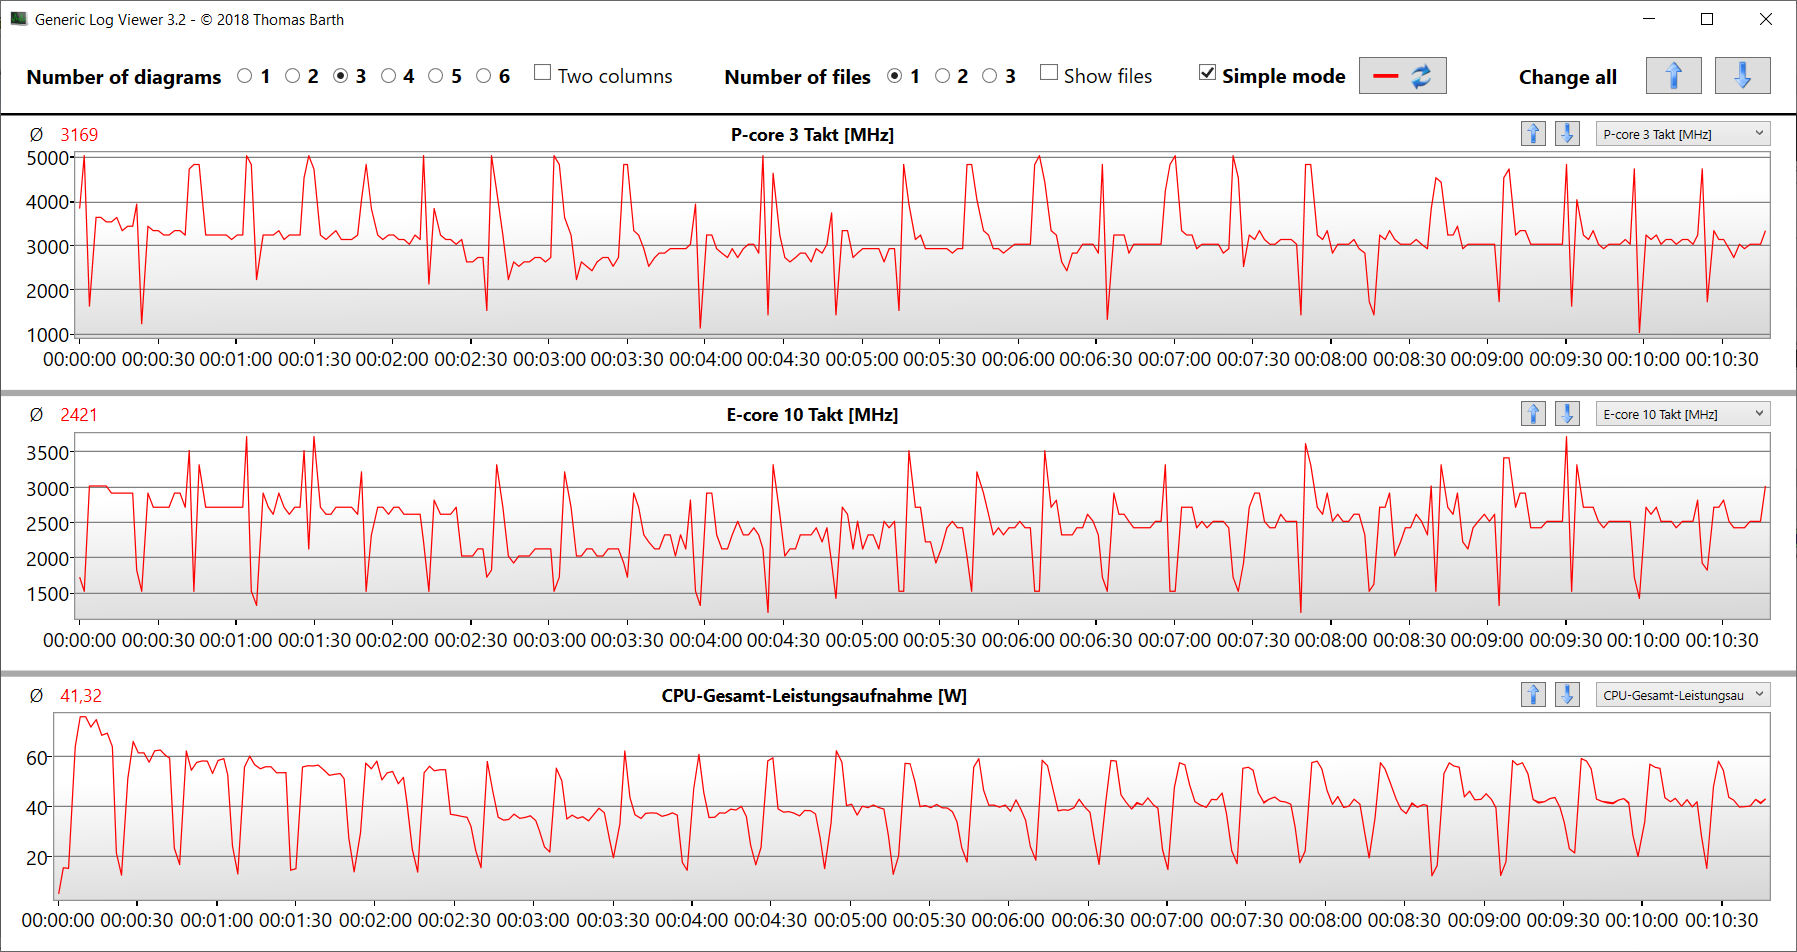
CB15-slingtestet avslöjar att kontinuerlig belastning med flera trådar gör att turboklockan sjunker med varje ytterligare körning och fluktuerar från och med den åttonde körningen. En konstant nivå kan inte upprätthållas. Profilen "High Performance" garanterar en högre genomsnittlig klocka och lägre fluktuationer.
Cinebench R15 Multi Sustained Load
| CPU Performance rating - Percent | |
| Genomsnitt av klass Multimedia | |
| Samsung Galaxy Book3 Ultra 16 | |
| Genomsnitt Intel Core i7-13700H | |
| Dell XPS 15 9520 RTX 3050 Ti | |
| Samsung Galaxy Book3 Ultra 16 | |
| Schenker Vision 16 Pro RTX 3070 Ti | |
| Lenovo ThinkBook 16p G3 ARH | |
| Acer Swift X SFX16-52G-77RX | |
| Samsung Galaxy Book3 Ultra 16 | |
| LG Gram 17Z90Q-E.AD78G | |
| Asus VivoBook Pro 16X OLED N7600PC-L2026X | |
| Cinebench R23 | |
| Multi Core | |
| Genomsnitt av klass Multimedia (4861 - 33362, n=74, senaste 2 åren) | |
| Samsung Galaxy Book3 Ultra 16 | |
| Genomsnitt Intel Core i7-13700H (5890 - 20034, n=29) | |
| Samsung Galaxy Book3 Ultra 16 (Hohe Leistung) | |
| Dell XPS 15 9520 RTX 3050 Ti | |
| Lenovo ThinkBook 16p G3 ARH | |
| Schenker Vision 16 Pro RTX 3070 Ti | |
| Samsung Galaxy Book3 Ultra 16 (Leise) | |
| Acer Swift X SFX16-52G-77RX | |
| LG Gram 17Z90Q-E.AD78G | |
| LG Gram 17Z90Q-E.AD78G | |
| Asus VivoBook Pro 16X OLED N7600PC-L2026X | |
| Single Core | |
| Genomsnitt av klass Multimedia (1128 - 2459, n=66, senaste 2 åren) | |
| Samsung Galaxy Book3 Ultra 16 (Hohe Leistung) | |
| Schenker Vision 16 Pro RTX 3070 Ti | |
| Genomsnitt Intel Core i7-13700H (1323 - 1914, n=29) | |
| Dell XPS 15 9520 RTX 3050 Ti | |
| Acer Swift X SFX16-52G-77RX | |
| Samsung Galaxy Book3 Ultra 16 | |
| LG Gram 17Z90Q-E.AD78G | |
| Lenovo ThinkBook 16p G3 ARH | |
| Asus VivoBook Pro 16X OLED N7600PC-L2026X | |
| Samsung Galaxy Book3 Ultra 16 (Leise) | |
| Cinebench R20 | |
| CPU (Multi Core) | |
| Genomsnitt av klass Multimedia (1887 - 12912, n=57, senaste 2 åren) | |
| Samsung Galaxy Book3 Ultra 16 | |
| Genomsnitt Intel Core i7-13700H (2322 - 7674, n=29) | |
| Samsung Galaxy Book3 Ultra 16 (Hohe Leistung) | |
| Dell XPS 15 9520 RTX 3050 Ti | |
| Lenovo ThinkBook 16p G3 ARH | |
| Schenker Vision 16 Pro RTX 3070 Ti | |
| Samsung Galaxy Book3 Ultra 16 (Leise) | |
| Acer Swift X SFX16-52G-77RX | |
| LG Gram 17Z90Q-E.AD78G | |
| Asus VivoBook Pro 16X OLED N7600PC-L2026X | |
| CPU (Single Core) | |
| Genomsnitt av klass Multimedia (425 - 853, n=57, senaste 2 åren) | |
| Samsung Galaxy Book3 Ultra 16 (Hohe Leistung) | |
| Schenker Vision 16 Pro RTX 3070 Ti | |
| Genomsnitt Intel Core i7-13700H (508 - 741, n=29) | |
| Dell XPS 15 9520 RTX 3050 Ti | |
| Acer Swift X SFX16-52G-77RX | |
| Samsung Galaxy Book3 Ultra 16 | |
| LG Gram 17Z90Q-E.AD78G | |
| Lenovo ThinkBook 16p G3 ARH | |
| Asus VivoBook Pro 16X OLED N7600PC-L2026X | |
| Samsung Galaxy Book3 Ultra 16 (Leise) | |
| Cinebench R15 | |
| CPU Multi 64Bit | |
| Schenker Vision 16 Pro RTX 3070 Ti (Turbo) | |
| Schenker Vision 16 Pro RTX 3070 Ti | |
| Genomsnitt av klass Multimedia (856 - 5224, n=61, senaste 2 åren) | |
| Samsung Galaxy Book3 Ultra 16 | |
| Samsung Galaxy Book3 Ultra 16 (Hohe Leistung) | |
| Genomsnitt Intel Core i7-13700H (905 - 2982, n=29) | |
| Samsung Galaxy Book3 Ultra 16 (Leise) | |
| Dell XPS 15 9520 RTX 3050 Ti | |
| Lenovo ThinkBook 16p G3 ARH | |
| Acer Swift X SFX16-52G-77RX | |
| LG Gram 17Z90Q-E.AD78G | |
| Asus VivoBook Pro 16X OLED N7600PC-L2026X | |
| CPU Single 64Bit | |
| Genomsnitt av klass Multimedia (184.8 - 326, n=59, senaste 2 åren) | |
| Samsung Galaxy Book3 Ultra 16 (Hohe Leistung) | |
| Schenker Vision 16 Pro RTX 3070 Ti | |
| Genomsnitt Intel Core i7-13700H (213 - 278, n=29) | |
| Dell XPS 15 9520 RTX 3050 Ti | |
| Acer Swift X SFX16-52G-77RX | |
| Samsung Galaxy Book3 Ultra 16 | |
| Lenovo ThinkBook 16p G3 ARH | |
| Asus VivoBook Pro 16X OLED N7600PC-L2026X | |
| Asus VivoBook Pro 16X OLED N7600PC-L2026X | |
| LG Gram 17Z90Q-E.AD78G | |
| Samsung Galaxy Book3 Ultra 16 (Leise) | |
| Blender - v2.79 BMW27 CPU | |
| Asus VivoBook Pro 16X OLED N7600PC-L2026X | |
| LG Gram 17Z90Q-E.AD78G | |
| Acer Swift X SFX16-52G-77RX | |
| Samsung Galaxy Book3 Ultra 16 (Leise) | |
| Schenker Vision 16 Pro RTX 3070 Ti | |
| Genomsnitt av klass Multimedia (100 - 557, n=58, senaste 2 åren) | |
| Lenovo ThinkBook 16p G3 ARH | |
| Genomsnitt Intel Core i7-13700H (169 - 555, n=29) | |
| Dell XPS 15 9520 RTX 3050 Ti | |
| Samsung Galaxy Book3 Ultra 16 | |
| Samsung Galaxy Book3 Ultra 16 (Hohe Leistung) | |
| 7-Zip 18.03 | |
| 7z b 4 | |
| Dell XPS 15 9520 RTX 3050 Ti | |
| Samsung Galaxy Book3 Ultra 16 | |
| Genomsnitt Intel Core i7-13700H (27322 - 76344, n=29) | |
| Genomsnitt av klass Multimedia (26062 - 130368, n=55, senaste 2 åren) | |
| Samsung Galaxy Book3 Ultra 16 (Hohe Leistung) | |
| Lenovo ThinkBook 16p G3 ARH | |
| Schenker Vision 16 Pro RTX 3070 Ti | |
| Samsung Galaxy Book3 Ultra 16 (Leise) | |
| Acer Swift X SFX16-52G-77RX | |
| LG Gram 17Z90Q-E.AD78G | |
| Asus VivoBook Pro 16X OLED N7600PC-L2026X | |
| 7z b 4 -mmt1 | |
| Samsung Galaxy Book3 Ultra 16 (Hohe Leistung) | |
| Genomsnitt av klass Multimedia (3666 - 7545, n=56, senaste 2 åren) | |
| Genomsnitt Intel Core i7-13700H (4825 - 6238, n=29) | |
| Schenker Vision 16 Pro RTX 3070 Ti | |
| Dell XPS 15 9520 RTX 3050 Ti | |
| Samsung Galaxy Book3 Ultra 16 | |
| Asus VivoBook Pro 16X OLED N7600PC-L2026X | |
| Acer Swift X SFX16-52G-77RX | |
| Lenovo ThinkBook 16p G3 ARH | |
| LG Gram 17Z90Q-E.AD78G | |
| Samsung Galaxy Book3 Ultra 16 (Leise) | |
| Geekbench 5.5 | |
| Multi-Core | |
| Genomsnitt av klass Multimedia (4652 - 20422, n=56, senaste 2 åren) | |
| Samsung Galaxy Book3 Ultra 16 (Hohe Leistung) | |
| Dell XPS 15 9520 RTX 3050 Ti | |
| Genomsnitt Intel Core i7-13700H (6165 - 14215, n=29) | |
| Samsung Galaxy Book3 Ultra 16 | |
| Schenker Vision 16 Pro RTX 3070 Ti | |
| Acer Swift X SFX16-52G-77RX | |
| Samsung Galaxy Book3 Ultra 16 (Leise) | |
| Lenovo ThinkBook 16p G3 ARH | |
| LG Gram 17Z90Q-E.AD78G | |
| Asus VivoBook Pro 16X OLED N7600PC-L2026X | |
| Single-Core | |
| Genomsnitt av klass Multimedia (805 - 2974, n=56, senaste 2 åren) | |
| Samsung Galaxy Book3 Ultra 16 (Hohe Leistung) | |
| Schenker Vision 16 Pro RTX 3070 Ti | |
| Genomsnitt Intel Core i7-13700H (1362 - 1919, n=29) | |
| Acer Swift X SFX16-52G-77RX | |
| Dell XPS 15 9520 RTX 3050 Ti | |
| Samsung Galaxy Book3 Ultra 16 | |
| LG Gram 17Z90Q-E.AD78G | |
| Lenovo ThinkBook 16p G3 ARH | |
| Asus VivoBook Pro 16X OLED N7600PC-L2026X | |
| Samsung Galaxy Book3 Ultra 16 (Leise) | |
| HWBOT x265 Benchmark v2.2 - 4k Preset | |
| Genomsnitt av klass Multimedia (5.26 - 36.1, n=56, senaste 2 åren) | |
| Samsung Galaxy Book3 Ultra 16 (Hohe Leistung) | |
| Lenovo ThinkBook 16p G3 ARH | |
| Samsung Galaxy Book3 Ultra 16 | |
| Genomsnitt Intel Core i7-13700H (6.72 - 21.2, n=29) | |
| Dell XPS 15 9520 RTX 3050 Ti | |
| Schenker Vision 16 Pro RTX 3070 Ti | |
| Acer Swift X SFX16-52G-77RX | |
| Samsung Galaxy Book3 Ultra 16 (Leise) | |
| LG Gram 17Z90Q-E.AD78G | |
| Asus VivoBook Pro 16X OLED N7600PC-L2026X | |
| LibreOffice - 20 Documents To PDF | |
| LG Gram 17Z90Q-E.AD78G | |
| Lenovo ThinkBook 16p G3 ARH | |
| Acer Swift X SFX16-52G-77RX | |
| Asus VivoBook Pro 16X OLED N7600PC-L2026X | |
| Samsung Galaxy Book3 Ultra 16 (Leise) | |
| Genomsnitt av klass Multimedia (23.9 - 146.7, n=57, senaste 2 åren) | |
| Samsung Galaxy Book3 Ultra 16 | |
| Genomsnitt Intel Core i7-13700H (31.3 - 62.4, n=29) | |
| Schenker Vision 16 Pro RTX 3070 Ti | |
| Dell XPS 15 9520 RTX 3050 Ti | |
| Samsung Galaxy Book3 Ultra 16 (Hohe Leistung) | |
| R Benchmark 2.5 - Overall mean | |
| Samsung Galaxy Book3 Ultra 16 (Leise) | |
| Asus VivoBook Pro 16X OLED N7600PC-L2026X | |
| LG Gram 17Z90Q-E.AD78G | |
| Lenovo ThinkBook 16p G3 ARH | |
| Samsung Galaxy Book3 Ultra 16 | |
| Samsung Galaxy Book3 Ultra 16 (Hohe Leistung) | |
| Acer Swift X SFX16-52G-77RX | |
| Genomsnitt Intel Core i7-13700H (0.4308 - 0.607, n=29) | |
| Genomsnitt av klass Multimedia (0.3604 - 0.947, n=56, senaste 2 åren) | |
| Schenker Vision 16 Pro RTX 3070 Ti | |
| Dell XPS 15 9520 RTX 3050 Ti | |
* ... mindre är bättre
AIDA64: FP32 Ray-Trace | FPU Julia | CPU SHA3 | CPU Queen | FPU SinJulia | FPU Mandel | CPU AES | CPU ZLib | FP64 Ray-Trace | CPU PhotoWorxx
| Performance rating | |
| Genomsnitt av klass Multimedia | |
| Lenovo ThinkBook 16p G3 ARH | |
| Samsung Galaxy Book3 Ultra 16 | |
| Genomsnitt Intel Core i7-13700H | |
| Schenker Vision 16 Pro RTX 3070 Ti | |
| Dell XPS 15 9520 RTX 3050 Ti | |
| Acer Swift X SFX16-52G-77RX | |
| LG Gram 17Z90Q-E.AD78G | |
| Asus VivoBook Pro 16X OLED N7600PC-L2026X | |
| AIDA64 / FP32 Ray-Trace | |
| Genomsnitt av klass Multimedia (2214 - 50388, n=53, senaste 2 åren) | |
| Lenovo ThinkBook 16p G3 ARH (v6.75.6100) | |
| Samsung Galaxy Book3 Ultra 16 (v6.75.6100) | |
| Genomsnitt Intel Core i7-13700H (4986 - 18908, n=29) | |
| Schenker Vision 16 Pro RTX 3070 Ti (v6.75.6100) | |
| Acer Swift X SFX16-52G-77RX (v6.70.6000) | |
| Dell XPS 15 9520 RTX 3050 Ti (v6.50.5800) | |
| Asus VivoBook Pro 16X OLED N7600PC-L2026X (v6.75.6100) | |
| LG Gram 17Z90Q-E.AD78G (v6.50.5800) | |
| AIDA64 / FPU Julia | |
| Lenovo ThinkBook 16p G3 ARH (v6.75.6100) | |
| Genomsnitt av klass Multimedia (12867 - 201874, n=54, senaste 2 åren) | |
| Genomsnitt Intel Core i7-13700H (25360 - 92359, n=29) | |
| Samsung Galaxy Book3 Ultra 16 (v6.75.6100) | |
| Schenker Vision 16 Pro RTX 3070 Ti (v6.75.6100) | |
| Acer Swift X SFX16-52G-77RX (v6.70.6000) | |
| Dell XPS 15 9520 RTX 3050 Ti (v6.50.5800) | |
| Asus VivoBook Pro 16X OLED N7600PC-L2026X (v6.75.6100) | |
| LG Gram 17Z90Q-E.AD78G (v6.50.5800) | |
| AIDA64 / CPU SHA3 | |
| Genomsnitt av klass Multimedia (626 - 8623, n=54, senaste 2 åren) | |
| Lenovo ThinkBook 16p G3 ARH (v6.75.6100) | |
| Samsung Galaxy Book3 Ultra 16 (v6.75.6100) | |
| Genomsnitt Intel Core i7-13700H (1339 - 4224, n=29) | |
| Schenker Vision 16 Pro RTX 3070 Ti (v6.75.6100) | |
| Dell XPS 15 9520 RTX 3050 Ti (v6.50.5800) | |
| Acer Swift X SFX16-52G-77RX (v6.70.6000) | |
| Asus VivoBook Pro 16X OLED N7600PC-L2026X (v6.75.6100) | |
| LG Gram 17Z90Q-E.AD78G (v6.50.5800) | |
| AIDA64 / CPU Queen | |
| Lenovo ThinkBook 16p G3 ARH (v6.75.6100) | |
| Samsung Galaxy Book3 Ultra 16 (v6.75.6100) | |
| Dell XPS 15 9520 RTX 3050 Ti (v6.50.5800) | |
| Genomsnitt Intel Core i7-13700H (59324 - 107159, n=29) | |
| Schenker Vision 16 Pro RTX 3070 Ti (v6.75.6100) | |
| Acer Swift X SFX16-52G-77RX (v6.70.6000) | |
| Genomsnitt av klass Multimedia (13483 - 181505, n=41, senaste 2 åren) | |
| LG Gram 17Z90Q-E.AD78G (v6.50.5800) | |
| Asus VivoBook Pro 16X OLED N7600PC-L2026X (v6.75.6100) | |
| AIDA64 / FPU SinJulia | |
| Lenovo ThinkBook 16p G3 ARH (v6.75.6100) | |
| Samsung Galaxy Book3 Ultra 16 (v6.75.6100) | |
| Genomsnitt Intel Core i7-13700H (4800 - 11050, n=29) | |
| Genomsnitt av klass Multimedia (886 - 28794, n=54, senaste 2 åren) | |
| Dell XPS 15 9520 RTX 3050 Ti (v6.50.5800) | |
| Schenker Vision 16 Pro RTX 3070 Ti (v6.75.6100) | |
| Acer Swift X SFX16-52G-77RX (v6.70.6000) | |
| LG Gram 17Z90Q-E.AD78G (v6.50.5800) | |
| Asus VivoBook Pro 16X OLED N7600PC-L2026X (v6.75.6100) | |
| AIDA64 / FPU Mandel | |
| Lenovo ThinkBook 16p G3 ARH (v6.75.6100) | |
| Genomsnitt av klass Multimedia (6395 - 105740, n=53, senaste 2 åren) | |
| Samsung Galaxy Book3 Ultra 16 (v6.75.6100) | |
| Genomsnitt Intel Core i7-13700H (12321 - 45118, n=29) | |
| Schenker Vision 16 Pro RTX 3070 Ti (v6.75.6100) | |
| Acer Swift X SFX16-52G-77RX (v6.70.6000) | |
| Dell XPS 15 9520 RTX 3050 Ti (v6.50.5800) | |
| Asus VivoBook Pro 16X OLED N7600PC-L2026X (v6.75.6100) | |
| LG Gram 17Z90Q-E.AD78G (v6.50.5800) | |
| AIDA64 / CPU AES | |
| Dell XPS 15 9520 RTX 3050 Ti (v6.50.5800) | |
| Genomsnitt Intel Core i7-13700H (28769 - 151254, n=29) | |
| Samsung Galaxy Book3 Ultra 16 (v6.75.6100) | |
| Genomsnitt av klass Multimedia (8171 - 126790, n=54, senaste 2 åren) | |
| Schenker Vision 16 Pro RTX 3070 Ti (v6.75.6100) | |
| Asus VivoBook Pro 16X OLED N7600PC-L2026X (v6.75.6100) | |
| Lenovo ThinkBook 16p G3 ARH (v6.75.6100) | |
| Acer Swift X SFX16-52G-77RX (v6.70.6000) | |
| LG Gram 17Z90Q-E.AD78G (v6.50.5800) | |
| AIDA64 / CPU ZLib | |
| Samsung Galaxy Book3 Ultra 16 (v6.75.6100) | |
| Genomsnitt av klass Multimedia (143.8 - 2022, n=54, senaste 2 åren) | |
| Genomsnitt Intel Core i7-13700H (389 - 1215, n=29) | |
| Lenovo ThinkBook 16p G3 ARH (v6.75.6100) | |
| Schenker Vision 16 Pro RTX 3070 Ti (v6.75.6100) | |
| Dell XPS 15 9520 RTX 3050 Ti (v6.50.5800) | |
| Acer Swift X SFX16-52G-77RX (v6.70.6000) | |
| LG Gram 17Z90Q-E.AD78G (v6.50.5800) | |
| Asus VivoBook Pro 16X OLED N7600PC-L2026X (v6.75.6100) | |
| AIDA64 / FP64 Ray-Trace | |
| Genomsnitt av klass Multimedia (1014 - 26875, n=54, senaste 2 åren) | |
| Lenovo ThinkBook 16p G3 ARH (v6.75.6100) | |
| Samsung Galaxy Book3 Ultra 16 (v6.75.6100) | |
| Genomsnitt Intel Core i7-13700H (2540 - 10135, n=29) | |
| Schenker Vision 16 Pro RTX 3070 Ti (v6.75.6100) | |
| Acer Swift X SFX16-52G-77RX (v6.70.6000) | |
| Dell XPS 15 9520 RTX 3050 Ti (v6.50.5800) | |
| Asus VivoBook Pro 16X OLED N7600PC-L2026X (v6.75.6100) | |
| LG Gram 17Z90Q-E.AD78G (v6.50.5800) | |
| AIDA64 / CPU PhotoWorxx | |
| Genomsnitt av klass Multimedia (8187 - 88154, n=54, senaste 2 åren) | |
| Samsung Galaxy Book3 Ultra 16 (v6.75.6100) | |
| Acer Swift X SFX16-52G-77RX (v6.70.6000) | |
| Schenker Vision 16 Pro RTX 3070 Ti (v6.75.6100) | |
| Genomsnitt Intel Core i7-13700H (12872 - 52727, n=29) | |
| LG Gram 17Z90Q-E.AD78G (v6.50.5800) | |
| Dell XPS 15 9520 RTX 3050 Ti (v6.50.5800) | |
| Lenovo ThinkBook 16p G3 ARH (v6.75.6100) | |
| Asus VivoBook Pro 16X OLED N7600PC-L2026X (v6.75.6100) | |
Systemets prestanda
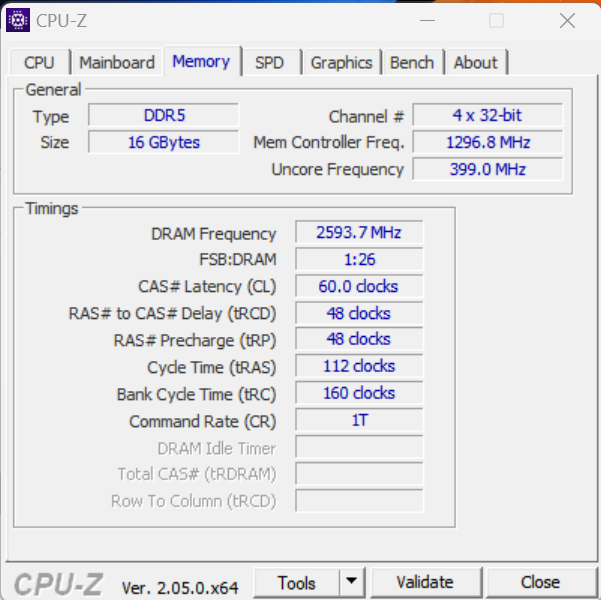
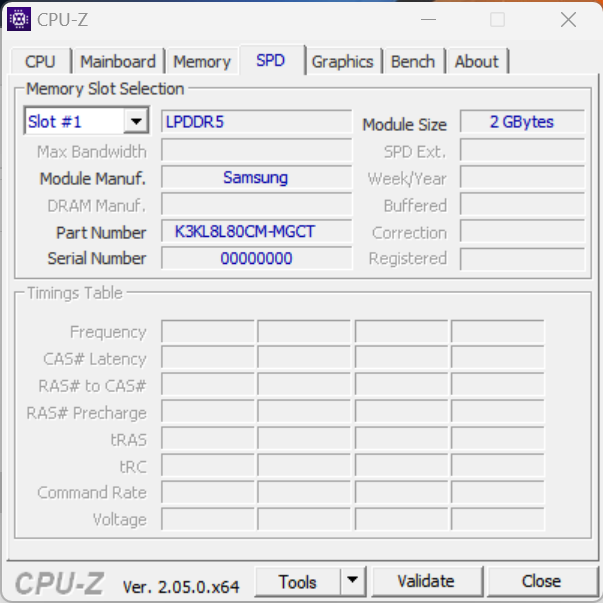
Det smidiga systemet är inte konstruerat för maximal prestanda. Målet är en kompromiss mellan kompakthet, rörlighet, energiförbrukning och prestanda. Trots detta kan den bärbara datorn hantera krävande tillämpningar som rendering och spel, vilket bekräftas av de goda PCMark-resultaten. RAM-minneets överföringshastigheter ligger på en normal nivå för LPDDR5-5200 RAM-minne.
CrossMark: Overall | Productivity | Creativity | Responsiveness
| PCMark 10 / Score | |
| Genomsnitt av klass Multimedia (4325 - 10386, n=52, senaste 2 åren) | |
| Genomsnitt Intel Core i7-13700H, NVIDIA GeForce RTX 4050 Laptop GPU (6822 - 7556, n=7) | |
| Dell XPS 15 9520 RTX 3050 Ti | |
| Lenovo ThinkBook 16p G3 ARH | |
| Samsung Galaxy Book3 Ultra 16 | |
| LG Gram 17Z90Q-E.AD78G | |
| Acer Swift X SFX16-52G-77RX | |
| Asus VivoBook Pro 16X OLED N7600PC-L2026X | |
| PCMark 10 / Essentials | |
| Dell XPS 15 9520 RTX 3050 Ti | |
| Genomsnitt Intel Core i7-13700H, NVIDIA GeForce RTX 4050 Laptop GPU (10283 - 11549, n=7) | |
| Acer Swift X SFX16-52G-77RX | |
| Samsung Galaxy Book3 Ultra 16 | |
| Genomsnitt av klass Multimedia (8025 - 11664, n=51, senaste 2 åren) | |
| Lenovo ThinkBook 16p G3 ARH | |
| LG Gram 17Z90Q-E.AD78G | |
| Asus VivoBook Pro 16X OLED N7600PC-L2026X | |
| PCMark 10 / Productivity | |
| Genomsnitt av klass Multimedia (7323 - 18233, n=51, senaste 2 åren) | |
| Dell XPS 15 9520 RTX 3050 Ti | |
| LG Gram 17Z90Q-E.AD78G | |
| Genomsnitt Intel Core i7-13700H, NVIDIA GeForce RTX 4050 Laptop GPU (8368 - 9836, n=7) | |
| Lenovo ThinkBook 16p G3 ARH | |
| Samsung Galaxy Book3 Ultra 16 | |
| Asus VivoBook Pro 16X OLED N7600PC-L2026X | |
| Acer Swift X SFX16-52G-77RX | |
| PCMark 10 / Digital Content Creation | |
| Genomsnitt av klass Multimedia (3651 - 16240, n=51, senaste 2 åren) | |
| Genomsnitt Intel Core i7-13700H, NVIDIA GeForce RTX 4050 Laptop GPU (9527 - 10643, n=7) | |
| Samsung Galaxy Book3 Ultra 16 | |
| Lenovo ThinkBook 16p G3 ARH | |
| Dell XPS 15 9520 RTX 3050 Ti | |
| LG Gram 17Z90Q-E.AD78G | |
| Acer Swift X SFX16-52G-77RX | |
| Asus VivoBook Pro 16X OLED N7600PC-L2026X | |
| CrossMark / Overall | |
| Genomsnitt av klass Multimedia (866 - 2728, n=60, senaste 2 åren) | |
| Dell XPS 15 9520 RTX 3050 Ti | |
| Genomsnitt Intel Core i7-13700H, NVIDIA GeForce RTX 4050 Laptop GPU (1205 - 1937, n=9) | |
| Acer Swift X SFX16-52G-77RX | |
| Schenker Vision 16 Pro RTX 3070 Ti | |
| Samsung Galaxy Book3 Ultra 16 | |
| Lenovo ThinkBook 16p G3 ARH | |
| LG Gram 17Z90Q-E.AD78G | |
| Asus VivoBook Pro 16X OLED N7600PC-L2026X | |
| CrossMark / Productivity | |
| Dell XPS 15 9520 RTX 3050 Ti | |
| Genomsnitt av klass Multimedia (931 - 2489, n=60, senaste 2 åren) | |
| Acer Swift X SFX16-52G-77RX | |
| Genomsnitt Intel Core i7-13700H, NVIDIA GeForce RTX 4050 Laptop GPU (1158 - 1877, n=9) | |
| Schenker Vision 16 Pro RTX 3070 Ti | |
| Lenovo ThinkBook 16p G3 ARH | |
| Samsung Galaxy Book3 Ultra 16 | |
| LG Gram 17Z90Q-E.AD78G | |
| Asus VivoBook Pro 16X OLED N7600PC-L2026X | |
| CrossMark / Creativity | |
| Genomsnitt av klass Multimedia (907 - 3465, n=60, senaste 2 åren) | |
| Dell XPS 15 9520 RTX 3050 Ti | |
| Genomsnitt Intel Core i7-13700H, NVIDIA GeForce RTX 4050 Laptop GPU (1293 - 2044, n=9) | |
| Schenker Vision 16 Pro RTX 3070 Ti | |
| Acer Swift X SFX16-52G-77RX | |
| Samsung Galaxy Book3 Ultra 16 | |
| LG Gram 17Z90Q-E.AD78G | |
| Lenovo ThinkBook 16p G3 ARH | |
| Asus VivoBook Pro 16X OLED N7600PC-L2026X | |
| CrossMark / Responsiveness | |
| Dell XPS 15 9520 RTX 3050 Ti | |
| Acer Swift X SFX16-52G-77RX | |
| Genomsnitt Intel Core i7-13700H, NVIDIA GeForce RTX 4050 Laptop GPU (1097 - 1929, n=9) | |
| Genomsnitt av klass Multimedia (605 - 2024, n=60, senaste 2 åren) | |
| Samsung Galaxy Book3 Ultra 16 | |
| Schenker Vision 16 Pro RTX 3070 Ti | |
| Lenovo ThinkBook 16p G3 ARH | |
| LG Gram 17Z90Q-E.AD78G | |
| Asus VivoBook Pro 16X OLED N7600PC-L2026X | |
| PCMark 8 Home Score Accelerated v2 | 4564 poäng | |
| PCMark 8 Work Score Accelerated v2 | 5090 poäng | |
| PCMark 10 Score | 6822 poäng | |
Hjälp | ||
| AIDA64 / Memory Copy | |
| Genomsnitt av klass Multimedia (11299 - 132135, n=54, senaste 2 åren) | |
| Samsung Galaxy Book3 Ultra 16 | |
| LG Gram 17Z90Q-E.AD78G | |
| Acer Swift X SFX16-52G-77RX | |
| Schenker Vision 16 Pro RTX 3070 Ti | |
| Genomsnitt Intel Core i7-13700H (24334 - 78081, n=29) | |
| Dell XPS 15 9520 RTX 3050 Ti | |
| Lenovo ThinkBook 16p G3 ARH | |
| Asus VivoBook Pro 16X OLED N7600PC-L2026X | |
| AIDA64 / Memory Read | |
| Genomsnitt av klass Multimedia (11624 - 174586, n=54, senaste 2 åren) | |
| LG Gram 17Z90Q-E.AD78G | |
| Samsung Galaxy Book3 Ultra 16 | |
| Acer Swift X SFX16-52G-77RX | |
| Schenker Vision 16 Pro RTX 3070 Ti | |
| Genomsnitt Intel Core i7-13700H (23681 - 79656, n=29) | |
| Dell XPS 15 9520 RTX 3050 Ti | |
| Lenovo ThinkBook 16p G3 ARH | |
| Asus VivoBook Pro 16X OLED N7600PC-L2026X | |
| AIDA64 / Memory Write | |
| Samsung Galaxy Book3 Ultra 16 | |
| Genomsnitt av klass Multimedia (11755 - 134998, n=54, senaste 2 åren) | |
| Genomsnitt Intel Core i7-13700H (22986 - 99898, n=29) | |
| Schenker Vision 16 Pro RTX 3070 Ti | |
| LG Gram 17Z90Q-E.AD78G | |
| Acer Swift X SFX16-52G-77RX | |
| Dell XPS 15 9520 RTX 3050 Ti | |
| Lenovo ThinkBook 16p G3 ARH | |
| Asus VivoBook Pro 16X OLED N7600PC-L2026X | |
| AIDA64 / Memory Latency | |
| Genomsnitt av klass Multimedia (7 - 535, n=53, senaste 2 åren) | |
| Lenovo ThinkBook 16p G3 ARH | |
| Acer Swift X SFX16-52G-77RX | |
| LG Gram 17Z90Q-E.AD78G | |
| Dell XPS 15 9520 RTX 3050 Ti | |
| Samsung Galaxy Book3 Ultra 16 | |
| Genomsnitt Intel Core i7-13700H (82.4 - 136.8, n=29) | |
| Schenker Vision 16 Pro RTX 3070 Ti | |
| Asus VivoBook Pro 16X OLED N7600PC-L2026X | |
* ... mindre är bättre
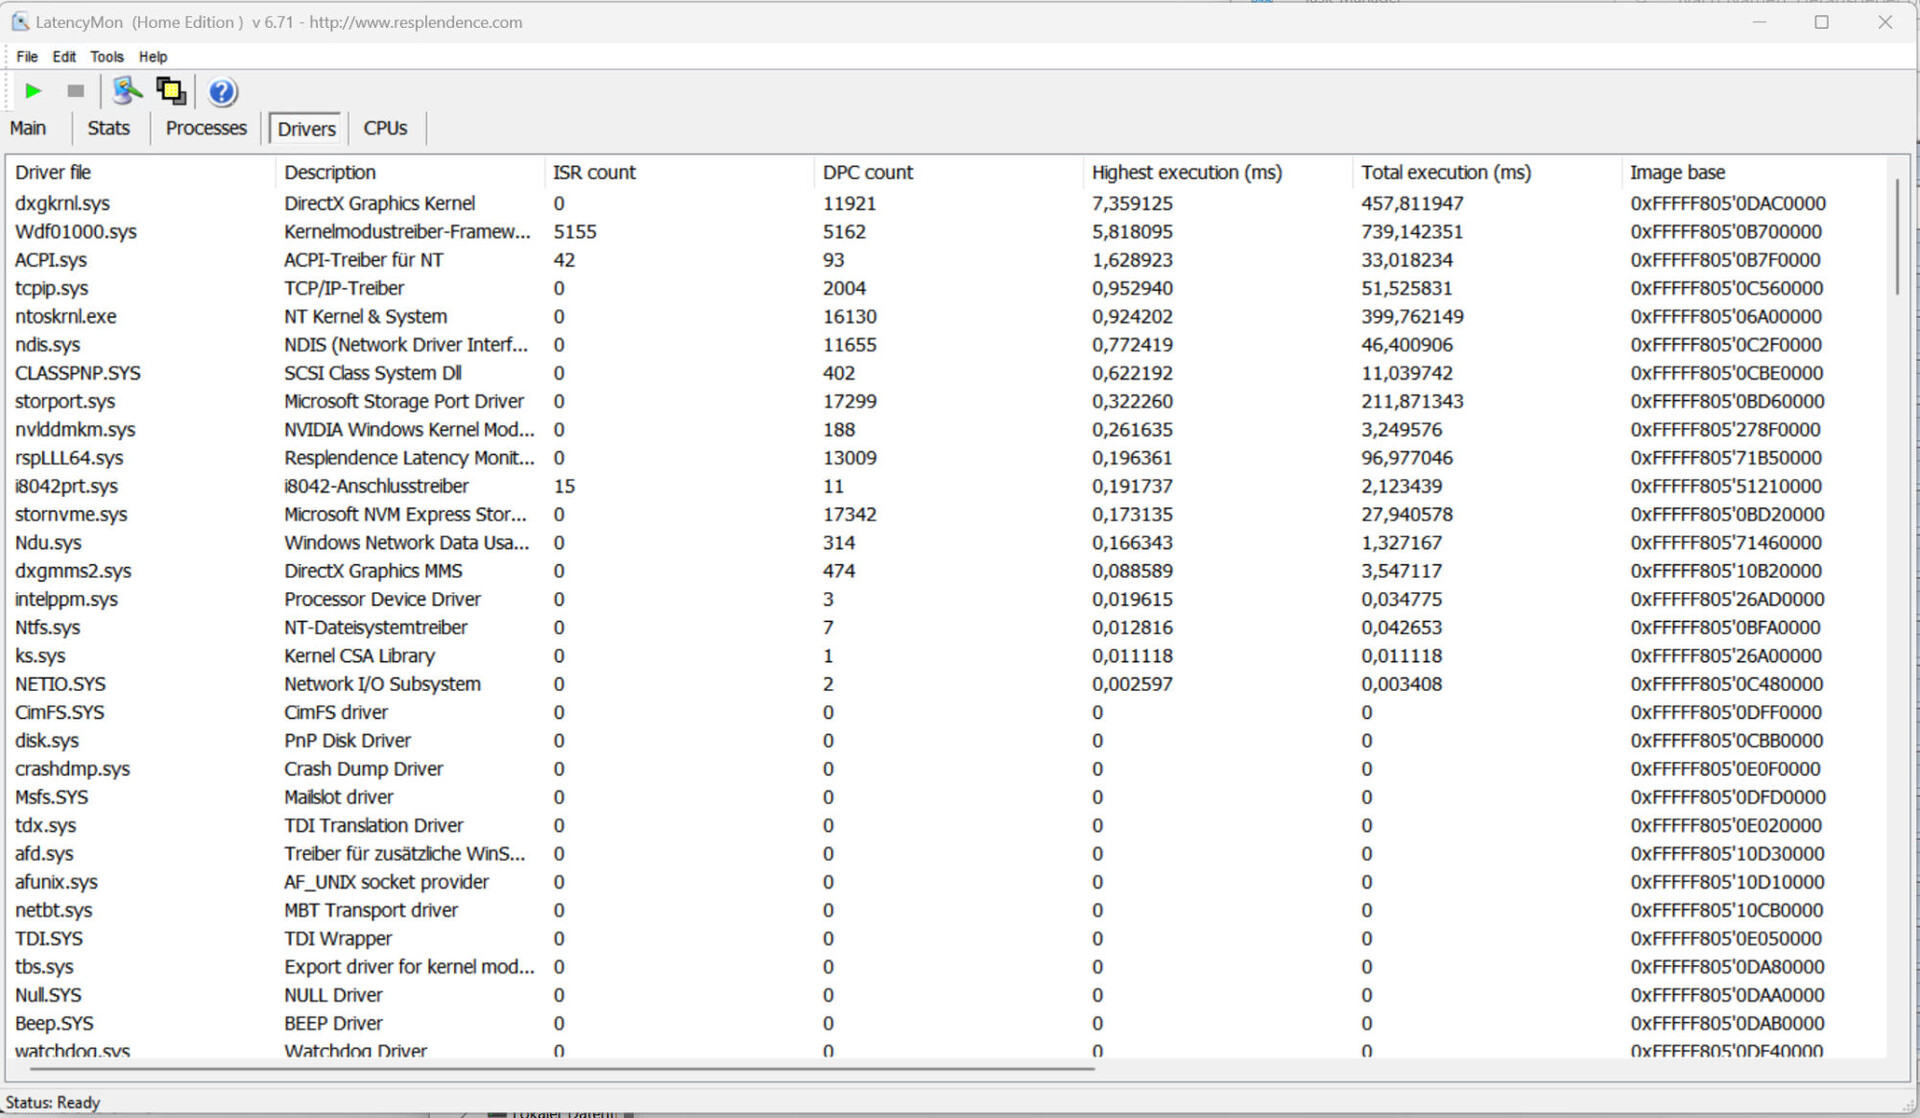
DPC-latenstid
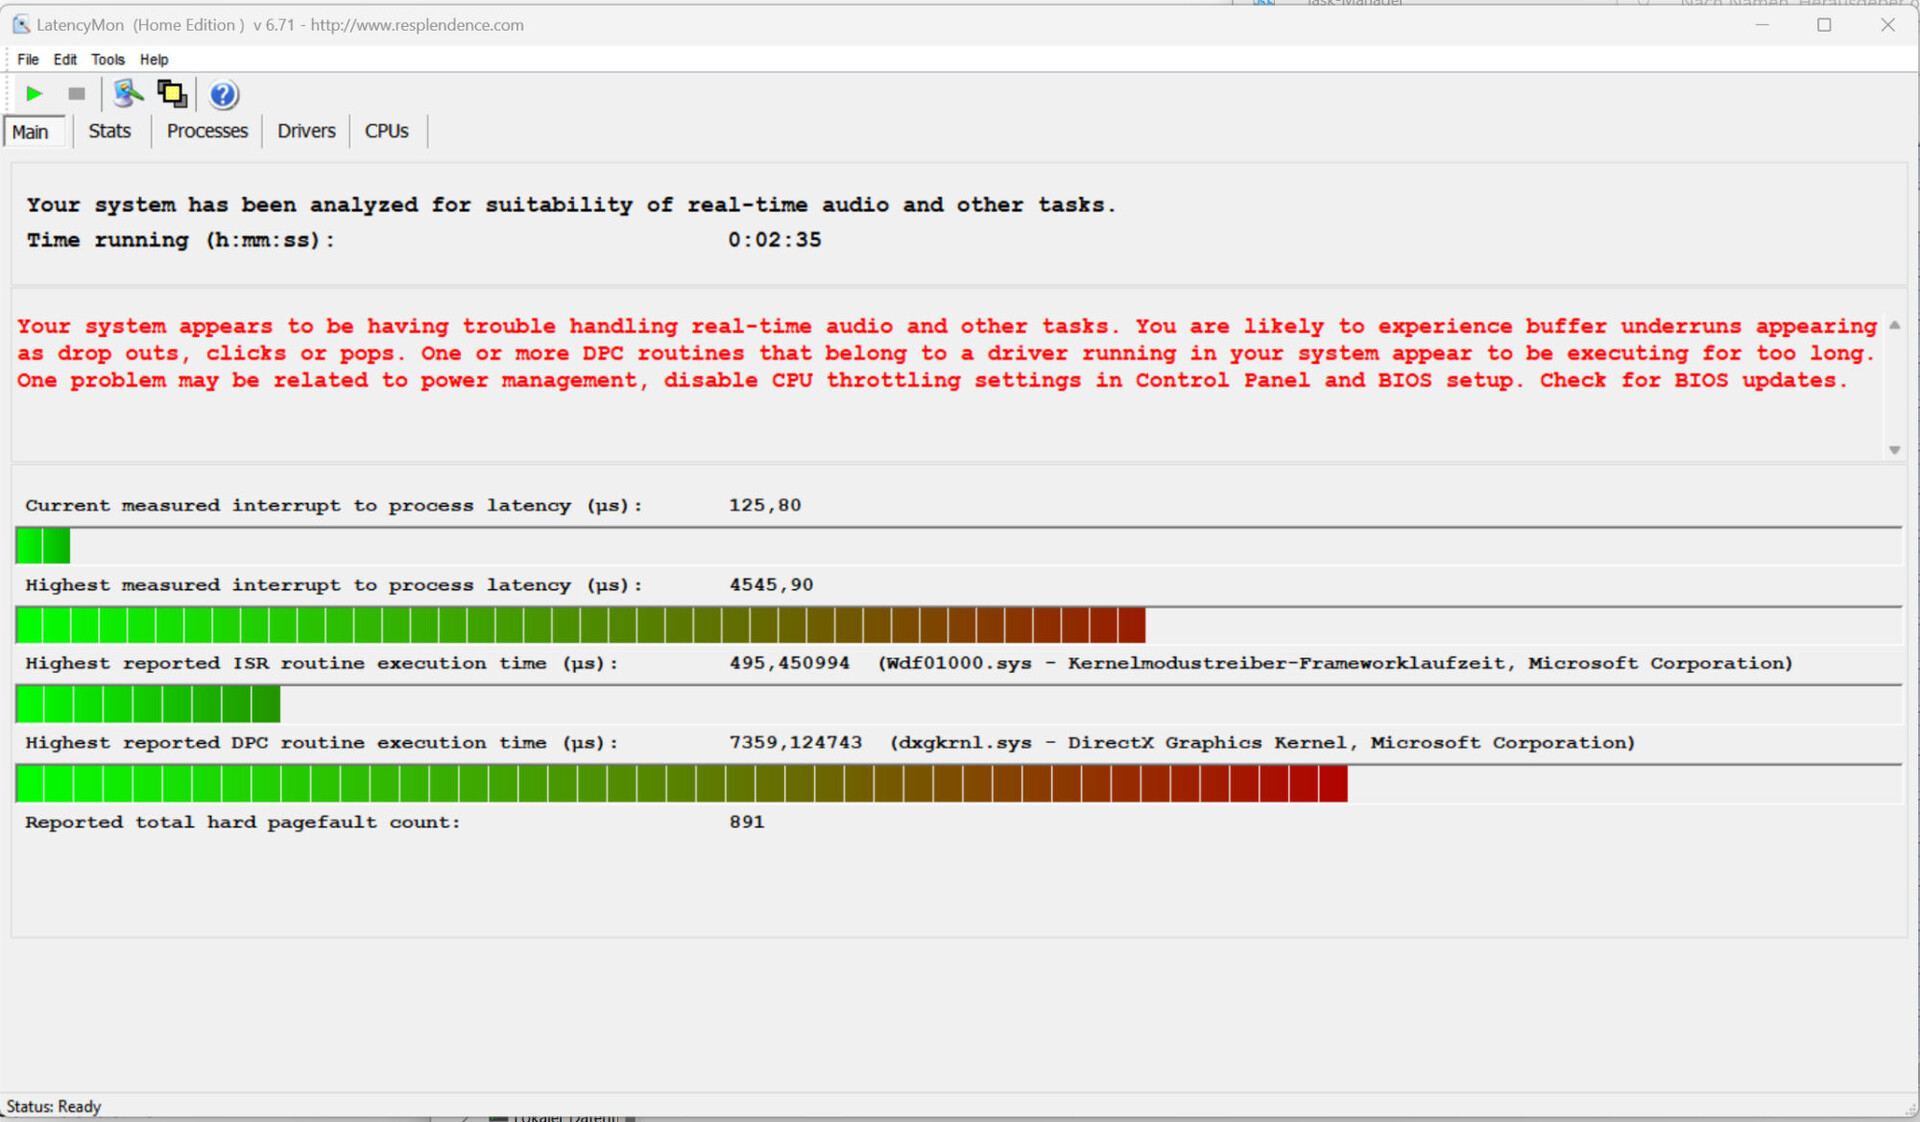
Det standardiserade testet för övervakning av latenstid (webbsurfning, uppspelning av 4k-video, Prime95 hög belastning) avslöjade avvikelser, så systemet verkar inte vara lämpligt för video- och ljudredigering i realtid. Framtida mjukvaruuppdateringar kan leda till förbättringar eller till och med försämringar.
| DPC Latencies / LatencyMon - interrupt to process latency (max), Web, Youtube, Prime95 | |
| LG Gram 17Z90Q-E.AD78G | |
| Samsung Galaxy Book3 Ultra 16 | |
| Lenovo ThinkBook 16p G3 ARH | |
| Dell XPS 15 9520 RTX 3050 Ti | |
| Acer Swift X SFX16-52G-77RX | |
| Schenker Vision 16 Pro RTX 3070 Ti | |
| Asus VivoBook Pro 16X OLED N7600PC-L2026X | |
* ... mindre är bättre
Lagringsenheter
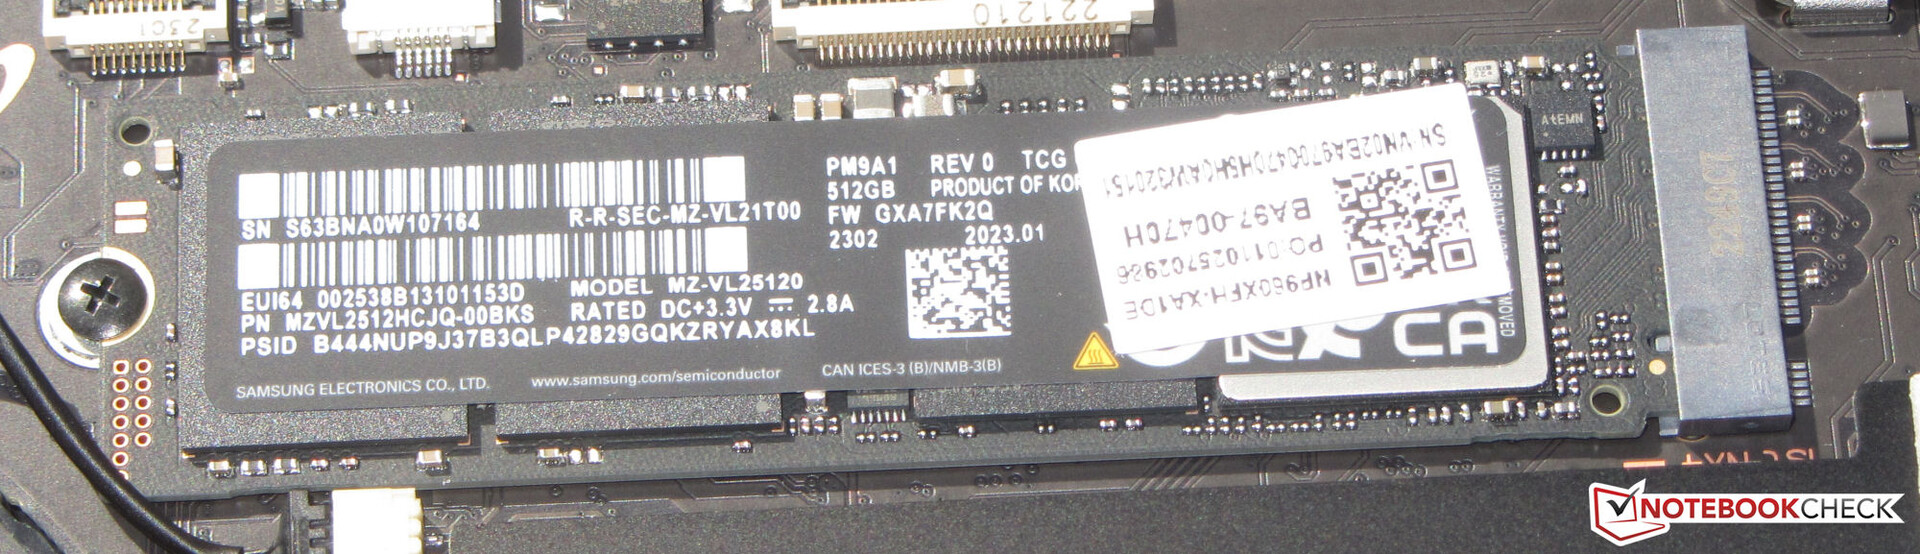
Samsung är snål när det gäller lagringsutrymme, för den inbyggda PCIe 4 SSD (M.2 2280) i vår testenhet har bara 512 GB - för lite för en bärbar dator för 2 400 USD. Den levererar i alla fall utmärkta datahastigheter. En andra SSD kan installeras.

* ... mindre är bättre
Sustained Read Performance: DiskSpd Read Loop, Queue Depth 8
Grafikkort
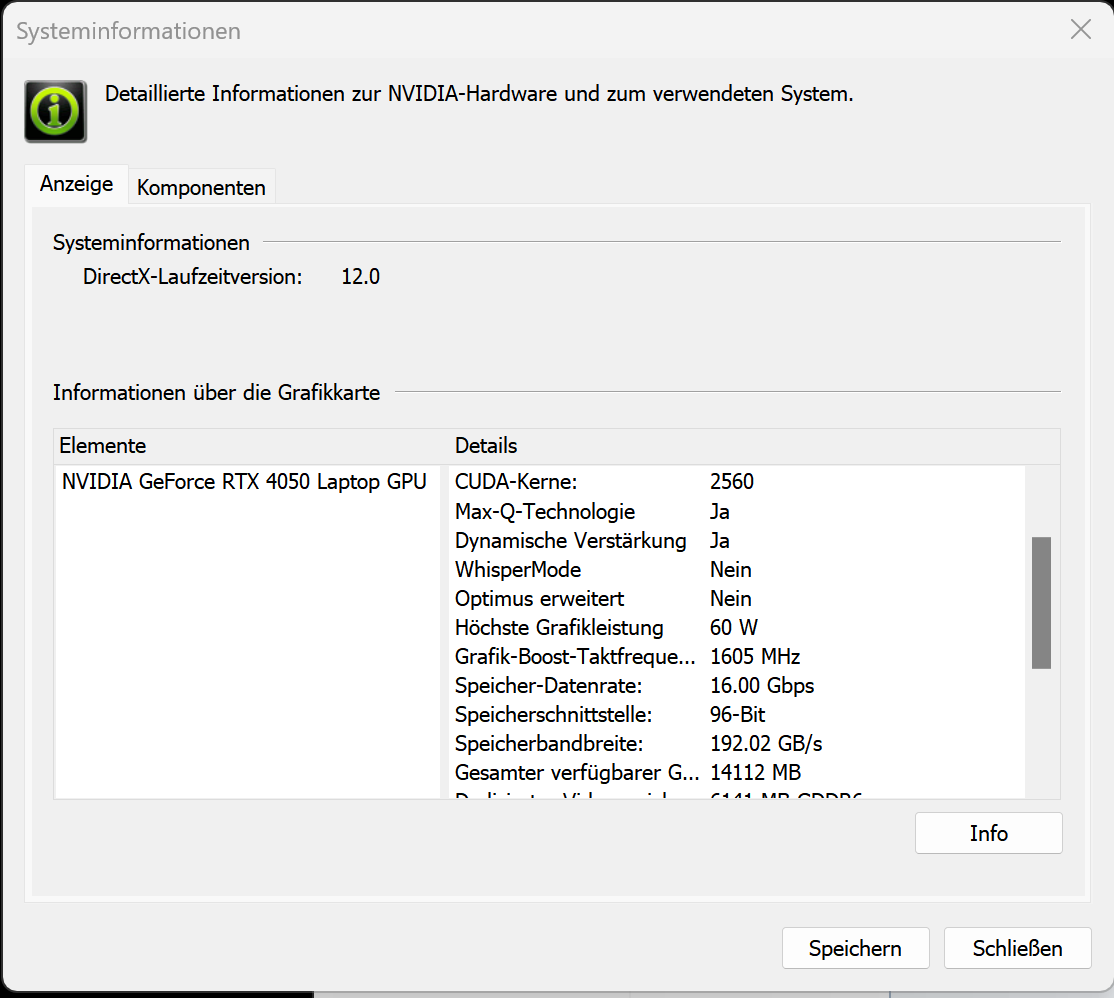
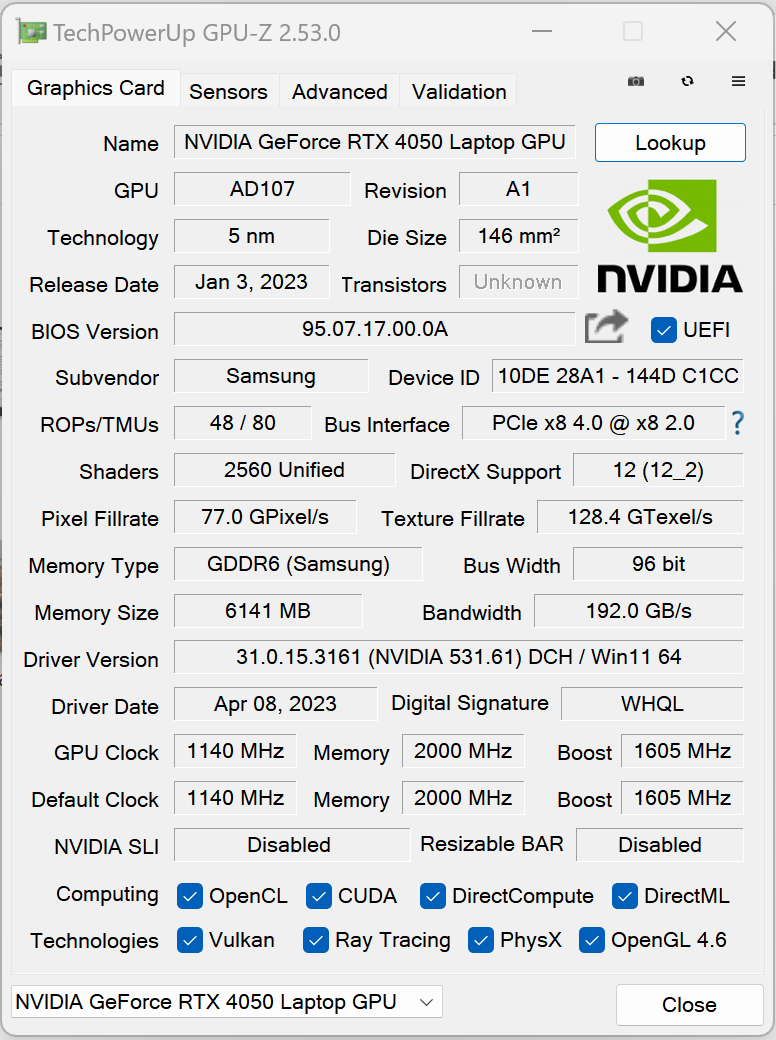
The GeForce RTX 4050 bärbar dator har 2 560 shaders, en 96-bitars bred buss och snabbt GDDR6-minne (6 144 MB). Samsung ger den en TGP på 60 watt (35 watt + 25 watt dynamisk) - ett värde i den nedre delen av vad som är möjligt. Enligt testet Witcher 3 utnyttjas TGP fullt ut - men bara när profilen "High Performance" är aktiv. Den bärbara datorn erbjuder inget dGPU-läge.
Benchmarkresultaten beror på vilken prestandaprofil som valts, men ligger alltid under RTX 4050-genomsnittet. I grund och botten arbetar RTX 4050 ganska effektivt med en låg TGP och uppnår fler poäng eller högre bildfrekvens per watt än RTX 4050 i MSI Katana 15 (TGP: 105 watt).
| 3DMark Performance rating - Percent | |
| Schenker Vision 16 Pro RTX 3070 Ti -1! | |
| MSI Katana 15 B12VEK | |
| Genomsnitt NVIDIA GeForce RTX 4050 Laptop GPU | |
| Lenovo ThinkBook 16p G3 ARH | |
| Samsung Galaxy Book3 Ultra 16 | |
| Samsung Galaxy Book3 Ultra 16 | |
| Genomsnitt av klass Multimedia | |
| Samsung Galaxy Book3 Ultra 16 | |
| Dell XPS 15 9520 RTX 3050 Ti | |
| Asus VivoBook Pro 16X OLED N7600PC-L2026X | |
| Acer Swift X SFX16-52G-77RX | |
| LG Gram 17Z90Q-E.AD78G | |
| 3DMark 11 - 1280x720 Performance GPU | |
| Schenker Vision 16 Pro RTX 3070 Ti | |
| MSI Katana 15 B12VEK | |
| Genomsnitt NVIDIA GeForce RTX 4050 Laptop GPU (13339 - 32642, n=41) | |
| Samsung Galaxy Book3 Ultra 16 (Hohe Leistung) | |
| Lenovo ThinkBook 16p G3 ARH | |
| Samsung Galaxy Book3 Ultra 16 | |
| Genomsnitt av klass Multimedia (3749 - 60002, n=55, senaste 2 åren) | |
| Samsung Galaxy Book3 Ultra 16 (Leise) | |
| Asus VivoBook Pro 16X OLED N7600PC-L2026X | |
| Dell XPS 15 9520 RTX 3050 Ti | |
| Acer Swift X SFX16-52G-77RX | |
| LG Gram 17Z90Q-E.AD78G | |
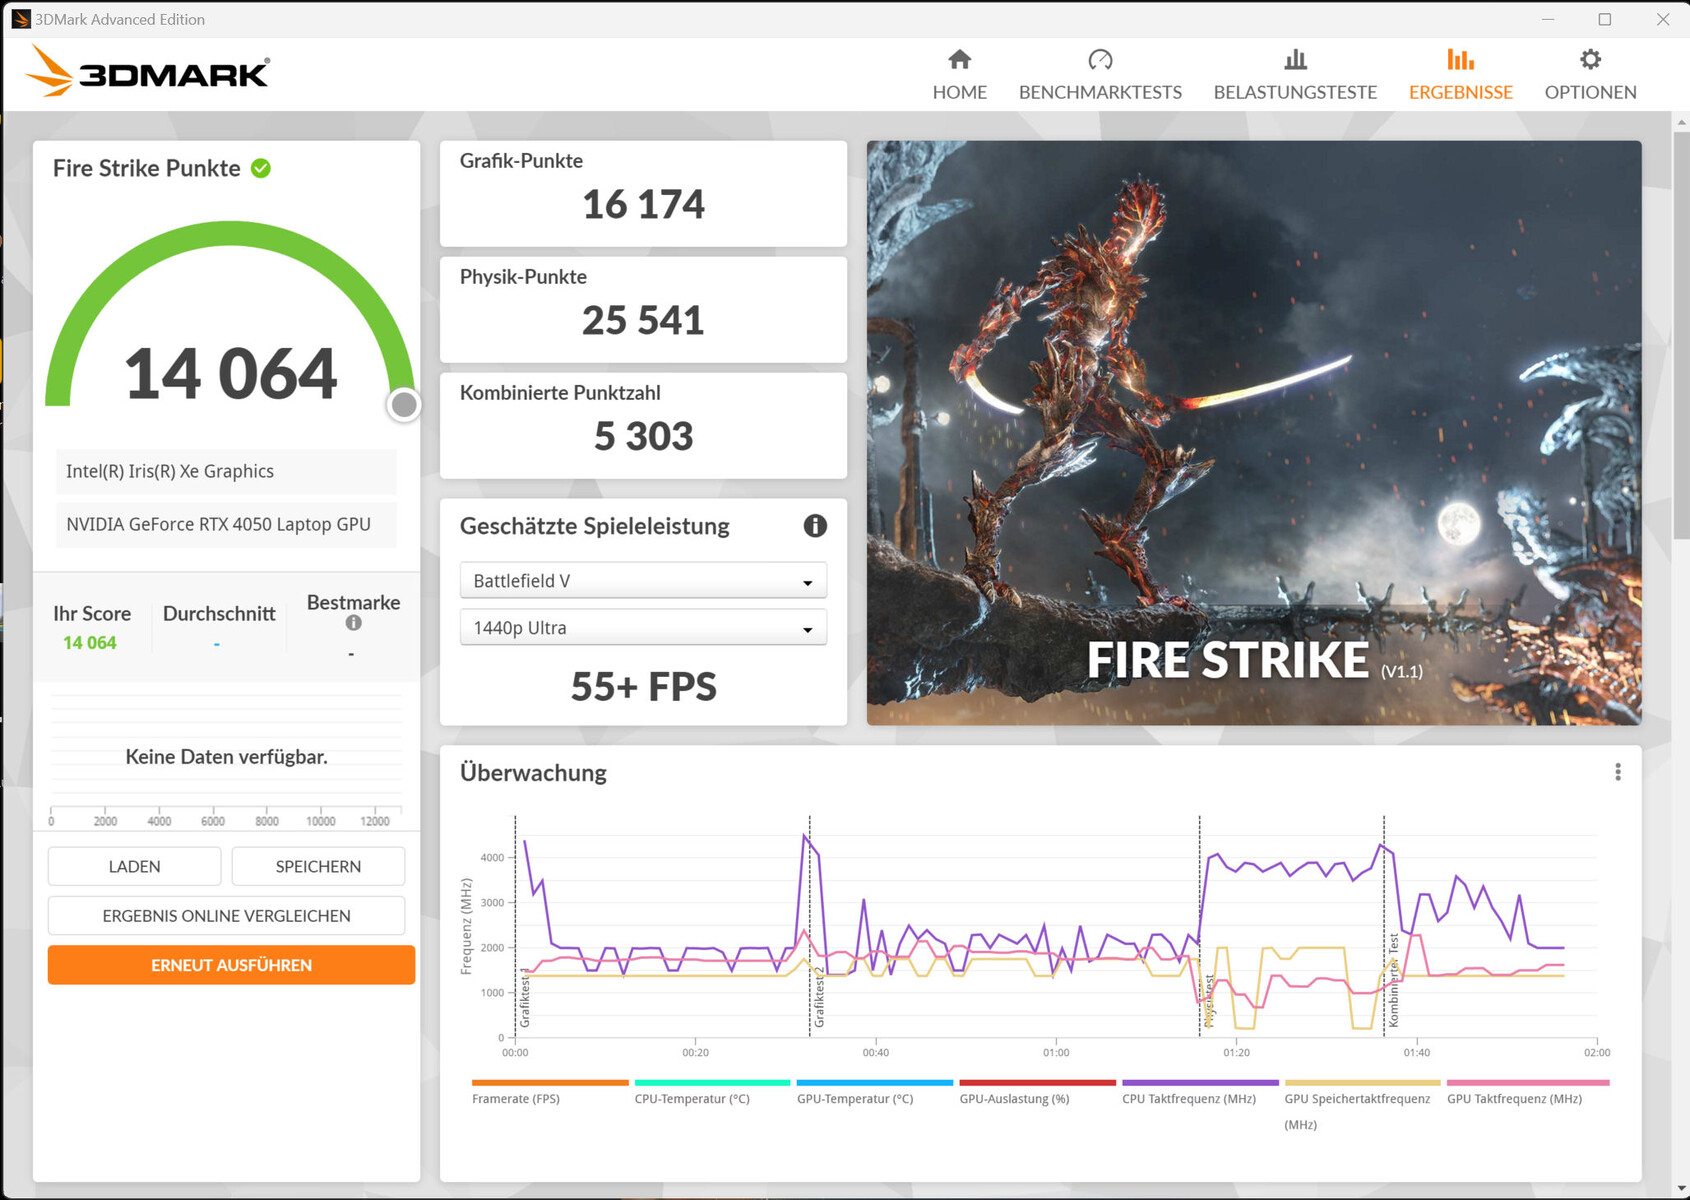
| 3DMark 06 Standard Score | 45618 poäng | |
| 3DMark 11 Performance | 18217 poäng | |
| 3DMark Cloud Gate Standard Score | 41061 poäng | |
| 3DMark Fire Strike Score | 14064 poäng | |
| 3DMark Time Spy Score | 5784 poäng | |
Hjälp | ||
| Blender | |
| v3.3 Classroom OPTIX/RTX | |
| LG Gram 17Z90Q-E.AD78G (3.3.2) | |
| Asus VivoBook Pro 16X OLED N7600PC-L2026X (3.3.0) | |
| Samsung Galaxy Book3 Ultra 16 (3.3.3, Leise) | |
| Genomsnitt av klass Multimedia (12 - 105, n=22, senaste 2 åren) | |
| Lenovo ThinkBook 16p G3 ARH (3.3.0) | |
| Samsung Galaxy Book3 Ultra 16 (3.3.3) | |
| Genomsnitt NVIDIA GeForce RTX 4050 Laptop GPU (25 - 37, n=40) | |
| Samsung Galaxy Book3 Ultra 16 (3.3.3, Hohe Leistung) | |
| Schenker Vision 16 Pro RTX 3070 Ti (3.3.0) | |
| v3.3 Classroom CUDA | |
| LG Gram 17Z90Q-E.AD78G (3.3.2) | |
| Asus VivoBook Pro 16X OLED N7600PC-L2026X (3.3.0) | |
| Samsung Galaxy Book3 Ultra 16 (3.3.3, Leise) | |
| Genomsnitt av klass Multimedia (20 - 186, n=22, senaste 2 åren) | |
| Samsung Galaxy Book3 Ultra 16 (3.3.3) | |
| Lenovo ThinkBook 16p G3 ARH (3.3.0) | |
| Samsung Galaxy Book3 Ultra 16 (3.3.3, Hohe Leistung) | |
| Genomsnitt NVIDIA GeForce RTX 4050 Laptop GPU (47 - 68, n=39) | |
| Schenker Vision 16 Pro RTX 3070 Ti (3.3.0) | |
| v3.3 Classroom oneAPI/Intel | |
| Genomsnitt av klass Multimedia (105 - 492, n=17, senaste 2 åren) | |
| Acer Swift X SFX16-52G-77RX | |
| V-Ray Benchmark Next 4.10 | |
| GPU | |
| Genomsnitt NVIDIA GeForce RTX 4050 Laptop GPU (333 - 565, n=35) | |
| Schenker Vision 16 Pro RTX 3070 Ti (v4.10.07 ) | |
| Samsung Galaxy Book3 Ultra 16 (v4.10.07, Hohe Leistung) | |
| Samsung Galaxy Book3 Ultra 16 (v4.10.07 ) | |
| Samsung Galaxy Book3 Ultra 16 (v4.10.07, Leise) | |
| Genomsnitt av klass Multimedia (32 - 1191, n=53, senaste 2 åren) | |
| Asus VivoBook Pro 16X OLED N7600PC-L2026X (v4.10.07 ) | |
| LG Gram 17Z90Q-E.AD78G (v4.10.07 ) | |
| Acer Swift X SFX16-52G-77RX (v4.10.07 ) | |
| CPU | |
| Genomsnitt av klass Multimedia (4772 - 35165, n=53, senaste 2 åren) | |
| Samsung Galaxy Book3 Ultra 16 (v4.10.07, Hohe Leistung ) | |
| Genomsnitt NVIDIA GeForce RTX 4050 Laptop GPU (5413 - 24181, n=35) | |
| Samsung Galaxy Book3 Ultra 16 (v4.10.07 ) | |
| Schenker Vision 16 Pro RTX 3070 Ti (v4.10.07 ) | |
| Samsung Galaxy Book3 Ultra 16 (v4.10.07, Leise) | |
| Acer Swift X SFX16-52G-77RX (v4.10.07 ) | |
| LG Gram 17Z90Q-E.AD78G (v4.10.07 ) | |
| Asus VivoBook Pro 16X OLED N7600PC-L2026X (v4.10.07 ) | |
* ... mindre är bättre
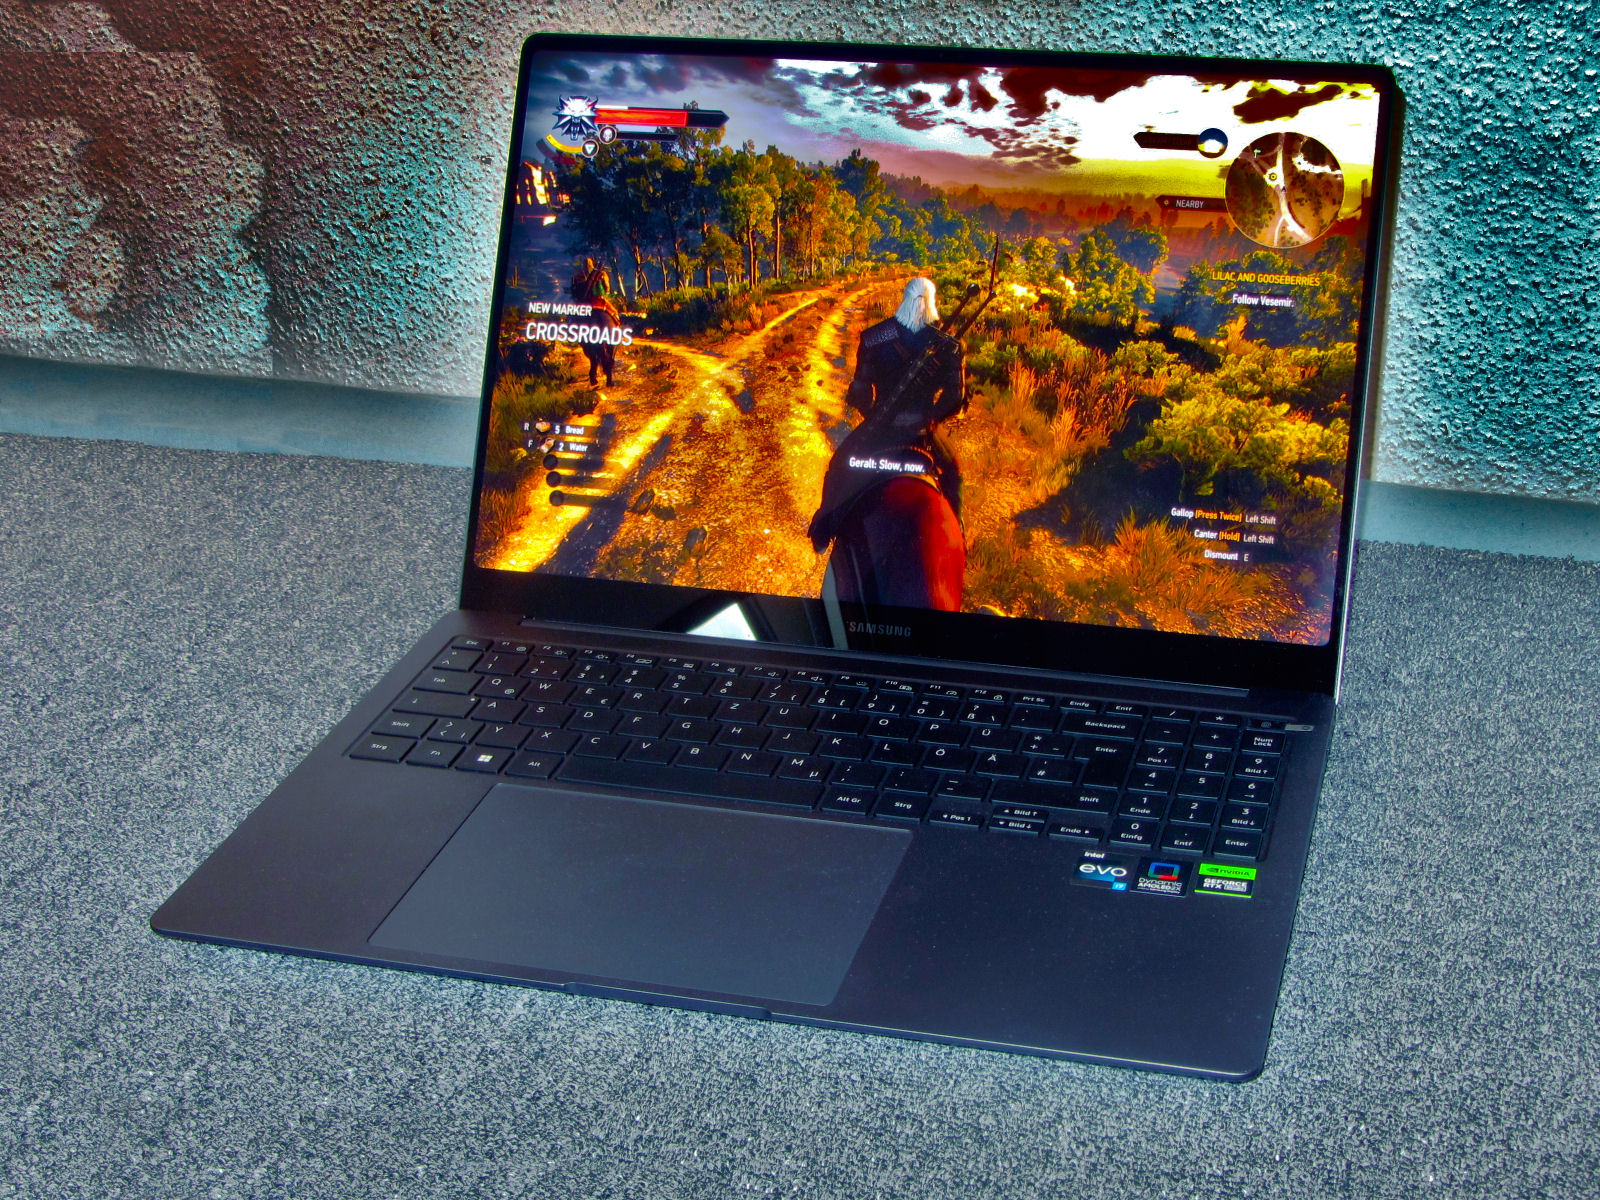
Spelprestanda
Den bärbara datorn klarar av FHD-spel med medelhöga till höga, ibland maximala inställningar. OLED-skärmens fulla prakt (2880x1800) kan framhävas i reducerade inställningar. Bildfrekvensen beror på vilket prestandaläge som används, men ligger alltid under RTX 4050-genomsnittet. "High Performance" ger cirka 20 till 30 procent högre bildfrekvens än "Optimized". Profilen "Silent" lämpar sig främst för spel på HD-nivå.
| Performance rating - Percent | |
| Schenker Vision 16 Pro RTX 3070 Ti | |
| MSI Katana 15 B12VEK | |
| Genomsnitt NVIDIA GeForce RTX 4050 Laptop GPU | |
| Samsung Galaxy Book3 Ultra 16 | |
| Lenovo ThinkBook 16p G3 ARH | |
| Samsung Galaxy Book3 Ultra 16 | |
| Dell XPS 15 9520 RTX 3050 Ti | |
| Genomsnitt av klass Multimedia | |
| Asus VivoBook Pro 16X OLED N7600PC-L2026X | |
| LG Gram 17Z90Q-E.AD78G | |
| Samsung Galaxy Book3 Ultra 16 | |
| Acer Swift X SFX16-52G-77RX | |
| The Witcher 3 - 1920x1080 Ultra Graphics & Postprocessing (HBAO+) | |
| Schenker Vision 16 Pro RTX 3070 Ti | |
| MSI Katana 15 B12VEK | |
| Genomsnitt NVIDIA GeForce RTX 4050 Laptop GPU (18.5 - 94.7, n=40) | |
| Lenovo ThinkBook 16p G3 ARH | |
| Samsung Galaxy Book3 Ultra 16 (Hohe Leistung) | |
| Samsung Galaxy Book3 Ultra 16 | |
| Genomsnitt av klass Multimedia (11 - 121, n=7, senaste 2 åren) | |
| Asus VivoBook Pro 16X OLED N7600PC-L2026X | |
| Dell XPS 15 9520 RTX 3050 Ti | |
| LG Gram 17Z90Q-E.AD78G | |
| Acer Swift X SFX16-52G-77RX | |
| Samsung Galaxy Book3 Ultra 16 | |
| GTA V - 1920x1080 Highest AA:4xMSAA + FX AF:16x | |
| Schenker Vision 16 Pro RTX 3070 Ti | |
| MSI Katana 15 B12VEK | |
| Samsung Galaxy Book3 Ultra 16 (Hohe Leistung) | |
| Genomsnitt NVIDIA GeForce RTX 4050 Laptop GPU (14.9 - 101.7, n=35) | |
| Lenovo ThinkBook 16p G3 ARH | |
| Samsung Galaxy Book3 Ultra 16 | |
| Genomsnitt av klass Multimedia (7.92 - 141.6, n=55, senaste 2 åren) | |
| Asus VivoBook Pro 16X OLED N7600PC-L2026X | |
| Dell XPS 15 9520 RTX 3050 Ti | |
| LG Gram 17Z90Q-E.AD78G | |
| Acer Swift X SFX16-52G-77RX | |
| Samsung Galaxy Book3 Ultra 16 (Leise) | |
| Final Fantasy XV Benchmark - 1920x1080 High Quality | |
| Schenker Vision 16 Pro RTX 3070 Ti (1.3) | |
| MSI Katana 15 B12VEK (1.3) | |
| Lenovo ThinkBook 16p G3 ARH (1.3) | |
| Genomsnitt NVIDIA GeForce RTX 4050 Laptop GPU (15.5 - 122.3, n=39) | |
| Samsung Galaxy Book3 Ultra 16 (1.3, Hohe Leistung) | |
| Samsung Galaxy Book3 Ultra 16 (1.3) | |
| Genomsnitt av klass Multimedia (7.61 - 144.4, n=57, senaste 2 åren) | |
| Dell XPS 15 9520 RTX 3050 Ti (1.3) | |
| Asus VivoBook Pro 16X OLED N7600PC-L2026X (1.3) | |
| LG Gram 17Z90Q-E.AD78G (1.3) | |
| Acer Swift X SFX16-52G-77RX (1.3) | |
| Samsung Galaxy Book3 Ultra 16 (1.3, Leise) | |
| Strange Brigade - 1920x1080 ultra AA:ultra AF:16 | |
| Schenker Vision 16 Pro RTX 3070 Ti (1.47.22.14 D3D12) | |
| MSI Katana 15 B12VEK (1.47.22.14 D3D12) | |
| Genomsnitt NVIDIA GeForce RTX 4050 Laptop GPU (21.2 - 156.6, n=38) | |
| Lenovo ThinkBook 16p G3 ARH (1.47.22.14 D3D12) | |
| Samsung Galaxy Book3 Ultra 16 (1.47.22.14 D3D12, Hohe Leistung) | |
| Samsung Galaxy Book3 Ultra 16 (1.47.22.14 D3D12) | |
| Genomsnitt av klass Multimedia (13.3 - 303, n=57, senaste 2 åren) | |
| Dell XPS 15 9520 RTX 3050 Ti (1.47.22.14 D3D12) | |
| Asus VivoBook Pro 16X OLED N7600PC-L2026X (1.47.22.14 D3D12) | |
| Acer Swift X SFX16-52G-77RX (1.47.22.14 D3D12) | |
| LG Gram 17Z90Q-E.AD78G (1.47.22.14 D3D12) | |
| Samsung Galaxy Book3 Ultra 16 (1.47.22.14 D3D12, Leise) | |
| Dota 2 Reborn - 1920x1080 ultra (3/3) best looking | |
| Schenker Vision 16 Pro RTX 3070 Ti | |
| MSI Katana 15 B12VEK | |
| Samsung Galaxy Book3 Ultra 16 (Hohe Leistung) | |
| Genomsnitt NVIDIA GeForce RTX 4050 Laptop GPU (73.5 - 175.6, n=39) | |
| Samsung Galaxy Book3 Ultra 16 (Leise) | |
| Dell XPS 15 9520 RTX 3050 Ti | |
| Asus VivoBook Pro 16X OLED N7600PC-L2026X | |
| Lenovo ThinkBook 16p G3 ARH | |
| Genomsnitt av klass Multimedia (29 - 179.9, n=59, senaste 2 åren) | |
| Samsung Galaxy Book3 Ultra 16 | |
| Acer Swift X SFX16-52G-77RX | |
| LG Gram 17Z90Q-E.AD78G | |
| X-Plane 11.11 - 1920x1080 high (fps_test=3) | |
| Schenker Vision 16 Pro RTX 3070 Ti | |
| Dell XPS 15 9520 RTX 3050 Ti | |
| Samsung Galaxy Book3 Ultra 16 (Hohe Leistung) | |
| MSI Katana 15 B12VEK | |
| Genomsnitt NVIDIA GeForce RTX 4050 Laptop GPU (55.5 - 117, n=40) | |
| Samsung Galaxy Book3 Ultra 16 (Leise) | |
| Samsung Galaxy Book3 Ultra 16 | |
| Asus VivoBook Pro 16X OLED N7600PC-L2026X | |
| Lenovo ThinkBook 16p G3 ARH | |
| LG Gram 17Z90Q-E.AD78G | |
| LG Gram 17Z90Q-E.AD78G | |
| Genomsnitt av klass Multimedia (16.9 - 141.1, n=54, senaste 2 åren) | |
| Acer Swift X SFX16-52G-77RX | |
För att kontrollera om bildfrekvensen förblir konstant under en längre tid körde vi "The Witcher 3" i cirka 60 minuter i Full HD-upplösning och med maximala kvalitetsinställningar. Spelkaraktären flyttades inte. Ingen minskning av bildfrekvensen upptäcktes.
Witcher 3 FPS chart
| låg | med. | hög | ultra | QHD | |
|---|---|---|---|---|---|
| GTA V (2015) | 182.1 | 166.5 | 133.2 | 65.3 | 50.5 |
| The Witcher 3 (2015) | 268.5 | 184.1 | 107.1 | 60.1 | |
| Dota 2 Reborn (2015) | 161.8 | 138.7 | 79.2 | 73.5 | |
| Final Fantasy XV Benchmark (2018) | 105 | 77.2 | 56.9 | 41.5 | |
| X-Plane 11.11 (2018) | 143.6 | 88.2 | 79 | ||
| Far Cry 5 (2018) | 148 | 87 | 74 | 71 | 56 |
| Strange Brigade (2018) | 321 | 153.5 | 120.1 | 103.9 | 72.7 |
| The Division 2 (2019) | 130 | 83 | 69 | 53 | 35 |
| Doom Eternal (2020) | 228 | 135.6 | 124.7 | 114.3 | 82.5 |
| Gears Tactics (2020) | 268.5 | 141.8 | 95.2 | 64.8 | 44.8 |
| Flight Simulator 2020 (2020) | 107.2 | 57.6 | 40.5 | 30.6 | 22.9 |
| Crysis Remastered (2020) | 242 | 121.1 | 49.5 | 41.6 | 28.6 |
| Hitman 3 (2021) | 193.9 | 111.4 | 101 | 94.2 | 60.1 |
| Alan Wake Remastered (2021) | 161.5 | 98.3 | 86.7 | 63.2 | |
| Riders Republic (2021) | 138 | 72 | 67 | 63 | 44 |
| Forza Horizon 5 (2021) | 119 | 68 | 69 | 42 | 36 |
| Rainbow Six Extraction (2022) | 139 | 115 | 111 | 89 | 56 |
| Cyberpunk 2077 1.6 (2022) | 71 | 54.7 | 48 | 44.4 | 27.2 |
| Tiny Tina's Wonderlands (2022) | 104.5 | 93.4 | 63.3 | 49.8 | 33.6 |
| F1 22 (2022) | 135.3 | 127.4 | 97.5 | 36.2 | 23.1 |
| The Quarry (2022) | 91 | 68.8 | 57 | 44.6 | 28.5 |
| FIFA 23 (2022) | 94.3 | ||||
| A Plague Tale Requiem (2022) | 58.6 | 49 | 42.8 | 36.3 | 27.5 |
| Call of Duty Modern Warfare 2 2022 (2022) | 79 | 73 | 56 | 54 | 36 |
| Spider-Man Miles Morales (2022) | 72.9 | 67.1 | 56.9 | 51.5 | 42.5 |
| The Callisto Protocol (2022) | 74 | 62.5 | 59.3 | 41.4 | 29.5 |
| Need for Speed Unbound (2022) | 51.2 | 42.8 | 37 | 28.9 | 26.7 |
| High On Life (2023) | 104.9 | 78.1 | 65.3 | 57.3 | 35.7 |
| The Witcher 3 v4 (2023) | 113.4 | 82.5 | 43 | 38.1 | 23.8 |
| Dead Space Remake (2023) | 47.9 | 47.7 | 40.2 | 39.8 | 25.1 |
| Hogwarts Legacy (2023) | 92 | 74.2 | 59.6 | 51.9 | 23.9 |
| Returnal (2023) | 59 | 57 | 52 | 44 | |
| Atomic Heart (2023) | 95 | 76.1 | 47.8 | 37.8 | 28.2 |
| Company of Heroes 3 (2023) | 116.4 | 106.2 | 79 | 79.7 | 55.7 |
| Resident Evil 4 Remake (2023) | 81 | 57.7 | 53.4 | 36.8 | 23.8 |
Utsläpp - Samsung ultrabook med måttlig bullerutveckling
Buller
På det hela taget har Samsung fått bra kontroll över bullerutvecklingen. Den bärbara datorns profiler erbjuder en acceptabel balans mellan ljud och prestanda. Det högsta värdet på 48 dB(A) uppnåddes under testet Witcher 3 under "High Performance". "Optimized" säkerställer måttliga bullernivåer med fortfarande spelbara bildfrekvenser. Profilen "Silent" lever upp till sitt namn. Lite eller inget hörs från de två fläktarna vid tomgång och vardaglig användning, eftersom de ofta står stilla.
Ljudnivå
| Låg belastning |
| 26 / 27 / 28 dB(A) |
| Hög belastning |
| 40 / 41 dB(A) |
 | ||
30 dB tyst 40 dB(A) hörbar 50 dB(A) högt ljud |
||
min: | ||
| Samsung Galaxy Book3 Ultra 16 i7-13700H, GeForce RTX 4050 Laptop GPU | Schenker Vision 16 Pro RTX 3070 Ti i7-12700H, GeForce RTX 3070 Ti Laptop GPU | LG Gram 17Z90Q-E.AD78G i7-1260P, GeForce RTX 2050 Mobile | Lenovo ThinkBook 16p G3 ARH R9 6900HX, GeForce RTX 3060 Laptop GPU | Dell XPS 15 9520 RTX 3050 Ti i7-12700H, GeForce RTX 3050 Ti Laptop GPU | Asus VivoBook Pro 16X OLED N7600PC-L2026X i7-11370H, GeForce RTX 3050 4GB Laptop GPU | Acer Swift X SFX16-52G-77RX i7-1260P, A370M | |
|---|---|---|---|---|---|---|---|
| Noise | -2% | -10% | 5% | 10% | -22% | -0% | |
| av / miljö * (dB) | 25 | 22.9 8% | 26 -4% | 22.7 9% | 22.8 9% | 25.15 -1% | 25 -0% |
| Idle Minimum * (dB) | 26 | 24.3 7% | 28 -8% | 23.1 11% | 22.9 12% | 30 -15% | 25 4% |
| Idle Average * (dB) | 27 | 24.3 10% | 28 -4% | 23.2 14% | 22.9 15% | 30 -11% | 25 7% |
| Idle Maximum * (dB) | 28 | 24.3 13% | 28.8 -3% | 23.6 16% | 22.9 18% | 30 -7% | 25 11% |
| Load Average * (dB) | 40 | 38.5 4% | 49.3 -23% | 30.6 23% | 30.9 23% | 57.6 -44% | 44.7 -12% |
| Witcher 3 ultra * (dB) | 39 | 51 -31% | 47.6 -22% | 37.8 3% | |||
| Load Maximum * (dB) | 41 | 51 -24% | 49.1 -20% | 47.5 -16% | 44.7 -9% | 62.9 -53% | 45.6 -11% |
* ... mindre är bättre
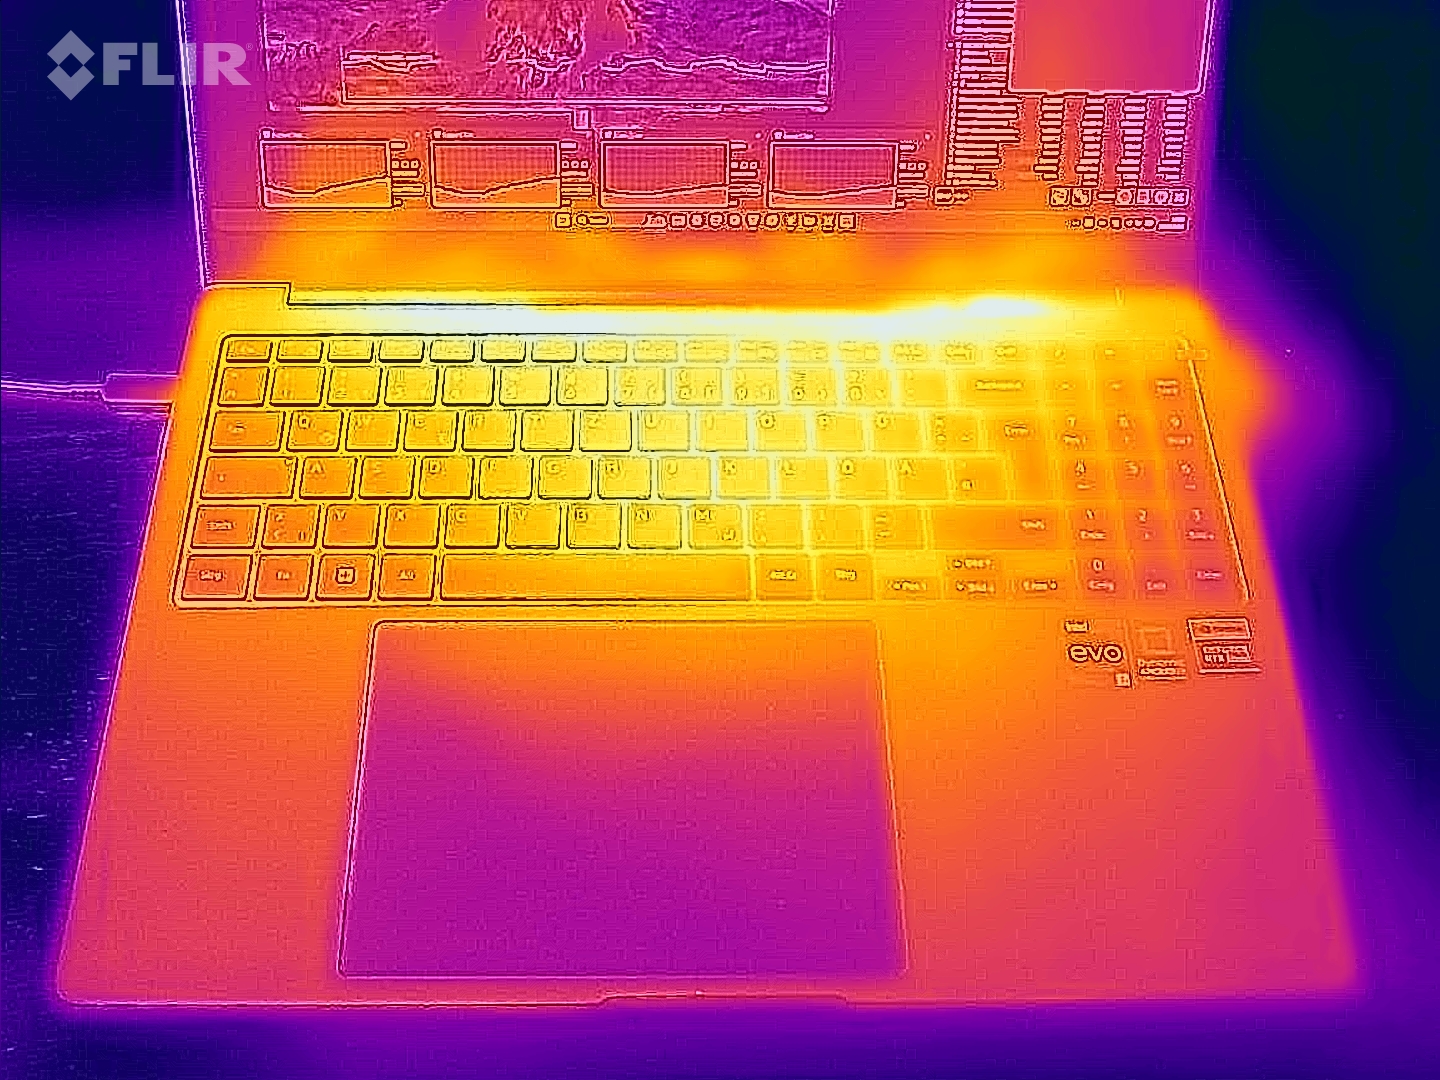
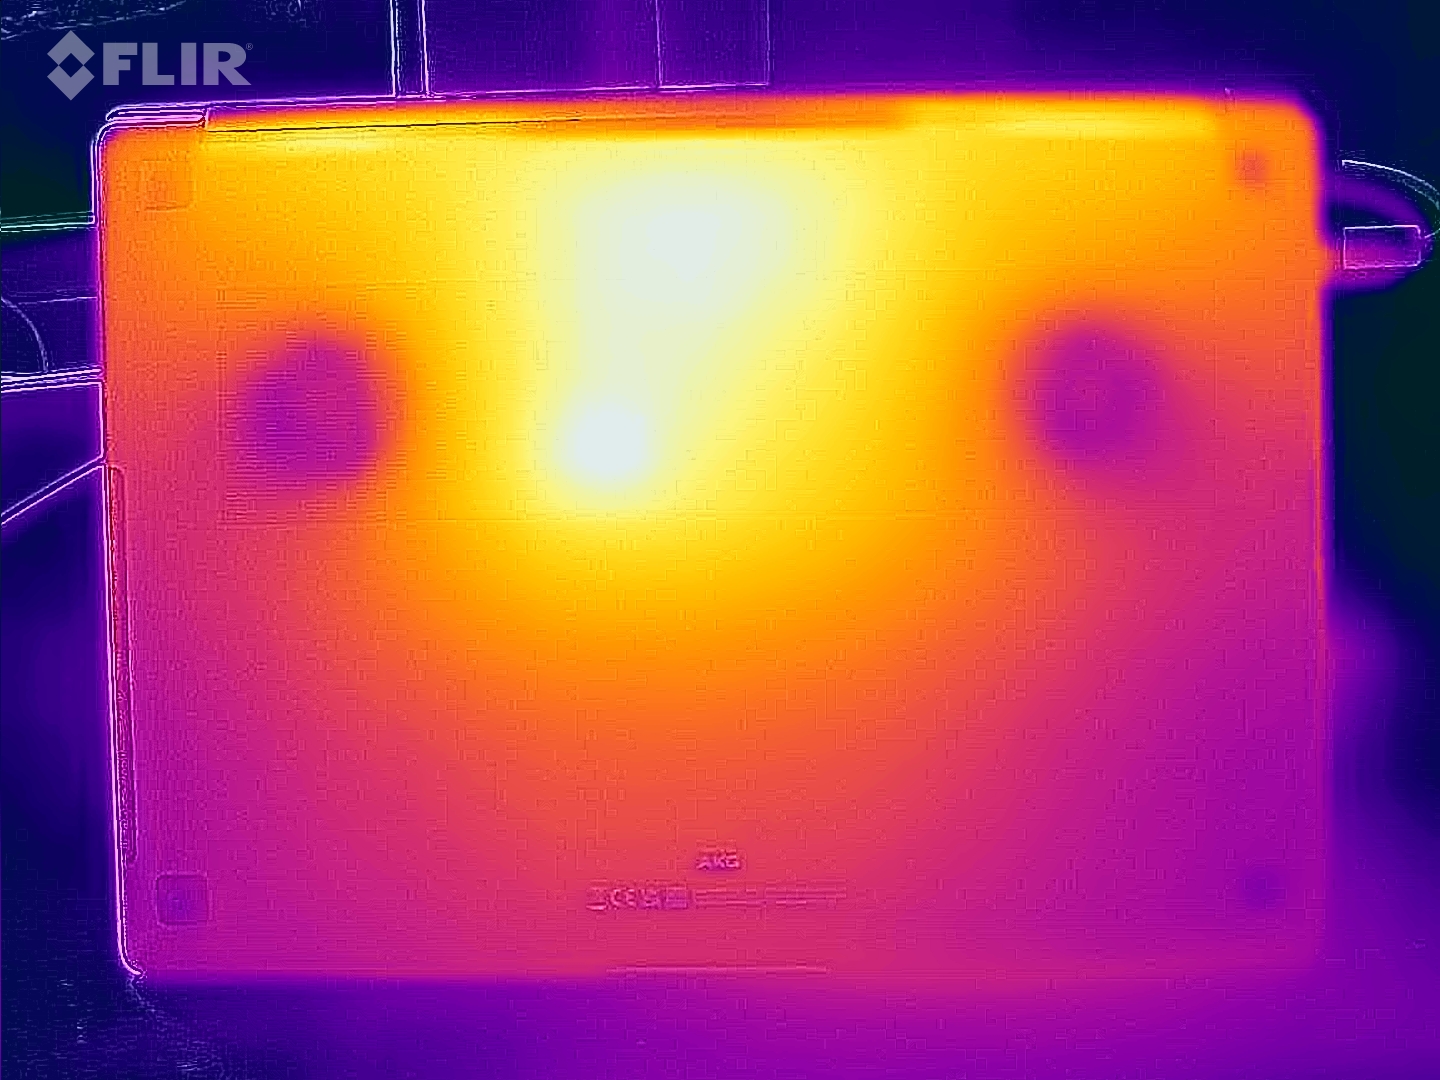
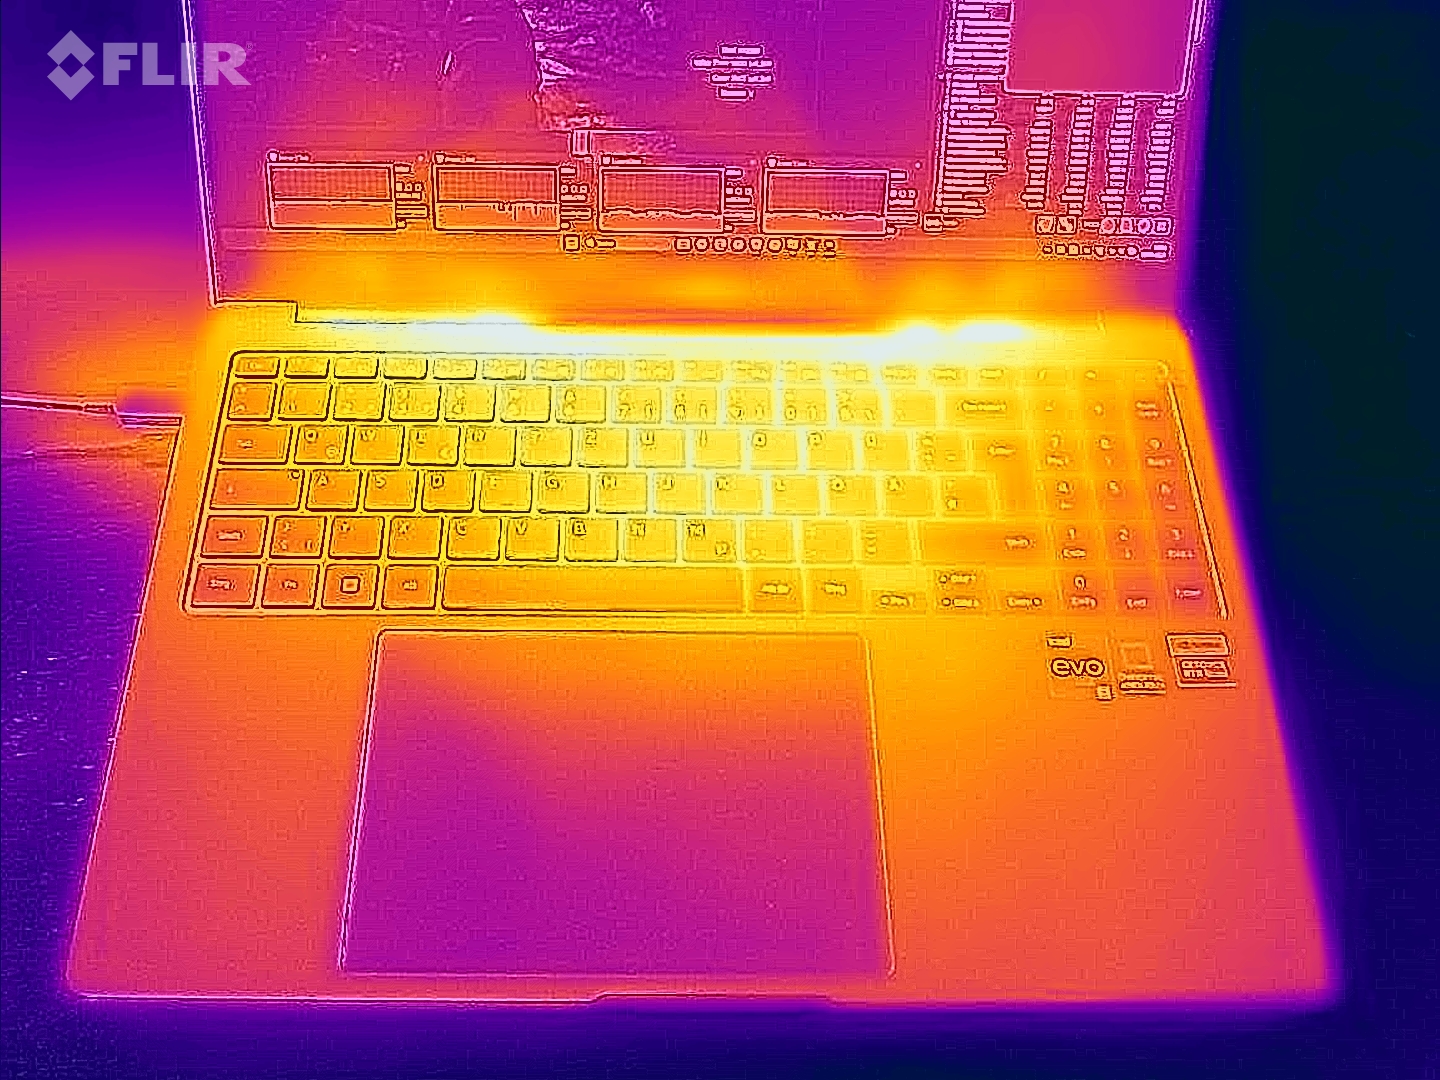
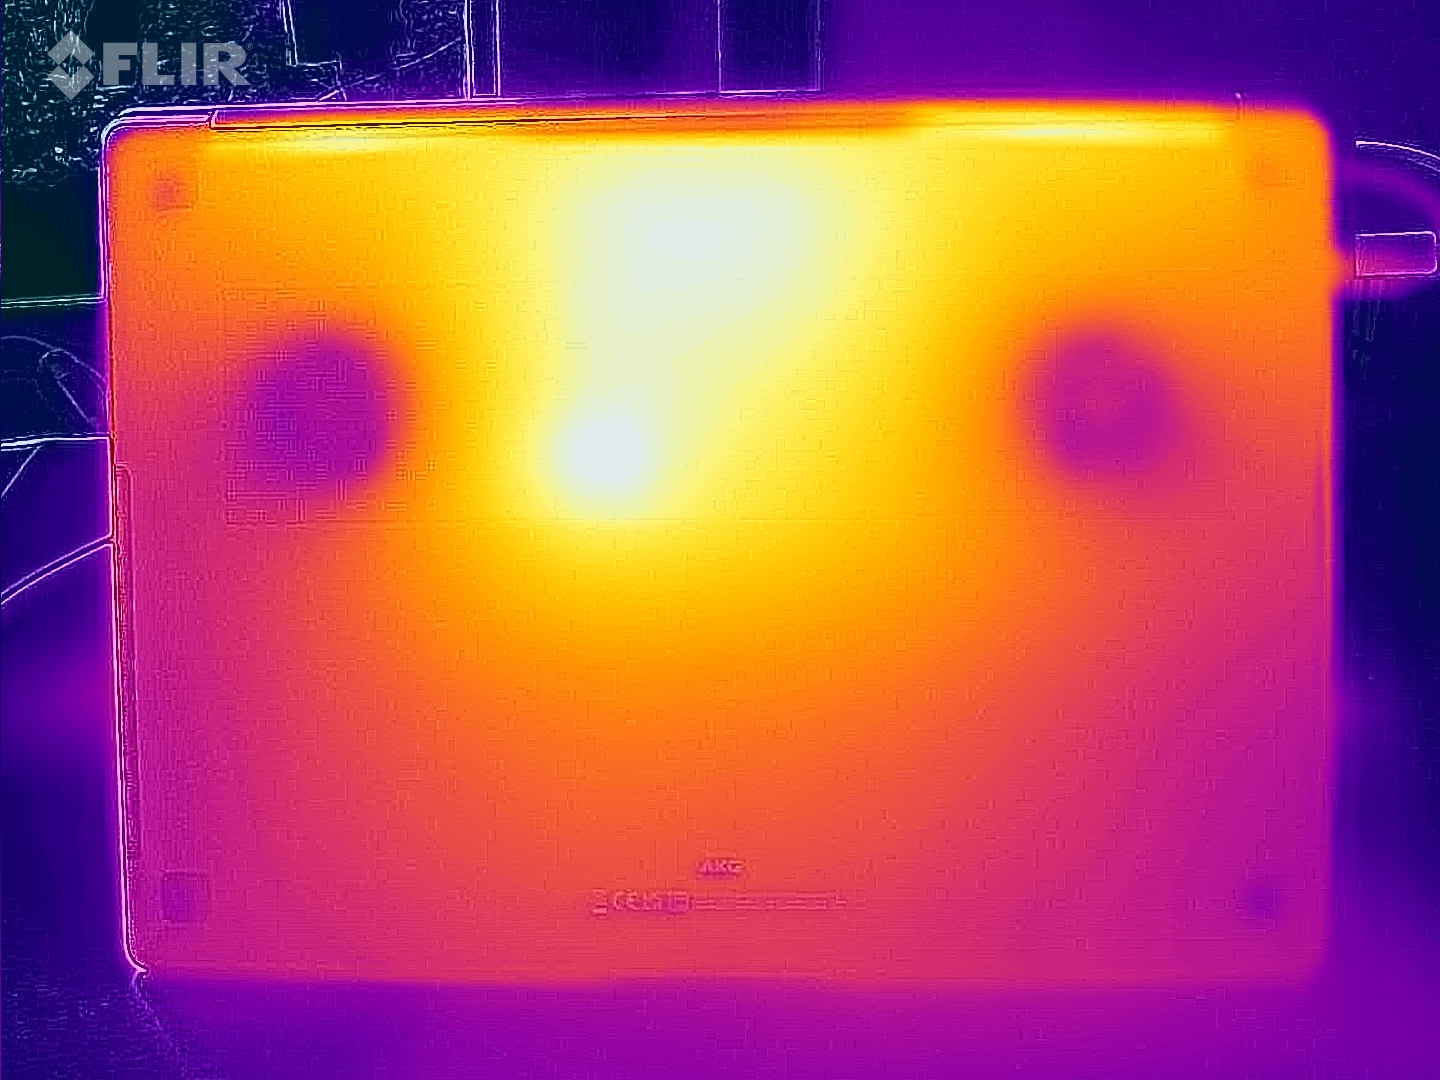
Temperatur
Temperaturen i höljet håller sig inom det gröna området vid daglig användning (kontor, internet). Vid belastning (stresstest, Witcher 3 test) blir den bärbara datorn märkbart varm, men inte överdrivet varm. CPU-temperaturerna ger ingen anledning till oro.
(±) Den maximala temperaturen på ovansidan är 41 °C / 106 F, jämfört med genomsnittet av 36.8 °C / 98 F , allt från 21 till 71 °C för klassen Multimedia.
(±) Botten värms upp till maximalt 44 °C / 111 F, jämfört med genomsnittet av 39.1 °C / 102 F
(+) Vid tomgångsbruk är medeltemperaturen för ovansidan 22.9 °C / 73 F, jämfört med enhetsgenomsnittet på 31.3 °C / ### class_avg_f### F.
(-) När du spelar The Witcher 3 är medeltemperaturen för ovansidan 38.6 °C / 101 F, jämfört med enhetsgenomsnittet på 31.3 °C / ## #class_avg_f### F.
(+) Handledsstöden och pekplattan når maximal hudtemperatur (35 °C / 95 F) och är därför inte varma.
(-) Medeltemperaturen för handledsstödsområdet på liknande enheter var 28.7 °C / 83.7 F (-6.3 °C / -11.3 F).
| Samsung Galaxy Book3 Ultra 16 Intel Core i7-13700H, NVIDIA GeForce RTX 4050 Laptop GPU | Schenker Vision 16 Pro RTX 3070 Ti Intel Core i7-12700H, NVIDIA GeForce RTX 3070 Ti Laptop GPU | LG Gram 17Z90Q-E.AD78G Intel Core i7-1260P, NVIDIA GeForce RTX 2050 Mobile | Lenovo ThinkBook 16p G3 ARH AMD Ryzen 9 6900HX, NVIDIA GeForce RTX 3060 Laptop GPU | Dell XPS 15 9520 RTX 3050 Ti Intel Core i7-12700H, NVIDIA GeForce RTX 3050 Ti Laptop GPU | Asus VivoBook Pro 16X OLED N7600PC-L2026X Intel Core i7-11370H, NVIDIA GeForce RTX 3050 4GB Laptop GPU | Acer Swift X SFX16-52G-77RX Intel Core i7-1260P, Intel Arc A370M | |
|---|---|---|---|---|---|---|---|
| Heat | -12% | -15% | -25% | -25% | -14% | -24% | |
| Maximum Upper Side * (°C) | 41 | 50.8 -24% | 50.3 -23% | 48.2 -18% | 51.4 -25% | 40.6 1% | 49.4 -20% |
| Maximum Bottom * (°C) | 44 | 46.3 -5% | 52.5 -19% | 49.6 -13% | 51 -16% | 53 -20% | 55.5 -26% |
| Idle Upper Side * (°C) | 23 | 27.2 -18% | 26.9 -17% | 31.8 -38% | 30 -30% | 29 -26% | 28.4 -23% |
| Idle Bottom * (°C) | 26 | 26.6 -2% | 26.5 -2% | 33.6 -29% | 33 -27% | 28.3 -9% | 32.6 -25% |
* ... mindre är bättre
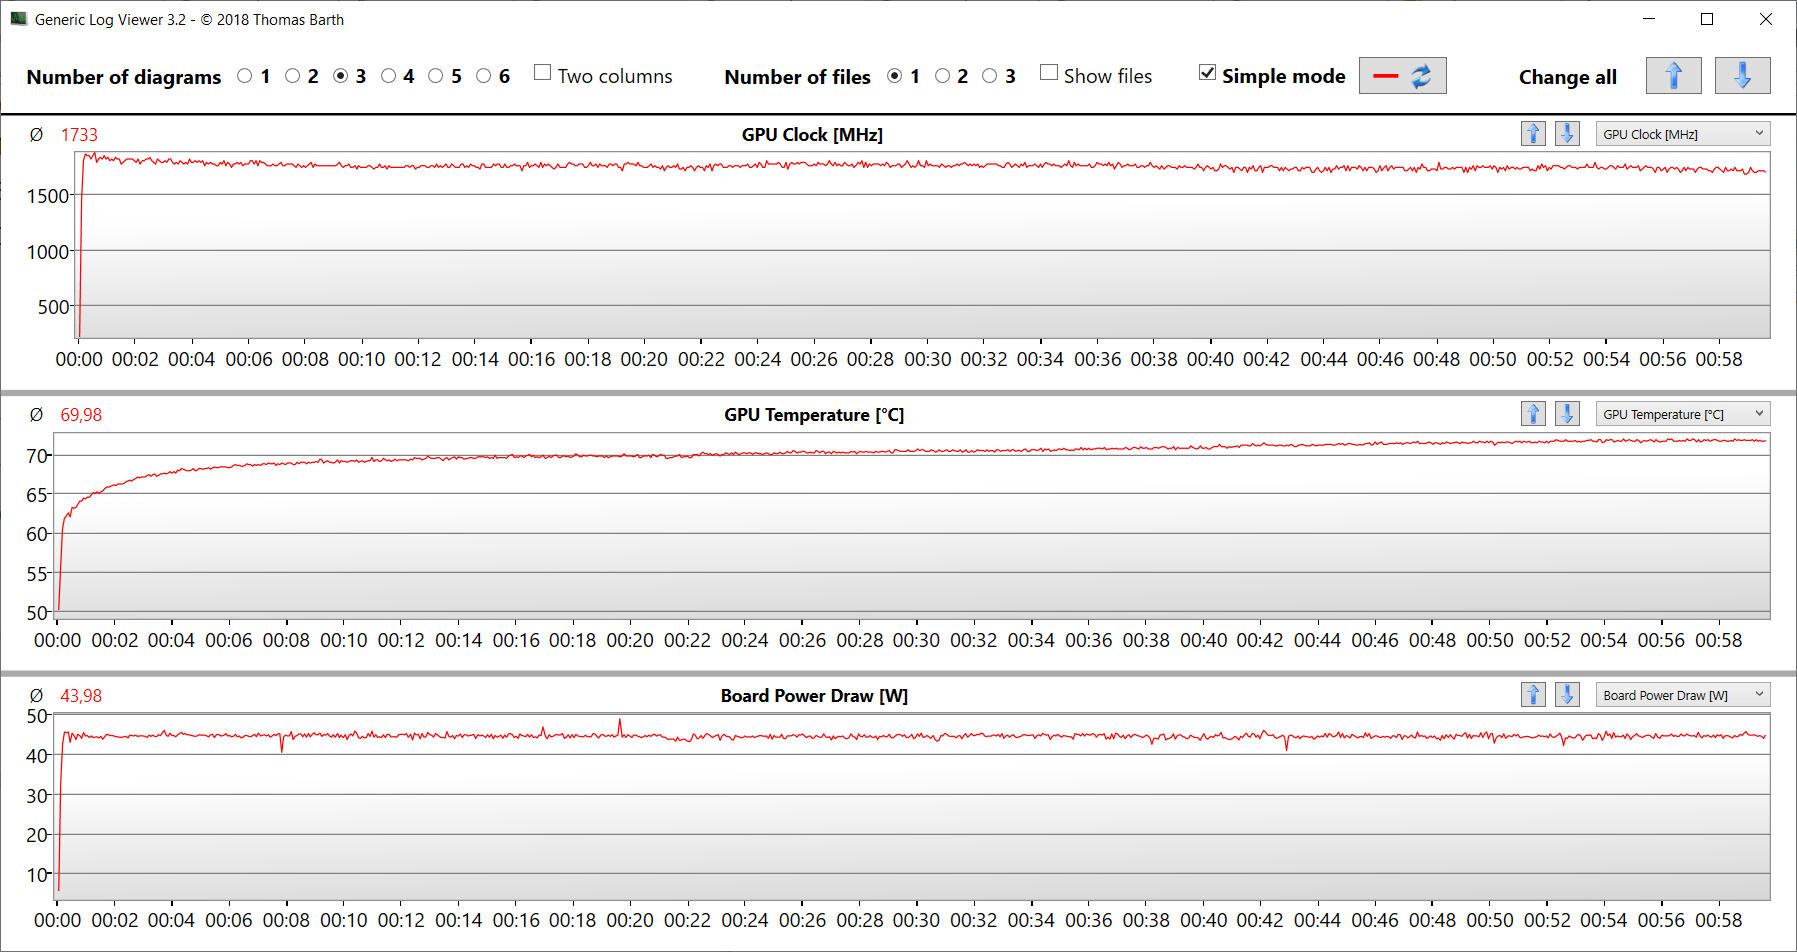
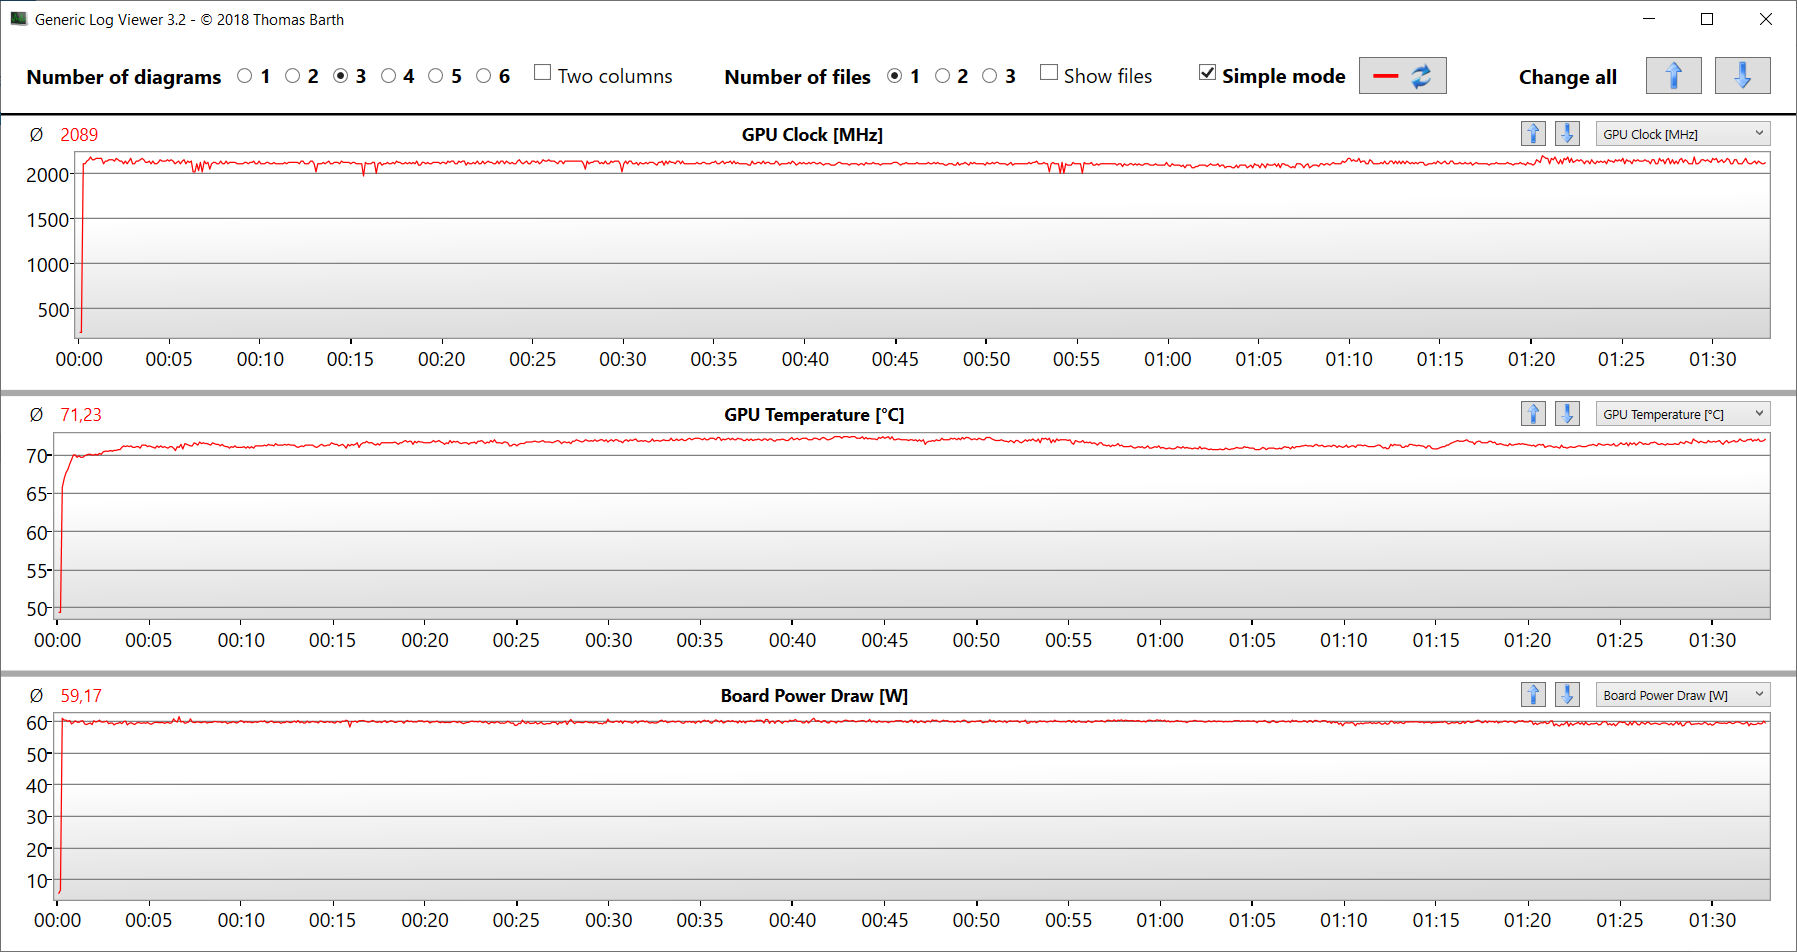
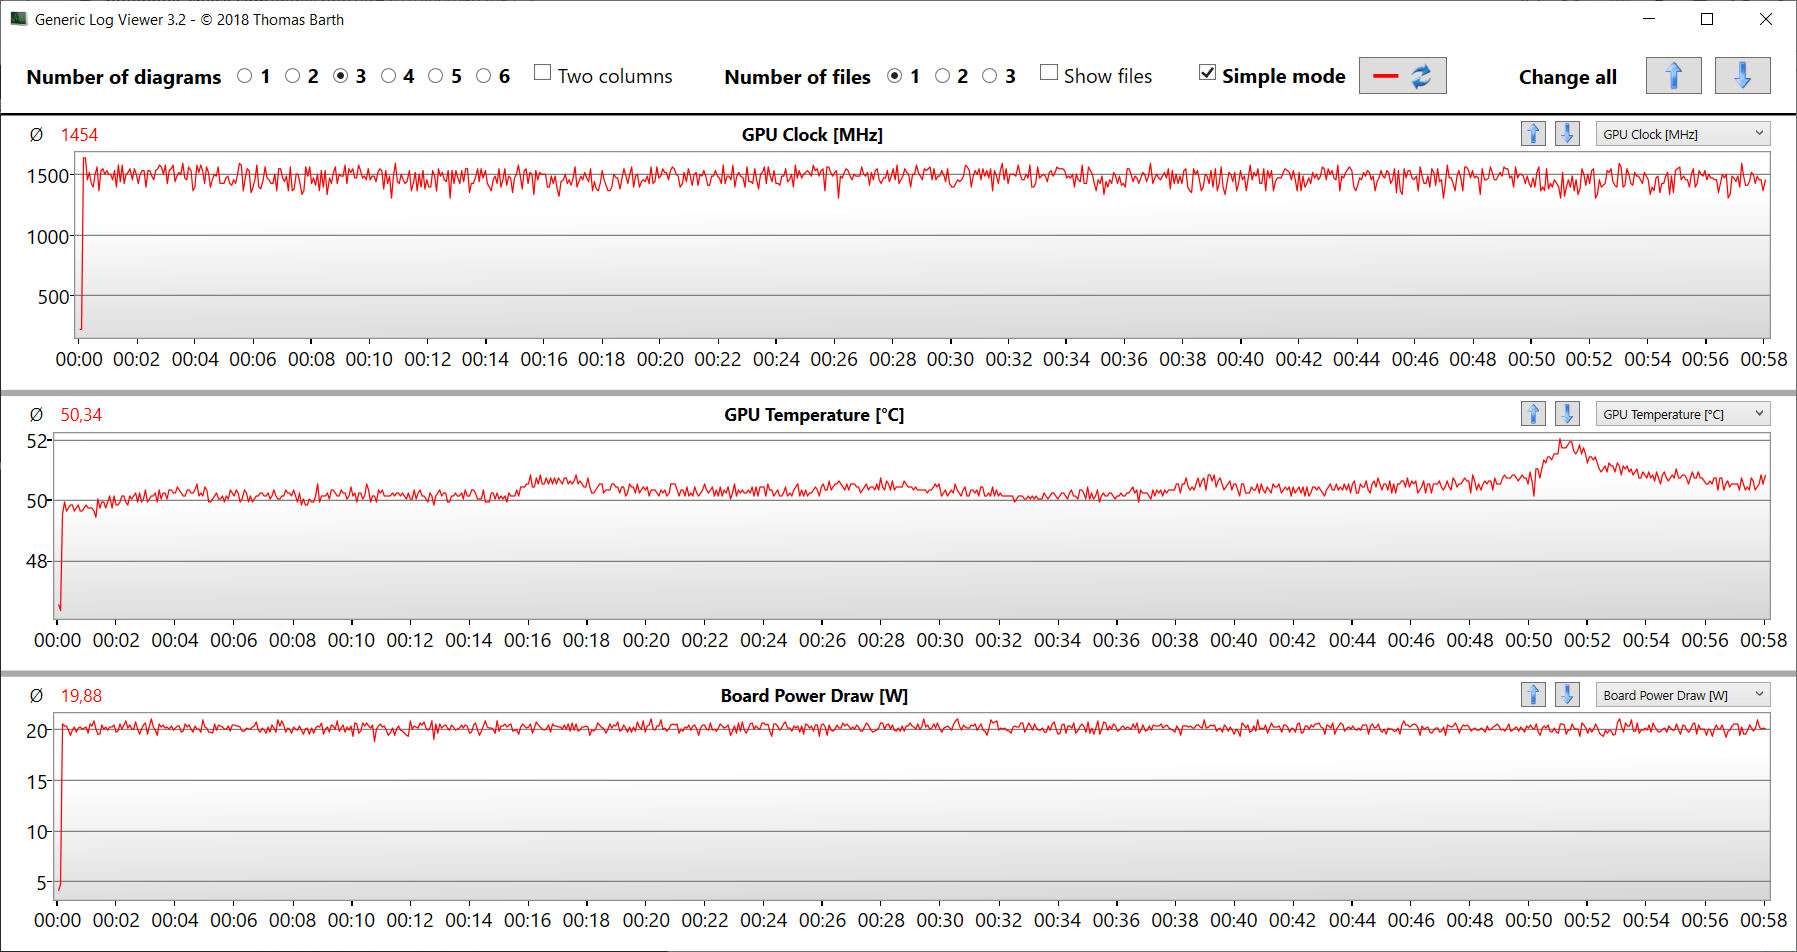
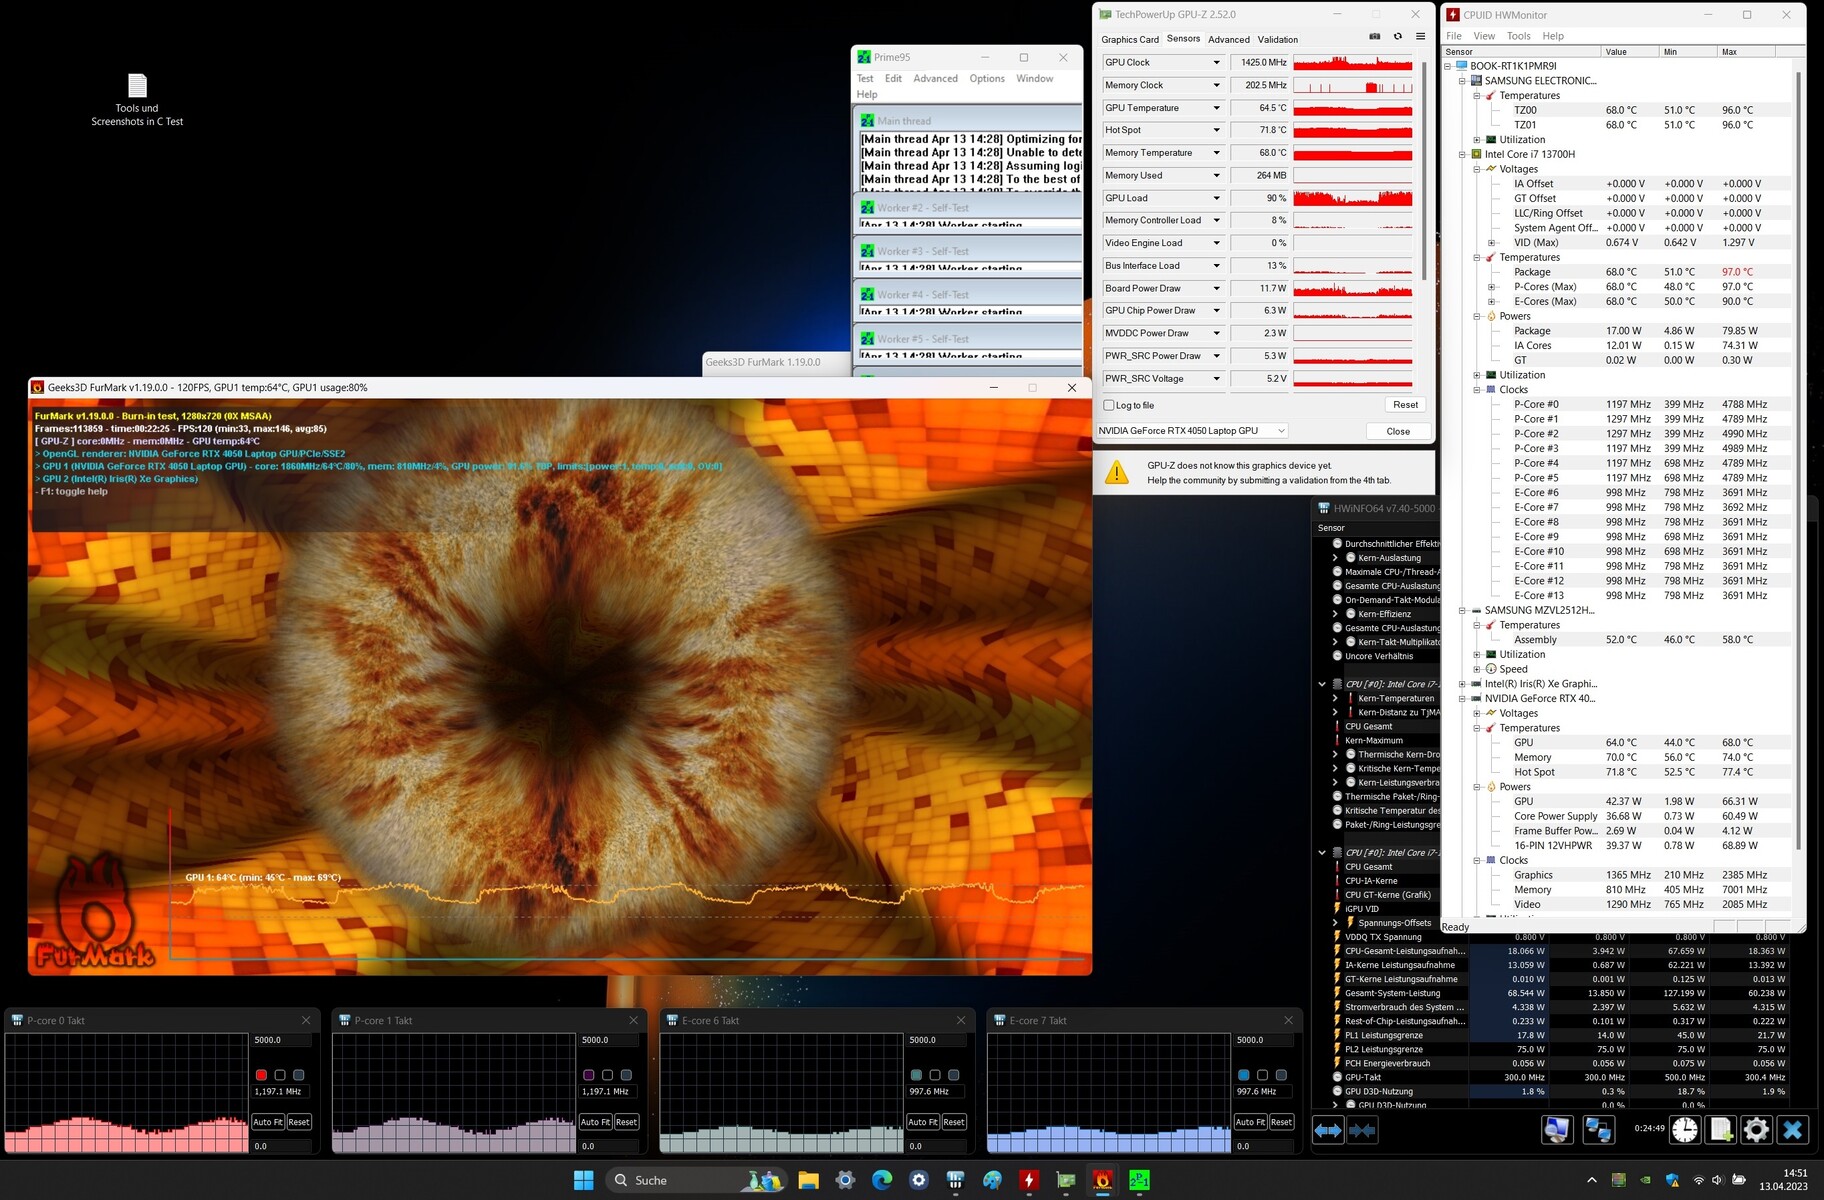
Stresstest
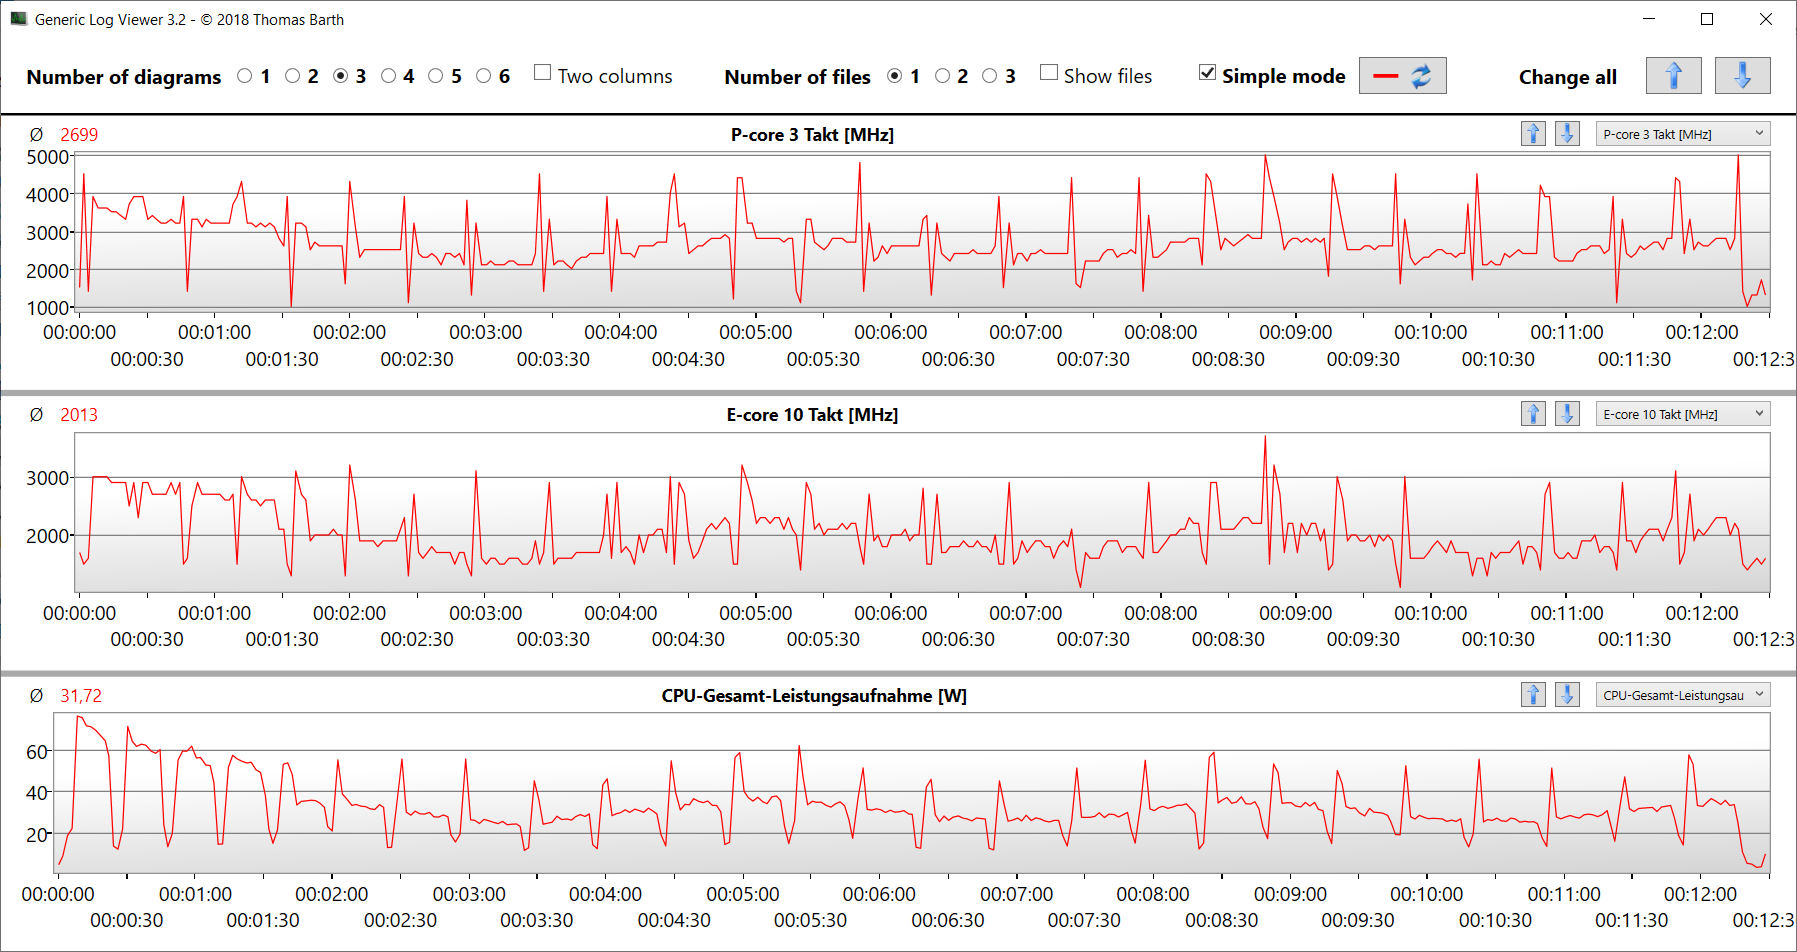
Stresstestet (Prime95 och Furmark i kontinuerlig drift) utgör ett extremt scenario för att kontrollera systemets stabilitet under full belastning. Processorn (P: 2,8-2,9 GHz, E: 2,3-2,4 GHz) och grafikprocessorn (ca 1 100 MHz) börjar testet med hastigheter som ligger ungefär på samma nivå som basklockan och sjunker betydligt under testets gång.
Högtalare
Stereohögtalarna ger ett mycket bra ljud, men skulle behöva mer bas. Hörlurar eller externa högtalare rekommenderas för bättre ljudkvalitet.
Samsung Galaxy Book3 Ultra 16 ljudanalys
(+) | högtalare kan spela relativt högt (83 dB)
Bas 100 - 315 Hz
(±) | reducerad bas - i genomsnitt 11.4% lägre än medianen
(±) | linjäriteten för basen är genomsnittlig (10.3% delta till föregående frekvens)
Mellan 400 - 2000 Hz
(±) | högre mellan - i genomsnitt 5.4% högre än median
(+) | mids är linjära (3% delta till föregående frekvens)
Högsta 2 - 16 kHz
(+) | balanserade toppar - endast 1.6% från medianen
(+) | toppar är linjära (3.8% delta till föregående frekvens)
Totalt 100 - 16 000 Hz
(+) | det totala ljudet är linjärt (11.8% skillnad mot median)
Jämfört med samma klass
» 19% av alla testade enheter i den här klassen var bättre, 4% liknande, 76% sämre
» Den bästa hade ett delta på 5%, genomsnittet var 17%, sämst var 45%
Jämfört med alla testade enheter
» 9% av alla testade enheter var bättre, 3% liknande, 89% sämre
» Den bästa hade ett delta på 4%, genomsnittet var 23%, sämst var 134%
Schenker Vision 16 Pro RTX 3070 Ti ljudanalys
(±) | högtalarljudstyrkan är genomsnittlig men bra (77.6 dB)
Bas 100 - 315 Hz
(-) | nästan ingen bas - i genomsnitt 17.9% lägre än medianen
(±) | linjäriteten för basen är genomsnittlig (12.2% delta till föregående frekvens)
Mellan 400 - 2000 Hz
(+) | balanserad mellan - endast 3.3% från medianen
(+) | mids är linjära (4.9% delta till föregående frekvens)
Högsta 2 - 16 kHz
(+) | balanserade toppar - endast 2.8% från medianen
(+) | toppar är linjära (5.1% delta till föregående frekvens)
Totalt 100 - 16 000 Hz
(±) | linjäriteten för det totala ljudet är genomsnittlig (15.1% skillnad mot median)
Jämfört med samma klass
» 36% av alla testade enheter i den här klassen var bättre, 4% liknande, 60% sämre
» Den bästa hade ett delta på 5%, genomsnittet var 17%, sämst var 45%
Jämfört med alla testade enheter
» 21% av alla testade enheter var bättre, 4% liknande, 75% sämre
» Den bästa hade ett delta på 4%, genomsnittet var 23%, sämst var 134%
Energihantering - NP960XFH saknar inte uthållighet
Effektförbrukning
På det hela taget är Samsungs bärbara dator nöjd med relativt lite energi. Både vid tomgång och under belastning är energikraven lägre än hos konkurrenterna, med undantag för LG Gram https://www.notebookcheck.net/LG-Gram-17-review-A-super-light-17-inch-laptop-with-a-modest-dGPU.698340.0.html. Testet Witcher 3 och stresstestet körs med relativt konstant energiförbrukning. Mot slutet av stresstestet sjunker kravet lite. USB-C-strömförsörjningen (100 watt) är tillräckligt stor.
| Av/Standby | |
| Låg belastning | |
| Hög belastning |
|
Förklaring:
min: | |
| Samsung Galaxy Book3 Ultra 16 i7-13700H, GeForce RTX 4050 Laptop GPU | Schenker Vision 16 Pro RTX 3070 Ti i7-12700H, GeForce RTX 3070 Ti Laptop GPU | LG Gram 17Z90Q-E.AD78G i7-1260P, GeForce RTX 2050 Mobile | Lenovo ThinkBook 16p G3 ARH R9 6900HX, GeForce RTX 3060 Laptop GPU | Dell XPS 15 9520 RTX 3050 Ti i7-12700H, GeForce RTX 3050 Ti Laptop GPU | Asus VivoBook Pro 16X OLED N7600PC-L2026X i7-11370H, GeForce RTX 3050 4GB Laptop GPU | Acer Swift X SFX16-52G-77RX i7-1260P, A370M | Genomsnitt NVIDIA GeForce RTX 4050 Laptop GPU | Genomsnitt av klass Multimedia | |
|---|---|---|---|---|---|---|---|---|---|
| Power Consumption | -105% | -7% | -126% | -39% | -63% | -12% | -123% | -41% | |
| Idle Minimum * (Watt) | 3 | 9 -200% | 4.1 -37% | 10.3 -243% | 5.5 -83% | 8.9 -197% | 3.7 -23% | 9.95 ? -232% | 5.66 ? -89% |
| Idle Average * (Watt) | 5 | 13.3 -166% | 9.8 -96% | 16 -220% | 7.2 -44% | 10.2 -104% | 7.6 -52% | 15.8 ? -216% | 10.2 ? -104% |
| Idle Maximum * (Watt) | 11 | 14.3 -30% | 12 -9% | 24 -118% | 16 -45% | 12 -9% | 11.1 -1% | 20.1 ? -83% | 12.5 ? -14% |
| Load Average * (Watt) | 72 | 107 -49% | 49.3 32% | 85.4 -19% | 91.8 -27% | 94 -31% | 70 3% | 88 ? -22% | 65.2 ? 9% |
| Witcher 3 ultra * (Watt) | 69.7 | 155.2 -123% | 49.3 29% | 132.2 -90% | 74.6 -7% | 93.1 -34% | 68.8 1% | ||
| Load Maximum * (Watt) | 108 | 172 -59% | 66 39% | 181.9 -68% | 134.7 -25% | 112 -4% | 108 -0% | 176.3 ? -63% | 113.5 ? -5% |
* ... mindre är bättre
Power consumption Witcher 3 / Stress test
Power consumption with an external monitor
Batteritid
16-tummaren uppnår körtider på 9:36 timmar och 13:23 timmar i WLAN-testet (uppringning av webbplatser via ett skript) respektive videotestet (kortfilmen Big Buck Bunny, H.264-kodning, FHD, i en slinga). Under båda testerna var den bärbara datorns energisparfunktioner inaktiverade och skärmens ljusstyrka inställd på cirka 150 cd/m². De trådlösa modulerna var också inaktiverade under videotestet.
| Samsung Galaxy Book3 Ultra 16 i7-13700H, GeForce RTX 4050 Laptop GPU, 76 Wh | Schenker Vision 16 Pro RTX 3070 Ti i7-12700H, GeForce RTX 3070 Ti Laptop GPU, 80 Wh | LG Gram 17Z90Q-E.AD78G i7-1260P, GeForce RTX 2050 Mobile, 90 Wh | Lenovo ThinkBook 16p G3 ARH R9 6900HX, GeForce RTX 3060 Laptop GPU, 71 Wh | Dell XPS 15 9520 RTX 3050 Ti i7-12700H, GeForce RTX 3050 Ti Laptop GPU, 86 Wh | Asus VivoBook Pro 16X OLED N7600PC-L2026X i7-11370H, GeForce RTX 3050 4GB Laptop GPU, 96 Wh | Acer Swift X SFX16-52G-77RX i7-1260P, A370M, 56 Wh | Genomsnitt av klass Multimedia | |
|---|---|---|---|---|---|---|---|---|
| Batteridrifttid | -40% | 37% | -32% | 17% | -3% | -22% | 21% | |
| Reader / Idle (h) | 18.2 | 14.8 -19% | 11.1 -39% | 24.9 ? 37% | ||||
| H.264 (h) | 13.4 | 6.1 -54% | 10.4 -22% | 17.1 ? 28% | ||||
| WiFi v1.3 (h) | 9.6 | 6 -37% | 14.5 51% | 6.5 -32% | 8.8 -8% | 8.7 -9% | 9.1 -5% | 12.2 ? 27% |
| Load (h) | 1.8 | 1.3 -28% | 2.2 22% | 3.2 78% | 2.5 39% | 1.1 -39% | 1.664 ? -8% |
För
Emot
Slutsats - En lyckad kompromiss
Galaxy Book3 Ultra 16 är en bra kompromiss mellan prestanda, mobilitet och ergonomi. The Core i7-13700H och GeForce RTX 4050 bärbar dator körs med reducerad prestanda, men levererar ändå tillräckligt med kraft för FHD-spel och rendering.
Samsung levererar en mobil bärbar dator för spelare och kreativa arbetare i Galaxy Book3 Ultra 16. Men den alltför höga prislappen kastar en skugga över den bärbara datorns annars starka karaktär.
Den kompakta enheten väger inte alltför mycket med sina 1,8 kg. I kombination med en praktisk batteritid på 9 till 13 timmar har du en ganska mobil enhet i handen. Buller- och värmeutvecklingen är måttlig. Två USB-C-platser (Thunderbolt 4) används för strömförsörjningen och möjliggör enkel integrering i befintliga arbetsplatsuppställningar.
Den stora 16-tumsskärmen (2 880 x 1 800, OLED) i ett arbetsvänligt 16:10-format gör mål med hög ljusstyrka, utmärkt kontrast, stabila betraktningsvinklar, korta svarstider, bra färgåtergivning och mycket god färgområdestäckning. Nackdelen: panelen har en reflekterande yta och den använder dessutom PWM för alla ljusstyrkor - en enhet för 2399,99 USD borde erbjuda mer här.
RAM-minnet är också lite tunt med 16 GB. En enhet med anspråket Galaxy Book borde erbjuda 32 GB här, särskilt eftersom minnet (inbyggt) inte kan utökas. Åtminstone finns det högre prissatta 32 GB-modeller tillgängliga.
The Schenker Vision 16 Pro skulle kunna övervägas som ett alternativ. Den erbjuder mer grafikprestanda och utökningsbart RAM-minne, men har en nackdel när det gäller körtider och utsläpp. The Asus VivoBook Pro 16X OLED (cirka 1 400 US-dollar) och Acer Swift X 16 (ca 1 100 US-dollar) är billigare och svagare alternativ till Samsung-datorn. De erbjuder mindre prestanda, ibland kortare körtider och permanent lödd arbetsminne.
Pris och tillgänglighet
Konfigurationen av vår testenhet är tillgänglig via Amazon UK och Amazon Kanada för £2 449,00 respektive CAD$2 799,99. I USA verkar 1 TB vara den minsta konfigurationen på Samsungs webbplatssom börjar på 2399,99 dollar.
Samsung Galaxy Book3 Ultra 16
- 04/26/2023 v7 (old)
Sascha Mölck
Genomskinlighet
Valet av enheter som ska granskas görs av vår redaktion. Testprovet gavs till författaren som ett lån av tillverkaren eller återförsäljaren för denna recension. Långivaren hade inget inflytande på denna recension och inte heller fick tillverkaren en kopia av denna recension innan publiceringen. Det fanns ingen skyldighet att publicera denna recension. Som ett oberoende medieföretag är Notebookcheck inte föremål för auktoritet från tillverkare, återförsäljare eller förlag.
This is how Notebookcheck is testingEvery year, Notebookcheck independently reviews hundreds of laptops and smartphones using standardized procedures to ensure that all results are comparable. We have continuously developed our test methods for around 20 years and set industry standards in the process. In our test labs, high-quality measuring equipment is utilized by experienced technicians and editors. These tests involve a multi-stage validation process. Our complex rating system is based on hundreds of well-founded measurements and benchmarks, which maintains objectivity.
Price comparison

