Aorus 16X (2024) recension: Core i9 och RTX 4070 för 2 000 USD
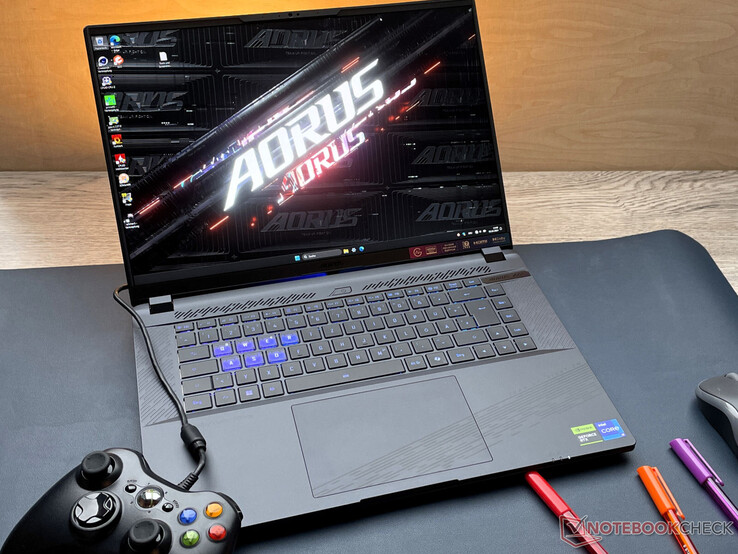
Gaming, rendering och innehållsskapande är de främsta styrkorna hos Aorus 16X ASG. Raptor Lake och Ada Lovelace levererar den prestanda som krävs. Dess konkurrenter inkluderar enheter som Alienware m16 R2, HP Omen Transcend 16, XMG Pro 16 Studio (Mid 23), Asus TUF Gaming A17 FA707XI och Lenovo Legion Pro 5 16IRX9.
Potentiella konkurrenter i jämförelse
Gradering | Datum | Modell | Vikt | Höjd | Storlek | Upplösning | Pris |
|---|---|---|---|---|---|---|---|
| 87.4 % v7 (old) | 04/2024 | Aorus 16X 2024 i9-14900HX, GeForce RTX 4070 Laptop GPU | 2.3 kg | 20 mm | 16.00" | 2560x1600 | |
| 90.2 % v7 (old) | 03/2024 | Alienware m16 R2 Ultra 7 155H, GeForce RTX 4070 Laptop GPU | 2.5 kg | 23.5 mm | 16.00" | 2560x1600 | |
| 88.4 % v7 (old) | 02/2024 | HP Omen Transcend 16-u1095ng i9-14900HX, GeForce RTX 4070 Laptop GPU | 2.3 kg | 20 mm | 16.00" | 2560x1600 | |
| 85.6 % v7 (old) | 01/2024 | Asus TUF Gaming A17 FA707XI-NS94 R9 7940HS, GeForce RTX 4070 Laptop GPU | 2.5 kg | 25.4 mm | 17.30" | 1920x1080 | |
| 87.9 % v7 (old) | 10/2023 | Schenker XMG Pro 16 Studio (Mid 23) i9-13900H, GeForce RTX 4070 Laptop GPU | 2.6 kg | 19.9 mm | 16.00" | 2560x1600 | |
| 89.3 % v7 (old) | 04/2024 | Lenovo Legion Pro 5 16IRX9 i9-14900HX, GeForce RTX 4070 Laptop GPU | 2.5 kg | 26.95 mm | 16.00" | 2560x1600 |
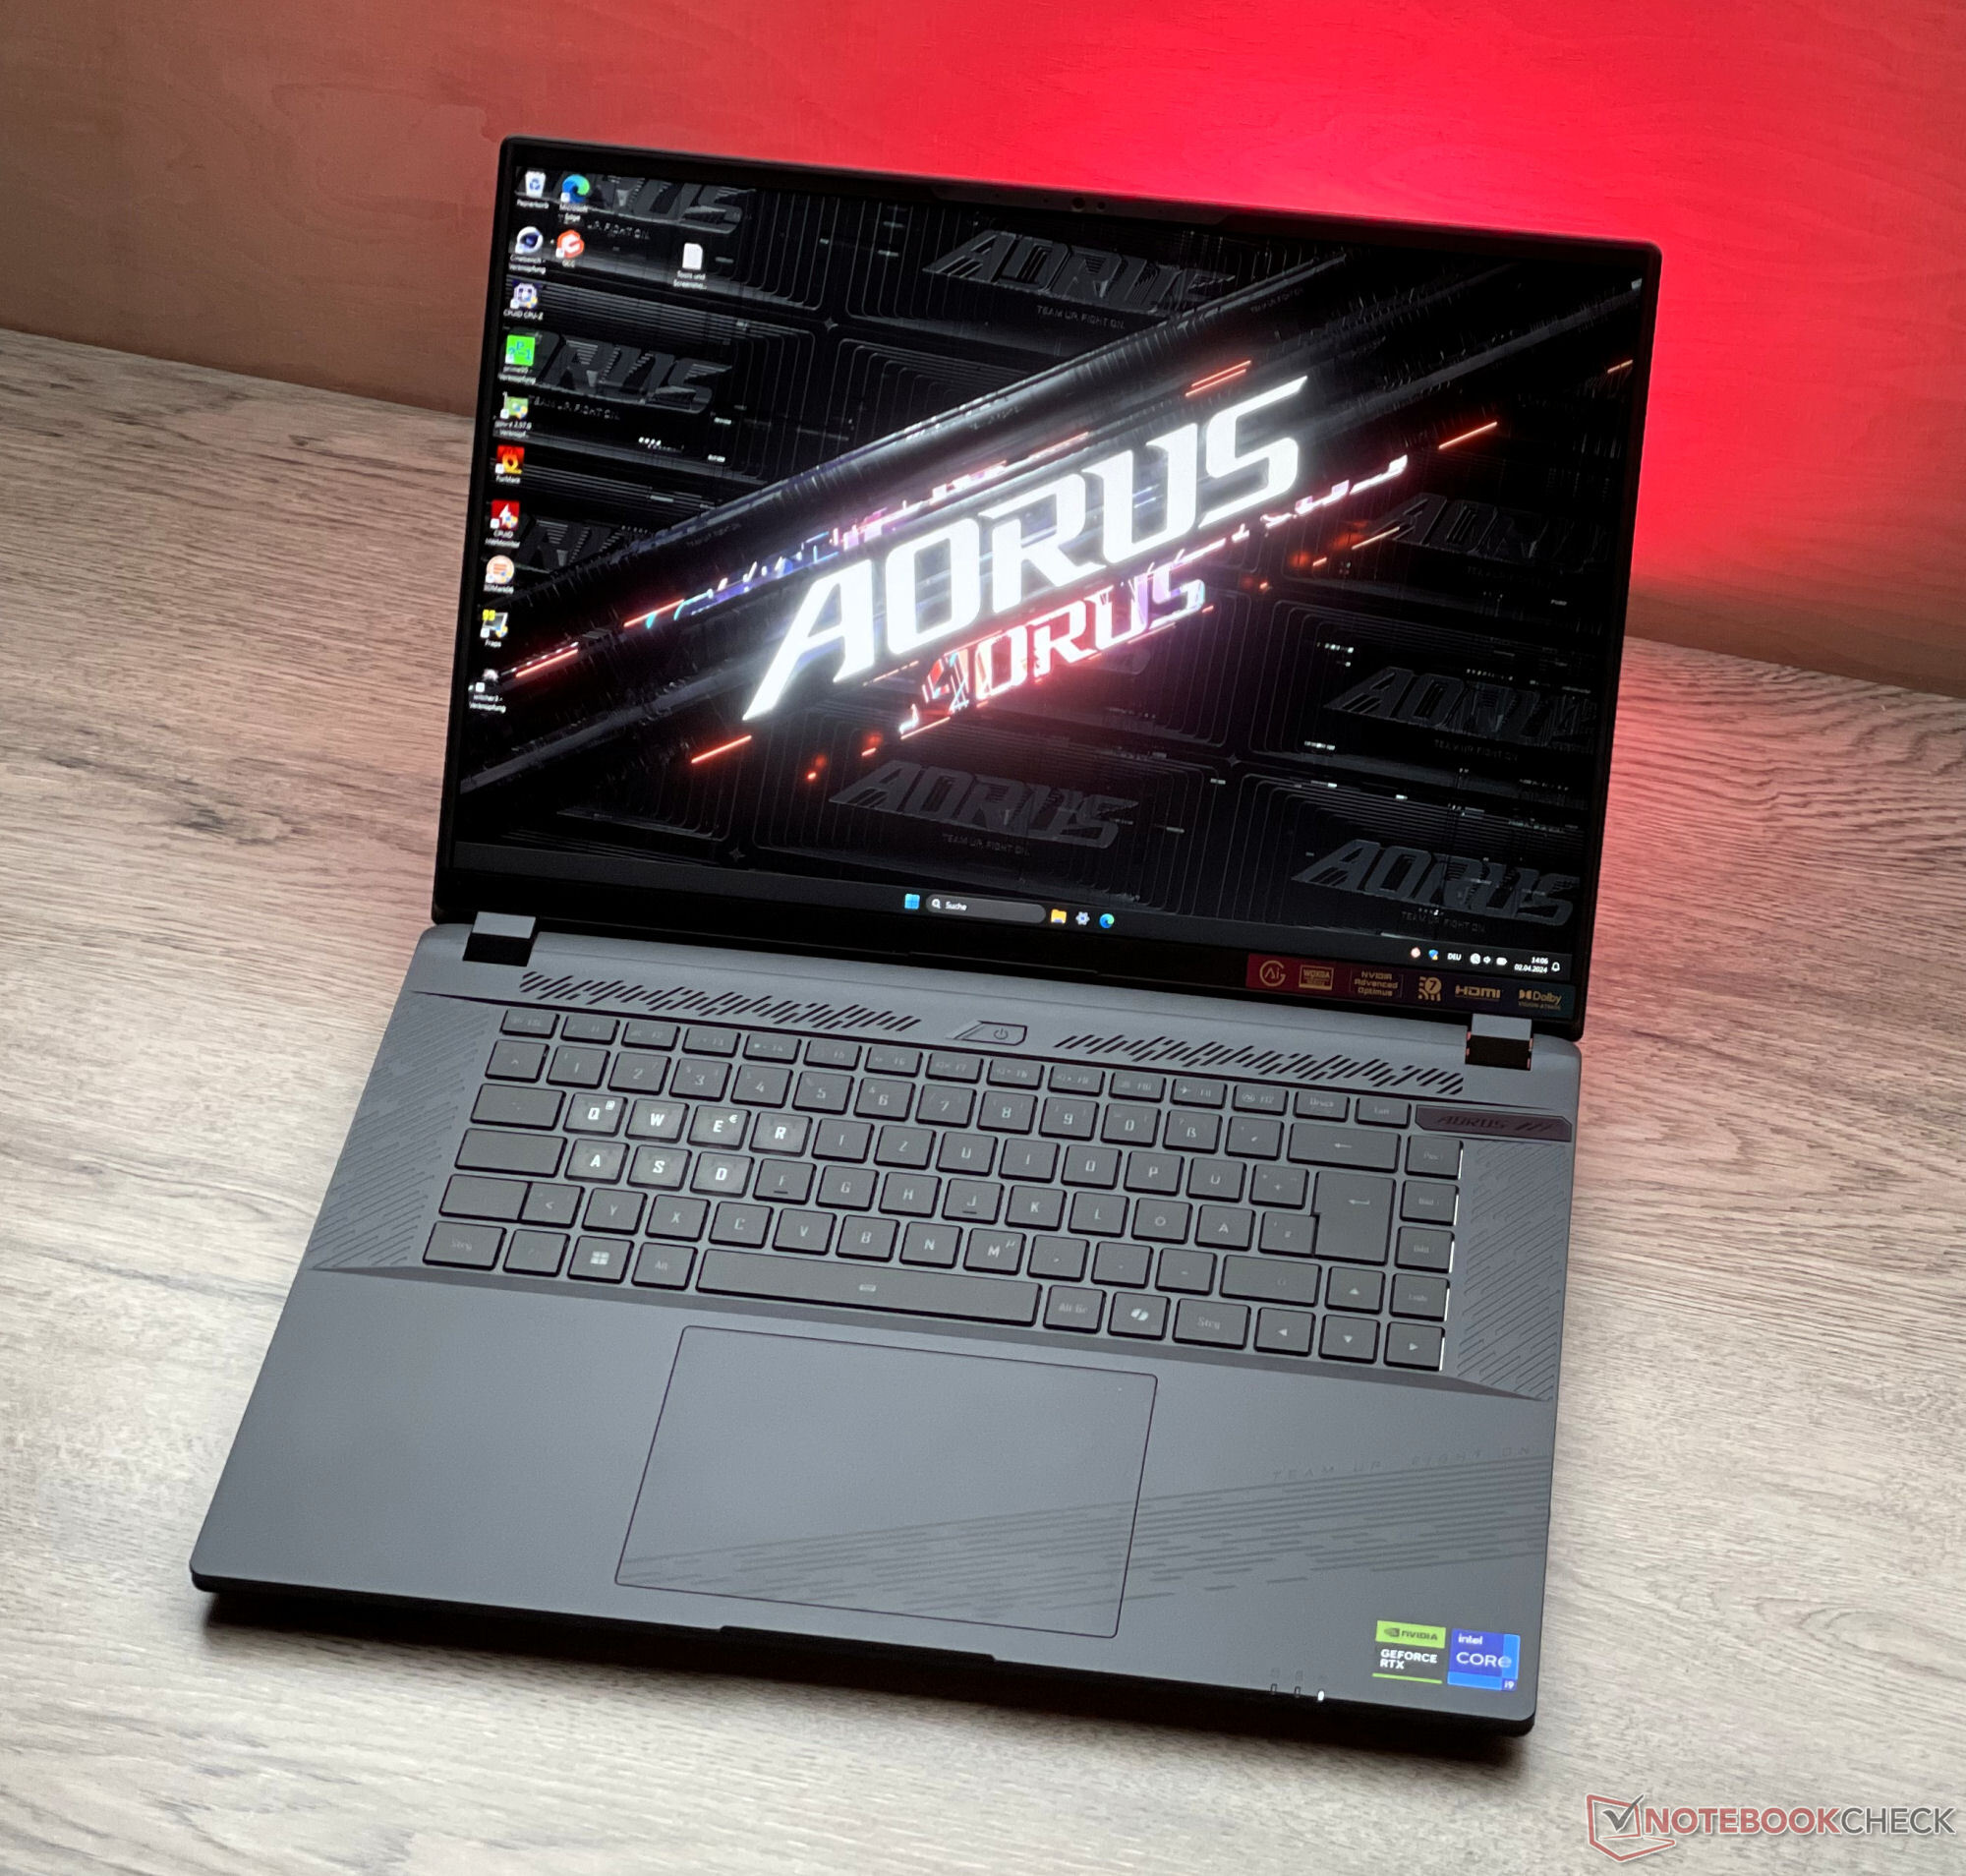
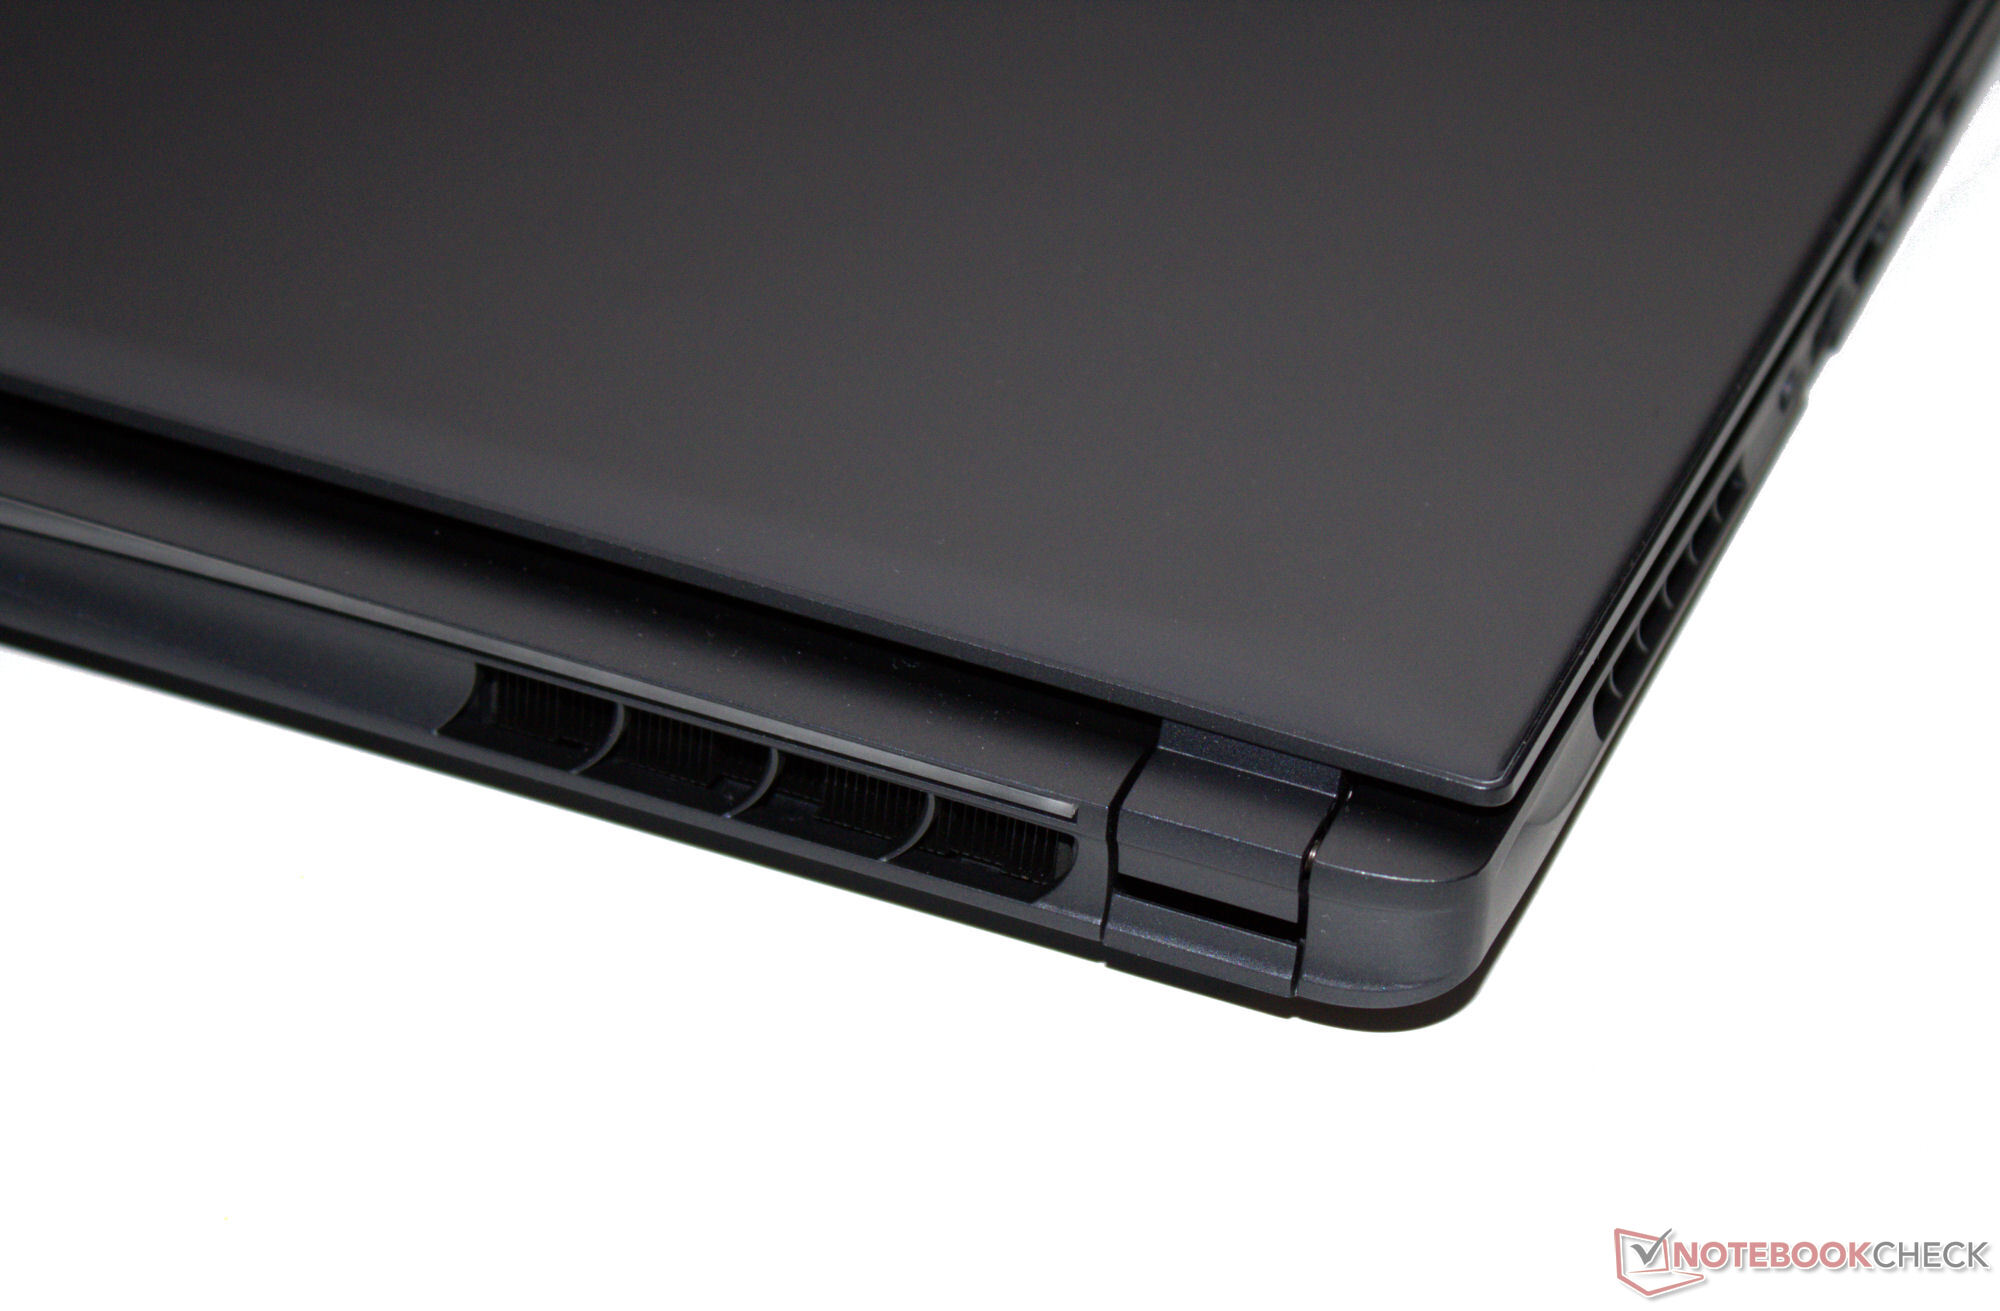
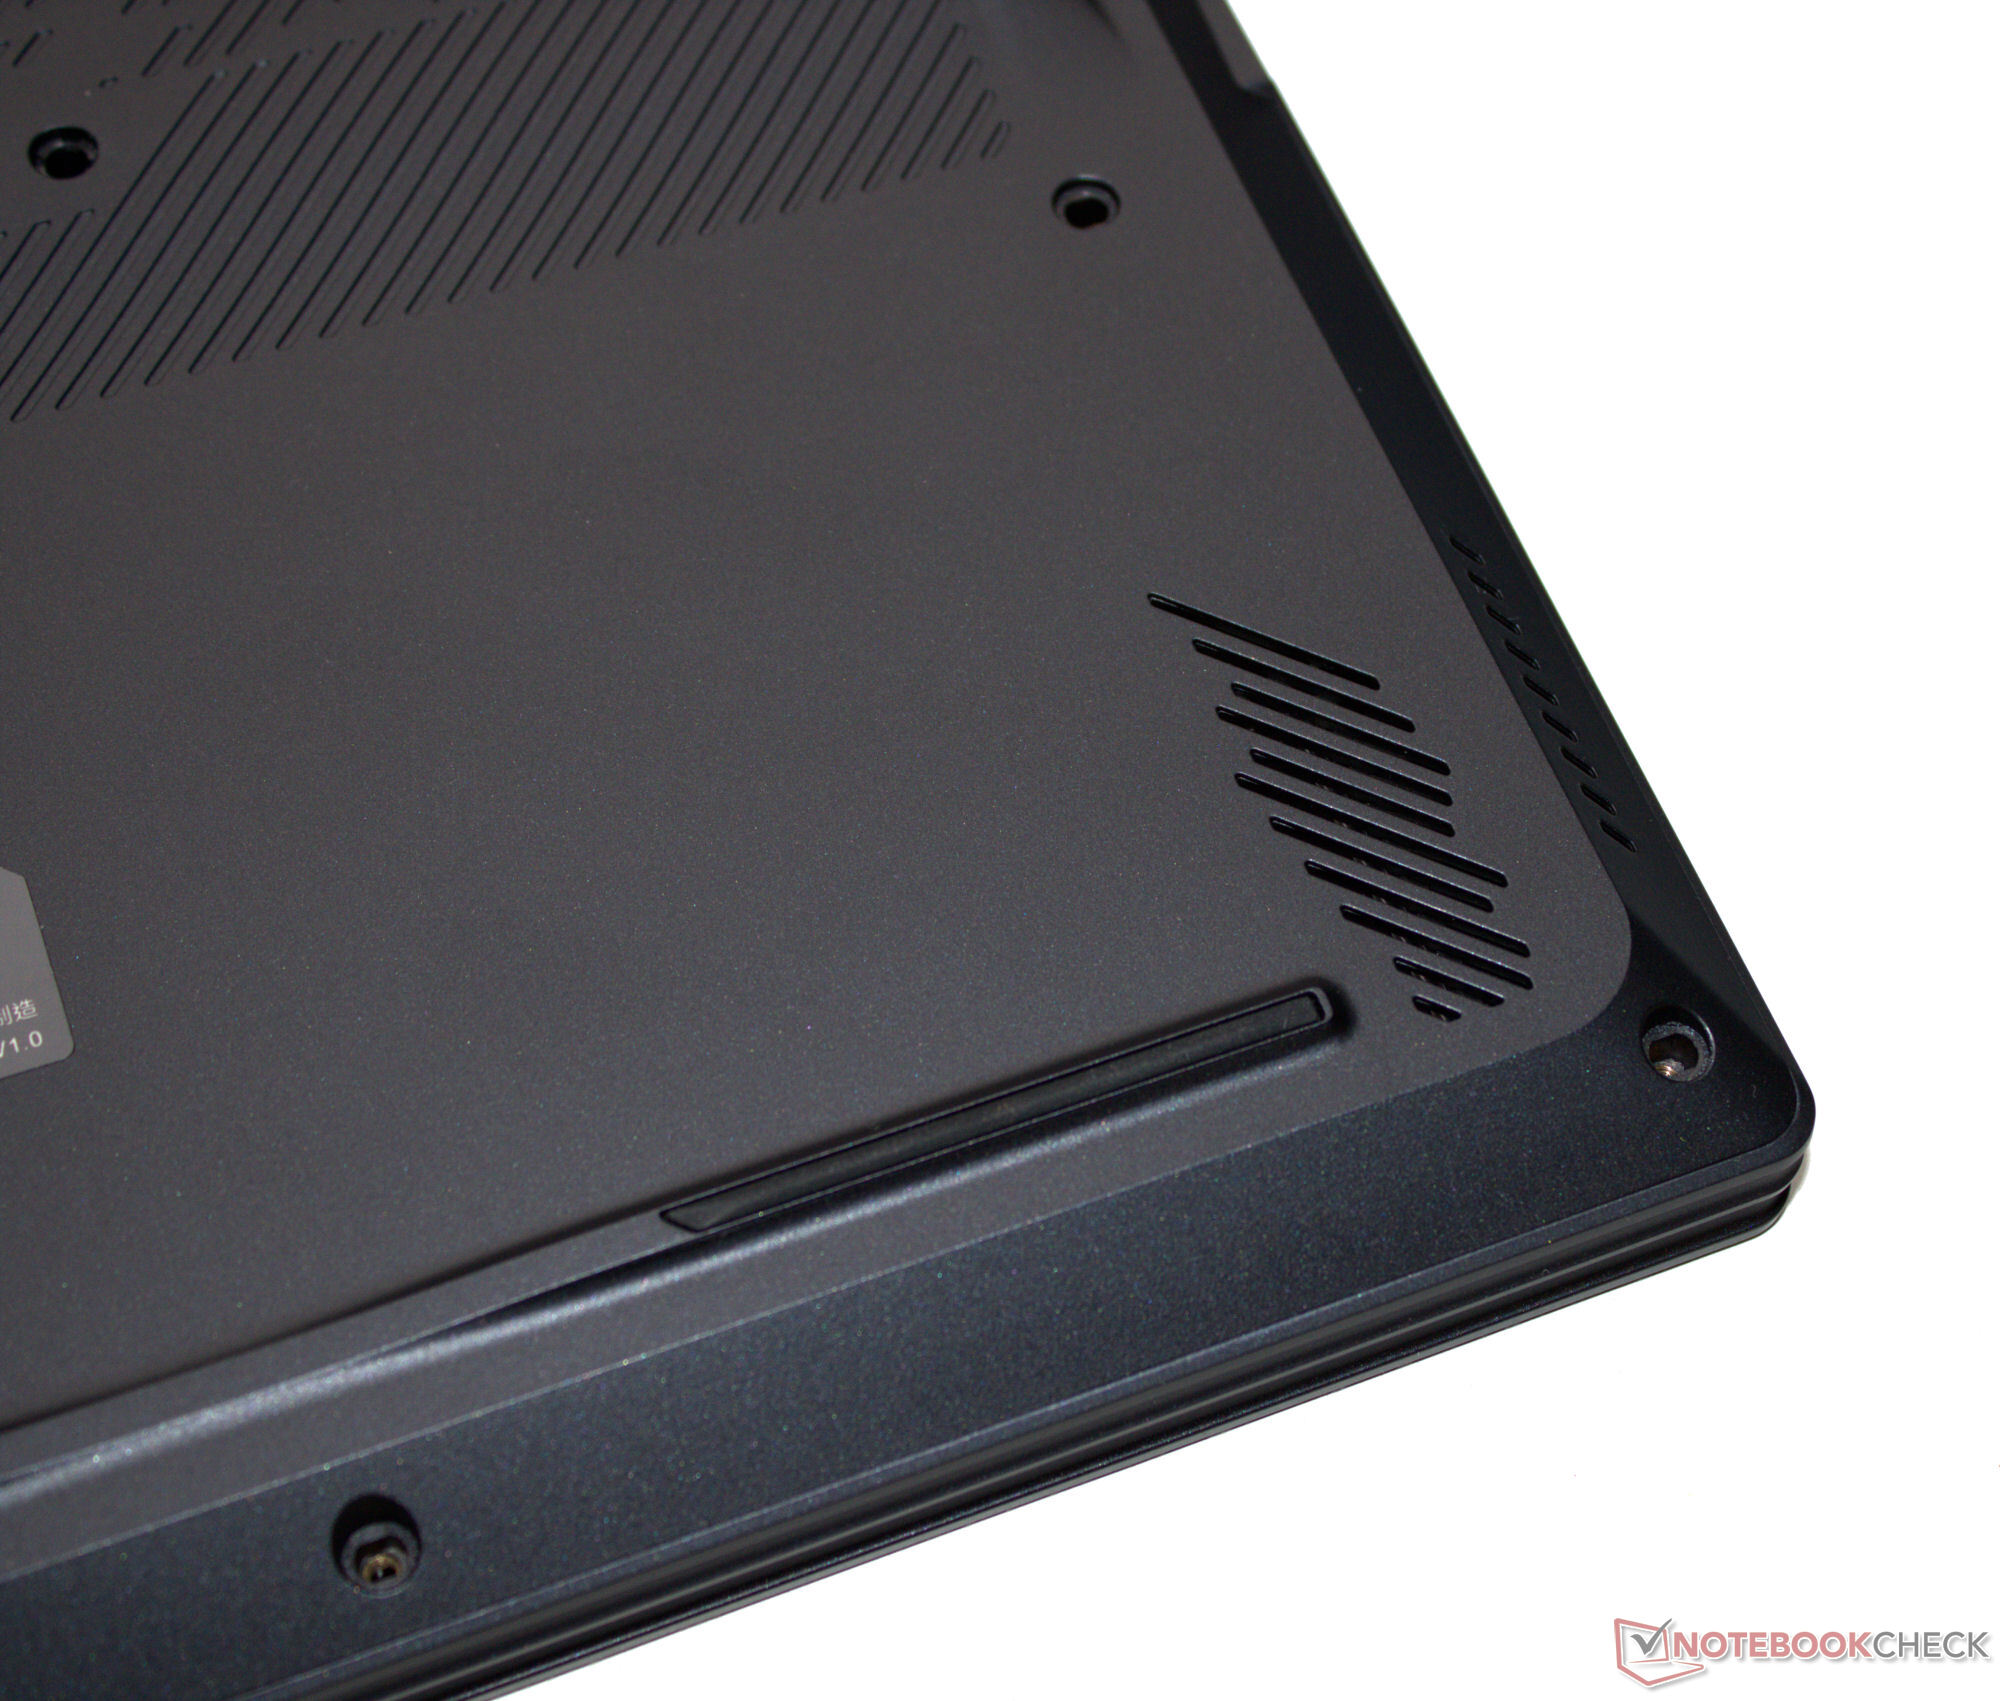
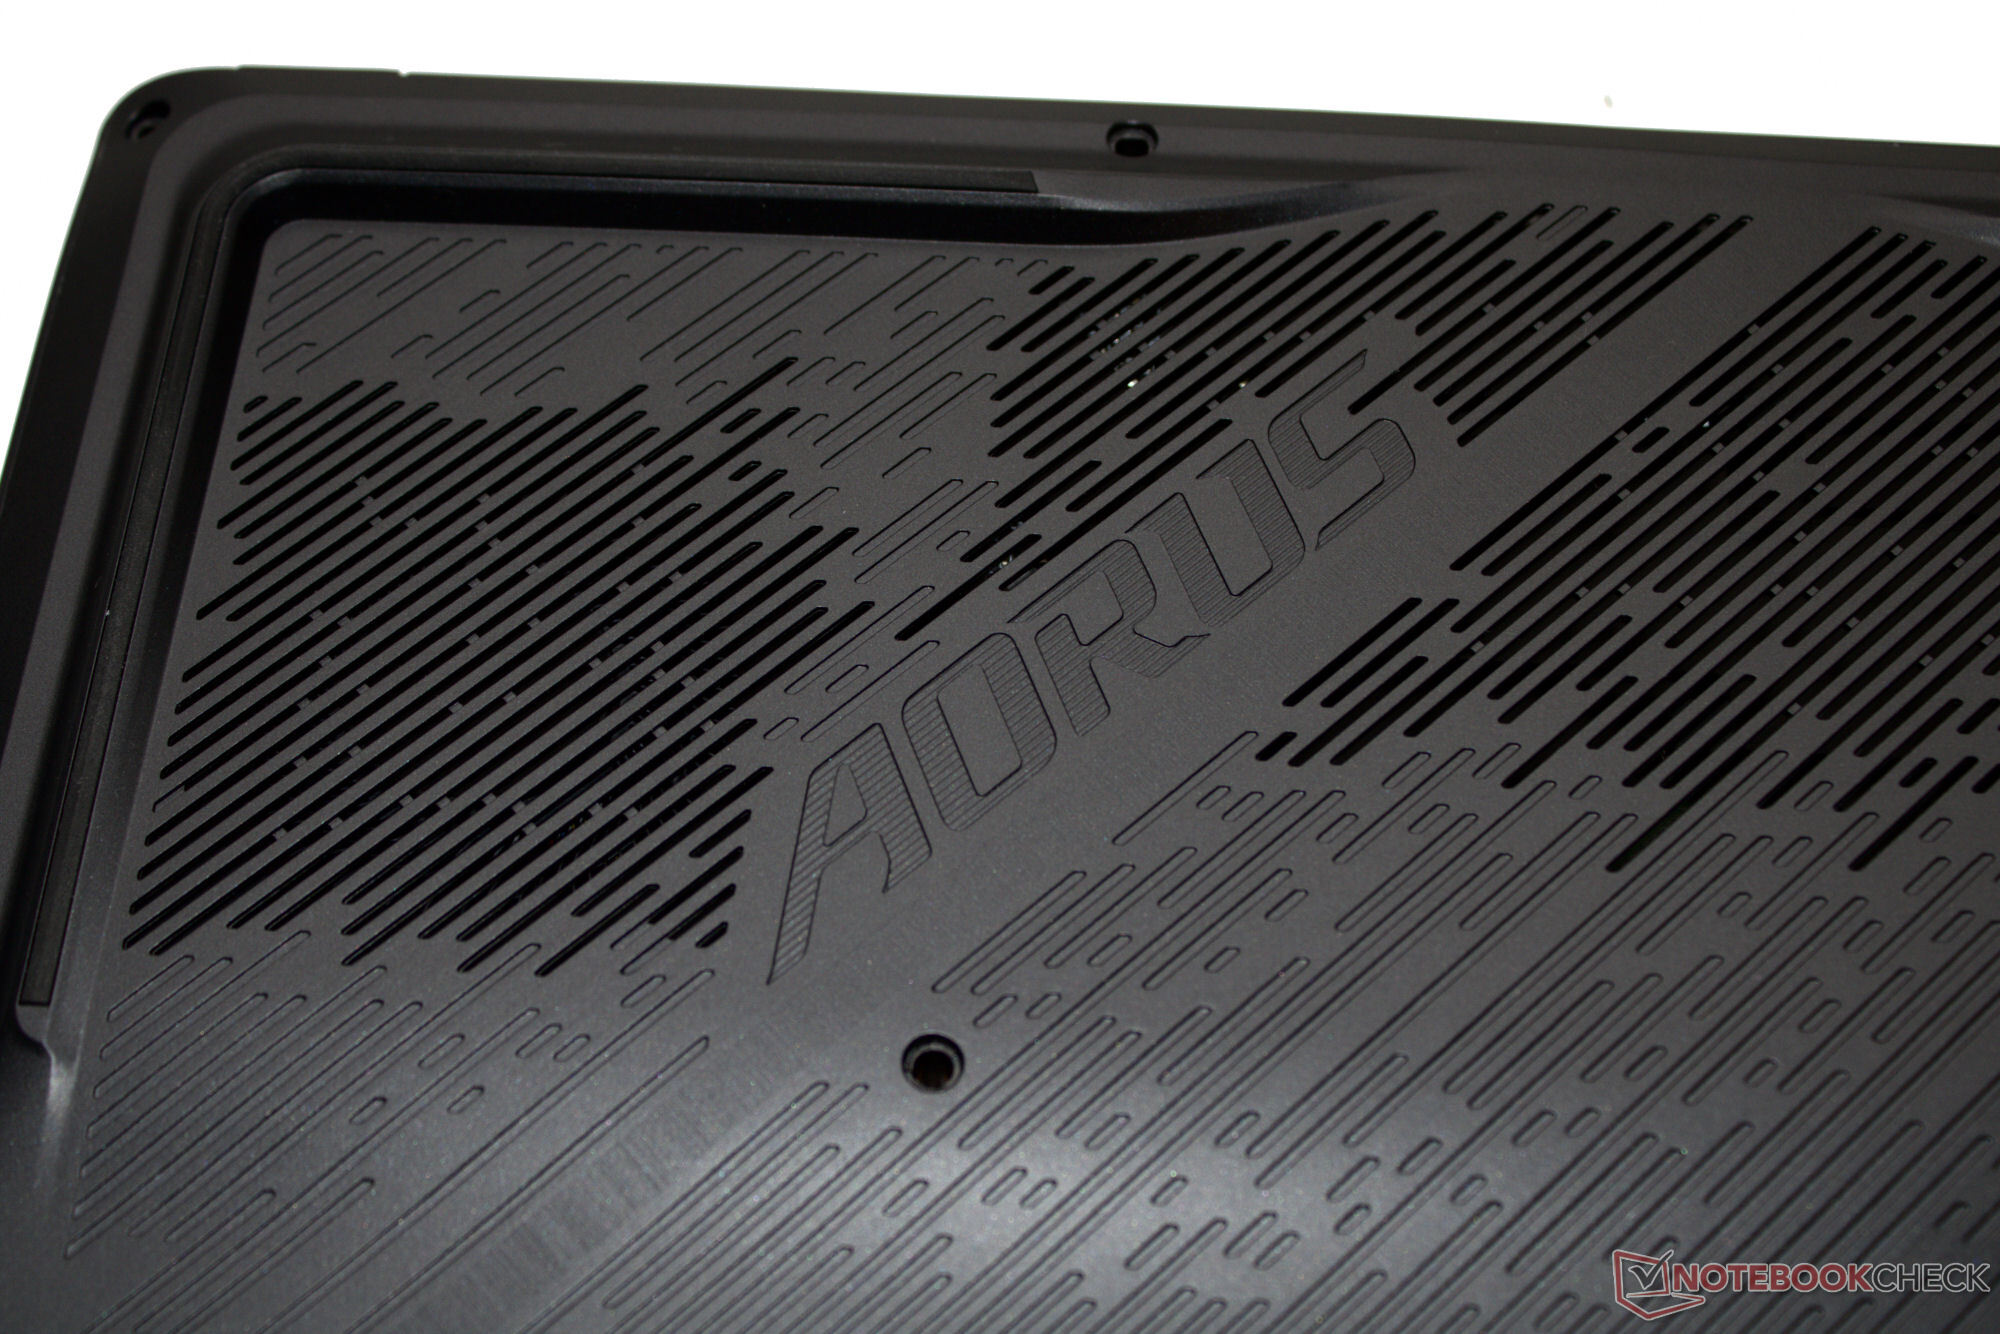
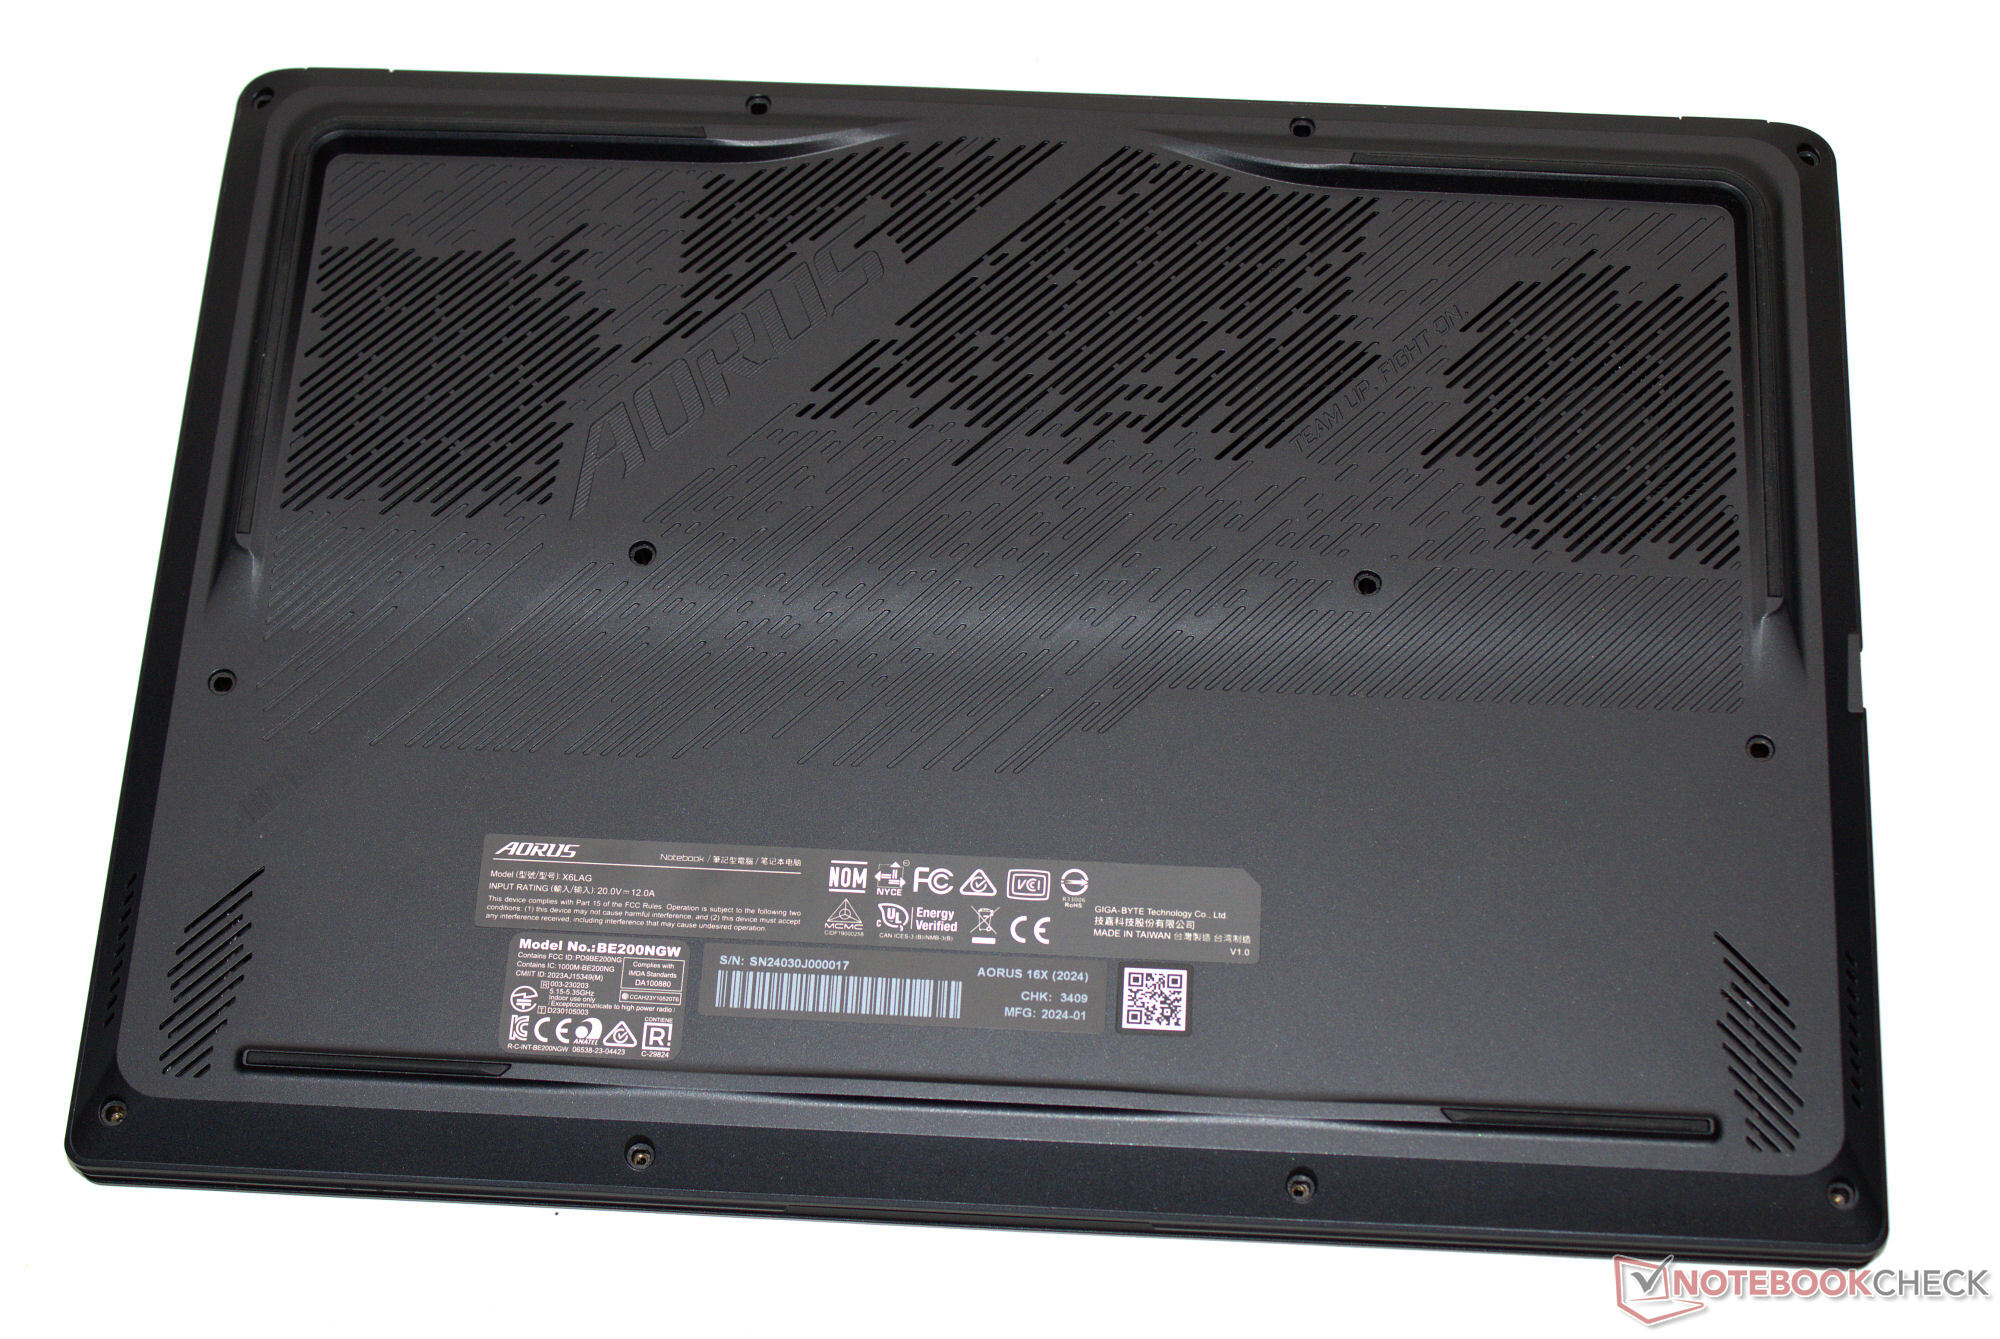
Case - LED-remsor ger en touch av skoj
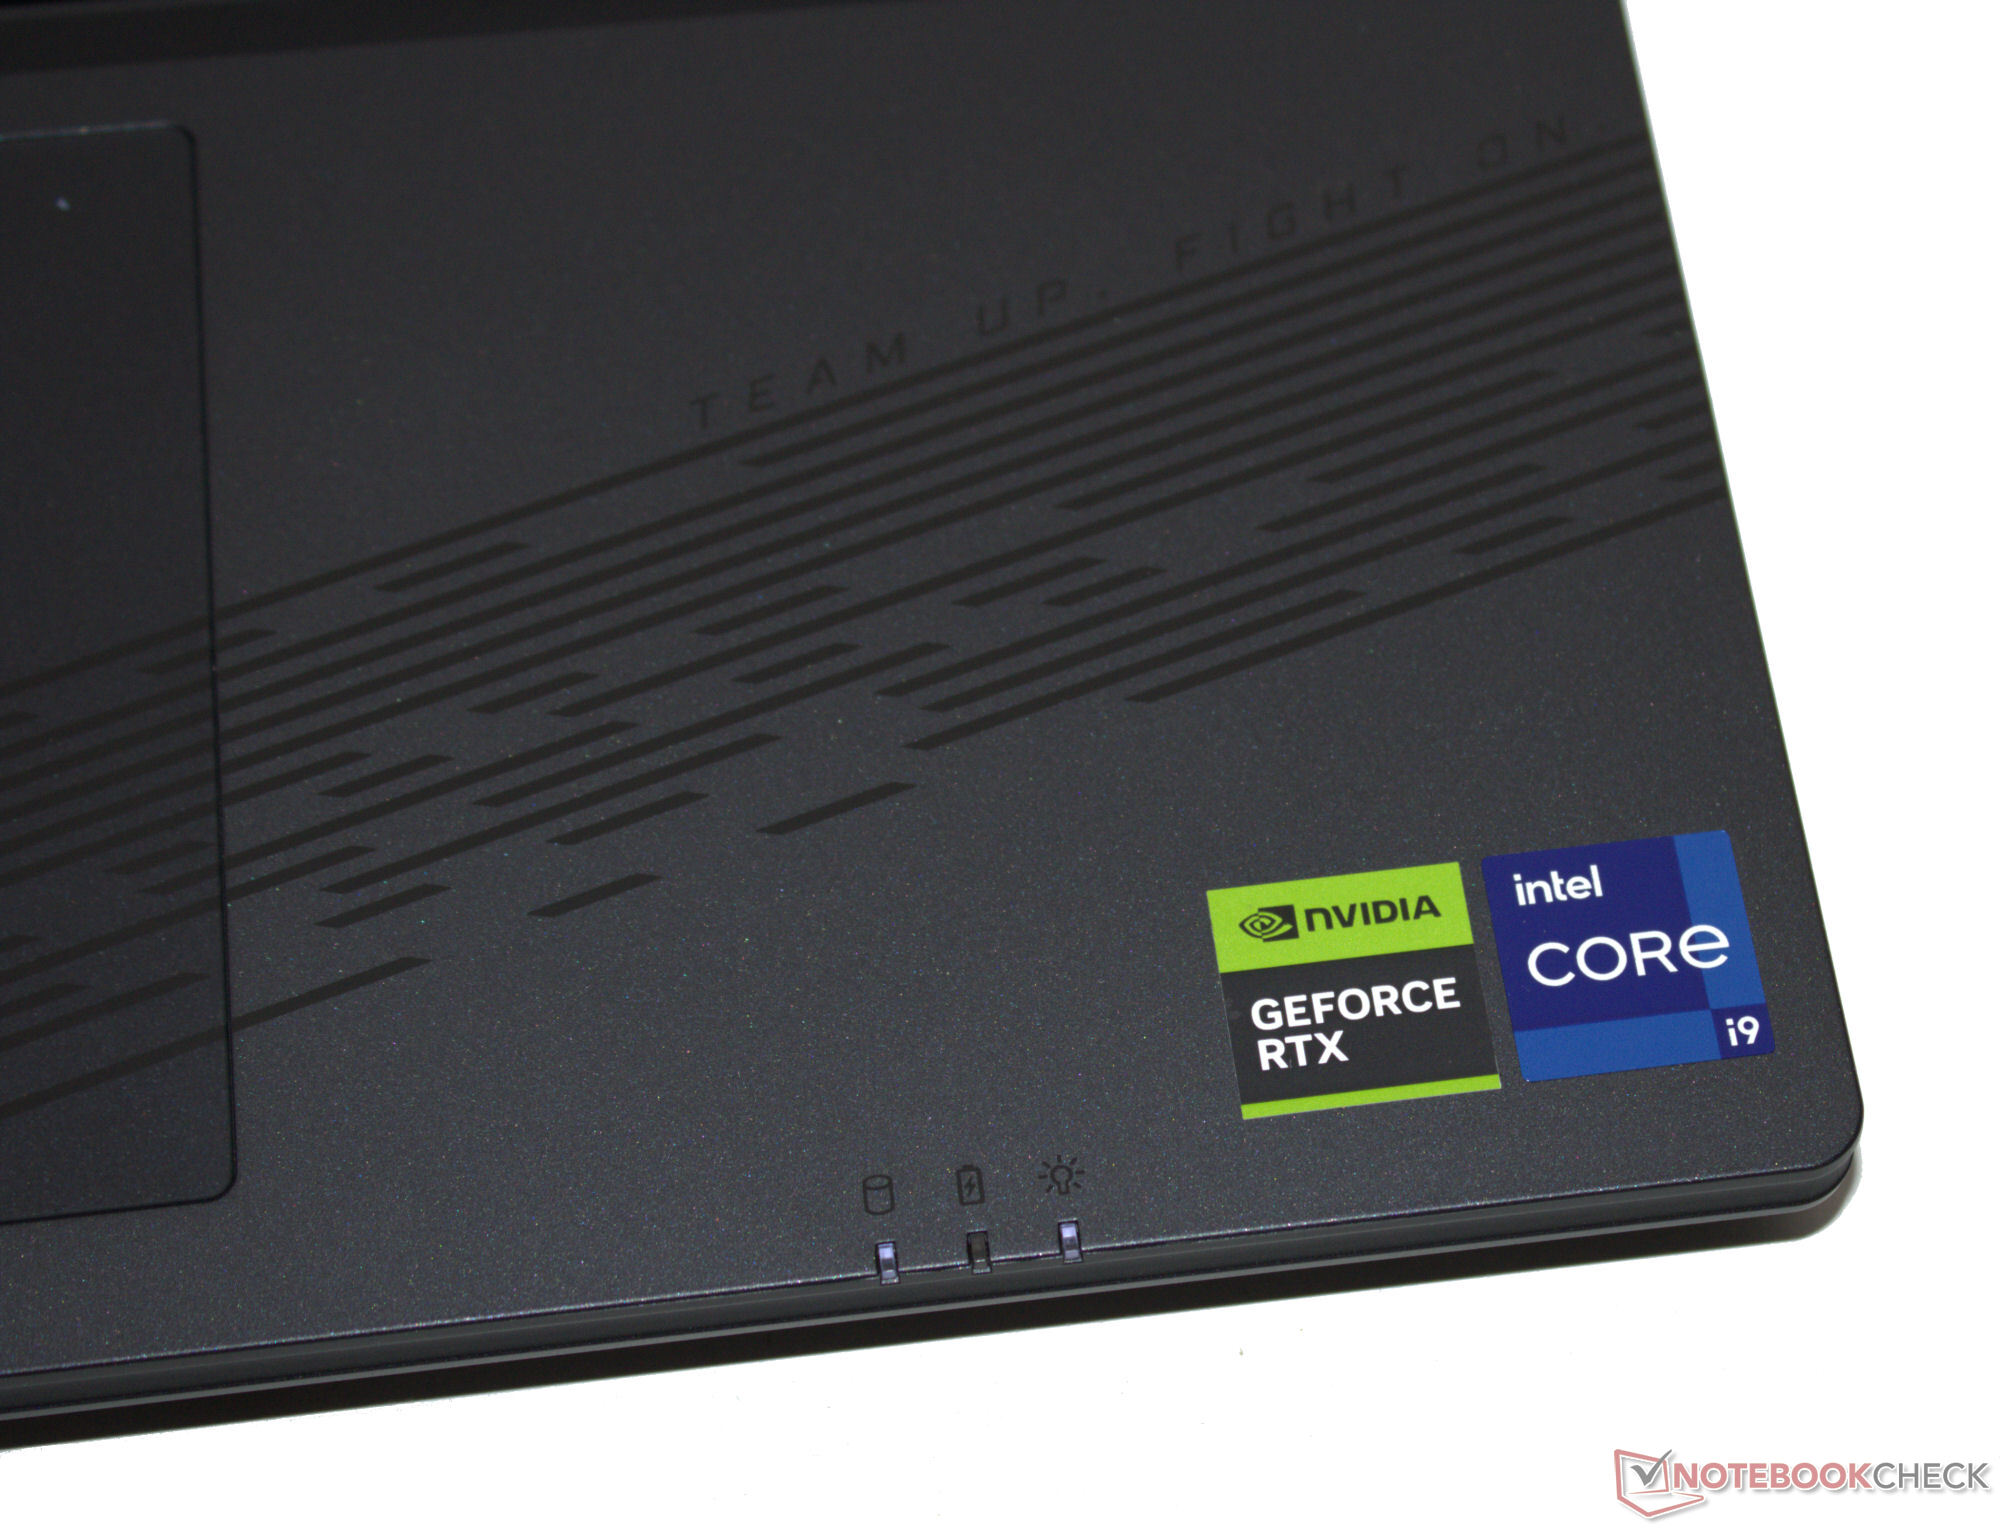
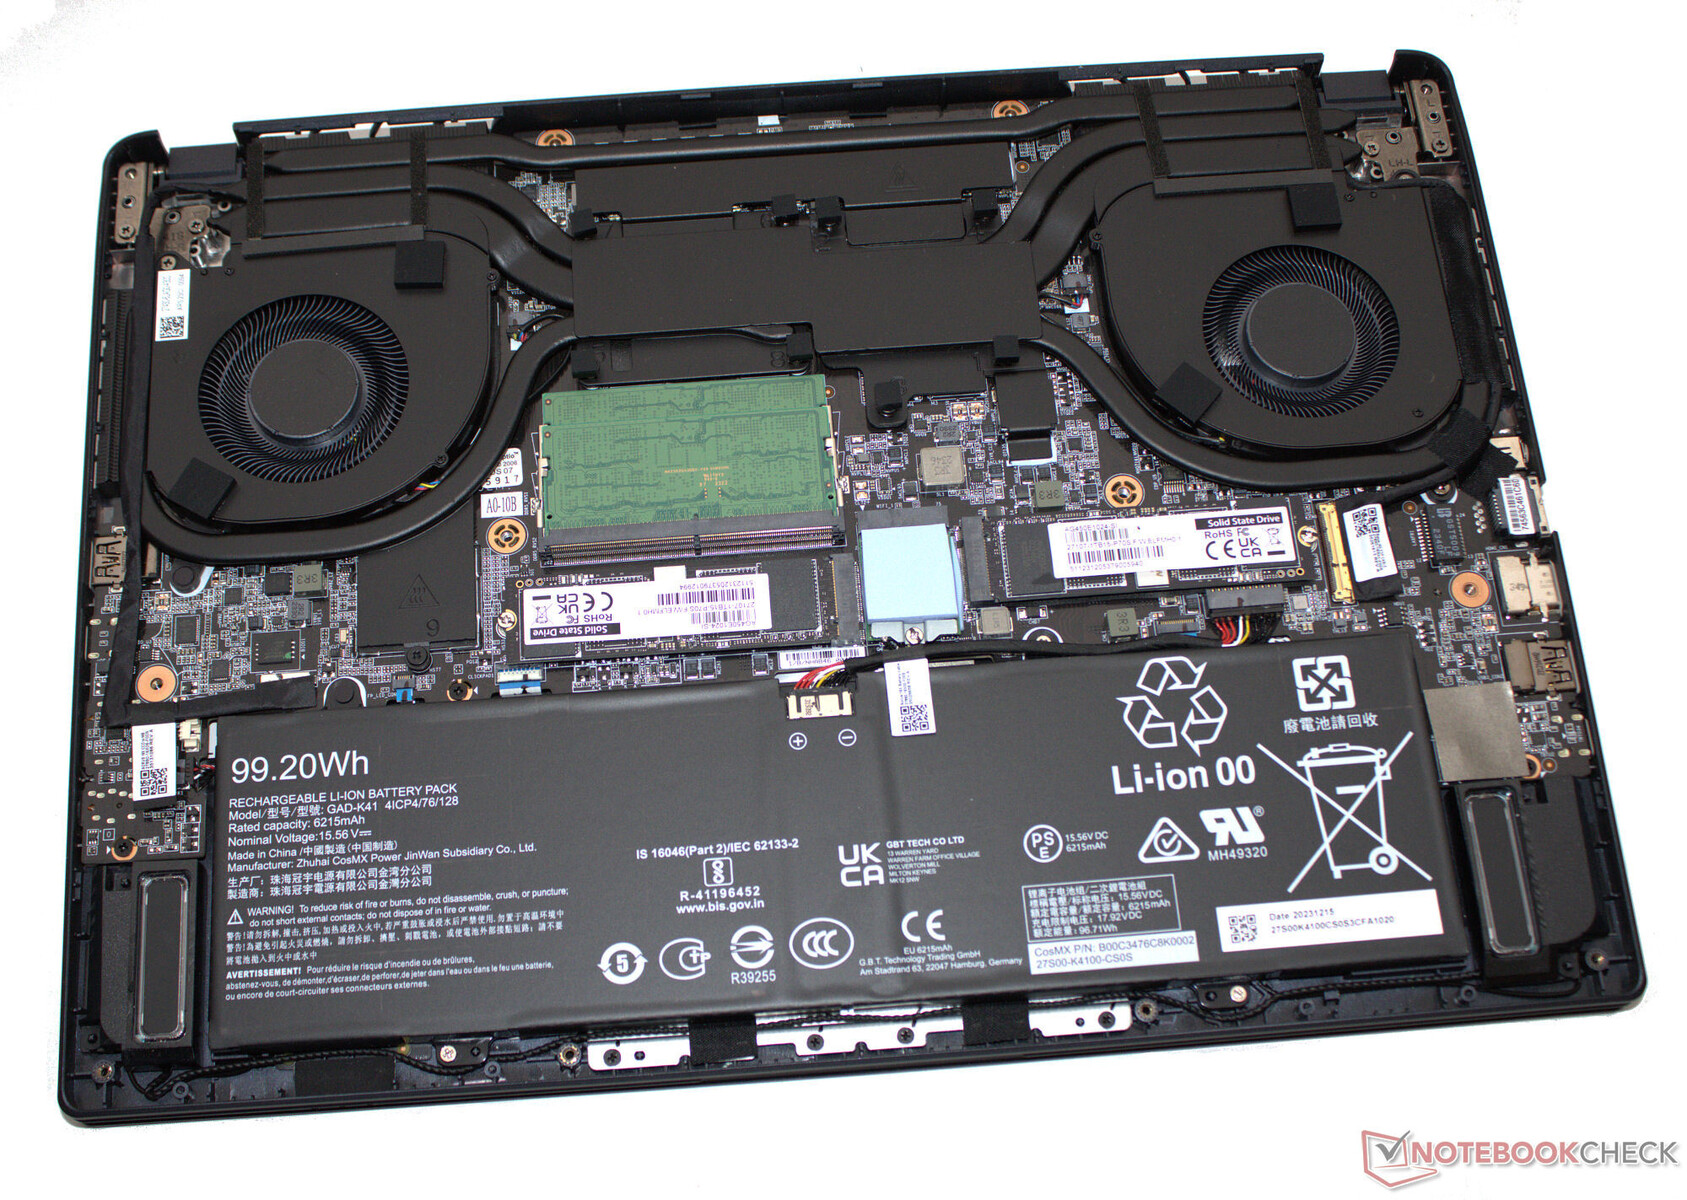
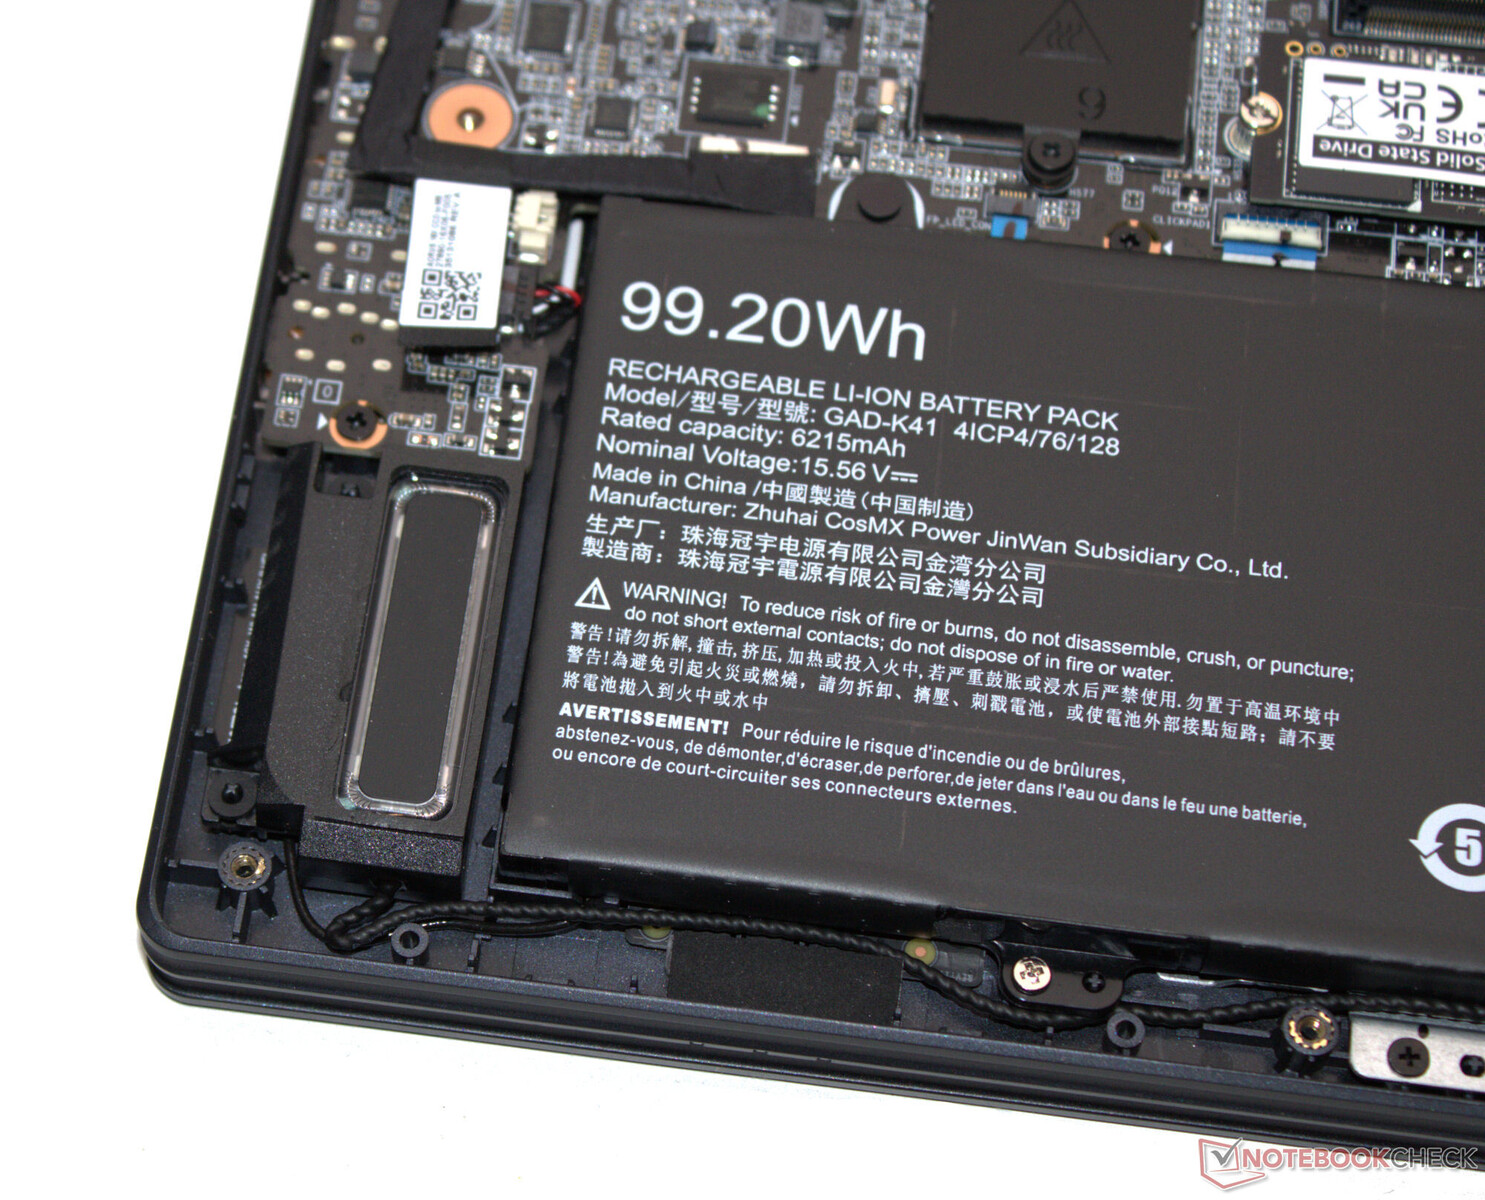
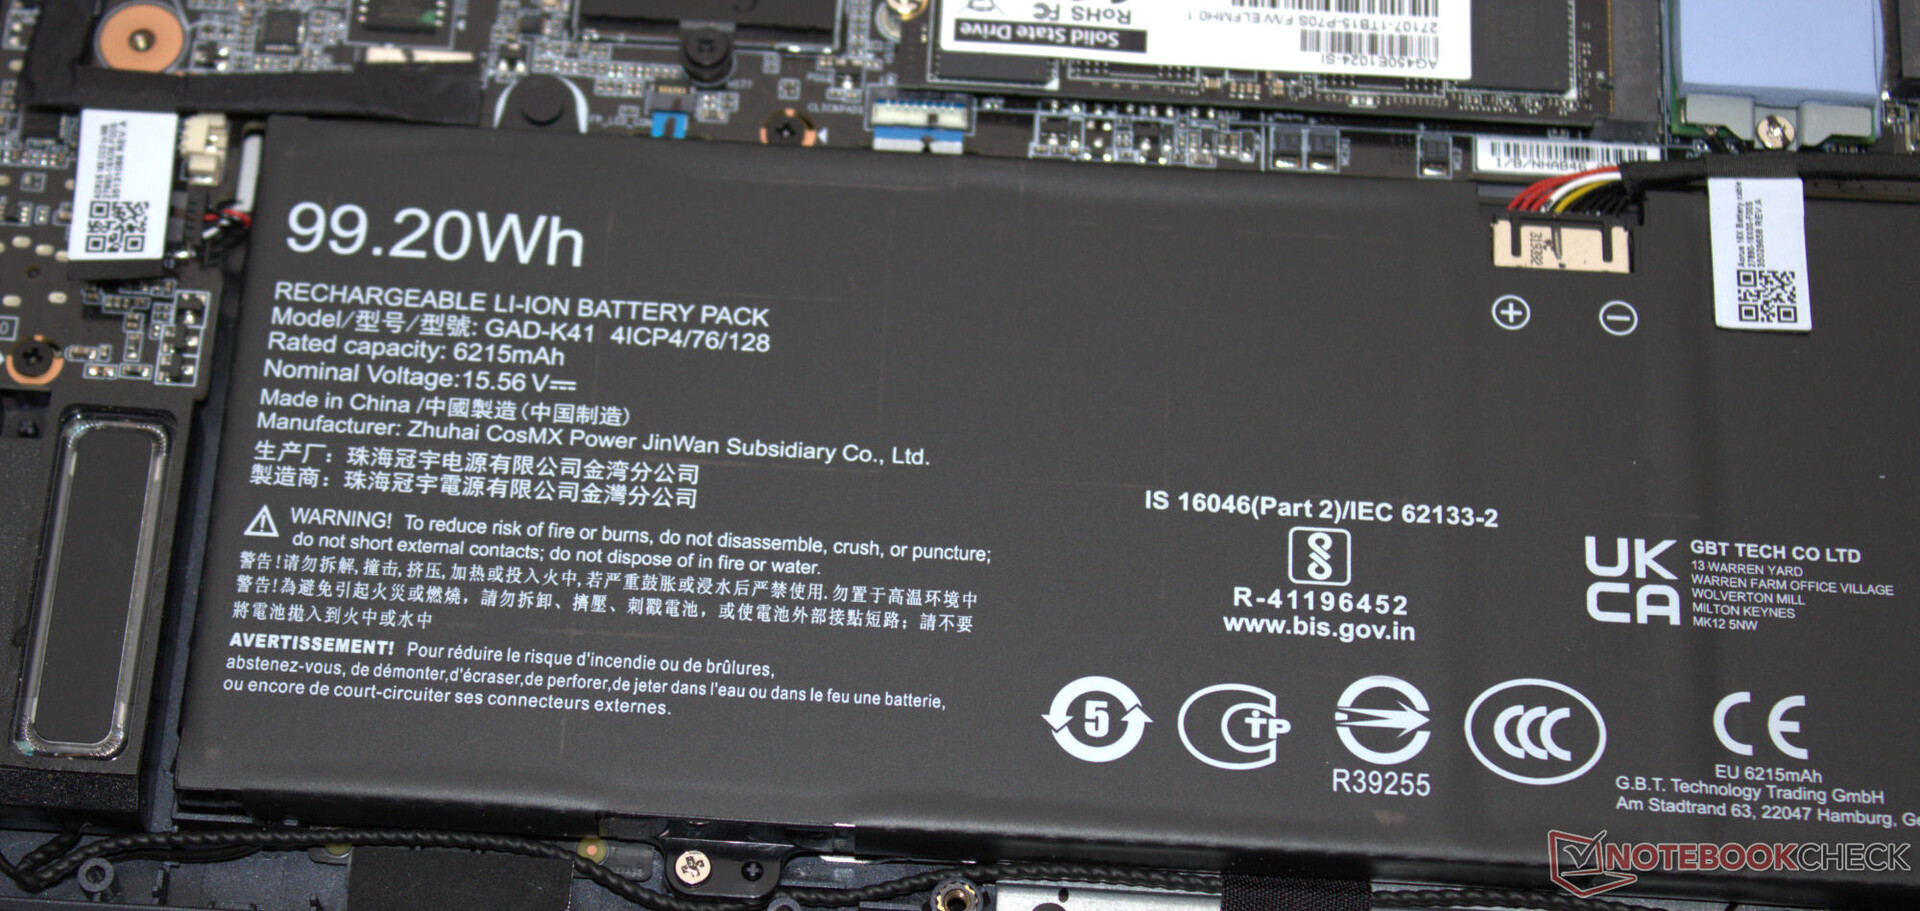
Den bärbara datorns teknik sitter i ett mörkgrått hölje med matta ytor. Totalt sett har Gigabyte gått för en mer avskalad look. Förutom tangentbordets bakgrundsbelysning ger två LED-remsor på baksidan av enheten lite färgglatt kul till dess utseende. Medan basenheten är tillverkad av plast, förlitar sig locket på aluminium. Batteriet (skruvat i, inte limmat i) samt resten av den bärbara datorns insida kan nås när den nedre delen av höljet har tagits bort.
Vi noterade inga byggfel och alla mellanrum stämmer väl överens. Locket och basenheten kan vridas en aning - men det är inget utöver det vanliga. Gångjärnen håller locket säkert på plats, men locket studsar lite när du justerar dess vinkel. Den maximala öppningsvinkeln är ca 130 grader. Det kan öppnas med en hand.
Aorus 16X är en av de mest kompakta och lättviktiga enheterna inom jämförelseområdet.
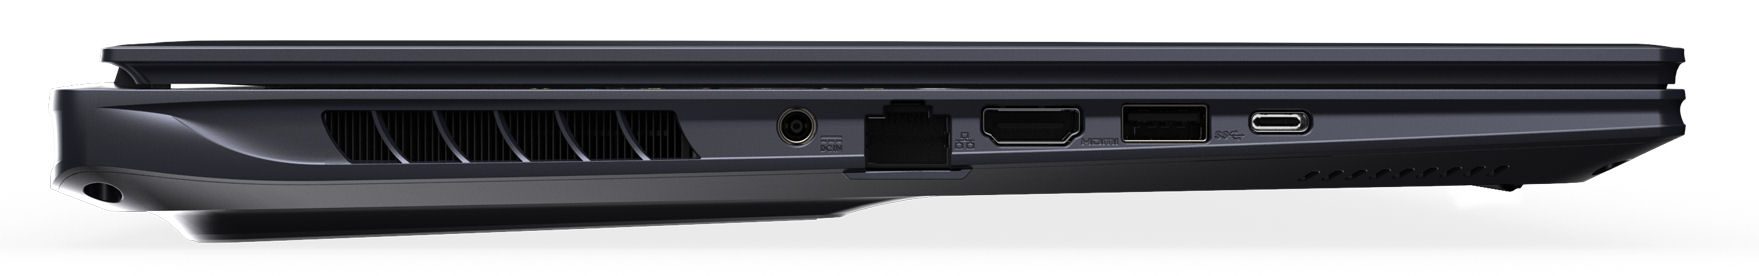
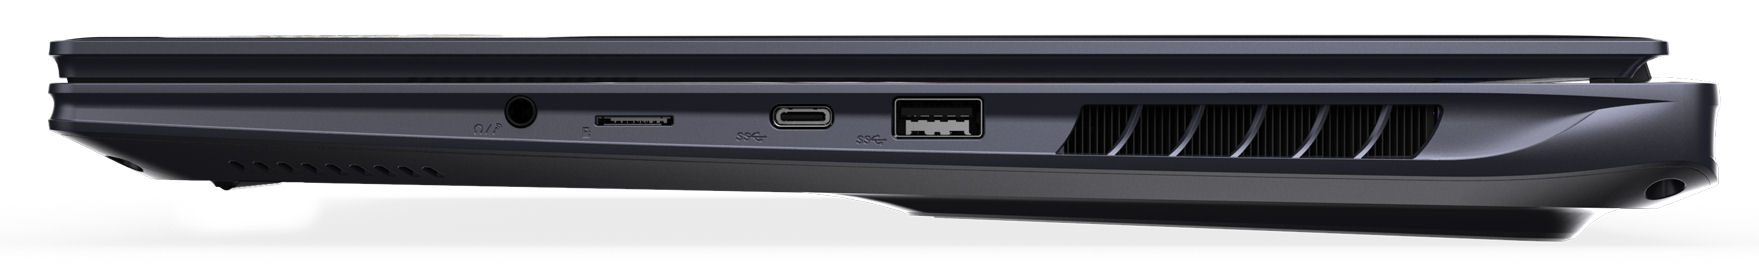
Anslutningsmöjligheter - Gigabytes bärbara dator har Thunderbolt 4
16X har två USB-A-portar (USB 3.2 Gen 2) och två USB-C-portar (1x USB 3.2 Gen 2, 1x Thunderbolt 4). TB4-porten har stöd för Power Delivery och båda USB-C-anslutningarna kan mata ut en DisplayPort-signal. Totalt är den bärbara datorn utrustad med tre videoutgångar (1x HDMI, 2x DP). Ett ljuduttag och en Gigabit Ethernet-port avrundar paketet.
Gigabyte har placerat alla anslutningar längs mitten av enhetens högra och vänstra sida. Områdena bredvid pennan är i allmänhet fria från kablar.
SD-kortläsare
Enhetens MicroSD-kortläsare (referenskort: AV PRO microSD 128 GB V60) är en av de snabbare modellerna och uppnår en maximal överföringshastighet på 186 MB/s (överföring av 250 jpg-bilder, vardera cirka 5 MB stora) och 188 MB/s (kopiering av större datablock).
| SD Card Reader | |
| average JPG Copy Test (av. of 3 runs) | |
| Aorus 16X 2024 (AV PRO microSD 128 GB V60) | |
| Genomsnitt av klass Gaming (20.9 - 210, n=55, senaste 2 åren) | |
| Schenker XMG Pro 16 Studio (Mid 23) (AV PRO microSD 128 GB V60) | |
| Alienware m16 R2 (AV PRO microSD 128 GB V60) | |
| maximum AS SSD Seq Read Test (1GB) | |
| Alienware m16 R2 (AV PRO microSD 128 GB V60) | |
| Aorus 16X 2024 (AV PRO microSD 128 GB V60) | |
| Genomsnitt av klass Gaming (25.5 - 261, n=52, senaste 2 åren) | |
| Schenker XMG Pro 16 Studio (Mid 23) (AV PRO microSD 128 GB V60) | |
Kommunikation
Under optimala förhållanden (inga WLAN-enheter i närheten, kort avstånd mellan laptop och server PC) noterade vi mycket bra WiFi-datahastigheter. 16X:s dåliga värden vid sändning av data beror sannolikt på drivrutinsproblem. Gigabytes bärbara dator använder ett WiFi 7-chip (Intel BE200). Trådbundna anslutningar sköts av en kontroller (RTL8168/8111; 1 GBit/s) tillverkad av Realtek.
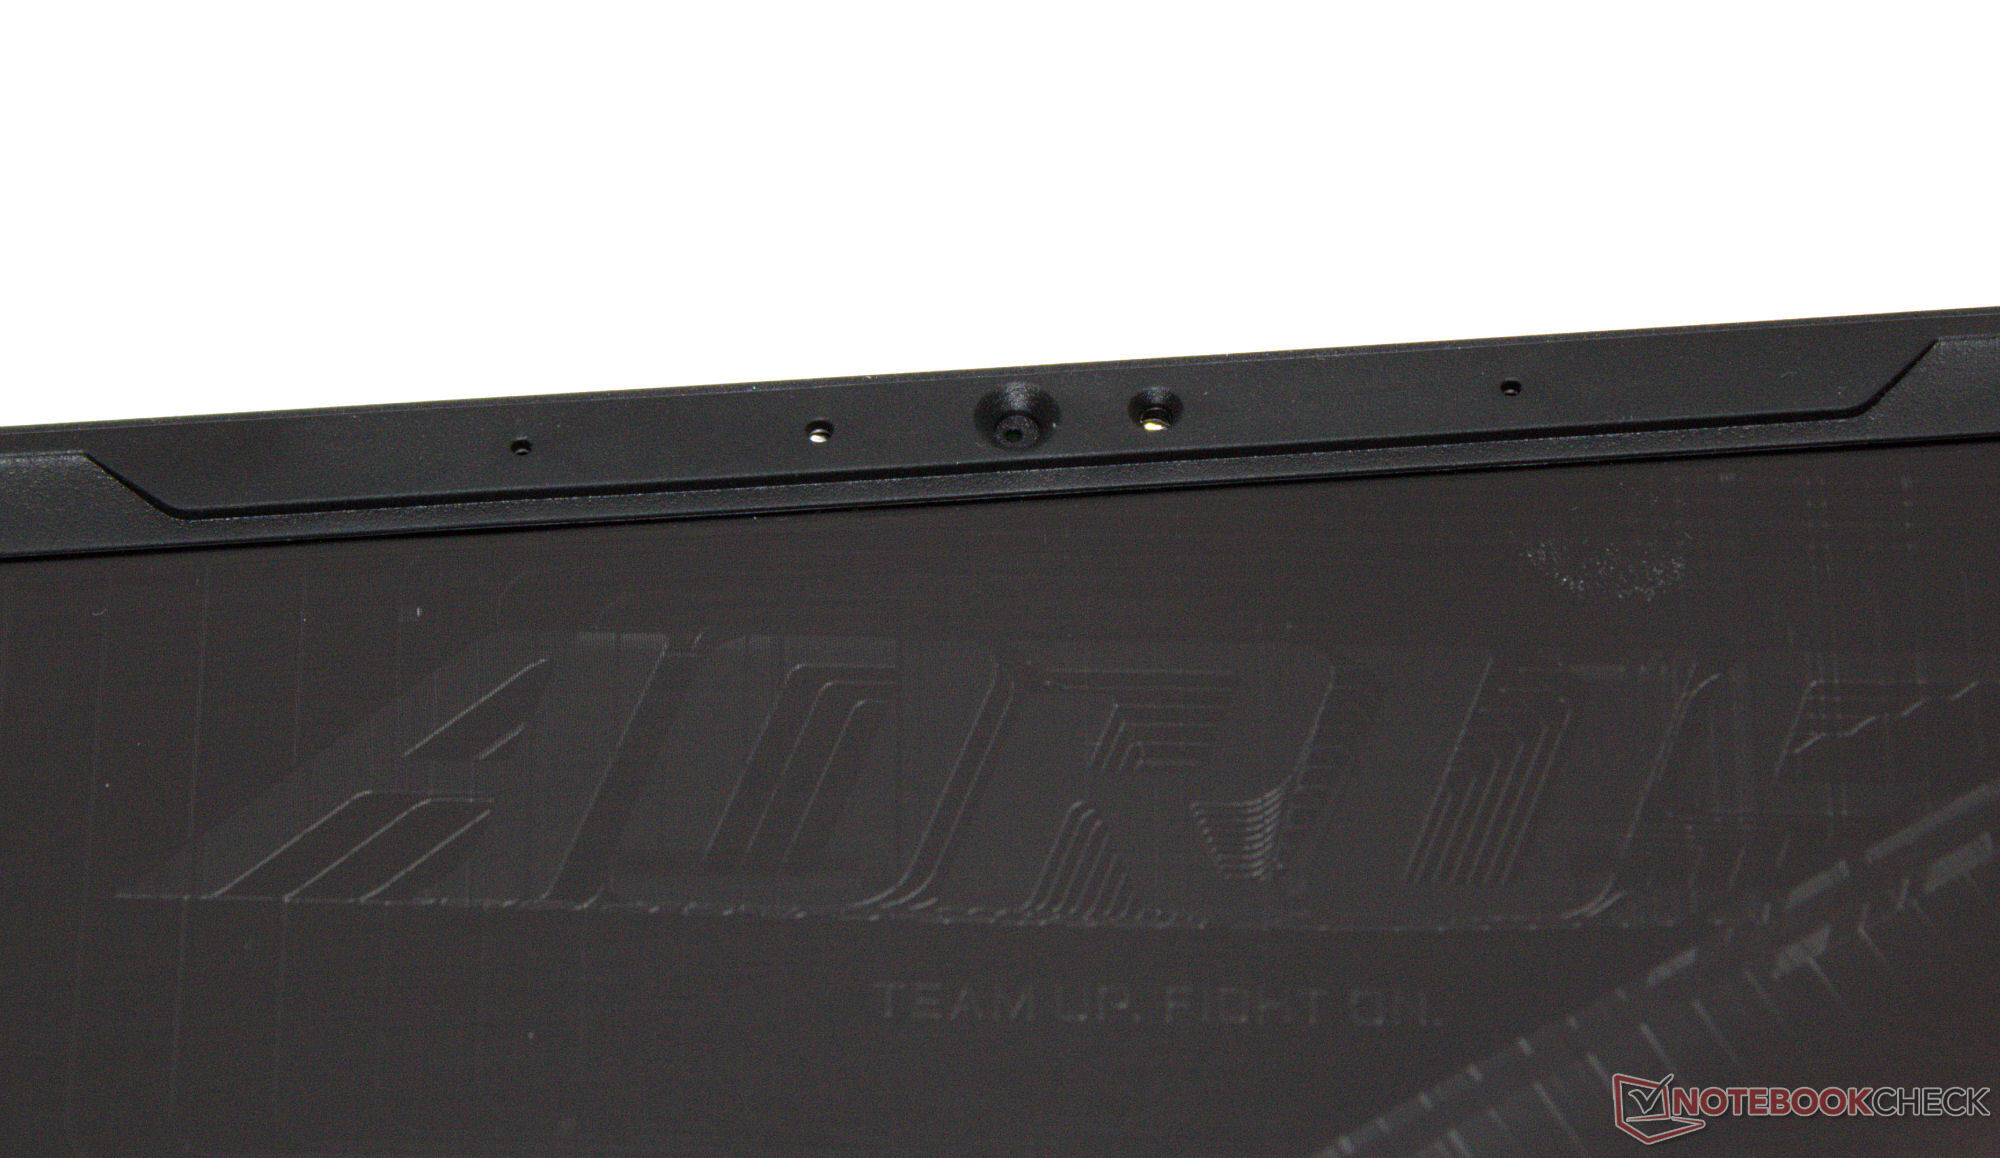
Webbkamera
Webbkameran (2,1 MP, max. 1 920 x 1 080 pixlar, IR) levererar endast bilder av genomsnittlig kvalitet. Dess färgnoggrannhet är där den misslyckas: Med en avvikelse på cirka 10 har målvärdet (DeltaE lägre än 3) missats. Den har dock stöd för Windows Hello. I gengäld har den inget mekaniskt lock.


Tillbehör
Förutom de vanliga dokumenten (snabbstartsguide och garantiinformation) levereras inga ytterligare tillbehör med den bärbara datorn.
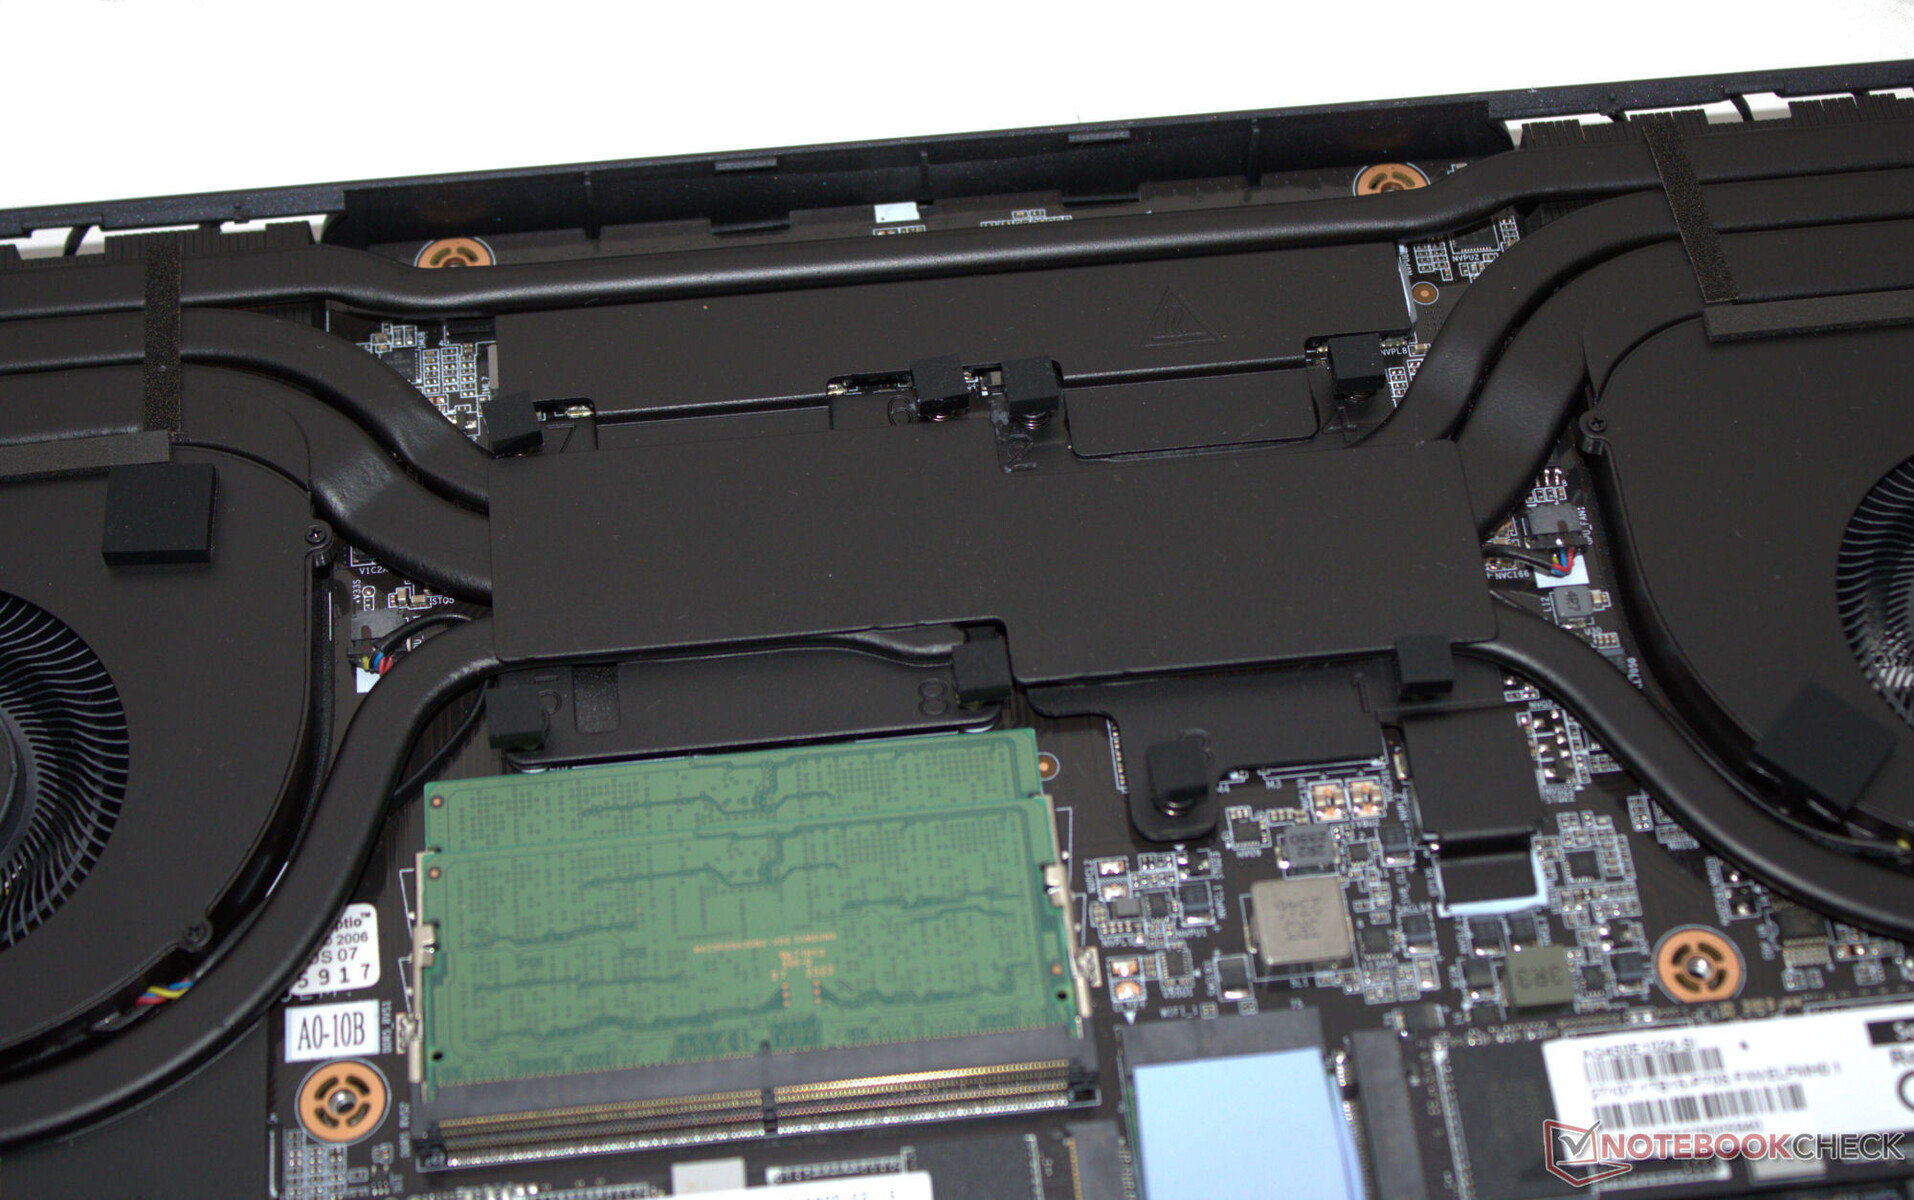
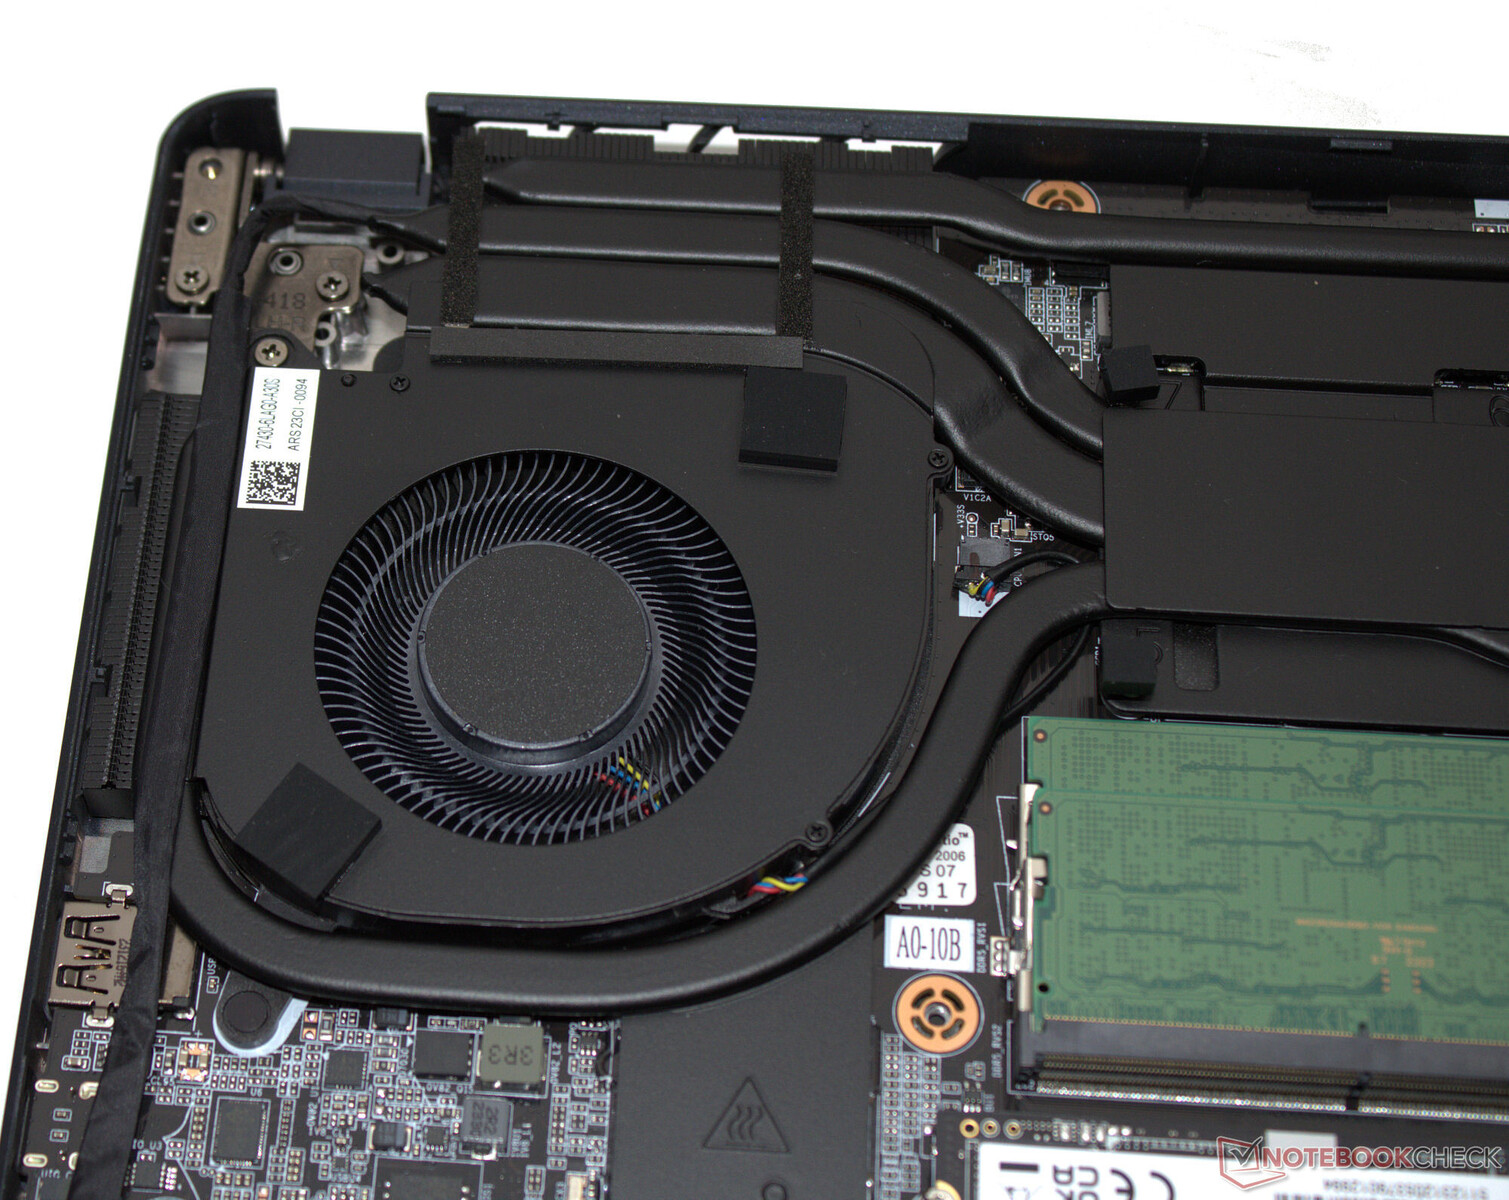
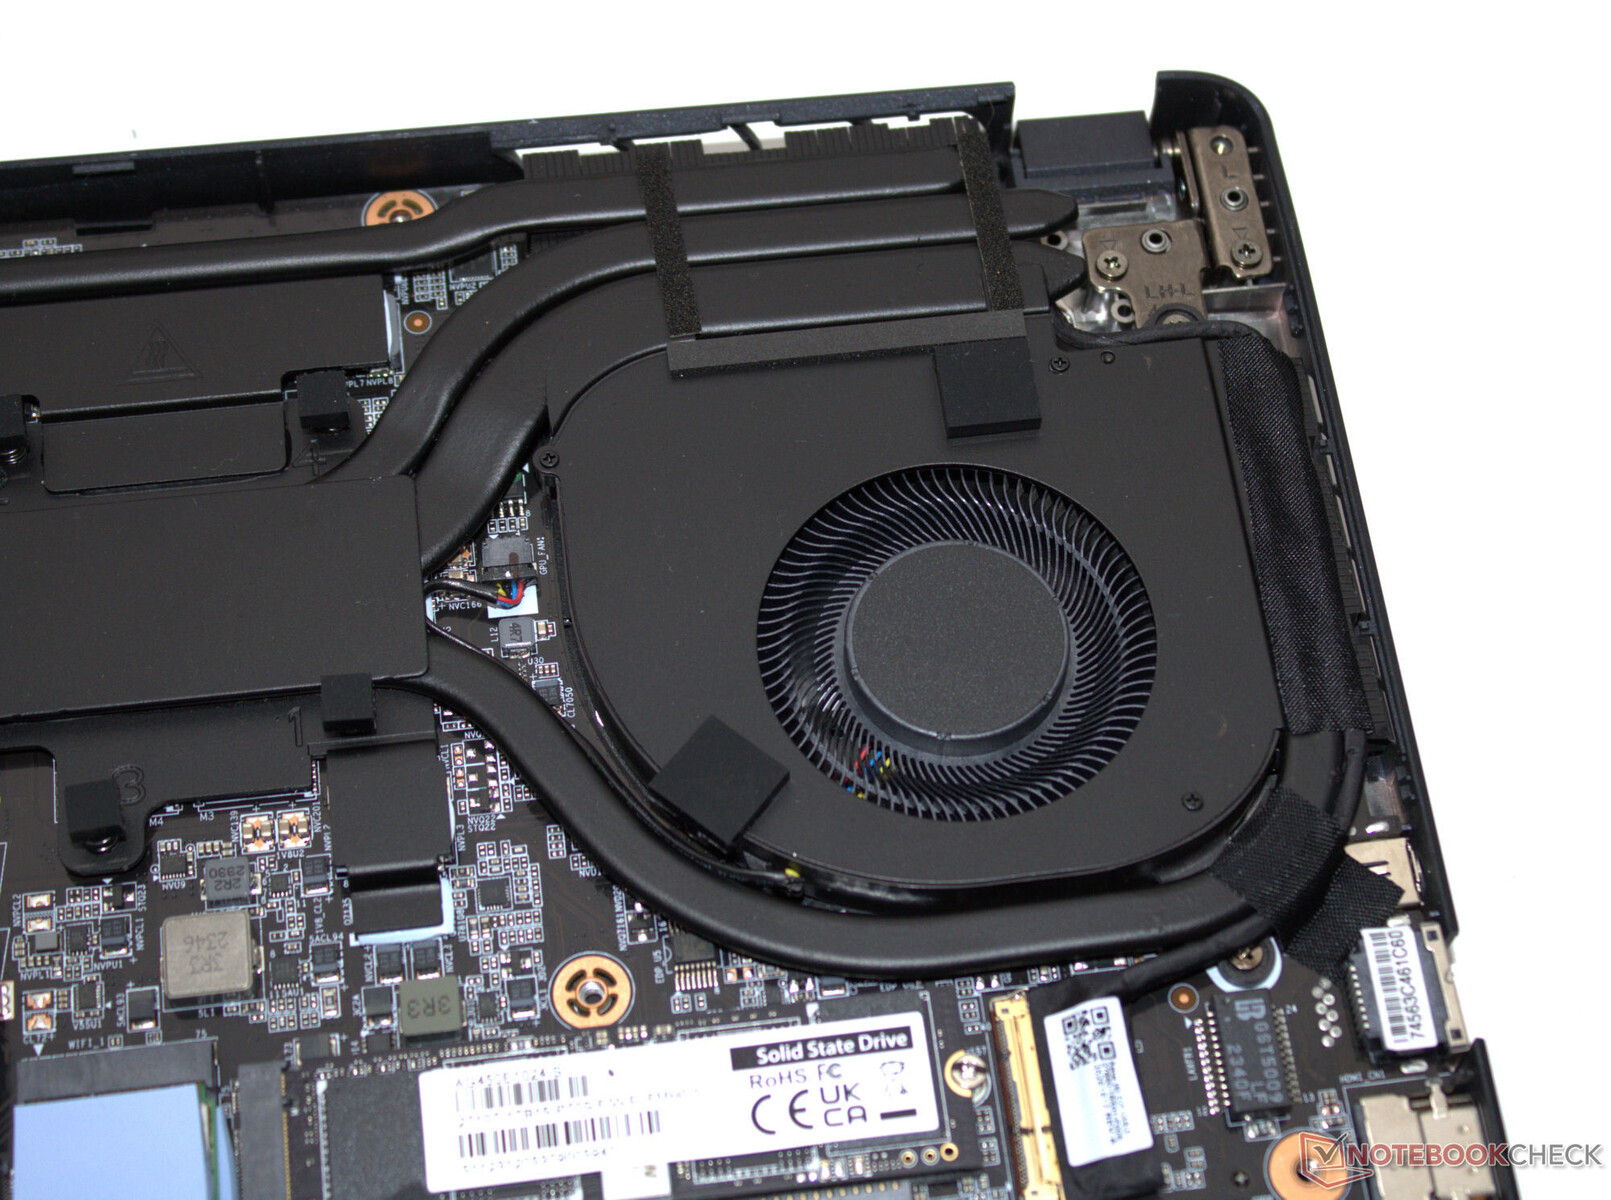
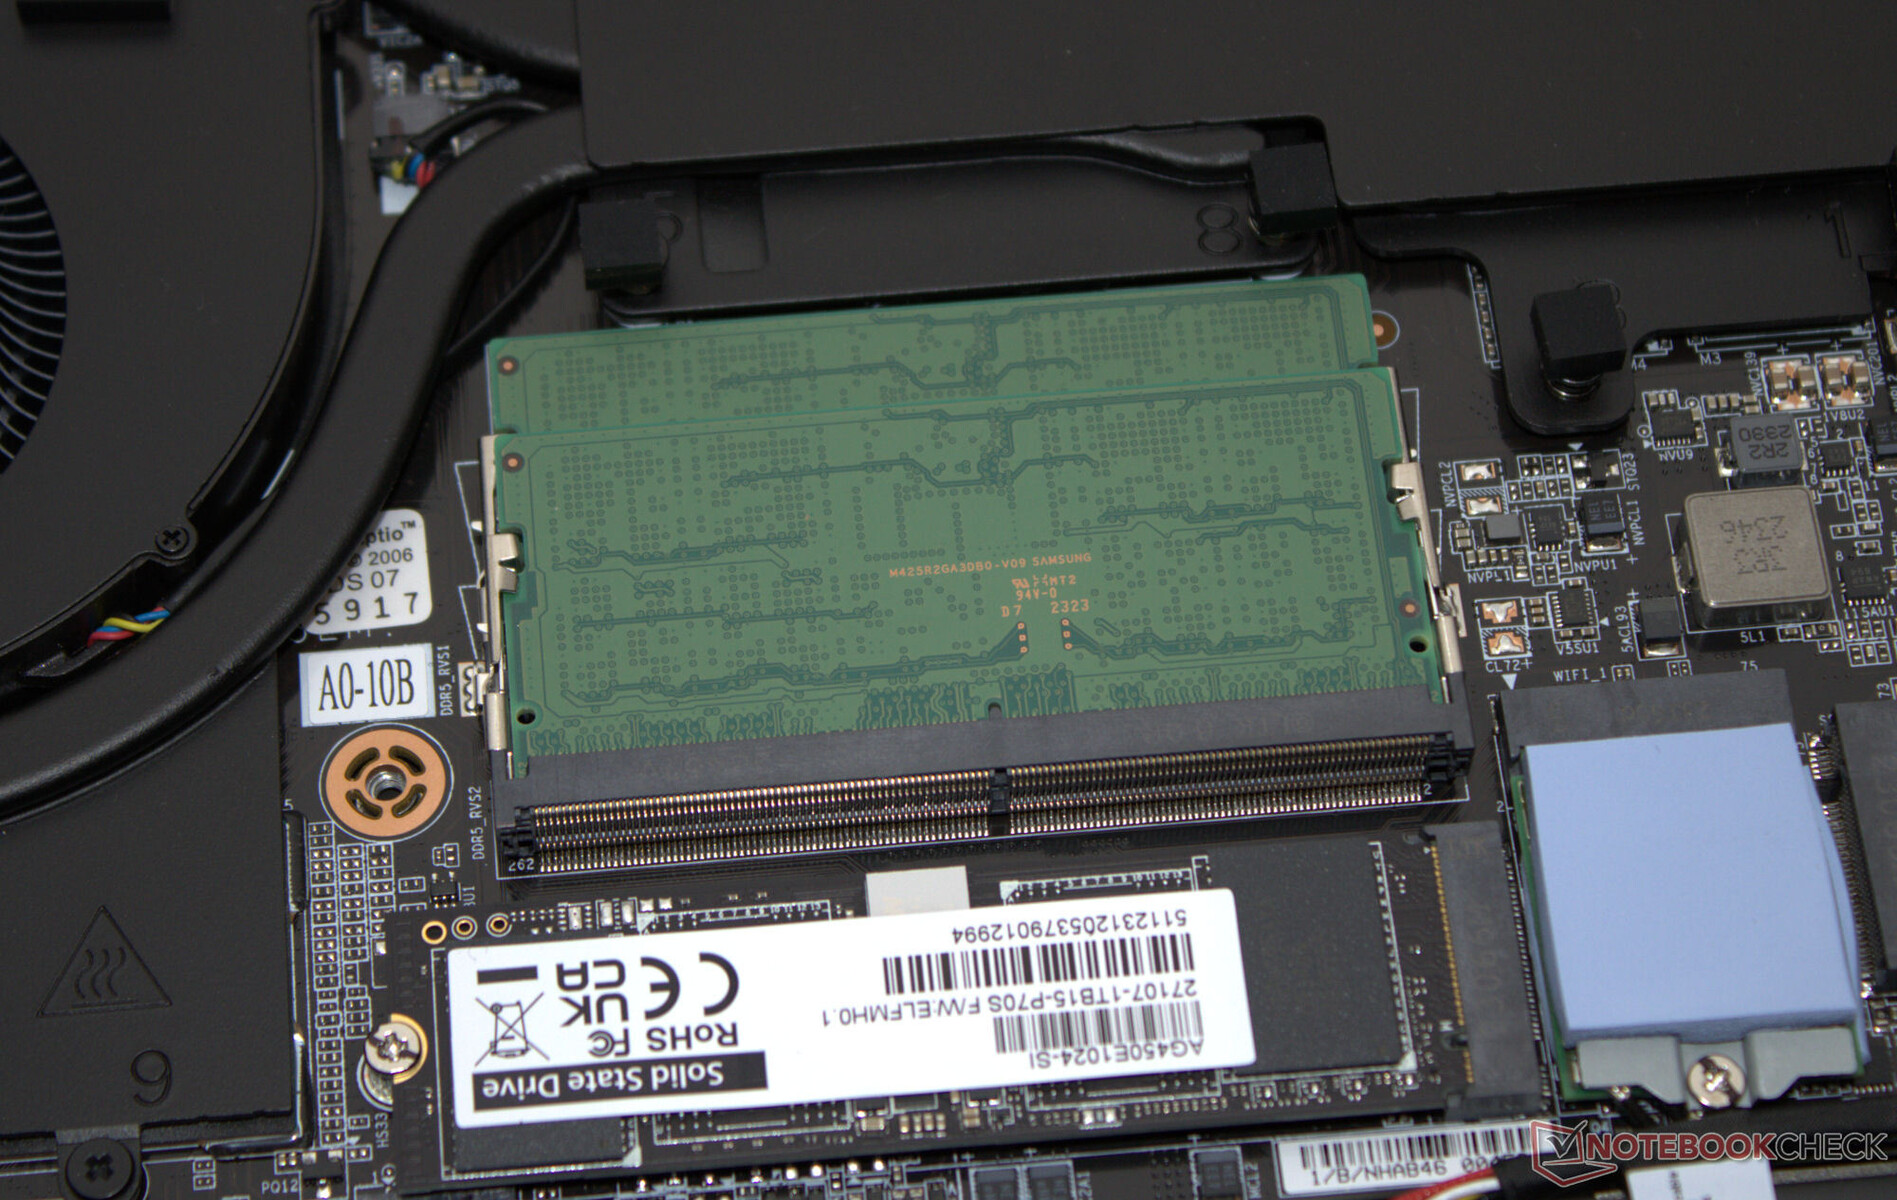
Underhåll
När du har tagit bort alla skruvar på undersidan av enheten kan du använda en platt spatel eller plektrum för att ta bort den nedre delen av höljet. Därefter kan du komma åt minnesbankerna (båda upptagna), båda SSD-enheterna (PCIe 4, M.2-2280), WLAN-modulen, fläktarna, BIOS-batteriet samt det vanliga batteriet.
Garanti
Den 16 tum stora enheten omfattas av en 12 månaders standardgaranti. Alternativ för att förlänga denna är inte tillgängliga.
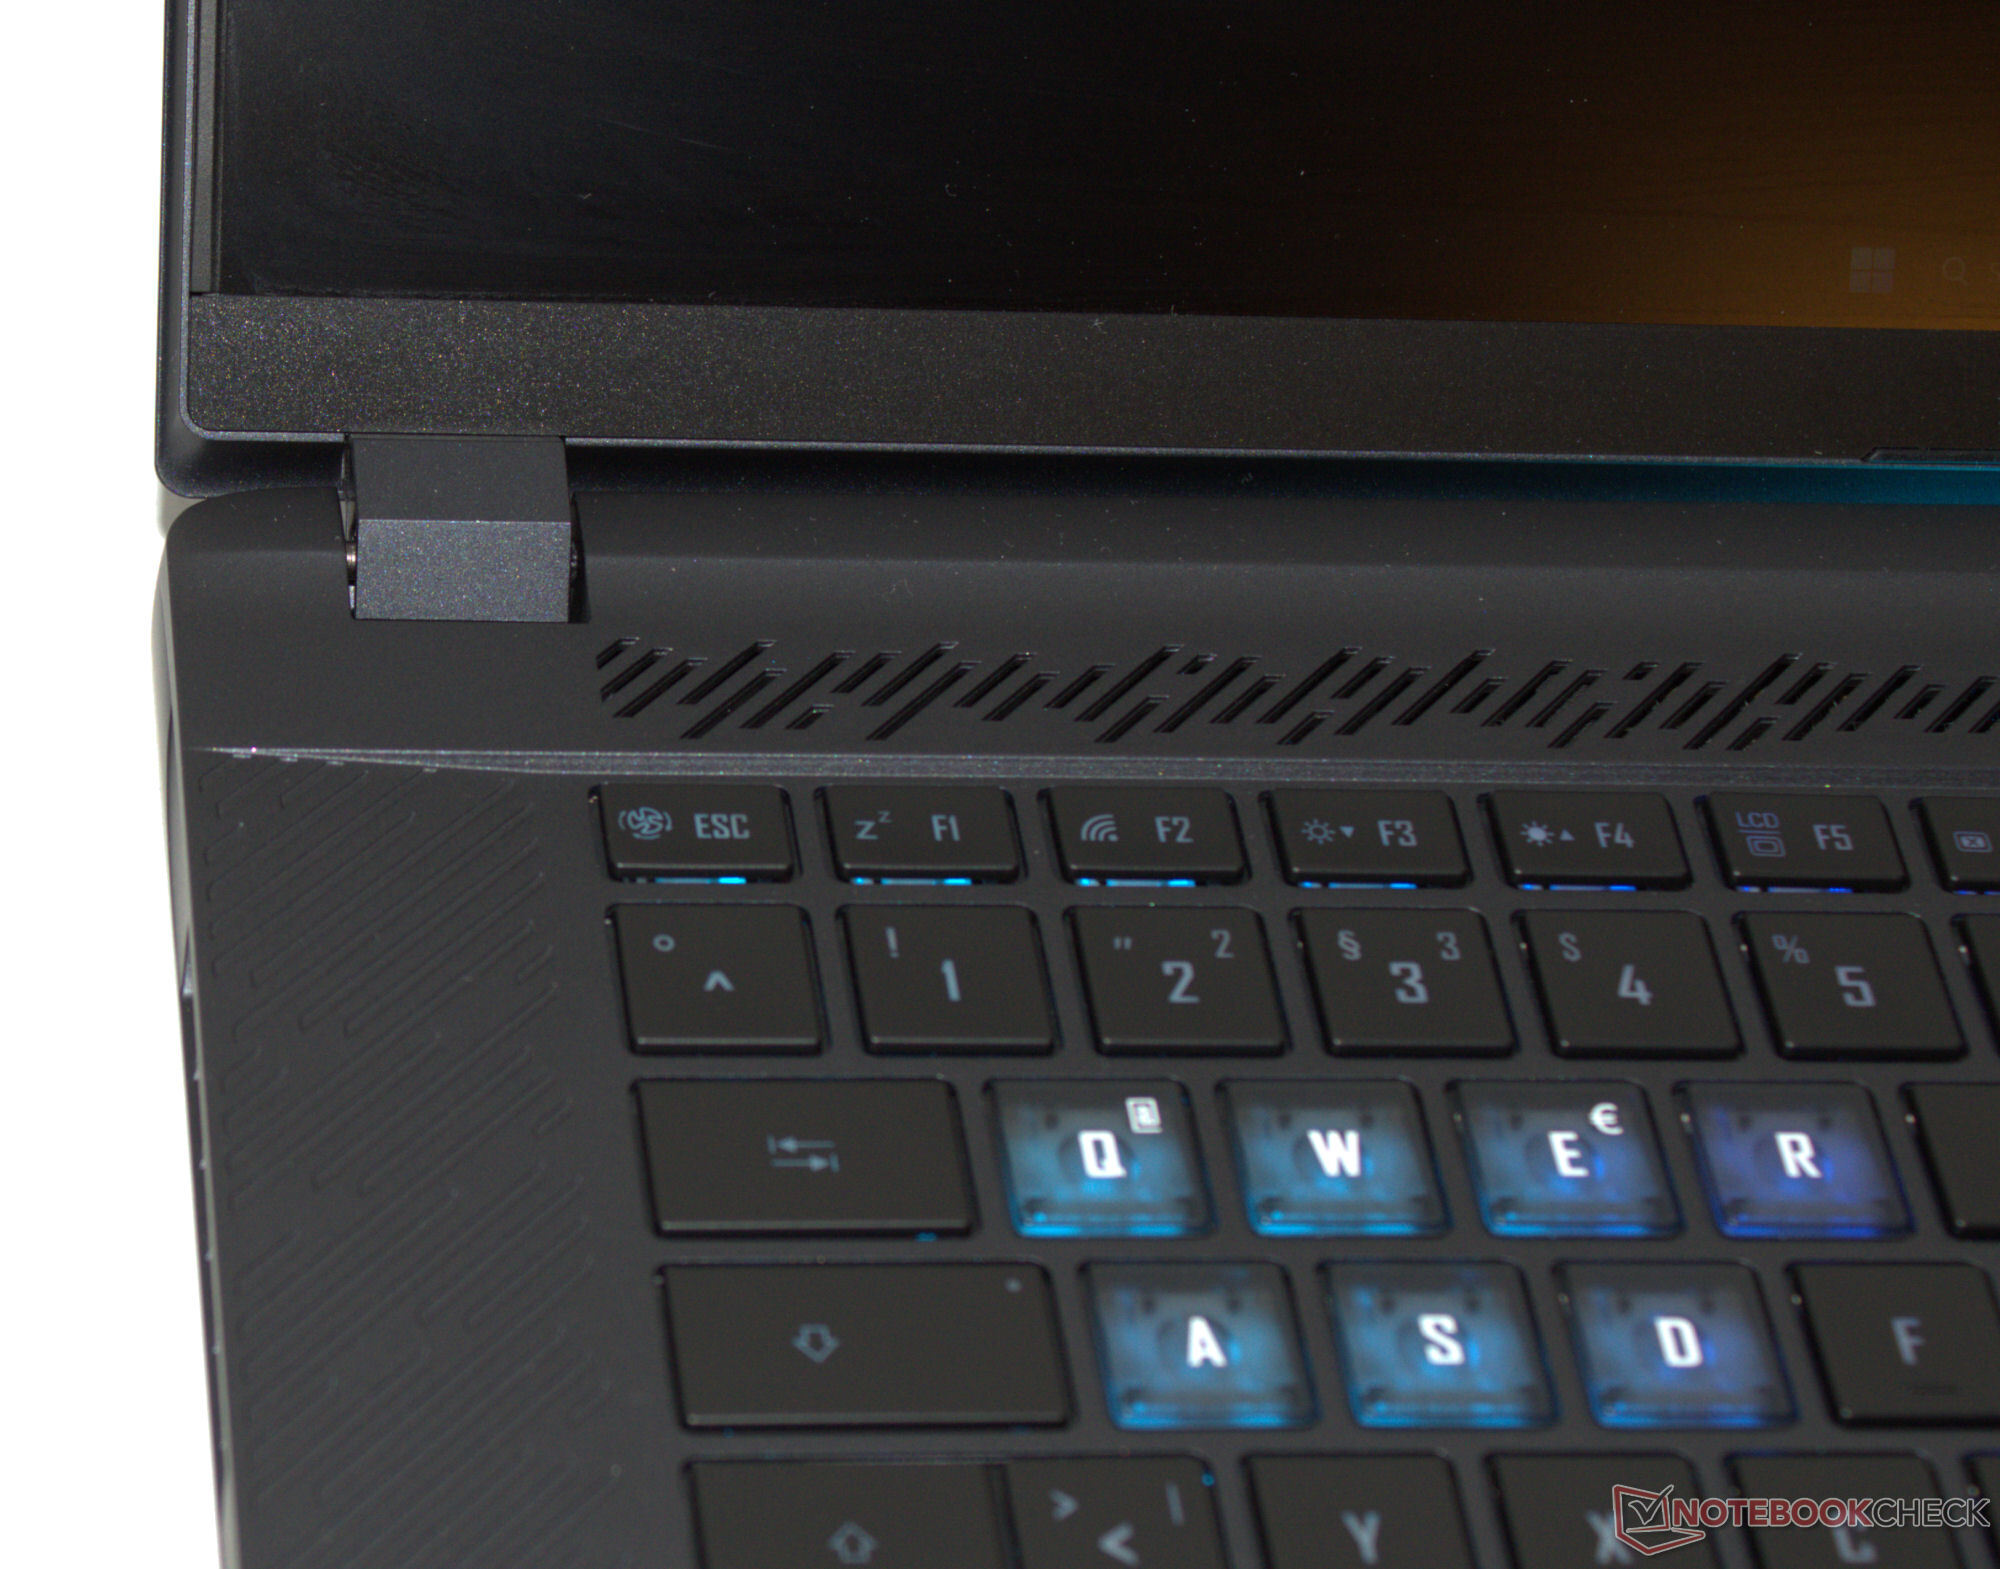
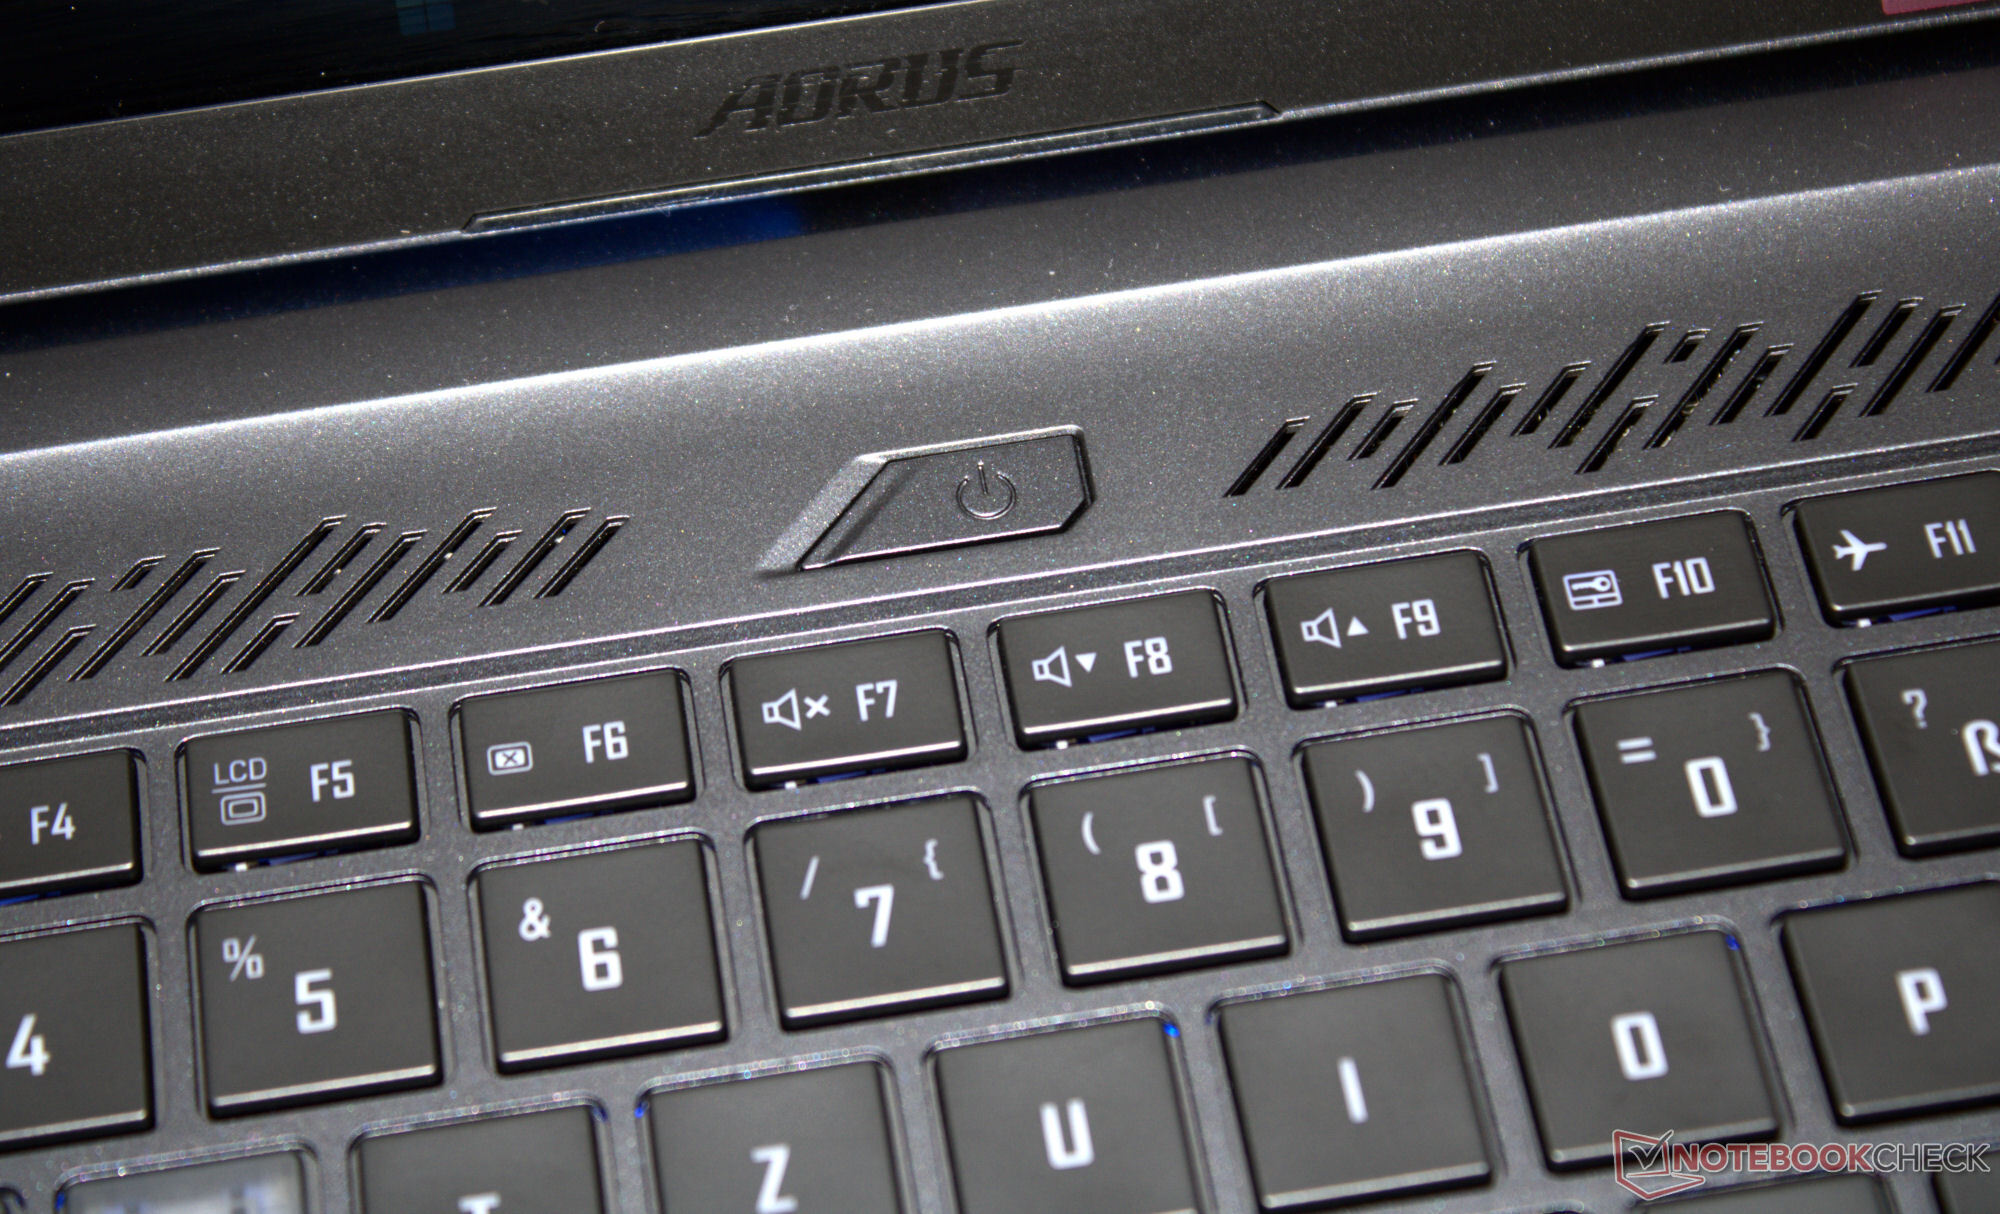
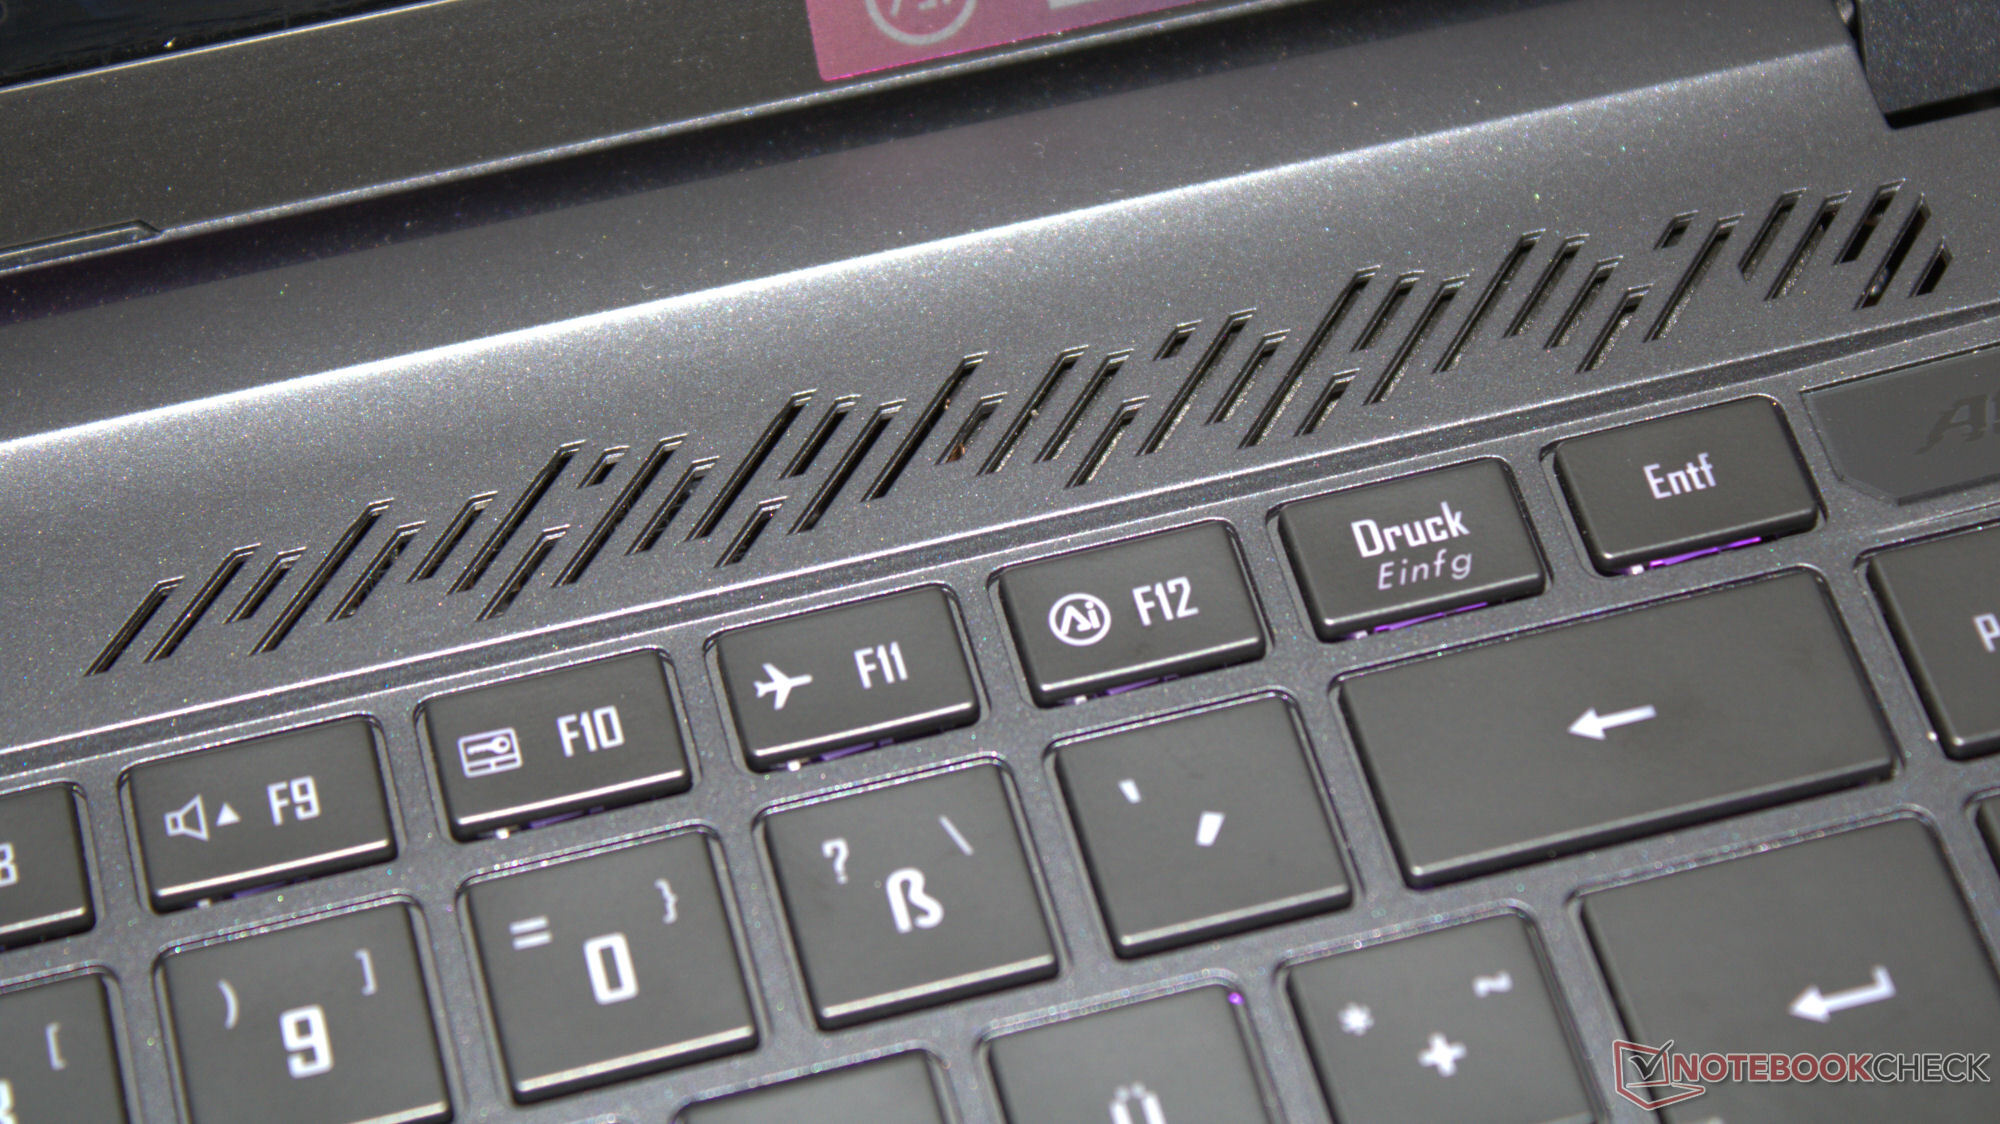
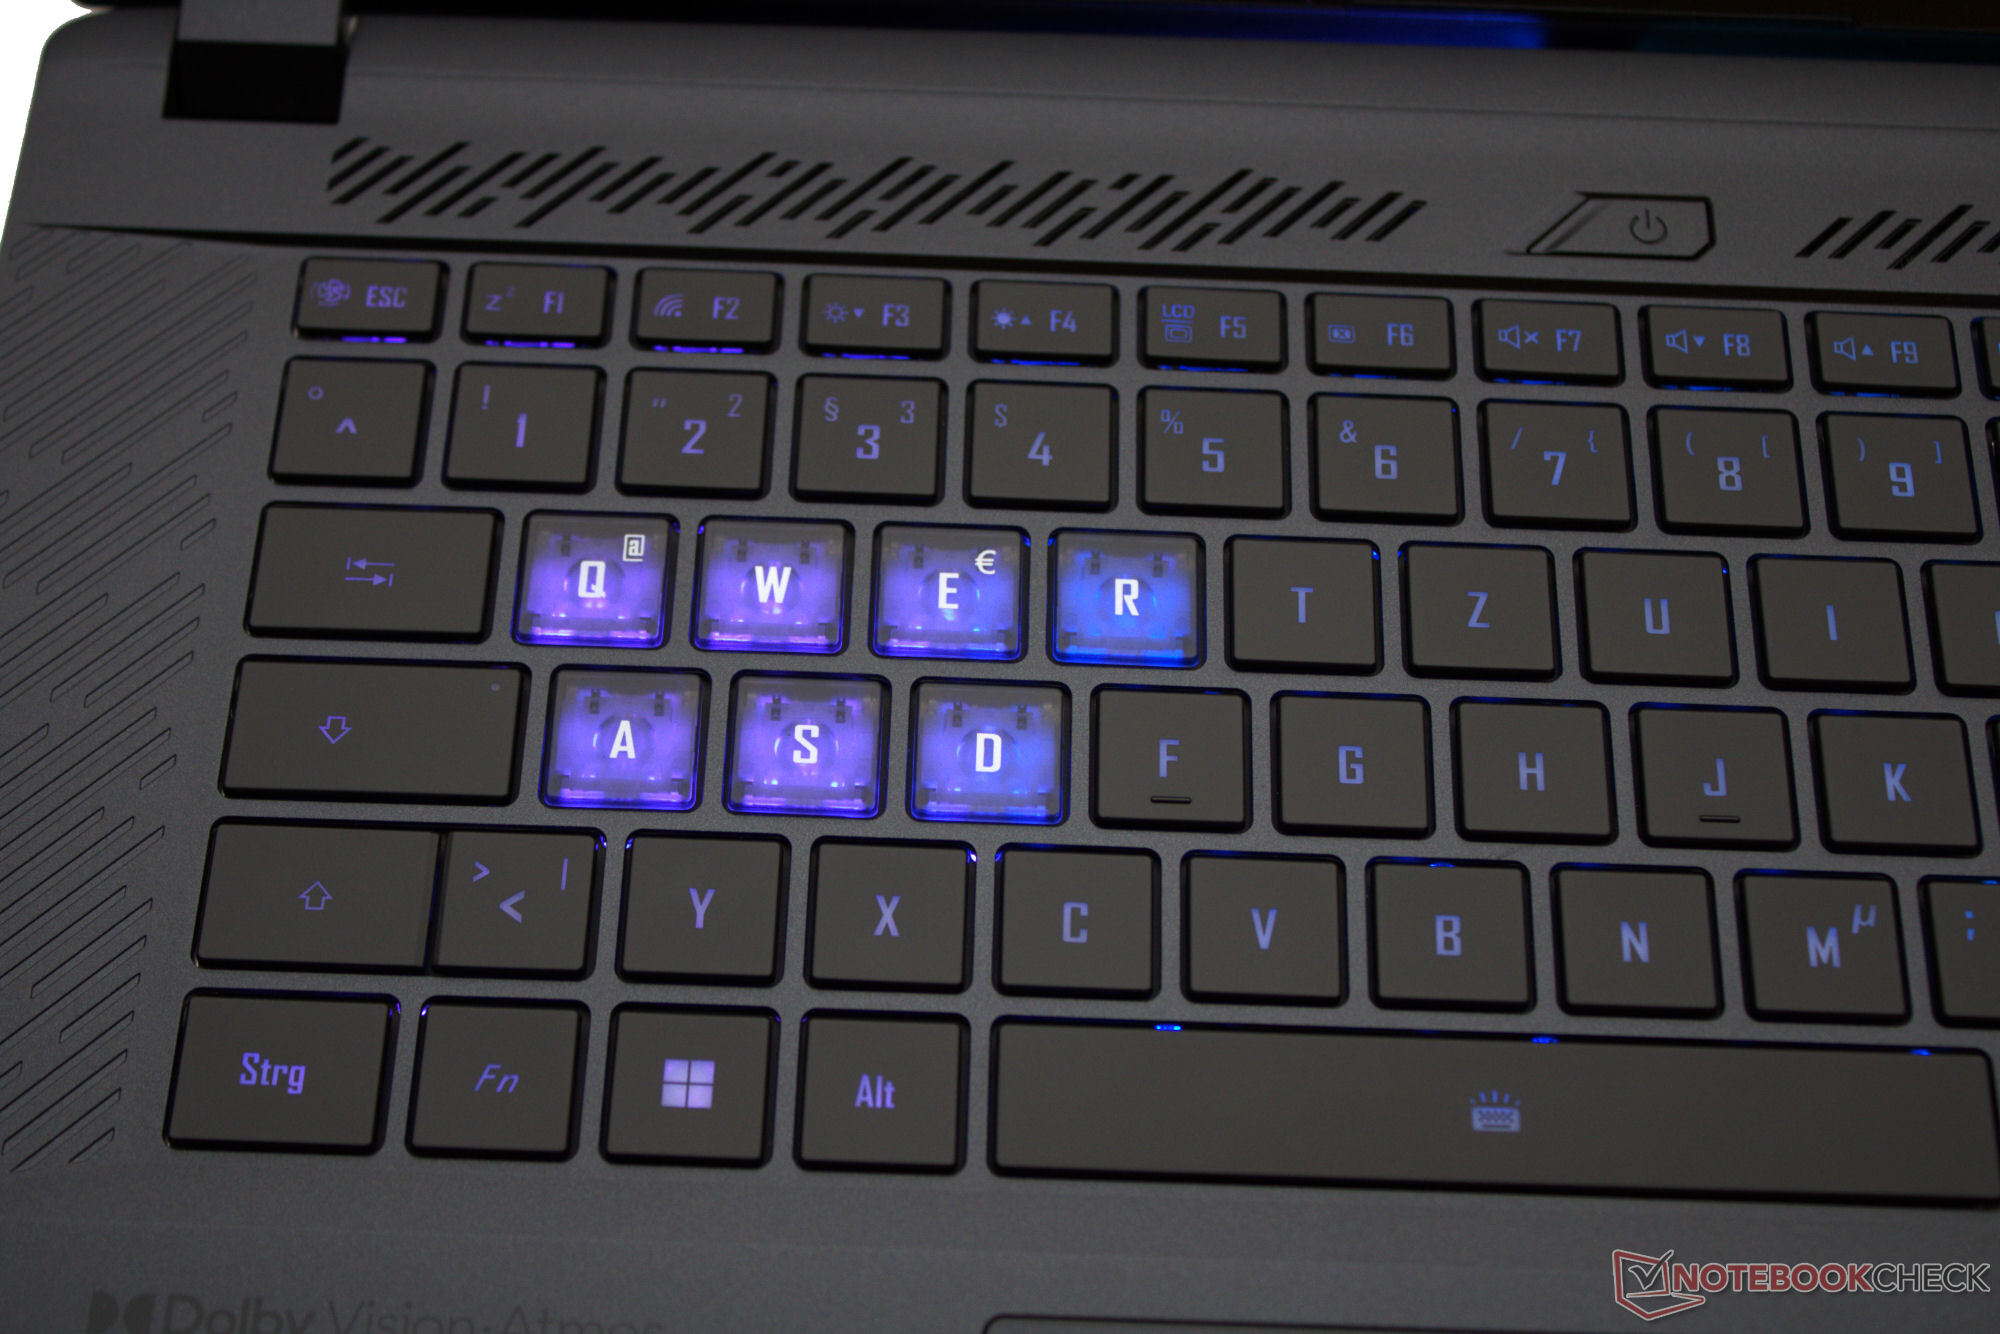
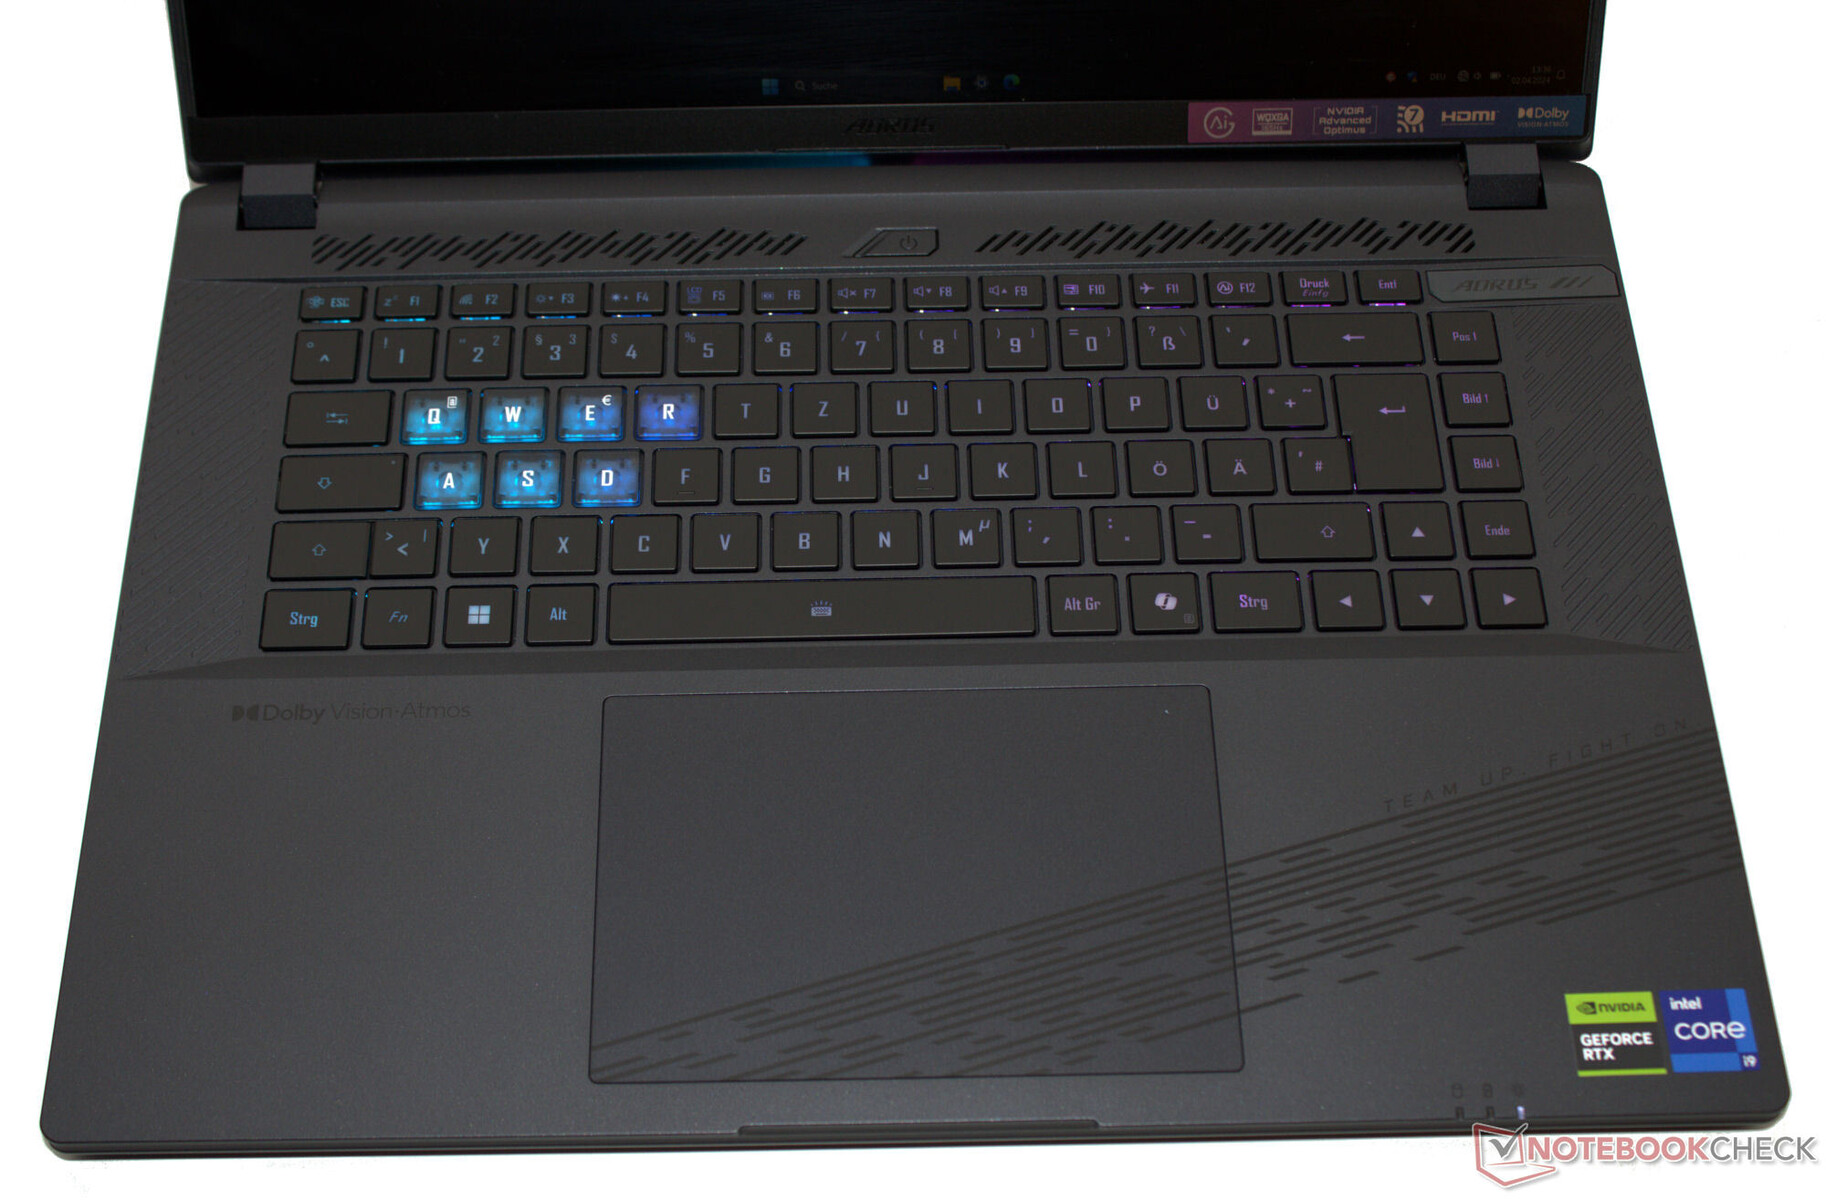
Inmatningsenheter - Aorus laptop har ett bakgrundsbelyst tangentbord
Tangentbord
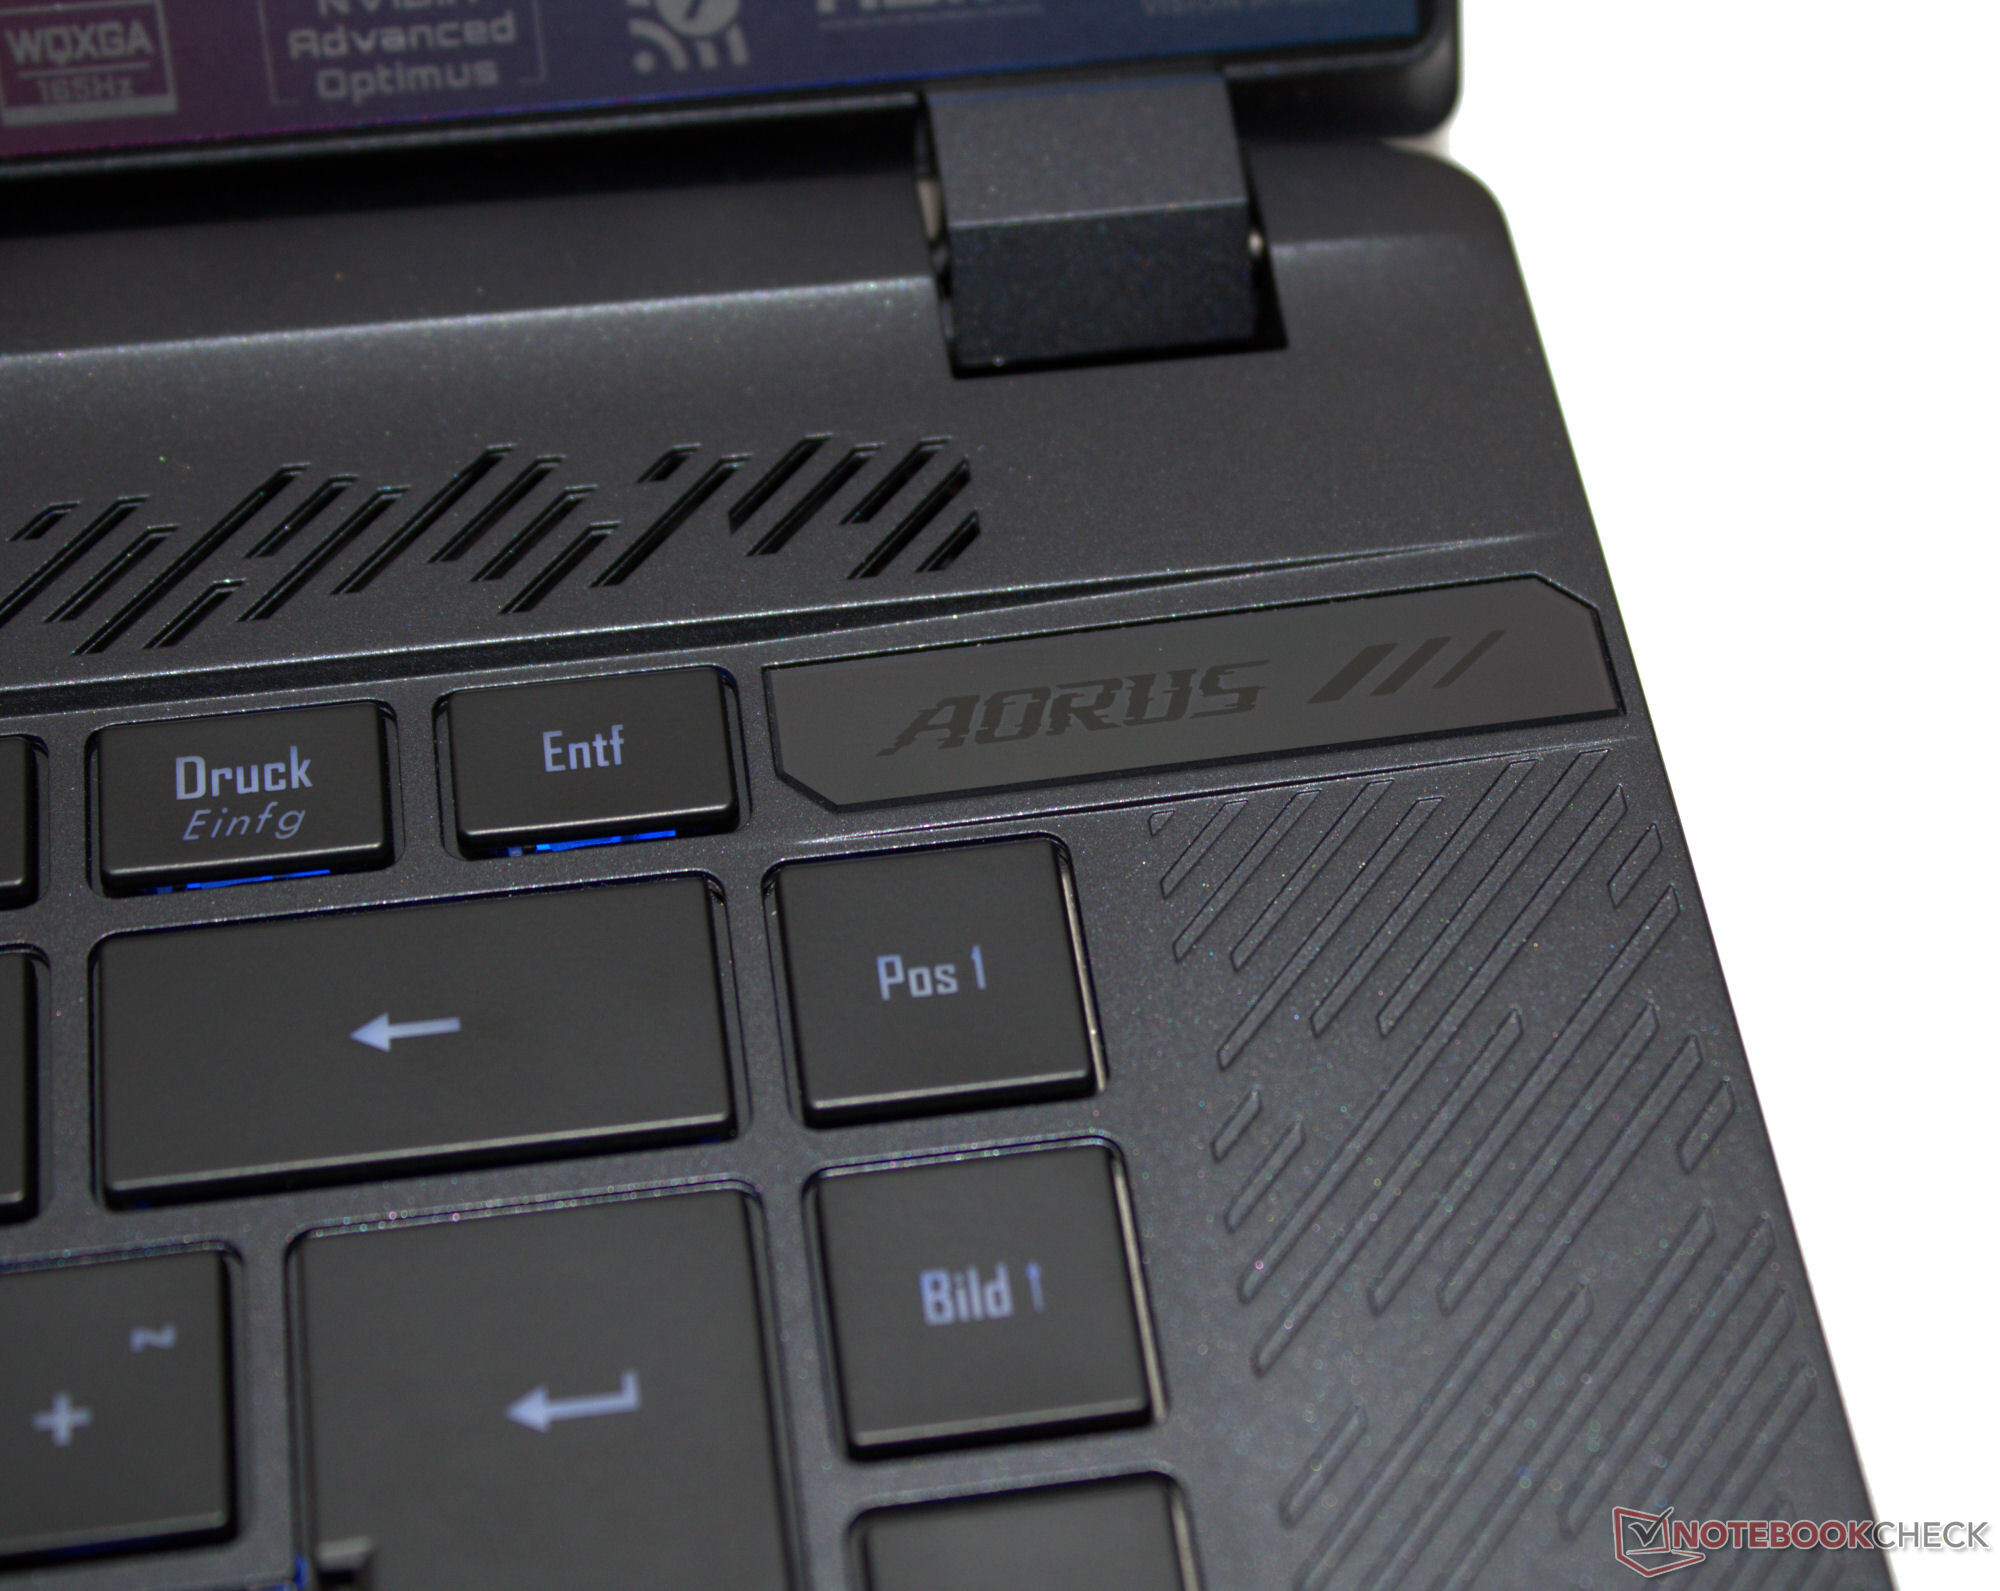
Tangenterna på chiclet-tangentbordet (RGB-belysning i tre steg) har en medelhög lyfthöjd och en tydlig tryckpunkt. Deras motstånd är okej. Tangentbordet ger efter något när du skriver, men det har ännu inte visat sig vara irriterande. Bra: De fyra piltangenterna är i full storlek. Gigabyte har beslutat att inte installera en numerisk knappsats. Sammantaget har tillverkaren levererat ett tangentbord som är lämpligt för daglig användning.
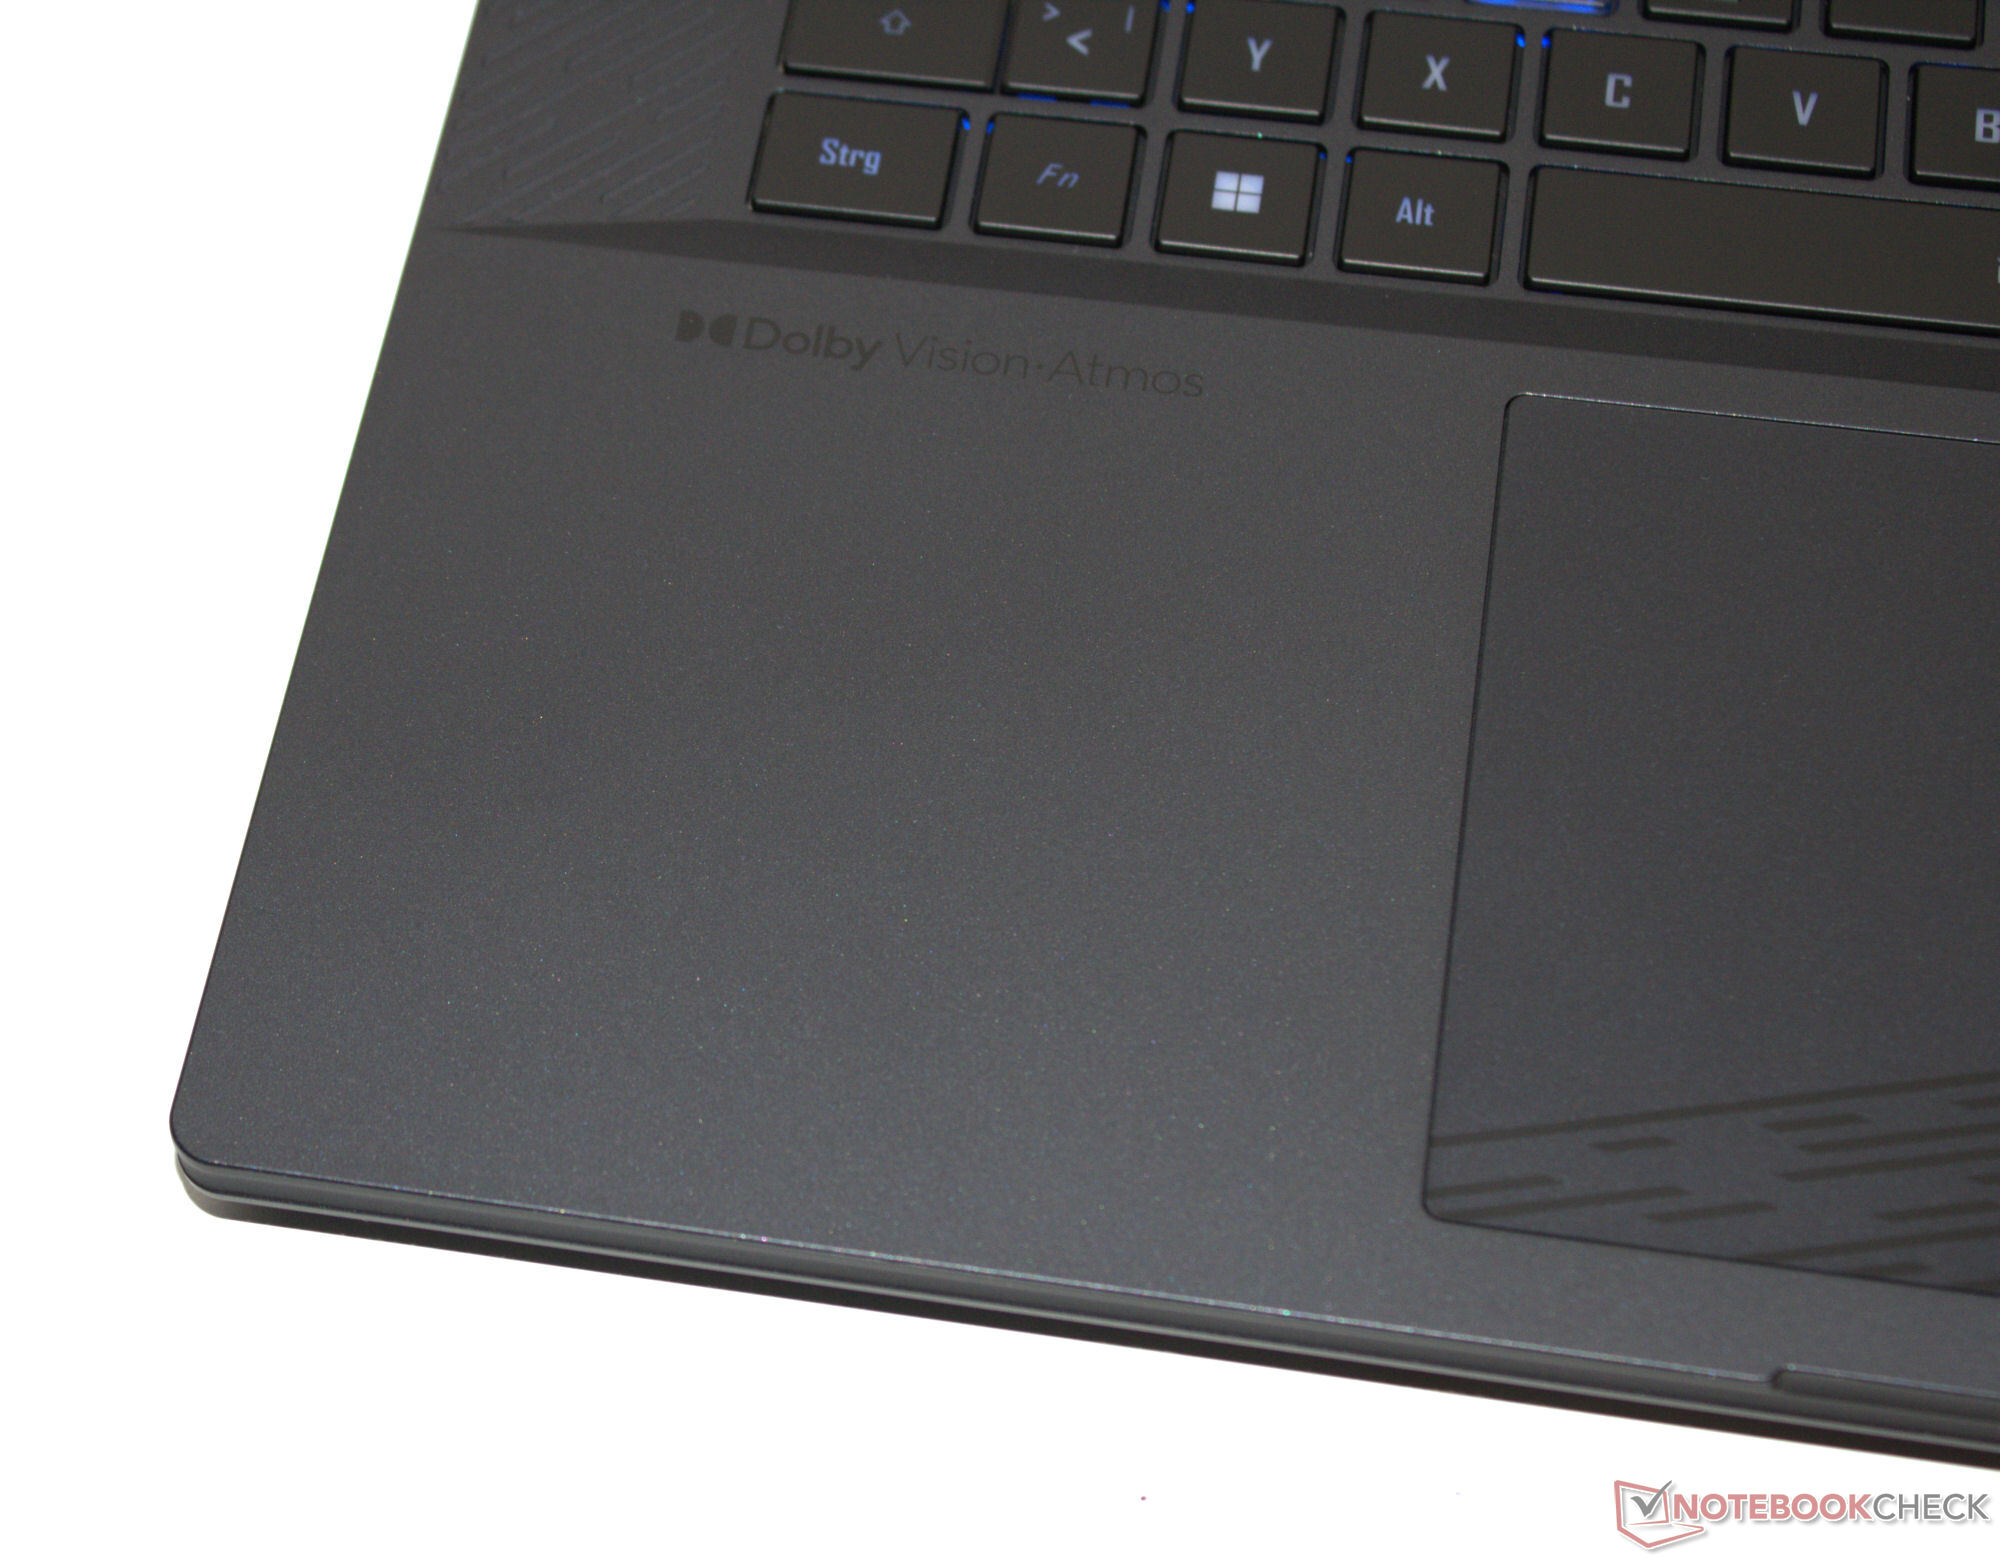
Pekplatta
Som musersättning fungerar en multi-touch-klickplatta (ca 13,3 x 9 cm) vars släta yta gör det lätt för fingrarna att glida. Den har en kort lyfthöjd och en tydlig tryckpunkt.
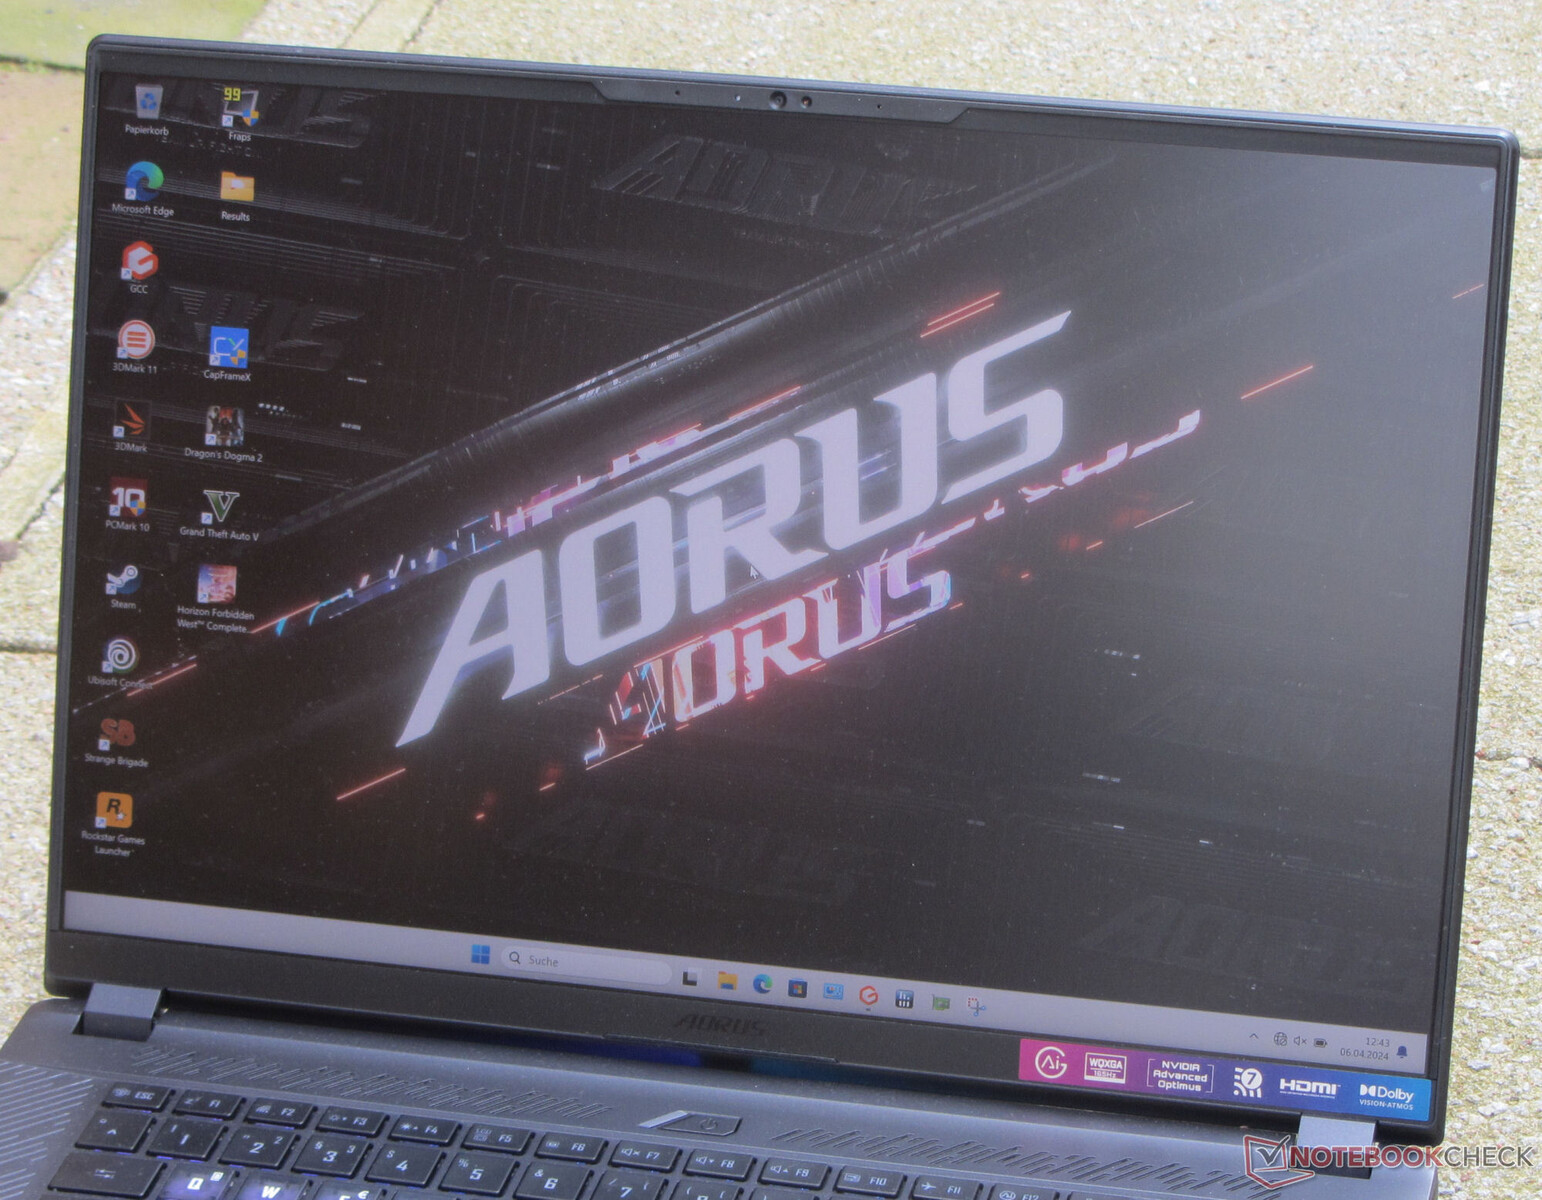
Display - Ljusstark, 16:10, sRGB
Gigabyte har installerat en 165-Hz-panel inklusive G-Sync-stöd. Det senare justerar dynamiskt uppdateringsfrekvenserna för skärmen och GPU för att skapa den smidigaste möjliga bilden - särskilt när du spelar.
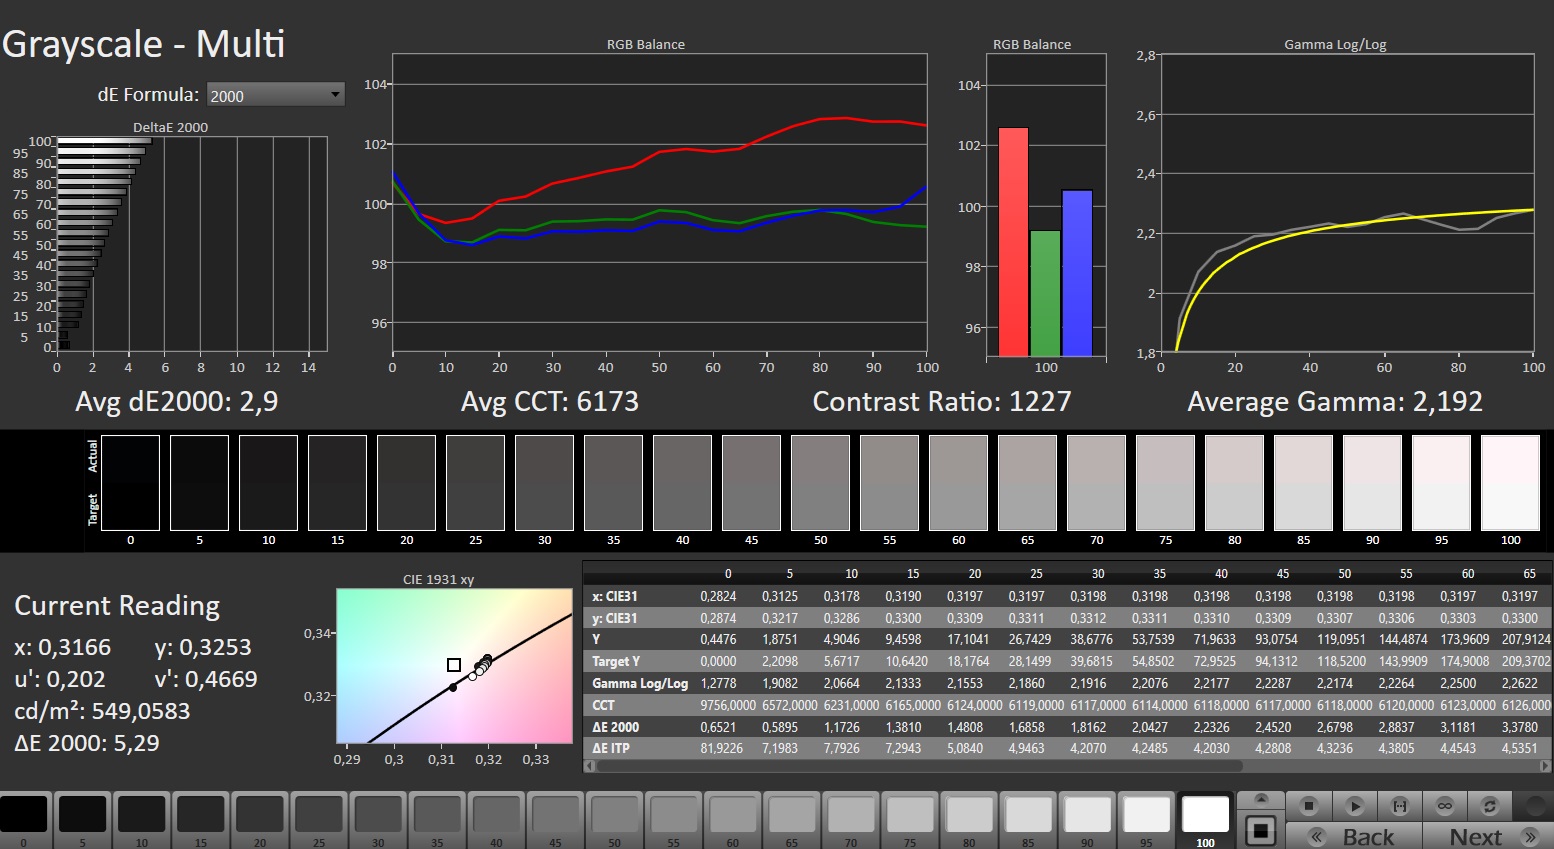
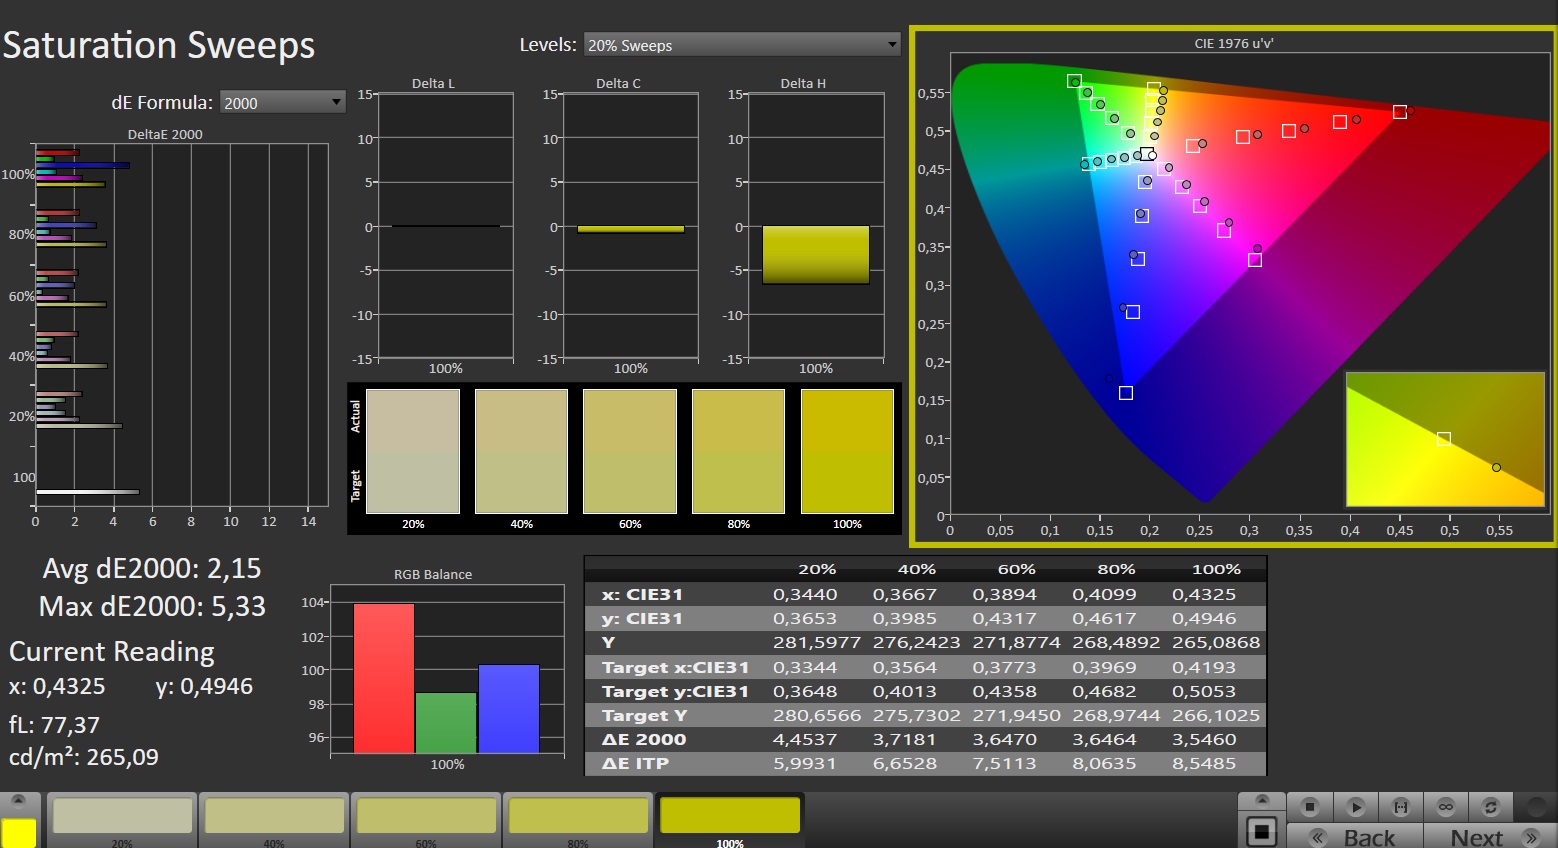
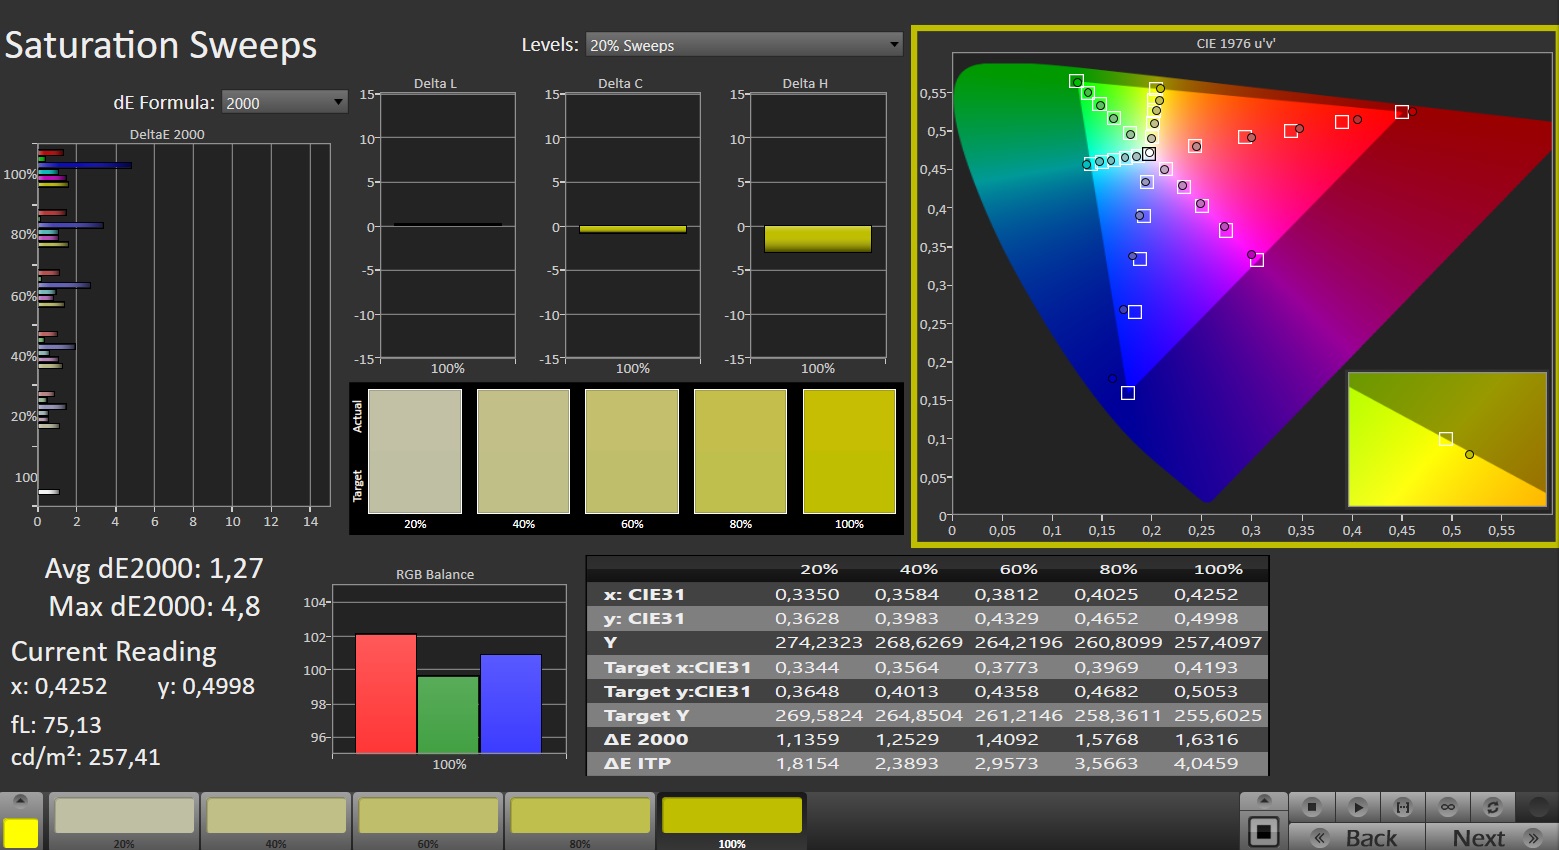
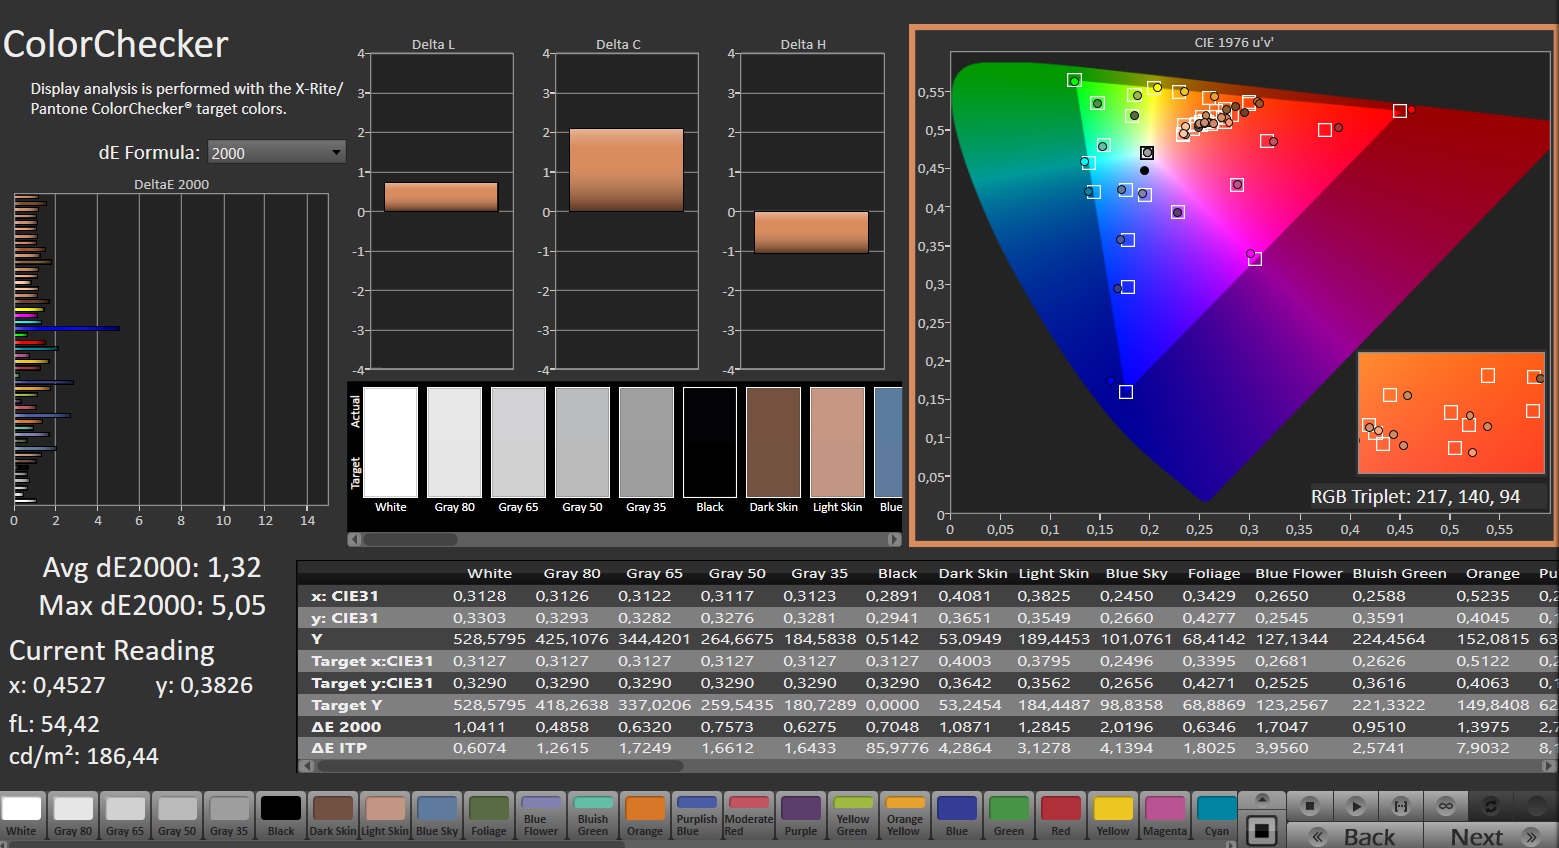
Vi noterade inga tecken på PWM-flimmer vid någon ljusstyrka. Den 16:10-matta 16-tumspanelens (2.560 x 1.600 pixlar) ljusstyrka och kontrast uppfyller sina respektive mål (> 300 cd/m² eller 1.000:1). Den höga ljusstyrkan är särskilt anmärkningsvärd.
| |||||||||||||||||||||||||
Distribution av ljusstyrkan: 86 %
Mitt på batteriet: 542 cd/m²
Kontrast: 1204:1 (Svärta: 0.45 cd/m²)
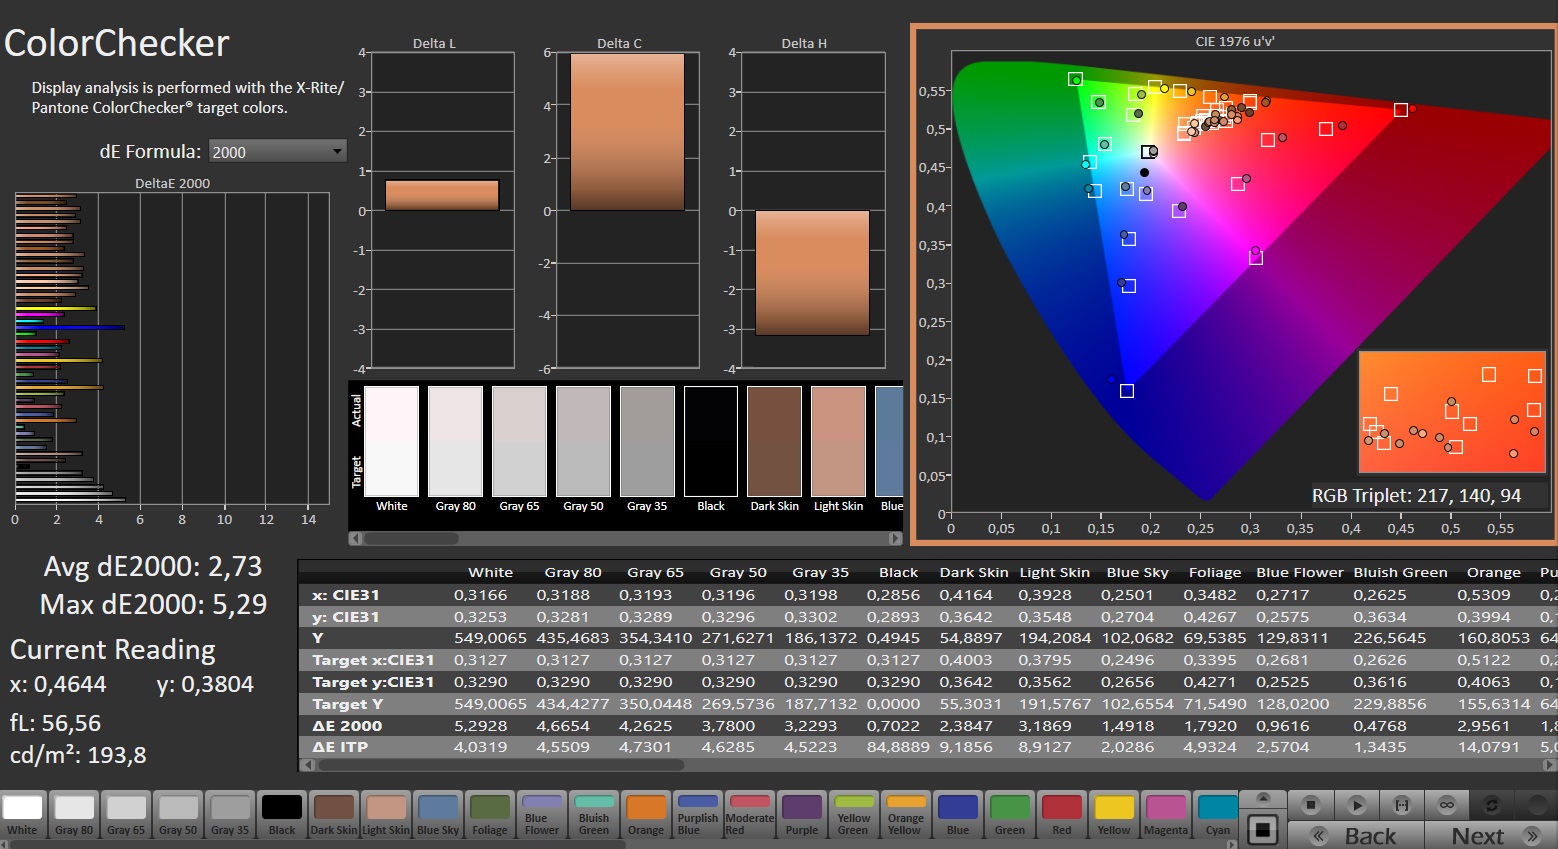
ΔE ColorChecker Calman: 2.73 | ∀{0.5-29.43 Ø4.73}
calibrated: 1.32
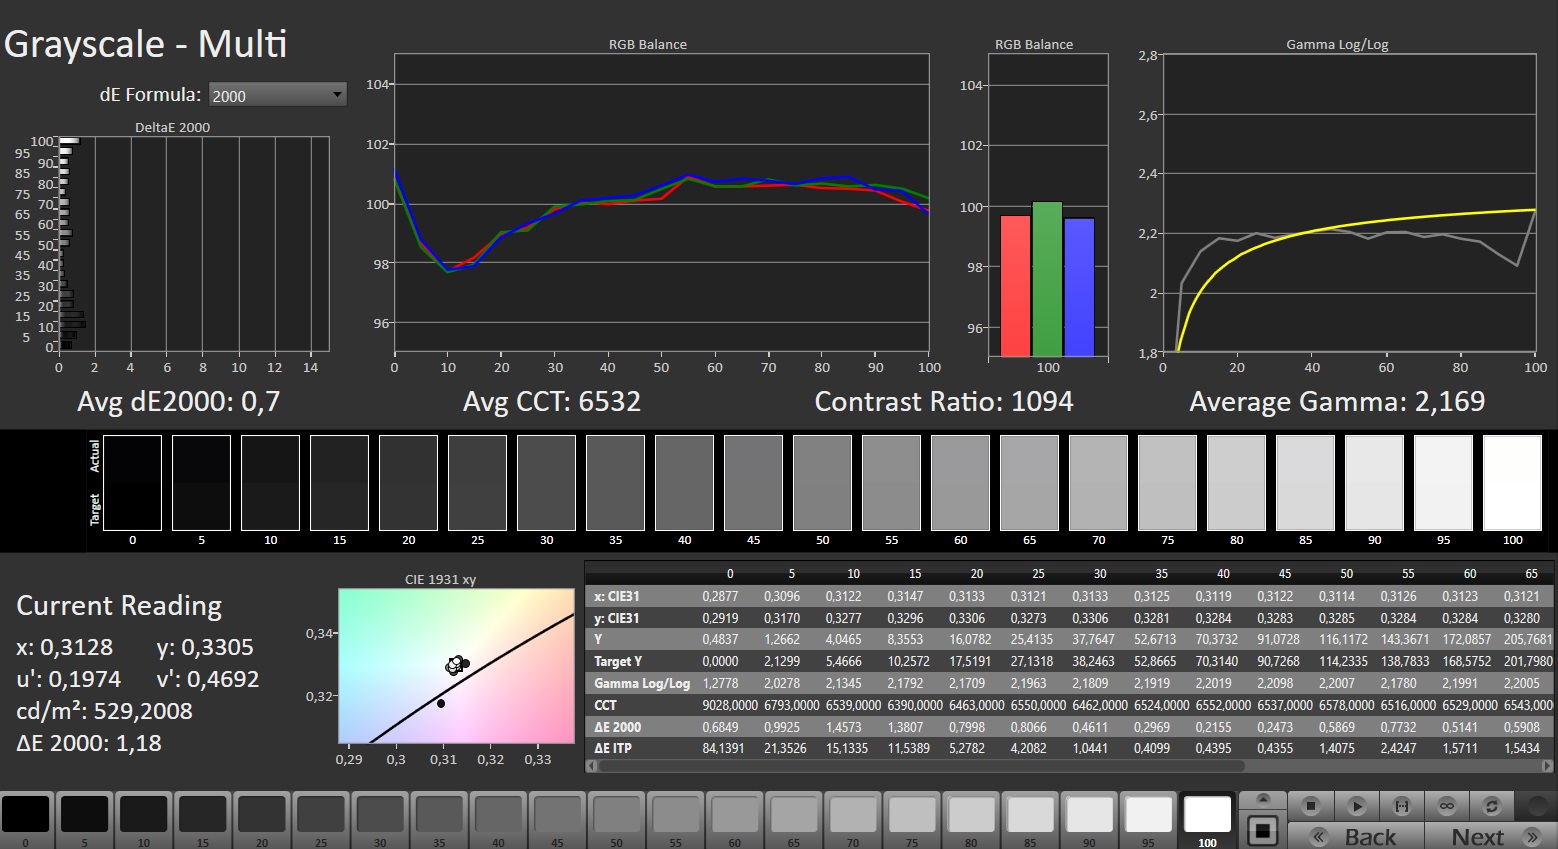
ΔE Greyscale Calman: 2.9 | ∀{0.09-98 Ø4.97}
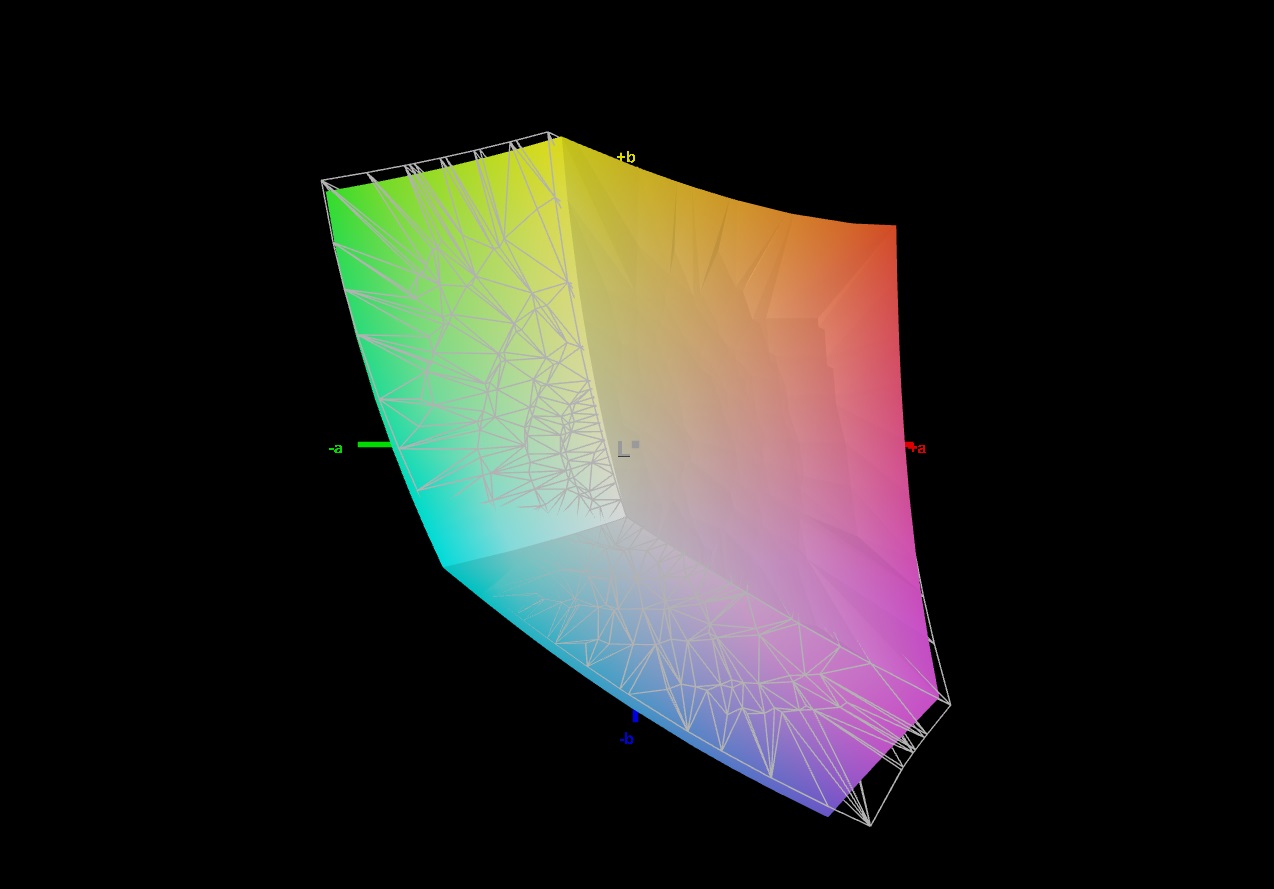
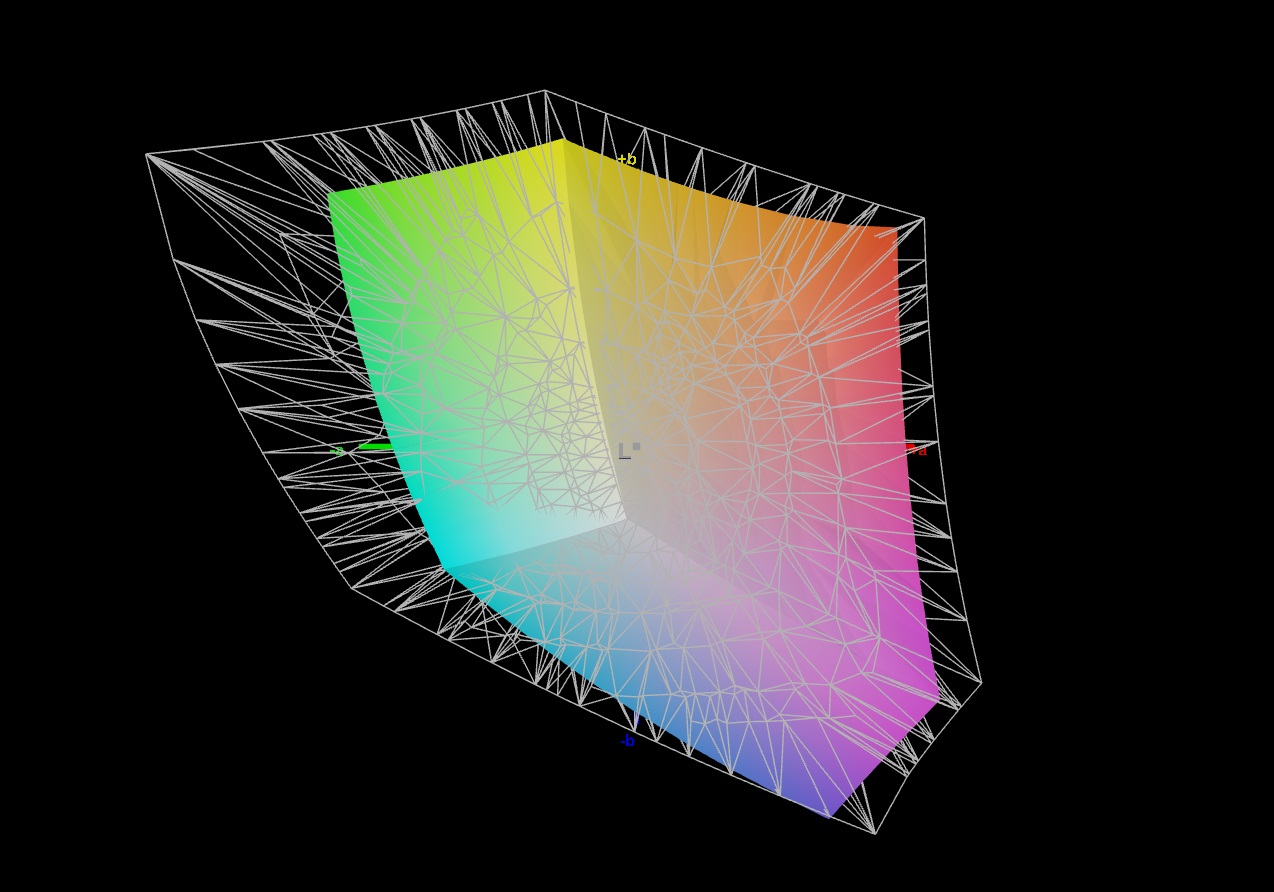
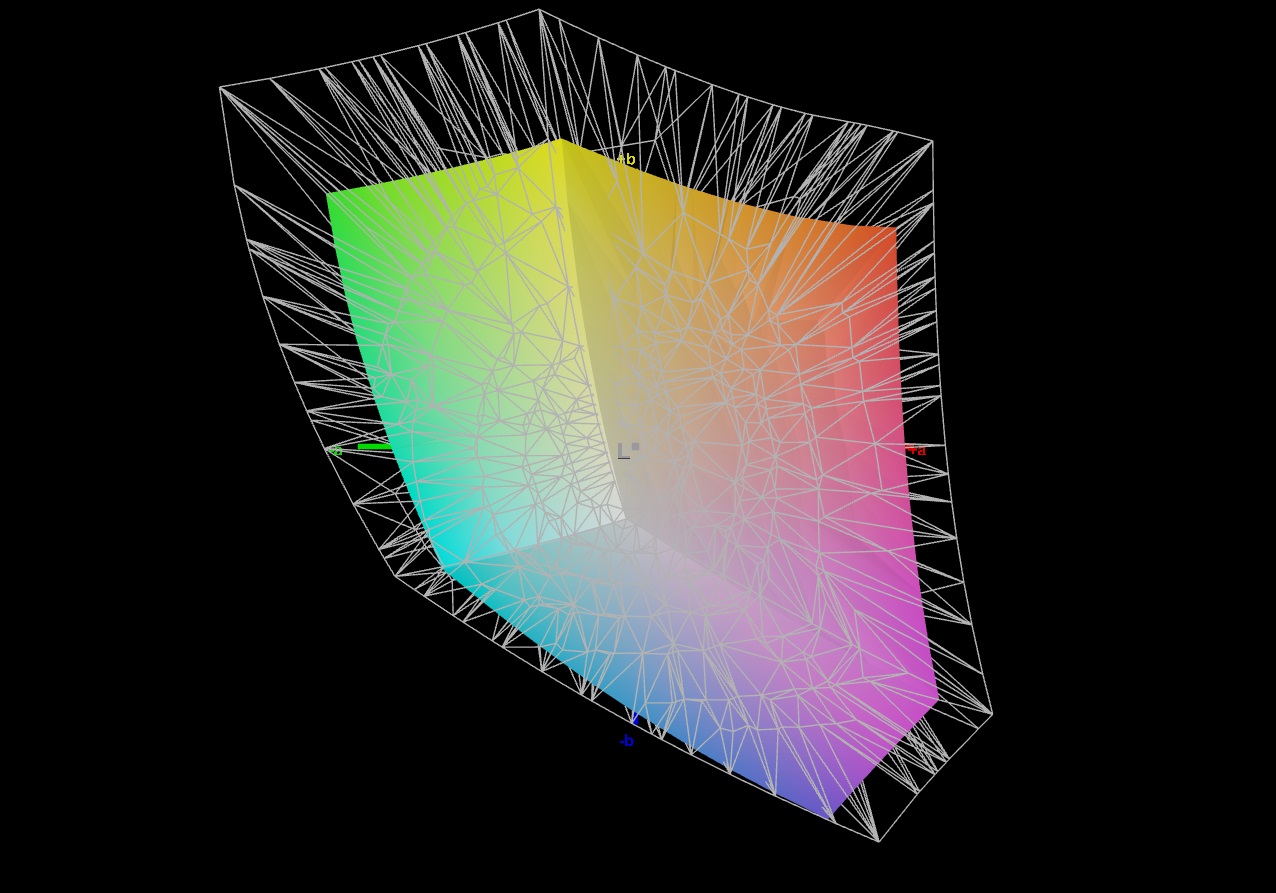
69.3% AdobeRGB 1998 (Argyll 3D)
96.7% sRGB (Argyll 3D)
67.2% Display P3 (Argyll 3D)
Gamma: 2.192
CCT: 6173 K
| Aorus 16X 2024 BOE CQ NE160QDM-NY1, IPS, 2560x1600, 16" | Alienware m16 R2 BOE NE16NYH, IPS, 2560x1600, 16" | HP Omen Transcend 16-u1095ng ATNA60DL02-0 (SDC41A4), OLED, 2560x1600, 16" | Asus TUF Gaming A17 FA707XI-NS94 AU Optronics B173HAN04.9, IPS, 1920x1080, 17.3" | Schenker XMG Pro 16 Studio (Mid 23) BOE CQ NE160QDM-NZ1, IPS, 2560x1600, 16" | Lenovo Legion Pro 5 16IRX9 BOE NE160QDM-NYC, IPS, 2560x1600, 16" | |
|---|---|---|---|---|---|---|
| Display | 4% | 31% | -40% | 2% | 2% | |
| Display P3 Coverage (%) | 67.2 | 71 6% | 99.8 49% | 39.7 -41% | 69.4 3% | 69.3 3% |
| sRGB Coverage (%) | 96.7 | 100 3% | 100 3% | 59.1 -39% | 98.2 2% | 99.4 3% |
| AdobeRGB 1998 Coverage (%) | 69.3 | 71.4 3% | 97 40% | 41 -41% | 70.1 1% | 70.1 1% |
| Response Times | -19% | 97% | -409% | -53% | -62% | |
| Response Time Grey 50% / Grey 80% * (ms) | 7.5 ? | 5.7 ? 24% | 0.2 ? 97% | 39 ? -420% | 12.2 ? -63% | 11.9 ? -59% |
| Response Time Black / White * (ms) | 5.4 ? | 8.7 ? -61% | 0.2 ? 96% | 26.9 ? -398% | 7.7 ? -43% | 8.9 ? -65% |
| PWM Frequency (Hz) | 120 ? | |||||
| Screen | 11% | 162% | -50% | -9% | 17% | |
| Brightness middle (cd/m²) | 542 | 345.8 -36% | 390 -28% | 255.9 -53% | 349 -36% | 384 -29% |
| Brightness (cd/m²) | 504 | 337 -33% | 392 -22% | 248 -51% | 348 -31% | 366 -27% |
| Brightness Distribution (%) | 86 | 87 1% | 98 14% | 91 6% | 93 8% | 91 6% |
| Black Level * (cd/m²) | 0.45 | 0.3 33% | 0.02 96% | 0.21 53% | 0.32 29% | 0.35 22% |
| Contrast (:1) | 1204 | 1153 -4% | 19500 1520% | 1219 1% | 1091 -9% | 1097 -9% |
| Colorchecker dE 2000 * | 2.73 | 1.99 27% | 1.94 29% | 4.51 -65% | 1.98 27% | 0.97 64% |
| Colorchecker dE 2000 max. * | 5.29 | 3.52 33% | 4.26 19% | 20.77 -293% | 7.56 -43% | 3.57 33% |
| Colorchecker dE 2000 calibrated * | 1.32 | 0.62 53% | 4.21 -219% | 1.82 -38% | 1.45 -10% | 0.77 42% |
| Greyscale dE 2000 * | 2.9 | 2.1 28% | 1.5 48% | 3.2 -10% | 3.3 -14% | 1.5 48% |
| Gamma | 2.192 100% | 2.32 95% | 2.221 99% | 2.08 106% | 2.137 103% | 2.24 98% |
| CCT | 6173 105% | 6369 102% | 6395 102% | 6054 107% | 6672 97% | 6709 97% |
| Totalt genomsnitt (program/inställningar) | -1% /
6% | 97% /
124% | -166% /
-99% | -20% /
-13% | -14% /
2% |
* ... mindre är bättre
Skärmen visade redan bra färgåtergivning direkt ur lådan: Med en avvikelse på cirka 2,7 har målet (DeltaE < 3) uppnåtts. Kalibreringen minskar avvikelsen till 1,3 och säkerställer mer balanserade gråtoner. Panelen kan helt återge sRGB-färgrymden, men inte AdobeRGB och DCI P3-färgrymderna. Detta är ingen skillnad för de flesta konkurrenternas skärmar.
Visa svarstider
| ↔ Svarstid svart till vitt | ||
|---|---|---|
| 5.4 ms ... stiga ↗ och falla ↘ kombinerat | ↗ 1.5 ms stiga | 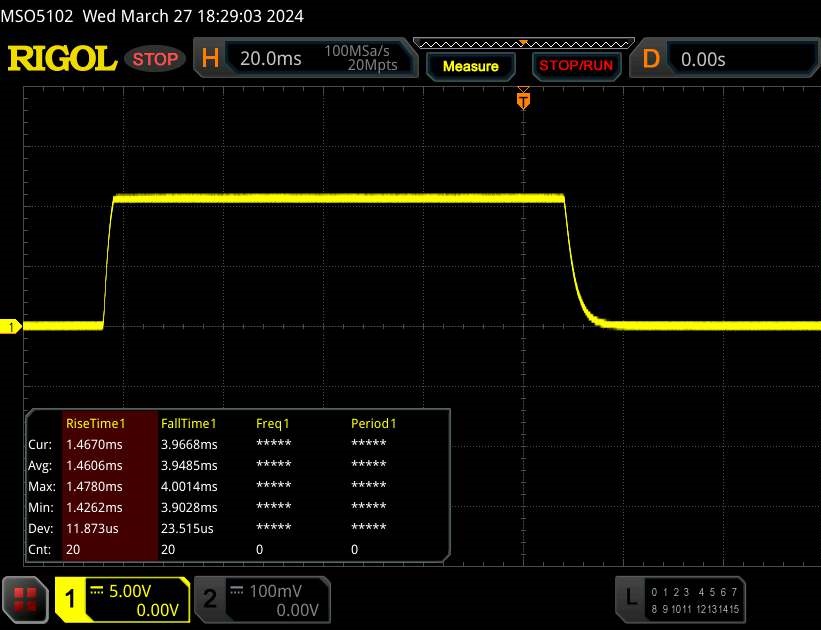 |
| ↘ 3.9 ms hösten | ||
| Skärmen visar väldigt snabba svarsfrekvenser i våra tester och borde vara mycket väl lämpad för fartfyllt spel. I jämförelse sträcker sig alla testade enheter från 0.1 (minst) till 240 (maximalt) ms. » 18 % av alla enheter är bättre. Det betyder att den uppmätta svarstiden är bättre än genomsnittet av alla testade enheter (19.9 ms). | ||
| ↔ Svarstid 50 % grått till 80 % grått | ||
| 7.5 ms ... stiga ↗ och falla ↘ kombinerat | ↗ 3.3 ms stiga | 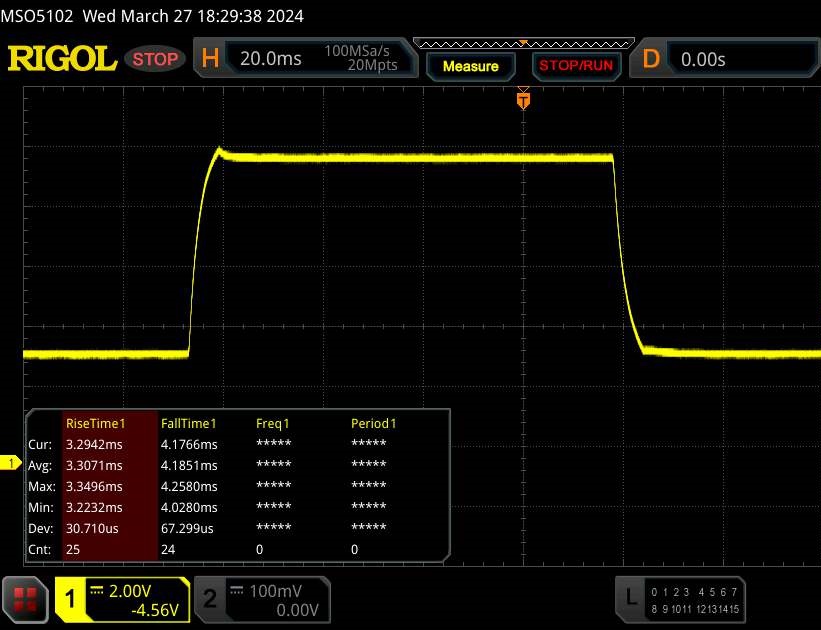 |
| ↘ 4.2 ms hösten | ||
| Skärmen visar väldigt snabba svarsfrekvenser i våra tester och borde vara mycket väl lämpad för fartfyllt spel. I jämförelse sträcker sig alla testade enheter från 0.165 (minst) till 636 (maximalt) ms. » 20 % av alla enheter är bättre. Det betyder att den uppmätta svarstiden är bättre än genomsnittet av alla testade enheter (31.1 ms). | ||
Skärmflimmer / PWM (Puls-Width Modulation)
| Skärmflimmer / PWM upptäcktes inte | 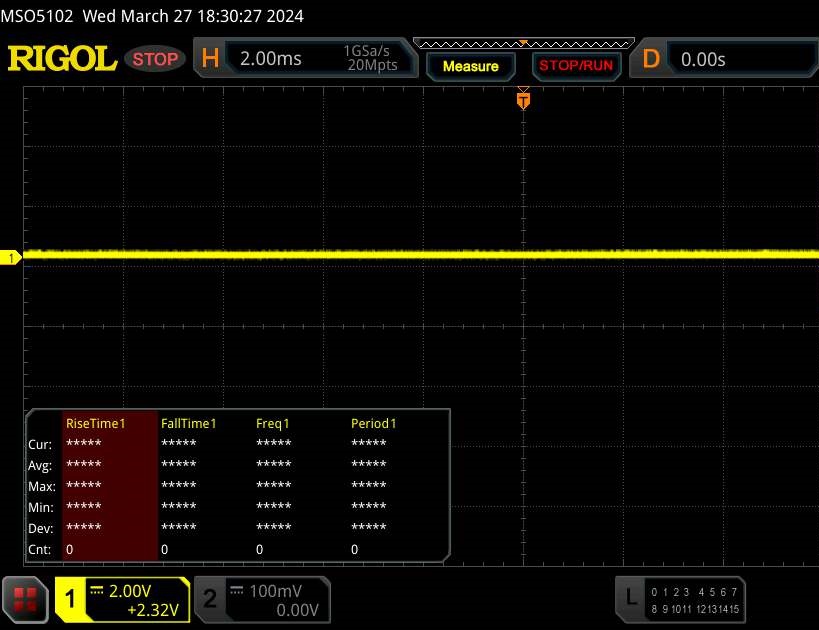 | ||
Som jämförelse: 52 % av alla testade enheter använder inte PWM för att dämpa skärmen. Om PWM upptäcktes mättes ett medelvärde av 7798 (minst: 5 - maximum: 343500) Hz. | |||
Den betraktningsvinkelstabila IPS-panelen är läsbar från alla vinklar. Utomhus kan du läsa på panelen så länge solen inte skiner för starkt.

Prestanda - Raptor Lake och Ada Lovelace driver enheten
Gigabytes Aorus 16X är en bärbar dator för spelare och kreatörer. Den nödvändiga beräkningskraften levereras av Raptor Lake och Ada Lovelace. Den aktuella modellen kan för närvarande köpas för cirka 2 000 USD. Billigare varianter finns också tillgängliga.
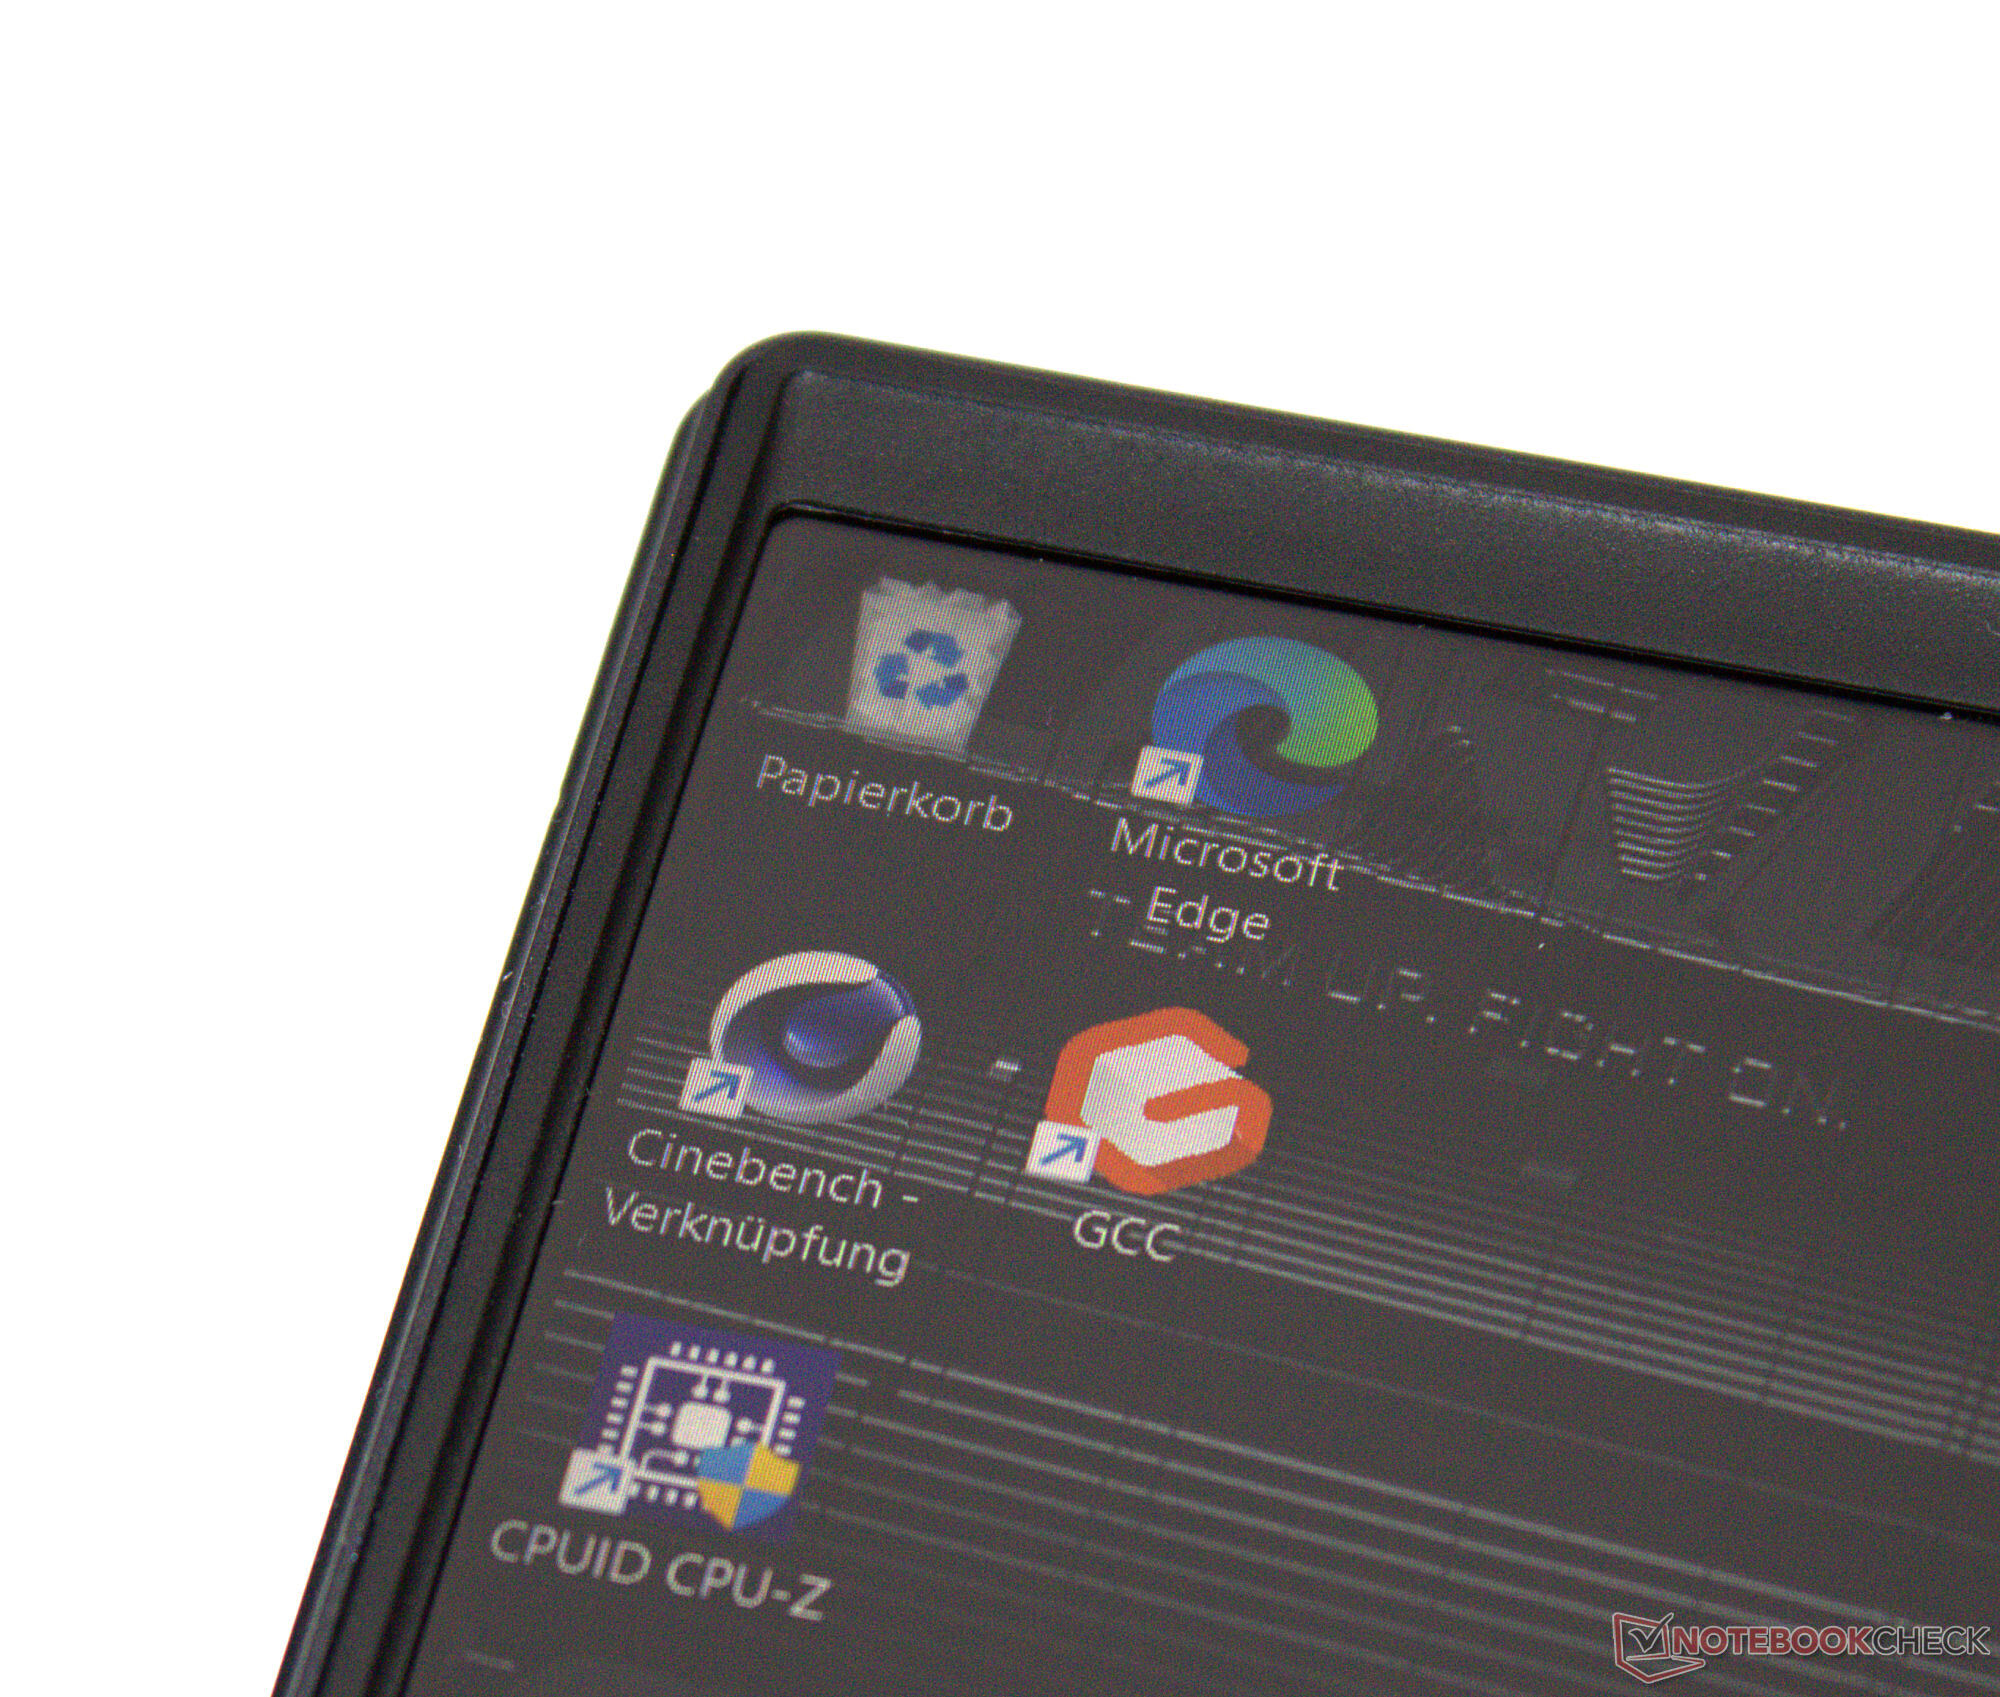
Villkor för testning
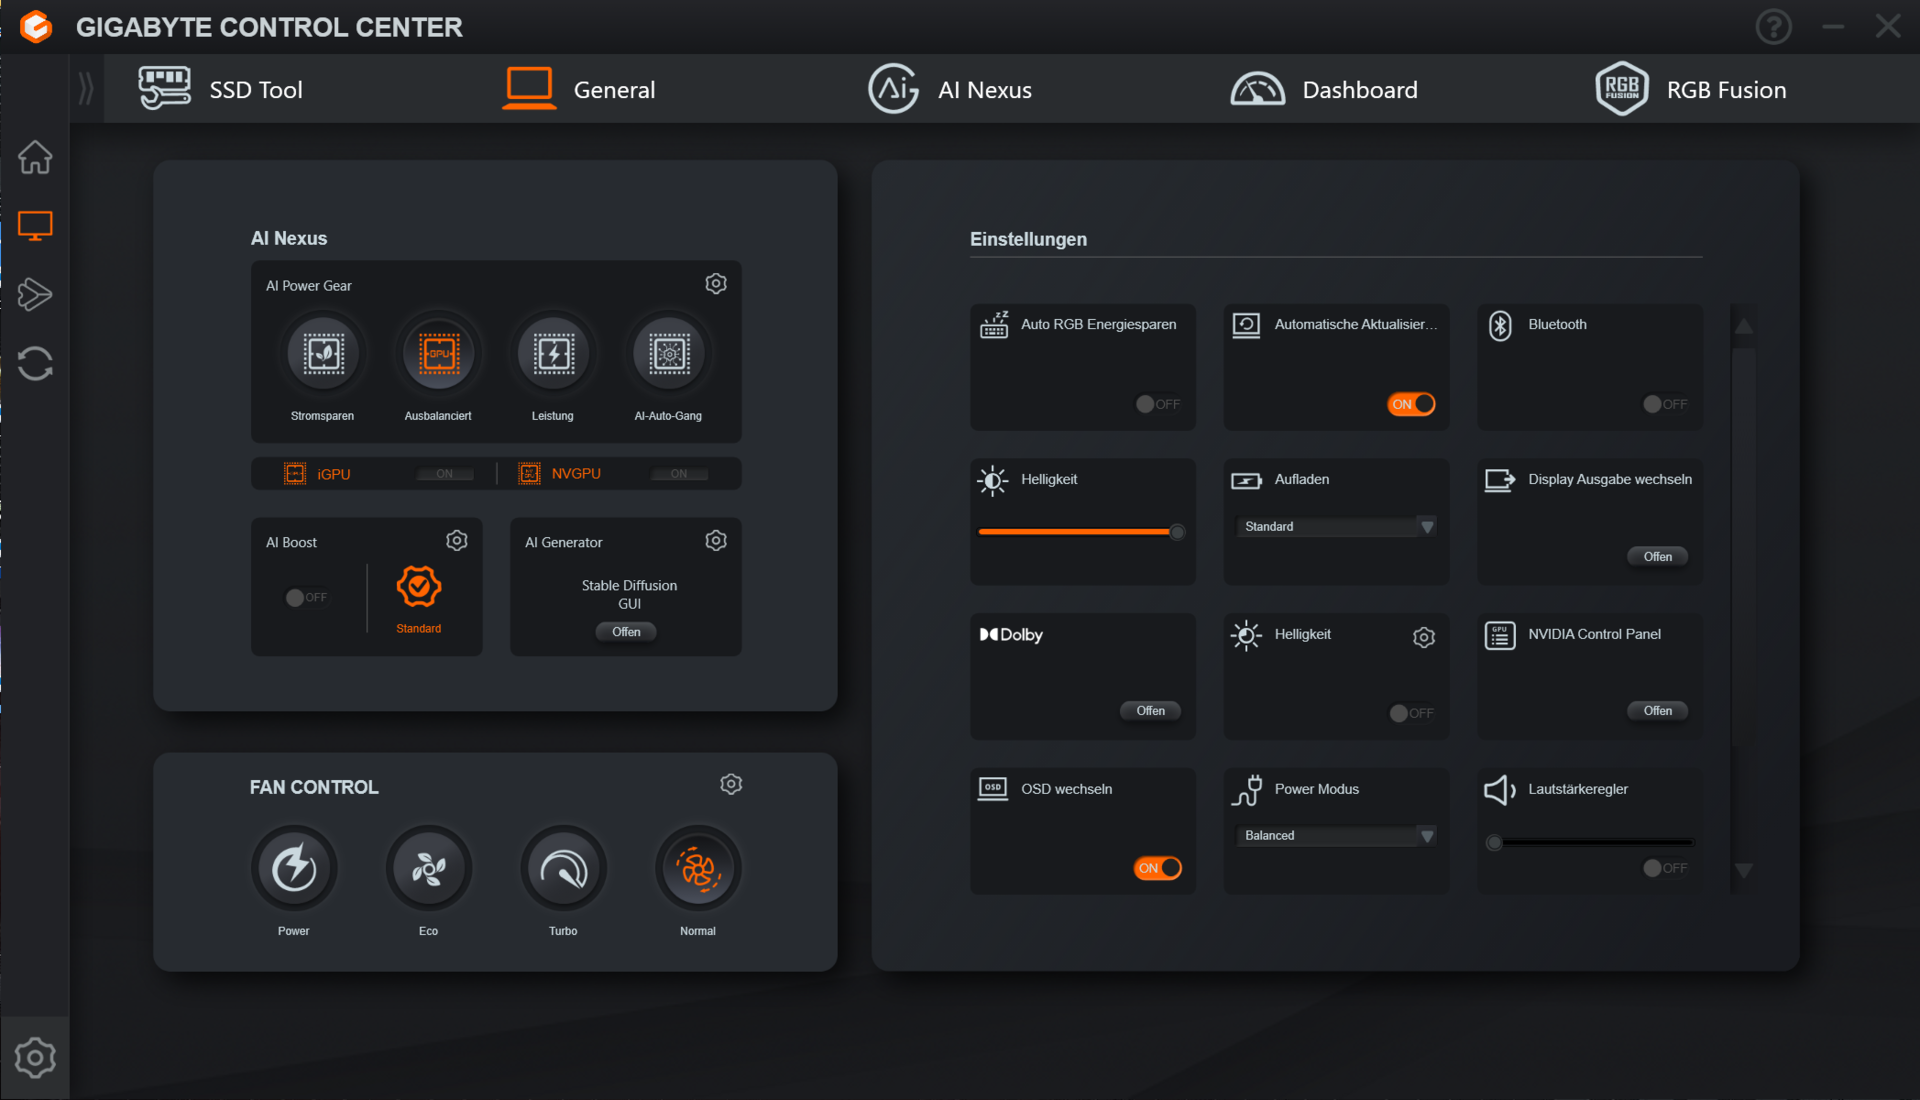
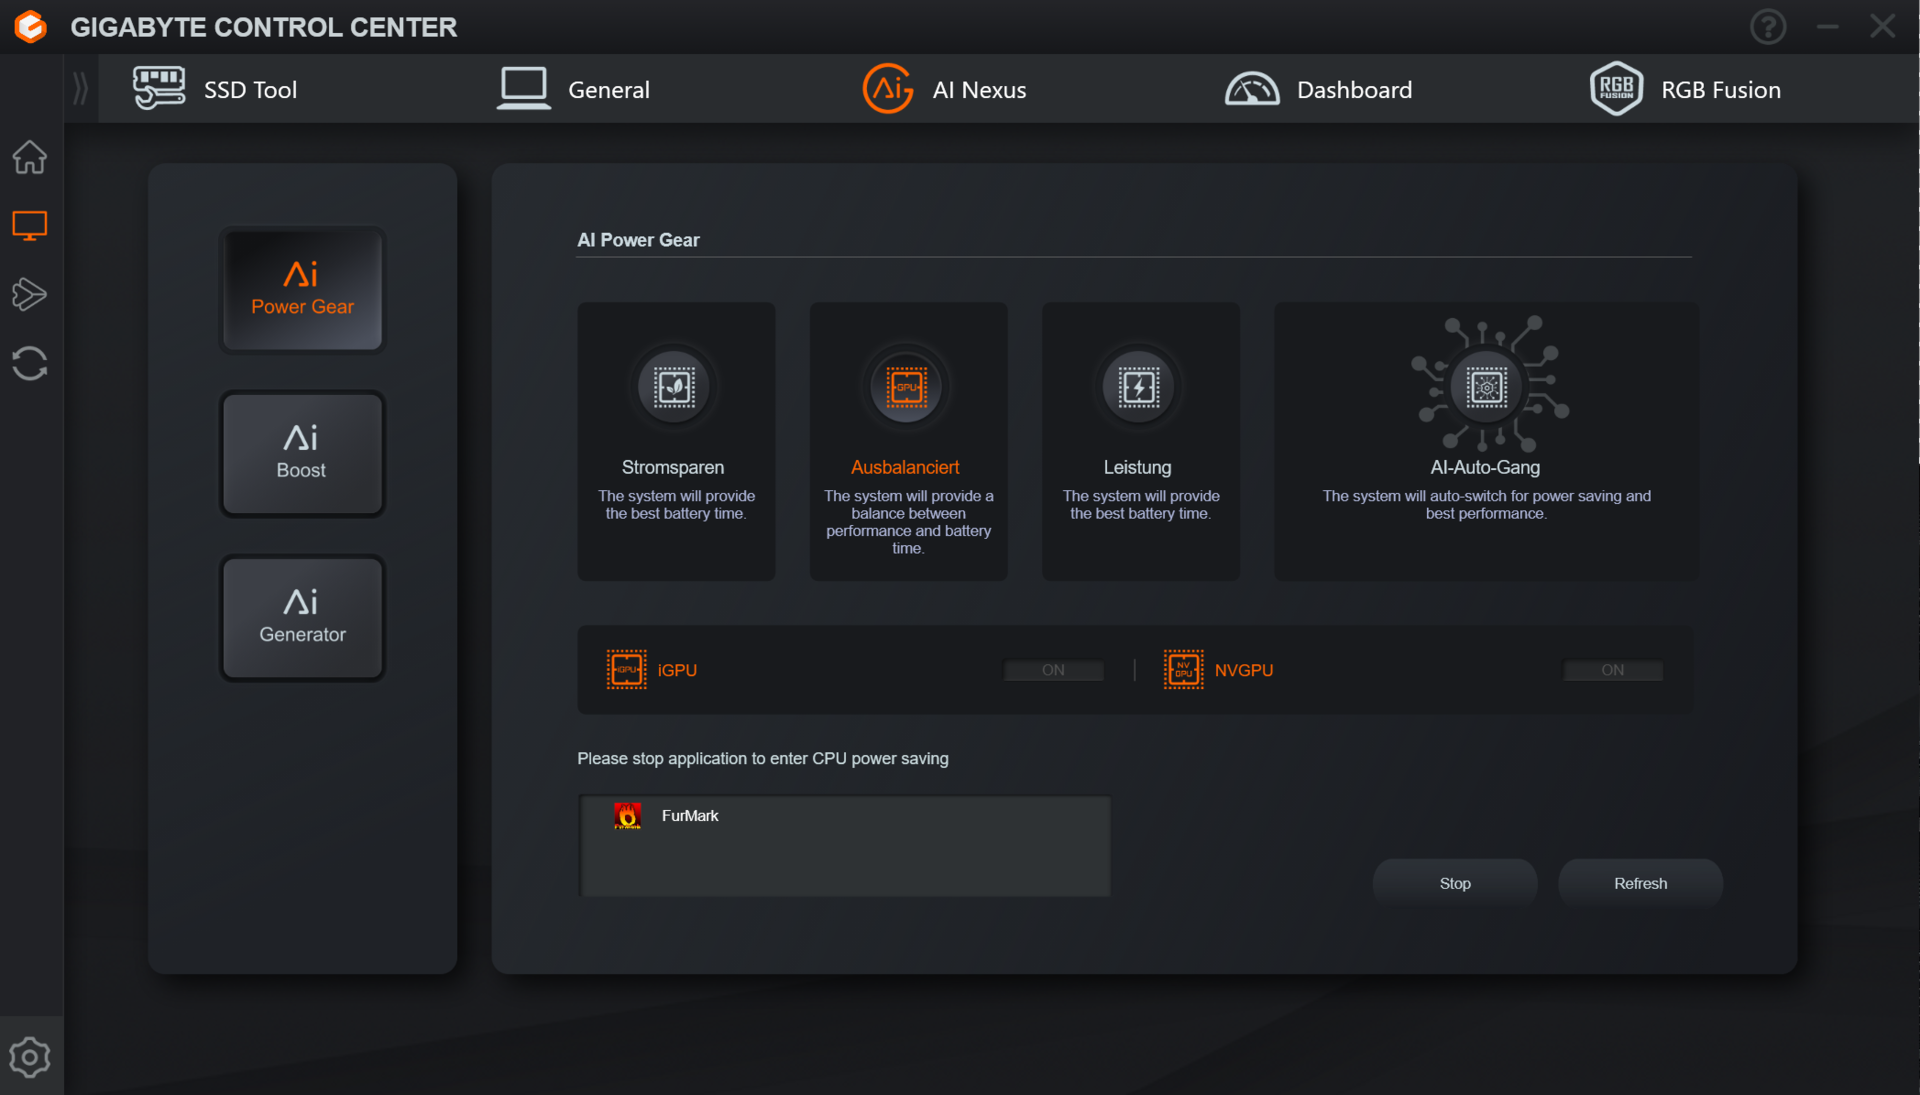
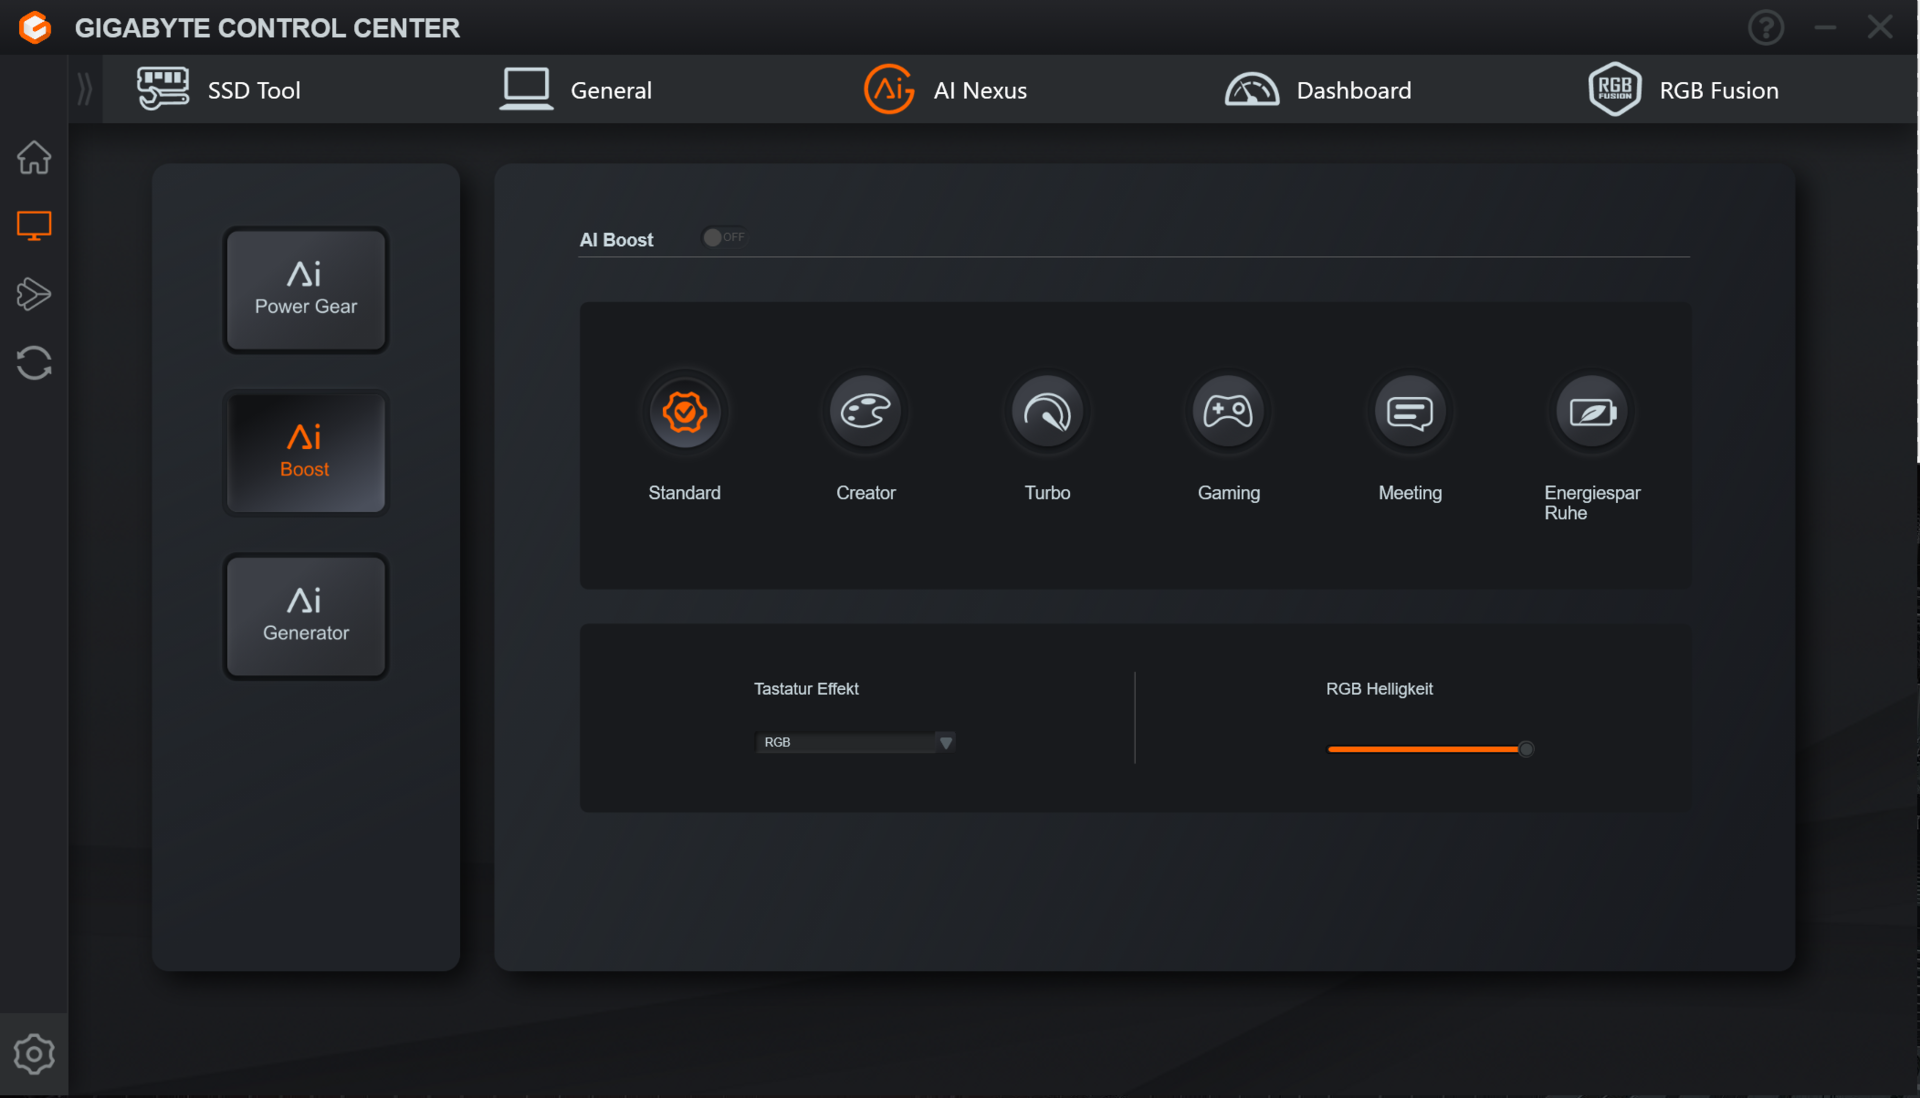
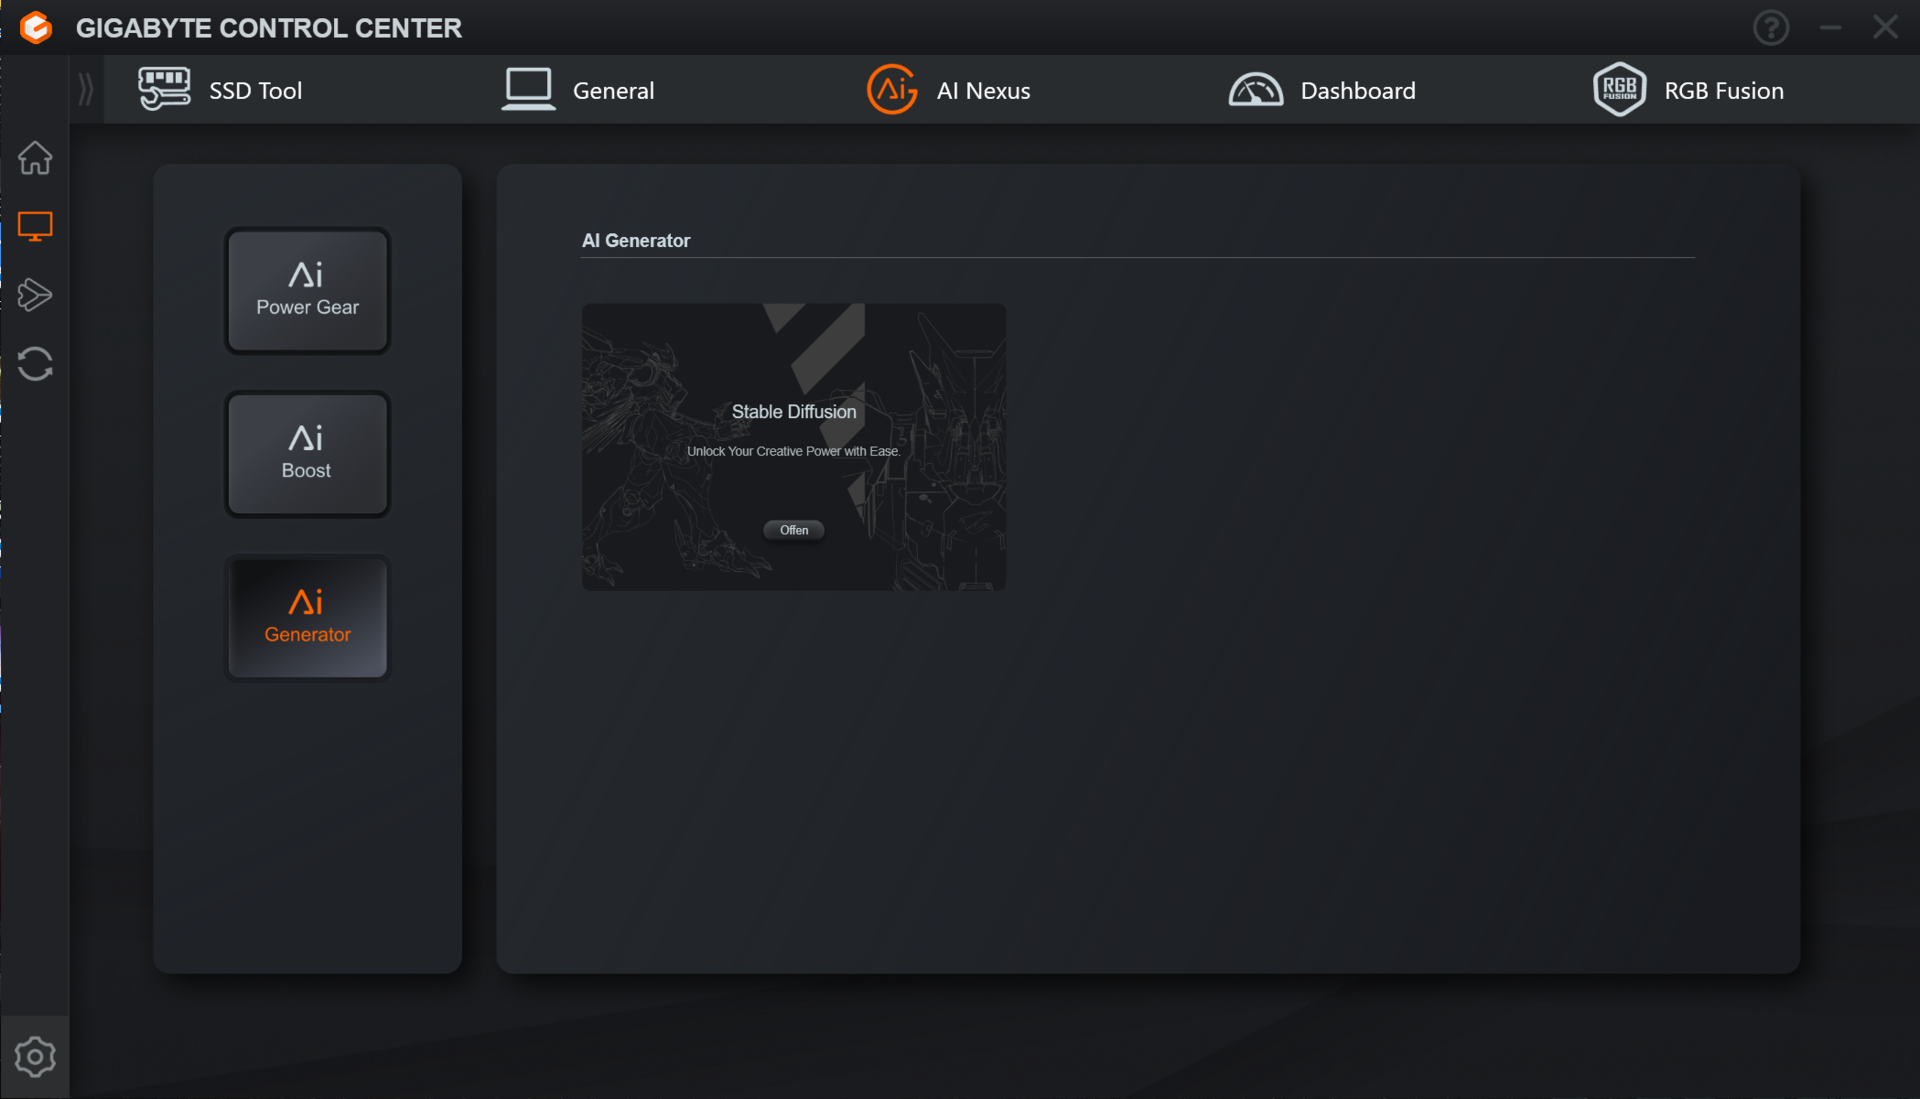
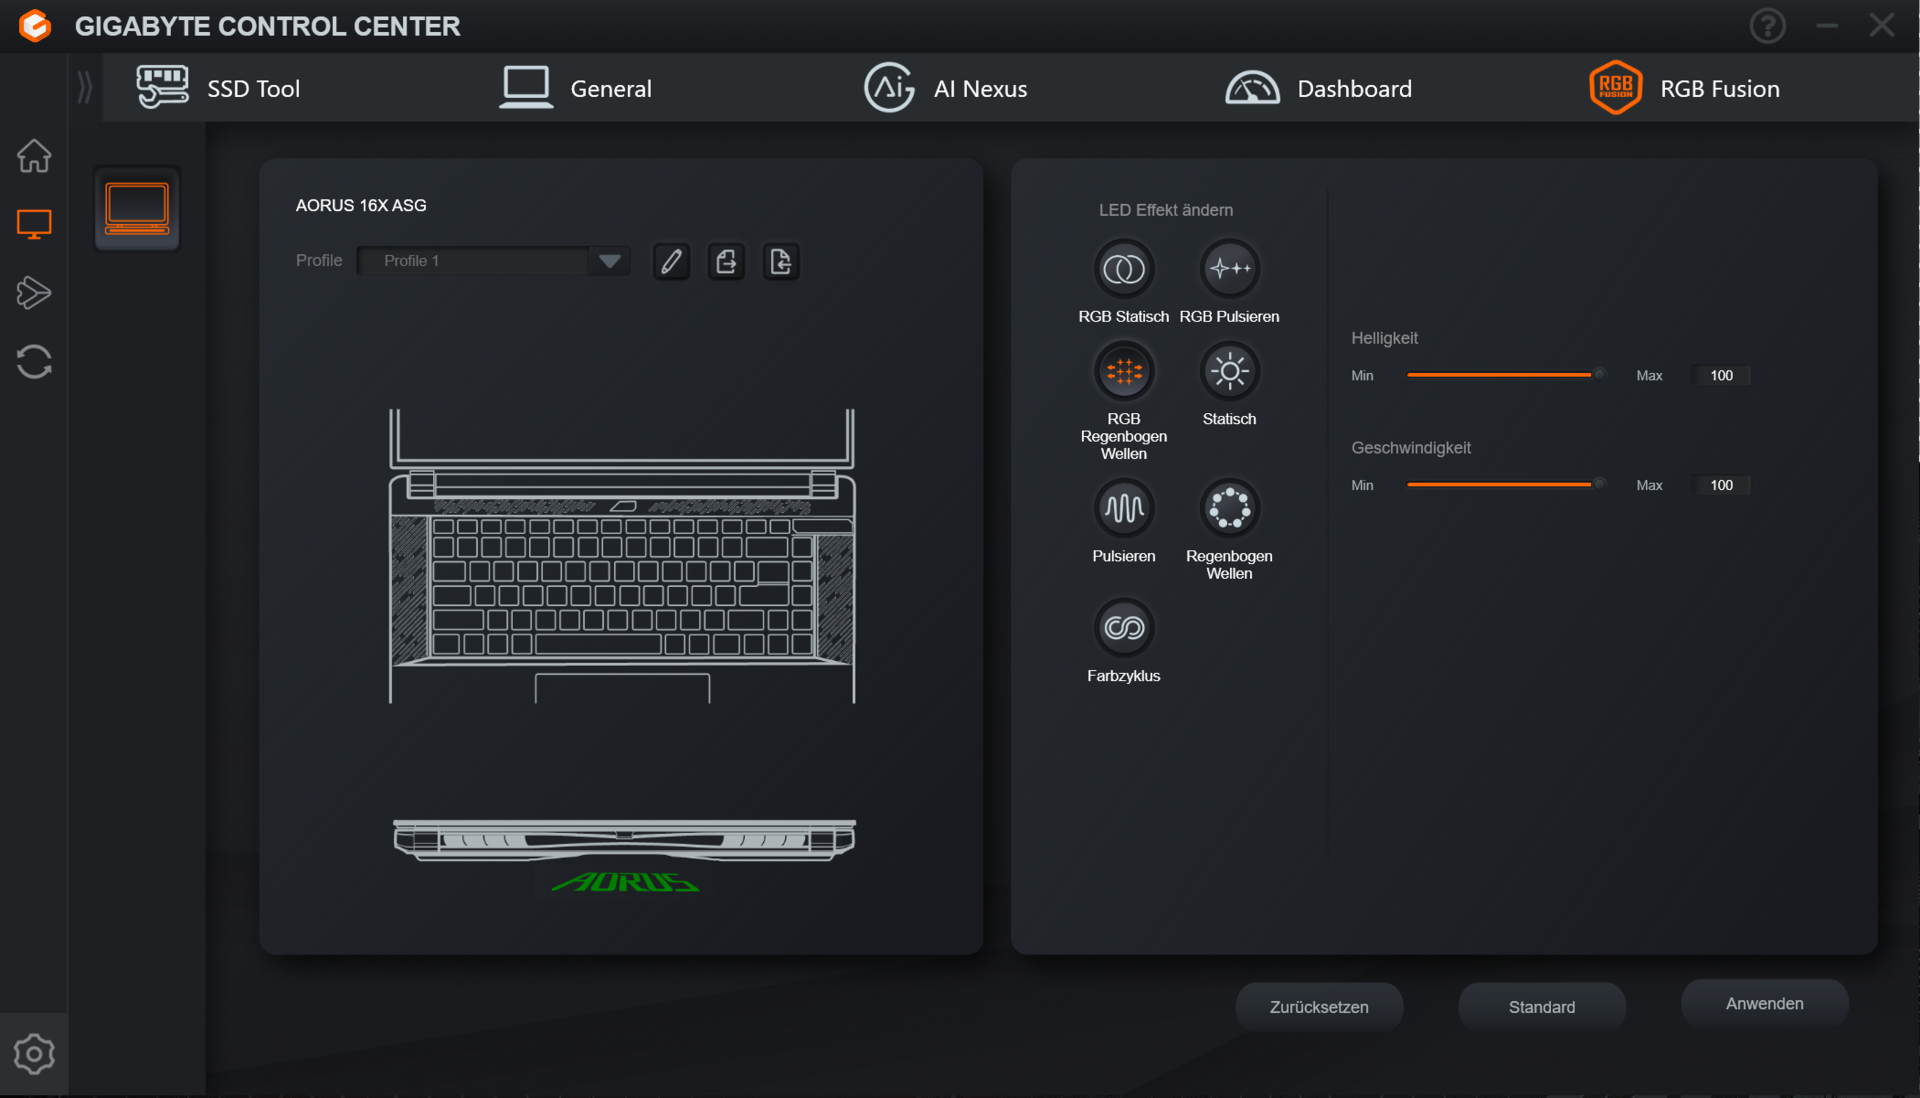
16X erbjuder sex tillverkarspecifika prestandalägen (se tabell), som kan växlas mellan via Gigabyte Control Center (den bärbara datorns kontrollcenter). Vi använde lägena Standard (riktmärken) och Energy-Saving Quiet (batteritester). Turbo, Gaming och Creator kan endast användas när den bärbara datorn är ansluten till elnätet.
Observera: De tillgängliga prestandainställningarna kommuniceras inte särskilt tydligt i Gigabyte Control Center. De systemövergripande prestandaprofilerna finns i avsnittet "AI Boost". Avsnittet "AI Power Gear" hänvisar endast till driftstatusen för dGPU (endast dGPU eller av, grafikväxling).
| Standard | Creator | Turbo | Gaming | Möte | Energisparande Tyst | |
|---|---|---|---|---|---|---|
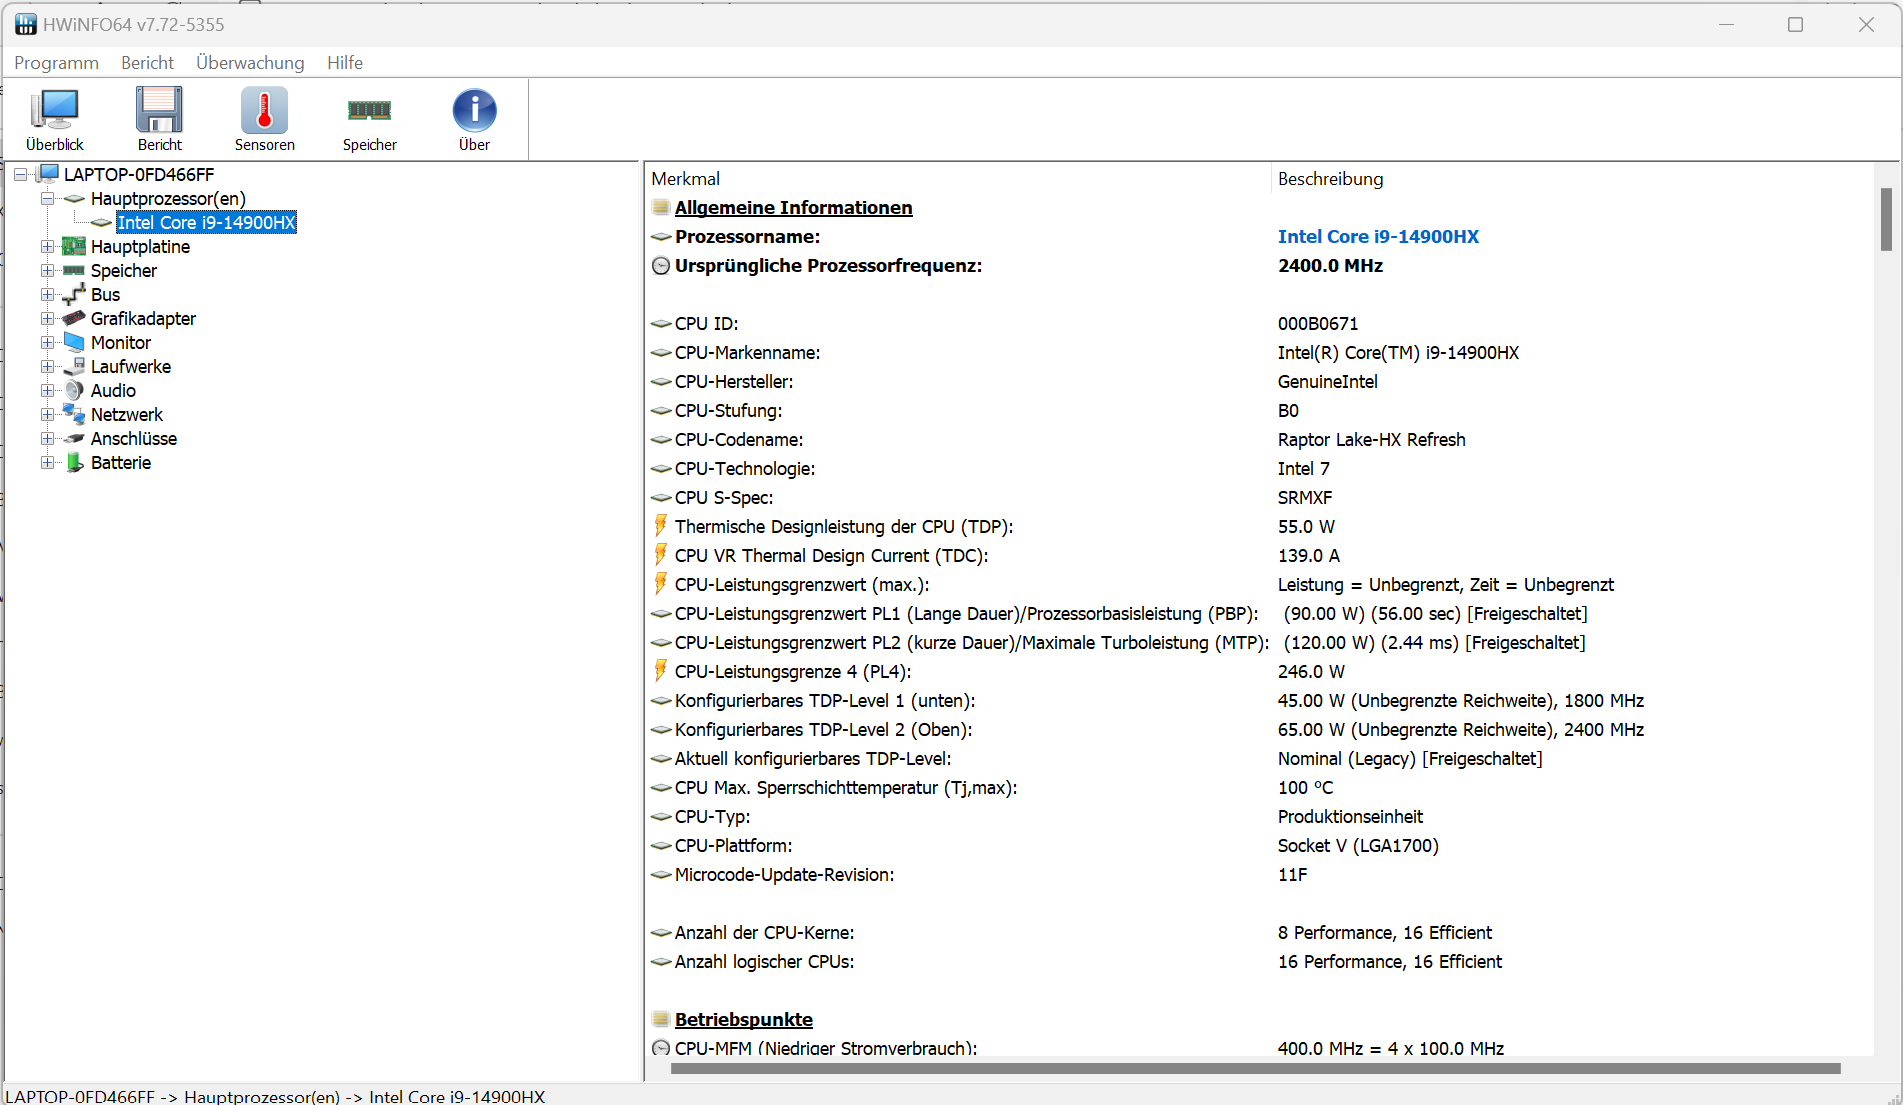
| Effektgräns 1 (HWInfo) | 90 watt | 110 watt | 125 watt | 110 watt | 65 watt | 65 watt |
| Effektgräns 2 (HWInfo) | 120 watt | 135 watt | 150 watt | 135 watt | 100 watt | 100 watt |
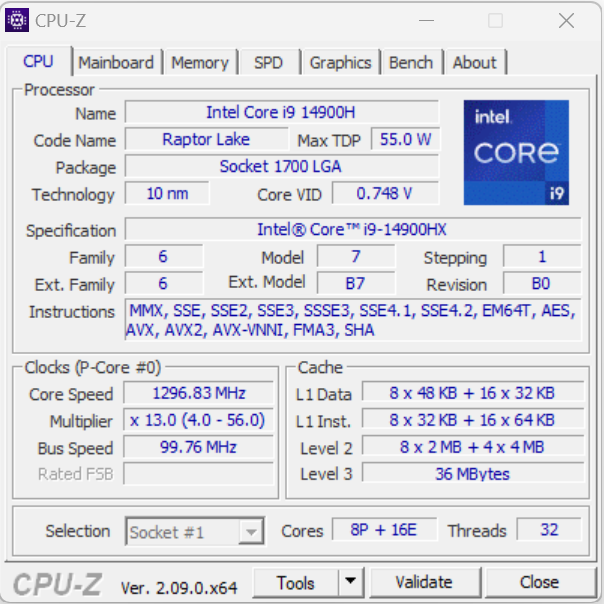
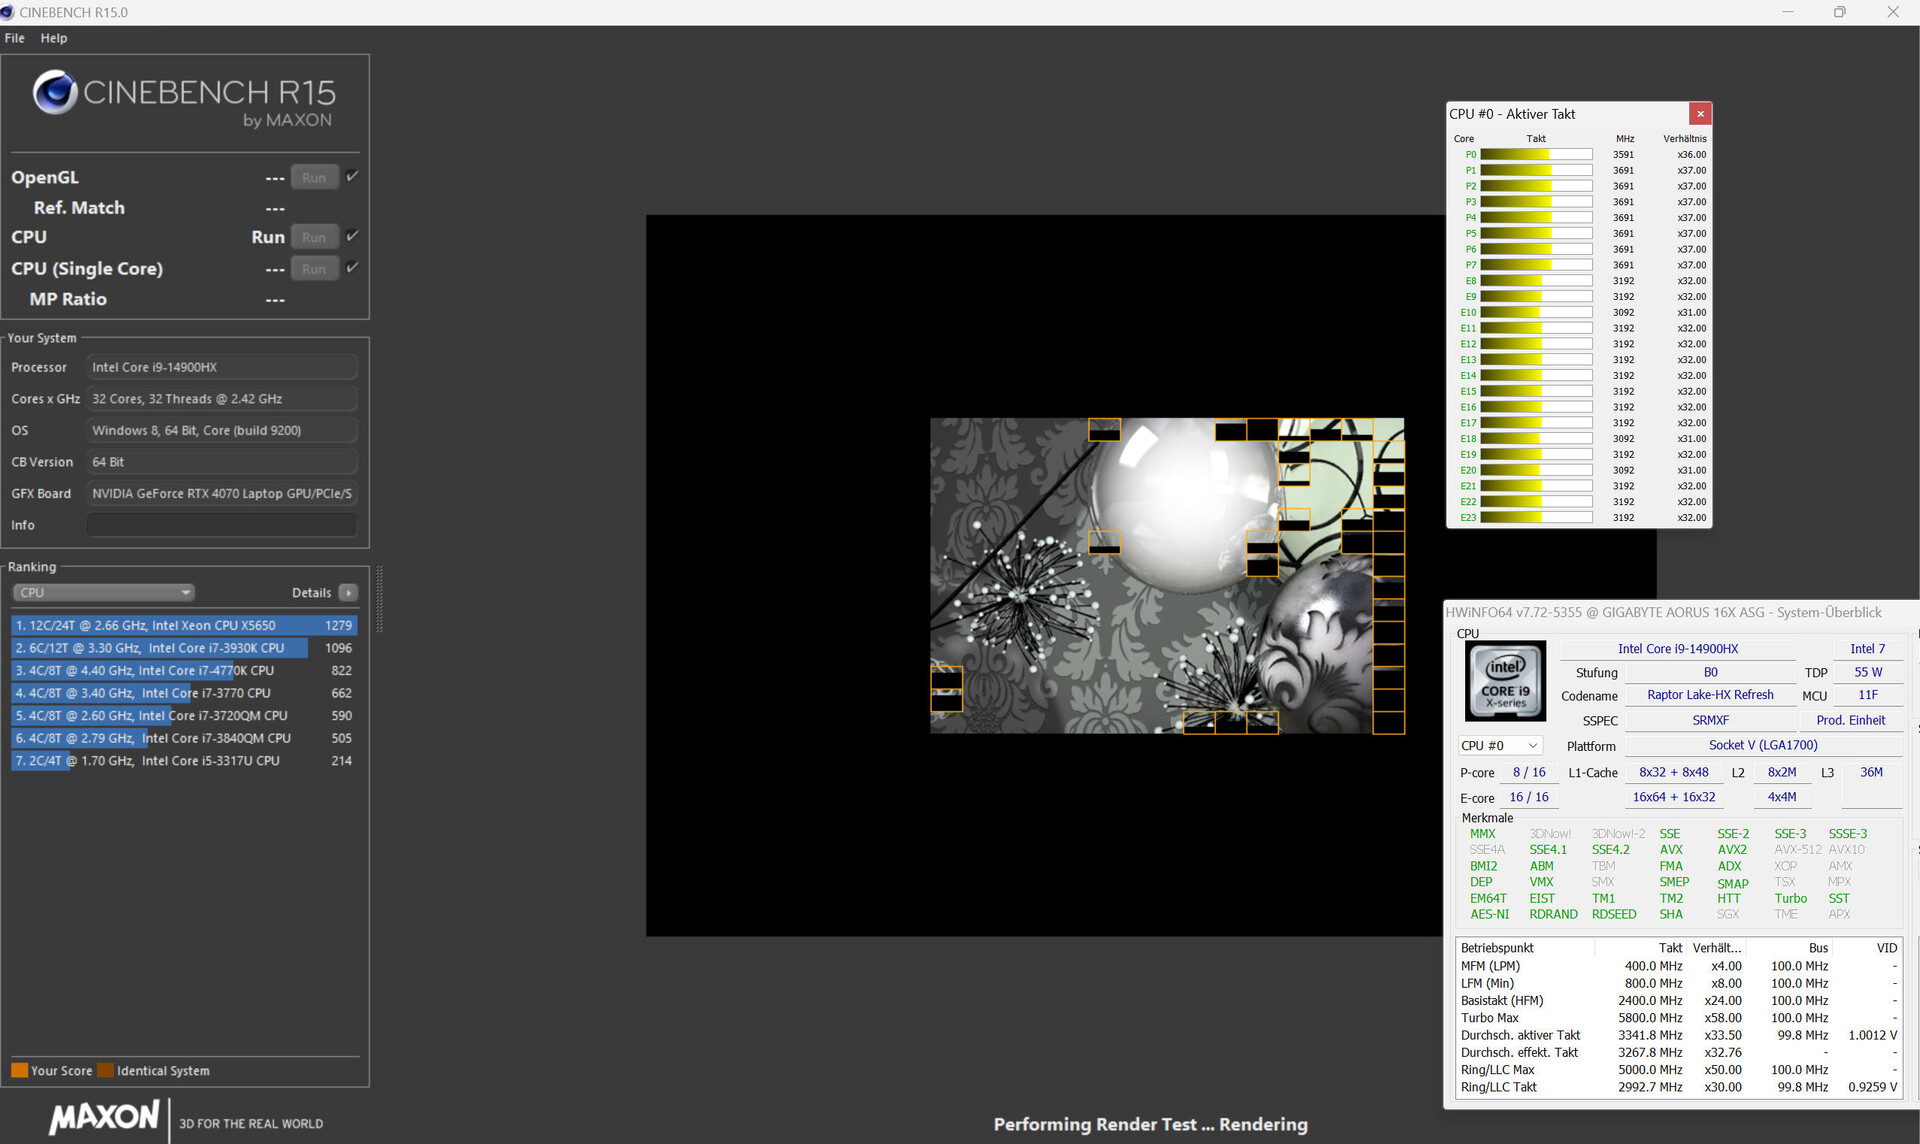
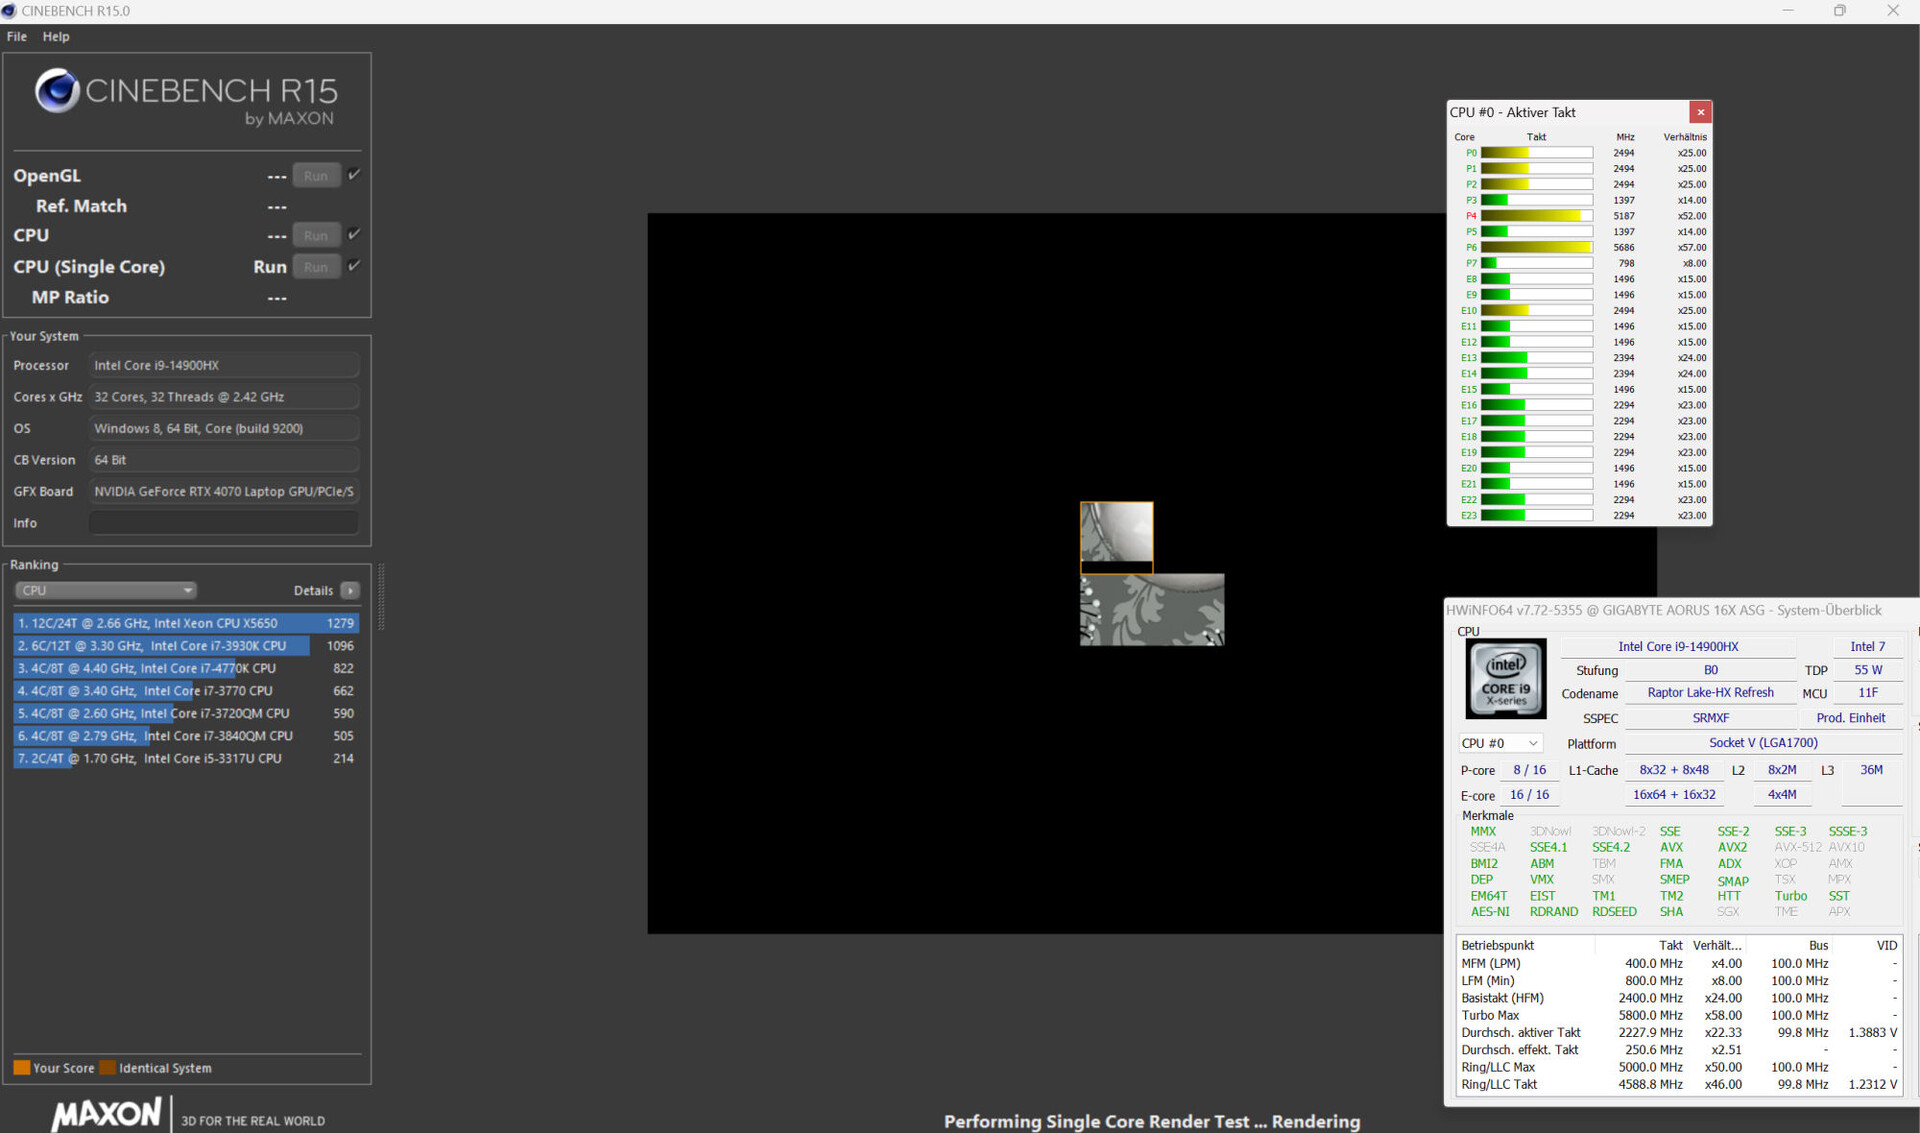
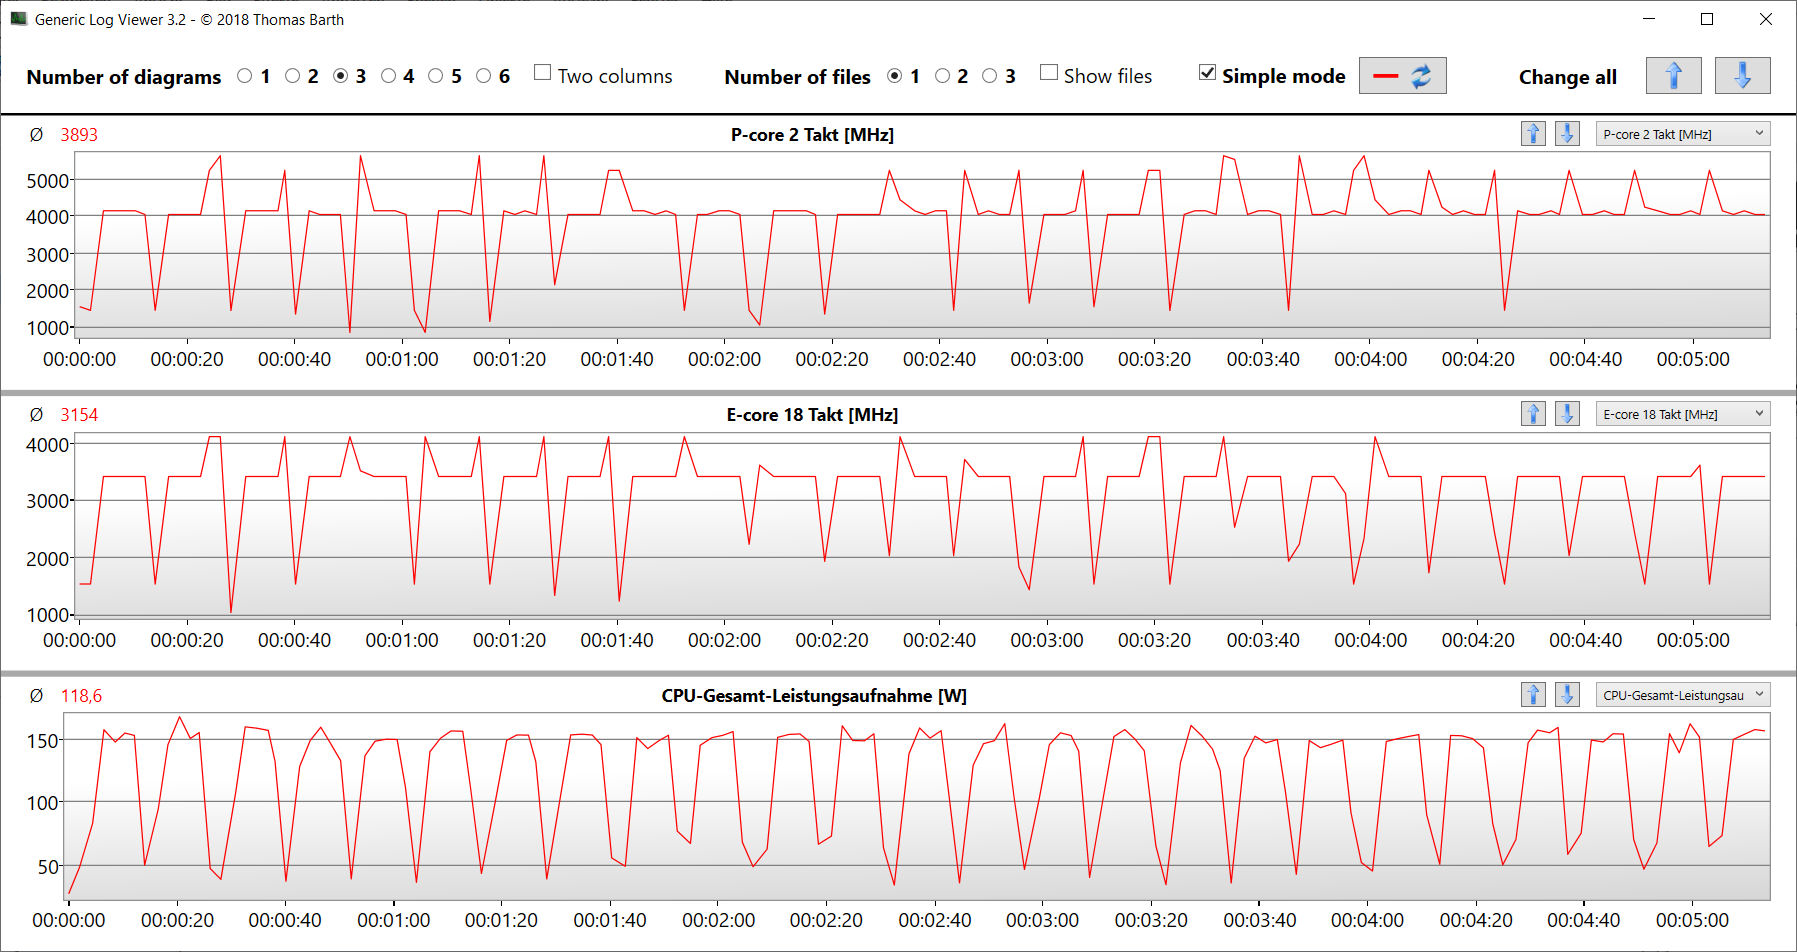
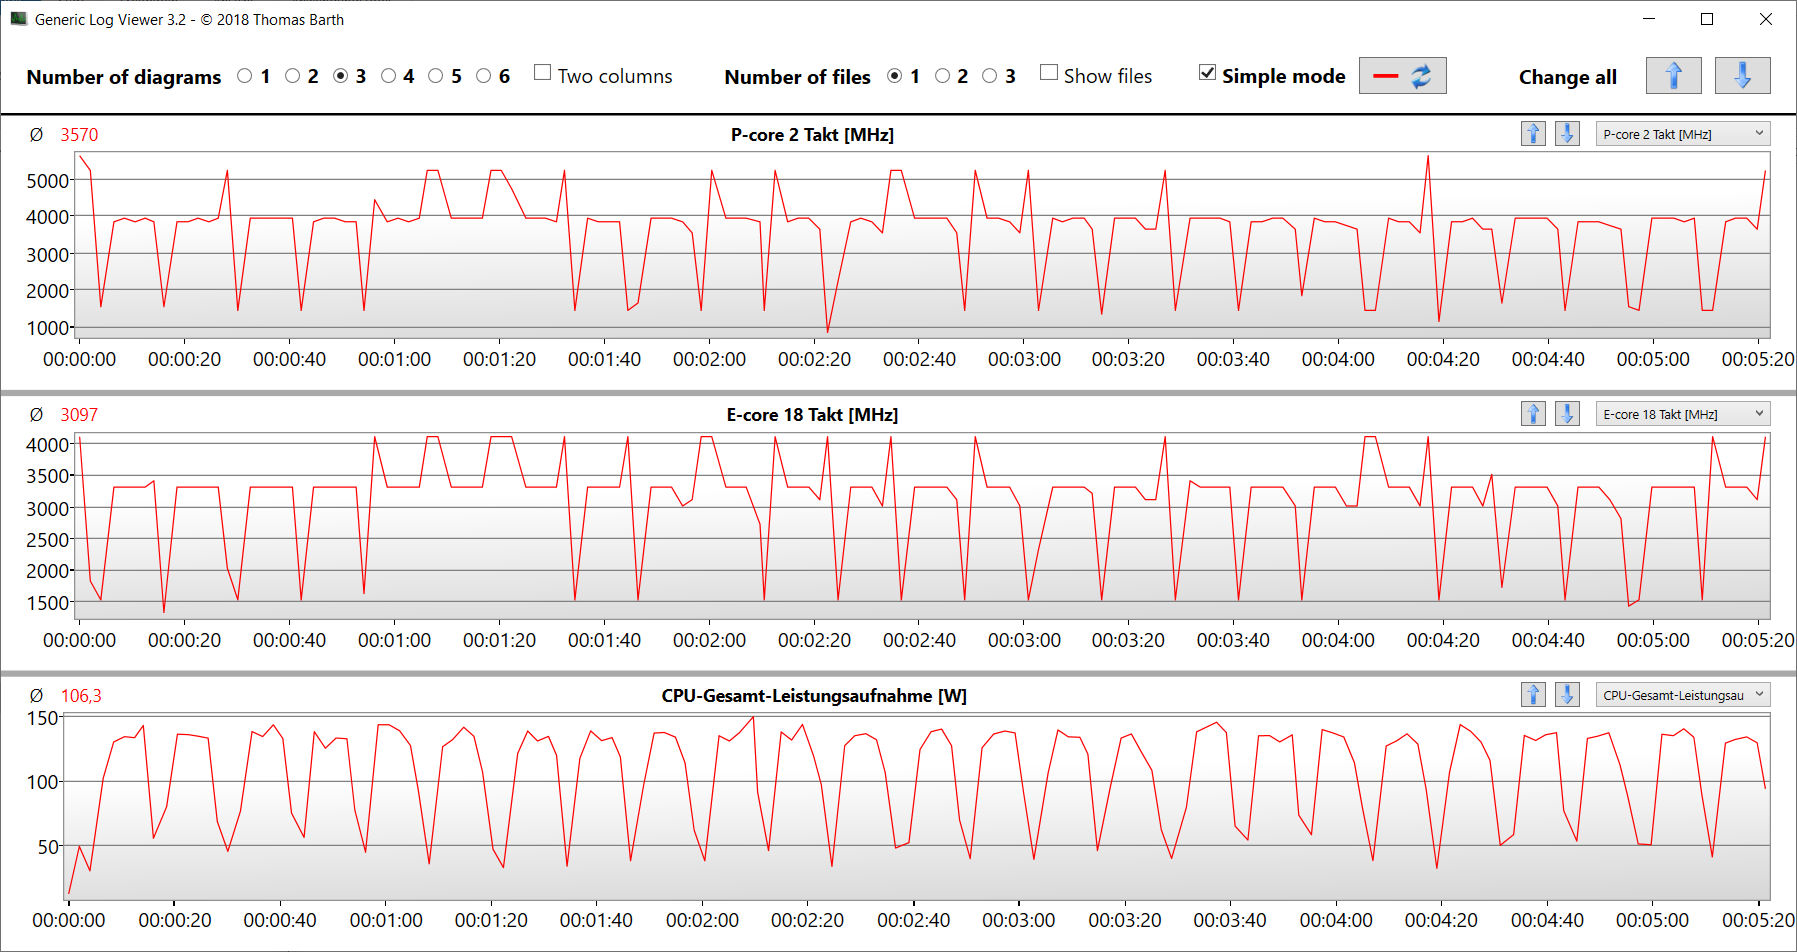
Processor
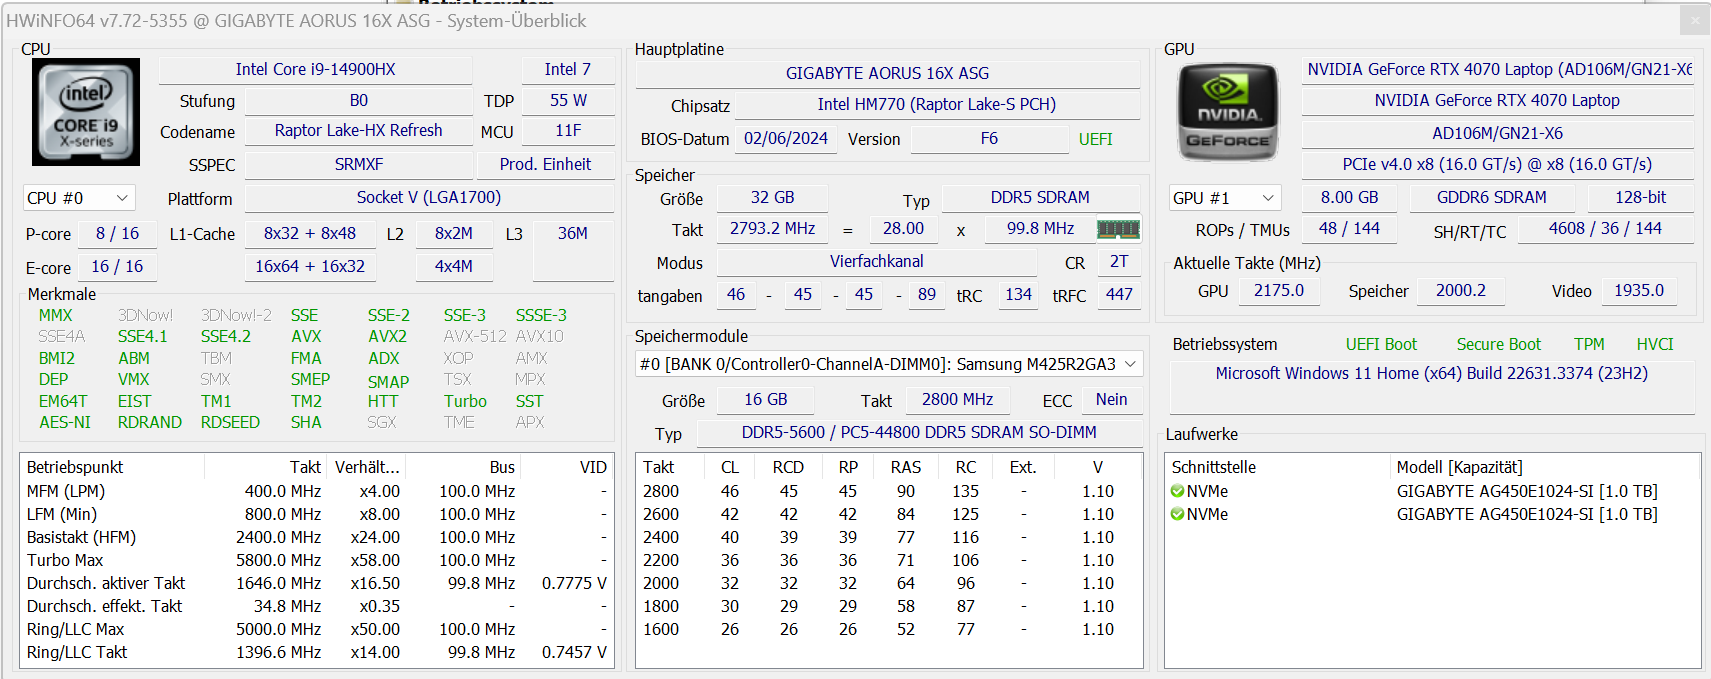
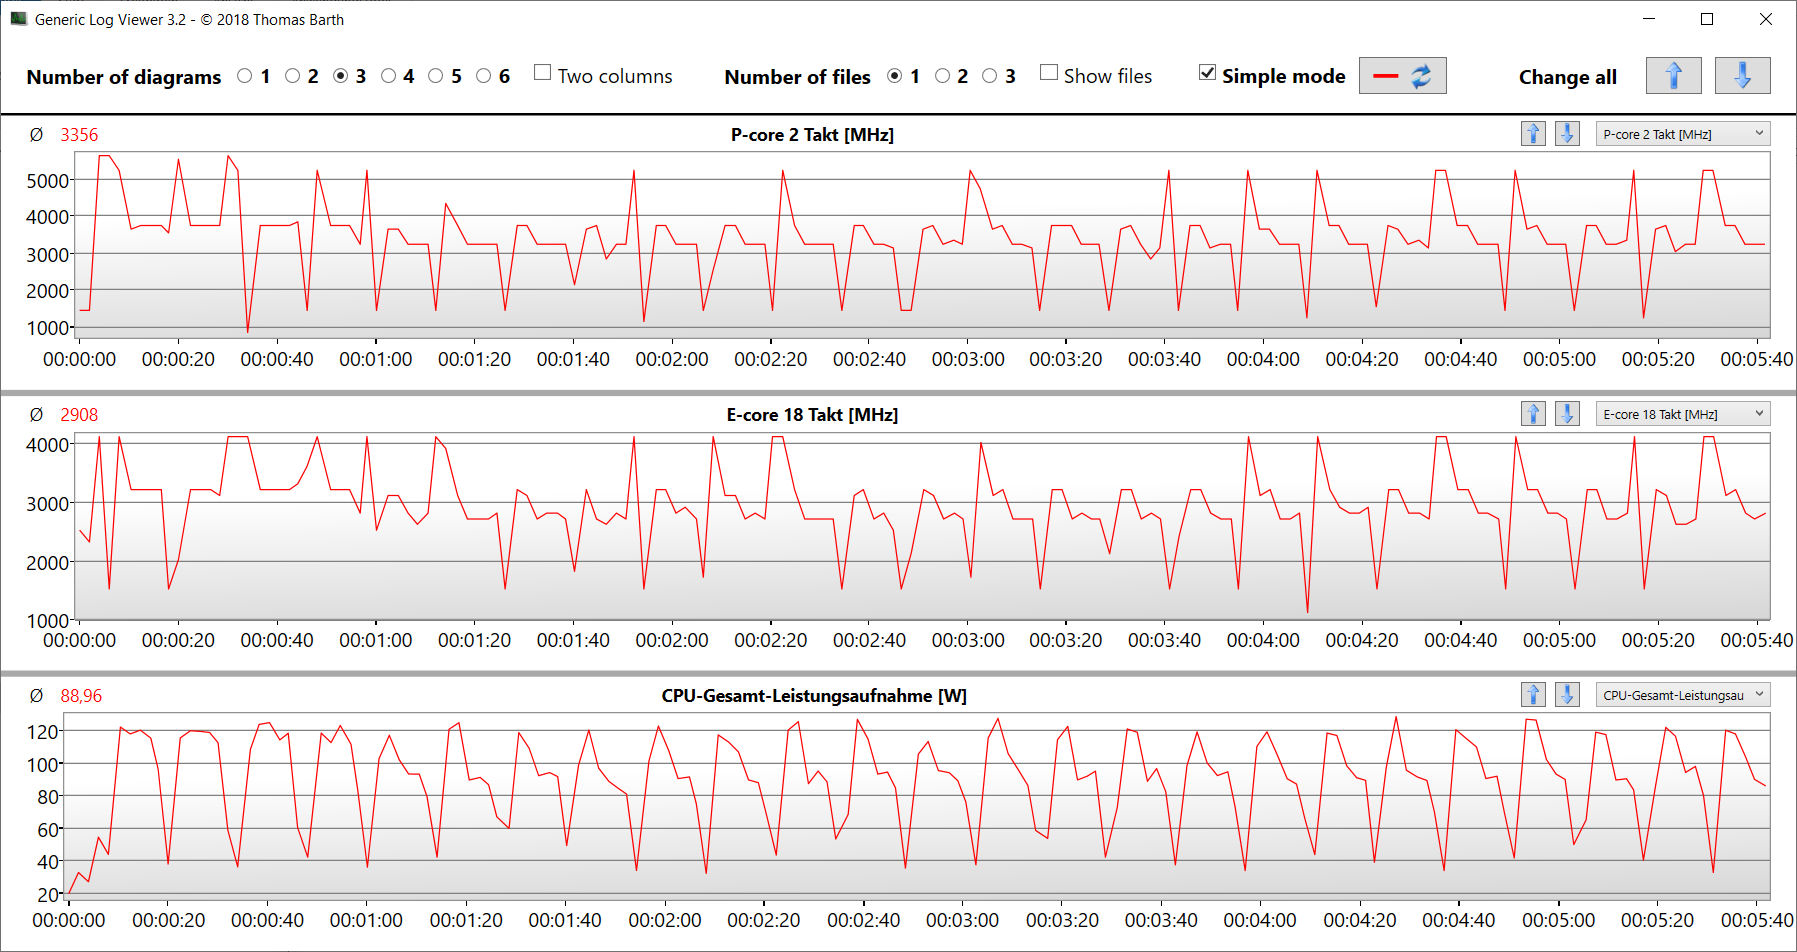
Core i9-14900HX Core i9-14900HX(Raptor Lake) 24 CPU-kärnor (8P + 16E = 32 trådar) uppnår en maximal klockfrekvens på 5,8 GHz (P) och 4,1 GHz (E). Kontinuerlig flertrådsbelastning (CB15 Loop) resulterade i att klockfrekvensen sjönk från den fjärde till den femte körningen. Därefter höll den en ganska stabil nivå. Profilerna Turbo, Gaming och Creator leder till en konsekvent högre prestandanivå.
Dess benchmarkresultat ligger i nivå med CPU:ns genomsnitt. I batteriläge sjönk den mer relevanta single-thread-prestandan (187 poäng; CB15) i mindre utsträckning än multi-thread-prestandan (1 533 poäng; CB15).
Cinebench R15 Multi continuous test
| Geekbench 6.7 | |
| Multi-Core | |
| Lenovo Legion Pro 5 16IRX9 (6.2.1) | |
| Aorus 16X 2024 (6.2.1, Turbo) | |
| Aorus 16X 2024 (6.2.1) | |
| Genomsnitt Intel Core i9-14900HX (13158 - 19665, n=37) | |
| HP Omen Transcend 16-u1095ng (6.2.1) | |
| Genomsnitt av klass Gaming (6625 - 22104, n=112, senaste 2 åren) | |
| Schenker XMG Pro 16 Studio (Mid 23) | |
| Alienware m16 R2 (6.2.1) | |
| Asus TUF Gaming A17 FA707XI-NS94 (6.2.1) | |
| Single-Core | |
| Aorus 16X 2024 (6.2.1, Turbo) | |
| Aorus 16X 2024 (6.2.1) | |
| Genomsnitt Intel Core i9-14900HX (2419 - 3129, n=37) | |
| Lenovo Legion Pro 5 16IRX9 (6.2.1) | |
| Genomsnitt av klass Gaming (1490 - 3259, n=112, senaste 2 åren) | |
| HP Omen Transcend 16-u1095ng (6.2.1) | |
| Asus TUF Gaming A17 FA707XI-NS94 (6.2.1) | |
| Schenker XMG Pro 16 Studio (Mid 23) | |
| Alienware m16 R2 (6.2.1) | |
| HWBOT x265 Benchmark v2.2 - 4k Preset | |
| Aorus 16X 2024 (Turbo) | |
| Lenovo Legion Pro 5 16IRX9 | |
| Genomsnitt Intel Core i9-14900HX (16.8 - 38.9, n=37) | |
| Genomsnitt av klass Gaming (11.5 - 44.3, n=111, senaste 2 åren) | |
| Aorus 16X 2024 | |
| HP Omen Transcend 16-u1095ng | |
| Asus TUF Gaming A17 FA707XI-NS94 | |
| Alienware m16 R2 | |
| Schenker XMG Pro 16 Studio (Mid 23) | |
| LibreOffice - 20 Documents To PDF | |
| HP Omen Transcend 16-u1095ng (6.3.4.2) | |
| Alienware m16 R2 (6.3.4.2) | |
| Asus TUF Gaming A17 FA707XI-NS94 (6.3.4.2) | |
| Genomsnitt av klass Gaming (19 - 88.8, n=111, senaste 2 åren) | |
| Schenker XMG Pro 16 Studio (Mid 23) | |
| Genomsnitt Intel Core i9-14900HX (19 - 85.1, n=37) | |
| Lenovo Legion Pro 5 16IRX9 (6.3.4.2) | |
| Aorus 16X 2024 (6.3.4.2) | |
| Aorus 16X 2024 (6.3.4.2, Turbo) | |
* ... mindre är bättre
AIDA64: FP32 Ray-Trace | FPU Julia | CPU SHA3 | CPU Queen | FPU SinJulia | FPU Mandel | CPU AES | CPU ZLib | FP64 Ray-Trace | CPU PhotoWorxx
| Performance rating | |
| Aorus 16X 2024 | |
| Lenovo Legion Pro 5 16IRX9 | |
| Genomsnitt Intel Core i9-14900HX | |
| Genomsnitt av klass Gaming | |
| Aorus 16X 2024 | |
| Asus TUF Gaming A17 FA707XI-NS94 | |
| HP Omen Transcend 16-u1095ng | |
| Schenker XMG Pro 16 Studio (Mid 23) | |
| Alienware m16 R2 | |
| AIDA64 / FP32 Ray-Trace | |
| Genomsnitt av klass Gaming (10227 - 85542, n=110, senaste 2 åren) | |
| Asus TUF Gaming A17 FA707XI-NS94 (v6.92.6600) | |
| Aorus 16X 2024 (v6.92.6600, Turbo) | |
| Lenovo Legion Pro 5 16IRX9 (v6.92.6600) | |
| Genomsnitt Intel Core i9-14900HX (13098 - 33474, n=36) | |
| Aorus 16X 2024 (v6.92.6600) | |
| Alienware m16 R2 (v6.92.6600) | |
| HP Omen Transcend 16-u1095ng (v6.92.6600) | |
| Schenker XMG Pro 16 Studio (Mid 23) (v6.75.6100) | |
| AIDA64 / FPU Julia | |
| Genomsnitt av klass Gaming (51376 - 238426, n=110, senaste 2 åren) | |
| Aorus 16X 2024 (v6.92.6600, Turbo) | |
| Lenovo Legion Pro 5 16IRX9 (v6.92.6600) | |
| Genomsnitt Intel Core i9-14900HX (67573 - 166040, n=36) | |
| Asus TUF Gaming A17 FA707XI-NS94 (v6.92.6600) | |
| Aorus 16X 2024 (v6.92.6600) | |
| Alienware m16 R2 (v6.92.6600) | |
| HP Omen Transcend 16-u1095ng (v6.92.6600) | |
| Schenker XMG Pro 16 Studio (Mid 23) (v6.75.6100) | |
| AIDA64 / CPU SHA3 | |
| Aorus 16X 2024 (v6.92.6600, Turbo) | |
| Lenovo Legion Pro 5 16IRX9 (v6.92.6600) | |
| Genomsnitt Intel Core i9-14900HX (3589 - 7979, n=36) | |
| Genomsnitt av klass Gaming (2180 - 9817, n=110, senaste 2 åren) | |
| Aorus 16X 2024 (v6.92.6600) | |
| Asus TUF Gaming A17 FA707XI-NS94 (v6.92.6600) | |
| HP Omen Transcend 16-u1095ng (v6.92.6600) | |
| Alienware m16 R2 (v6.92.6600) | |
| Schenker XMG Pro 16 Studio (Mid 23) (v6.75.6100) | |
| AIDA64 / CPU Queen | |
| Lenovo Legion Pro 5 16IRX9 (v6.92.6600) | |
| Aorus 16X 2024 (v6.92.6600, Turbo) | |
| Aorus 16X 2024 (v6.92.6600) | |
| Genomsnitt Intel Core i9-14900HX (118405 - 148966, n=36) | |
| Asus TUF Gaming A17 FA707XI-NS94 (v6.92.6600) | |
| HP Omen Transcend 16-u1095ng (v6.92.6600) | |
| Genomsnitt av klass Gaming (49785 - 173351, n=101, senaste 2 åren) | |
| Schenker XMG Pro 16 Studio (Mid 23) (v6.75.6100) | |
| Alienware m16 R2 (v6.92.6600) | |
| AIDA64 / FPU SinJulia | |
| Aorus 16X 2024 (v6.92.6600, Turbo) | |
| Asus TUF Gaming A17 FA707XI-NS94 (v6.92.6600) | |
| Lenovo Legion Pro 5 16IRX9 (v6.92.6600) | |
| Genomsnitt Intel Core i9-14900HX (10475 - 18517, n=36) | |
| Aorus 16X 2024 (v6.92.6600) | |
| Genomsnitt av klass Gaming (4424 - 33636, n=110, senaste 2 åren) | |
| HP Omen Transcend 16-u1095ng (v6.92.6600) | |
| Alienware m16 R2 (v6.92.6600) | |
| Schenker XMG Pro 16 Studio (Mid 23) (v6.75.6100) | |
| AIDA64 / FPU Mandel | |
| Genomsnitt av klass Gaming (25115 - 128721, n=110, senaste 2 åren) | |
| Aorus 16X 2024 (v6.92.6600, Turbo) | |
| Asus TUF Gaming A17 FA707XI-NS94 (v6.92.6600) | |
| Lenovo Legion Pro 5 16IRX9 (v6.92.6600) | |
| Genomsnitt Intel Core i9-14900HX (32543 - 83662, n=36) | |
| Aorus 16X 2024 (v6.92.6600) | |
| Alienware m16 R2 (v6.92.6600) | |
| HP Omen Transcend 16-u1095ng (v6.92.6600) | |
| Schenker XMG Pro 16 Studio (Mid 23) (v6.75.6100) | |
| AIDA64 / CPU AES | |
| Schenker XMG Pro 16 Studio (Mid 23) (v6.75.6100) | |
| Genomsnitt Intel Core i9-14900HX (86964 - 241777, n=36) | |
| Aorus 16X 2024 (v6.92.6600, Turbo) | |
| Lenovo Legion Pro 5 16IRX9 (v6.92.6600) | |
| Aorus 16X 2024 (v6.92.6600) | |
| Genomsnitt av klass Gaming (39258 - 247074, n=110, senaste 2 åren) | |
| Asus TUF Gaming A17 FA707XI-NS94 (v6.92.6600) | |
| HP Omen Transcend 16-u1095ng (v6.92.6600) | |
| Alienware m16 R2 (v6.92.6600) | |
| AIDA64 / CPU ZLib | |
| Aorus 16X 2024 (v6.92.6600, Turbo) | |
| Lenovo Legion Pro 5 16IRX9 (v6.92.6600) | |
| Genomsnitt Intel Core i9-14900HX (1054 - 2292, n=36) | |
| Aorus 16X 2024 (v6.92.6600) | |
| Genomsnitt av klass Gaming (574 - 2531, n=110, senaste 2 åren) | |
| HP Omen Transcend 16-u1095ng (v6.92.6600) | |
| Alienware m16 R2 (v6.92.6600) | |
| Asus TUF Gaming A17 FA707XI-NS94 (v6.92.6600) | |
| Schenker XMG Pro 16 Studio (Mid 23) (v6.75.6100) | |
| AIDA64 / FP64 Ray-Trace | |
| Genomsnitt av klass Gaming (5509 - 45446, n=110, senaste 2 åren) | |
| Asus TUF Gaming A17 FA707XI-NS94 (v6.92.6600) | |
| Aorus 16X 2024 (v6.92.6600, Turbo) | |
| Lenovo Legion Pro 5 16IRX9 (v6.92.6600) | |
| Genomsnitt Intel Core i9-14900HX (6809 - 18349, n=36) | |
| Aorus 16X 2024 (v6.92.6600) | |
| Alienware m16 R2 (v6.92.6600) | |
| HP Omen Transcend 16-u1095ng (v6.92.6600) | |
| Schenker XMG Pro 16 Studio (Mid 23) (v6.75.6100) | |
| AIDA64 / CPU PhotoWorxx | |
| Lenovo Legion Pro 5 16IRX9 (v6.92.6600) | |
| HP Omen Transcend 16-u1095ng (v6.92.6600) | |
| Aorus 16X 2024 (v6.92.6600, Turbo) | |
| Aorus 16X 2024 (v6.92.6600) | |
| Schenker XMG Pro 16 Studio (Mid 23) (v6.75.6100) | |
| Genomsnitt Intel Core i9-14900HX (23903 - 54702, n=36) | |
| Genomsnitt av klass Gaming (12271 - 89891, n=110, senaste 2 åren) | |
| Alienware m16 R2 (v6.92.6600) | |
| Asus TUF Gaming A17 FA707XI-NS94 (v6.92.6600) | |
Systemets prestanda
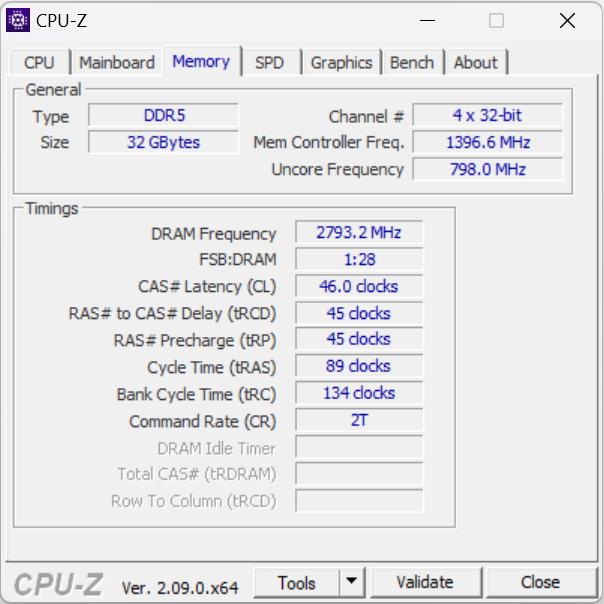
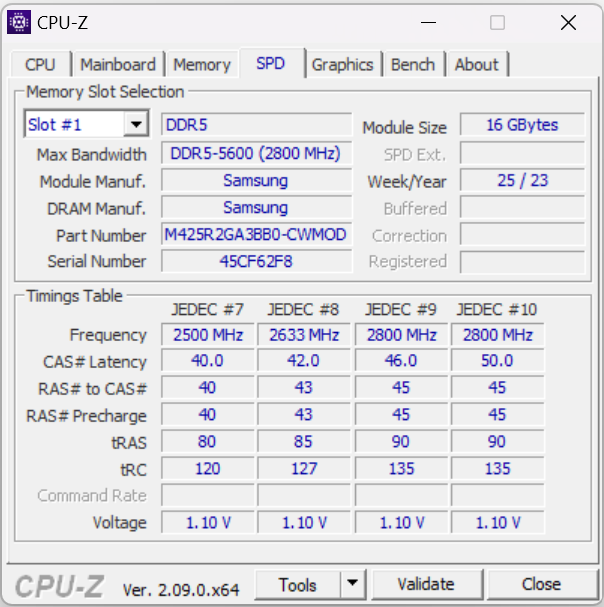
Det smidiga systemet saknar inte datorkraft. Spel, streaming och rendering utgör inga större utmaningar för den bärbara datorn. RAM-minnets överföringshastigheter ligger på en normal nivå för DDR5-5600 RAM-minne.
CrossMark: Overall | Productivity | Creativity | Responsiveness
WebXPRT 3: Overall
WebXPRT 4: Overall
Mozilla Kraken 1.1: Total
| PCMark 10 / Score | |
| Lenovo Legion Pro 5 16IRX9 | |
| Aorus 16X 2024 | |
| Genomsnitt av klass Gaming (5828 - 11574, n=96, senaste 2 åren) | |
| Genomsnitt Intel Core i9-14900HX, NVIDIA GeForce RTX 4070 Laptop GPU (7768 - 8550, n=8) | |
| Asus TUF Gaming A17 FA707XI-NS94 | |
| Schenker XMG Pro 16 Studio (Mid 23) | |
| HP Omen Transcend 16-u1095ng | |
| Alienware m16 R2 | |
| PCMark 10 / Essentials | |
| Schenker XMG Pro 16 Studio (Mid 23) | |
| Lenovo Legion Pro 5 16IRX9 | |
| Aorus 16X 2024 | |
| Asus TUF Gaming A17 FA707XI-NS94 | |
| Genomsnitt Intel Core i9-14900HX, NVIDIA GeForce RTX 4070 Laptop GPU (10104 - 11815, n=8) | |
| Genomsnitt av klass Gaming (8810 - 12600, n=100, senaste 2 åren) | |
| HP Omen Transcend 16-u1095ng | |
| Alienware m16 R2 | |
| PCMark 10 / Productivity | |
| Aorus 16X 2024 | |
| Genomsnitt av klass Gaming (6845 - 18766, n=98, senaste 2 åren) | |
| Genomsnitt Intel Core i9-14900HX, NVIDIA GeForce RTX 4070 Laptop GPU (9577 - 11103, n=8) | |
| Schenker XMG Pro 16 Studio (Mid 23) | |
| HP Omen Transcend 16-u1095ng | |
| Lenovo Legion Pro 5 16IRX9 | |
| Asus TUF Gaming A17 FA707XI-NS94 | |
| Alienware m16 R2 | |
| PCMark 10 / Digital Content Creation | |
| Lenovo Legion Pro 5 16IRX9 | |
| Genomsnitt av klass Gaming (7602 - 19657, n=98, senaste 2 åren) | |
| Asus TUF Gaming A17 FA707XI-NS94 | |
| Genomsnitt Intel Core i9-14900HX, NVIDIA GeForce RTX 4070 Laptop GPU (12114 - 14827, n=8) | |
| Aorus 16X 2024 | |
| Alienware m16 R2 | |
| HP Omen Transcend 16-u1095ng | |
| Schenker XMG Pro 16 Studio (Mid 23) | |
| CrossMark / Overall | |
| Aorus 16X 2024 | |
| Genomsnitt Intel Core i9-14900HX, NVIDIA GeForce RTX 4070 Laptop GPU (2002 - 2312, n=7) | |
| Lenovo Legion Pro 5 16IRX9 | |
| Genomsnitt av klass Gaming (1366 - 2409, n=98, senaste 2 åren) | |
| Schenker XMG Pro 16 Studio (Mid 23) | |
| Asus TUF Gaming A17 FA707XI-NS94 | |
| Alienware m16 R2 | |
| CrossMark / Productivity | |
| Aorus 16X 2024 | |
| Genomsnitt Intel Core i9-14900HX, NVIDIA GeForce RTX 4070 Laptop GPU (1827 - 2191, n=7) | |
| Schenker XMG Pro 16 Studio (Mid 23) | |
| Genomsnitt av klass Gaming (1386 - 2254, n=98, senaste 2 åren) | |
| Lenovo Legion Pro 5 16IRX9 | |
| Asus TUF Gaming A17 FA707XI-NS94 | |
| Alienware m16 R2 | |
| CrossMark / Creativity | |
| Aorus 16X 2024 | |
| Genomsnitt Intel Core i9-14900HX, NVIDIA GeForce RTX 4070 Laptop GPU (2258 - 2458, n=7) | |
| Lenovo Legion Pro 5 16IRX9 | |
| Genomsnitt av klass Gaming (1343 - 2729, n=98, senaste 2 åren) | |
| Schenker XMG Pro 16 Studio (Mid 23) | |
| Asus TUF Gaming A17 FA707XI-NS94 | |
| Alienware m16 R2 | |
| CrossMark / Responsiveness | |
| Aorus 16X 2024 | |
| Genomsnitt Intel Core i9-14900HX, NVIDIA GeForce RTX 4070 Laptop GPU (1734 - 2330, n=7) | |
| Schenker XMG Pro 16 Studio (Mid 23) | |
| Lenovo Legion Pro 5 16IRX9 | |
| Genomsnitt av klass Gaming (1226 - 2334, n=98, senaste 2 åren) | |
| Alienware m16 R2 | |
| Asus TUF Gaming A17 FA707XI-NS94 | |
| WebXPRT 3 / Overall | |
| HP Omen Transcend 16-u1095ng | |
| Aorus 16X 2024 | |
| Lenovo Legion Pro 5 16IRX9 | |
| Genomsnitt Intel Core i9-14900HX, NVIDIA GeForce RTX 4070 Laptop GPU (269 - 342, n=8) | |
| Schenker XMG Pro 16 Studio (Mid 23) | |
| Asus TUF Gaming A17 FA707XI-NS94 | |
| Genomsnitt av klass Gaming (242 - 532, n=101, senaste 2 åren) | |
| Alienware m16 R2 | |
| WebXPRT 4 / Overall | |
| Genomsnitt Intel Core i9-14900HX, NVIDIA GeForce RTX 4070 Laptop GPU (291 - 304, n=6) | |
| Lenovo Legion Pro 5 16IRX9 | |
| Genomsnitt av klass Gaming (176.4 - 354, n=101, senaste 2 åren) | |
| Asus TUF Gaming A17 FA707XI-NS94 | |
| Alienware m16 R2 | |
| Mozilla Kraken 1.1 / Total | |
| Alienware m16 R2 | |
| Schenker XMG Pro 16 Studio (Mid 23) | |
| Asus TUF Gaming A17 FA707XI-NS94 | |
| Genomsnitt av klass Gaming (391 - 590, n=106, senaste 2 åren) | |
| Lenovo Legion Pro 5 16IRX9 | |
| Genomsnitt Intel Core i9-14900HX, NVIDIA GeForce RTX 4070 Laptop GPU (431 - 469, n=8) | |
| HP Omen Transcend 16-u1095ng | |
| Aorus 16X 2024 | |
* ... mindre är bättre
| PCMark 10 Score | 8389 poäng | |
Hjälp | ||
| AIDA64 / Memory Copy | |
| Lenovo Legion Pro 5 16IRX9 | |
| Aorus 16X 2024 | |
| HP Omen Transcend 16-u1095ng | |
| Genomsnitt Intel Core i9-14900HX (38028 - 83392, n=36) | |
| Genomsnitt av klass Gaming (21750 - 129946, n=110, senaste 2 åren) | |
| Schenker XMG Pro 16 Studio (Mid 23) | |
| Alienware m16 R2 | |
| Asus TUF Gaming A17 FA707XI-NS94 | |
| AIDA64 / Memory Read | |
| Aorus 16X 2024 | |
| Lenovo Legion Pro 5 16IRX9 | |
| HP Omen Transcend 16-u1095ng | |
| Genomsnitt Intel Core i9-14900HX (43306 - 87568, n=36) | |
| Alienware m16 R2 | |
| Schenker XMG Pro 16 Studio (Mid 23) | |
| Genomsnitt av klass Gaming (22956 - 118858, n=110, senaste 2 åren) | |
| Asus TUF Gaming A17 FA707XI-NS94 | |
| AIDA64 / Memory Write | |
| HP Omen Transcend 16-u1095ng | |
| Aorus 16X 2024 | |
| Lenovo Legion Pro 5 16IRX9 | |
| Genomsnitt av klass Gaming (22297 - 135096, n=110, senaste 2 åren) | |
| Asus TUF Gaming A17 FA707XI-NS94 | |
| Genomsnitt Intel Core i9-14900HX (37146 - 80589, n=36) | |
| Schenker XMG Pro 16 Studio (Mid 23) | |
| Alienware m16 R2 | |
| AIDA64 / Memory Latency | |
| Alienware m16 R2 | |
| Genomsnitt av klass Gaming (75.3 - 259, n=110, senaste 2 åren) | |
| Asus TUF Gaming A17 FA707XI-NS94 | |
| Schenker XMG Pro 16 Studio (Mid 23) | |
| HP Omen Transcend 16-u1095ng | |
| Genomsnitt Intel Core i9-14900HX (76.1 - 105, n=36) | |
| Lenovo Legion Pro 5 16IRX9 | |
| Aorus 16X 2024 | |
* ... mindre är bättre
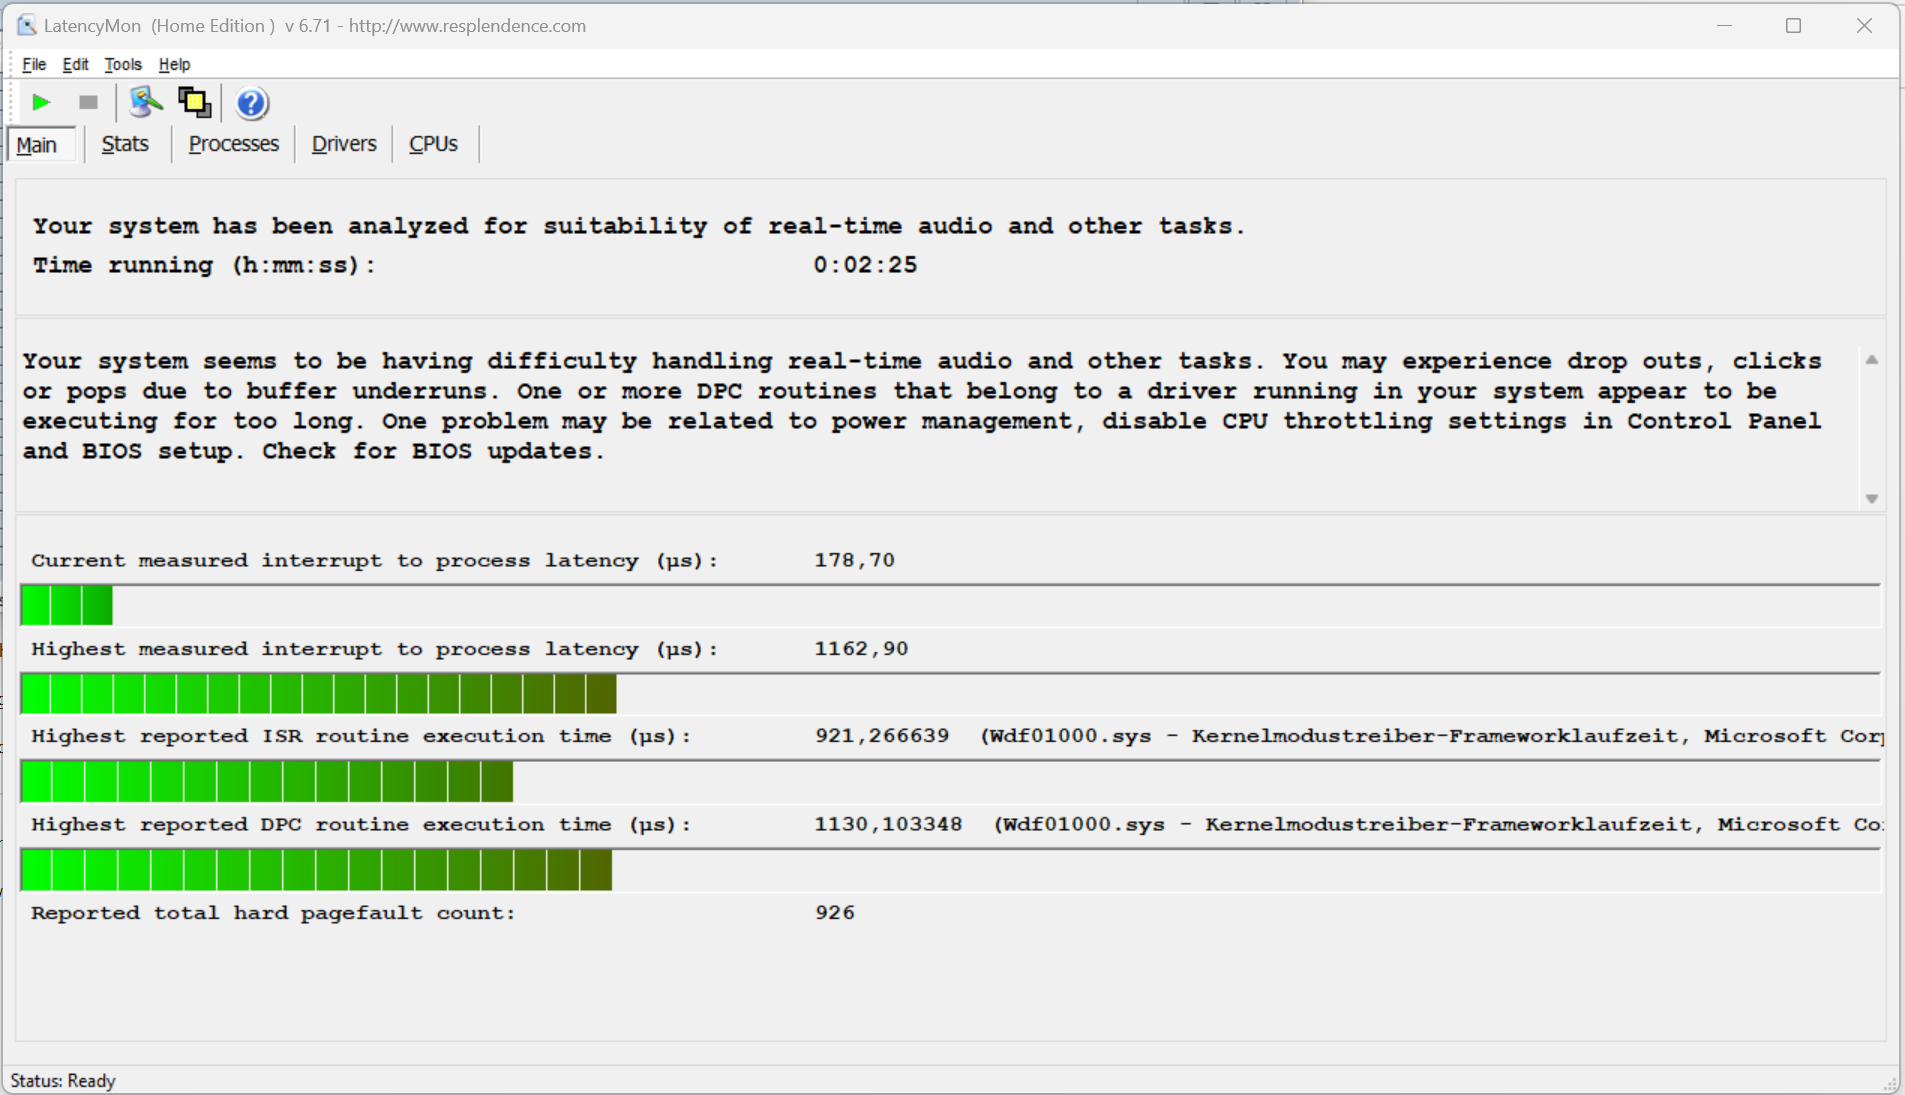
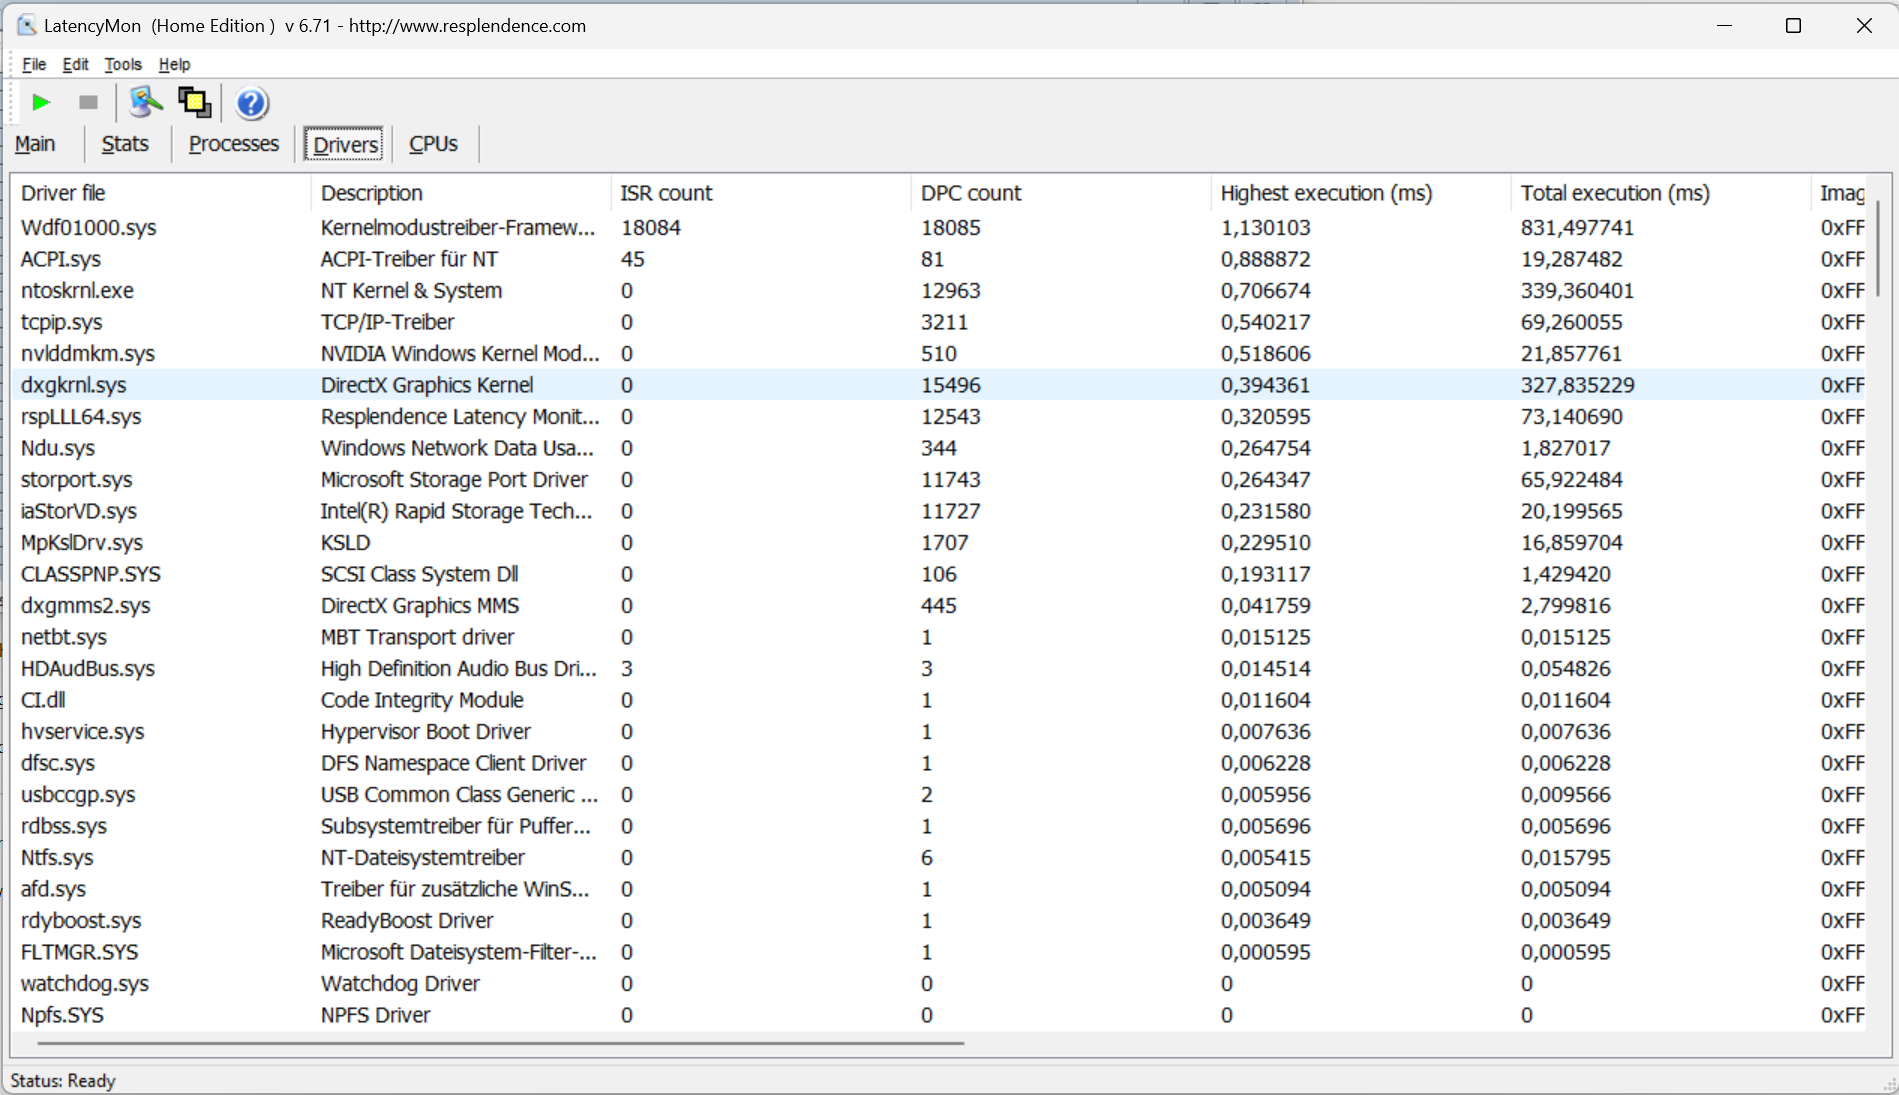
DPC-fördröjningar
Det standardiserade Latency Monitor-testet (webbsurfning, uppspelning av 4k-video, Prime95 hög belastning) avslöjade några avvikelser. Systemet verkar inte vara lämpligt för video- och ljudredigering i realtid. Framtida programuppdateringar kan leda till förbättringar eller till och med försämringar.
| DPC Latencies / LatencyMon - interrupt to process latency (max), Web, Youtube, Prime95 | |
| Alienware m16 R2 | |
| Schenker XMG Pro 16 Studio (Mid 23) | |
| Asus TUF Gaming A17 FA707XI-NS94 | |
| HP Omen Transcend 16-u1095ng | |
| Aorus 16X 2024 | |
| Lenovo Legion Pro 5 16IRX9 | |
* ... mindre är bättre
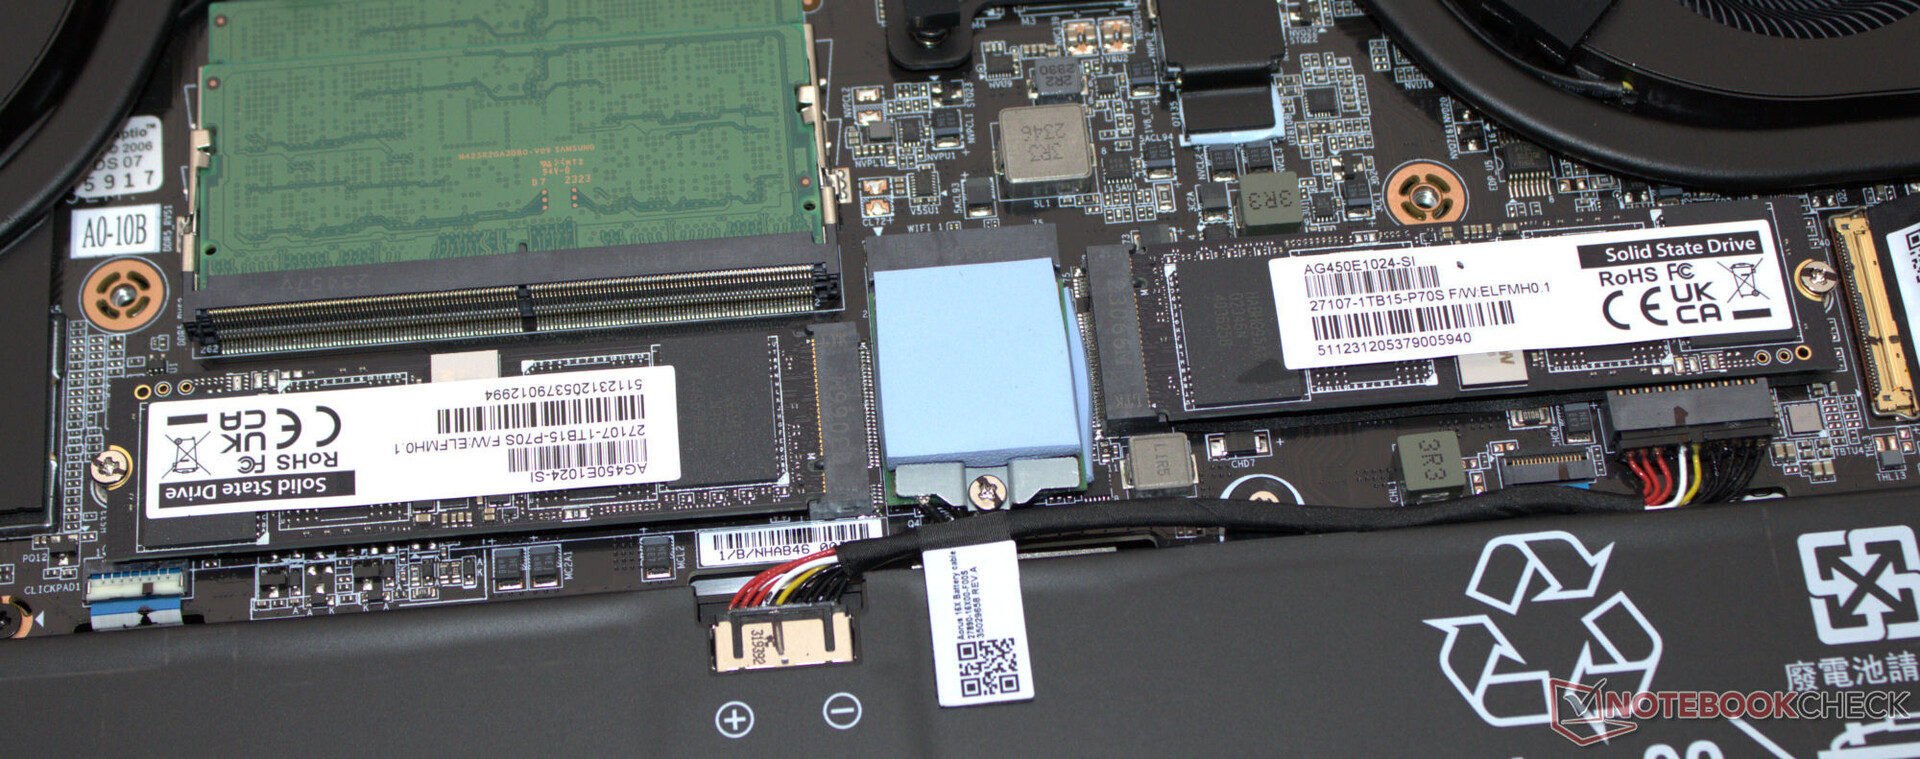
Lagringsenheter
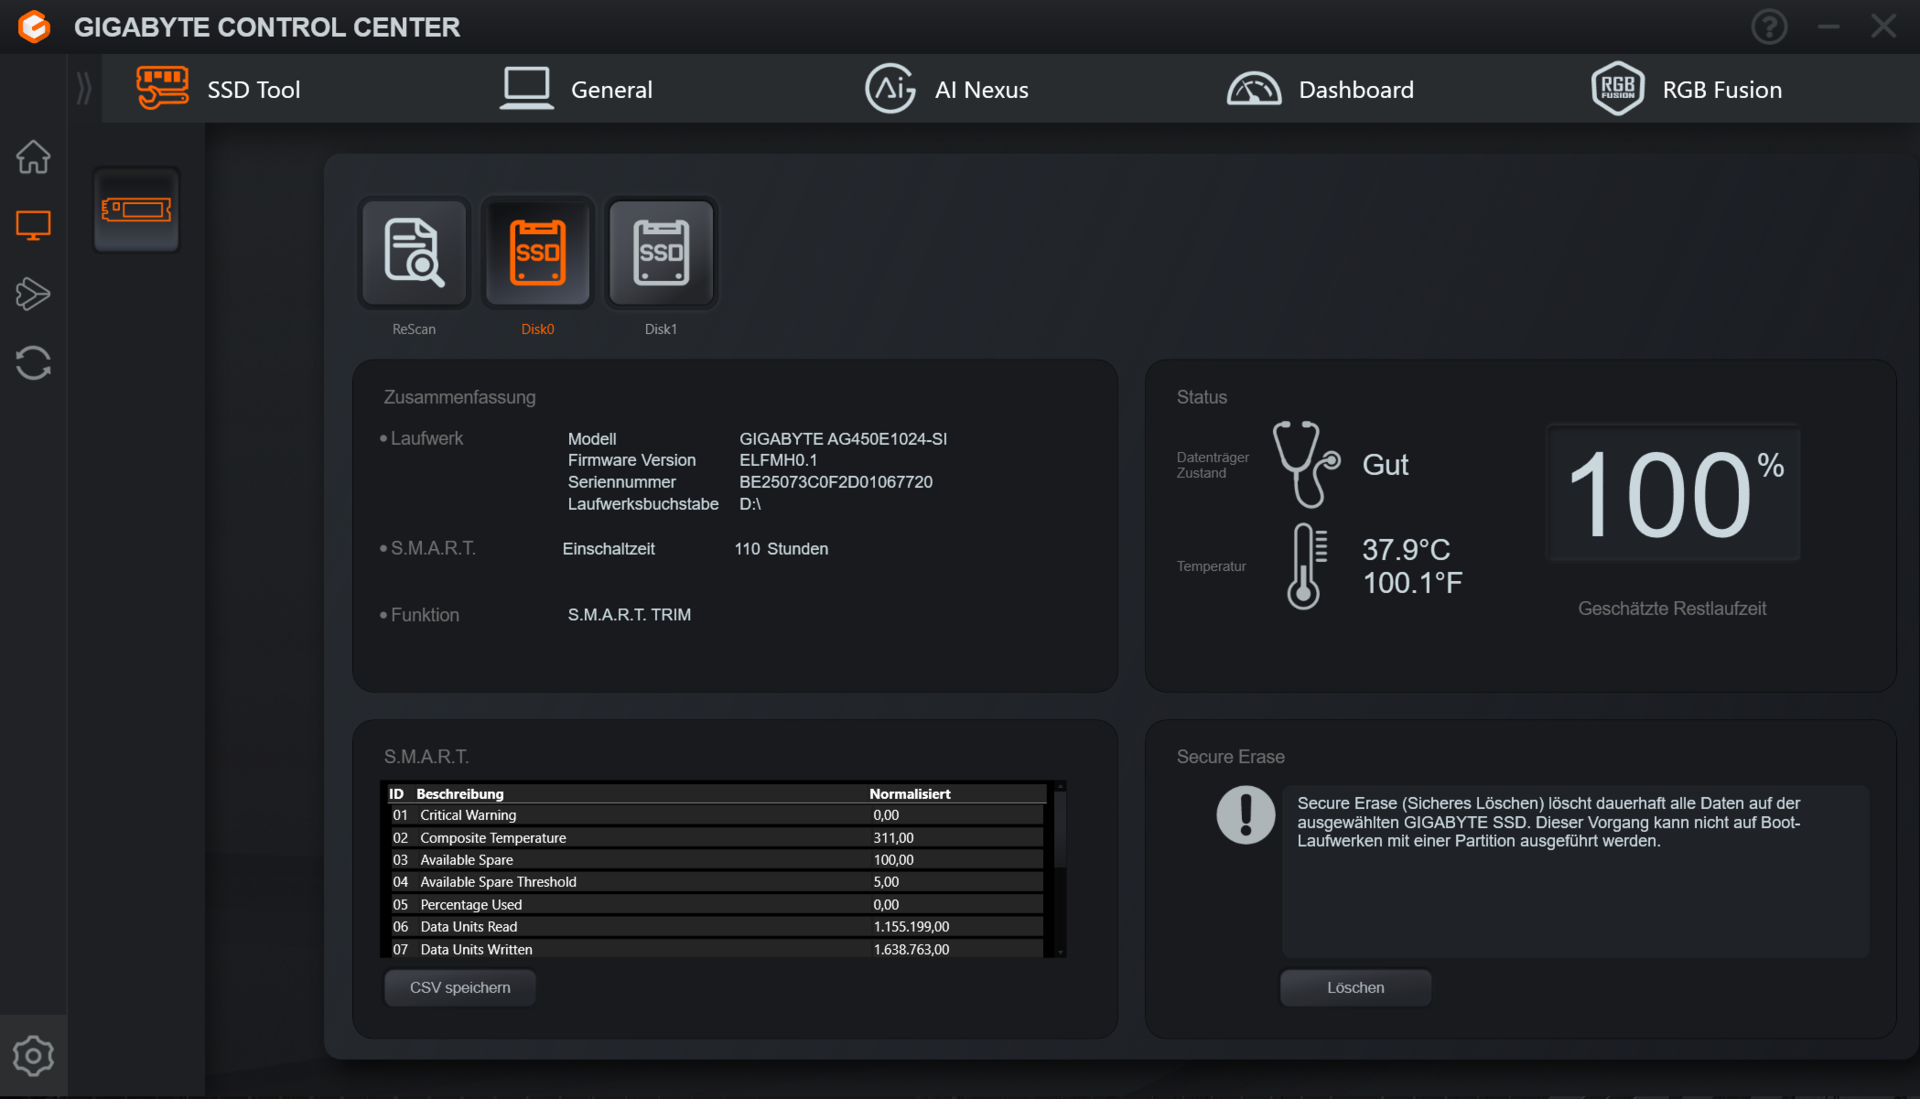
16X har två PCIe 4 SSD-enheter med 1 TB lagringsutrymme vardera (M.2-2280) - de bildar inte en RAID-array. En SSD fungerar som systemenhet, den andra som datalagring - båda uppnår mycket bra datahastigheter. Vi noterade inga minskningar på grund av termisk strypning.
16X har generellt stöd för RAID. Det motsvarande alternativet måste dock först aktiveras i BIOS, varefter Windows måste installeras om. Denna procedur rekommenderas inte för oerfarna.

* ... mindre är bättre
Reading continuous performance: DiskSpd Read Loop, Queue Depth 8
Grafikkort
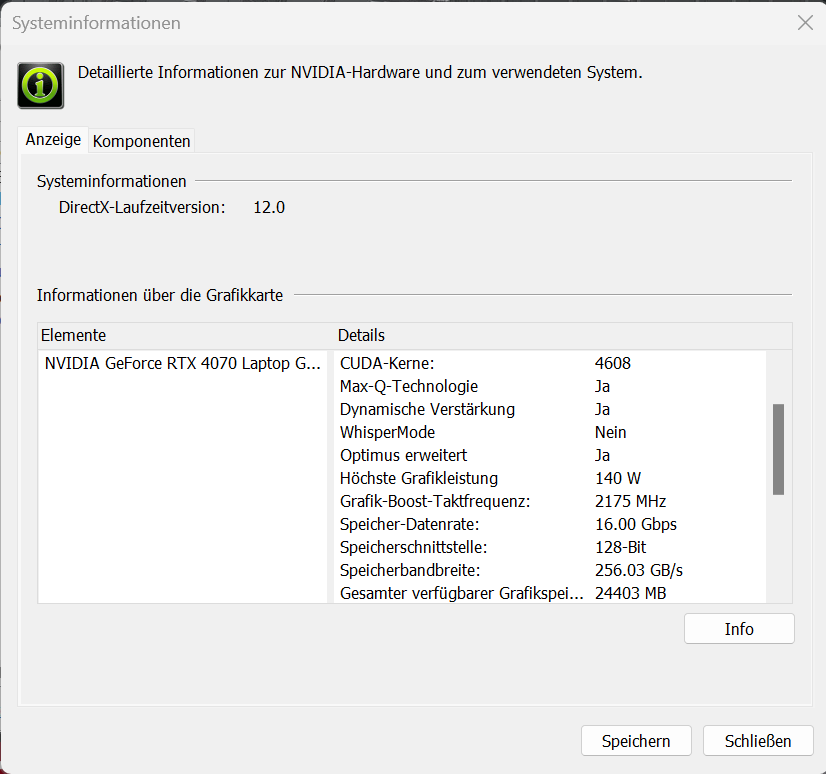
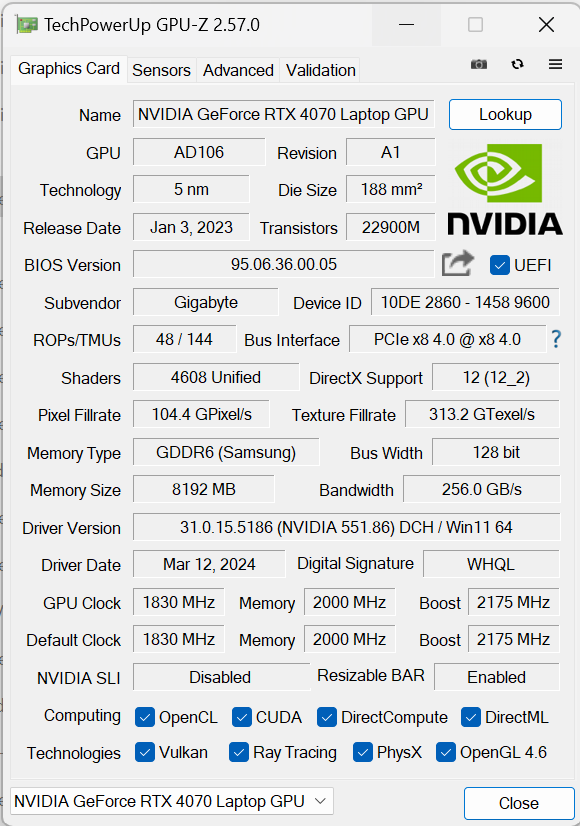
Gigabyte har ställt in den installerade GeForce RTX 4070till 140 watt (115 watt + 25 watt Dynamic Boost) - mer specificeras inte av Nvidia. GPU:n har 8 GB VRAM (GDDR6) tillgängligt - lite i underkant för dagens krav. Dess benchmarkresultat var något över RTX-4070-genomsnittet(Standard), de mer kraftfulla profilerna ger en liten boost på sin höjd. Att växla mellan dGPU och Optimus kräver ingen omstart av systemet. Avancerad Optimus stöds.


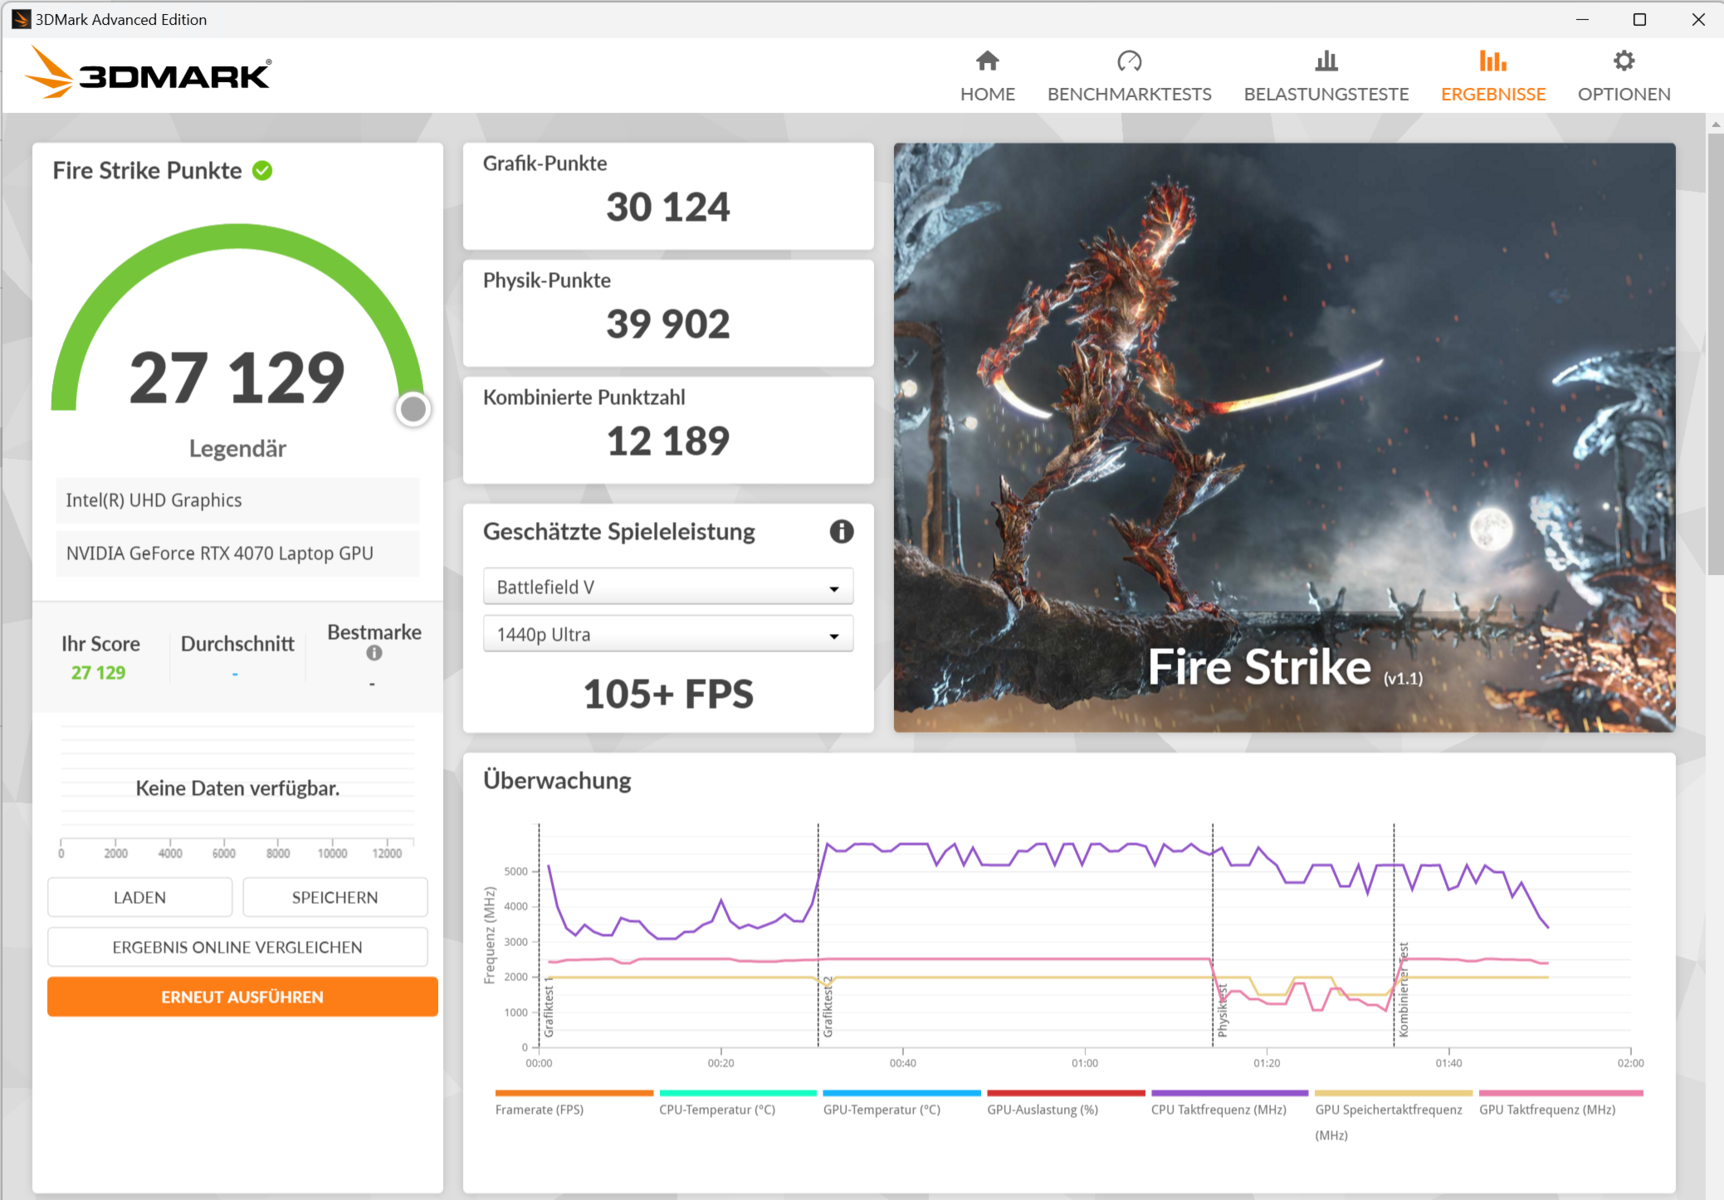
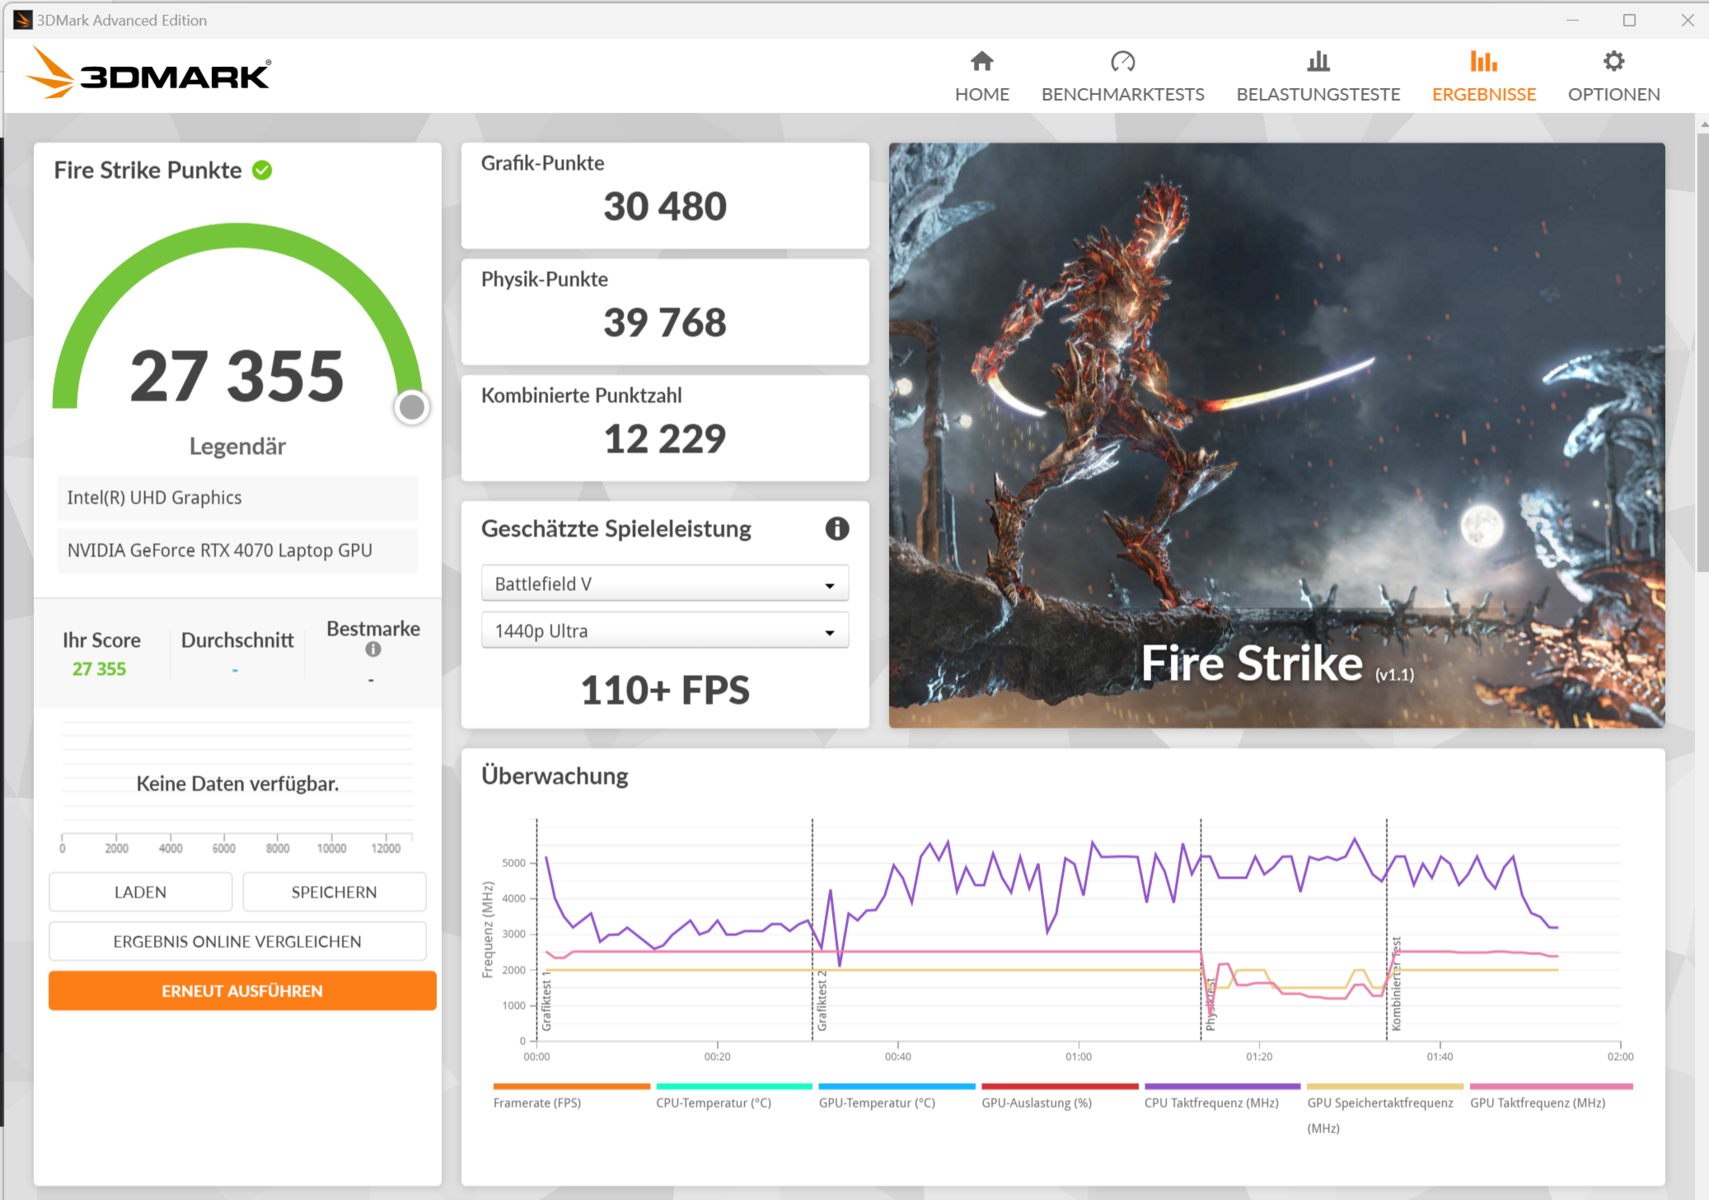
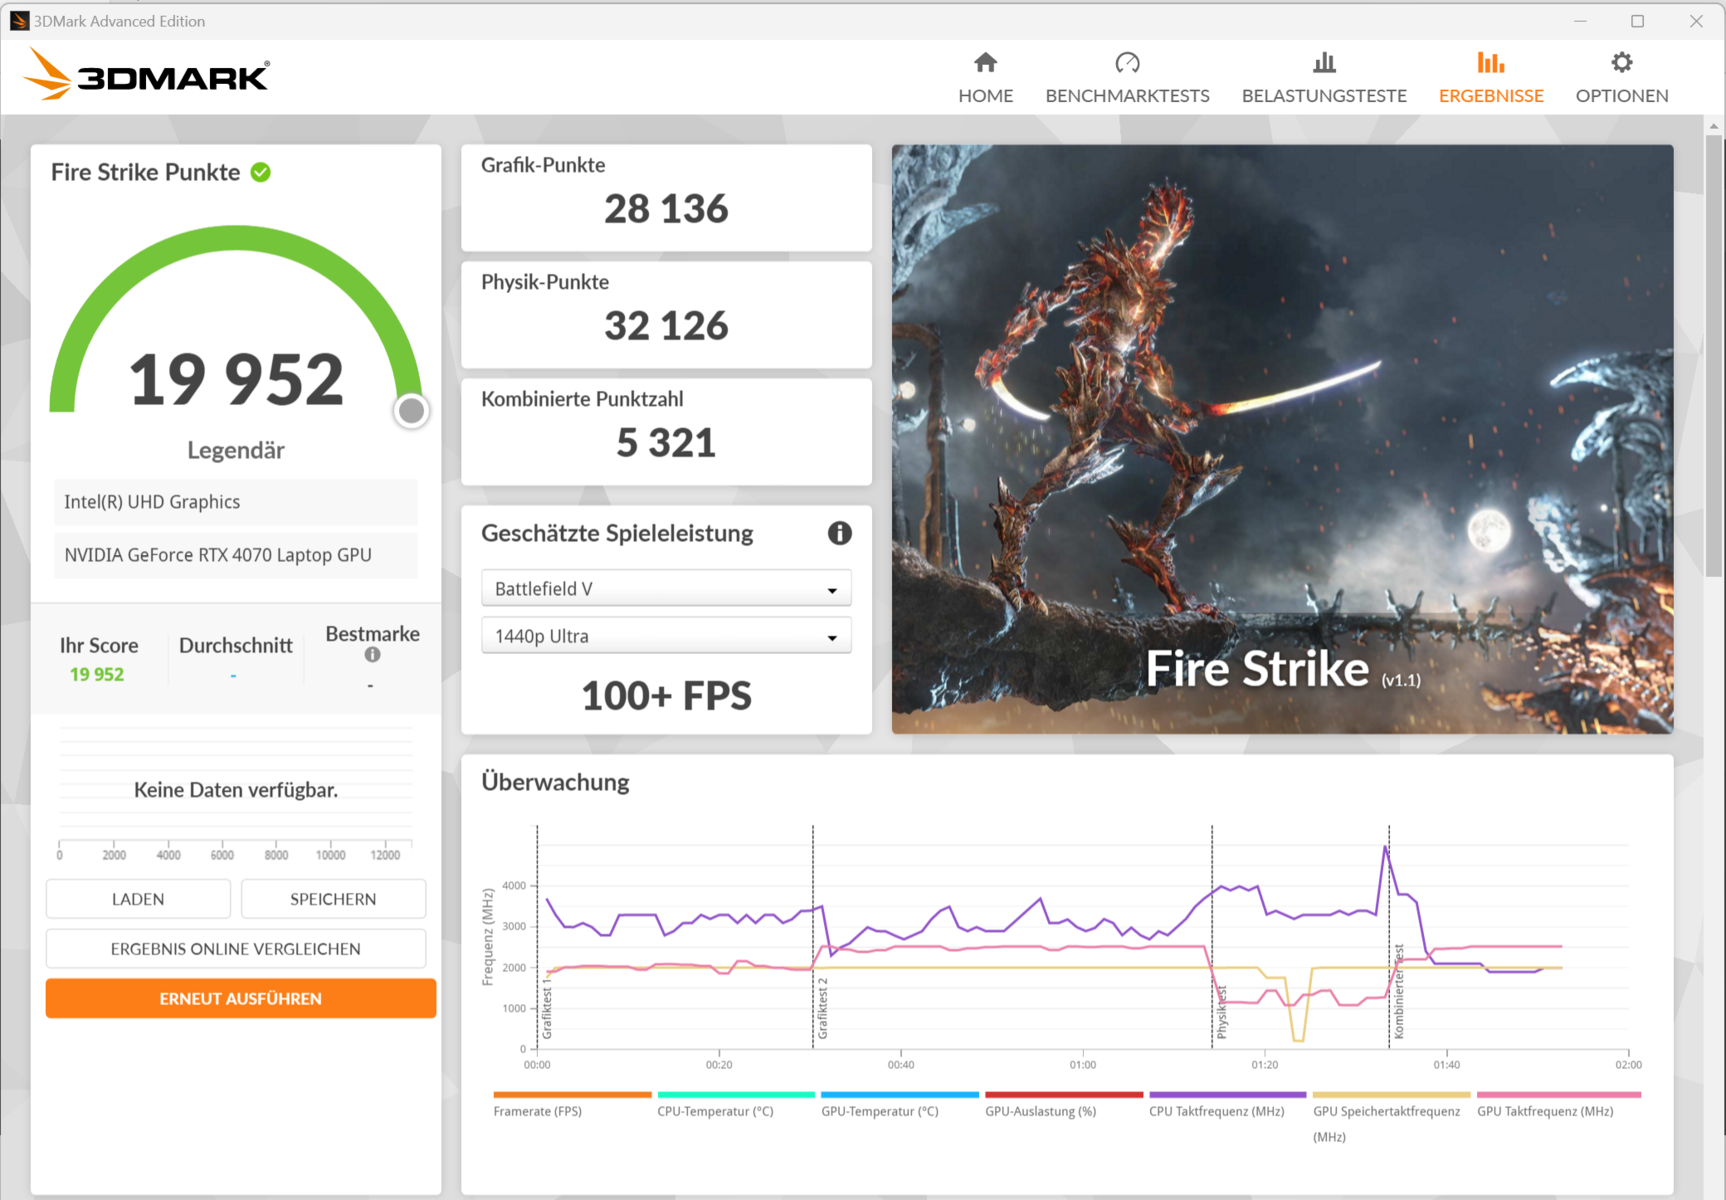

| 3DMark 11 Performance | 35473 poäng | |
| 3DMark Fire Strike Score | 23487 poäng | |
| 3DMark Time Spy Score | 12612 poäng | |
Hjälp | ||
* ... mindre är bättre
Spelprestanda
Grafikkärnan möjliggör QHD-spel med höga till maximala inställningar. Detta resulterar i bildfrekvenser över det tidigare RTX 4070-genomsnittet(Standard); de mer kraftfulla profilerna kan i bästa fall resultera i en liten ökning. Med DLSS 3 och Frame Generation kan maximala inställningar inklusive ray tracing också vara möjliga vid högre upplösningar - men bara för spel som stöder dessa.
| The Witcher 3 - 1920x1080 Ultra Graphics & Postprocessing (HBAO+) | |
| Genomsnitt av klass Gaming (95 - 240, n=8, senaste 2 åren) | |
| Lenovo Legion Pro 5 16IRX9 | |
| Aorus 16X 2024 | |
| Alienware m16 R2 | |
| Asus TUF Gaming A17 FA707XI-NS94 | |
| Schenker XMG Pro 16 Studio (Mid 23) | |
| HP Omen Transcend 16-u1095ng | |
| Genomsnitt NVIDIA GeForce RTX 4070 Laptop GPU (69.8 - 133.7, n=57) | |
| Horizon Forbidden West | |
| 1920x1080 Very High Preset AA:T | |
| Genomsnitt av klass Gaming (14.7 - 140.3, n=13, senaste 2 åren) | |
| Aorus 16X 2024 | |
| XMG Pro 15 E23 | |
| Genomsnitt NVIDIA GeForce RTX 4070 Laptop GPU (53.2 - 76.7, n=10) | |
| 2560x1440 Very High Preset AA:T | |
| Genomsnitt av klass Gaming (39.6 - 100.9, n=10, senaste 2 åren) | |
| Aorus 16X 2024 | |
| XMG Pro 15 E23 | |
| Genomsnitt NVIDIA GeForce RTX 4070 Laptop GPU (40.3 - 59.1, n=9) | |
| Alone in the Dark | |
| 1920x1080 High Preset | |
| XMG Pro 15 E23 | |
| Genomsnitt NVIDIA GeForce RTX 4070 Laptop GPU (125.8 - 196.5, n=5) | |
| Aorus 16X 2024 | |
| Genomsnitt av klass Gaming (n=1senaste 2 åren) | |
| 2560x1440 Cinematic Preset | |
| XMG Pro 15 E23 | |
| Genomsnitt NVIDIA GeForce RTX 4070 Laptop GPU (37.4 - 76.6, n=5) | |
| Aorus 16X 2024 | |
| Skull & Bones | |
| 1920x1080 Ultra High Preset AA:T | |
| Aorus 16X 2024 | |
| Genomsnitt NVIDIA GeForce RTX 4070 Laptop GPU (75 - 81, n=3) | |
| XMG Pro 15 E23 | |
| 2560x1440 Ultra High Preset AA:T | |
| Aorus 16X 2024 | |
| Genomsnitt NVIDIA GeForce RTX 4070 Laptop GPU (56 - 63, n=3) | |
| XMG Pro 15 E23 | |
| Last Epoch | |
| 1920x1080 Ultra Preset AA:T | |
| XMG Pro 15 E23 | |
| Genomsnitt NVIDIA GeForce RTX 4070 Laptop GPU (133.8 - 140, n=2) | |
| Aorus 16X 2024 | |
| Genomsnitt av klass Gaming (n=1senaste 2 åren) | |
| 2560x1440 Ultra Preset AA:T | |
| XMG Pro 15 E23 | |
| Genomsnitt NVIDIA GeForce RTX 4070 Laptop GPU (80.4 - 81.1, n=2) | |
| Aorus 16X 2024 | |
| Genomsnitt av klass Gaming (n=1senaste 2 åren) | |
För att kontrollera om enhetens bildfrekvens förblir i stort sett konstant under en längre tid körde vi spelet The Witcher 3 i cirka 60 minuter i Full HD-upplösning och med maximala kvalitetsinställningar. Spelkaraktären flyttades inte. Det fanns ingen märkbar minskning av bildfrekvensen.
Witcher 3 FPS diagram
| låg | med. | hög | ultra | QHD | |
|---|---|---|---|---|---|
| GTA V (2015) | 187.5 | 187 | 176.5 | 107.2 | 90.5 |
| The Witcher 3 (2015) | 435 | 338 | 223 | 122 | 88.5 |
| Dota 2 Reborn (2015) | 233 | 208 | 199.1 | 180.9 | |
| Final Fantasy XV Benchmark (2018) | 176.6 | 139.1 | 111.5 | 85.8 | |
| X-Plane 11.11 (2018) | 194.4 | 163 | 126.4 | ||
| Far Cry 5 (2018) | 184 | 124 | 114 | 109 | 98 |
| Strange Brigade (2018) | 455 | 277 | 233 | 204 | 136.2 |
| Cyberpunk 2077 (2023) | 90.2 | 81.6 | 76.9 | 75.8 | 49.4 |
| Skull & Bones (2024) | 107 | 101 | 94 | 81 | 63 |
| Last Epoch (2024) | 169.7 | 156 | 155.9 | 133.8 | 80.4 |
| Alone in the Dark (2024) | 185.9 | 157.3 | 151.1 | 124.7 | 64.7 |
| Horizon Forbidden West (2024) | 92.3 | 77.3 | 73.4 | 71.1 | 54.5 |
Utsläpp - Aorus laptop blir inte särskilt varm
Utsläpp av buller
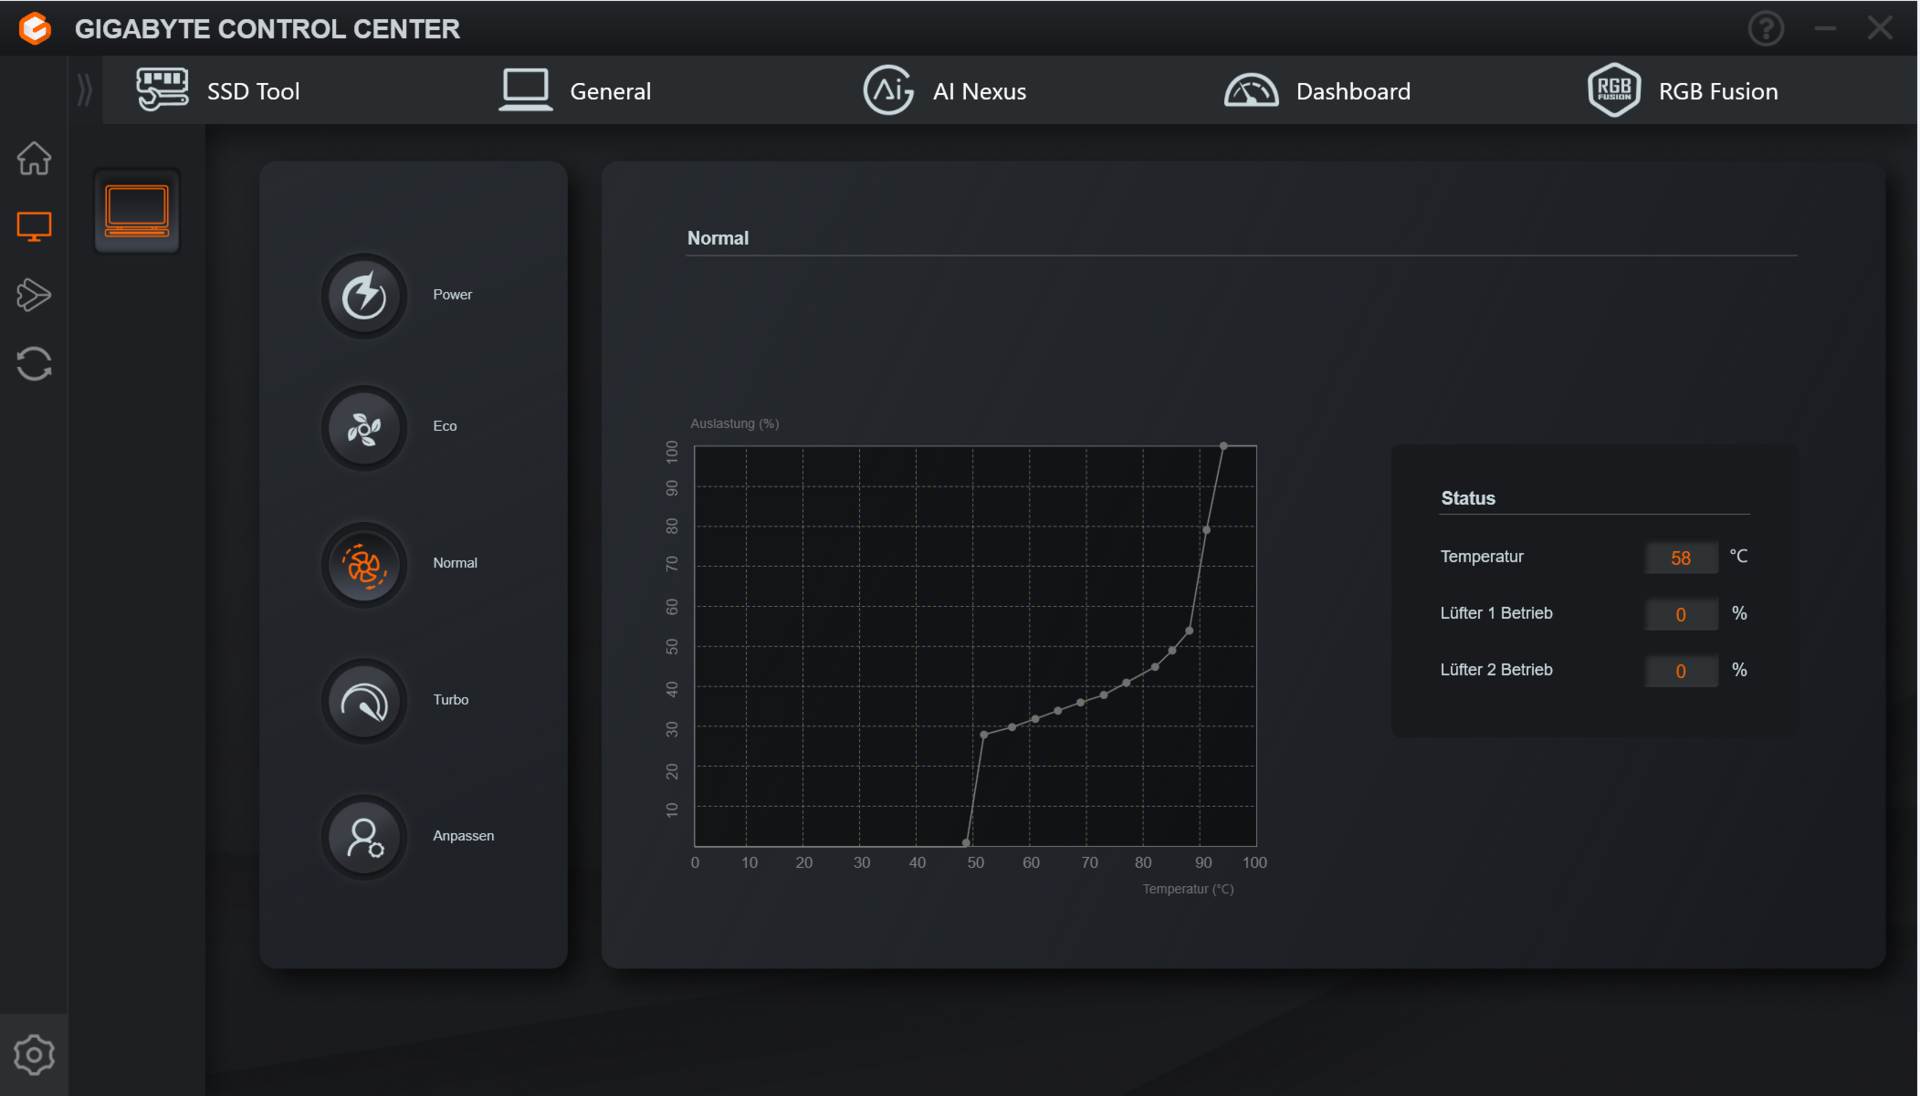
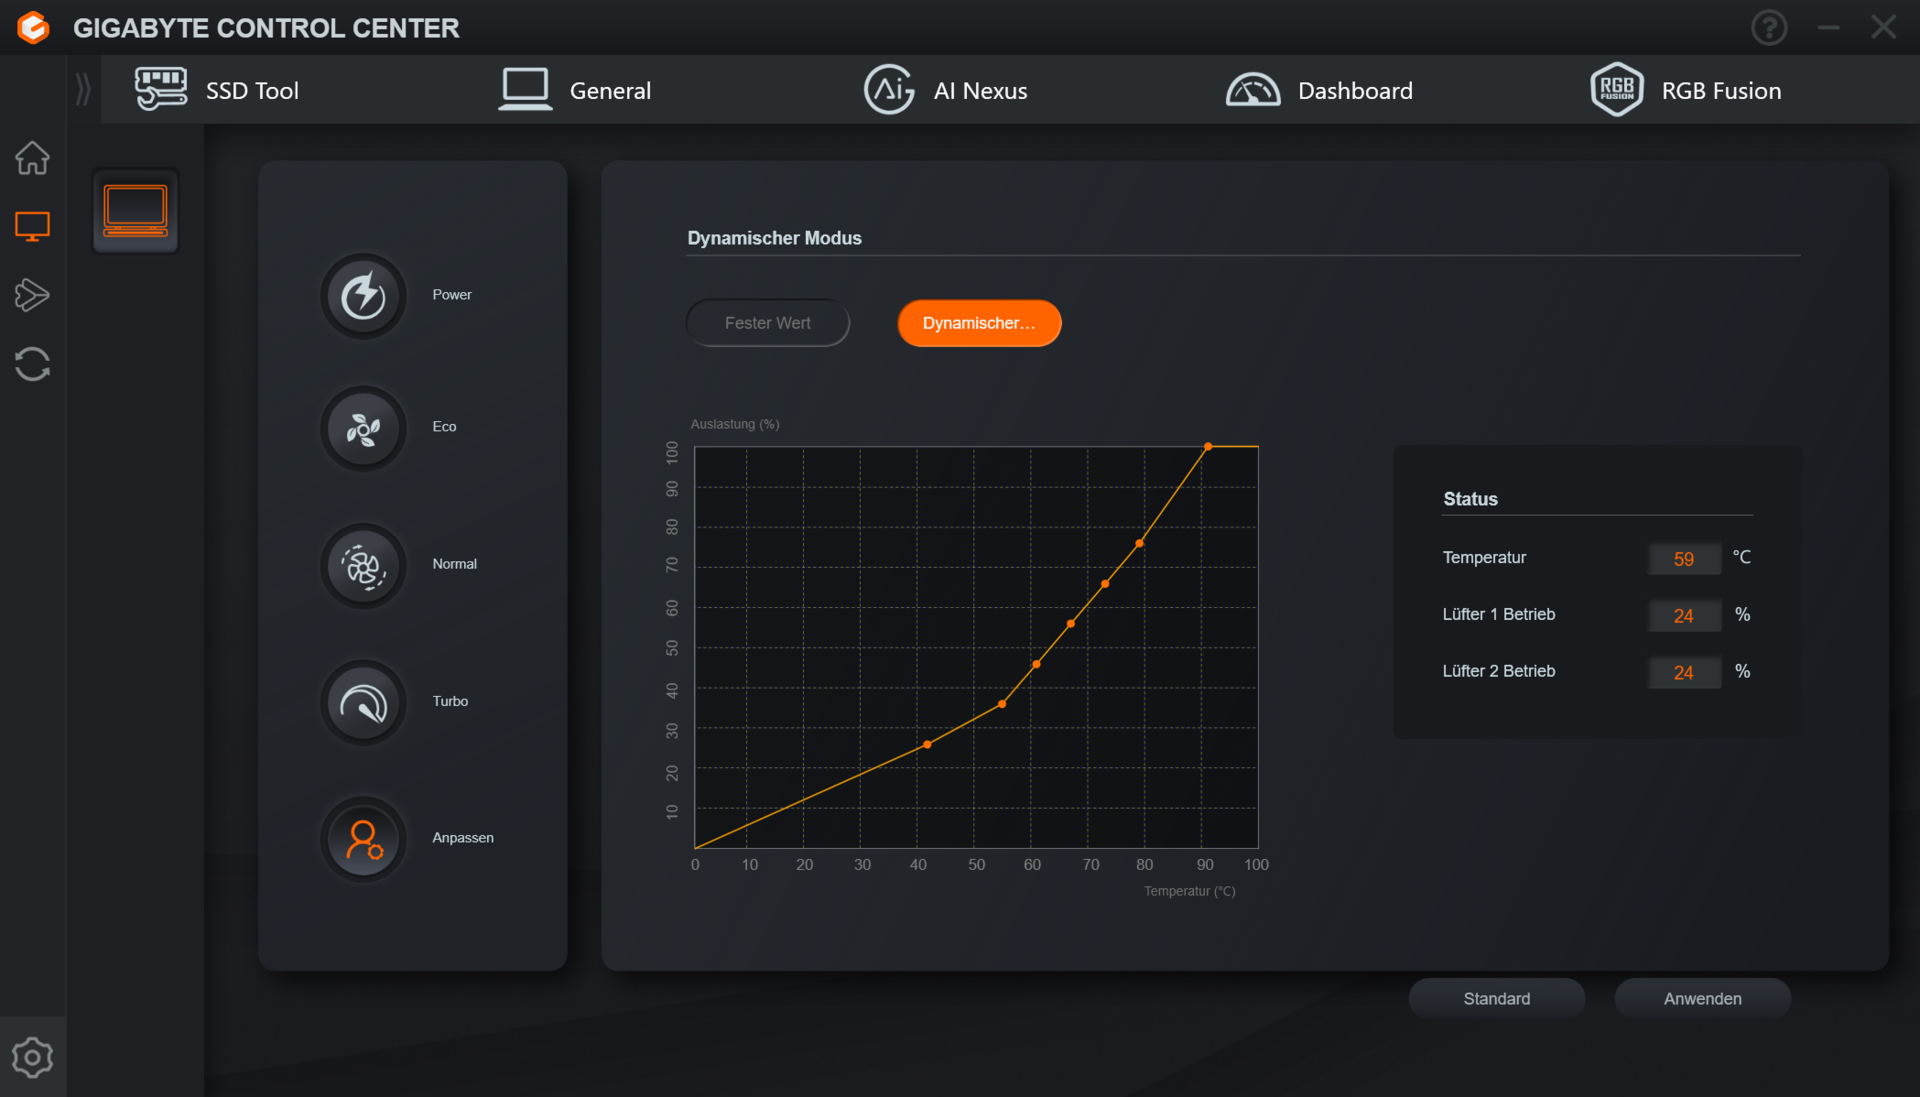
Vid full belastning ger den bärbara datorn upphov till bulleremissioner på upp till 55 dB(A). Energiprofilerna Meeting och Energy-Saving Quiet ger en totalt sett tystare upplevelse - på bekostnad av viss prestanda. Alternativt kan fläktaktiviteten styras via fyra fläktprofiler (i Gigabyte Control Center). Du kan också skapa en anpassad fläktkurva om så önskas. I viloläge och vid daglig användning (kontor, internet) körs den bärbara datorn i allmänhet tyst - ibland till och med ljudlöst. Ibland börjar fläktarna snurra ganska snabbt.
Ljudnivå
| Låg belastning |
| 26 / 32 / 38 dB(A) |
| Hög belastning |
| 54 / 55 dB(A) |
 | ||
30 dB tyst 40 dB(A) hörbar 50 dB(A) högt ljud |
||
min: | ||
| Aorus 16X 2024 i9-14900HX, GeForce RTX 4070 Laptop GPU | Alienware m16 R2 Ultra 7 155H, GeForce RTX 4070 Laptop GPU | HP Omen Transcend 16-u1095ng i9-14900HX, GeForce RTX 4070 Laptop GPU | Asus TUF Gaming A17 FA707XI-NS94 R9 7940HS, GeForce RTX 4070 Laptop GPU | Schenker XMG Pro 16 Studio (Mid 23) i9-13900H, GeForce RTX 4070 Laptop GPU | Lenovo Legion Pro 5 16IRX9 i9-14900HX, GeForce RTX 4070 Laptop GPU | |
|---|---|---|---|---|---|---|
| Noise | 12% | 9% | 4% | 9% | 10% | |
| av / miljö * (dB) | 26 | 24.7 5% | 24 8% | 27.9 -7% | 25 4% | 23.9 8% |
| Idle Minimum * (dB) | 26 | 25.3 3% | 29 -12% | 28.5 -10% | 26 -0% | 24.3 7% |
| Idle Average * (dB) | 32 | 25.3 21% | 30 6% | 29.8 7% | 29 9% | 24.3 24% |
| Idle Maximum * (dB) | 38 | 25.3 33% | 31 18% | 29.8 22% | 34 11% | 28.9 24% |
| Load Average * (dB) | 54 | 31.7 41% | 45 17% | 34.8 36% | 43 20% | 45.8 15% |
| Witcher 3 ultra * (dB) | 50 | 53.8 -8% | 44 12% | 57.1 -14% | 48 4% | 51 -2% |
| Load Maximum * (dB) | 55 | 62 -13% | 47 15% | 57.3 -4% | 48 13% | 56.6 -3% |
* ... mindre är bättre
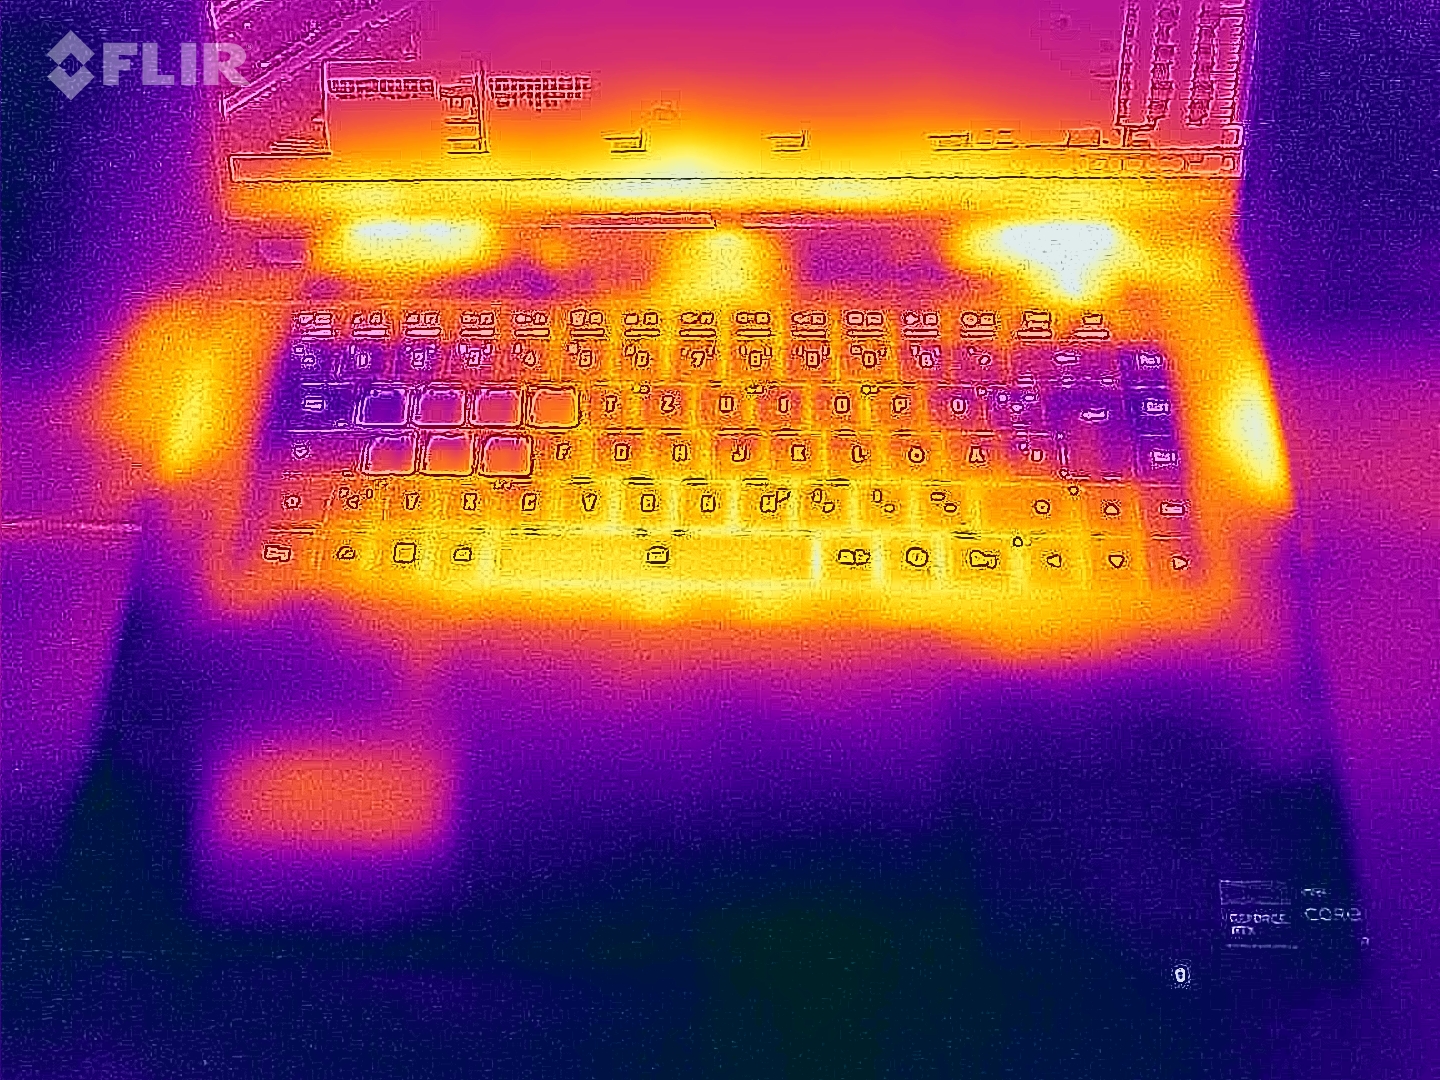
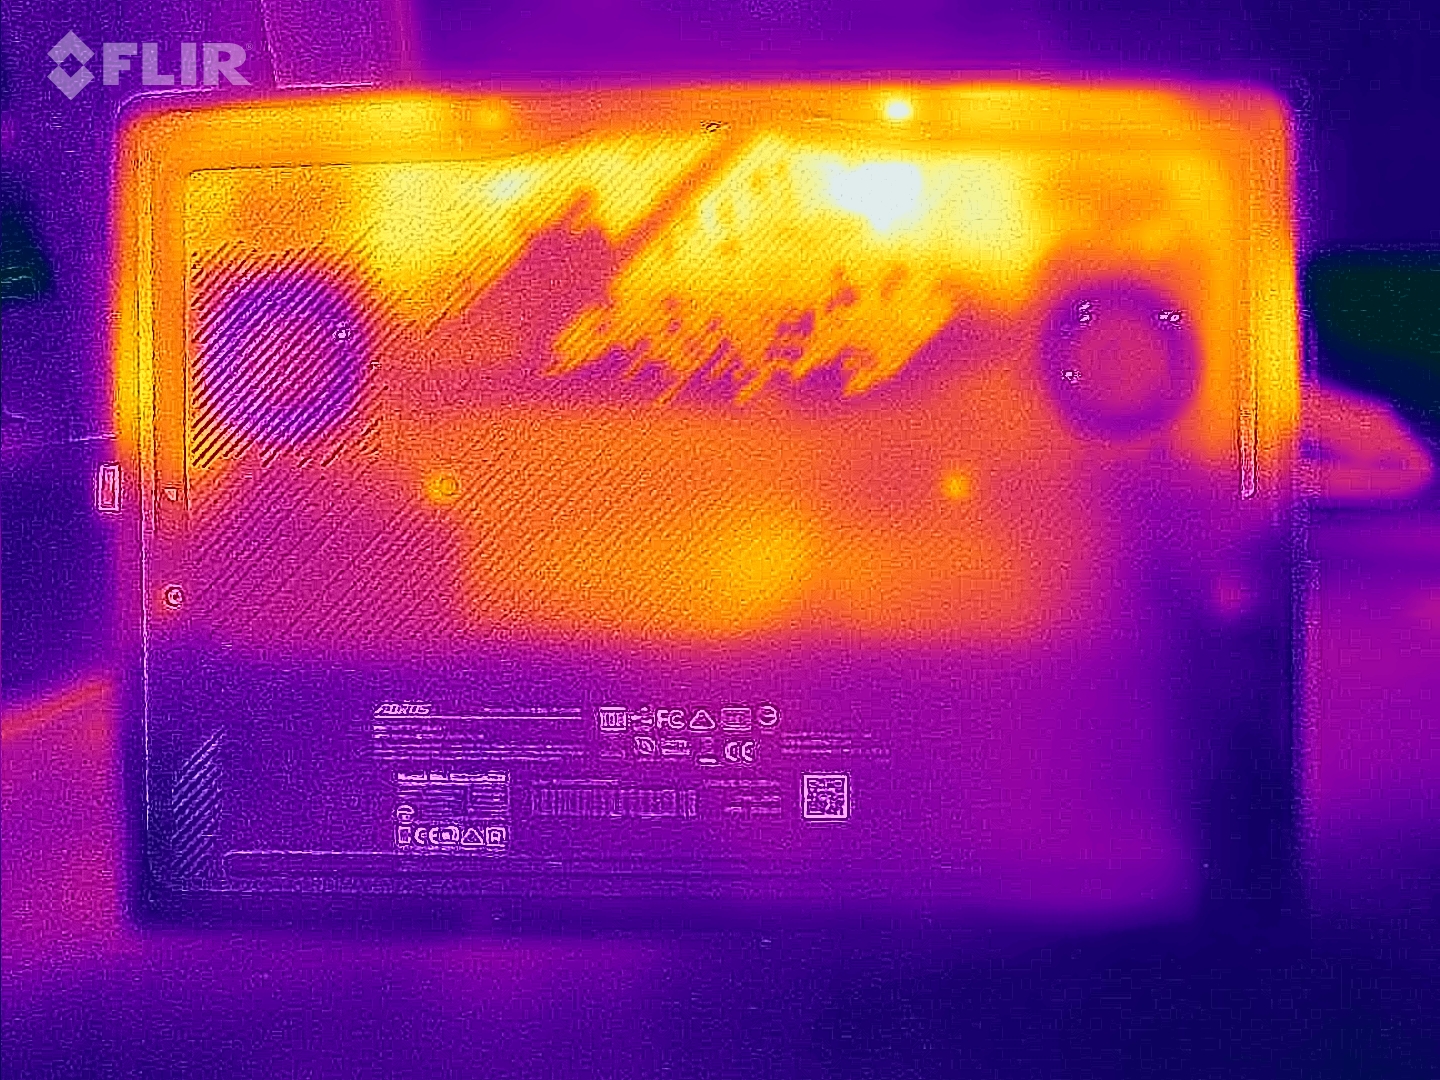
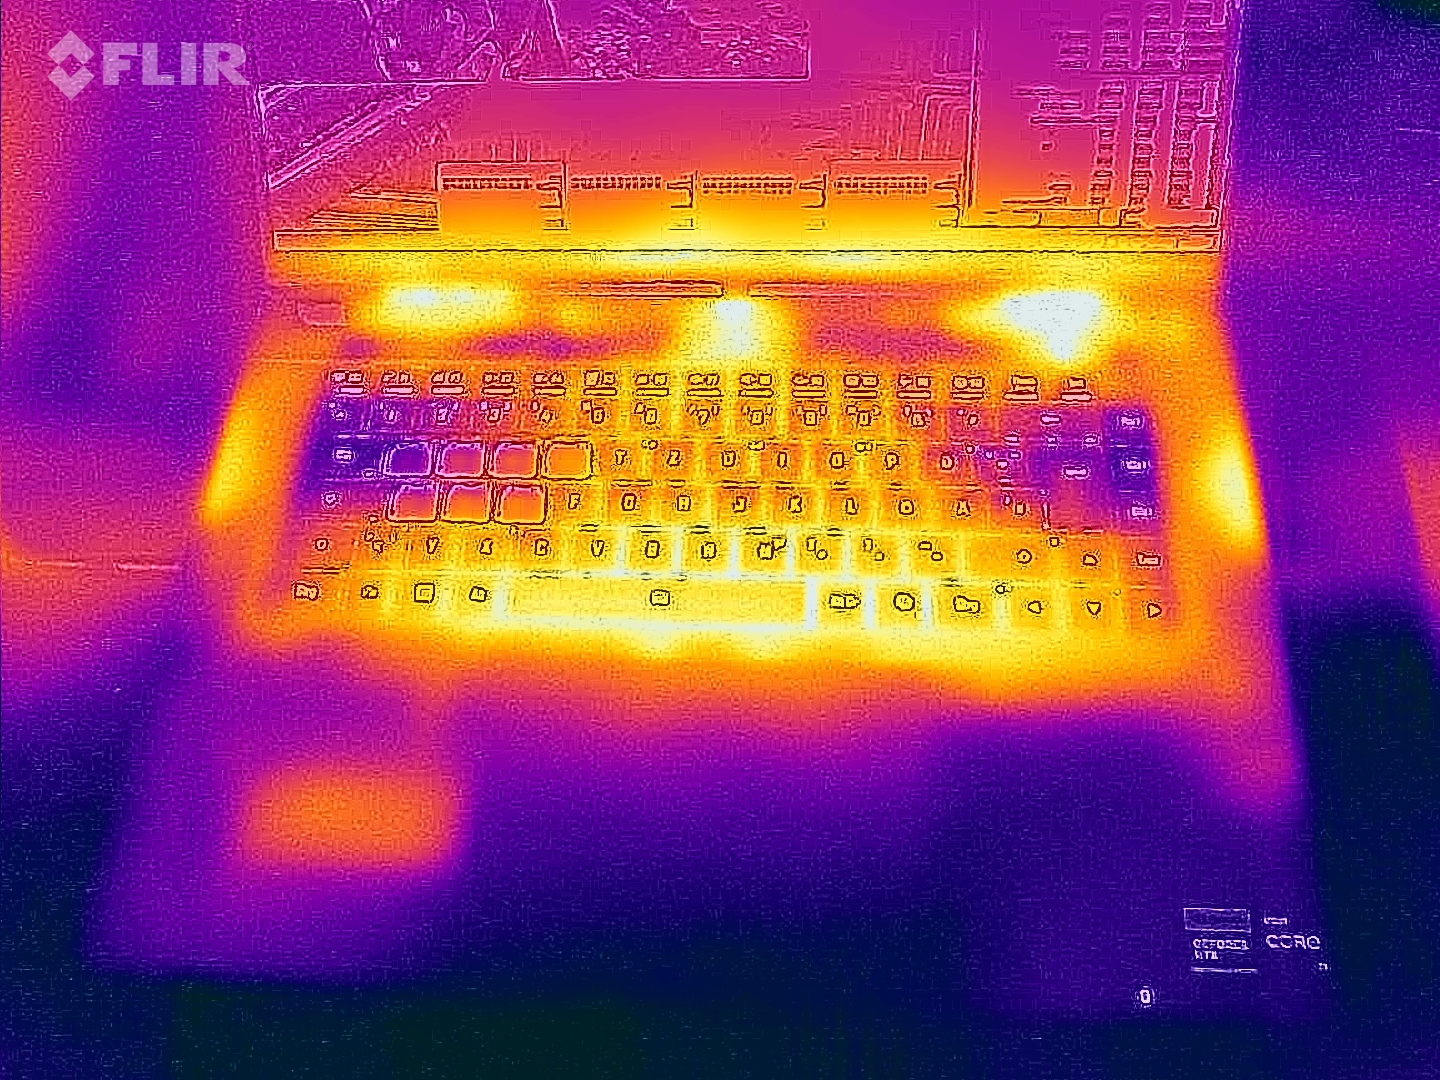
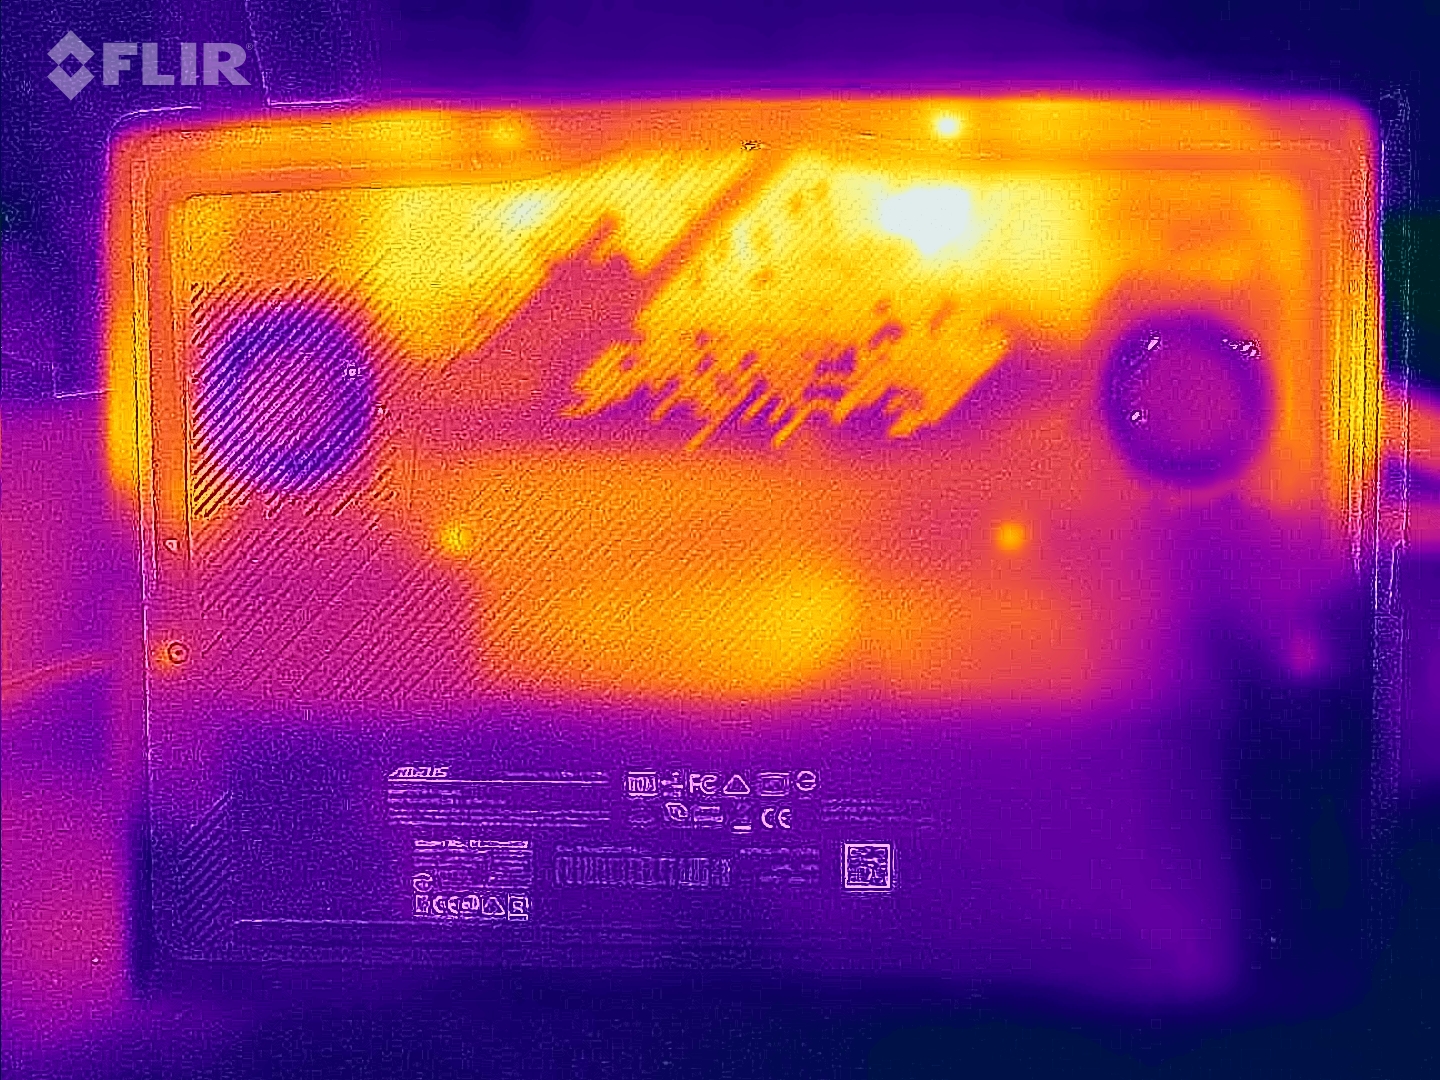
Temperatur
Stresstestet och Witcher 3 test fick bara den bärbara datorn att värmas upp lite. I vissa fall uppmätte vi värden i det lägre till mellersta 40-graders Celsius-intervallet. Vid daglig användning (kontor, internet) kommer värdena i stort sett att ligga kvar i den gröna zonen, men de är över genomsnittet.
(±) Den maximala temperaturen på ovansidan är 41 °C / 106 F, jämfört med genomsnittet av 40.4 °C / 105 F , allt från 21.2 till 68.8 °C för klassen Gaming.
(±) Botten värms upp till maximalt 41 °C / 106 F, jämfört med genomsnittet av 43.2 °C / 110 F
(±) Vid tomgångsbruk är medeltemperaturen för ovansidan 33.2 °C / 92 F, jämfört med enhetsgenomsnittet på 33.9 °C / ### class_avg_f### F.
(±) När du spelar The Witcher 3 är medeltemperaturen för ovansidan 35.7 °C / 96 F, jämfört med enhetsgenomsnittet på 33.9 °C / ## #class_avg_f### F.
(+) Handledsstöden och pekplattan är kallare än hudtemperaturen med maximalt 30 °C / 86 F och är därför svala att ta på.
(±) Medeltemperaturen för handledsstödsområdet på liknande enheter var 28.8 °C / 83.8 F (-1.2 °C / -2.2 F).
| Aorus 16X 2024 i9-14900HX, GeForce RTX 4070 Laptop GPU | Alienware m16 R2 Ultra 7 155H, GeForce RTX 4070 Laptop GPU | HP Omen Transcend 16-u1095ng i9-14900HX, GeForce RTX 4070 Laptop GPU | Asus TUF Gaming A17 FA707XI-NS94 R9 7940HS, GeForce RTX 4070 Laptop GPU | Schenker XMG Pro 16 Studio (Mid 23) i9-13900H, GeForce RTX 4070 Laptop GPU | Lenovo Legion Pro 5 16IRX9 i9-14900HX, GeForce RTX 4070 Laptop GPU | |
|---|---|---|---|---|---|---|
| Heat | -10% | -8% | 21% | -19% | -7% | |
| Maximum Upper Side * (°C) | 41 | 44.8 -9% | 49 -20% | 40 2% | 55 -34% | 43.8 -7% |
| Maximum Bottom * (°C) | 41 | 48 -17% | 63 -54% | 33.6 18% | 66 -61% | 55.4 -35% |
| Idle Upper Side * (°C) | 37 | 37.2 -1% | 30 19% | 26.6 28% | 33 11% | 32.8 11% |
| Idle Bottom * (°C) | 38 | 42 -11% | 29 24% | 24.4 36% | 35 8% | 36 5% |
* ... mindre är bättre
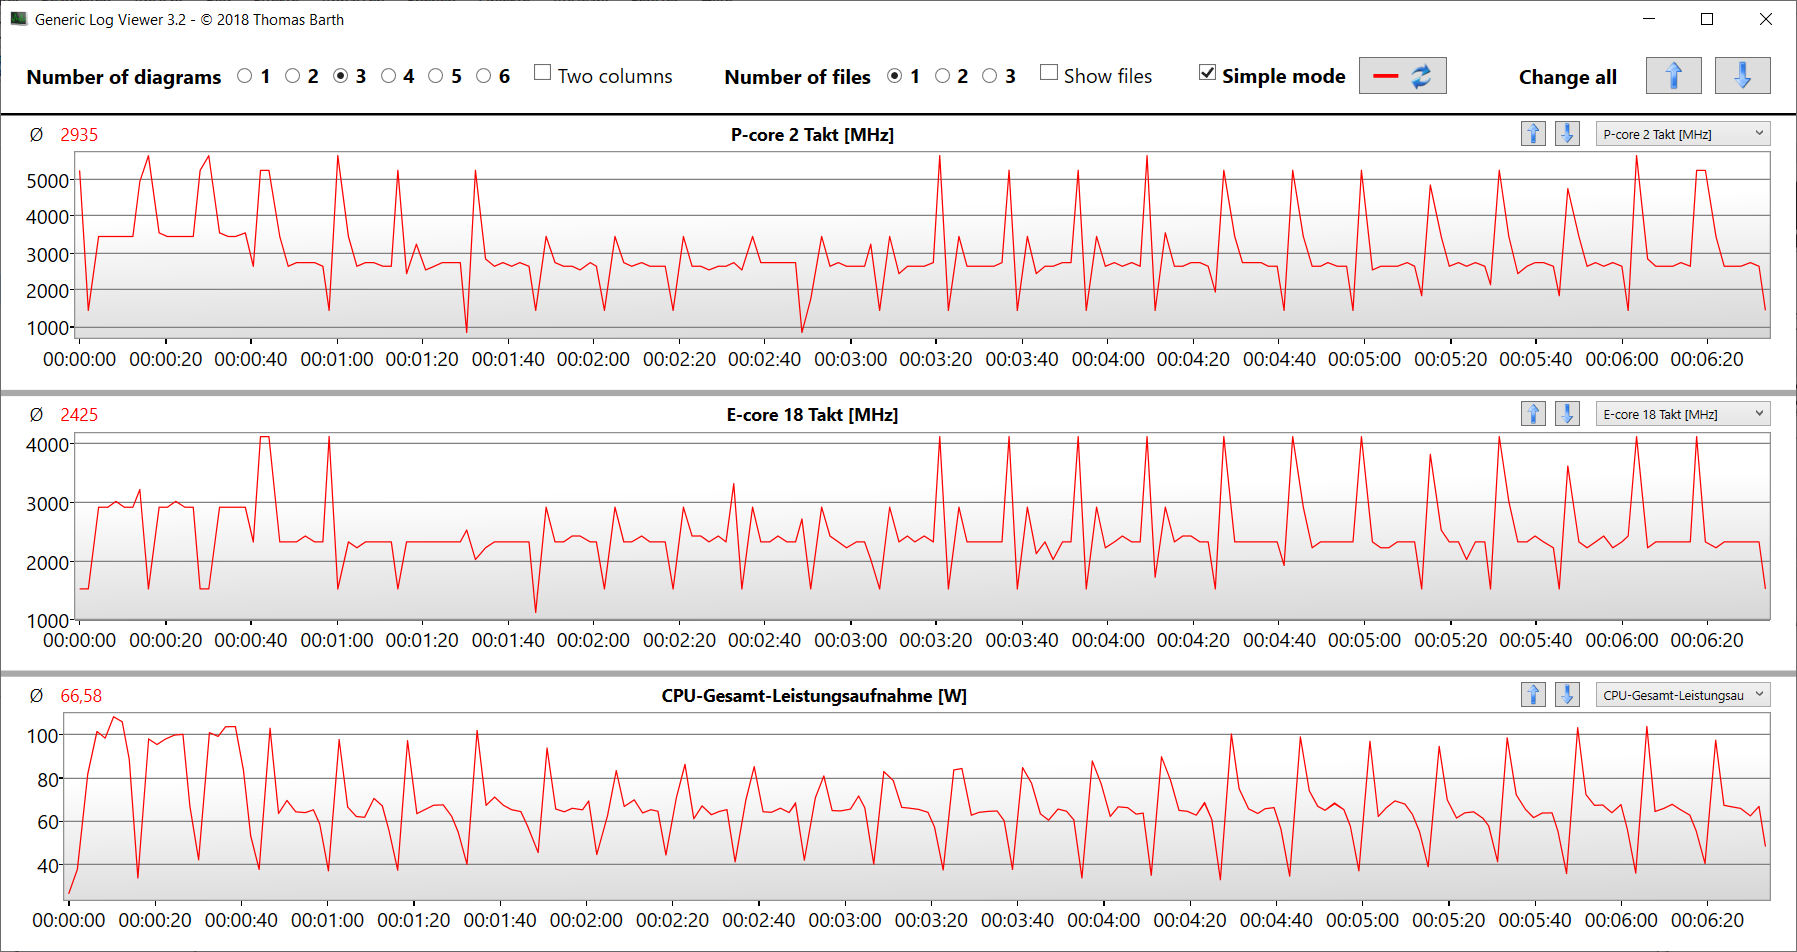
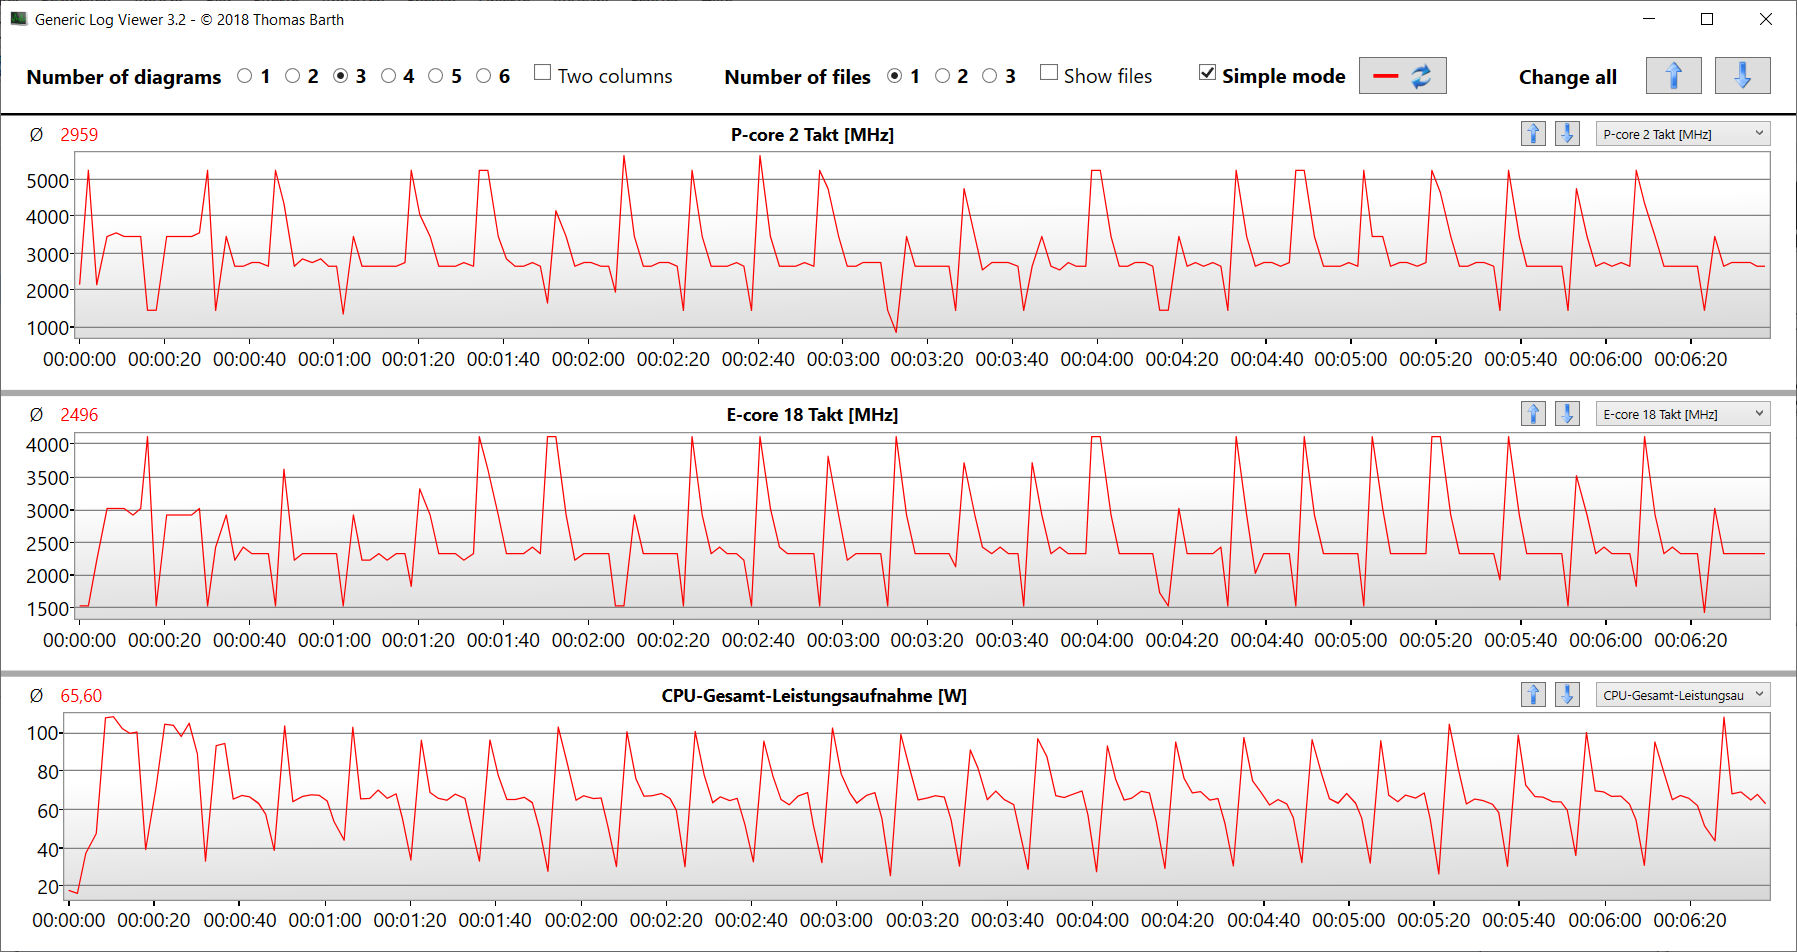
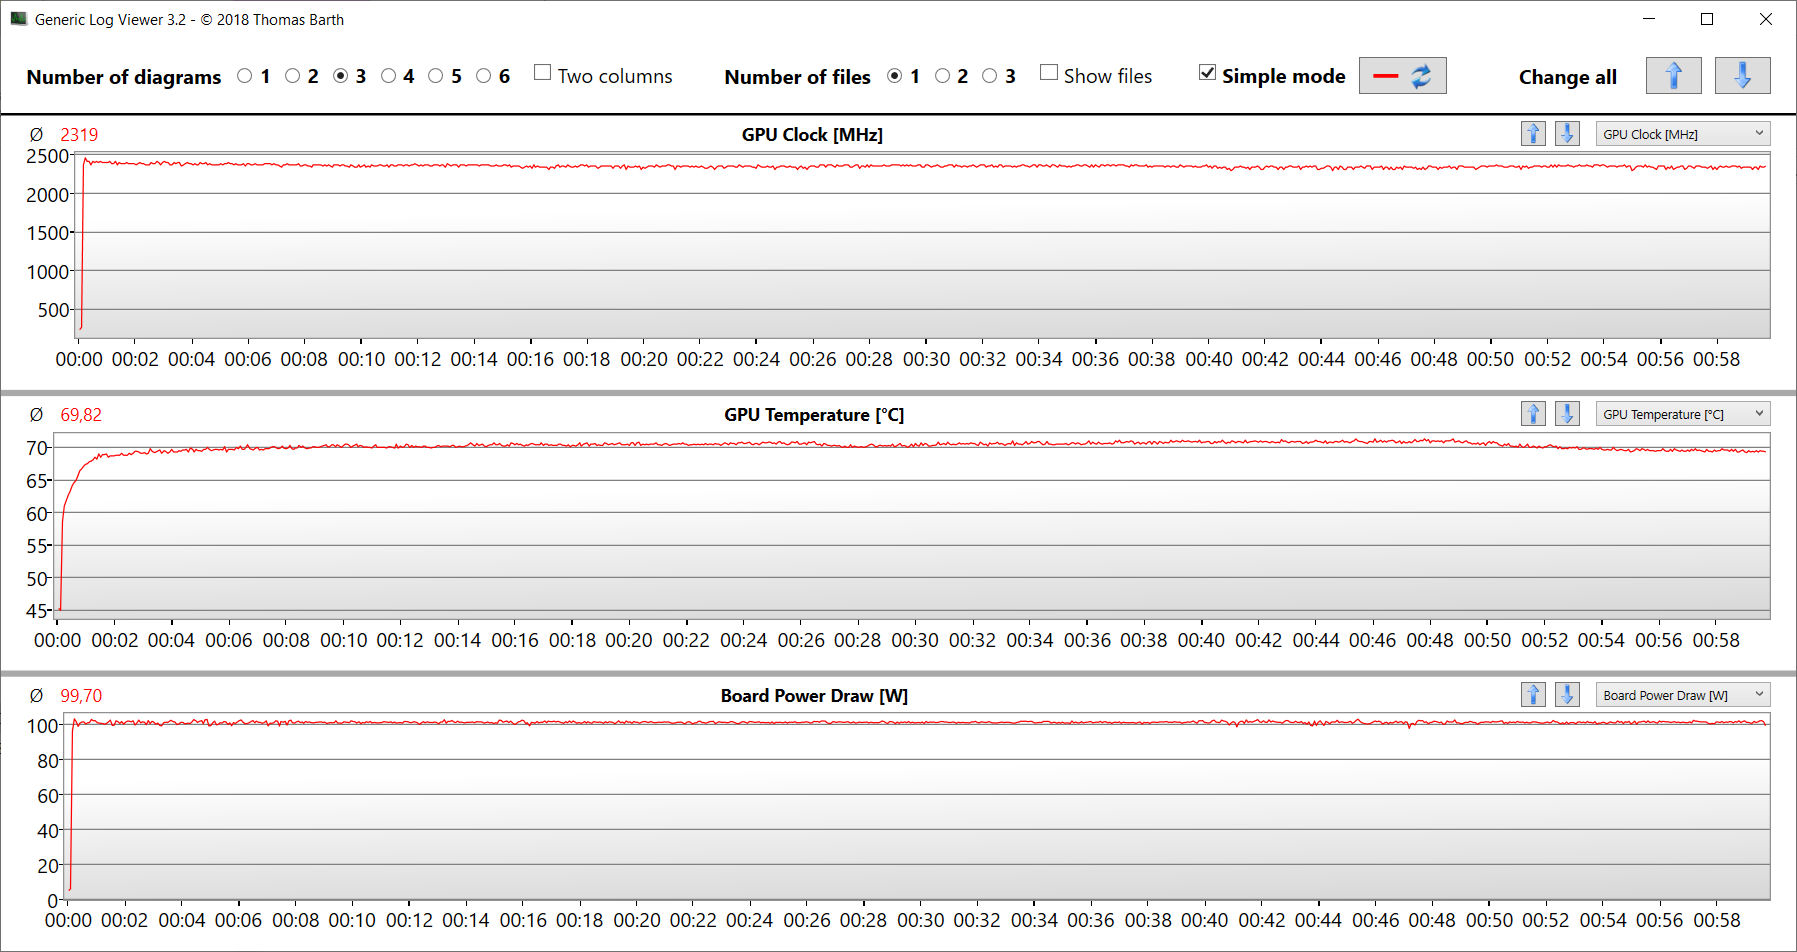
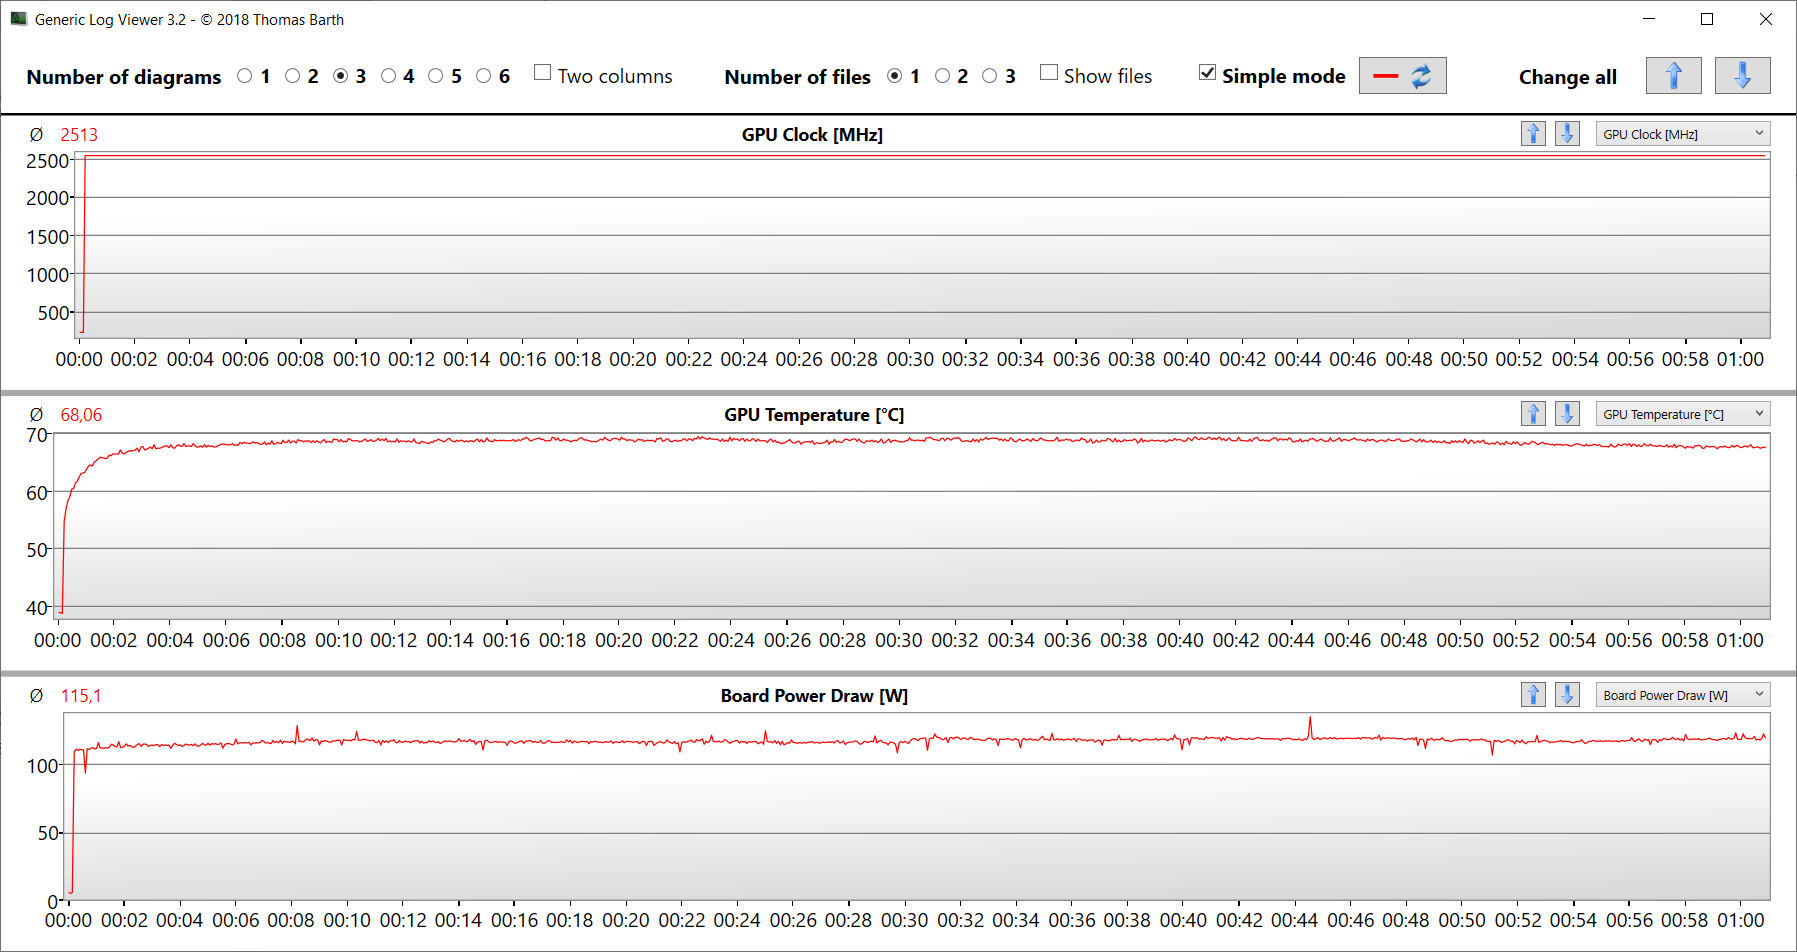
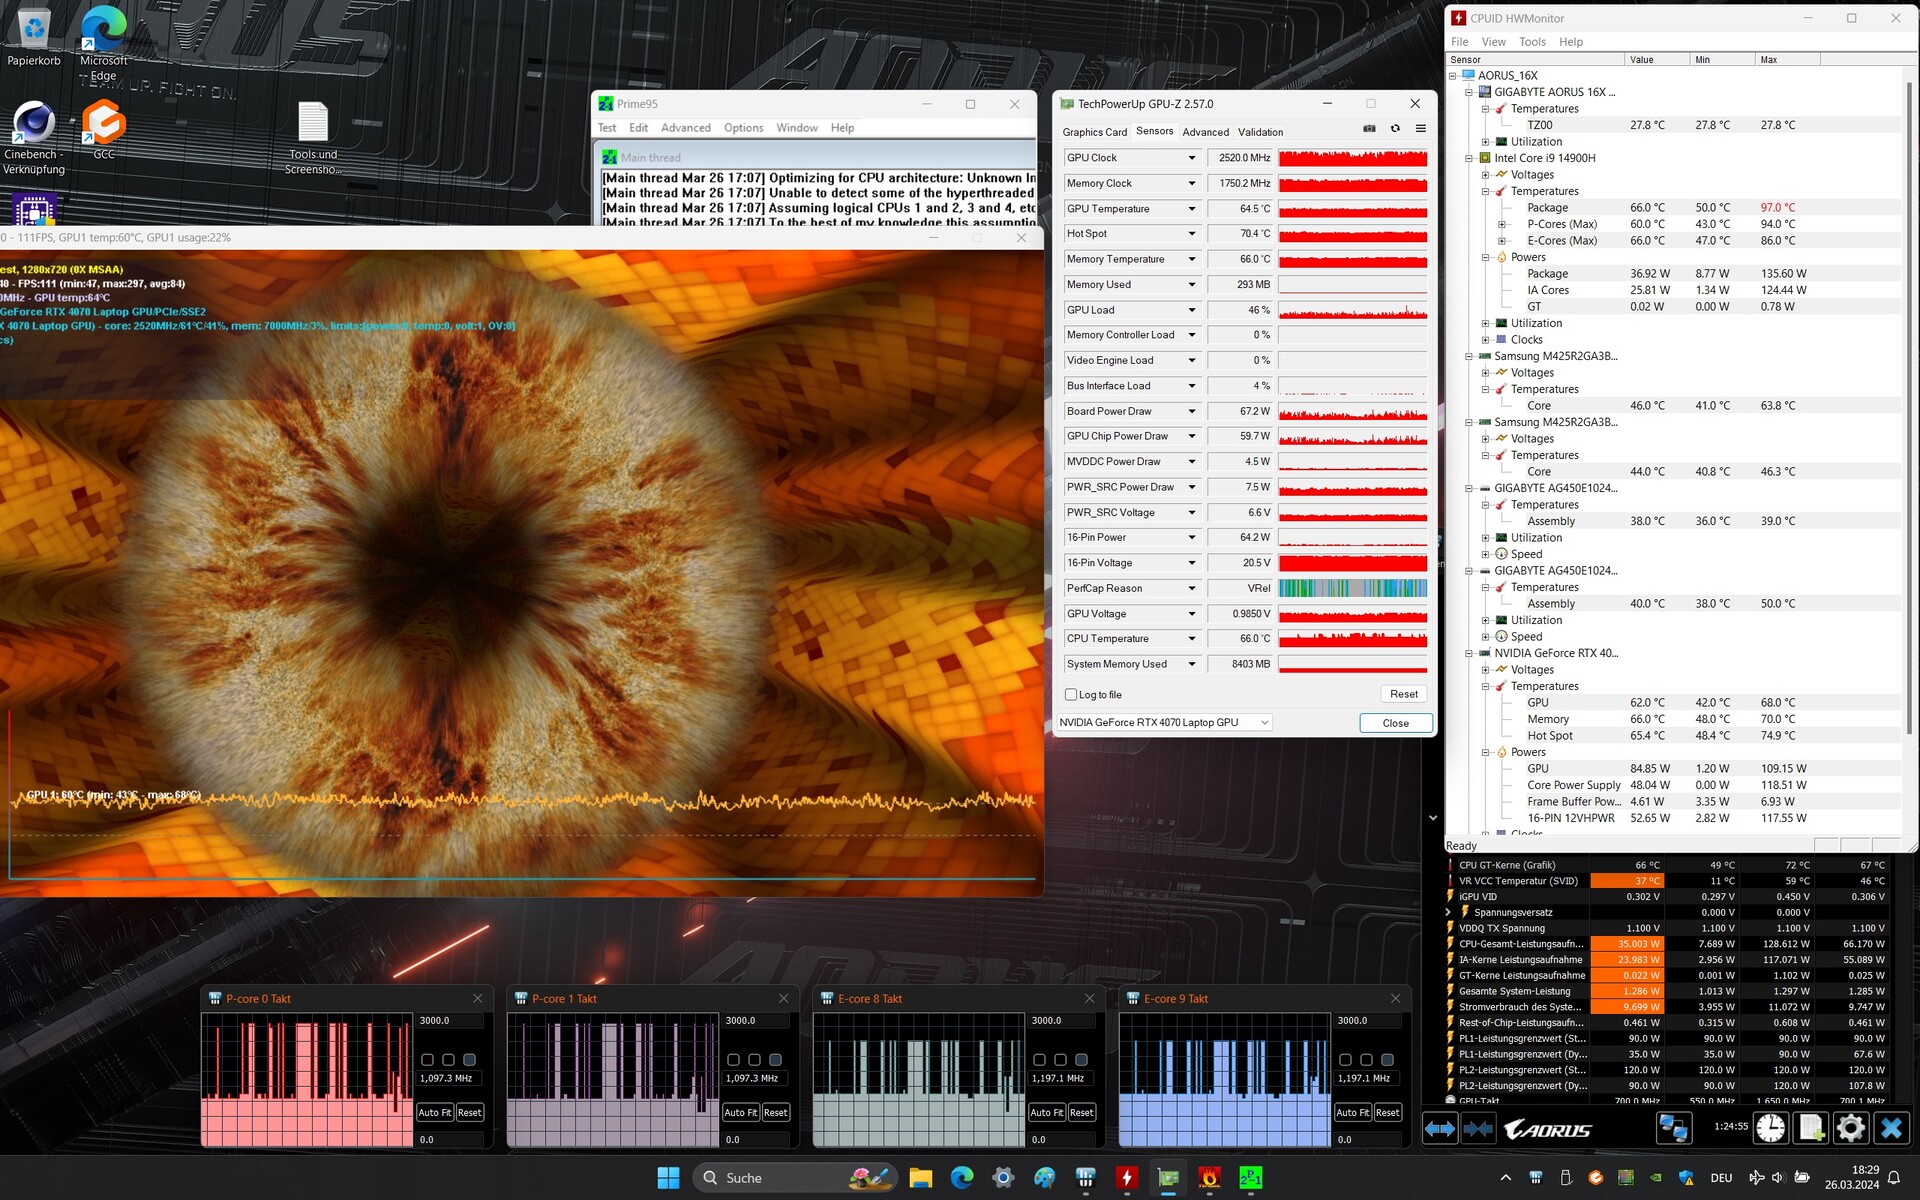
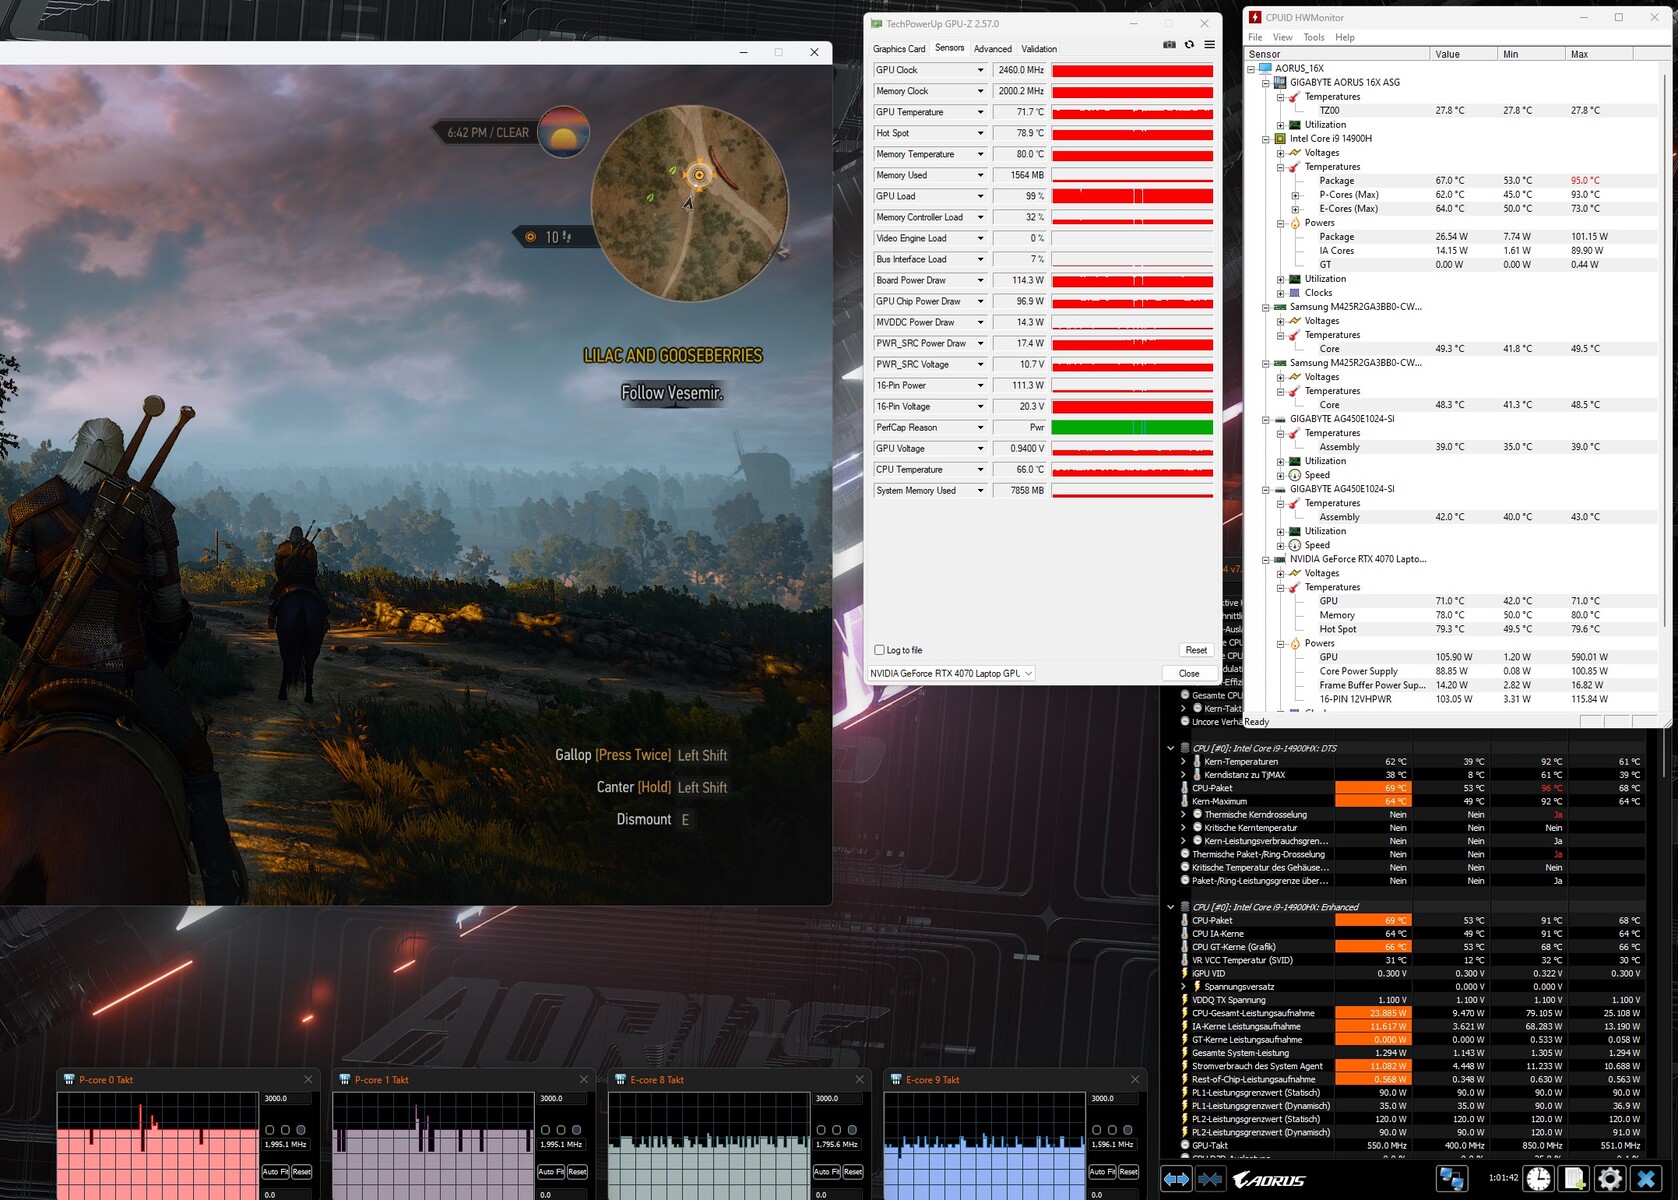
Stresstest
Det extrema stresstestscenariot (Prime95 och Furmark i kontinuerlig drift) kontrollerar systemets stabilitet under full belastning. CPU-klockan fluktuerade mellan 1 och 3 GHz under ganska lång tid men stabiliserades sedan på en låg nivå efter ett tag. Grafikkärnan kördes i höga hastigheter.
Högtalare
Den bärbara datorns stereohögtalare ger ett bra ljud överlag. En ännu bättre ljudupplevelse kan uppnås genom att använda hörlurar eller externa högtalare.
Aorus 16X 2024 ljudanalys
(+) | högtalare kan spela relativt högt (85 dB)
Bas 100 - 315 Hz
(±) | reducerad bas - i genomsnitt 8.5% lägre än medianen
(±) | linjäriteten för basen är genomsnittlig (8.3% delta till föregående frekvens)
Mellan 400 - 2000 Hz
(+) | balanserad mellan - endast 3.1% från medianen
(+) | mids är linjära (5.8% delta till föregående frekvens)
Högsta 2 - 16 kHz
(+) | balanserade toppar - endast 2.5% från medianen
(±) | linjäriteten för toppar är genomsnittlig (7% delta till föregående frekvens)
Totalt 100 - 16 000 Hz
(+) | det totala ljudet är linjärt (8.4% skillnad mot median)
Jämfört med samma klass
» 2% av alla testade enheter i den här klassen var bättre, 1% liknande, 97% sämre
» Den bästa hade ett delta på 6%, genomsnittet var 18%, sämst var 132%
Jämfört med alla testade enheter
» 2% av alla testade enheter var bättre, 1% liknande, 97% sämre
» Den bästa hade ett delta på 4%, genomsnittet var 24%, sämst var 134%
Alienware m16 R2 ljudanalys
(+) | högtalare kan spela relativt högt (82.4 dB)
Bas 100 - 315 Hz
(-) | nästan ingen bas - i genomsnitt 20.1% lägre än medianen
(±) | linjäriteten för basen är genomsnittlig (11.1% delta till föregående frekvens)
Mellan 400 - 2000 Hz
(+) | balanserad mellan - endast 2.2% från medianen
(+) | mids är linjära (3.1% delta till föregående frekvens)
Högsta 2 - 16 kHz
(+) | balanserade toppar - endast 2.2% från medianen
(+) | toppar är linjära (3.5% delta till föregående frekvens)
Totalt 100 - 16 000 Hz
(+) | det totala ljudet är linjärt (12.9% skillnad mot median)
Jämfört med samma klass
» 17% av alla testade enheter i den här klassen var bättre, 4% liknande, 79% sämre
» Den bästa hade ett delta på 6%, genomsnittet var 18%, sämst var 132%
Jämfört med alla testade enheter
» 12% av alla testade enheter var bättre, 3% liknande, 85% sämre
» Den bästa hade ett delta på 4%, genomsnittet var 24%, sämst var 134%
Energihantering - Gaminglaptop med hyfsad uthållighet
Strömförbrukning
Enhetens strömförbrukning ligger på en normal nivå för den installerade hårdvaran. Medan Witcher 3 testet kördes med konstant strömförbrukning, varierade den bärbara datorns efterfrågan avsevärt under de första minuterna av stresstestet. Strömförsörjningsenheten (240 watt) är tillräckligt stor.
| Av/Standby | |
| Låg belastning | |
| Hög belastning |
|
Förklaring:
min: | |
| Aorus 16X 2024 i9-14900HX, GeForce RTX 4070 Laptop GPU | Alienware m16 R2 Ultra 7 155H, GeForce RTX 4070 Laptop GPU | HP Omen Transcend 16-u1095ng i9-14900HX, GeForce RTX 4070 Laptop GPU | Asus TUF Gaming A17 FA707XI-NS94 R9 7940HS, GeForce RTX 4070 Laptop GPU | Schenker XMG Pro 16 Studio (Mid 23) i9-13900H, GeForce RTX 4070 Laptop GPU | Genomsnitt av klass Gaming | |
|---|---|---|---|---|---|---|
| Power Consumption | 12% | 7% | 17% | 23% | 6% | |
| Idle Minimum * (Watt) | 13 | 8.1 38% | 10 23% | 6.2 52% | 8 38% | 13.3 ? -2% |
| Idle Average * (Watt) | 18 | 13 28% | 18 -0% | 21.8 -21% | 12 33% | 19 ? -6% |
| Idle Maximum * (Watt) | 35 | 40.3 -15% | 32 9% | 22 37% | 23 34% | 24.5 ? 30% |
| Load Average * (Watt) | 138 | 79 43% | 128 7% | 59.2 57% | 94 32% | 108.1 ? 22% |
| Witcher 3 ultra * (Watt) | 172.6 | 188.1 -9% | 148.4 14% | 189.7 -10% | 181.5 -5% | |
| Load Maximum * (Watt) | 222 | 254.9 -15% | 242 -9% | 247.8 -12% | 215 3% | 254 ? -14% |
* ... mindre är bättre
Power consumption Witcher 3 / stress test
Power consumption with external monitor
Körtider
16-tumsenheten uppnådde körtider på 8:01 h och 9:01 h under WLAN-testet (åtkomst till webbplatser med hjälp av ett skript) och videotestet (kortfilm Big Buck Bunny (H.264-kodning, FHD) i en loop). Allt som allt levererade Aorus 16X mycket bra resultat. Ingen av jämförelsedatorerna kom dock i närheten av uthålligheten hos Asus A17.
| Aorus 16X 2024 i9-14900HX, GeForce RTX 4070 Laptop GPU, 99 Wh | Alienware m16 R2 Ultra 7 155H, GeForce RTX 4070 Laptop GPU, 90 Wh | HP Omen Transcend 16-u1095ng i9-14900HX, GeForce RTX 4070 Laptop GPU, 97 Wh | Asus TUF Gaming A17 FA707XI-NS94 R9 7940HS, GeForce RTX 4070 Laptop GPU, 90 Wh | Schenker XMG Pro 16 Studio (Mid 23) i9-13900H, GeForce RTX 4070 Laptop GPU, 73 Wh | Lenovo Legion Pro 5 16IRX9 i9-14900HX, GeForce RTX 4070 Laptop GPU, 80 Wh | Genomsnitt av klass Gaming | |
|---|---|---|---|---|---|---|---|
| Batteridrifttid | -13% | -39% | 23% | -15% | -41% | -16% | |
| Reader / Idle (h) | 12.6 | 12.6 0% | 19.7 56% | 6.7 -47% | 8.71 ? -31% | ||
| H.264 (h) | 9 | 8.26 ? -8% | |||||
| WiFi v1.3 (h) | 8 | 8.1 1% | 4.9 -39% | 9.1 14% | 6.8 -15% | 4.8 -40% | 7.01 ? -12% |
| Load (h) | 1.7 | 1 -41% | 1.7 0% | 1.1 -35% | 1.47 ? -14% |
För
Emot
Omdöme - En väl avrundad bärbar dator i övre mellanklassen
Aorus 16X är optimerad för spel, streaming och rendering i QHD+. Den Core i9-14900HX och GeForce RTX 4070 levererar den prestanda som krävs. CPU och grafikkärna arbetar med genomgående höga klockfrekvenser. Två snabba PCIe-4 SSD-enheter (1 TB vardera) säkerställer korta laddningstider.
Gigabytes Aorus 16X (2024) är en kraftfull, välutrustad bärbar dator för spelare och kreatörer som inte verkar ha några större brister.
Den bärbara datorn blir inte särskilt varm under belastning, men den kan producera en hel del ljud. Tystare drift kommer på bekostnad av viss datorprestanda. Den installerade IPS-skärmen (16 tum, 2 560 x 1 600 pixlar, 165 Hz) har ett arbetsvänligt 16:10 bildförhållande och lämnade ett allmänt gott intryck på oss. Den har särskilt extremt bra ljusstyrka.
Två USB-C-portar (1x Thunderbolt 4, 1x USB 3.2 Gen 2) gör det enkelt att integrera den bärbara datorn i befintliga arbetsplatsinställningar och öppnar upp för ytterligare expansionsalternativ (extern GPU, dockning). Båda portarna kan mata ut en DisplayPort-signal och en har dessutom stöd för Power Delivery. Enhetens körtider är imponerande.
Ett alternativ till Aorus 16X skulle potentiellt kunna vara Lenovo Legion Pro 5 16IRX9. Den erbjuder något bättre grafikprestanda med samma CPU/GPU-konfiguration, men den har bara en SSD och använder fortfarande en WiFi 6E-modul (Aorus: WiFi 7).
Pris och tillgänglighet
För närvarande kan Aorus 16X ASG köpas för 1 949,99 USD på Amazon.
Aorus 16X 2024
- 04/09/2024 v7 (old)
Sascha Mölck
Genomskinlighet
Valet av enheter som ska granskas görs av vår redaktion. Testprovet gavs till författaren som ett lån av tillverkaren eller återförsäljaren för denna recension. Långivaren hade inget inflytande på denna recension och inte heller fick tillverkaren en kopia av denna recension innan publiceringen. Det fanns ingen skyldighet att publicera denna recension. Som ett oberoende medieföretag är Notebookcheck inte föremål för auktoritet från tillverkare, återförsäljare eller förlag.
This is how Notebookcheck is testingEvery year, Notebookcheck independently reviews hundreds of laptops and smartphones using standardized procedures to ensure that all results are comparable. We have continuously developed our test methods for around 20 years and set industry standards in the process. In our test labs, high-quality measuring equipment is utilized by experienced technicians and editors. These tests involve a multi-stage validation process. Our complex rating system is based on hundreds of well-founded measurements and benchmarks, which maintains objectivity.
Price comparison

