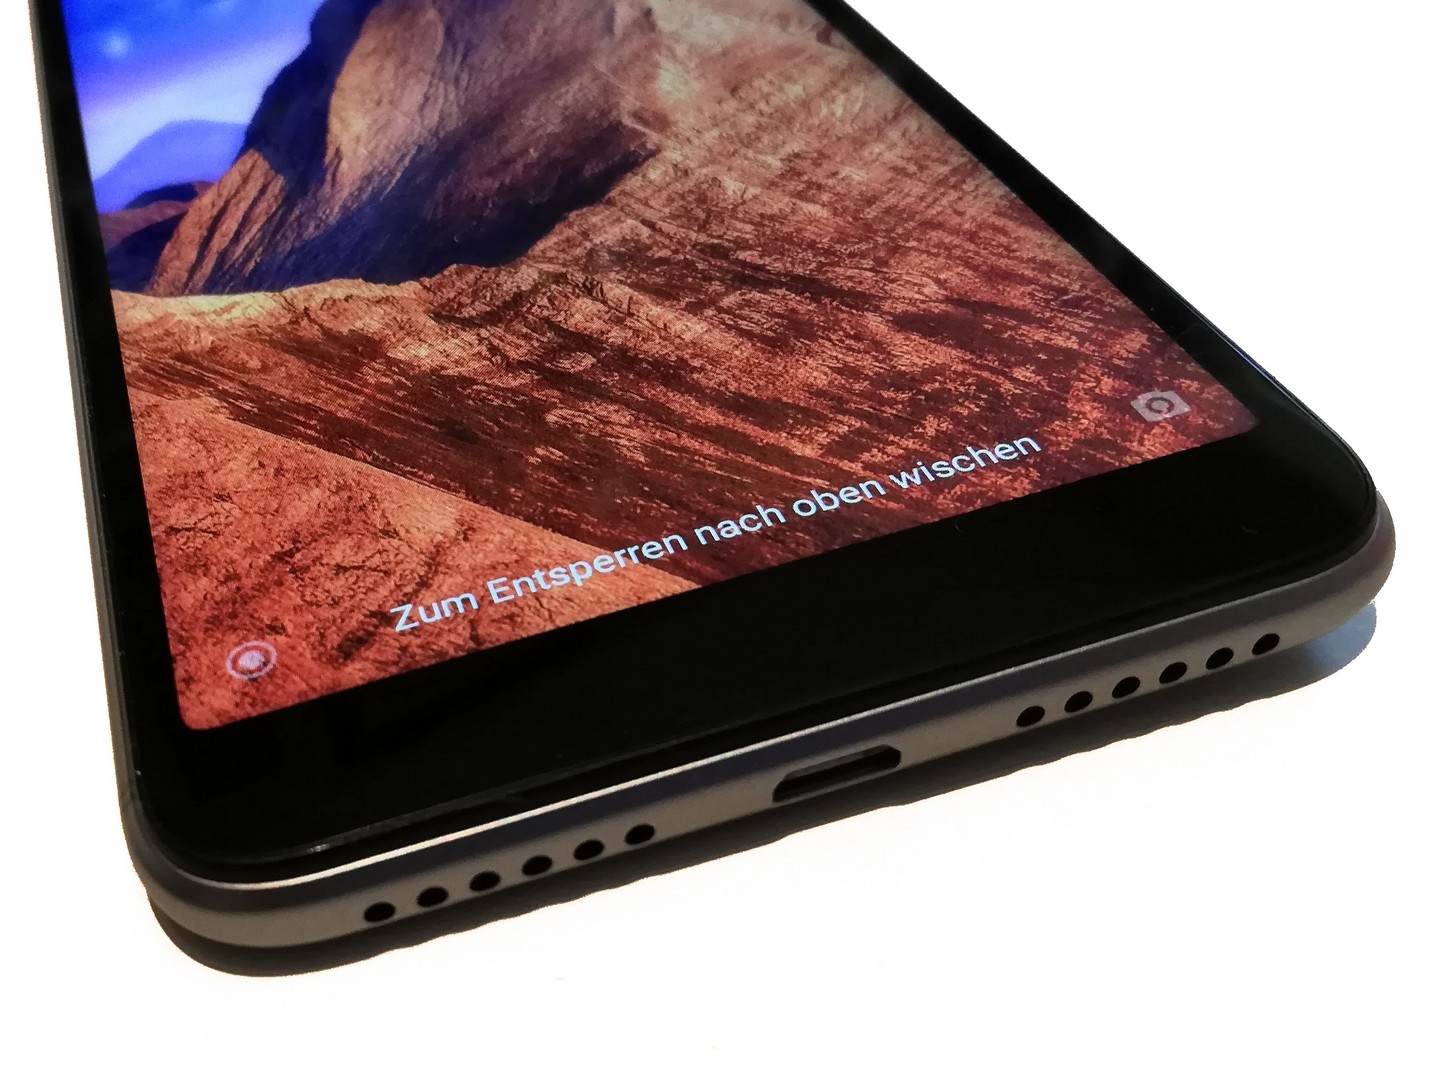
Test: Xiaomi Redmi S2 Smartphone (Sammanfattning)
| Networking | |
| iperf3 transmit AX12 | |
| Nokia 6 2018 | |
| Motorola Moto G6 Plus | |
| Samsung Galaxy A6 2018 | |
| Huawei Y7 2018 | |
| Xiaomi Redmi S2 | |
| iperf3 receive AX12 | |
| Motorola Moto G6 Plus | |
| Nokia 6 2018 | |
| Samsung Galaxy A6 2018 | |
| Huawei Y7 2018 | |
| Xiaomi Redmi S2 | |


| |||||||||||||||||||||||||
Distribution av ljusstyrkan: 90 %
Kontrast: 771:1 (Svärta: 0.65 cd/m²)
ΔE ColorChecker Calman: 5.74 | ∀{0.5-29.43 Ø4.71}
ΔE Greyscale Calman: 5.3 | ∀{0.09-98 Ø4.96}
94.7% sRGB (Calman 2D)
Gamma: 2.309
CCT: 7895 K
| Xiaomi Redmi S2 IPS, 1440x720, 6" | Huawei Y7 2018 IPS, 1440x720, 6" | Motorola Moto G6 Plus IPS, 2160x1080, 5.9" | Nokia 6 2018 IPS, 1920x1080, 5.5" | Samsung Galaxy A6 2018 Super AMOLED, 1480x720, 5.6" | |
|---|---|---|---|---|---|
| Screen | 13% | 38% | -14% | 18% | |
| Brightness middle (cd/m²) | 501 | 393 -22% | 761 52% | 417 -17% | 453 -10% |
| Brightness (cd/m²) | 483 | 365 -24% | 723 50% | 421 -13% | 459 -5% |
| Brightness Distribution (%) | 90 | 85 -6% | 90 0% | 88 -2% | 93 3% |
| Black Level * (cd/m²) | 0.65 | 0.29 55% | 0.69 -6% | 0.61 6% | |
| Contrast (:1) | 771 | 1355 76% | 1103 43% | 684 -11% | |
| Colorchecker dE 2000 * | 5.74 | 5.28 8% | 2.4 58% | 6.1 -6% | 2.6 55% |
| Colorchecker dE 2000 max. * | 8.53 | 9 -6% | 5.2 39% | 11.2 -31% | 9.2 -8% |
| Greyscale dE 2000 * | 5.3 | 4.2 21% | 1.8 66% | 7.1 -34% | 1.6 70% |
| Gamma | 2.309 95% | 2.6 85% | 2.21 100% | 2.16 102% | 2.07 106% |
| CCT | 7895 82% | 7086 92% | 6312 103% | 8362 78% | 6356 102% |
* ... mindre är bättre
Skärmflimmer / PWM (Puls-Width Modulation)
| Skärmflimmer / PWM upptäcktes inte | 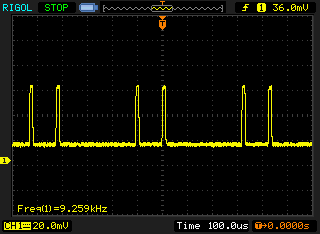 | ||
Som jämförelse: 52 % av alla testade enheter använder inte PWM för att dämpa skärmen. Om PWM upptäcktes mättes ett medelvärde av 7757 (minst: 5 - maximum: 343500) Hz. | |||
Visa svarstider
| ↔ Svarstid svart till vitt | ||
|---|---|---|
| 16 ms ... stiga ↗ och falla ↘ kombinerat | ↗ 7 ms stiga | 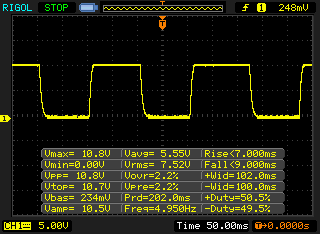 |
| ↘ 9 ms hösten | ||
| Skärmen visar bra svarsfrekvens i våra tester, men kan vara för långsam för konkurrenskraftiga spelare. I jämförelse sträcker sig alla testade enheter från 0.1 (minst) till 240 (maximalt) ms. » 37 % av alla enheter är bättre. Det betyder att den uppmätta svarstiden är bättre än genomsnittet av alla testade enheter (19.8 ms). | ||
| ↔ Svarstid 50 % grått till 80 % grått | ||
| 35 ms ... stiga ↗ och falla ↘ kombinerat | ↗ 20 ms stiga | 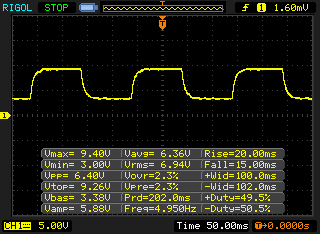 |
| ↘ 15 ms hösten | ||
| Skärmen visar långsamma svarsfrekvenser i våra tester och kommer att vara otillfredsställande för spelare. I jämförelse sträcker sig alla testade enheter från 0.165 (minst) till 636 (maximalt) ms. » 49 % av alla enheter är bättre. Detta innebär att den uppmätta svarstiden är sämre än genomsnittet av alla testade enheter (31 ms). | ||
| AnTuTu v6 - Total Score | |
| Nokia 6 2018 | |
| Motorola Moto G6 Plus | |
| Genomsnitt Qualcomm Snapdragon 625 (59867 - 68348, n=17) | |
| Xiaomi Redmi S2 | |
| Samsung Galaxy A6 2018 | |
| Huawei Y7 2018 | |
| AnTuTu v7 - Total Score | |
| Nokia 6 2018 | |
| Motorola Moto G6 Plus | |
| Genomsnitt Qualcomm Snapdragon 625 (65759 - 81789, n=6) | |
| Samsung Galaxy A6 2018 | |
| Huawei Y7 2018 | |
| Xiaomi Redmi S2 | |
| PCMark for Android | |
| Work performance score | |
| Genomsnitt Qualcomm Snapdragon 625 (4596 - 7846, n=16) | |
| Motorola Moto G6 Plus | |
| Nokia 6 2018 | |
| Xiaomi Redmi S2 | |
| Huawei Y7 2018 | |
| Samsung Galaxy A6 2018 | |
| Work 2.0 performance score | |
| Genomsnitt Qualcomm Snapdragon 625 (4626 - 5558, n=14) | |
| Motorola Moto G6 Plus | |
| Xiaomi Redmi S2 | |
| Nokia 6 2018 | |
| Huawei Y7 2018 | |
| Samsung Galaxy A6 2018 | |
| JetStream 1.1 - 1.1 Total | |
| Nokia 6 2018 (Browser: Chrome 65) | |
| Motorola Moto G6 Plus (Chrome 66) | |
| Genomsnitt Qualcomm Snapdragon 625 (21.3 - 31.8, n=17) | |
| Xiaomi Redmi S2 (Chrome 67) | |
| Samsung Galaxy A6 2018 (Chrome 64.0.3282.137) | |
| Huawei Y7 2018 (Chrome 66) | |
| Octane V2 - Total Score | |
| Genomsnitt av klass Smartphone (2800 - 126661, n=146, senaste 2 åren) | |
| Motorola Moto G6 Plus (Chrome 66) | |
| Nokia 6 2018 (Browser: Chrome 65) | |
| Xiaomi Redmi S2 (Chrome 67) | |
| Genomsnitt Qualcomm Snapdragon 625 (3781 - 4979, n=17) | |
| Samsung Galaxy A6 2018 (Chrome 64.0.3282.137) | |
| Huawei Y7 2018 (Chrome 66) | |
| Mozilla Kraken 1.1 - Total | |
| Huawei Y7 2018 (Chrome 66) | |
| Samsung Galaxy A6 2018 (Chrome 64.0.3282.137) | |
| Xiaomi Redmi S2 (Chrome 67) | |
| Nokia 6 2018 (Browser: Chrome 65) | |
| Motorola Moto G6 Plus (Chrome 66) | |
| Genomsnitt Qualcomm Snapdragon 625 (8028 - 12194, n=17) | |
| Genomsnitt av klass Smartphone (257 - 28190, n=124, senaste 2 åren) | |
| WebXPRT 2015 - Overall | |
| Nokia 6 2018 | |
| Motorola Moto G6 Plus (Chrome 66) | |
| Xiaomi Redmi S2 (Chrome 67) | |
| Genomsnitt Qualcomm Snapdragon 625 (60 - 113, n=12) | |
| Samsung Galaxy A6 2018 (Chrome 64.0.3282.137) | |
| Huawei Y7 2018 (Chrome 66) | |
* ... mindre är bättre
| Xiaomi Redmi S2 | Huawei Y7 2018 | Motorola Moto G6 Plus | Nokia 6 2018 | Samsung Galaxy A6 2018 | Genomsnitt 32 GB eMMC Flash | Genomsnitt av klass Smartphone | |
|---|---|---|---|---|---|---|---|
| AndroBench 3-5 | -25% | 17% | -16% | -27% | -22% | 791% | |
| Sequential Read 256KB (MB/s) | 261.4 | 256 -2% | 286.6 10% | 272.6 4% | 208.4 -20% | 242 ? -7% | 2214 ? 747% |
| Sequential Write 256KB (MB/s) | 117.7 | 71.5 -39% | 216.1 84% | 118.3 1% | 100.6 -15% | 100.5 ? -15% | 1894 ? 1509% |
| Random Read 4KB (MB/s) | 52.5 | 38.8 -26% | 58.4 11% | 38.78 -26% | 24.54 -53% | 43.1 ? -18% | 310 ? 490% |
| Random Write 4KB (MB/s) | 68.7 | 9.5 -86% | 62.8 -9% | 15.3 -78% | 10.68 -84% | 22.3 ? -68% | 356 ? 418% |
| Sequential Read 256KB SDCard (MB/s) | 81.8 ? | 85 4% | 83.7 ? 2% | 83.4 ? 2% | 81.4 ? 0% | 71.8 ? -12% | |
| Sequential Write 256KB SDCard (MB/s) | 60.9 ? | 61.5 1% | 62.1 ? 2% | 61.3 ? 1% | 65.7 ? 8% | 52.9 ? -13% |
| Asphalt 8: Airborne | |||
| Inställningar | Värde | ||
| high | 30 fps | ||
| very low | 30 fps | ||
| Dead Trigger 2 | |||
| Inställningar | Värde | ||
| high | 30 fps | ||
(±) Den maximala temperaturen på ovansidan är 41.4 °C / 107 F, jämfört med genomsnittet av 35.3 °C / 96 F , allt från 21.9 till 247 °C för klassen Smartphone.
(±) Botten värms upp till maximalt 40.2 °C / 104 F, jämfört med genomsnittet av 34 °C / 93 F
(+) Vid tomgångsbruk är medeltemperaturen för ovansidan 27.5 °C / 82 F, jämfört med enhetsgenomsnittet på 33 °C / ### class_avg_f### F.
Xiaomi Redmi S2 ljudanalys
(±) | högtalarljudstyrkan är genomsnittlig men bra (78.2 dB)
Bas 100 - 315 Hz
(-) | nästan ingen bas - i genomsnitt 31.6% lägre än medianen
(±) | linjäriteten för basen är genomsnittlig (11.5% delta till föregående frekvens)
Mellan 400 - 2000 Hz
(±) | högre mellan - i genomsnitt 5.7% högre än median
(+) | mids är linjära (6.7% delta till föregående frekvens)
Högsta 2 - 16 kHz
(±) | högre toppar - i genomsnitt 5.4% högre än medianen
(+) | toppar är linjära (5.1% delta till föregående frekvens)
Totalt 100 - 16 000 Hz
(±) | linjäriteten för det totala ljudet är genomsnittlig (29% skillnad mot median)
Jämfört med samma klass
» 76% av alla testade enheter i den här klassen var bättre, 3% liknande, 20% sämre
» Den bästa hade ett delta på 11%, genomsnittet var 34%, sämst var 134%
Jämfört med alla testade enheter
» 87% av alla testade enheter var bättre, 2% liknande, 11% sämre
» Den bästa hade ett delta på 4%, genomsnittet var 23%, sämst var 134%
Samsung Galaxy A6 2018 ljudanalys
(+) | högtalare kan spela relativt högt (87 dB)
Bas 100 - 315 Hz
(-) | nästan ingen bas - i genomsnitt 26.5% lägre än medianen
(±) | linjäriteten för basen är genomsnittlig (7.6% delta till föregående frekvens)
Mellan 400 - 2000 Hz
(+) | balanserad mellan - endast 2.8% från medianen
(+) | mids är linjära (5.5% delta till föregående frekvens)
Högsta 2 - 16 kHz
(+) | balanserade toppar - endast 3.5% från medianen
(+) | toppar är linjära (6.2% delta till föregående frekvens)
Totalt 100 - 16 000 Hz
(±) | linjäriteten för det totala ljudet är genomsnittlig (17.4% skillnad mot median)
Jämfört med samma klass
» 13% av alla testade enheter i den här klassen var bättre, 8% liknande, 79% sämre
» Den bästa hade ett delta på 11%, genomsnittet var 34%, sämst var 134%
Jämfört med alla testade enheter
» 33% av alla testade enheter var bättre, 8% liknande, 58% sämre
» Den bästa hade ett delta på 4%, genomsnittet var 23%, sämst var 134%
| Av/Standby | |
| Låg belastning | |
| Hög belastning |
|
Förklaring:
min: | |
| Xiaomi Redmi S2 3080 mAh | Huawei Y7 2018 3000 mAh | Motorola Moto G6 Plus 3200 mAh | Nokia 6 2018 3000 mAh | Samsung Galaxy A6 2018 3000 mAh | Genomsnitt Qualcomm Snapdragon 625 | Genomsnitt av klass Smartphone | |
|---|---|---|---|---|---|---|---|
| Power Consumption | 26% | 41% | 44% | 48% | 31% | 8% | |
| Idle Minimum * (Watt) | 2 | 0.9 55% | 0.5 75% | 0.67 66% | 0.81 59% | 0.981 ? 51% | 0.888 ? 56% |
| Idle Average * (Watt) | 2.6 | 1.9 27% | 1.78 32% | 1.76 32% | 1.26 52% | 1.985 ? 24% | 1.481 ? 43% |
| Idle Maximum * (Watt) | 3.5 | 2.3 34% | 1.81 48% | 1.78 49% | 1.3 63% | 2.27 ? 35% | 1.669 ? 52% |
| Load Average * (Watt) | 4.6 | 4.7 -2% | 3.3 28% | 2.82 39% | 2.87 38% | 3.51 ? 24% | 6.73 ? -46% |
| Load Maximum * (Watt) | 6.7 | 5.7 15% | 5.14 23% | 4.56 32% | 4.82 28% | 5.38 ? 20% | 11.2 ? -67% |
* ... mindre är bättre
| Xiaomi Redmi S2 3080 mAh | Huawei Y7 2018 3000 mAh | Motorola Moto G6 Plus 3200 mAh | Nokia 6 2018 3000 mAh | Samsung Galaxy A6 2018 3000 mAh | |
|---|---|---|---|---|---|
| Batteridrifttid | 35% | 89% | 86% | 61% | |
| H.264 (h) | 15.2 | 11.5 -24% | 9 -41% | 11.3 -26% | 14.5 -5% |
| WiFi v1.3 (h) | 18.8 | 10.4 -45% | 11.7 -38% | 15.7 -16% | 10.1 -46% |
| Load (h) | 1.5 | 4.1 173% | 6.7 347% | 6 300% | 5 233% |
| Reader / Idle (h) | 21.8 | 30.8 | 30.6 | 26.9 |
För
Emot
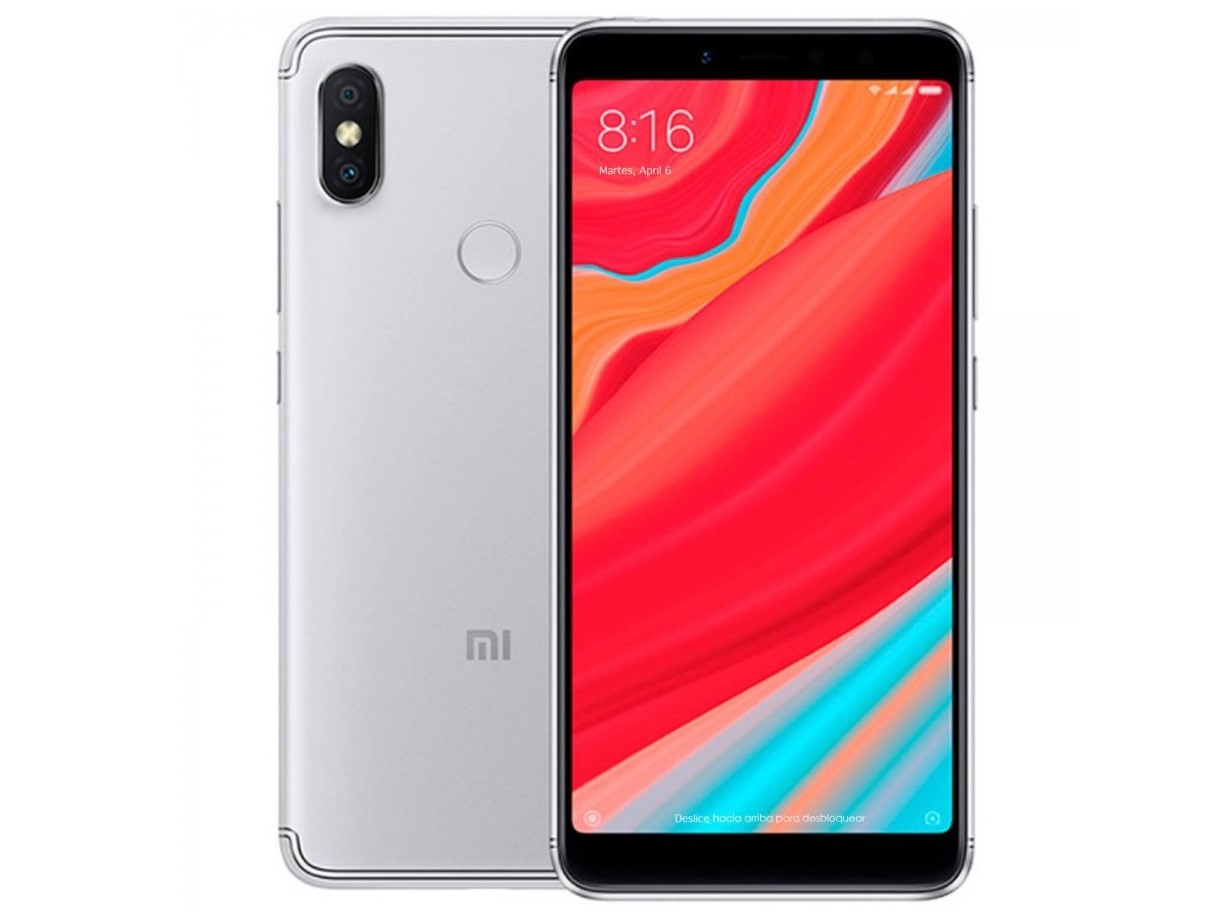
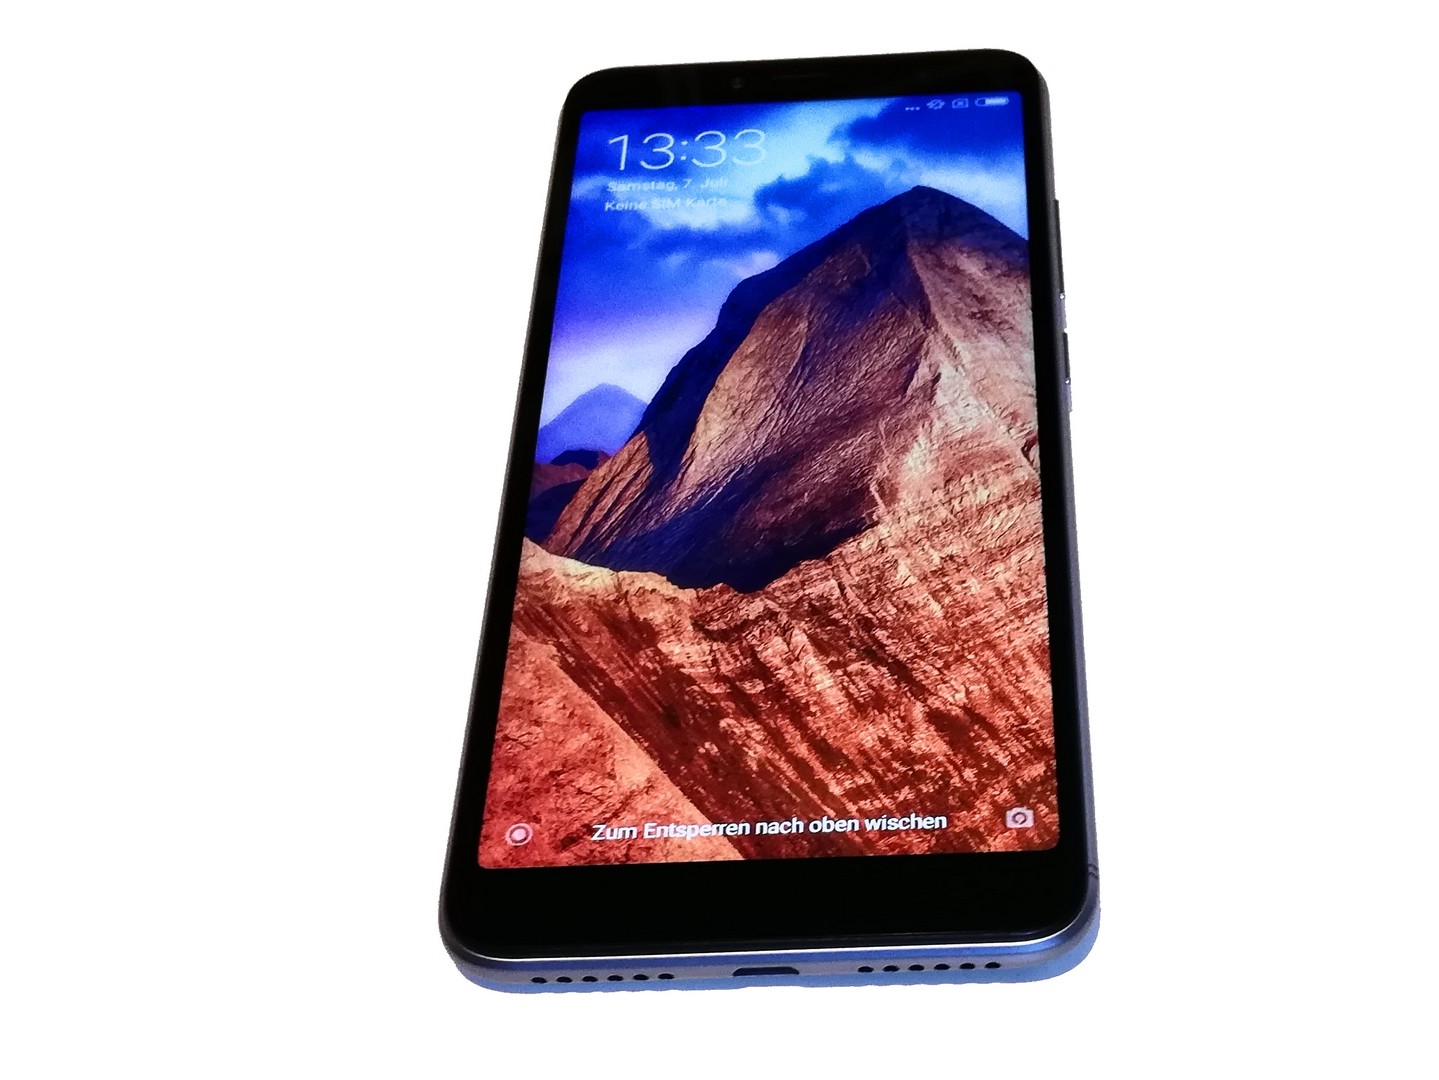
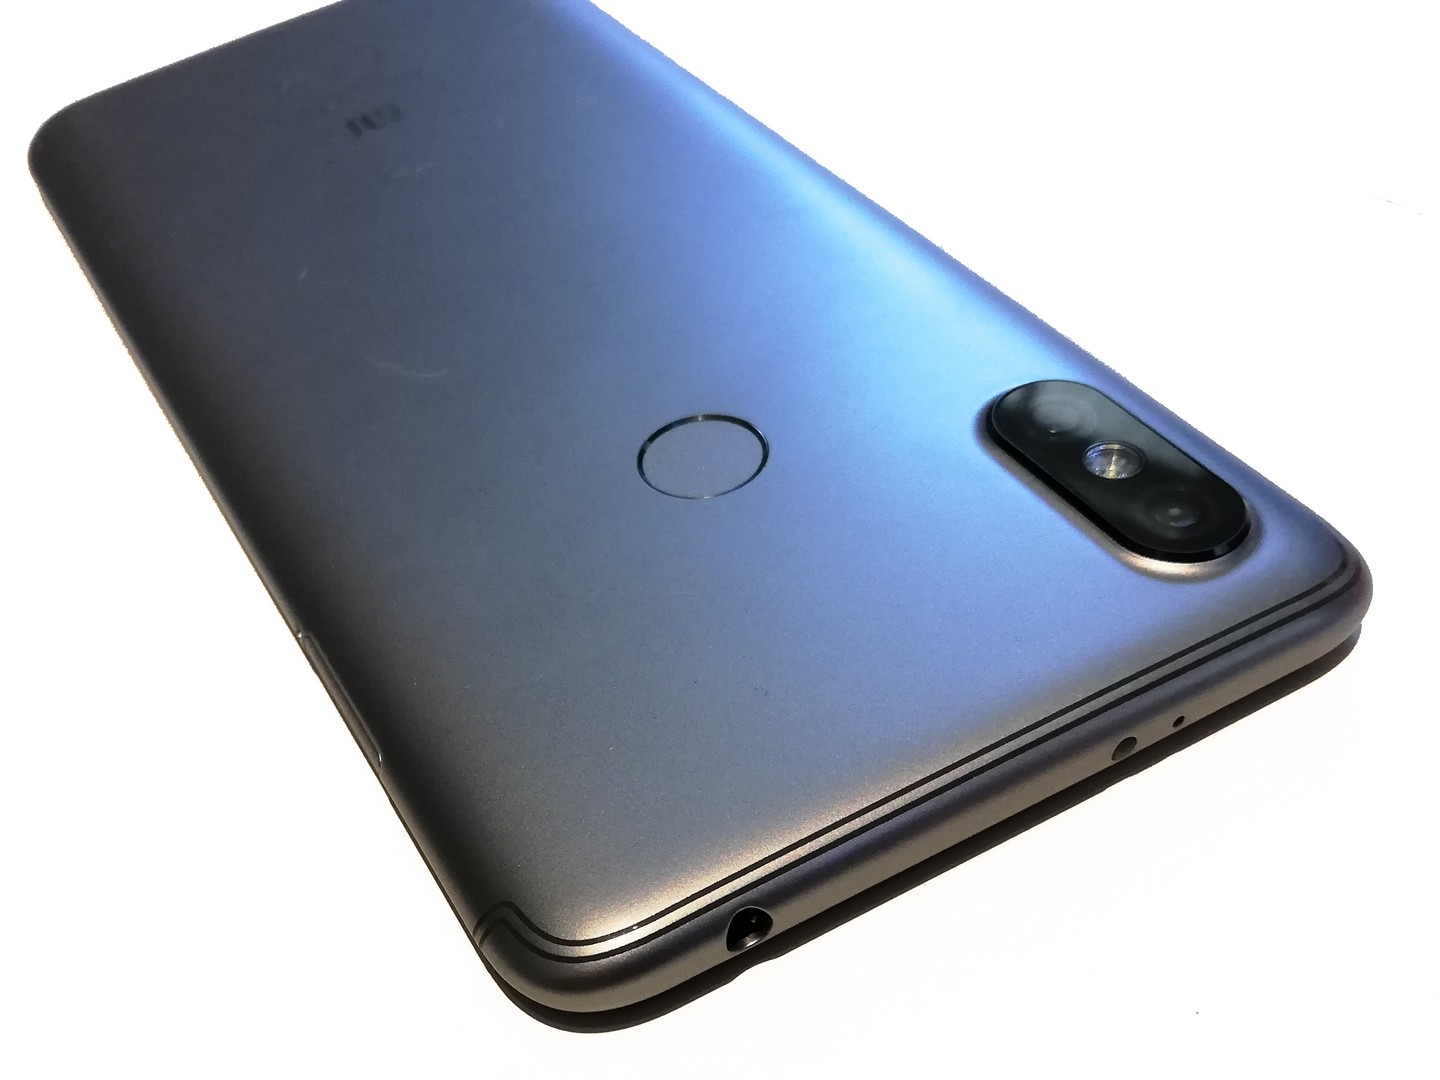
I våra tester visar sig Redmi S2 vara en bra mittenskiktstelefon som stolt kan marschera genom leden av konkurrenter. För att attrahera selfie-fantaster har Xiaomi utrustat vår testenhet med en riktigt bra framåtriktad kamera; ett unikt säljargument jämfört med dess konkurrenter. Även huvudkameran lämpar sig för enstaka foton.
Prestandatesternas resultat kan intyga att telefonens goda systemprestanda borde vara tillräcklig för nästan varje tänkbart app-scenario. Den som letar efter ett kap eller gillar enheter med gedigen, grundläggande hårdvara kommer vara nöjd med Xiaomis senaste modell i Redmi-serien och kan med säkerhet tacka ja till detta erbjudande.
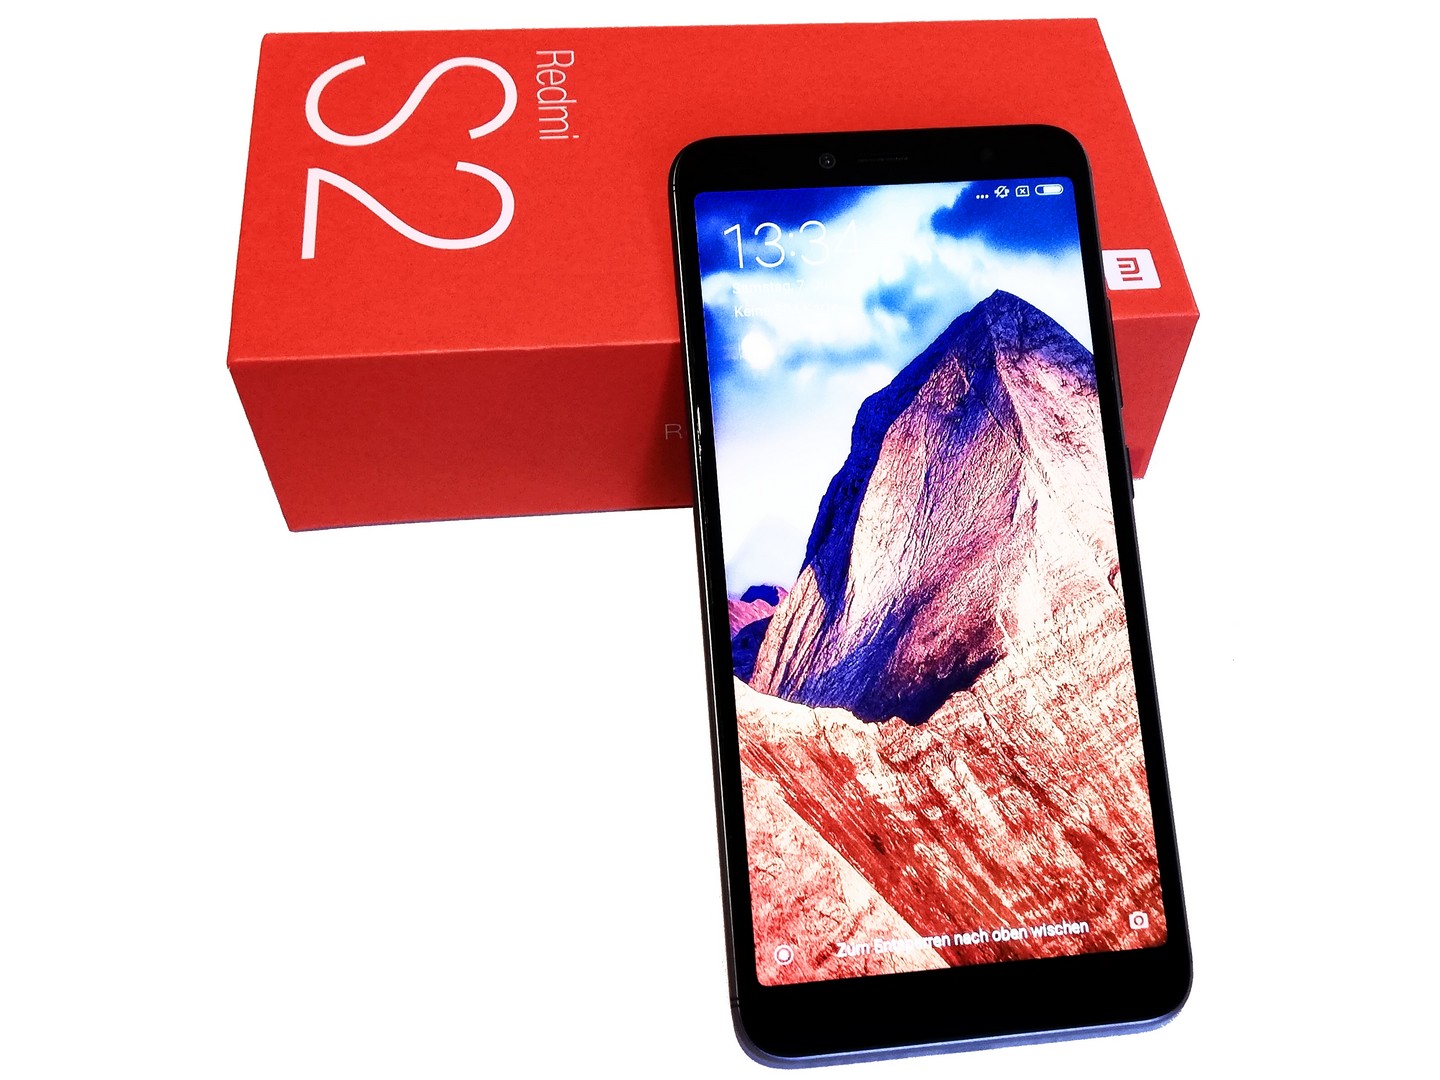
Xiaomi Redmi S2 är en bra mittenskiktstelefon. Med sin högupplösta framåtriktade kamera är enheten inte bara lämplig för selfie-fantaster; tack vare god systemprestanda kan den även tilltala andra intresserade köpare.
Xiaomi Redmi S2
- 07/11/2018 v6 (old)
Mike Wobker