Test: Xiaomi Pocophone F1 Smartphone (Sammanfattning)
| Networking | |
| iperf3 transmit AX12 | |
| Sony Xperia XZ2 Premium | |
| Xiaomi Poco F1 | |
| OnePlus 6 | |
| Samsung Galaxy S9 Plus | |
| Honor 10 | |
| iperf3 receive AX12 | |
| Sony Xperia XZ2 Premium | |
| Xiaomi Poco F1 | |
| Samsung Galaxy S9 Plus | |
| OnePlus 6 | |
| Honor 10 | |


| |||||||||||||||||||||||||
Distribution av ljusstyrkan: 93 %
Mitt på batteriet: 489 cd/m²
Kontrast: 1438:1 (Svärta: 0.34 cd/m²)
ΔE ColorChecker Calman: 3.8 | ∀{0.5-29.43 Ø4.73}
ΔE Greyscale Calman: 4.4 | ∀{0.09-98 Ø4.97}
99.5% sRGB (Calman 2D)
Gamma: 2.22
CCT: 7213 K
| Xiaomi Poco F1 IPS, 2246x1080, 6.2" | Honor 10 IPS, 2280x1080, 5.8" | OnePlus 6 Optic AMOLED, 2280x1080, 6.3" | Nokia 7 Plus IPS, 2160x1080, 6" | Samsung Galaxy S9 Plus Super AMOLED, 2960x1440, 6.2" | LG G7 ThinQ IPS, 3120x1440, 6.1" | |
|---|---|---|---|---|---|---|
| Screen | 9% | 15% | 7% | 27% | 7% | |
| Brightness middle (cd/m²) | 489 | 555 13% | 430 -12% | 458 -6% | 565 16% | 974 99% |
| Brightness (cd/m²) | 486 | 537 10% | 437 -10% | 463 -5% | 571 17% | 975 101% |
| Brightness Distribution (%) | 93 | 94 1% | 87 -6% | 92 -1% | 96 3% | 96 3% |
| Black Level * (cd/m²) | 0.34 | 0.39 -15% | 0.22 35% | 0.49 -44% | ||
| Contrast (:1) | 1438 | 1423 -1% | 2082 45% | 1988 38% | ||
| Colorchecker dE 2000 * | 3.8 | 2.3 39% | 2.3 39% | 4 -5% | 2.3 39% | 5.4 -42% |
| Colorchecker dE 2000 max. * | 7.1 | 6 15% | 4.6 35% | 7.4 -4% | 4.8 32% | 13.1 -85% |
| Greyscale dE 2000 * | 4.4 | 3.9 11% | 2.4 45% | 4.7 -7% | 1.9 57% | 5 -14% |
| Gamma | 2.22 99% | 2.19 100% | 2.28 96% | 2.19 100% | 2.16 102% | 2.31 95% |
| CCT | 7213 90% | 6212 105% | 6160 106% | 7425 88% | 6332 103% | 7480 87% |
* ... mindre är bättre
Skärmflimmer / PWM (Puls-Width Modulation)
| Skärmflimmer / PWM upptäckt | 2315 Hz | ≤ 20 % ljusstyrka inställning | 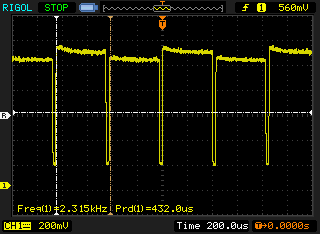 |
Displayens bakgrundsbelysning flimrar vid 2315 Hz (i värsta fall, t.ex. med PWM) Flimrande upptäckt vid en ljusstyrkeinställning på 20 % och lägre. Det ska inte finnas något flimmer eller PWM över denna ljusstyrkeinställning. Frekvensen för 2315 Hz är ganska hög, så de flesta användare som är känsliga för PWM bör inte märka något flimmer. Som jämförelse: 52 % av alla testade enheter använder inte PWM för att dämpa skärmen. Om PWM upptäcktes mättes ett medelvärde av 7784 (minst: 5 - maximum: 343500) Hz. | |||
Visa svarstider
| ↔ Svarstid svart till vitt | ||
|---|---|---|
| 24 ms ... stiga ↗ och falla ↘ kombinerat | ↗ 9.2 ms stiga | 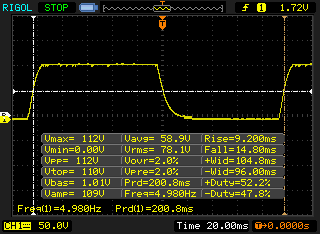 |
| ↘ 14.8 ms hösten | ||
| Skärmen visar bra svarsfrekvens i våra tester, men kan vara för långsam för konkurrenskraftiga spelare. I jämförelse sträcker sig alla testade enheter från 0.1 (minst) till 240 (maximalt) ms. » 54 % av alla enheter är bättre. Detta innebär att den uppmätta svarstiden är sämre än genomsnittet av alla testade enheter (19.9 ms). | ||
| ↔ Svarstid 50 % grått till 80 % grått | ||
| 44 ms ... stiga ↗ och falla ↘ kombinerat | ↗ 21.6 ms stiga | 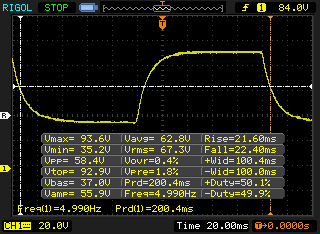 |
| ↘ 22.4 ms hösten | ||
| Skärmen visar långsamma svarsfrekvenser i våra tester och kommer att vara otillfredsställande för spelare. I jämförelse sträcker sig alla testade enheter från 0.165 (minst) till 636 (maximalt) ms. » 73 % av alla enheter är bättre. Detta innebär att den uppmätta svarstiden är sämre än genomsnittet av alla testade enheter (31.1 ms). | ||
| Lightmark - 1920x1080 1080p (sortera efter värde) | |
| Nokia 7 Plus | |
| Samsung Galaxy S9 Plus | |
| Huawei P20 Pro | |
| Basemark ES 3.1 / Metal - offscreen Overall Score (sortera efter värde) | |
| OnePlus 6 | |
| Nokia 7 Plus | |
| LG G7 ThinQ | |
| Samsung Galaxy S9 Plus | |
| Huawei P20 Pro | |
| Genomsnitt Qualcomm Snapdragon 845 (1169 - 1201, n=5) | |
| Genomsnitt av klass Smartphone (544 - 7731, n=24, senaste 2 åren) | |
| JetStream 1.1 - 1.1 Total | |
| LG G7 ThinQ (Chrome 66) | |
| OnePlus 6 (Chrome 66) | |
| Genomsnitt Qualcomm Snapdragon 845 (22.5 - 90.9, n=25) | |
| Xiaomi Poco F1 (Chrome 68) | |
| Sony Xperia XZ2 Premium (Chrome 68) | |
| Samsung Galaxy S9 Plus (Samsung Browser 7.0) | |
| Huawei P20 Pro (Chrome 65) | |
| Honor 10 (Chrome 66) | |
| Nokia 7 Plus (Chrome 60) | |
| Octane V2 - Total Score | |
| Genomsnitt av klass Smartphone (2800 - 126661, n=156, senaste 2 åren) | |
| OnePlus 6 (Chrome 66) | |
| LG G7 ThinQ (Chrome 66) | |
| Genomsnitt Qualcomm Snapdragon 845 (3991 - 18275, n=28) | |
| Samsung Galaxy S9 Plus (Samsung Browser 7.0) | |
| Xiaomi Poco F1 (Chrome 68) | |
| Sony Xperia XZ2 Premium (Chrome 68) | |
| Huawei P20 Pro (Chrome 65) | |
| Honor 10 (Chrome 66) | |
| Nokia 7 Plus (Chrome 60) | |
| Mozilla Kraken 1.1 - Total | |
| Nokia 7 Plus (Chrome 60) | |
| Honor 10 (Chrome 66) | |
| Huawei P20 Pro (Chrome 65) | |
| Sony Xperia XZ2 Premium (Chrome 68) | |
| Genomsnitt Qualcomm Snapdragon 845 (2154 - 11204, n=28) | |
| Xiaomi Poco F1 (Chrome 68) | |
| LG G7 ThinQ (Chrome 66) | |
| OnePlus 6 (Chrome 66) | |
| Samsung Galaxy S9 Plus (Samsung Browser 7.0) | |
| Genomsnitt av klass Smartphone (257 - 28190, n=134, senaste 2 åren) | |
| WebXPRT 2015 - Overall | |
| OnePlus 6 (Chrome 66) | |
| LG G7 ThinQ (Chrome 66) | |
| Genomsnitt Qualcomm Snapdragon 845 (96 - 291, n=23) | |
| Xiaomi Poco F1 (Chrome 68) | |
| Sony Xperia XZ2 Premium (Chrome 68) | |
| Huawei P20 Pro (Chrome 65) | |
| Honor 10 (Chrome 66) | |
| Nokia 7 Plus (Chrome 60) | |
| Samsung Galaxy S9 Plus (Samsung Browser 7.0) | |
* ... mindre är bättre
| Xiaomi Poco F1 | Nokia 7 Plus | LG G7 ThinQ | Samsung Galaxy S9 Plus | Sony Xperia XZ2 Premium | Honor 10 | OnePlus 6 | Genomsnitt 64 GB UFS 2.1 Flash | Genomsnitt av klass Smartphone | |
|---|---|---|---|---|---|---|---|---|---|
| AndroBench 3-5 | -12% | 8% | 17% | -7% | 225% | 23% | 69% | 872% | |
| Sequential Read 256KB (MB/s) | 705 | 283.1 -60% | 695 -1% | 819 16% | 749 6% | 828 17% | 726 3% | 696 ? -1% | 2242 ? 218% |
| Sequential Write 256KB (MB/s) | 155.6 | 211.6 36% | 176.4 13% | 204.9 32% | 171 10% | 192.1 23% | 201.4 29% | 224 ? 44% | 1924 ? 1137% |
| Random Read 4KB (MB/s) | 101 | 54.7 -46% | 110.5 9% | 129.7 28% | 136 35% | 145.9 44% | 137 36% | 137.2 ? 36% | 309 ? 206% |
| Random Write 4KB (MB/s) | 17.81 | 19.62 10% | 23.26 31% | 22.74 28% | 21.75 22% | 163 815% | 21.8 22% | 84.7 ? 376% | 361 ? 1927% |
| Sequential Read 256KB SDCard (MB/s) | 85.3 ? | 82.2 -4% | 84.7 ? -1% | 79.2 ? -7% | 34.18 ? -60% | 68.6 ? -20% | |||
| Sequential Write 256KB SDCard (MB/s) | 65.6 ? | 62.3 -5% | 62.7 ? -4% | 67.2 ? 2% | 30.23 ? -54% | 52.2 ? -20% |
PUBG Mobile
Arena of Valor
(+) Den maximala temperaturen på ovansidan är 35.1 °C / 95 F, jämfört med genomsnittet av 35.3 °C / 96 F , allt från 21.9 till 247 °C för klassen Smartphone.
(+) Botten värms upp till maximalt 33.9 °C / 93 F, jämfört med genomsnittet av 34 °C / 93 F
(+) Vid tomgångsbruk är medeltemperaturen för ovansidan 28.6 °C / 83 F, jämfört med enhetsgenomsnittet på 33 °C / ### class_avg_f### F.
Xiaomi Poco F1 ljudanalys
(+) | högtalare kan spela relativt högt (83.4 dB)
Bas 100 - 315 Hz
(-) | nästan ingen bas - i genomsnitt 24.4% lägre än medianen
(±) | linjäriteten för basen är genomsnittlig (10.6% delta till föregående frekvens)
Mellan 400 - 2000 Hz
(±) | högre mellan - i genomsnitt 6.2% högre än median
(±) | linjäriteten för mids är genomsnittlig (10.2% delta till föregående frekvens)
Högsta 2 - 16 kHz
(±) | högre toppar - i genomsnitt 5.3% högre än medianen
(+) | toppar är linjära (5.8% delta till föregående frekvens)
Totalt 100 - 16 000 Hz
(±) | linjäriteten för det totala ljudet är genomsnittlig (23.9% skillnad mot median)
Jämfört med samma klass
» 55% av alla testade enheter i den här klassen var bättre, 8% liknande, 37% sämre
» Den bästa hade ett delta på 11%, genomsnittet var 34%, sämst var 134%
Jämfört med alla testade enheter
» 72% av alla testade enheter var bättre, 6% liknande, 22% sämre
» Den bästa hade ett delta på 4%, genomsnittet var 24%, sämst var 134%
Sony Xperia XZ2 Premium ljudanalys
(+) | högtalare kan spela relativt högt (83.6 dB)
Bas 100 - 315 Hz
(-) | nästan ingen bas - i genomsnitt 34.5% lägre än medianen
(±) | linjäriteten för basen är genomsnittlig (9.2% delta till föregående frekvens)
Mellan 400 - 2000 Hz
(+) | balanserad mellan - endast 4% från medianen
(+) | mids är linjära (6.3% delta till föregående frekvens)
Högsta 2 - 16 kHz
(+) | balanserade toppar - endast 3.5% från medianen
(+) | toppar är linjära (3.5% delta till föregående frekvens)
Totalt 100 - 16 000 Hz
(±) | linjäriteten för det totala ljudet är genomsnittlig (23.9% skillnad mot median)
Jämfört med samma klass
» 55% av alla testade enheter i den här klassen var bättre, 8% liknande, 37% sämre
» Den bästa hade ett delta på 11%, genomsnittet var 34%, sämst var 134%
Jämfört med alla testade enheter
» 72% av alla testade enheter var bättre, 6% liknande, 22% sämre
» Den bästa hade ett delta på 4%, genomsnittet var 24%, sämst var 134%
| Av/Standby | |
| Låg belastning | |
| Hög belastning |
|
Förklaring:
min: | |
| Xiaomi Poco F1 4000 mAh | Nokia 7 Plus 3800 mAh | Honor 10 3400 mAh | OnePlus 6 3300 mAh | Samsung Galaxy S9 Plus 3500 mAh | Genomsnitt Qualcomm Snapdragon 845 | Genomsnitt av klass Smartphone | |
|---|---|---|---|---|---|---|---|
| Power Consumption | 3% | -22% | 16% | 26% | -8% | -15% | |
| Idle Minimum * (Watt) | 0.65 | 0.65 -0% | 1.12 -72% | 0.6 8% | 0.68 -5% | 0.862 ? -33% | 0.87 ? -34% |
| Idle Average * (Watt) | 1.97 | 1.76 11% | 2.26 -15% | 1 49% | 0.95 52% | 1.728 ? 12% | 1.467 ? 26% |
| Idle Maximum * (Watt) | 2.01 | 1.78 11% | 2.3 -14% | 1.6 20% | 1.09 46% | 2.07 ? -3% | 1.656 ? 18% |
| Load Average * (Watt) | 4.29 | 4.47 -4% | 5.14 -20% | 4.3 -0% | 4.58 -7% | 4.87 ? -14% | 6.81 ? -59% |
| Load Maximum * (Watt) | 9.05 | 9.13 -1% | 7.89 13% | 8.6 5% | 5.16 43% | 9.27 ? -2% | 11.3 ? -25% |
* ... mindre är bättre
| Xiaomi Poco F1 4000 mAh | Honor 10 3400 mAh | OnePlus 6 3300 mAh | Nokia 7 Plus 3800 mAh | LG G7 ThinQ 3000 mAh | Samsung Galaxy S9 Plus 3500 mAh | Huawei P20 Pro 4000 mAh | Sony Xperia XZ2 Premium 3540 mAh | |
|---|---|---|---|---|---|---|---|---|
| Batteridrifttid | -24% | -6% | -22% | -9% | -23% | 4% | -27% | |
| Reader / Idle (h) | 34.8 | 19.4 -44% | 30.1 -14% | 28.4 -18% | 27.7 -20% | 22.4 -36% | 28.8 -17% | 22.5 -35% |
| H.264 (h) | 15.6 | 11 -29% | 13.2 -15% | 11.8 -24% | 15.1 -3% | 11.2 -28% | 13.1 -16% | 8.7 -44% |
| WiFi v1.3 (h) | 13.5 | 11.1 -18% | 12.7 -6% | 11.2 -17% | 9.9 -27% | 8.7 -36% | 12.4 -8% | 9.1 -33% |
| Load (h) | 3.7 | 3.6 -3% | 4.1 11% | 2.6 -30% | 4.3 16% | 4 8% | 5.8 57% | 3.9 5% |
För
Emot
Läs den fullständiga versionen av den här recensionen på engelska här.
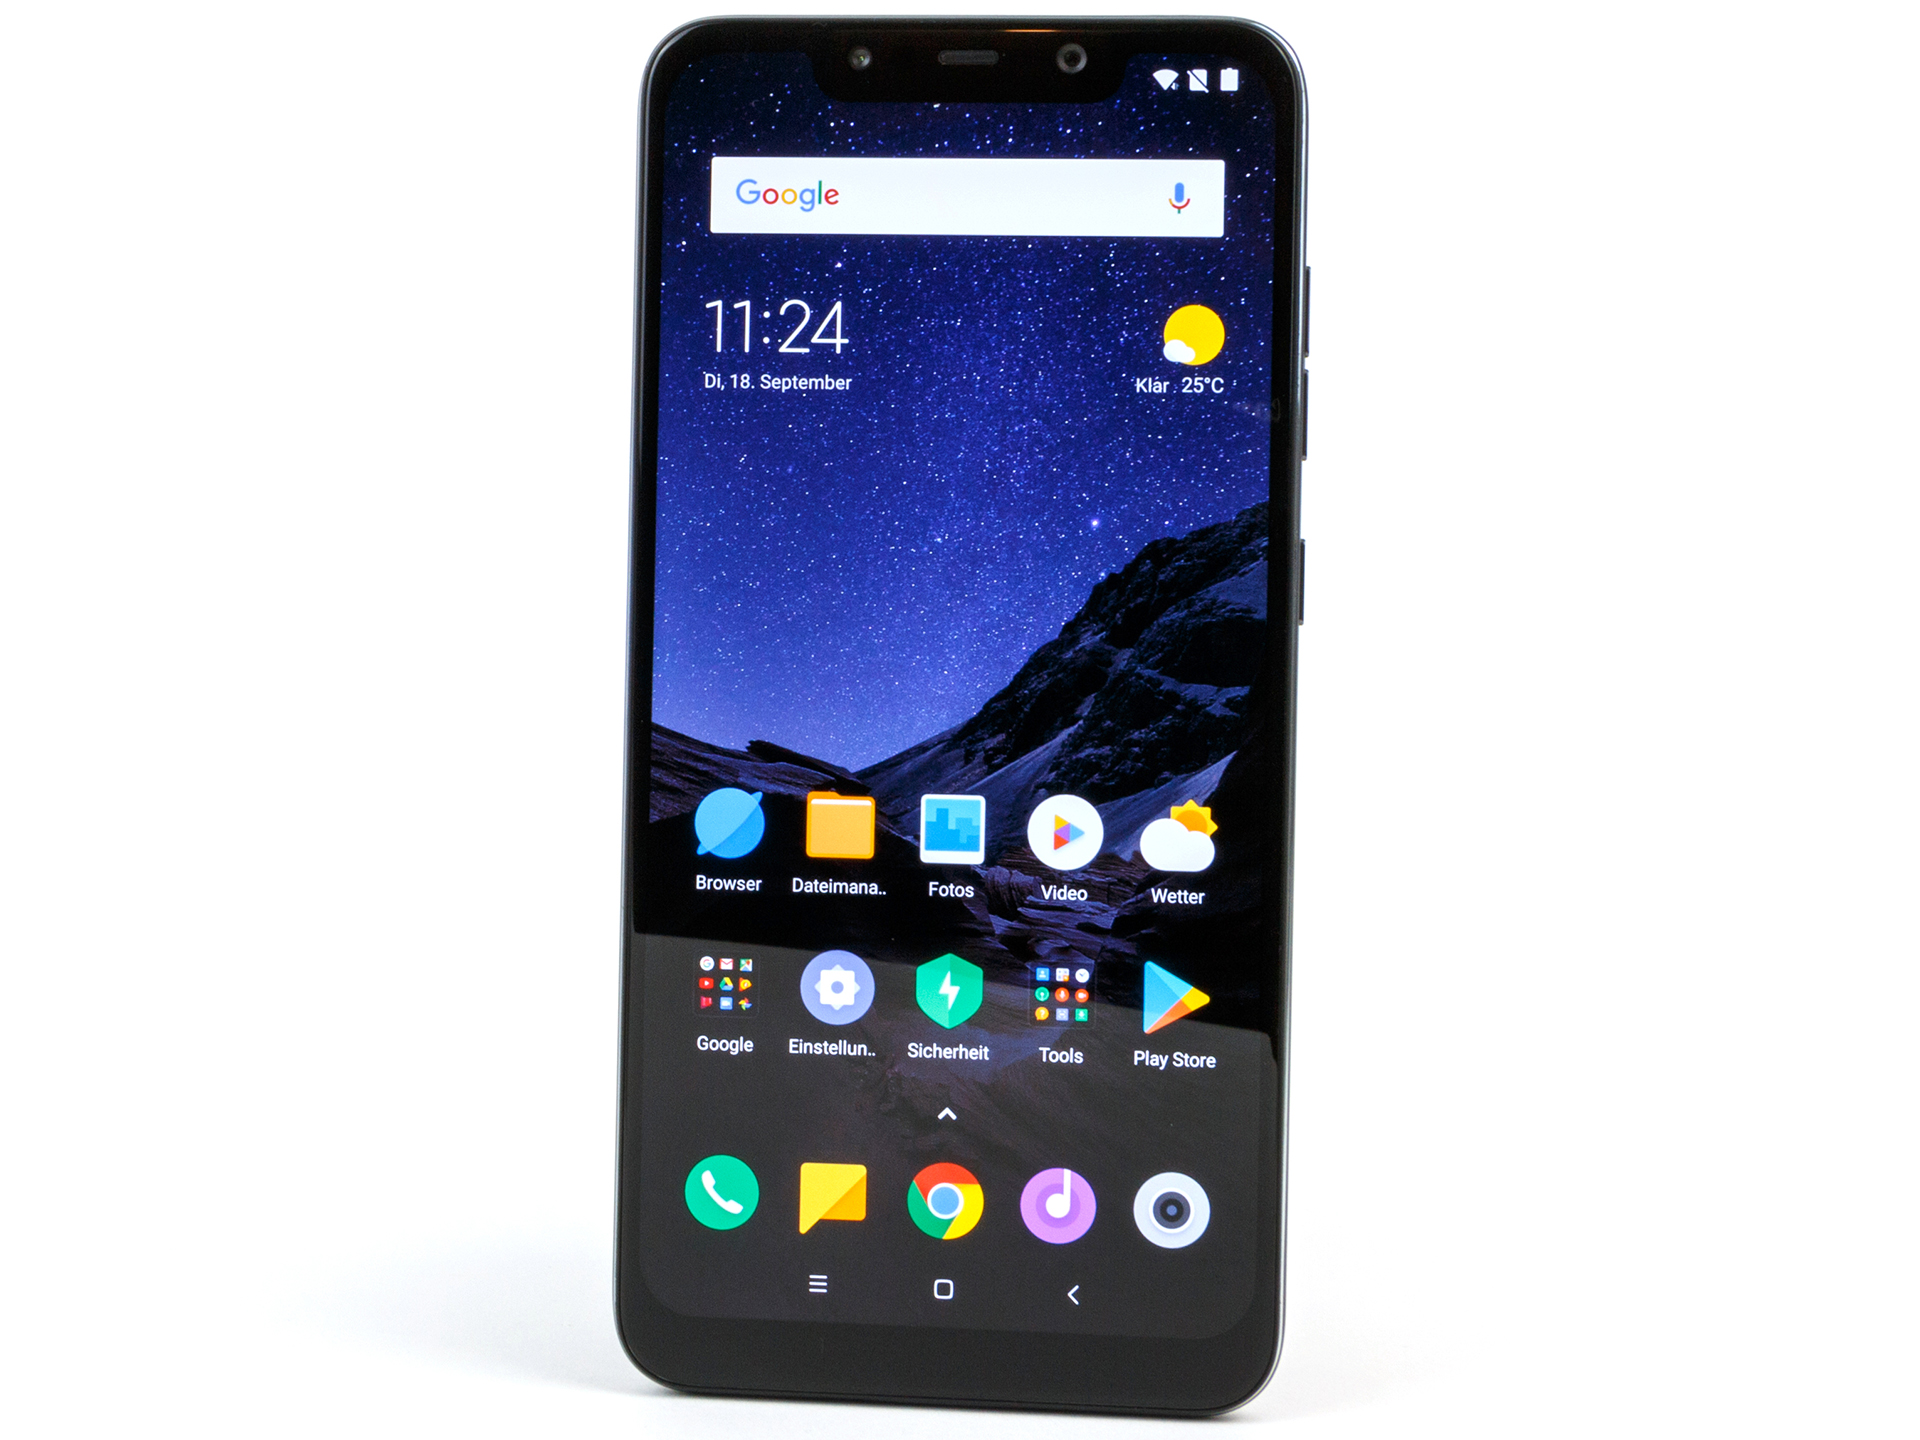
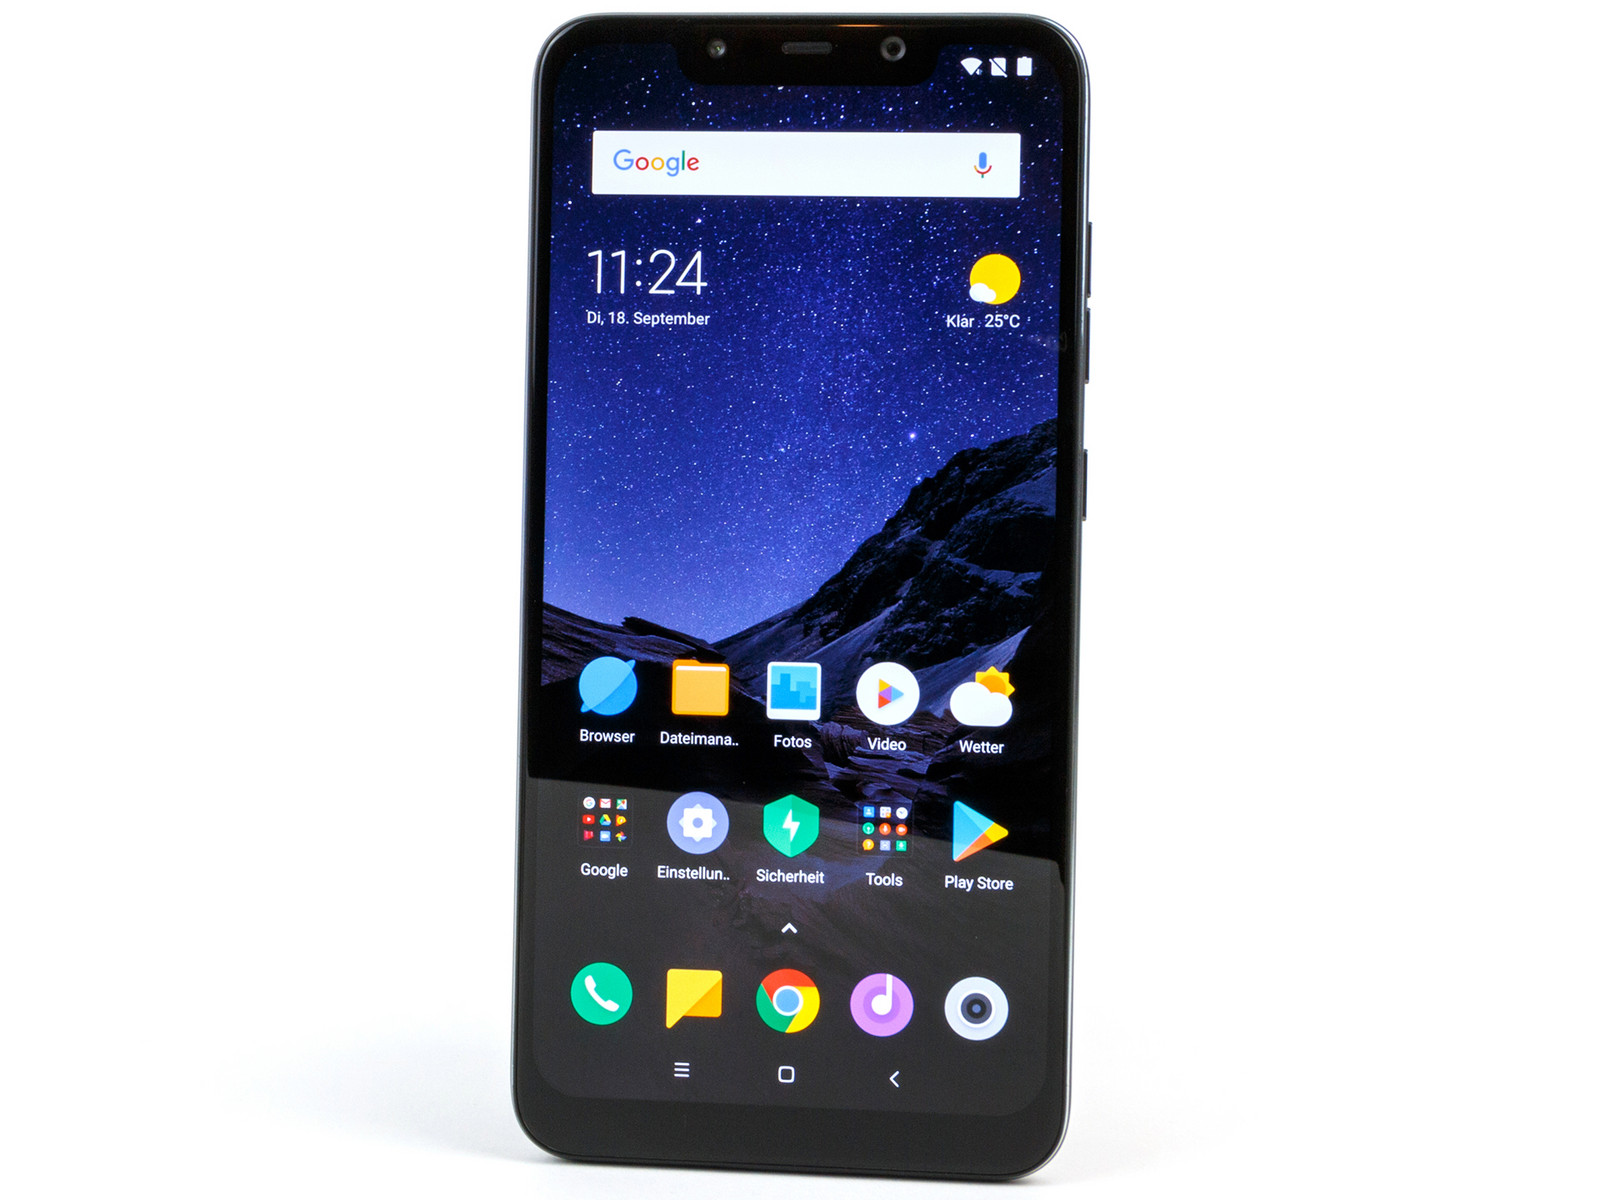
Xiaomi har gett nytt liv åt OnePlus ursprungliga koncept som gick ut på att skapa en flaggskeppstelefon till budgetpris. Xiaomi Pocophone F1 presterade bra på i princip alla våra tester, särskilt när det kom till batteritid, kamerakvalitet och prestanda.
Vår testenhet använder sin Snapdragon 845 SoC väl, men Pocophone kan inte möta förväntningarna från den LiquidCool-teknik man gjort reklam för. Frustrerande nog bombarderade operativsystemet oss med reklam samtidigt som avsaknaden av HD-stöd för Amazon och Netflix kan vara en avgörande faktor för en del.
Xiaomi Pocophone F1 är mycket prisvärd, särskilt med tanke på dess kraftfulla SoC, imponerande batteritid och utmärkta kameror. För det här priset får du dock leva med några besparingar.
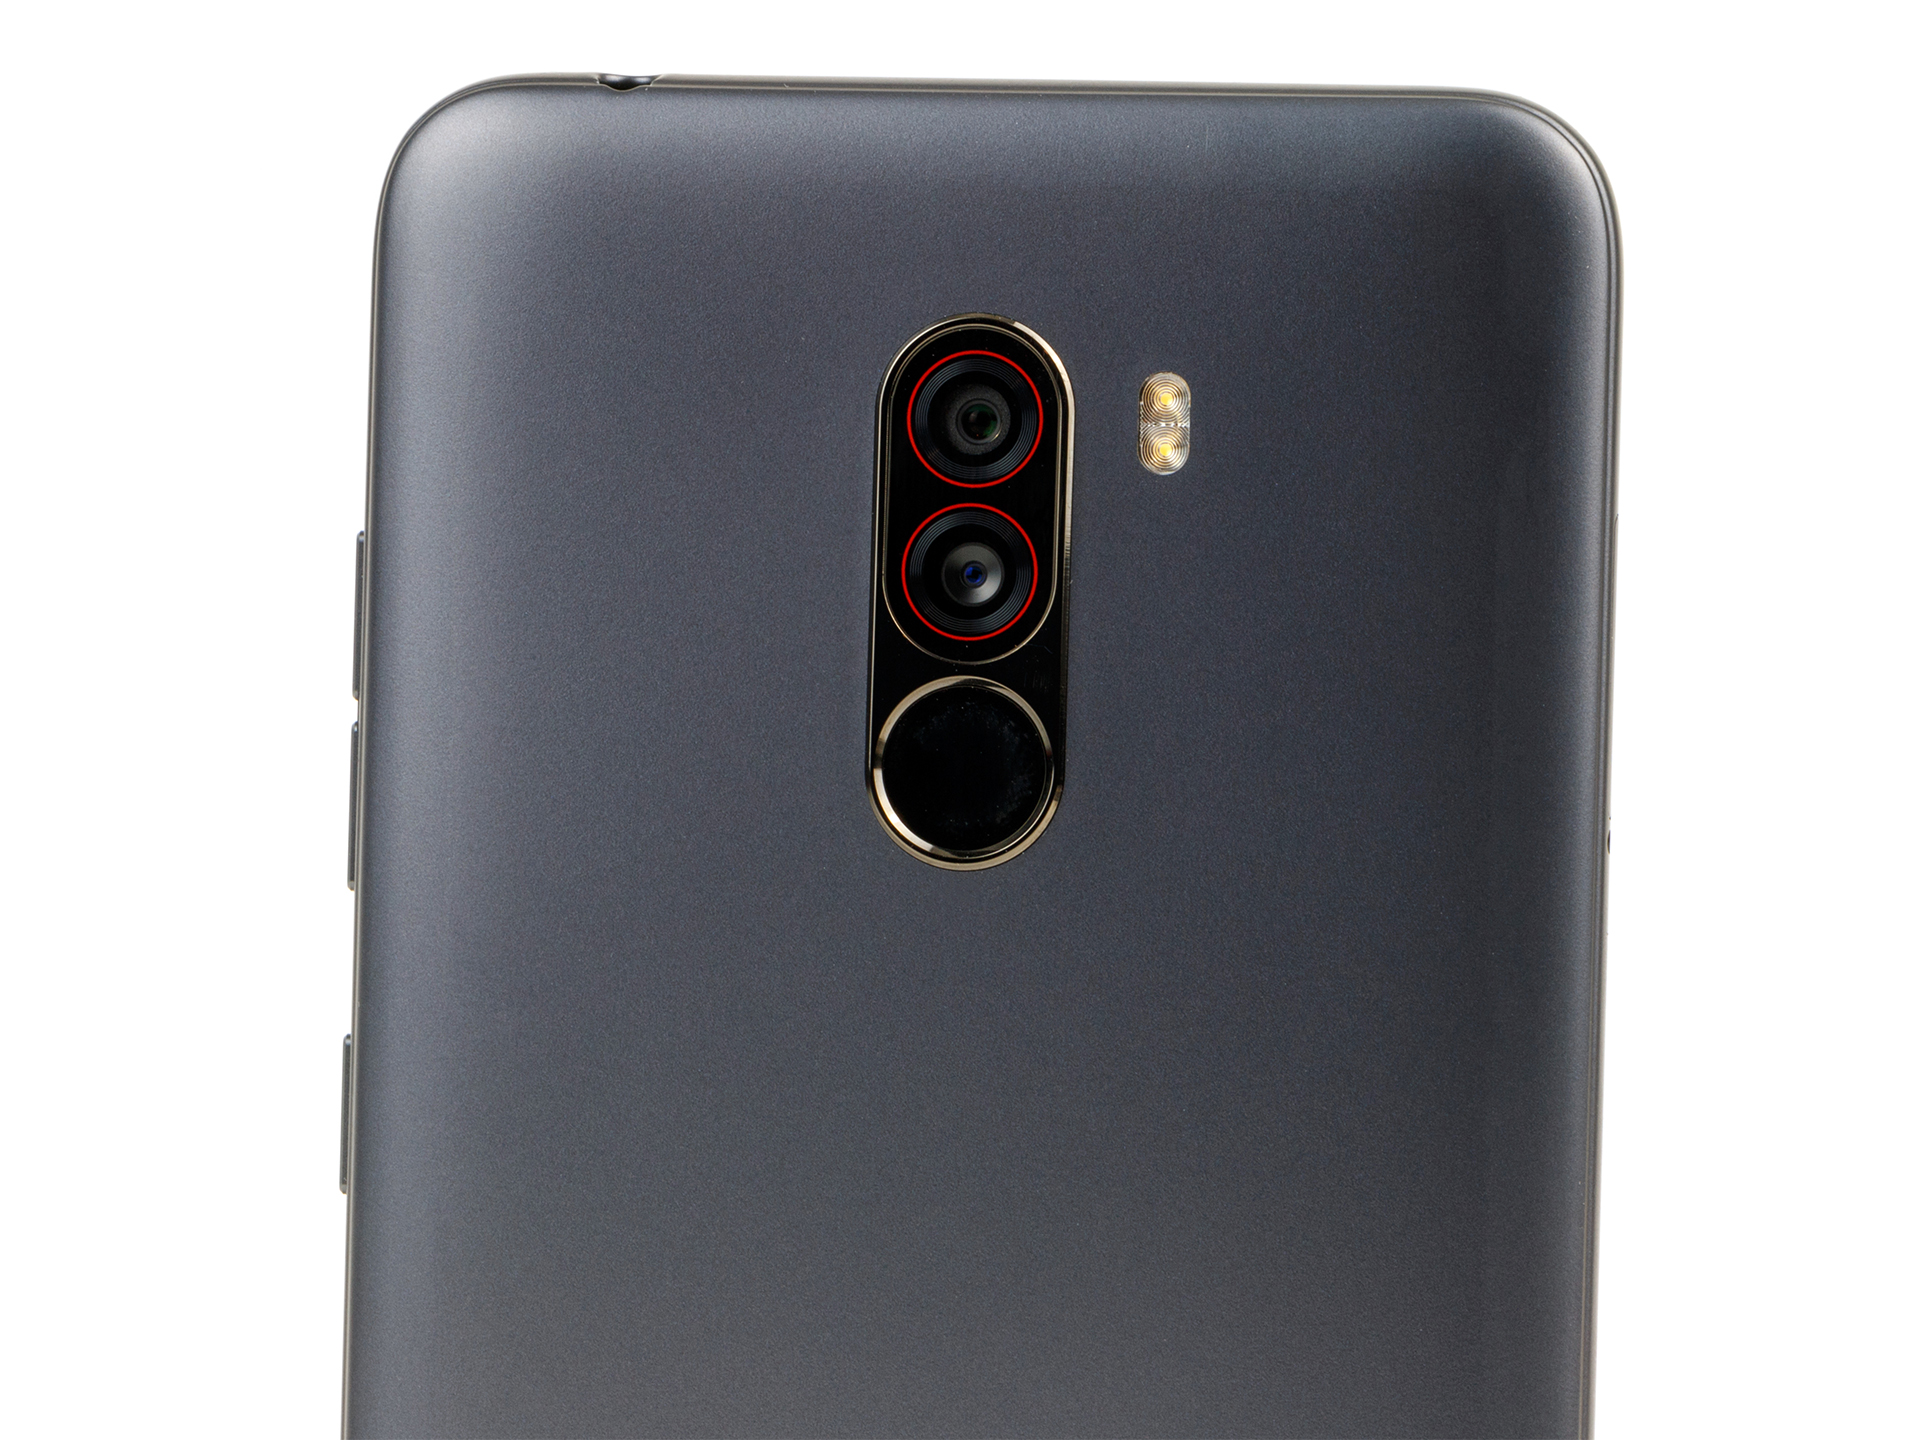
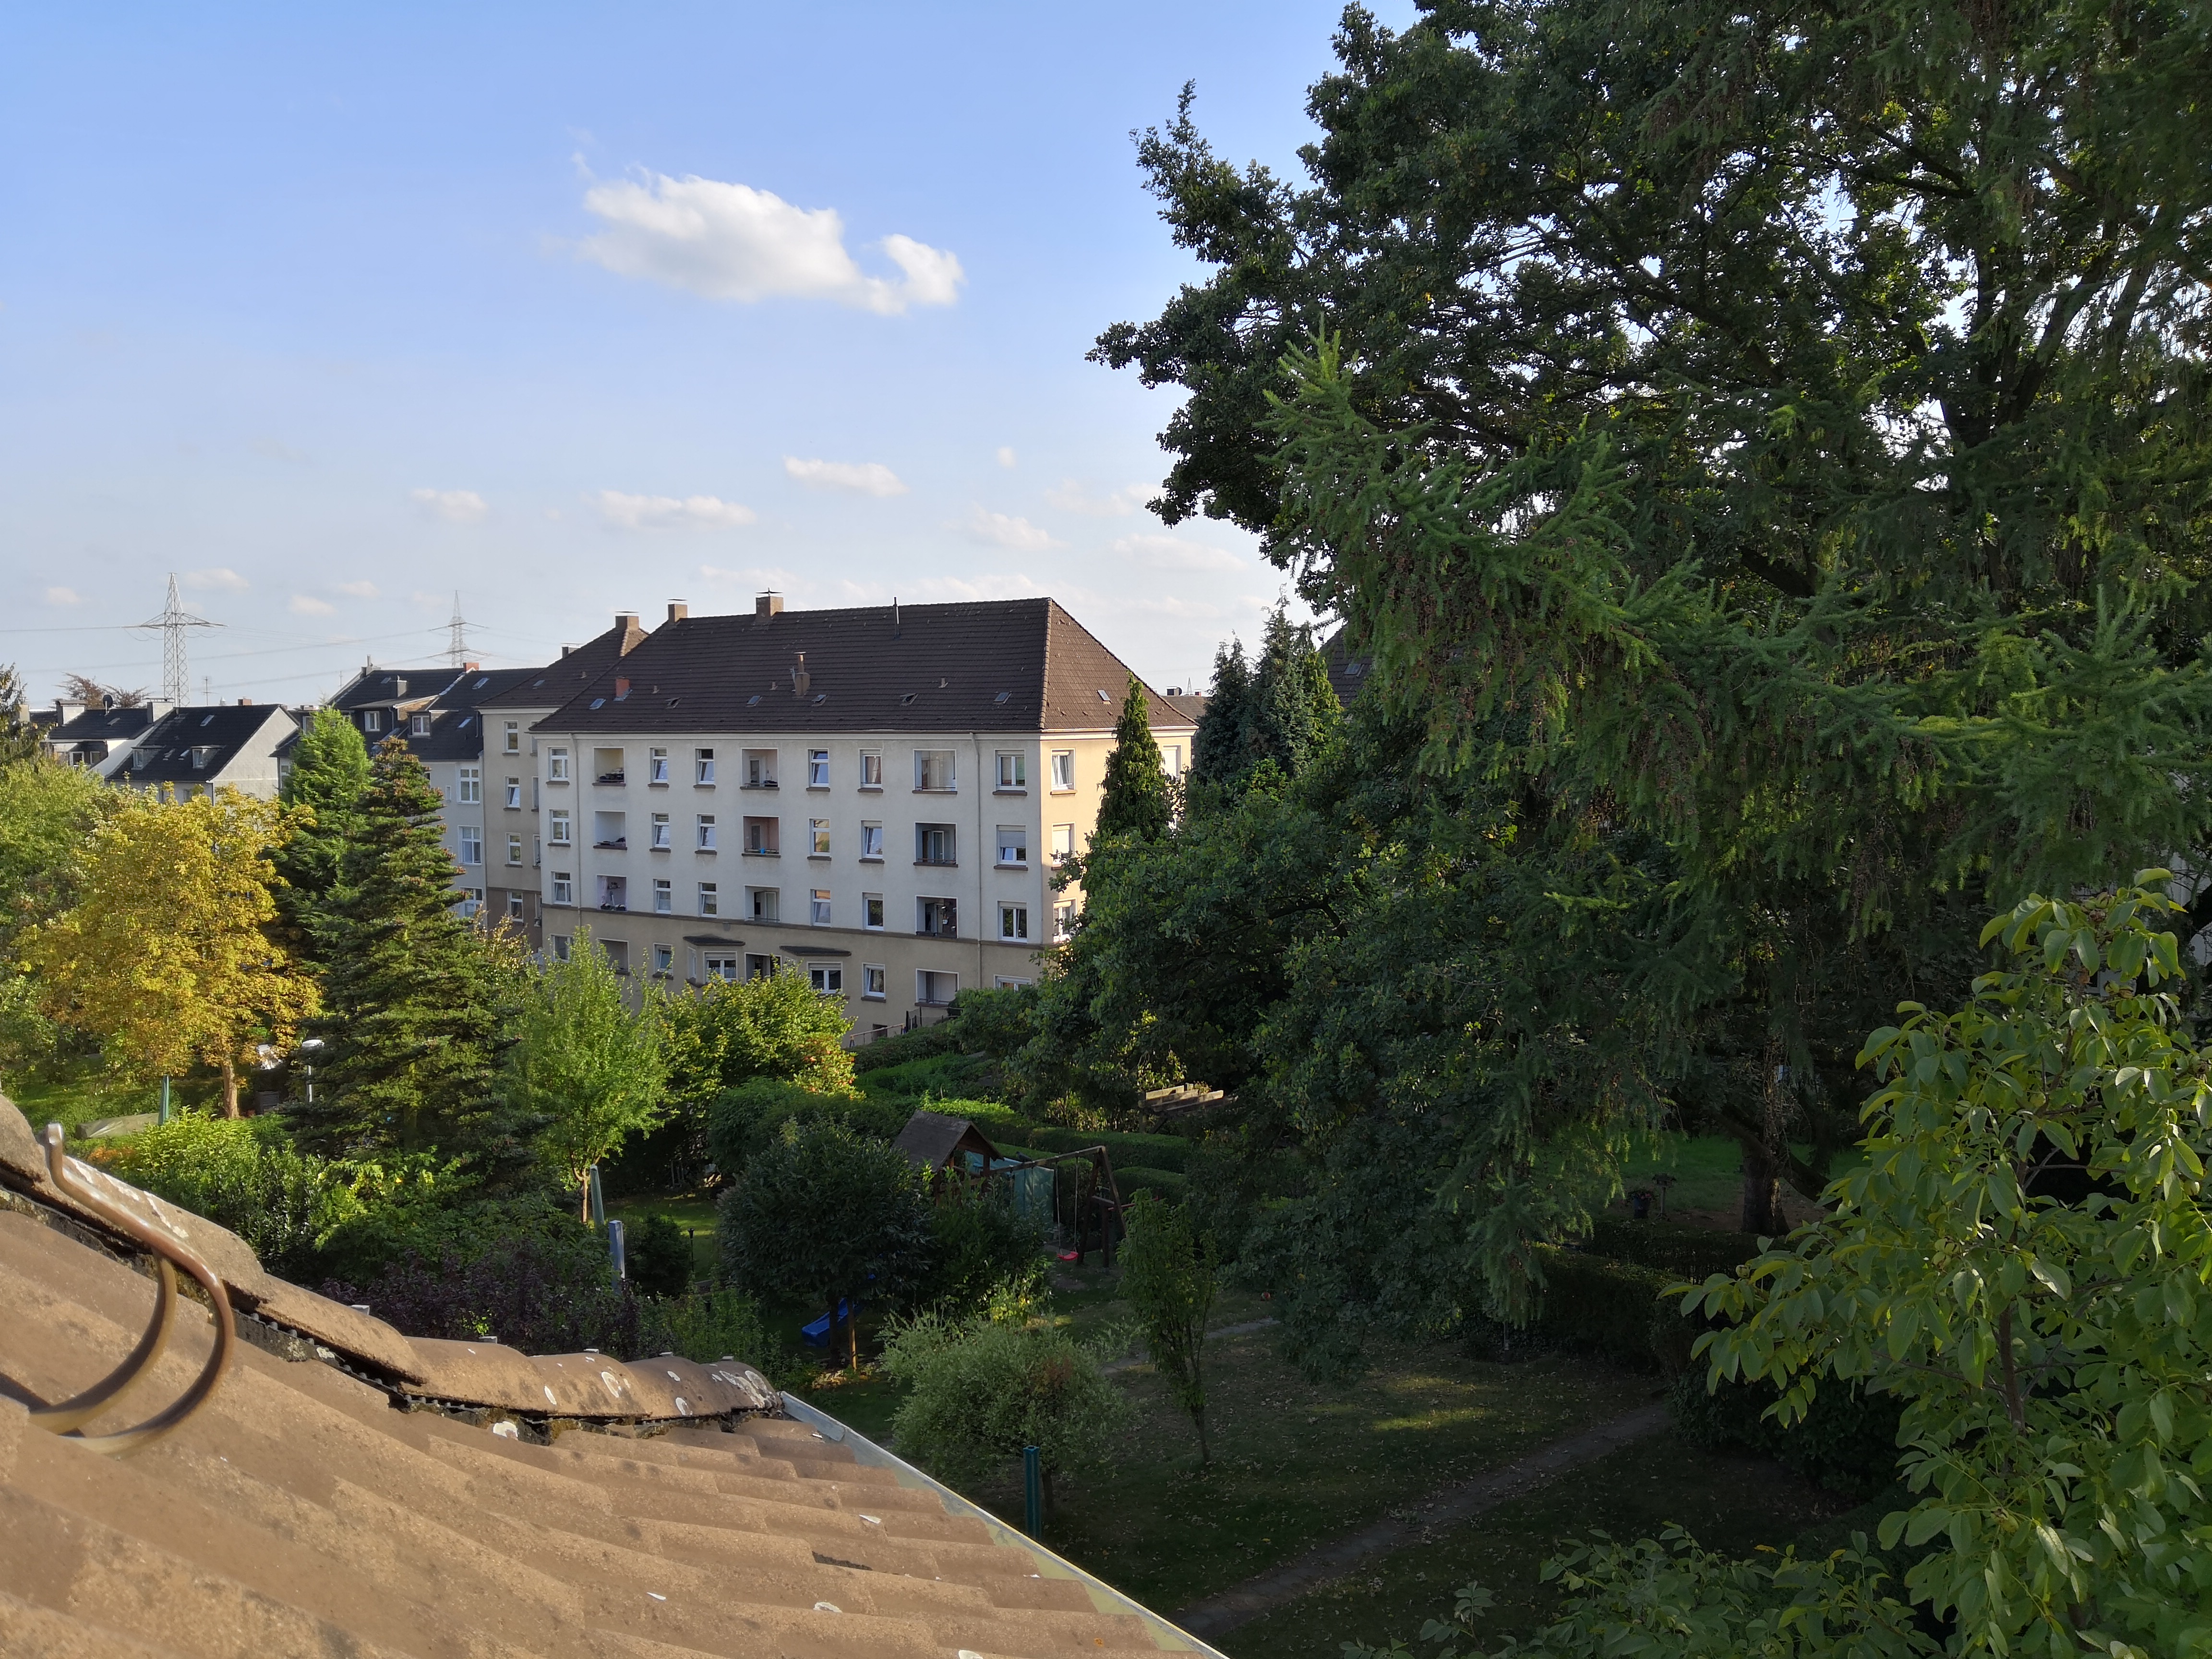
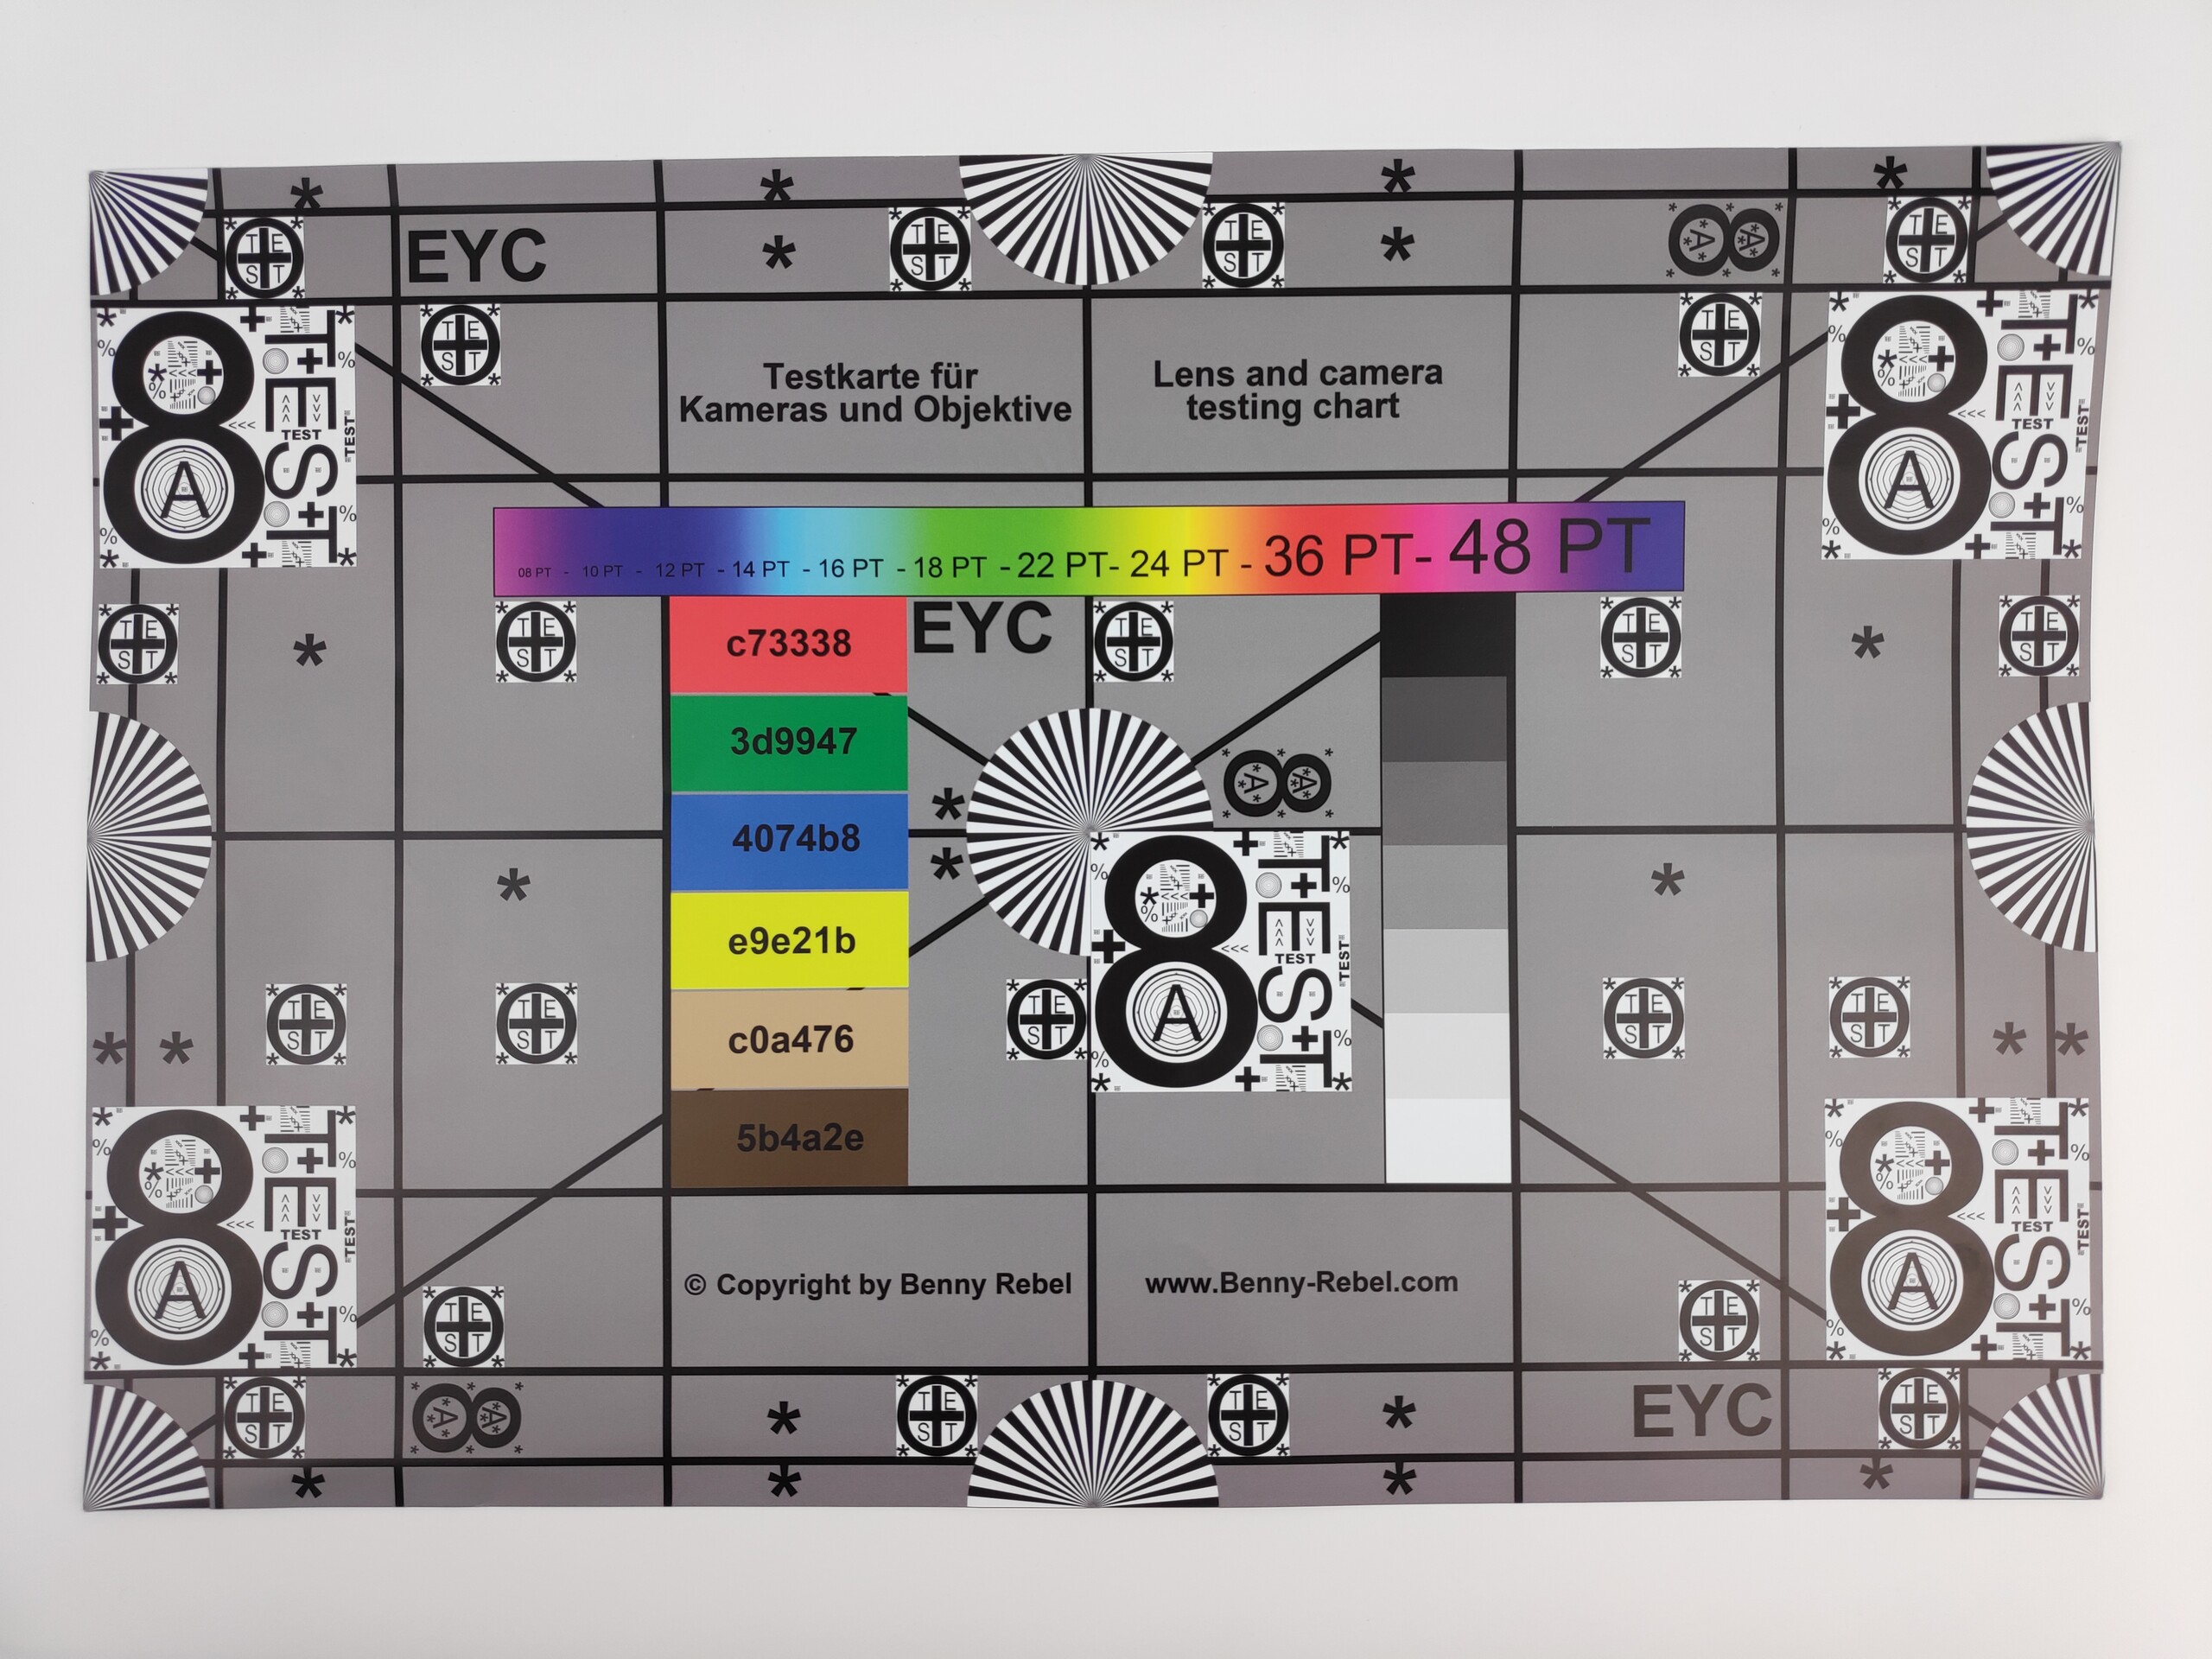
Pocophone kunde haft en bättre kalibrerad och mer ljusstark skärm, men Xiaomi behövde spara in någonstans. Skärmen kommer bara vara ett problem om enheten används i direkt solljus. Vi gillade dock kamerorna. Förvisso finns det bättre kameror där ute, men inte många till det här priset.
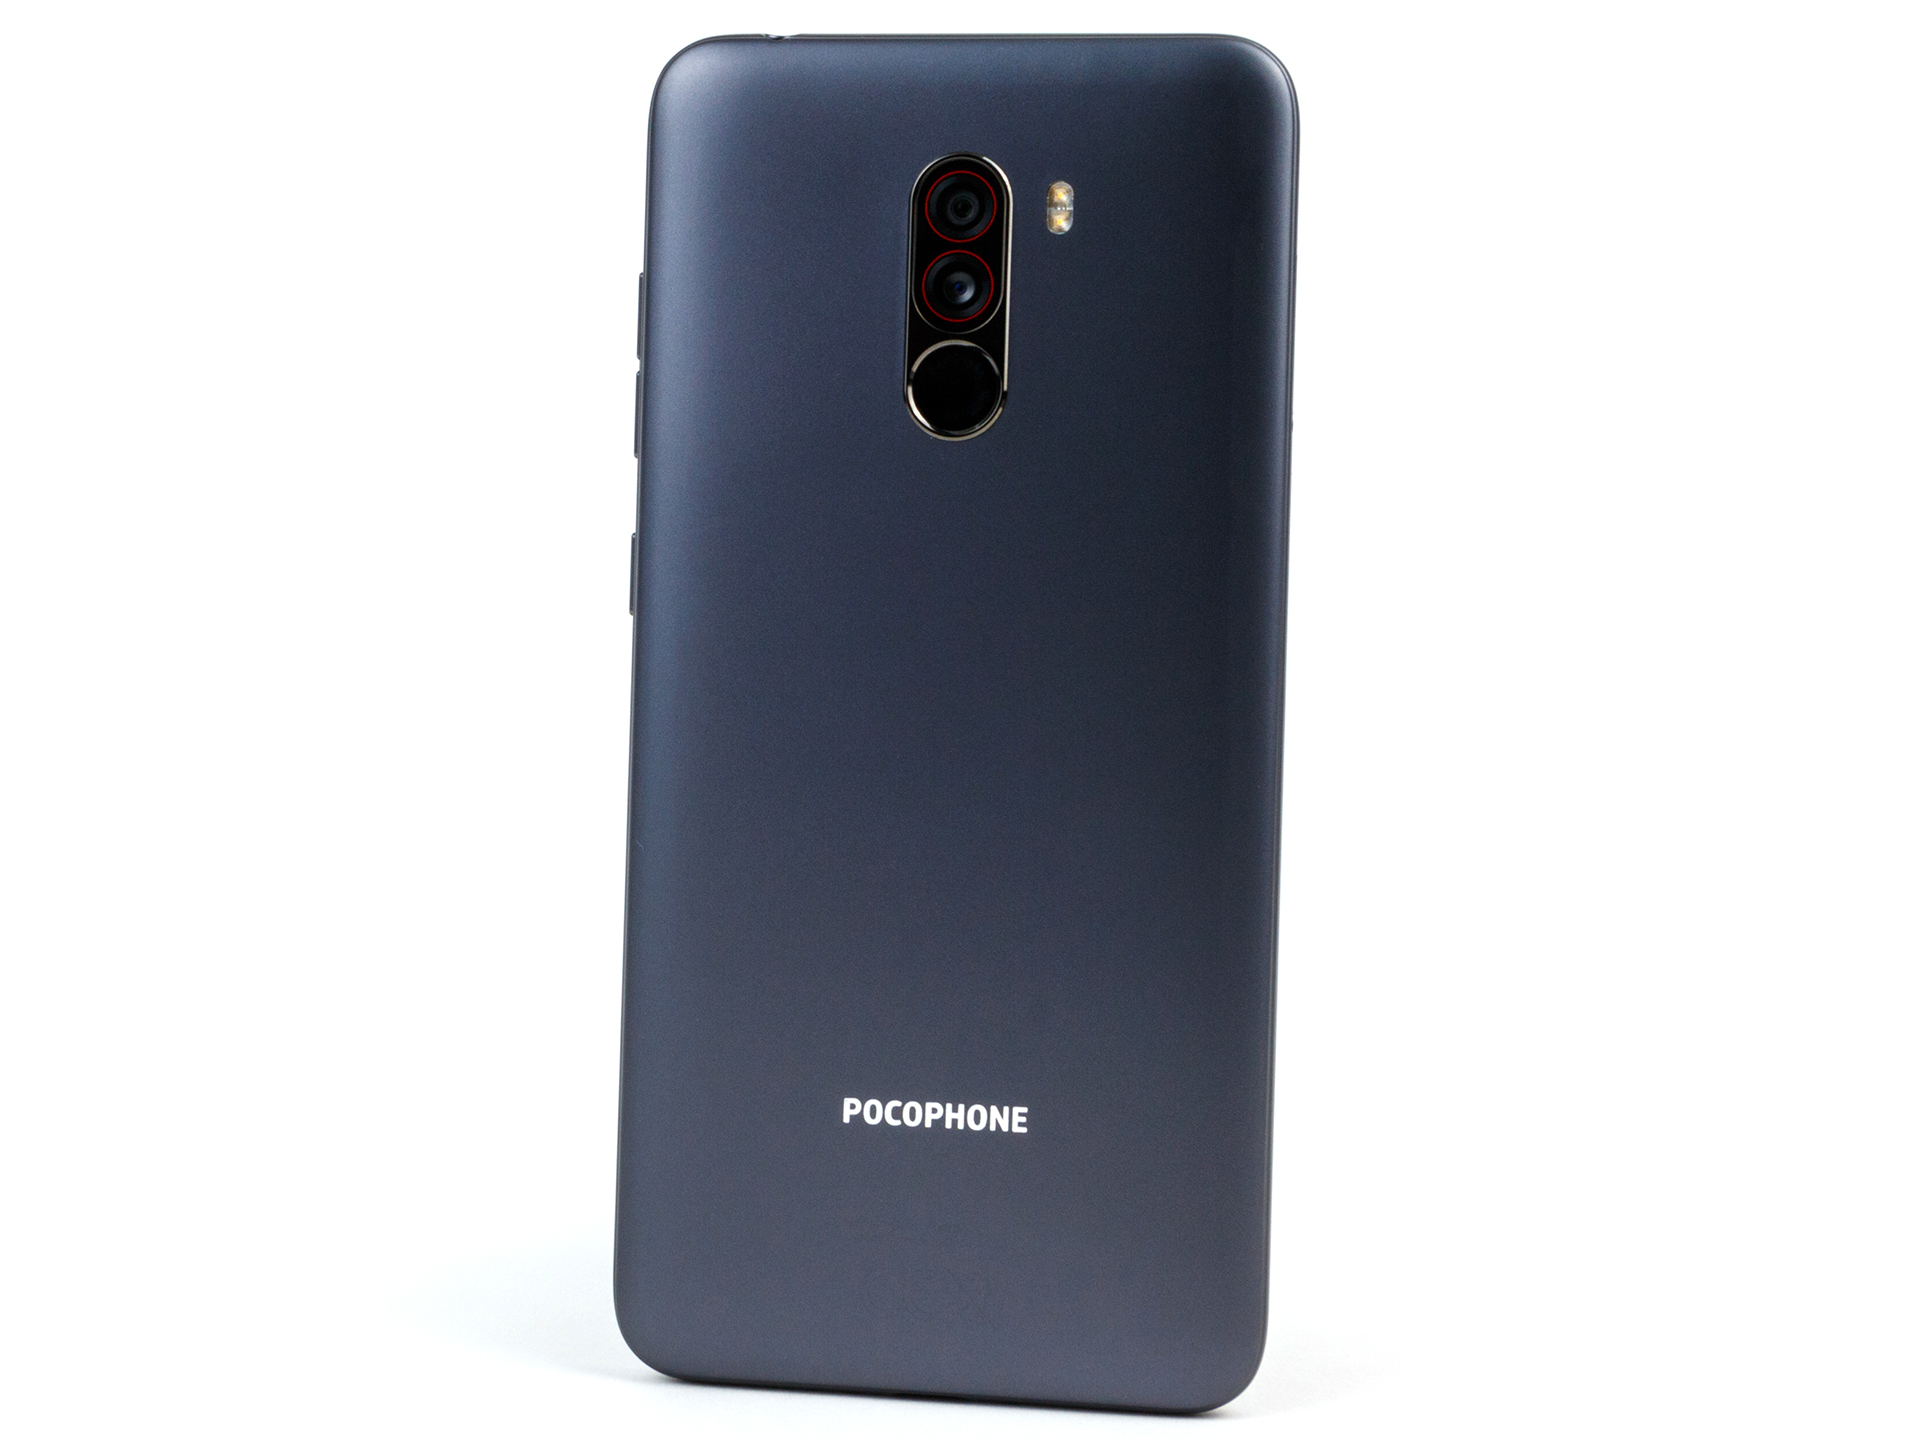
Vår testenhet hade även andra svagheter, nämligen dess samtalskvalitet och mottagning, som var sämre än hos konkurrenterna. Designen som i huvudsak består av plast är i vårt tycke enkel och stabil, men det är förstås subjektivt.
Xiaomi Pocophone F1 är med rätta en het kandidat för den som inte vill spendera mer än 3.500 kronor på en smartphone.
Xiaomi Poco F1
- 11/04/2019 v7 (old)
Daniel Schmidt
Price comparison
