Test: Samsung Galaxy S9 Plus Smartphone (Sammanfattning)


| |||||||||||||||||||||||||
Distribution av ljusstyrkan: 96 %
Mitt på batteriet: 565 cd/m²
Kontrast: ∞:1 (Svärta: 0 cd/m²)
ΔE ColorChecker Calman: 2.3 | ∀{0.5-29.43 Ø4.73}
ΔE Greyscale Calman: 1.9 | ∀{0.09-98 Ø4.97}
Gamma: 2.16
CCT: 6332 K
| Samsung Galaxy S9 Plus Super AMOLED, 2960x1440, 6.2" | Samsung Galaxy S8 Plus Super AMOLED, 2960x1440, 6.2" | Apple iPhone X Super AMOLED, 2436x1125, 5.8" | Huawei Mate 10 Pro OLED, 2160x1080, 6" | Google Pixel 2 XL P-OLED, 2880x1440, 6" | HTC U11 Plus Super LCD 6, 2880x1440, 6" | OnePlus 5T AMOLED, 2160x1080, 6" | |
|---|---|---|---|---|---|---|---|
| Screen | 11% | 19% | 8% | -24% | -15% | -8% | |
| Brightness middle (cd/m²) | 565 | 560 -1% | 600 6% | 629 11% | 415 -27% | 361 -36% | 425 -25% |
| Brightness (cd/m²) | 571 | 562 -2% | 606 6% | 636 11% | 420 -26% | 356 -38% | 423 -26% |
| Brightness Distribution (%) | 96 | 93 -3% | 94 -2% | 94 -2% | 87 -9% | 90 -6% | 92 -4% |
| Black Level * (cd/m²) | 0.21 | ||||||
| Colorchecker dE 2000 * | 2.3 | 1.7 26% | 1.2 48% | 1.7 26% | 2.7 -17% | 2.5 -9% | 2.1 9% |
| Colorchecker dE 2000 max. * | 4.8 | 3.4 29% | 3 37% | 3.6 25% | 4.3 10% | 5.3 -10% | 3.4 29% |
| Greyscale dE 2000 * | 1.9 | 1.6 16% | 1.6 16% | 2.4 -26% | 3.3 -74% | 1.7 11% | 2.5 -32% |
| Gamma | 2.16 102% | 2.13 103% | 2.23 99% | 2.15 102% | 2.36 93% | 2.21 100% | 2.32 95% |
| CCT | 6332 103% | 6435 101% | 6707 97% | 6337 103% | 6787 96% | 6580 99% | 6455 101% |
| Color Space (Percent of AdobeRGB 1998) (%) | 81.57 | ||||||
| Color Space (Percent of sRGB) (%) | 99.87 | ||||||
| Contrast (:1) | 1719 |
* ... mindre är bättre
Skärmflimmer / PWM (Puls-Width Modulation)
| Skärmflimmer / PWM upptäckt | 215.5 Hz | 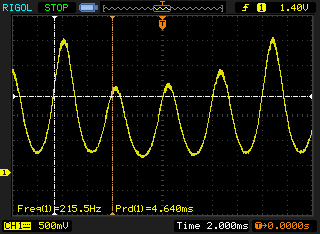 | |
Displayens bakgrundsbelysning flimrar vid 215.5 Hz (i värsta fall, t.ex. med PWM) . Frekvensen för 215.5 Hz är relativt låg, så känsliga användare kommer sannolikt att märka flimmer och uppleva ansträngda ögon vid den angivna ljusstyrkeinställningen och nedan. Som jämförelse: 52 % av alla testade enheter använder inte PWM för att dämpa skärmen. Om PWM upptäcktes mättes ett medelvärde av 7794 (minst: 5 - maximum: 343500) Hz. | |||
![Grayscales (profile: adaptive [optimized], color space: DCI-P3)](fileadmin/_processed_/b/b/csm_CalMAN_Anpassbar_Optimiert_Grayscale_P3_2a5e5d90e0.jpg)
![Mixed colors (profile: adaptive [optimized], color space: DCI-P3)](fileadmin/_processed_/f/9/csm_CalMAN_Anpassbar_Optimiert_ColorChecker_P3_3eca2185c3.jpg)
Visa svarstider
| ↔ Svarstid svart till vitt | ||
|---|---|---|
| 6 ms ... stiga ↗ och falla ↘ kombinerat | ↗ 3 ms stiga | 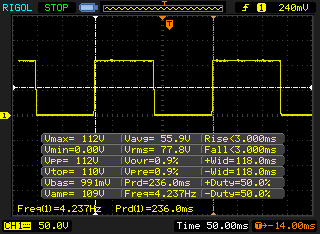 |
| ↘ 3 ms hösten | ||
| Skärmen visar väldigt snabba svarsfrekvenser i våra tester och borde vara mycket väl lämpad för fartfyllt spel. I jämförelse sträcker sig alla testade enheter från 0.1 (minst) till 240 (maximalt) ms. » 18 % av alla enheter är bättre. Det betyder att den uppmätta svarstiden är bättre än genomsnittet av alla testade enheter (19.9 ms). | ||
| ↔ Svarstid 50 % grått till 80 % grått | ||
| 8 ms ... stiga ↗ och falla ↘ kombinerat | ↗ 3 ms stiga | 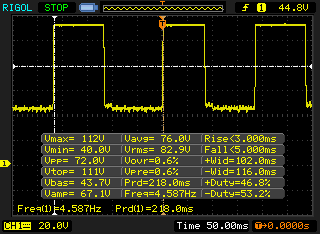 |
| ↘ 5 ms hösten | ||
| Skärmen visar snabba svarsfrekvenser i våra tester och bör passa för spel. I jämförelse sträcker sig alla testade enheter från 0.165 (minst) till 636 (maximalt) ms. » 21 % av alla enheter är bättre. Det betyder att den uppmätta svarstiden är bättre än genomsnittet av alla testade enheter (31.1 ms). | ||
| AnTuTu v7 - Total Score (sortera efter värde) | |
| Samsung Galaxy S9 Plus | |
| Apple iPhone X | |
| Huawei Mate 10 Pro | |
| Google Pixel 2 XL | |
| HTC U11 Plus | |
| OnePlus 5T | |
| Genomsnitt Samsung Exynos 9810 (236552 - 250577, n=3) | |
| Lightmark - 1920x1080 1080p (sortera efter värde) | |
| Samsung Galaxy S9 Plus | |
| Samsung Galaxy S8 Plus | |
| Huawei Mate 10 Pro | |
| Google Pixel 2 XL | |
| HTC U11 Plus | |
| Genomsnitt Samsung Exynos 9810 (34 - 35.8, n=2) | |
| JetStream 1.1 - 1.1 Total | |
| Apple iPhone X (IOS 11.1.1) | |
| Samsung Galaxy S9 Plus (Samsung Browser 7.0) | |
| Motorola Moto Z2 Force (Chrome 63.0.3239.111) | |
| OnePlus 5T (Chrome 63) | |
| Genomsnitt Samsung Exynos 9810 (62.9 - 69.6, n=4) | |
| HTC U11 Plus (Chrome 63) | |
| Google Pixel 2 XL (Chrome 62) | |
| Samsung Galaxy S8 Plus (Samsung Browser 5.2) | |
| Huawei Mate 10 Pro (Chrome 61) | |
| LG V30 (Chrome 62) | |
| Octane V2 - Total Score | |
| Genomsnitt av klass Smartphone (2800 - 126661, n=157, senaste 2 åren) | |
| Apple iPhone X (IOS 11.1.2) | |
| Samsung Galaxy S9 Plus (Samsung Browser 7.0) | |
| Genomsnitt Samsung Exynos 9810 (12933 - 15233, n=4) | |
| Samsung Galaxy S8 Plus (Samsung Browser 5.2) | |
| Motorola Moto Z2 Force (Chrome 63.0.3239.111) | |
| OnePlus 5T (Chrome 63) | |
| HTC U11 Plus (Chrome 63) | |
| Google Pixel 2 XL (Chrome 62) | |
| LG V30 (Chrome 62) | |
| Huawei Mate 10 Pro (Chrome 61) | |
| Mozilla Kraken 1.1 - Total | |
| LG V30 (Chrome 62) | |
| Huawei Mate 10 Pro (Chrome 61) | |
| Google Pixel 2 XL (Chrome 62) | |
| Motorola Moto Z2 Force (Chrome 63.0.3239.111) | |
| HTC U11 Plus (Chrome 63) | |
| OnePlus 5T (Chrome 63) | |
| Genomsnitt Samsung Exynos 9810 (2060 - 3189, n=4) | |
| Samsung Galaxy S8 Plus (Samsung Browser 5.2) | |
| Samsung Galaxy S9 Plus (Samsung Browser 7.0) | |
| Genomsnitt av klass Smartphone (257 - 28190, n=135, senaste 2 åren) | |
| Apple iPhone X (IOS 11.1.2) | |
| WebXPRT 2015 - Overall | |
| Apple iPhone X (Safari Mobile 11.0) | |
| Google Pixel 2 XL (Chrome 62) | |
| OnePlus 5T (Chrome 63) | |
| HTC U11 Plus (Chrome 63) | |
| Genomsnitt Samsung Exynos 9810 (163 - 202, n=3) | |
| Samsung Galaxy S9 Plus (Samsung Browser 7.0) | |
| Motorola Moto Z2 Force (Chrome 63.0.3239.111) | |
| Huawei Mate 10 Pro (Chrome 61) | |
| Samsung Galaxy S8 Plus (Samsung Browser 5.2) | |
| LG V30 (Chrome 62) | |
* ... mindre är bättre
| Samsung Galaxy S9 Plus | Samsung Galaxy S8 Plus | LG V30 | HTC U11 Plus | Motorola Moto Z2 Force | Huawei P10 Plus | Genomsnitt 64 GB UFS 2.1 Flash | Genomsnitt av klass Smartphone | |
|---|---|---|---|---|---|---|---|---|
| AndroBench 3-5 | -12% | -28% | 77% | 38% | 81% | 40% | 662% | |
| Sequential Read 256KB (MB/s) | 819 | 788 -4% | 669 -18% | 728 -11% | 696 -15% | 733 -11% | 696 ? -15% | 2251 ? 175% |
| Sequential Write 256KB (MB/s) | 204.9 | 194.2 -5% | 193.2 -6% | 207.9 1% | 213.6 4% | 182.6 -11% | 224 ? 9% | 1932 ? 843% |
| Random Read 4KB (MB/s) | 129.7 | 127.2 -2% | 78.2 -40% | 132.4 2% | 148.8 15% | 173.1 33% | 137.2 ? 6% | 310 ? 139% |
| Random Write 4KB (MB/s) | 22.74 | 15.27 -33% | 10.21 -55% | 135.7 497% | 78.6 246% | 149.8 559% | 84.7 ? 272% | 362 ? 1492% |
| Sequential Read 256KB SDCard (MB/s) | 79.2 ? | 71.1 ? -10% | 62.8 -21% | 75.4 ? -5% | 77.4 ? -2% | 54 ? -32% | 68.6 ? -13% | |
| Sequential Write 256KB SDCard (MB/s) | 67.2 ? | 57.2 ? -15% | 47.2 -30% | 51.3 ? -24% | 54.7 ? -19% | 33.61 ? -50% | 52.2 ? -22% |
| Asphalt 8: Airborne | |||
| Inställningar | Värde | ||
| high | 30 fps | ||
| Dead Trigger 2 | |||
| Inställningar | Värde | ||
| high | 30 fps | ||
| Battle Bay | |||
| Inställningar | Värde | ||
| full resolution | 60 fps | ||
| World of Tanks Blitz | |||
| Inställningar | Värde | ||
| high, 0xAA, 0xAF | 59 fps | ||
| Arena of Valor | |||
| Inställningar | Värde | ||
| high HD | 60 fps | ||
| Shadow Fight 3 | |||
| Inställningar | Värde | ||
| high | 60 fps | ||
(+) Den maximala temperaturen på ovansidan är 35.8 °C / 96 F, jämfört med genomsnittet av 35.3 °C / 96 F , allt från 21.9 till 247 °C för klassen Smartphone.
(+) Botten värms upp till maximalt 37.9 °C / 100 F, jämfört med genomsnittet av 34 °C / 93 F
(+) Vid tomgångsbruk är medeltemperaturen för ovansidan 22.4 °C / 72 F, jämfört med enhetsgenomsnittet på 32.9 °C / ### class_avg_f### F.
Samsung Galaxy S9 Plus ljudanalys
(+) | högtalare kan spela relativt högt (85.6 dB)
Bas 100 - 315 Hz
(-) | nästan ingen bas - i genomsnitt 22.8% lägre än medianen
(±) | linjäriteten för basen är genomsnittlig (12.2% delta till föregående frekvens)
Mellan 400 - 2000 Hz
(+) | balanserad mellan - endast 3.2% från medianen
(+) | mids är linjära (3.2% delta till föregående frekvens)
Högsta 2 - 16 kHz
(+) | balanserade toppar - endast 4.4% från medianen
(+) | toppar är linjära (4.8% delta till föregående frekvens)
Totalt 100 - 16 000 Hz
(±) | linjäriteten för det totala ljudet är genomsnittlig (17.3% skillnad mot median)
Jämfört med samma klass
» 12% av alla testade enheter i den här klassen var bättre, 8% liknande, 80% sämre
» Den bästa hade ett delta på 11%, genomsnittet var 34%, sämst var 134%
Jämfört med alla testade enheter
» 32% av alla testade enheter var bättre, 8% liknande, 59% sämre
» Den bästa hade ett delta på 4%, genomsnittet var 24%, sämst var 134%
Google Pixel 2 XL ljudanalys
(+) | högtalare kan spela relativt högt (88.4 dB)
Bas 100 - 315 Hz
(-) | nästan ingen bas - i genomsnitt 28.1% lägre än medianen
(±) | linjäriteten för basen är genomsnittlig (9.5% delta till föregående frekvens)
Mellan 400 - 2000 Hz
(+) | balanserad mellan - endast 3.2% från medianen
(+) | mids är linjära (5.5% delta till föregående frekvens)
Högsta 2 - 16 kHz
(+) | balanserade toppar - endast 3.1% från medianen
(+) | toppar är linjära (4.2% delta till föregående frekvens)
Totalt 100 - 16 000 Hz
(±) | linjäriteten för det totala ljudet är genomsnittlig (19.6% skillnad mot median)
Jämfört med samma klass
» 30% av alla testade enheter i den här klassen var bättre, 8% liknande, 62% sämre
» Den bästa hade ett delta på 11%, genomsnittet var 34%, sämst var 134%
Jämfört med alla testade enheter
» 49% av alla testade enheter var bättre, 7% liknande, 44% sämre
» Den bästa hade ett delta på 4%, genomsnittet var 24%, sämst var 134%
Apple iPhone X ljudanalys
(+) | högtalare kan spela relativt högt (85.3 dB)
Bas 100 - 315 Hz
(±) | reducerad bas - i genomsnitt 14.9% lägre än medianen
(±) | linjäriteten för basen är genomsnittlig (9.4% delta till föregående frekvens)
Mellan 400 - 2000 Hz
(+) | balanserad mellan - endast 3.4% från medianen
(+) | mids är linjära (5.1% delta till föregående frekvens)
Högsta 2 - 16 kHz
(±) | högre toppar - i genomsnitt 7.3% högre än medianen
(+) | toppar är linjära (4.6% delta till föregående frekvens)
Totalt 100 - 16 000 Hz
(±) | linjäriteten för det totala ljudet är genomsnittlig (19% skillnad mot median)
Jämfört med samma klass
» 24% av alla testade enheter i den här klassen var bättre, 9% liknande, 66% sämre
» Den bästa hade ett delta på 11%, genomsnittet var 34%, sämst var 134%
Jämfört med alla testade enheter
» 45% av alla testade enheter var bättre, 7% liknande, 48% sämre
» Den bästa hade ett delta på 4%, genomsnittet var 24%, sämst var 134%
| Av/Standby | |
| Låg belastning | |
| Hög belastning |
|
Förklaring:
min: | |
| Samsung Galaxy S9 Plus 3500 mAh | Samsung Galaxy S8 Plus 3500 mAh | Google Pixel 2 XL 3520 mAh | Apple iPhone X 2716 mAh | Huawei Mate 10 Pro 4000 mAh | LG V30 3300 mAh | HTC U11 Plus 3930 mAh | OnePlus 5T 3300 mAh | |
|---|---|---|---|---|---|---|---|---|
| Power Consumption | -6% | -59% | -67% | -22% | -21% | -33% | -22% | |
| Idle Minimum * (Watt) | 0.68 | 0.68 -0% | 1.28 -88% | 1.03 -51% | 0.85 -25% | 0.72 -6% | 0.51 25% | 0.58 15% |
| Idle Average * (Watt) | 0.95 | 1.13 -19% | 1.87 -97% | 2.4 -153% | 1.15 -21% | 1.37 -44% | 1.62 -71% | 1.44 -52% |
| Idle Maximum * (Watt) | 1.09 | 1.16 -6% | 1.89 -73% | 2.6 -139% | 1.23 -13% | 1.41 -29% | 1.87 -72% | 1.53 -40% |
| Load Average * (Watt) | 4.58 | 4.69 -2% | 3.73 19% | 2.96 35% | 4.12 10% | 3.46 24% | 3.92 14% | 3.17 31% |
| Load Maximum * (Watt) | 5.16 | 5.24 -2% | 8.08 -57% | 6.6 -28% | 8.42 -63% | 7.83 -52% | 8.27 -60% | 8.54 -66% |
* ... mindre är bättre
| Samsung Galaxy S9 Plus 3500 mAh | Samsung Galaxy S8 Plus 3500 mAh | Google Pixel 2 XL 3520 mAh | Apple iPhone X 2716 mAh | Huawei Mate 10 Pro 4000 mAh | OnePlus 5T 3300 mAh | Motorola Moto Z2 Force 2730 mAh | LG V30 3300 mAh | |
|---|---|---|---|---|---|---|---|---|
| Batteridrifttid | 21% | 16% | -7% | 47% | 24% | 23% | 31% | |
| Reader / Idle (h) | 22.4 | 26.1 17% | 28.4 27% | 21.5 -4% | 29.1 30% | 29.2 30% | 27.2 21% | 31.9 42% |
| H.264 (h) | 11.2 | 12.4 11% | 11.2 0% | 10.6 -5% | 15.5 38% | 13.3 19% | 13.5 21% | 13.7 22% |
| WiFi v1.3 (h) | 8.7 | 12.3 41% | 9.7 11% | 9.4 8% | 13.6 56% | 12 38% | 8.9 2% | 12.9 48% |
| Load (h) | 4 | 4.6 15% | 5 25% | 3 -25% | 6.6 65% | 4.3 8% | 5.9 48% | 4.5 13% |
För
Emot
Läs den fullständiga versionen av den här recensionen på engelska här.
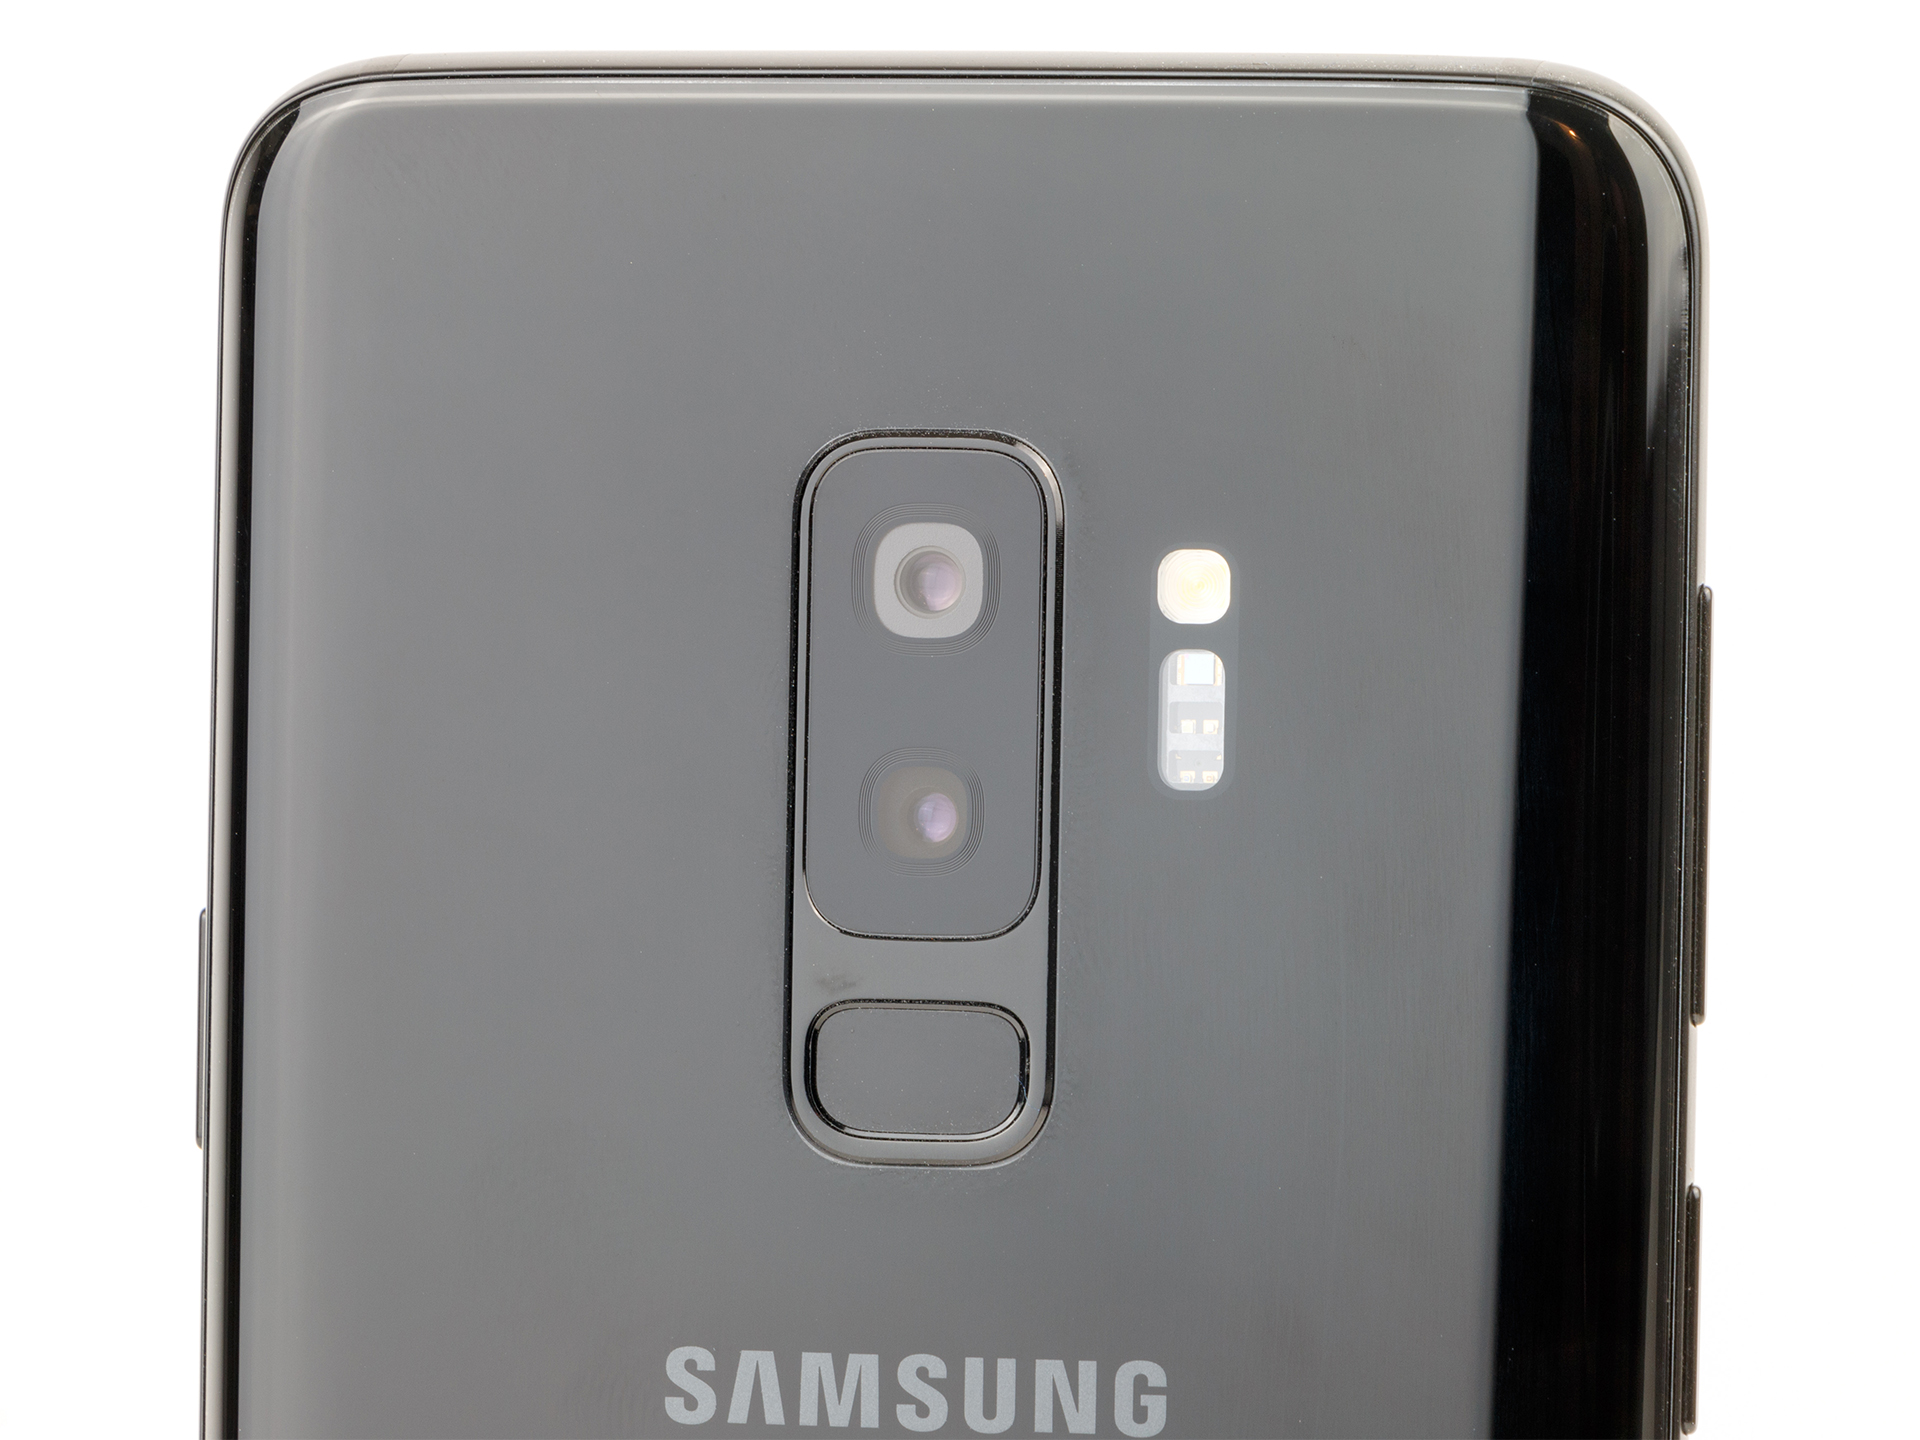
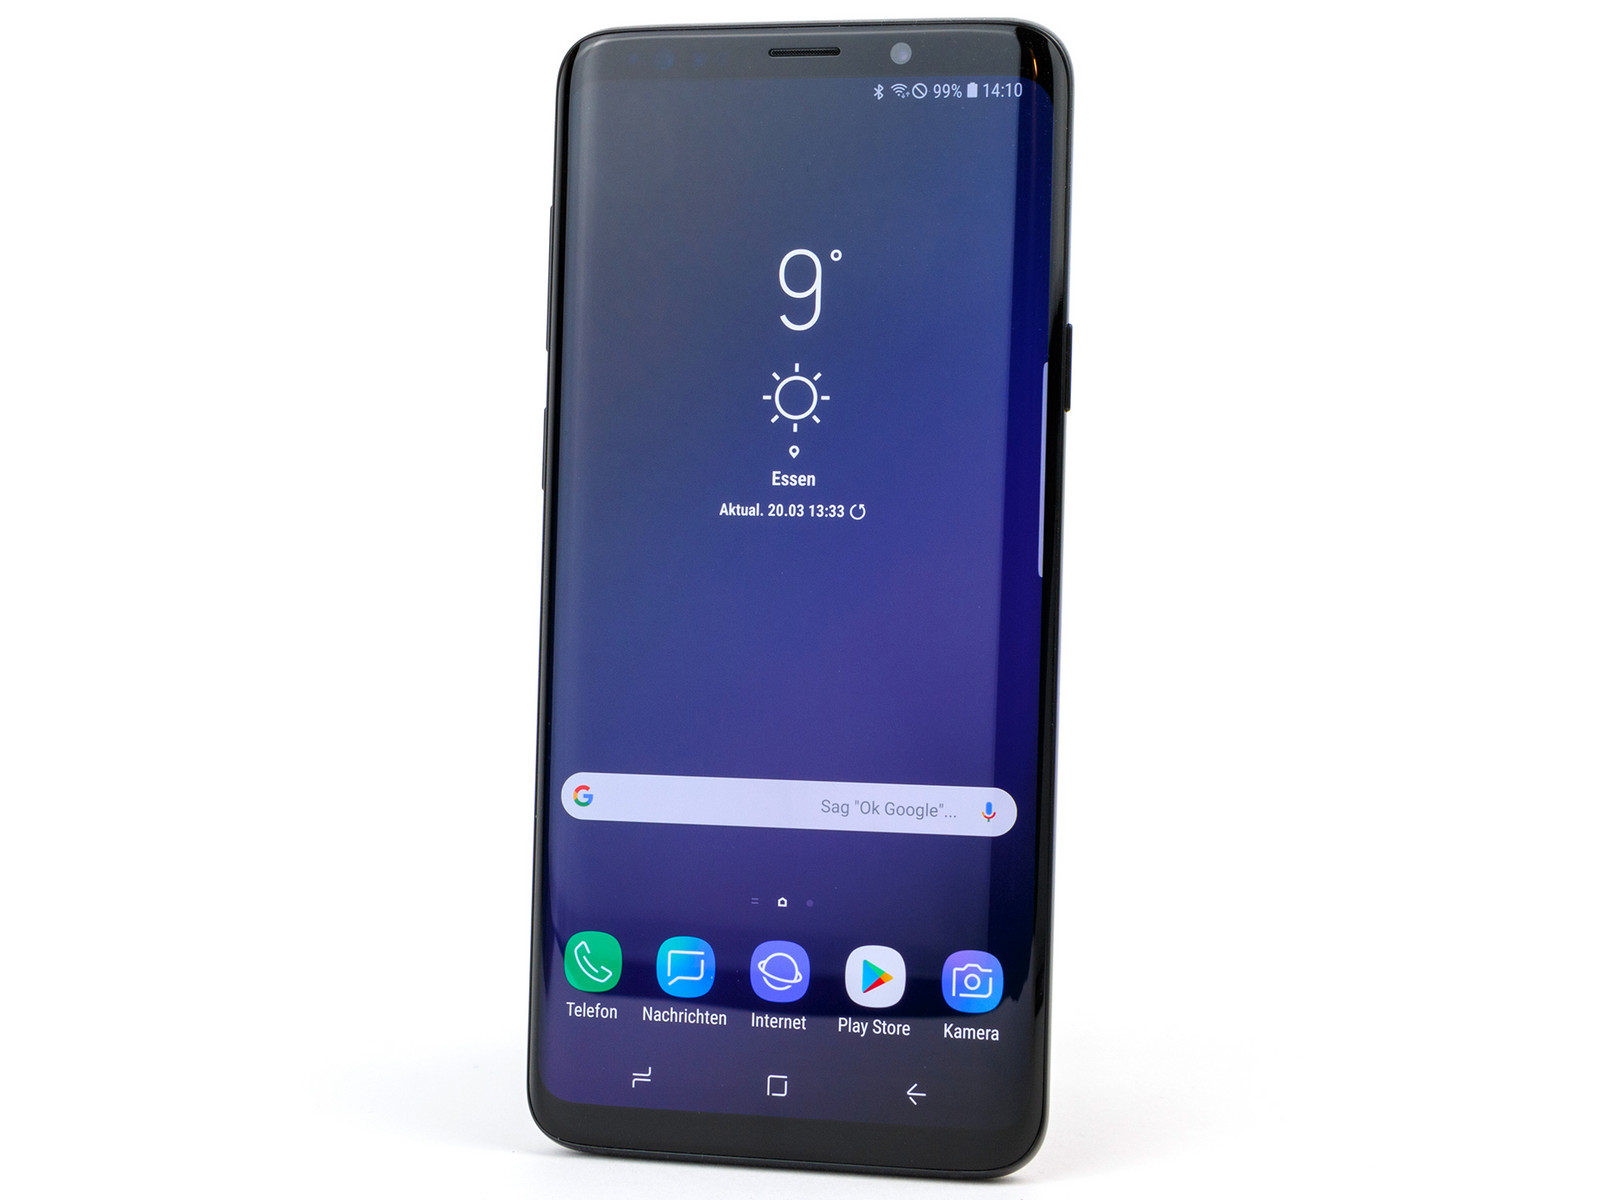
Med sin Galaxy S9 Plus har Samsung återigen lyckats skapa en utmärkt smartphone som fått många vettiga förbättringar men inga riktiga innovationer. Huvudkamerans två bländarnivåer är en utmärkt sak att ha och fungerar bra i vardagen. Samsung har också optimerad kvaliteten på bilderna ytterligare. Super Slow Motion-läget är inte mycket mer än en gimmick för bra ljusförhållanden och bilderna man får ut av det är endast lämpliga för sociala nätverk. AR-emojis fungerar heller inte särskilt bra. Eventuella likheter med användaren beror i huvudsak på tur.
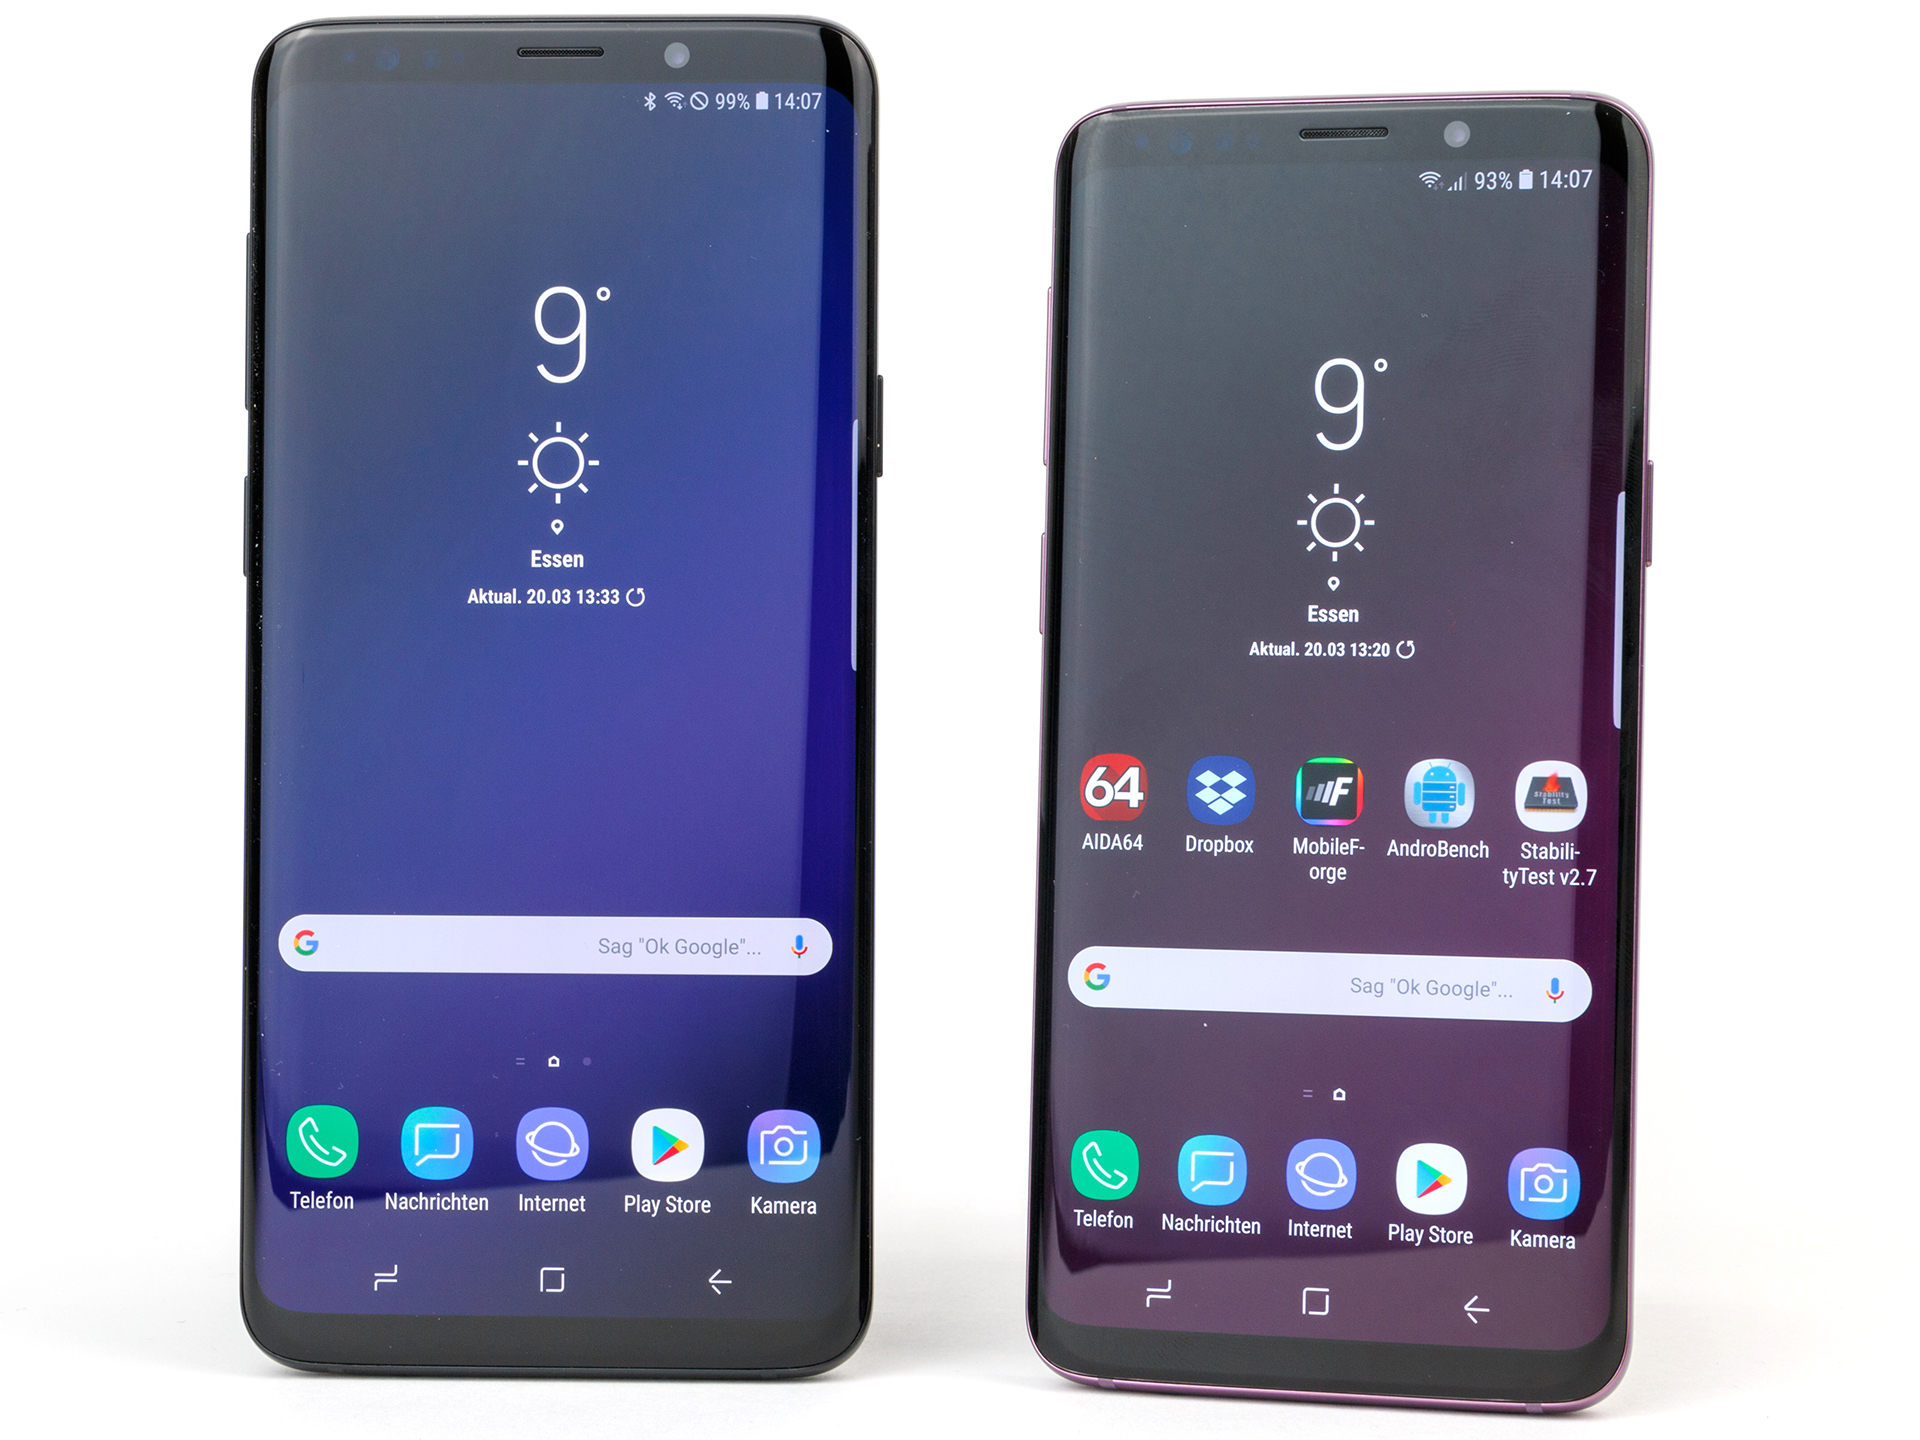
Men hur det än ligger till med det så har det Koreanska företaget ändå levererat en utmärkt produkt. En snabb processor, fantastisk skärm, bättre placering av fingeravtrycksläsaren, lagring som lätt kan utökas, bra stereohögtalare och skydd från damm och vatten är alla definitivt fördelar. Det finns till och med en variant med dual-SIM tillgänglig.
Samsung Galaxy S9 Plus är en kraftfull smartphone, men den måste ändå brottas med en del inledande svårigheter.
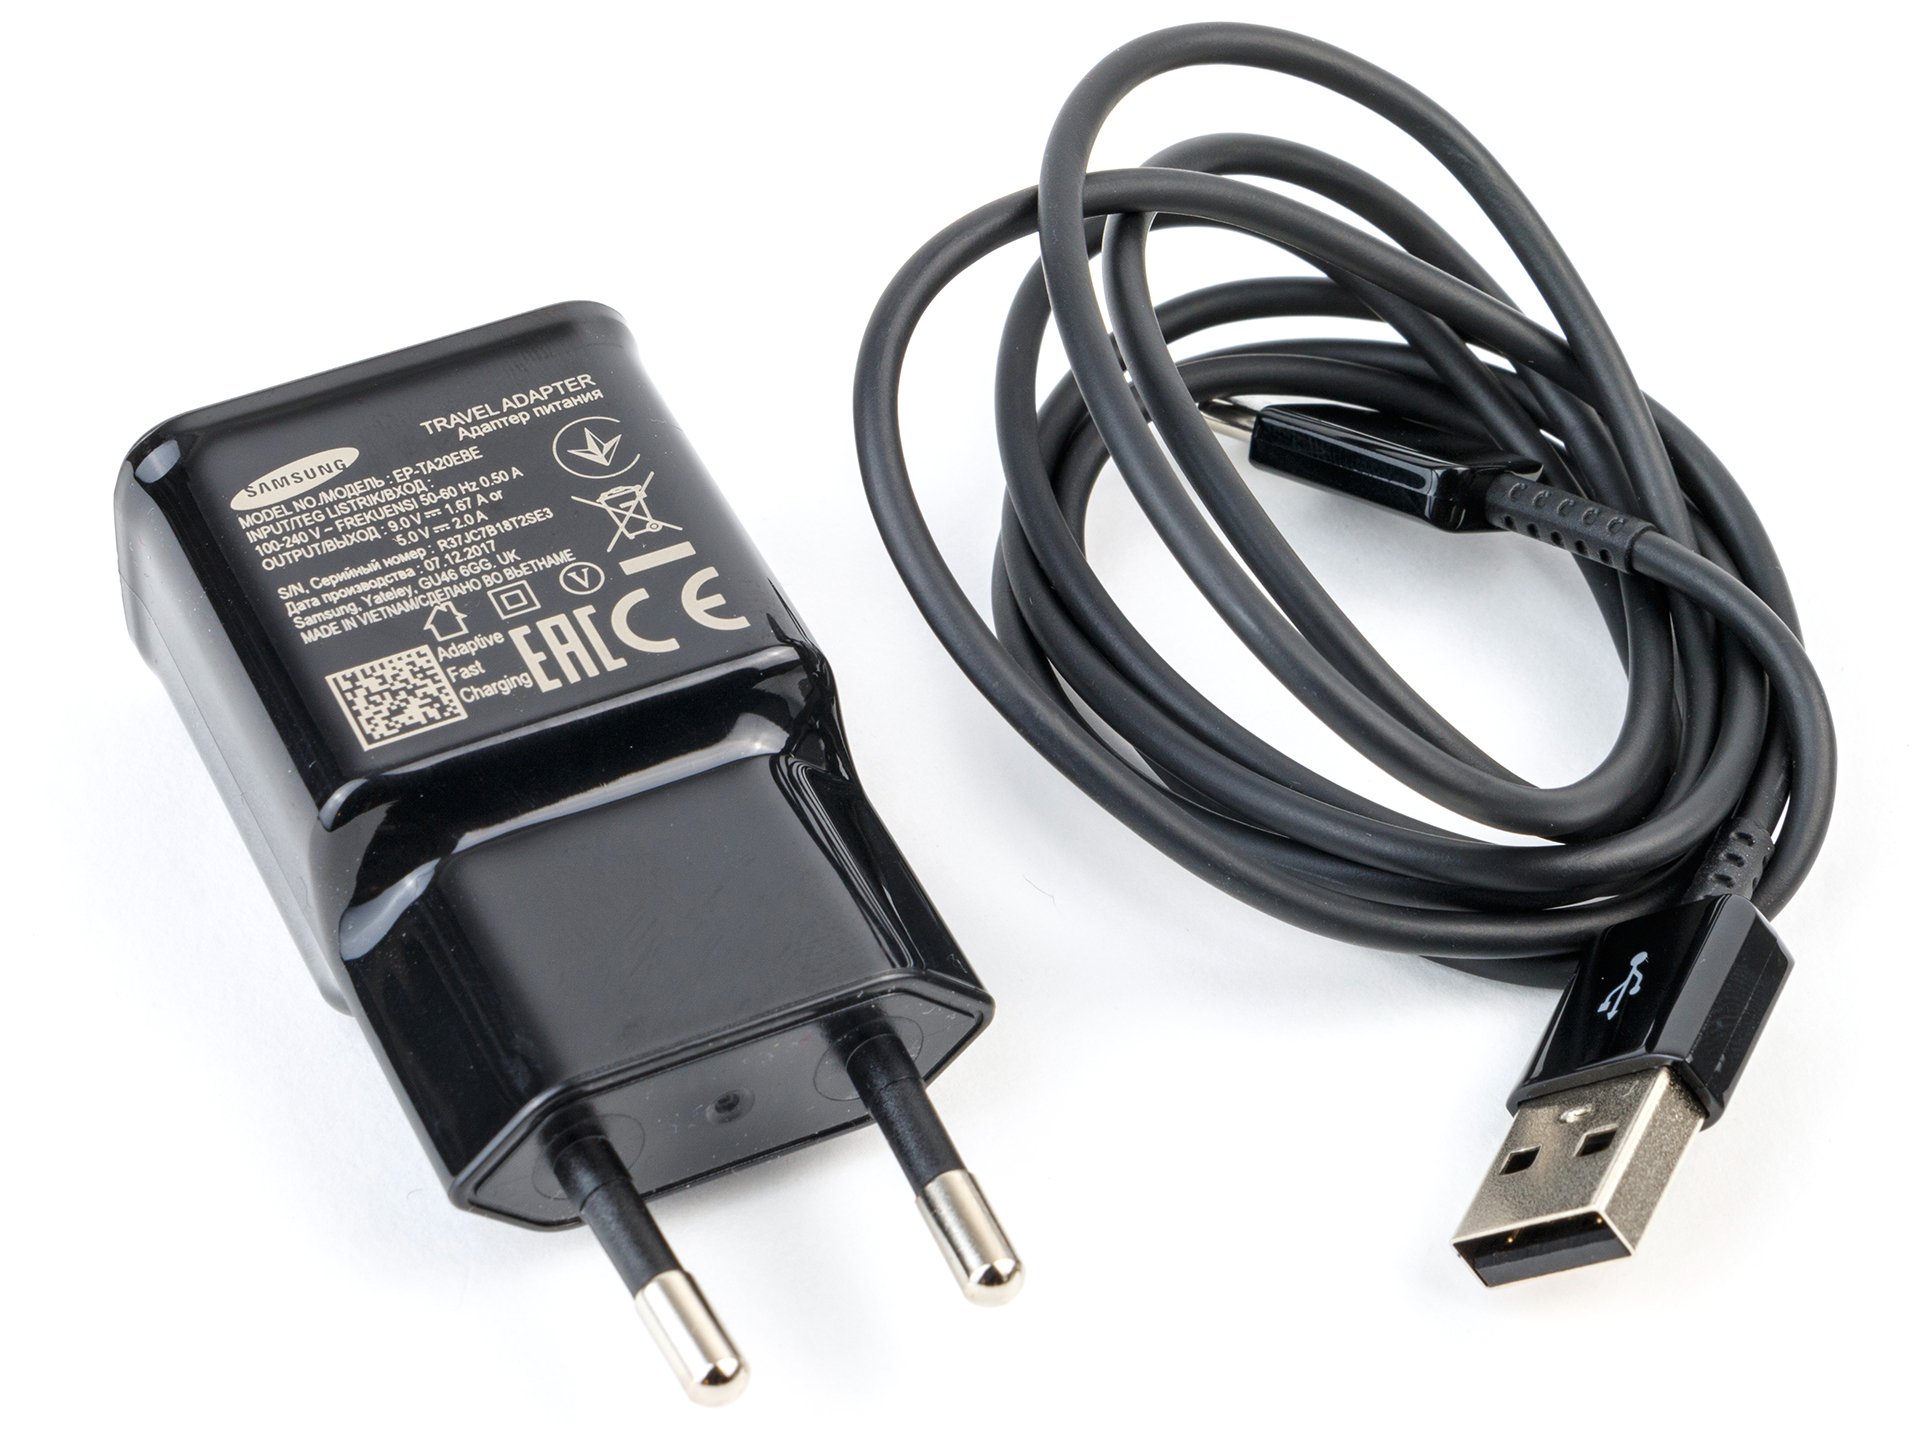
Denna Samsung-smartphone är lite mindre övertygande när det kommer till batteritiderna, som är märkbart sämre än dom var på den föregående modellen. Quick Charge fungerade heller inte på vår testenhet, så den behövde mer än fyra timmar att laddas till fullo i vårt test – alldeles för långt. Samsung kommer antagligen att lösa dom här problemen med en uppdatering, men det lämnar ändå en dålig smak i munnen hos användare som redan från början köpt denna telefon till fullpris.
Om du redan äger en Galaxy S8+ så finns det ingen akut anledning att byta nu. Skillnaderna i vardaglig användning är för små för att rättfärdiga prisskillnaden.
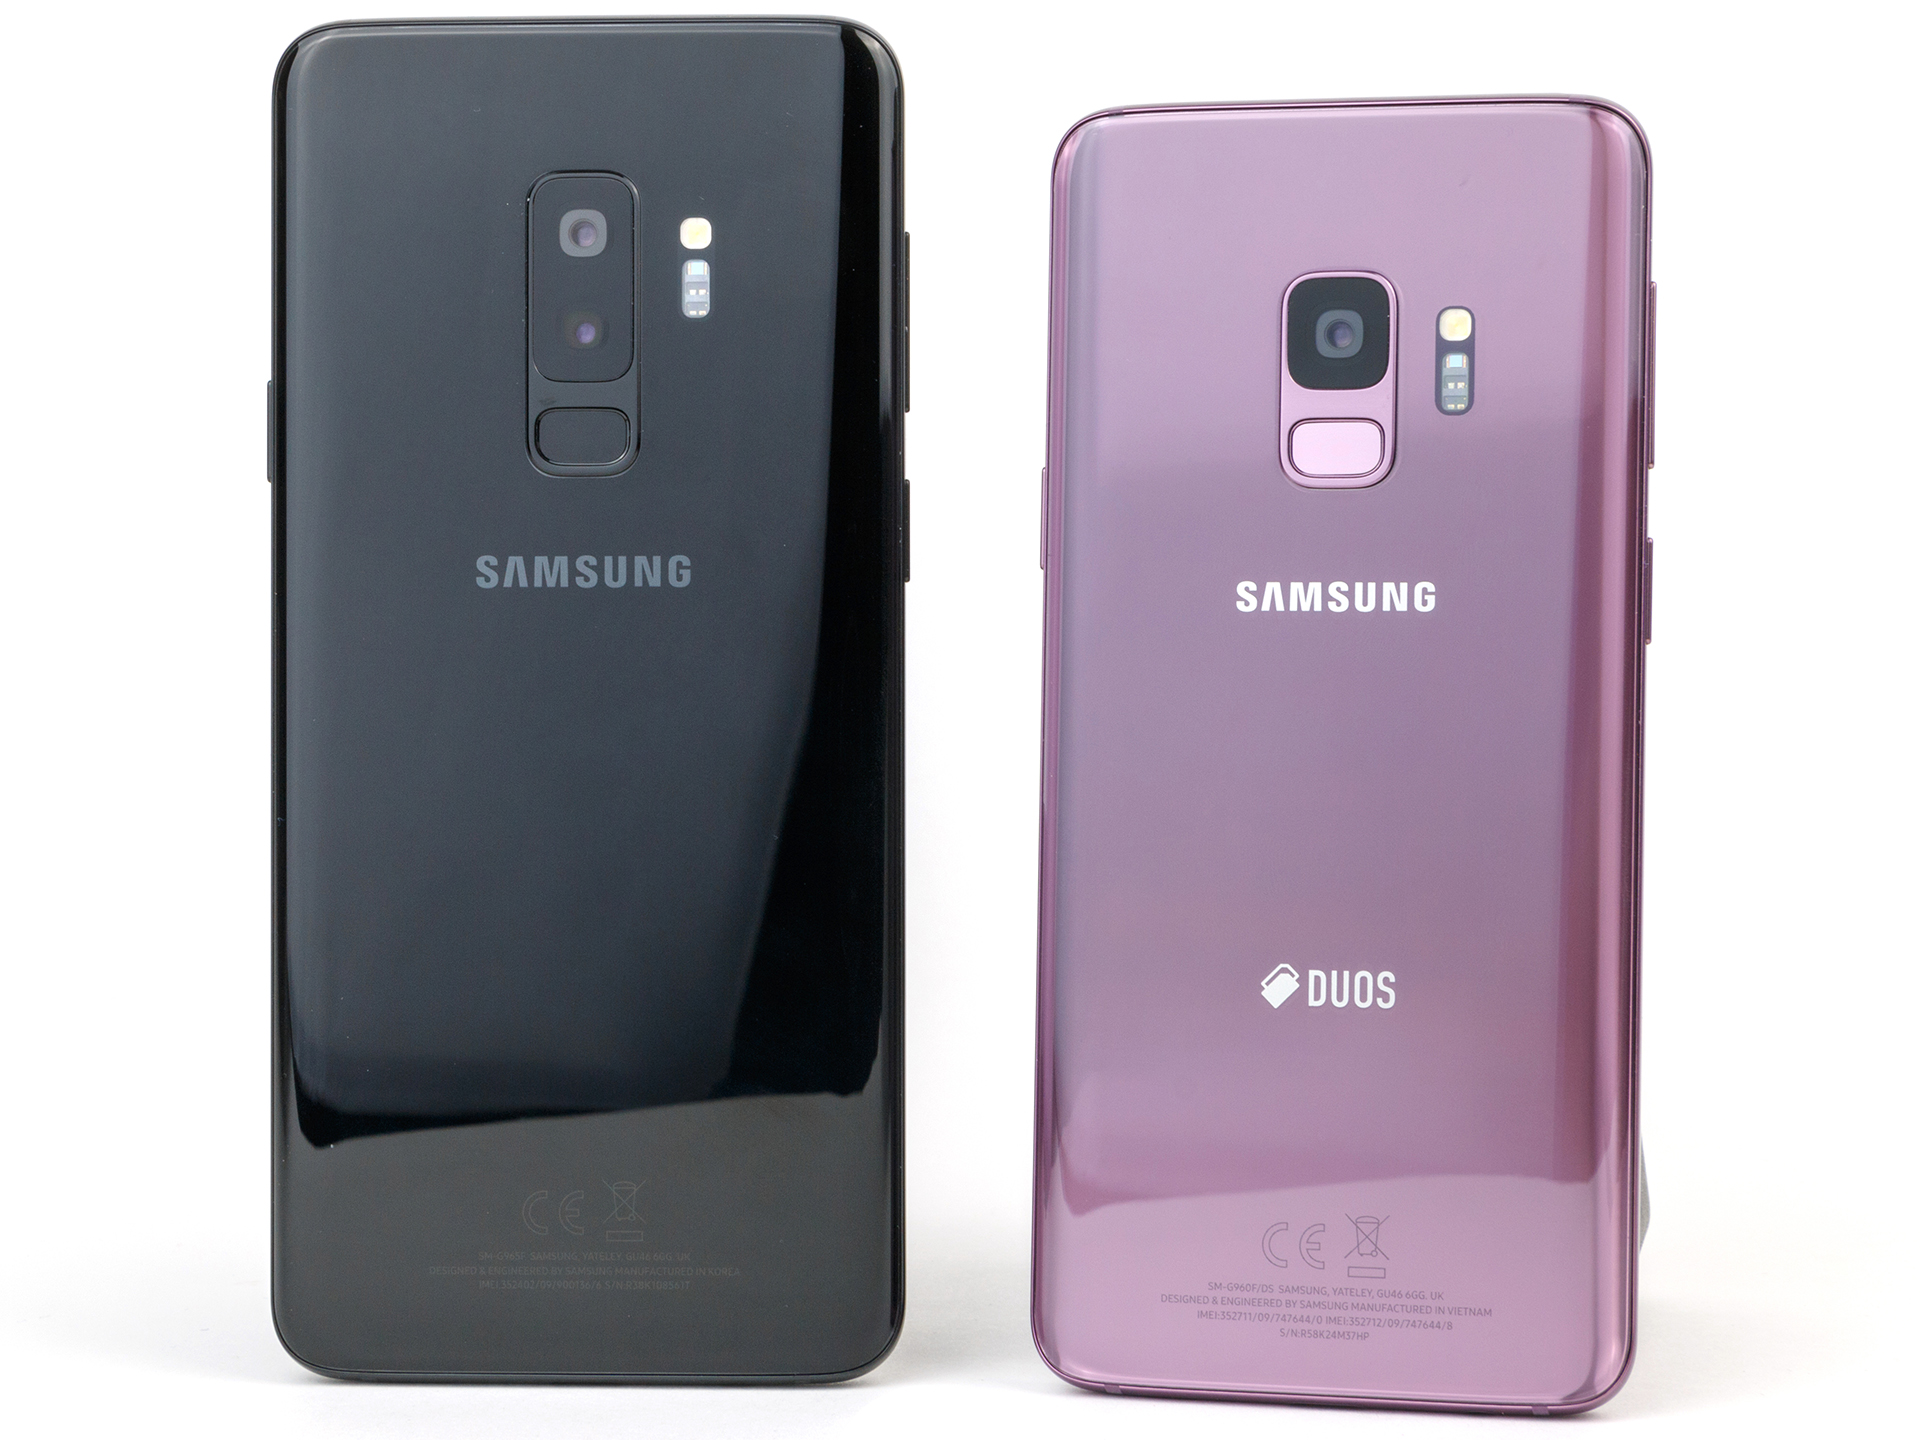
Samsung Galaxy S9 Plus
- 03/26/2018 v6 (old)
Daniel Schmidt