Test: Nokia 7 Plus Smartphone (Sammanfattning)


| |||||||||||||||||||||||||
Distribution av ljusstyrkan: 92 %
Mitt på batteriet: 458 cd/m²
Kontrast: 2082:1 (Svärta: 0.22 cd/m²)
ΔE ColorChecker Calman: 4 | ∀{0.5-29.43 Ø4.71}
ΔE Greyscale Calman: 4.7 | ∀{0.09-98 Ø4.96}
99.9% sRGB (Calman 2D)
Gamma: 2.19
CCT: 7425 K
| Nokia 7 Plus IPS, 2160x1080, 6" | Asus ZenFone 4 Selfie Pro ZD552KL AMOLED, 1920x1080, 5.5" | Sony Xperia XA2 Ultra IPS, 1920x1080, 6" | Wiko WIM AMOLED, 1920x1080, 5.5" | Samsung Galaxy A8 2018 Super AMOLED, 2220x1080, 5.6" | OnePlus 5T AMOLED, 2160x1080, 6" | Samsung Galaxy S8 Super AMOLED, 2960x1440, 5.8" | Huawei P20 Pro OLED, 2240x1080, 6.1" | |
|---|---|---|---|---|---|---|---|---|
| Screen | -25% | -4% | -28% | 7% | 22% | 24% | 43% | |
| Brightness middle (cd/m²) | 458 | 456 0% | 659 44% | 344 -25% | 541 18% | 425 -7% | 566 24% | 569 24% |
| Brightness (cd/m²) | 463 | 455 -2% | 680 47% | 353 -24% | 538 16% | 423 -9% | 564 22% | 578 25% |
| Brightness Distribution (%) | 92 | 85 -8% | 88 -4% | 90 -2% | 96 4% | 92 0% | 94 2% | 95 3% |
| Black Level * (cd/m²) | 0.22 | 0.56 -155% | ||||||
| Contrast (:1) | 2082 | 1177 -43% | ||||||
| Colorchecker dE 2000 * | 4 | 5.6 -40% | 2.8 30% | 5.7 -43% | 5.8 -45% | 2.1 47% | 2.7 32% | 1.3 67% |
| Colorchecker dE 2000 max. * | 7.4 | 11.1 -50% | 6.5 12% | 12.2 -65% | 3.4 54% | 5.4 27% | 2.1 72% | |
| Greyscale dE 2000 * | 4.7 | 6.9 -47% | 3 36% | 5.1 -9% | 2.7 43% | 2.5 47% | 3.1 34% | 1.6 66% |
| Gamma | 2.19 100% | 2.3 96% | 2.18 101% | 2.73 81% | 2.07 106% | 2.32 95% | 2.15 102% | 2.31 95% |
| CCT | 7425 88% | 7883 82% | 6938 94% | 7407 88% | 6570 99% | 6455 101% | 6335 103% | 6401 102% |
| Color Space (Percent of AdobeRGB 1998) (%) | 81.57 | |||||||
| Color Space (Percent of sRGB) (%) | 99.87 |
* ... mindre är bättre
Skärmflimmer / PWM (Puls-Width Modulation)
| Skärmflimmer / PWM upptäcktes inte | 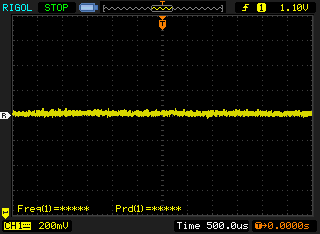 | ||
Som jämförelse: 52 % av alla testade enheter använder inte PWM för att dämpa skärmen. Om PWM upptäcktes mättes ett medelvärde av 7757 (minst: 5 - maximum: 343500) Hz. | |||
Visa svarstider
| ↔ Svarstid svart till vitt | ||
|---|---|---|
| 29.6 ms ... stiga ↗ och falla ↘ kombinerat | ↗ 14 ms stiga | 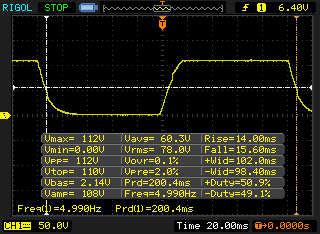 |
| ↘ 15.6 ms hösten | ||
| Skärmen visar relativt långsamma svarsfrekvenser i våra tester och kan vara för långsam för spelare. I jämförelse sträcker sig alla testade enheter från 0.1 (minst) till 240 (maximalt) ms. » 79 % av alla enheter är bättre. Detta innebär att den uppmätta svarstiden är sämre än genomsnittet av alla testade enheter (19.8 ms). | ||
| ↔ Svarstid 50 % grått till 80 % grått | ||
| 43.2 ms ... stiga ↗ och falla ↘ kombinerat | ↗ 20.4 ms stiga | 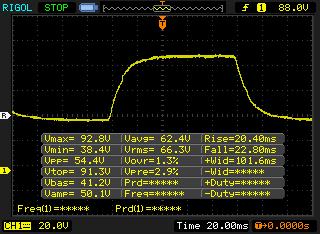 |
| ↘ 22.8 ms hösten | ||
| Skärmen visar långsamma svarsfrekvenser i våra tester och kommer att vara otillfredsställande för spelare. I jämförelse sträcker sig alla testade enheter från 0.165 (minst) till 636 (maximalt) ms. » 72 % av alla enheter är bättre. Detta innebär att den uppmätta svarstiden är sämre än genomsnittet av alla testade enheter (31 ms). | ||
| JetStream 1.1 - 1.1 Total | |
| OnePlus 5T (Chrome 63) | |
| Samsung Galaxy S8 (Samsung Browser 5.2) | |
| Huawei P20 Pro (Chrome 65) | |
| Nokia 7 Plus (Chrome 60) | |
| Genomsnitt Qualcomm Snapdragon 660 (45.3 - 55.5, n=12) | |
| Samsung Galaxy A8 2018 (Chrome 64.0.3282.137) | |
| Sony Xperia XA2 Ultra (Chrome 65) | |
| Asus ZenFone 4 Selfie Pro ZD552KL (Chrome 64) | |
| Wiko WIM (Chrome Version 59) | |
| Octane V2 - Total Score | |
| Genomsnitt av klass Smartphone (2800 - 126661, n=142, senaste 2 åren) | |
| Samsung Galaxy S8 (Samsung Browser 5.2) | |
| OnePlus 5T (Chrome 63) | |
| Huawei P20 Pro (Chrome 65) | |
| Nokia 7 Plus (Chrome 60) | |
| Genomsnitt Qualcomm Snapdragon 660 (8463 - 10945, n=14) | |
| Samsung Galaxy A8 2018 (Chrome 64.0.3282.137) | |
| Sony Xperia XA2 Ultra (Chrome 65) | |
| Asus ZenFone 4 Selfie Pro ZD552KL (Chrome 64) | |
| Wiko WIM (Chrome Version 59) | |
| Mozilla Kraken 1.1 - Total | |
| Sony Xperia XA2 Ultra (Chrome 65) | |
| Asus ZenFone 4 Selfie Pro ZD552KL (Chrome 64) | |
| Wiko WIM (Chrome Version 59) | |
| Samsung Galaxy A8 2018 (Chrome 64.0.3282.137) | |
| Genomsnitt Qualcomm Snapdragon 660 (3796 - 4769, n=13) | |
| Nokia 7 Plus (Chrome 60) | |
| Huawei P20 Pro (Chrome 65) | |
| OnePlus 5T (Chrome 63) | |
| Samsung Galaxy S8 (Samsung Browser 5.2) | |
| Genomsnitt av klass Smartphone (257 - 28190, n=121, senaste 2 åren) | |
| WebXPRT 2015 - Overall | |
| Samsung Galaxy S8 (Samsung Browser 5.2) | |
| Huawei P20 Pro (Chrome 65) | |
| OnePlus 5T (Chrome 63) | |
| Genomsnitt Qualcomm Snapdragon 660 (159 - 182, n=8) | |
| Nokia 7 Plus (Chrome 60) | |
| Samsung Galaxy A8 2018 (Chrome 64.0.3282.137) | |
| Sony Xperia XA2 Ultra (Chrome 65) | |
| WebXPRT 3 - Overall | |
| Genomsnitt av klass Smartphone (104 - 380, n=12, senaste 2 åren) | |
| Huawei P20 Pro (Chrome 65) | |
| Nokia 7 Plus (Chrome 60) | |
| Genomsnitt Qualcomm Snapdragon 660 (47 - 63, n=9) | |
* ... mindre är bättre
| Nokia 7 Plus | Asus ZenFone 4 Selfie Pro ZD552KL | Sony Xperia XA2 Ultra | Wiko WIM | Samsung Galaxy A8 2018 | OnePlus 5T | Samsung Galaxy S8 | Huawei P20 Pro | Genomsnitt 64 GB eMMC Flash | Genomsnitt av klass Smartphone | |
|---|---|---|---|---|---|---|---|---|---|---|
| AndroBench 3-5 | -16% | -7% | -17% | -4% | 74% | 41% | 267% | 9% | 920% | |
| Sequential Read 256KB (MB/s) | 283.1 | 269.3 -5% | 273.7 -3% | 272.1 -4% | 299.9 6% | 699 147% | 793 180% | 832 194% | 278 ? -2% | 2225 ? 686% |
| Sequential Write 256KB (MB/s) | 211.6 | 139.5 -34% | 138.8 -34% | 136.7 -35% | 104.2 -51% | 203.4 -4% | 193.2 -9% | 196.7 -7% | 178.6 ? -16% | 1903 ? 799% |
| Random Read 4KB (MB/s) | 54.7 | 36.8 -33% | 76 39% | 38.1 -30% | 82.6 51% | 138.1 152% | 127.2 133% | 144.3 164% | 60.9 ? 11% | 311 ? 469% |
| Random Write 4KB (MB/s) | 19.62 | 12 -39% | 10.1 -49% | 13.34 -32% | 14.69 -25% | 20 2% | 15.25 -22% | 160.5 718% | 34.2 ? 74% | 358 ? 1725% |
| Sequential Read 256KB SDCard (MB/s) | 82.2 | 83.9 ? 2% | 85.9 ? 5% | 83.8 2% | 77.9 ? -5% | 63.9 ? -22% | 77.4 ? -6% | |||
| Sequential Write 256KB SDCard (MB/s) | 62.3 | 72.1 ? 16% | 63.3 ? 2% | 61.4 -1% | 62.3 ? 0% | 53.5 ? -14% | 58.3 ? -6% |
| Asphalt 8: Airborne | |||
| Inställningar | Värde | ||
| high | 29 fps | ||
| Dead Trigger 2 | |||
| Inställningar | Värde | ||
| high | 30 fps | ||
| World of Tanks Blitz | |||
| Inställningar | Värde | ||
| high, 0xAA, 0xAF | 30 fps | ||
(+) Den maximala temperaturen på ovansidan är 39.6 °C / 103 F, jämfört med genomsnittet av 35.3 °C / 96 F , allt från 21.9 till 247 °C för klassen Smartphone.
(+) Botten värms upp till maximalt 38.7 °C / 102 F, jämfört med genomsnittet av 34 °C / 93 F
(+) Vid tomgångsbruk är medeltemperaturen för ovansidan 26 °C / 79 F, jämfört med enhetsgenomsnittet på 33 °C / ### class_avg_f### F.
Nokia 7 Plus ljudanalys
(+) | högtalare kan spela relativt högt (85.3 dB)
Bas 100 - 315 Hz
(-) | nästan ingen bas - i genomsnitt 25.3% lägre än medianen
(±) | linjäriteten för basen är genomsnittlig (7.1% delta till föregående frekvens)
Mellan 400 - 2000 Hz
(±) | högre mellan - i genomsnitt 6.1% högre än median
(±) | linjäriteten för mids är genomsnittlig (7.7% delta till föregående frekvens)
Högsta 2 - 16 kHz
(+) | balanserade toppar - endast 4.8% från medianen
(+) | toppar är linjära (3.7% delta till föregående frekvens)
Totalt 100 - 16 000 Hz
(±) | linjäriteten för det totala ljudet är genomsnittlig (22.1% skillnad mot median)
Jämfört med samma klass
» 47% av alla testade enheter i den här klassen var bättre, 7% liknande, 46% sämre
» Den bästa hade ett delta på 11%, genomsnittet var 34%, sämst var 134%
Jämfört med alla testade enheter
» 64% av alla testade enheter var bättre, 6% liknande, 30% sämre
» Den bästa hade ett delta på 4%, genomsnittet var 23%, sämst var 134%
Samsung Galaxy A8 2018 ljudanalys
(+) | högtalare kan spela relativt högt (85 dB)
Bas 100 - 315 Hz
(-) | nästan ingen bas - i genomsnitt 28.7% lägre än medianen
(±) | linjäriteten för basen är genomsnittlig (9.6% delta till föregående frekvens)
Mellan 400 - 2000 Hz
(+) | balanserad mellan - endast 2.8% från medianen
(+) | mids är linjära (5.3% delta till föregående frekvens)
Högsta 2 - 16 kHz
(+) | balanserade toppar - endast 4.6% från medianen
(+) | toppar är linjära (5.9% delta till föregående frekvens)
Totalt 100 - 16 000 Hz
(±) | linjäriteten för det totala ljudet är genomsnittlig (20.2% skillnad mot median)
Jämfört med samma klass
» 34% av alla testade enheter i den här klassen var bättre, 9% liknande, 57% sämre
» Den bästa hade ett delta på 11%, genomsnittet var 34%, sämst var 134%
Jämfört med alla testade enheter
» 53% av alla testade enheter var bättre, 8% liknande, 39% sämre
» Den bästa hade ett delta på 4%, genomsnittet var 23%, sämst var 134%
| Av/Standby | |
| Låg belastning | |
| Hög belastning |
|
Förklaring:
min: | |
| Nokia 7 Plus 3800 mAh | Asus ZenFone 4 Selfie Pro ZD552KL 3000 mAh | Sony Xperia XA2 Ultra 3580 mAh | Wiko WIM 3200 mAh | Samsung Galaxy A8 2018 3000 mAh | OnePlus 5T 3300 mAh | Samsung Galaxy S8 3000 mAh | Huawei P20 Pro 4000 mAh | Genomsnitt Qualcomm Snapdragon 660 | Genomsnitt av klass Smartphone | |
|---|---|---|---|---|---|---|---|---|---|---|
| Power Consumption | 36% | -6% | 21% | 25% | 16% | 21% | 23% | -37% | -18% | |
| Idle Minimum * (Watt) | 0.65 | 0.58 11% | 0.77 -18% | 0.93 -43% | 0.67 -3% | 0.58 11% | 0.78 -20% | 0.84 -29% | 1.052 ? -62% | 0.887 ? -36% |
| Idle Average * (Watt) | 1.76 | 1.31 26% | 2.12 -20% | 1.28 27% | 1.02 42% | 1.44 18% | 1.1 37% | 1.54 12% | 2.62 ? -49% | 1.485 ? 16% |
| Idle Maximum * (Watt) | 1.78 | 1.33 25% | 2.17 -22% | 1.37 23% | 1.1 38% | 1.53 14% | 1.16 35% | 1.57 12% | 2.88 ? -62% | 1.672 ? 6% |
| Load Average * (Watt) | 4.47 | 1.88 58% | 4.3 4% | 2.39 47% | 3.86 14% | 3.17 29% | 4.15 7% | 2.47 45% | 5.1 ? -14% | 6.76 ? -51% |
| Load Maximum * (Watt) | 9.13 | 3.8 58% | 6.73 26% | 4.25 53% | 5.97 35% | 8.54 6% | 5.12 44% | 2.49 73% | 9.08 ? 1% | 11.2 ? -23% |
* ... mindre är bättre
| Nokia 7 Plus 3800 mAh | Asus ZenFone 4 Selfie Pro ZD552KL 3000 mAh | Sony Xperia XA2 Ultra 3580 mAh | Wiko WIM 3200 mAh | Samsung Galaxy A8 2018 3000 mAh | OnePlus 5T 3300 mAh | Samsung Galaxy S8 3000 mAh | Huawei P20 Pro 4000 mAh | |
|---|---|---|---|---|---|---|---|---|
| Batteridrifttid | -3% | 28% | -27% | 20% | 22% | 21% | 37% | |
| Reader / Idle (h) | 28.4 | 29.8 5% | 25.8 -9% | 29.2 3% | 27.8 -2% | 28.8 1% | ||
| H.264 (h) | 11.8 | 14.6 24% | 15.1 28% | 13.3 13% | 12.9 9% | 13.1 11% | ||
| WiFi v1.3 (h) | 11.2 | 10.9 -3% | 14.2 27% | 8.2 -27% | 10.8 -4% | 12 7% | 12 7% | 12.4 11% |
| Load (h) | 2.6 | 4 54% | 4.3 65% | 4.3 65% | 4.4 69% | 5.8 123% |
För
Emot
Läs den fullständiga versionen av den här recensionen på engelska här.
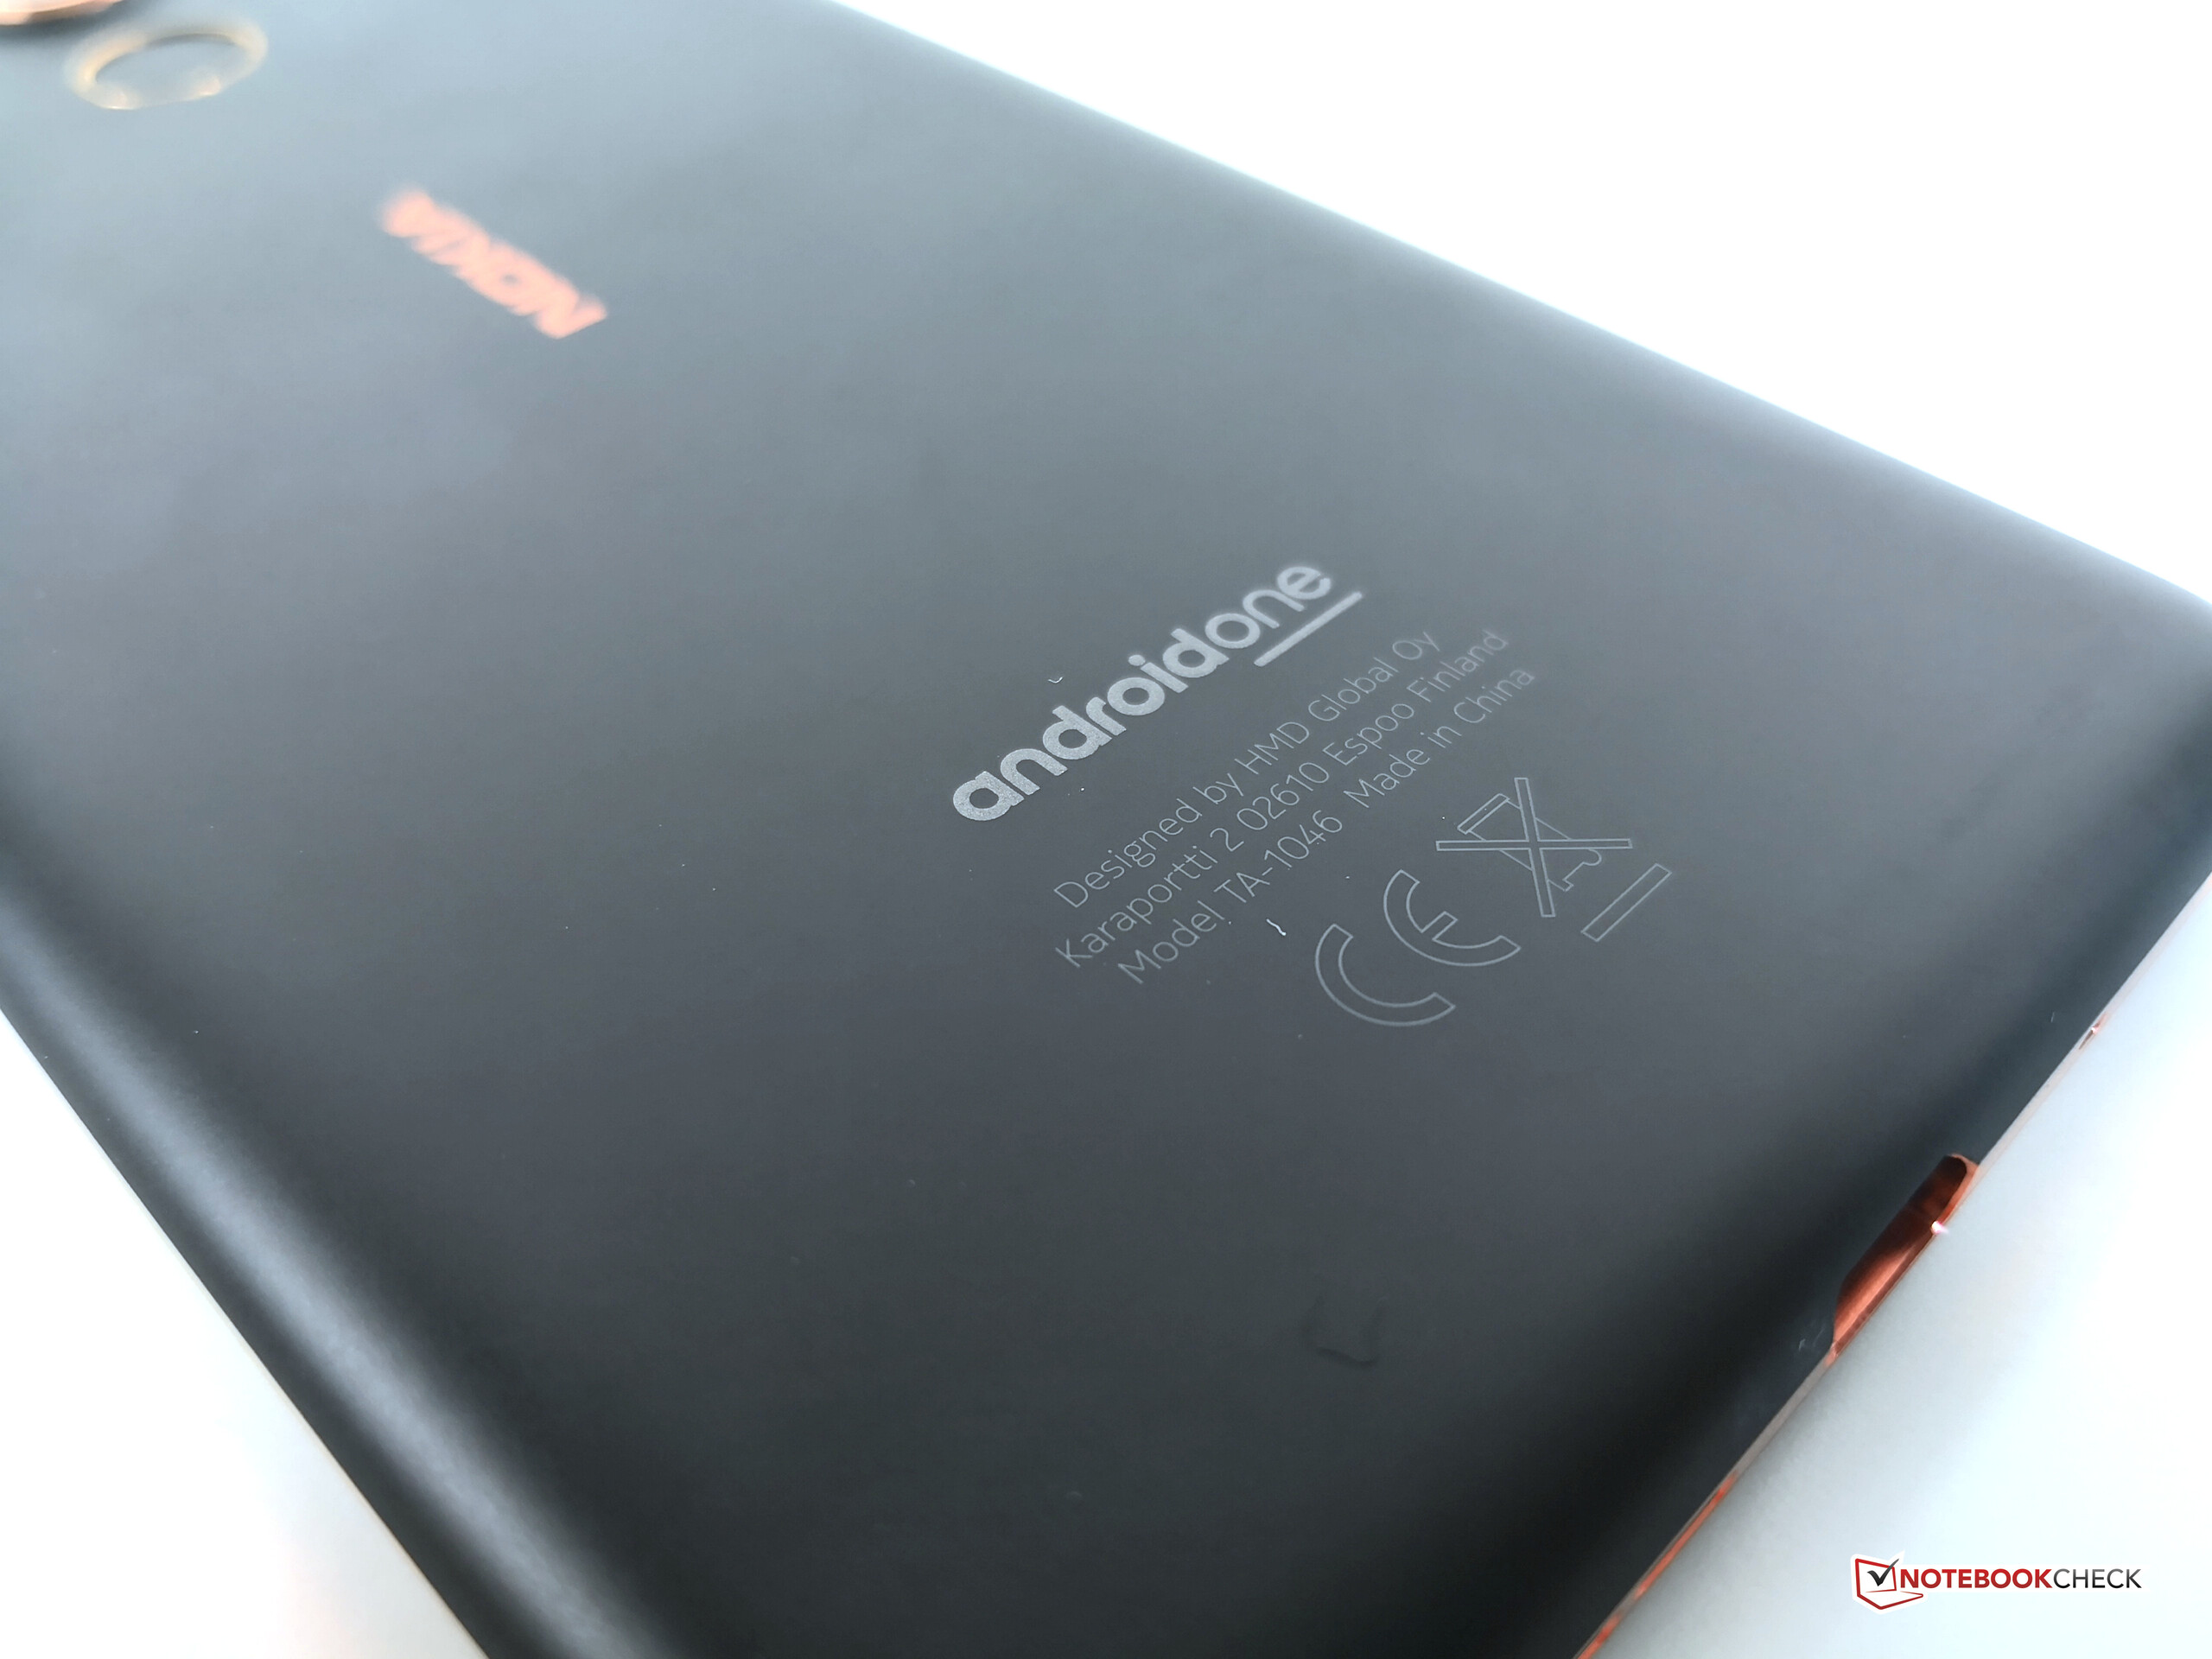
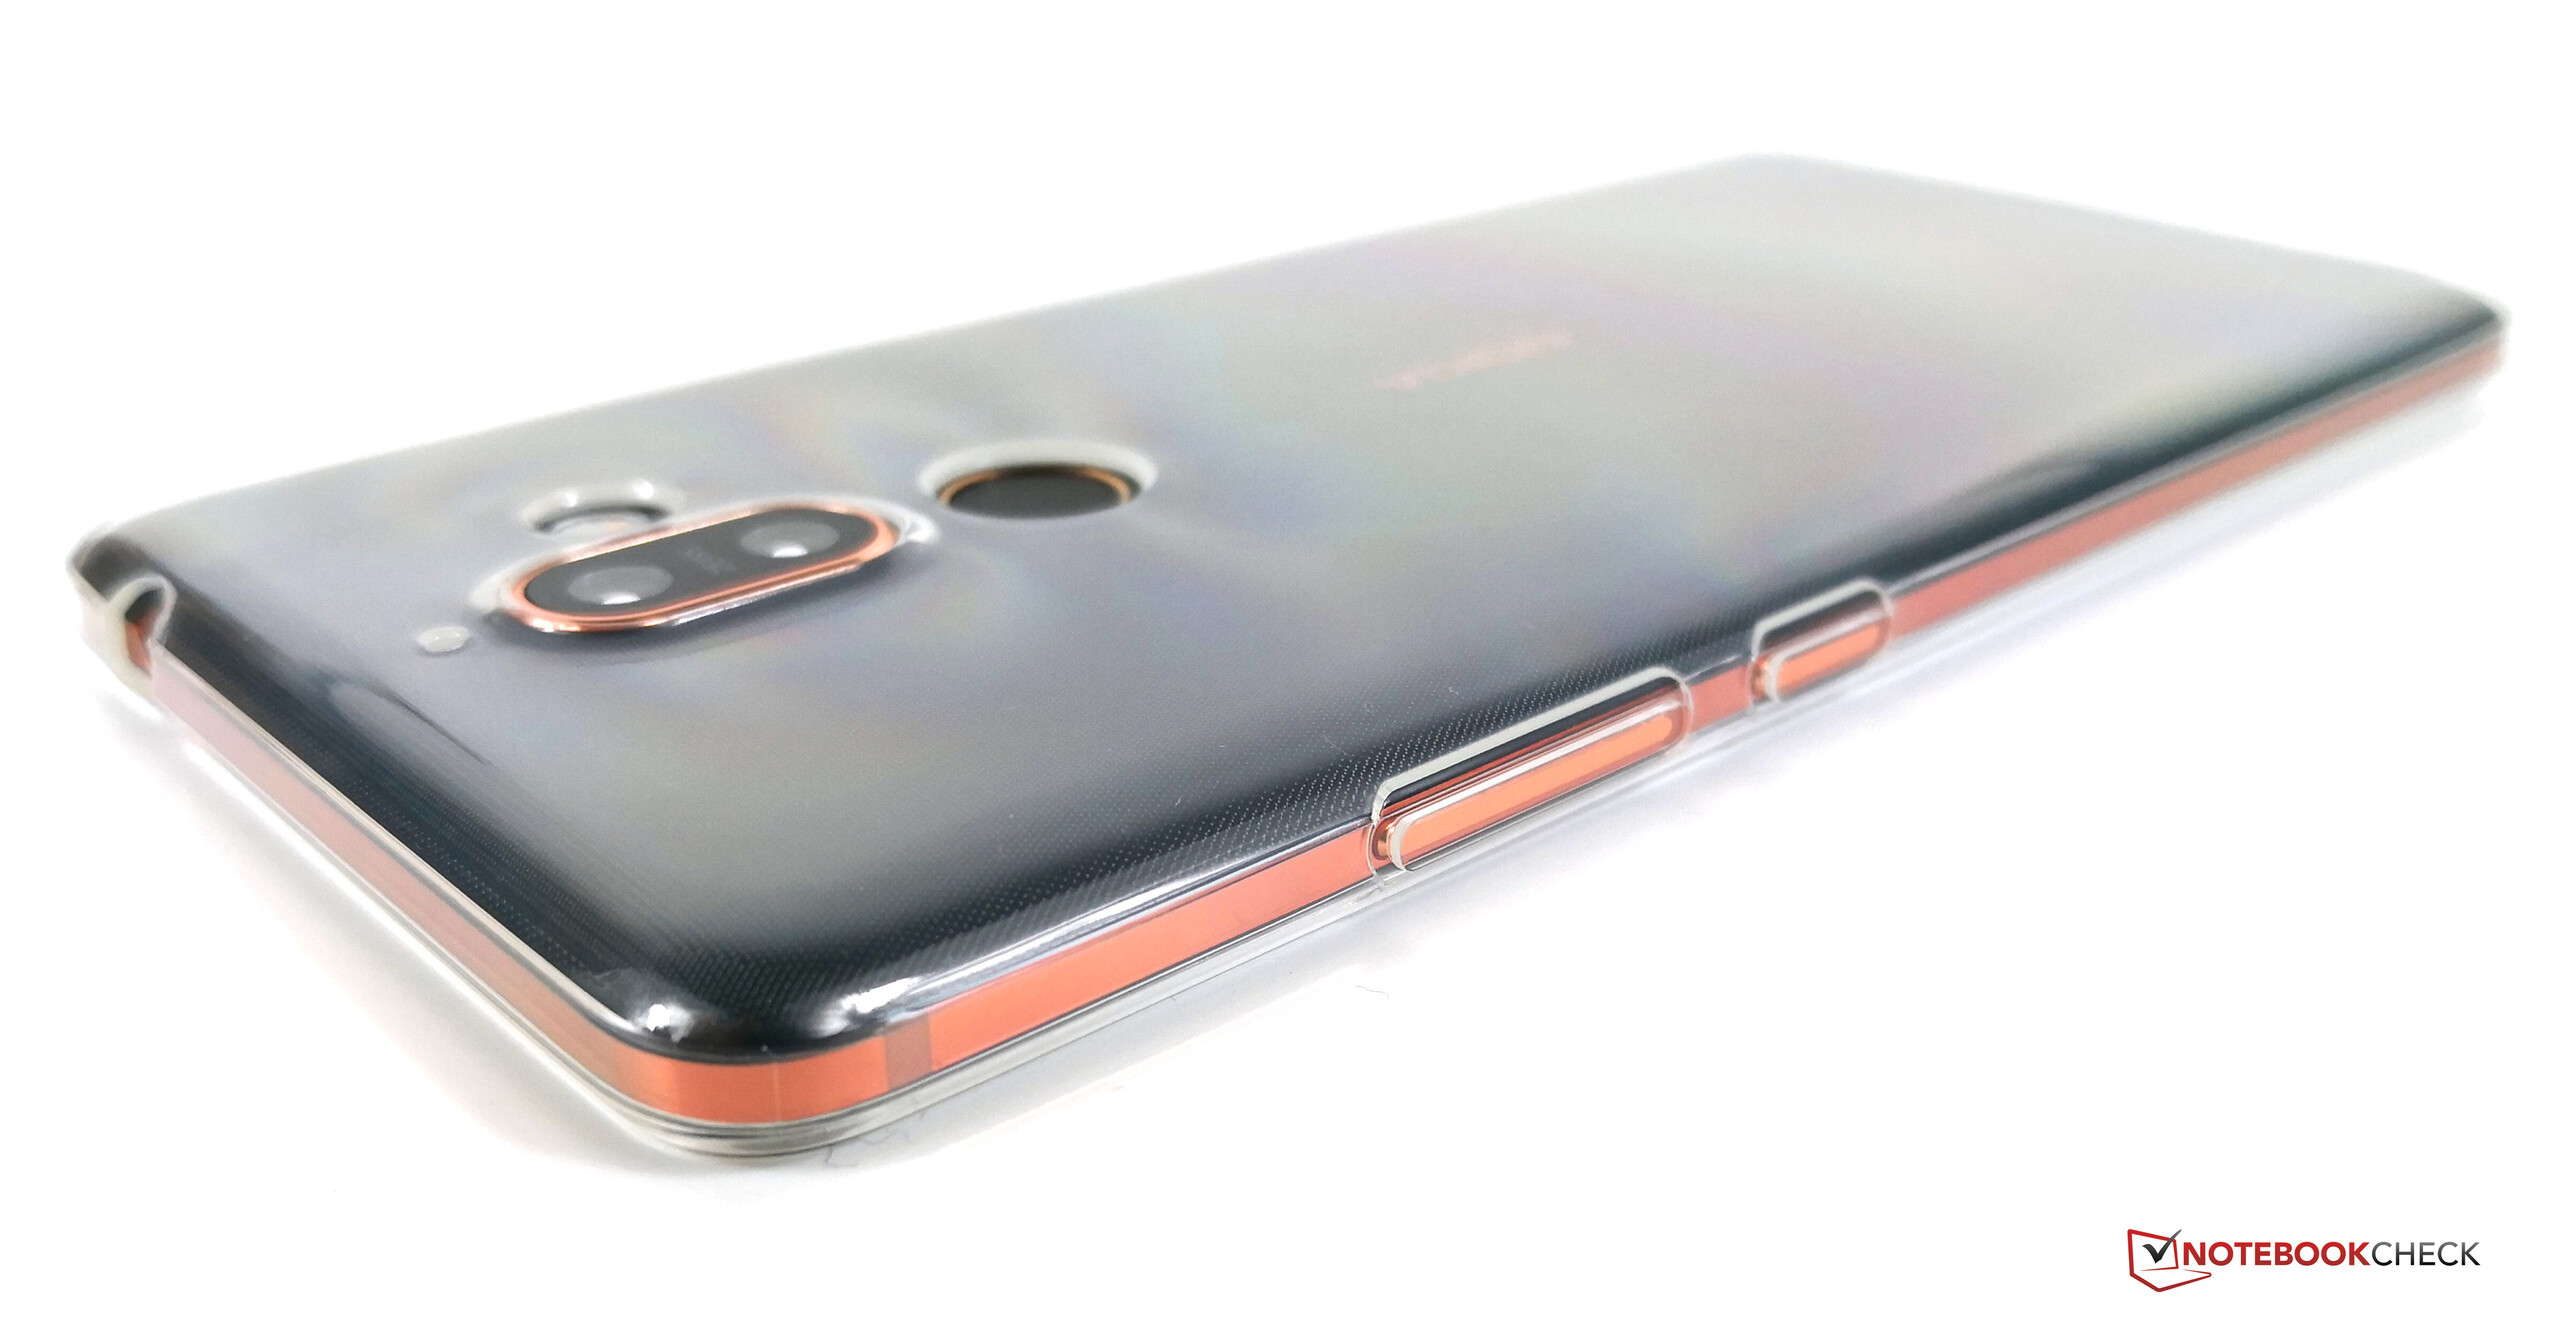
Med Nokia 7 Plus erbjuder den Finska tillverkaren HMD Global en väldigt intressant helhet som ligger i prisskiktet runt 3 600 - 4000 kronor (vid skrivande stund). Detta gäller särskilt med tanke på att telefonen kommer via Android One-programmet och därför garanteras säkerhets och mjukvaruuppdateringar för en lång tid framöver.
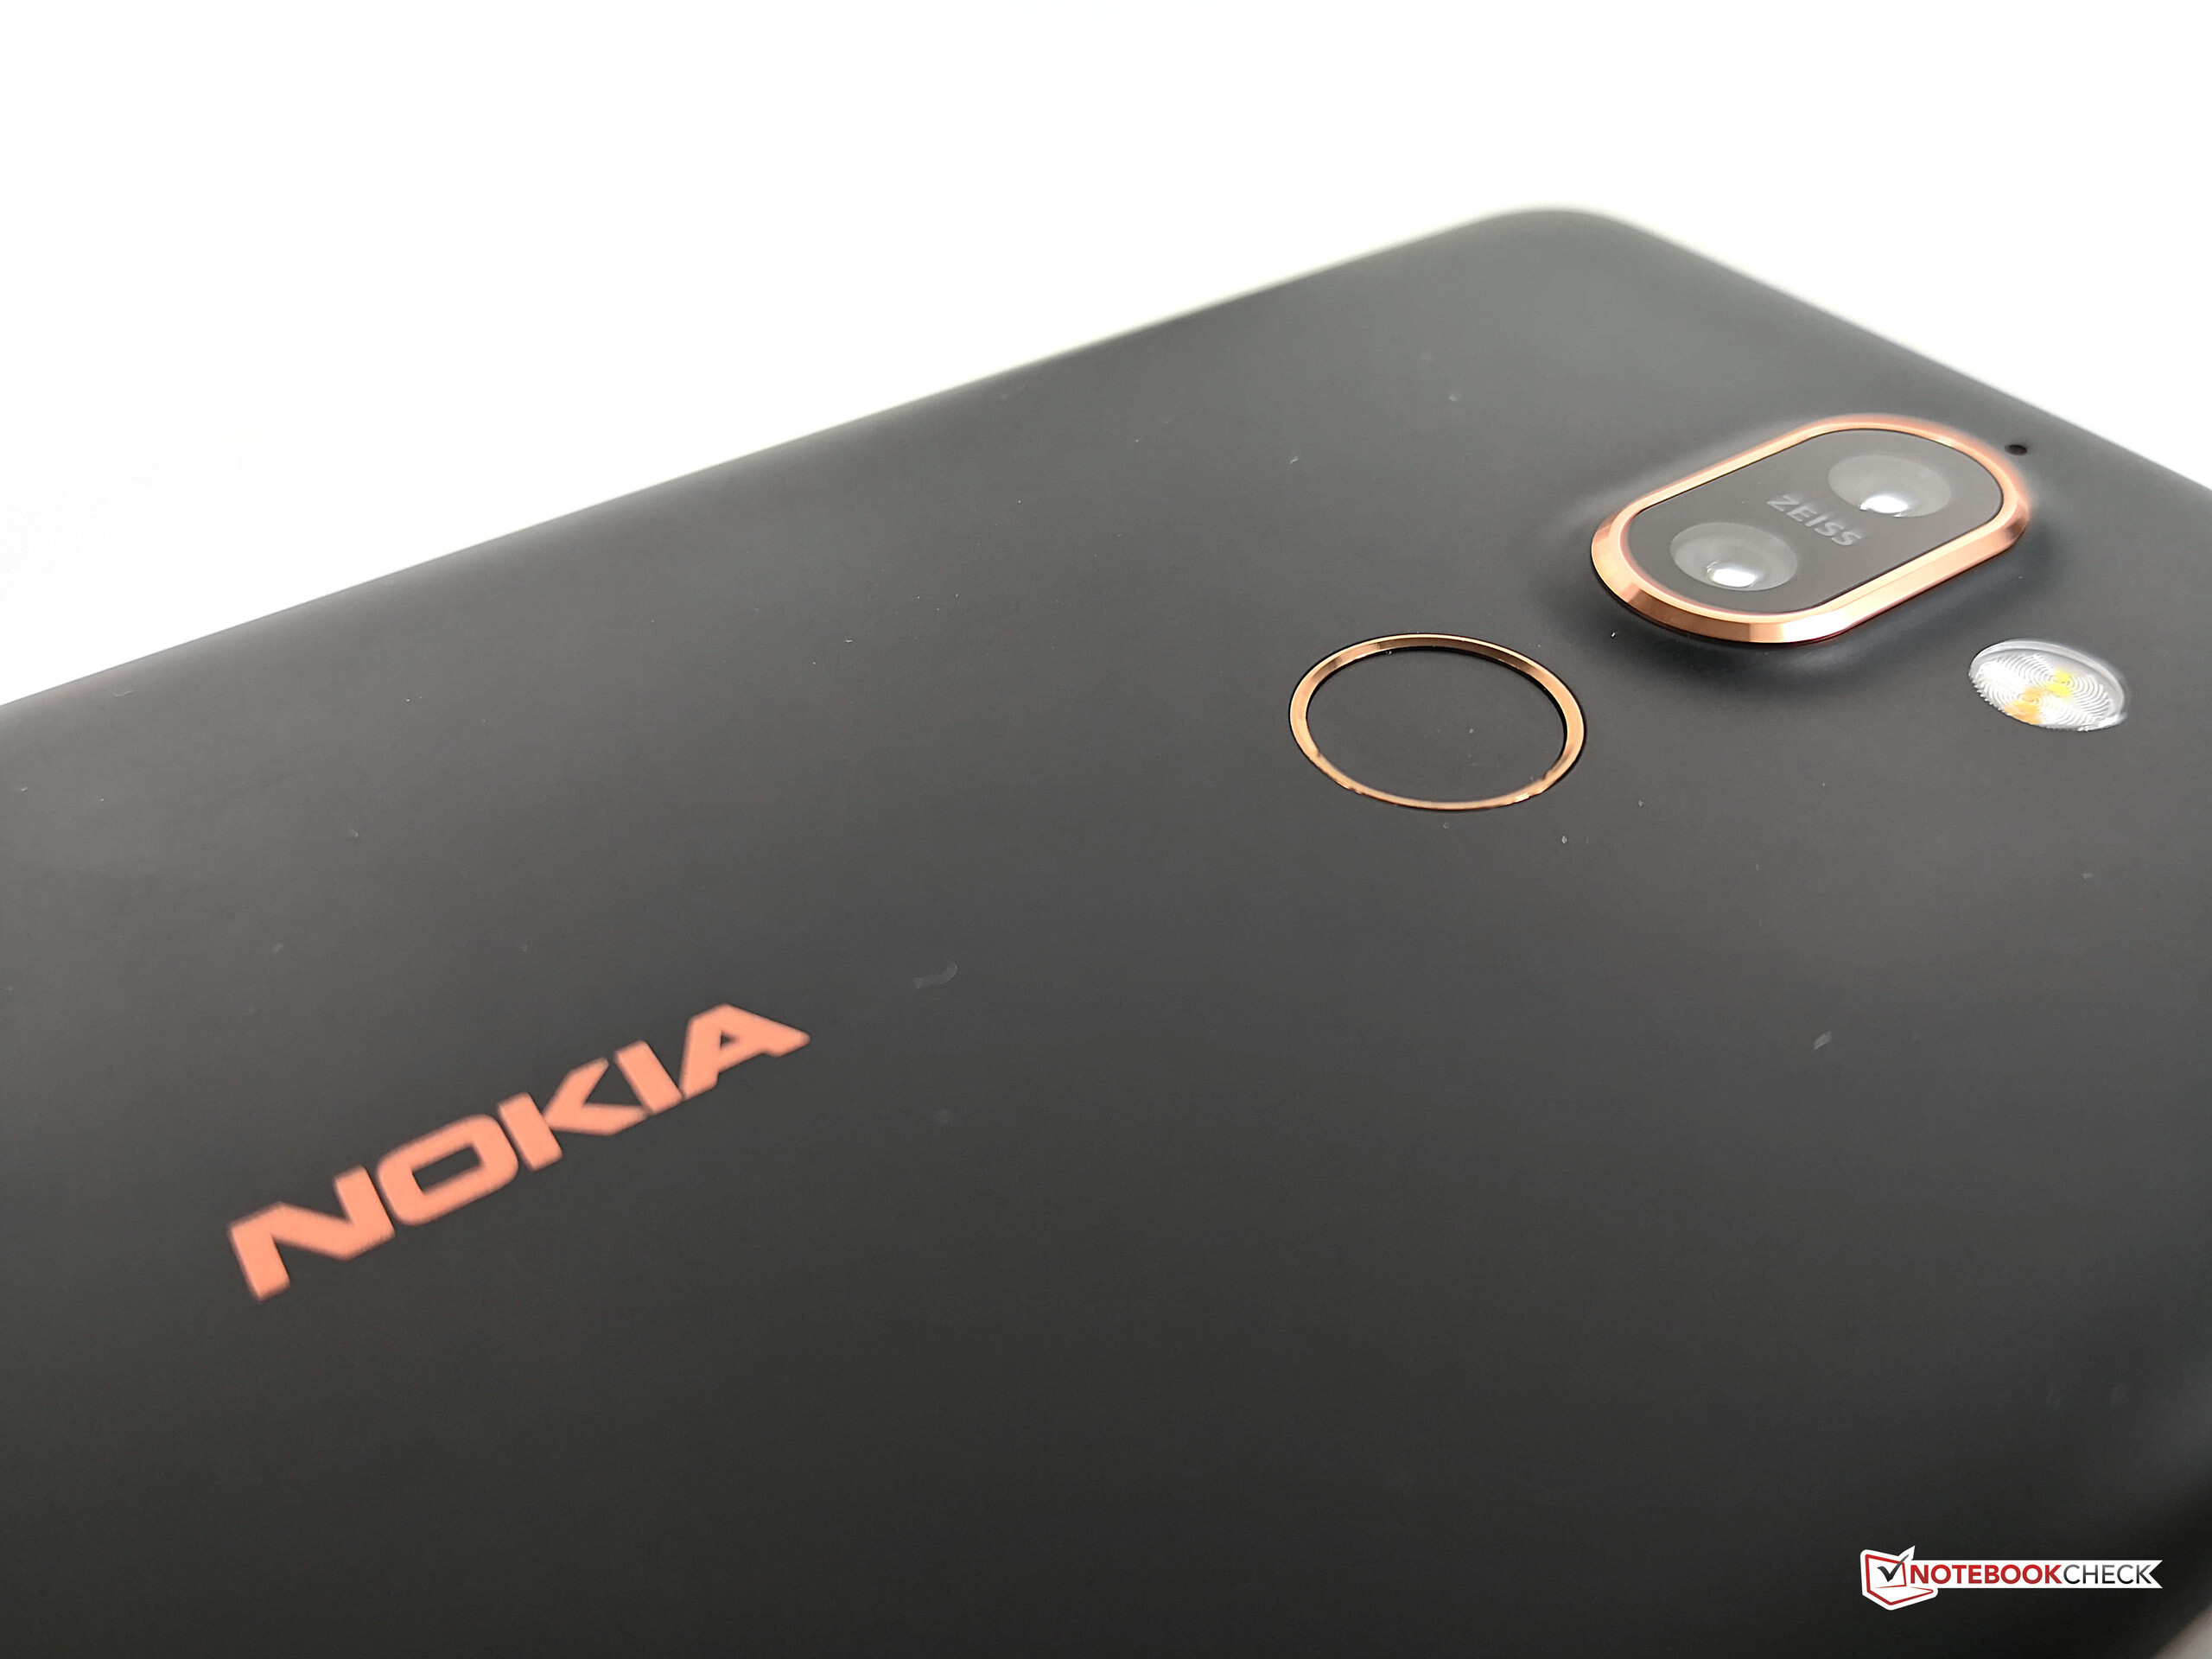
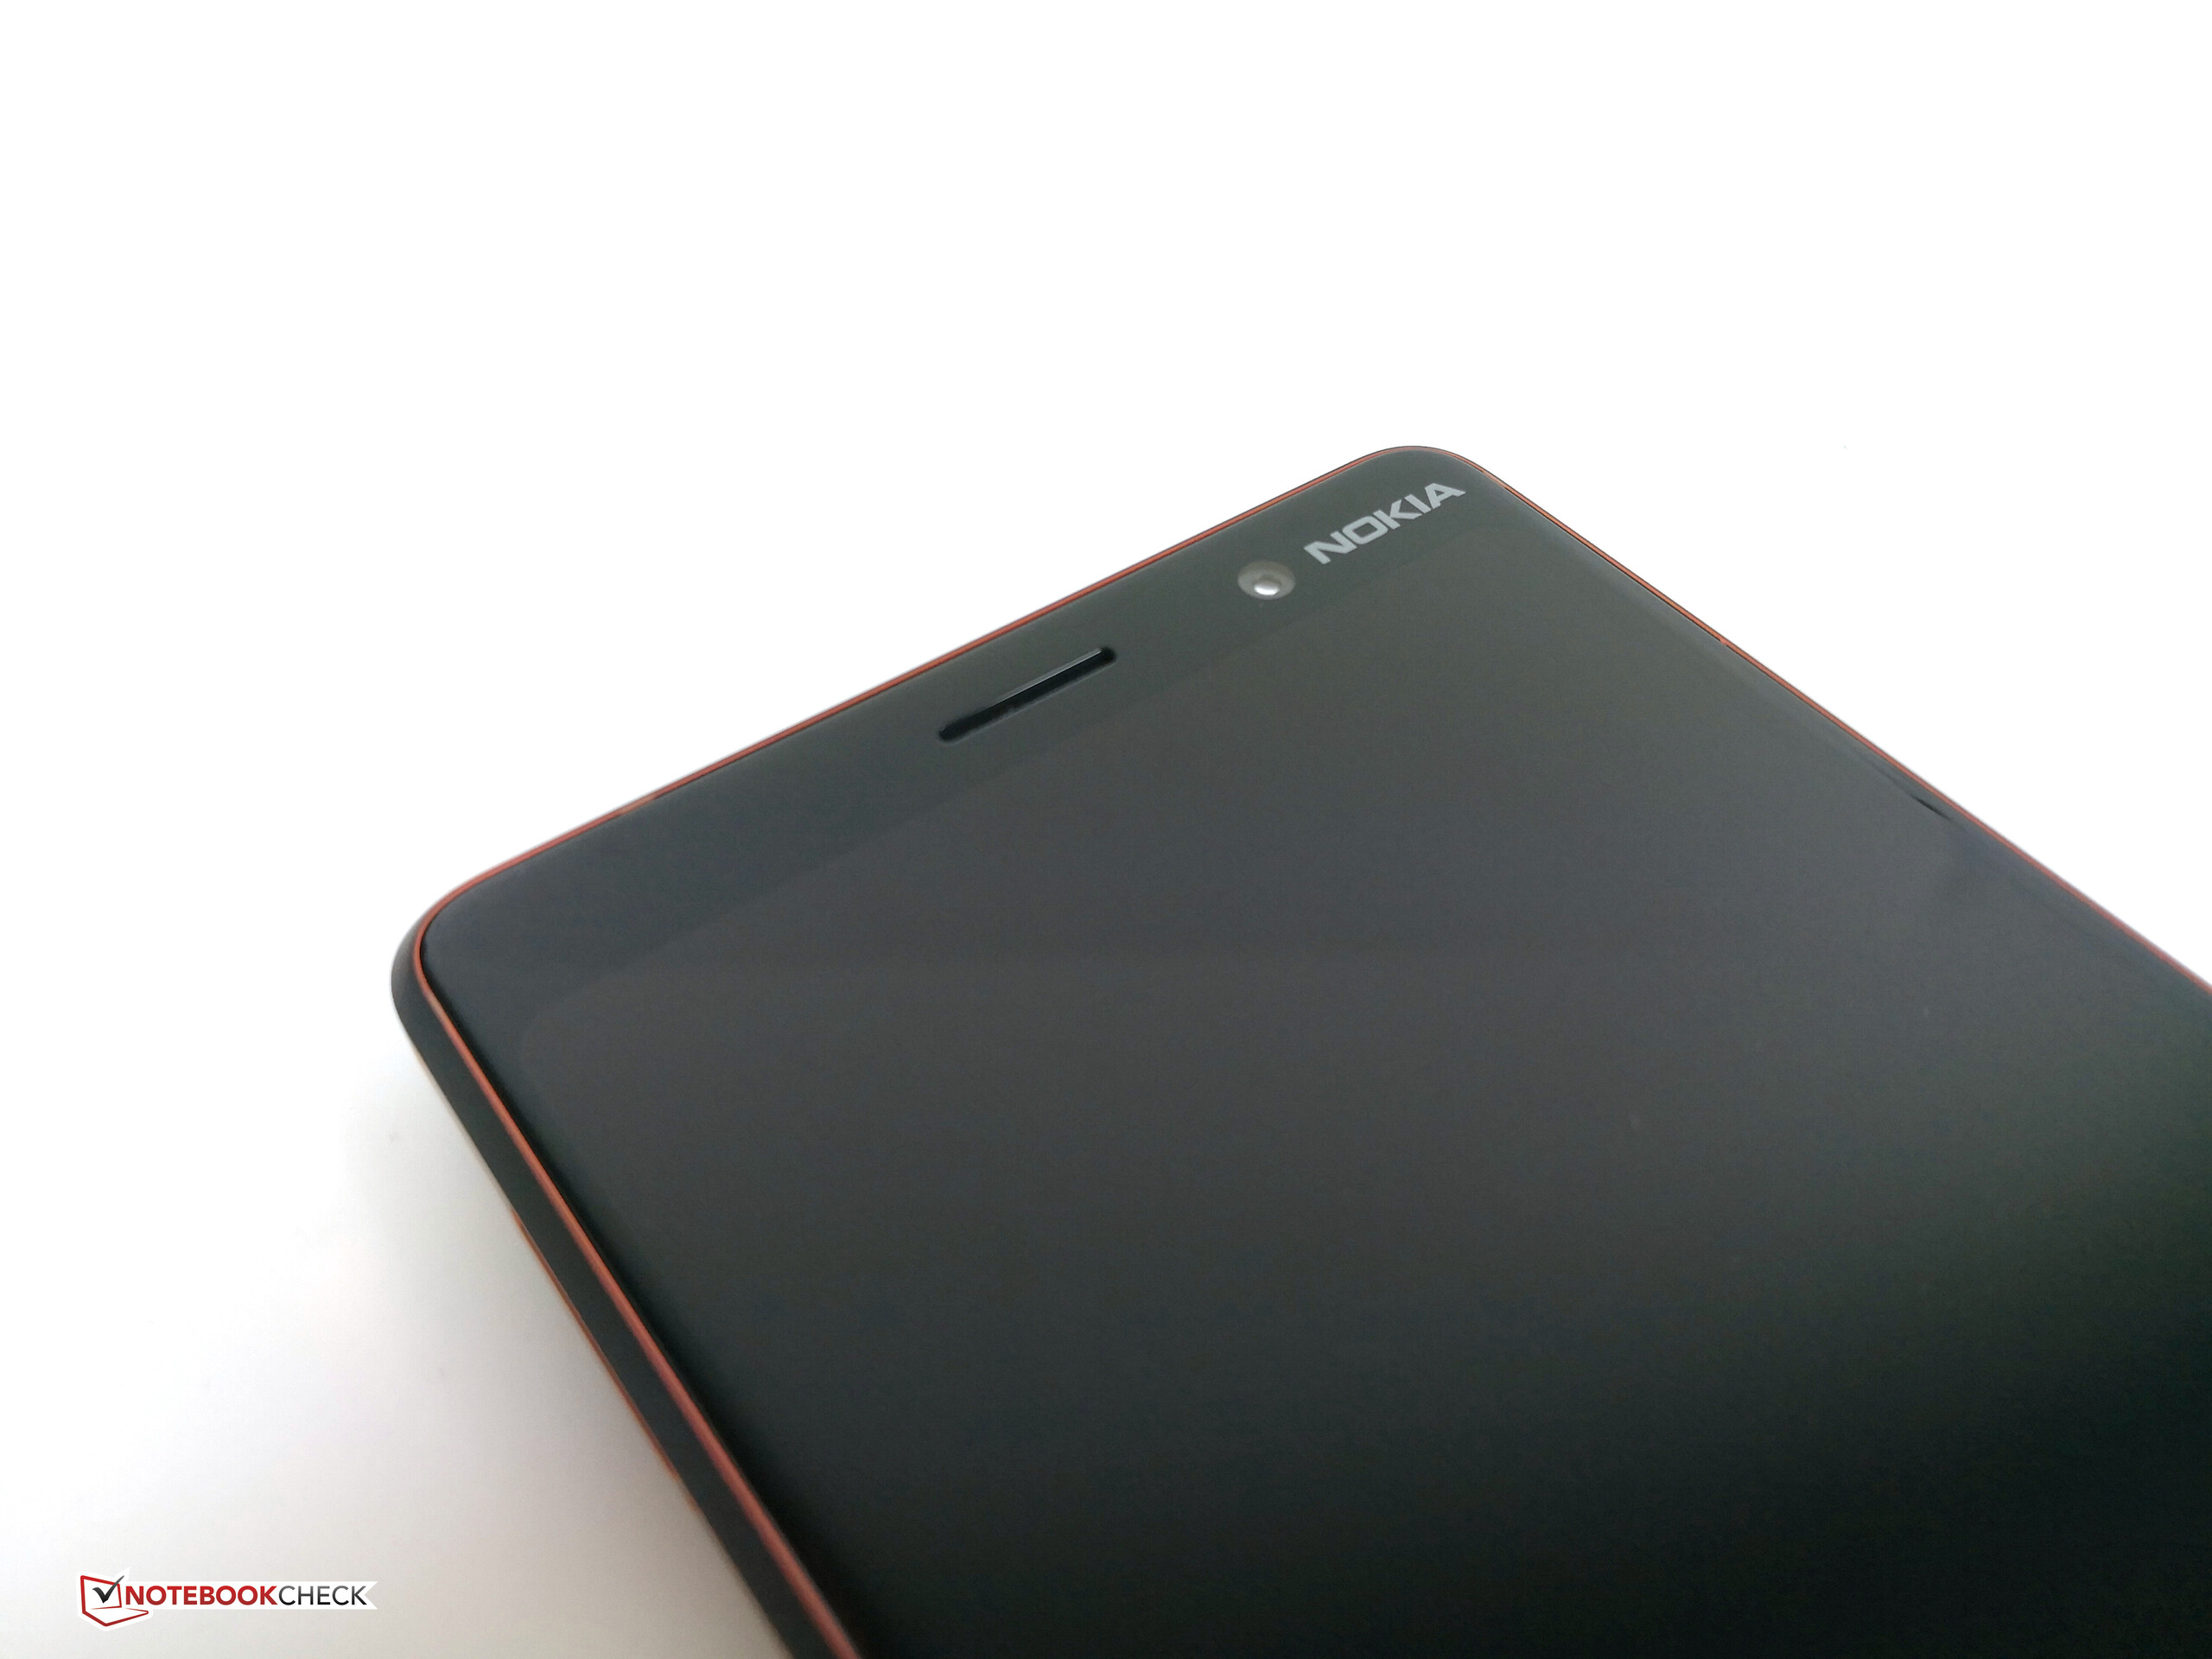
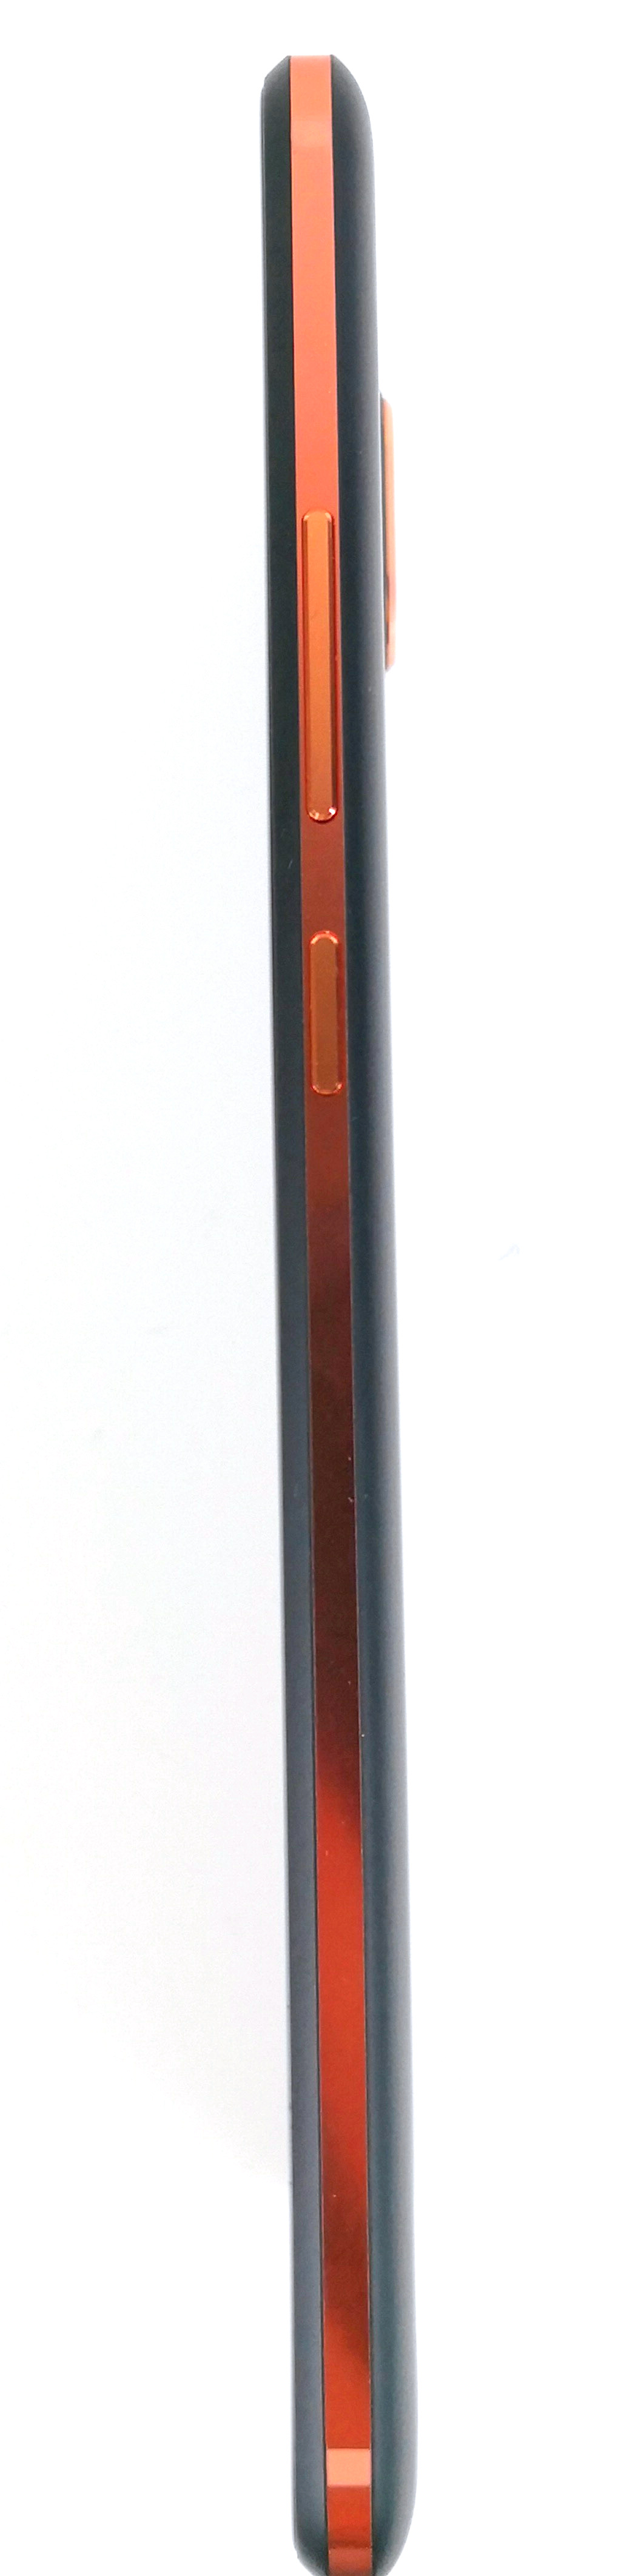
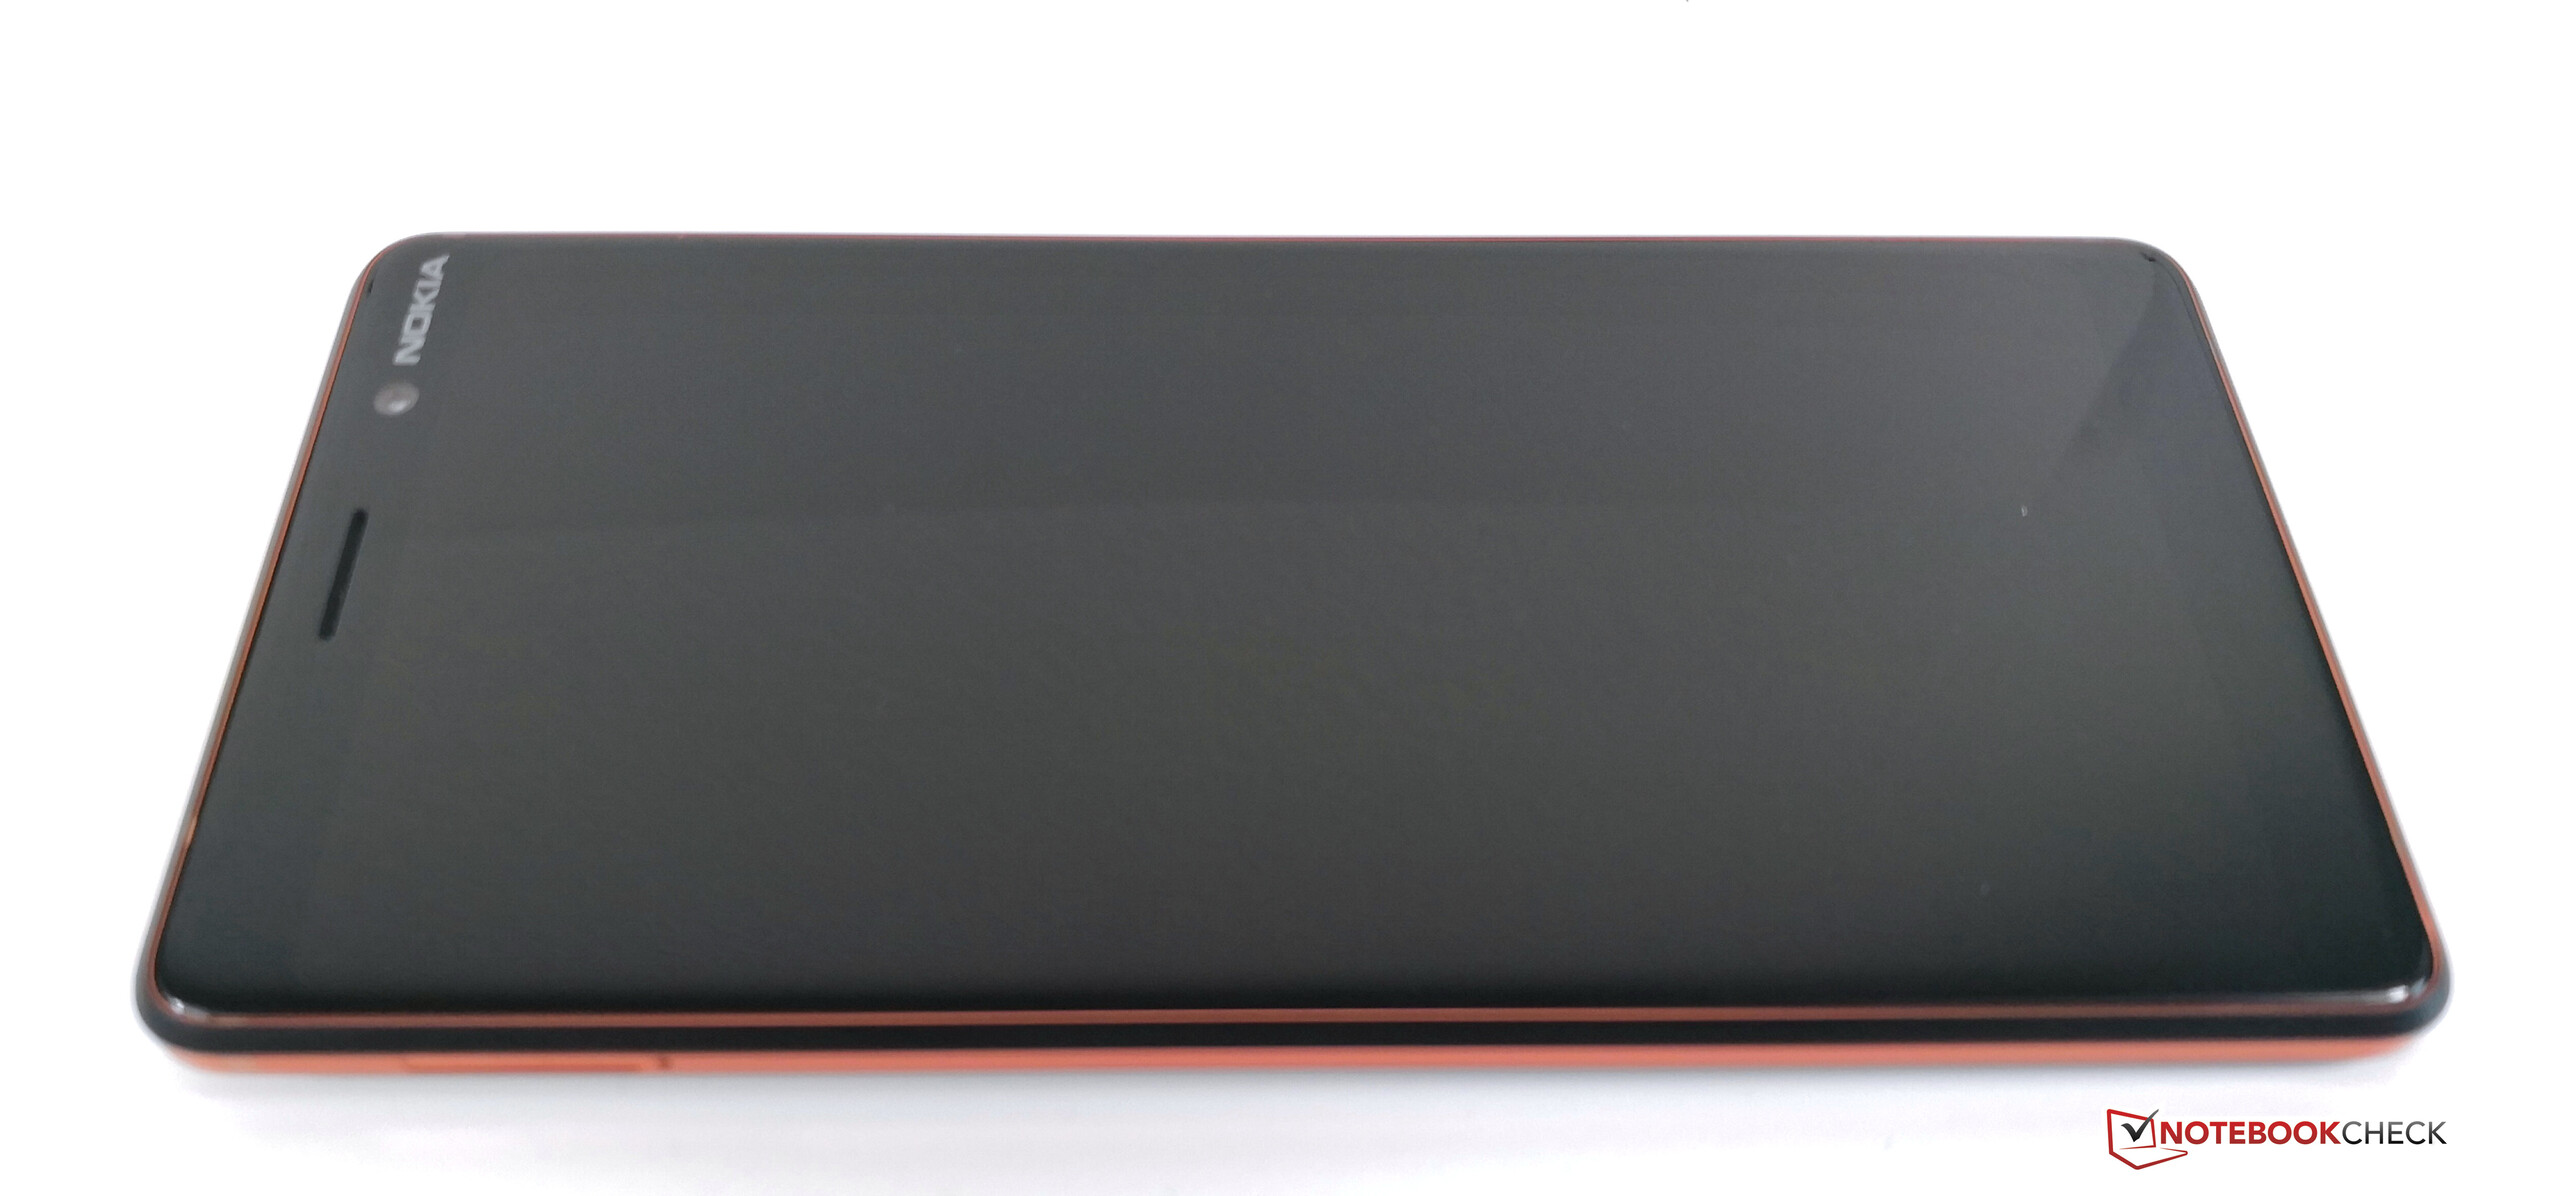
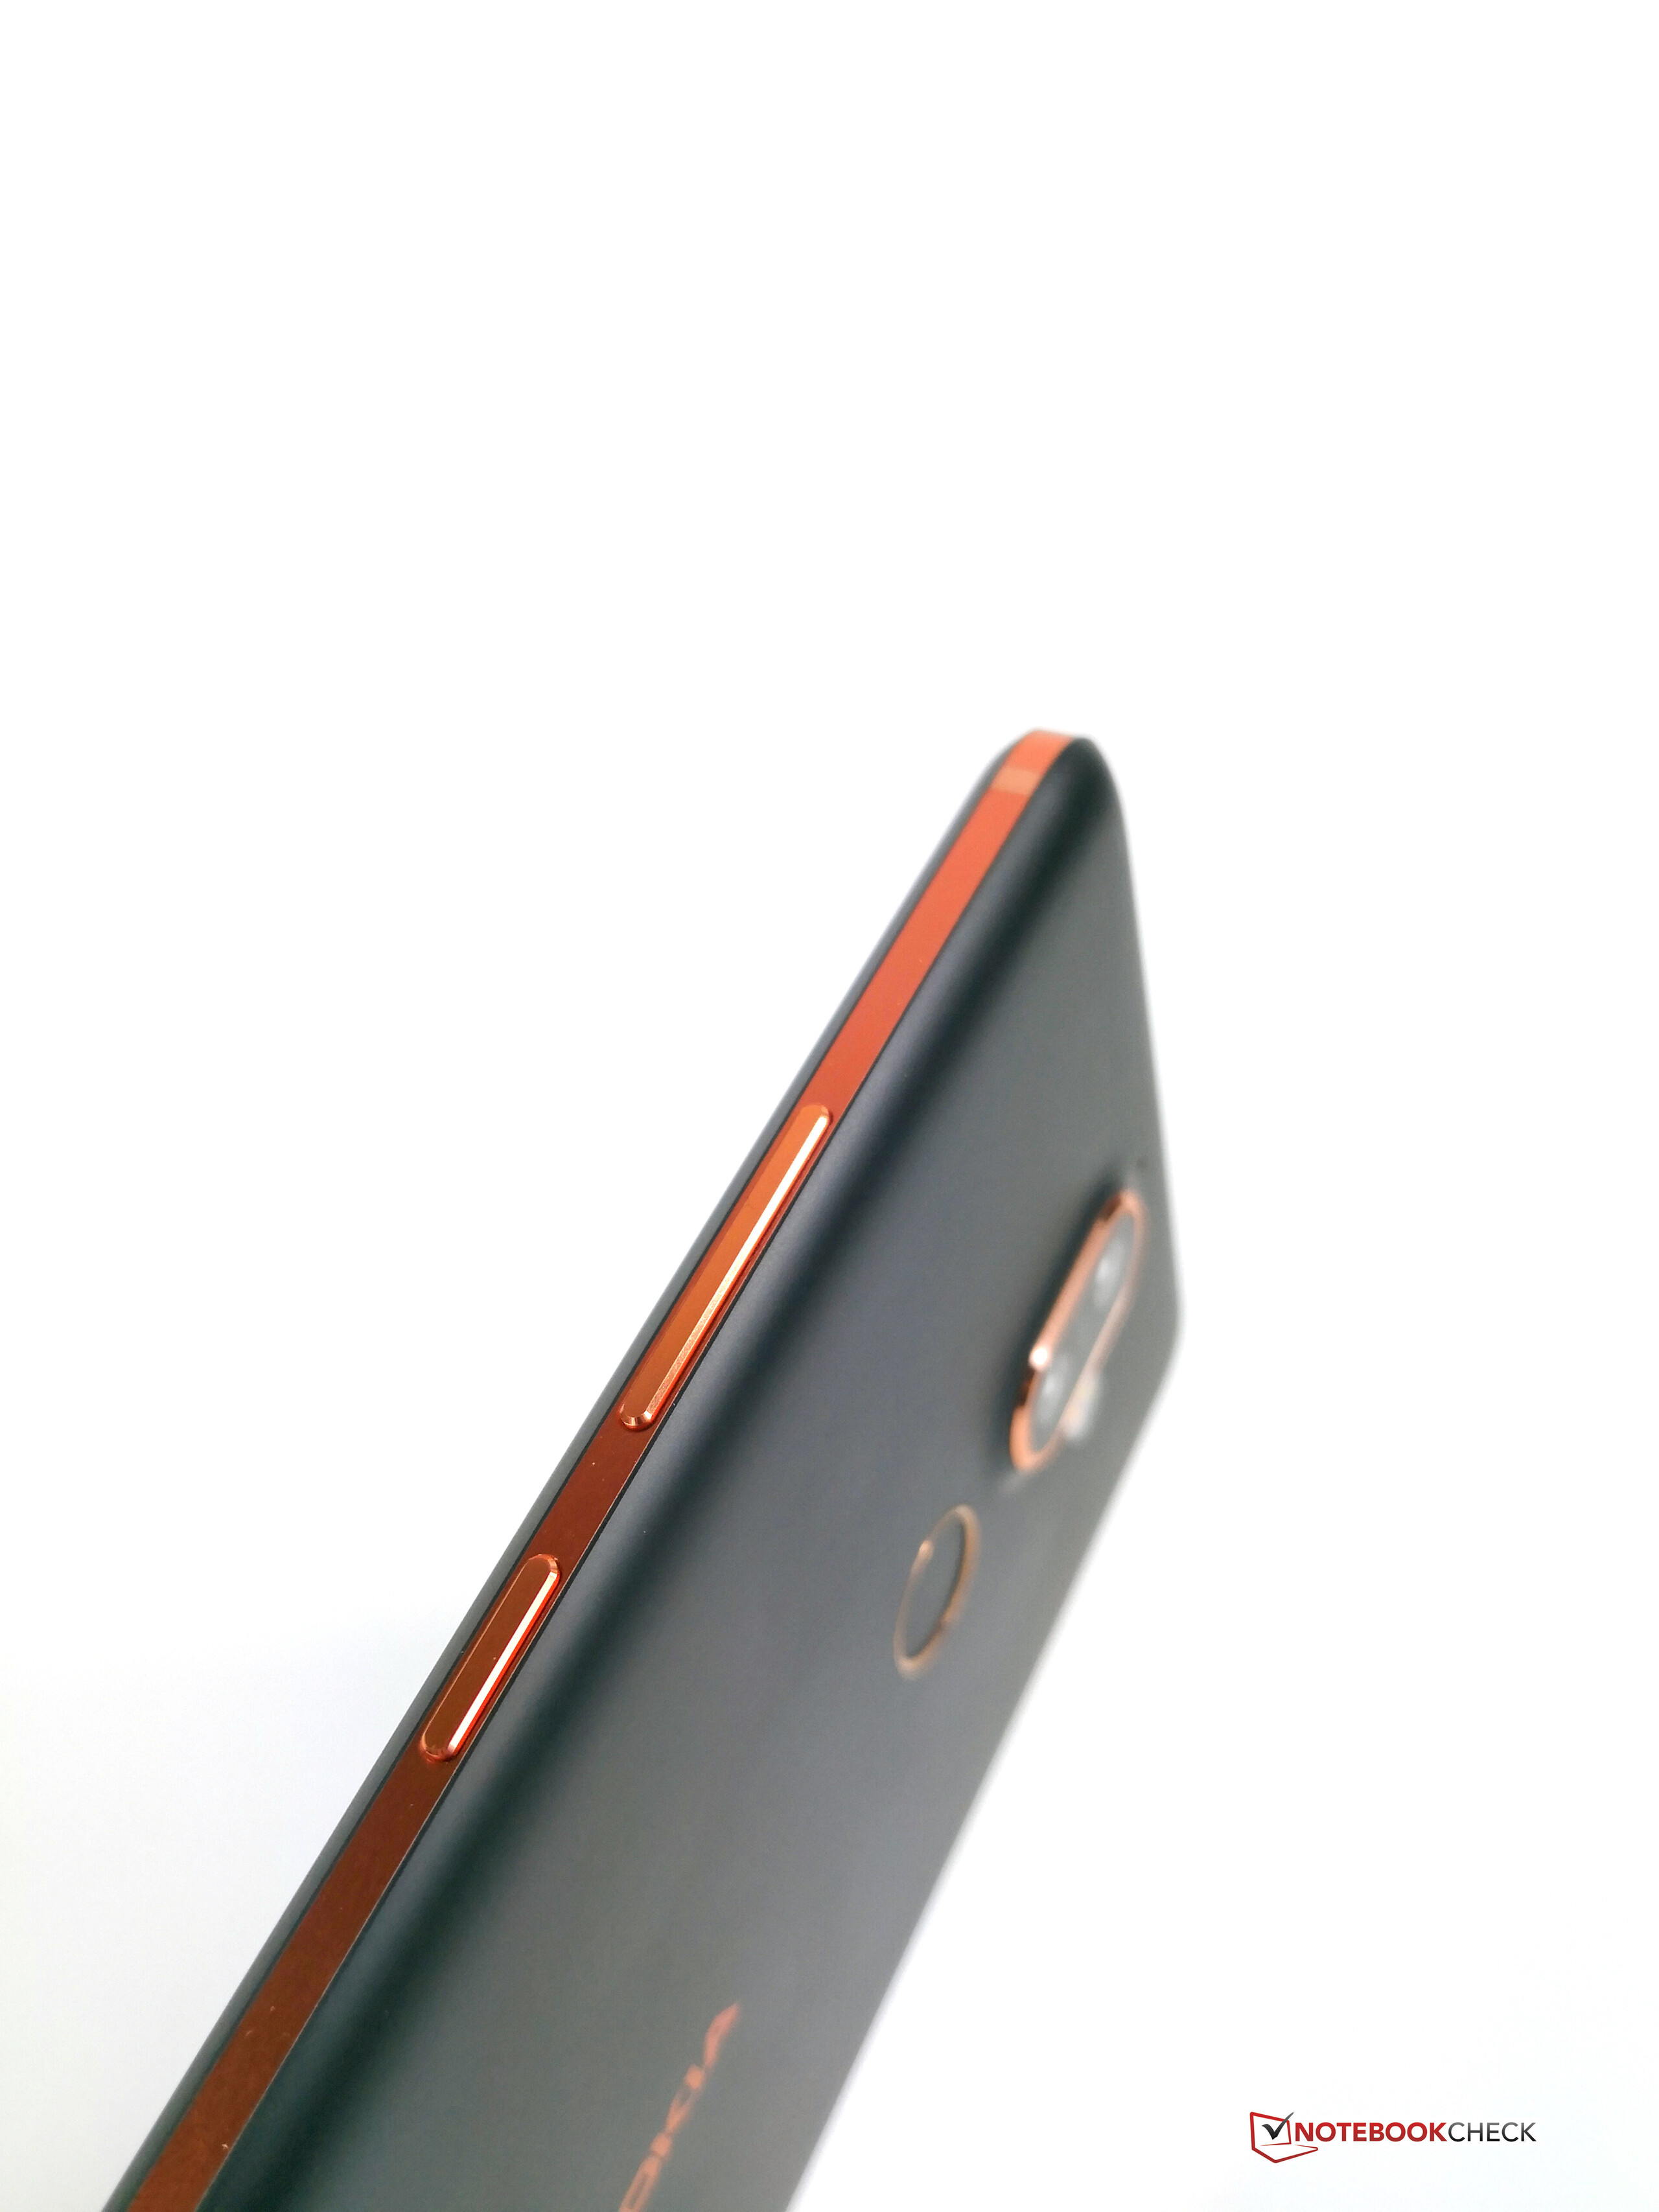
Nokia 7 Plus ser bra ut och känns väldigt bra. Men med det sagt så tyckte vi inte att materialvalet på enhetens baksida var 100% imponerande. Dessutom känns telefonens sidor kantiga och den känns klumpig i handen.
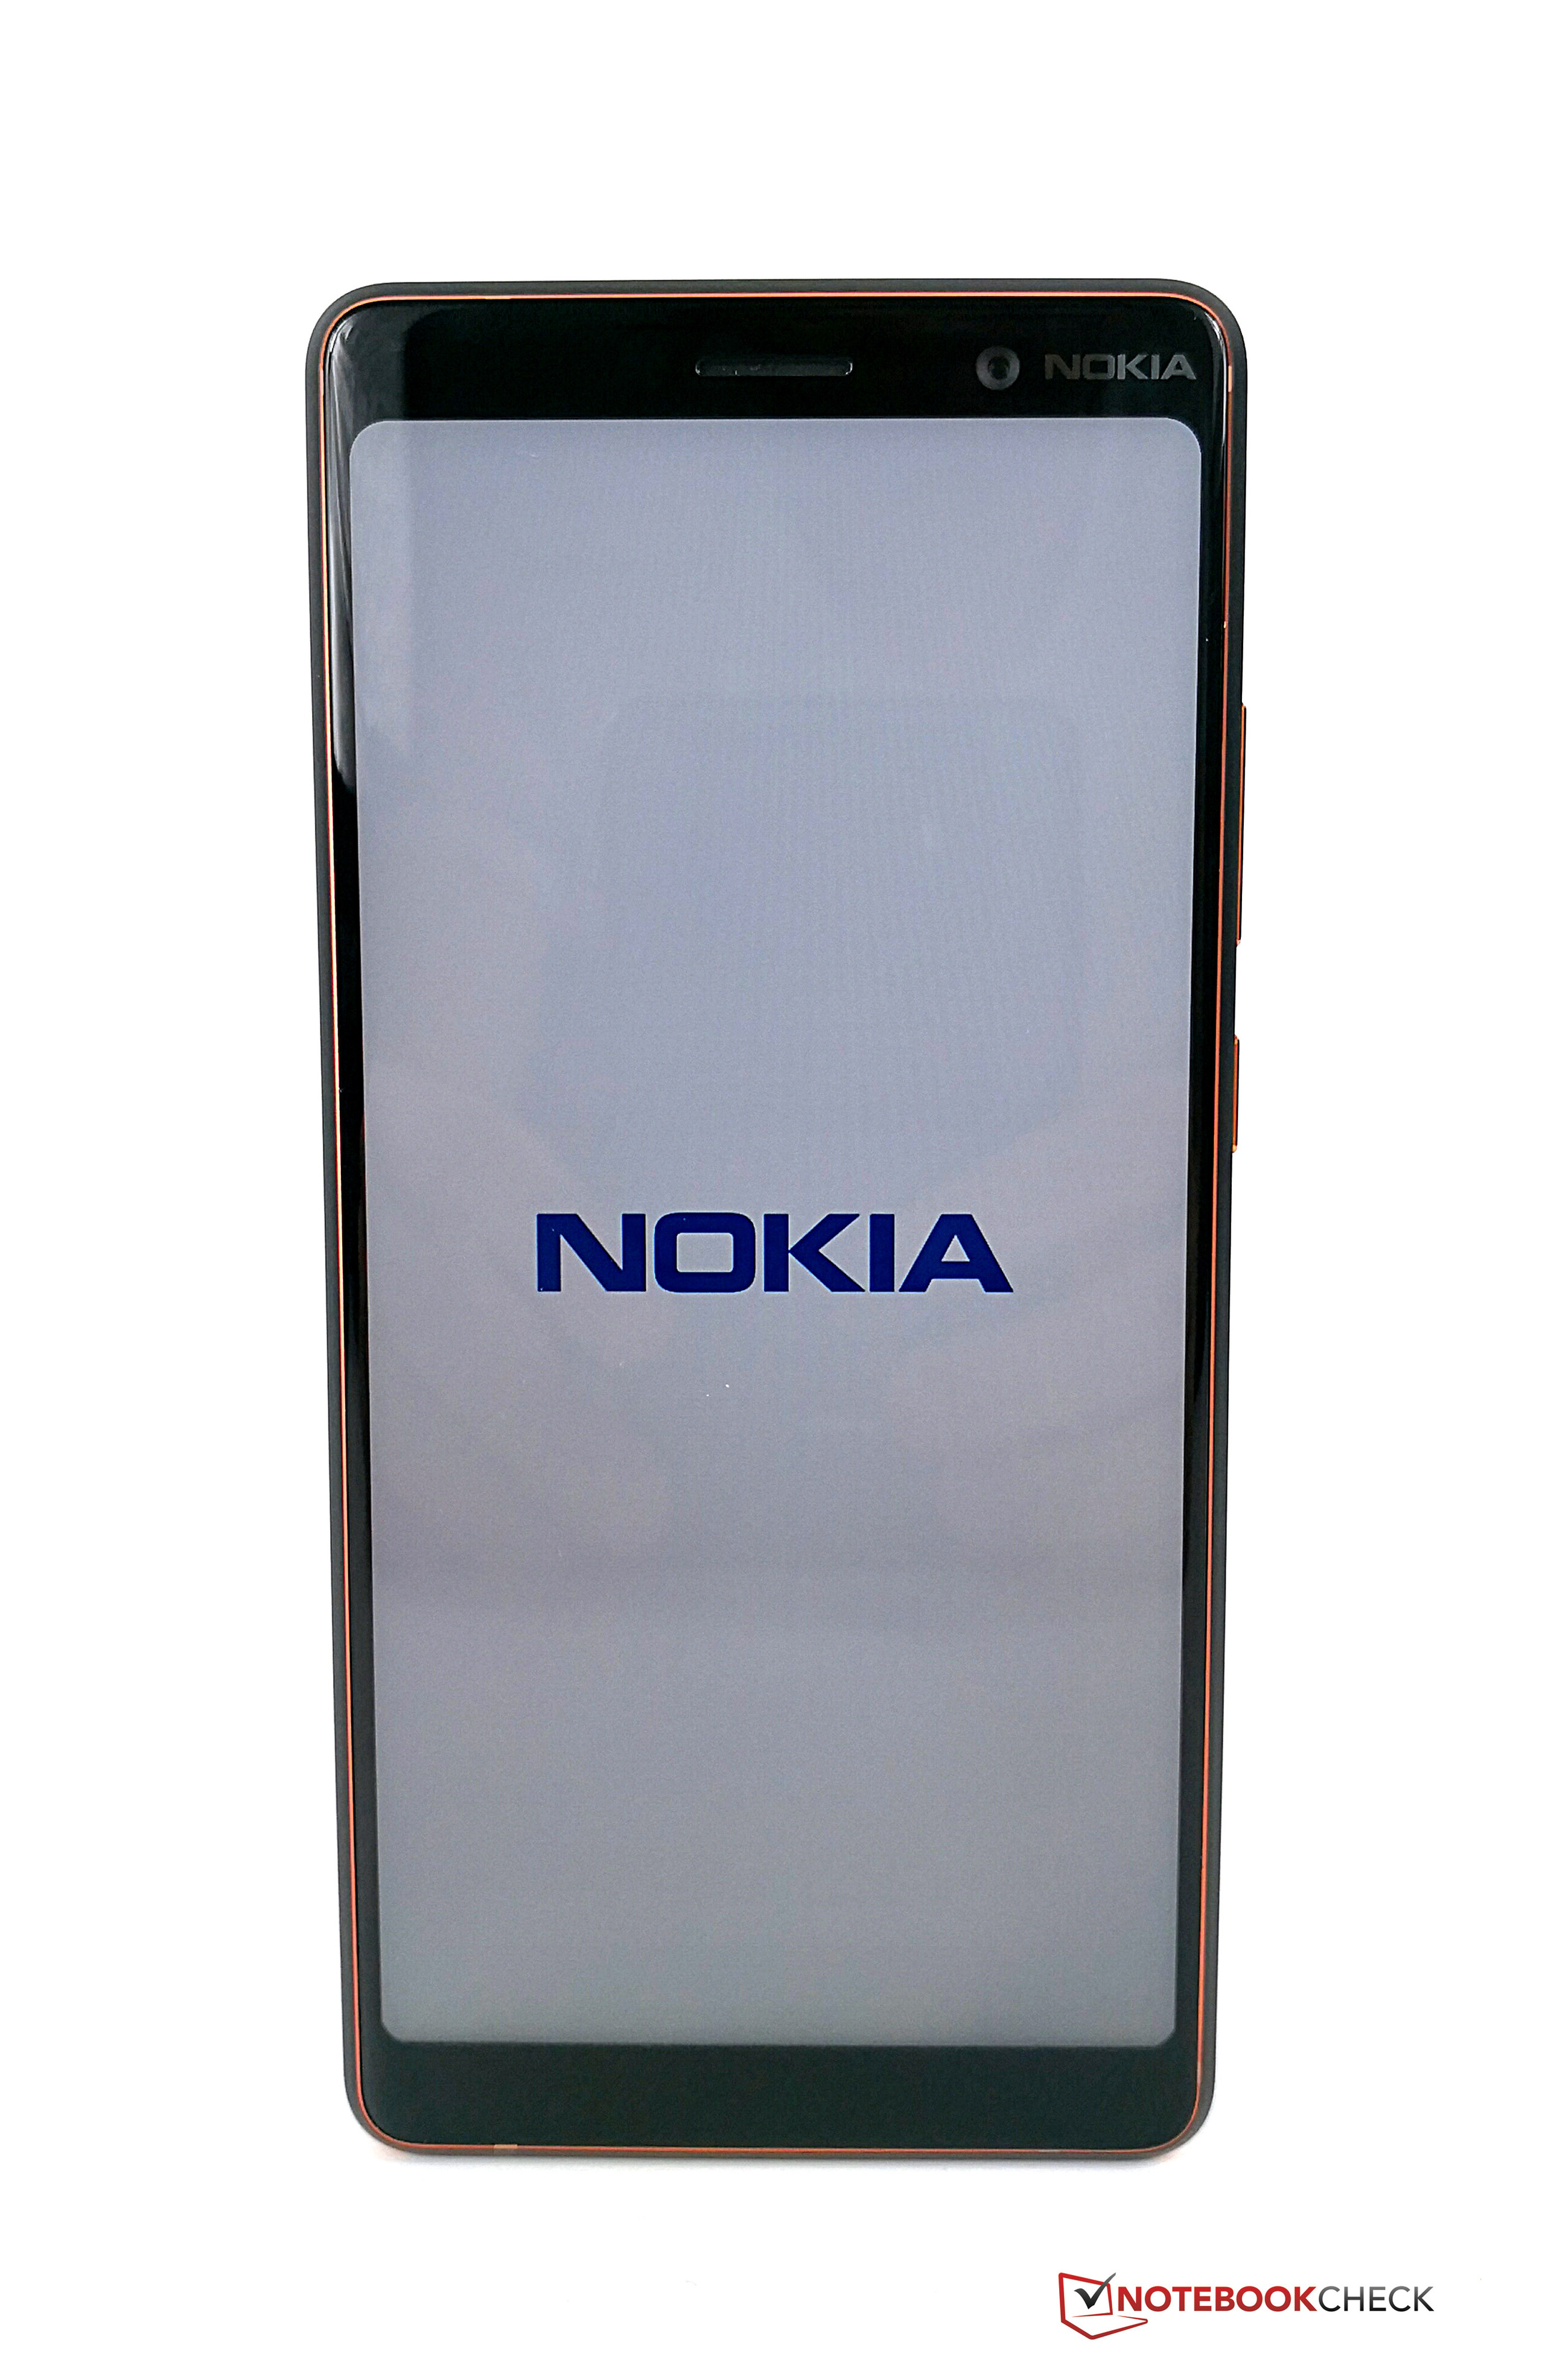
Skärmen, kameran och dess SoC är ganska konkurrenskraftiga för en enhet på 4 000 kronor. Men om du kan tänka dig att spendera runt 500 - 1 000 kronor mer så kan du skaffa dig en Samsung Galaxy S8, som har en mycket bättre skärm och en snabbare SoC. Batteritiden är redan vid släpp väldigt bra, men det finns ändå rum för förbättring.
Om det priset som vanligt faller efter den släppts så erbjuder Nokia 7 Plus en väldigt intressant kombination av hårdvara och mjukvara. Den som är intresserad av en mittenskikts-smartphone borde ta en närmare titt på Nokia 7 Plus.
Nokia 7 Plus
- 11/04/2019 v7 (old)
Marcus Herbrich