Test: Samsung Galaxy Tab S5e (WiFi) Surfplatta (Sammanfattning)


| |||||||||||||||||||||||||
Distribution av ljusstyrkan: 90 %
Mitt på batteriet: 452 cd/m²
Kontrast: ∞:1 (Svärta: 0 cd/m²)
ΔE ColorChecker Calman: 1.7 | ∀{0.5-29.43 Ø4.73}
ΔE Greyscale Calman: 2.4 | ∀{0.09-98 Ø4.97}
97.5% sRGB (Calman 2D)
Gamma: 2.07
CCT: 6337 K
| Samsung Galaxy Tab S5e SM-T720 Super AMOLED, 2560x1600, 10.5" | Amazon Fire HD 10 2017 IPS, 1920x1200, 10.1" | Apple iPad Air 3 2019 IPS, 2224x1668, 10.5" | Huawei MediaPad M5 10.8 IPS, 2560x1600, 10.8" | Lenovo Tab P10 IPS, 1920x1200, 10.1" | Samsung Galaxy Tab S4 Super AMOLED, 2560x1600, 10.5" | |
|---|---|---|---|---|---|---|
| Screen | -69% | -2% | -34% | -131% | -14% | |
| Brightness middle (cd/m²) | 452 | 426 -6% | 515 14% | 382 -15% | 522 15% | 474 5% |
| Brightness (cd/m²) | 453 | 399 -12% | 483 7% | 378 -17% | 495 9% | 477 5% |
| Brightness Distribution (%) | 90 | 91 1% | 90 0% | 92 2% | 84 -7% | 91 1% |
| Black Level * (cd/m²) | 0.38 | 0.41 | 0.24 | 0.41 | ||
| Colorchecker dE 2000 * | 1.7 | 4.5 -165% | 1.6 6% | 2.8 -65% | 6.7 -294% | 2.5 -47% |
| Colorchecker dE 2000 max. * | 3.7 | 7.9 -114% | 4.4 -19% | 6 -62% | 12.2 -230% | 5.8 -57% |
| Greyscale dE 2000 * | 2.4 | 5.2 -117% | 2.8 -17% | 3.5 -46% | 9.1 -279% | 2.1 12% |
| Gamma | 2.07 106% | 2.23 99% | 2.21 100% | 2.33 94% | 2.14 103% | 2.08 106% |
| CCT | 6337 103% | 6875 95% | 6944 94% | 6903 94% | 9417 69% | 6281 103% |
| Contrast (:1) | 1121 | 1256 | 1592 | 1273 |
* ... mindre är bättre
Skärmflimmer / PWM (Puls-Width Modulation)
| Skärmflimmer / PWM upptäckt | 245.1 Hz | ≤ 99 % ljusstyrka inställning | 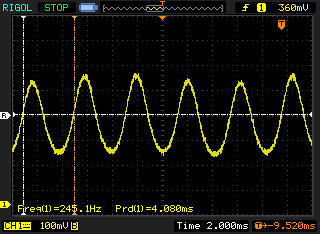 |
Displayens bakgrundsbelysning flimrar vid 245.1 Hz (i värsta fall, t.ex. med PWM) Flimrande upptäckt vid en ljusstyrkeinställning på 99 % och lägre. Det ska inte finnas något flimmer eller PWM över denna ljusstyrkeinställning. Frekvensen för 245.1 Hz är relativt låg, så känsliga användare kommer sannolikt att märka flimmer och uppleva ansträngda ögon vid den angivna ljusstyrkeinställningen och nedan. Som jämförelse: 52 % av alla testade enheter använder inte PWM för att dämpa skärmen. Om PWM upptäcktes mättes ett medelvärde av 7798 (minst: 5 - maximum: 343500) Hz. | |||
Visa svarstider
| ↔ Svarstid svart till vitt | ||
|---|---|---|
| 4 ms ... stiga ↗ och falla ↘ kombinerat | ↗ 2 ms stiga | 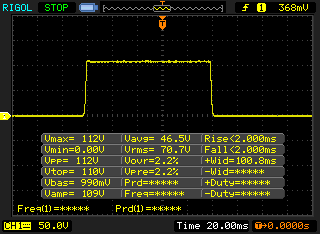 |
| ↘ 2 ms hösten | ||
| Skärmen visar väldigt snabba svarsfrekvenser i våra tester och borde vara mycket väl lämpad för fartfyllt spel. I jämförelse sträcker sig alla testade enheter från 0.1 (minst) till 240 (maximalt) ms. » 16 % av alla enheter är bättre. Det betyder att den uppmätta svarstiden är bättre än genomsnittet av alla testade enheter (19.9 ms). | ||
| ↔ Svarstid 50 % grått till 80 % grått | ||
| 5.6 ms ... stiga ↗ och falla ↘ kombinerat | ↗ 2.8 ms stiga | 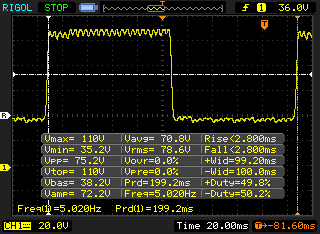 |
| ↘ 2.8 ms hösten | ||
| Skärmen visar väldigt snabba svarsfrekvenser i våra tester och borde vara mycket väl lämpad för fartfyllt spel. I jämförelse sträcker sig alla testade enheter från 0.165 (minst) till 636 (maximalt) ms. » 18 % av alla enheter är bättre. Det betyder att den uppmätta svarstiden är bättre än genomsnittet av alla testade enheter (31.1 ms). | ||
| Basemark GPU 1.1 | |
| 1920x1080 Vulkan Medium Offscreen | |
| Samsung Galaxy Tab S4 | |
| Genomsnitt Qualcomm Snapdragon 670 (12 - 12.5, n=2) | |
| Samsung Galaxy Tab S5e SM-T720 | |
| Vulkan Medium Native | |
| Samsung Galaxy Tab S4 | |
| Genomsnitt Qualcomm Snapdragon 670 (7.67 - 11.6, n=2) | |
| Samsung Galaxy Tab S5e SM-T720 | |
| 1920x1080 OpenGL Medium Offscreen | |
| Samsung Galaxy Tab S4 | |
| Genomsnitt Qualcomm Snapdragon 670 (13.1 - 13.8, n=2) | |
| Samsung Galaxy Tab S5e SM-T720 | |
| VRMark - Amber Room | |
| Samsung Galaxy Tab S4 | |
| Genomsnitt Qualcomm Snapdragon 670 (1423 - 1473, n=2) | |
| Samsung Galaxy Tab S5e SM-T720 | |
| Basemark ES 3.1 / Metal - offscreen Overall Score | |
| Genomsnitt av klass Tablet (255 - 5784, n=7, senaste 2 åren) | |
| Apple iPad Air 3 2019 | |
| Genomsnitt Qualcomm Snapdragon 670 (444 - 447, n=2) | |
| Samsung Galaxy Tab S5e SM-T720 | |
| Jetstream 2 - 2.0 Total | |
| Genomsnitt av klass Tablet (35.8 - 395, n=59, senaste 2 åren) | |
| Apple iPad Air 3 2019 (Safari Mobile 12) | |
| Samsung Galaxy Tab S5e SM-T720 (Chrome 74.0.3729.136) | |
| Genomsnitt Qualcomm Snapdragon 670 (32.1 - 33.6, n=4) | |
| WebXPRT 3 - Overall | |
| Genomsnitt av klass Tablet (108 - 480, n=11, senaste 2 åren) | |
| Apple iPad Air 3 2019 (Safari Mobile 12) | |
| Samsung Galaxy Tab S4 (Samsung Browser 8.0) | |
| Samsung Galaxy Tab S5e SM-T720 (Chrome 74.0.3729.136) | |
| Genomsnitt Qualcomm Snapdragon 670 (53 - 66, n=3) | |
| Speedometer 2.0 - Result 2.0 | |
| Genomsnitt av klass Tablet (2.59 - 790, n=38, senaste 2 åren) | |
| Apple iPad Air 3 2019 (Safari Mobile 12) | |
| Samsung Galaxy Tab S5e SM-T720 (Chrome 74.0.3729.136) | |
| Genomsnitt Qualcomm Snapdragon 670 (29.6 - 33.7, n=3) | |
| Octane V2 - Total Score | |
| Genomsnitt av klass Tablet (763 - 138481, n=74, senaste 2 åren) | |
| Apple iPad Air 3 2019 (Safari Mobile 12) | |
| Samsung Galaxy Tab S4 (Samsung Browser 8.0) | |
| Samsung Galaxy Tab S5e SM-T720 (Chrome 74.0.3729.136) | |
| Genomsnitt Qualcomm Snapdragon 670 (10245 - 11312, n=4) | |
| Amazon Fire HD 10 2017 (Amazon Silk 61.2) | |
| Huawei MediaPad M5 10.8 (Chrome 65) | |
| Lenovo Tab P10 (Chrome 71) | |
| Mozilla Kraken 1.1 - Total | |
| Lenovo Tab P10 (Chrome 71) | |
| Huawei MediaPad M5 10.8 (Chrome 65) | |
| Amazon Fire HD 10 2017 (Amazon Silk 61.2) | |
| Genomsnitt Qualcomm Snapdragon 670 (3361 - 3655, n=4) | |
| Samsung Galaxy Tab S5e SM-T720 (Chrome 74.0.3729.136) | |
| Samsung Galaxy Tab S4 (Samsung Browser 8.0) | |
| Genomsnitt av klass Tablet (243 - 27101, n=68, senaste 2 åren) | |
| Apple iPad Air 3 2019 (Safari Mobile 12) | |
* ... mindre är bättre
| Samsung Galaxy Tab S5e SM-T720 | Amazon Fire HD 10 2017 | Huawei MediaPad M5 10.8 | Lenovo Tab P10 | Samsung Galaxy Tab S4 | Genomsnitt 64 GB eMMC Flash | Genomsnitt av klass Tablet | |
|---|---|---|---|---|---|---|---|
| AndroBench 3-5 | -38% | 29% | -7% | 44% | 7% | 769% | |
| Sequential Read 256KB (MB/s) | 294.4 | 262.2 -11% | 247.8 -16% | 276.7 -6% | 741 152% | 278 ? -6% | 1987 ? 575% |
| Sequential Write 256KB (MB/s) | 197.1 | 147.7 -25% | 126.8 -36% | 205.7 4% | 195.8 -1% | 178.6 ? -9% | 1580 ? 702% |
| Random Read 4KB (MB/s) | 79.2 | 27.72 -65% | 54.7 -31% | 53.9 -32% | 142 79% | 60.9 ? -23% | 268 ? 238% |
| Random Write 4KB (MB/s) | 18.79 | 9.37 -50% | 60.8 224% | 15.75 -16% | 24.43 30% | 34.2 ? 82% | 312 ? 1560% |
| Sequential Read 256KB SDCard (MB/s) | 76.1 ? | 55.5 ? -27% | 85.1 ? 12% | 84.3 ? 11% | 80.1 ? 5% | 77.4 ? 2% | |
| Sequential Write 256KB SDCard (MB/s) | 60.8 ? | 30.14 ? -50% | 73.8 ? 21% | 61 ? 0% | 59.1 ? -3% | 58.3 ? -4% |
PUBG Mobile
Dead Trigger 2
Shadow Fight 3
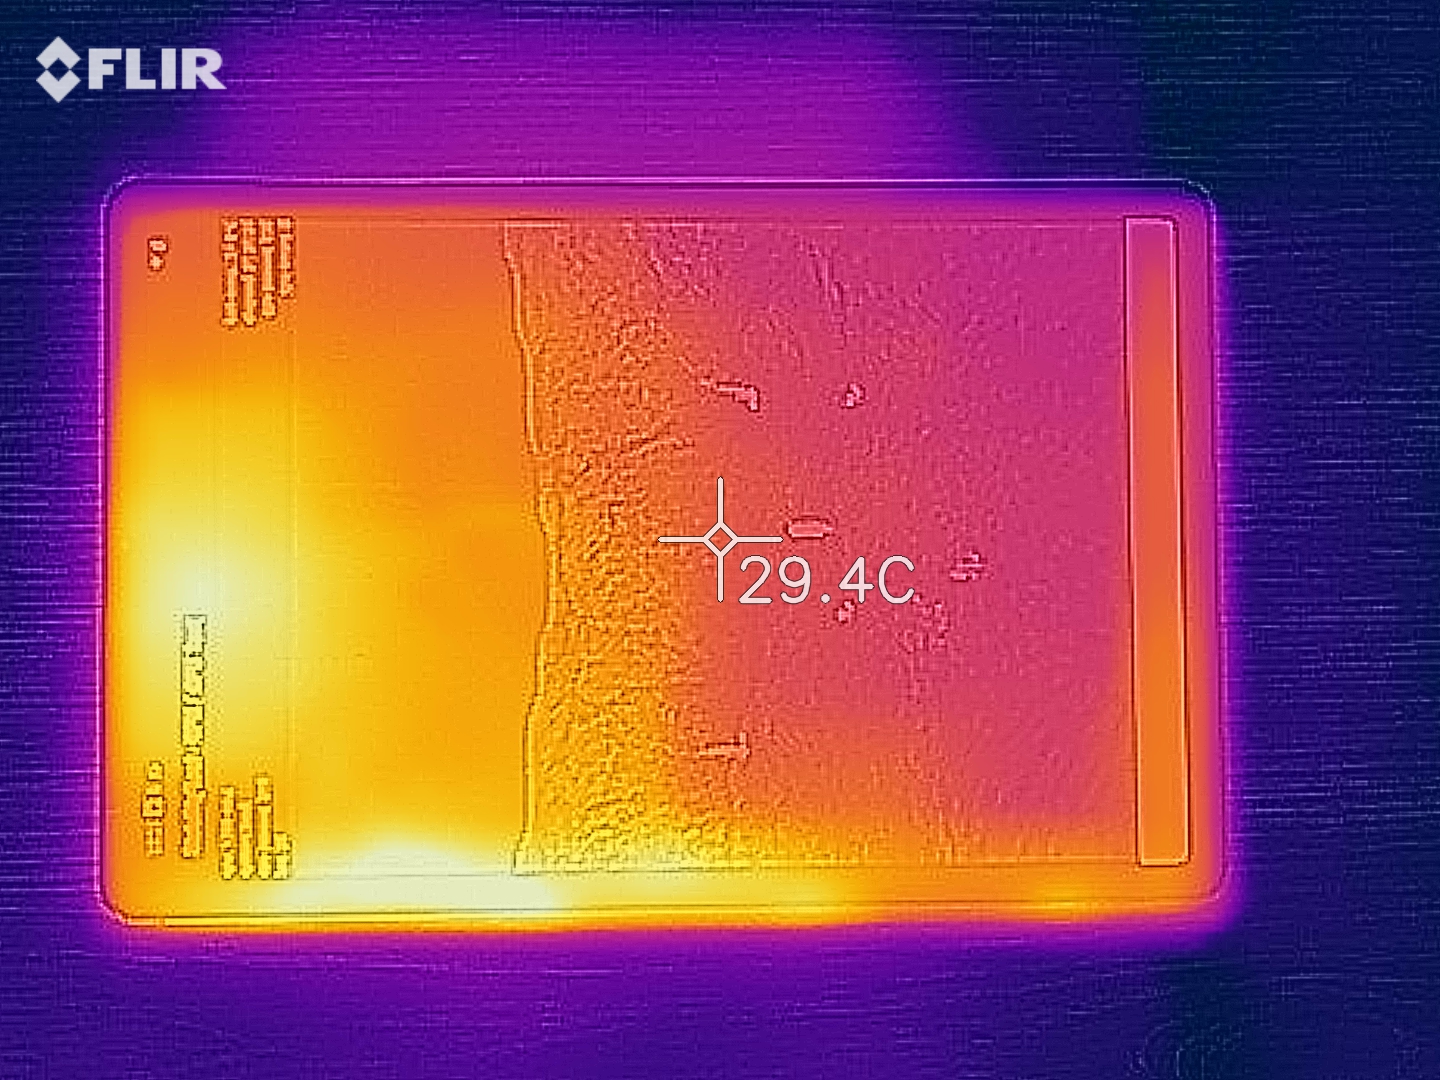
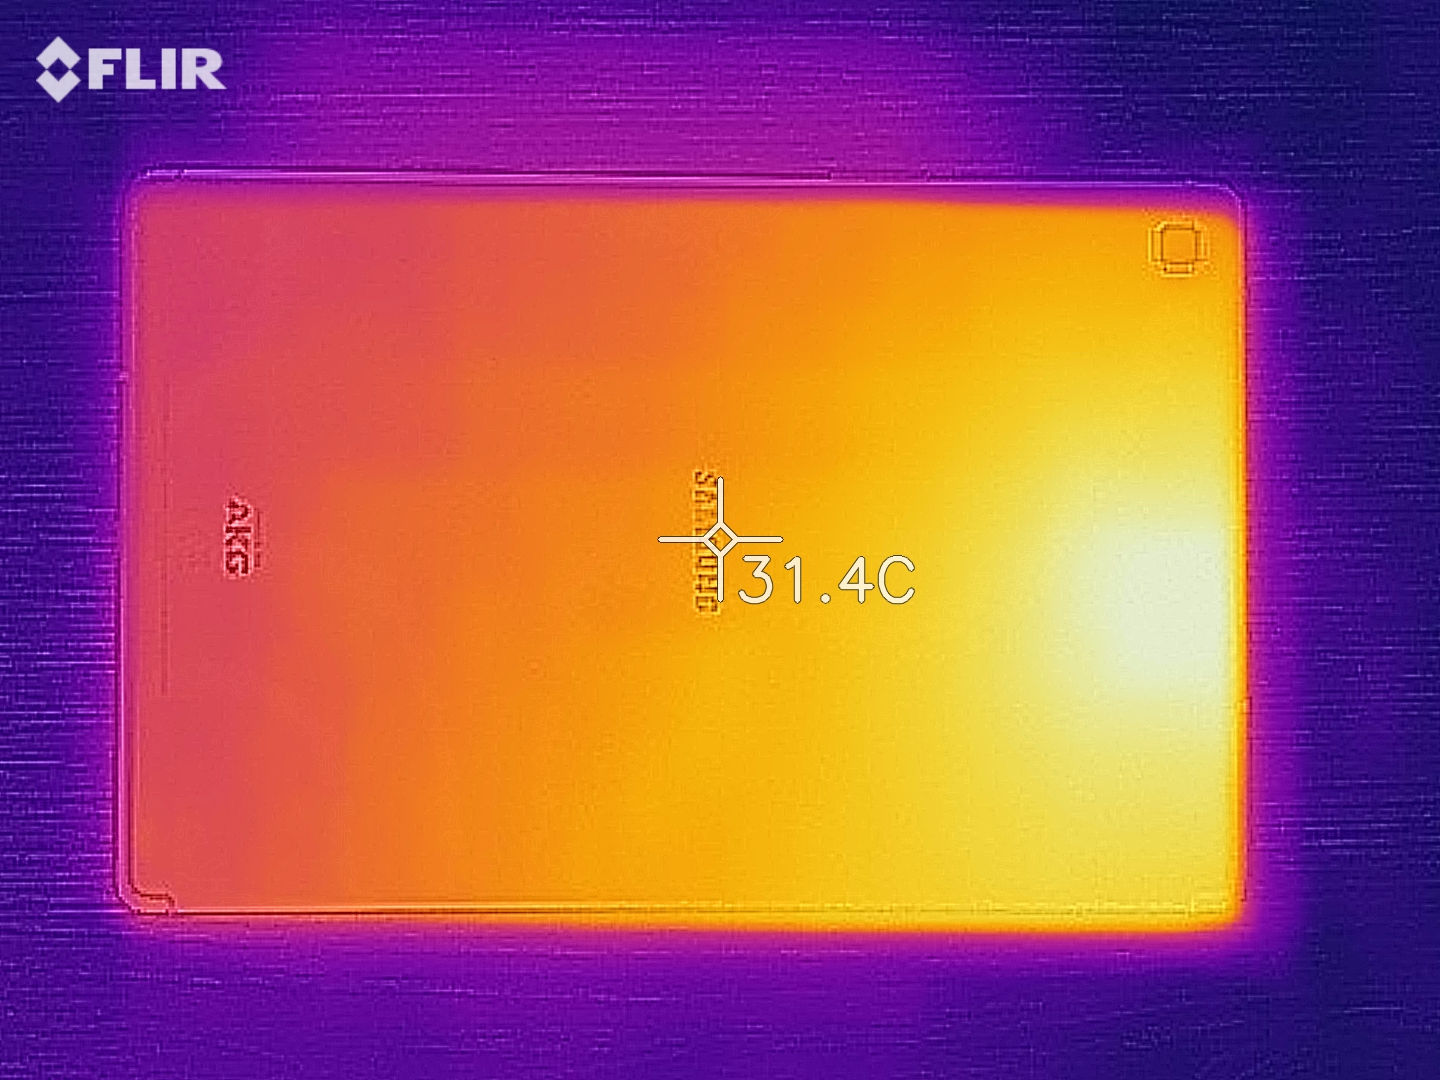
(+) Den maximala temperaturen på ovansidan är 33.1 °C / 92 F, jämfört med genomsnittet av 33.6 °C / 92 F , allt från 20.7 till 53.2 °C för klassen Tablet.
(+) Botten värms upp till maximalt 31.2 °C / 88 F, jämfört med genomsnittet av 33.2 °C / 92 F
(+) Vid tomgångsbruk är medeltemperaturen för ovansidan 28.8 °C / 84 F, jämfört med enhetsgenomsnittet på 30 °C / ### class_avg_f### F.
Samsung Galaxy Tab S5e SM-T720 ljudanalys
(+) | högtalare kan spela relativt högt (83.3 dB)
Bas 100 - 315 Hz
(±) | reducerad bas - i genomsnitt 14.3% lägre än medianen
(±) | linjäriteten för basen är genomsnittlig (10.4% delta till föregående frekvens)
Mellan 400 - 2000 Hz
(+) | balanserad mellan - endast 2.8% från medianen
(+) | mids är linjära (2.8% delta till föregående frekvens)
Högsta 2 - 16 kHz
(+) | balanserade toppar - endast 1.9% från medianen
(+) | toppar är linjära (3.8% delta till föregående frekvens)
Totalt 100 - 16 000 Hz
(+) | det totala ljudet är linjärt (12% skillnad mot median)
Jämfört med samma klass
» 15% av alla testade enheter i den här klassen var bättre, 5% liknande, 80% sämre
» Den bästa hade ett delta på 7%, genomsnittet var 20%, sämst var 129%
Jämfört med alla testade enheter
» 9% av alla testade enheter var bättre, 2% liknande, 88% sämre
» Den bästa hade ett delta på 4%, genomsnittet var 24%, sämst var 134%
Huawei MediaPad M5 10.8 ljudanalys
(±) | högtalarljudstyrkan är genomsnittlig men bra (79.9 dB)
Bas 100 - 315 Hz
(±) | reducerad bas - i genomsnitt 11.9% lägre än medianen
(-) | basen är inte linjär (16.4% delta till föregående frekvens)
Mellan 400 - 2000 Hz
(+) | balanserad mellan - endast 3.2% från medianen
(+) | mids är linjära (5.7% delta till föregående frekvens)
Högsta 2 - 16 kHz
(+) | balanserade toppar - endast 4.6% från medianen
(+) | toppar är linjära (6.9% delta till föregående frekvens)
Totalt 100 - 16 000 Hz
(±) | linjäriteten för det totala ljudet är genomsnittlig (15.9% skillnad mot median)
Jämfört med samma klass
» 35% av alla testade enheter i den här klassen var bättre, 6% liknande, 59% sämre
» Den bästa hade ett delta på 7%, genomsnittet var 20%, sämst var 129%
Jämfört med alla testade enheter
» 25% av alla testade enheter var bättre, 5% liknande, 70% sämre
» Den bästa hade ett delta på 4%, genomsnittet var 24%, sämst var 134%
| Av/Standby | |
| Låg belastning | |
| Hög belastning |
|
Förklaring:
min: | |
| Samsung Galaxy Tab S5e SM-T720 7040 mAh | Amazon Fire HD 10 2017 6300 mAh | Apple iPad Air 3 2019 8134 mAh | Huawei MediaPad M5 10.8 7500 mAh | Lenovo Tab P10 7000 mAh | Samsung Galaxy Tab S4 7300 mAh | |
|---|---|---|---|---|---|---|
| Power Consumption | -26% | -60% | -56% | -3% | -8% | |
| Idle Minimum * (Watt) | 2.07 | 1.55 25% | 2.18 -5% | 2.01 3% | 1.01 51% | 1.76 15% |
| Idle Average * (Watt) | 3.94 | 4.17 -6% | 6.4 -62% | 5.4 -37% | 4.16 -6% | 4.22 -7% |
| Idle Maximum * (Watt) | 3.96 | 4.25 -7% | 6.43 -62% | 5.44 -37% | 4.17 -5% | 4.25 -7% |
| Load Average * (Watt) | 4.07 | 7.13 -75% | 7.48 -84% | 8.55 -110% | 5.45 -34% | 4.52 -11% |
| Load Maximum * (Watt) | 5.73 | 9.63 -68% | 10.65 -86% | 11.53 -101% | 6.9 -20% | 7.35 -28% |
* ... mindre är bättre
| Samsung Galaxy Tab S5e SM-T720 7040 mAh | Amazon Fire HD 10 2017 6300 mAh | Apple iPad Air 3 2019 8134 mAh | Huawei MediaPad M5 10.8 7500 mAh | Lenovo Tab P10 7000 mAh | Samsung Galaxy Tab S4 7300 mAh | |
|---|---|---|---|---|---|---|
| Batteridrifttid | -19% | -3% | -11% | 16% | -14% | |
| Reader / Idle (h) | 21.1 | 16 -24% | 25 18% | 22.4 6% | 21.9 4% | 20.5 -3% |
| H.264 (h) | 14.4 | 9.8 -32% | 11.4 -21% | 11.7 -19% | 15.2 6% | 12.3 -15% |
| WiFi v1.3 (h) | 10.4 | 9 -13% | 12.3 18% | 10.8 4% | 16.5 59% | 8.3 -20% |
| Load (h) | 5 | 4.6 -8% | 3.6 -28% | 3.3 -34% | 4.8 -4% | 4.1 -18% |
För
Emot
Läs den fullständiga versionen av den här recensionen på engelska här.
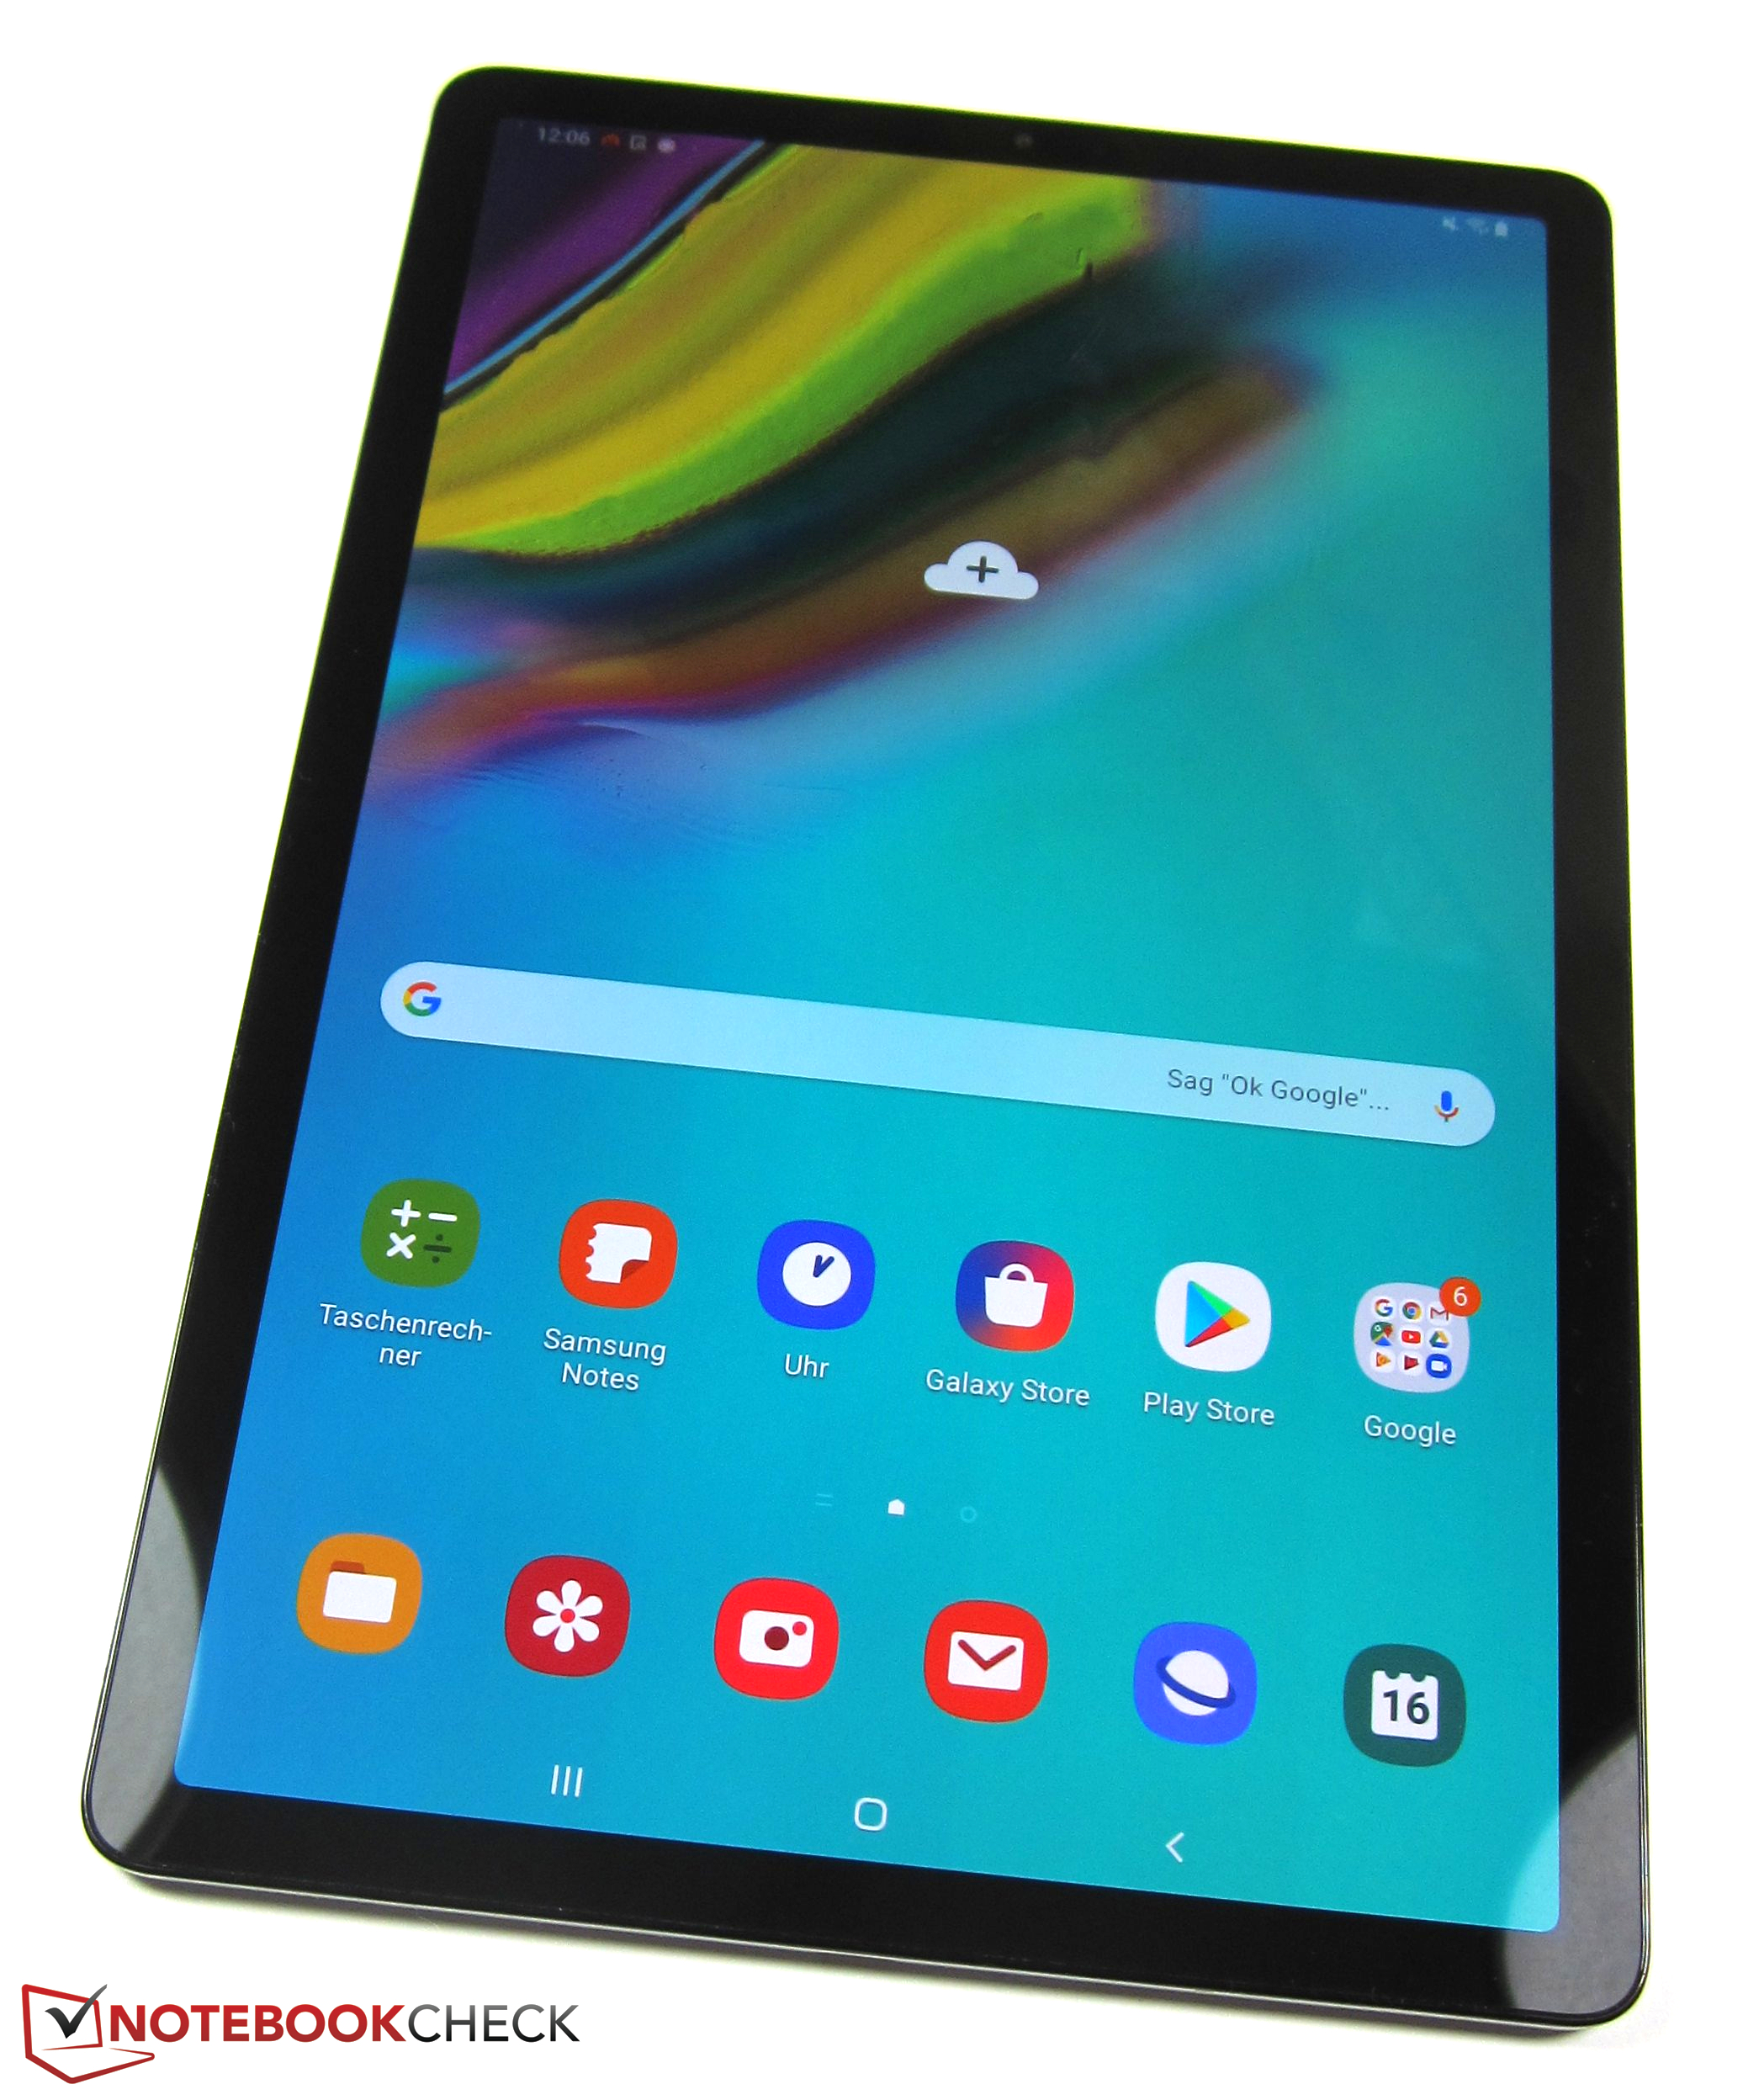
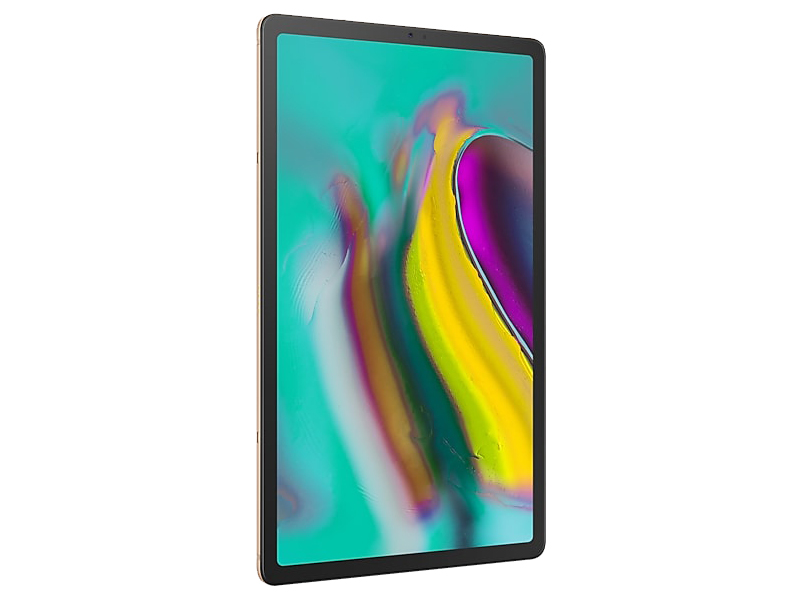
Samsung Galaxy Tab S5e är riktigt prisvärd och är i huvudsak en bra och rejäl surfplatta. Den har en ljusstark och kontrastrik Super AMOLED-skärm på 10.5 tum och en SoC som till och med kan hantera de senaste och mest komplexa spelen. På samma sätt ger högtalarna en inlevelsefull spelupplevelse samtidigt som batteritiden inte kommer att ge upp under längre spel- eller filmsessioner.
Plattan är dessutom lätt och välbyggd, vilket inte alltid är fallet för surfplattor i mittenskiktet. Metalldesignen och den tunna skärminfattningen gör att den ser dyrare ut än den är. Dessutom gör stödet för DeX och tangentbordsfodral att Tab S5e är mer än bara en multimediaplatta.
Den har några svaga punkter, men de är få och sällsynta. Samsung har utrustat enheten med medelmåttiga kameror och det är synd att den saknar ett NFC-chipp. Vi rekommenderar också att du själv testar Tab S5e om du är känslig för PWM, då skärmen flimrar i en frekvens som kan orsaka ansträngda ögon eller huvudvärk vid långvarig användning.
Samsung Galaxy Tab S5e är ett värdigt alternativ till dyrare surfplattor som Tab S4 och iPad Air (2019). Den har i princip allt en genomsnittlig användare kan önska från en surfplatta, men till ett lågt pris utan något större antal kompromisser.
Sammanfattningsvis är Tab S5e inte bara en av de mest prisvärda surfplattorna som går att köpa för tillfället utan den utmanar till och med dyrare surfplattor. Tab S4 är dock fortfarande en totalt sett bättre multimediaplatta tack vare en kraftigare SoC, mer RAM och snabbare intern lagring. Stödet för penn-inmatning får också skalan att tippa över till fördel för Tab S4.
Samsung Galaxy Tab S5e SM-T720
- 08/31/2022 v7 (old)
Manuel Masiero
Price comparison
