Test: Samsung Galaxy Tab S3 (sammanfattning)

| Networking | |
| iperf3 transmit AX12 | |
| Samsung Galaxy Tab S3 SM-T825 | |
| Apple iPad (2017) | |
| Asus ZenPad 3s 10 Z500M | |
| Huawei MediaPad M3 8.4 inch | |
| iperf3 receive AX12 | |
| Samsung Galaxy Tab S3 SM-T825 | |
| Apple iPad (2017) | |
| Asus ZenPad 3s 10 Z500M | |
| Huawei MediaPad M3 8.4 inch | |

| |||||||||||||||||||||||||
Distribution av ljusstyrkan: 82 %
Mitt på batteriet: 452 cd/m²
Kontrast: ∞:1 (Svärta: 0 cd/m²)
ΔE ColorChecker Calman: 1.8 | ∀{0.5-29.43 Ø4.71}
ΔE Greyscale Calman: 1.2 | ∀{0.09-98 Ø4.96}
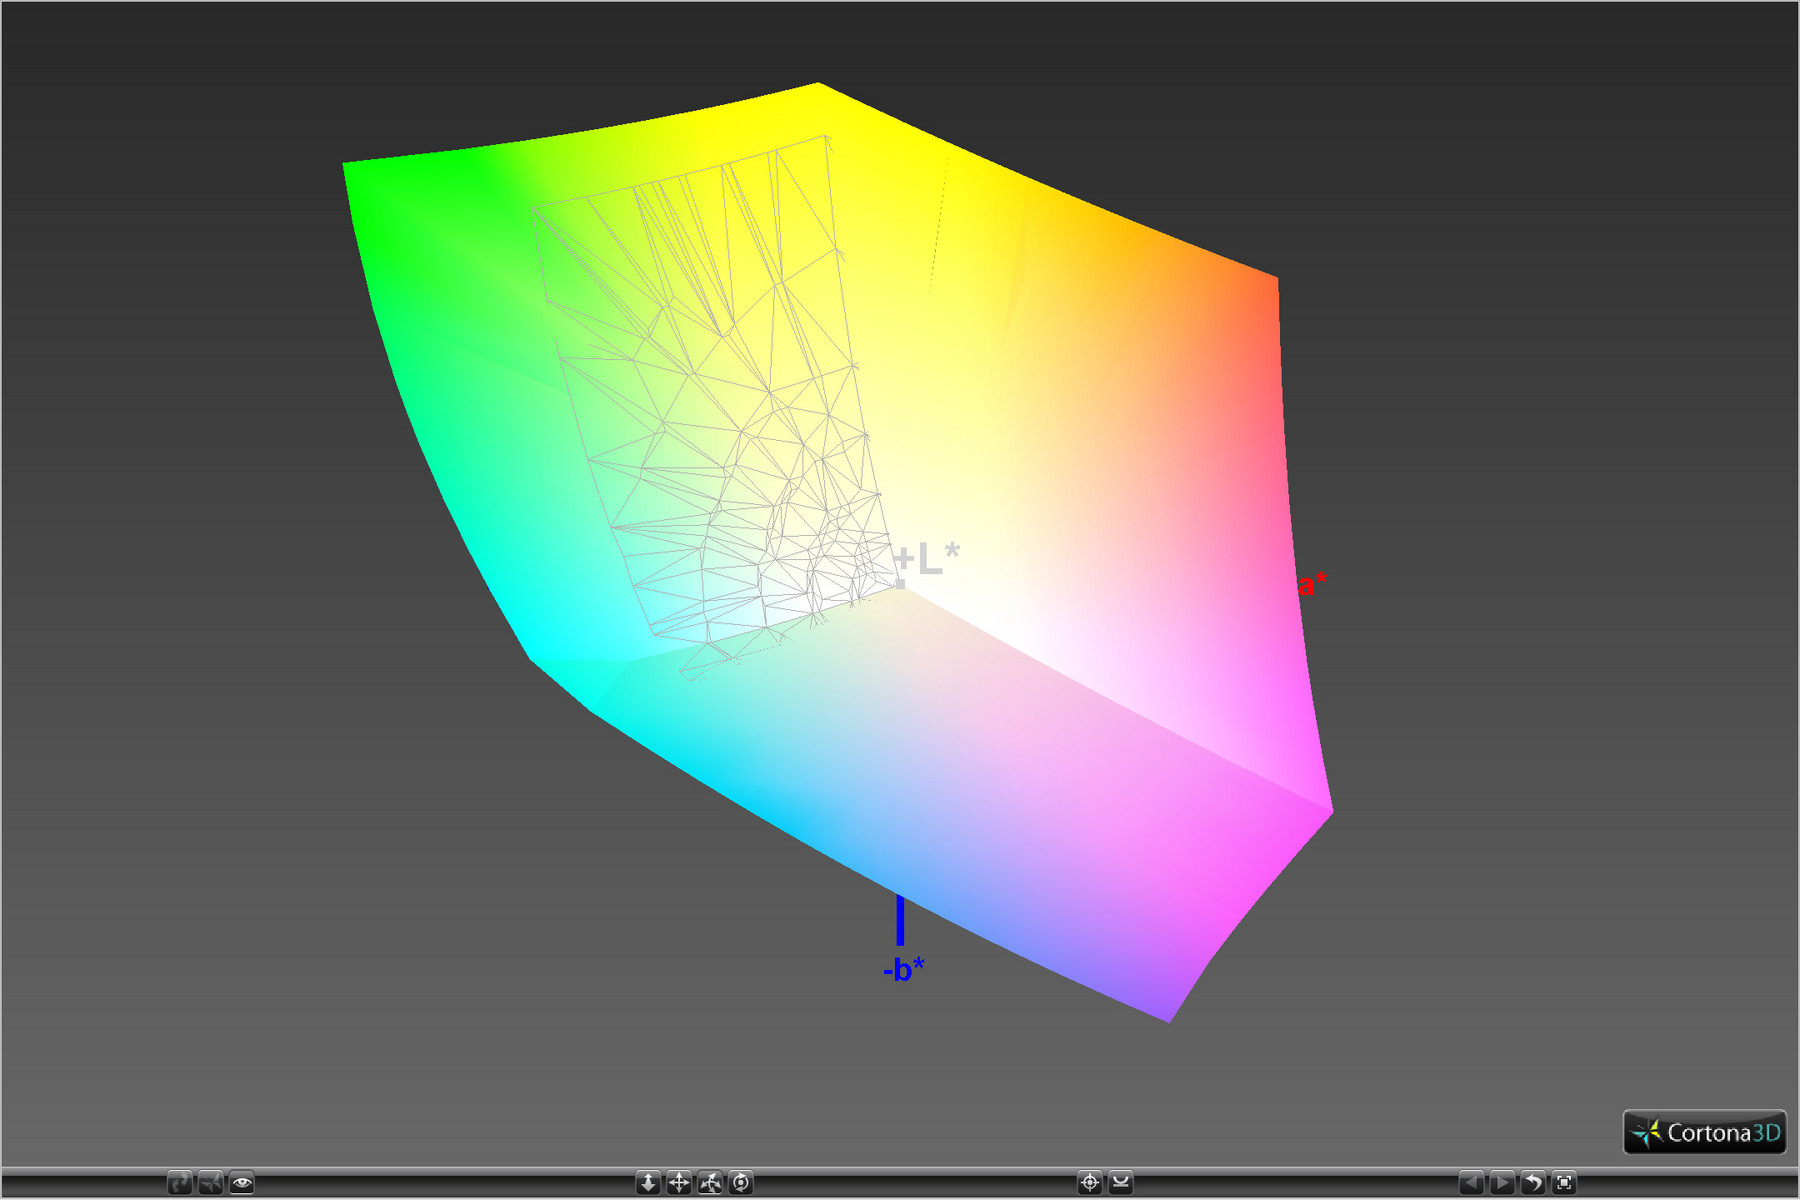
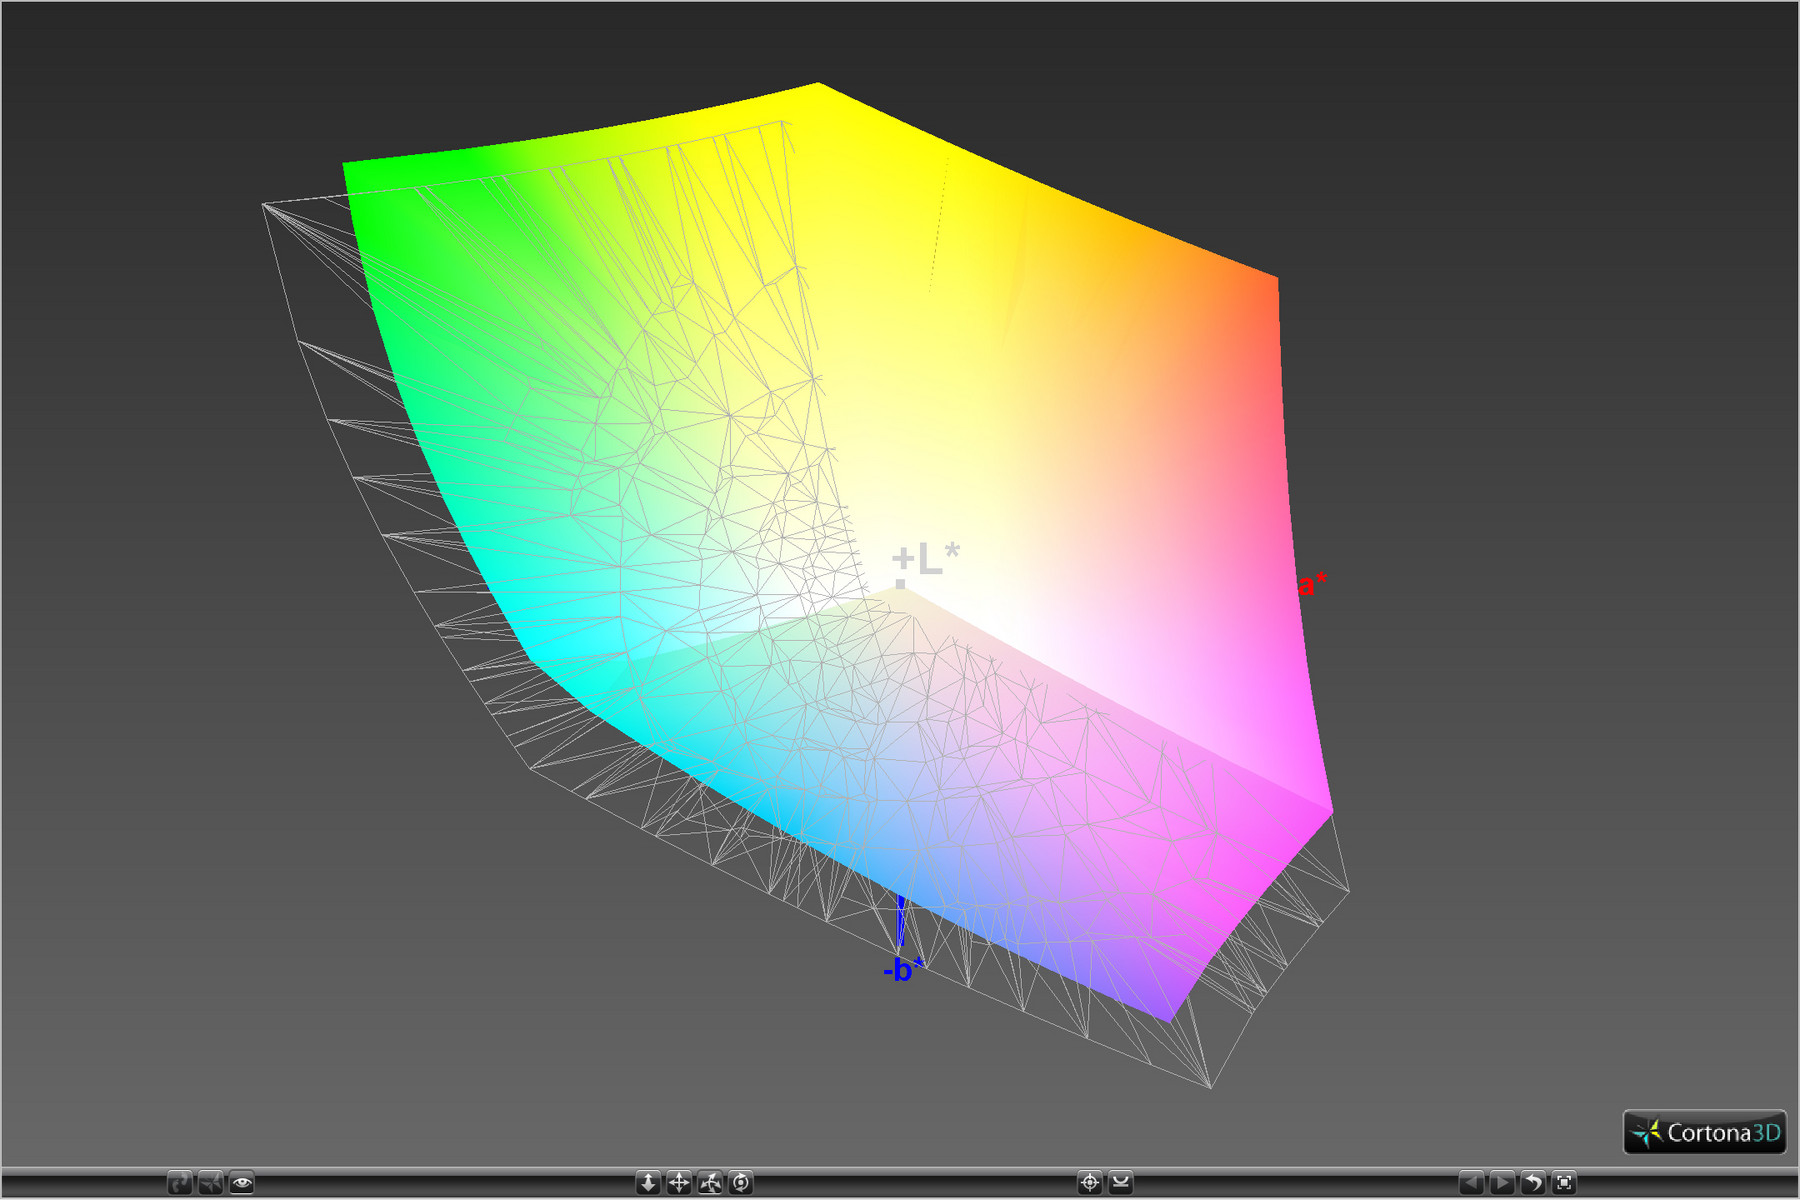
99.06% sRGB (Argyll 1.6.3 3D)
82.32% AdobeRGB 1998 (Argyll 1.6.3 3D)
94% AdobeRGB 1998 (Argyll 3D)
99.1% sRGB (Argyll 3D)
83.9% Display P3 (Argyll 3D)
Gamma: 2.11
CCT: 6500 K
| Samsung Galaxy Tab S3 SM-T825 Super AMOLED, 2048x1526, 9.7" | Samsung Galaxy Tab S2 9.7 LTE Super AMOLED, 2048x1536, 9.7" | Huawei MediaPad T2 10.0 Pro IPS, 1920x1200, 10.1" | Apple iPad Pro 9.7 IPS, 2048x1536, 9.7" | Google Pixel C LTPS, 2560x1800, 10.2" | Asus ZenPad 3s 10 Z500M IPS, 2048x1536, 9.7" | Apple iPad (2017) IPS, 2048x1536, 9.7" | |
|---|---|---|---|---|---|---|---|
| Screen | -11% | -94% | 11% | -145% | -141% | -0% | |
| Brightness middle (cd/m²) | 452 | 358 -21% | 392 -13% | 523 16% | 487 8% | 489 8% | 514 14% |
| Brightness (cd/m²) | 468 | 357 -24% | 385 -18% | 500 7% | 510 9% | 443 -5% | 485 4% |
| Brightness Distribution (%) | 82 | 86 5% | 91 11% | 93 13% | 91 11% | 86 5% | 88 7% |
| Black Level * (cd/m²) | 0.59 | 0.52 | 0.39 | 0.43 | 0.46 | ||
| Colorchecker dE 2000 * | 1.8 | 1.78 1% | 4.5 -150% | 1.1 39% | 5.24 -191% | 5.5 -206% | 1.4 22% |
| Colorchecker dE 2000 max. * | 4 | 7.8 -95% | 1.9 52% | 11.6 -190% | 2.9 27% | ||
| Greyscale dE 2000 * | 1.2 | 1.38 -15% | 4.8 -300% | 1.4 -17% | 7.95 -563% | 6.7 -458% | 2.1 -75% |
| Gamma | 2.11 104% | 2.24 98% | 2.47 89% | 2.11 104% | 2.16 102% | 2.06 107% | 2.22 99% |
| CCT | 6500 100% | 6366 102% | 7426 88% | 6662 98% | 6565 99% | 7457 87% | 6647 98% |
| Color Space (Percent of AdobeRGB 1998) (%) | 82.32 | 62.97 -24% | |||||
| Color Space (Percent of sRGB) (%) | 99.06 | 99.55 0% | |||||
| Contrast (:1) | 664 | 1006 | 1249 | 1137 | 1117 |
* ... mindre är bättre
Skärmflimmer / PWM (Puls-Width Modulation)
| Skärmflimmer / PWM upptäckt | 221.2 Hz | ≤ 100 % ljusstyrka inställning | 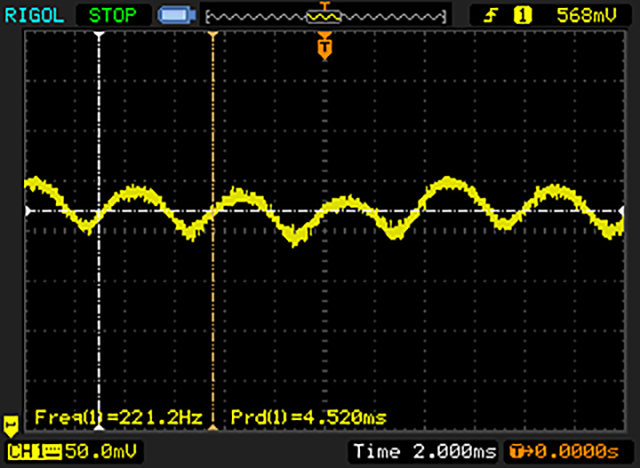 |
Displayens bakgrundsbelysning flimrar vid 221.2 Hz (i värsta fall, t.ex. med PWM) Flimrande upptäckt vid en ljusstyrkeinställning på 100 % och lägre. Det ska inte finnas något flimmer eller PWM över denna ljusstyrkeinställning. Frekvensen för 221.2 Hz är relativt låg, så känsliga användare kommer sannolikt att märka flimmer och uppleva ansträngda ögon vid den angivna ljusstyrkeinställningen och nedan. Som jämförelse: 52 % av alla testade enheter använder inte PWM för att dämpa skärmen. Om PWM upptäcktes mättes ett medelvärde av 7757 (minst: 5 - maximum: 343500) Hz. | |||
Visa svarstider
| ↔ Svarstid svart till vitt | ||
|---|---|---|
| 3.2 ms ... stiga ↗ och falla ↘ kombinerat | ↗ 2 ms stiga | 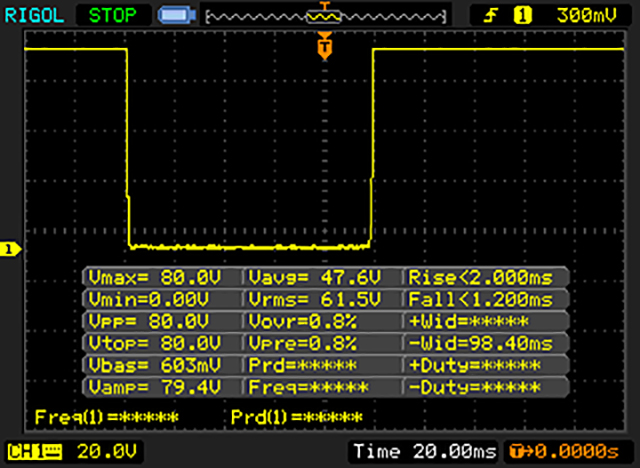 |
| ↘ 1.2 ms hösten | ||
| Skärmen visar väldigt snabba svarsfrekvenser i våra tester och borde vara mycket väl lämpad för fartfyllt spel. I jämförelse sträcker sig alla testade enheter från 0.1 (minst) till 240 (maximalt) ms. » 15 % av alla enheter är bättre. Det betyder att den uppmätta svarstiden är bättre än genomsnittet av alla testade enheter (19.8 ms). | ||
| ↔ Svarstid 50 % grått till 80 % grått | ||
| 4 ms ... stiga ↗ och falla ↘ kombinerat | ↗ 2 ms stiga | 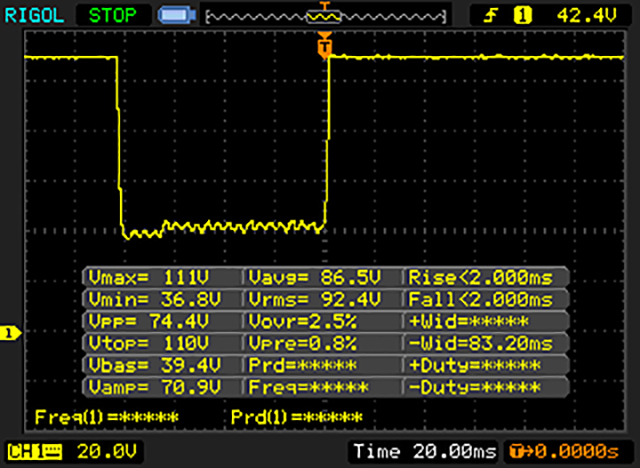 |
| ↘ 2 ms hösten | ||
| Skärmen visar väldigt snabba svarsfrekvenser i våra tester och borde vara mycket väl lämpad för fartfyllt spel. I jämförelse sträcker sig alla testade enheter från 0.165 (minst) till 636 (maximalt) ms. » 15 % av alla enheter är bättre. Det betyder att den uppmätta svarstiden är bättre än genomsnittet av alla testade enheter (31 ms). | ||
| GFXBench | |
| on screen Car Chase Onscreen | |
| Samsung Galaxy Tab S3 SM-T825 | |
| Samsung Galaxy S8 Plus | |
| Google Pixel C | |
| Huawei MediaPad M3 8.4 inch | |
| Asus ZenPad 3s 10 Z500M | |
| 1920x1080 Car Chase Offscreen | |
| Samsung Galaxy S8 Plus | |
| Google Pixel C | |
| Samsung Galaxy Tab S3 SM-T825 | |
| Huawei MediaPad M3 8.4 inch | |
| Asus ZenPad 3s 10 Z500M | |
| PCMark for Android | |
| Work performance score | |
| Google Pixel C | |
| Samsung Galaxy S8 Plus | |
| Samsung Galaxy Tab S3 SM-T825 | |
| Samsung Galaxy Tab S2 9.7 LTE | |
| Huawei MediaPad M3 8.4 inch | |
| Lenovo Yoga Book Android YB1-X90F | |
| Asus ZenPad 3s 10 Z500M | |
| Huawei MediaPad T2 10.0 Pro | |
| Work 2.0 performance score | |
| Samsung Galaxy Tab S3 SM-T825 | |
| Samsung Galaxy S8 Plus | |
| Storage score | |
| Samsung Galaxy S8 Plus | |
| Samsung Galaxy Tab S3 SM-T825 | |
| Geekbench 4.4 | |
| 64 Bit Single-Core Score | |
| Samsung Galaxy S8 Plus | |
| Samsung Galaxy Tab S3 SM-T825 | |
| 64 Bit Multi-Core Score | |
| Samsung Galaxy S8 Plus | |
| Samsung Galaxy Tab S3 SM-T825 | |
| Basemark ES 3.1 / Metal - offscreen Overall Score | |
| Samsung Galaxy S8 Plus | |
| Apple iPad Pro 9.7 | |
| Apple iPad (2017) | |
| Google Pixel C | |
| Samsung Galaxy Tab S3 SM-T825 | |
| ANDEBench PRO | |
| Device Score | |
| Google Pixel C | |
| Samsung Galaxy Tab S3 SM-T825 | |
| CoreMark-PRO/HPC (Base) | |
| Samsung Galaxy Tab S3 SM-T825 | |
| Google Pixel C | |
| Memory Bandwidth | |
| Samsung Galaxy Tab S3 SM-T825 | |
| Google Pixel C | |
| Memory Latency | |
| Google Pixel C | |
| Samsung Galaxy Tab S3 SM-T825 | |
| Storage | |
| Google Pixel C | |
| Samsung Galaxy Tab S3 SM-T825 | |
| Platform | |
| Google Pixel C | |
| Samsung Galaxy Tab S3 SM-T825 | |
| 3D | |
| Google Pixel C | |
| Samsung Galaxy Tab S3 SM-T825 | |
| Epic Citadel - Ultra High Quality | |
| Samsung Galaxy S8 Plus | |
| Google Pixel C | |
| Samsung Galaxy Tab S3 SM-T825 | |
* ... mindre är bättre
| Samsung Galaxy Tab S3 SM-T825 | Samsung Galaxy Tab S2 9.7 LTE | Huawei MediaPad T2 10.0 Pro | Google Pixel C | Huawei MediaPad M3 8.4 inch | Asus ZenPad 3s 10 Z500M | Lenovo Yoga Book Android YB1-X90F | Samsung Galaxy S8 Plus | |
|---|---|---|---|---|---|---|---|---|
| AndroBench 3-5 | -32% | -52% | -25% | 9% | -27% | -34% | 80% | |
| Sequential Read 256KB (MB/s) | 288.6 | 248.2 -14% | 131 -55% | 154.3 -47% | 249.7 -13% | 209.3 -27% | 143.4 -50% | 788 173% |
| Sequential Write 256KB (MB/s) | 87.6 | 49.37 -44% | 78.2 -11% | 109.4 25% | 117.2 34% | 136.5 56% | 80.6 -8% | 194.2 122% |
| Random Read 4KB (MB/s) | 45.82 | 25.56 -44% | 14.59 -68% | 19.96 -56% | 32.04 -30% | 24.85 -46% | 23.5 -49% | 127.2 178% |
| Random Write 4KB (MB/s) | 13.13 | 9.82 -25% | 9.86 -25% | 10.08 -23% | 31.35 139% | 6.8 -48% | 11.7 -11% | 15.27 16% |
| Sequential Read 256KB SDCard (MB/s) | 76.4 | 17.57 -77% | 61.7 -19% | 45.15 -41% | 48.9 -36% | 71.1 -7% | ||
| Sequential Write 256KB SDCard (MB/s) | 58.6 | 13.98 -76% | 23.52 -60% | 26.9 -54% | 30.6 -48% | 57.2 -2% |
| Dead Trigger 2 | |||
| Inställningar | Värde | ||
| high | 30 fps | ||
| Asphalt 8: Airborne | |||
| Inställningar | Värde | ||
| high | 30 fps | ||
| very low | 30 fps | ||
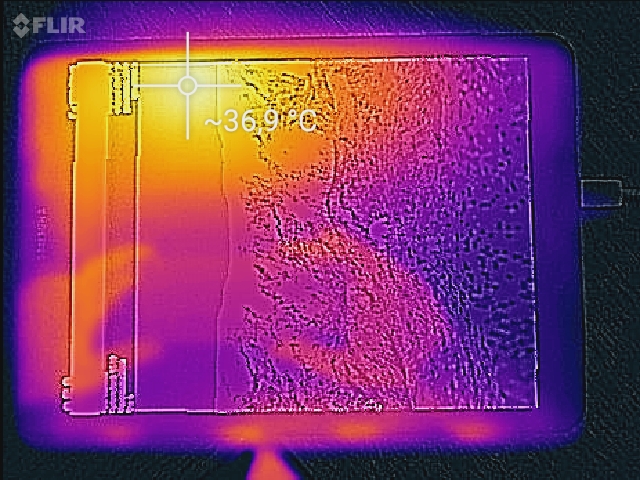
(+) Den maximala temperaturen på ovansidan är 34.4 °C / 94 F, jämfört med genomsnittet av 33.7 °C / 93 F , allt från 20.7 till 53.2 °C för klassen Tablet.
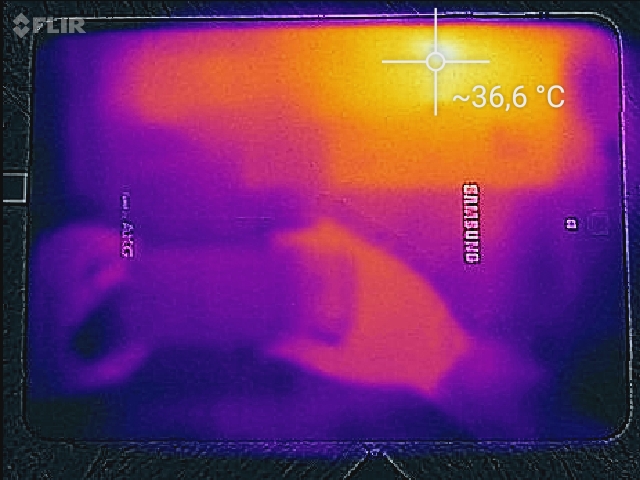
(+) Botten värms upp till maximalt 31.1 °C / 88 F, jämfört med genomsnittet av 33.2 °C / 92 F
(+) Vid tomgångsbruk är medeltemperaturen för ovansidan 27.8 °C / 82 F, jämfört med enhetsgenomsnittet på 30 °C / ### class_avg_f### F.
Samsung Galaxy Tab S3 SM-T825 ljudanalys
(+) | högtalare kan spela relativt högt (86.5 dB)
Bas 100 - 315 Hz
(-) | nästan ingen bas - i genomsnitt 26.5% lägre än medianen
(±) | linjäriteten för basen är genomsnittlig (14.5% delta till föregående frekvens)
Mellan 400 - 2000 Hz
(±) | högre mellan - i genomsnitt 5.1% högre än median
(+) | mids är linjära (5.2% delta till föregående frekvens)
Högsta 2 - 16 kHz
(+) | balanserade toppar - endast 1.9% från medianen
(+) | toppar är linjära (5.6% delta till föregående frekvens)
Totalt 100 - 16 000 Hz
(±) | linjäriteten för det totala ljudet är genomsnittlig (17.9% skillnad mot median)
Jämfört med samma klass
» 45% av alla testade enheter i den här klassen var bättre, 6% liknande, 48% sämre
» Den bästa hade ett delta på 7%, genomsnittet var 20%, sämst var 129%
Jämfört med alla testade enheter
» 37% av alla testade enheter var bättre, 8% liknande, 55% sämre
» Den bästa hade ett delta på 4%, genomsnittet var 23%, sämst var 134%
Apple iPad Pro 9.7 ljudanalys
(+) | högtalare kan spela relativt högt (90.6 dB)
Bas 100 - 315 Hz
(-) | nästan ingen bas - i genomsnitt 23.2% lägre än medianen
(±) | linjäriteten för basen är genomsnittlig (8.6% delta till föregående frekvens)
Mellan 400 - 2000 Hz
(+) | balanserad mellan - endast 4.7% från medianen
(+) | mids är linjära (4.9% delta till föregående frekvens)
Högsta 2 - 16 kHz
(+) | balanserade toppar - endast 4.6% från medianen
(+) | toppar är linjära (4.1% delta till föregående frekvens)
Totalt 100 - 16 000 Hz
(±) | linjäriteten för det totala ljudet är genomsnittlig (16.8% skillnad mot median)
Jämfört med samma klass
» 41% av alla testade enheter i den här klassen var bättre, 4% liknande, 55% sämre
» Den bästa hade ett delta på 7%, genomsnittet var 20%, sämst var 129%
Jämfört med alla testade enheter
» 30% av alla testade enheter var bättre, 8% liknande, 63% sämre
» Den bästa hade ett delta på 4%, genomsnittet var 23%, sämst var 134%
Google Pixel C ljudanalys
(+) | högtalare kan spela relativt högt (92.8 dB)
Bas 100 - 315 Hz
(-) | nästan ingen bas - i genomsnitt 29.9% lägre än medianen
(±) | linjäriteten för basen är genomsnittlig (7.5% delta till föregående frekvens)
Mellan 400 - 2000 Hz
(+) | balanserad mellan - endast 4.8% från medianen
(±) | linjäriteten för mids är genomsnittlig (7% delta till föregående frekvens)
Högsta 2 - 16 kHz
(±) | högre toppar - i genomsnitt 7.5% högre än medianen
(±) | linjäriteten för toppar är genomsnittlig (8.6% delta till föregående frekvens)
Totalt 100 - 16 000 Hz
(±) | linjäriteten för det totala ljudet är genomsnittlig (24.2% skillnad mot median)
Jämfört med samma klass
» 76% av alla testade enheter i den här klassen var bättre, 6% liknande, 18% sämre
» Den bästa hade ett delta på 7%, genomsnittet var 20%, sämst var 129%
Jämfört med alla testade enheter
» 73% av alla testade enheter var bättre, 6% liknande, 21% sämre
» Den bästa hade ett delta på 4%, genomsnittet var 23%, sämst var 134%
| Av/Standby | |
| Låg belastning | |
| Hög belastning |
|
Förklaring:
min: | |
| Samsung Galaxy Tab S3 SM-T825 6000 mAh | Samsung Galaxy Tab S2 9.7 LTE 5870 mAh | Apple iPad Pro 9.7 7306 mAh | Huawei MediaPad T2 10.0 Pro 6600 mAh | Google Pixel C mAh | Asus ZenPad 3s 10 Z500M 5900 mAh | Apple iPad (2017) 8.827 mAh | |
|---|---|---|---|---|---|---|---|
| Power Consumption | -31% | -59% | -5% | -32% | -25% | -64% | |
| Idle Minimum * (Watt) | 2.08 | 2.3 -11% | 1.71 18% | 1.58 24% | 1.82 12% | 1.59 24% | 2.06 1% |
| Idle Average * (Watt) | 3.5 | 4.5 -29% | 7.55 -116% | 4.12 -18% | 4.26 -22% | 4.14 -18% | 7.42 -112% |
| Idle Maximum * (Watt) | 3.58 | 5 -40% | 7.62 -113% | 4.15 -16% | 4.33 -21% | 4.23 -18% | 7.47 -109% |
| Load Average * (Watt) | 6.97 | 9.4 -35% | 8.39 -20% | 6.2 11% | 9.82 -41% | 10.89 -56% | 9.45 -36% |
| Load Maximum * (Watt) | 7.4 | 10.4 -41% | 12.08 -63% | 9.27 -25% | 13.99 -89% | 11.58 -56% | 12.31 -66% |
* ... mindre är bättre
| Samsung Galaxy Tab S3 SM-T825 6000 mAh | Samsung Galaxy Tab S2 9.7 LTE 5870 mAh | Huawei MediaPad T2 10.0 Pro 6600 mAh | Asus ZenPad 3s 10 Z500M 5900 mAh | Apple iPad (2017) 8.827 mAh | Apple iPad Pro 9.7 7306 mAh | |
|---|---|---|---|---|---|---|
| Batteridrifttid | -26% | -27% | -22% | -2% | -6% | |
| Reader / Idle (h) | 31.7 | 15.3 -52% | 20.5 -35% | 24.2 -24% | 24.9 -21% | 30.8 -3% |
| H.264 (h) | 9.2 | 10.9 18% | 9.9 8% | 10 9% | 14.1 53% | 11.8 28% |
| WiFi v1.3 (h) | 12.7 | 6.6 -48% | 6.9 -46% | 8.6 -32% | 12.7 0% | 13 2% |
| Load (h) | 6.3 | 4.9 -22% | 4.1 -35% | 3.8 -40% | 3.8 -40% | 3.1 -51% |
För
Emot
Läs originaltestet i sin helhet här (på engelska).
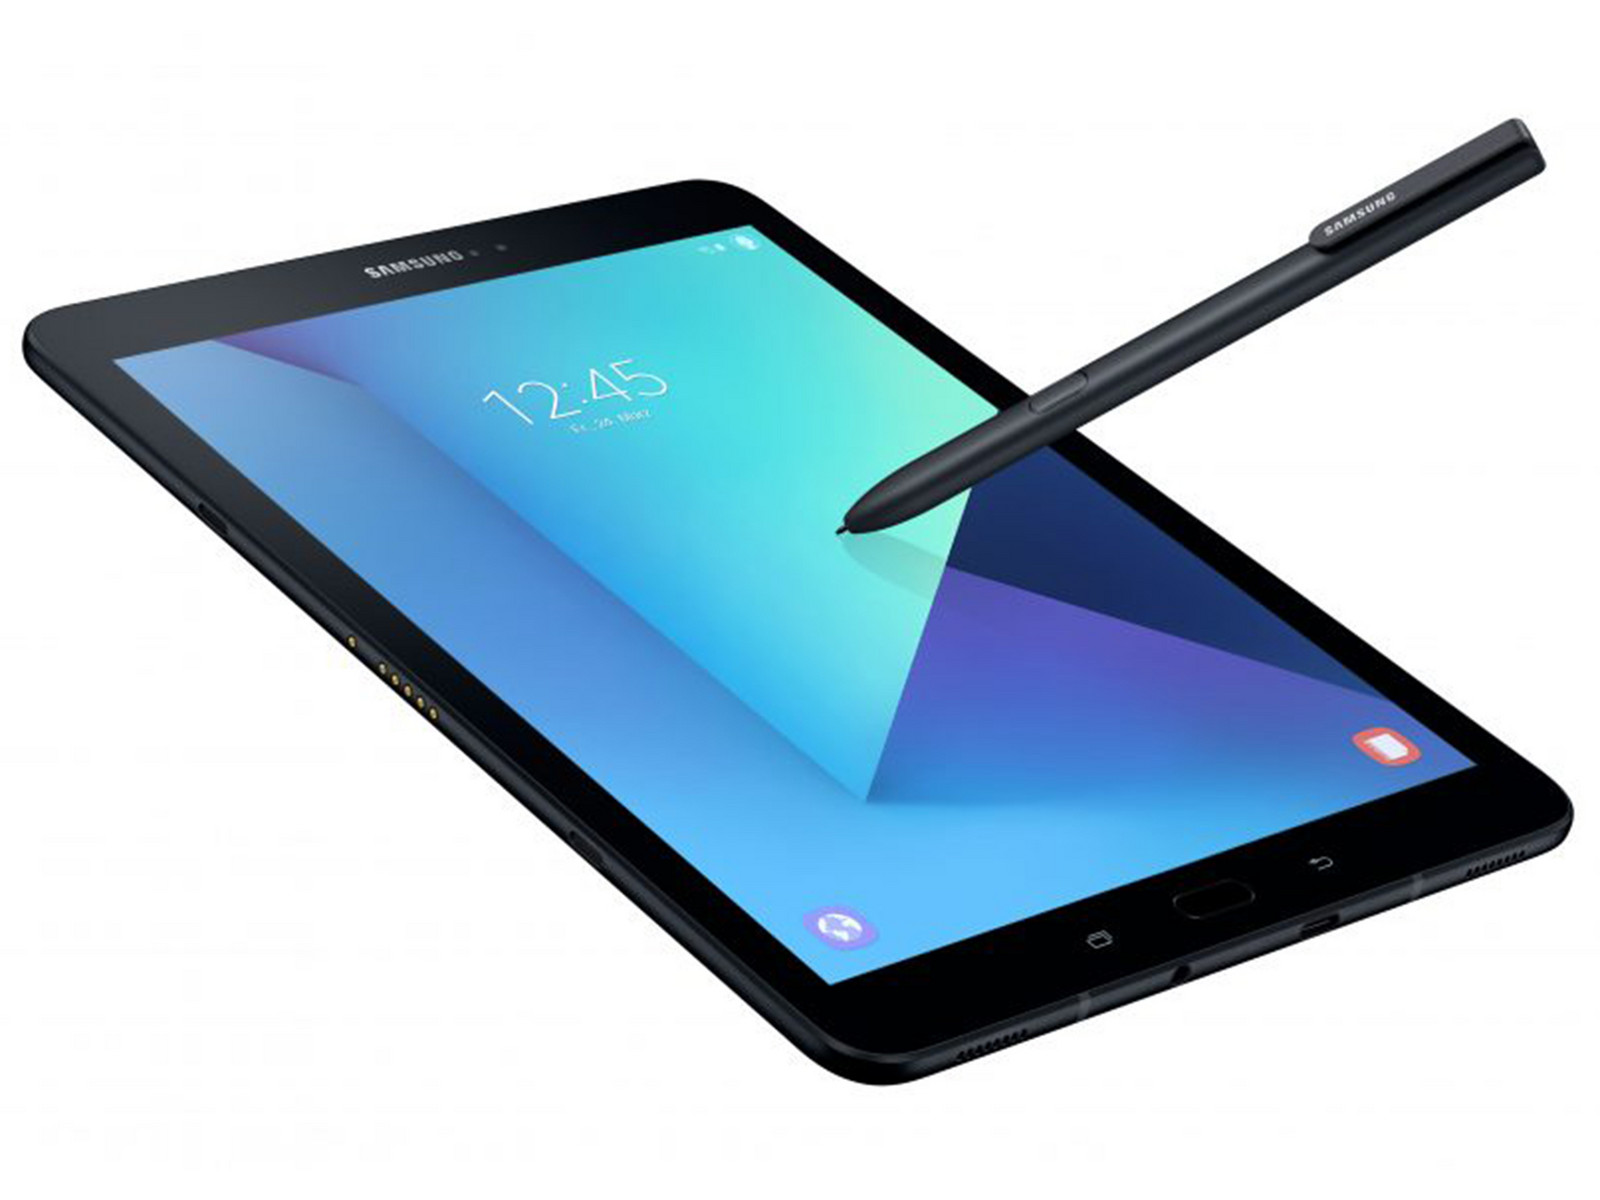
Samsungs Galaxy Tab S3 LTE är en mycket bra surfplatta som liksom iPad 2017 inte nödvändigtvis förlitar sig till den senaste hårdvaran. Men helheten är ändå mycket övertygande.
Utöver en bra skärm med HDR-stöd, bra högtalare, förbättrad batteritid och S Pen-stöd, är även Wi-Fi-modulen mycket snabb. Systemkretsen Snapdragon 820 är verkligen inte den senaste varianten från Qualcomm, men prestandan är fortfarande mycket bra. Däremot är den långsamma eMMC-lagringen en besvikelse i premiumsegmentet. Samsung har inte heller använt särskilt bra kameror, så premiumkänslan lyser med sin frånvaro.
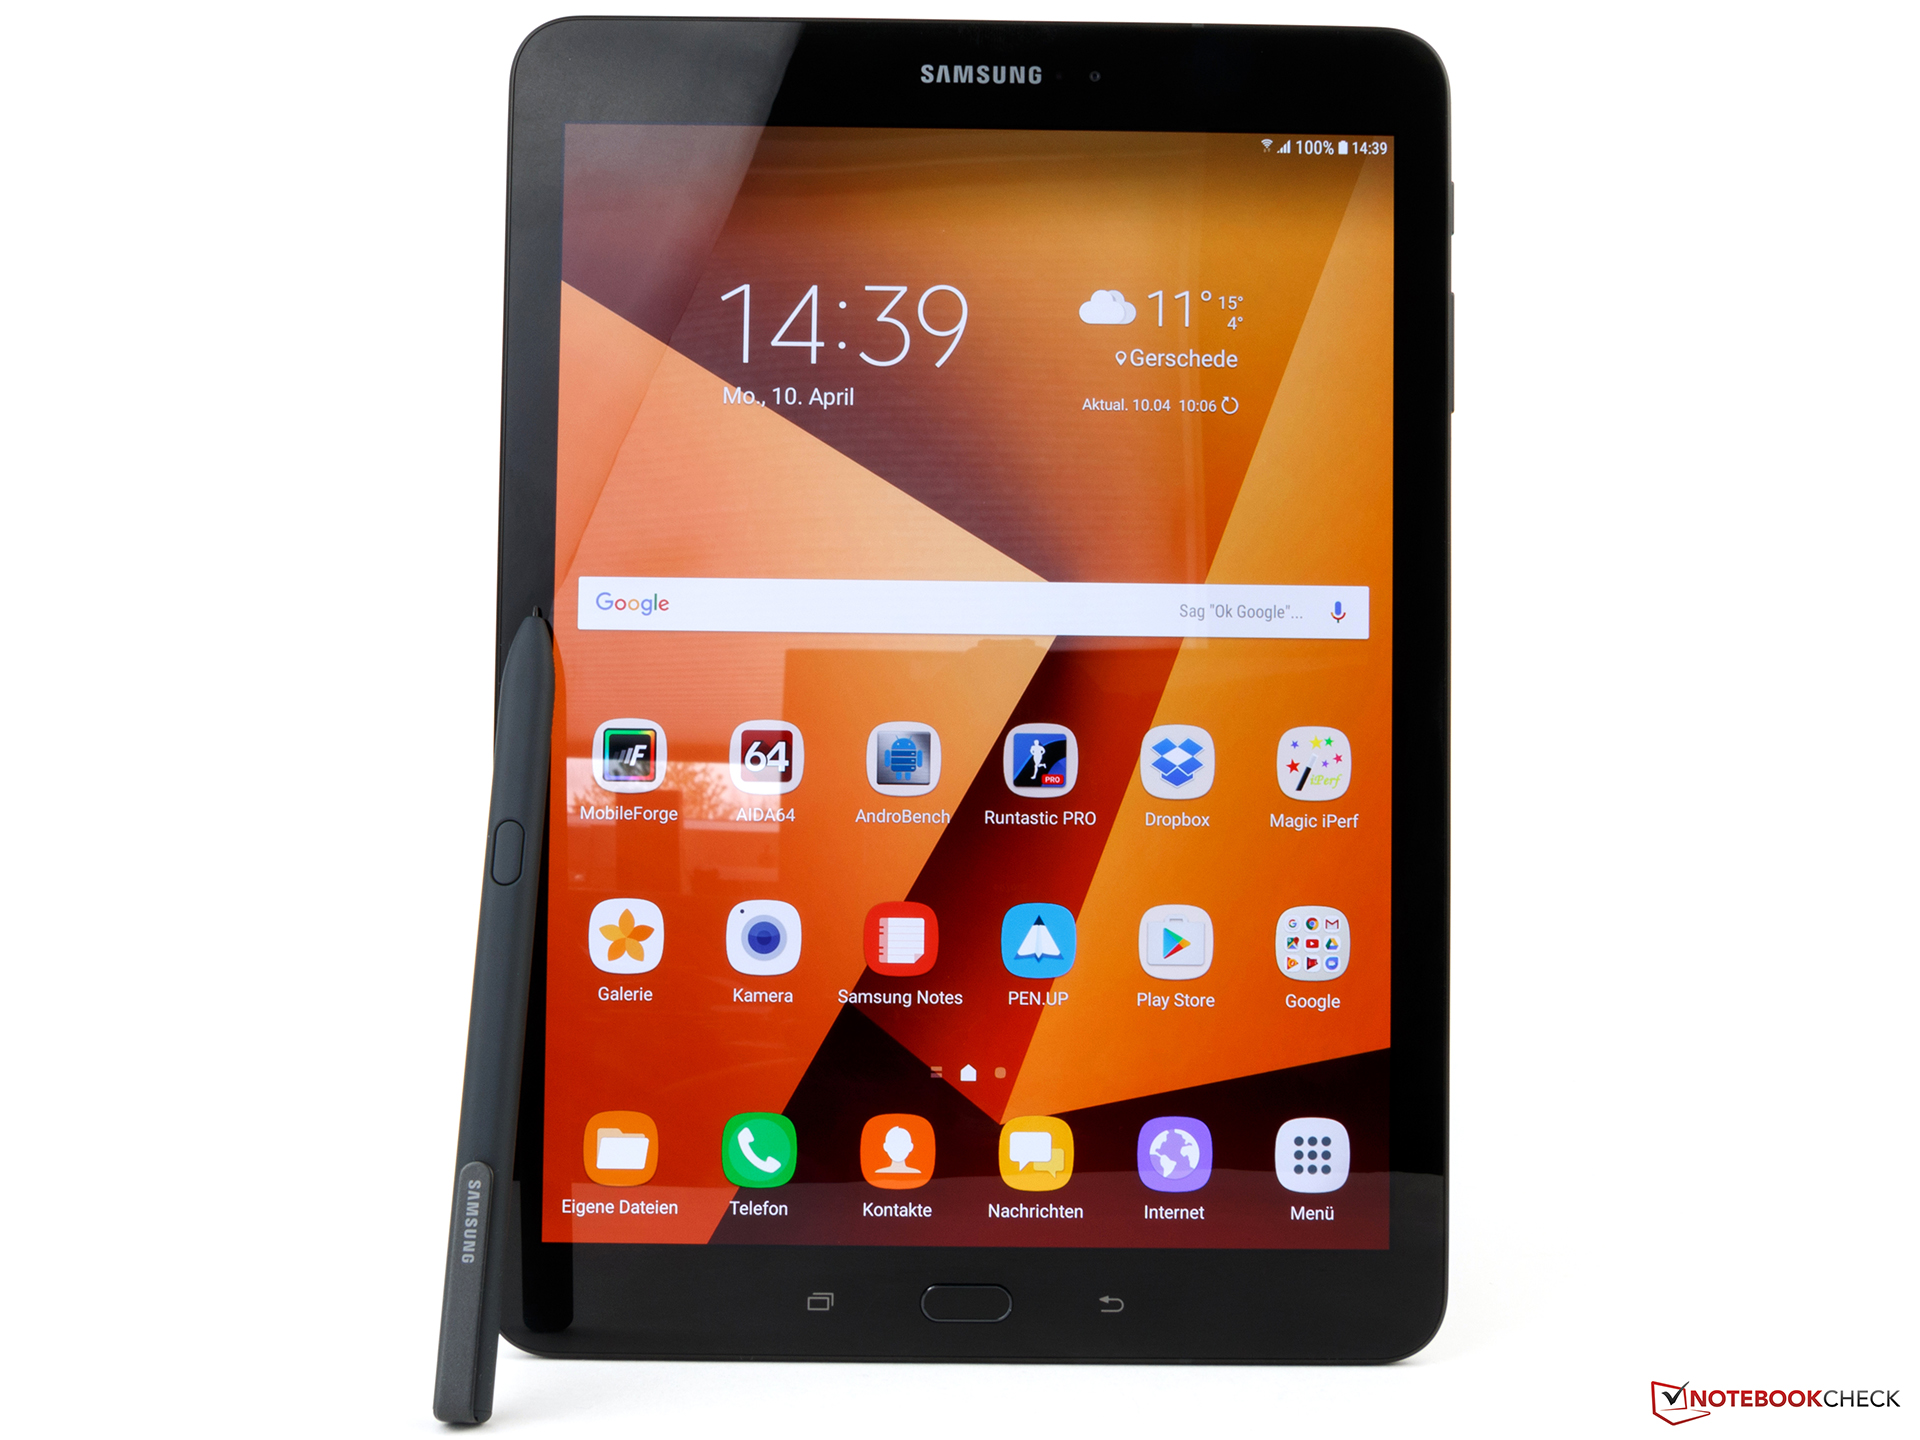
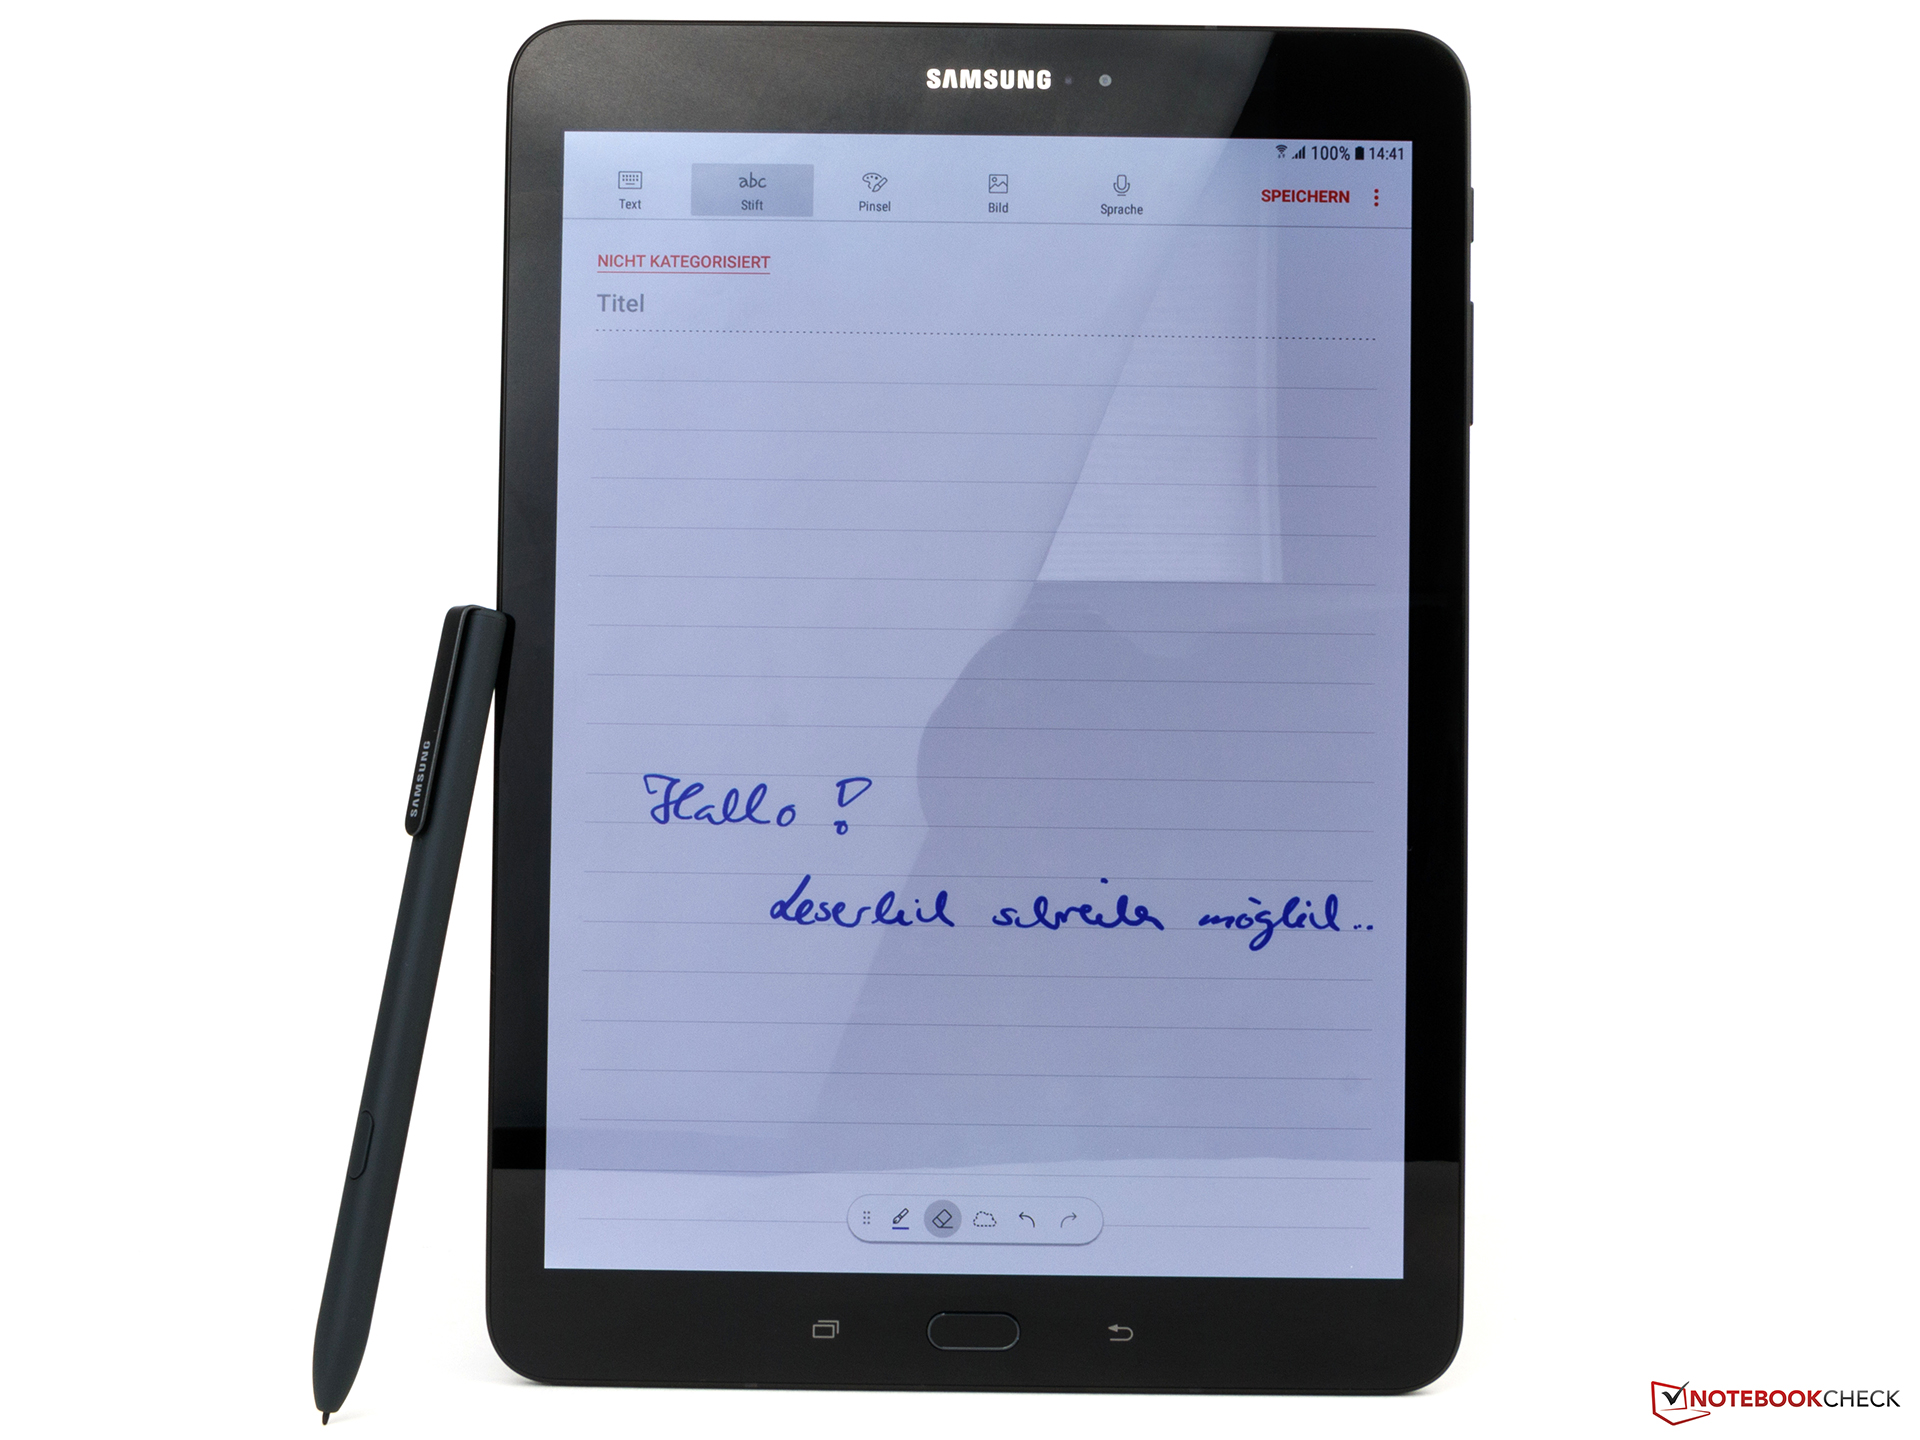
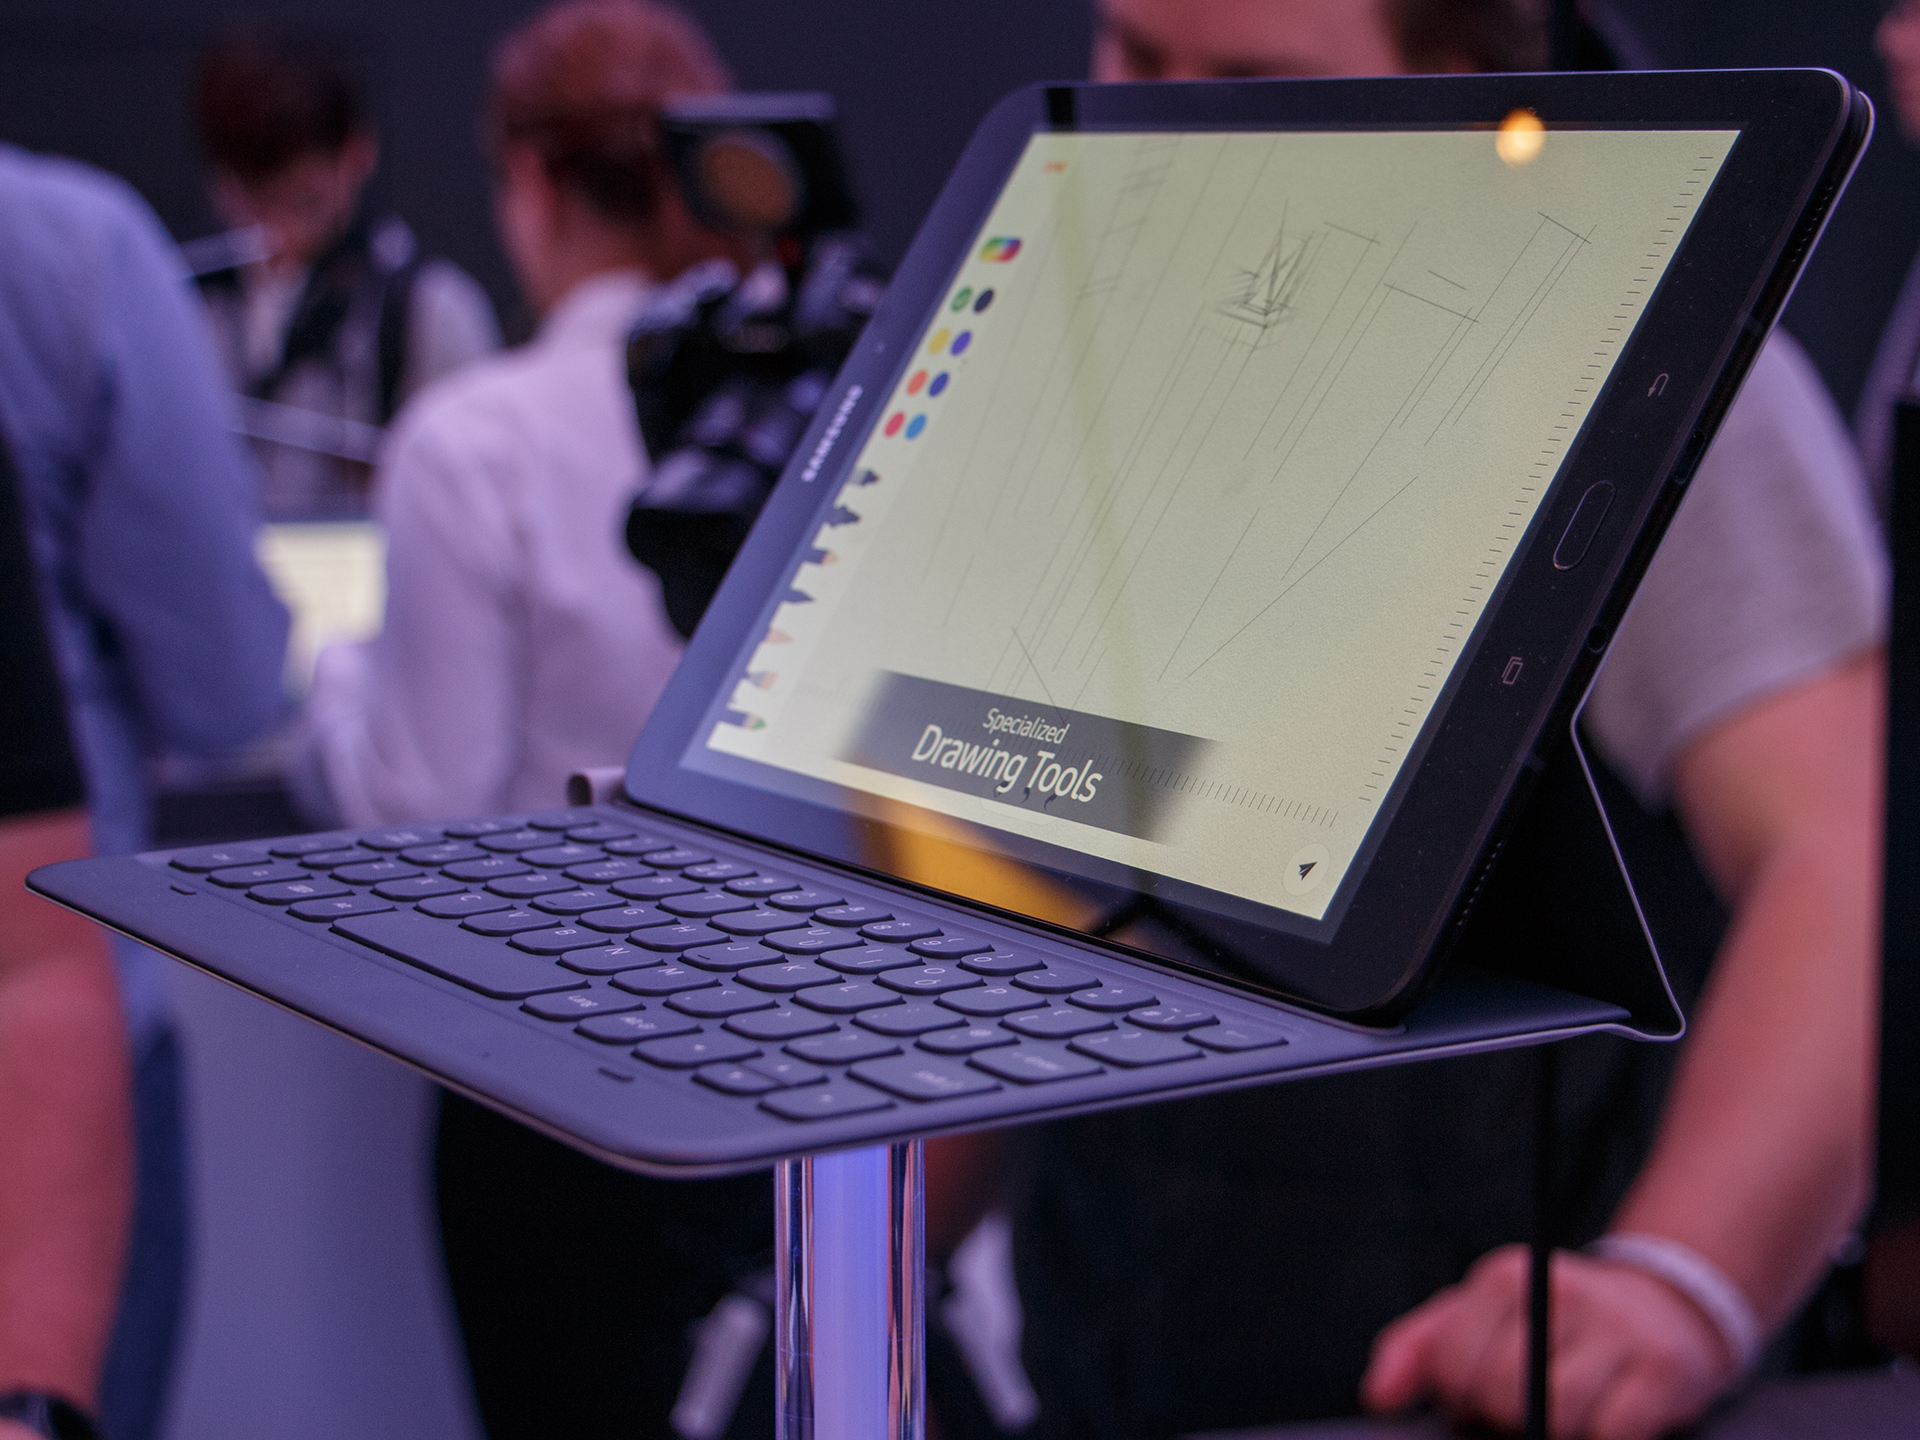
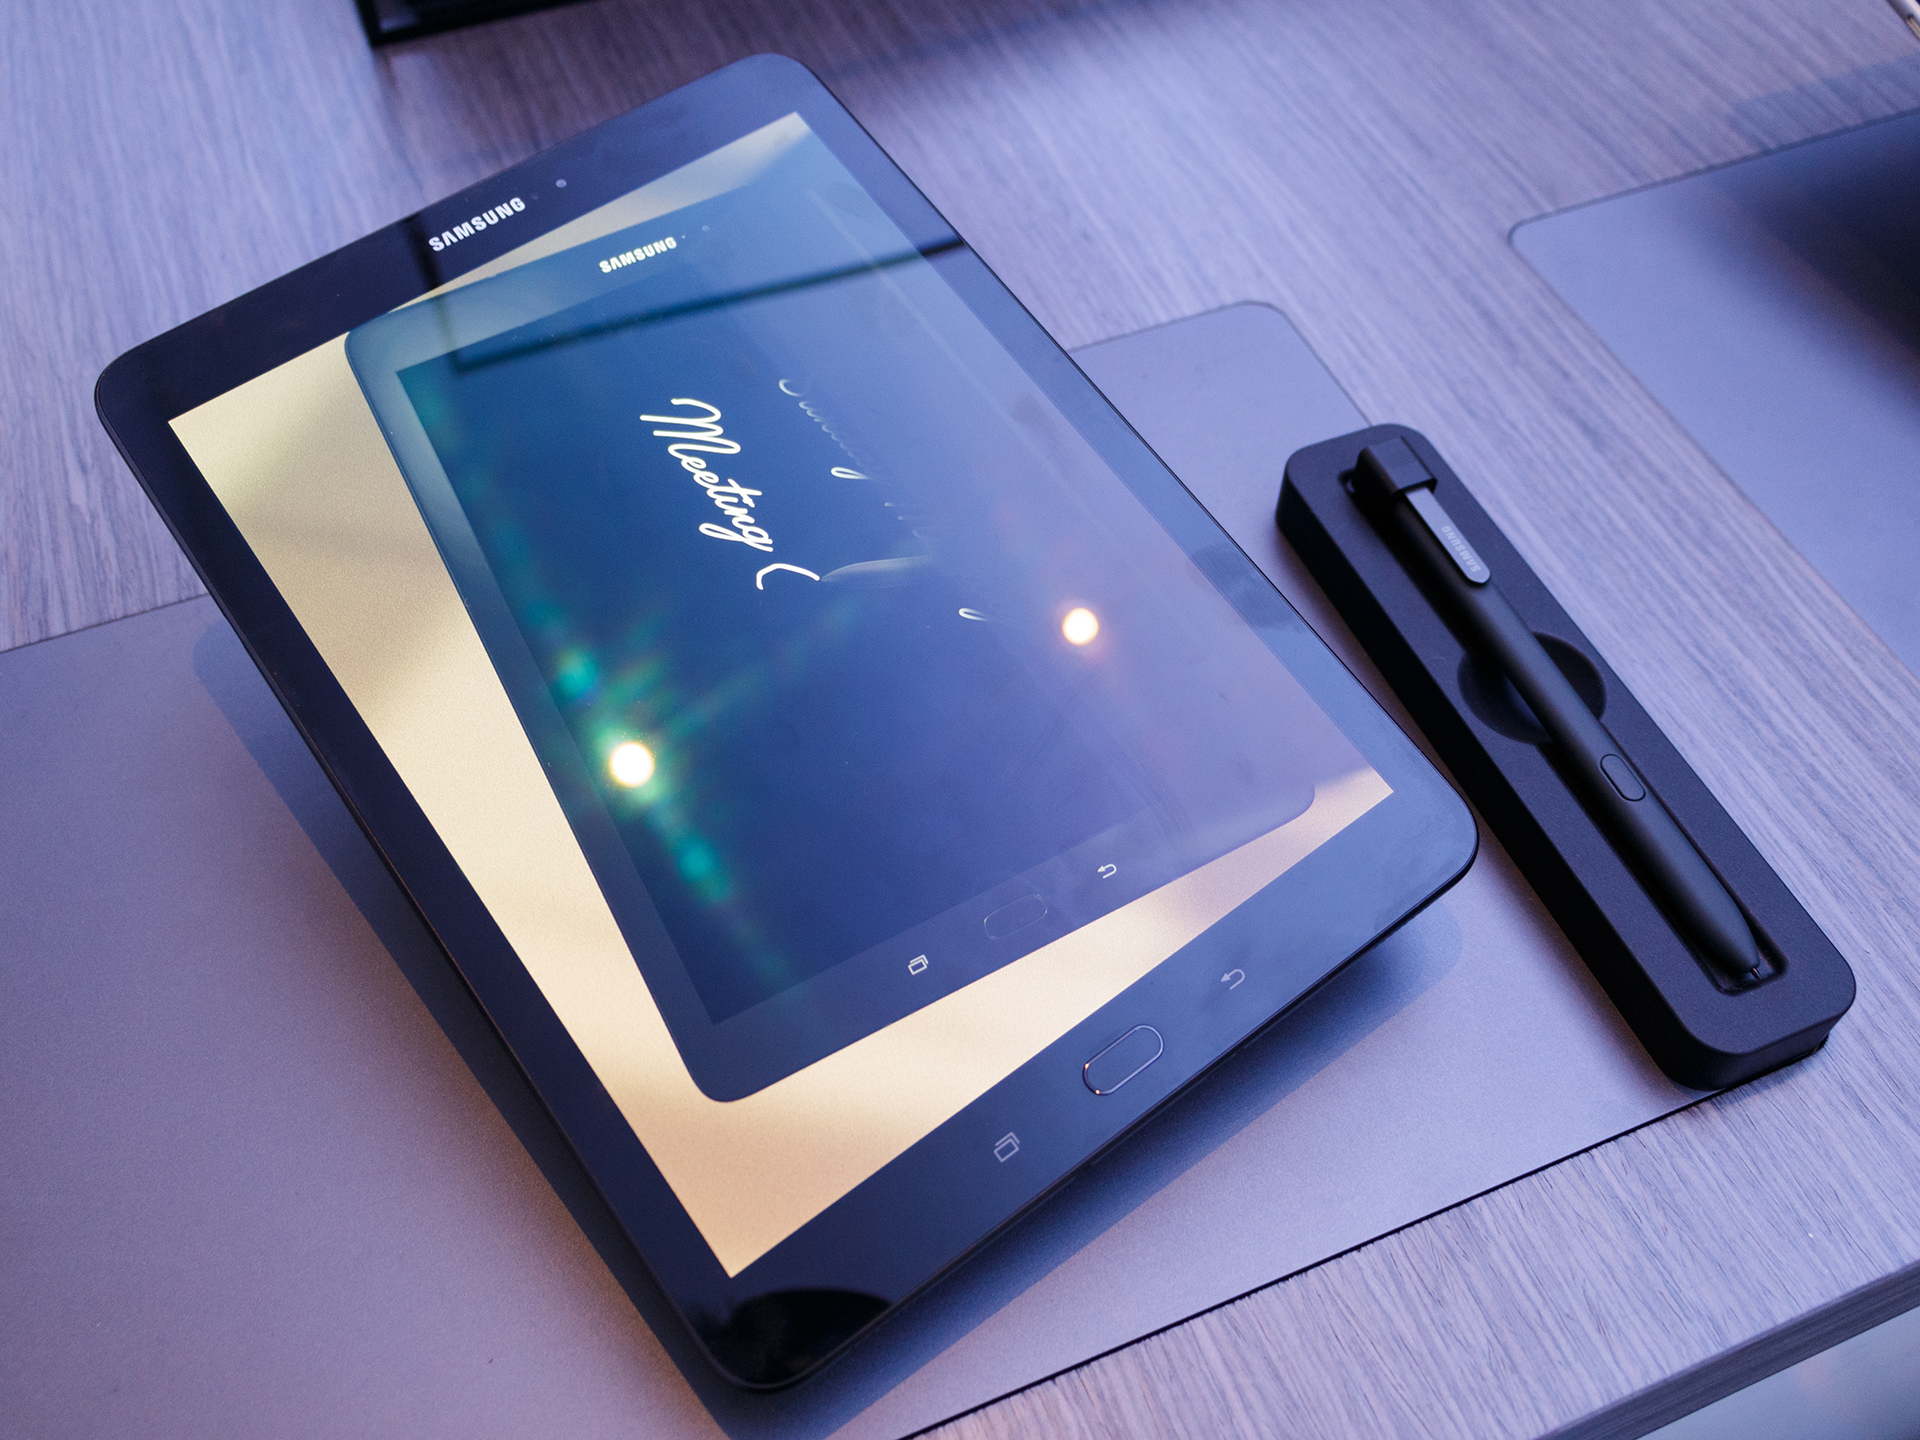
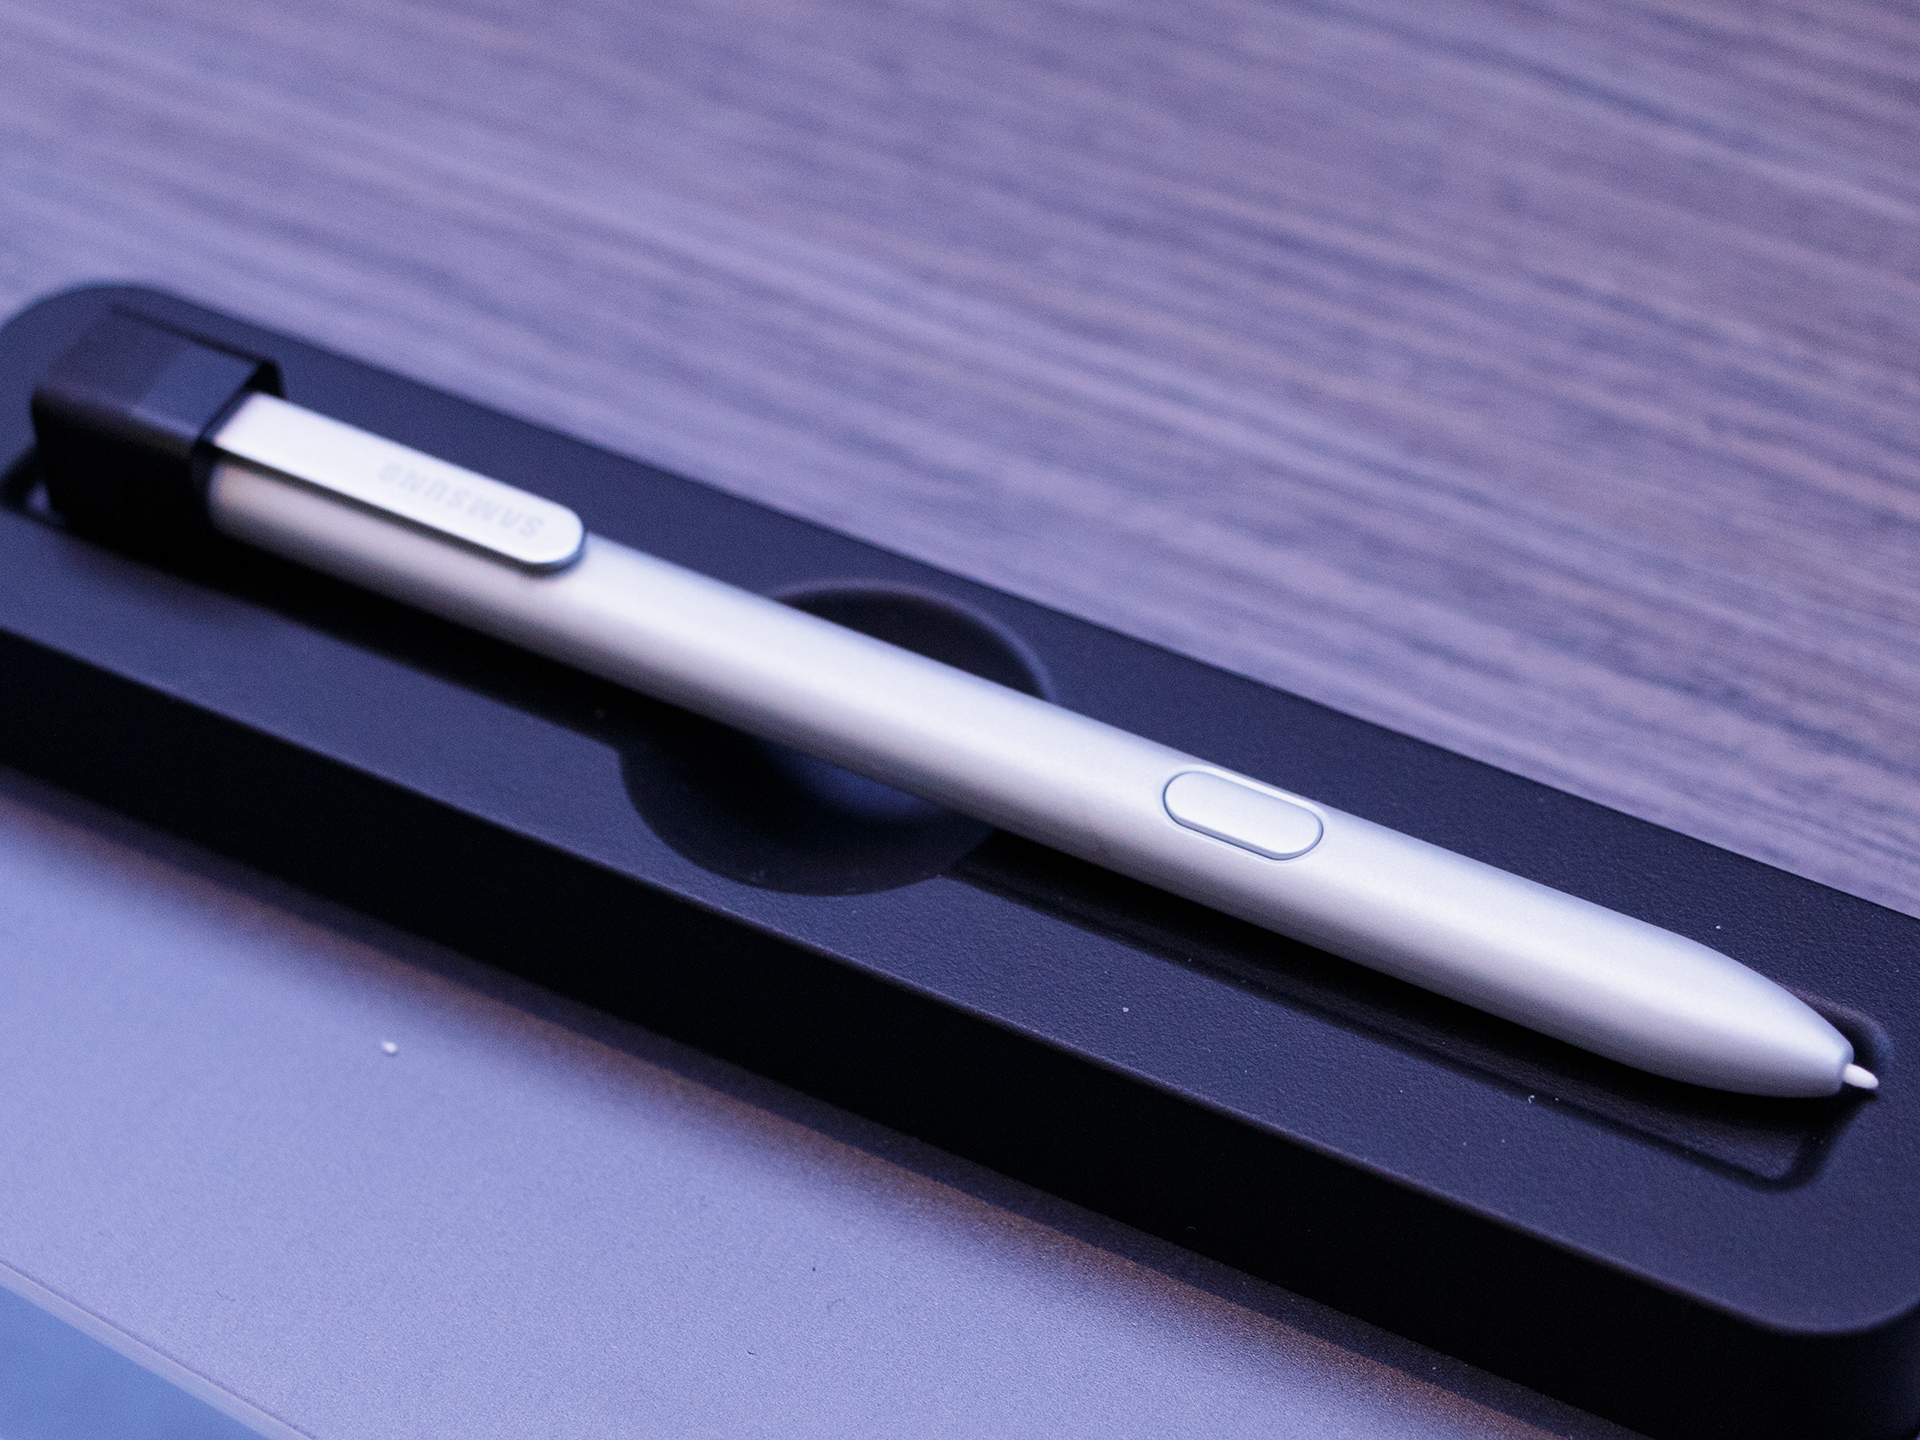
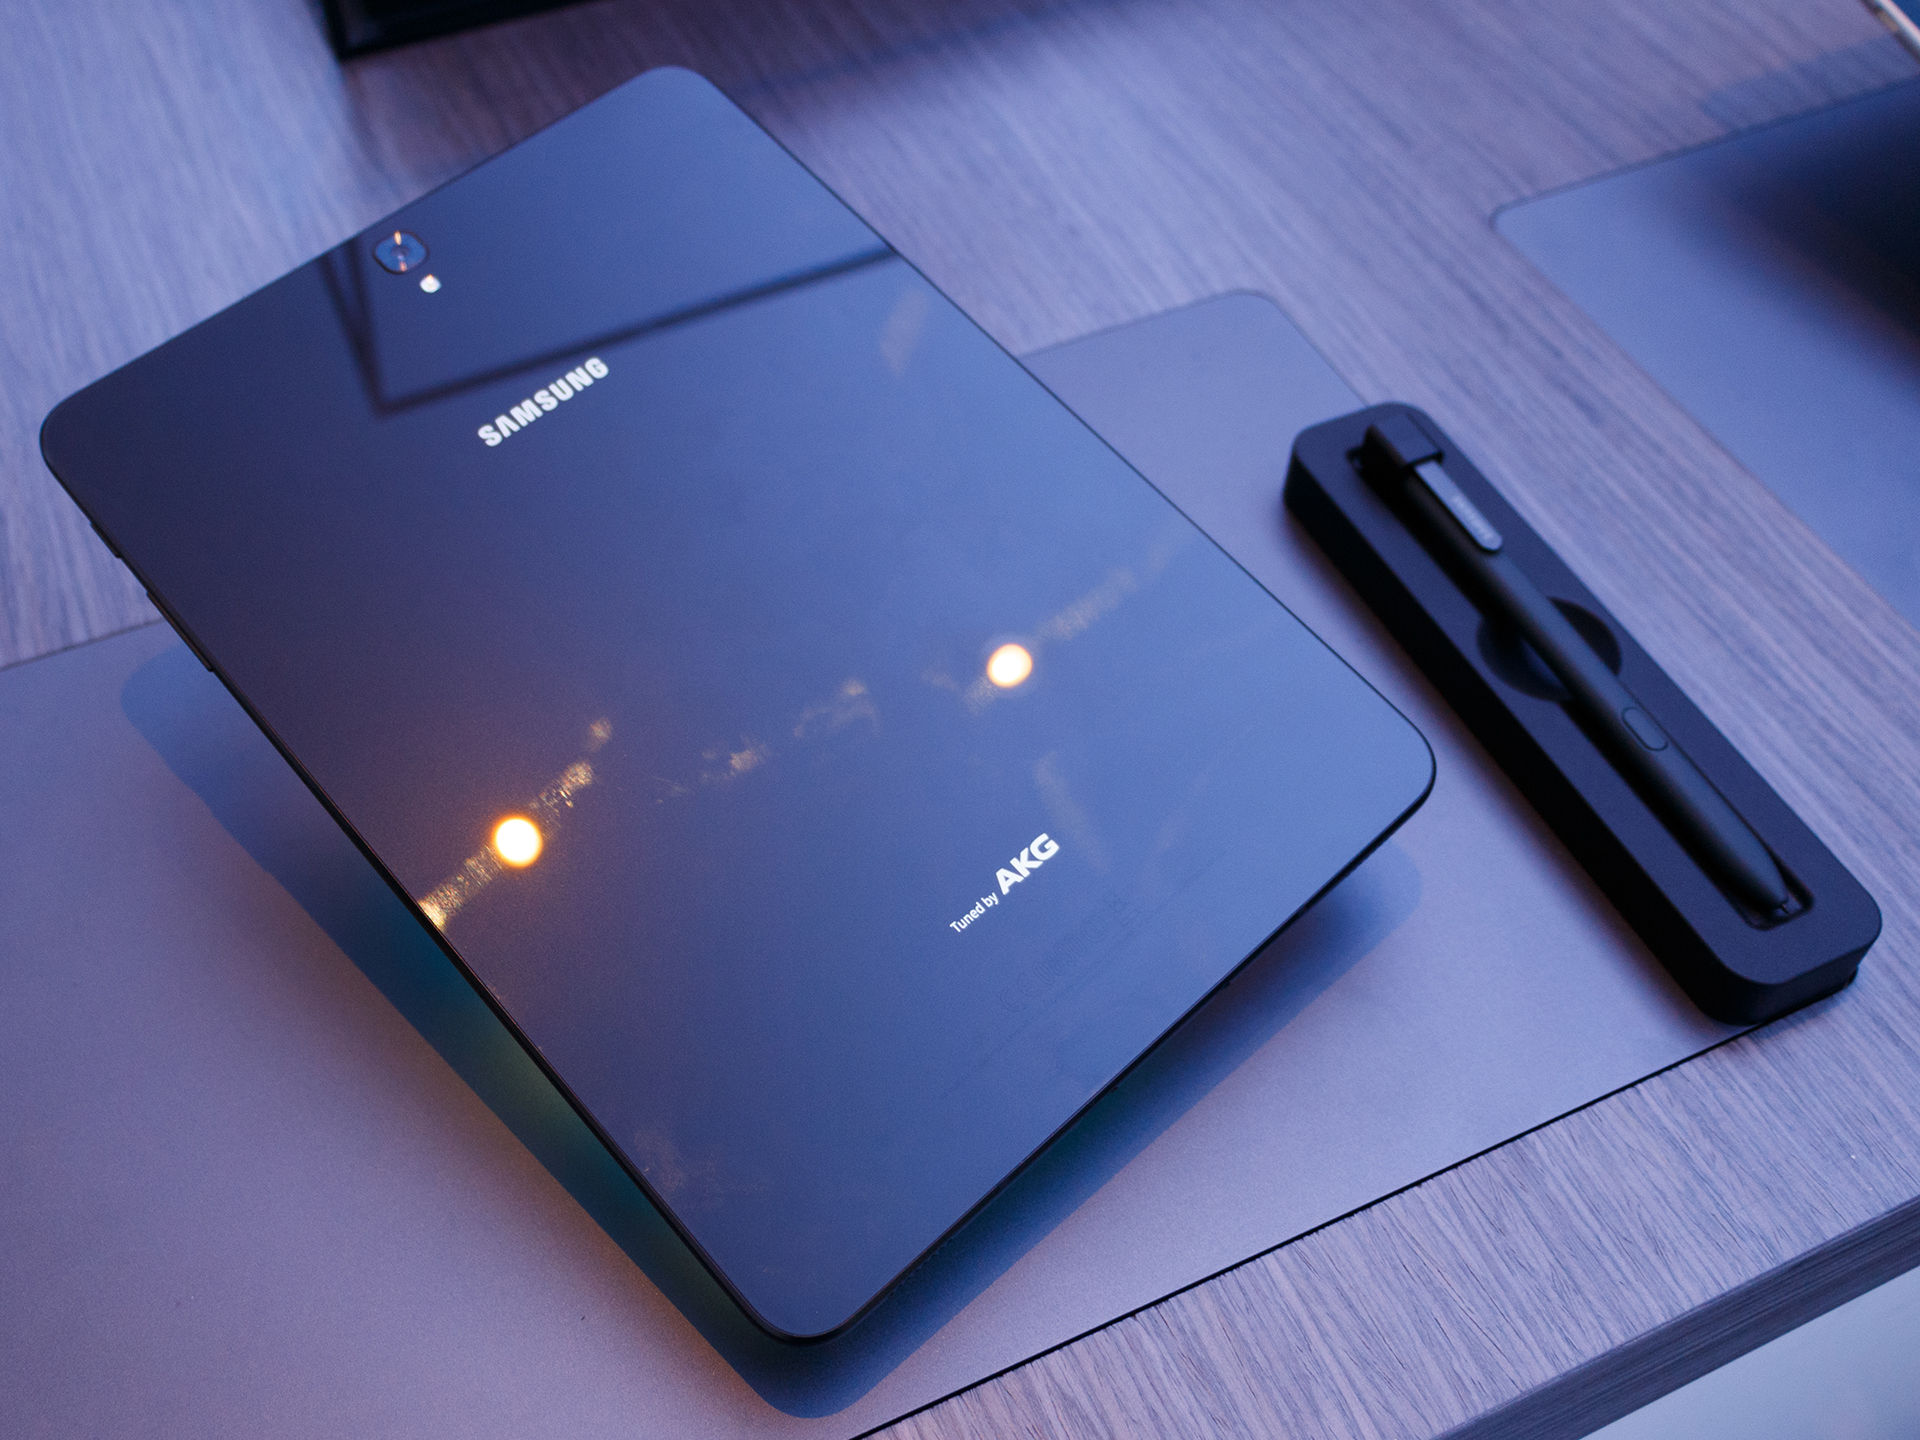
Stödet för S Pen är något vi verkligen uppskattade. Pekpennan ingår alltid med Tab S3 och gör ett utmärkt intryck. Tyvärr är surfplattan dyr och det finns inte många skäl att byta om du redan äger en Galaxy Tab S2 9.7 och klarar dig utan stylus.
Samsung Galaxy Tab S3 SM-T825
- 04/26/2017 v6 (old)
Daniel Schmidt
Price comparison
