Test: Samsung Galaxy Tab S7 Plus - Äntligen en riktigt bra Android-surfplatta (Sammanfattning)
Gradering | Datum | Modell | Vikt | Höjd | Storlek | Upplösning | Pris |
|---|---|---|---|---|---|---|---|
| 88.1 % v7 (old) | 10/2020 | Samsung Galaxy Tab S7 Plus SD 865+ (Plus), Adreno 650 | 575 g | 5.7 mm | 12.40" | 2800x1752 | |
| 89.3 % v7 (old) | 05/2020 | Apple iPad Pro 12.9 2020 A12Z Bionic, A12Z Bionic GPU | 641 g | 5.9 mm | 12.90" | 2732x2048 | |
| 88.4 % v7 (old) | 08/2020 | Huawei MatePad Pro 10.8 Kirin 990, Mali-G76 MP16 | 460 g | 7.2 mm | 10.80" | 2560x1600 | |
| 87.8 % v7 (old) | 10/2019 | Samsung Galaxy Tab S6 SM-T860 SD 855, Adreno 640 | 420 g | 5.7 mm | 10.50" | 2560x1600 |
| Networking | |
| iperf3 transmit AX12 | |
| Huawei MatePad Pro 10.8 | |
| Apple iPad Pro 12.9 2020 | |
| Samsung Galaxy Tab S7 Plus | |
| Samsung Galaxy Tab S6 SM-T860 | |
| iperf3 receive AX12 | |
| Huawei MatePad Pro 10.8 | |
| Samsung Galaxy Tab S6 SM-T860 | |
| Samsung Galaxy Tab S7 Plus | |
| Apple iPad Pro 12.9 2020 | |
Bildjämförelse
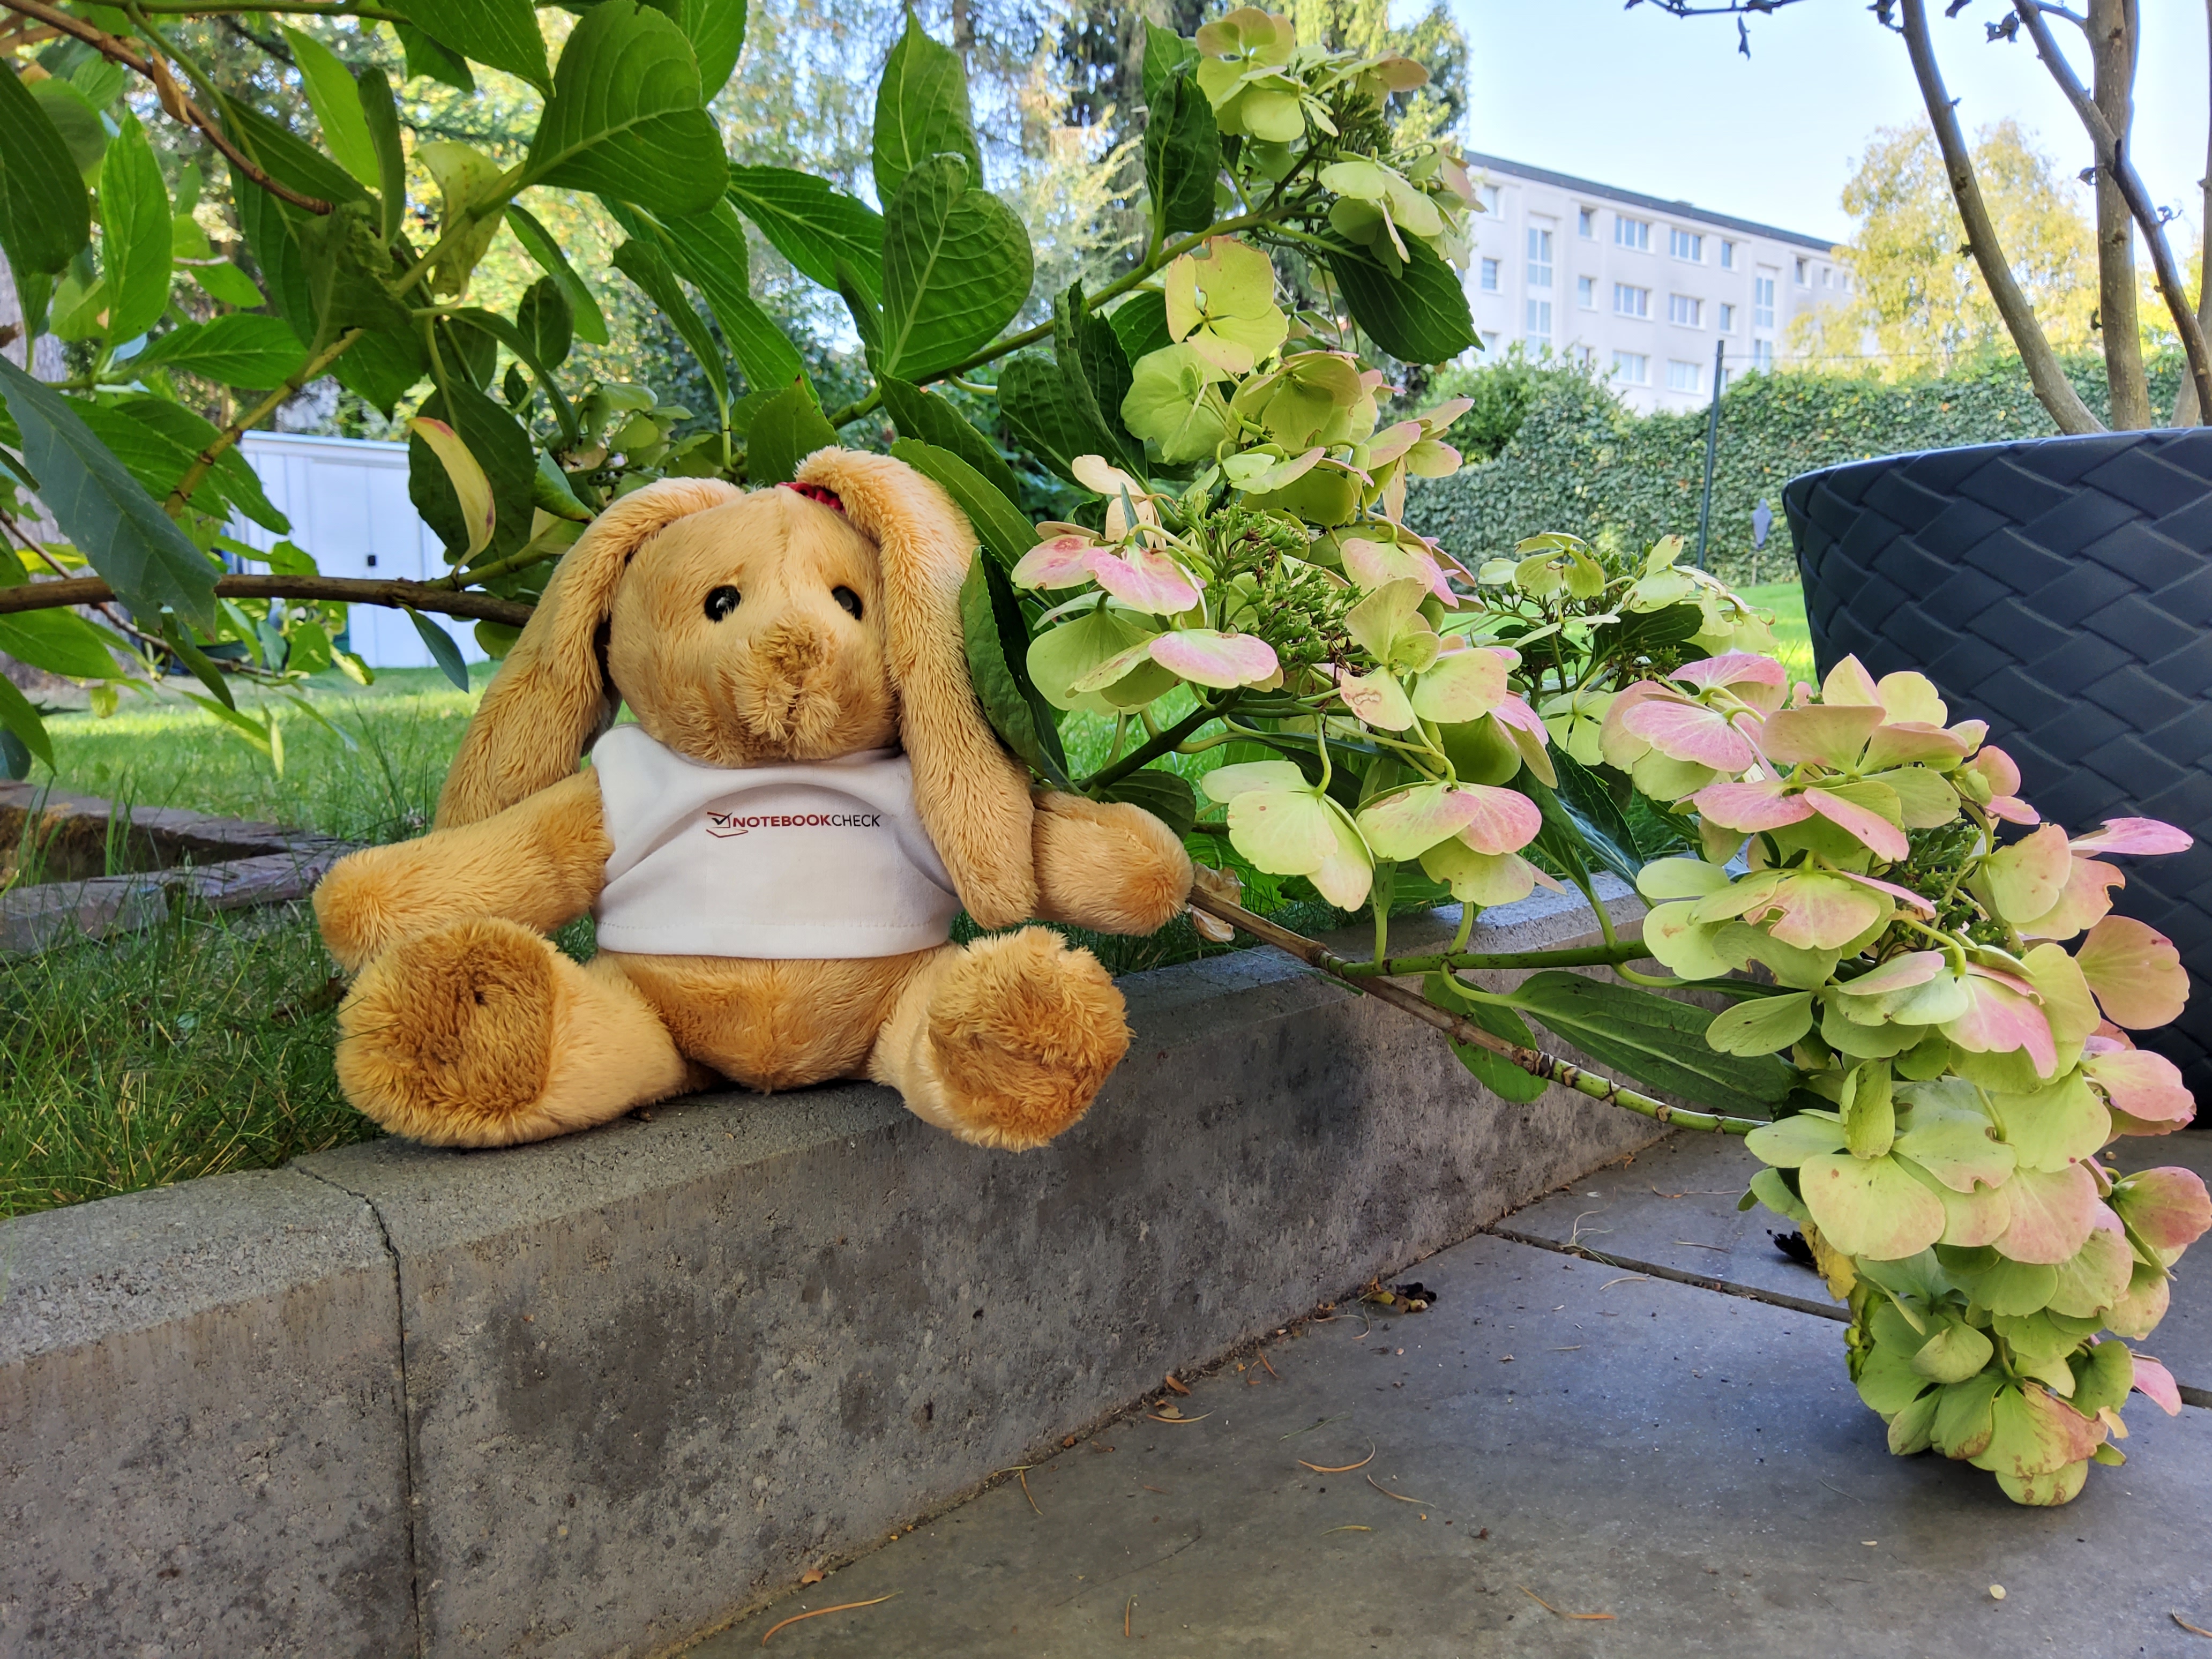
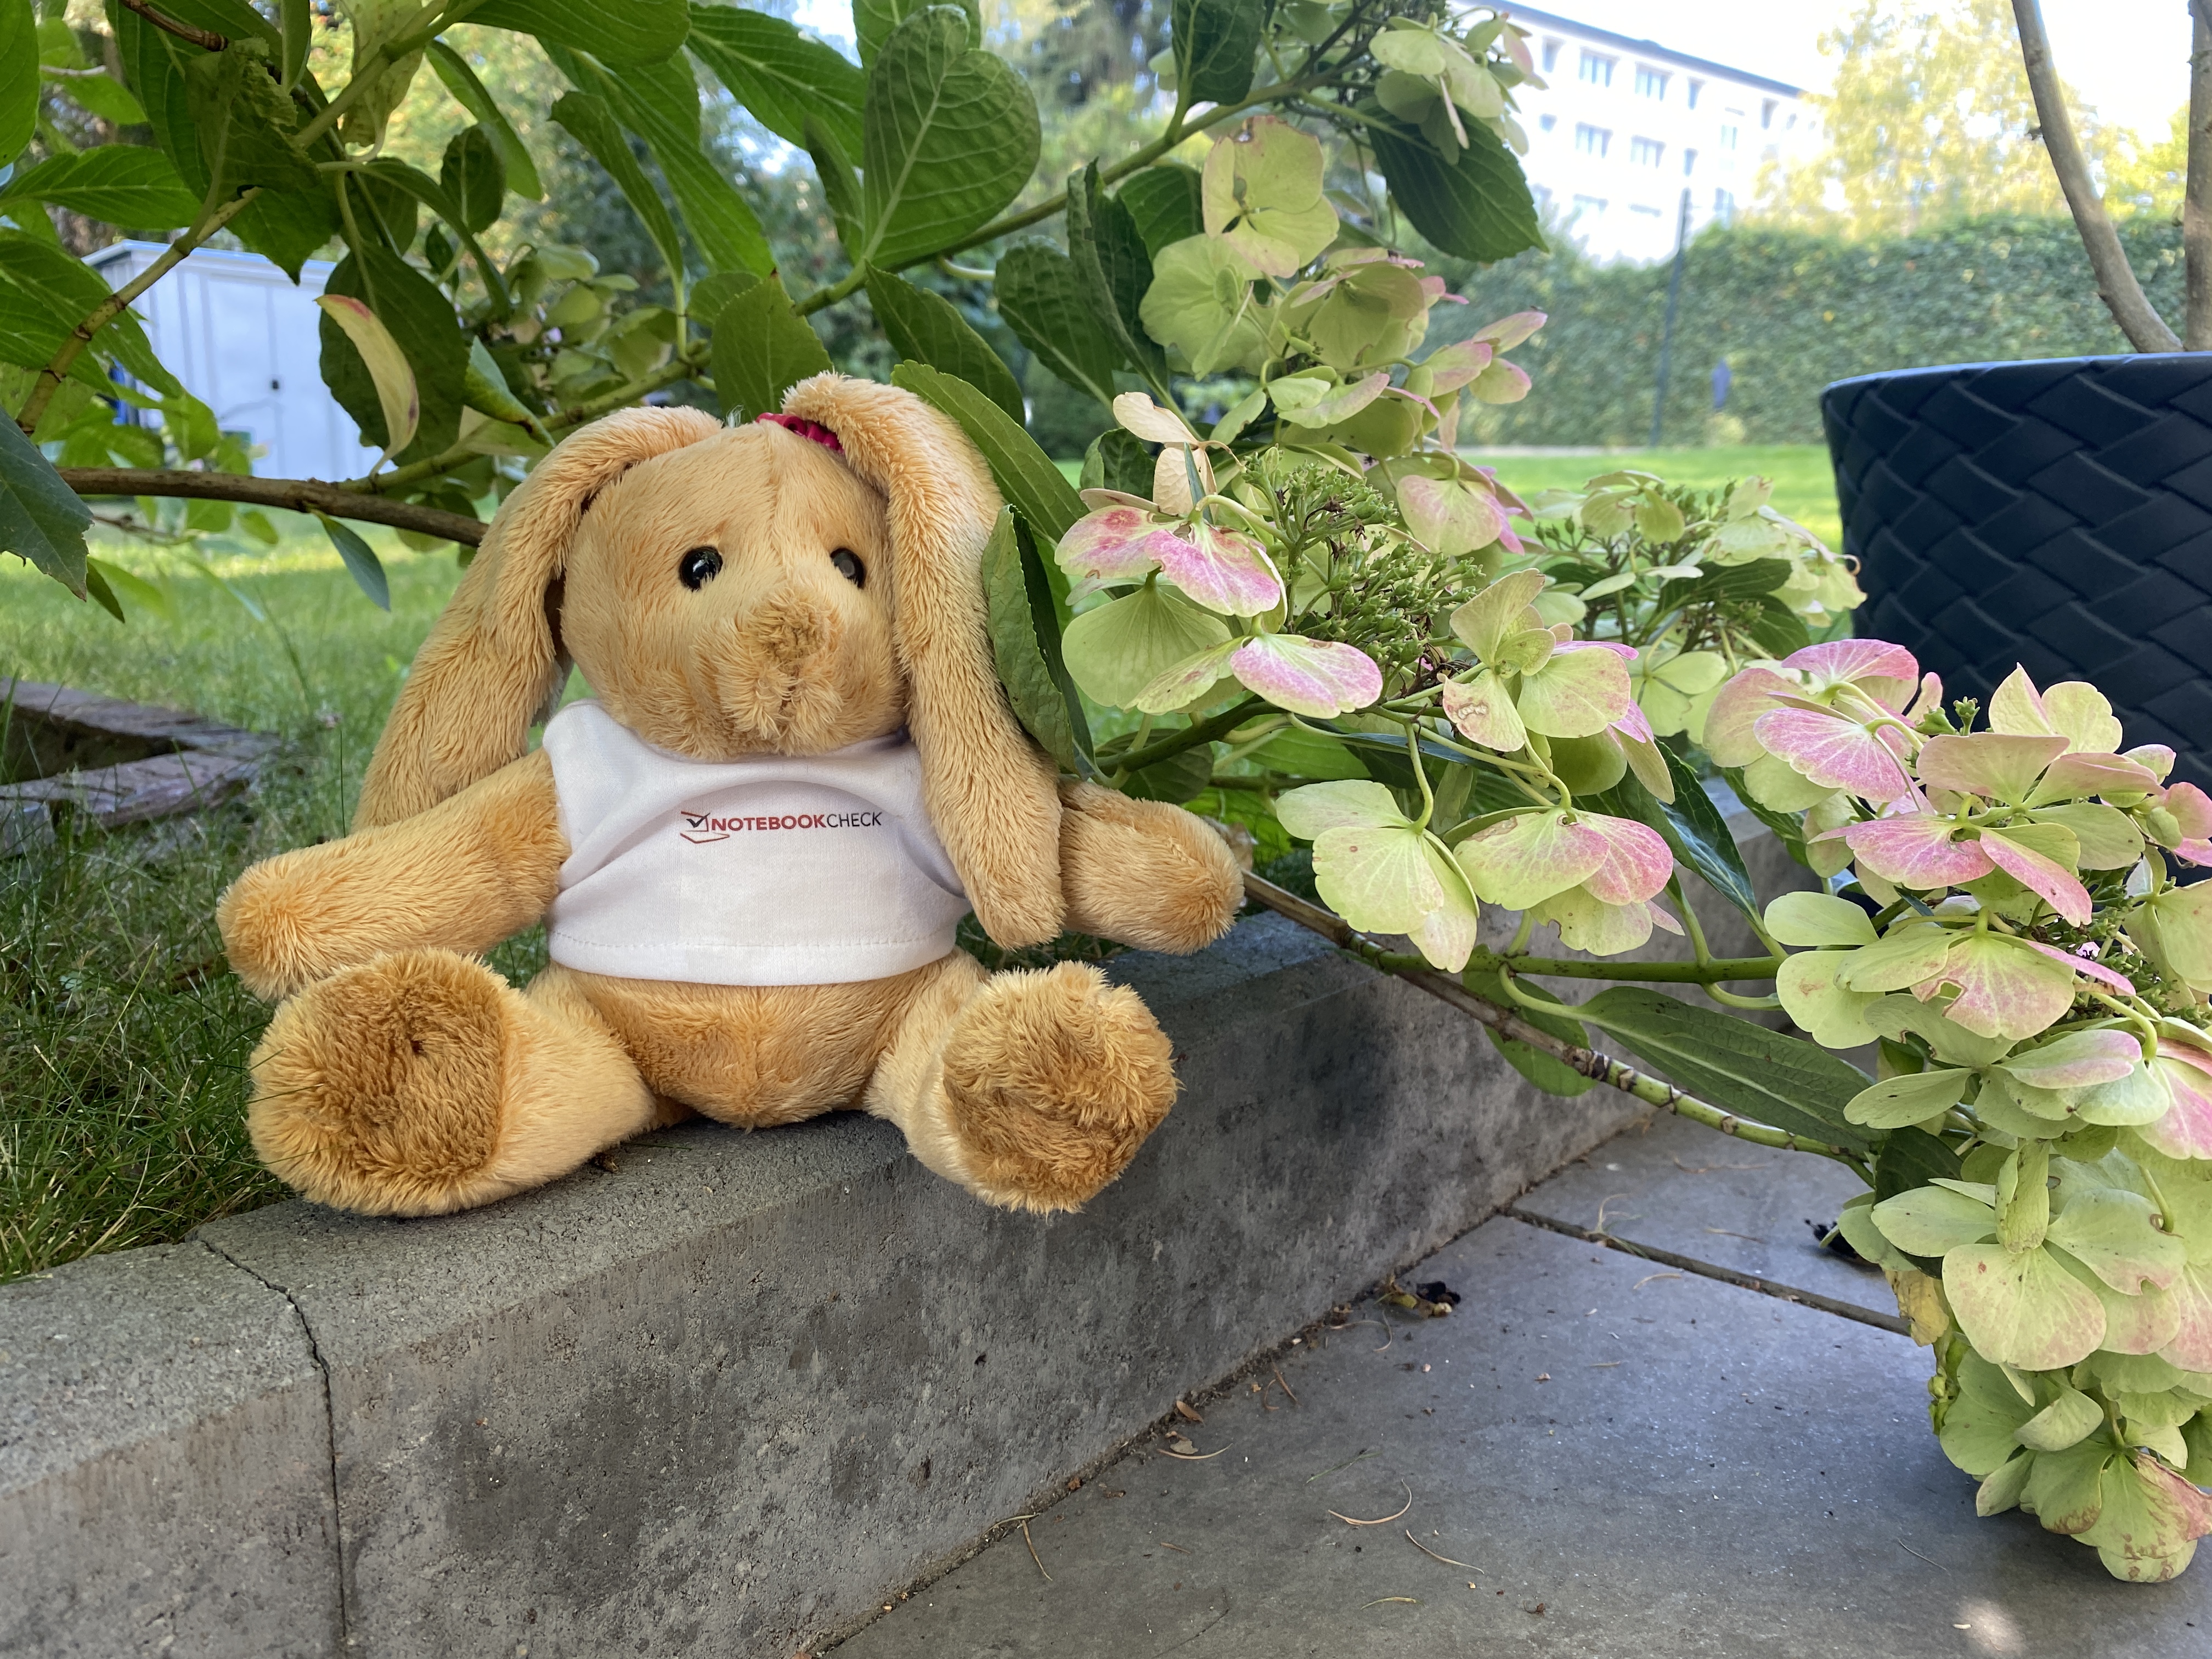
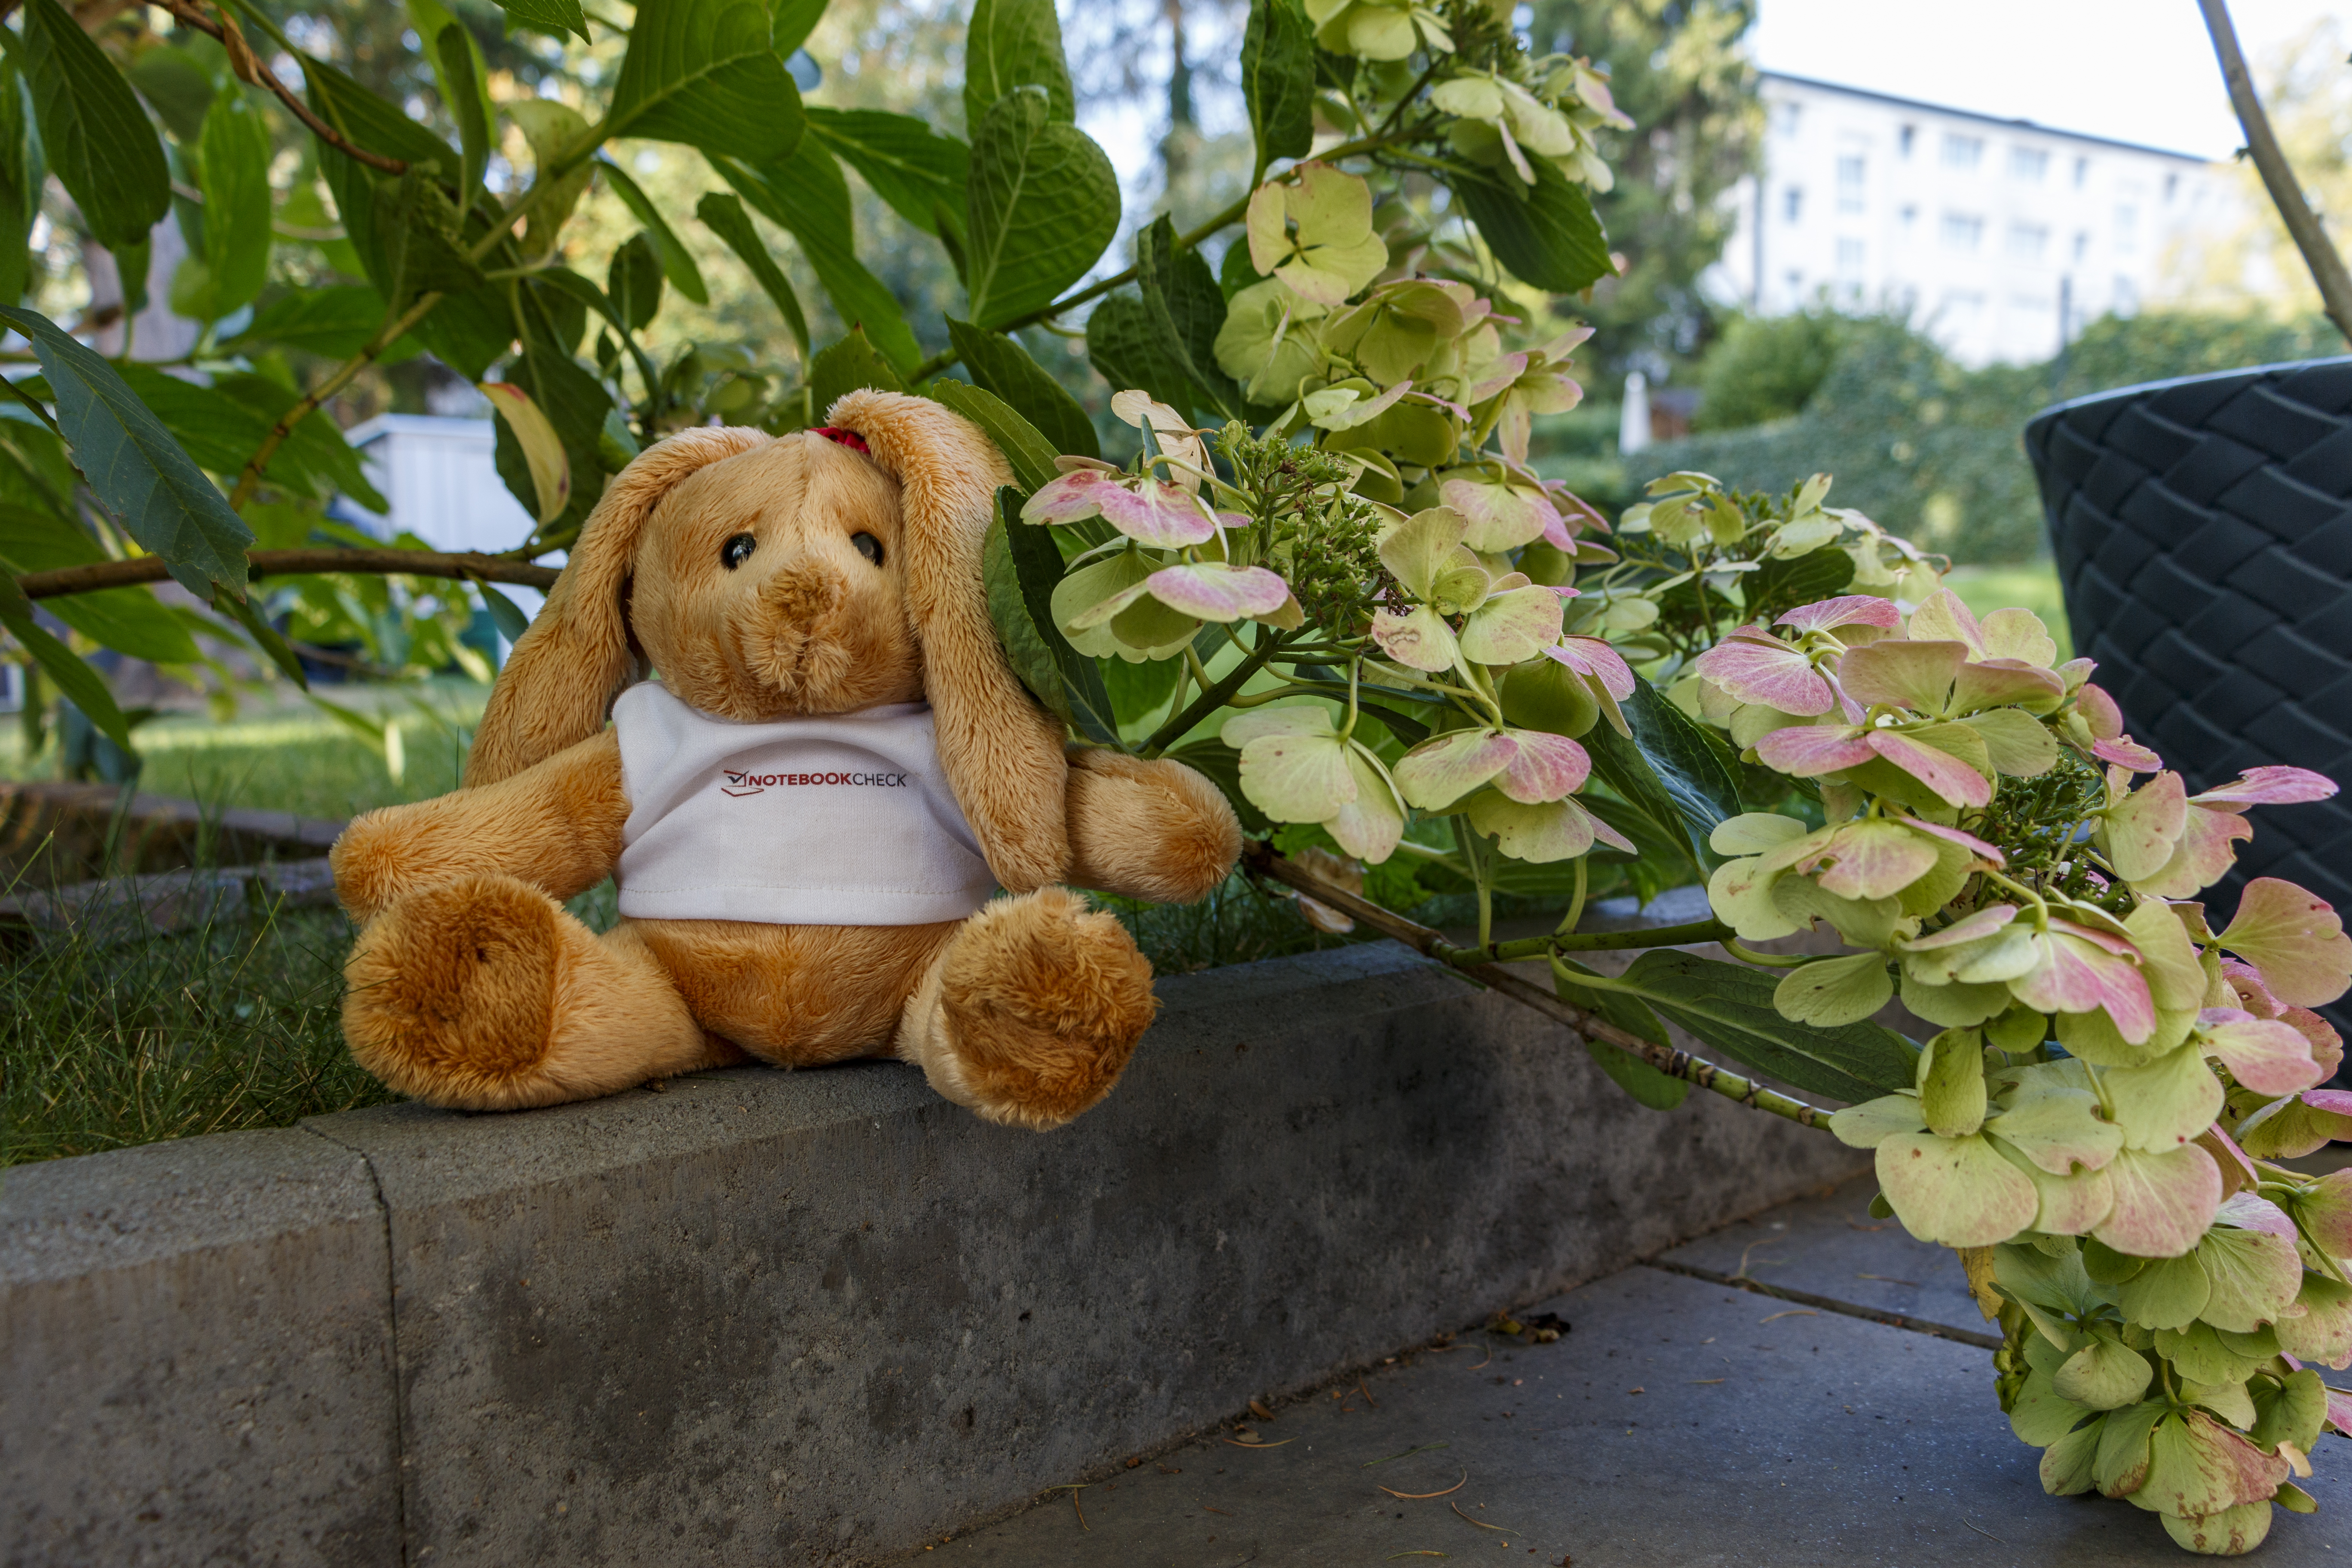
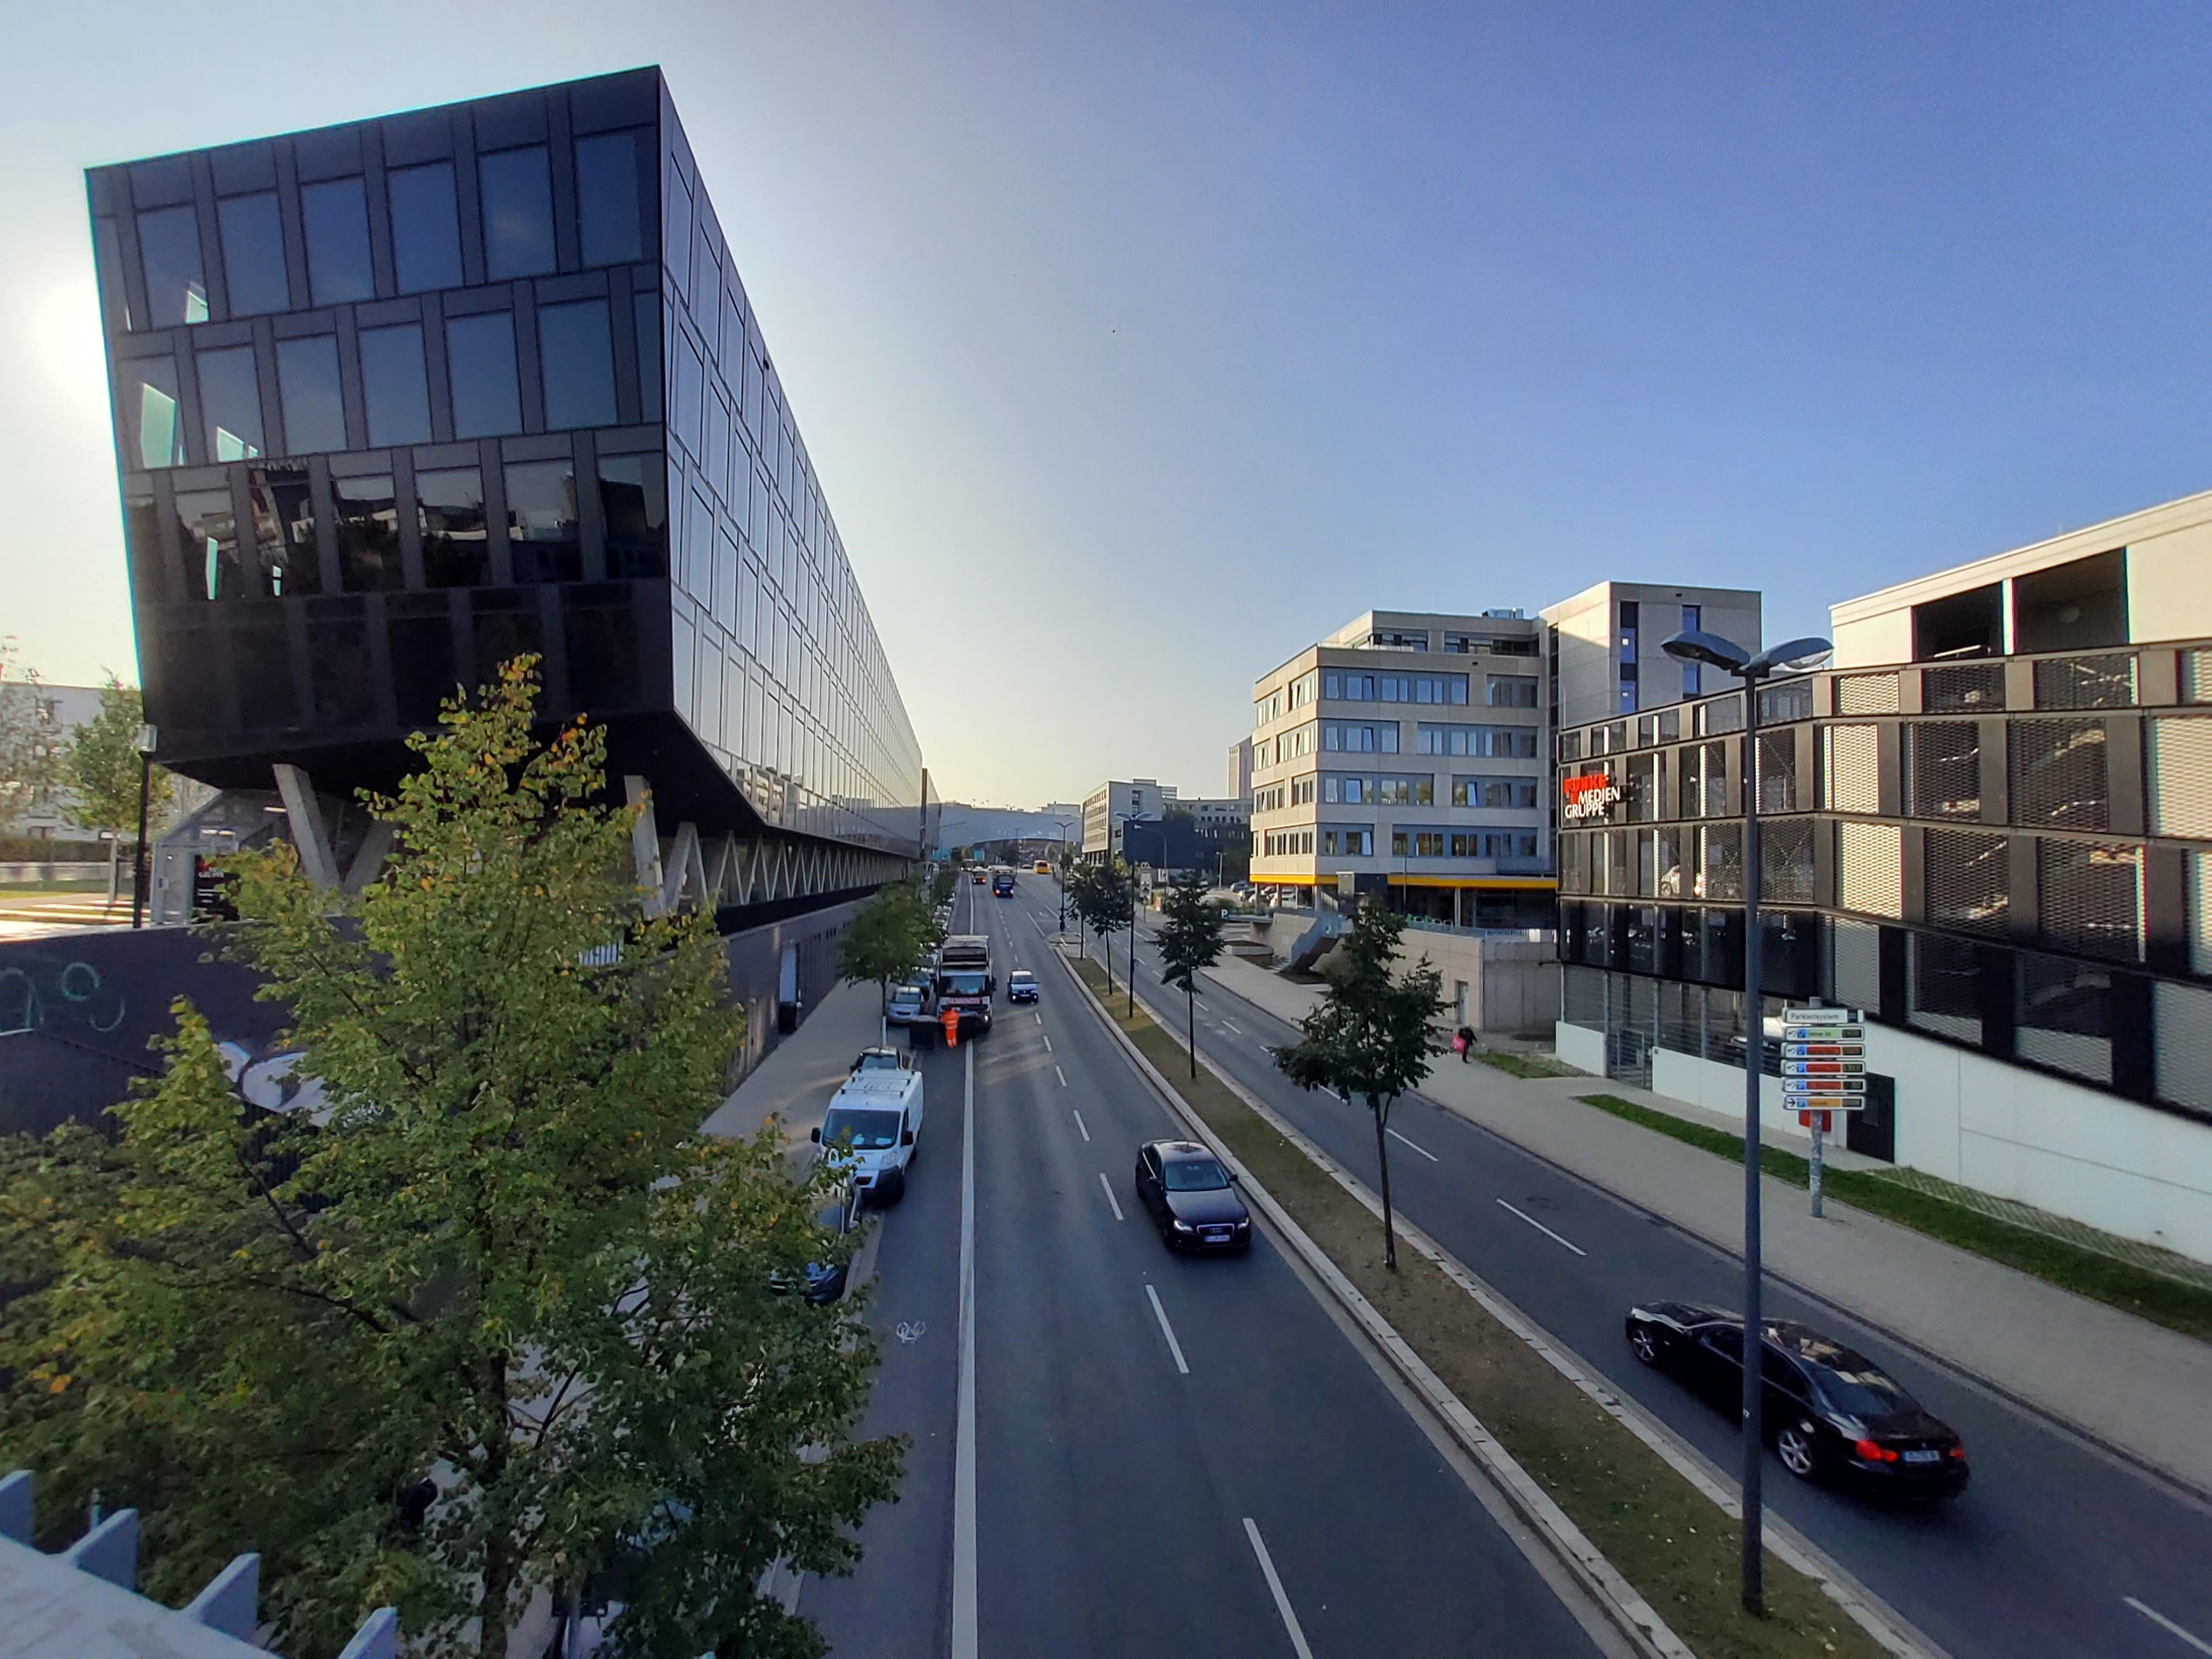
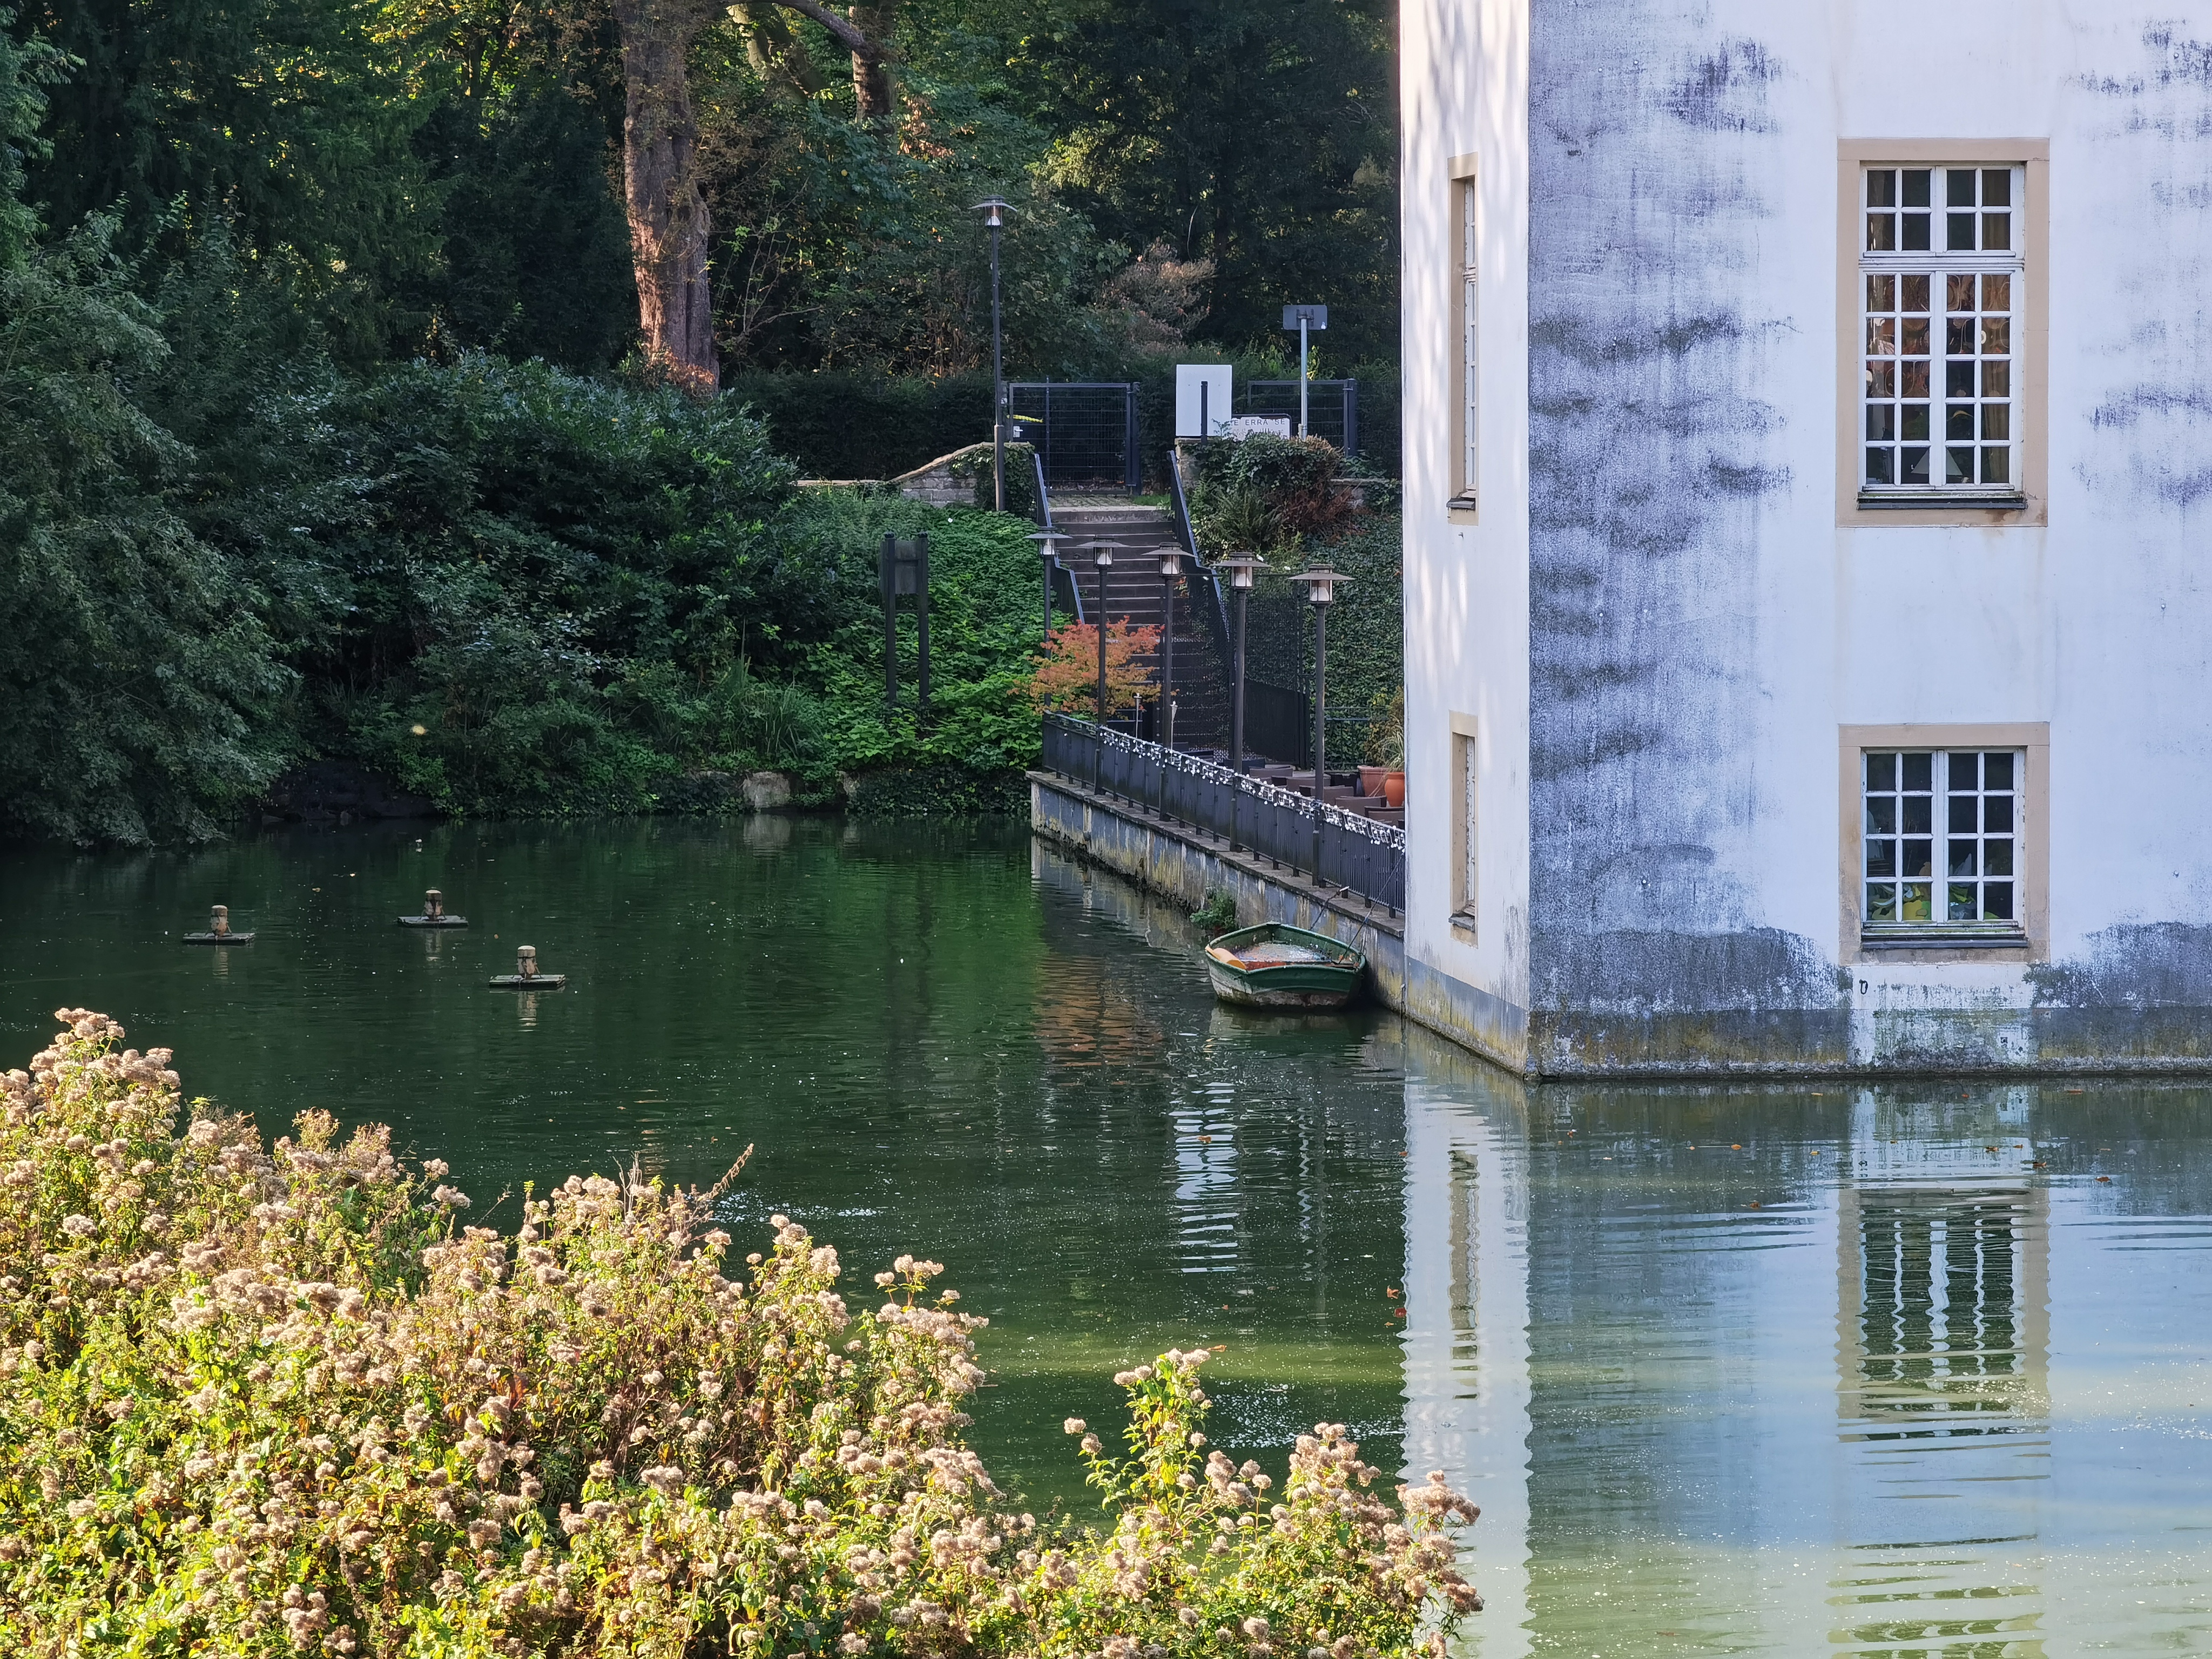
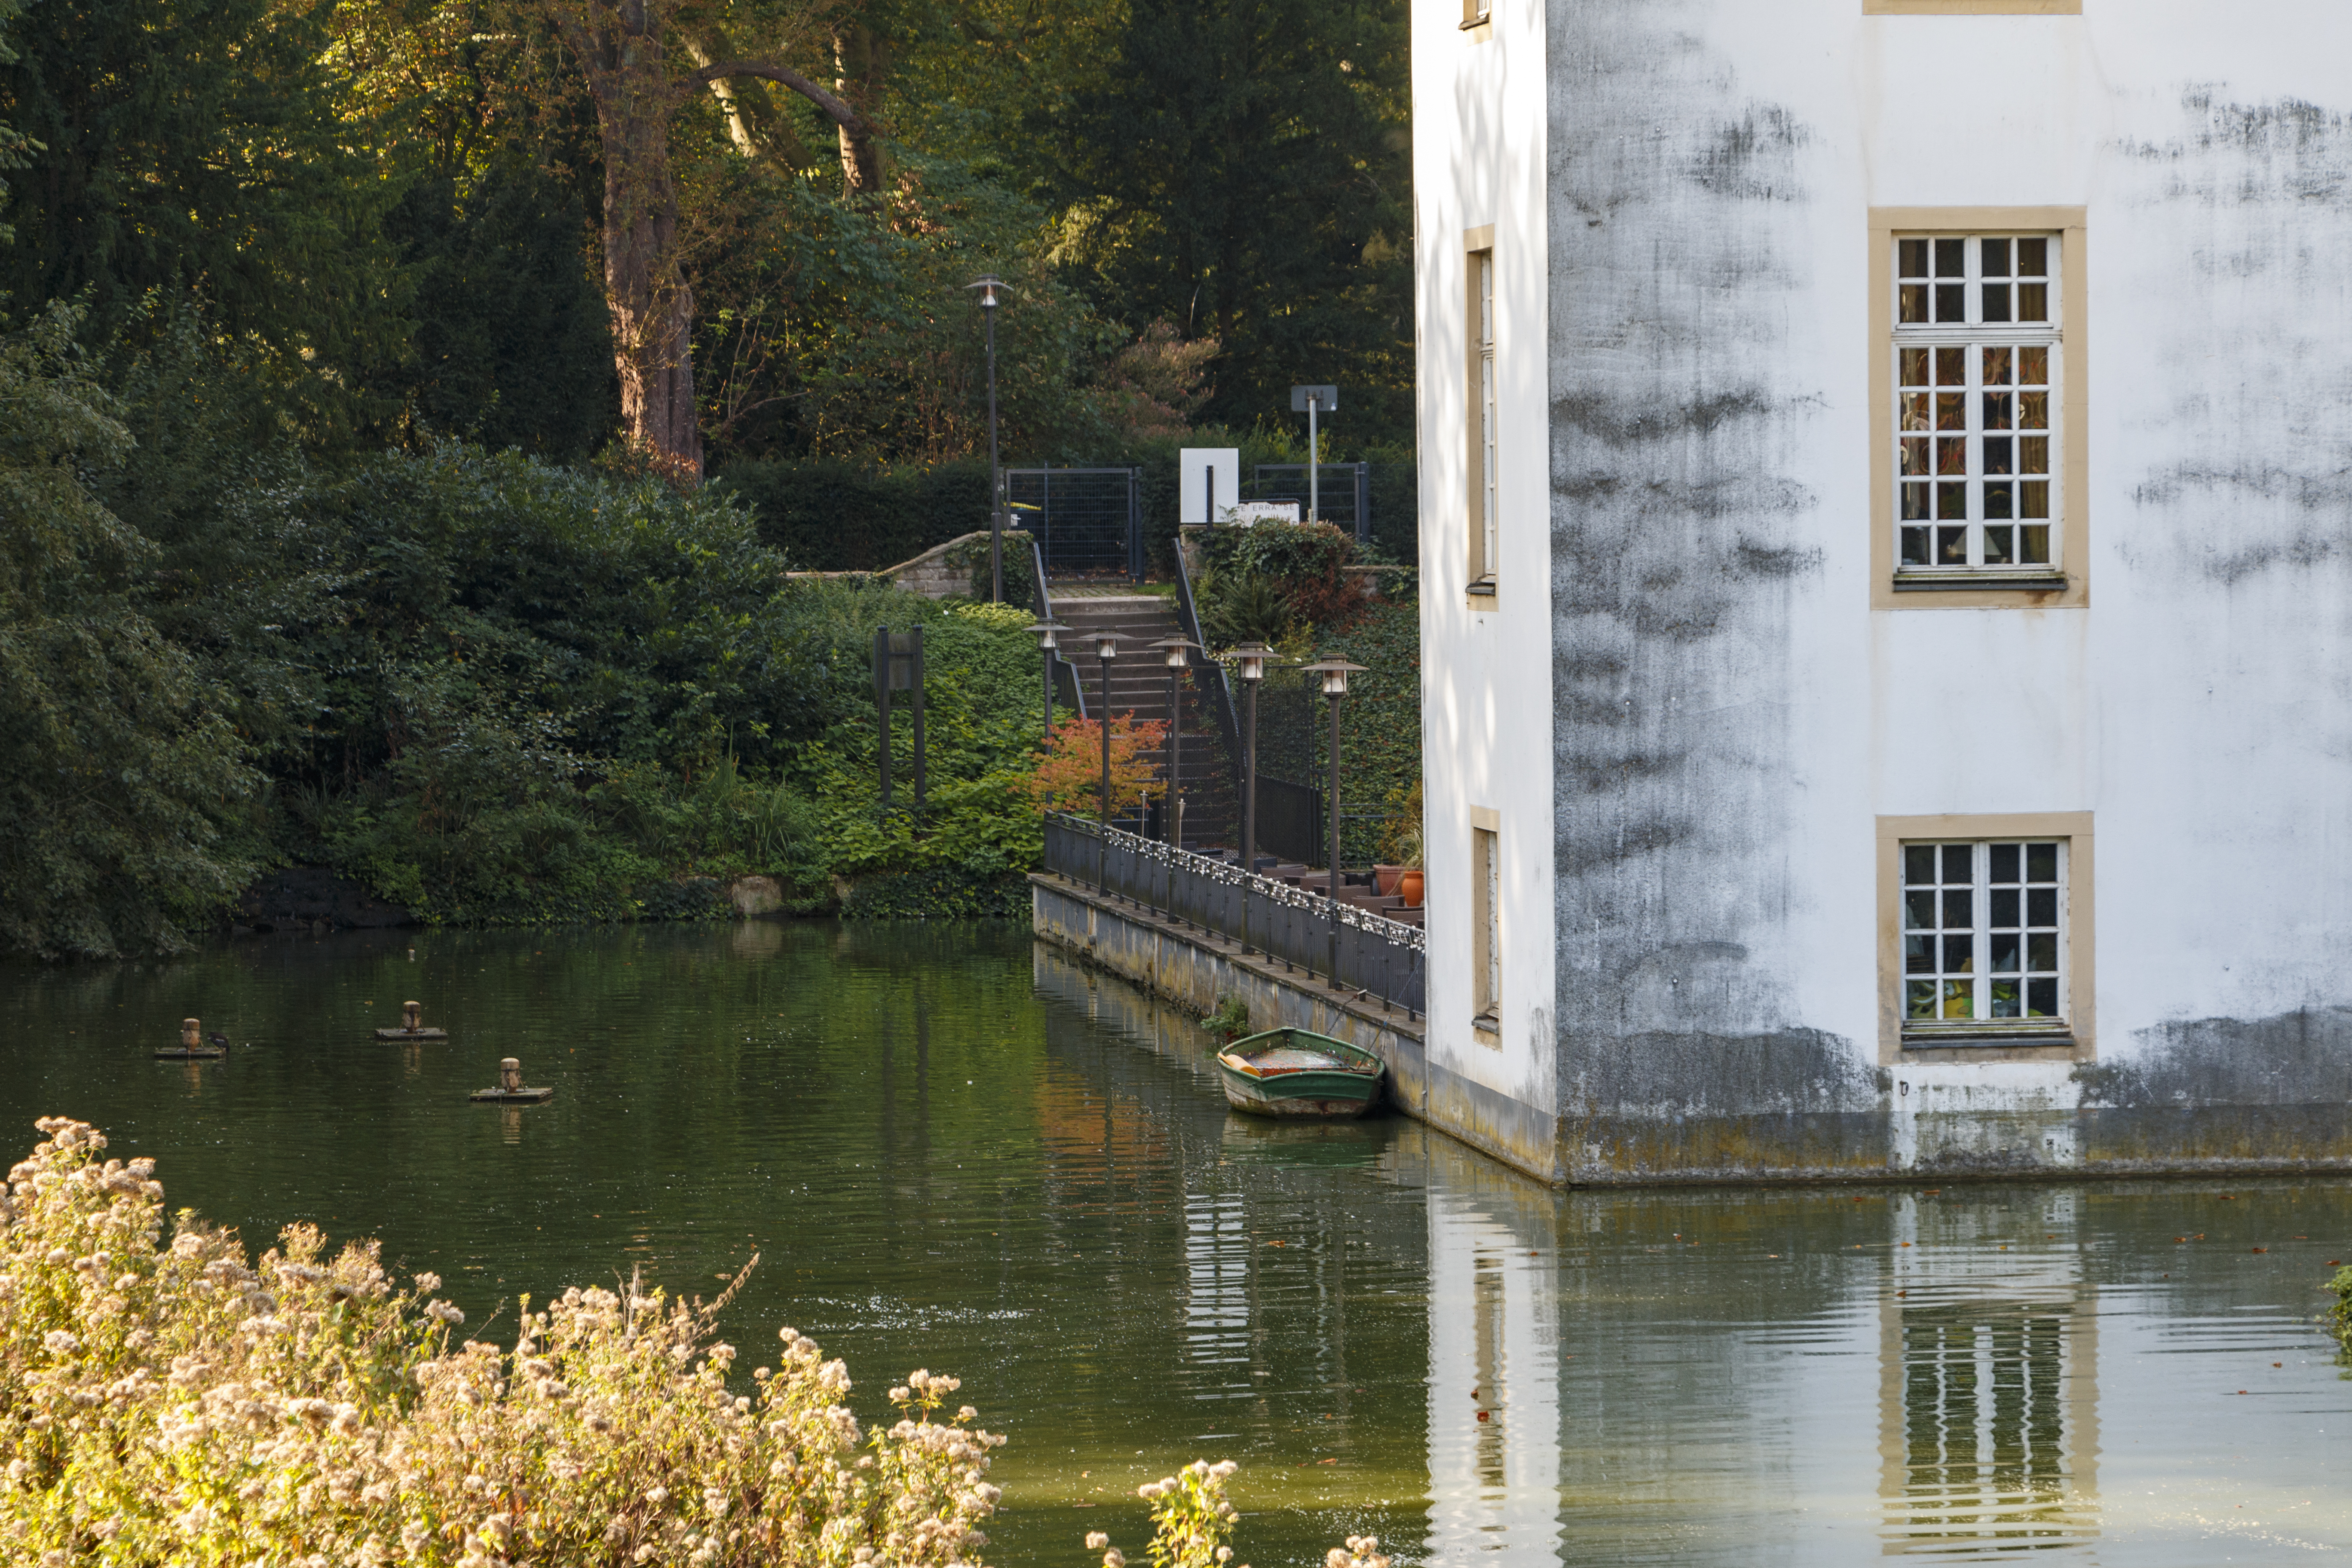
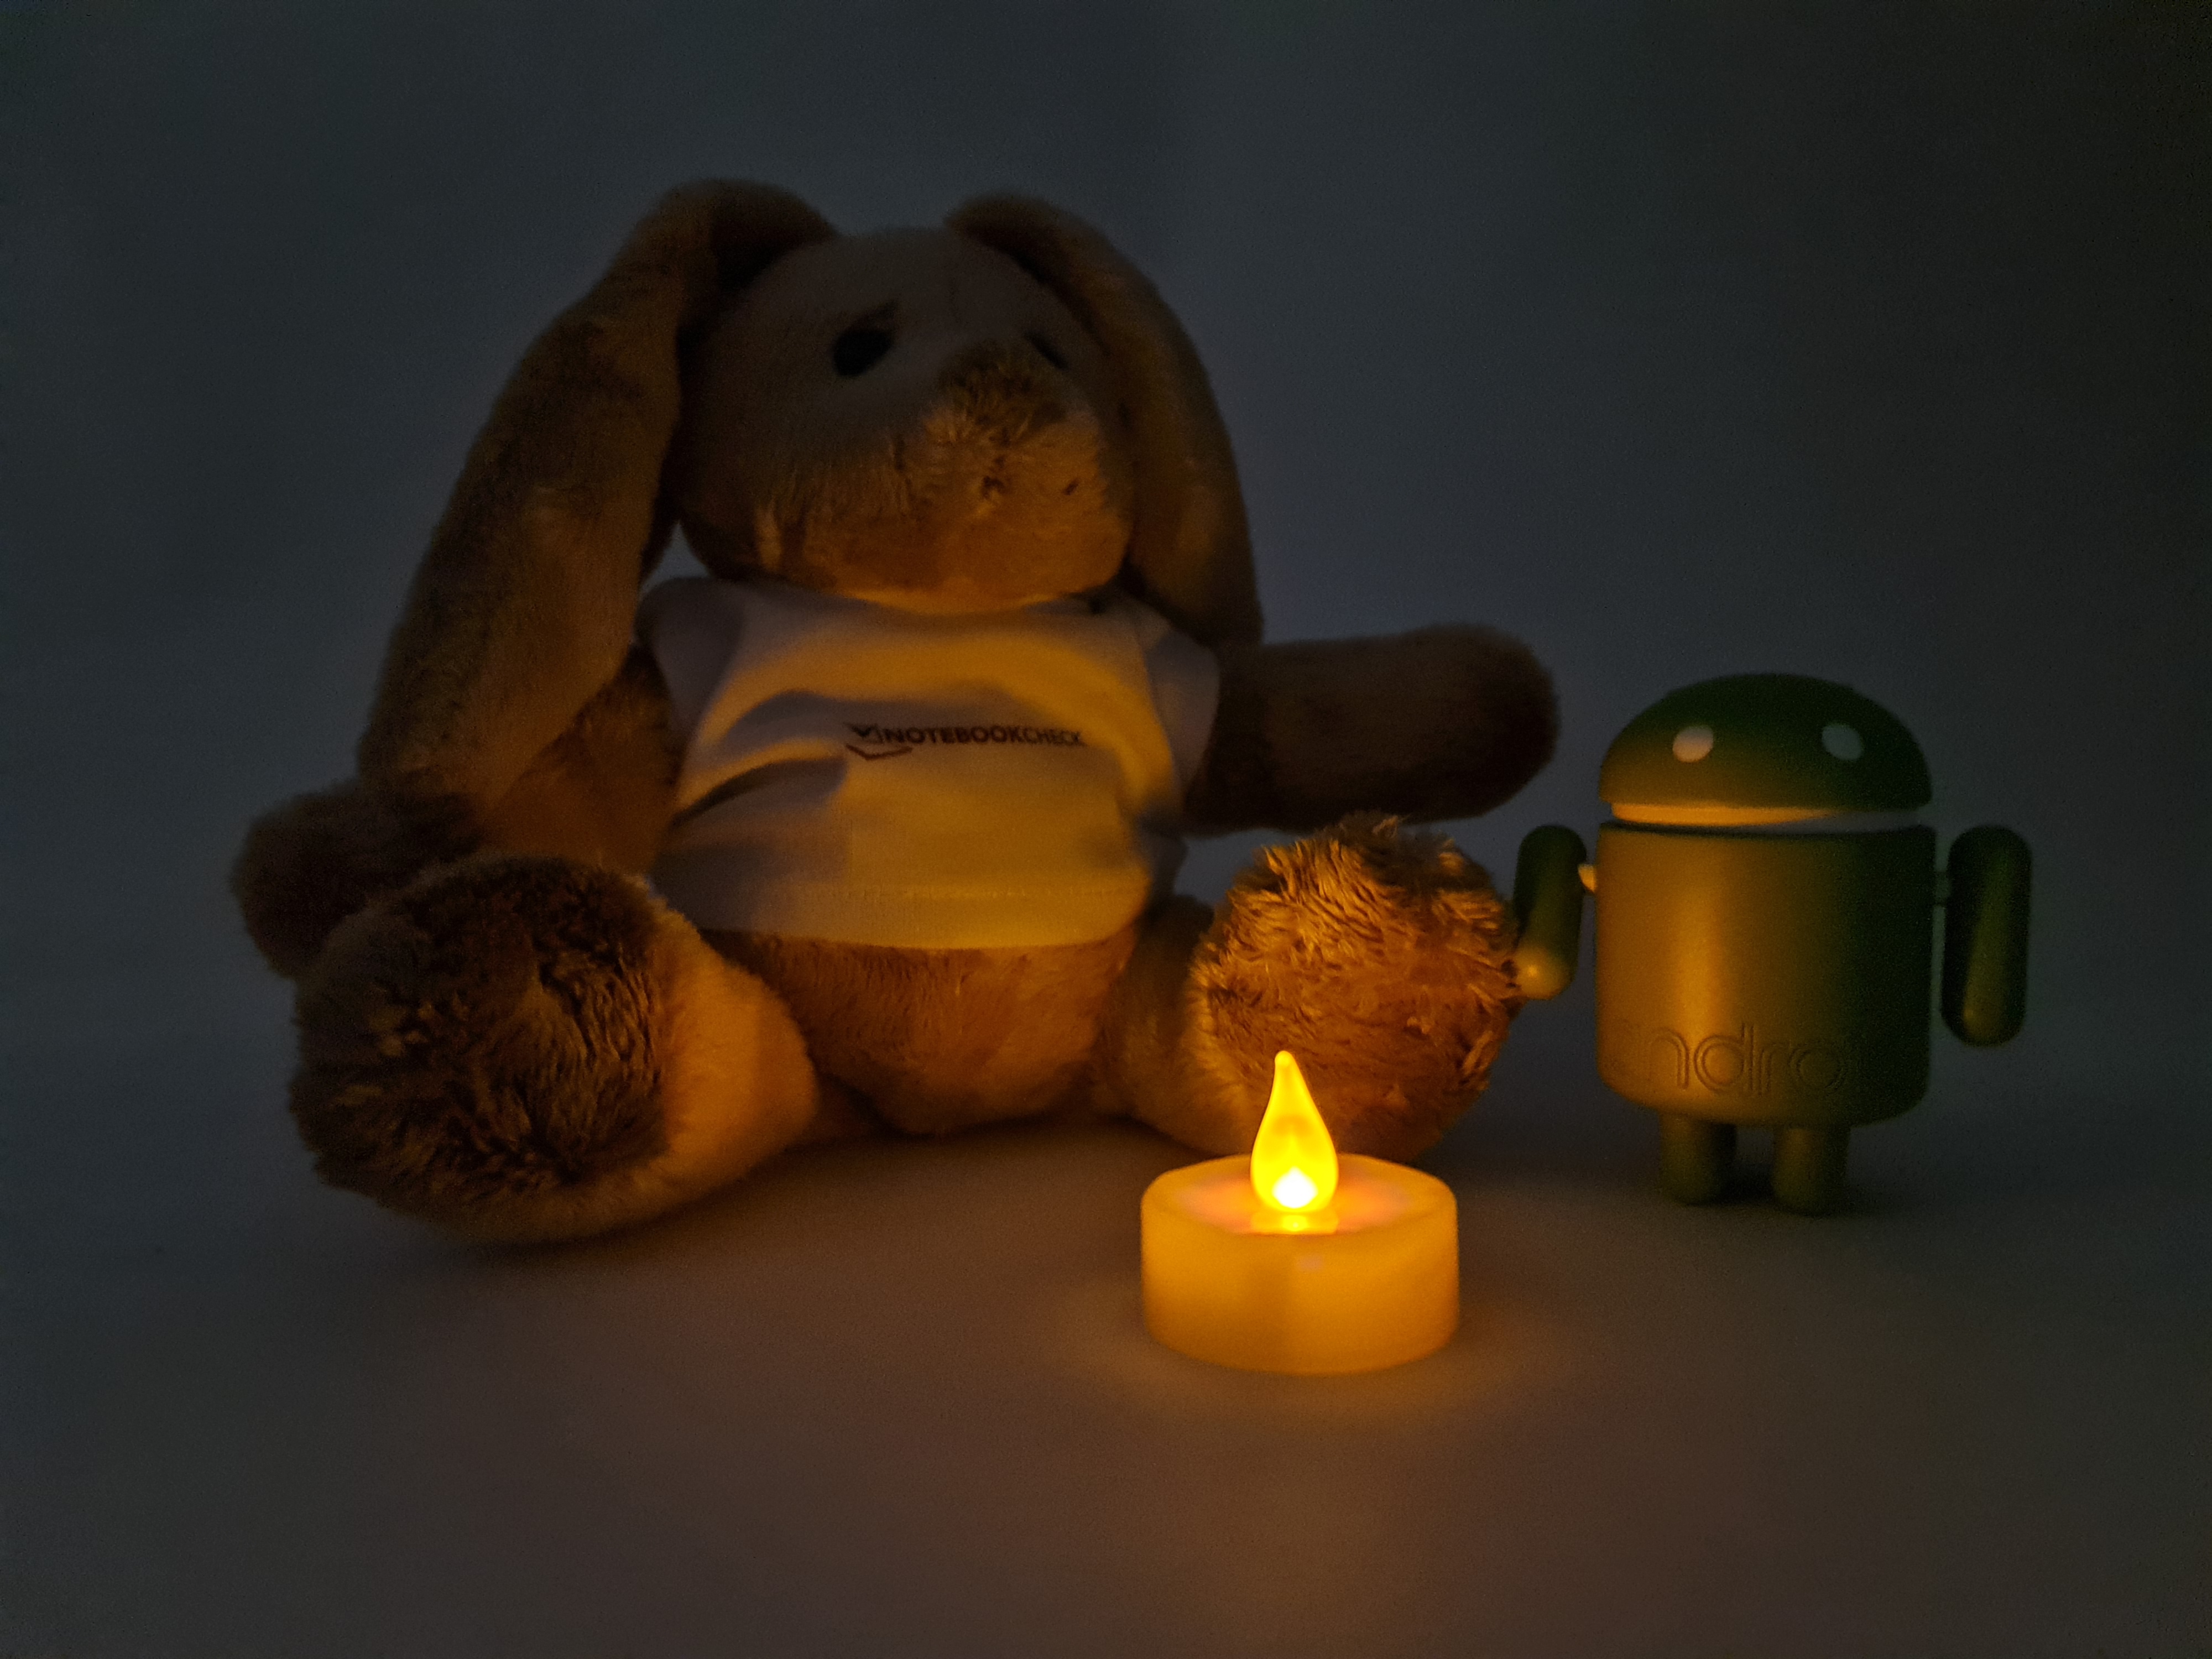
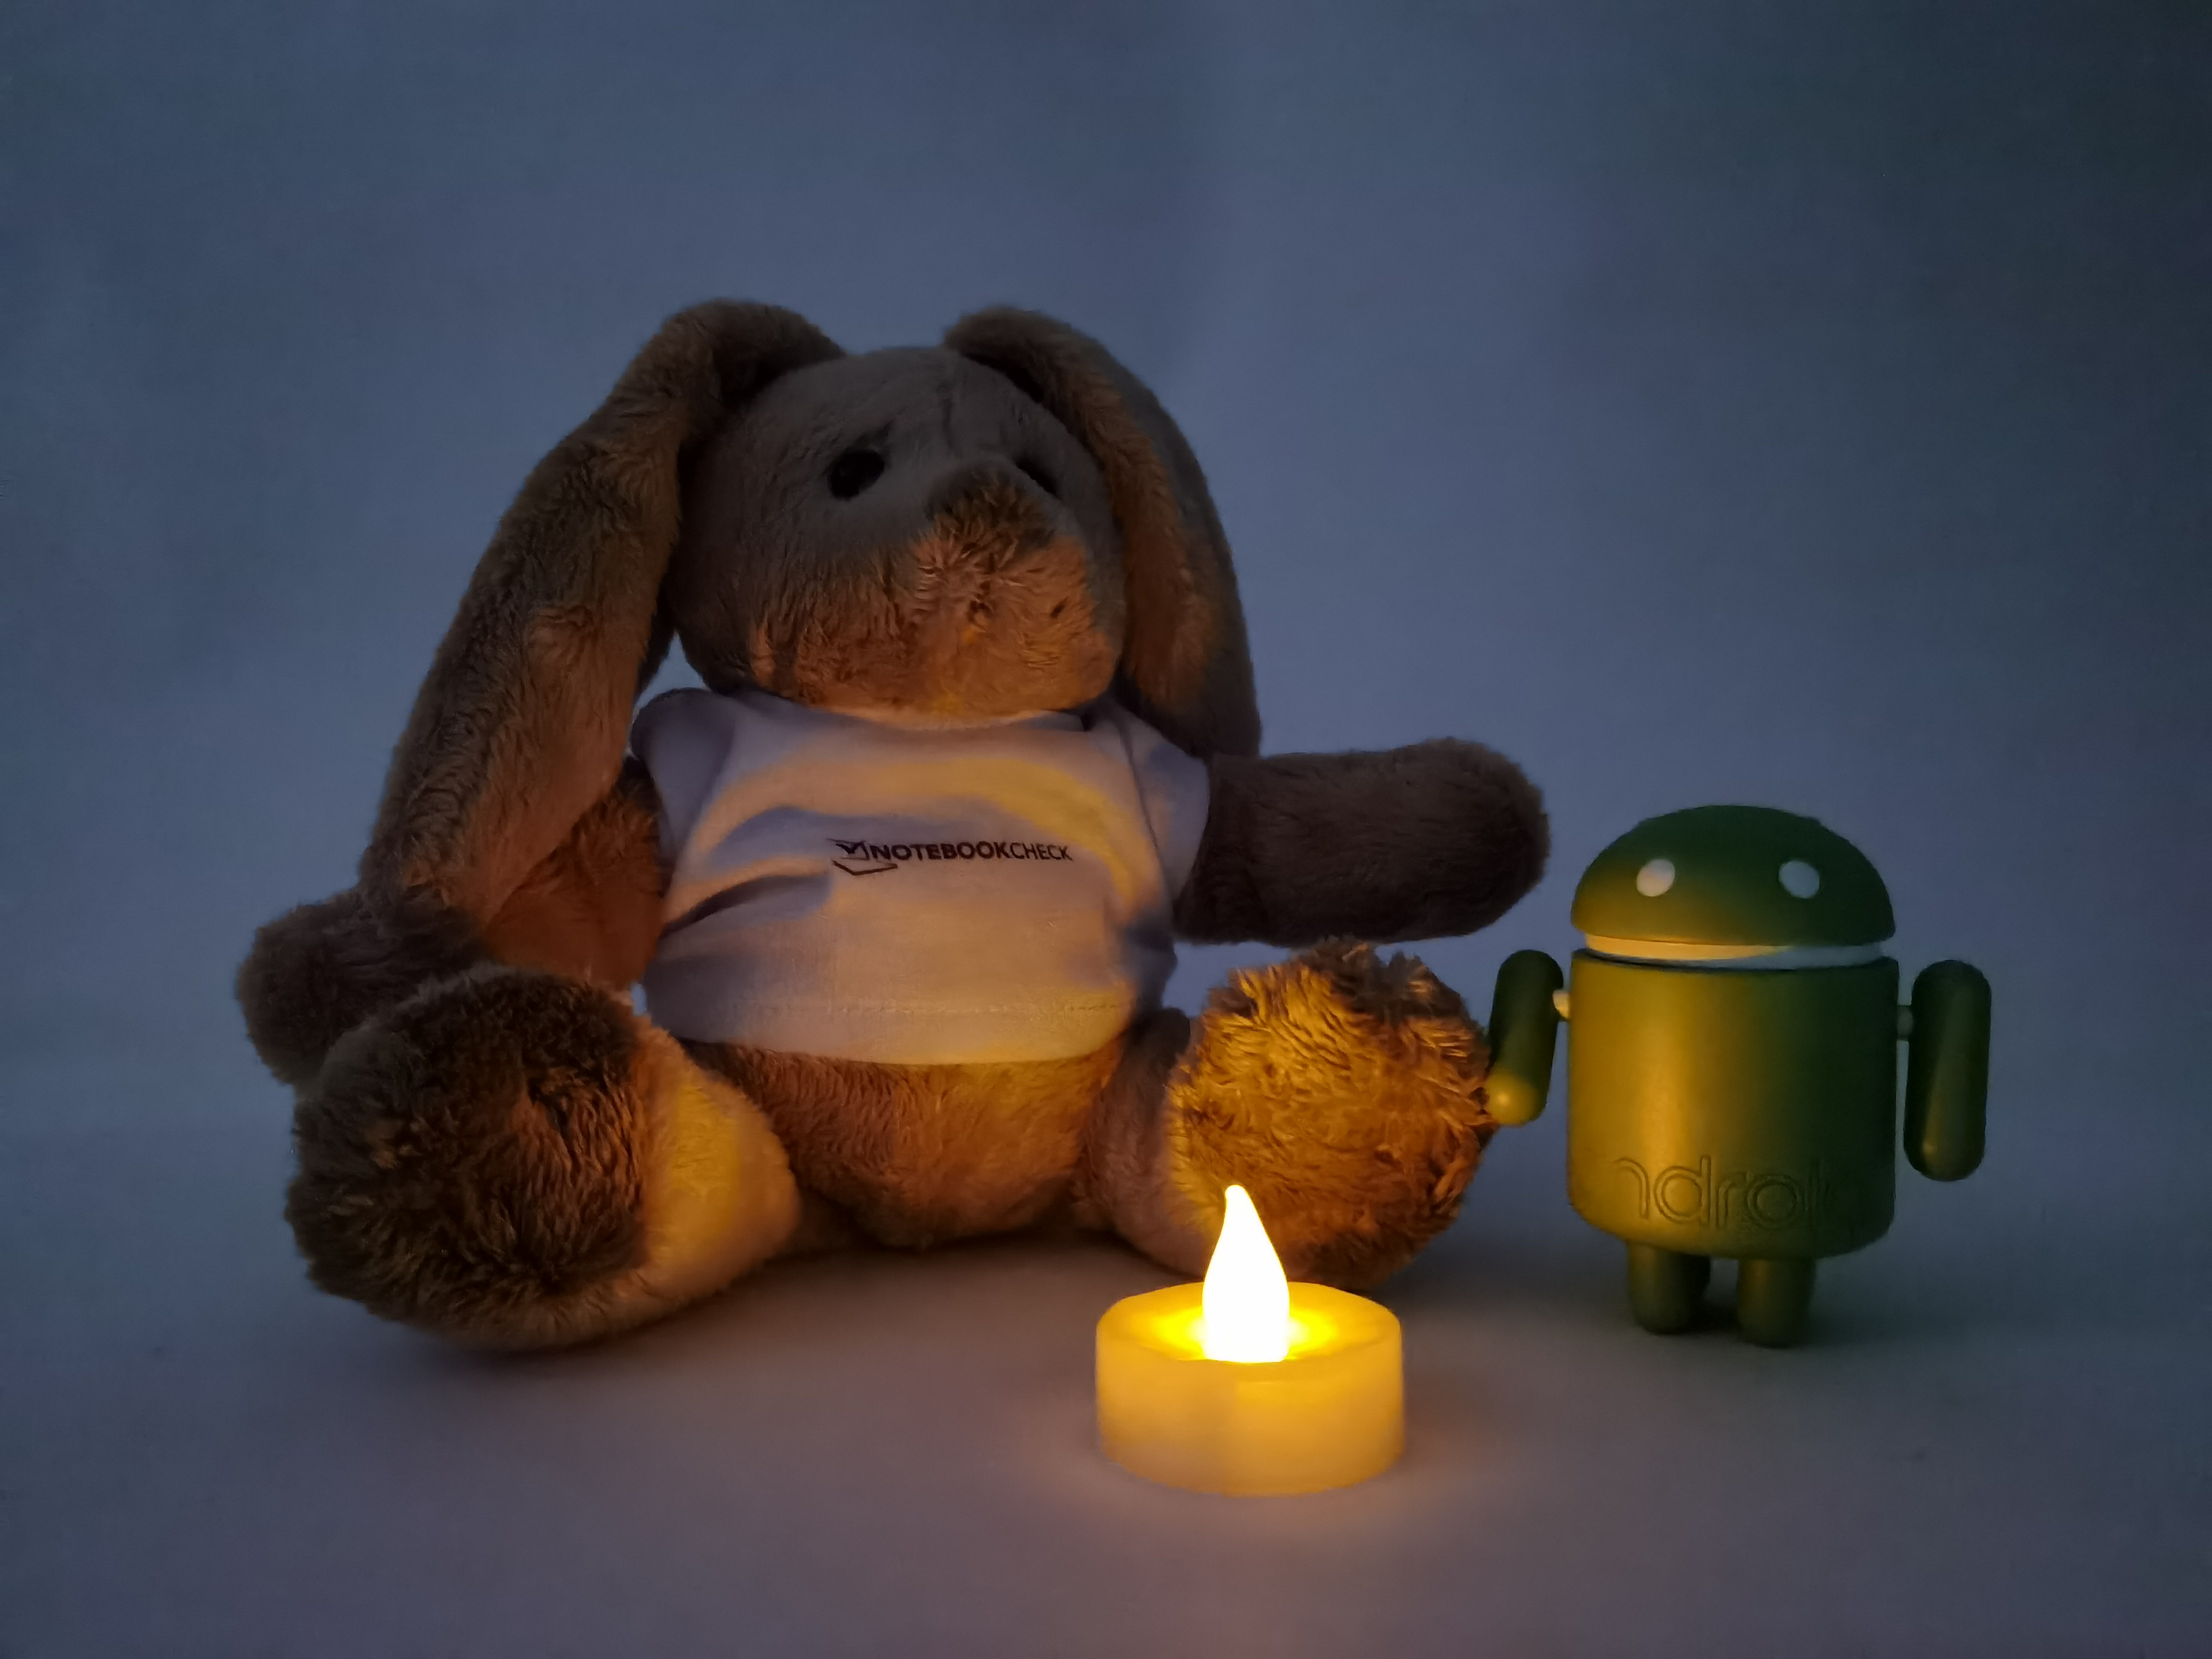
Välj en scen och navigera inom den första bilden. Ett klick ändrar positionen på pekskärmar. Ett klick på den inzoomade bilden öppnar originalet i ett nytt fönster. Den första bilden visar det skalade fotografiet av testanordningen.
Wide-angleWide-angleUltra Wide-angle5X zoomLow-light photography


, 256 GB UFS 3.1 Flash")
, 256 GB UFS 3.1 Flash")
, 256 GB UFS 3.1 Flash")
, 256 GB UFS 3.1 Flash")
| |||||||||||||||||||||||||
Distribution av ljusstyrkan: 98 %
Mitt på batteriet: 441 cd/m²
Kontrast: ∞:1 (Svärta: 0 cd/m²)
ΔE ColorChecker Calman: 2.4 | ∀{0.5-29.43 Ø4.71}
ΔE Greyscale Calman: 2.9 | ∀{0.09-98 Ø4.96}
99.8% sRGB (Calman 2D)
Gamma: 2.01
CCT: 6469 K
| Samsung Galaxy Tab S7 Plus Super AMOLED, 2800x1752, 12.4" | Apple iPad Pro 12.9 2020 IPS, 2732x2048, 12.9" | Huawei MatePad Pro 10.8 IPS, 2560x1600, 10.8" | Samsung Galaxy Tab S6 SM-T860 Super AMOLED, 2560x1600, 10.5" | |
|---|---|---|---|---|
| Screen | 31% | -10% | -5% | |
| Brightness middle (cd/m²) | 441 | 625 42% | 606 37% | 446 1% |
| Brightness (cd/m²) | 447 | 599 34% | 579 30% | 445 0% |
| Brightness Distribution (%) | 98 | 87 -11% | 89 -9% | 86 -12% |
| Black Level * (cd/m²) | 0.47 | 0.32 | ||
| Colorchecker dE 2000 * | 2.4 | 1.3 46% | 2.9 -21% | 2.7 -13% |
| Colorchecker dE 2000 max. * | 4.1 | 2.7 34% | 6 -46% | 5.4 -32% |
| Greyscale dE 2000 * | 2.9 | 1.8 38% | 4.3 -48% | 2.1 28% |
| Gamma | 2.01 109% | 2.23 99% | 2.22 99% | 2.05 107% |
| CCT | 6469 100% | 6765 96% | 7272 89% | 6468 100% |
| Contrast (:1) | 1330 | 1894 |
* ... mindre är bättre
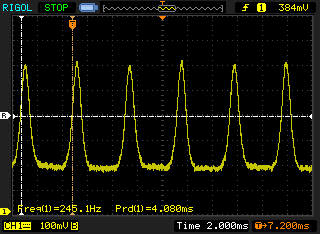
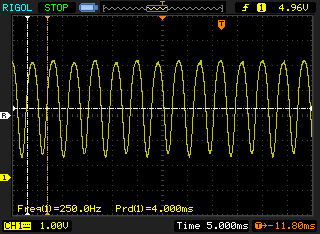
Skärmflimmer / PWM (Puls-Width Modulation)
| Skärmflimmer / PWM upptäckt | 245.1 Hz | ≤ 1 % ljusstyrka inställning | |
| ≤ 1.73 cd/m² ljusstyrka | |||
Displayens bakgrundsbelysning flimrar vid 245.1 Hz (i värsta fall, t.ex. med PWM) Flimrande upptäckt vid en ljusstyrkeinställning på 1 % (1.73 cd/m²) och lägre. Det ska inte finnas något flimmer eller PWM över denna ljusstyrkeinställning. Frekvensen för 245.1 Hz är relativt låg, så känsliga användare kommer sannolikt att märka flimmer och uppleva ansträngda ögon vid den angivna ljusstyrkeinställningen och nedan. Eftersom flimmer bara förekommer vid inställningar för mycket låg ljusstyrka, bör det inte vara ett problem i vanliga kontorsmiljöer. Ändå kan användning i svagt ljus vara ansträngande för ögonen. Som jämförelse: 52 % av alla testade enheter använder inte PWM för att dämpa skärmen. Om PWM upptäcktes mättes ett medelvärde av 7757 (minst: 5 - maximum: 343500) Hz. | |||
Visa svarstider
| ↔ Svarstid svart till vitt | ||
|---|---|---|
| 2.4 ms ... stiga ↗ och falla ↘ kombinerat | ↗ 1.2 ms stiga | 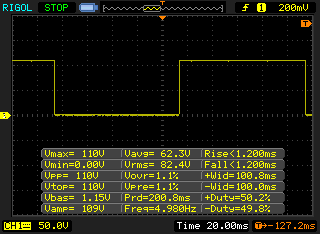 |
| ↘ 1.2 ms hösten | ||
| Skärmen visar väldigt snabba svarsfrekvenser i våra tester och borde vara mycket väl lämpad för fartfyllt spel. I jämförelse sträcker sig alla testade enheter från 0.1 (minst) till 240 (maximalt) ms. » 13 % av alla enheter är bättre. Det betyder att den uppmätta svarstiden är bättre än genomsnittet av alla testade enheter (19.8 ms). | ||
| ↔ Svarstid 50 % grått till 80 % grått | ||
| 3.2 ms ... stiga ↗ och falla ↘ kombinerat | ↗ 2 ms stiga | 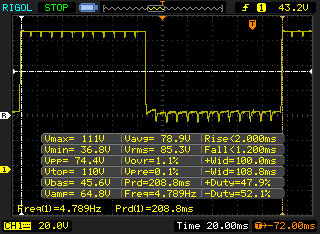 |
| ↘ 1.2 ms hösten | ||
| Skärmen visar väldigt snabba svarsfrekvenser i våra tester och borde vara mycket väl lämpad för fartfyllt spel. I jämförelse sträcker sig alla testade enheter från 0.165 (minst) till 636 (maximalt) ms. » 13 % av alla enheter är bättre. Det betyder att den uppmätta svarstiden är bättre än genomsnittet av alla testade enheter (31 ms). | ||
| Geekbench 4.4 | |
| 64 Bit Single-Core Score | |
| Genomsnitt av klass Tablet (4231 - 9867, n=8, senaste 2 åren) | |
| Genomsnitt Qualcomm Snapdragon 865+ (Plus) (n=1) | |
| Huawei MatePad Pro 10.8 | |
| 64 Bit Multi-Core Score | |
| Genomsnitt av klass Tablet (11144 - 28034, n=8, senaste 2 åren) | |
| Genomsnitt Qualcomm Snapdragon 865+ (Plus) (n=1) | |
| Huawei MatePad Pro 10.8 | |
| Compute RenderScript Score | |
| Genomsnitt av klass Tablet (8856 - 22243, n=5, senaste 2 åren) | |
| Genomsnitt Qualcomm Snapdragon 865+ (Plus) (n=1) | |
| Huawei MatePad Pro 10.8 | |
| PCMark for Android | |
| Work performance score | |
| Genomsnitt Qualcomm Snapdragon 865+ (Plus) (13629 - 19824, n=5) | |
| Samsung Galaxy Tab S7 Plus | |
| Samsung Galaxy Tab S6 SM-T860 | |
| Huawei MatePad Pro 10.8 | |
| Work 2.0 performance score | |
| Genomsnitt Qualcomm Snapdragon 865+ (Plus) (12355 - 14979, n=6) | |
| Samsung Galaxy Tab S7 Plus | |
| Samsung Galaxy Tab S6 SM-T860 | |
| Huawei MatePad Pro 10.8 | |
| GFXBench 3.1 | |
| on screen Manhattan ES 3.1 Onscreen | |
| Genomsnitt Qualcomm Snapdragon 865+ (Plus) (41 - 82, n=5) | |
| Genomsnitt av klass Tablet (9.2 - 160, n=57, senaste 2 åren) | |
| Samsung Galaxy Tab S7 Plus | |
| Samsung Galaxy Tab S6 SM-T860 | |
| Huawei MatePad Pro 10.8 | |
| 1920x1080 Manhattan ES 3.1 Offscreen | |
| Genomsnitt av klass Tablet (9.8 - 361, n=57, senaste 2 åren) | |
| Genomsnitt Qualcomm Snapdragon 865+ (Plus) (75 - 93, n=5) | |
| Samsung Galaxy Tab S7 Plus | |
| Samsung Galaxy Tab S6 SM-T860 | |
| Huawei MatePad Pro 10.8 | |
| AnTuTu v8 - Total Score | |
| Apple iPad Pro 12.9 2020 | |
| Genomsnitt Qualcomm Snapdragon 865+ (Plus) (490260 - 622888, n=4) | |
| Samsung Galaxy Tab S7 Plus | |
| Huawei MatePad Pro 10.8 | |
| Jetstream 2 - 2.0 Total | |
| Genomsnitt av klass Tablet (35.8 - 420, n=55, senaste 2 åren) | |
| Apple iPad Pro 12.9 2020 (Safari 13) | |
| Samsung Galaxy Tab S7 Plus (Samsung Browser 12.1) | |
| Genomsnitt Qualcomm Snapdragon 865+ (Plus) (69.8 - 75.5, n=4) | |
| Samsung Galaxy Tab S6 SM-T860 (Chrome 77.0.3865.116) | |
| Huawei MatePad Pro 10.8 (Huawei Browser V10.1.2) | |
| JetStream 1.1 - 1.1 Total | |
| Apple iPad Pro 12.9 2020 (Safari 13) | |
| Samsung Galaxy Tab S7 Plus (Samsung Browser 12.1) | |
| Genomsnitt Qualcomm Snapdragon 865+ (Plus) (121.7 - 131.5, n=4) | |
| Samsung Galaxy Tab S6 SM-T860 (Chrome 77.0.3865.116) | |
| Huawei MatePad Pro 10.8 (Huawei Browser V10.1.2) | |
| WebXPRT 3 - Overall | |
| Genomsnitt av klass Tablet (168 - 520, n=10, senaste 2 åren) | |
| Apple iPad Pro 12.9 2020 (Safari 13) | |
| Samsung Galaxy Tab S7 Plus (Samsung Browser 12.1) | |
| Genomsnitt Qualcomm Snapdragon 865+ (Plus) (114 - 126, n=4) | |
| Samsung Galaxy Tab S6 SM-T860 (Chrome 77.0.3865.116) | |
| Huawei MatePad Pro 10.8 (Huawei Browser V10.1.2) | |
| Speedometer 2.0 - Result 2.0 | |
| Genomsnitt av klass Tablet (6.8 - 790, n=33, senaste 2 åren) | |
| Apple iPad Pro 12.9 2020 (Safari 13) | |
| Samsung Galaxy Tab S7 Plus (Samsung Browser 12.1) | |
| Samsung Galaxy Tab S6 SM-T860 (Chrome 77.0.3865.116) | |
| Genomsnitt Qualcomm Snapdragon 865+ (Plus) (41.2 - 73.3, n=4) | |
| Huawei MatePad Pro 10.8 (Huawei Browser V10.1.2) | |
| Octane V2 - Total Score | |
| Genomsnitt av klass Tablet (1633 - 138481, n=71, senaste 2 åren) | |
| Apple iPad Pro 12.9 2020 (Safari 13) | |
| Samsung Galaxy Tab S7 Plus (Samsung Browser 12.1) | |
| Genomsnitt Qualcomm Snapdragon 865+ (Plus) (25953 - 27360, n=4) | |
| Samsung Galaxy Tab S6 SM-T860 (Chrome 77.0.3865.116) | |
| Huawei MatePad Pro 10.8 (Huawei Browser V10.1.2) | |
| Mozilla Kraken 1.1 - Total | |
| Huawei MatePad Pro 10.8 (Huawei Browser V10.1.2) | |
| Samsung Galaxy Tab S6 SM-T860 (Chrome 77.0.3865.116) | |
| Samsung Galaxy Tab S7 Plus (Samsung Browser 12.1) | |
| Genomsnitt Qualcomm Snapdragon 865+ (Plus) (1854 - 1947, n=4) | |
| Genomsnitt av klass Tablet (243 - 16233, n=65, senaste 2 åren) | |
| Apple iPad Pro 12.9 2020 (Safari 13) | |
* ... mindre är bättre
| Samsung Galaxy Tab S7 Plus | Huawei MatePad Pro 10.8 | Samsung Galaxy Tab S6 SM-T860 | Genomsnitt 256 GB UFS 3.1 Flash | Genomsnitt av klass Tablet | |
|---|---|---|---|---|---|
| AndroBench 3-5 | -2% | -20% | 22% | 58% | |
| Sequential Read 256KB (MB/s) | 1675 | 1789 7% | 1416 -15% | 1771 ? 6% | 2073 ? 24% |
| Sequential Write 256KB (MB/s) | 732 | 399 -45% | 522 -29% | 1233 ? 68% | 1667 ? 128% |
| Random Read 4KB (MB/s) | 230.1 | 224.6 -2% | 191.6 -17% | 289 ? 26% | 275 ? 20% |
| Random Write 4KB (MB/s) | 205 | 262.4 28% | 170.2 -17% | 321 ? 57% | 324 ? 58% |
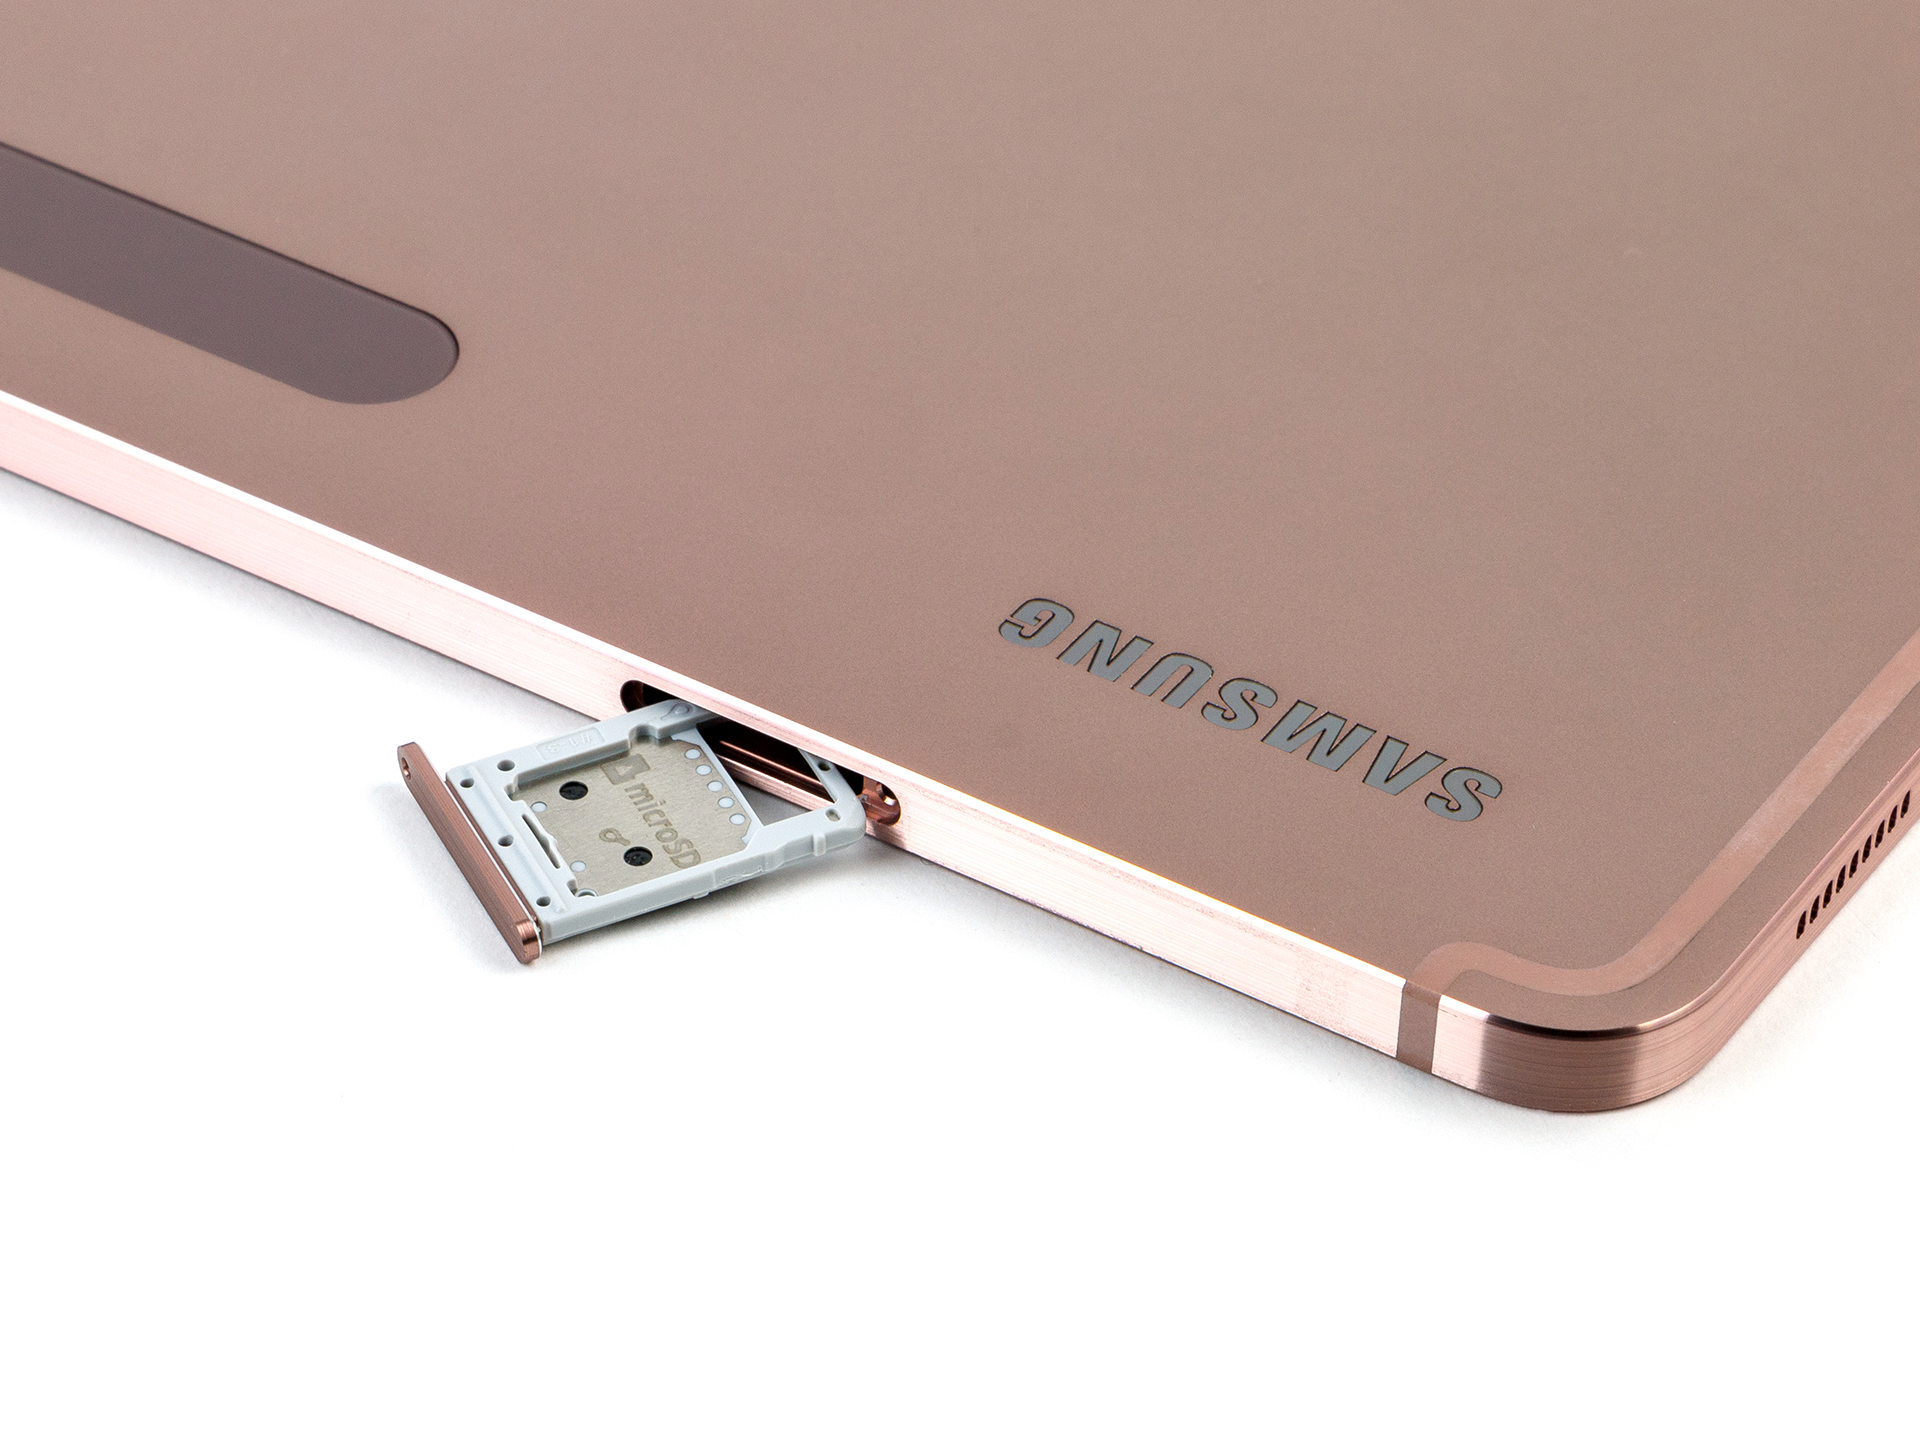
| Sequential Read 256KB SDCard (MB/s) | 85.8 ? | 82.4 ? -4% | 70.5 ? -18% | 75.9 ? -12% | |
| Sequential Write 256KB SDCard (MB/s) | 69.3 ? | 71.7 ? 3% | 54.5 ? -21% | 61.9 ? -11% |
PUBG Compare
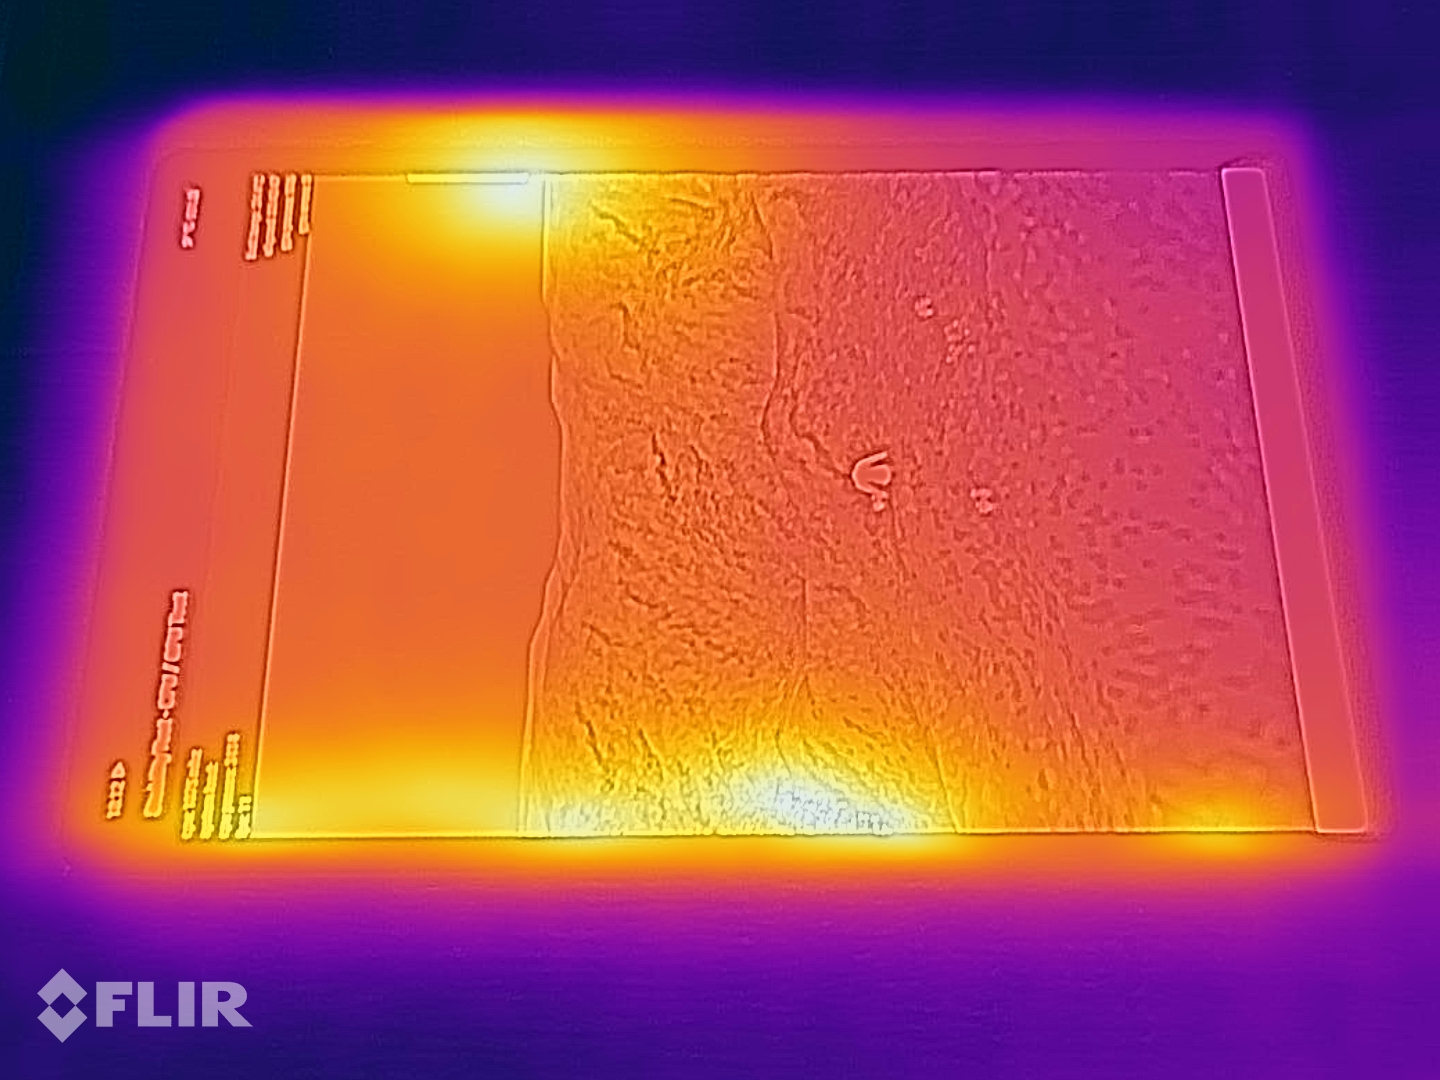
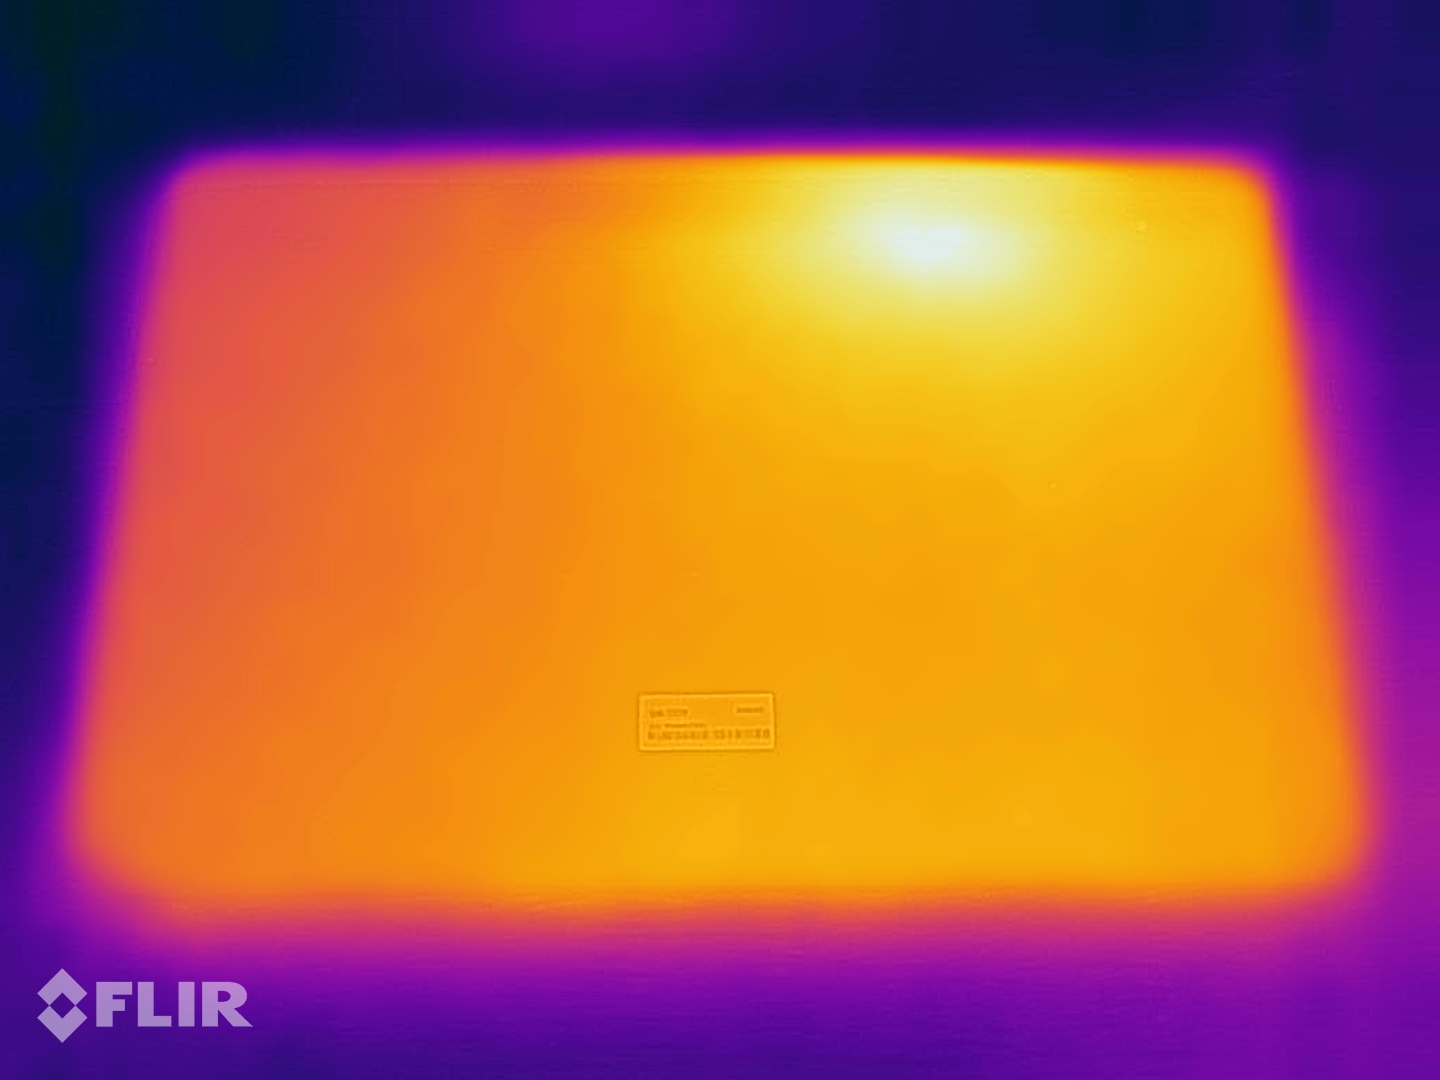
(+) Den maximala temperaturen på ovansidan är 32.3 °C / 90 F, jämfört med genomsnittet av 33.7 °C / 93 F , allt från 20.7 till 53.2 °C för klassen Tablet.
(+) Botten värms upp till maximalt 28 °C / 82 F, jämfört med genomsnittet av 33.2 °C / 92 F
(+) Vid tomgångsbruk är medeltemperaturen för ovansidan 24 °C / 75 F, jämfört med enhetsgenomsnittet på 30 °C / ### class_avg_f### F.
Samsung Galaxy Tab S7 Plus ljudanalys
(+) | högtalare kan spela relativt högt (87.2 dB)
Bas 100 - 315 Hz
(±) | reducerad bas - i genomsnitt 12.9% lägre än medianen
(±) | linjäriteten för basen är genomsnittlig (10.3% delta till föregående frekvens)
Mellan 400 - 2000 Hz
(+) | balanserad mellan - endast 3.8% från medianen
(+) | mids är linjära (2.7% delta till föregående frekvens)
Högsta 2 - 16 kHz
(+) | balanserade toppar - endast 2.9% från medianen
(+) | toppar är linjära (5.5% delta till föregående frekvens)
Totalt 100 - 16 000 Hz
(+) | det totala ljudet är linjärt (10.9% skillnad mot median)
Jämfört med samma klass
» 11% av alla testade enheter i den här klassen var bättre, 3% liknande, 87% sämre
» Den bästa hade ett delta på 7%, genomsnittet var 20%, sämst var 129%
Jämfört med alla testade enheter
» 6% av alla testade enheter var bättre, 2% liknande, 92% sämre
» Den bästa hade ett delta på 4%, genomsnittet var 23%, sämst var 134%
Apple iPad Pro 12.9 2020 ljudanalys
(±) | högtalarljudstyrkan är genomsnittlig men bra (81 dB)
Bas 100 - 315 Hz
(±) | reducerad bas - i genomsnitt 6.6% lägre än medianen
(±) | linjäriteten för basen är genomsnittlig (10.6% delta till föregående frekvens)
Mellan 400 - 2000 Hz
(+) | balanserad mellan - endast 4.2% från medianen
(+) | mids är linjära (4.6% delta till föregående frekvens)
Högsta 2 - 16 kHz
(+) | balanserade toppar - endast 4.1% från medianen
(+) | toppar är linjära (5.5% delta till föregående frekvens)
Totalt 100 - 16 000 Hz
(+) | det totala ljudet är linjärt (11.2% skillnad mot median)
Jämfört med samma klass
» 11% av alla testade enheter i den här klassen var bättre, 4% liknande, 85% sämre
» Den bästa hade ett delta på 7%, genomsnittet var 20%, sämst var 129%
Jämfört med alla testade enheter
» 7% av alla testade enheter var bättre, 2% liknande, 91% sämre
» Den bästa hade ett delta på 4%, genomsnittet var 23%, sämst var 134%
| Av/Standby | |
| Låg belastning | |
| Hög belastning |
|
Förklaring:
min: | |
| Samsung Galaxy Tab S7 Plus 10090 mAh | Apple iPad Pro 12.9 2020 9720 mAh | Huawei MatePad Pro 10.8 7250 mAh | Samsung Galaxy Tab S6 SM-T860 7040 mAh | |
|---|---|---|---|---|
| Power Consumption | -77% | -17% | 12% | |
| Idle Minimum * (Watt) | 2.41 | 1.22 49% | 1.98 18% | 1.96 19% |
| Idle Average * (Watt) | 3.4 | 8.68 -155% | 5.66 -66% | 2.8 18% |
| Idle Maximum * (Watt) | 3.43 | 8.75 -155% | 5.69 -66% | 2.82 18% |
| Load Average * (Watt) | 6.63 | 11.72 -77% | 6.96 -5% | 5.31 20% |
| Load Maximum * (Watt) | 10.29 | 15.25 -48% | 6.98 32% | 11.91 -16% |
* ... mindre är bättre
| Samsung Galaxy Tab S7 Plus 10090 mAh | Apple iPad Pro 12.9 2020 9720 mAh | Huawei MatePad Pro 10.8 7250 mAh | Samsung Galaxy Tab S6 SM-T860 7040 mAh | |
|---|---|---|---|---|
| Batteridrifttid | 46% | 58% | 28% | |
| Reader / Idle (h) | 15 | 30.5 103% | 31.3 109% | 21.3 42% |
| H.264 (h) | 10.3 | 12.3 19% | 15.2 48% | 14.5 41% |
| WiFi v1.3 (h) | 7.1 | 15.1 113% | 14.9 110% | 9.3 31% |
| Load (h) | 5.9 | 2.8 -53% | 3.9 -34% | 5.7 -3% |
För
Emot
Omdöme - En kraftfull surfplatta, men inte den bästa

Läs den fullständiga versionen av den här recensionen på engelska här.
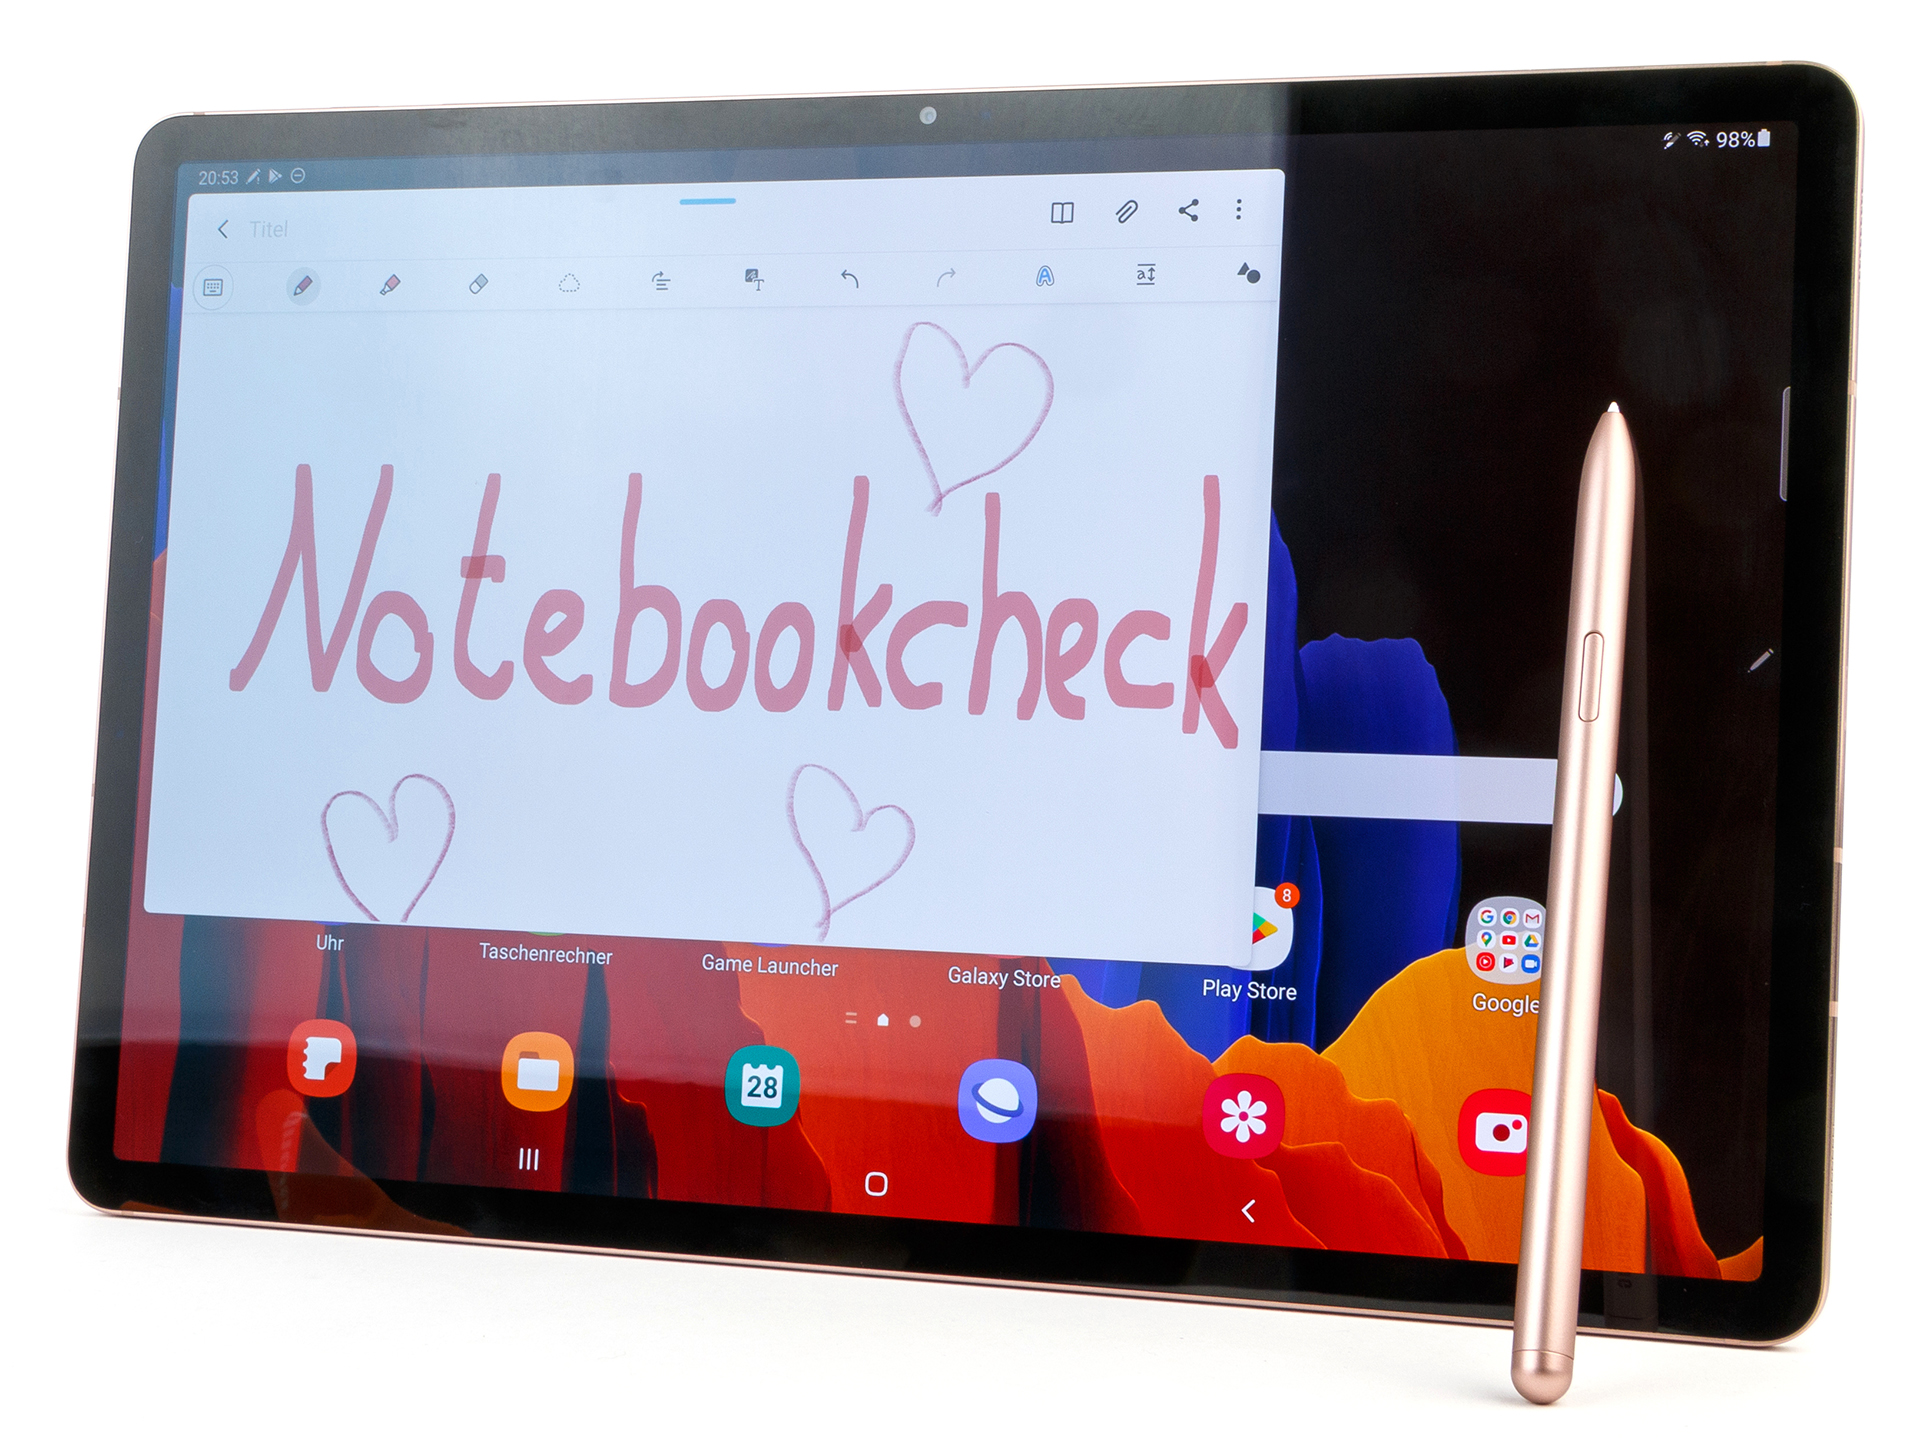
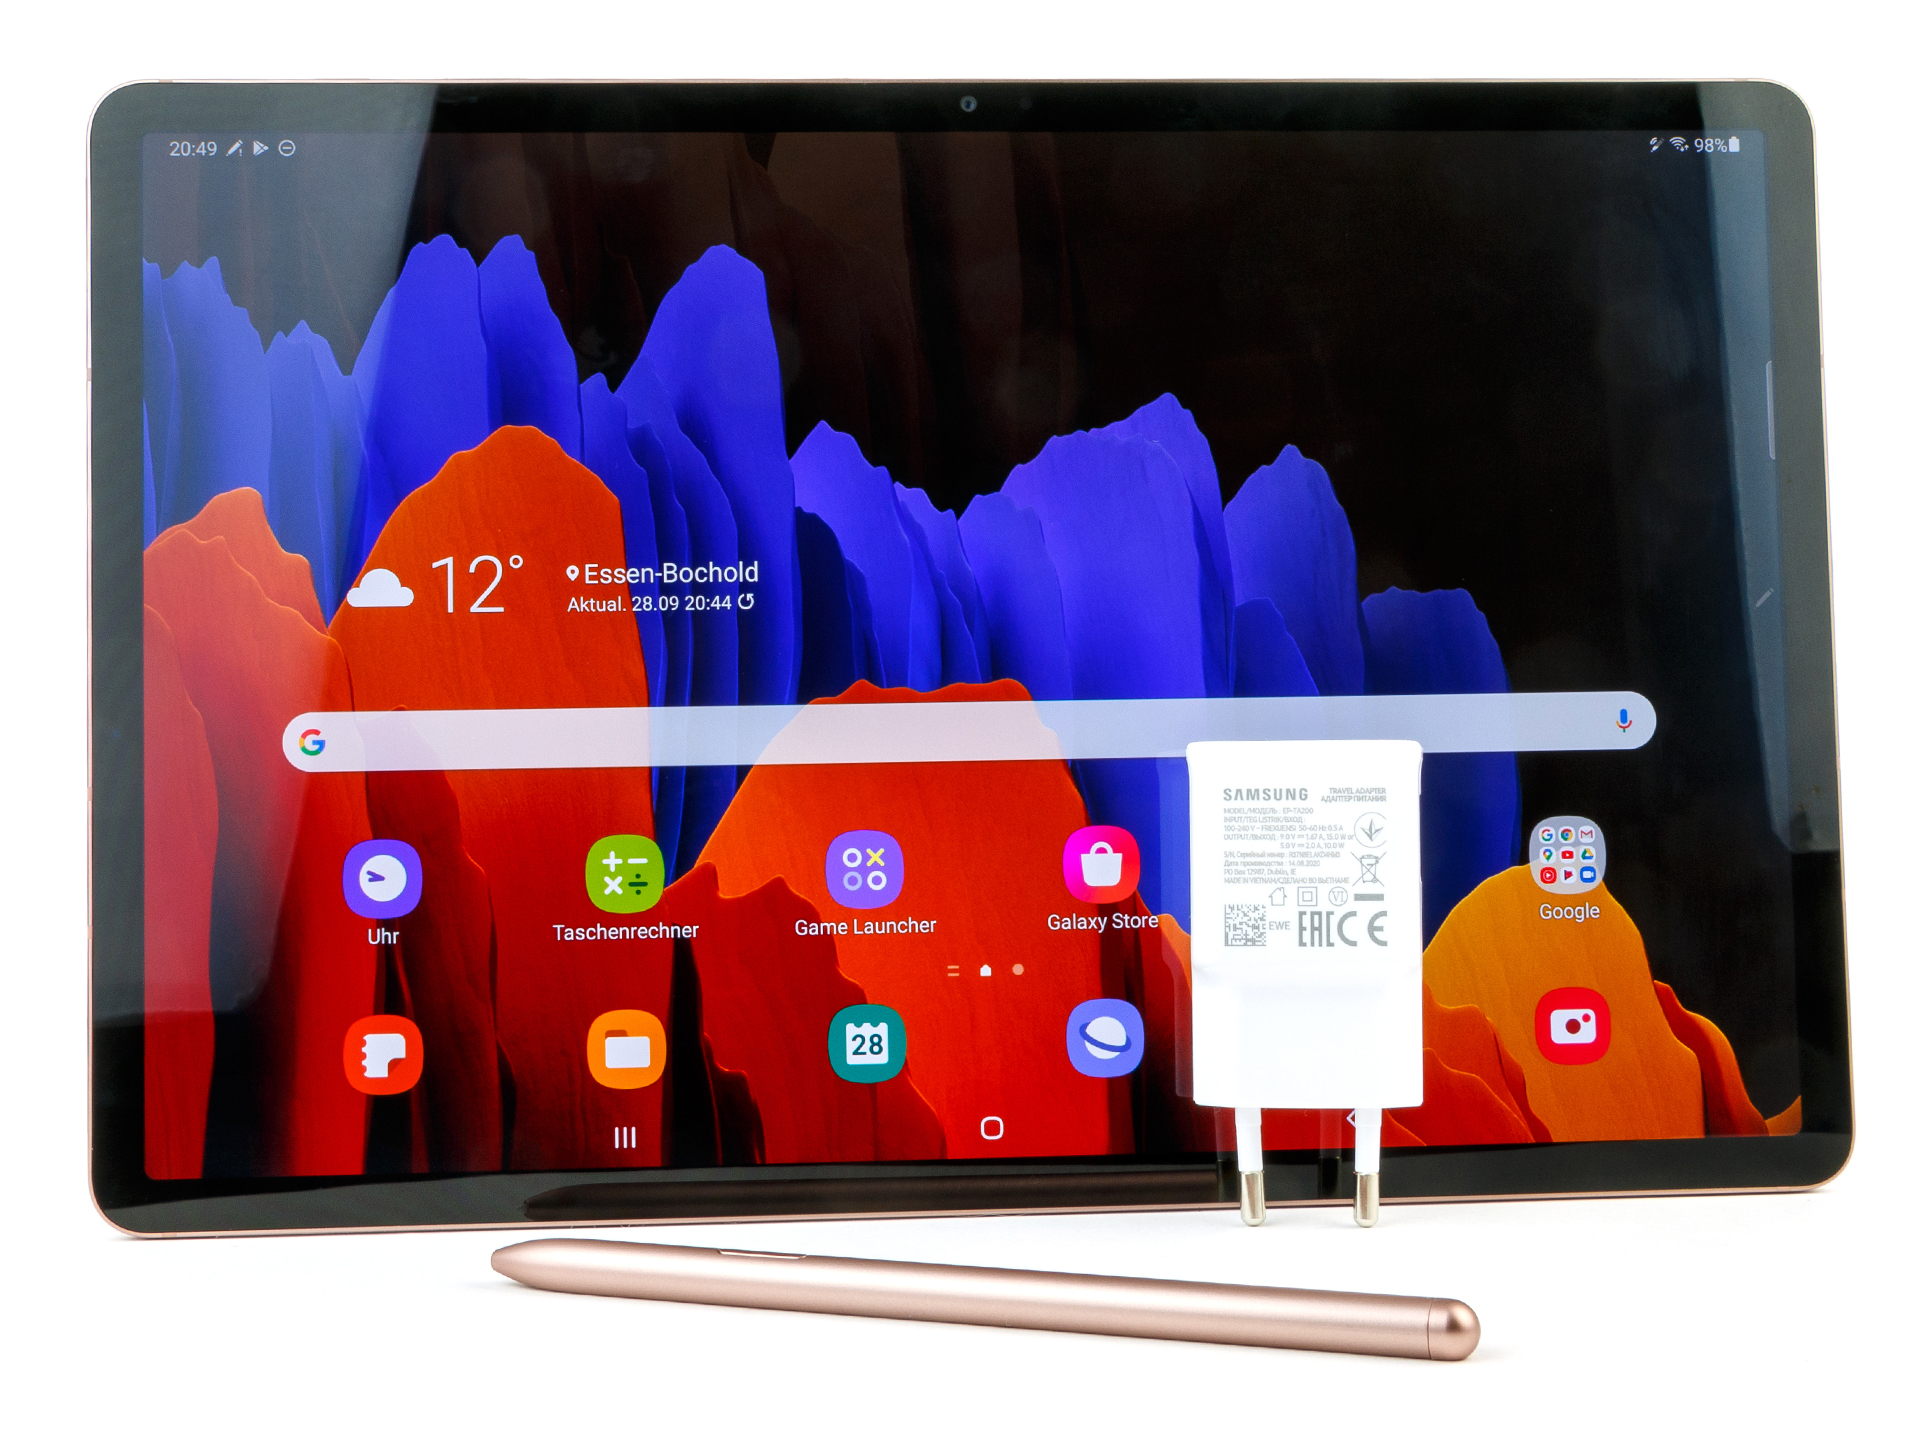
Samsung Galaxy Tab S7+ är för tillfället den största lyxsurfplattan från Android-sidan. Den har en Super AMOLED-skärm på 12.4 tum med utmärkt färgåtergivning. Skärmen är däremot inte tillräckligt ljusstark för användning utomhus. Det är synd att Samsung inte lyckats implementera sin Dynamic AMOLED-teknik här.
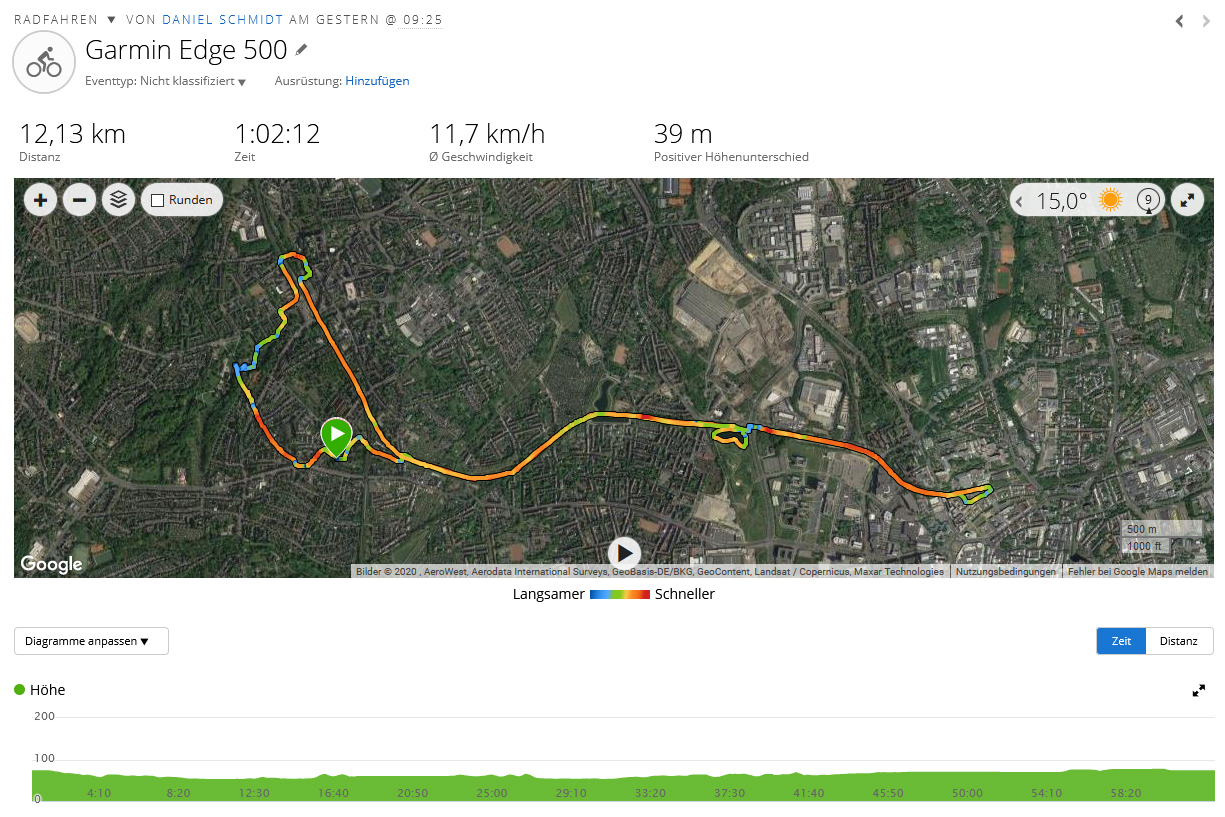
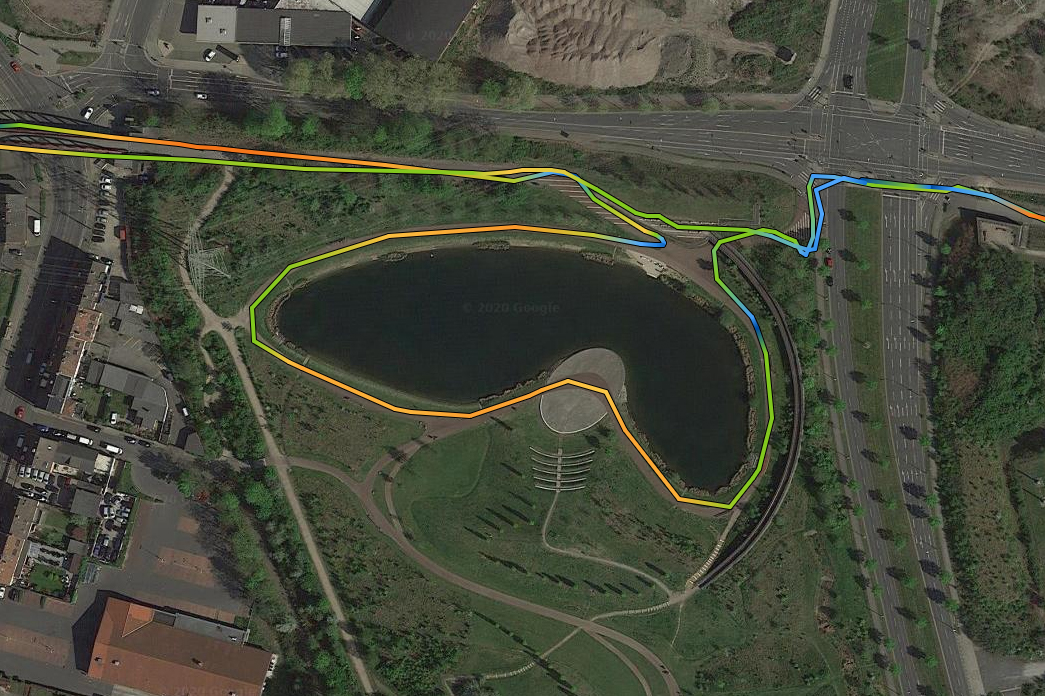
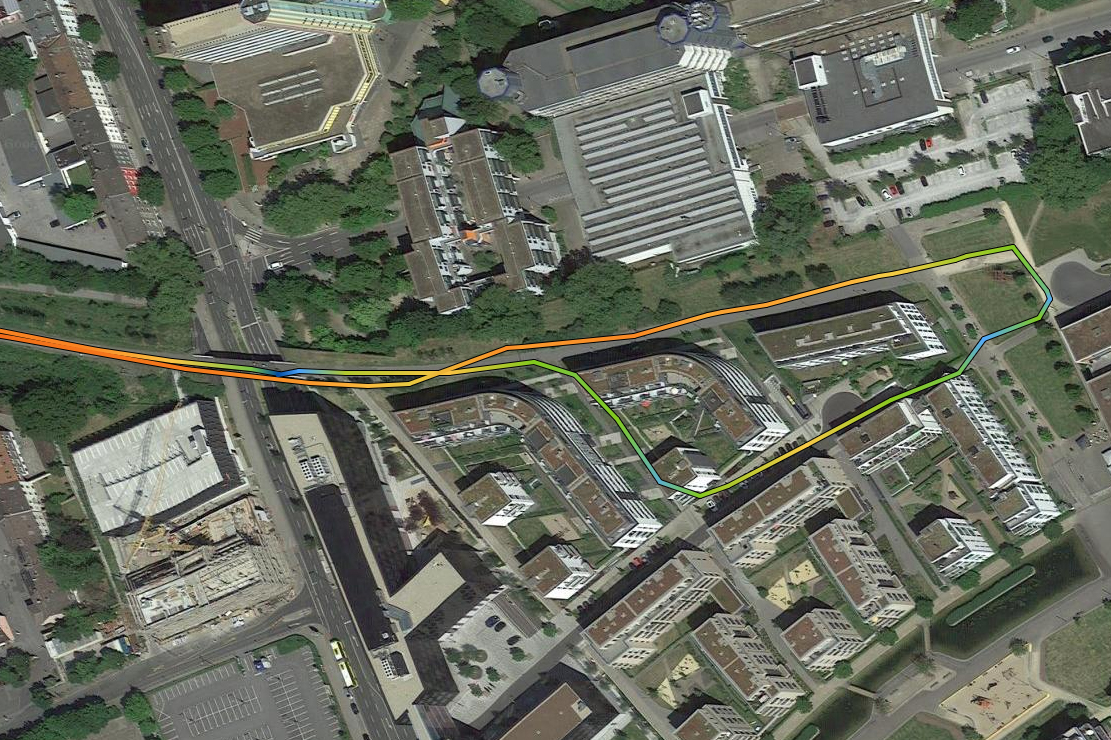
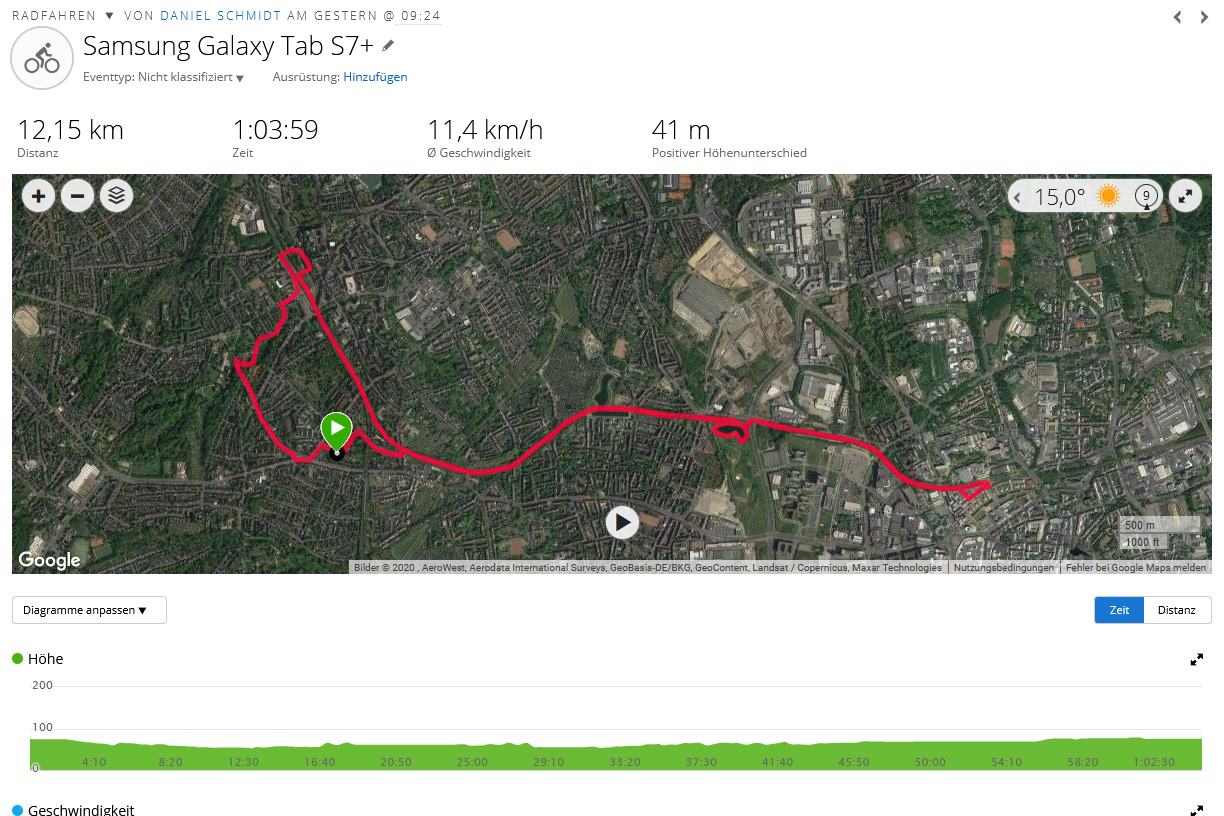
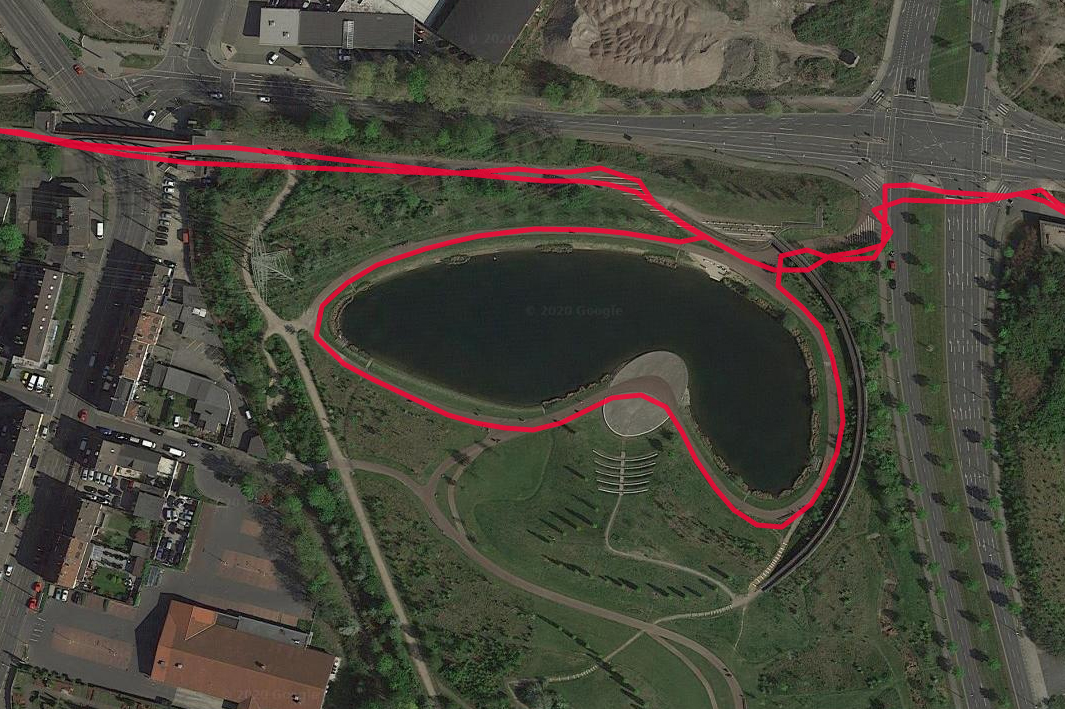
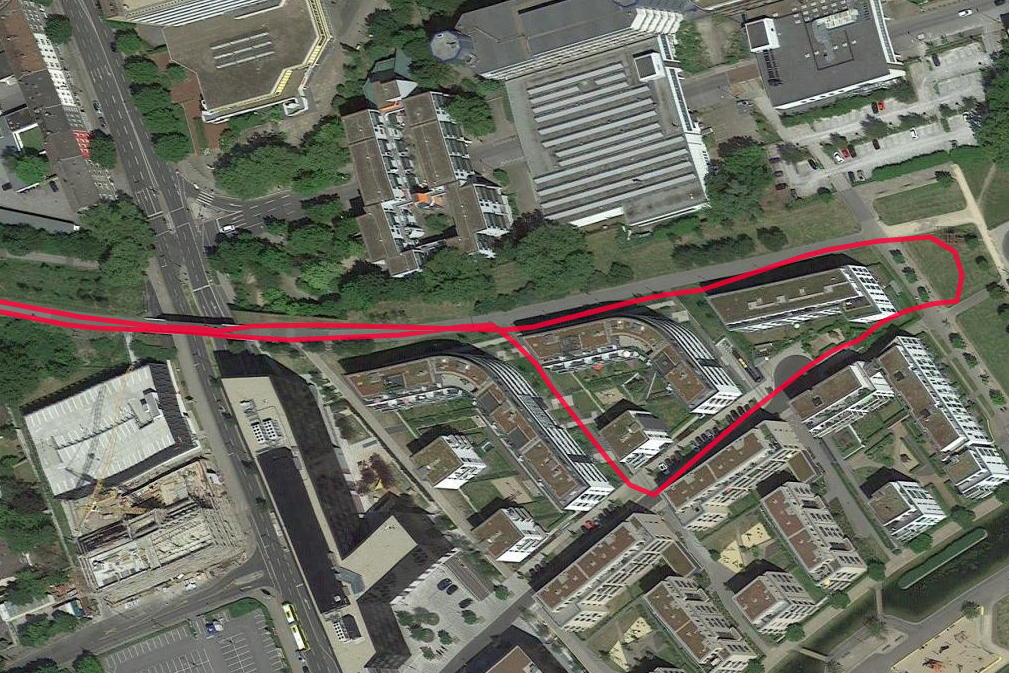
WiFi-prestandan var väldigt instabil. Men vid vardagsanvändning hamnar den aldrig under den kritiska gränsen. Samsung borde dock ändå förbättra det området. Det gäller också batteritiden, som är ganska dålig även vid minimal ljusstyrka om kommunikationsmodulerna är på.
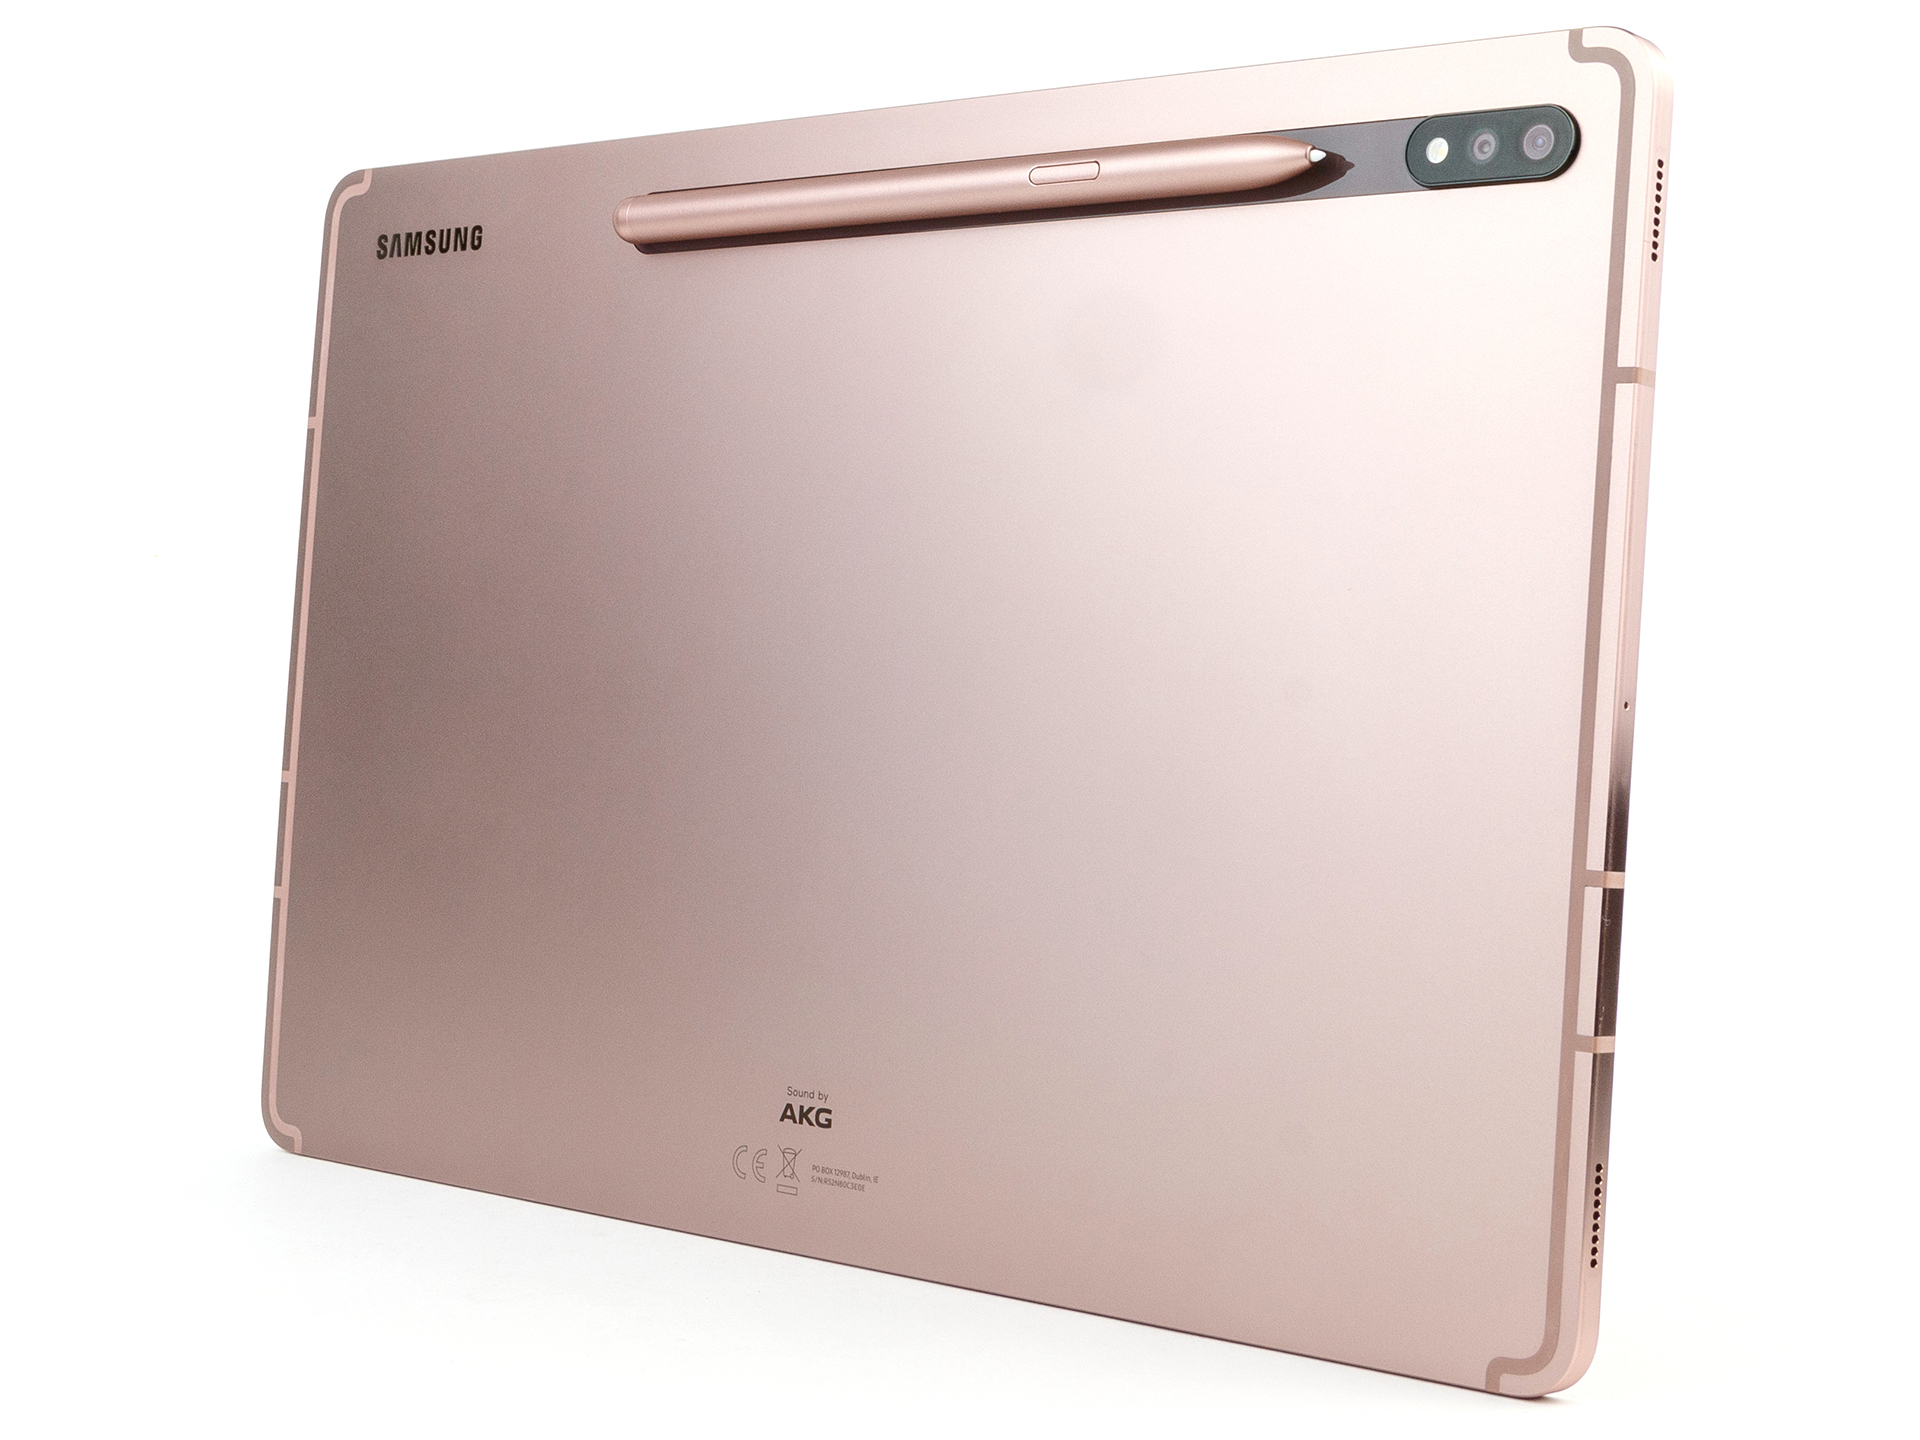
Samsung Galaxy Tab S7+ är en kraftfull och lyxig surfplatta som passar bra både för mediakonsumtion och proffsbruk.
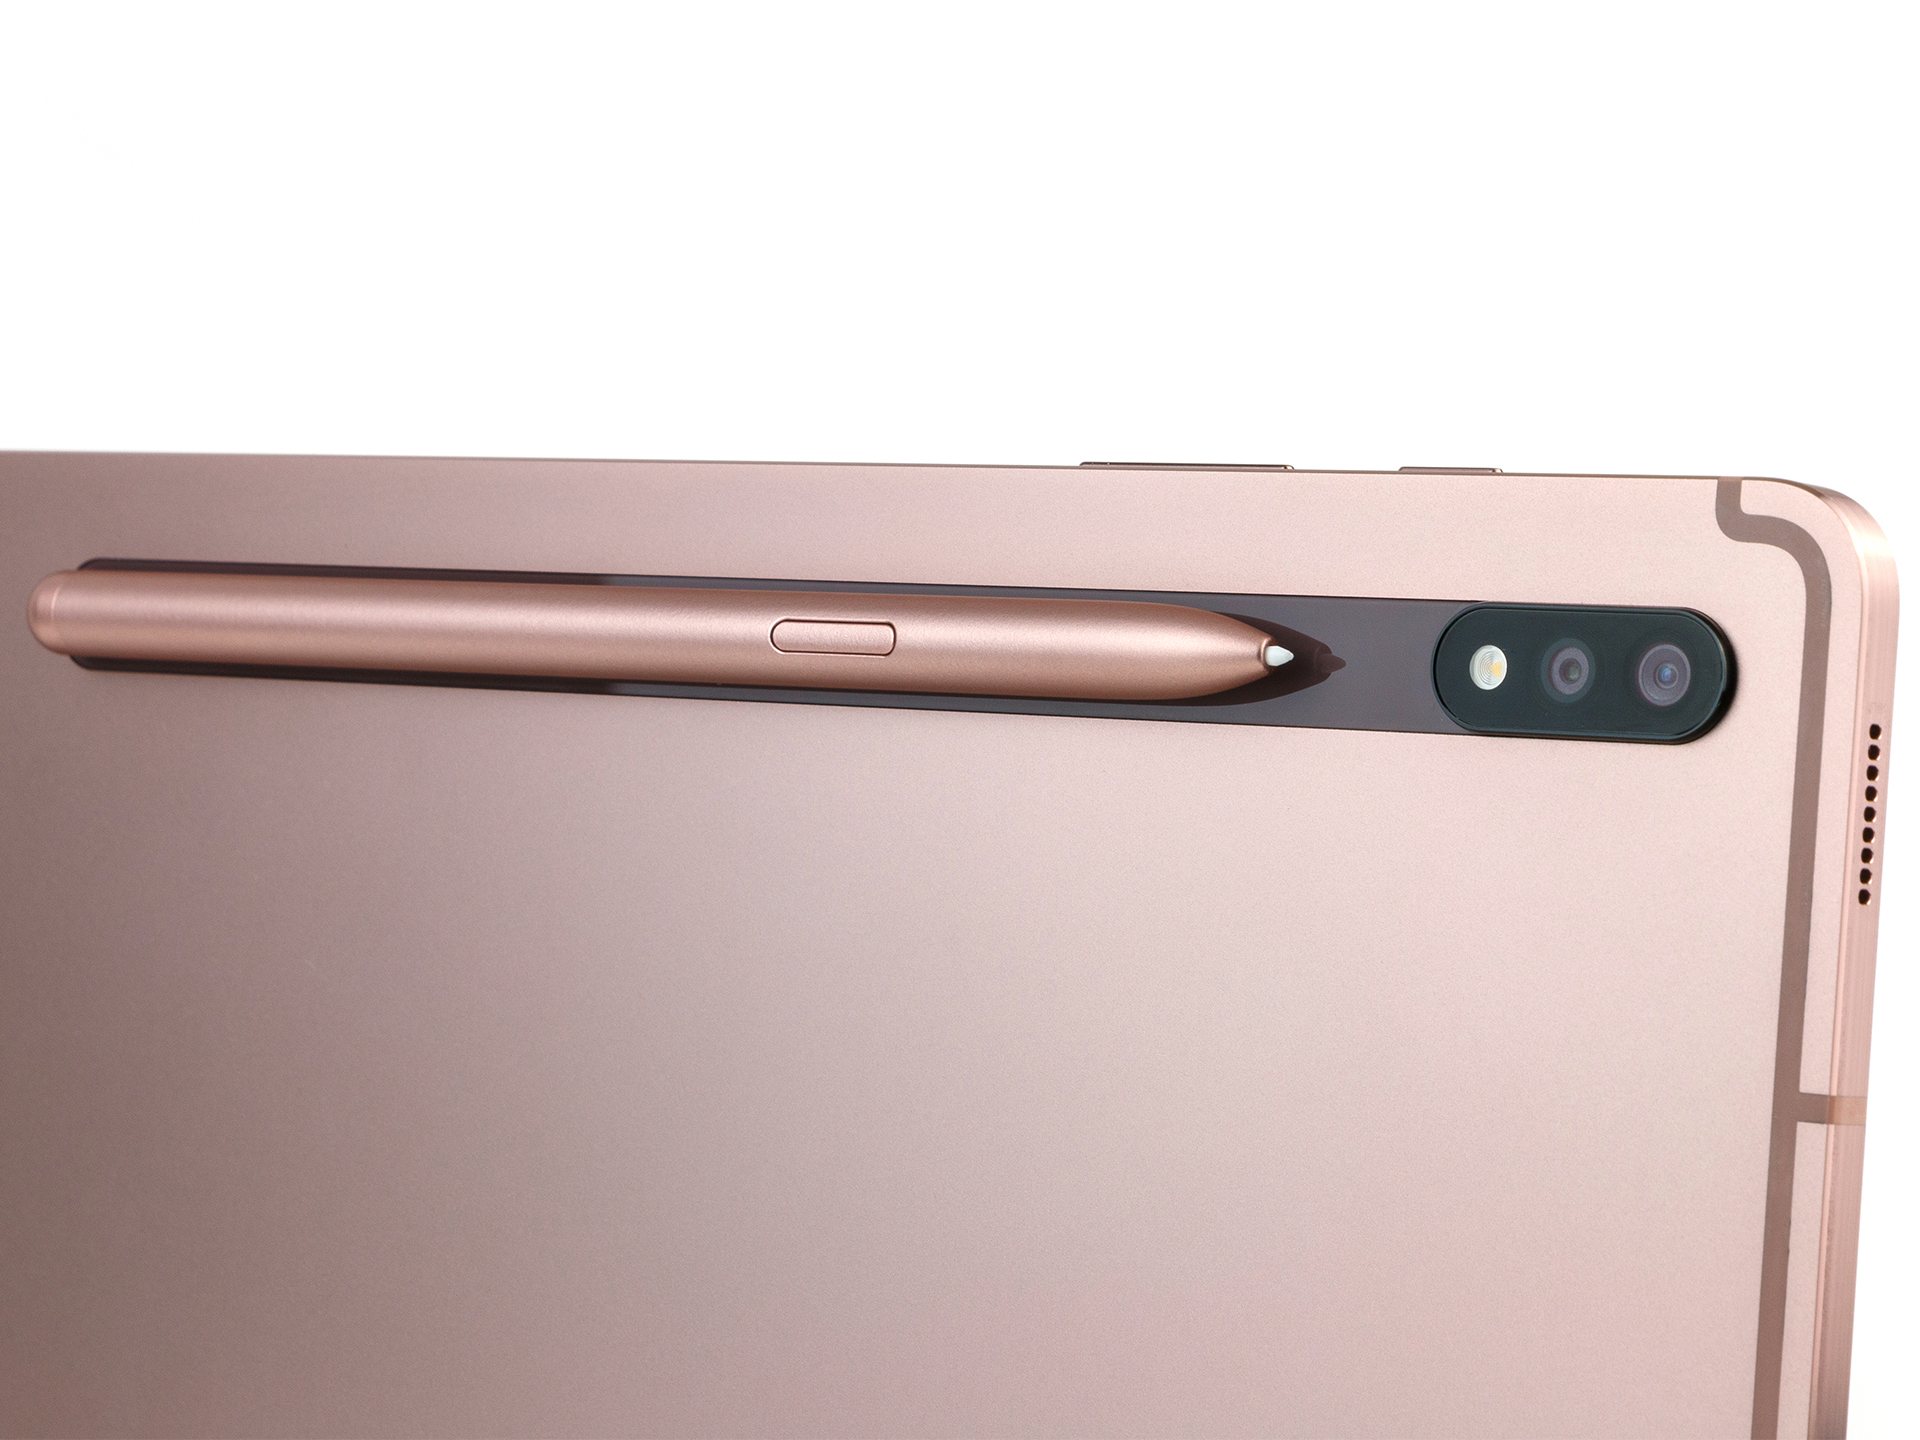
I grunden är Tab S7+ en bra surfplatta. Samsung har gjort rätt på många sätt. Tab S7+ har en riktigt snabb SoC och en 120 Hz-skärm gör hela upplevelsen bättre, inte bara när man spelar. S-Pen, som ingår i förpackningen, är ett kraftfullt verktyg för att ta anteckningar, måla eller göra presentationer. Dessutom går det att få den här Android-surfplattan med ett 5G modem som tillval, vilket borde göra Tab S7+ rätt så framtidssäkrad om Samsung håller vad de lovar i fråga om uppdateringar.
Samsung Galaxy Tab S7 Plus
- 08/31/2022 v7 (old)
Daniel Schmidt