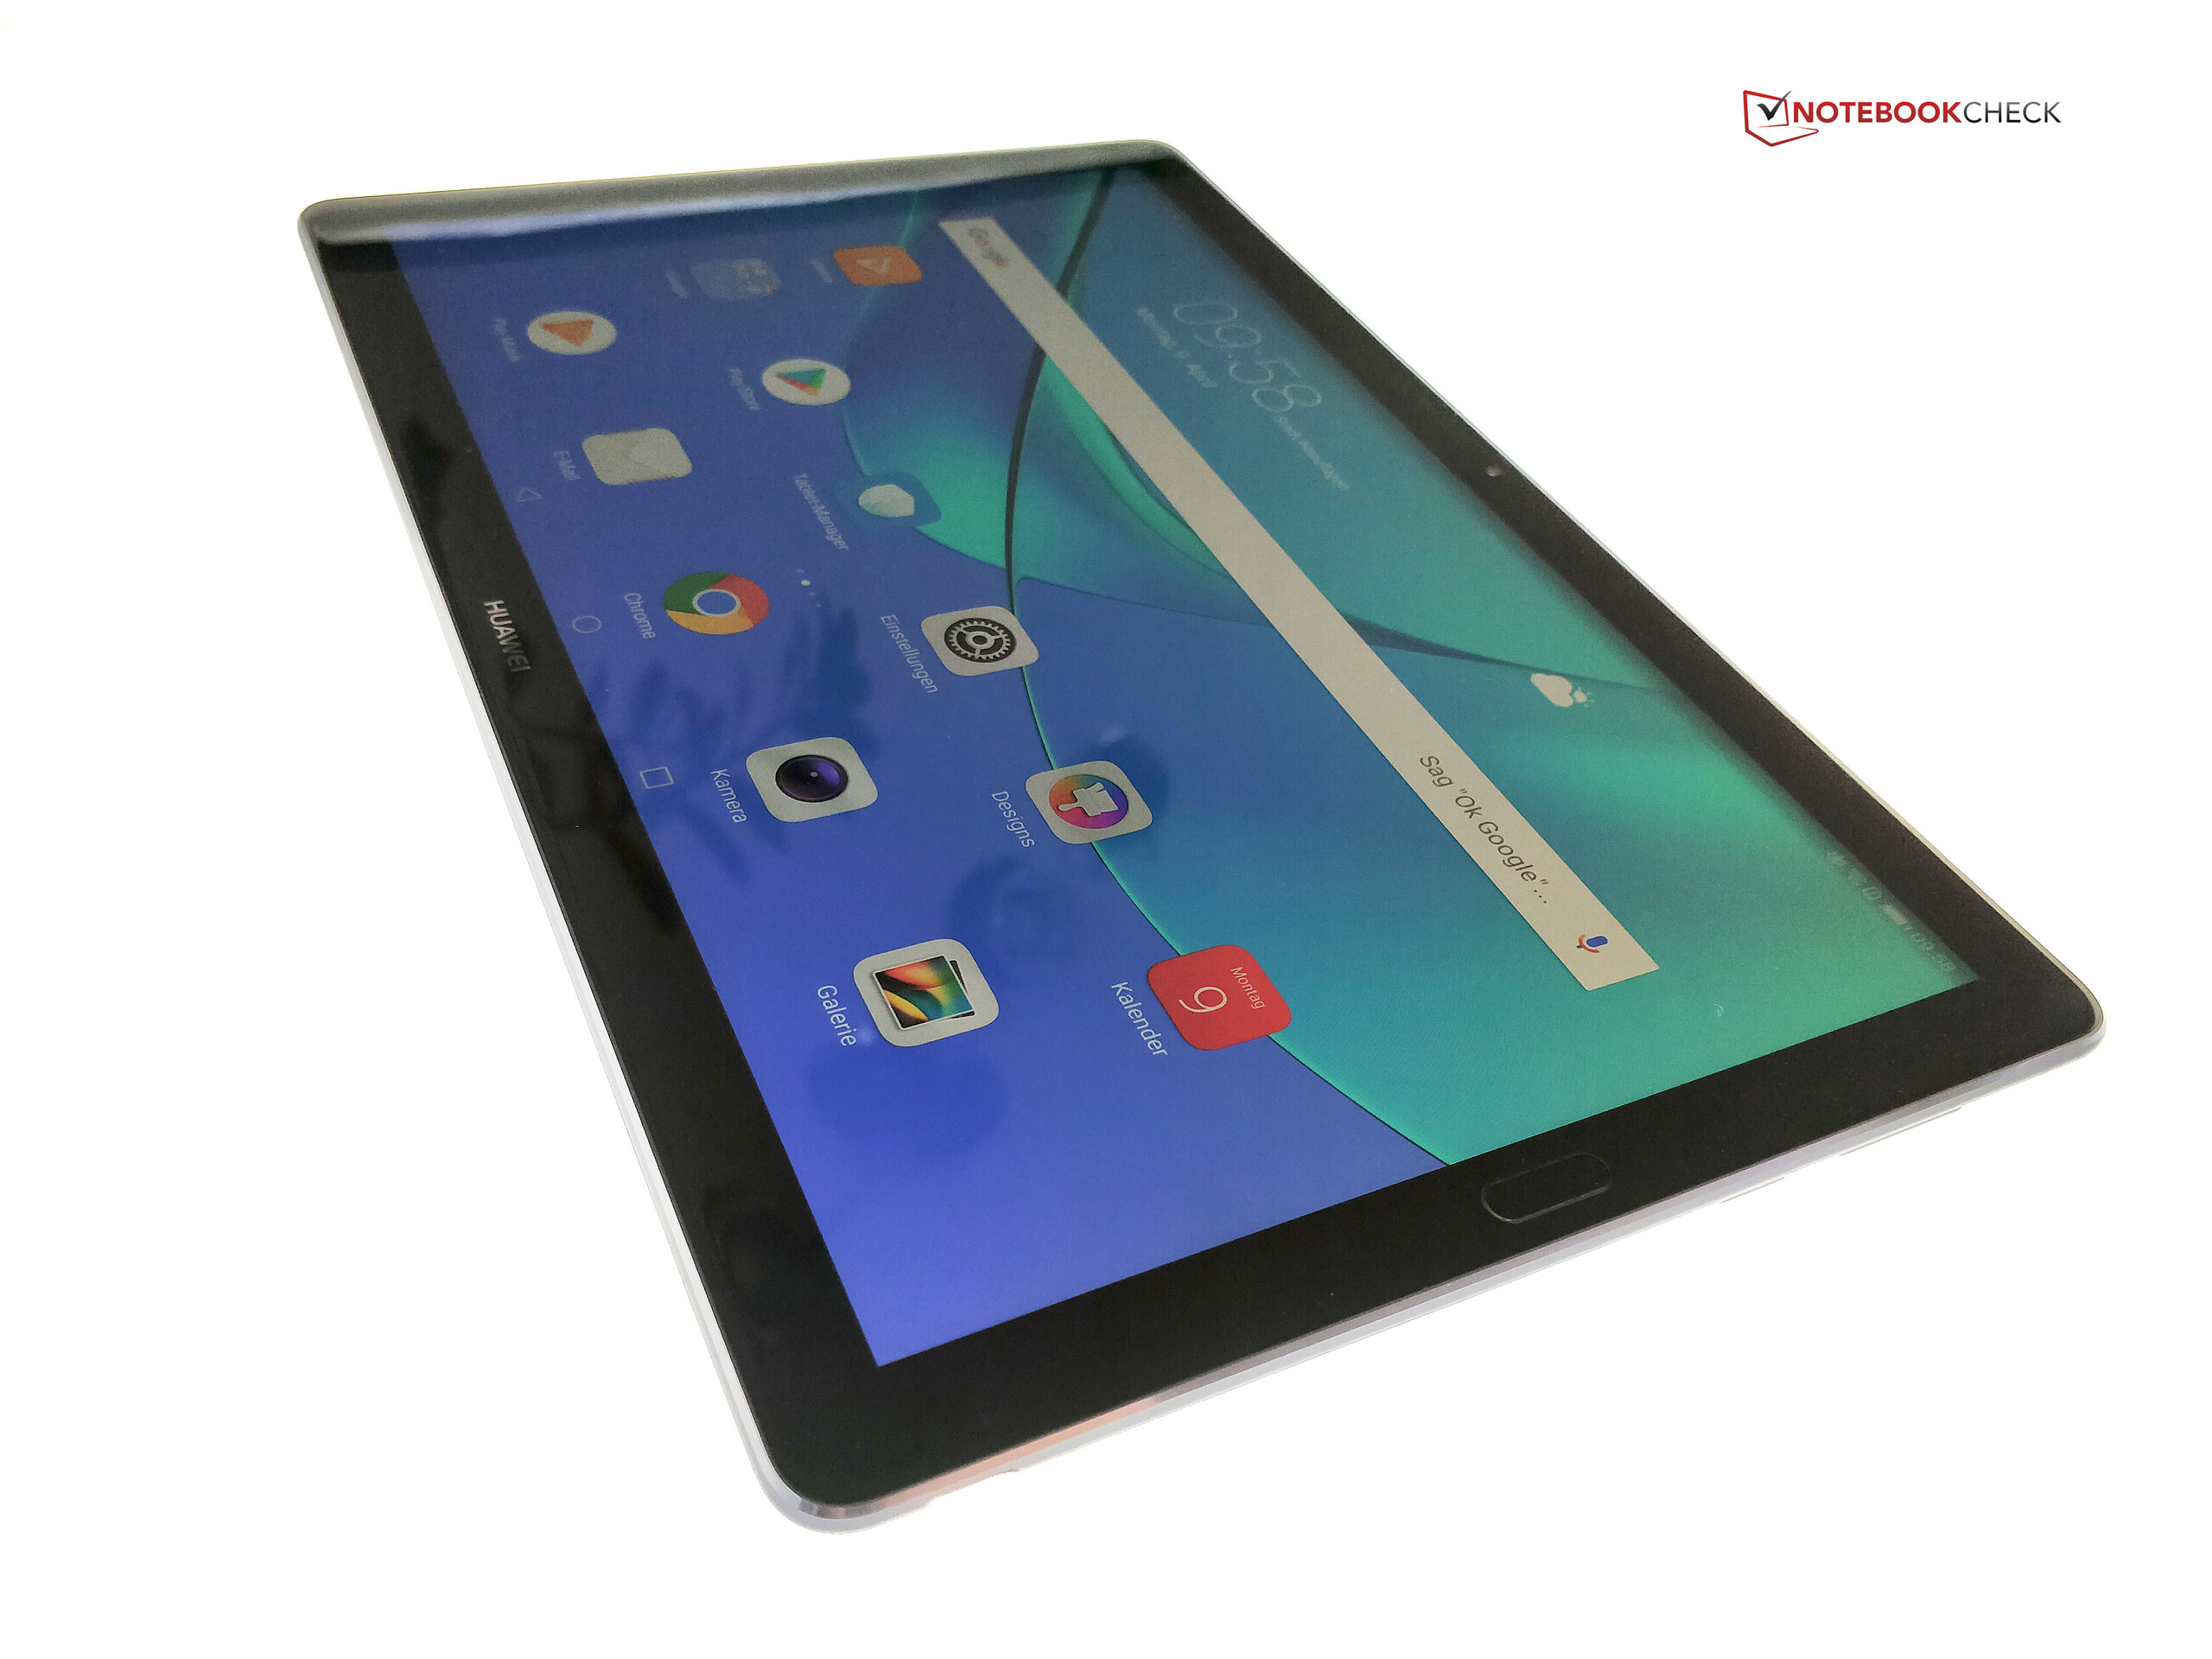
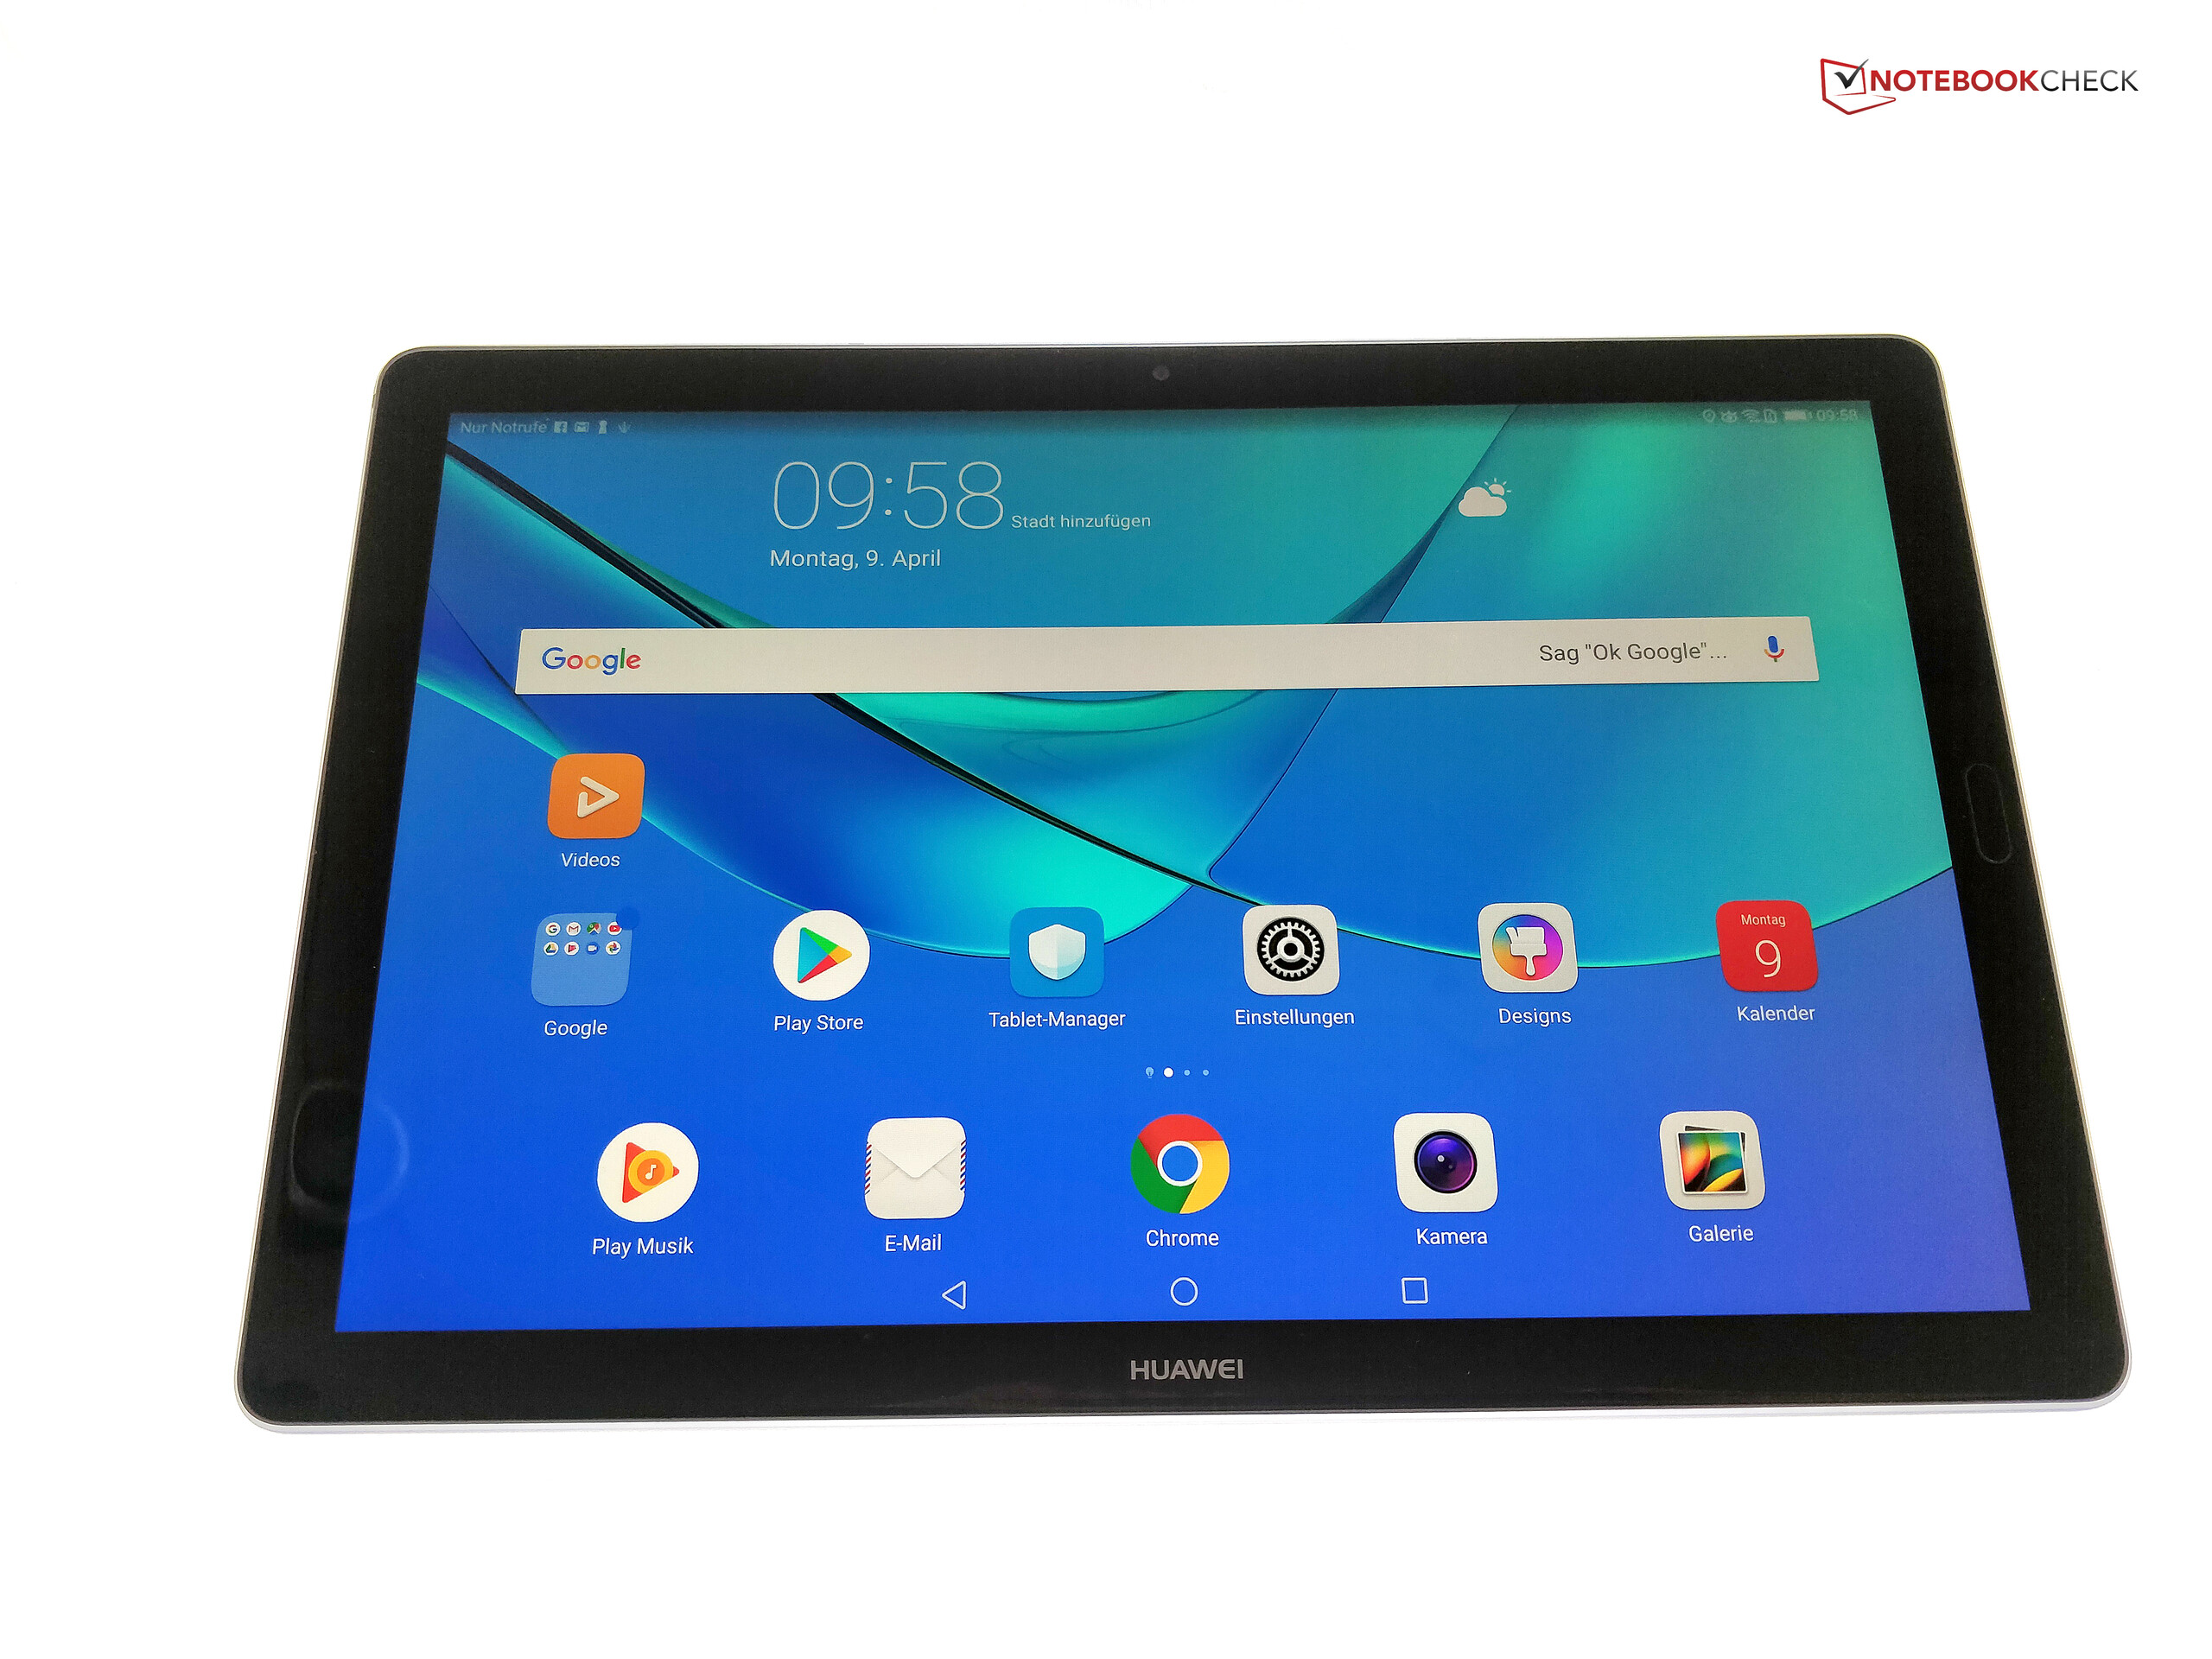
Test: Huawei MediaPad M5 (10.8 tum, LTE) Surfplatta (Sammanfattning)


| |||||||||||||||||||||||||
Distribution av ljusstyrkan: 92 %
Mitt på batteriet: 382 cd/m²
Kontrast: 1592:1 (Svärta: 0.24 cd/m²)
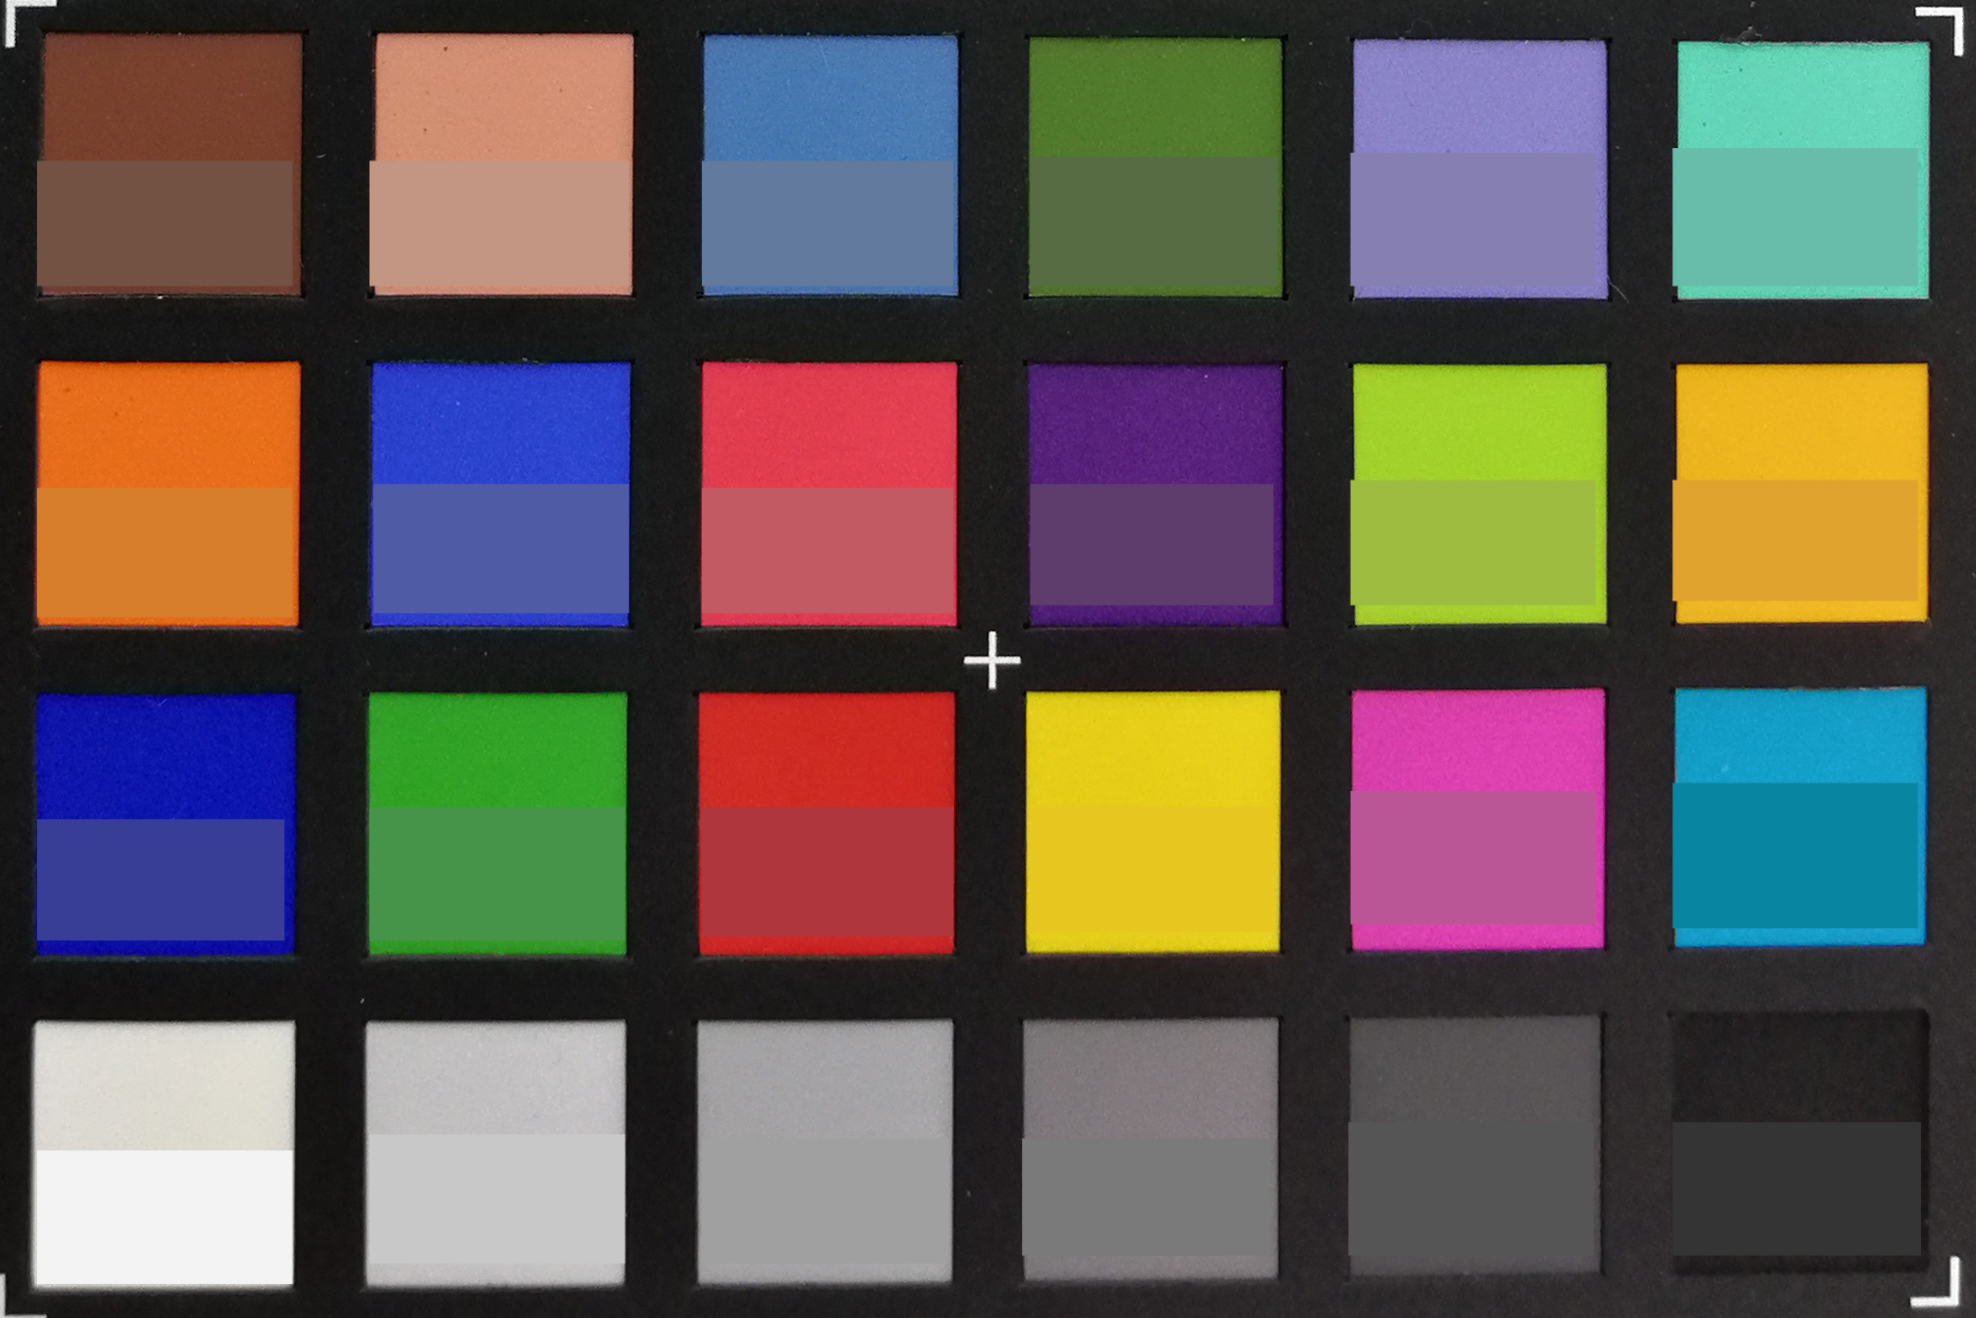
ΔE ColorChecker Calman: 2.8 | ∀{0.5-29.43 Ø4.71}
ΔE Greyscale Calman: 3.5 | ∀{0.09-98 Ø4.96}
Gamma: 2.33
CCT: 6903 K
| Huawei MediaPad M5 10.8 IPS, 2560x1600, 10.8" | Apple iPad 6 2018 IPS, 2048x1536, 9.7" | Acer Iconia Tab 10 A3-A50 IPS, 1920x1200, 10.1" | Lenovo Tab 4 10 Plus IPS, 1920x1200, 10.1" | Amazon Fire HD 10 2017 IPS, 1920x1200, 10.1" | Huawei MediaPad M3 Lite IPS, 1920x1200, 10.1" | |
|---|---|---|---|---|---|---|
| Screen | 6% | -92% | -8% | -27% | -6% | |
| Brightness middle (cd/m²) | 382 | 530 39% | 340 -11% | 443 16% | 426 12% | 435 14% |
| Brightness (cd/m²) | 378 | 513 36% | 320 -15% | 428 13% | 399 6% | 413 9% |
| Brightness Distribution (%) | 92 | 92 0% | 84 -9% | 94 2% | 91 -1% | 93 1% |
| Black Level * (cd/m²) | 0.24 | 0.61 -154% | 0.19 21% | 0.36 -50% | 0.38 -58% | 0.25 -4% |
| Contrast (:1) | 1592 | 869 -45% | 1789 12% | 1231 -23% | 1121 -30% | 1740 9% |
| Colorchecker dE 2000 * | 2.8 | 1.2 57% | 15 -436% | 3.3 -18% | 4.5 -61% | 4.4 -57% |
| Colorchecker dE 2000 max. * | 6 | 3.2 47% | 22.8 -280% | 7.2 -20% | 7.9 -32% | 7.7 -28% |
| Greyscale dE 2000 * | 3.5 | 1 71% | 4 -14% | 2.9 17% | 5.2 -49% | 3.2 9% |
| Gamma | 2.33 94% | 2.28 96% | 2.09 105% | 2.27 97% | 2.23 99% | 2.35 94% |
| CCT | 6903 94% | 6588 99% | 6940 94% | 6961 93% | 6875 95% | 7056 92% |
* ... mindre är bättre
Skärmflimmer / PWM (Puls-Width Modulation)
| Skärmflimmer / PWM upptäckt | 19530 Hz | ≤ 45 % ljusstyrka inställning | 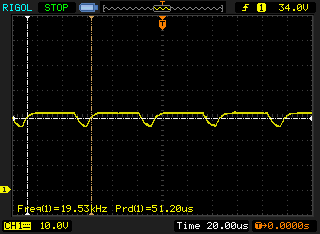 |
Displayens bakgrundsbelysning flimrar vid 19530 Hz (i värsta fall, t.ex. med PWM) Flimrande upptäckt vid en ljusstyrkeinställning på 45 % och lägre. Det ska inte finnas något flimmer eller PWM över denna ljusstyrkeinställning. Frekvensen för 19530 Hz är ganska hög, så de flesta användare som är känsliga för PWM bör inte märka något flimmer. Som jämförelse: 52 % av alla testade enheter använder inte PWM för att dämpa skärmen. Om PWM upptäcktes mättes ett medelvärde av 7754 (minst: 5 - maximum: 343500) Hz. | |||
Visa svarstider
| ↔ Svarstid svart till vitt | ||
|---|---|---|
| 30.4 ms ... stiga ↗ och falla ↘ kombinerat | ↗ 16.4 ms stiga | 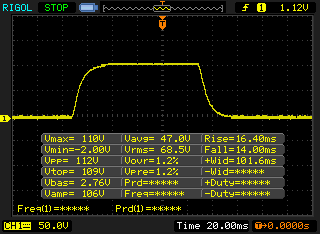 |
| ↘ 14 ms hösten | ||
| Skärmen visar långsamma svarsfrekvenser i våra tester och kommer att vara otillfredsställande för spelare. I jämförelse sträcker sig alla testade enheter från 0.1 (minst) till 240 (maximalt) ms. » 82 % av alla enheter är bättre. Detta innebär att den uppmätta svarstiden är sämre än genomsnittet av alla testade enheter (19.8 ms). | ||
| ↔ Svarstid 50 % grått till 80 % grått | ||
| 42.4 ms ... stiga ↗ och falla ↘ kombinerat | ↗ 22 ms stiga | 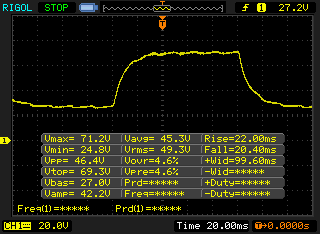 |
| ↘ 20.4 ms hösten | ||
| Skärmen visar långsamma svarsfrekvenser i våra tester och kommer att vara otillfredsställande för spelare. I jämförelse sträcker sig alla testade enheter från 0.165 (minst) till 636 (maximalt) ms. » 70 % av alla enheter är bättre. Detta innebär att den uppmätta svarstiden är sämre än genomsnittet av alla testade enheter (31 ms). | ||
| AnTuTu v6 - Total Score | |
| Huawei MediaPad M5 10.8 | |
| Genomsnitt HiSilicon Kirin 960s (n=1) | |
| Acer Iconia Tab 10 A3-A50 | |
| Amazon Fire HD 10 2017 | |
| Lenovo Tab 4 10 Plus | |
| Huawei MediaPad M3 Lite | |
| PCMark for Android | |
| Work performance score | |
| Acer Iconia Tab 10 A3-A50 | |
| Lenovo Tab 4 10 Plus | |
| Huawei MediaPad M3 Lite | |
| Huawei MediaPad M5 10.8 | |
| Genomsnitt HiSilicon Kirin 960s (n=1) | |
| Amazon Fire HD 10 2017 | |
| Work 2.0 performance score | |
| Huawei MediaPad M5 10.8 | |
| Genomsnitt HiSilicon Kirin 960s (n=1) | |
| Acer Iconia Tab 10 A3-A50 | |
| Lenovo Tab 4 10 Plus | |
| Huawei MediaPad M3 Lite | |
| Amazon Fire HD 10 2017 | |
| Octane V2 - Total Score | |
| Genomsnitt av klass Tablet (1633 - 138481, n=71, senaste 2 åren) | |
| Apple iPad 6 2018 (Safari Mobile 11.3) | |
| Acer Iconia Tab 10 A3-A50 (Browser: Chrome Version 63) | |
| Amazon Fire HD 10 2017 (Amazon Silk 61.2) | |
| Huawei MediaPad M5 10.8 (Chrome 65) | |
| Genomsnitt HiSilicon Kirin 960s (n=1) | |
| Lenovo Tab 4 10 Plus (Chrome 60) | |
| Huawei MediaPad M3 Lite (Chrome 58) | |
| WebXPRT 2015 - Overall | |
| Apple iPad 6 2018 (Safari Mobile 11.3) | |
| Amazon Fire HD 10 2017 (Amazon Silk 61.2) | |
| Huawei MediaPad M5 10.8 (Chrome 65) | |
| Genomsnitt HiSilicon Kirin 960s (n=1) | |
| Lenovo Tab 4 10 Plus (Chrome 60) | |
| Huawei MediaPad M3 Lite (Chrome 58) | |
| JetStream 1.1 - 1.1 Total | |
| Apple iPad 6 2018 (Safari Mobile 11.3) | |
| Acer Iconia Tab 10 A3-A50 (Browser: Chrome Version 63) | |
| Amazon Fire HD 10 2017 (Amazon Silk 61.2) | |
| Huawei MediaPad M5 10.8 (Chrome 65) | |
| Genomsnitt HiSilicon Kirin 960s (n=1) | |
| Lenovo Tab 4 10 Plus (Chrome 60) | |
| Huawei MediaPad M3 Lite (Chrome 58) | |
| Mozilla Kraken 1.1 - Total | |
| Huawei MediaPad M3 Lite (Chrome 58) | |
| Lenovo Tab 4 10 Plus (Chrome 60) | |
| Huawei MediaPad M5 10.8 (Chrome 65) | |
| Genomsnitt HiSilicon Kirin 960s (n=1) | |
| Amazon Fire HD 10 2017 (Amazon Silk 61.2) | |
| Acer Iconia Tab 10 A3-A50 (Browser: Chrome Version 63) | |
| Genomsnitt av klass Tablet (243 - 16233, n=65, senaste 2 åren) | |
| Apple iPad 6 2018 (Safari Mobile 11.3) | |
* ... mindre är bättre
| Huawei MediaPad M5 10.8 | Acer Iconia Tab 10 A3-A50 | Lenovo Tab 4 10 Plus | Amazon Fire HD 10 2017 | Huawei MediaPad M3 Lite | Genomsnitt 32 GB eMMC Flash | Genomsnitt av klass Tablet | |
|---|---|---|---|---|---|---|---|
| AndroBench 3-5 | -41% | -19% | -34% | -41% | -25% | 697% | |
| Sequential Read 256KB (MB/s) | 247.8 | 173.7 -30% | 270.1 9% | 262.2 6% | 133.5 -46% | 242 ? -2% | 2073 ? 737% |
| Sequential Write 256KB (MB/s) | 126.8 | 92.4 -27% | 135.5 7% | 147.7 16% | 60.3 -52% | 100.5 ? -21% | 1667 ? 1215% |
| Random Read 4KB (MB/s) | 54.7 | 13.7 -75% | 37.3 -32% | 27.72 -49% | 38.8 -29% | 43.1 ? -21% | 275 ? 403% |
| Random Write 4KB (MB/s) | 60.8 | 8.77 -86% | 11.8 -81% | 9.37 -85% | 8.5 -86% | 22.3 ? -63% | 324 ? 433% |
| Sequential Read 256KB SDCard (MB/s) | 85.1 ? | 80.4 ? -6% | 83.9 -1% | 55.5 ? -35% | 78.7 -8% | 71.8 ? -16% | |
| Sequential Write 256KB SDCard (MB/s) | 73.8 ? | 56.8 ? -23% | 61.1 -17% | 30.14 ? -59% | 56.8 -23% | 52.9 ? -28% |
| Arena of Valor | |||
| Inställningar | Värde | ||
| min | 60 fps | ||
| high HD | 60 fps | ||
| Battle Bay | |||
| Inställningar | Värde | ||
| half resolution | 60 fps | ||
| full resolution | 60 fps | ||
| Shadow Fight 3 | |||
| Inställningar | Värde | ||
| high | 30 fps | ||
| minimal | 30 fps | ||
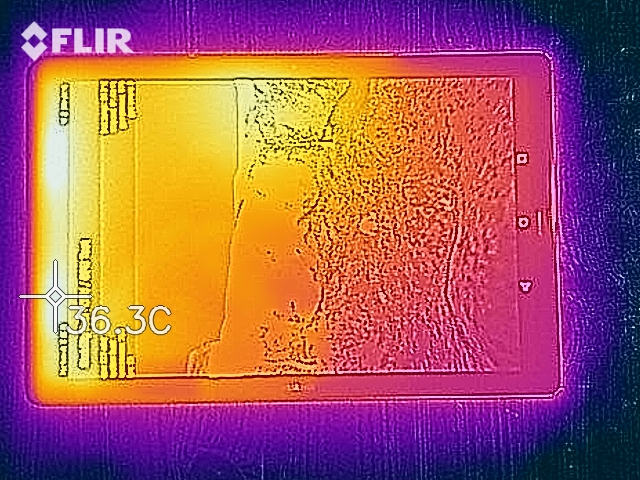
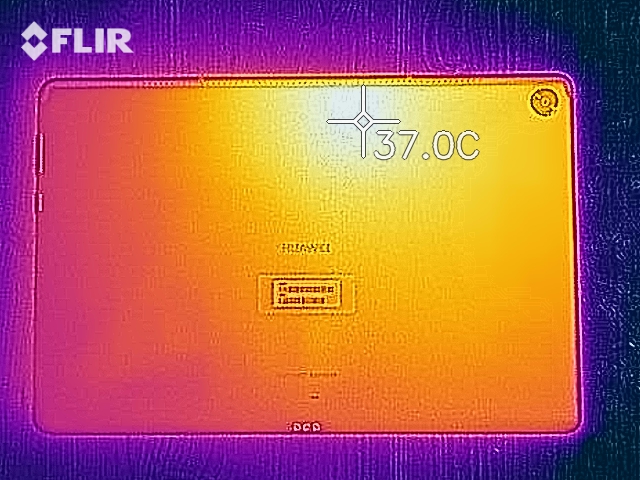
(+) Den maximala temperaturen på ovansidan är 33.6 °C / 92 F, jämfört med genomsnittet av 33.7 °C / 93 F , allt från 20.7 till 53.2 °C för klassen Tablet.
(+) Botten värms upp till maximalt 32.9 °C / 91 F, jämfört med genomsnittet av 33.2 °C / 92 F
(+) Vid tomgångsbruk är medeltemperaturen för ovansidan 29.3 °C / 85 F, jämfört med enhetsgenomsnittet på 30 °C / ### class_avg_f### F.
Huawei MediaPad M5 10.8 ljudanalys
(±) | högtalarljudstyrkan är genomsnittlig men bra (79.9 dB)
Bas 100 - 315 Hz
(±) | reducerad bas - i genomsnitt 11.9% lägre än medianen
(-) | basen är inte linjär (16.4% delta till föregående frekvens)
Mellan 400 - 2000 Hz
(+) | balanserad mellan - endast 3.2% från medianen
(+) | mids är linjära (5.7% delta till föregående frekvens)
Högsta 2 - 16 kHz
(+) | balanserade toppar - endast 4.6% från medianen
(+) | toppar är linjära (6.9% delta till föregående frekvens)
Totalt 100 - 16 000 Hz
(±) | linjäriteten för det totala ljudet är genomsnittlig (15.9% skillnad mot median)
Jämfört med samma klass
» 36% av alla testade enheter i den här klassen var bättre, 6% liknande, 58% sämre
» Den bästa hade ett delta på 7%, genomsnittet var 20%, sämst var 129%
Jämfört med alla testade enheter
» 25% av alla testade enheter var bättre, 5% liknande, 70% sämre
» Den bästa hade ett delta på 4%, genomsnittet var 23%, sämst var 134%
Apple iPad 6 2018 ljudanalys
(±) | högtalarljudstyrkan är genomsnittlig men bra (75.7 dB)
Bas 100 - 315 Hz
(±) | reducerad bas - i genomsnitt 11.2% lägre än medianen
(±) | linjäriteten för basen är genomsnittlig (11.9% delta till föregående frekvens)
Mellan 400 - 2000 Hz
(+) | balanserad mellan - endast 1.3% från medianen
(+) | mids är linjära (5.9% delta till föregående frekvens)
Högsta 2 - 16 kHz
(+) | balanserade toppar - endast 3.3% från medianen
(±) | linjäriteten för toppar är genomsnittlig (11% delta till föregående frekvens)
Totalt 100 - 16 000 Hz
(+) | det totala ljudet är linjärt (13.3% skillnad mot median)
Jämfört med samma klass
» 24% av alla testade enheter i den här klassen var bättre, 4% liknande, 71% sämre
» Den bästa hade ett delta på 7%, genomsnittet var 20%, sämst var 129%
Jämfört med alla testade enheter
» 14% av alla testade enheter var bättre, 3% liknande, 83% sämre
» Den bästa hade ett delta på 4%, genomsnittet var 23%, sämst var 134%
| Av/Standby | |
| Låg belastning | |
| Hög belastning |
|
Förklaring:
min: | |
| Huawei MediaPad M5 10.8 7500 mAh | Apple iPad 6 2018 mAh | Acer Iconia Tab 10 A3-A50 6100 mAh | Lenovo Tab 4 10 Plus 7000 mAh | Amazon Fire HD 10 2017 6300 mAh | Huawei MediaPad M3 Lite 6600 mAh | |
|---|---|---|---|---|---|---|
| Power Consumption | -31% | -17% | 35% | 20% | 27% | |
| Idle Minimum * (Watt) | 2.01 | 2.2 -9% | 3.21 -60% | 1.23 39% | 1.55 23% | 1.45 28% |
| Idle Average * (Watt) | 5.4 | 7.8 -44% | 5.97 -11% | 3.92 27% | 4.17 23% | 4.44 18% |
| Idle Maximum * (Watt) | 5.44 | 7.9 -45% | 6.19 -14% | 4.03 26% | 4.25 22% | 4.61 15% |
| Load Average * (Watt) | 8.55 | 12.6 -47% | 9.72 -14% | 5 42% | 7.13 17% | 6.21 27% |
| Load Maximum * (Watt) | 11.53 | 12.8 -11% | 9.97 14% | 7.09 39% | 9.63 16% | 6.33 45% |
* ... mindre är bättre
| Huawei MediaPad M5 10.8 7500 mAh | Apple iPad 6 2018 mAh | Acer Iconia Tab 10 A3-A50 6100 mAh | Lenovo Tab 4 10 Plus 7000 mAh | Amazon Fire HD 10 2017 6300 mAh | Huawei MediaPad M3 Lite 6600 mAh | |
|---|---|---|---|---|---|---|
| Batteridrifttid | 2% | -32% | 16% | -6% | 25% | |
| Reader / Idle (h) | 22.4 | 12.3 -45% | 27.1 21% | 16 -29% | 22.4 0% | |
| H.264 (h) | 11.7 | 13.3 14% | 9.8 -16% | 13.9 19% | ||
| WiFi v1.3 (h) | 10.8 | 11.9 10% | 6.5 -40% | 10.8 0% | 9 -17% | 13.4 24% |
| Load (h) | 3.3 | 3.1 -6% | 2.9 -12% | 4.3 30% | 4.6 39% | 5.2 58% |
För
Emot
Läs den fullständiga versionen av den här recensionen på engelska här.
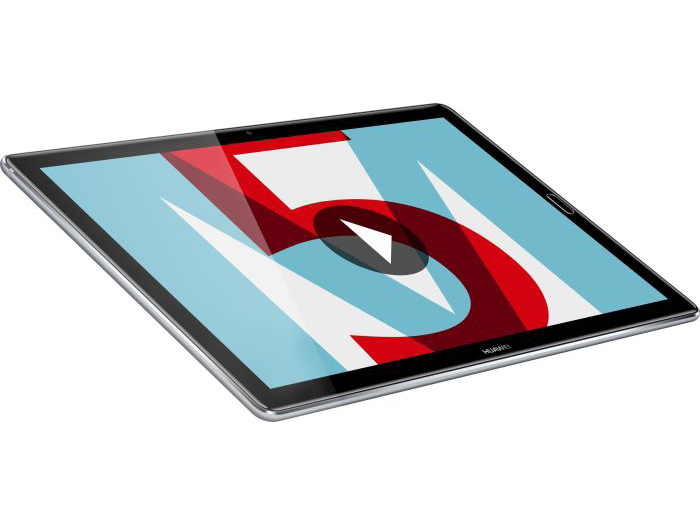
I början av recensionen frågade vi oss huruvida Huaweis surfplatta verkligen var värd sitt pris. Svaret är: Det finns många höjdpunkter som gör att plattan inte verkar särskilt dyr. Plus, förhållandet mellan pris och prestanda är också väldigt bra.
Höjdpunkterna inkluderar: Den högupplösta skärmen med bra färgrymdstäckning, dom kraftfulla högtalarna och den utmärkta prestandan. Det faktum att du kan ringa telefonsamtal med plattan är en trevlig gimmick. Bra inmatningsenheter, utförlig mjukvara och snabb laddning rundar av det hela.
Under loppet av vår recension dök också ett antal negativa punker upp: Säkerhetspatcharna är inte aktuella, det finns förinstallerad bloatware, dess WiFi är riktigt långsam och GPS:en tar lång tid på sig att hitta en plats. Den höga prestandan är heller inte alltid tillgänglig och surfplattan begränsar hastigheten då och då. Dessutom kunde enheten varit mer robust. Avsaknaden av stabilitet minskar den känsla av hög kvalitet som surfplattan i övrigt ger ifrån sig.
En dyr surfplatta som är värd pengarna.
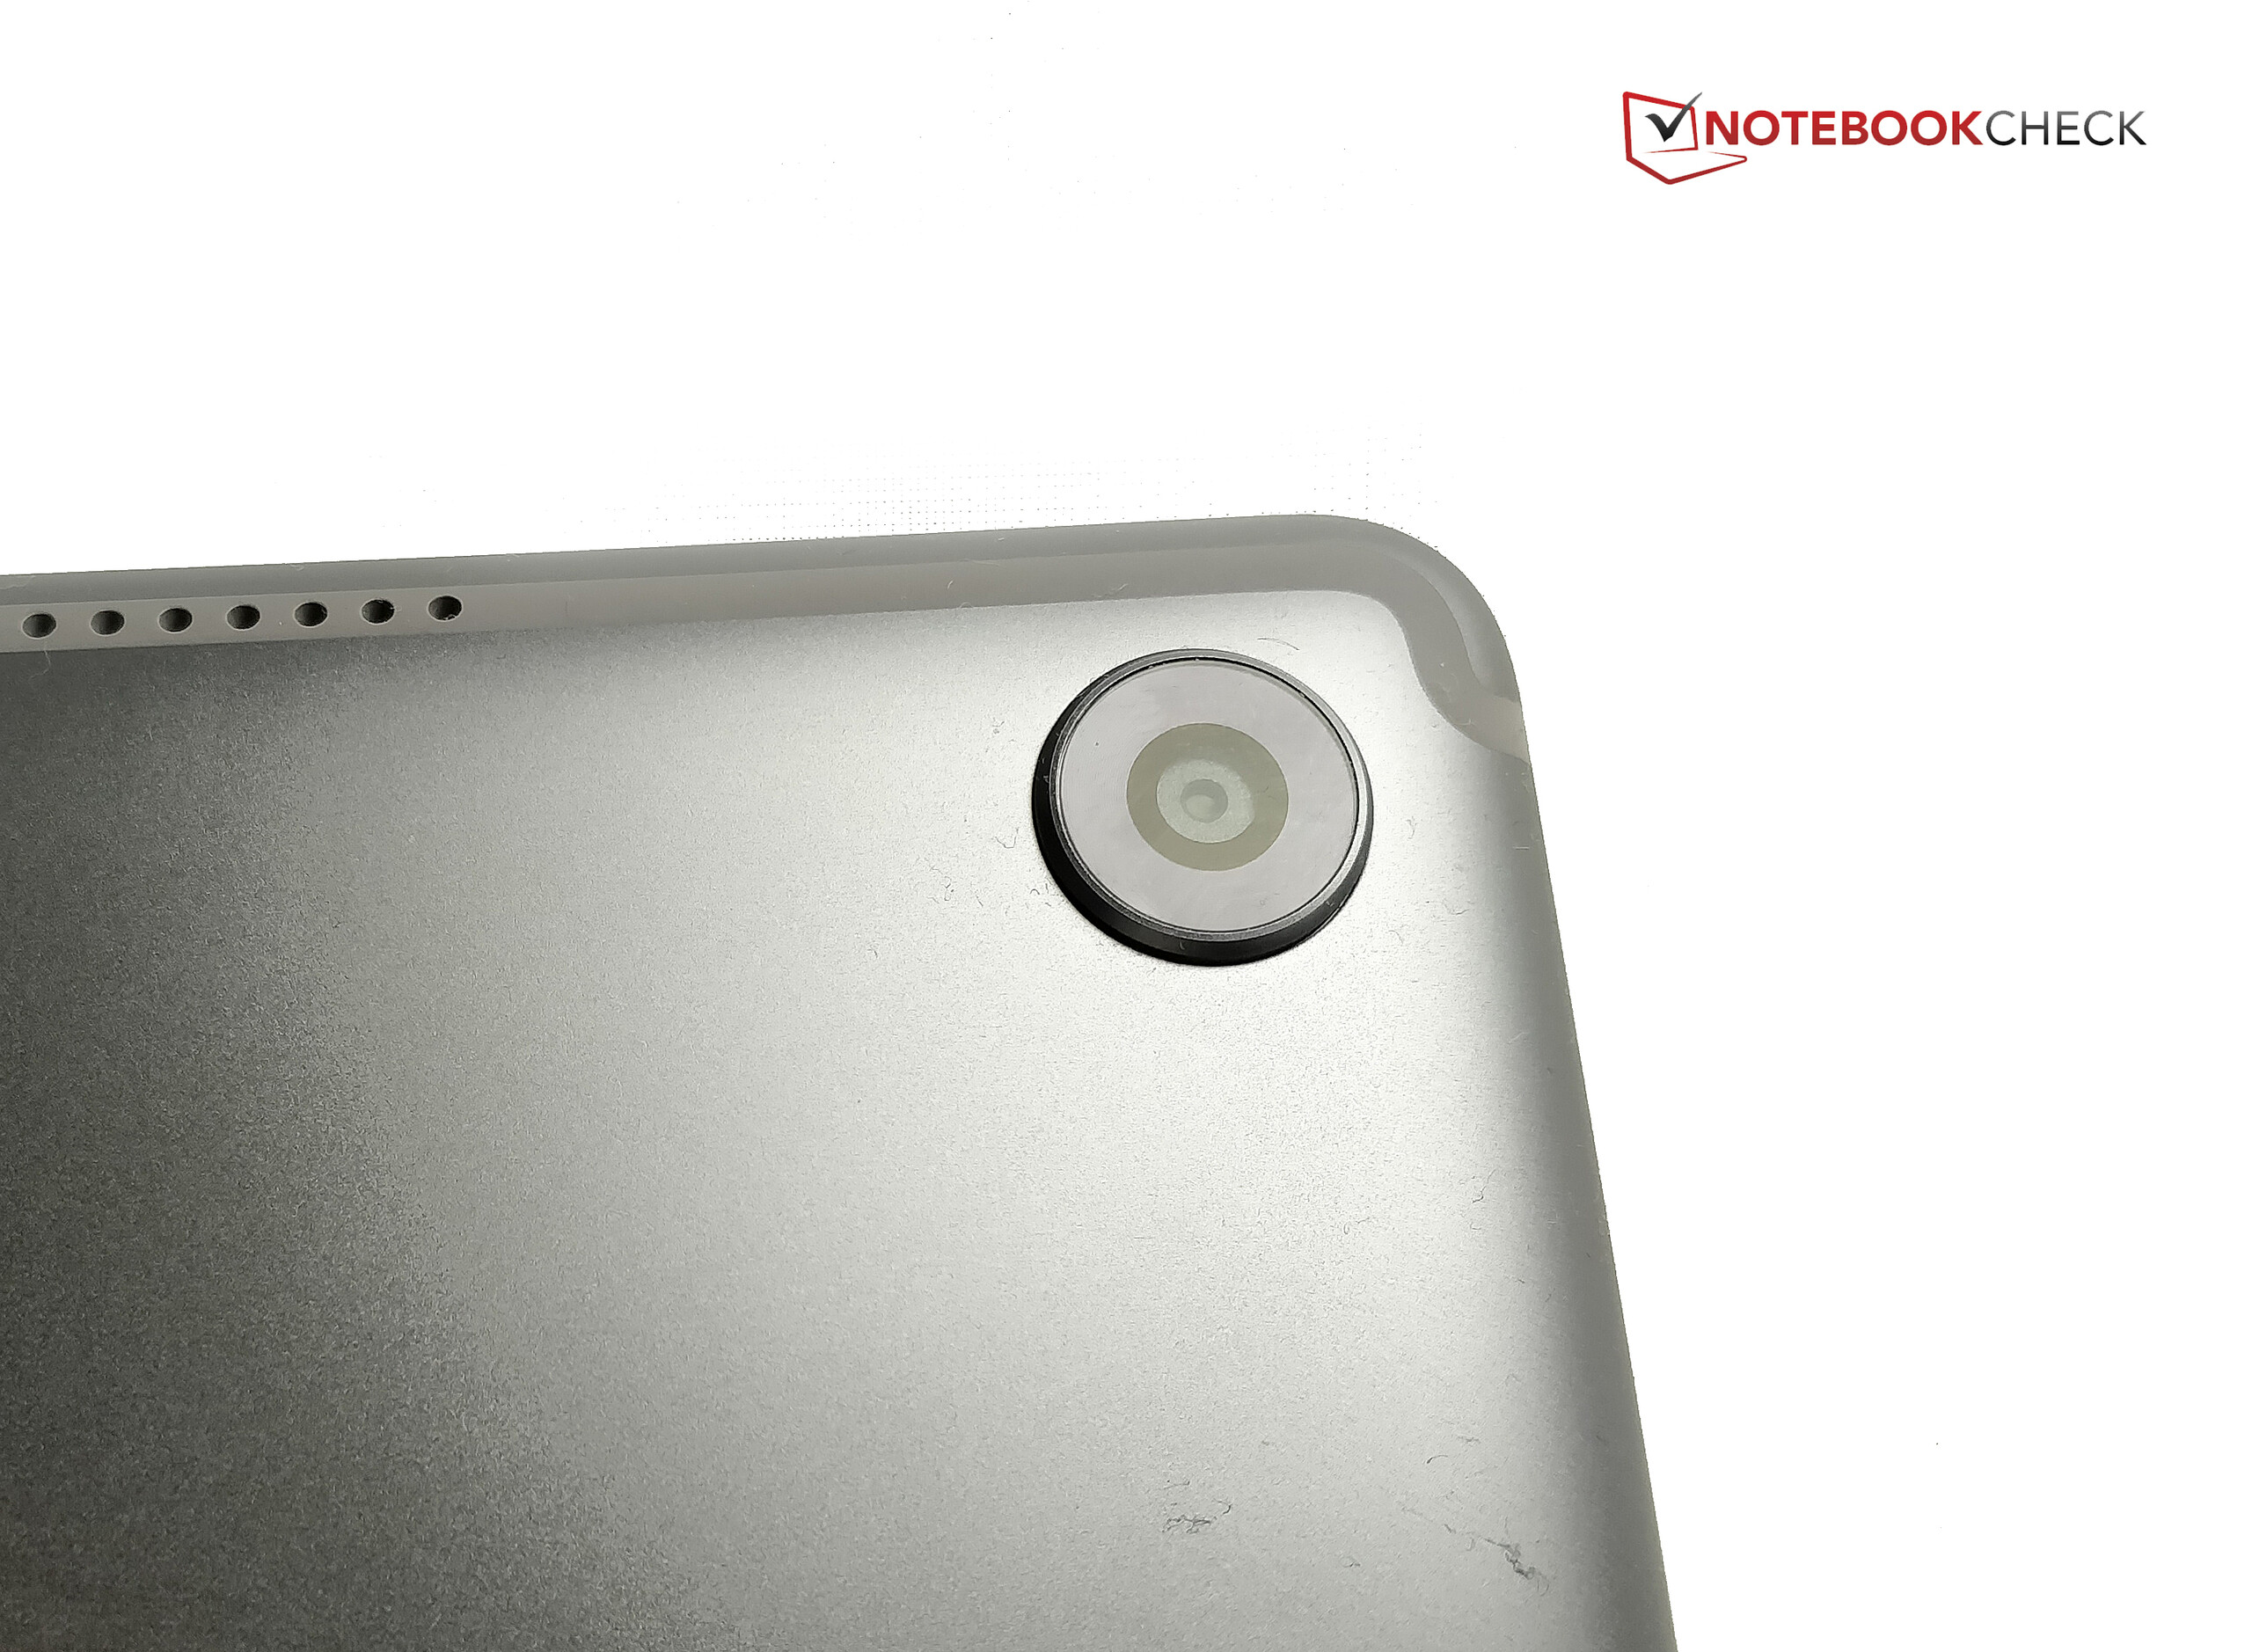
Men eftersom kamerorna är ganska bra för en surfplatta och inmatningsenheterna fungerar väldigt pålitligt och dessutom erbjuder ordentliga möjligheter till anpassning så kan vi lätt ge Huawei MediaPad M5 10.8 en klar rekommendation. Den som inte behöver LTE-funktionerna kan spara en del pengar genom att skaffa en enkel WiFi-version.
Huawei MediaPad M5 10.8
- 09/16/2019 v7 (old)
Florian Wimmer