Test: Amazon Fire HD 10 (2017) Surfplatta (Sammanfattning)
| Networking | |
| iperf3 transmit AX12 | |
| Apple iPad (2017) | |
| Asus ZenPad 3s 10 Z500M | |
| Amazon Fire HD 10 2017 | |
| Huawei MediaPad T3 10 | |
| Lenovo Tab 4 10 | |
| iperf3 receive AX12 | |
| Apple iPad (2017) | |
| Asus ZenPad 3s 10 Z500M | |
| Amazon Fire HD 10 2017 | |
| Huawei MediaPad T3 10 | |
| Lenovo Tab 4 10 | |


| |||||||||||||||||||||||||
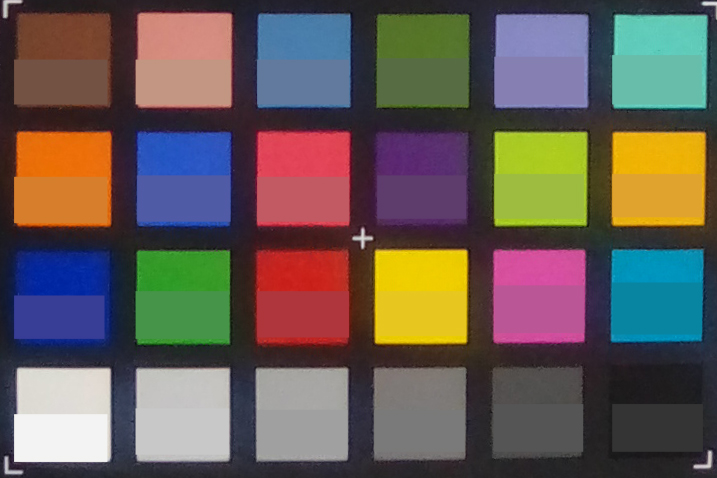
Distribution av ljusstyrkan: 91 %
Mitt på batteriet: 426 cd/m²
Kontrast: 1121:1 (Svärta: 0.38 cd/m²)
ΔE ColorChecker Calman: 4.5 | ∀{0.5-29.43 Ø4.72}
ΔE Greyscale Calman: 5.2 | ∀{0.09-98 Ø4.97}
Gamma: 2.23
CCT: 6875 K
| Amazon Fire HD 10 2017 IPS, 1920x1200, 10.1" | Asus ZenPad 3s 10 Z500M IPS, 2048x1536, 9.7" | Lenovo Tab 4 10 IPS, 1280x800, 10.1" | Huawei MediaPad T3 10 IPS, 1280x800, 9.6" | Apple iPad (2017) IPS, 2048x1536, 9.7" | |
|---|---|---|---|---|---|
| Screen | -11% | 0% | 2% | 26% | |
| Brightness middle (cd/m²) | 426 | 489 15% | 316 -26% | 410 -4% | 514 21% |
| Brightness (cd/m²) | 399 | 443 11% | 305 -24% | 409 3% | 485 22% |
| Brightness Distribution (%) | 91 | 86 -5% | 86 -5% | 92 1% | 88 -3% |
| Black Level * (cd/m²) | 0.38 | 0.43 -13% | 0.2 47% | 0.32 16% | 0.46 -21% |
| Contrast (:1) | 1121 | 1137 1% | 1580 41% | 1281 14% | 1117 0% |
| Colorchecker dE 2000 * | 4.5 | 5.5 -22% | 5 -11% | 4.5 -0% | 1.4 69% |
| Colorchecker dE 2000 max. * | 7.9 | 11.6 -47% | 8.7 -10% | 14.2 -80% | 2.9 63% |
| Greyscale dE 2000 * | 5.2 | 6.7 -29% | 5.7 -10% | 2 62% | 2.1 60% |
| Gamma | 2.23 99% | 2.06 107% | 2.25 98% | 2.17 101% | 2.22 99% |
| CCT | 6875 95% | 7457 87% | 7921 82% | 6930 94% | 6647 98% |
* ... mindre är bättre
Skärmflimmer / PWM (Puls-Width Modulation)
| Skärmflimmer / PWM upptäckt | 80650 Hz | ≤ 55 % ljusstyrka inställning | 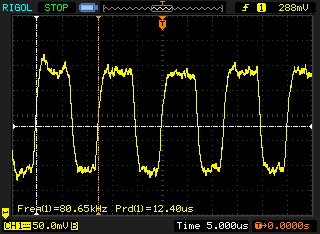 |
Displayens bakgrundsbelysning flimrar vid 80650 Hz (i värsta fall, t.ex. med PWM) Flimrande upptäckt vid en ljusstyrkeinställning på 55 % och lägre. Det ska inte finnas något flimmer eller PWM över denna ljusstyrkeinställning. Frekvensen för 80650 Hz är ganska hög, så de flesta användare som är känsliga för PWM bör inte märka något flimmer. Som jämförelse: 52 % av alla testade enheter använder inte PWM för att dämpa skärmen. Om PWM upptäcktes mättes ett medelvärde av 7772 (minst: 5 - maximum: 343500) Hz. | |||
Visa svarstider
| ↔ Svarstid svart till vitt | ||
|---|---|---|
| 37.2 ms ... stiga ↗ och falla ↘ kombinerat | ↗ 12.4 ms stiga | 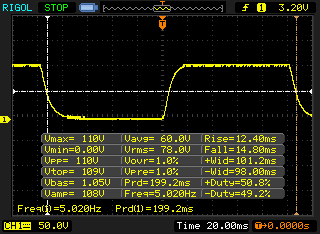 |
| ↘ 14.8 ms hösten | ||
| Skärmen visar långsamma svarsfrekvenser i våra tester och kommer att vara otillfredsställande för spelare. I jämförelse sträcker sig alla testade enheter från 0.1 (minst) till 240 (maximalt) ms. » 95 % av alla enheter är bättre. Detta innebär att den uppmätta svarstiden är sämre än genomsnittet av alla testade enheter (19.8 ms). | ||
| ↔ Svarstid 50 % grått till 80 % grått | ||
| 40.4 ms ... stiga ↗ och falla ↘ kombinerat | ↗ 22 ms stiga | 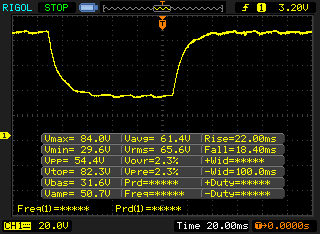 |
| ↘ 18.4 ms hösten | ||
| Skärmen visar långsamma svarsfrekvenser i våra tester och kommer att vara otillfredsställande för spelare. I jämförelse sträcker sig alla testade enheter från 0.165 (minst) till 636 (maximalt) ms. » 63 % av alla enheter är bättre. Detta innebär att den uppmätta svarstiden är sämre än genomsnittet av alla testade enheter (31 ms). | ||
| AnTuTu v6 - Total Score | |
| Apple iPad (2017) | |
| Asus ZenPad 3s 10 Z500M | |
| Amazon Fire HD 10 2017 | |
| Huawei MediaPad T3 10 | |
| Lenovo Tab 4 10 | |
| PCMark for Android | |
| Work performance score | |
| Amazon Fire HD 10 2017 | |
| Huawei MediaPad T3 10 | |
| Lenovo Tab 4 10 | |
| Asus ZenPad 3s 10 Z500M | |
| Work 2.0 performance score | |
| Amazon Fire HD 10 2017 | |
| Huawei MediaPad T3 10 | |
| Lenovo Tab 4 10 | |
| Geekbench 4.4 | |
| 64 Bit Single-Core Score | |
| Amazon Fire HD 10 2017 | |
| Lenovo Tab 4 10 | |
| Huawei MediaPad T3 10 | |
| 64 Bit Multi-Core Score | |
| Amazon Fire HD 10 2017 | |
| Lenovo Tab 4 10 | |
| Huawei MediaPad T3 10 | |
| Compute RenderScript Score | |
| Amazon Fire HD 10 2017 | |
| Lenovo Tab 4 10 | |
| GFXBench (DX / GLBenchmark) 2.7 | |
| T-Rex Onscreen | |
| Apple iPad (2017) | |
| Asus ZenPad 3s 10 Z500M | |
| Amazon Fire HD 10 2017 | |
| Huawei MediaPad T3 10 | |
| Lenovo Tab 4 10 | |
| 1920x1080 T-Rex Offscreen | |
| Apple iPad (2017) | |
| Asus ZenPad 3s 10 Z500M | |
| Amazon Fire HD 10 2017 | |
| Lenovo Tab 4 10 | |
| Huawei MediaPad T3 10 | |
| GFXBench 3.0 | |
| on screen Manhattan Onscreen OGL | |
| Apple iPad (2017) | |
| Asus ZenPad 3s 10 Z500M | |
| Amazon Fire HD 10 2017 | |
| Huawei MediaPad T3 10 | |
| Lenovo Tab 4 10 | |
| 1920x1080 1080p Manhattan Offscreen | |
| Apple iPad (2017) | |
| Asus ZenPad 3s 10 Z500M | |
| Amazon Fire HD 10 2017 | |
| Lenovo Tab 4 10 | |
| Huawei MediaPad T3 10 | |
| GFXBench 3.1 | |
| on screen Manhattan ES 3.1 Onscreen | |
| Apple iPad (2017) | |
| Amazon Fire HD 10 2017 | |
| Asus ZenPad 3s 10 Z500M | |
| 1920x1080 Manhattan ES 3.1 Offscreen | |
| Apple iPad (2017) | |
| Amazon Fire HD 10 2017 | |
| Asus ZenPad 3s 10 Z500M | |
| GFXBench | |
| on screen Car Chase Onscreen | |
| Amazon Fire HD 10 2017 | |
| Asus ZenPad 3s 10 Z500M | |
| 1920x1080 Car Chase Offscreen | |
| Amazon Fire HD 10 2017 | |
| Asus ZenPad 3s 10 Z500M | |
| Basemark ES 3.1 / Metal - offscreen Overall Score | |
| Apple iPad (2017) | |
| Octane V2 - Total Score | |
| Apple iPad (2017) | |
| Amazon Fire HD 10 2017 (Amazon Silk 61.2) | |
| Asus ZenPad 3s 10 Z500M (Chrome 55) | |
| Lenovo Tab 4 10 (Chrome 60) | |
| Huawei MediaPad T3 10 (Chrome 58) | |
| WebXPRT 2015 - Overall | |
| Apple iPad (2017) | |
| Amazon Fire HD 10 2017 (Amazon Silk 61.2) | |
| Asus ZenPad 3s 10 Z500M (Chrome 55) | |
| Huawei MediaPad T3 10 (Chrome 58) | |
| Lenovo Tab 4 10 (Chrome 60) | |
| JetStream 1.1 - 1.1 Total | |
| Apple iPad (2017) | |
| Asus ZenPad 3s 10 Z500M (Chrome 55) | |
| Amazon Fire HD 10 2017 (Amazon Silk 61.2) | |
| Huawei MediaPad T3 10 (Chrome 58) | |
| Mozilla Kraken 1.1 - Total | |
| Huawei MediaPad T3 10 (Chrome 58) | |
| Lenovo Tab 4 10 (Chrome 60) | |
| Amazon Fire HD 10 2017 (Amazon Silk 61.2) | |
| Asus ZenPad 3s 10 Z500M (Chrome 55) | |
| Apple iPad (2017) | |
* ... mindre är bättre
| Amazon Fire HD 10 2017 | Asus ZenPad 3s 10 Z500M | Lenovo Tab 4 10 | Huawei MediaPad T3 10 | |
|---|---|---|---|---|
| AndroBench 3-5 | -16% | 17% | 12% | |
| Sequential Read 256KB (MB/s) | 262.2 | 209.3 -20% | 275 5% | 154.7 -41% |
| Sequential Write 256KB (MB/s) | 147.7 | 136.5 -8% | 45.3 -69% | 41.1 -72% |
| Random Read 4KB (MB/s) | 27.72 | 24.85 -10% | 32.3 17% | 50 80% |
| Random Write 4KB (MB/s) | 9.37 | 6.8 -27% | 8.9 -5% | 5.3 -43% |
| Sequential Read 256KB SDCard (MB/s) | 55.5 ? | 45.15 ? -19% | 84.5 52% | 83 ? 50% |
| Sequential Write 256KB SDCard (MB/s) | 30.14 ? | 26.9 ? -11% | 59.9 99% | 58.7 ? 95% |
| Asphalt 8: Airborne | |||
| Inställningar | Värde | ||
| high | 22 fps | ||
| very low | 30 fps | ||
| Temple Run 2 | |||
| Inställningar | Värde | ||
| default | 60 fps | ||
| Dead Trigger 2 | |||
| Inställningar | Värde | ||
| high | 30 fps | ||
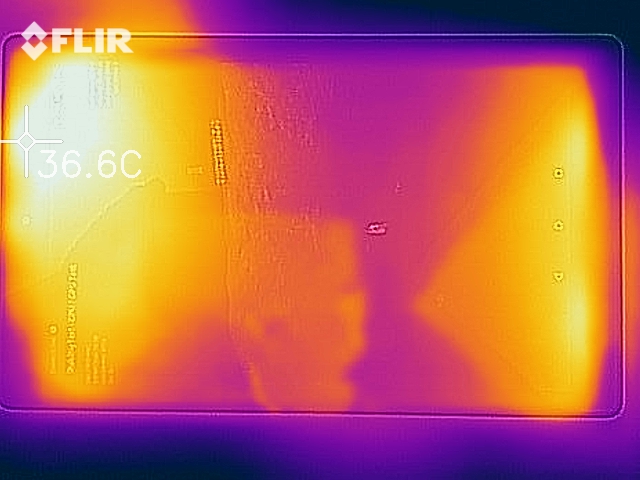
(+) Den maximala temperaturen på ovansidan är 36.1 °C / 97 F, jämfört med genomsnittet av 33.6 °C / 92 F , allt från 20.7 till 53.2 °C för klassen Tablet.
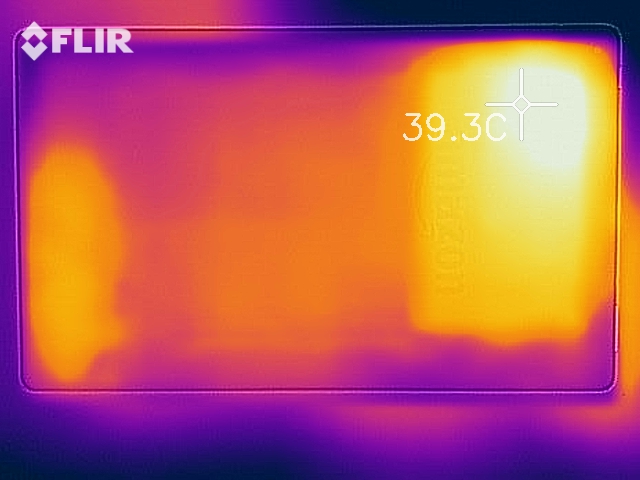
(+) Botten värms upp till maximalt 39.9 °C / 104 F, jämfört med genomsnittet av 33.2 °C / 92 F
(+) Vid tomgångsbruk är medeltemperaturen för ovansidan 25.2 °C / 77 F, jämfört med enhetsgenomsnittet på 30 °C / ### class_avg_f### F.
Amazon Fire HD 10 2017 ljudanalys
(+) | högtalare kan spela relativt högt (86.1 dB)
Bas 100 - 315 Hz
(-) | nästan ingen bas - i genomsnitt 24.1% lägre än medianen
(±) | linjäriteten för basen är genomsnittlig (10.6% delta till föregående frekvens)
Mellan 400 - 2000 Hz
(+) | balanserad mellan - endast 4.8% från medianen
(+) | mids är linjära (5.9% delta till föregående frekvens)
Högsta 2 - 16 kHz
(±) | högre toppar - i genomsnitt 5.8% högre än medianen
(+) | toppar är linjära (6.5% delta till föregående frekvens)
Totalt 100 - 16 000 Hz
(±) | linjäriteten för det totala ljudet är genomsnittlig (21.5% skillnad mot median)
Jämfört med samma klass
» 65% av alla testade enheter i den här klassen var bättre, 6% liknande, 29% sämre
» Den bästa hade ett delta på 7%, genomsnittet var 20%, sämst var 129%
Jämfört med alla testade enheter
» 61% av alla testade enheter var bättre, 7% liknande, 33% sämre
» Den bästa hade ett delta på 4%, genomsnittet var 24%, sämst var 134%
Asus ZenPad 3s 10 Z500M ljudanalys
(+) | högtalare kan spela relativt högt (95 dB)
Bas 100 - 315 Hz
(-) | nästan ingen bas - i genomsnitt 24% lägre än medianen
(+) | basen är linjär (5% delta till föregående frekvens)
Mellan 400 - 2000 Hz
(±) | reducerade mids - i genomsnitt 5.4% lägre än median
(+) | mids är linjära (4.2% delta till föregående frekvens)
Högsta 2 - 16 kHz
(±) | högre toppar - i genomsnitt 5.7% högre än medianen
(+) | toppar är linjära (5.3% delta till föregående frekvens)
Totalt 100 - 16 000 Hz
(±) | linjäriteten för det totala ljudet är genomsnittlig (18.4% skillnad mot median)
Jämfört med samma klass
» 47% av alla testade enheter i den här klassen var bättre, 6% liknande, 46% sämre
» Den bästa hade ett delta på 7%, genomsnittet var 20%, sämst var 129%
Jämfört med alla testade enheter
» 41% av alla testade enheter var bättre, 8% liknande, 52% sämre
» Den bästa hade ett delta på 4%, genomsnittet var 24%, sämst var 134%
Huawei MediaPad T3 10 ljudanalys
(+) | högtalare kan spela relativt högt (87.2 dB)
Bas 100 - 315 Hz
(-) | nästan ingen bas - i genomsnitt 32.3% lägre än medianen
(±) | linjäriteten för basen är genomsnittlig (9.4% delta till föregående frekvens)
Mellan 400 - 2000 Hz
(±) | reducerade mids - i genomsnitt 5.6% lägre än median
(±) | linjäriteten för mids är genomsnittlig (7.6% delta till föregående frekvens)
Högsta 2 - 16 kHz
(±) | högre toppar - i genomsnitt 7.8% högre än medianen
(+) | toppar är linjära (4.9% delta till föregående frekvens)
Totalt 100 - 16 000 Hz
(±) | linjäriteten för det totala ljudet är genomsnittlig (26.7% skillnad mot median)
Jämfört med samma klass
» 84% av alla testade enheter i den här klassen var bättre, 4% liknande, 13% sämre
» Den bästa hade ett delta på 7%, genomsnittet var 20%, sämst var 129%
Jämfört med alla testade enheter
» 82% av alla testade enheter var bättre, 4% liknande, 14% sämre
» Den bästa hade ett delta på 4%, genomsnittet var 24%, sämst var 134%
| Av/Standby | |
| Låg belastning | |
| Hög belastning |
|
Förklaring:
min: | |
| Amazon Fire HD 10 2017 6300 mAh | Asus ZenPad 3s 10 Z500M 5900 mAh | Lenovo Tab 4 10 7000 mAh | Apple iPad (2017) 8.827 mAh | |
|---|---|---|---|---|
| Power Consumption | -15% | 22% | -50% | |
| Idle Minimum * (Watt) | 1.55 | 1.59 -3% | 1.09 30% | 2.06 -33% |
| Idle Average * (Watt) | 4.17 | 4.14 1% | 3.71 11% | 7.42 -78% |
| Idle Maximum * (Watt) | 4.25 | 4.23 -0% | 3.84 10% | 7.47 -76% |
| Load Average * (Watt) | 7.13 | 10.89 -53% | 5.07 29% | 9.45 -33% |
| Load Maximum * (Watt) | 9.63 | 11.58 -20% | 6.88 29% | 12.31 -28% |
* ... mindre är bättre
| Amazon Fire HD 10 2017 6300 mAh | Asus ZenPad 3s 10 Z500M 5900 mAh | Lenovo Tab 4 10 7000 mAh | Huawei MediaPad T3 10 4800 mAh | Apple iPad (2017) 8.827 mAh | |
|---|---|---|---|---|---|
| Batteridrifttid | 8% | 17% | -7% | 31% | |
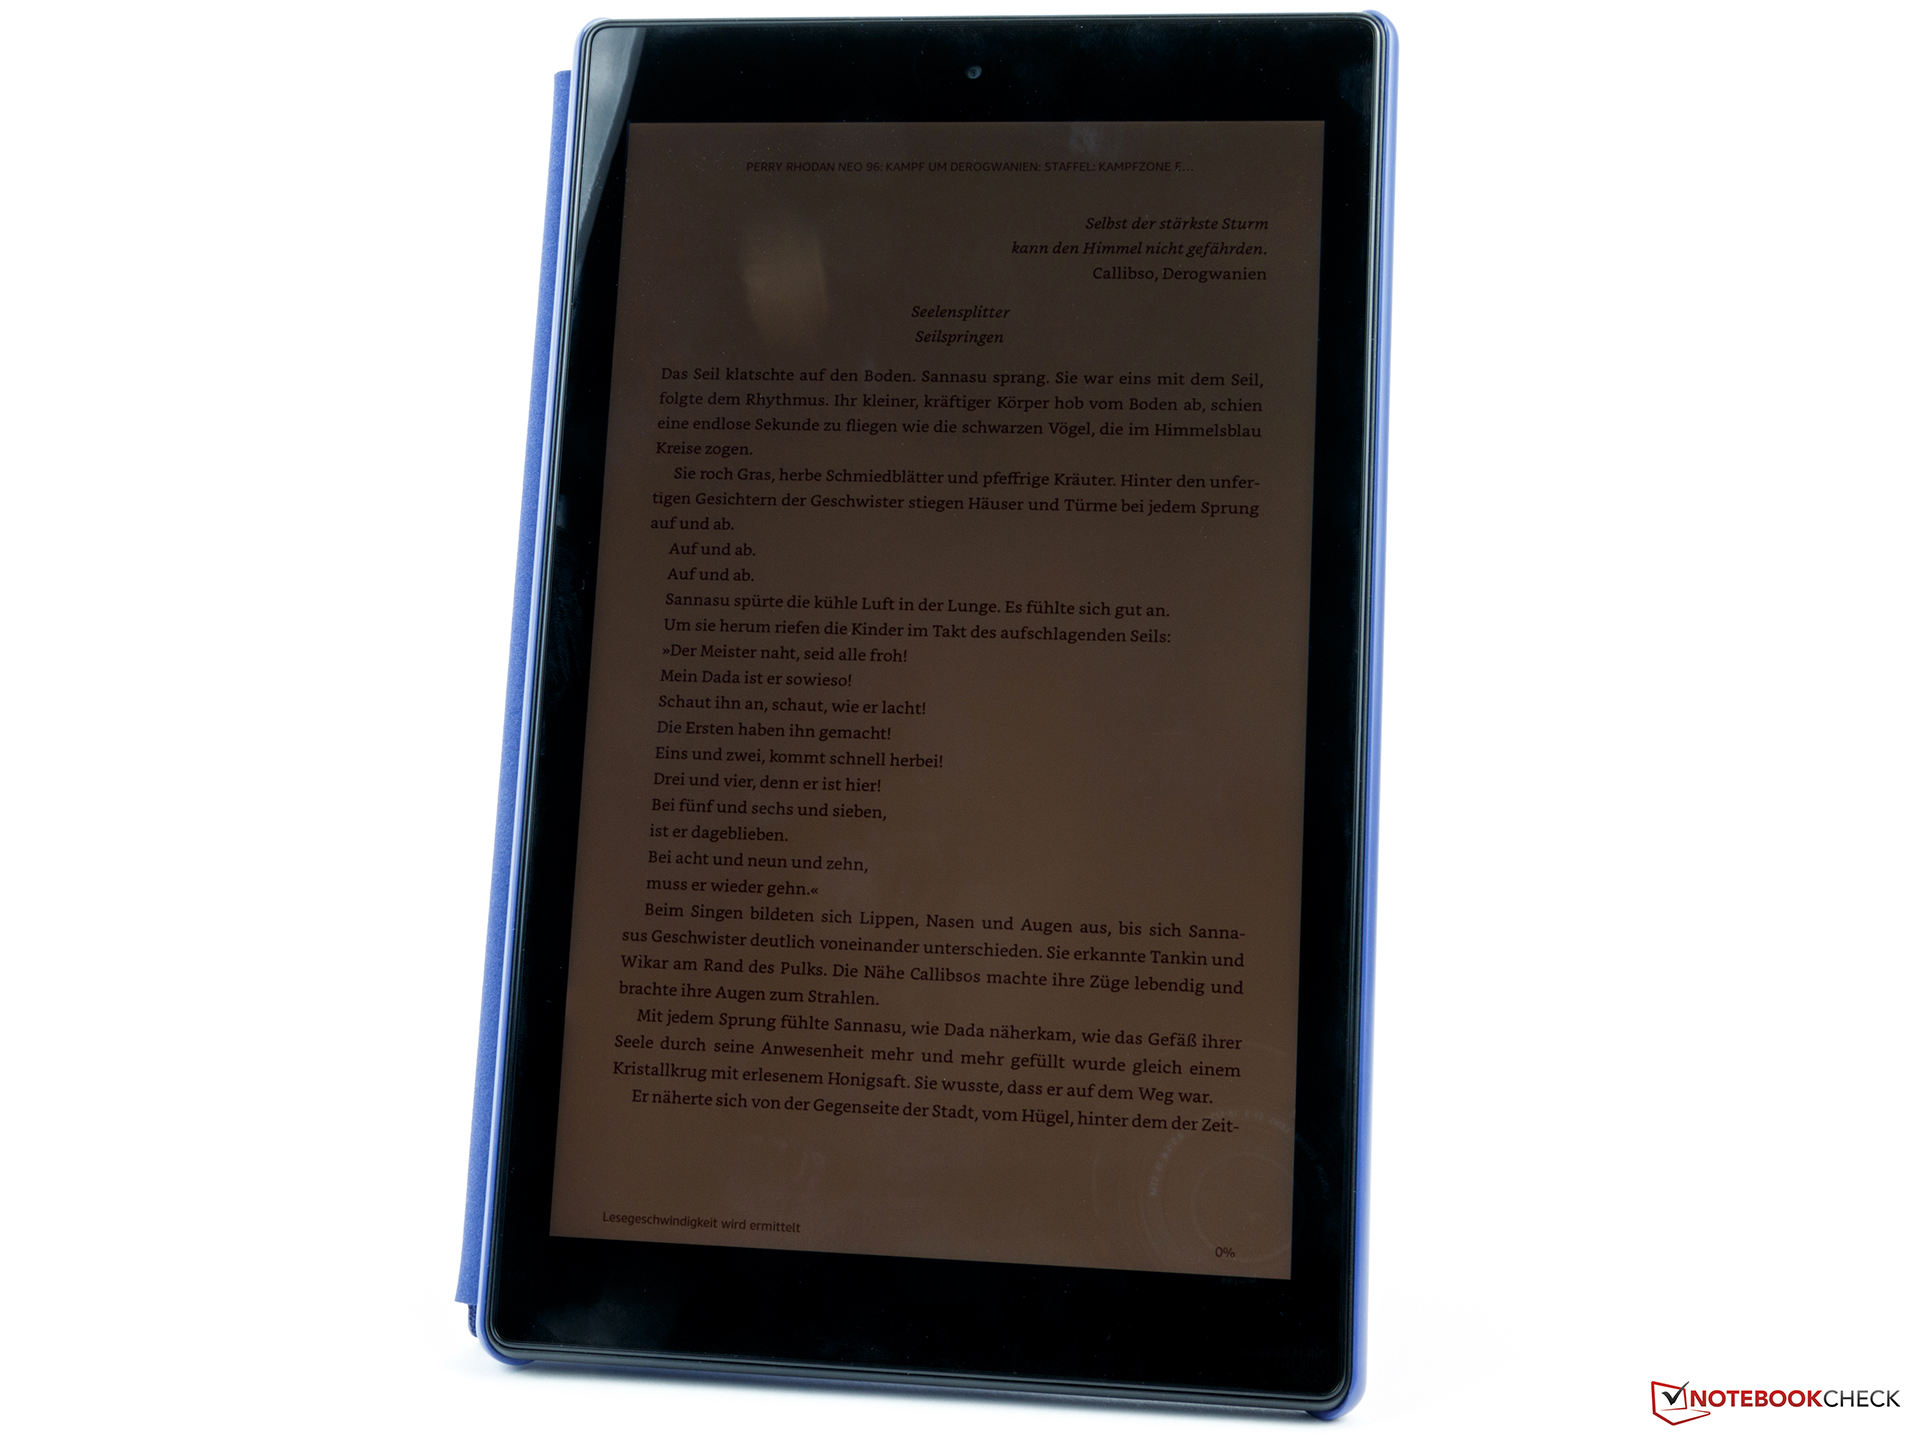
| Reader / Idle (h) | 16 | 24.2 51% | 18.9 18% | 24.9 56% | |
| H.264 (h) | 9.8 | 10 2% | 8.8 -10% | 14.1 44% | |
| WiFi v1.3 (h) | 9 | 8.6 -4% | 10.5 17% | 7.3 -19% | 12.7 41% |
| Load (h) | 4.6 | 3.8 -17% | 3.8 -17% | 3.8 -17% |
För
Emot

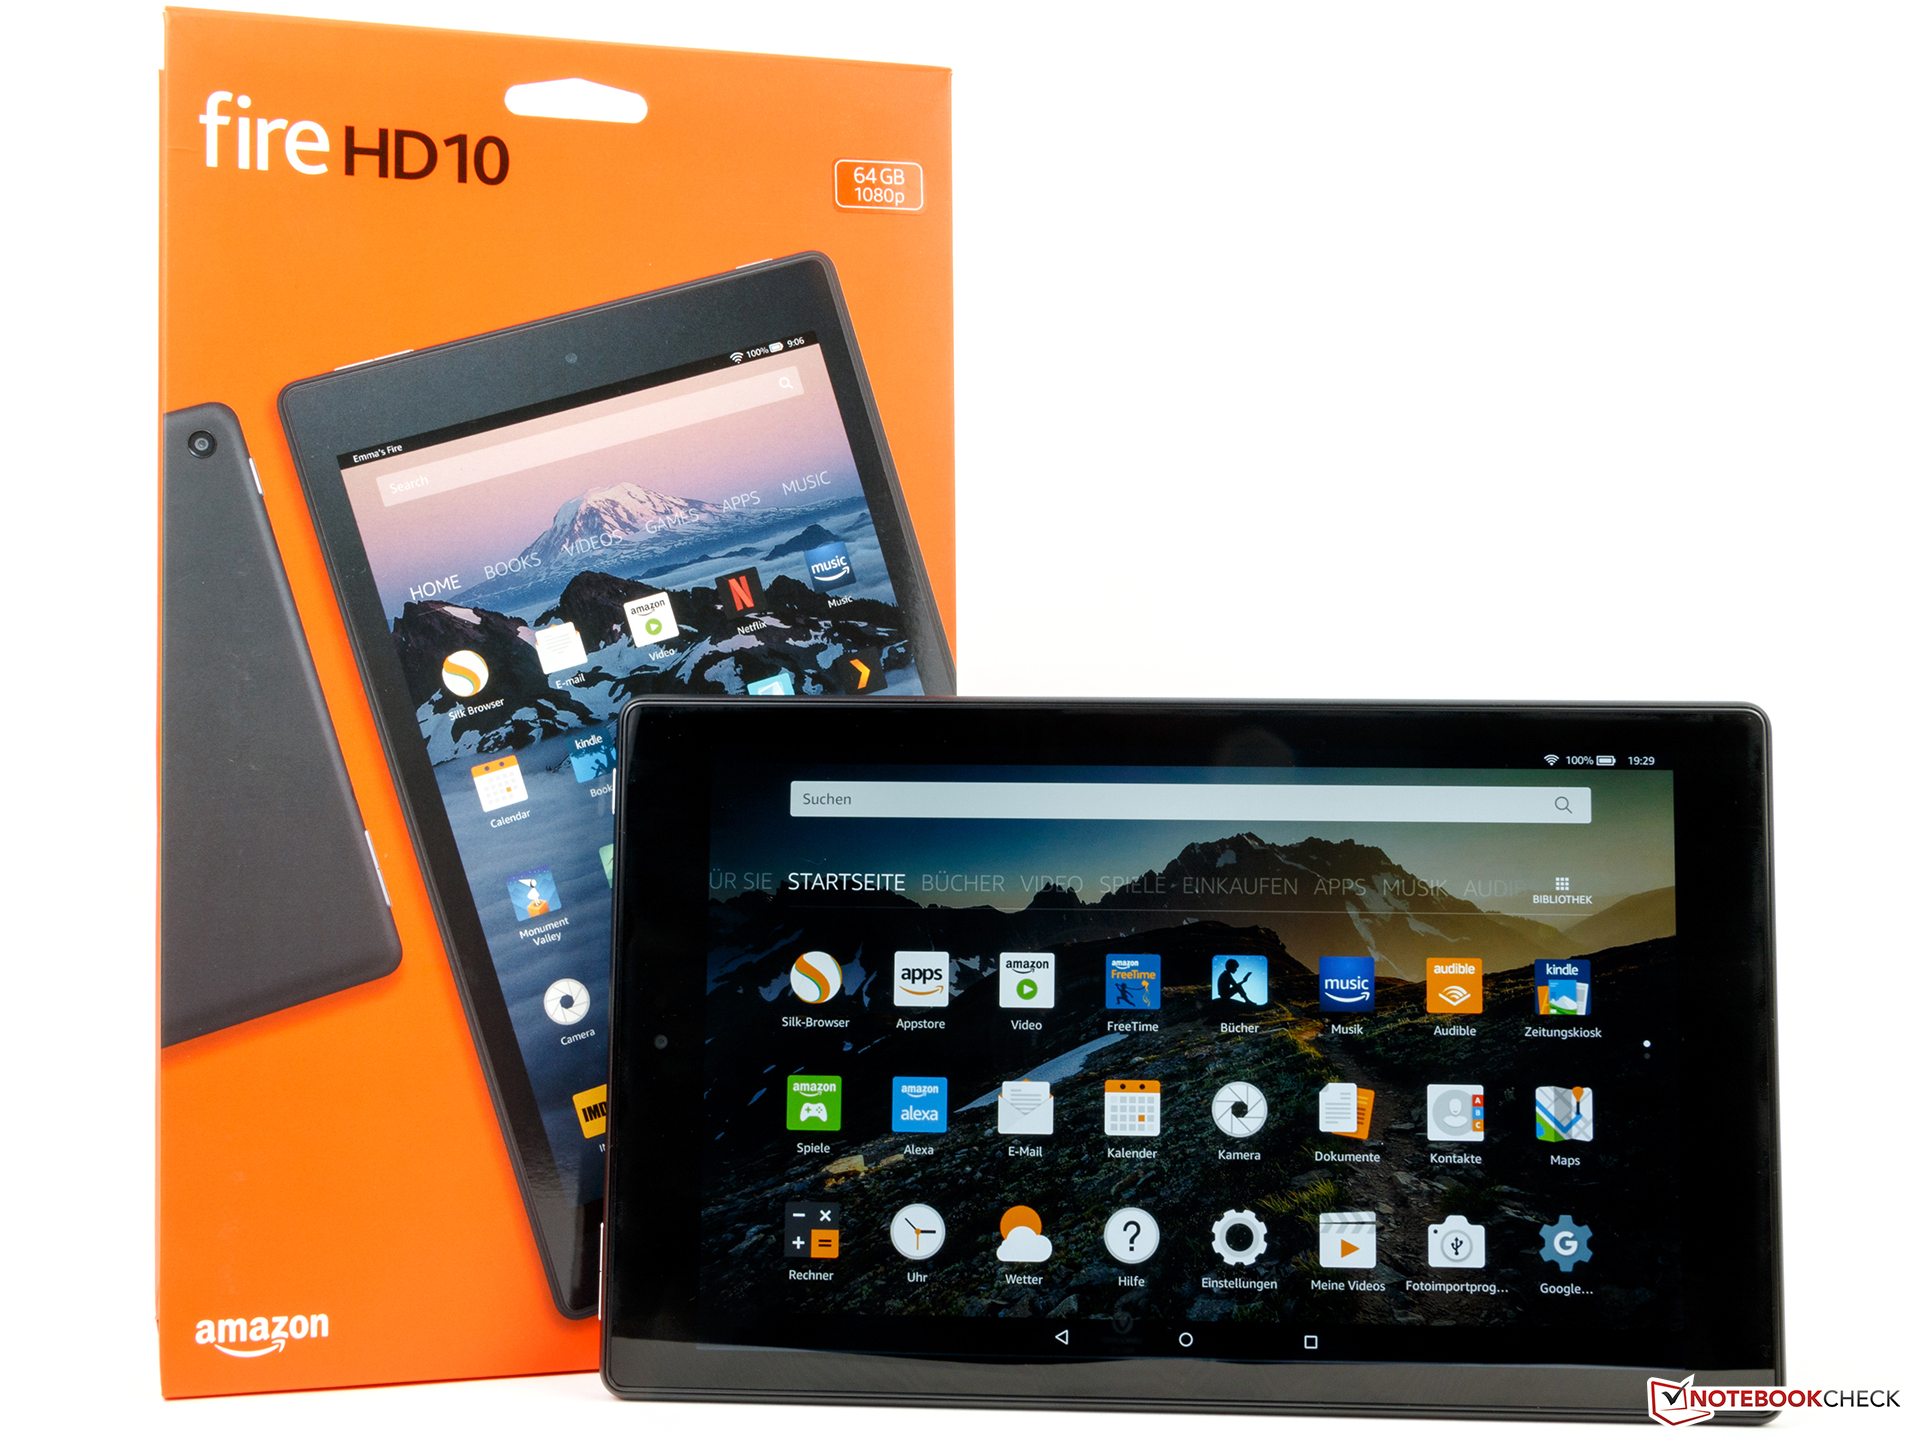
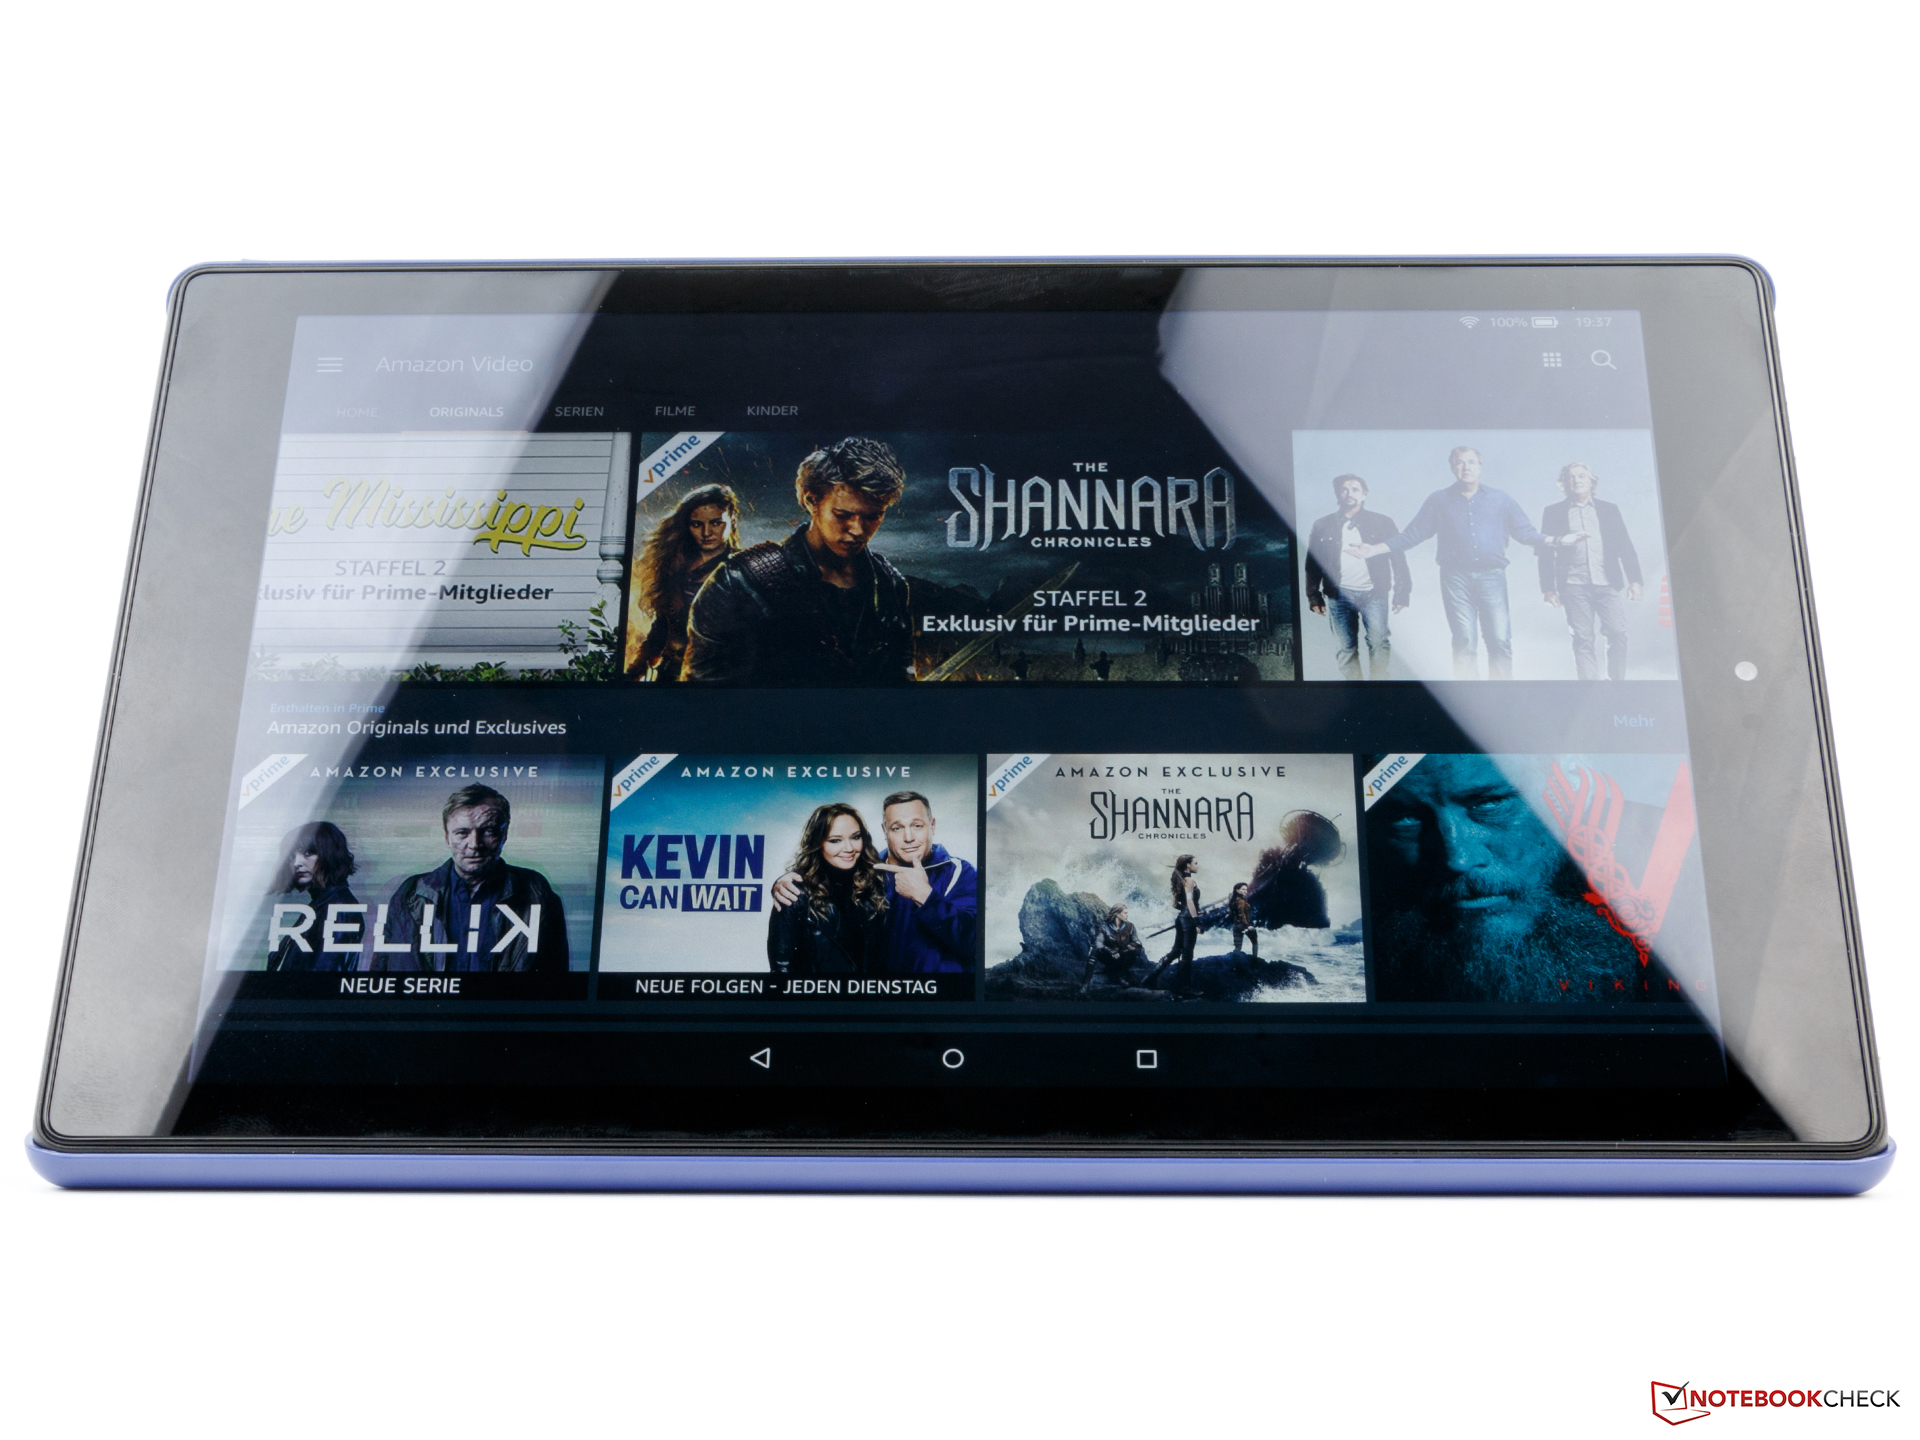
Dom som köper en sjunde generationens Amazon Fire HD 10-surfplatta kommer få en multimediaspecialist i Amazons ekosystem utan några större tillkortakommanden. Det är just det som gör enheten till ett riktigt alternativ som kan fås för ett ganska lågt pris.
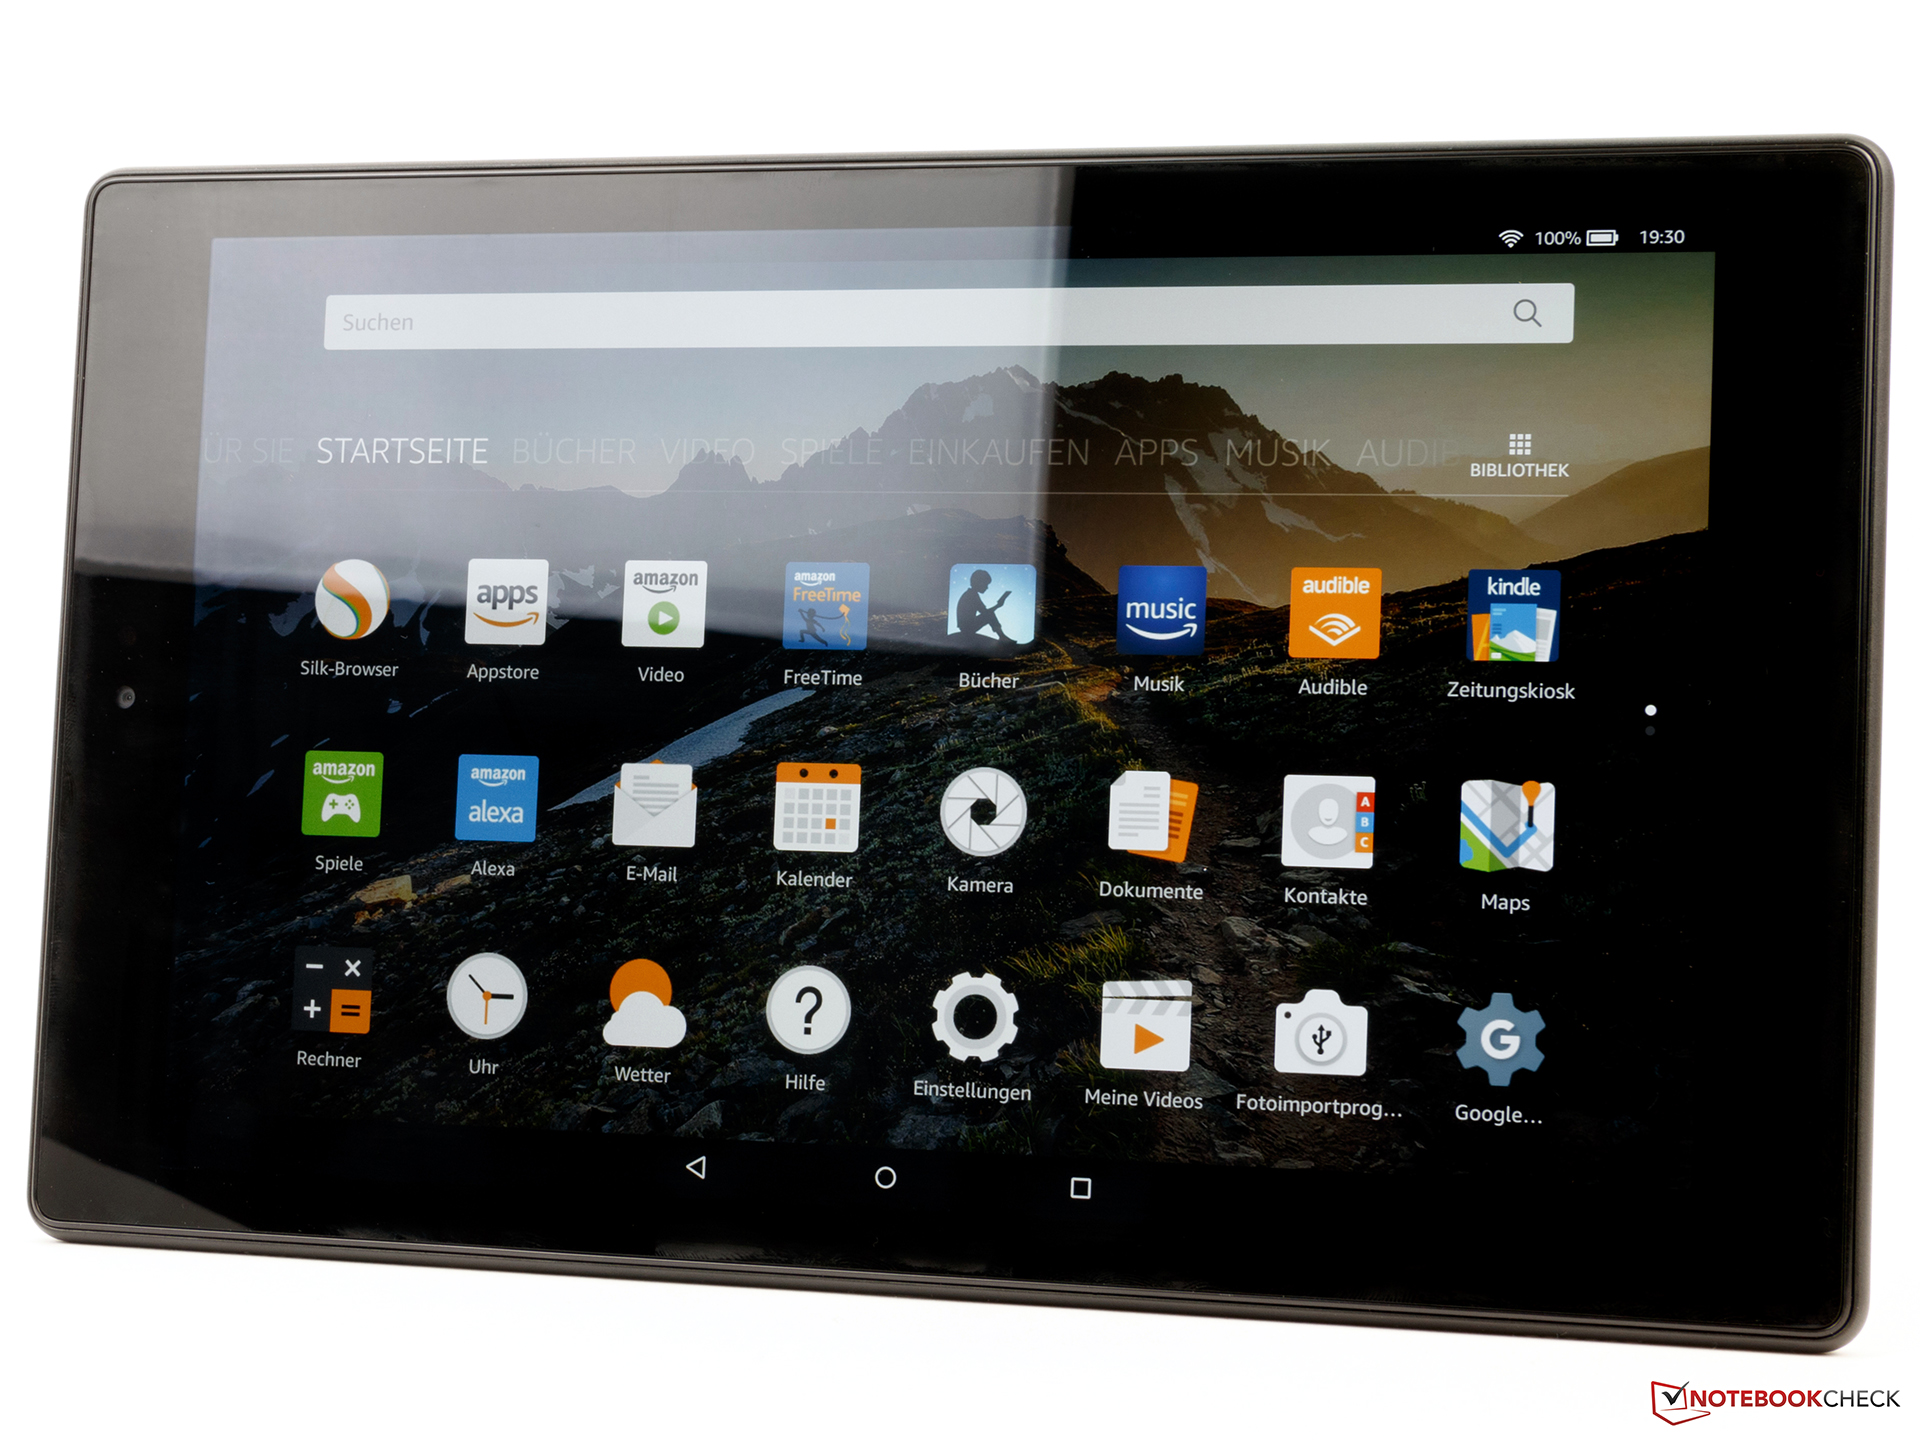
På plus-sidan finns en bra skärm, hyfsade högtalare, snabb Wi-Fi och ett snabbt chipset som annars bara används i dyrare enheter. Å andra sidan, den gamla grundmjukvaran som troligen inte kommer få några nya uppdateringar är en nackdel.
Amazon Fire HD 10 är ett prismedvetet alternativ för mediakonsumenter.
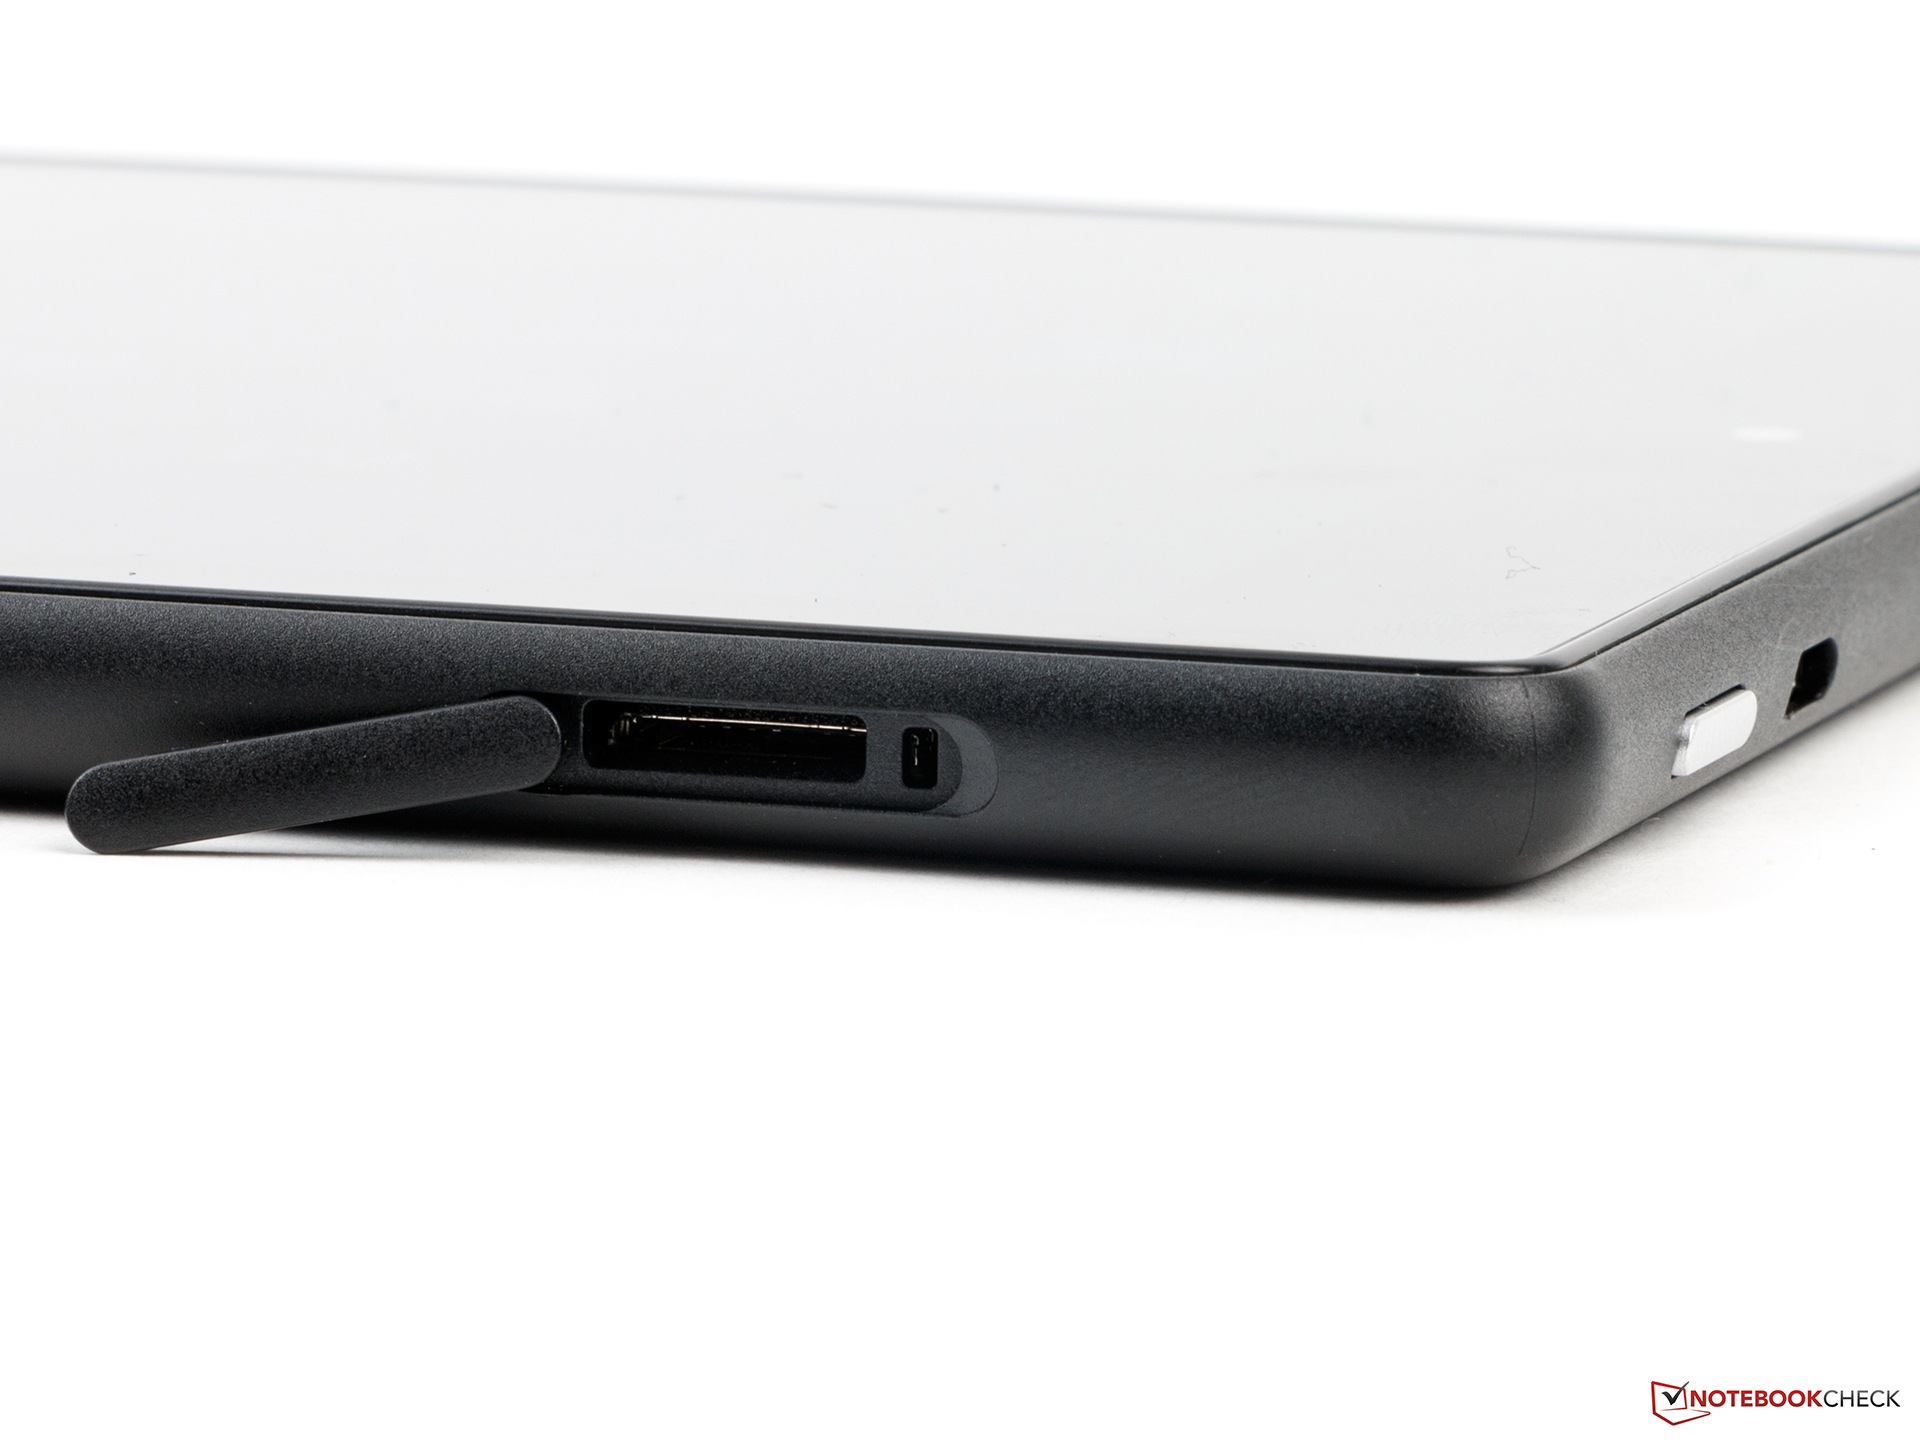
Det ska sägas, funktioner såsom NFC, aptX, GPS, Miracast, snabbladdning eller ett bättre utbud av sensorer saknas. Vidare så fungerade Alexa inte särskild smidigt, även om detta troligen kommer lösa sig i framtiden genom uppdateringar. Amazon erbjuder hursomhelst en stark kombination till ett attraktivt pris.
Amazon Fire HD 10 2017
- 11/05/2019 v7 (old)
Daniel Schmidt