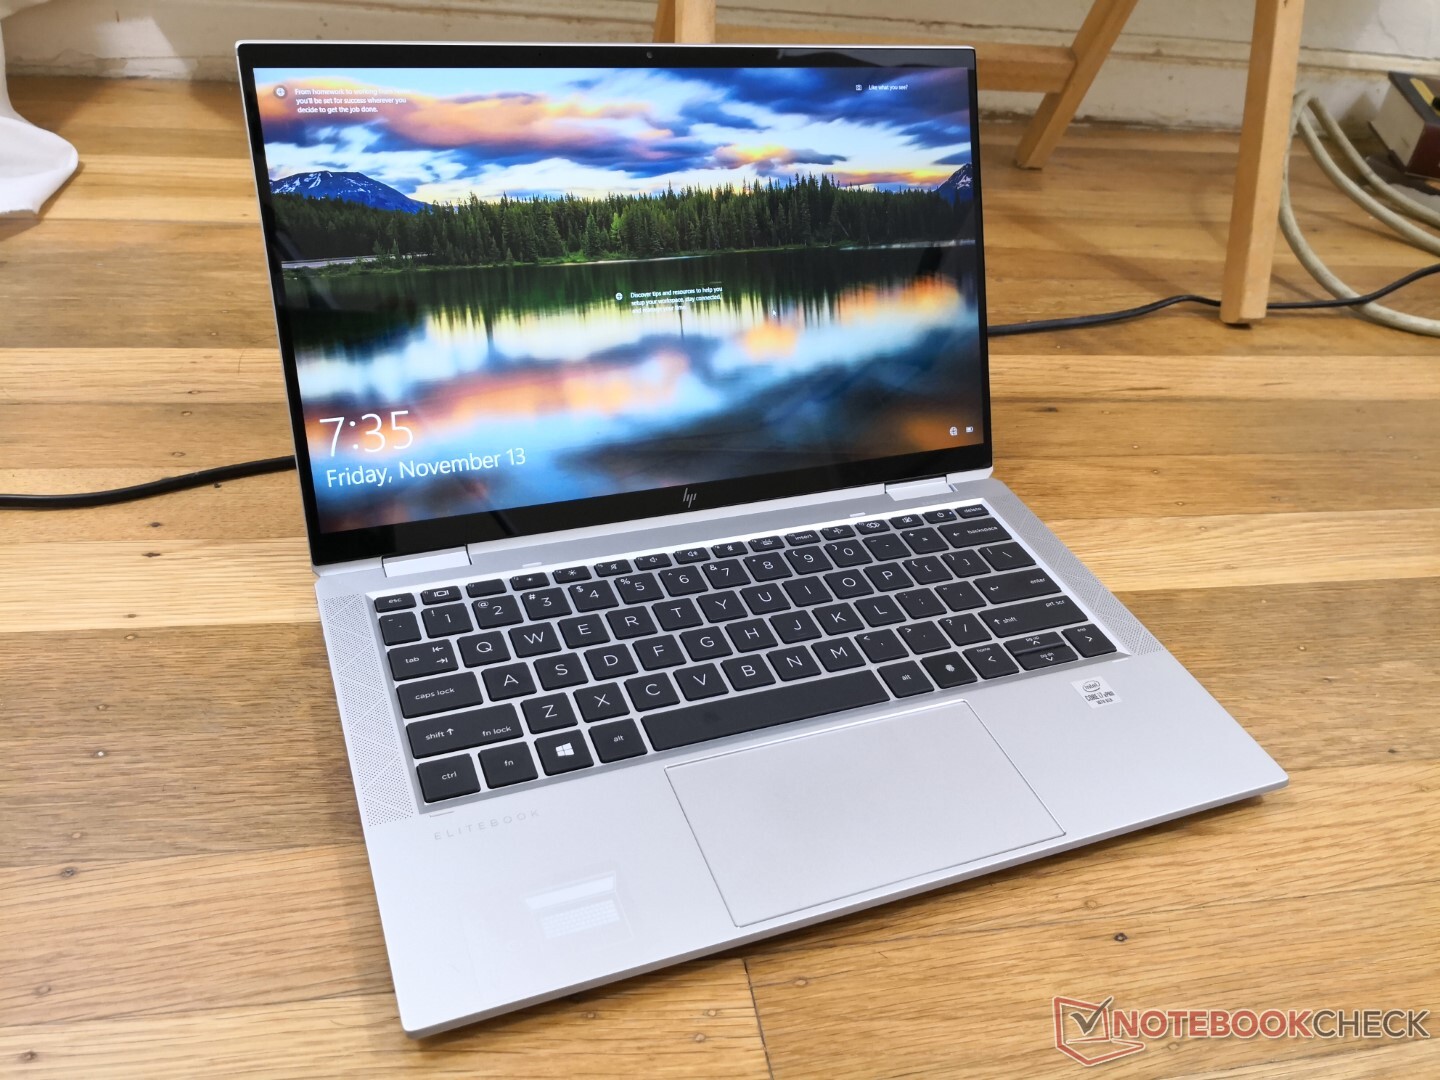
Test: HP EliteBook x360 1030 G7 - En Spectre/Dragonfly-hybrid (Sammanfattning)
Gradering | Datum | Modell | Vikt | Höjd | Storlek | Upplösning | Pris |
|---|---|---|---|---|---|---|---|
| 90 % v7 (old) | 11/2020 | HP EliteBook x360 1030 G7 i7-10810U, UHD Graphics 620 | 1.2 kg | 16 mm | 13.30" | 1920x1080 | |
| 89 % v7 (old) | 03/2020 | HP EliteBook x360 1030 G4 7YL44EA i7-8565U, UHD Graphics 620 | 1.3 kg | 16 mm | 13.30" | 1920x1080 | |
| 86.3 % v7 (old) | 10/2019 | Dell XPS 13 7390 2-in-1 Core i7 i7-1065G7, Iris Plus Graphics G7 (Ice Lake 64 EU) | 1.3 kg | 13 mm | 13.40" | 1920x1200 | |
| 87.9 % v7 (old) | 02/2021 | Lenovo ThinkPad X13 Yoga 20SX0004GE i7-10510U, UHD Graphics 620 | 1.3 kg | 15.95 mm | 13.30" | 1920x1080 | |
| 86.3 % v7 (old) | 10/2020 | Asus ZenBook Flip S UX371 i7-1165G7, Iris Xe G7 96EUs | 1.2 kg | 13.9 mm | 13.30" | 3840x2160 | |
| 87.4 % v7 (old) | 06/2020 | Huawei MateBook X Pro 2020 i7 i7-10510U, GeForce MX250 | 1.3 kg | 14.6 mm | 13.90" | 3000x2000 |


| |||||||||||||||||||||||||
Distribution av ljusstyrkan: 89 %
Mitt på batteriet: 425.4 cd/m²
Kontrast: 1519:1 (Svärta: 0.28 cd/m²)
ΔE ColorChecker Calman: 4.39 | ∀{0.5-29.43 Ø4.72}
calibrated: 1.65
ΔE Greyscale Calman: 3.9 | ∀{0.09-98 Ø4.97}
96.6% sRGB (Argyll 1.6.3 3D)
61.7% AdobeRGB 1998 (Argyll 1.6.3 3D)
67.7% AdobeRGB 1998 (Argyll 3D)
97% sRGB (Argyll 3D)
66.1% Display P3 (Argyll 3D)
Gamma: 1.87
CCT: 6758 K
| HP EliteBook x360 1030 G7 Chi Mei CMN13A9, IPS, 13.3", 1920x1080 | HP EliteBook x360 1030 G4 7YL44EA InfoVison IVO857A, IPS, 13.3", 1920x1080 | Dell XPS 13 7390 2-in-1 Core i7 Sharp LQ134N1, IPS, 13.4", 1920x1200 | Lenovo ThinkPad X13 Yoga 20SX0004GE N133HCG-GR3, IPS, 13.3", 1920x1080 | Asus ZenBook Flip S UX371 SDC4147, OLED, 13.3", 3840x2160 | Huawei MateBook X Pro 2020 i7 JDI LPM139M422A, LTPS, 13.9", 3000x2000 | |
|---|---|---|---|---|---|---|
| Display | 3% | 5% | 2% | 34% | 1% | |
| Display P3 Coverage (%) | 66.1 | 69.3 5% | 69.9 6% | 67.2 2% | 99.9 51% | 66.6 1% |
| sRGB Coverage (%) | 97 | 92.2 -5% | 99.2 2% | 98.1 1% | 100 3% | 99.4 2% |
| AdobeRGB 1998 Coverage (%) | 67.7 | 72.9 8% | 71.5 6% | 69 2% | 100 48% | 68.6 1% |
| Response Times | -30% | 16% | 10% | 94% | 11% | |
| Response Time Grey 50% / Grey 80% * (ms) | 56.4 ? | 74 ? -31% | 47.6 ? 16% | 56 ? 1% | 2 ? 96% | 49.6 ? 12% |
| Response Time Black / White * (ms) | 34.4 ? | 44 ? -28% | 29.2 ? 15% | 28 ? 19% | 2.8 ? 92% | 30.8 ? 10% |
| PWM Frequency (Hz) | 26040 ? | 952 ? | 2500 ? | 59.5 ? | 29070 ? | |
| Screen | -1% | 15% | 22% | 43% | 27% | |
| Brightness middle (cd/m²) | 425.4 | 542 27% | 549.8 29% | 401 -6% | 365 -14% | 557 31% |
| Brightness (cd/m²) | 407 | 653 60% | 520 28% | 383 -6% | 372 -9% | 532 31% |
| Brightness Distribution (%) | 89 | 70 -21% | 86 -3% | 91 2% | 91 2% | 87 -2% |
| Black Level * (cd/m²) | 0.28 | 0.22 21% | 0.39 -39% | 0.16 43% | 0.03 89% | 0.33 -18% |
| Contrast (:1) | 1519 | 2464 62% | 1410 -7% | 2506 65% | 12167 701% | 1688 11% |
| Colorchecker dE 2000 * | 4.39 | 4.72 -8% | 2.12 52% | 2.6 41% | 7.6 -73% | 1.4 68% |
| Colorchecker dE 2000 max. * | 6.73 | 10.5 -56% | 3.66 46% | 4.2 38% | 12.9 -92% | 2.5 63% |
| Colorchecker dE 2000 calibrated * | 1.65 | 1.37 17% | 0.9 45% | 4.1 -148% | 0.7 58% | |
| Greyscale dE 2000 * | 3.9 | 7.71 -98% | 2.6 33% | 3.3 15% | 5.4 -38% | 2 49% |
| Gamma | 1.87 118% | 2.31 95% | 2.3 96% | 2.01 109% | 1.6 138% | 2.14 103% |
| CCT | 6758 96% | 6670 97% | 6884 94% | 6076 107% | 6327 103% | 6689 97% |
| Color Space (Percent of AdobeRGB 1998) (%) | 61.7 | 63 2% | 65.4 6% | 62.7 2% | 92 49% | 62.5 1% |
| Color Space (Percent of sRGB) (%) | 96.6 | 100 4% | 99.7 3% | 98.1 2% | 100 4% | 99.5 3% |
| Totalt genomsnitt (program/inställningar) | -9% /
-4% | 12% /
13% | 11% /
17% | 57% /
48% | 13% /
20% |
* ... mindre är bättre
Visa svarstider
| ↔ Svarstid svart till vitt | ||
|---|---|---|
| 34.4 ms ... stiga ↗ och falla ↘ kombinerat | ↗ 16.4 ms stiga | 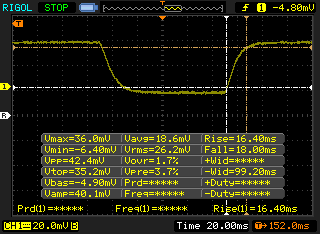 |
| ↘ 18 ms hösten | ||
| Skärmen visar långsamma svarsfrekvenser i våra tester och kommer att vara otillfredsställande för spelare. I jämförelse sträcker sig alla testade enheter från 0.1 (minst) till 240 (maximalt) ms. » 92 % av alla enheter är bättre. Detta innebär att den uppmätta svarstiden är sämre än genomsnittet av alla testade enheter (19.9 ms). | ||
| ↔ Svarstid 50 % grått till 80 % grått | ||
| 56.4 ms ... stiga ↗ och falla ↘ kombinerat | ↗ 26 ms stiga | 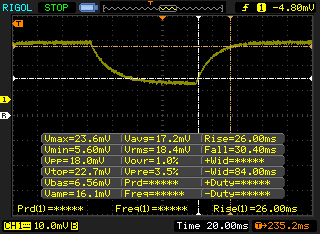 |
| ↘ 30.4 ms hösten | ||
| Skärmen visar långsamma svarsfrekvenser i våra tester och kommer att vara otillfredsställande för spelare. I jämförelse sträcker sig alla testade enheter från 0.165 (minst) till 636 (maximalt) ms. » 93 % av alla enheter är bättre. Detta innebär att den uppmätta svarstiden är sämre än genomsnittet av alla testade enheter (31.1 ms). | ||
Skärmflimmer / PWM (Puls-Width Modulation)
| Skärmflimmer / PWM upptäckt | 26040 Hz | ≤ 62 % ljusstyrka inställning | 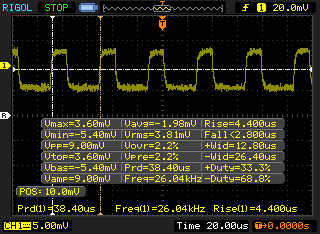 |
Displayens bakgrundsbelysning flimrar vid 26040 Hz (i värsta fall, t.ex. med PWM) Flimrande upptäckt vid en ljusstyrkeinställning på 62 % och lägre. Det ska inte finnas något flimmer eller PWM över denna ljusstyrkeinställning. Frekvensen för 26040 Hz är ganska hög, så de flesta användare som är känsliga för PWM bör inte märka något flimmer. Som jämförelse: 52 % av alla testade enheter använder inte PWM för att dämpa skärmen. Om PWM upptäcktes mättes ett medelvärde av 7784 (minst: 5 - maximum: 343500) Hz. | |||
Cinebench R15: CPU Multi 64Bit | CPU Single 64Bit
Blender: v2.79 BMW27 CPU
7-Zip 18.03: 7z b 4 -mmt1 | 7z b 4
Geekbench 5.5: Single-Core | Multi-Core
HWBOT x265 Benchmark v2.2: 4k Preset
LibreOffice : 20 Documents To PDF
R Benchmark 2.5: Overall mean
| Cinebench R20 / CPU (Multi Core) | |
| HP ProBook 455 G7-175W8EA | |
| Dell XPS 13 7390 Core i7-10710U | |
| HP ProBook x360 435 G7, Ryzen 5 4500U | |
| Dell XPS 13 9310 Core i7 FHD | |
| Genomsnitt Intel Core i7-10810U (1498 - 2344, n=5) | |
| HP EliteBook x360 1030 G7 | |
| Asus Zenbook S UX393JA | |
| Lenovo ThinkPad X13-20T20033GE | |
| HP Envy 13-ba0001ng | |
| HP EliteBook x360 830 G6 | |
| HP Elite Dragonfly-8MK79EA | |
| Cinebench R20 / CPU (Single Core) | |
| Dell XPS 13 9310 Core i7 FHD | |
| HP ProBook 455 G7-175W8EA | |
| Dell XPS 13 7390 Core i7-10710U | |
| HP ProBook x360 435 G7, Ryzen 5 4500U | |
| Asus Zenbook S UX393JA | |
| HP EliteBook x360 1030 G7 | |
| HP Envy 13-ba0001ng | |
| Genomsnitt Intel Core i7-10810U (396 - 447, n=5) | |
| HP EliteBook x360 830 G6 | |
| HP Elite Dragonfly-8MK79EA | |
| Lenovo ThinkPad X13-20T20033GE | |
| Cinebench R15 / CPU Multi 64Bit | |
| Dell XPS 13 7390 Core i7-10710U | |
| HP ProBook 455 G7-175W8EA | |
| Dell XPS 13 9310 Core i7 FHD | |
| HP ProBook x360 435 G7, Ryzen 5 4500U | |
| Genomsnitt Intel Core i7-10810U (623 - 1064, n=4) | |
| HP EliteBook x360 1030 G7 | |
| Lenovo ThinkPad X13-20T20033GE | |
| Asus Zenbook S UX393JA | |
| HP Envy 13-ba0001ng | |
| HP EliteBook x360 830 G6 | |
| HP Elite Dragonfly-8MK79EA | |
| Cinebench R15 / CPU Single 64Bit | |
| Dell XPS 13 9310 Core i7 FHD | |
| HP EliteBook x360 1030 G7 | |
| HP ProBook 455 G7-175W8EA | |
| Dell XPS 13 7390 Core i7-10710U | |
| Asus Zenbook S UX393JA | |
| HP Envy 13-ba0001ng | |
| Genomsnitt Intel Core i7-10810U (161 - 183, n=5) | |
| HP ProBook x360 435 G7, Ryzen 5 4500U | |
| Lenovo ThinkPad X13-20T20033GE | |
| HP EliteBook x360 830 G6 | |
| HP Elite Dragonfly-8MK79EA | |
| Blender / v2.79 BMW27 CPU | |
| HP Elite Dragonfly-8MK79EA | |
| HP Envy 13-ba0001ng | |
| Asus Zenbook S UX393JA | |
| Lenovo ThinkPad X13-20T20033GE | |
| Genomsnitt Intel Core i7-10810U (571 - 875, n=5) | |
| Dell XPS 13 9310 Core i7 FHD | |
| HP EliteBook x360 1030 G7 | |
| Dell XPS 13 7390 Core i7-10710U | |
| HP ProBook x360 435 G7, Ryzen 5 4500U | |
| HP ProBook 455 G7-175W8EA | |
| 7-Zip 18.03 / 7z b 4 -mmt1 | |
| Dell XPS 13 9310 Core i7 FHD | |
| HP Envy 13-ba0001ng | |
| Genomsnitt Intel Core i7-10810U (4398 - 4794, n=5) | |
| HP EliteBook x360 1030 G7 | |
| Asus Zenbook S UX393JA | |
| HP EliteBook x360 830 G6 | |
| Dell XPS 13 7390 Core i7-10710U | |
| Lenovo ThinkPad X13-20T20033GE | |
| HP ProBook x360 435 G7, Ryzen 5 4500U | |
| HP ProBook 455 G7-175W8EA | |
| HP Elite Dragonfly-8MK79EA | |
| 7-Zip 18.03 / 7z b 4 | |
| HP ProBook 455 G7-175W8EA | |
| Dell XPS 13 7390 Core i7-10710U | |
| HP ProBook x360 435 G7, Ryzen 5 4500U | |
| HP EliteBook x360 1030 G7 | |
| Genomsnitt Intel Core i7-10810U (16072 - 25244, n=5) | |
| Dell XPS 13 9310 Core i7 FHD | |
| Asus Zenbook S UX393JA | |
| Lenovo ThinkPad X13-20T20033GE | |
| HP Envy 13-ba0001ng | |
| HP EliteBook x360 830 G6 | |
| HP Elite Dragonfly-8MK79EA | |
| Geekbench 5.5 / Single-Core | |
| Dell XPS 13 9310 Core i7 FHD | |
| Asus Zenbook S UX393JA | |
| Genomsnitt Intel Core i7-10810U (1219 - 1274, n=5) | |
| HP EliteBook x360 1030 G7 | |
| HP Envy 13-ba0001ng | |
| HP ProBook 455 G7-175W8EA | |
| Lenovo ThinkPad X13-20T20033GE | |
| HP ProBook x360 435 G7, Ryzen 5 4500U | |
| Geekbench 5.5 / Multi-Core | |
| Dell XPS 13 9310 Core i7 FHD | |
| HP EliteBook x360 1030 G7 | |
| HP ProBook 455 G7-175W8EA | |
| Asus Zenbook S UX393JA | |
| HP ProBook x360 435 G7, Ryzen 5 4500U | |
| Genomsnitt Intel Core i7-10810U (3351 - 5553, n=5) | |
| Lenovo ThinkPad X13-20T20033GE | |
| HP Envy 13-ba0001ng | |
| HWBOT x265 Benchmark v2.2 / 4k Preset | |
| HP ProBook x360 435 G7, Ryzen 5 4500U | |
| HP ProBook 455 G7-175W8EA | |
| Dell XPS 13 7390 Core i7-10710U | |
| HP EliteBook x360 1030 G7 | |
| Dell XPS 13 9310 Core i7 FHD | |
| Genomsnitt Intel Core i7-10810U (3.81 - 6.45, n=5) | |
| Lenovo ThinkPad X13-20T20033GE | |
| Asus Zenbook S UX393JA | |
| HP Envy 13-ba0001ng | |
| HP Elite Dragonfly-8MK79EA | |
| LibreOffice / 20 Documents To PDF | |
| HP ProBook 455 G7-175W8EA | |
| HP ProBook x360 435 G7, Ryzen 5 4500U | |
| HP EliteBook x360 1030 G7 | |
| Genomsnitt Intel Core i7-10810U (60.6 - 68.2, n=5) | |
| HP Envy 13-ba0001ng | |
| Lenovo ThinkPad X13-20T20033GE | |
| Asus Zenbook S UX393JA | |
| Dell XPS 13 9310 Core i7 FHD | |
| R Benchmark 2.5 / Overall mean | |
| Lenovo ThinkPad X13-20T20033GE | |
| Genomsnitt Intel Core i7-10810U (0.651 - 0.717, n=5) | |
| Asus Zenbook S UX393JA | |
| HP EliteBook x360 1030 G7 | |
| HP Envy 13-ba0001ng | |
| HP ProBook x360 435 G7, Ryzen 5 4500U | |
| HP ProBook 455 G7-175W8EA | |
| Dell XPS 13 9310 Core i7 FHD | |
* ... mindre är bättre
| PCMark 8 Home Score Accelerated v2 | 3775 poäng | |
| PCMark 8 Work Score Accelerated v2 | 4812 poäng | |
| PCMark 10 Score | 4279 poäng | |
Hjälp | ||
| DPC Latencies / LatencyMon - interrupt to process latency (max), Web, Youtube, Prime95 | |
| HP EliteBook x360 1030 G7 | |
| Lenovo ThinkPad X13 Yoga 20SX0004GE | |
| Asus ZenBook Flip S UX371 | |
* ... mindre är bättre
| HP EliteBook x360 1030 G7 Samsung SSD PM981a MZVLB512HBJQ | HP EliteBook x360 1030 G4 7YL44EA WDC PC SN520 SDAPNUW-512G | Dell XPS 13 7390 2-in-1 Core i7 Toshiba BG4 KBG40ZPZ512G | Lenovo ThinkPad X13 Yoga 20SX0004GE Samsung SSD PM981a MZVLB512HBJQ | Asus ZenBook Flip S UX371 WDC PC SN730 SDBPNTY-1T00 | |
|---|---|---|---|---|---|
| AS SSD | -7% | -18% | 15% | 7% | |
| Seq Read (MB/s) | 2036 | 1352 -34% | 1801 -12% | 2844 40% | 2726 34% |
| Seq Write (MB/s) | 1422 | 855 -40% | 1125 -21% | 1483 4% | 1527 7% |
| 4K Read (MB/s) | 53.8 | 44.14 -18% | 39.7 -26% | 56.1 4% | 45.44 -16% |
| 4K Write (MB/s) | 122 | 153.5 26% | 67 -45% | 138.1 13% | 152 25% |
| 4K-64 Read (MB/s) | 680 | 768 13% | 1253 84% | 870 28% | 789 16% |
| 4K-64 Write (MB/s) | 1445 | 971 -33% | 209 -86% | 1311 -9% | 1345 -7% |
| Access Time Read * (ms) | 0.041 | 0.05 -22% | 0.069 -68% | 0.049 -20% | 0.068 -66% |
| Access Time Write * (ms) | 0.091 | 0.023 75% | 0.625 -587% | 0.027 70% | 0.028 69% |
| Score Read (Points) | 937 | 947 1% | 1472 57% | 1210 29% | 1107 18% |
| Score Write (Points) | 1709 | 1210 -29% | 388 -77% | 1598 -6% | 1650 -3% |
| Score Total (Points) | 3111 | 2628 -16% | 2583 -17% | 3373 8% | 3274 5% |
| Copy ISO MB/s (MB/s) | 2109 | 1293 -39% | |||
| Copy Program MB/s (MB/s) | 103.5 | 560 441% | |||
| Copy Game MB/s (MB/s) | 387.8 | 927 139% | |||
| CrystalDiskMark 5.2 / 6 | -16% | -13% | -8% | -10% | |
| Write 4K (MB/s) | 122.2 | 146.4 20% | 106.7 -13% | 134.5 10% | 133.4 9% |
| Read 4K (MB/s) | 44.56 | 46.91 5% | 49.94 12% | 61.2 37% | 36.52 -18% |
| Write Seq (MB/s) | 2105 | 981 -53% | 1223 -42% | 931 -56% | 1901 -10% |
| Read Seq (MB/s) | 2346 | 908 -61% | 1801 -23% | 2534 8% | 2027 -14% |
| Write 4K Q32T1 (MB/s) | 349.6 | 474.9 36% | 325.3 -7% | 375.9 8% | 317.8 -9% |
| Read 4K Q32T1 (MB/s) | 340.6 | 442.3 30% | 551 62% | 343.7 1% | 299.1 -12% |
| Write Seq Q32T1 (MB/s) | 2958 | 1451 -51% | 1224 -59% | 934 -68% | 2602 -12% |
| Read Seq Q32T1 (MB/s) | 3564 | 1638 -54% | 2350 -34% | 3548 0% | 3142 -12% |
| Totalt genomsnitt (program/inställningar) | -12% /
-11% | -16% /
-16% | 4% /
5% | -2% /
0% |
* ... mindre är bättre

DiskSpd Read Loop, Queue Depth 8
| 3DMark 11 Performance | 2208 poäng | |
| 3DMark Cloud Gate Standard Score | 9947 poäng | |
| 3DMark Fire Strike Score | 1292 poäng | |
| 3DMark Time Spy Score | 493 poäng | |
Hjälp | ||
| låg | med. | hög | ultra | |
|---|---|---|---|---|
| Dota 2 Reborn (2015) | 85 | 54.1 | 23.3 | 20.6 |
| Final Fantasy XV Benchmark (2018) | 13.9 | 6.67 | 5.16 | |
| X-Plane 11.11 (2018) | 11.9 | 15.7 | 13.8 |
| HP EliteBook x360 1030 G7 UHD Graphics 620, i7-10810U, Samsung SSD PM981a MZVLB512HBJQ | HP EliteBook x360 1030 G4 7YL44EA UHD Graphics 620, i7-8565U, WDC PC SN520 SDAPNUW-512G | Dell XPS 13 7390 2-in-1 Core i7 Iris Plus Graphics G7 (Ice Lake 64 EU), i7-1065G7, Toshiba BG4 KBG40ZPZ512G | Lenovo ThinkPad X13 Yoga 20SX0004GE UHD Graphics 620, i7-10510U, Samsung SSD PM981a MZVLB512HBJQ | Asus ZenBook Flip S UX371 Iris Xe G7 96EUs, i7-1165G7, WDC PC SN730 SDBPNTY-1T00 | Huawei MateBook X Pro 2020 i7 GeForce MX250, i7-10510U, Samsung PM981a MZVLB1T0HBLR | |
|---|---|---|---|---|---|---|
| Noise | -1% | -1% | -2% | 3% | -5% | |
| av / miljö * (dB) | 28.1 | 30.3 -8% | 28.1 -0% | 29.3 -4% | 29 -3% | 29.6 -5% |
| Idle Minimum * (dB) | 28.1 | 30.3 -8% | 28.1 -0% | 29.3 -4% | 29 -3% | 29.6 -5% |
| Idle Average * (dB) | 28.1 | 30.3 -8% | 28.1 -0% | 29.3 -4% | 29 -3% | 29.6 -5% |
| Idle Maximum * (dB) | 28.1 | 30.3 -8% | 28.1 -0% | 31.4 -12% | 29 -3% | 30.3 -8% |
| Load Average * (dB) | 35.1 | 31.2 11% | 31.7 10% | 33 6% | 30.9 12% | 38 -8% |
| Load Maximum * (dB) | 37.6 | 32.8 13% | 43.4 -15% | 34.9 7% | 30.9 18% | 38 -1% |
| Witcher 3 ultra * (dB) | 43.4 | 30.9 | 38 |
* ... mindre är bättre
Ljudnivå
| Låg belastning |
| 28.1 / 28.1 / 28.1 dB(A) |
| Hög belastning |
| 35.1 / 37.6 dB(A) |
 | ||
30 dB tyst 40 dB(A) hörbar 50 dB(A) högt ljud |
||
min: | ||
(+) Den maximala temperaturen på ovansidan är 37 °C / 99 F, jämfört med genomsnittet av 35.4 °C / 96 F , allt från 19.6 till 60 °C för klassen Convertible.
(-) Botten värms upp till maximalt 47.2 °C / 117 F, jämfört med genomsnittet av 36.9 °C / 98 F
(+) Vid tomgångsbruk är medeltemperaturen för ovansidan 23.3 °C / 74 F, jämfört med enhetsgenomsnittet på 30.3 °C / ### class_avg_f### F.
(+) Handledsstöden och pekplattan är kallare än hudtemperaturen med maximalt 24.2 °C / 75.6 F och är därför svala att ta på.
(+) Medeltemperaturen för handledsstödsområdet på liknande enheter var 28 °C / 82.4 F (+3.8 °C / 6.8 F).
HP EliteBook x360 1030 G7 ljudanalys
(+) | högtalare kan spela relativt högt (90.7 dB)
Bas 100 - 315 Hz
(±) | reducerad bas - i genomsnitt 10.3% lägre än medianen
(±) | linjäriteten för basen är genomsnittlig (9.5% delta till föregående frekvens)
Mellan 400 - 2000 Hz
(+) | balanserad mellan - endast 3.6% från medianen
(+) | mids är linjära (4.2% delta till föregående frekvens)
Högsta 2 - 16 kHz
(+) | balanserade toppar - endast 2.8% från medianen
(+) | toppar är linjära (4% delta till föregående frekvens)
Totalt 100 - 16 000 Hz
(+) | det totala ljudet är linjärt (10% skillnad mot median)
Jämfört med samma klass
» 6% av alla testade enheter i den här klassen var bättre, 2% liknande, 92% sämre
» Den bästa hade ett delta på 6%, genomsnittet var 20%, sämst var 57%
Jämfört med alla testade enheter
» 4% av alla testade enheter var bättre, 1% liknande, 94% sämre
» Den bästa hade ett delta på 4%, genomsnittet var 24%, sämst var 134%
Apple MacBook 12 (Early 2016) 1.1 GHz ljudanalys
(+) | högtalare kan spela relativt högt (83.6 dB)
Bas 100 - 315 Hz
(±) | reducerad bas - i genomsnitt 11.3% lägre än medianen
(±) | linjäriteten för basen är genomsnittlig (14.2% delta till föregående frekvens)
Mellan 400 - 2000 Hz
(+) | balanserad mellan - endast 2.4% från medianen
(+) | mids är linjära (5.5% delta till föregående frekvens)
Högsta 2 - 16 kHz
(+) | balanserade toppar - endast 2% från medianen
(+) | toppar är linjära (4.5% delta till föregående frekvens)
Totalt 100 - 16 000 Hz
(+) | det totala ljudet är linjärt (10.2% skillnad mot median)
Jämfört med samma klass
» 7% av alla testade enheter i den här klassen var bättre, 2% liknande, 91% sämre
» Den bästa hade ett delta på 5%, genomsnittet var 18%, sämst var 53%
Jämfört med alla testade enheter
» 5% av alla testade enheter var bättre, 1% liknande, 94% sämre
» Den bästa hade ett delta på 4%, genomsnittet var 24%, sämst var 134%
| Av/Standby | |
| Låg belastning | |
| Hög belastning |
|
Förklaring:
min: | |
| HP EliteBook x360 1030 G7 i7-10810U, UHD Graphics 620, Samsung SSD PM981a MZVLB512HBJQ, IPS, 1920x1080, 13.3" | HP EliteBook x360 1030 G4 7YL44EA i7-8565U, UHD Graphics 620, WDC PC SN520 SDAPNUW-512G, IPS, 1920x1080, 13.3" | Dell XPS 13 7390 2-in-1 Core i7 i7-1065G7, Iris Plus Graphics G7 (Ice Lake 64 EU), Toshiba BG4 KBG40ZPZ512G, IPS, 1920x1200, 13.4" | Lenovo ThinkPad X13 Yoga 20SX0004GE i7-10510U, UHD Graphics 620, Samsung SSD PM981a MZVLB512HBJQ, IPS, 1920x1080, 13.3" | Asus ZenBook Flip S UX371 i7-1165G7, Iris Xe G7 96EUs, WDC PC SN730 SDBPNTY-1T00, OLED, 3840x2160, 13.3" | Huawei MateBook X Pro 2020 i7 i7-10510U, GeForce MX250, Samsung PM981a MZVLB1T0HBLR, LTPS, 3000x2000, 13.9" | |
|---|---|---|---|---|---|---|
| Power Consumption | -48% | -18% | -30% | -111% | -81% | |
| Idle Minimum * (Watt) | 1.5 | 3.4 -127% | 2.6 -73% | 3.4 -127% | 6.1 -307% | 4.3 -187% |
| Idle Average * (Watt) | 3.2 | 7.8 -144% | 5.3 -66% | 4.98 -56% | 10.6 -231% | 8.5 -166% |
| Idle Maximum * (Watt) | 9.4 | 10.3 -10% | 7 26% | 8.1 14% | 13.8 -47% | 12 -28% |
| Load Average * (Watt) | 41.1 | 36 12% | 43.1 -5% | 37.2 9% | 32.2 22% | 54.8 -33% |
| Load Maximum * (Watt) | 68.9 | 49.5 28% | 49 29% | 63.3 8% | 64.7 6% | 61.5 11% |
| Witcher 3 ultra * (Watt) | 43.1 | 28.3 | 47.1 |
* ... mindre är bättre
| HP EliteBook x360 1030 G7 i7-10810U, UHD Graphics 620, 54 Wh | HP EliteBook x360 1030 G4 7YL44EA i7-8565U, UHD Graphics 620, 56 Wh | Dell XPS 13 7390 2-in-1 Core i7 i7-1065G7, Iris Plus Graphics G7 (Ice Lake 64 EU), 51 Wh | Lenovo ThinkPad X13 Yoga 20SX0004GE i7-10510U, UHD Graphics 620, 50 Wh | Asus ZenBook Flip S UX371 i7-1165G7, Iris Xe G7 96EUs, 67 Wh | Huawei MateBook X Pro 2020 i7 i7-10510U, GeForce MX250, 57.4 Wh | |
|---|---|---|---|---|---|---|
| Batteridrifttid | -13% | -13% | 3% | -7% | 3% | |
| Reader / Idle (h) | 30.9 | 12.2 -61% | ||||
| WiFi v1.3 (h) | 10.3 | 9.4 -9% | 9 -13% | 8.2 -20% | 6.7 -35% | 10.4 1% |
| Load (h) | 2.3 | 3 30% | 2.9 26% | 2.8 22% | 2.4 4% |
För
Emot
Läs den fullständiga versionen av den här recensionen på engelska här.
HP EliteBook x360 1030 G7 är en tuff omvandlingsbar som andra kommer vilja slå. Den har 4G LTE, närhetssensor samt ett skärmalternativ på 1000 nit, saker som de flesta av konkurrenterna saknar. Den långa listan över funktioner är imponerande med tanke på den lilla formfaktorn. Jämfört med den utgående modellen EliteBook x360 1030 G4 är G7 ett värdigt steg upp.
De största bristerna med HP:s omvandlingsbara dator är den begränsade grafikprestandan, den svampiga klickplattan och det höga utgångspriset. Man är fast med utdaterade UHD Graphics 620 samtidigt som klickplattan inte är i närheten så lätt att använda som styrplattan på EliteBook 845. Du får vara redo på att betala nästan 20.000 kronor eller mer för den billigaste i5-konfigurationen. Vi förstår att processorprestanda aldrig varit ett avgörande säljargument för en omvandlingsbar EliteBook, men faktum att en billig Ryzen 5 4500U kan prestera bättre än det bästa Comet Lake-U Core i7-alternativet som finns till detta 20.000-kronorssystem är svårt att ignorera.
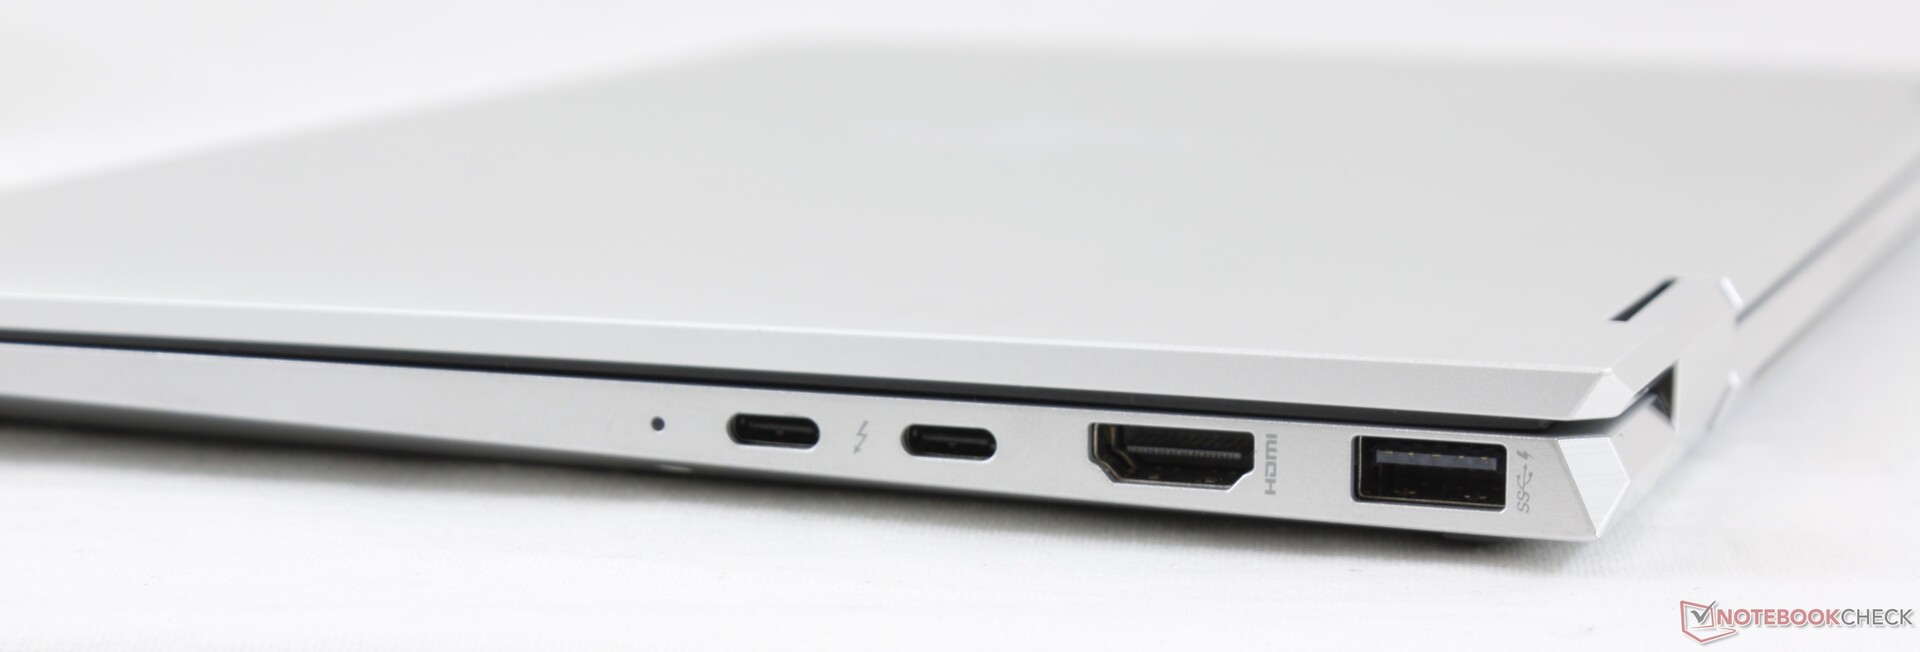
Vart kommer HP ta vägen härnäst? Vi misstänker att framtida modeller kommer gå över till 16:10, lägga till stöd för eSIM och trådlös laddning samt uppgradera till Thunderbolt 4 via Intels 11:e generations Core-plattform. Men fram tills dess är detta lätt en av våra favoriter bland omvandlingsbara modeller på 13.3 tum, både på kontoret och på resan.
Den kostar dig en arm och ett ben, men HP EliteBook x360 1030 G7 är en närmast perfekt resekollega för kontorsarbete och ordbehandling när den konfigurerats med rätt funktioner.
HP EliteBook x360 1030 G7
- 11/15/2020 v7 (old)
Allen Ngo
Price comparison
