Test: Asus ZenBook 13 UX333FA (i5-8265U) Laptop (Sammanfattning)
| SD Card Reader | |
| average JPG Copy Test (av. of 3 runs) | |
| Dell XPS 13 9370 i5 UHD (Toshiba Exceria Pro M501 64 GB UHS-II) | |
| Asus ZenBook 13 UX331UN (Toshiba Exceria Pro M501 microSDXC 64GB) | |
| Asus ZenBook 13 UX333FA (Toshiba Exceria Pro M501 microSDXC 64GB) | |
| maximum AS SSD Seq Read Test (1GB) | |
| Dell XPS 13 9370 i5 UHD (Toshiba Exceria Pro M501 64 GB UHS-II) | |
| Asus ZenBook 13 UX331UN (Toshiba Exceria Pro M501 microSDXC 64GB) | |
| Asus ZenBook 13 UX333FA (Toshiba Exceria Pro M501 microSDXC 64GB) | |
| Networking | |
| iperf3 transmit AX12 | |
| Asus ZenBook 13 UX331UN | |
| Dell XPS 13 9370 i5 UHD | |
| Asus ZenBook 13 UX333FA | |
| iperf3 receive AX12 | |
| Asus ZenBook 13 UX333FA | |
| Dell XPS 13 9370 i5 UHD | |
| Asus ZenBook 13 UX331UN | |
| |||||||||||||||||||||||||
Distribution av ljusstyrkan: 89 %
Mitt på batteriet: 276 cd/m²
Kontrast: 1314:1 (Svärta: 0.21 cd/m²)
ΔE ColorChecker Calman: 4.85 | ∀{0.5-29.43 Ø4.73}
calibrated: 1.6
ΔE Greyscale Calman: 5.7 | ∀{0.09-98 Ø4.97}
98% sRGB (Argyll 1.6.3 3D)
63% AdobeRGB 1998 (Argyll 1.6.3 3D)
69.2% AdobeRGB 1998 (Argyll 3D)
97.4% sRGB (Argyll 3D)
67.9% Display P3 (Argyll 3D)
Gamma: 2.08
CCT: 7424 K
| Asus ZenBook 13 UX333FA AU Optronics B133HAN05.C, IPS, 13.3", 1920x1080 | Asus ZenBook 13 UX331UN AU Optronics B133HAN04.9, IPS, 13.3", 1920x1080 | Dell XPS 13 9370 i5 UHD ID: Sharp SHP148B, Name: LQ133D1, Dell P/N: 8XDHY, IPS, 13.3", 3840x2160 | Huawei Matebook X Pro i5 Tianma XM, IPS, 13.9", 3000x2000 | HP Spectre 13-af033ng AU Optronics AUO422D, IPS, 13.3", 1920x1080 | Lenovo Yoga C930-13IKB 81C4 AUO B139HAN03_0, IPS, 13.9", 1920x1080 | |
|---|---|---|---|---|---|---|
| Display | -9% | 1% | -2% | -6% | -7% | |
| Display P3 Coverage (%) | 67.9 | 63.3 -7% | 68.9 1% | 65.9 -3% | 64 -6% | 62.7 -8% |
| sRGB Coverage (%) | 97.4 | 86.7 -11% | 98.4 1% | 95.2 -2% | 90.7 -7% | 92.6 -5% |
| AdobeRGB 1998 Coverage (%) | 69.2 | 63.4 -8% | 69.5 0% | 67.6 -2% | 65.1 -6% | 64.7 -7% |
| Response Times | 28% | -18% | 29% | 43% | 35% | |
| Response Time Grey 50% / Grey 80% * (ms) | 54.4 ? | 44 ? 19% | 67.2 ? -24% | 40.4 ? 26% | 27 ? 50% | 34.4 ? 37% |
| Response Time Black / White * (ms) | 37.6 ? | 24 ? 36% | 41.6 ? -11% | 25.6 ? 32% | 24 ? 36% | 25.6 ? 32% |
| PWM Frequency (Hz) | 2500 ? | |||||
| Screen | 3% | 10% | 9% | 10% | -32% | |
| Brightness middle (cd/m²) | 276 | 329 19% | 496.4 80% | 442.7 60% | 304 10% | 312 13% |
| Brightness (cd/m²) | 263 | 306 16% | 469 78% | 428 63% | 287 9% | 295 12% |
| Brightness Distribution (%) | 89 | 86 -3% | 84 -6% | 84 -6% | 80 -10% | 87 -2% |
| Black Level * (cd/m²) | 0.21 | 0.3 -43% | 0.5 -138% | 0.31 -48% | 0.21 -0% | 0.43 -105% |
| Contrast (:1) | 1314 | 1097 -17% | 993 -24% | 1428 9% | 1448 10% | 726 -45% |
| Colorchecker dE 2000 * | 4.85 | 4.07 16% | 2.9 40% | 2.24 54% | 3.66 25% | 7.6 -57% |
| Colorchecker dE 2000 max. * | 8.24 | 7.05 14% | 5.26 36% | 7.19 13% | 5.66 31% | 15.06 -83% |
| Colorchecker dE 2000 calibrated * | 1.6 | 1.11 31% | 1.96 -22% | |||
| Greyscale dE 2000 * | 5.7 | 2.76 52% | 3.9 32% | 9.7 -70% | 3.51 38% | 8.8 -54% |
| Gamma | 2.08 106% | 2.56 86% | 2.066 106% | 1.42 155% | 2.55 86% | 2.01 109% |
| CCT | 7424 88% | 6915 94% | 7169 91% | 6227 104% | 6955 93% | 6874 95% |
| Color Space (Percent of AdobeRGB 1998) (%) | 63 | 56 -11% | 63.9 1% | 61.6 -2% | 59 -6% | 59.1 -6% |
| Color Space (Percent of sRGB) (%) | 98 | 86 -12% | 98.2 0% | 95 -3% | 91 -7% | 92.3 -6% |
| Totalt genomsnitt (program/inställningar) | 7% /
4% | -2% /
4% | 12% /
10% | 16% /
11% | -1% /
-19% |
* ... mindre är bättre
Visa svarstider
| ↔ Svarstid svart till vitt | ||
|---|---|---|
| 37.6 ms ... stiga ↗ och falla ↘ kombinerat | ↗ 18.8 ms stiga | 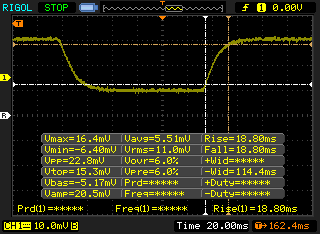 |
| ↘ 18.8 ms hösten | ||
| Skärmen visar långsamma svarsfrekvenser i våra tester och kommer att vara otillfredsställande för spelare. I jämförelse sträcker sig alla testade enheter från 0.1 (minst) till 240 (maximalt) ms. » 95 % av alla enheter är bättre. Detta innebär att den uppmätta svarstiden är sämre än genomsnittet av alla testade enheter (19.9 ms). | ||
| ↔ Svarstid 50 % grått till 80 % grått | ||
| 54.4 ms ... stiga ↗ och falla ↘ kombinerat | ↗ 24.4 ms stiga | 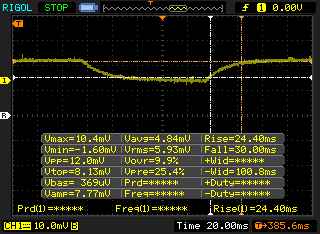 |
| ↘ 30 ms hösten | ||
| Skärmen visar långsamma svarsfrekvenser i våra tester och kommer att vara otillfredsställande för spelare. I jämförelse sträcker sig alla testade enheter från 0.165 (minst) till 636 (maximalt) ms. » 91 % av alla enheter är bättre. Detta innebär att den uppmätta svarstiden är sämre än genomsnittet av alla testade enheter (31.1 ms). | ||
Skärmflimmer / PWM (Puls-Width Modulation)
| Skärmflimmer / PWM upptäcktes inte | 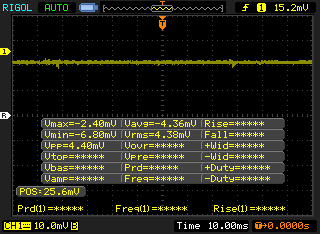 | ||
Som jämförelse: 52 % av alla testade enheter använder inte PWM för att dämpa skärmen. Om PWM upptäcktes mättes ett medelvärde av 7798 (minst: 5 - maximum: 343500) Hz. | |||
| Cinebench R10 | |
| Rendering Multiple CPUs 32Bit | |
| Asus ZenBook 13 UX331UN | |
| Genomsnitt Intel Core i5-8265U (16318 - 22962, n=9) | |
| Huawei Matebook X Pro i5 | |
| HP x2 210 G2 | |
| Rendering Single 32Bit | |
| Asus ZenBook 13 UX331UN | |
| Genomsnitt Intel Core i5-8265U (5841 - 6209, n=9) | |
| Huawei Matebook X Pro i5 | |
| HP x2 210 G2 | |
| wPrime 2.10 - 1024m | |
| Genomsnitt Intel Core i5-8265U (371 - 433, n=2) | |
| Huawei Matebook X Pro i5 | |
* ... mindre är bättre
| PCMark 8 Home Score Accelerated v2 | 3150 poäng | |
| PCMark 8 Work Score Accelerated v2 | 4341 poäng | |
| PCMark 10 Score | 3787 poäng | |
Hjälp | ||
| Asus ZenBook 13 UX333FA WDC PC SN520 SDAPNUW-256G | Asus ZenBook 13 UX331UN SK Hynix HFS256G39TND-N210A | Dell XPS 13 9370 i5 UHD Toshiba XG5 KXG50ZNV256G | Huawei Matebook X Pro i5 Samsung PM961 MZVLW256HEHP | Lenovo Yoga C930-13IKB 81C4 SK hynix PC401 HFS256GD9TNG | HP Elite x2 1013 G3 LTE i7 Samsung SSD PM981 MZVLB1T0HALR | |
|---|---|---|---|---|---|---|
| CrystalDiskMark 5.2 / 6 | -44% | 21% | 23% | 12% | 72% | |
| Write 4K (MB/s) | 113.7 | 78.4 -31% | 121.4 7% | 116.5 2% | 108.7 -4% | 100 -12% |
| Read 4K (MB/s) | 43.18 | 30.77 -29% | 33.42 -23% | 42.18 -2% | 40.91 -5% | 40.23 -7% |
| Write Seq (MB/s) | 970 | 264.5 -73% | 385.3 -60% | 1079 11% | 798 -18% | 1839 90% |
| Read Seq (MB/s) | 1085 | 465.7 -57% | 1958 80% | 1030 -5% | 1610 48% | 2024 87% |
| Write 4K Q32T1 (MB/s) | 396.8 | 262.8 -34% | 375.7 -5% | 225.7 -43% | 385.1 -3% | 314.9 -21% |
| Read 4K Q32T1 (MB/s) | 317.8 | 283.8 -11% | 364.1 15% | 302.9 -5% | 305.8 -4% | 269.8 -15% |
| Write Seq Q32T1 (MB/s) | 518 | 262.7 -49% | 1069 106% | 1174 127% | 779 50% | 2402 364% |
| Read Seq Q32T1 (MB/s) | 1741 | 559 -68% | 2564 47% | 3394 95% | 2359 35% | 3306 90% |

| 3DMark 11 | |
| 1280x720 Performance GPU | |
| Razer Blade Stealth i7-8565U | |
| Asus ZenBook 13 UX331UN | |
| Intel NUC8i7BE | |
| HP EliteBook 735 G5 3UN62EA | |
| Dell XPS 13 9360 FHD i7 Iris | |
| Lenovo Yoga C930-13IKB 81C4 | |
| Genomsnitt Intel UHD Graphics 620 (1144 - 3432, n=244) | |
| Asus ZenBook 13 UX333FA | |
| Fujitsu Lifebook A357-A3570MPH06DE | |
| HP x2 210 G2 | |
| 1280x720 Performance Combined | |
| Razer Blade Stealth i7-8565U | |
| Asus ZenBook 13 UX331UN | |
| Intel NUC8i7BE | |
| HP EliteBook 735 G5 3UN62EA | |
| Lenovo Yoga C930-13IKB 81C4 | |
| Dell XPS 13 9360 FHD i7 Iris | |
| Asus ZenBook 13 UX333FA | |
| Genomsnitt Intel UHD Graphics 620 (927 - 2505, n=244) | |
| Fujitsu Lifebook A357-A3570MPH06DE | |
| HP x2 210 G2 | |
| 3DMark | |
| 1280x720 Cloud Gate Standard Graphics | |
| Razer Blade Stealth i7-8565U | |
| Asus ZenBook 13 UX331UN | |
| Intel NUC8i7BE | |
| Dell XPS 13 9360 FHD i7 Iris | |
| Asus ZenBook 13 UX333FA | |
| Lenovo Yoga C930-13IKB 81C4 | |
| HP EliteBook 735 G5 3UN62EA | |
| Genomsnitt Intel UHD Graphics 620 (6205 - 16400, n=225) | |
| Fujitsu Lifebook A357-A3570MPH06DE | |
| HP x2 210 G2 | |
| 1920x1080 Fire Strike Graphics | |
| Razer Blade Stealth i7-8565U | |
| Asus ZenBook 13 UX331UN | |
| Intel NUC8i7BE | |
| HP EliteBook 735 G5 3UN62EA | |
| Dell XPS 13 9360 FHD i7 Iris | |
| Genomsnitt Intel UHD Graphics 620 (557 - 2608, n=213) | |
| Fujitsu Lifebook A357-A3570MPH06DE | |
| HP x2 210 G2 | |
| 1920x1080 Ice Storm Extreme Graphics | |
| Genomsnitt Intel UHD Graphics 620 (26409 - 59483, n=71) | |
| Fujitsu Lifebook A357-A3570MPH06DE | |
| 2560x1440 Time Spy Graphics | |
| Razer Blade Stealth i7-8565U | |
| Asus ZenBook 13 UX331UN | |
| Intel NUC8i7BE | |
| Dell XPS 13 9360 FHD i7 Iris | |
| Genomsnitt Intel UHD Graphics 620 (299 - 797, n=88) | |
| 3DMark 11 Performance | 1941 poäng | |
| 3DMark Cloud Gate Standard Score | 9235 poäng | |
Hjälp | ||
| låg | med. | hög | ultra | |
|---|---|---|---|---|
| BioShock Infinite (2013) | 63.4 | 35.8 | 31 | 9.6 |
| Rise of the Tomb Raider (2016) | 21.5 | 13.7 | 7.3 | 6.2 |
| Rocket League (2017) | 73.9 | 36.4 | 22.5 |
Ljudnivå
| Låg belastning |
| 28.6 / 28.6 / 28.6 dB(A) |
| Hög belastning |
| 28.6 / 42.4 dB(A) |
 | ||
30 dB tyst 40 dB(A) hörbar 50 dB(A) högt ljud |
||
min: | ||
| Asus ZenBook 13 UX333FA UHD Graphics 620, i5-8265U, WDC PC SN520 SDAPNUW-256G | Asus ZenBook 13 UX331UN GeForce MX150, i5-8550U, SK Hynix HFS256G39TND-N210A | Dell XPS 13 9370 i5 UHD UHD Graphics 620, i5-8250U, Toshiba XG5 KXG50ZNV256G | Huawei Matebook X Pro i5 GeForce MX150, i5-8250U, Samsung PM961 MZVLW256HEHP | HP Spectre 13-af033ng UHD Graphics 620, i5-8550U, Samsung PM961 NVMe MZVLW512HMJP | Lenovo Yoga C930-13IKB 81C4 UHD Graphics 620, i5-8550U, SK hynix PC401 HFS256GD9TNG | |
|---|---|---|---|---|---|---|
| Noise | -9% | -2% | -4% | -2% | -0% | |
| av / miljö * (dB) | 28.6 | 30.13 -5% | 29 -1% | 27.9 2% | 30.13 -5% | 27.9 2% |
| Idle Minimum * (dB) | 28.6 | 30.13 -5% | 29 -1% | 27.9 2% | 30.13 -5% | 27.9 2% |
| Idle Average * (dB) | 28.6 | 30.3 -6% | 29 -1% | 27.9 2% | 30.13 -5% | 27.9 2% |
| Idle Maximum * (dB) | 28.6 | 30.3 -6% | 29 -1% | 27.9 2% | 30.13 -5% | 29.3 -2% |
| Load Average * (dB) | 28.6 | 39.2 -37% | 32 -12% | 36.2 -27% | 31.5 -10% | 32 -12% |
| Load Maximum * (dB) | 42.4 | 41 3% | 40.1 5% | 45.2 -7% | 33.5 21% | 39.3 7% |
| Witcher 3 ultra * (dB) | 45 |
* ... mindre är bättre
(+) Den maximala temperaturen på ovansidan är 37 °C / 99 F, jämfört med genomsnittet av 35.9 °C / 97 F , allt från 21.4 till 59 °C för klassen Subnotebook.
(±) Botten värms upp till maximalt 44 °C / 111 F, jämfört med genomsnittet av 39.2 °C / 103 F
(+) Vid tomgångsbruk är medeltemperaturen för ovansidan 23.8 °C / 75 F, jämfört med enhetsgenomsnittet på 30.8 °C / ### class_avg_f### F.
(+) Handledsstöden och pekplattan är kallare än hudtemperaturen med maximalt 27.4 °C / 81.3 F och är därför svala att ta på.
(±) Medeltemperaturen för handledsstödsområdet på liknande enheter var 28.2 °C / 82.8 F (+0.8 °C / 1.5 F).
Asus ZenBook 13 UX333FA ljudanalys
(-) | inte särskilt höga högtalare (66 dB)
Bas 100 - 315 Hz
(±) | reducerad bas - i genomsnitt 14.6% lägre än medianen
(±) | linjäriteten för basen är genomsnittlig (12.2% delta till föregående frekvens)
Mellan 400 - 2000 Hz
(+) | balanserad mellan - endast 3.3% från medianen
(+) | mids är linjära (6.4% delta till föregående frekvens)
Högsta 2 - 16 kHz
(+) | balanserade toppar - endast 3.7% från medianen
(±) | linjäriteten för toppar är genomsnittlig (8.7% delta till föregående frekvens)
Totalt 100 - 16 000 Hz
(±) | linjäriteten för det totala ljudet är genomsnittlig (21.2% skillnad mot median)
Jämfört med samma klass
» 72% av alla testade enheter i den här klassen var bättre, 5% liknande, 23% sämre
» Den bästa hade ett delta på 5%, genomsnittet var 18%, sämst var 53%
Jämfört med alla testade enheter
» 59% av alla testade enheter var bättre, 7% liknande, 34% sämre
» Den bästa hade ett delta på 4%, genomsnittet var 24%, sämst var 134%
Apple MacBook 12 (Early 2016) 1.1 GHz ljudanalys
(+) | högtalare kan spela relativt högt (83.6 dB)
Bas 100 - 315 Hz
(±) | reducerad bas - i genomsnitt 11.3% lägre än medianen
(±) | linjäriteten för basen är genomsnittlig (14.2% delta till föregående frekvens)
Mellan 400 - 2000 Hz
(+) | balanserad mellan - endast 2.4% från medianen
(+) | mids är linjära (5.5% delta till föregående frekvens)
Högsta 2 - 16 kHz
(+) | balanserade toppar - endast 2% från medianen
(+) | toppar är linjära (4.5% delta till föregående frekvens)
Totalt 100 - 16 000 Hz
(+) | det totala ljudet är linjärt (10.2% skillnad mot median)
Jämfört med samma klass
» 7% av alla testade enheter i den här klassen var bättre, 2% liknande, 91% sämre
» Den bästa hade ett delta på 5%, genomsnittet var 18%, sämst var 53%
Jämfört med alla testade enheter
» 5% av alla testade enheter var bättre, 1% liknande, 94% sämre
» Den bästa hade ett delta på 4%, genomsnittet var 24%, sämst var 134%
| Av/Standby | |
| Låg belastning | |
| Hög belastning |
|
Förklaring:
min: | |
| Asus ZenBook 13 UX333FA i5-8265U, UHD Graphics 620, WDC PC SN520 SDAPNUW-256G, IPS, 1920x1080, 13.3" | Asus ZenBook 13 UX331UN i5-8550U, GeForce MX150, SK Hynix HFS256G39TND-N210A, IPS, 1920x1080, 13.3" | Dell XPS 13 9370 i5 UHD i5-8250U, UHD Graphics 620, Toshiba XG5 KXG50ZNV256G, IPS, 3840x2160, 13.3" | Huawei Matebook X Pro i5 i5-8250U, GeForce MX150, Samsung PM961 MZVLW256HEHP, IPS, 3000x2000, 13.9" | HP Spectre 13-af033ng i5-8550U, UHD Graphics 620, Samsung PM961 NVMe MZVLW512HMJP, IPS, 1920x1080, 13.3" | HP EliteBook 735 G5 3UN62EA R7 2700U, Vega 10, Toshiba KBG30ZMV256G, IPS, 1920x1080, 13.3" | |
|---|---|---|---|---|---|---|
| Power Consumption | -11% | -58% | -68% | -21% | -82% | |
| Idle Minimum * (Watt) | 1.6 | 2.2 -38% | 4.3 -169% | 3.5 -119% | 2.8 -75% | 5.5 -244% |
| Idle Average * (Watt) | 4.6 | 5 -9% | 8 -74% | 8.9 -93% | 6.2 -35% | 9.4 -104% |
| Idle Maximum * (Watt) | 7.3 | 8 -10% | 8.1 -11% | 12.3 -68% | 9.4 -29% | 11.6 -59% |
| Load Average * (Watt) | 37.9 | 33 13% | 46.6 -23% | 54.2 -43% | 32.2 15% | 39 -3% |
| Load Maximum * (Watt) | 44.8 | 49.4 -10% | 49.8 -11% | 52.1 -16% | 36.6 18% | 45.6 -2% |
| Witcher 3 ultra * (Watt) | 42.4 |
* ... mindre är bättre
| Asus ZenBook 13 UX333FA i5-8265U, UHD Graphics 620, 50 Wh | Asus ZenBook 13 UX331UN i5-8550U, GeForce MX150, 50 Wh | Dell XPS 13 9370 i5 UHD i5-8250U, UHD Graphics 620, 52 Wh | Huawei Matebook X Pro i5 i5-8250U, GeForce MX150, 57.4 Wh | HP Spectre 13-af033ng i5-8550U, UHD Graphics 620, 43 Wh | Lenovo Yoga C930-13IKB 81C4 i5-8550U, UHD Graphics 620, 60 Wh | |
|---|---|---|---|---|---|---|
| Batteridrifttid | -18% | -32% | -11% | -32% | 12% | |
| Reader / Idle (h) | 27.8 | 20.7 -26% | 14.5 -48% | 20.7 -26% | ||
| WiFi v1.3 (h) | 9.9 | 9 -9% | 6.8 -31% | 9.3 -6% | 5.9 -40% | 11.1 12% |
| Load (h) | 2.2 | 1.8 -18% | 1.8 -18% | 2.2 0% | 1.7 -23% |
För
Emot
Läs den fullständiga versionen av den här recensionen på engelska här.
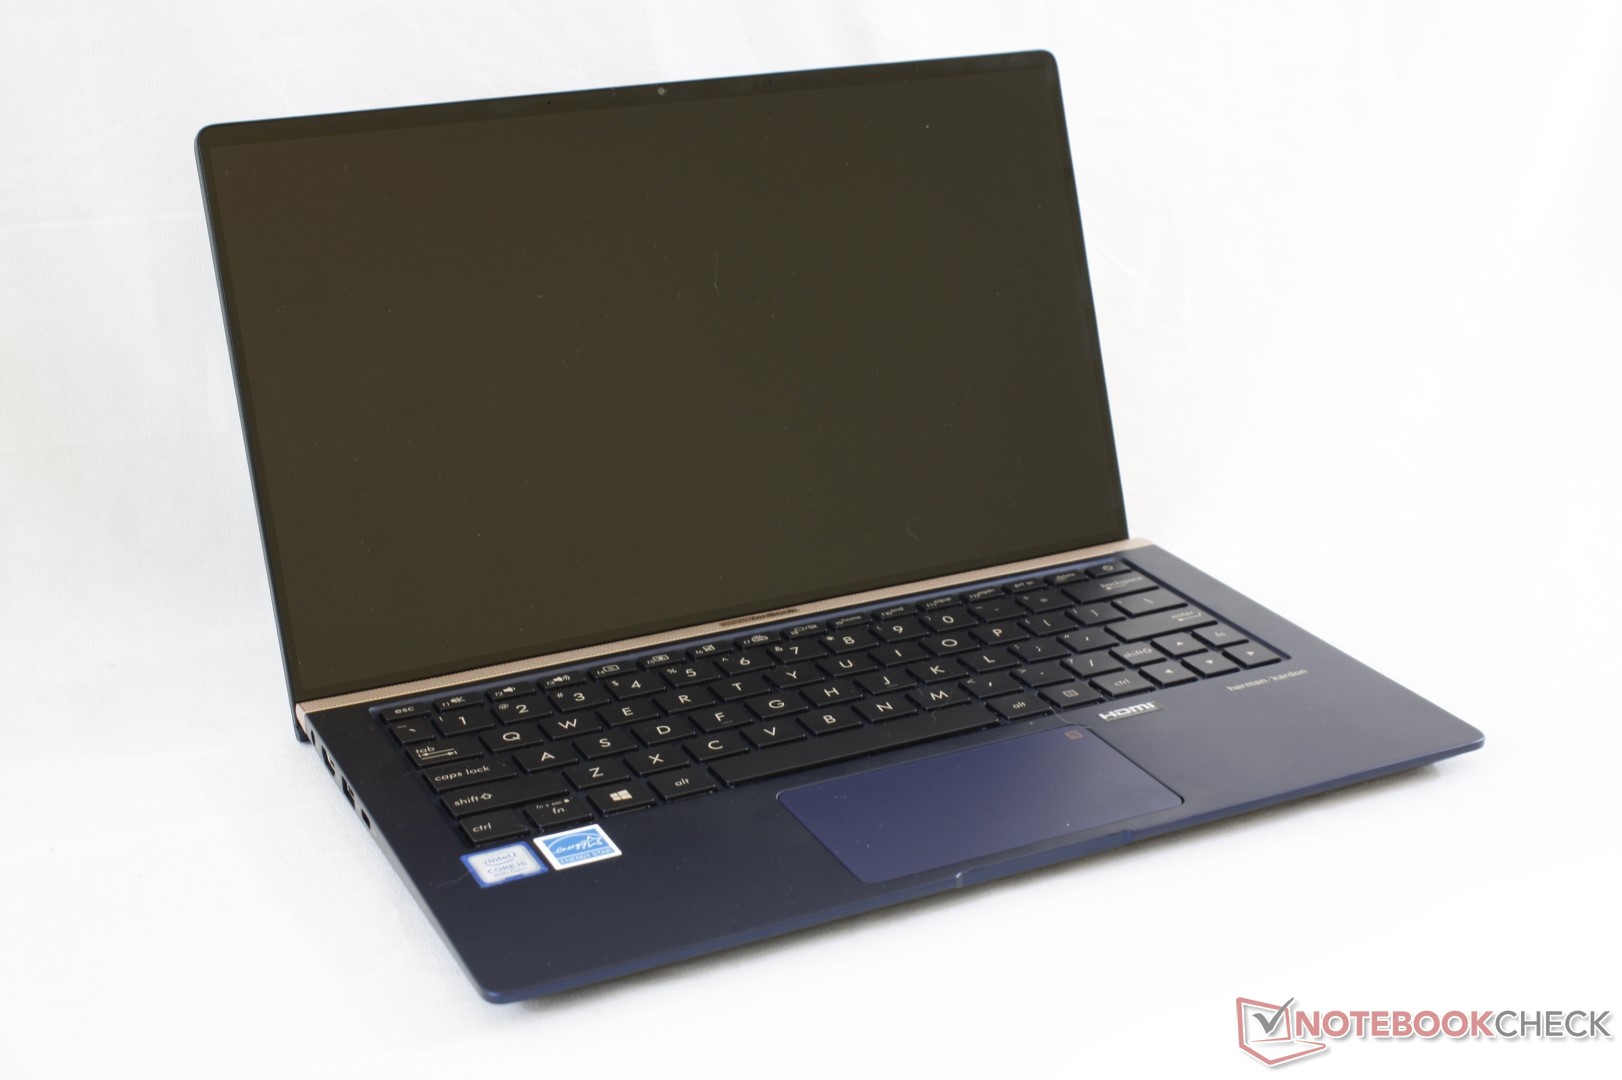
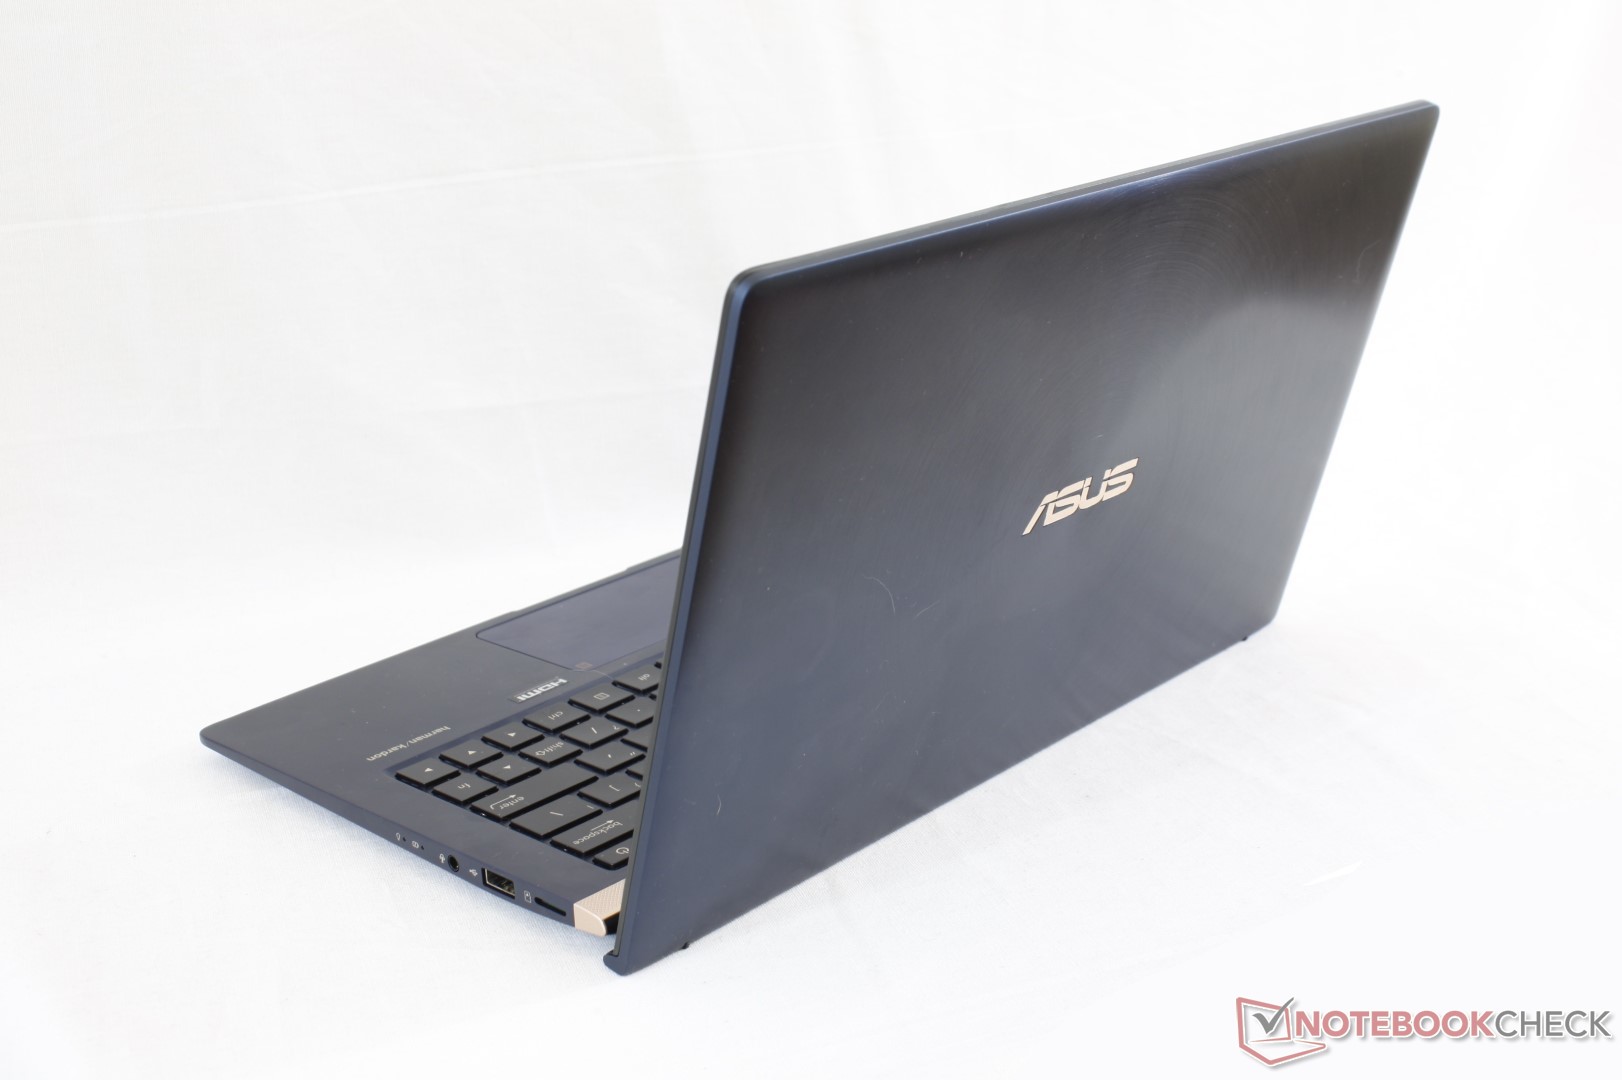
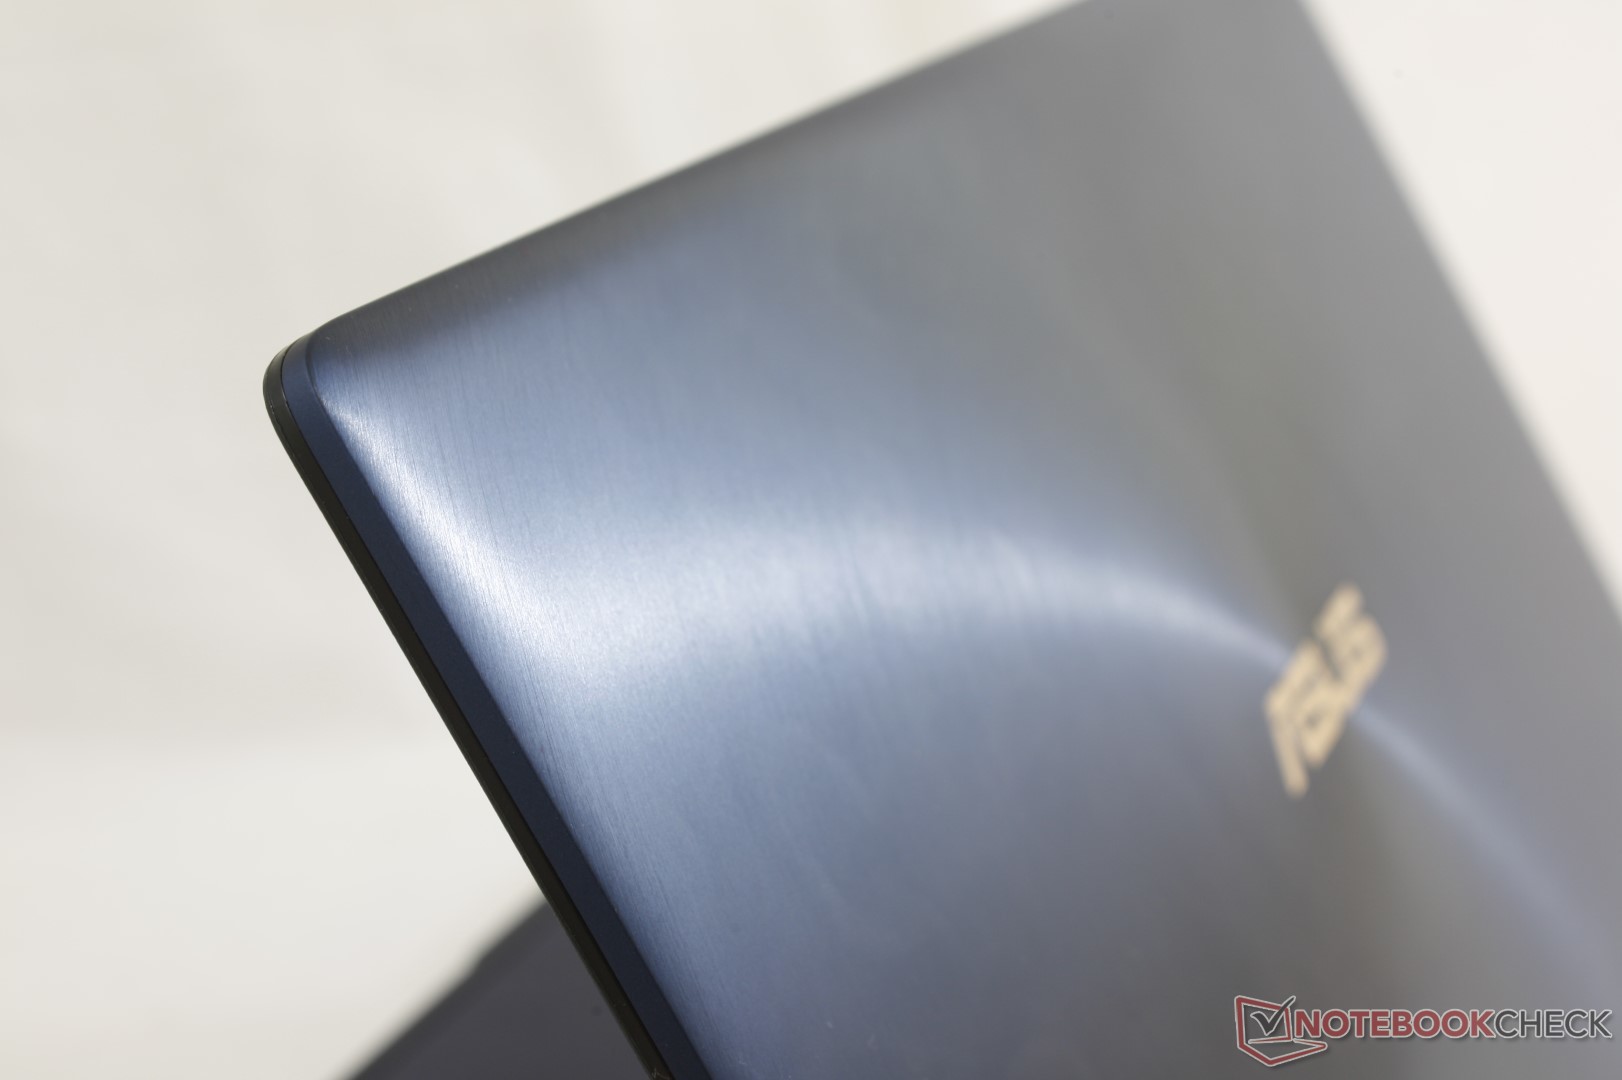
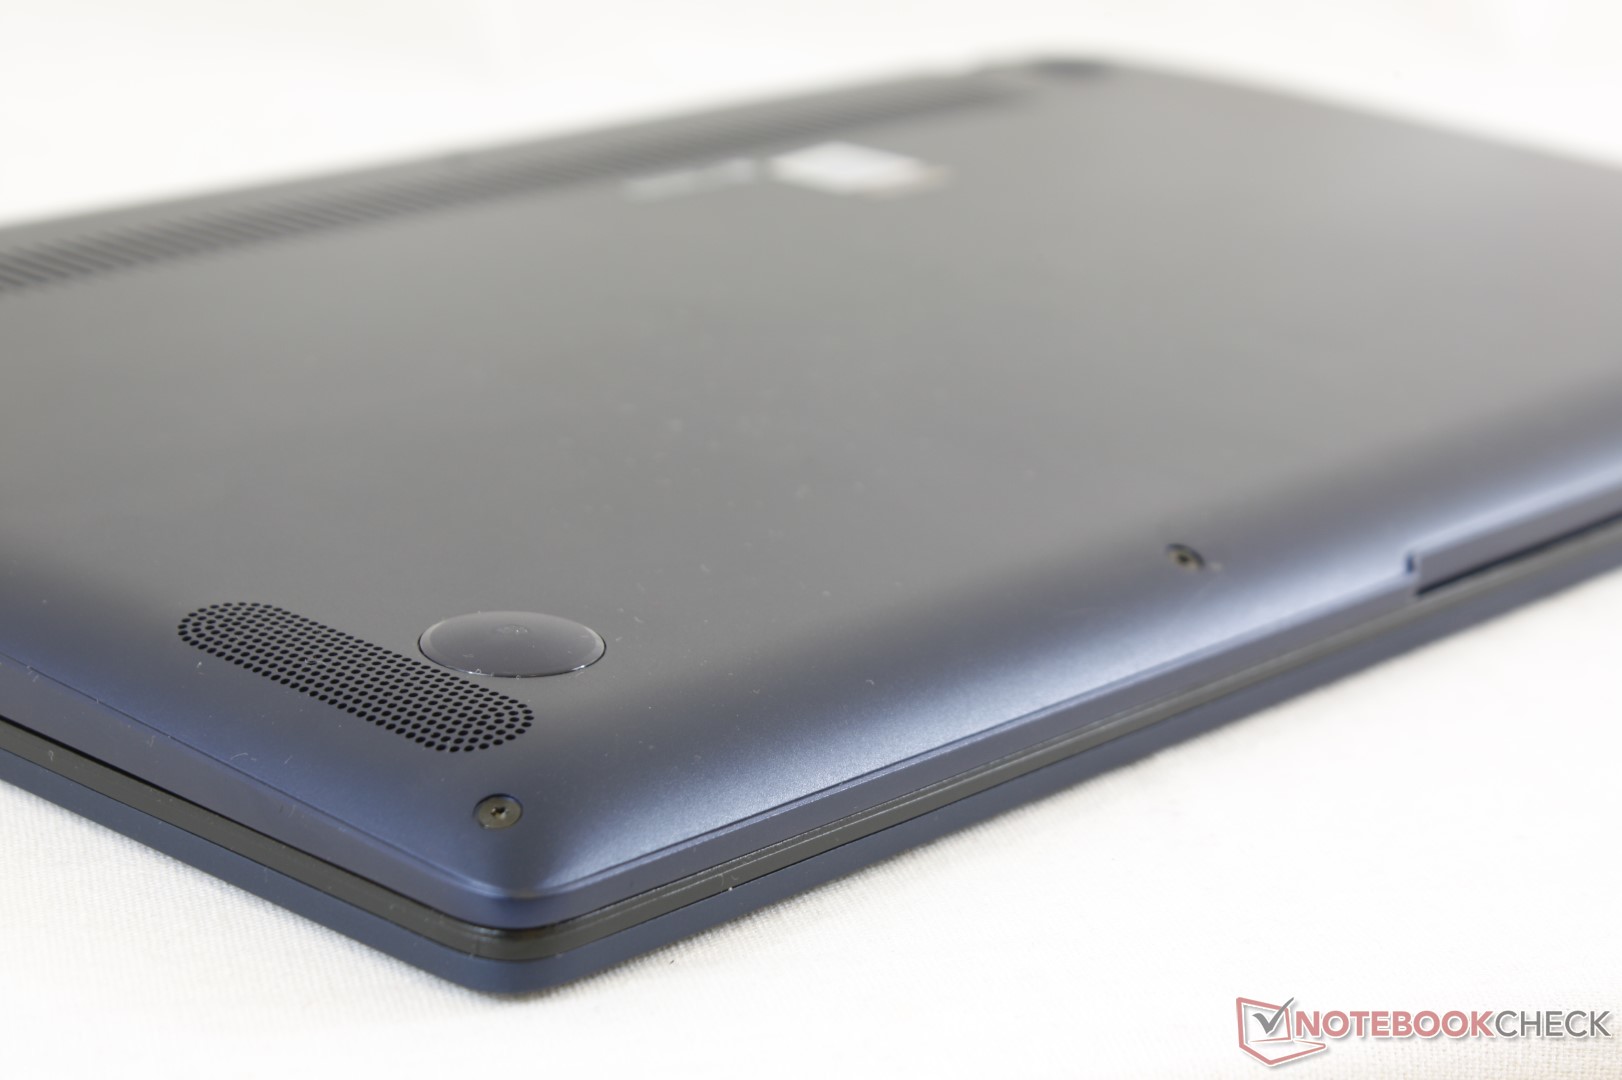
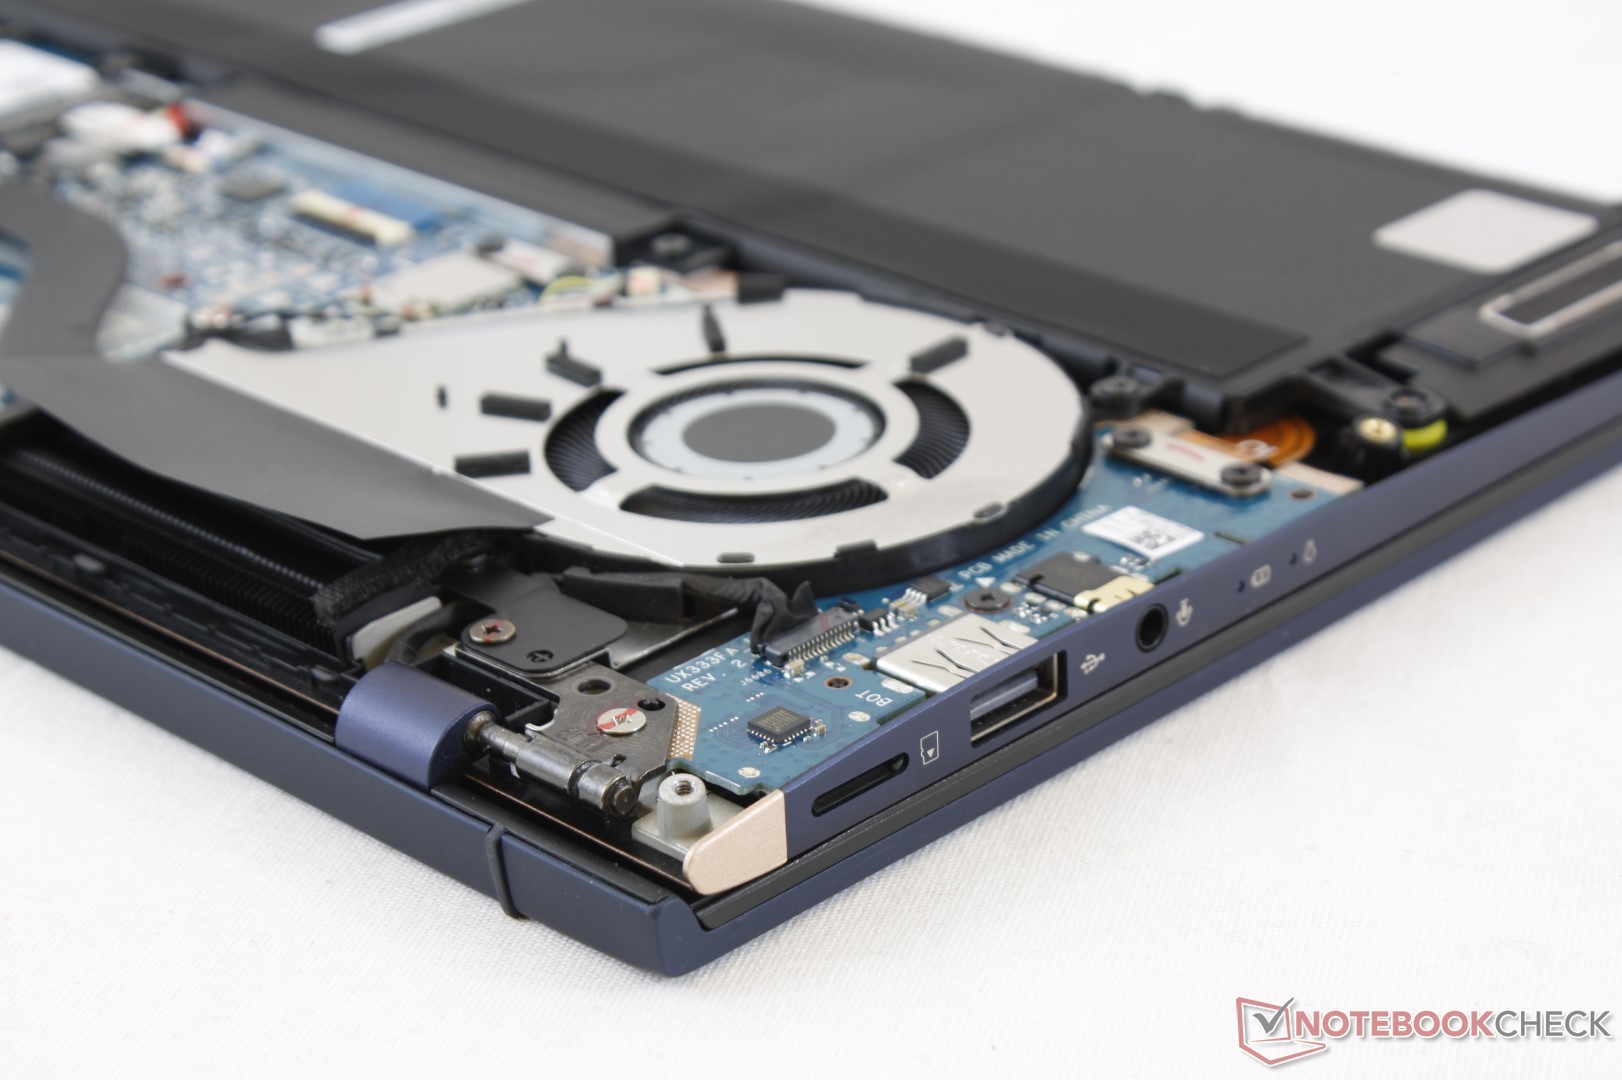
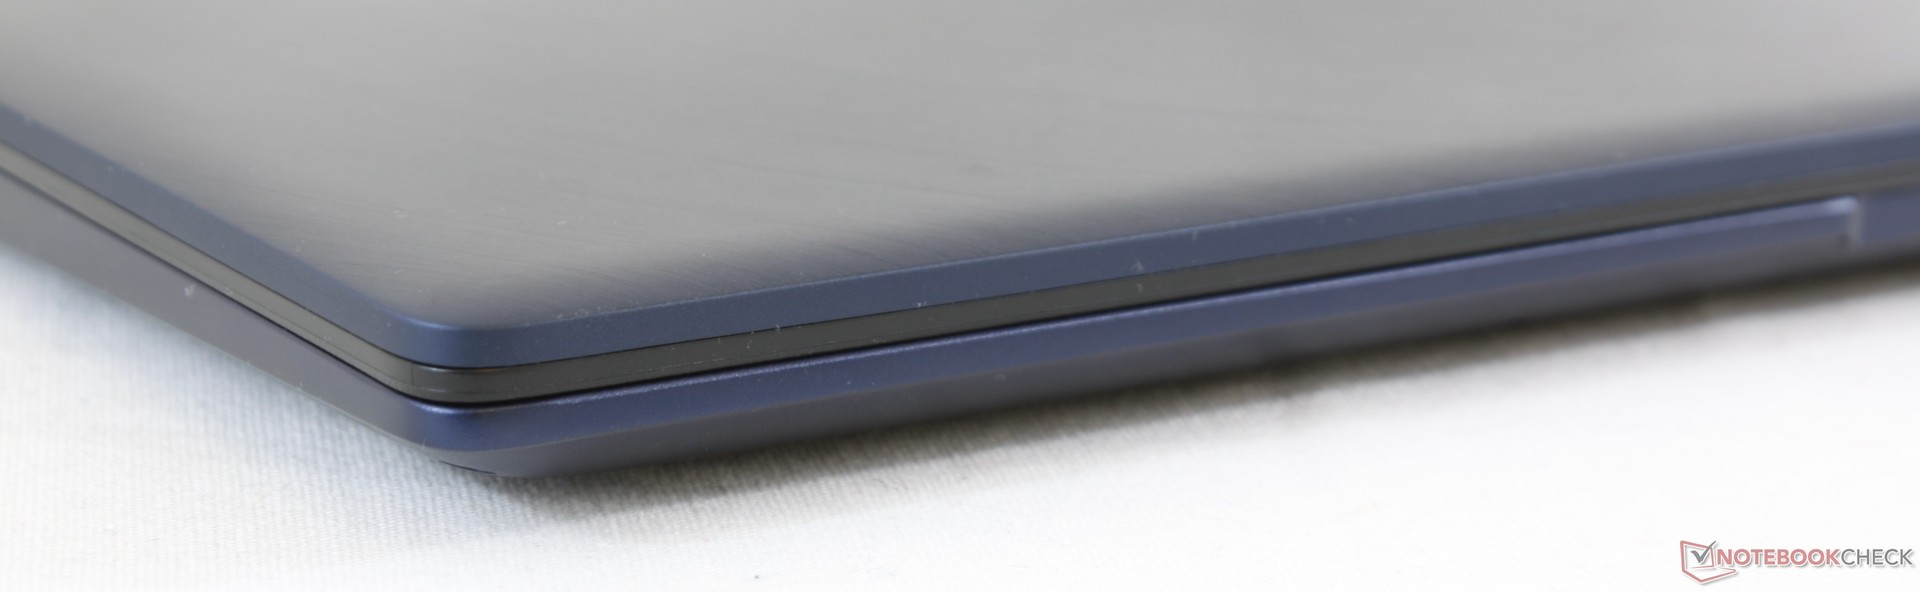
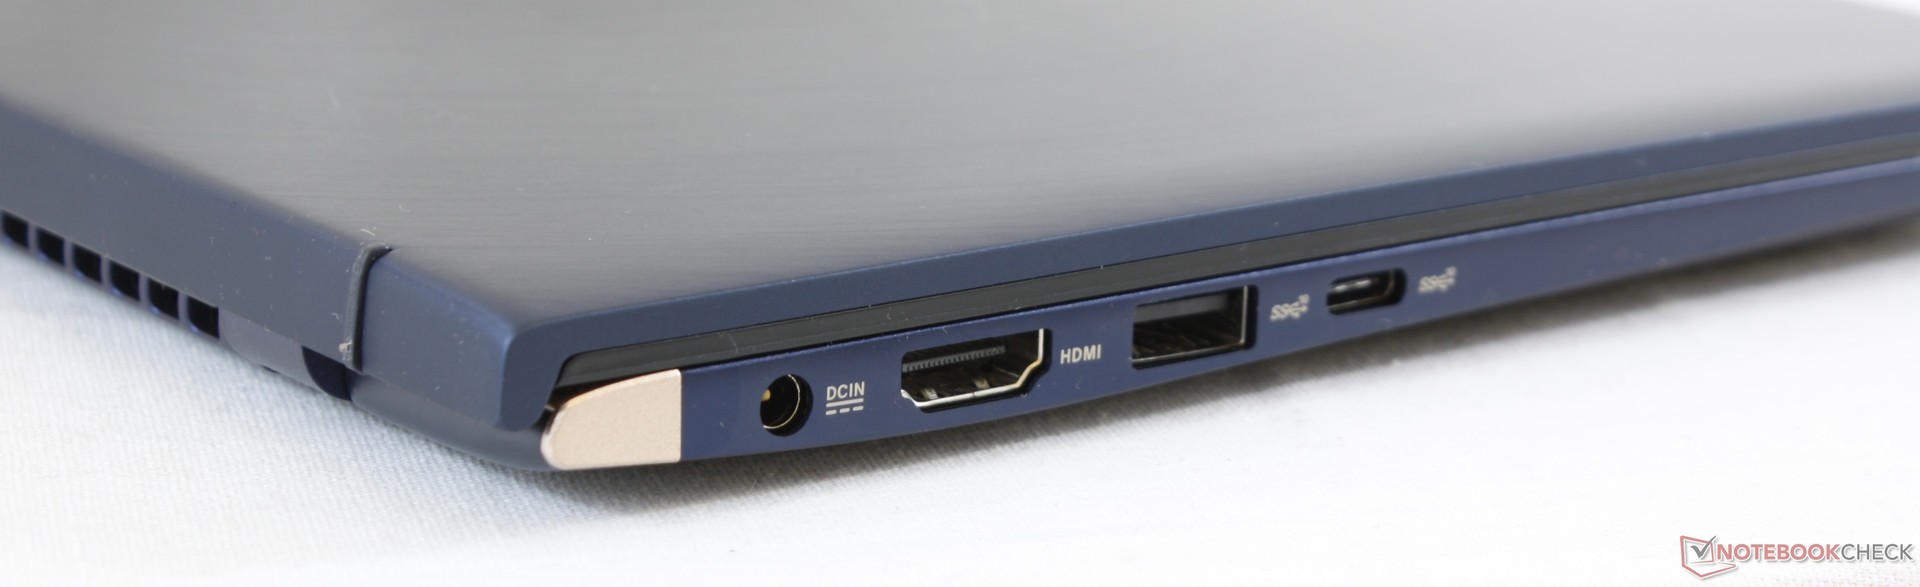
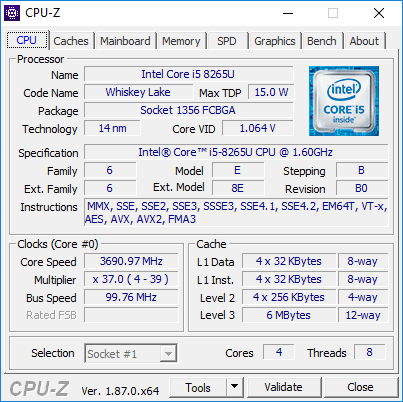
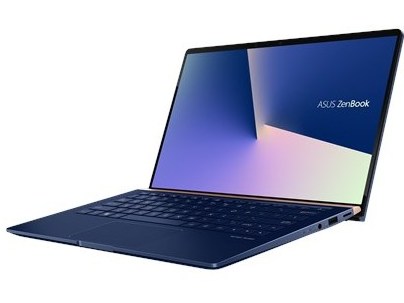
Designmässigt är det nya chassit ett steg upp från förra generationens ZenBook UX331. UX333 vågar vara tjockare för att kännas fastare samtidigt som den hyvlar av ännu mer av infattningen vilket ger ett kompakt intryck. Ett visuellt framsteg som känns som att det tillhör nästa generation och ett rimligt utgångspris är kanske de största anledningarna till att skaffa en ZenBook UX333, snarare än hoppet från 8:e generationens Intel Core Kaby Lake-R till Whiskey Lake-U.
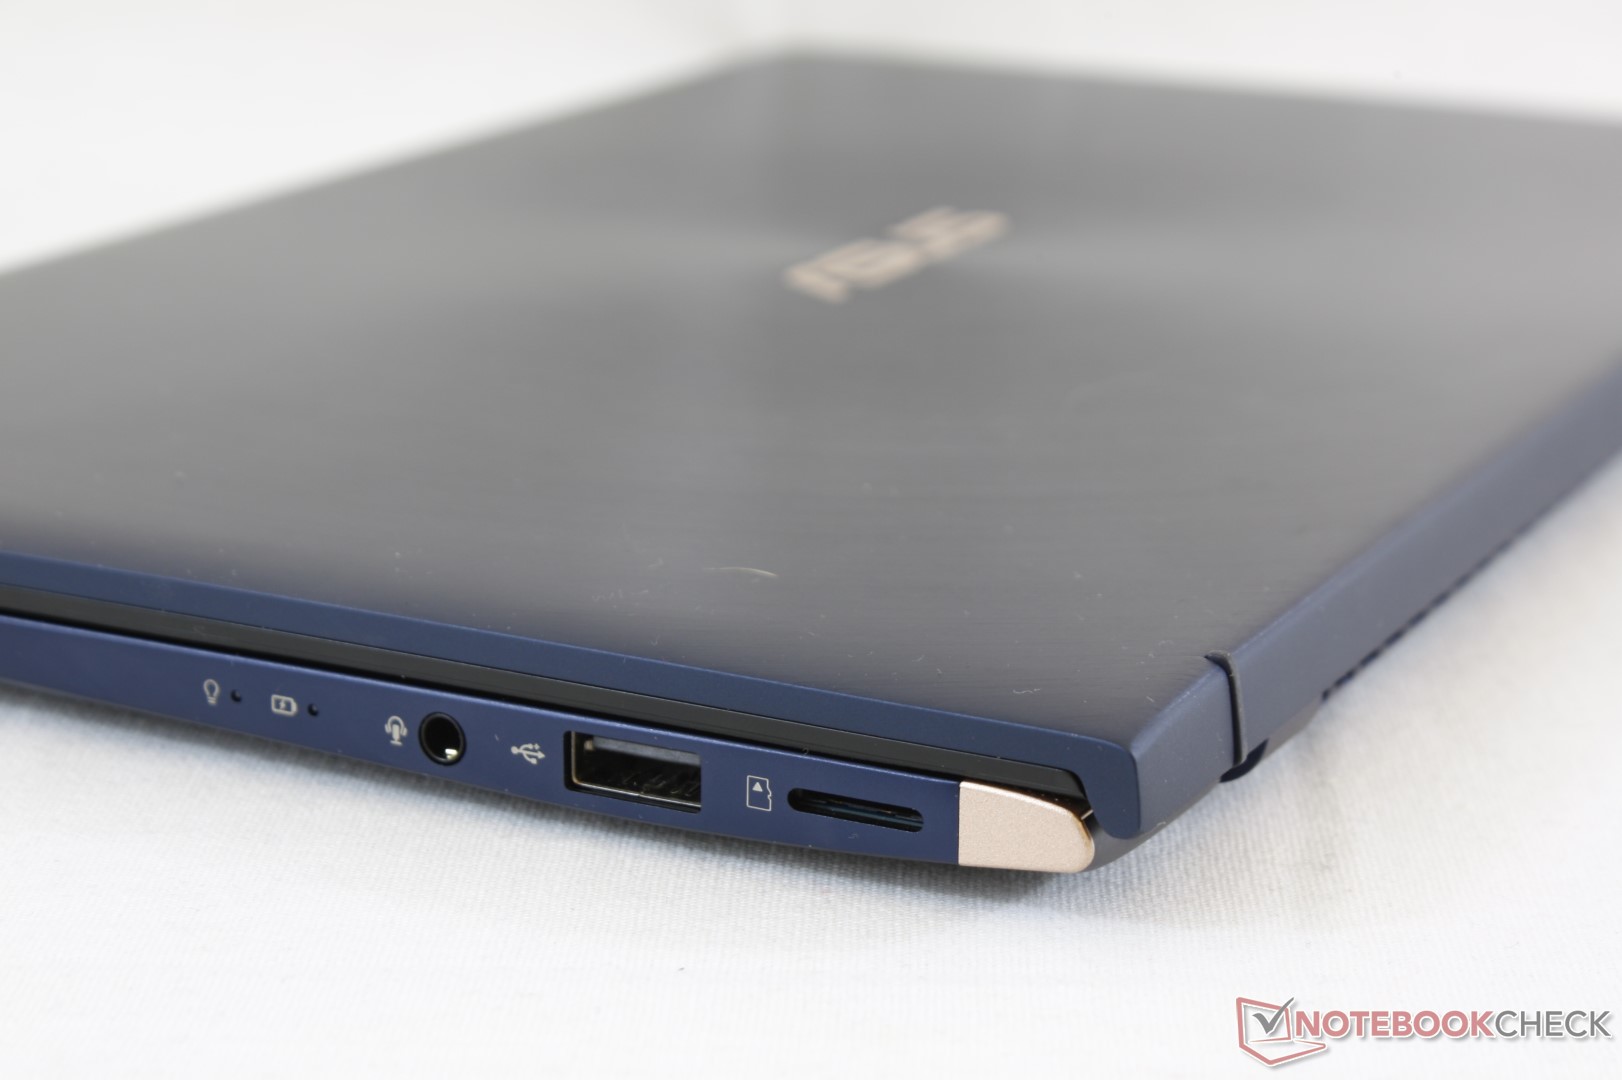
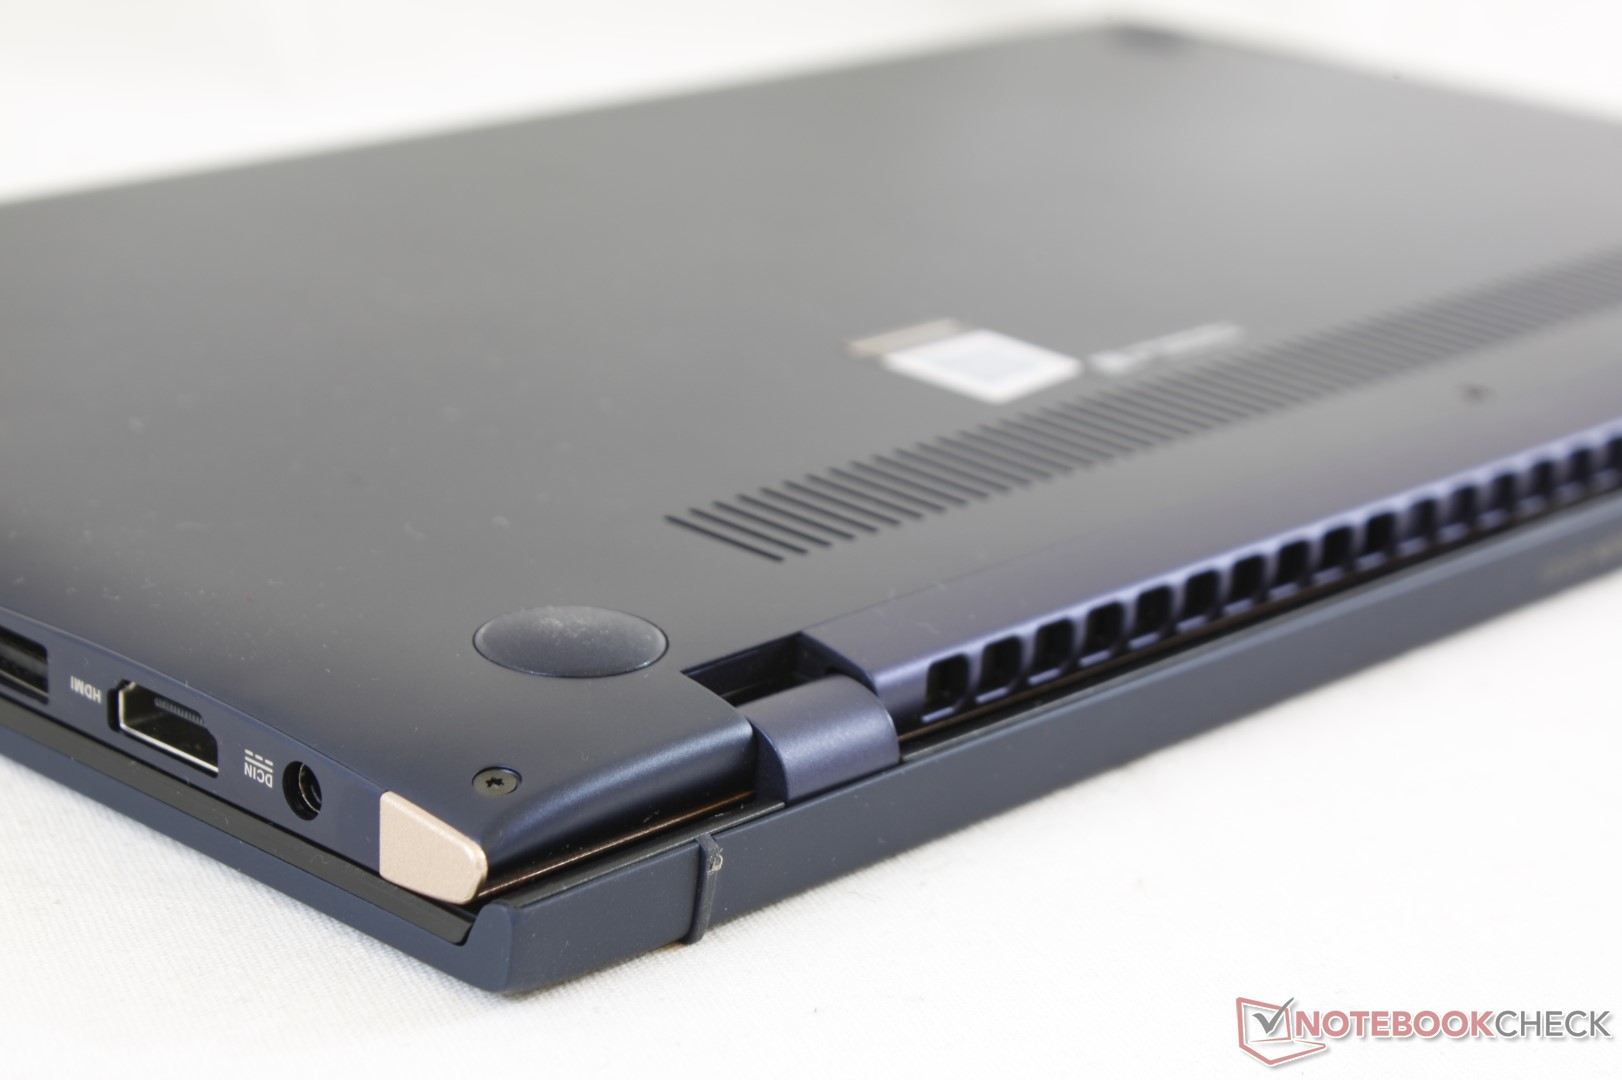
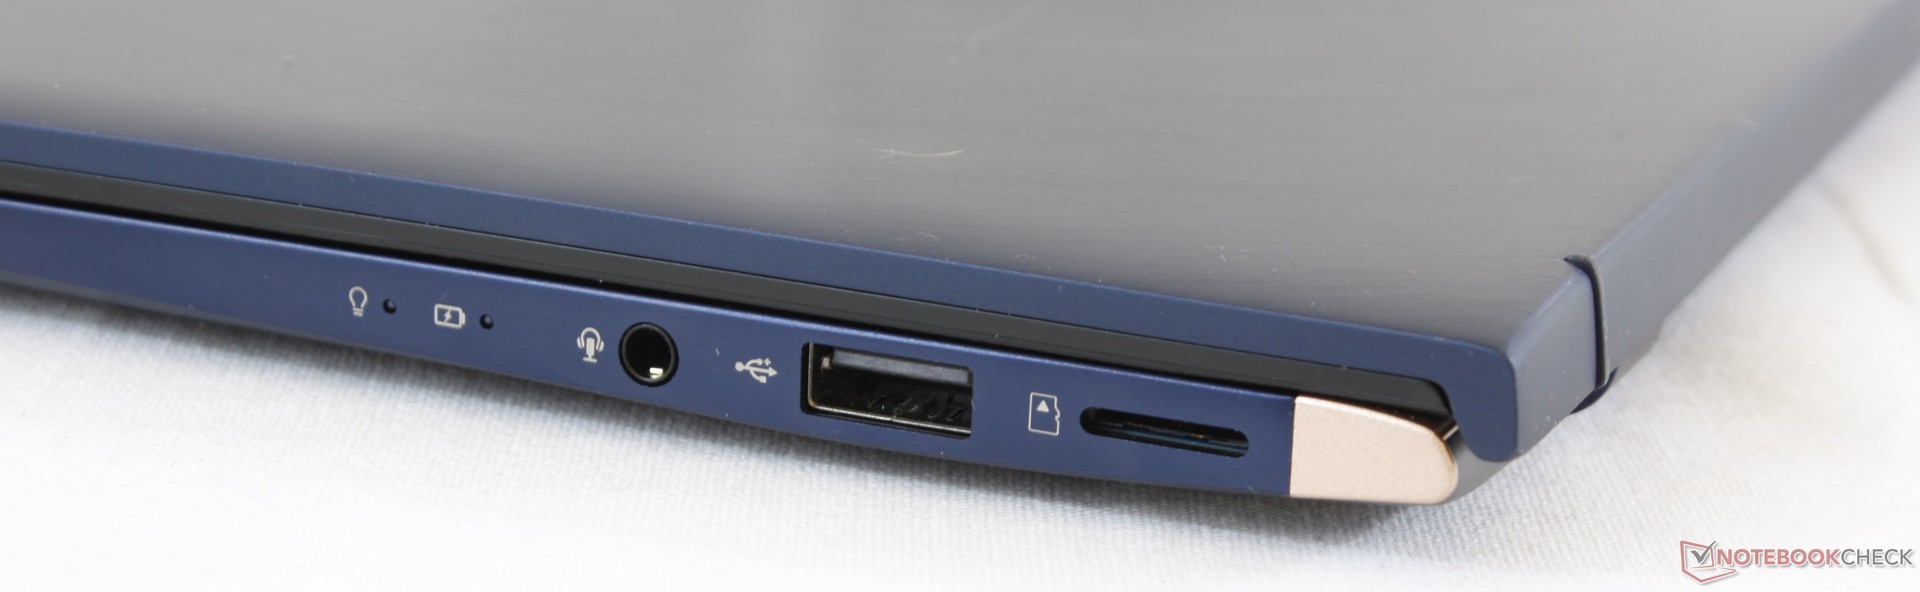
De flesta användare som letar efter en Ultrabook på 13 tum kommer troligen jämföra den här datorn med en Dell XPS 13 9370. Från det perspektivet har UX333 några fördelar och nackdelar att tänka på. Ett mindre fotavtryck, inbyggda USB Typ A- och HDMI-portar, alternativ för en snabbare GeForce MX150 GPU och ett lägre pris för samma Core i5 CPU är till Asus fördel. Å andra sidan har Dells system en mer ljusstark skärm, en tryckkänslig skärm som tillval, Thunderbolt 3, mångsidigare USB Typ C-laddning, en snabbare MicroSD-läsare och en större styrplatta. Valet beror i huvudsak på användarens preferenser.
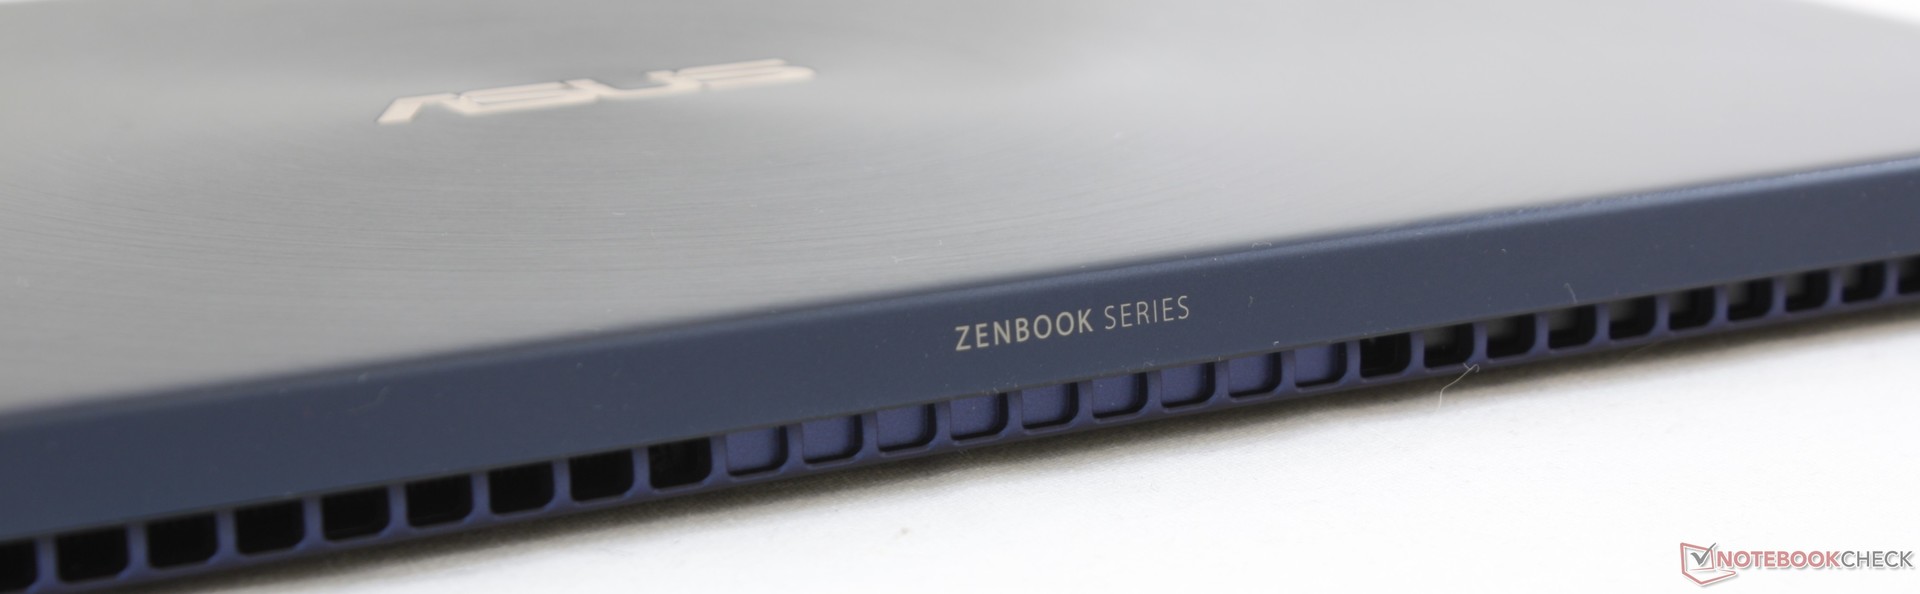
ZenBook UX333 får den äldre UX331 att se utdaterad ut vid jämförelse. Den tar serien till samma nivå som flaggskeppsalternativ som XPS 13 och Spectre 13 samtidigt som den kostar några tusen kronor mindre. Avsaknaden av Thunderbolt 3, USB Typ C-laddning och en tryckkänslig skärm kan vara svårt att svälja för entusiaster eller för den som reser mycket.
Asus ZenBook 13 UX333FA
- 12/28/2018 v6 (old)
Allen Ngo
Price comparison
