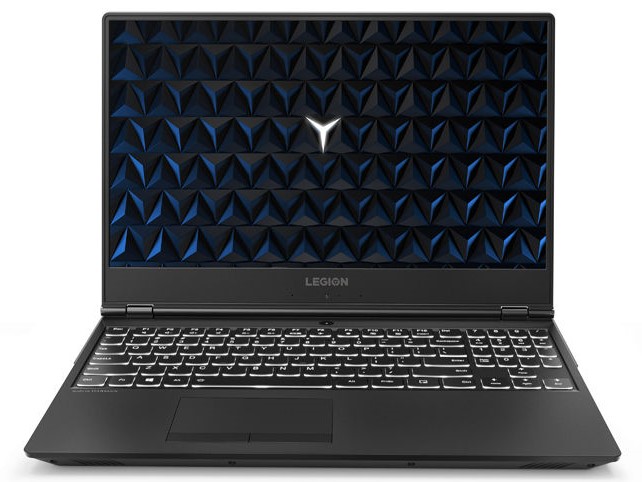
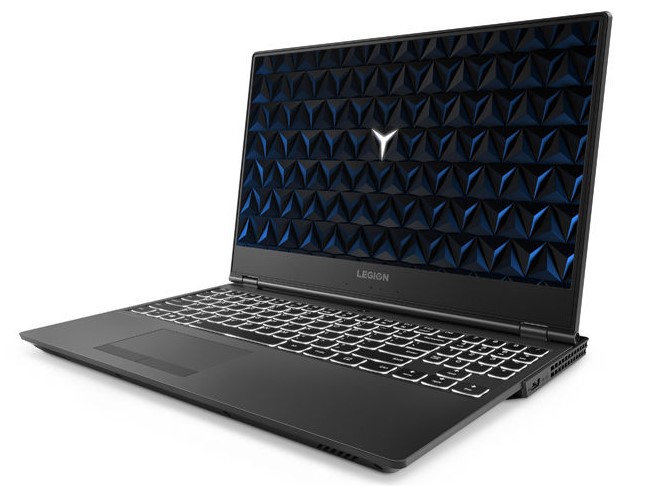
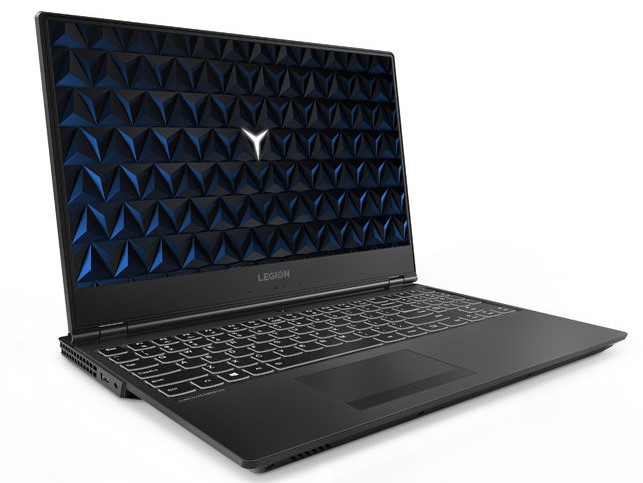
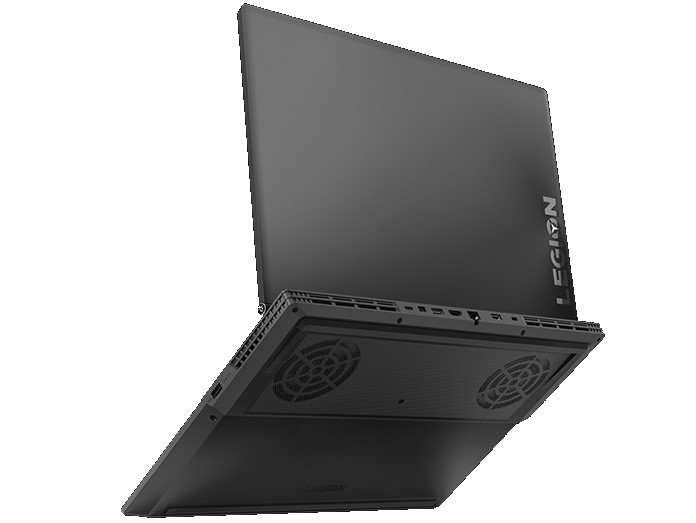
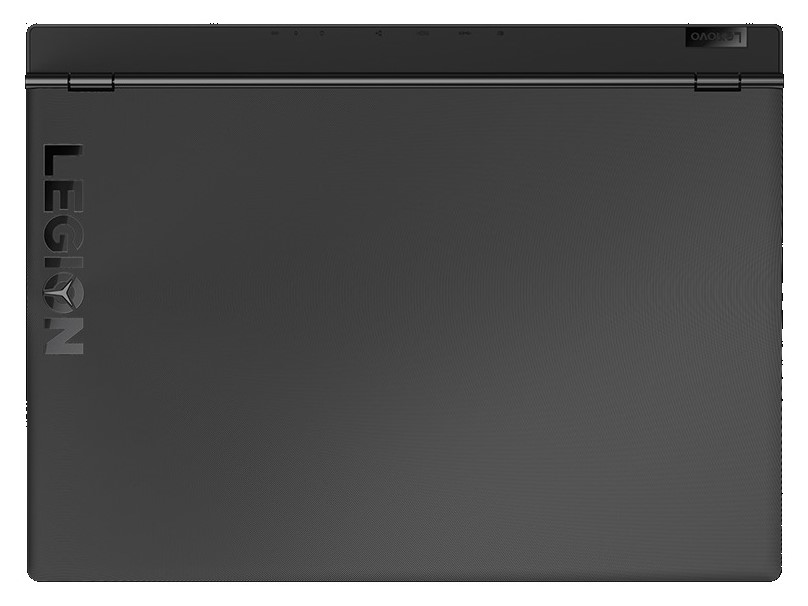
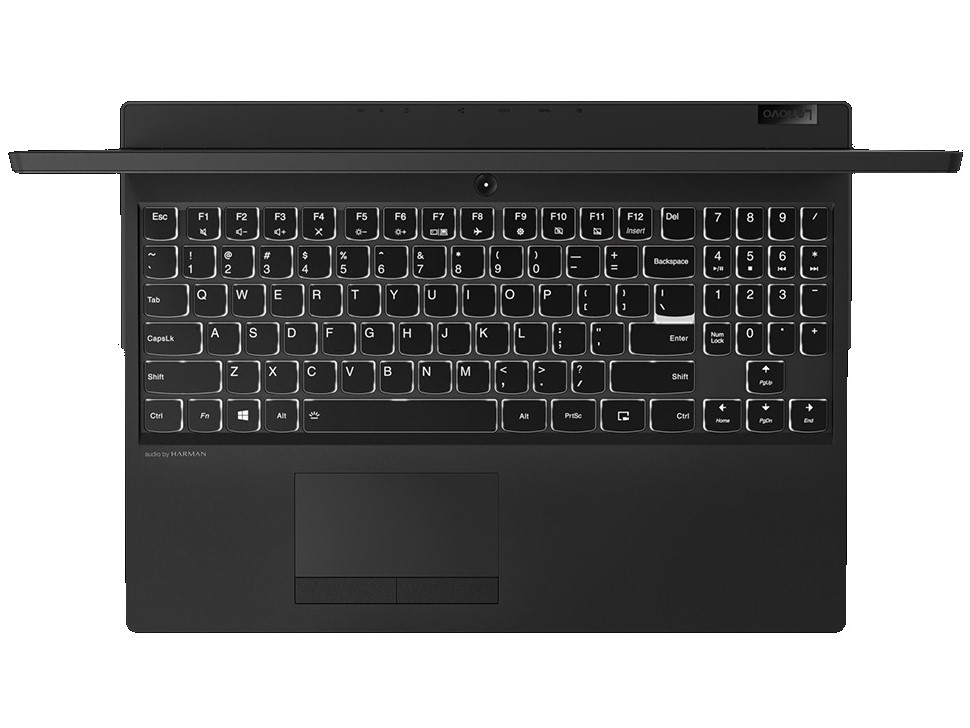
Test: Lenovo Legion Y530 (i7-8750H, GTX1060) Laptop (Sammanfattning)


| Networking | |
| iperf3 transmit AX12 | |
| HP Pavilion Gaming 15-cx0003ng | |
| Razer Blade 15 Base Model | |
| Lenovo Legion Y7000P-1060 | |
| Medion Erazer P6705-MD61131 | |
| Lenovo Legion Y530-15ICH | |
| Lenovo Legion Y530-15ICH | |
| iperf3 receive AX12 | |
| Medion Erazer P6705-MD61131 | |
| Razer Blade 15 Base Model | |
| Lenovo Legion Y530-15ICH | |
| Lenovo Legion Y7000P-1060 | |
| HP Pavilion Gaming 15-cx0003ng | |
| MSI P65 8RF-451 - Creator | |
| Lenovo Legion Y530-15ICH | |
| |||||||||||||||||||||||||
Distribution av ljusstyrkan: 83 %
Mitt på batteriet: 308 cd/m²
Kontrast: 587:1 (Svärta: 0.52 cd/m²)
ΔE ColorChecker Calman: 3.63 | ∀{0.5-29.43 Ø4.71}
calibrated: 1.31
ΔE Greyscale Calman: 4.77 | ∀{0.09-98 Ø4.96}
93% sRGB (Argyll 1.6.3 3D)
59% AdobeRGB 1998 (Argyll 1.6.3 3D)
63.8% AdobeRGB 1998 (Argyll 3D)
93% sRGB (Argyll 3D)
62.5% Display P3 (Argyll 3D)
Gamma: 2.54
CCT: 7500 K
| Lenovo Legion Y530-15ICH LG Display LP156WFG-SPB2, , 1920x1080, 15.6" | HP Pavilion Gaming 15-cx0003ng BOE07A1, , 1920x1080, 15.6" | Lenovo Legion Y7000P-1060 BOE NV156FHM-N61, , 1920x1080, 15.6" | Medion Erazer P6705-MD61131 AU Optronics B156HTN03.8 (AUO38ED), , 1920x1080, 15.6" | MSI P65 8RF-451 - Creator AU Optronics B156HAN08.0 (AUO80ED), , 1920x1080, 15.6" | Razer Blade 15 Base Model BOE NV156FHM-N61, , 1920x1080, 15.6" | Lenovo Legion Y530-15ICH B156HAN02.1, , 1920x1080, 15.6" | |
|---|---|---|---|---|---|---|---|
| Display | -36% | -1% | -41% | 2% | -1% | -38% | |
| Display P3 Coverage (%) | 62.5 | 39.72 -36% | 66.1 6% | 36.4 -42% | 65.1 4% | 66.3 6% | 38.31 -39% |
| sRGB Coverage (%) | 93 | 59.3 -36% | 86.4 -7% | 54.8 -41% | 91.1 -2% | 86.6 -7% | 57.3 -38% |
| AdobeRGB 1998 Coverage (%) | 63.8 | 41.04 -36% | 63.1 -1% | 37.61 -41% | 65.9 3% | 63.3 -1% | 39.58 -38% |
| Response Times | -198% | -206% | -122% | -4% | -191% | -193% | |
| Response Time Grey 50% / Grey 80% * (ms) | 15 ? | 47 ? -213% | 42.8 ? -185% | 44.8 ? -199% | 16 ? -7% | 39.2 ? -161% | 43.6 ? -191% |
| Response Time Black / White * (ms) | 11 ? | 31 ? -182% | 36 ? -227% | 16 ? -45% | 11 ? -0% | 35.2 ? -220% | 32.4 ? -195% |
| PWM Frequency (Hz) | 208 ? | 21740 ? | 21190 ? | ||||
| Screen | 7% | -17% | -71% | -5% | -5% | -36% | |
| Brightness middle (cd/m²) | 305 | 241 -21% | 312.9 3% | 200 -34% | 235 -23% | 273.6 -10% | 282.8 -7% |
| Brightness (cd/m²) | 284 | 236 -17% | 296 4% | 186 -35% | 235 -17% | 262 -8% | 264 -7% |
| Brightness Distribution (%) | 83 | 75 -10% | 88 6% | 85 2% | 85 2% | 86 4% | 88 6% |
| Black Level * (cd/m²) | 0.52 | 0.15 71% | 0.37 29% | 0.43 17% | 0.22 58% | 0.3 42% | 0.42 19% |
| Contrast (:1) | 587 | 1607 174% | 846 44% | 465 -21% | 1068 82% | 912 55% | 673 15% |
| Colorchecker dE 2000 * | 3.63 | 4.85 -34% | 5.49 -51% | 11.39 -214% | 2.82 22% | 3.22 11% | 4.93 -36% |
| Colorchecker dE 2000 max. * | 8.18 | 8.82 -8% | 8.78 -7% | 19.36 -137% | 4.82 41% | 7.61 7% | 17.65 -116% |
| Colorchecker dE 2000 calibrated * | 1.31 | 3.99 -205% | 3.05 -133% | 4.88 -273% | 4.1 -213% | 4.07 -211% | |
| Greyscale dE 2000 * | 4.77 | 5.15 -8% | 4.7 1% | 11.73 -146% | 2.32 51% | 1.4 71% | 3.8 20% |
| Gamma | 2.54 87% | 2.49 88% | 2.29 96% | 1.97 112% | 2.49 88% | 2.24 98% | 2.449 90% |
| CCT | 7500 87% | 7042 92% | 6779 96% | 12614 52% | 6310 103% | 6636 98% | 6112 106% |
| Color Space (Percent of AdobeRGB 1998) (%) | 59 | 38 -36% | 56.3 -5% | 35 -41% | 59 0% | 56.4 -4% | 36 -39% |
| Color Space (Percent of sRGB) (%) | 93 | 59 -37% | 86.1 -7% | 55 -41% | 92 -1% | 86.2 -7% | 57 -39% |
| Totalt genomsnitt (program/inställningar) | -76% /
-29% | -75% /
-38% | -78% /
-72% | -2% /
-4% | -66% /
-27% | -89% /
-56% |
* ... mindre är bättre
Visa svarstider
| ↔ Svarstid svart till vitt | ||
|---|---|---|
| 11 ms ... stiga ↗ och falla ↘ kombinerat | ↗ 7 ms stiga | 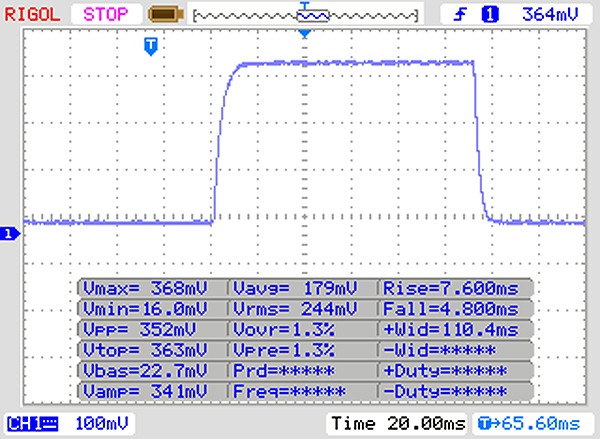 |
| ↘ 4 ms hösten | ||
| Skärmen visar bra svarsfrekvens i våra tester, men kan vara för långsam för konkurrenskraftiga spelare. I jämförelse sträcker sig alla testade enheter från 0.1 (minst) till 240 (maximalt) ms. » 30 % av alla enheter är bättre. Det betyder att den uppmätta svarstiden är bättre än genomsnittet av alla testade enheter (19.8 ms). | ||
| ↔ Svarstid 50 % grått till 80 % grått | ||
| 15 ms ... stiga ↗ och falla ↘ kombinerat | ↗ 8 ms stiga | 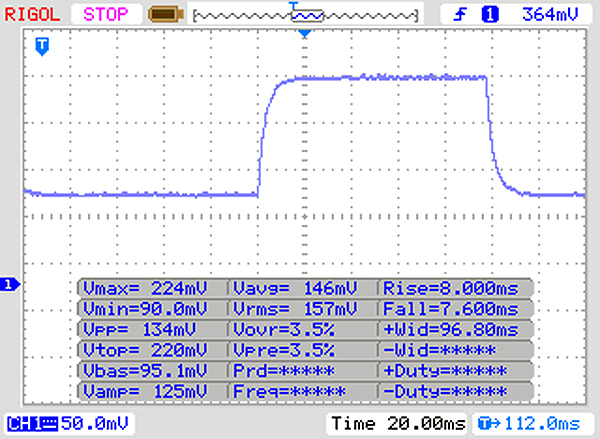 |
| ↘ 7 ms hösten | ||
| Skärmen visar bra svarsfrekvens i våra tester, men kan vara för långsam för konkurrenskraftiga spelare. I jämförelse sträcker sig alla testade enheter från 0.165 (minst) till 636 (maximalt) ms. » 29 % av alla enheter är bättre. Det betyder att den uppmätta svarstiden är bättre än genomsnittet av alla testade enheter (31 ms). | ||
Skärmflimmer / PWM (Puls-Width Modulation)
| Skärmflimmer / PWM upptäcktes inte | 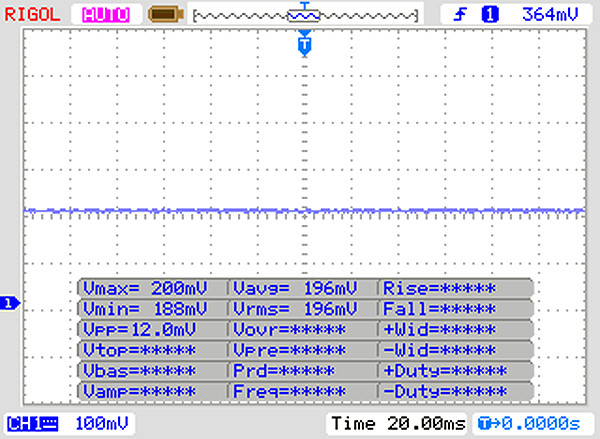 | ||
Som jämförelse: 52 % av alla testade enheter använder inte PWM för att dämpa skärmen. Om PWM upptäcktes mättes ett medelvärde av 7757 (minst: 5 - maximum: 343500) Hz. | |||
| PCMark 8 Home Score Accelerated v2 | 4440 poäng | |
| PCMark 8 Work Score Accelerated v2 | 5543 poäng | |
| PCMark 10 Score | 5125 poäng | |
Hjälp | ||
| Lenovo Legion Y530-15ICH Samsung SSD PM981 MZVLB256HAHQ | HP Pavilion Gaming 15-cx0003ng Intel Optane 16 GB MEMPEK1J016GAH + HGST HTS721010A9E630 1 TB HDD | Lenovo Legion Y7000P-1060 Samsung SSD PM981 MZVLB256HAHQ | Medion Erazer P6705-MD61131 Samsung SSD PM981 MZVLB256HAHQ | MSI P65 8RF-451 - Creator Kingston RBUSNS8154P3512GJ | Razer Blade 15 Base Model Samsung SSD PM981 MZVLB256HAHQ | Lenovo Legion Y530-15ICH Toshiba KBG30ZMT128G | Genomsnitt Samsung SSD PM981 MZVLB256HAHQ | |
|---|---|---|---|---|---|---|---|---|
| CrystalDiskMark 5.2 / 6 | -31% | -8% | 11% | -16% | 9% | -46% | 58% | |
| Write 4K (MB/s) | 108.9 | 59.2 -46% | 92.3 -15% | 107 -2% | 89.2 -18% | 112.5 3% | 71.8 -34% | 116.1 ? 7% |
| Read 4K (MB/s) | 40.23 | 91.3 127% | 39.04 -3% | 39.91 -1% | 34.36 -15% | 43.09 7% | 41.03 2% | 189.5 ? 371% |
| Write Seq (MB/s) | 1390 | 158.3 -89% | 1218 -12% | 1439 4% | 949 -32% | 1450 4% | 349 -75% | 1409 ? 1% |
| Read Seq (MB/s) | 964 | 880 -9% | 755 -22% | 2011 109% | 899 -7% | 1392 44% | 736 -24% | 1624 ? 68% |
| Write 4K Q32T1 (MB/s) | 314.2 | 161.8 -49% | 280.7 -11% | 282.1 -10% | 371.4 18% | 356.1 13% | 105.3 -66% | 360 ? 15% |
| Read 4K Q32T1 (MB/s) | 369.2 | 286.5 -22% | 328 -11% | 326.6 -12% | 399 8% | 406.9 10% | 308 -17% | 396 ? 7% |
| Write Seq Q32T1 (MB/s) | 1506 | 159.8 -89% | 1698 13% | 1441 -4% | 1035 -31% | 1451 -4% | 151.4 -90% | 1492 ? -1% |
| Read Seq Q32T1 (MB/s) | 3446 | 929 -73% | 3430 0% | 3516 2% | 1603 -53% | 3272 -5% | 1262 -63% | 3313 ? -4% |
| Write 4K Q8T8 (MB/s) | 760 | 1152 ? | ||||||
| Read 4K Q8T8 (MB/s) | 811 | 736 ? | ||||||
| AS SSD | -1631% | 60% | 19% | 11% | 58% | -160% | 50% | |
| Seq Read (MB/s) | 1808 | 854 -53% | 864 -52% | 2724 51% | 850 -53% | 1803 0% | 1231 -32% | 2032 ? 12% |
| Seq Write (MB/s) | 1429 | 147 -90% | 1646 15% | 1365 -4% | 869 -39% | 1367 -4% | 131.6 -91% | 1339 ? -6% |
| 4K Read (MB/s) | 46.1 | 105.1 128% | 32.4 -30% | 46.14 0% | 36.43 -21% | 40.75 -12% | 38.71 -16% | 46.1 ? 0% |
| 4K Write (MB/s) | 97 | 59.5 -39% | 88 -9% | 102.6 6% | 84.4 -13% | 93 -4% | 35.74 -63% | 107.4 ? 11% |
| 4K-64 Read (MB/s) | 536 | 42.09 -92% | 770 44% | 567 6% | 839 57% | 749 40% | 335.3 -37% | 712 ? 33% |
| 4K-64 Write (MB/s) | 273.6 | 137.3 -50% | 1392 409% | 459.8 68% | 602 120% | 1270 364% | 78.9 -71% | 999 ? 265% |
| Access Time Read * (ms) | 0.085 | 14.99 -17535% | 0.103 -21% | 0.08 6% | 0.104 -22% | 0.113 -33% | 0.626 -636% | 0.07076 ? 17% |
| Access Time Write * (ms) | 0.038 | 0.043 -13% | 0.044 -16% | 0.037 3% | 0.044 -16% | 0.04 -5% | 0.287 -655% | 0.04352 ? -15% |
| Score Read (Points) | 763 | 233 -69% | 888 16% | 886 16% | 960 26% | 970 27% | 497 -35% | 961 ? 26% |
| Score Write (Points) | 514 | 211 -59% | 1644 220% | 699 36% | 773 50% | 1499 192% | 128 -75% | 1240 ? 141% |
| Score Total (Points) | 1663 | 577 -65% | 3032 82% | 1983 19% | 2233 34% | 2952 78% | 838 -50% | 2671 ? 61% |
| Copy ISO MB/s (MB/s) | 110.1 | 1677 | 840 | 1892 | 1297 ? | |||
| Copy Program MB/s (MB/s) | 94.1 | 764 | 306.9 | 495.5 | 409 ? | |||
| Copy Game MB/s (MB/s) | 81.7 | 1298 | 622 | 1070 | 786 ? | |||
| Totalt genomsnitt (program/inställningar) | -831% /
-957% | 26% /
31% | 15% /
15% | -3% /
-0% | 34% /
38% | -103% /
-112% | 54% /
53% |
* ... mindre är bättre

| 3DMark 11 - 1280x720 Performance GPU | |
| Genomsnitt av klass Gaming (21841 - 80022, n=104, senaste 2 åren) | |
| MSI P65 8RF-451 - Creator | |
| Genomsnitt NVIDIA GeForce GTX 1060 Mobile (12620 - 15607, n=77) | |
| Lenovo Legion Y530-15ICH | |
| Lenovo Legion Y7000P-1060 | |
| Razer Blade 15 Base Model | |
| Lenovo Legion Y530-15ICH | |
| Medion Erazer P6705-MD61131 | |
| HP Pavilion Gaming 15-cx0003ng | |
| 3DMark 11 Performance | 13743 poäng | |
| 3DMark Cloud Gate Standard Score | 34124 poäng | |
| 3DMark Fire Strike Score | 10389 poäng | |
Hjälp | ||
| The Witcher 3 | |
| 1920x1080 High Graphics & Postprocessing (Nvidia HairWorks Off) | |
| Genomsnitt av klass Gaming (341 - 404, n=2, senaste 2 åren) | |
| MSI P65 8RF-451 - Creator | |
| Lenovo Legion Y530-15ICH | |
| Lenovo Legion Y7000P-1060 | |
| Razer Blade 15 Base Model | |
| Genomsnitt NVIDIA GeForce GTX 1060 Mobile (52.6 - 80.6, n=49) | |
| Medion Erazer P6705-MD61131 | |
| HP Pavilion Gaming 15-cx0003ng | |
| 1920x1080 Ultra Graphics & Postprocessing (HBAO+) | |
| Genomsnitt av klass Gaming (104.7 - 240, n=7, senaste 2 åren) | |
| MSI P65 8RF-451 - Creator | |
| Lenovo Legion Y530-15ICH | |
| Genomsnitt NVIDIA GeForce GTX 1060 Mobile (24 - 42.3, n=60) | |
| Razer Blade 15 Base Model | |
| Lenovo Legion Y530-15ICH | |
| Lenovo Legion Y7000P-1060 | |
| Medion Erazer P6705-MD61131 | |
| HP Pavilion Gaming 15-cx0003ng | |
| låg | med. | hög | ultra | |
|---|---|---|---|---|
| BioShock Infinite (2013) | 280.5 | 232.6 | 224.8 | 114.2 |
| Thief (2014) | 98.4 | 77.9 | ||
| The Witcher 3 (2015) | 78 | 41.4 | ||
| Rise of the Tomb Raider (2016) | 64.8 |
Ljudnivå
| Låg belastning |
| 30.9 / 30.9 / 31.6 dB(A) |
| Hårddisk |
| 31.3 dB(A) |
| Hög belastning |
| 42.3 / 40 dB(A) |
 | ||
30 dB tyst 40 dB(A) hörbar 50 dB(A) högt ljud |
||
min: | ||
(-) Den maximala temperaturen på ovansidan är 48.4 °C / 119 F, jämfört med genomsnittet av 40.4 °C / 105 F , allt från 21.2 till 68.8 °C för klassen Gaming.
(-) Botten värms upp till maximalt 48 °C / 118 F, jämfört med genomsnittet av 43.2 °C / 110 F
(+) Vid tomgångsbruk är medeltemperaturen för ovansidan 25.8 °C / 78 F, jämfört med enhetsgenomsnittet på 33.9 °C / ### class_avg_f### F.
(+) Handledsstöden och pekplattan är kallare än hudtemperaturen med maximalt 29.6 °C / 85.3 F och är därför svala att ta på.
(±) Medeltemperaturen för handledsstödsområdet på liknande enheter var 28.8 °C / 83.8 F (-0.8 °C / -1.5 F).
Lenovo Legion Y530-15ICH ljudanalys
(-) | inte särskilt höga högtalare (68.3 dB)
Bas 100 - 315 Hz
(±) | reducerad bas - i genomsnitt 11.5% lägre än medianen
(+) | basen är linjär (6.4% delta till föregående frekvens)
Mellan 400 - 2000 Hz
(±) | högre mellan - i genomsnitt 5% högre än median
(+) | mids är linjära (6.9% delta till föregående frekvens)
Högsta 2 - 16 kHz
(+) | balanserade toppar - endast 3% från medianen
(+) | toppar är linjära (4.6% delta till föregående frekvens)
Totalt 100 - 16 000 Hz
(±) | linjäriteten för det totala ljudet är genomsnittlig (16% skillnad mot median)
Jämfört med samma klass
» 38% av alla testade enheter i den här klassen var bättre, 6% liknande, 55% sämre
» Den bästa hade ett delta på 6%, genomsnittet var 18%, sämst var 132%
Jämfört med alla testade enheter
» 25% av alla testade enheter var bättre, 5% liknande, 69% sämre
» Den bästa hade ett delta på 4%, genomsnittet var 23%, sämst var 134%
| Av/Standby | |
| Låg belastning | |
| Hög belastning |
|
Förklaring:
min: | |
| Lenovo Legion Y530-15ICH i7-8750H, GeForce GTX 1060 Mobile, Samsung SSD PM981 MZVLB256HAHQ, IPS, 1920x1080, 15.6" | HP Pavilion Gaming 15-cx0003ng i7-8750H, GeForce GTX 1050 Ti Mobile, Intel Optane 16 GB MEMPEK1J016GAH + HGST HTS721010A9E630 1 TB HDD, IPS, 1920x1080, 15.6" | Lenovo Legion Y7000P-1060 i7-8750H, GeForce GTX 1060 Mobile, Samsung SSD PM981 MZVLB256HAHQ, IPS, 1920x1080, 15.6" | Medion Erazer P6705-MD61131 i7-8750H, GeForce GTX 1050 Ti Mobile, Samsung SSD PM981 MZVLB256HAHQ, TN, 1920x1080, 15.6" | MSI P65 8RF-451 - Creator i7-8750H, GeForce GTX 1070 Max-Q, Kingston RBUSNS8154P3512GJ, IPS, 1920x1080, 15.6" | Razer Blade 15 Base Model i7-8750H, GeForce GTX 1060 Max-Q, Samsung SSD PM981 MZVLB256HAHQ, IPS, 1920x1080, 15.6" | Lenovo Legion Y530-15ICH i5-8300H, GeForce GTX 1050 Ti Mobile, Toshiba KBG30ZMT128G, IPS, 1920x1080, 15.6" | Genomsnitt NVIDIA GeForce GTX 1060 Mobile | Genomsnitt av klass Gaming | |
|---|---|---|---|---|---|---|---|---|---|
| Power Consumption | 16% | 5% | 27% | -6% | -14% | 16% | -36% | -60% | |
| Idle Minimum * (Watt) | 7.3 | 5.5 25% | 4.9 33% | 4 45% | 7.4 -1% | 10.2 -40% | 4.5 38% | 12.7 ? -74% | 13 ? -78% |
| Idle Average * (Watt) | 11.1 | 8.5 23% | 8.1 27% | 7 37% | 11.7 -5% | 13.2 -19% | 10 10% | 17.5 ? -58% | 19 ? -71% |
| Idle Maximum * (Watt) | 12.6 | 11.9 6% | 16.5 -31% | 11 13% | 16.8 -33% | 17.6 -40% | 13.8 -10% | 21.8 ? -73% | 24.6 ? -95% |
| Load Average * (Watt) | 109 | 94 14% | 109.2 -0% | 72 34% | 94 14% | 99.5 9% | 92.5 15% | 91.7 ? 16% | 110.7 ? -2% |
| Load Maximum * (Watt) | 168 | 144 14% | 175.2 -4% | 158 6% | 177 -5% | 133.3 21% | 123.2 27% | 156.4 ? 7% | 259 ? -54% |
| Witcher 3 ultra * (Watt) | 86 | 124.6 | 79 | 113.6 | 108.1 |
* ... mindre är bättre
| Lenovo Legion Y530-15ICH i7-8750H, GeForce GTX 1060 Mobile, 52 Wh | HP Pavilion Gaming 15-cx0003ng i7-8750H, GeForce GTX 1050 Ti Mobile, 52.5 Wh | Lenovo Legion Y7000P-1060 i7-8750H, GeForce GTX 1060 Mobile, 57 Wh | Medion Erazer P6705-MD61131 i7-8750H, GeForce GTX 1050 Ti Mobile, 62 Wh | MSI P65 8RF-451 - Creator i7-8750H, GeForce GTX 1070 Max-Q, 82 Wh | Razer Blade 15 Base Model i7-8750H, GeForce GTX 1060 Max-Q, 65 Wh | Lenovo Legion Y530-15ICH i5-8300H, GeForce GTX 1050 Ti Mobile, 52.5 Wh | Genomsnitt av klass Gaming | |
|---|---|---|---|---|---|---|---|---|
| Batteridrifttid | 106% | 72% | 203% | 109% | 120% | 8% | 121% | |
| Reader / Idle (h) | 8.3 | 10.8 30% | 13.6 64% | 8.9 7% | 7.5 -10% | 11.5 39% | 8.27 ? 0% | |
| WiFi v1.3 (h) | 3.8 | 5.3 39% | 5.8 53% | 6.7 76% | 7.1 87% | 5.5 45% | 4.1 8% | 7.11 ? 87% |
| Load (h) | 0.4 | 1.4 250% | 0.8 100% | 2.5 525% | 1.4 250% | 1.5 275% | 1.502 ? 276% |
För
Emot
Läs den fullständiga versionen av den här recensionen på engelska här.
Lenovo Legion Y530 är en kraftfull spellaptop oavsett konfiguration som kan utnyttja prestandan från sina komponenter riktigt väl och får därför riktigt bra resultat i både syntetiska prestandatester och speltester. Skärmen producerar fina bilder med bra färger.
Med tanke på den låga priset kan vi rekommendera Lenovo Legion T530 med Nvidia GeForce GTX 1060.
Kyllösningen måste fungera bra för att prestandan ska kunna upprätthållas, men detta resulterar i fläktar som låter mycket vid belastning. Vid längre spelsessioner kan du vilja använda hörlurar. Batteritiden är dessutom jämförelsevis kort även om detta inte är ovanligt för enheter i det här segmentet.
Lenovo Legion Y530-15ICH
- 12/14/2018 v6 (old)
Mike Wobker
Price comparison
