Test: HP Spectre x360 13t (i7-8550U, FHD) Laptop (Sammanfattning)

| Networking | |
| iperf3 transmit AX12 | |
| Lenovo Yoga 720-13IKB | |
| Asus VivoBook Flip 15 TP510UA-E8073T | |
| HP Spectre 13-v131ng | |
| HP Spectre 13-af033ng | |
| Asus ZenBook 13 UX331UN | |
| Dell XPS 13 9370 FHD i5 | |
| Apple MacBook Pro 13 2017 | |
| Schenker Slim 15 L17 | |
| Lenovo ThinkPad X1 Yoga 2017 20JD0015US | |
| iperf3 receive AX12 | |
| Apple MacBook Pro 13 2017 | |
| Lenovo ThinkPad X1 Yoga 2017 20JD0015US | |
| Schenker Slim 15 L17 | |
| Dell XPS 13 9370 FHD i5 | |
| Lenovo Yoga 720-13IKB | |
| HP Spectre 13-af033ng | |
| Asus ZenBook 13 UX331UN | |
| Asus VivoBook Flip 15 TP510UA-E8073T | |
| HP Spectre 13-v131ng | |
| |||||||||||||||||||||||||
Distribution av ljusstyrkan: 80 %
Mitt på batteriet: 291 cd/m²
Kontrast: 1448:1 (Svärta: 0.21 cd/m²)
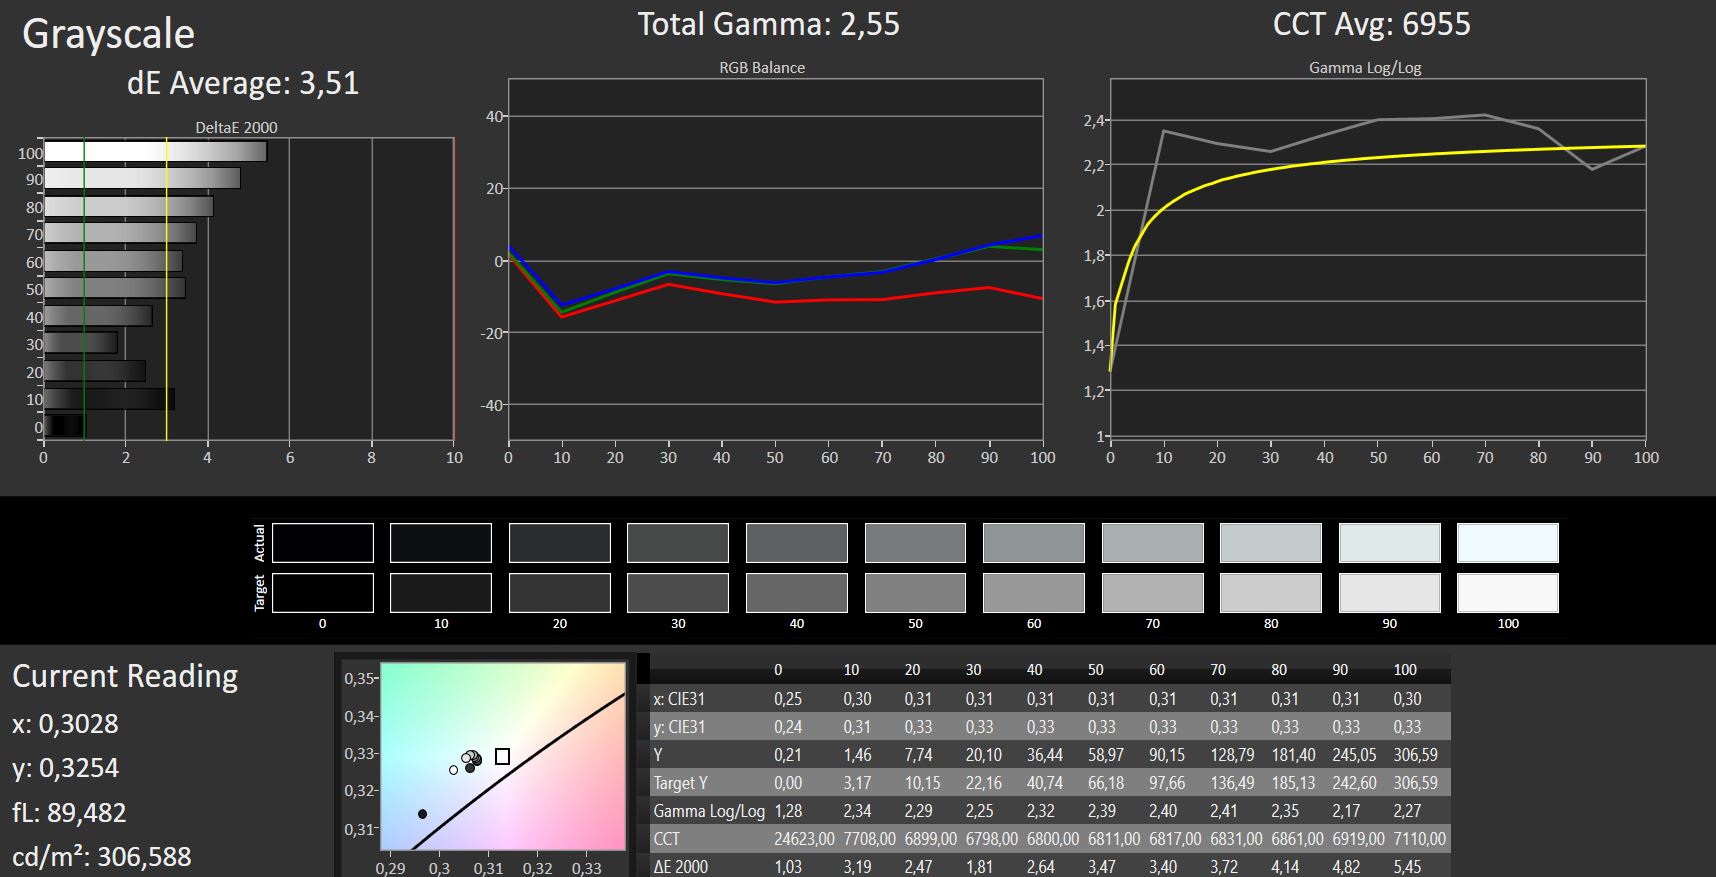
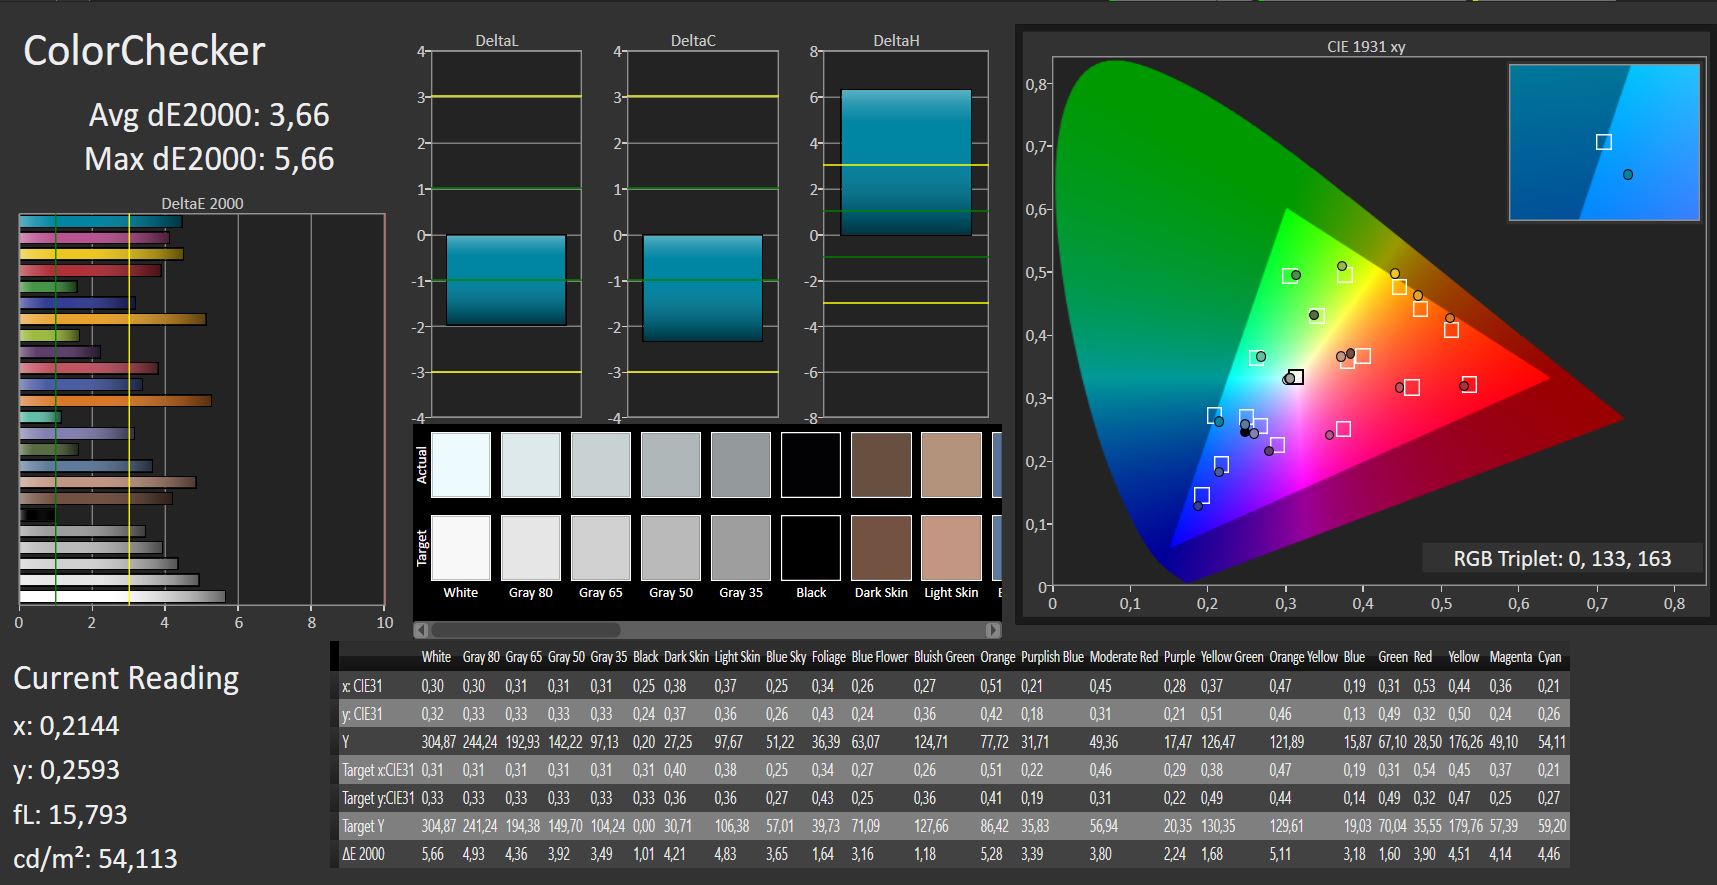
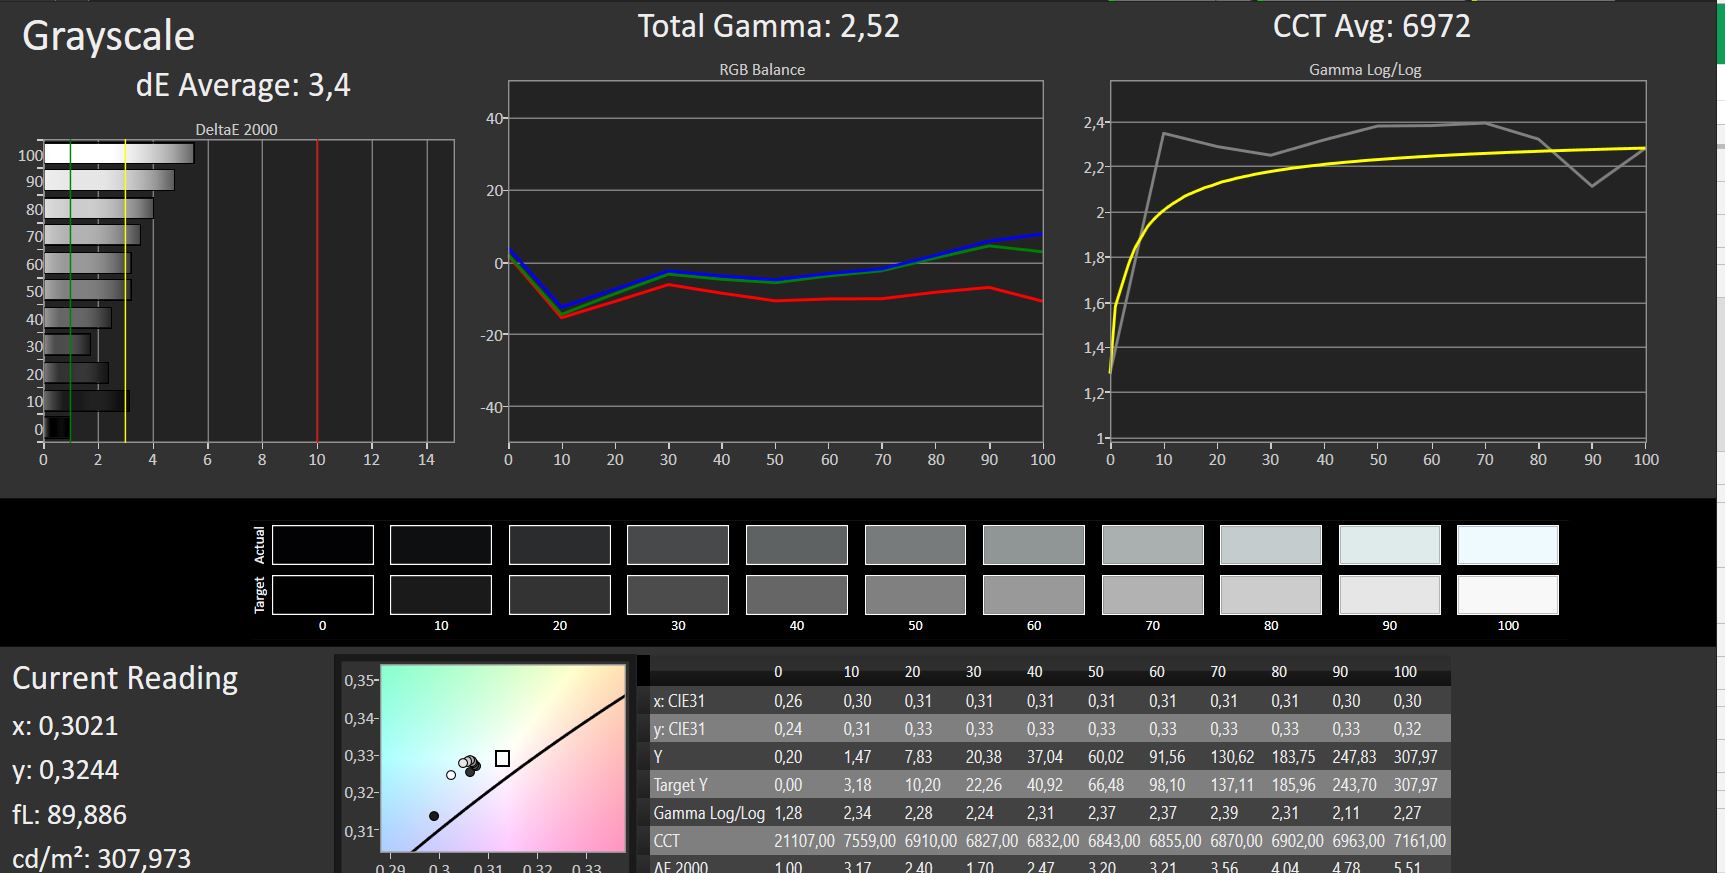
ΔE ColorChecker Calman: 3.66 | ∀{0.5-29.43 Ø4.71}
ΔE Greyscale Calman: 3.51 | ∀{0.09-98 Ø4.96}
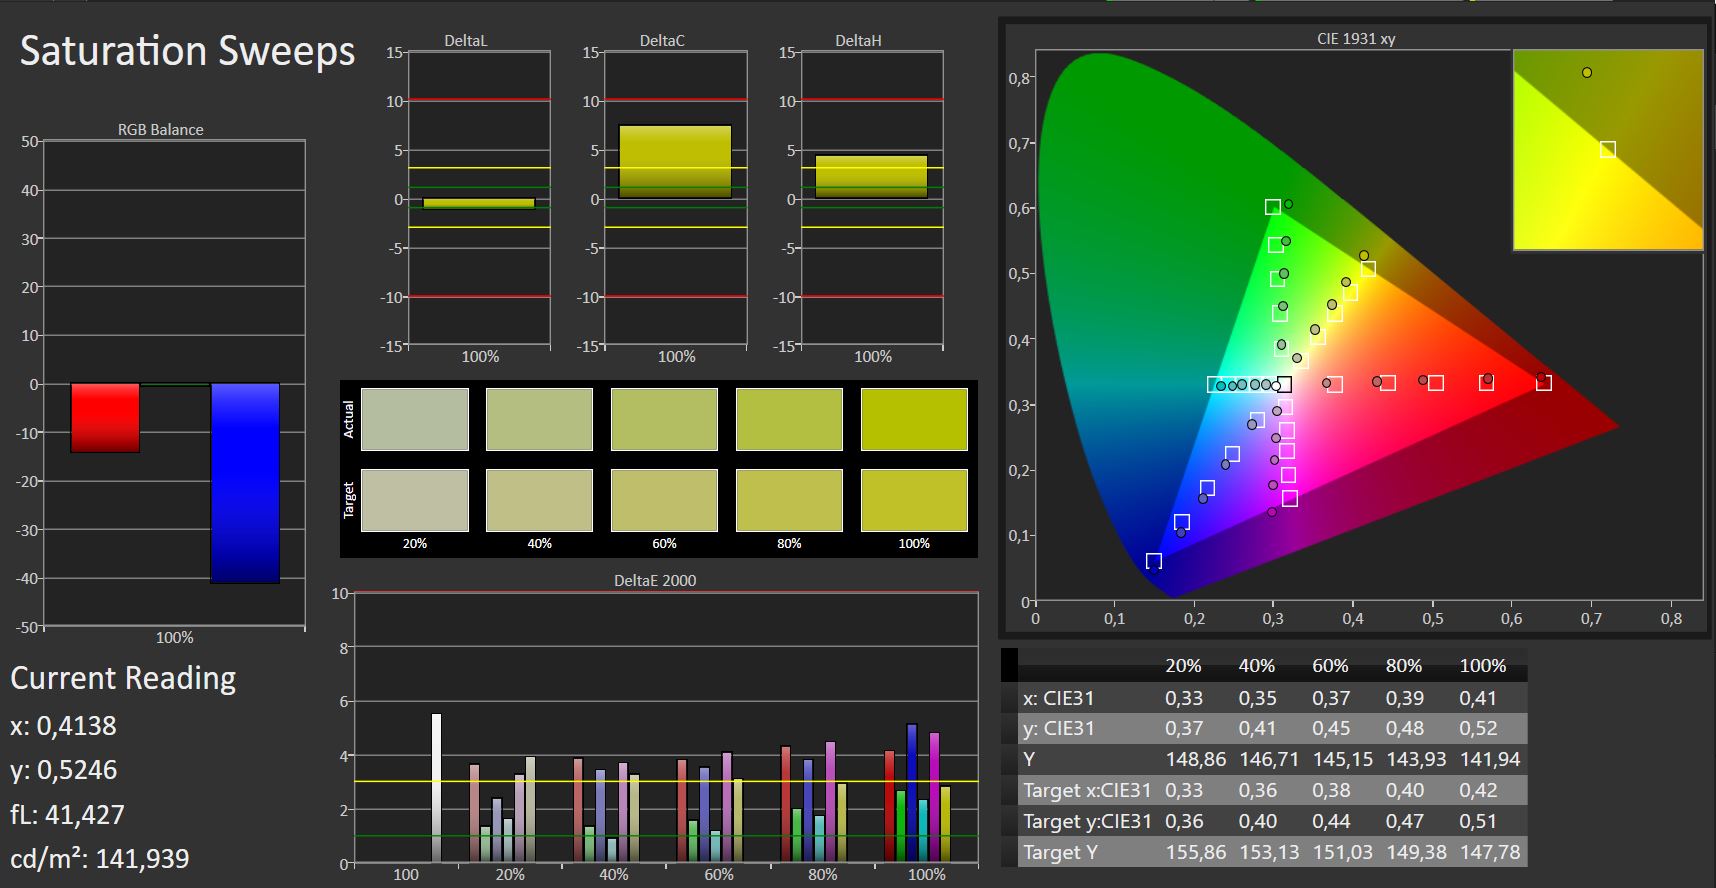
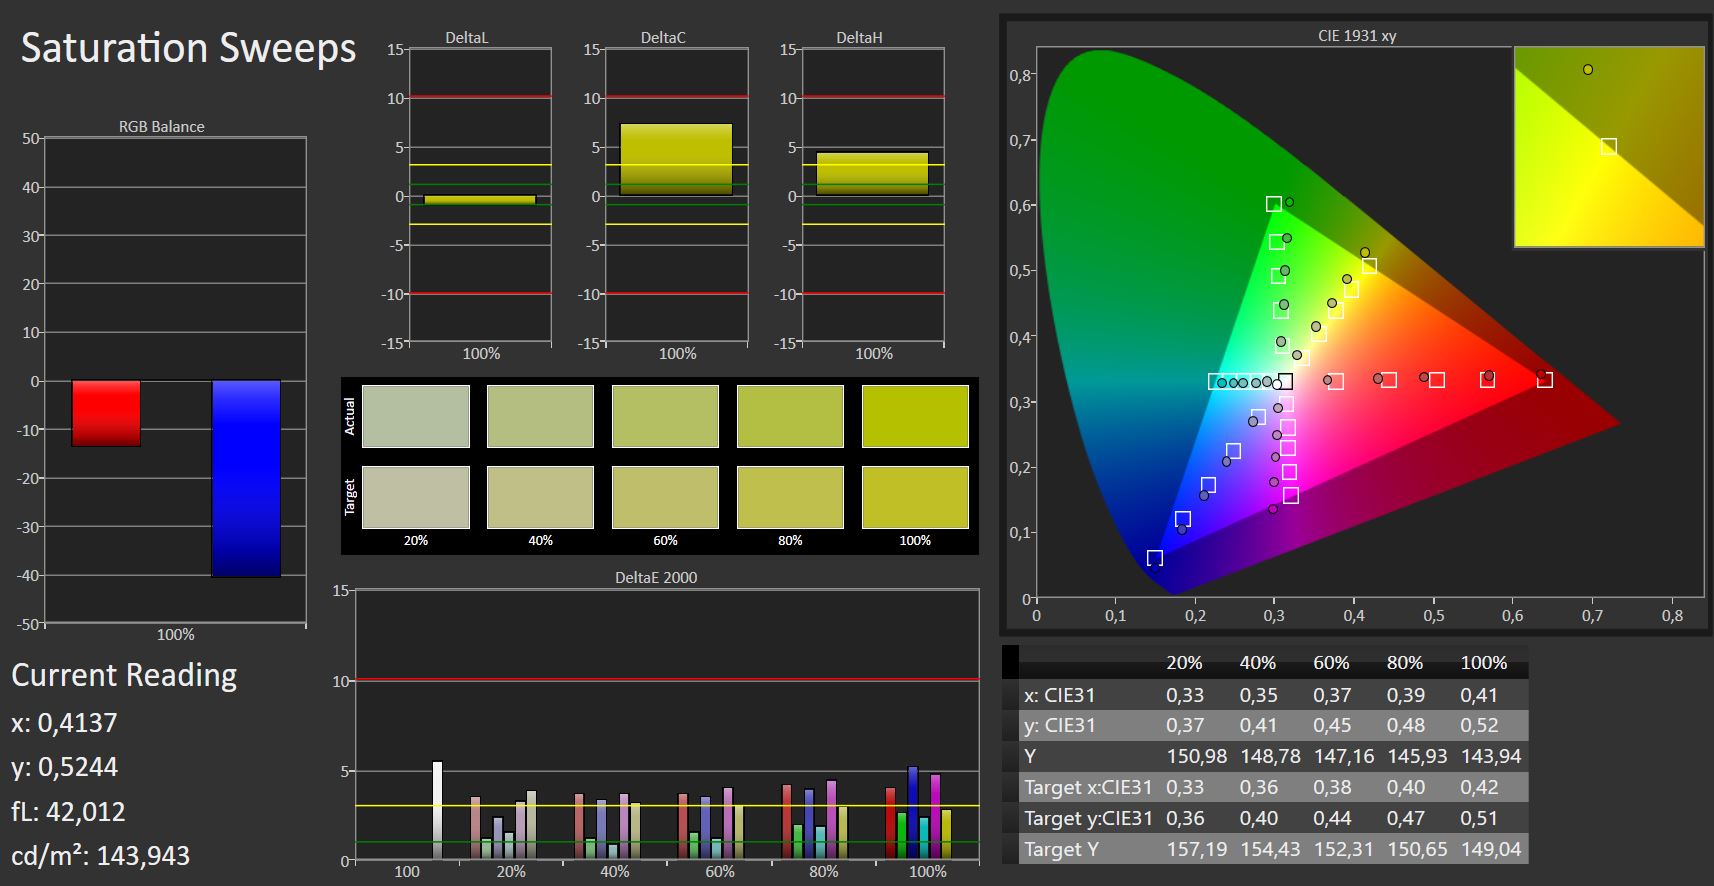
91% sRGB (Argyll 1.6.3 3D)
59% AdobeRGB 1998 (Argyll 1.6.3 3D)
65.1% AdobeRGB 1998 (Argyll 3D)
90.7% sRGB (Argyll 3D)
64% Display P3 (Argyll 3D)
Gamma: 2.55
CCT: 6955 K
| HP Spectre 13-af033ng, i5-8550U AU Optronics AUO422D, , 1920x1080, 13.3" | HP Spectre 13-v131ng, i7-7500U CMN1374, , 1920x1080, 13.3" | HP Spectre 13, 6500U 1920x1080, 13.3" | Apple MacBook Pro 13 2017, i5-7360U APPA033, , 2560x1600, 13.3" | Dell XPS 13 i7-8550U, i5-8550U ID: Sharp SHP144A, Name: LQ133Z1, , 3200x1800, 13.3" | Schenker Slim 15 L17, i5-8550U LG LP156WF6, , 1920x1080, 15.6" | Asus ZenBook 13 UX331UN, i5-8550U B133HAN04.9, , 1920x1080, 13.3" | Acer Spin 5 SP515-51GN-80A3, i5-8550U AUO, B156HAN06.1, , 1920x1080, 15.6" | |
|---|---|---|---|---|---|---|---|---|
| Display | -0% | 3% | 33% | 1% | -5% | 2% | -38% | |
| Display P3 Coverage (%) | 64 | 64.6 1% | 65.6 2% | 99.2 55% | 63.6 -1% | 63.9 0% | 65.4 2% | 38.73 -39% |
| sRGB Coverage (%) | 90.7 | 88.8 -2% | 94.7 4% | 99.9 10% | 93 3% | 82.8 -9% | 93.1 3% | 58.3 -36% |
| AdobeRGB 1998 Coverage (%) | 65.1 | 64.8 0% | 67.5 4% | 87.1 34% | 65.4 0% | 60.5 -7% | 66.4 2% | 40.02 -39% |
| Response Times | -54% | -63% | -40% | -23% | -35% | -7% | -39% | |
| Response Time Grey 50% / Grey 80% * (ms) | 27 ? | 46 ? -70% | 50.8 ? -88% | 42.8 ? -59% | 35.6 ? -32% | 40 ? -48% | 22.4 ? 17% | 42 ? -56% |
| Response Time Black / White * (ms) | 24 ? | 33 ? -38% | 33.2 ? -38% | 28.8 ? -20% | 27.2 ? -13% | 29.2 ? -22% | 31.2 ? -30% | 29 ? -21% |
| PWM Frequency (Hz) | 19690 ? | 20660 ? | ||||||
| Screen | -21% | 9% | 26% | -13% | -14% | -10% | -6% | |
| Brightness middle (cd/m²) | 304 | 404 33% | 300.5 -1% | 588 93% | 386.1 27% | 333 10% | 338 11% | 221 -27% |
| Brightness (cd/m²) | 287 | 382 33% | 305 6% | 561 95% | 357 24% | 336 17% | 321 12% | 224 -22% |
| Brightness Distribution (%) | 80 | 91 14% | 76 -5% | 92 15% | 83 4% | 93 16% | 90 13% | 89 11% |
| Black Level * (cd/m²) | 0.21 | 0.35 -67% | 0.184 12% | 0.45 -114% | 0.33 -57% | 0.3 -43% | 0.35 -67% | 0.12 43% |
| Contrast (:1) | 1448 | 1154 -20% | 1633 13% | 1307 -10% | 1170 -19% | 1110 -23% | 966 -33% | 1842 27% |
| Colorchecker dE 2000 * | 3.66 | 5.37 -47% | 2.64 28% | 1.7 54% | 4.2 -15% | 4.7 -28% | 4.2 -15% | 4.12 -13% |
| Colorchecker dE 2000 max. * | 5.66 | 9.46 -67% | 5.06 11% | 3.5 38% | 7.6 -34% | 9.7 -71% | 6.5 -15% | 6.41 -13% |
| Greyscale dE 2000 * | 3.51 | 6.44 -83% | 2.8 20% | 1.9 46% | 5.7 -62% | 3.5 -0% | 3.9 -11% | 3.4 3% |
| Gamma | 2.55 86% | 2.52 87% | 2.16 102% | 2.33 94% | 2.28 96% | 2.26 97% | 2.43 91% | 2.54 87% |
| CCT | 6955 93% | 6738 96% | 6999 93% | 6738 96% | 7336 89% | 6339 103% | 7144 91% | 6893 94% |
| Color Space (Percent of AdobeRGB 1998) (%) | 59 | 58 -2% | 60.9 3% | 77.92 32% | 59 0% | 54.2 -8% | 60.4 2% | 37 -37% |
| Color Space (Percent of sRGB) (%) | 91 | 89 -2% | 94.3 4% | 99.94 10% | 92.2 1% | 82.7 -9% | 93.1 2% | 58 -36% |
| Totalt genomsnitt (program/inställningar) | -25% /
-21% | -17% /
-2% | 6% /
19% | -12% /
-12% | -18% /
-15% | -5% /
-7% | -28% /
-17% |
* ... mindre är bättre

Visa svarstider
| ↔ Svarstid svart till vitt | ||
|---|---|---|
| 24 ms ... stiga ↗ och falla ↘ kombinerat | ↗ 14 ms stiga | 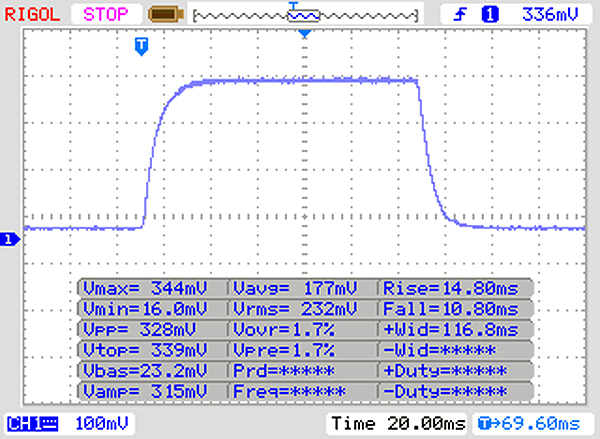 |
| ↘ 10 ms hösten | ||
| Skärmen visar bra svarsfrekvens i våra tester, men kan vara för långsam för konkurrenskraftiga spelare. I jämförelse sträcker sig alla testade enheter från 0.1 (minst) till 240 (maximalt) ms. » 54 % av alla enheter är bättre. Detta innebär att den uppmätta svarstiden är sämre än genomsnittet av alla testade enheter (19.8 ms). | ||
| ↔ Svarstid 50 % grått till 80 % grått | ||
| 27 ms ... stiga ↗ och falla ↘ kombinerat | ↗ 12 ms stiga | 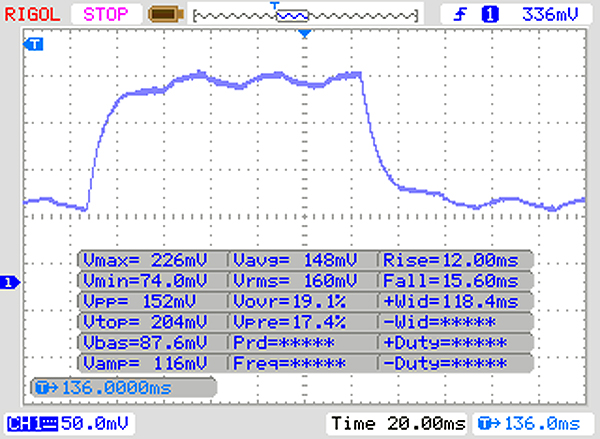 |
| ↘ 15 ms hösten | ||
| Skärmen visar relativt långsamma svarsfrekvenser i våra tester och kan vara för långsam för spelare. I jämförelse sträcker sig alla testade enheter från 0.165 (minst) till 636 (maximalt) ms. » 37 % av alla enheter är bättre. Det betyder att den uppmätta svarstiden är bättre än genomsnittet av alla testade enheter (31 ms). | ||
Skärmflimmer / PWM (Puls-Width Modulation)
| Skärmflimmer / PWM upptäcktes inte | ||
Som jämförelse: 52 % av alla testade enheter använder inte PWM för att dämpa skärmen. Om PWM upptäcktes mättes ett medelvärde av 7754 (minst: 5 - maximum: 343500) Hz. | ||
| Cinebench R15 | |
| CPU Single 64Bit | |
| Genomsnitt av klass Subnotebook (72.4 - 322, n=56, senaste 2 åren) | |
| Acer Spin 5 SP515-51GN-80A3 | |
| Schenker Slim 15 L17 | |
| Razer Blade Stealth QHD i7-8550U | |
| Asus ZenBook 13 UX331UN | |
| Genomsnitt Intel Core i7-8550U (108 - 172, n=76) | |
| HP Spectre 13-af033ng | |
| Dell XPS 13 9370 FHD i5 | |
| HP Spectre x360 13-ae048ng | |
| HP Spectre 13-v131ng | |
| Lenovo Yoga 720-13IKB | |
| CPU Multi 64Bit | |
| Genomsnitt av klass Subnotebook (327 - 3345, n=56, senaste 2 åren) | |
| Dell XPS 13 9370 FHD i5 | |
| Asus ZenBook 13 UX331UN | |
| Genomsnitt Intel Core i7-8550U (301 - 761, n=78) | |
| Acer Spin 5 SP515-51GN-80A3 | |
| Razer Blade Stealth QHD i7-8550U | |
| Schenker Slim 15 L17 | |
| HP Spectre 13-af033ng | |
| HP Spectre x360 13-ae048ng | |
| Lenovo Yoga 720-13IKB | |
| HP Spectre 13-v131ng | |
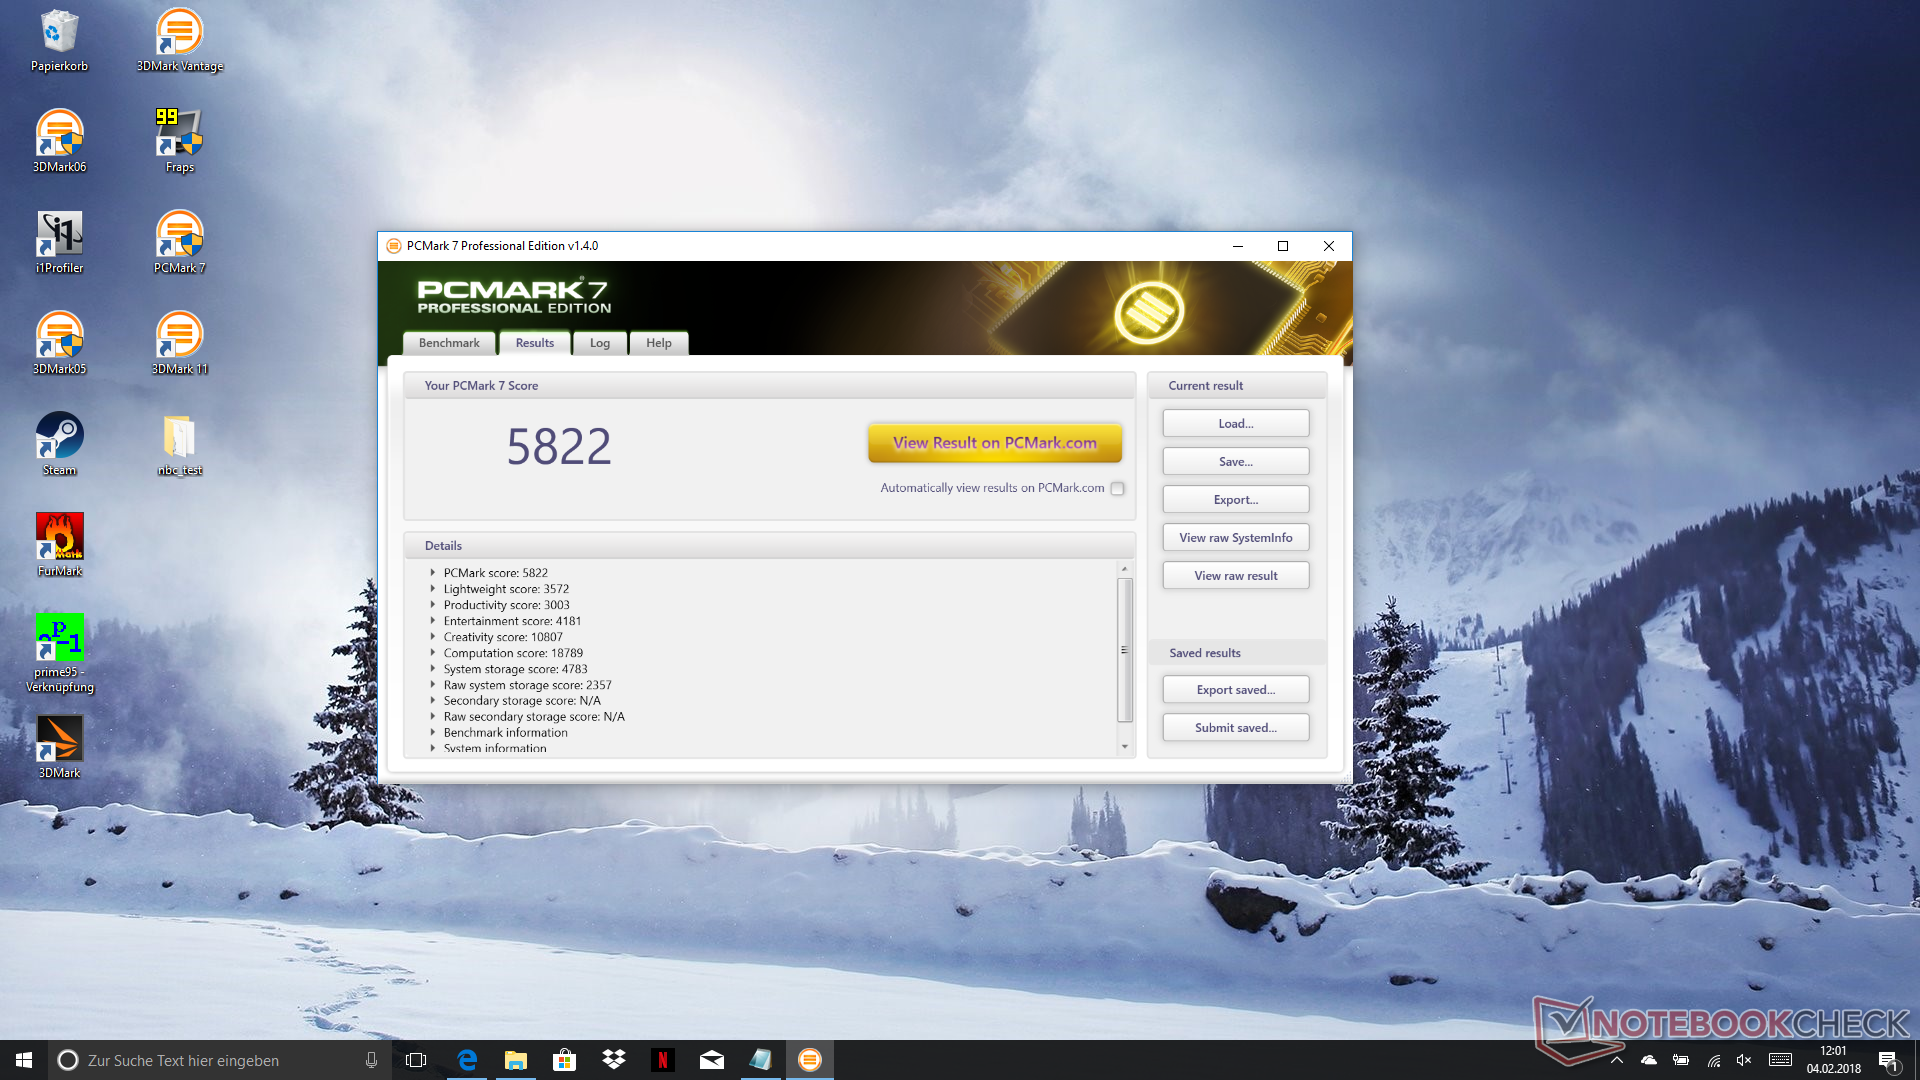
| PCMark 7 Score | 5822 poäng | |
| PCMark 8 Home Score Accelerated v2 | 3705 poäng | |
| PCMark 8 Creative Score Accelerated v2 | 5011 poäng | |
| PCMark 8 Work Score Accelerated v2 | 4562 poäng | |
Hjälp | ||
| HP Spectre 13-af033ng Samsung PM961 NVMe MZVLW512HMJP | HP Spectre 13-v131ng Samsung PM961 NVMe MZVLW512HMJP | HP Spectre x360 13-ae048ng Toshiba NVMe THNSN51T02DUK | Asus ZenBook 13 UX331UN SanDisk SD8SN8U512G1002 | Acer Spin 5 SP515-51GN-80A3 Intel SSD 600p SSDPEKKW256G7 | Lenovo Yoga 920-13IKB-80Y7 Samsung PM961 MZVLW256HEHP | Xiaomi Mi Notebook Pro i7 Samsung PM961 MZVLW256HEHP | |
|---|---|---|---|---|---|---|---|
| CrystalDiskMark 3.0 | 16% | -3% | -50% | -4% | 43% | 28% | |
| Read Seq (MB/s) | 907 | 1090 20% | 919 1% | 430.6 -53% | 1187 31% | 2070 128% | 1444 59% |
| Write Seq (MB/s) | 878 | 1088 24% | 776 -12% | 424.1 -52% | 599 -32% | 1125 28% | 1173 34% |
| Read 512 (MB/s) | 515 | 753 46% | 620 20% | 275 -47% | 935 82% | 1252 143% | 816 58% |
| Write 512 (MB/s) | 546 | 911 67% | 575 5% | 369.8 -32% | 609 12% | 832 52% | 851 56% |
| Read 4k (MB/s) | 60 | 57.5 -4% | 45.99 -23% | 28.04 -53% | 35.61 -41% | 56.2 -6% | 61.5 2% |
| Write 4k (MB/s) | 144 | 140.2 -3% | 138.1 -4% | 53.5 -63% | 134.4 -7% | 142.4 -1% | 171.9 19% |
| Read 4k QD32 (MB/s) | 543 | 497.1 -8% | 542 0% | 322.9 -41% | 289.3 -47% | 432.9 -20% | 568 5% |
| Write 4k QD32 (MB/s) | 476 | 416 -13% | 437.3 -8% | 211.9 -55% | 331.1 -30% | 573 20% | 436.4 -8% |

| 3DMark - 1280x720 Cloud Gate Standard Graphics | |
| Genomsnitt av klass Subnotebook (5577 - 61591, n=28, senaste 2 åren) | |
| Asus ZenBook 13 UX331UN | |
| Schenker Slim 15 L17 | |
| Lenovo Yoga 920-13IKB-80Y7 | |
| Dell XPS 13 i7-8550U | |
| Razer Blade Stealth QHD i7-8550U | |
| Genomsnitt Intel UHD Graphics 620 (6205 - 16400, n=225) | |
| HP Spectre 13-af033ng | |
| HP Spectre x360 13-ae048ng | |
| HP Spectre 13-v131ng | |
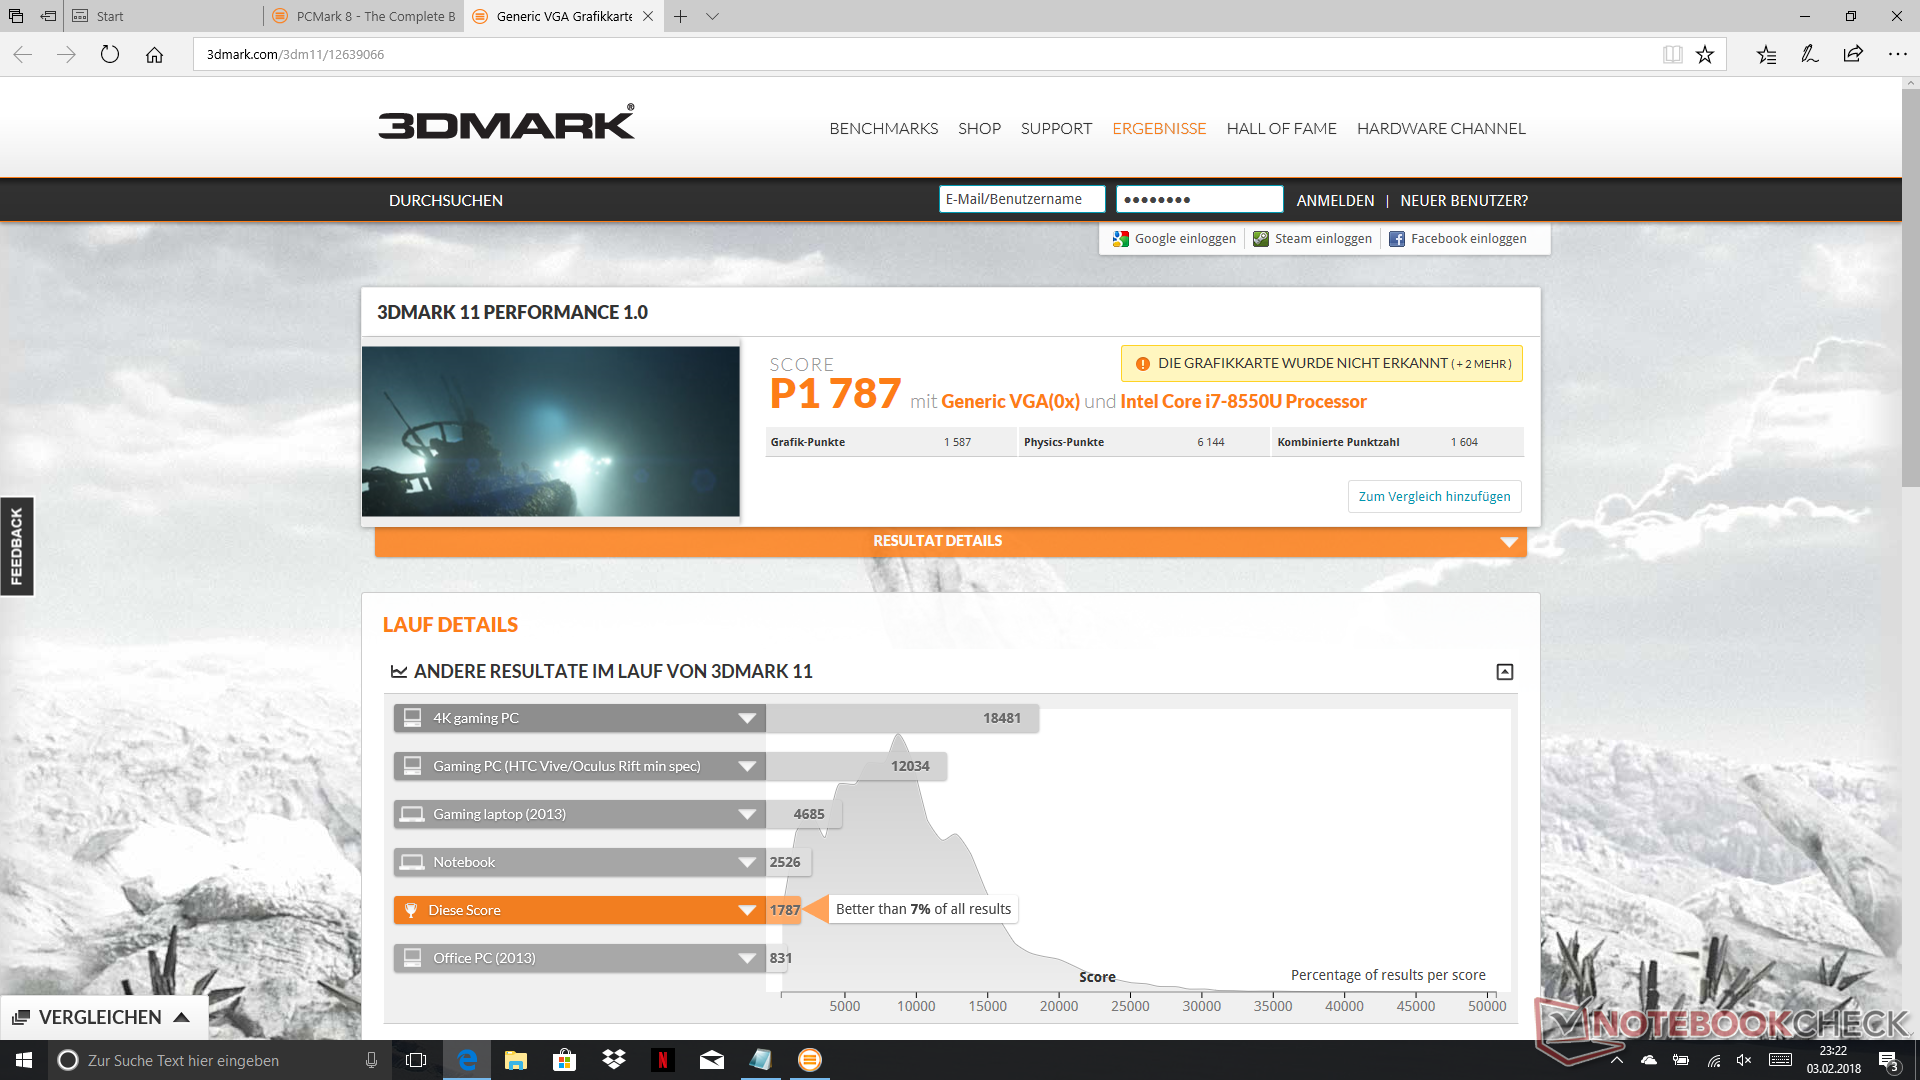
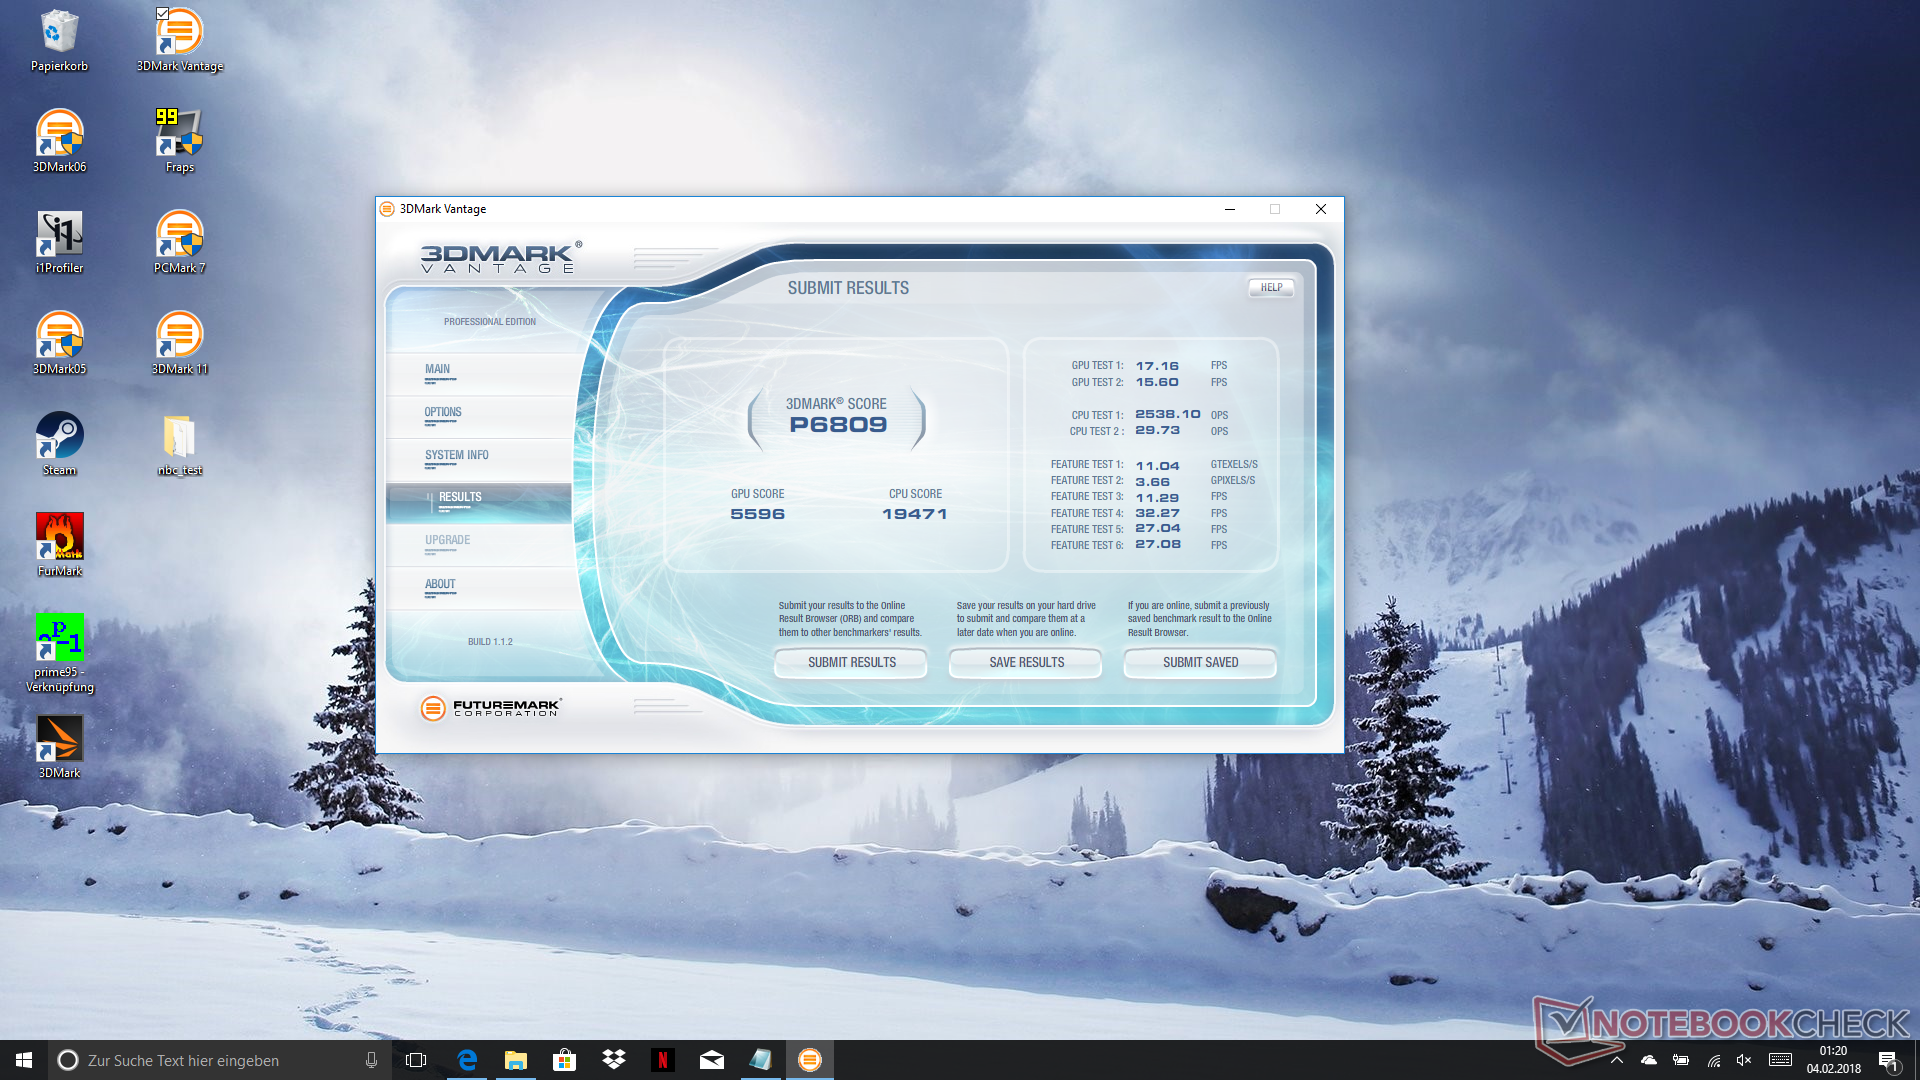
| 3DMark 11 Performance | 1787 poäng | |
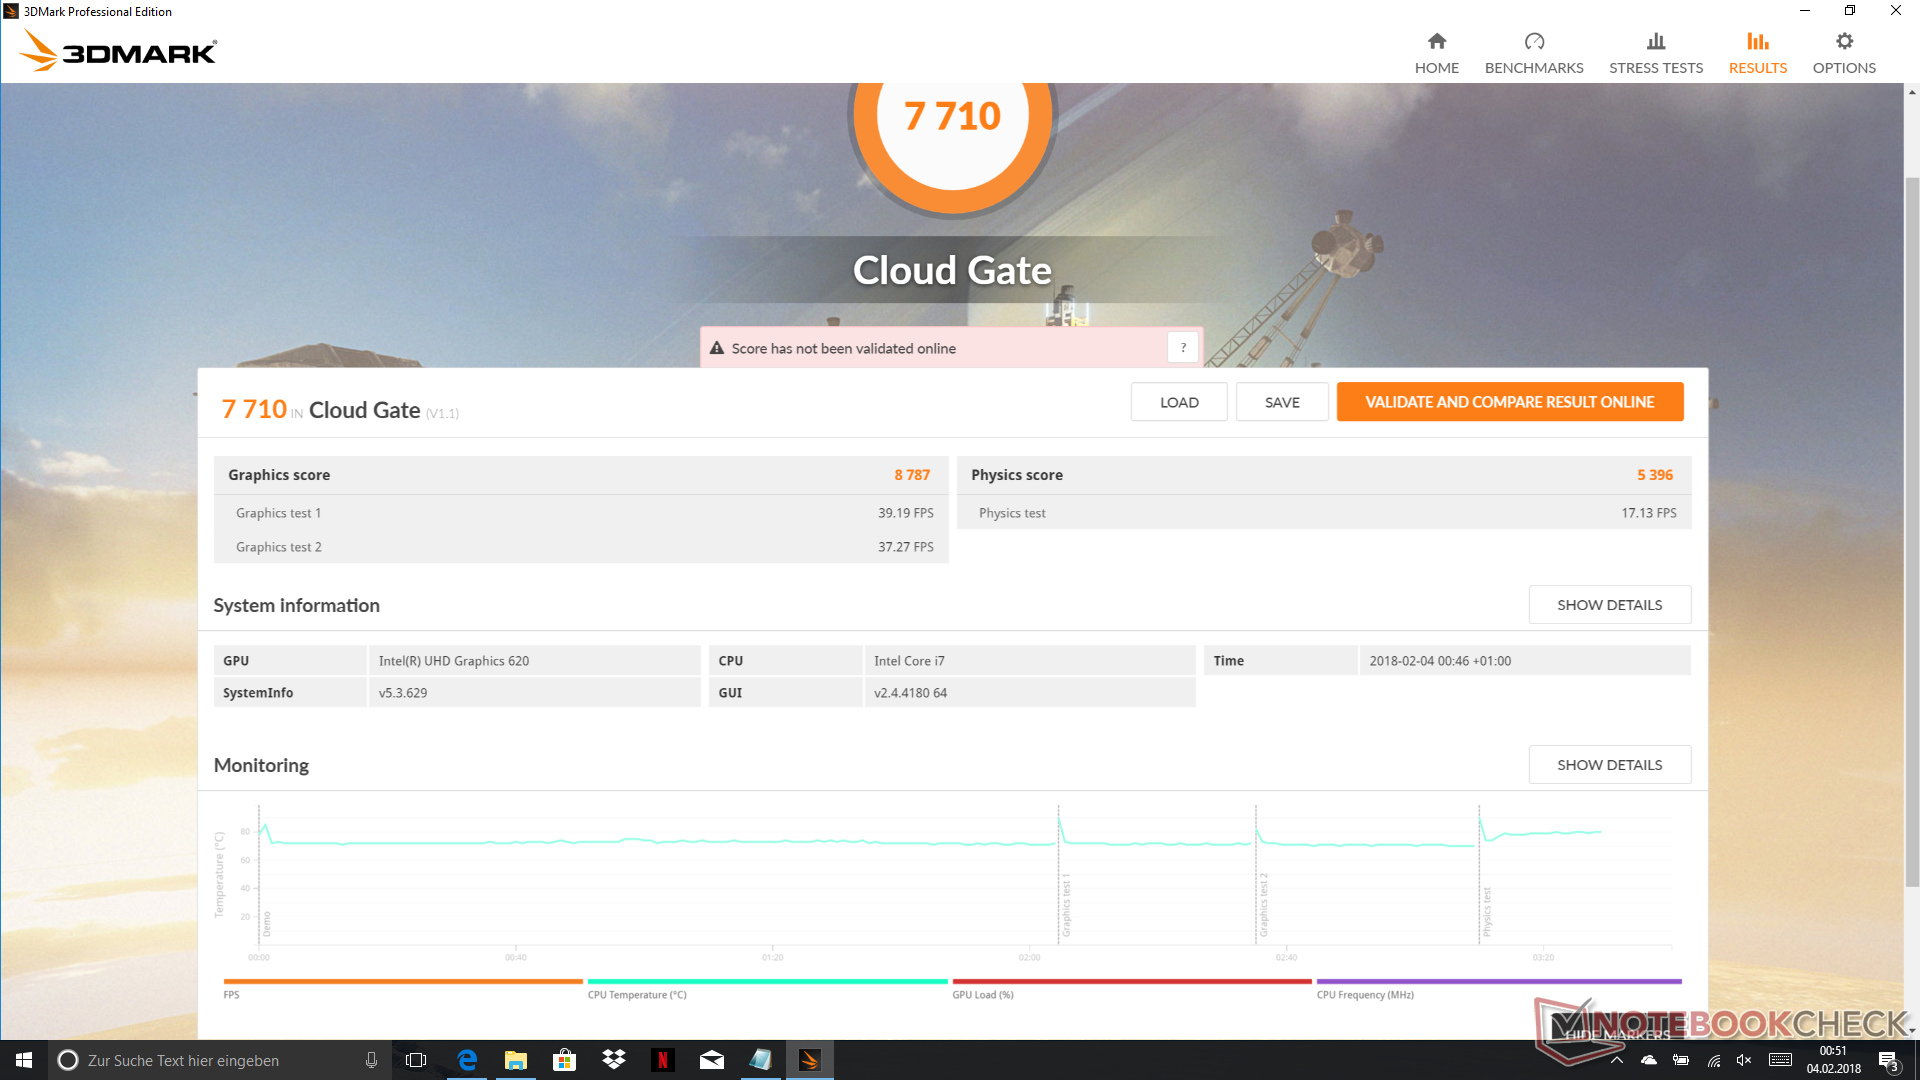
| 3DMark Cloud Gate Standard Score | 7710 poäng | |
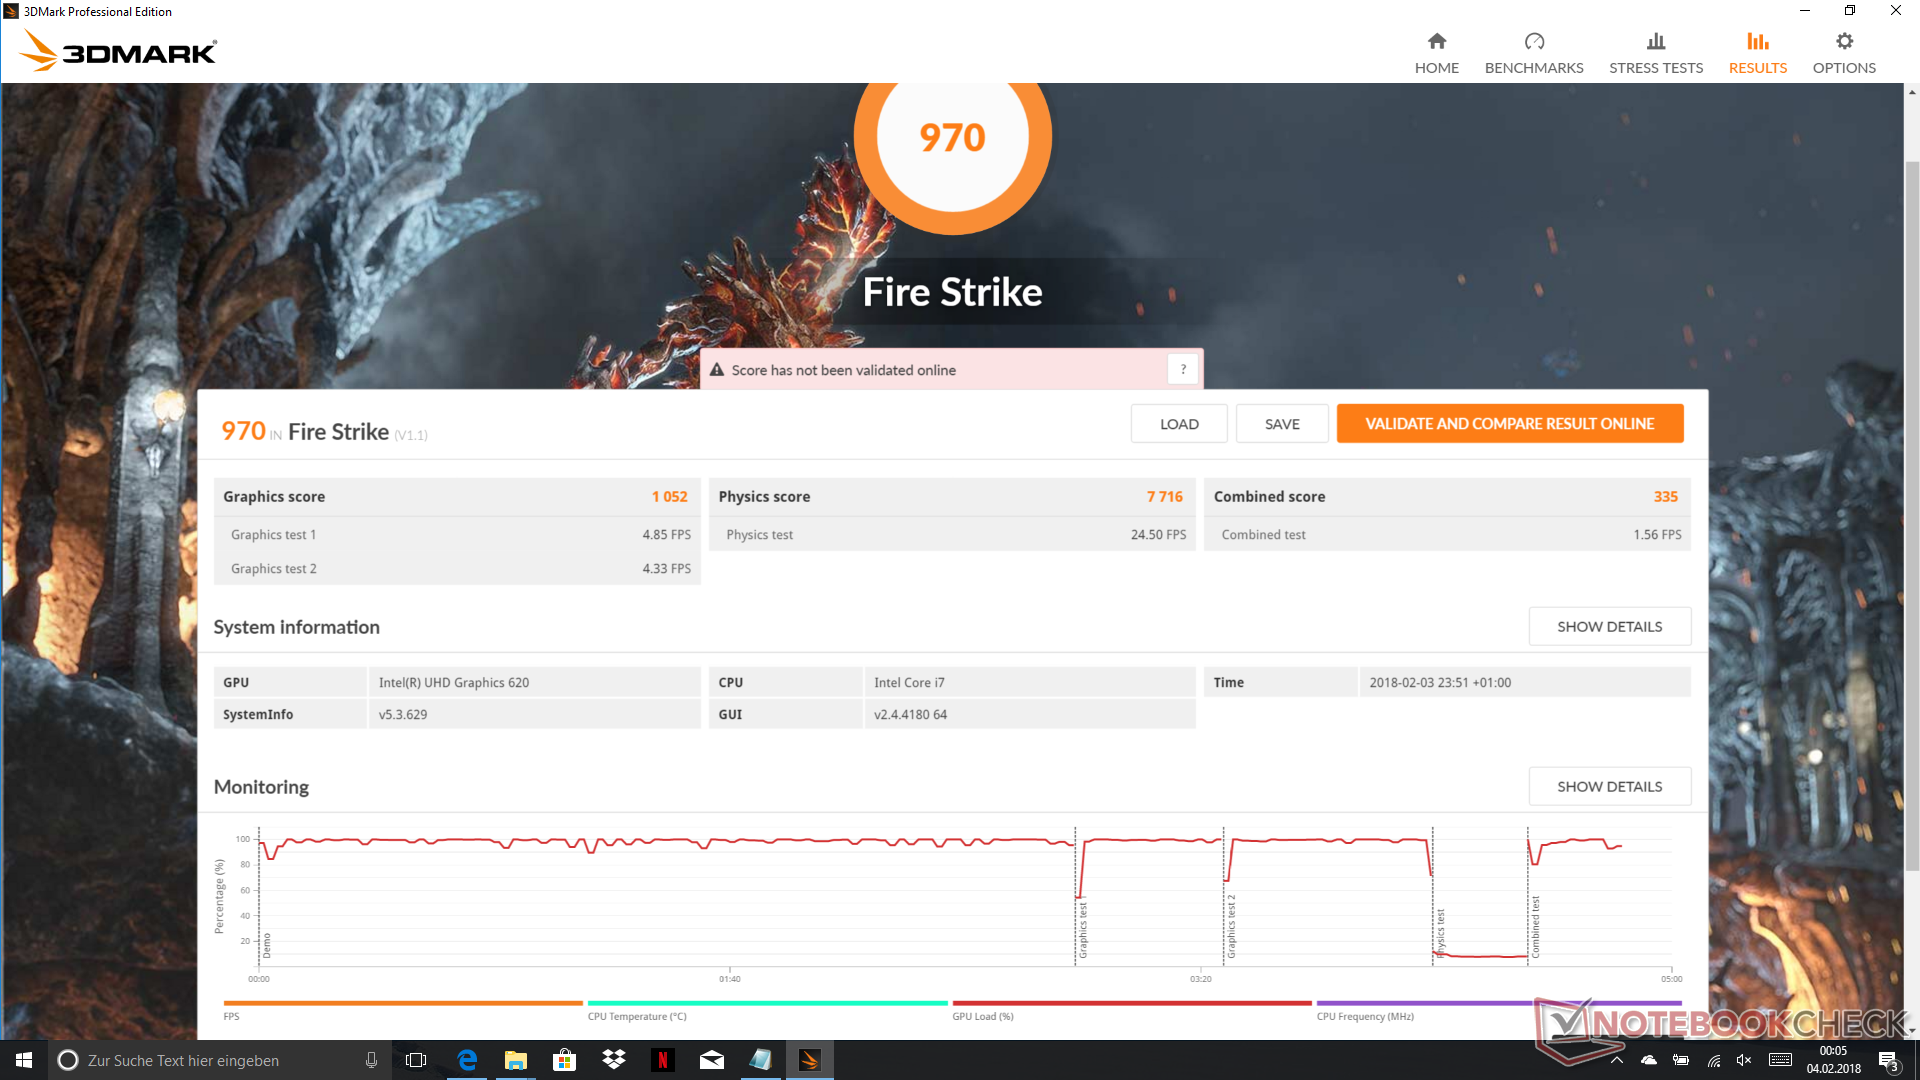
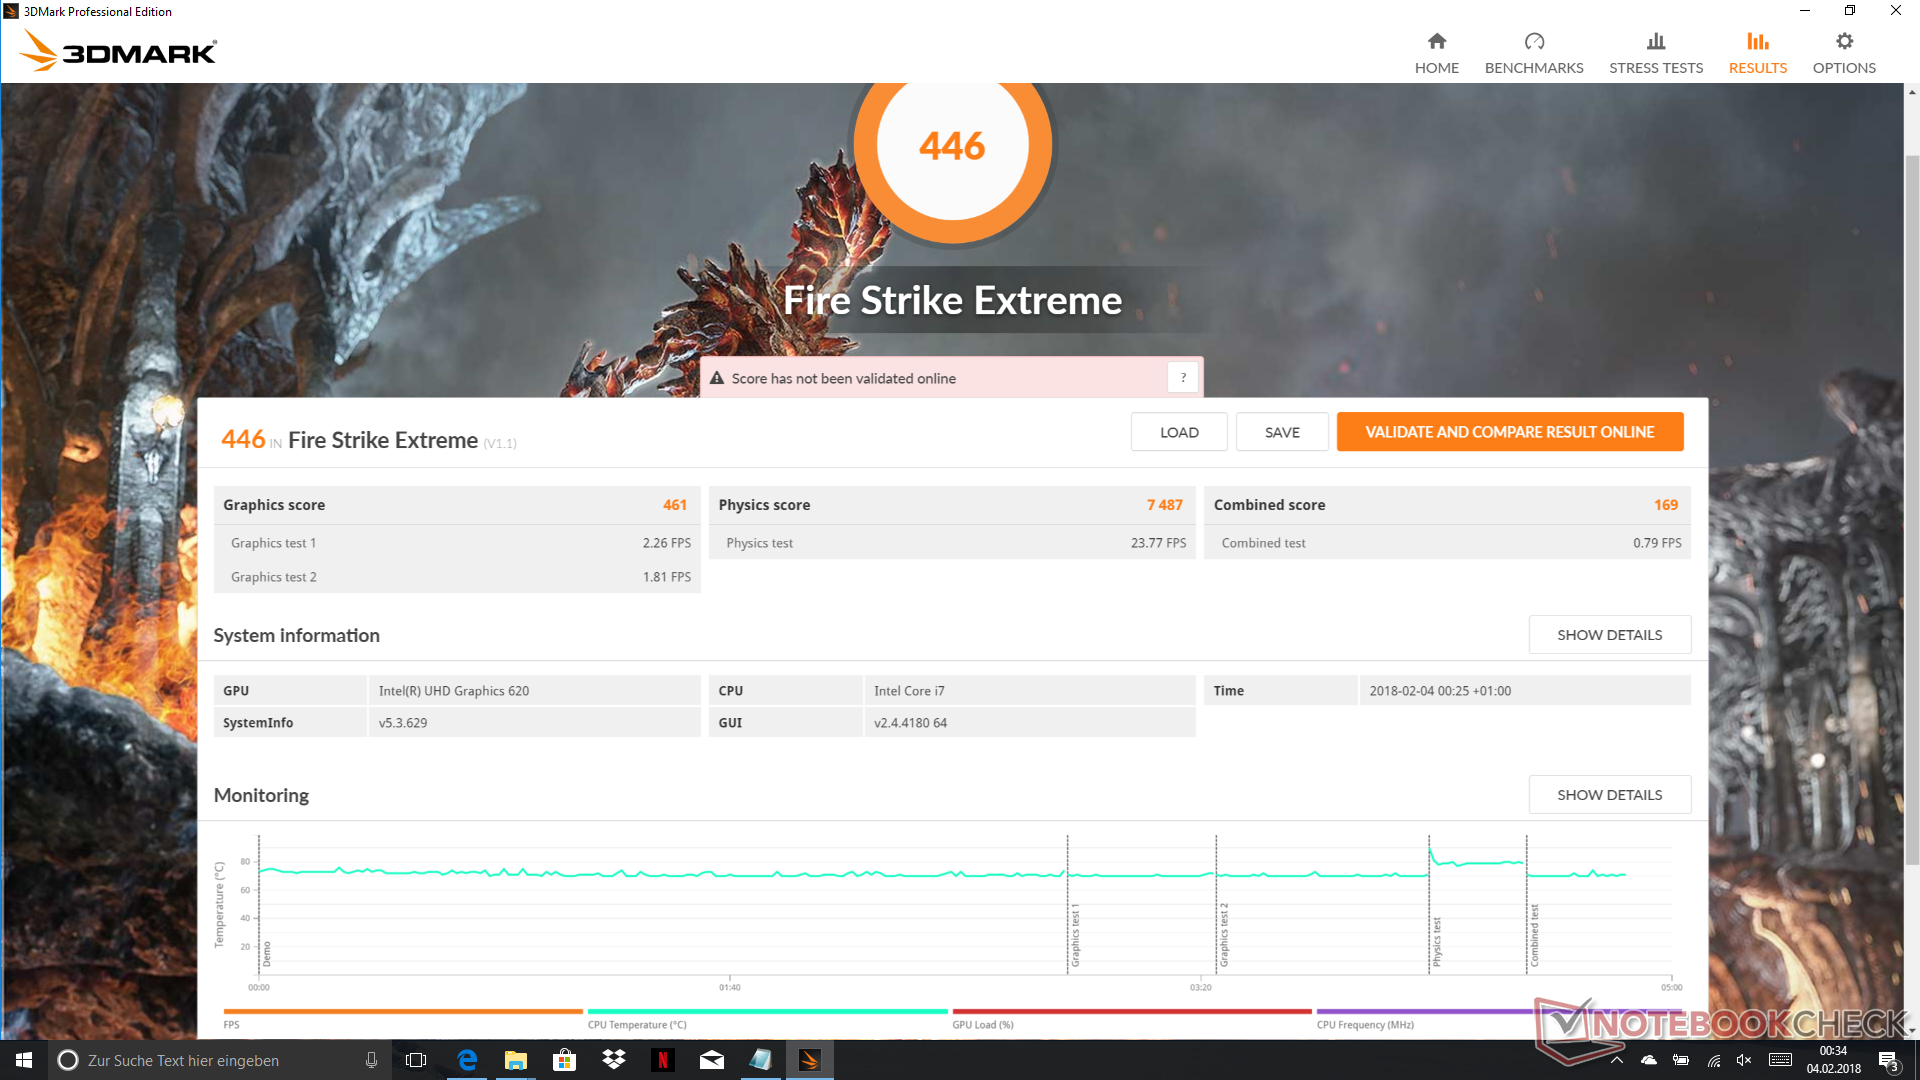
| 3DMark Fire Strike Score | 970 poäng | |
Hjälp | ||
| F1 2017 - 1280x720 Ultra Low Preset | |
| Xiaomi Mi Notebook Pro i7 | |
| Razer Blade Stealth QHD i7-8550U | |
| HP Spectre x360 13-ae048ng | |
| Genomsnitt Intel UHD Graphics 620 (30 - 32, n=4) | |
| HP Spectre 13-af033ng | |
| Final Fantasy XV Benchmark - 1280x720 Lite Quality | |
| Xiaomi Mi Notebook Pro i7 | |
| Asus ZenBook 13 UX331UN | |
| Genomsnitt Intel UHD Graphics 620 (5.61 - 14.7, n=14) | |
| HP Spectre 13-af033ng | |
| låg | med. | hög | ultra | |
|---|---|---|---|---|
| Rise of the Tomb Raider (2016) | 18.6 | 12.3 | 5.5 | |
| F1 2017 (2017) | 30 | 13 | 9 | |
| Final Fantasy XV Benchmark (2018) | 9.3 | 4.3 |
Ljudnivå
| Låg belastning |
| 30.13 / 30.13 / 30.13 dB(A) |
| Hög belastning |
| 31.5 / 33.5 dB(A) |
 | ||
30 dB tyst 40 dB(A) hörbar 50 dB(A) högt ljud |
||
min: | ||
| HP Spectre 13-af033ng i5-8550U, UHD Graphics 620 | HP Spectre 13-v131ng i7-7500U, HD Graphics 620 | HP Spectre x360 13-ae048ng i5-8550U, UHD Graphics 620 | Dell XPS 13 i7-8550U i5-8550U, UHD Graphics 620 | Acer Spin 5 SP515-51GN-80A3 i5-8550U, GeForce GTX 1050 Mobile | Lenovo Yoga 720-13IKB i5-8550U, UHD Graphics 620 | |
|---|---|---|---|---|---|---|
| Noise | -8% | -1% | 5% | -12% | -2% | |
| av / miljö * (dB) | 30.13 | 30.4 -1% | 30.13 -0% | 27.9 7% | 30.2 -0% | 30.5 -1% |
| Idle Minimum * (dB) | 30.13 | 30.4 -1% | 30.13 -0% | 27.9 7% | 30.2 -0% | 30.5 -1% |
| Idle Average * (dB) | 30.13 | 30.4 -1% | 30 -0% | 27.9 7% | 30.2 -0% | 30.5 -1% |
| Idle Maximum * (dB) | 30.13 | 30.4 -1% | 30.13 -0% | 27.9 7% | 30.9 -3% | 30.5 -1% |
| Load Average * (dB) | 31.5 | 40 -27% | 33.4 -6% | 30.8 2% | 42.4 -35% | 32.8 -4% |
| Load Maximum * (dB) | 33.5 | 40 -19% | 33 1% | 33.1 1% | 44.8 -34% | 34.7 -4% |
* ... mindre är bättre
(±) Den maximala temperaturen på ovansidan är 41.2 °C / 106 F, jämfört med genomsnittet av 35.9 °C / 97 F , allt från 21.4 till 59 °C för klassen Subnotebook.
(±) Botten värms upp till maximalt 44.2 °C / 112 F, jämfört med genomsnittet av 39.2 °C / 103 F
(+) Vid tomgångsbruk är medeltemperaturen för ovansidan 27.8 °C / 82 F, jämfört med enhetsgenomsnittet på 30.8 °C / ### class_avg_f### F.
(+) Handledsstöden och pekplattan är kallare än hudtemperaturen med maximalt 27.2 °C / 81 F och är därför svala att ta på.
(±) Medeltemperaturen för handledsstödsområdet på liknande enheter var 28.2 °C / 82.8 F (+1 °C / 1.8 F).
| HP Spectre 13-af033ng i5-8550U, UHD Graphics 620 | HP Spectre 13-v131ng i7-7500U, HD Graphics 620 | HP Spectre x360 13-ae048ng i5-8550U, UHD Graphics 620 | Dell XPS 13 9370 FHD i5 i5-8250U, UHD Graphics 620 | Acer Spin 5 SP515-51GN-80A3 i5-8550U, GeForce GTX 1050 Mobile | Lenovo Yoga 720-13IKB i5-8550U, UHD Graphics 620 | |
|---|---|---|---|---|---|---|
| Heat | 2% | 1% | 11% | 3% | 6% | |
| Maximum Upper Side * (°C) | 41.2 | 54.2 -32% | 46.5 -13% | 44.2 -7% | 50.9 -24% | 39.2 5% |
| Maximum Bottom * (°C) | 44.2 | 37.7 15% | 46.5 -5% | 45.5 -3% | 44.2 -0% | 40.6 8% |
| Idle Upper Side * (°C) | 32.1 | 29 10% | 29.6 8% | 24.1 25% | 26.3 18% | 30.5 5% |
| Idle Bottom * (°C) | 32.8 | 27.6 16% | 28.4 13% | 23.2 29% | 27.1 17% | 31.2 5% |
* ... mindre är bättre
HP Spectre 13-af033ng ljudanalys
(-) | inte särskilt höga högtalare (64.8 dB)
Bas 100 - 315 Hz
(±) | reducerad bas - i genomsnitt 13.2% lägre än medianen
(±) | linjäriteten för basen är genomsnittlig (7.4% delta till föregående frekvens)
Mellan 400 - 2000 Hz
(+) | balanserad mellan - endast 3.4% från medianen
(+) | mids är linjära (4.7% delta till föregående frekvens)
Högsta 2 - 16 kHz
(+) | balanserade toppar - endast 3.2% från medianen
(+) | toppar är linjära (3.7% delta till föregående frekvens)
Totalt 100 - 16 000 Hz
(±) | linjäriteten för det totala ljudet är genomsnittlig (17.2% skillnad mot median)
Jämfört med samma klass
» 44% av alla testade enheter i den här klassen var bättre, 9% liknande, 47% sämre
» Den bästa hade ett delta på 5%, genomsnittet var 18%, sämst var 53%
Jämfört med alla testade enheter
» 32% av alla testade enheter var bättre, 8% liknande, 60% sämre
» Den bästa hade ett delta på 4%, genomsnittet var 23%, sämst var 134%
Dell XPS 13 i7-8550U ljudanalys
(-) | inte särskilt höga högtalare (66.8 dB)
Bas 100 - 315 Hz
(+) | bra bas - bara 4.5% från medianen
(±) | linjäriteten för basen är genomsnittlig (8.2% delta till föregående frekvens)
Mellan 400 - 2000 Hz
(±) | högre mellan - i genomsnitt 5% högre än median
(+) | mids är linjära (5.8% delta till föregående frekvens)
Högsta 2 - 16 kHz
(+) | balanserade toppar - endast 3% från medianen
(±) | linjäriteten för toppar är genomsnittlig (14.5% delta till föregående frekvens)
Totalt 100 - 16 000 Hz
(±) | linjäriteten för det totala ljudet är genomsnittlig (17.2% skillnad mot median)
Jämfört med samma klass
» 44% av alla testade enheter i den här klassen var bättre, 9% liknande, 47% sämre
» Den bästa hade ett delta på 5%, genomsnittet var 18%, sämst var 53%
Jämfört med alla testade enheter
» 32% av alla testade enheter var bättre, 8% liknande, 60% sämre
» Den bästa hade ett delta på 4%, genomsnittet var 23%, sämst var 134%
HP Spectre 13-v131ng ljudanalys
(-) | inte särskilt höga högtalare (68 dB)
Bas 100 - 315 Hz
(-) | nästan ingen bas - i genomsnitt 23.7% lägre än medianen
(±) | linjäriteten för basen är genomsnittlig (9.6% delta till föregående frekvens)
Mellan 400 - 2000 Hz
(±) | reducerade mids - i genomsnitt 5.1% lägre än median
(±) | linjäriteten för mids är genomsnittlig (7.6% delta till föregående frekvens)
Högsta 2 - 16 kHz
(±) | högre toppar - i genomsnitt 7.7% högre än medianen
(+) | toppar är linjära (3.1% delta till föregående frekvens)
Totalt 100 - 16 000 Hz
(±) | linjäriteten för det totala ljudet är genomsnittlig (28.6% skillnad mot median)
Jämfört med samma klass
» 90% av alla testade enheter i den här klassen var bättre, 2% liknande, 7% sämre
» Den bästa hade ett delta på 5%, genomsnittet var 18%, sämst var 53%
Jämfört med alla testade enheter
» 86% av alla testade enheter var bättre, 3% liknande, 11% sämre
» Den bästa hade ett delta på 4%, genomsnittet var 23%, sämst var 134%
| Av/Standby | |
| Låg belastning | |
| Hög belastning |
|
Förklaring:
min: | |
| HP Spectre 13-af033ng i5-8550U, UHD Graphics 620, Samsung PM961 NVMe MZVLW512HMJP, IPS, 1920x1080, 13.3" | HP Spectre 13-v131ng i7-7500U, HD Graphics 620, Samsung PM961 NVMe MZVLW512HMJP, IPS UWVA, 1920x1080, 13.3" | HP Spectre x360 13-ae048ng i5-8550U, UHD Graphics 620, Toshiba NVMe THNSN51T02DUK, IPS, 1920x1080, 13.3" | Asus ZenBook 13 UX331UN i5-8550U, GeForce MX150, SanDisk SD8SN8U512G1002, IPS LED, 1920x1080, 13.3" | Lenovo Yoga 720-13IKB i5-8550U, UHD Graphics 620, Toshiba XG4 NVMe (THNSN5512GPUK), IPS, 1920x1080, 13.3" | Dell XPS 13 i7-8550U i5-8550U, UHD Graphics 620, Toshiba XG5 KXG50ZNV256G, IGZO IPS, 3200x1800, 13.3" | Razer Blade Stealth QHD i7-8550U i5-8550U, UHD Graphics 620, Samsung PM961 NVMe MZVLW512HMJP, , 3200x1800, 13.3" | |
|---|---|---|---|---|---|---|---|
| Power Consumption | -6% | 0% | -6% | -17% | -10% | -22% | |
| Idle Minimum * (Watt) | 2.8 | 3.6 -29% | 3.2 -14% | 2.7 4% | 3.8 -36% | 4.1 -46% | 5.6 -100% |
| Idle Average * (Watt) | 6.2 | 6.4 -3% | 6 3% | 5.3 15% | 8.4 -35% | 5.8 6% | 7.5 -21% |
| Idle Maximum * (Watt) | 9.4 | 9.2 2% | 9.2 2% | 6.2 34% | 9.7 -3% | 6 36% | 8.4 11% |
| Load Average * (Watt) | 32.2 | 34 -6% | 29.5 8% | 37.6 -17% | 36 -12% | 42.5 -32% | 33.7 -5% |
| Load Maximum * (Watt) | 36.6 | 34.4 6% | 35.6 3% | 60.1 -64% | 36 2% | 41.4 -13% | 34.6 5% |
| Witcher 3 ultra * (Watt) | 31 |
* ... mindre är bättre
| HP Spectre 13-af033ng i5-8550U, UHD Graphics 620, 43 Wh | HP Spectre 13-v131ng i7-7500U, HD Graphics 620, 38 Wh | HP Spectre x360 13-ae048ng i5-8550U, UHD Graphics 620, 60 Wh | Asus ZenBook 13 UX331UN i5-8550U, GeForce MX150, 50 Wh | Dell XPS 13 9370 FHD i5 i5-8250U, UHD Graphics 620, 52 Wh | Acer Spin 5 SP515-51GN-80A3 i5-8550U, GeForce GTX 1050 Mobile, 48 Wh | Lenovo Yoga 920-13IKB-80Y7 i5-8550U, UHD Graphics 620, 70 Wh | |
|---|---|---|---|---|---|---|---|
| Batteridrifttid | -19% | 60% | 16% | 43% | -19% | 64% | |
| H.264 (h) | 10.8 | 6.1 -44% | 17.8 65% | 9.6 -11% | 13.9 29% | 5.5 -49% | |
| WiFi v1.3 (h) | 5.9 | 6.6 12% | 8.8 49% | 8.4 42% | 10.7 81% | 6.2 5% | 11.4 93% |
| Load (h) | 1.7 | 1.3 -24% | 2.8 65% | 2 18% | 2 18% | 1.5 -12% | 2.3 35% |
| Reader / Idle (h) | 12 | 22 | 23.6 | 12.7 | 27.6 |
För
Emot
Läs den fullständiga versionen av den här recensionen på engelska här.
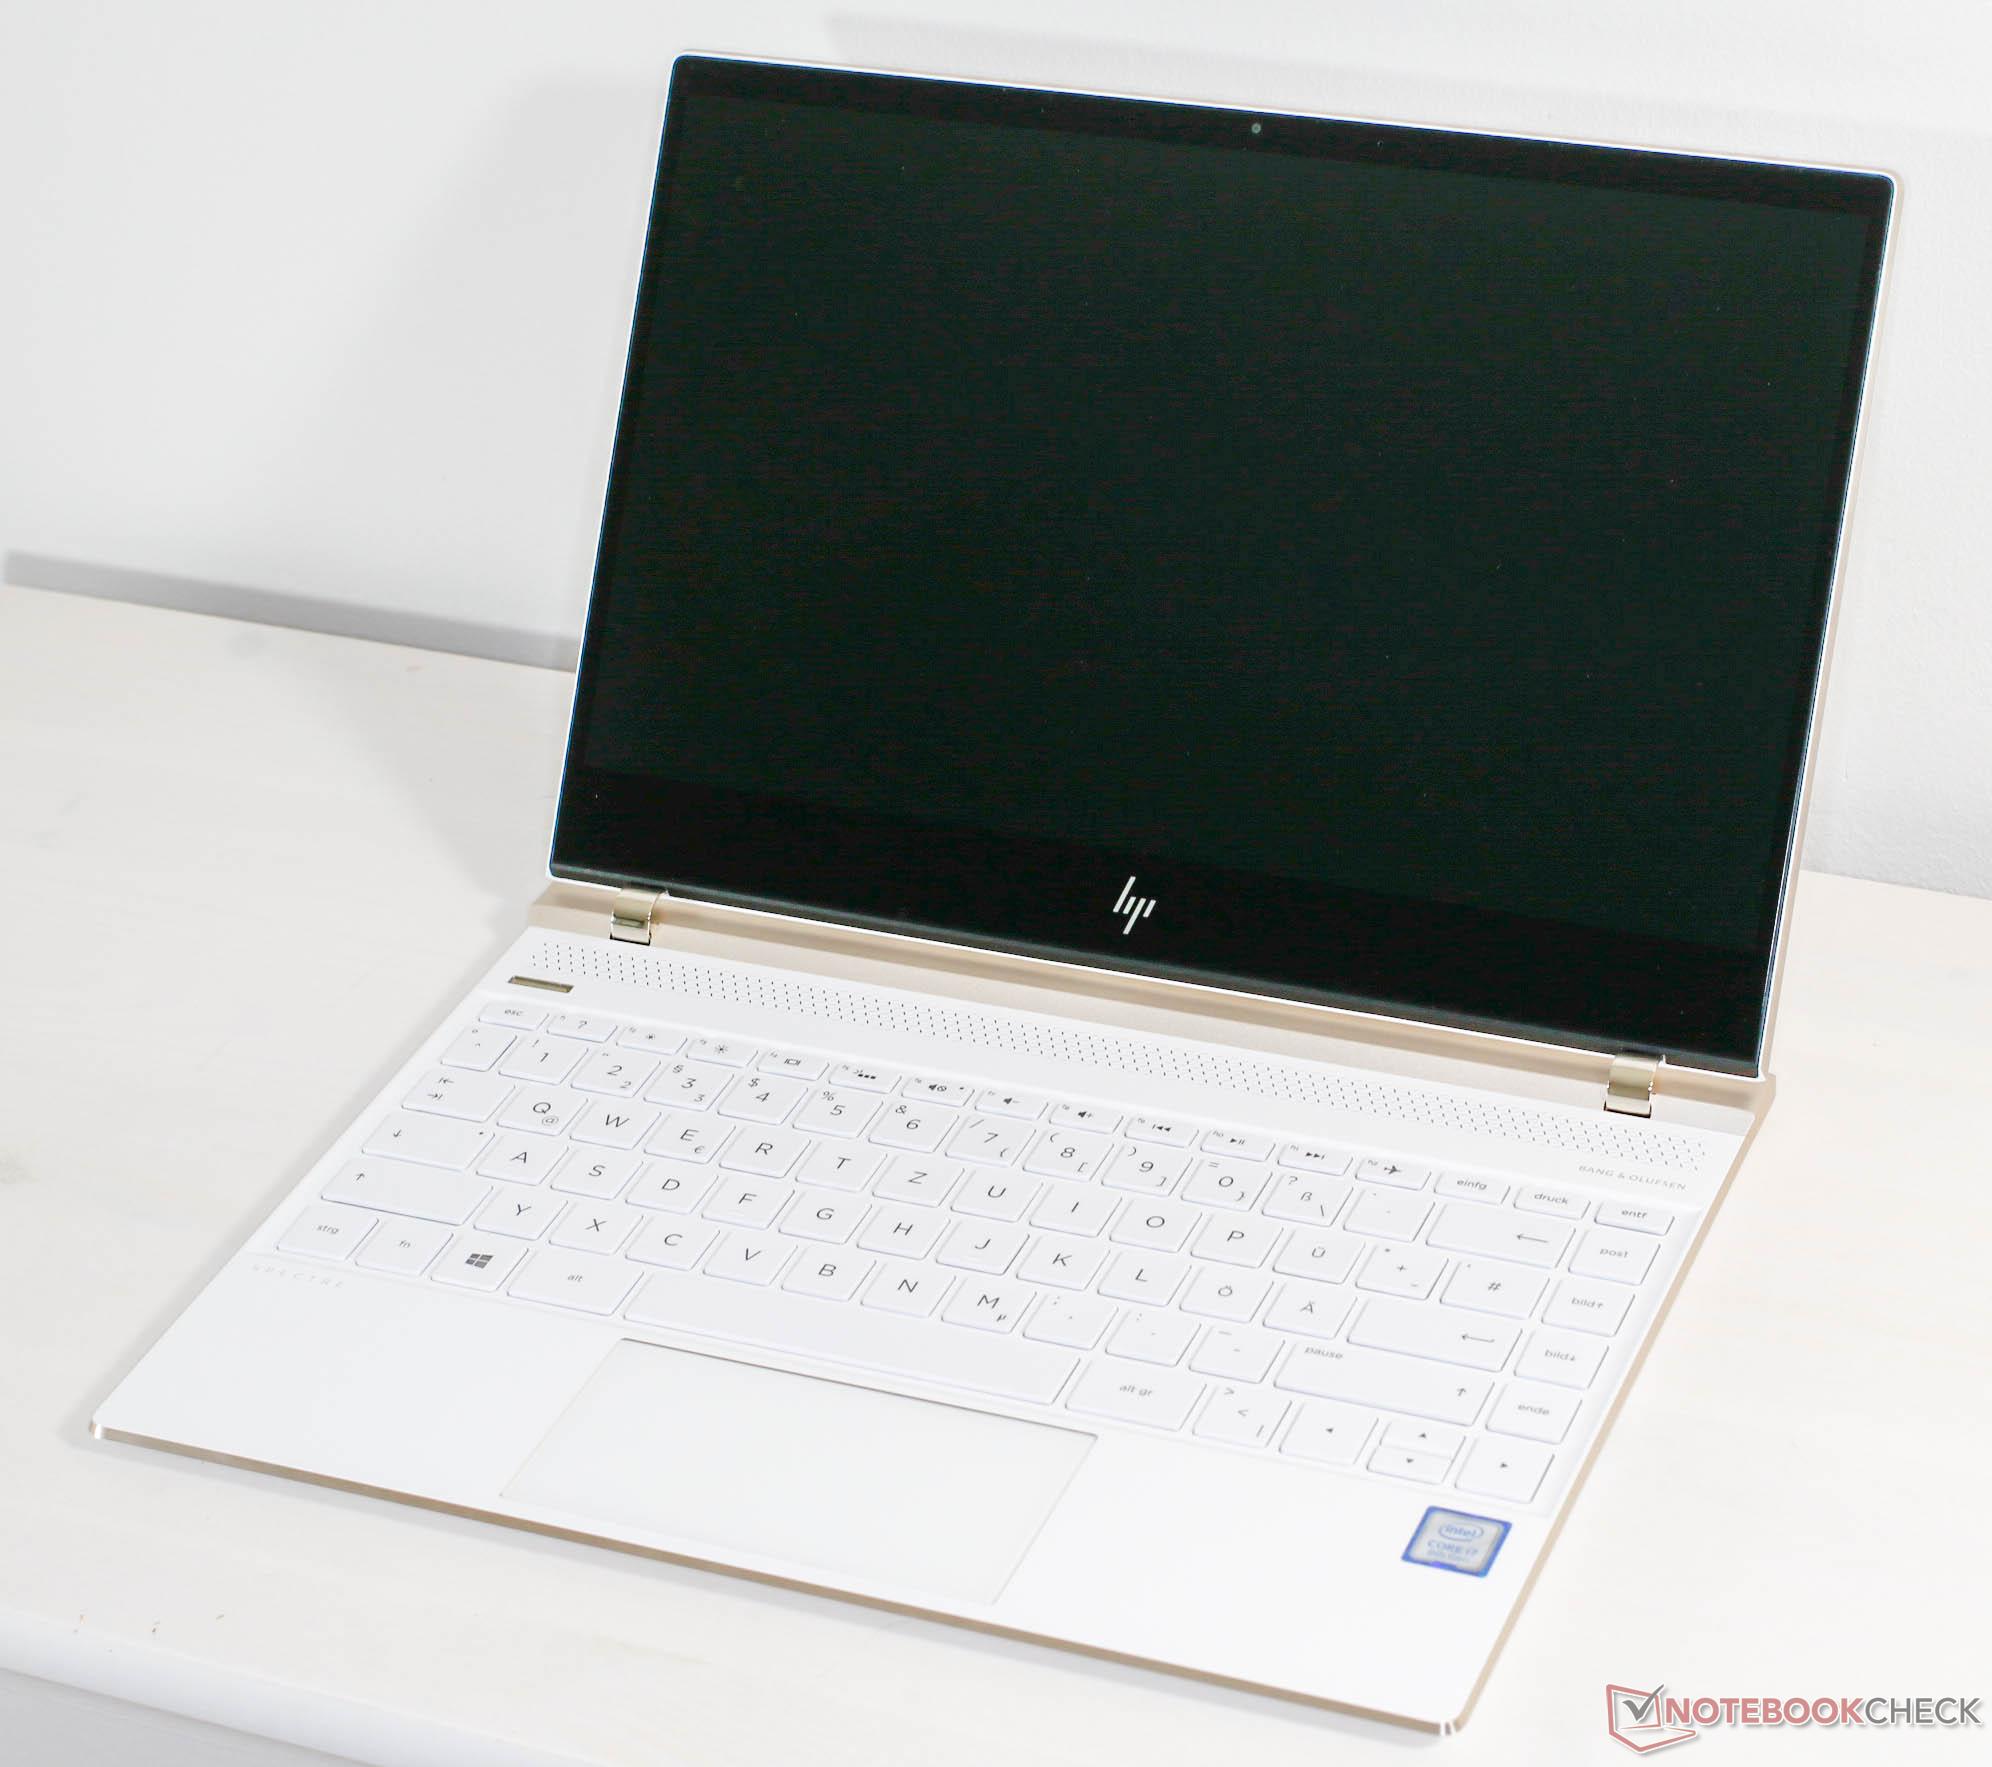
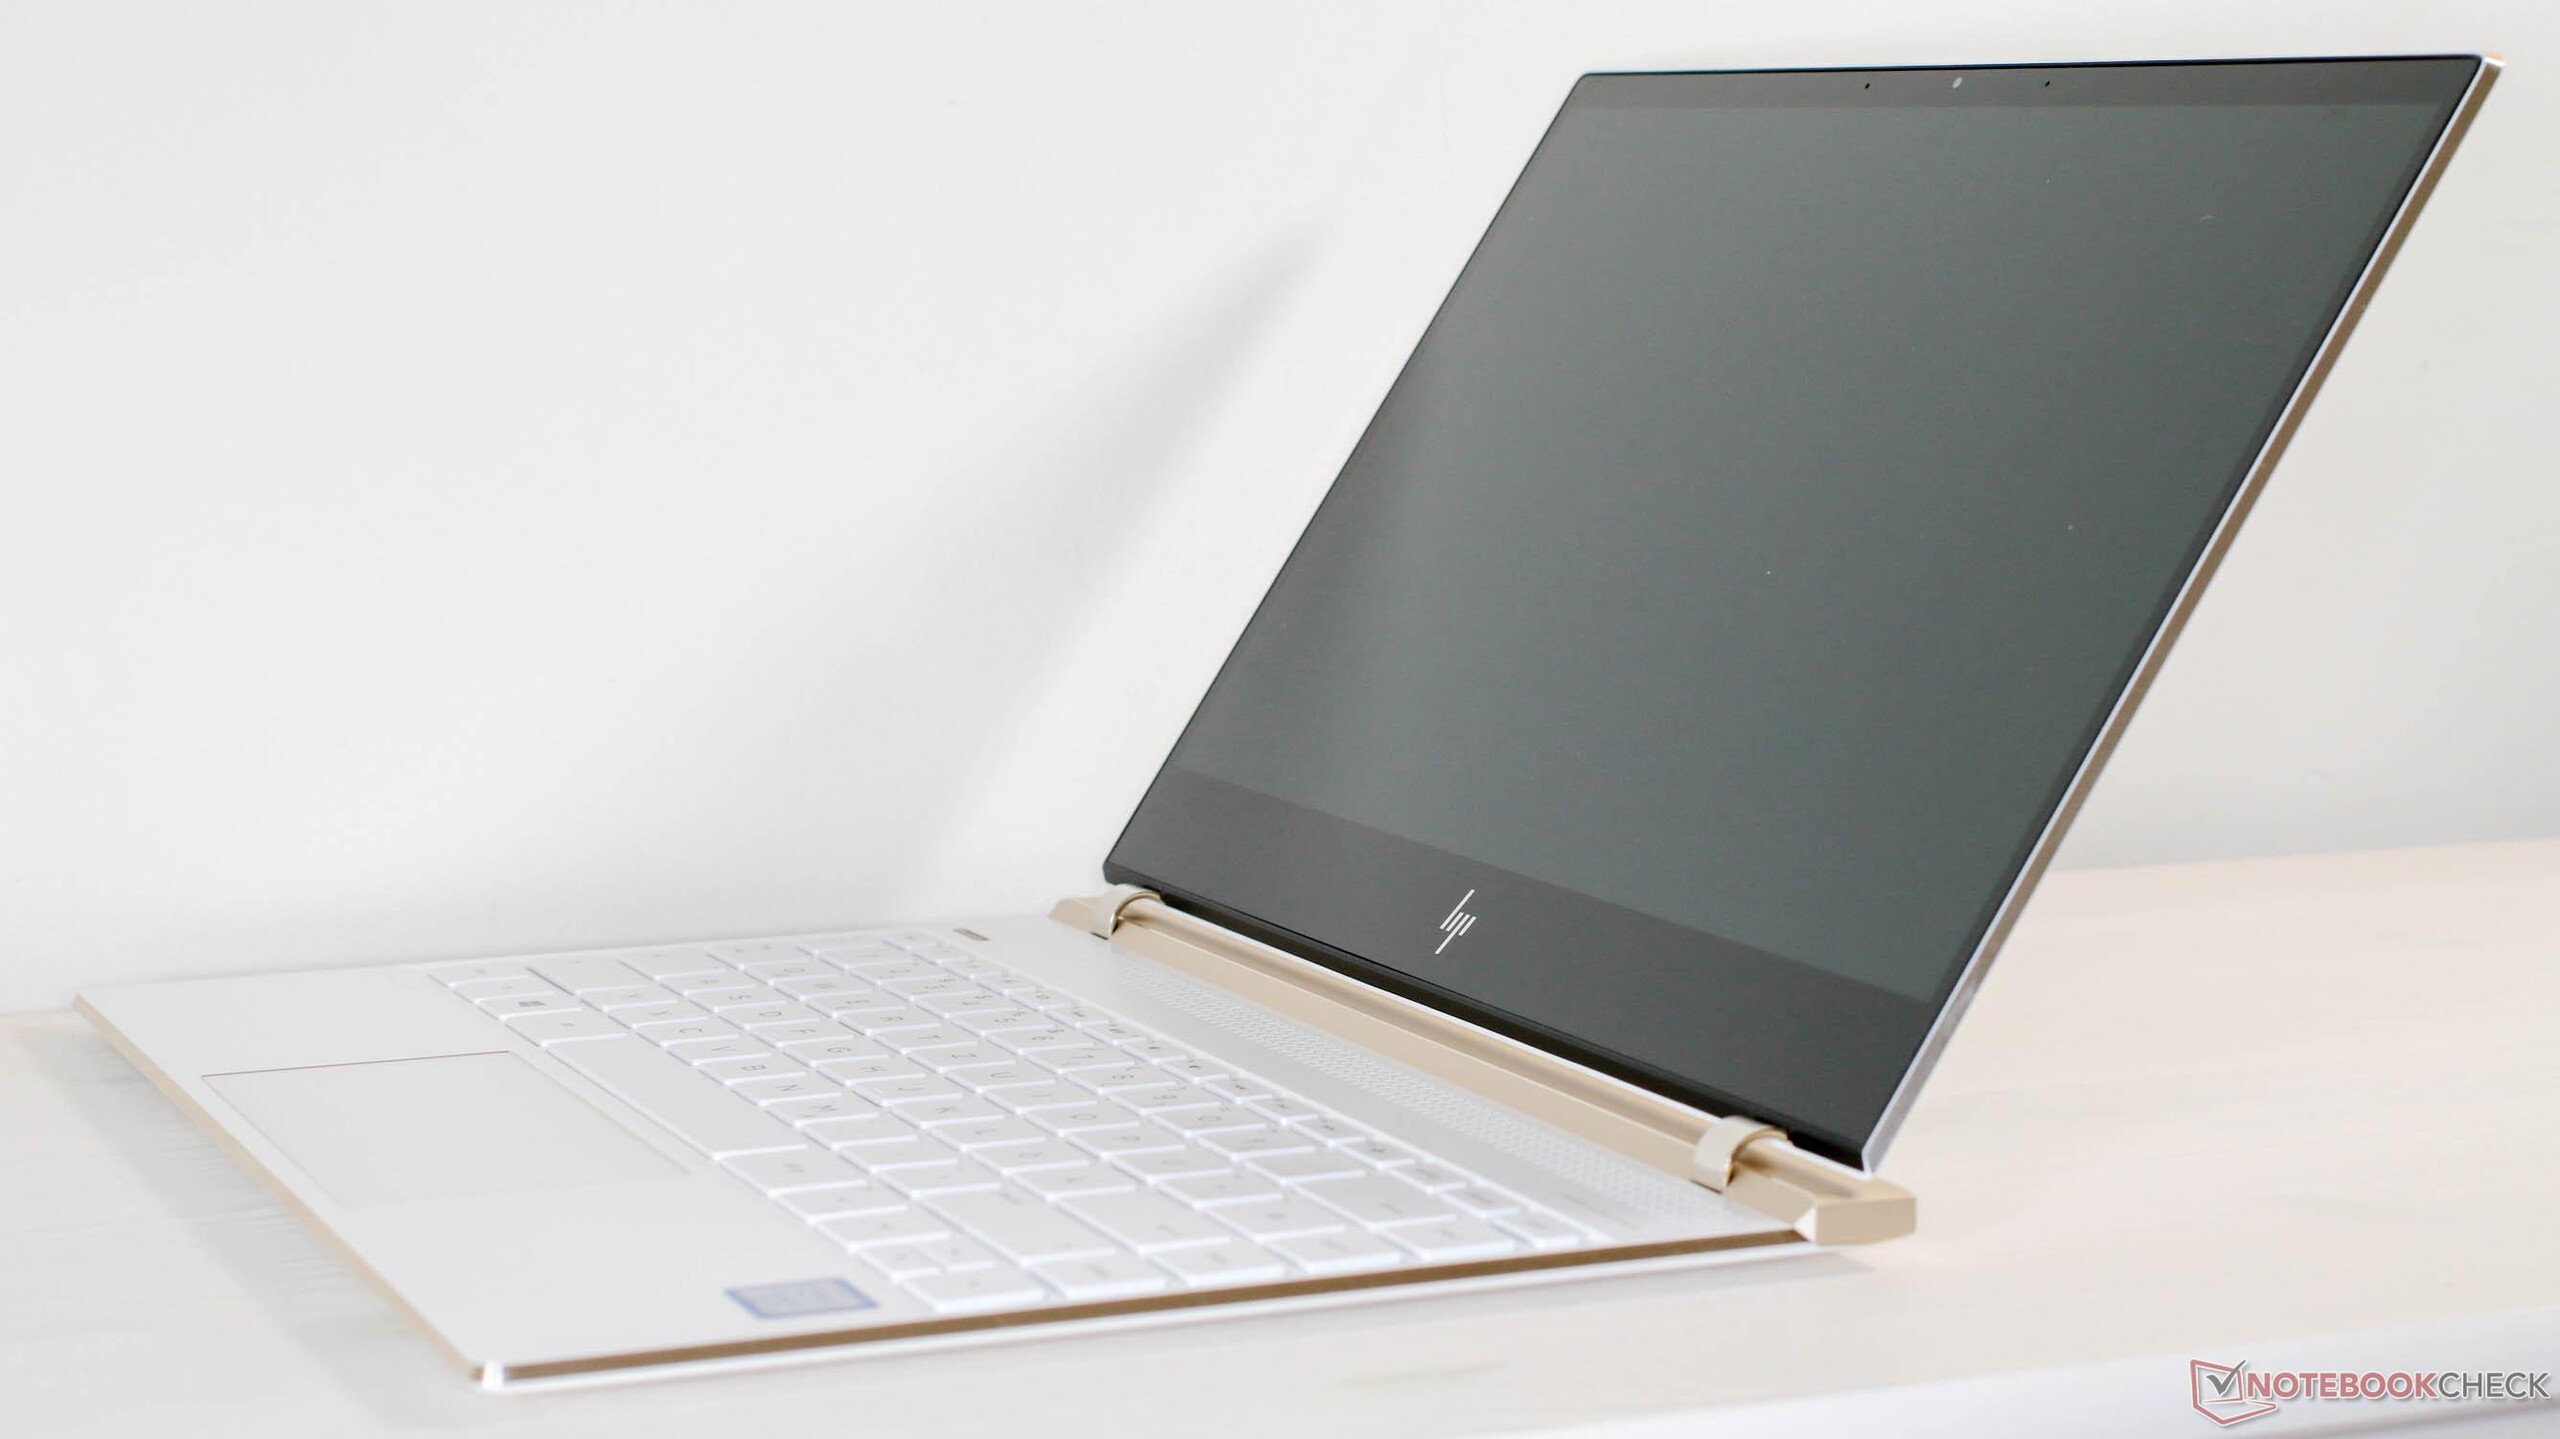
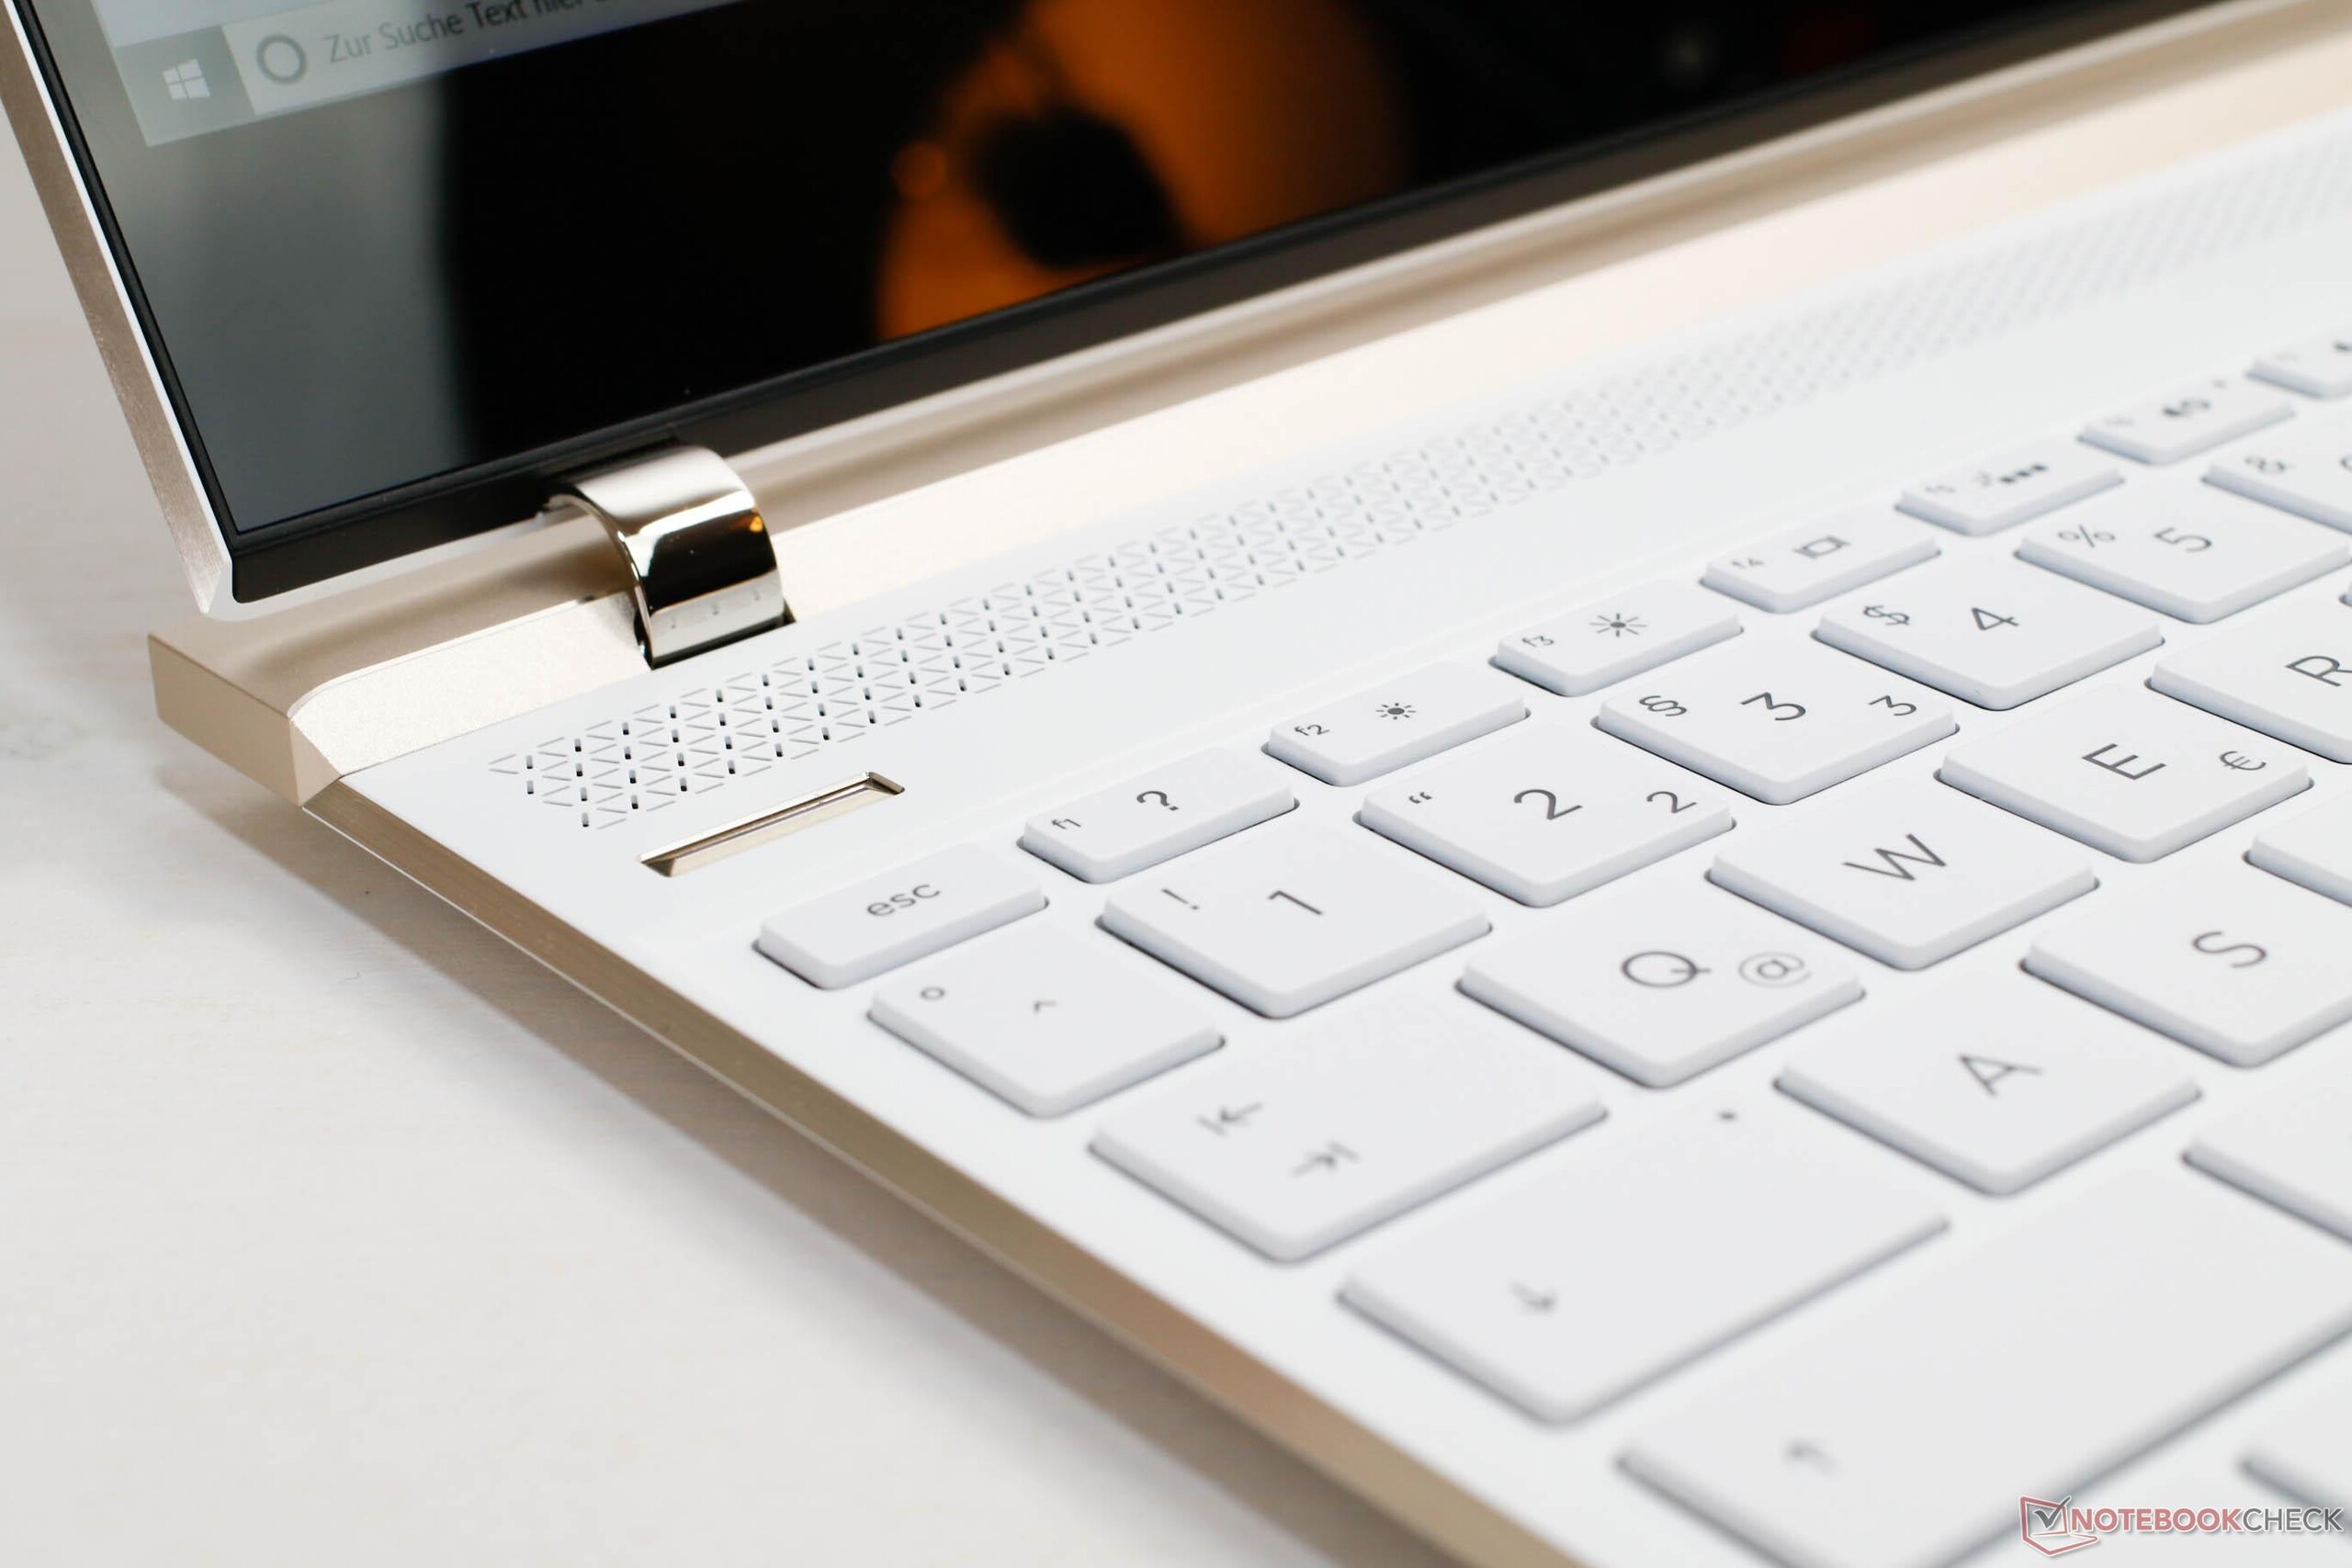
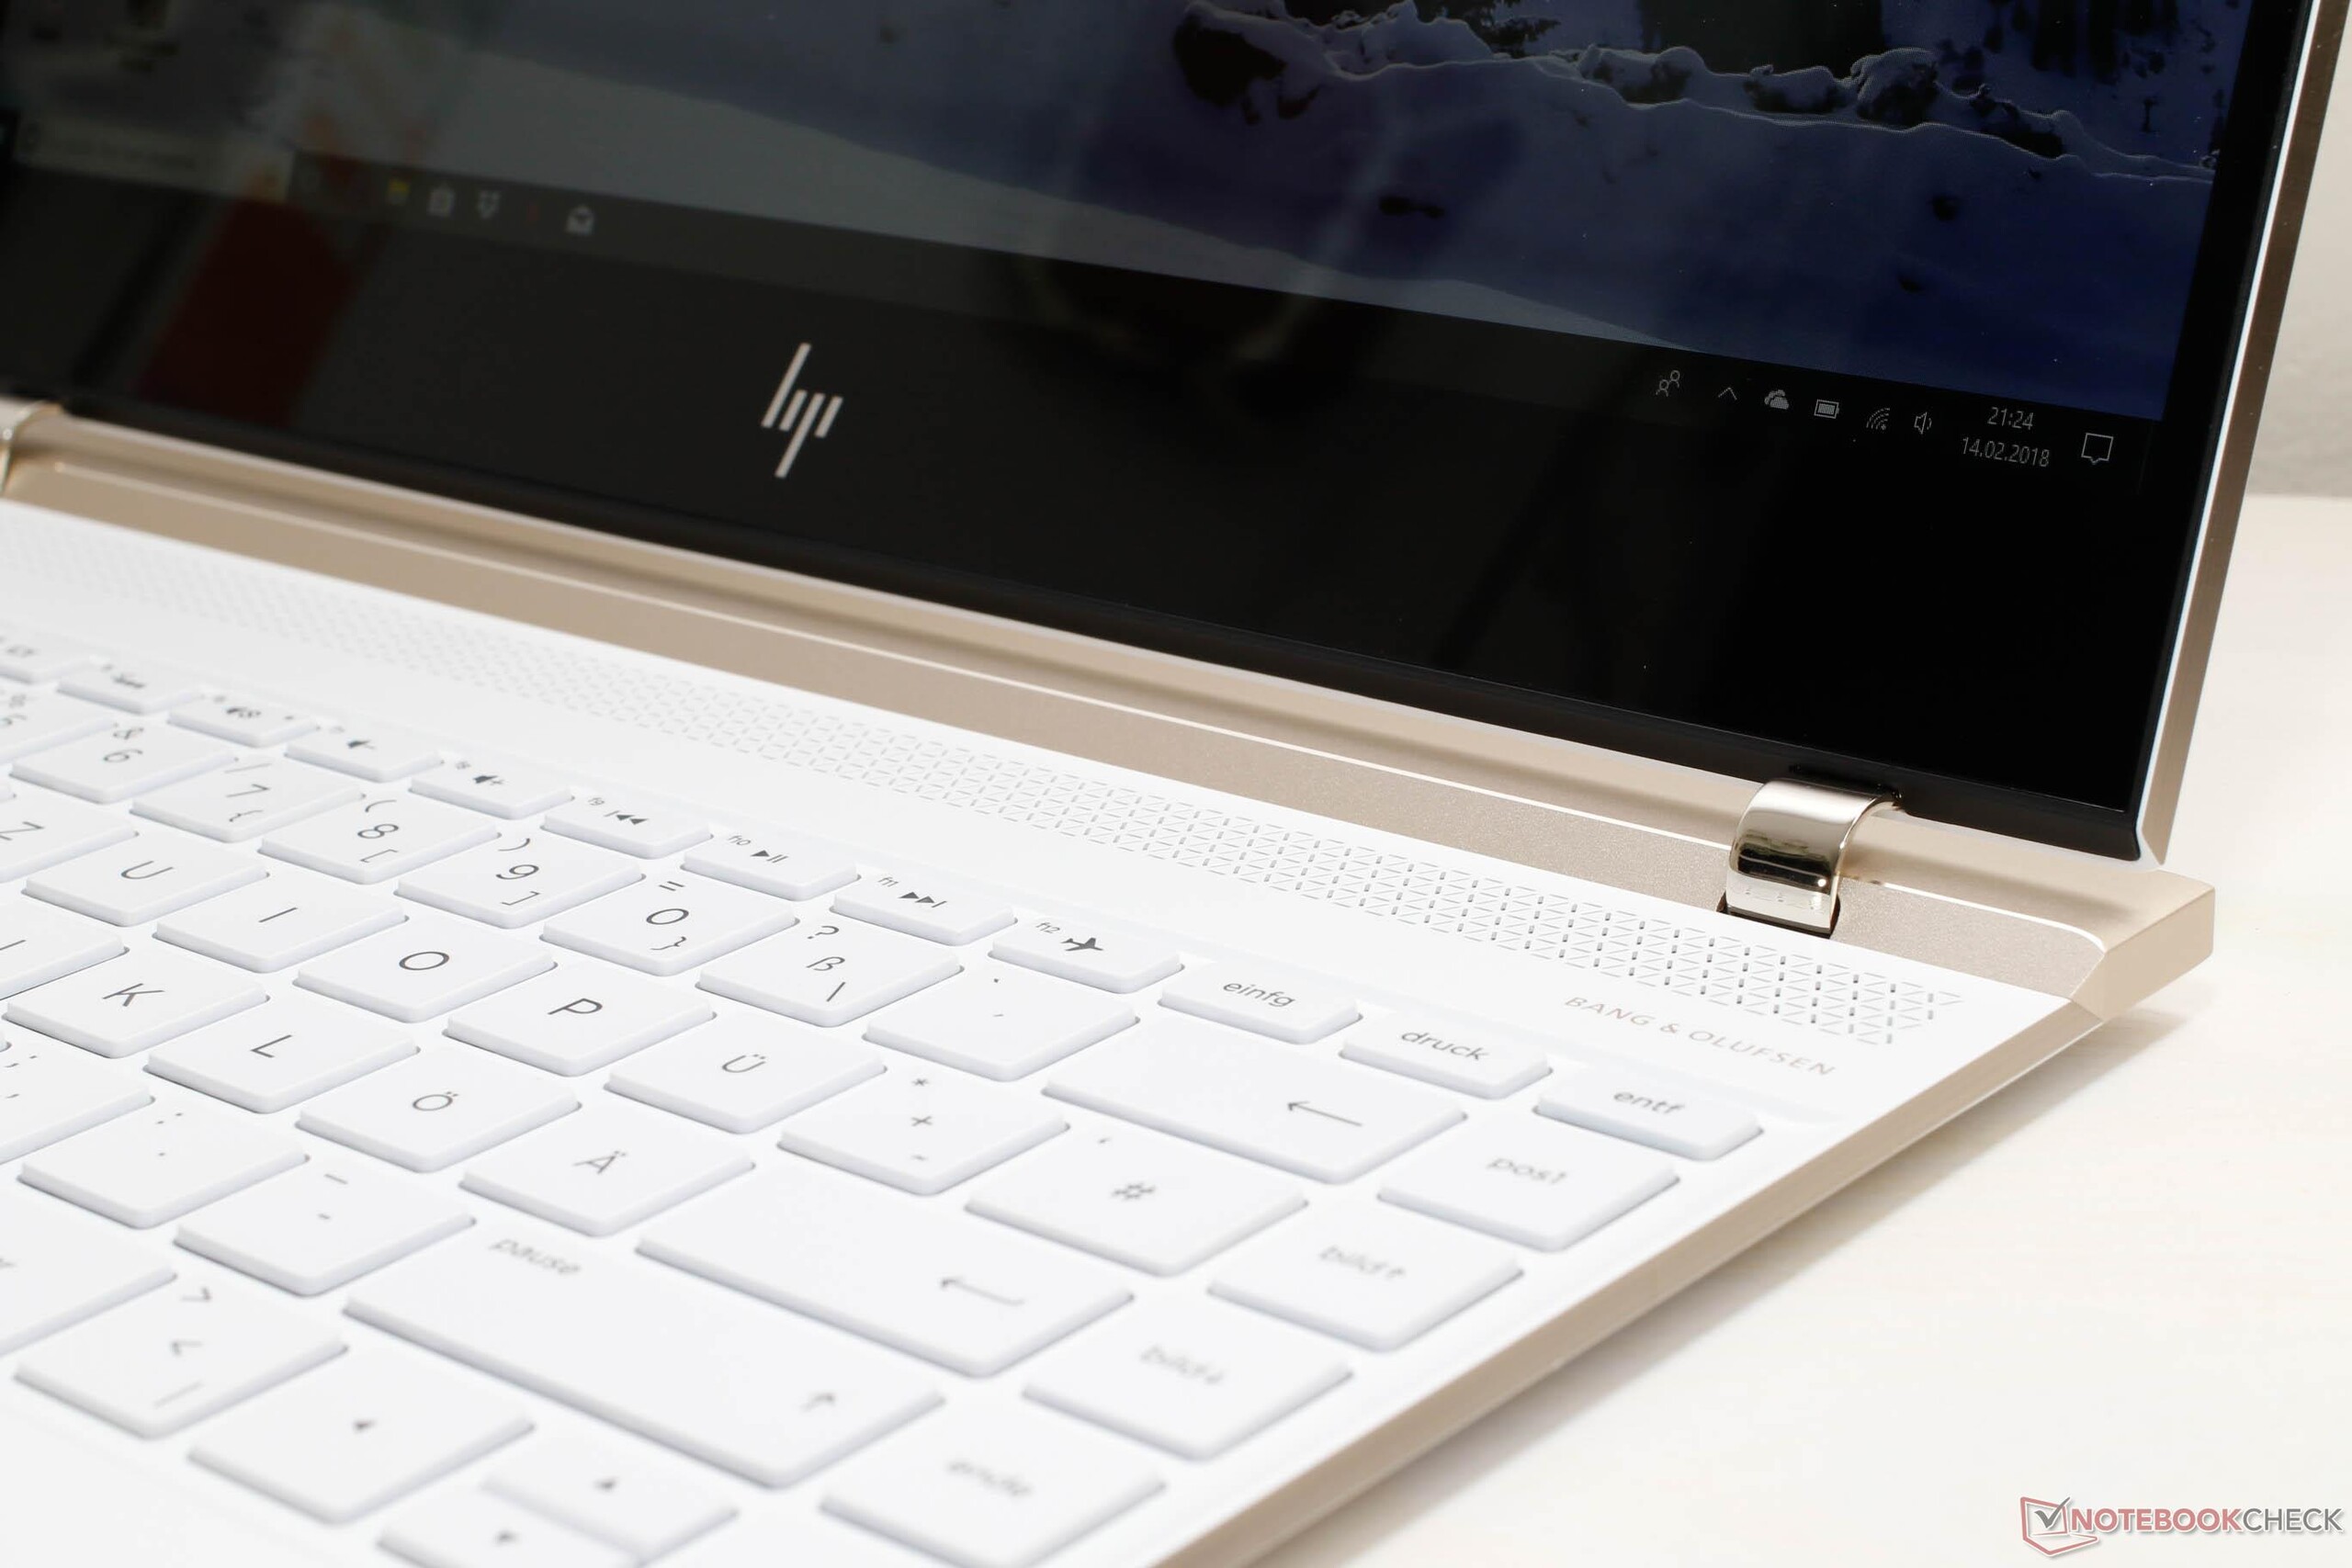
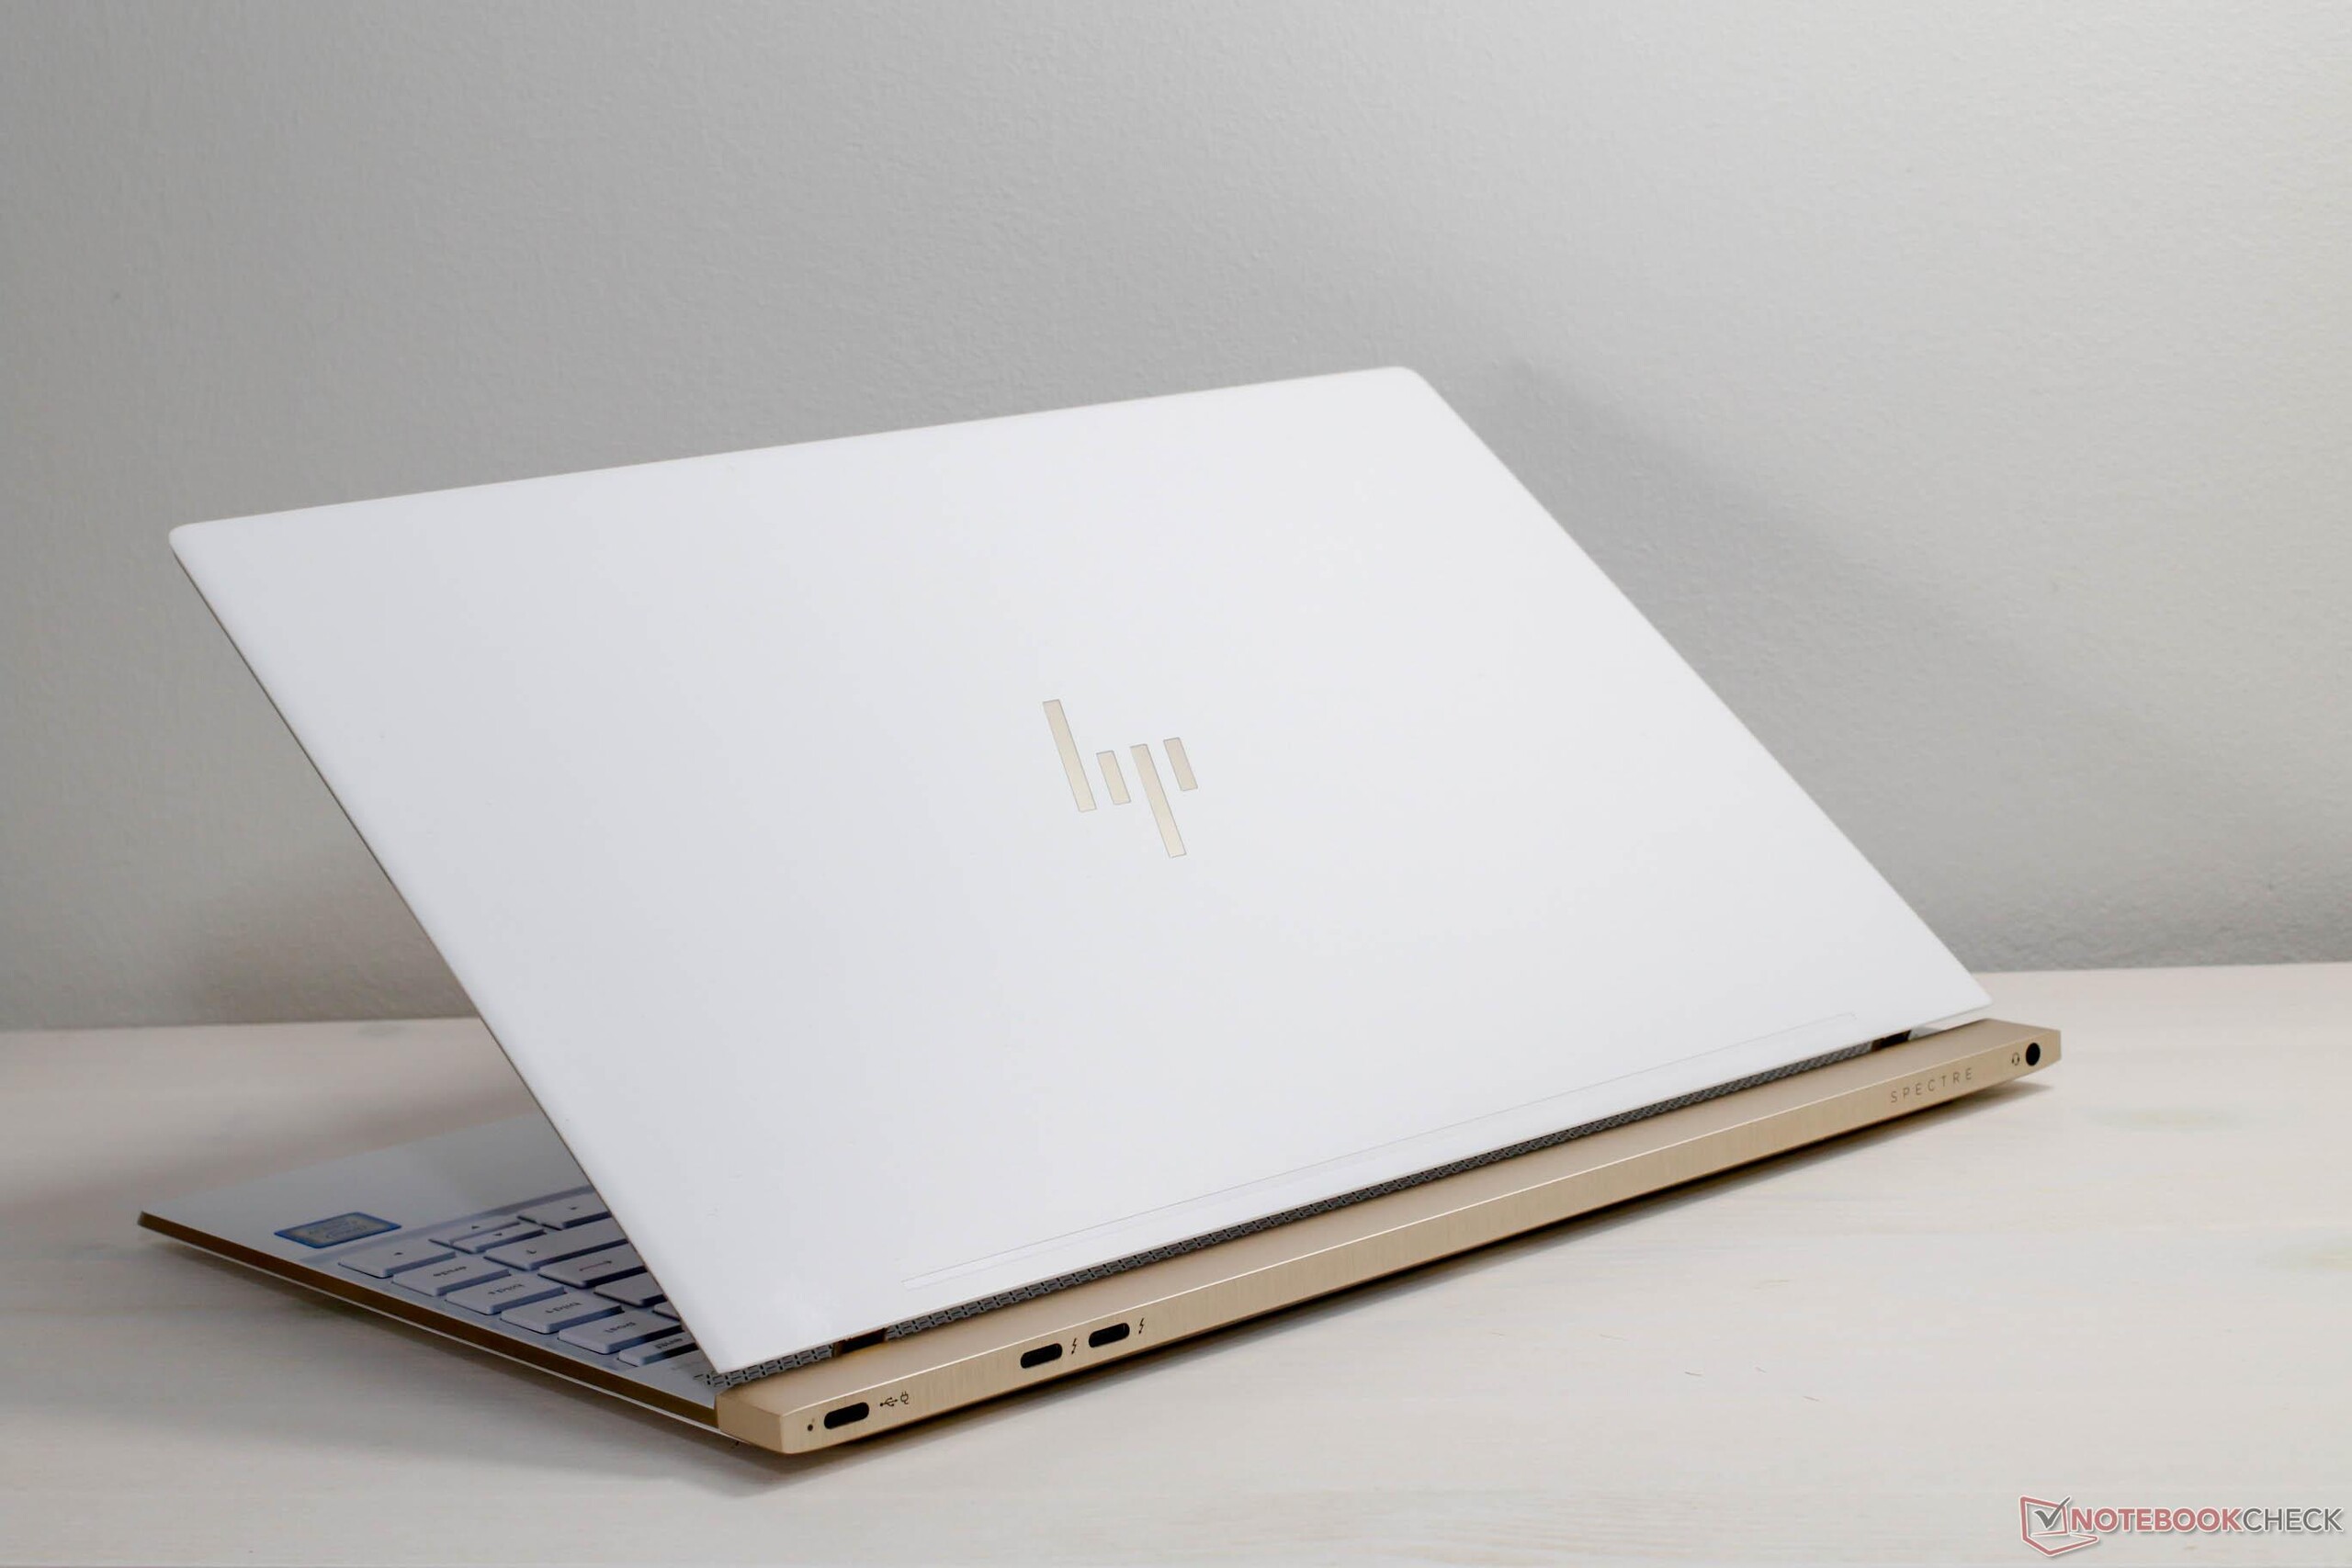
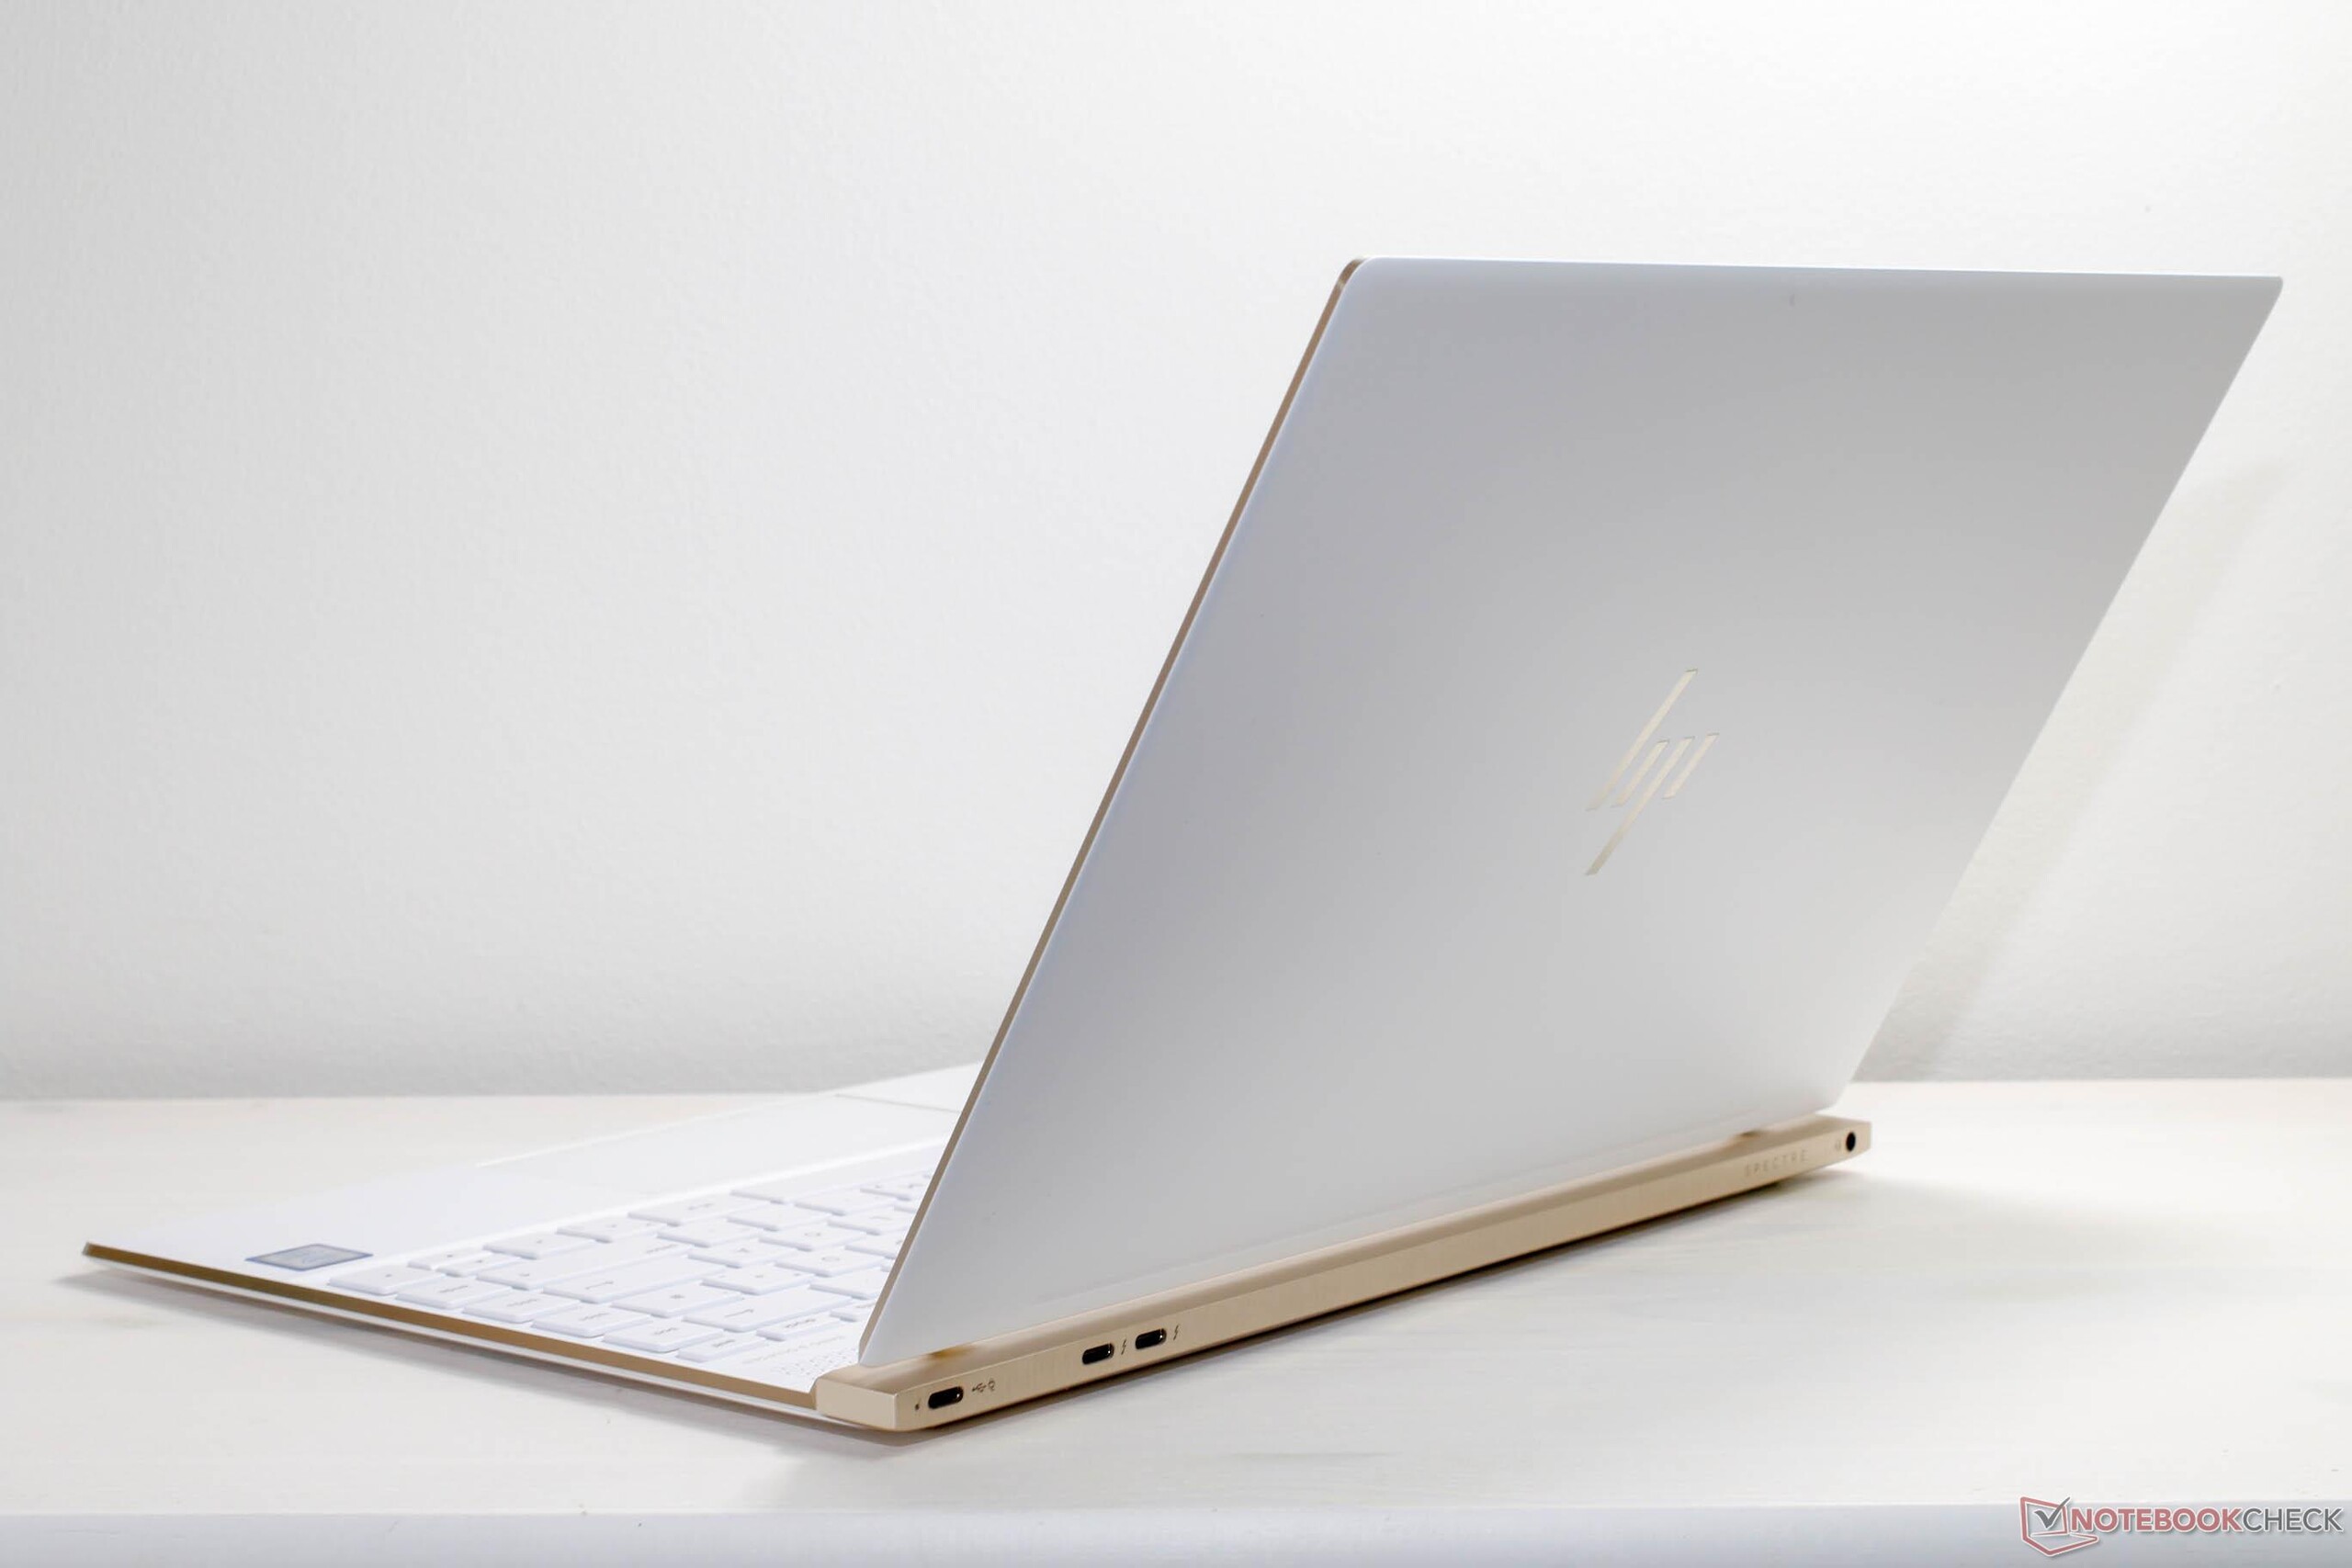
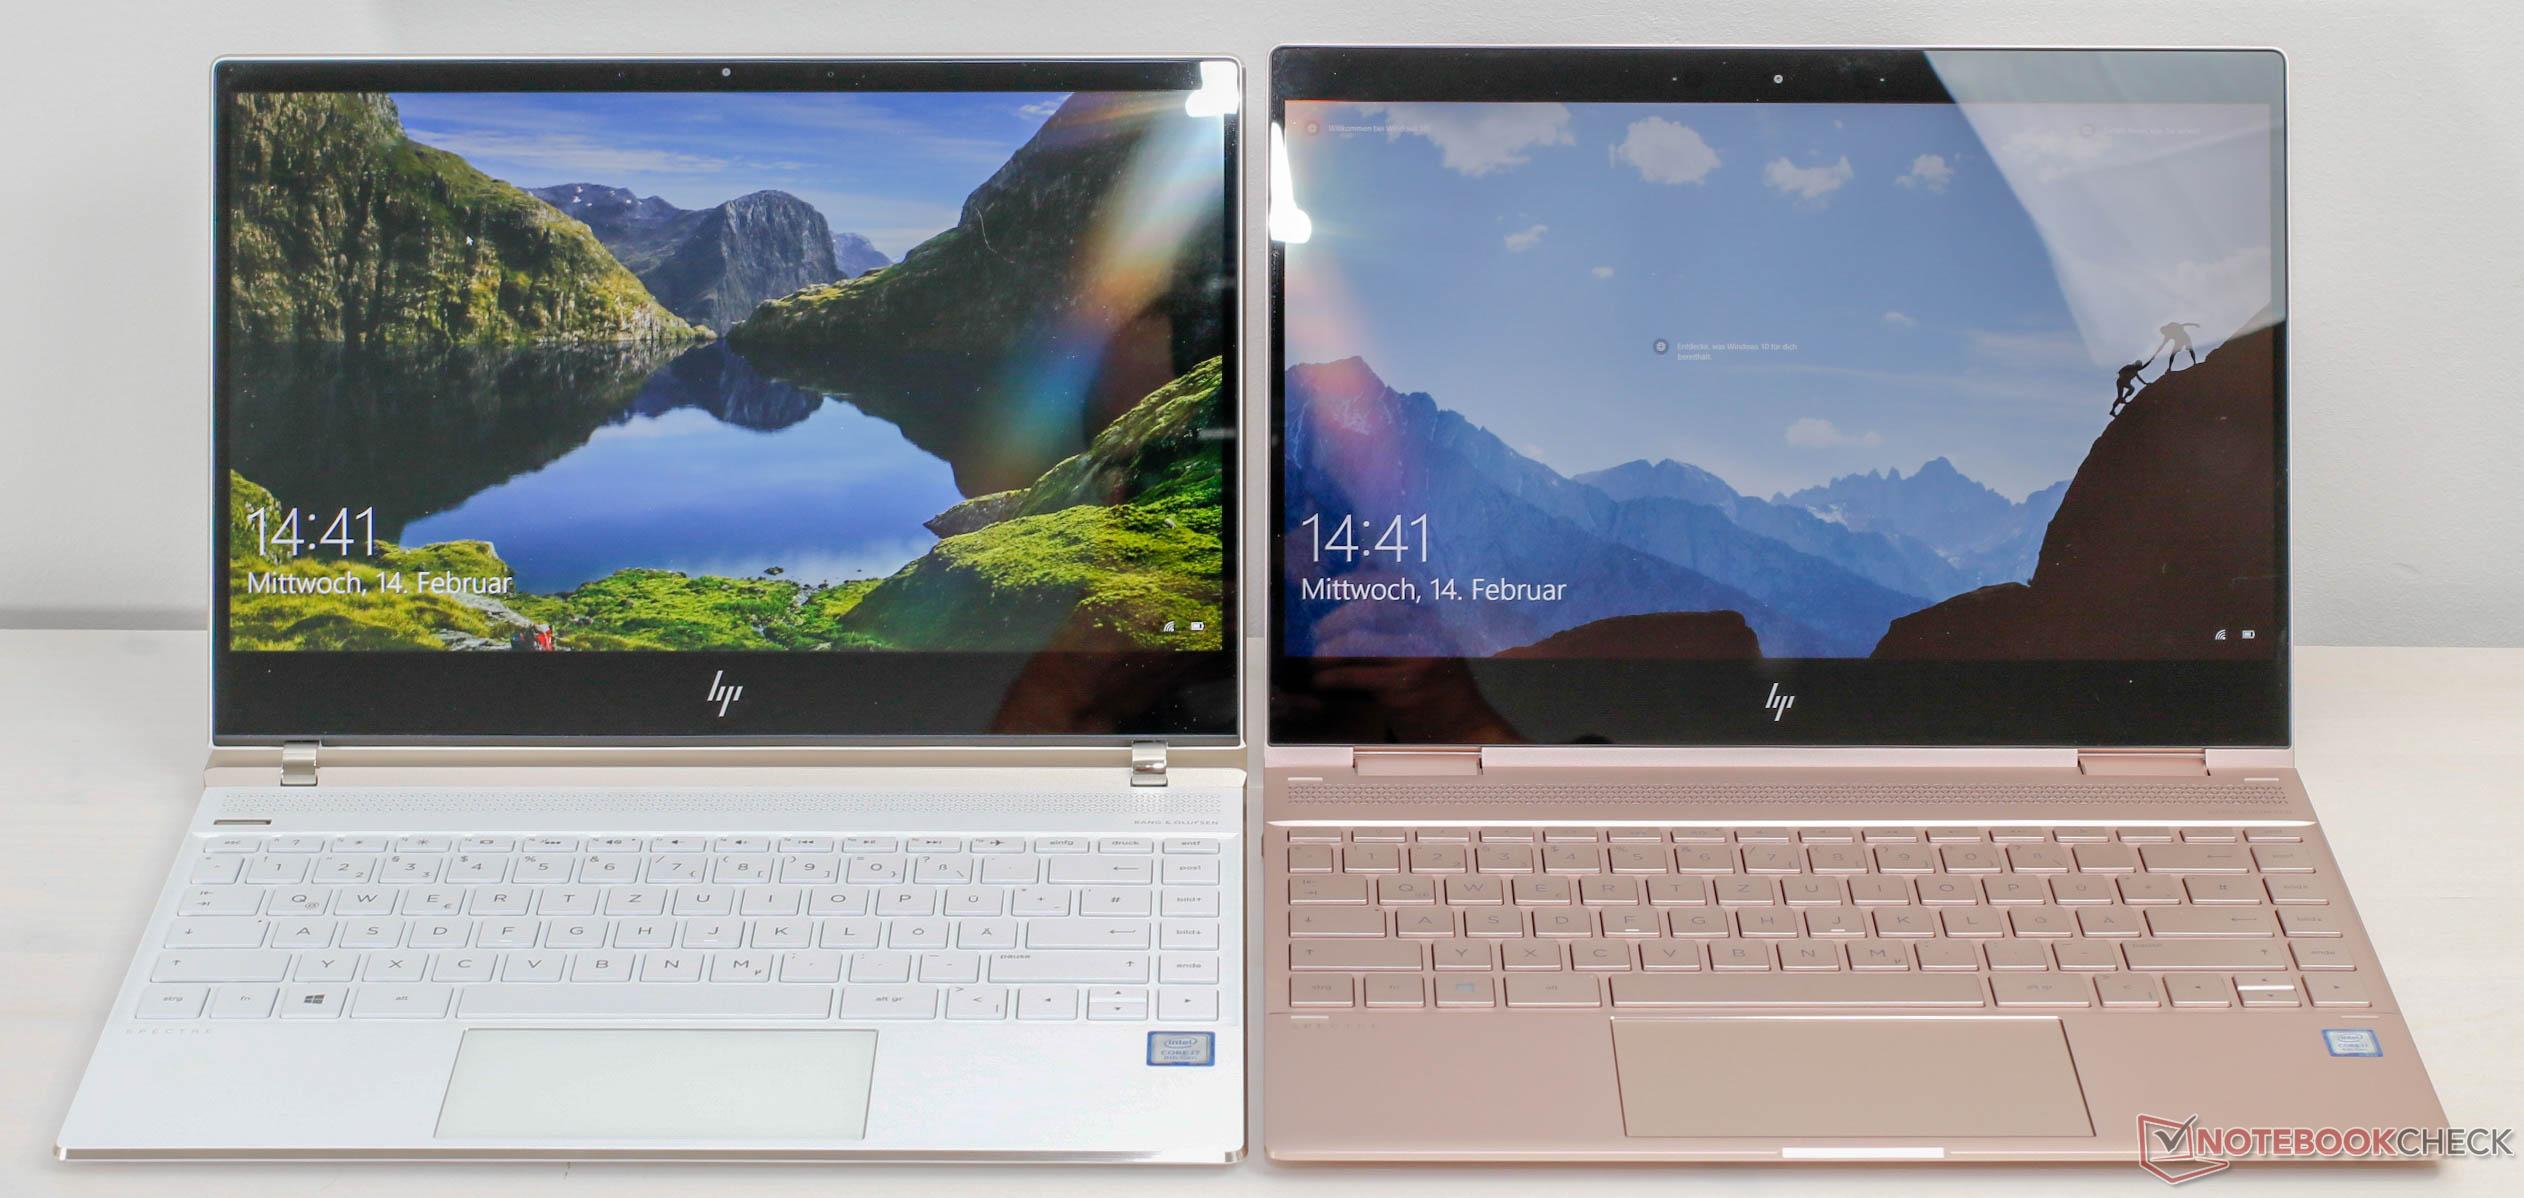
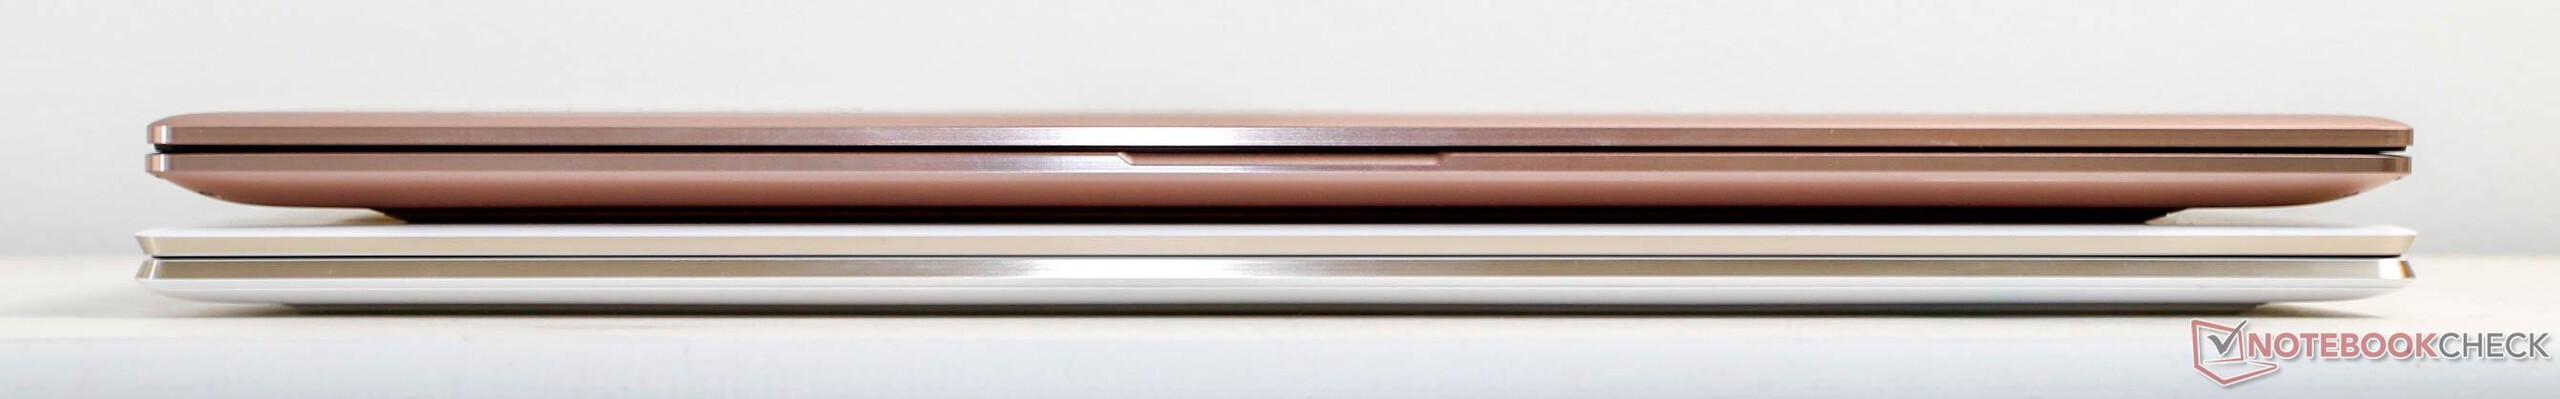
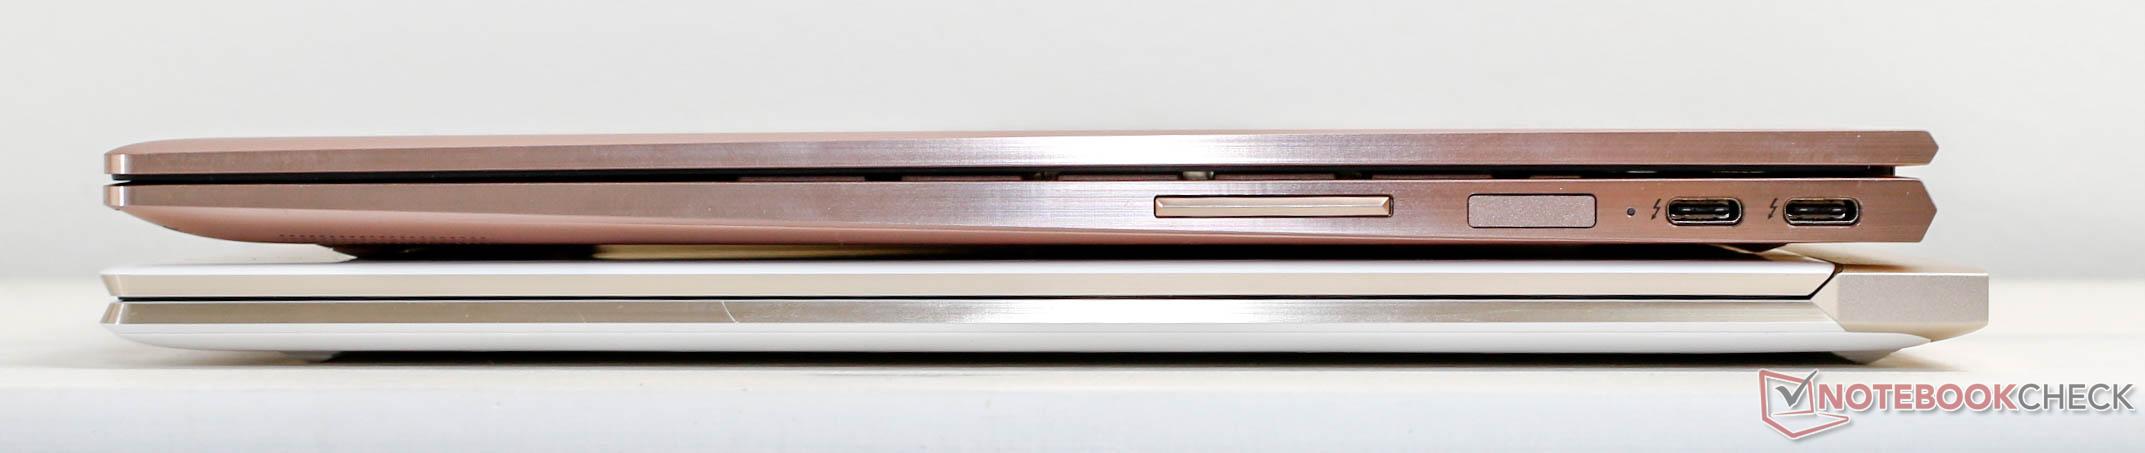
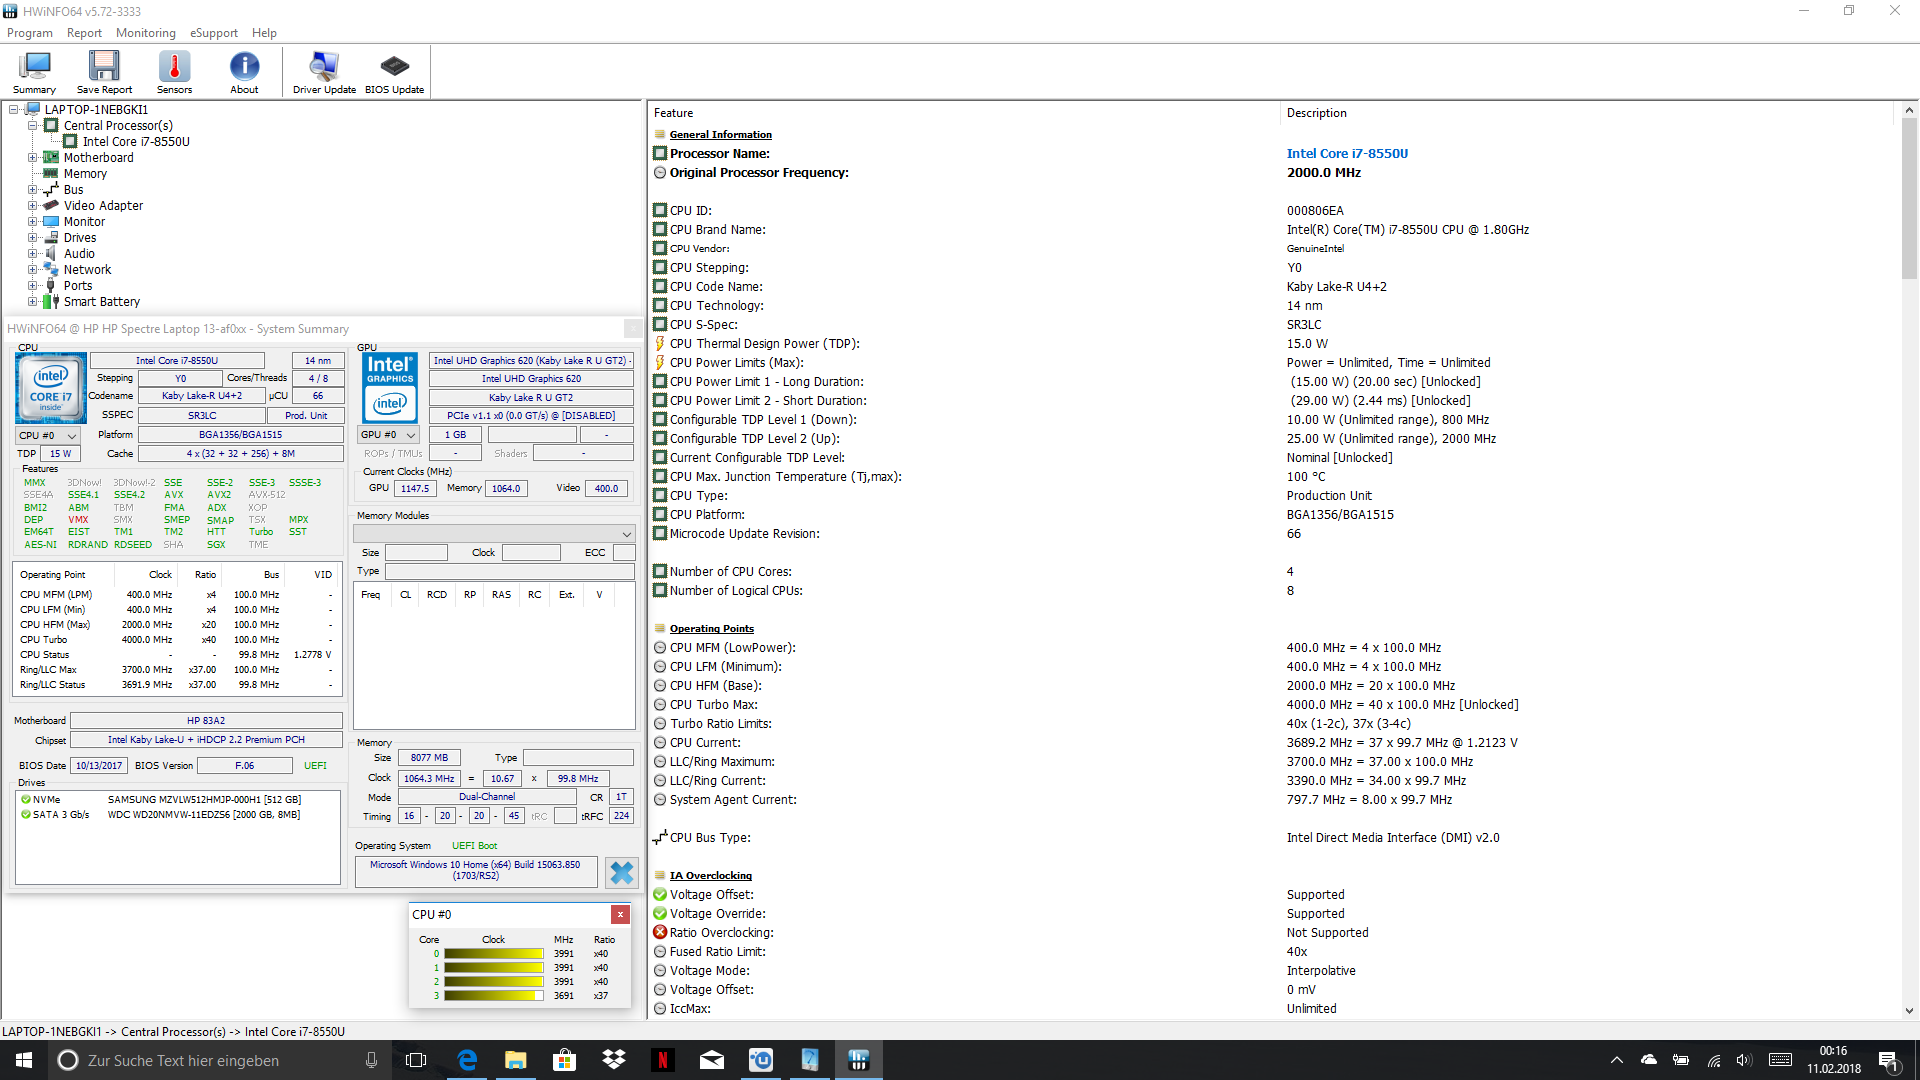
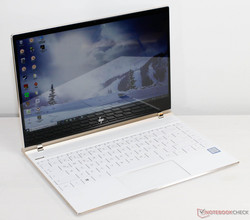
Innan vi publicerade den här recensionen frågade vi våra läsare vilka aspekter som var viktiga hos en ny Spectre 13. Svaren rörde i huvudsak batteritid och mobilitet, spoltjut, robusthet och, förstås, prestanda. Vi kommer nämna alla dessa aspekter i vårt omdöme, men först vill vi börja med att föra till protokollet att HP har get Spectre 13 en framgångsrik CPU-uppgradering och även arbetat om höljet. Även om förra årets Spectre 13 med Intel Core i7-7500U också var en fröjd för ögat så är den nya i7-8550U modellen ännu snyggare med sin lite rundare design, tunnare infattning och ännu mindre mått.
HP har tagit ett stort steg framåt med Spectres design. Dess nya hörnen och kanter passar dess namn. Jämfört med den nya Spectre 13 så framstår dom avrundade hörnena från den gamla Spectre 13 plötsligt som osexiga.
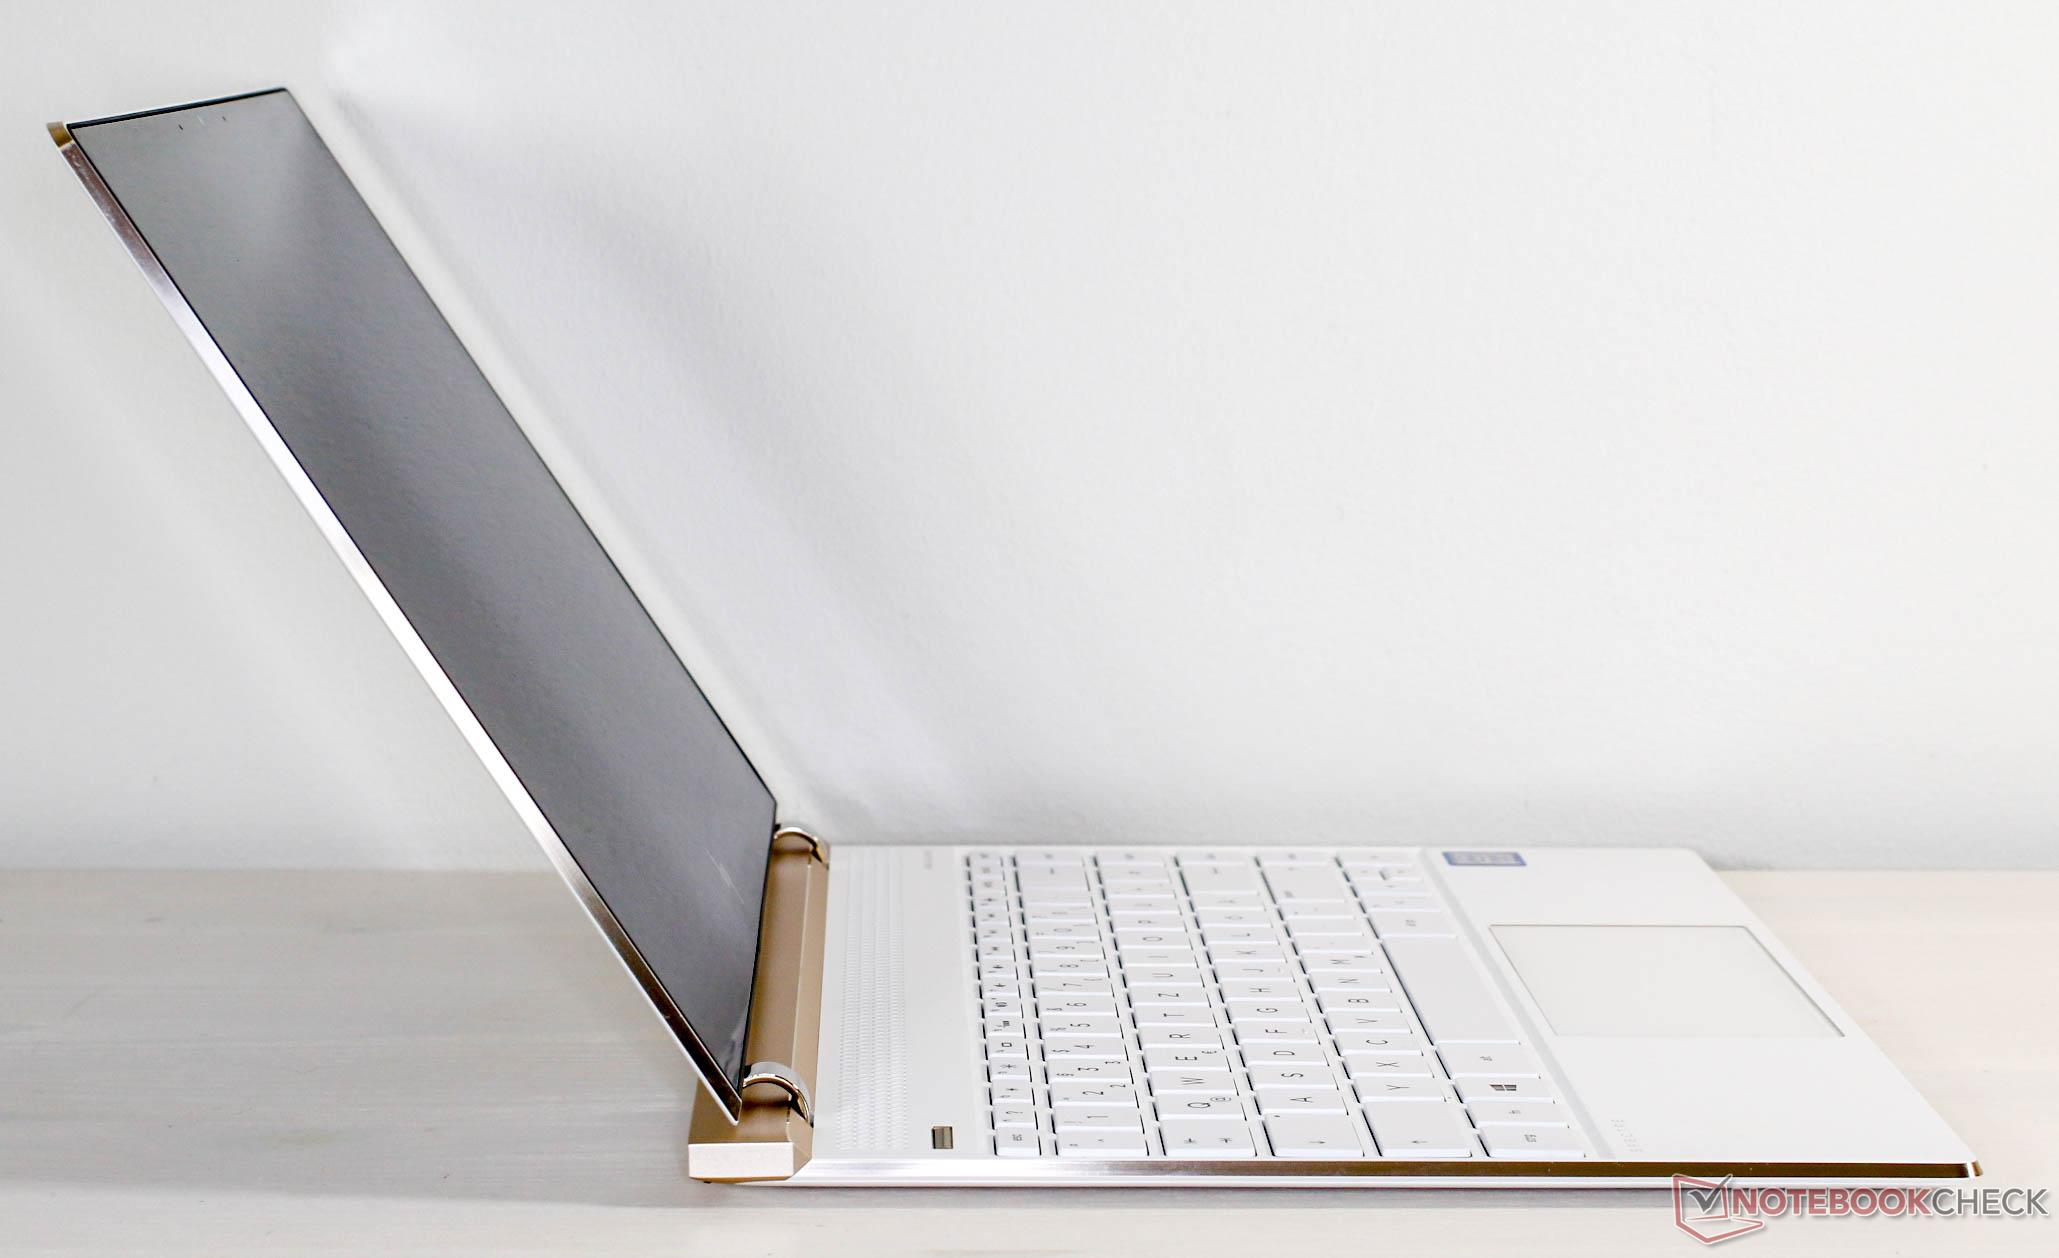
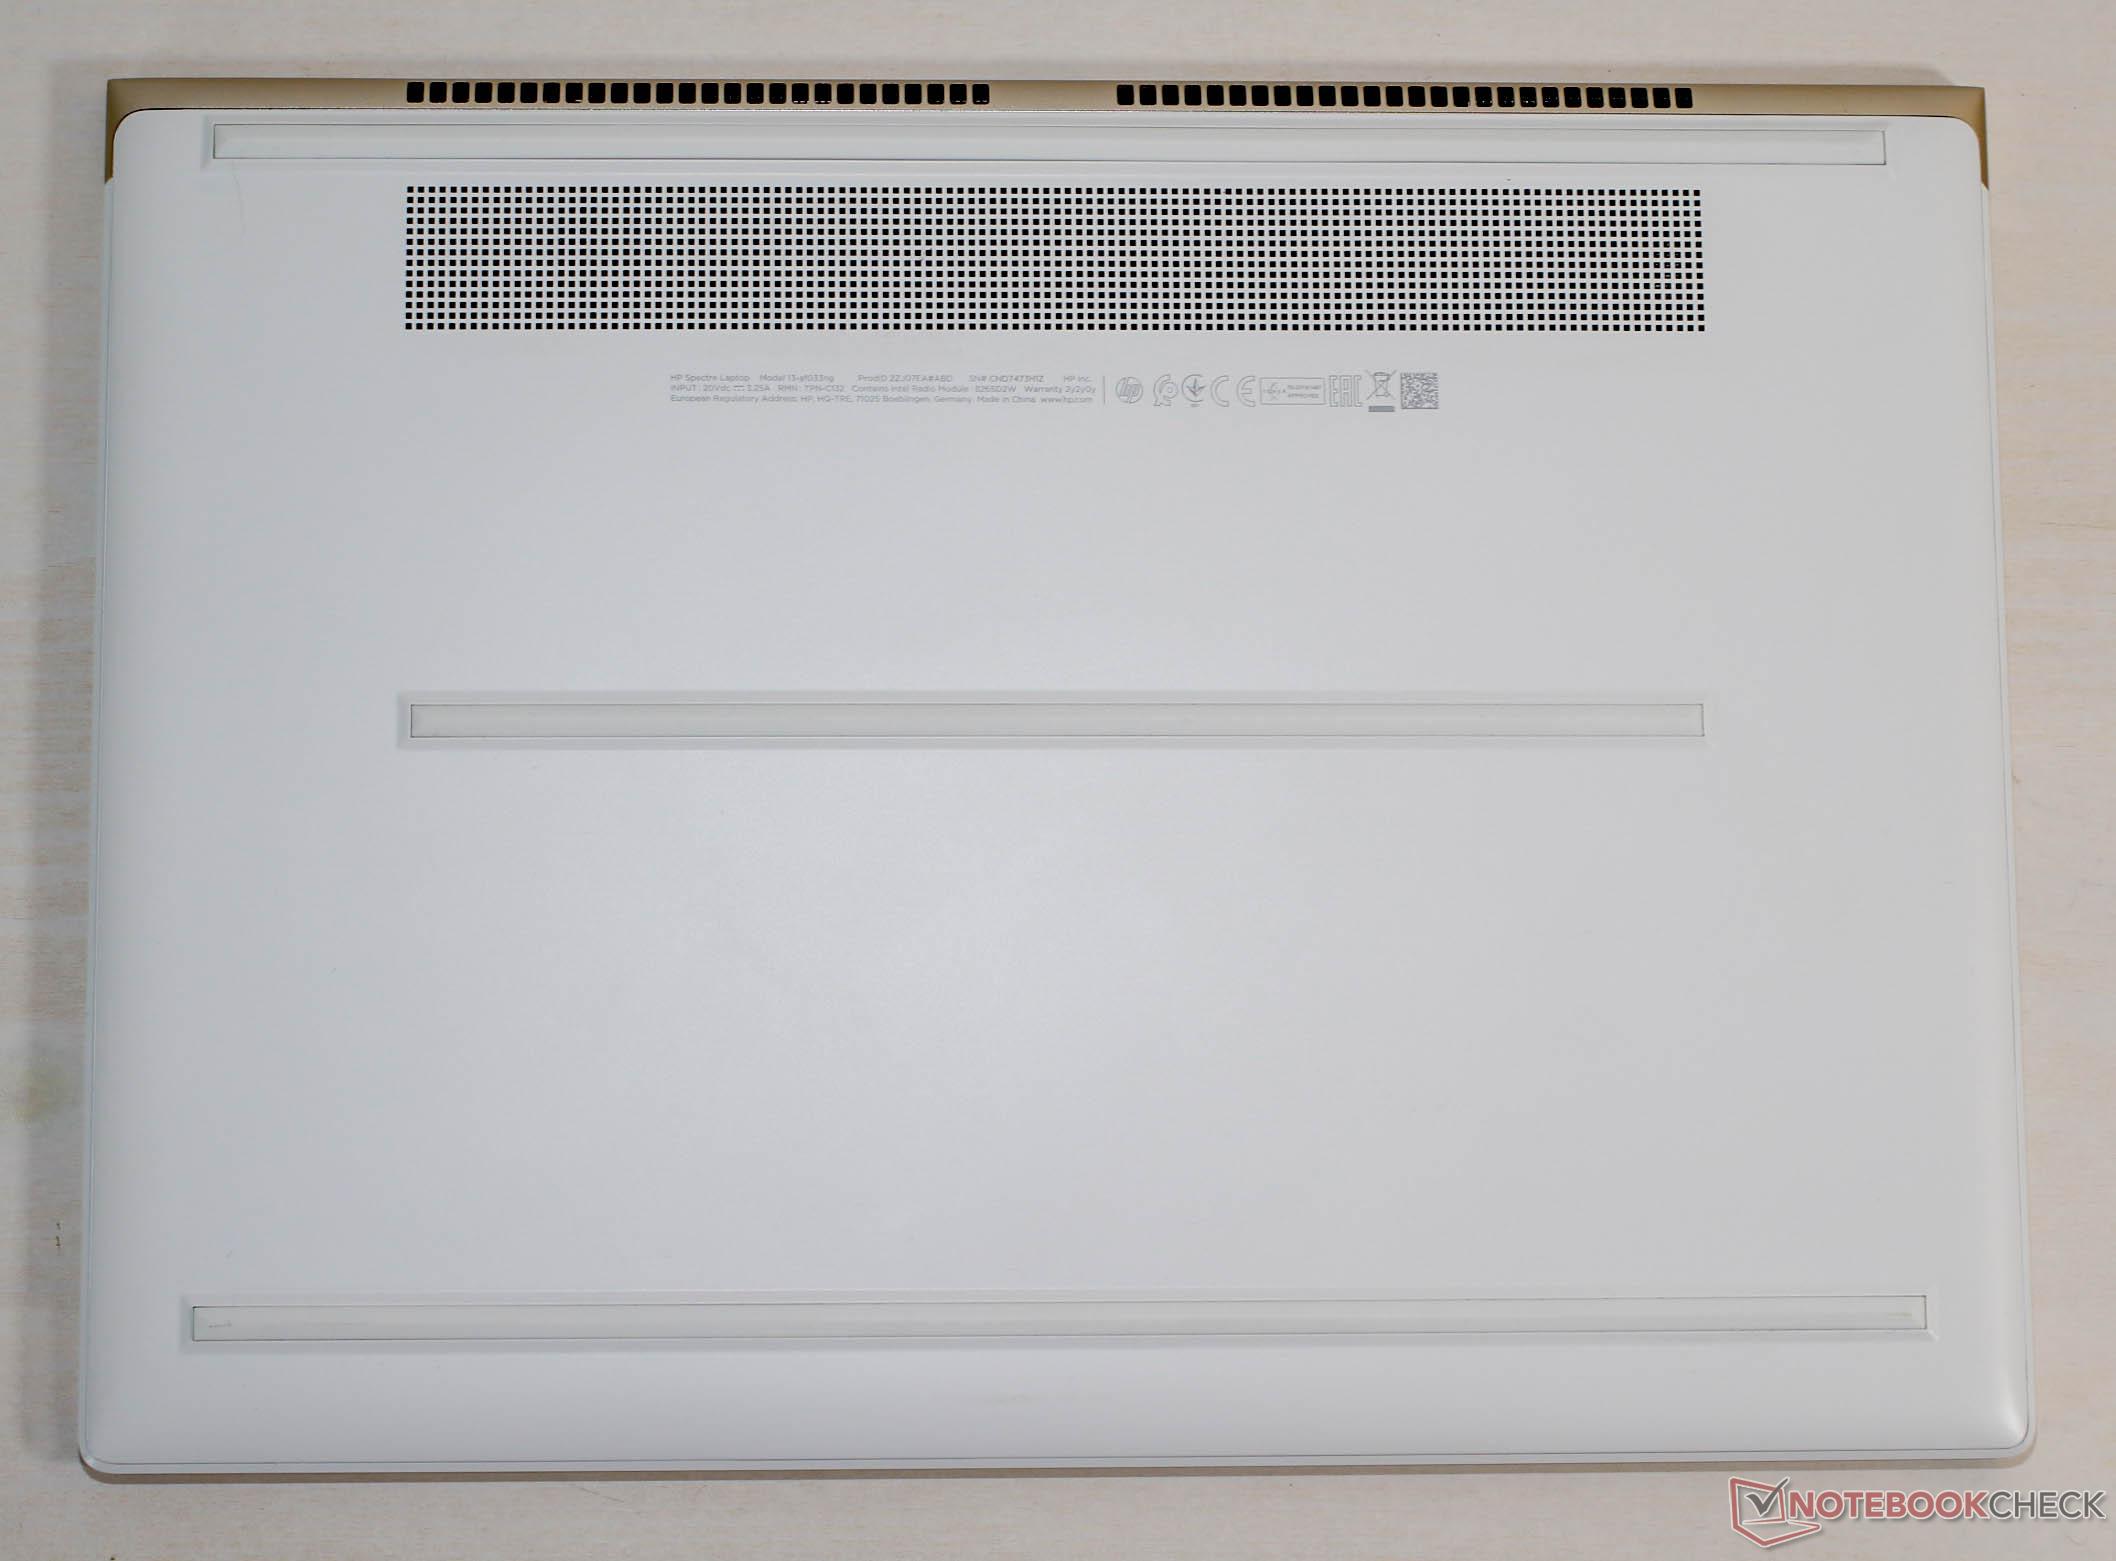
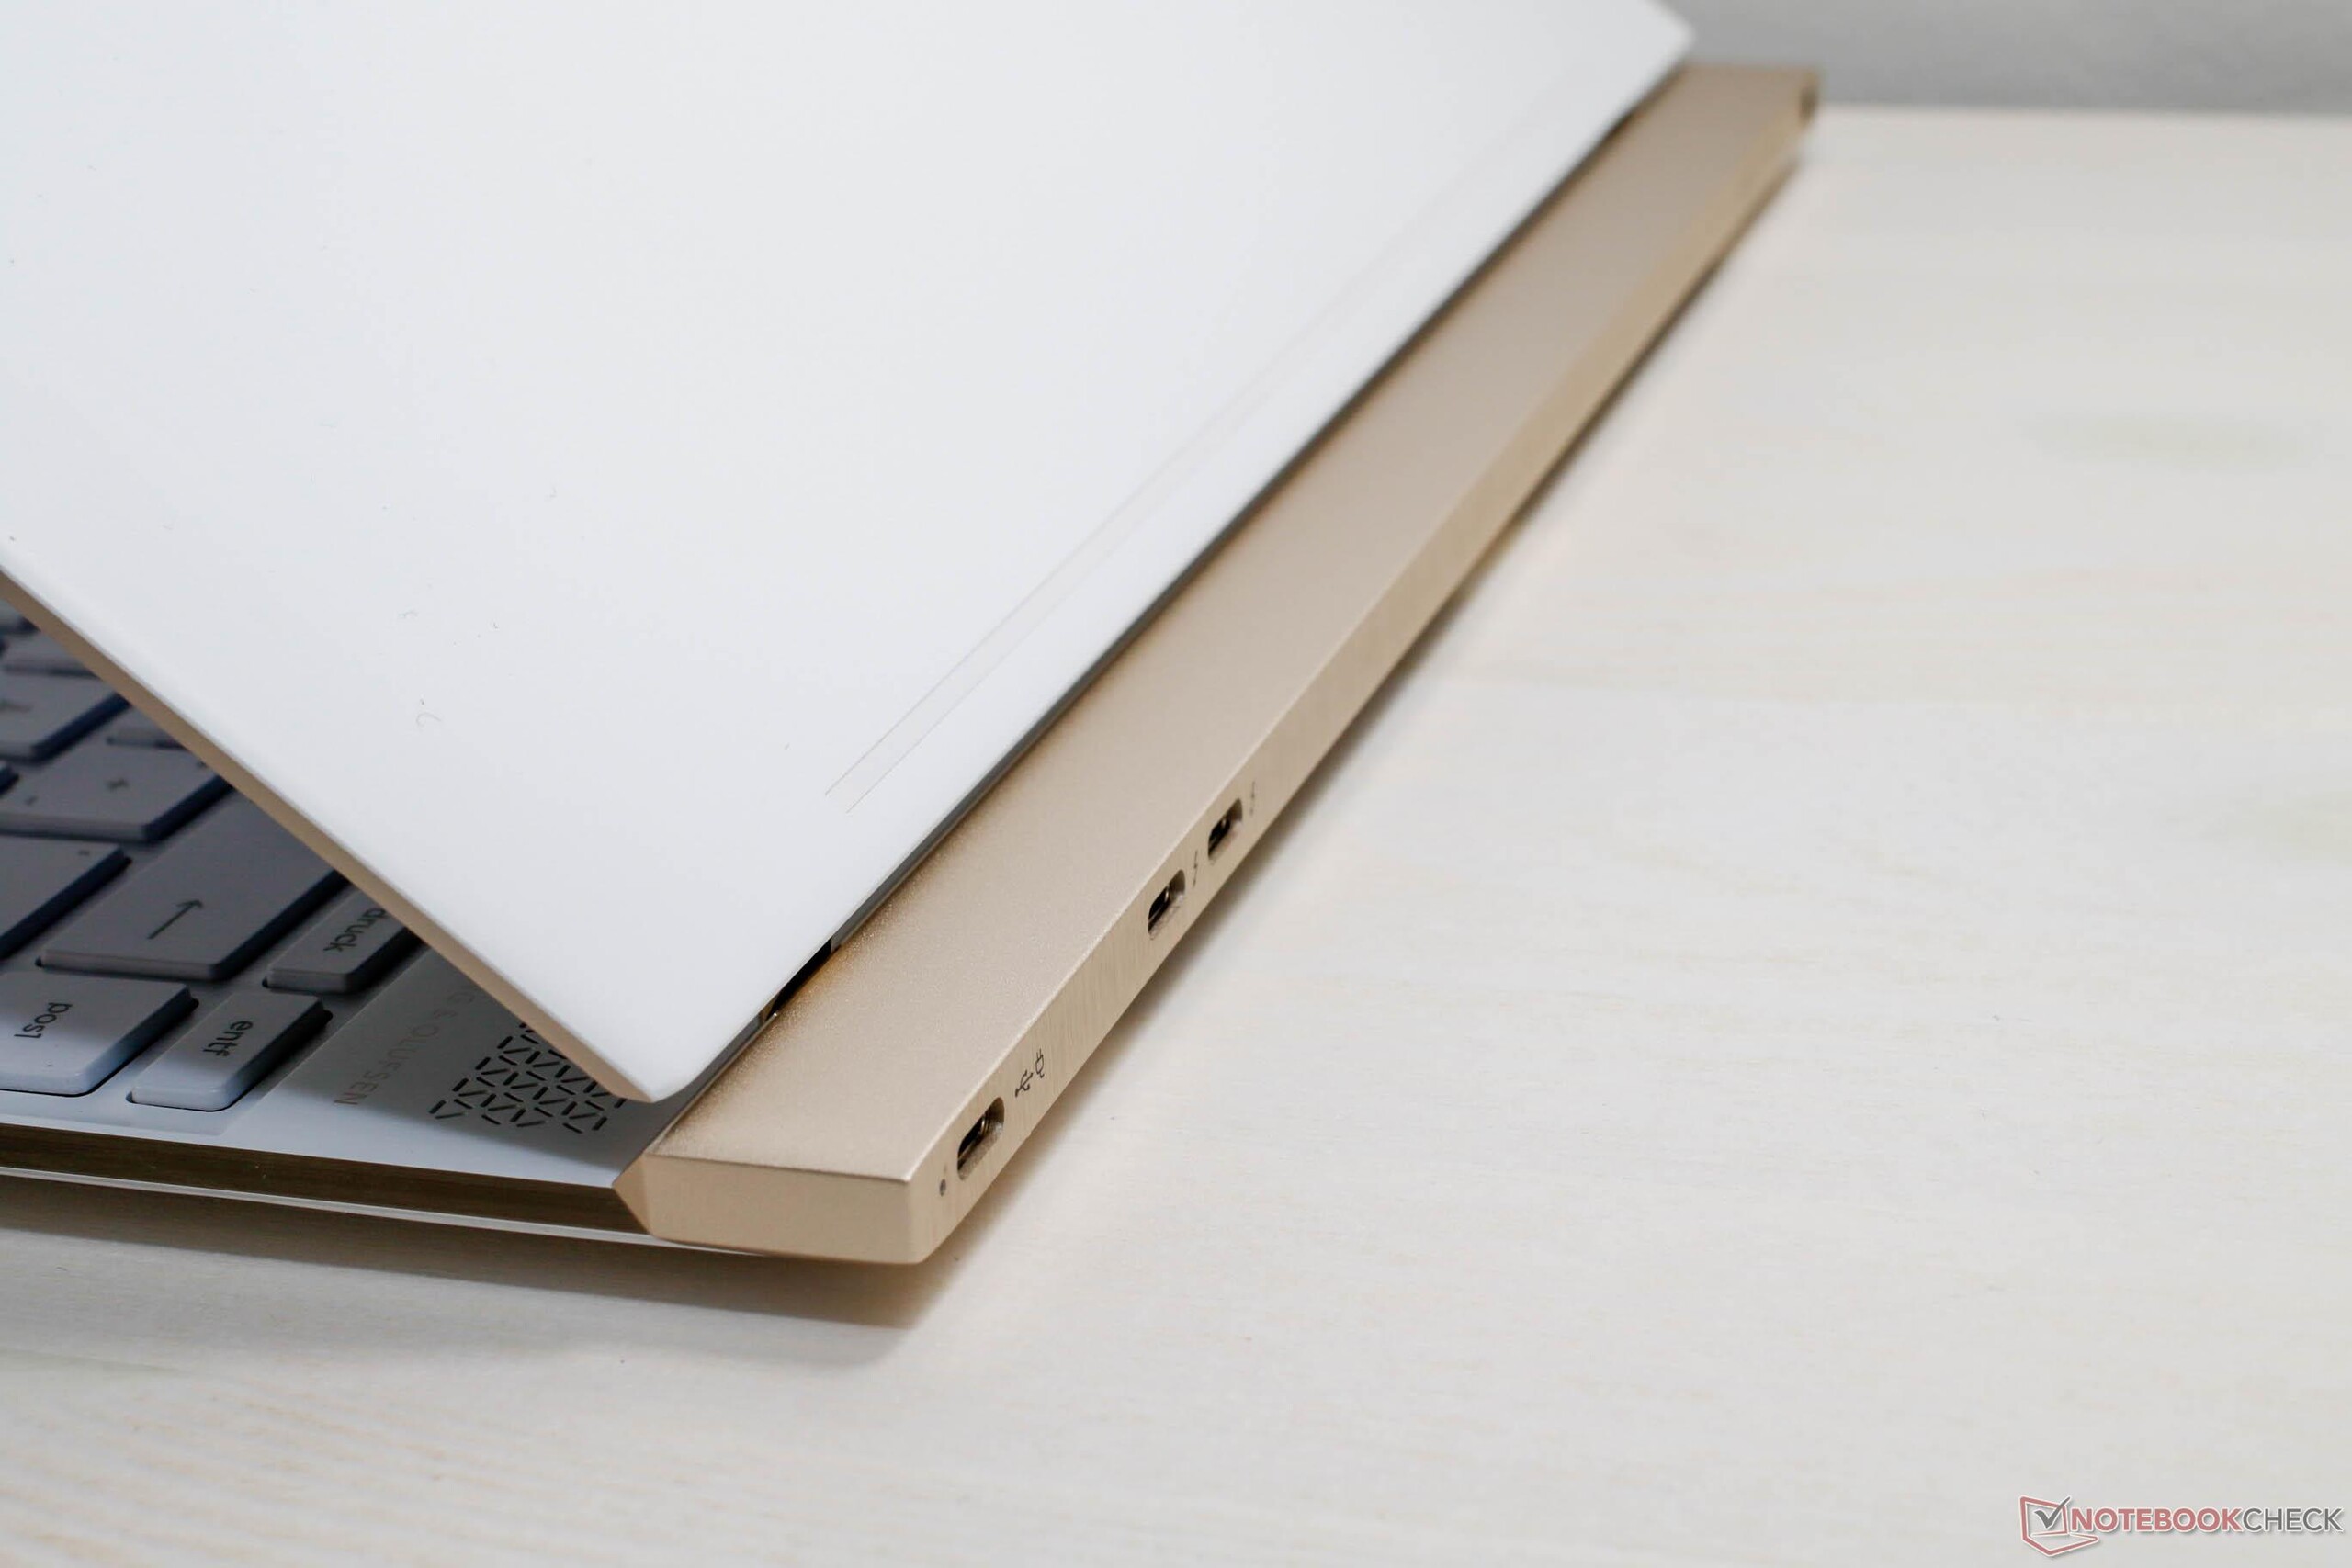
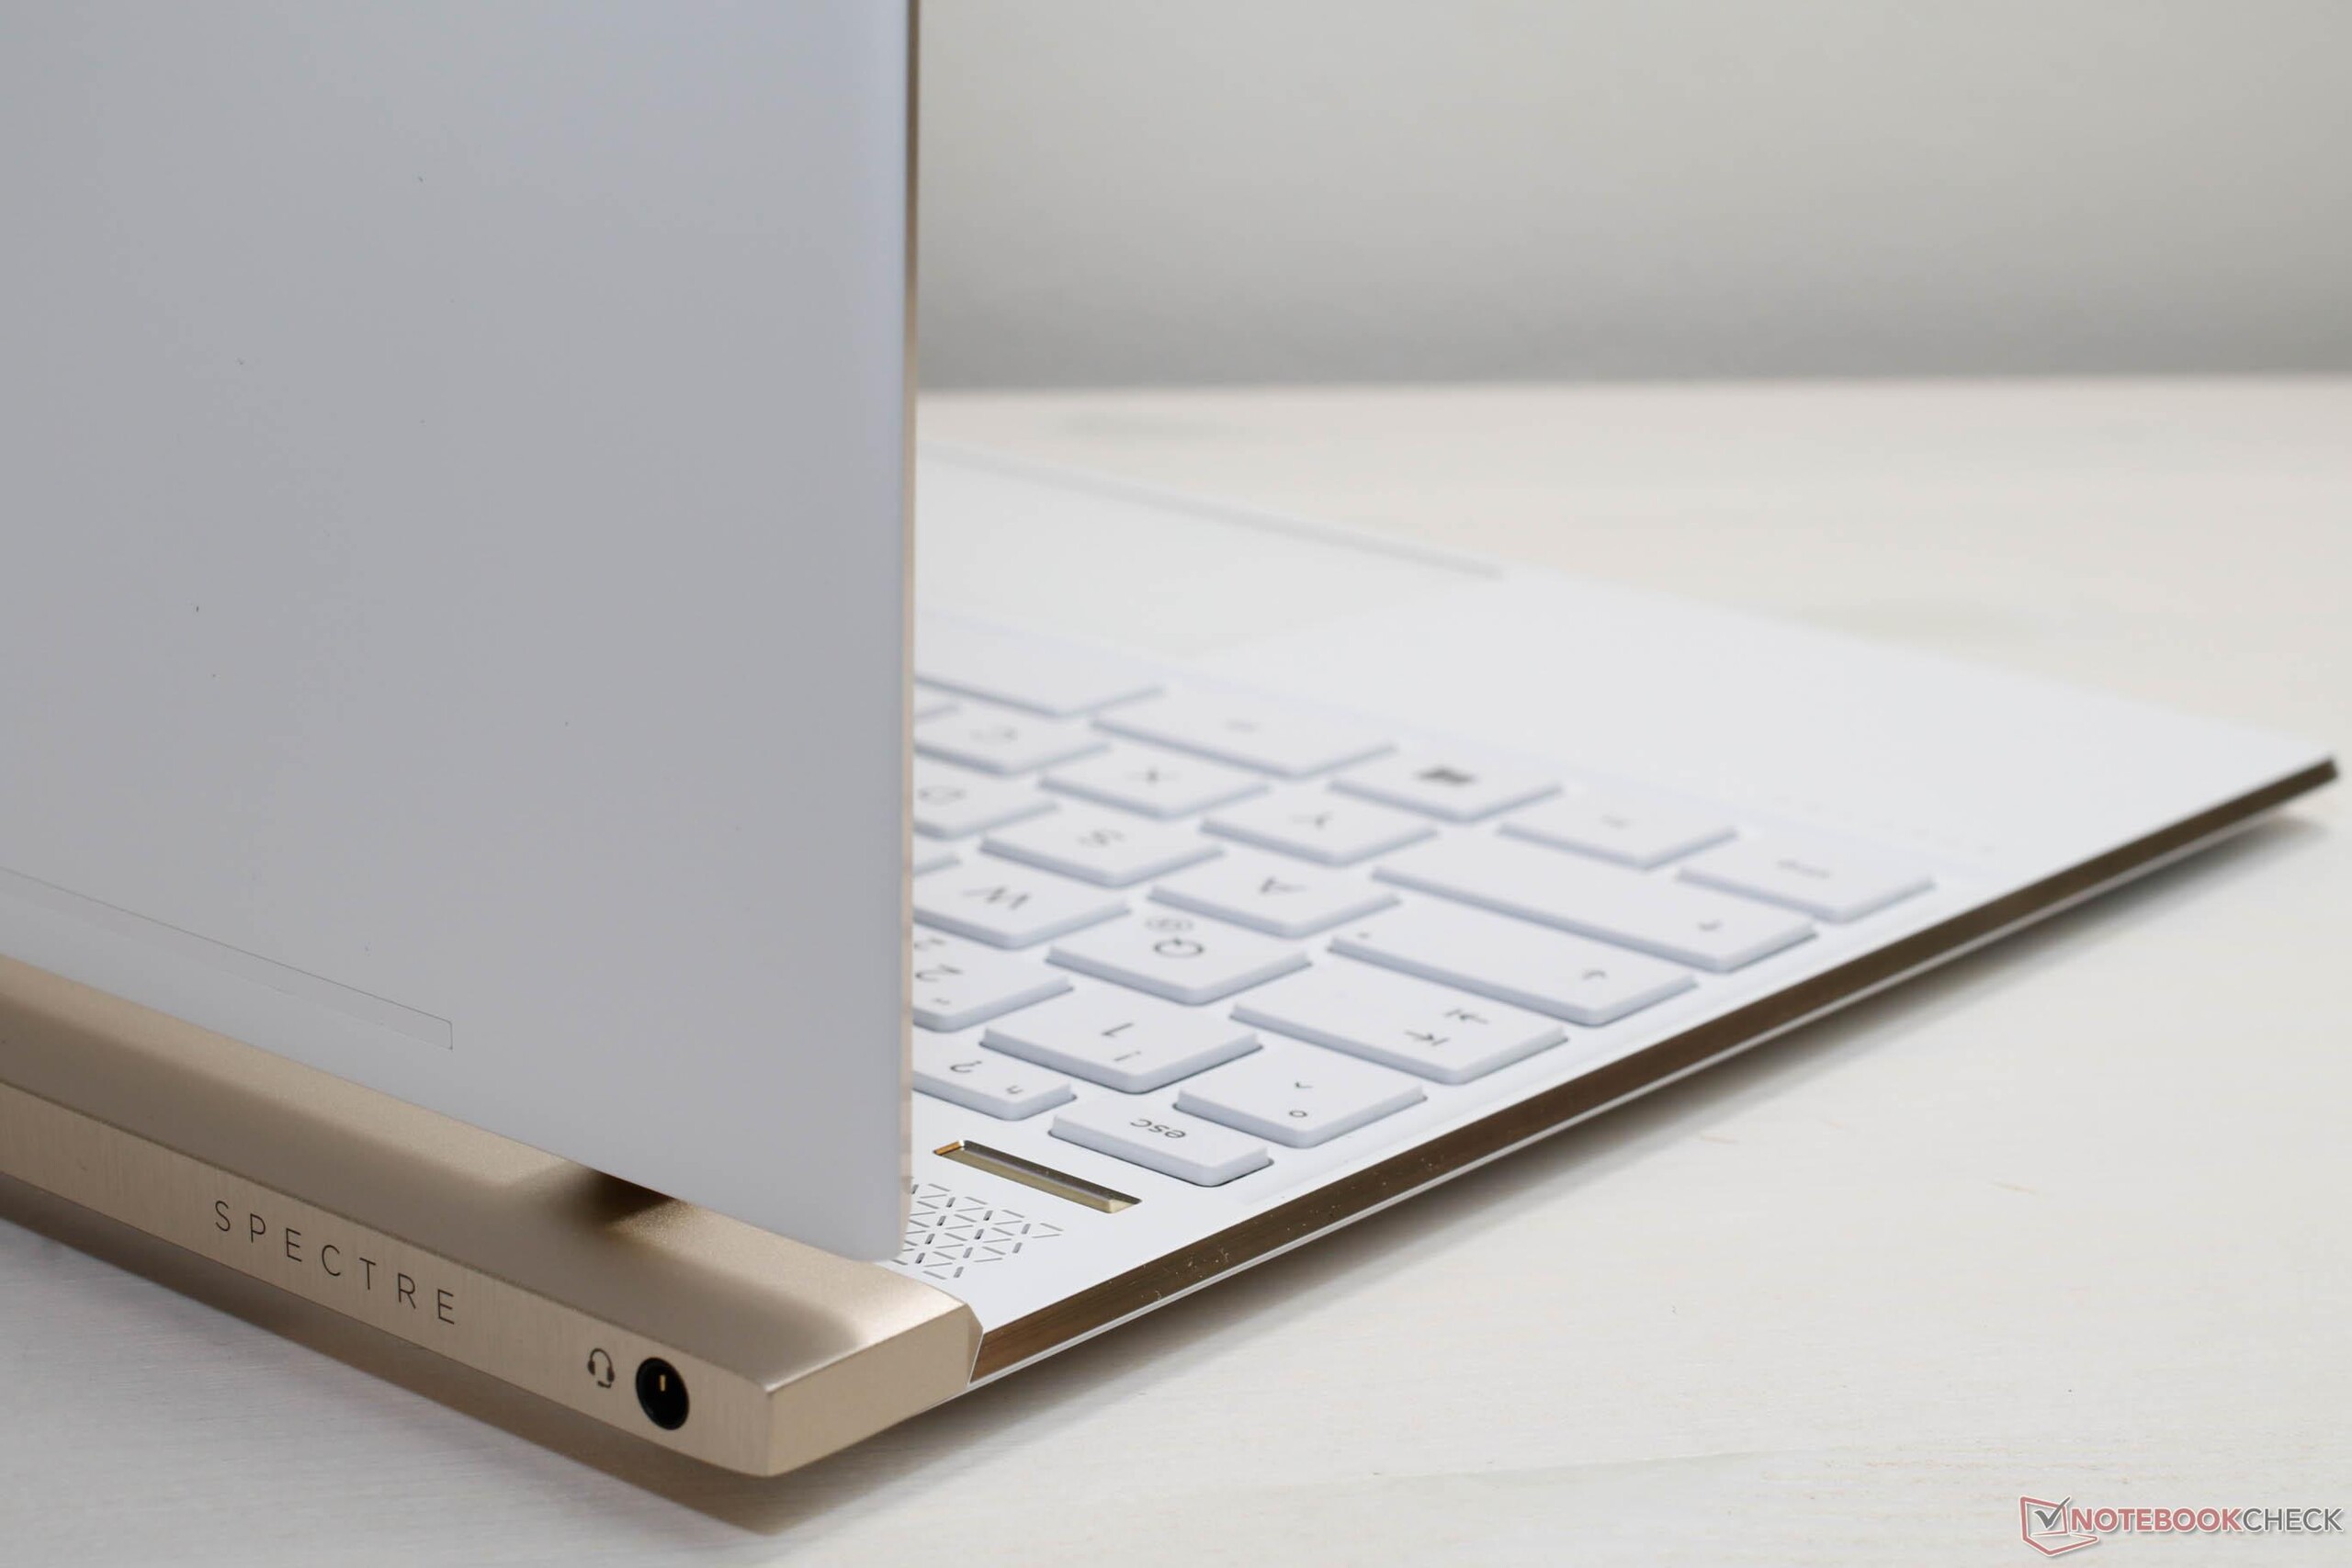
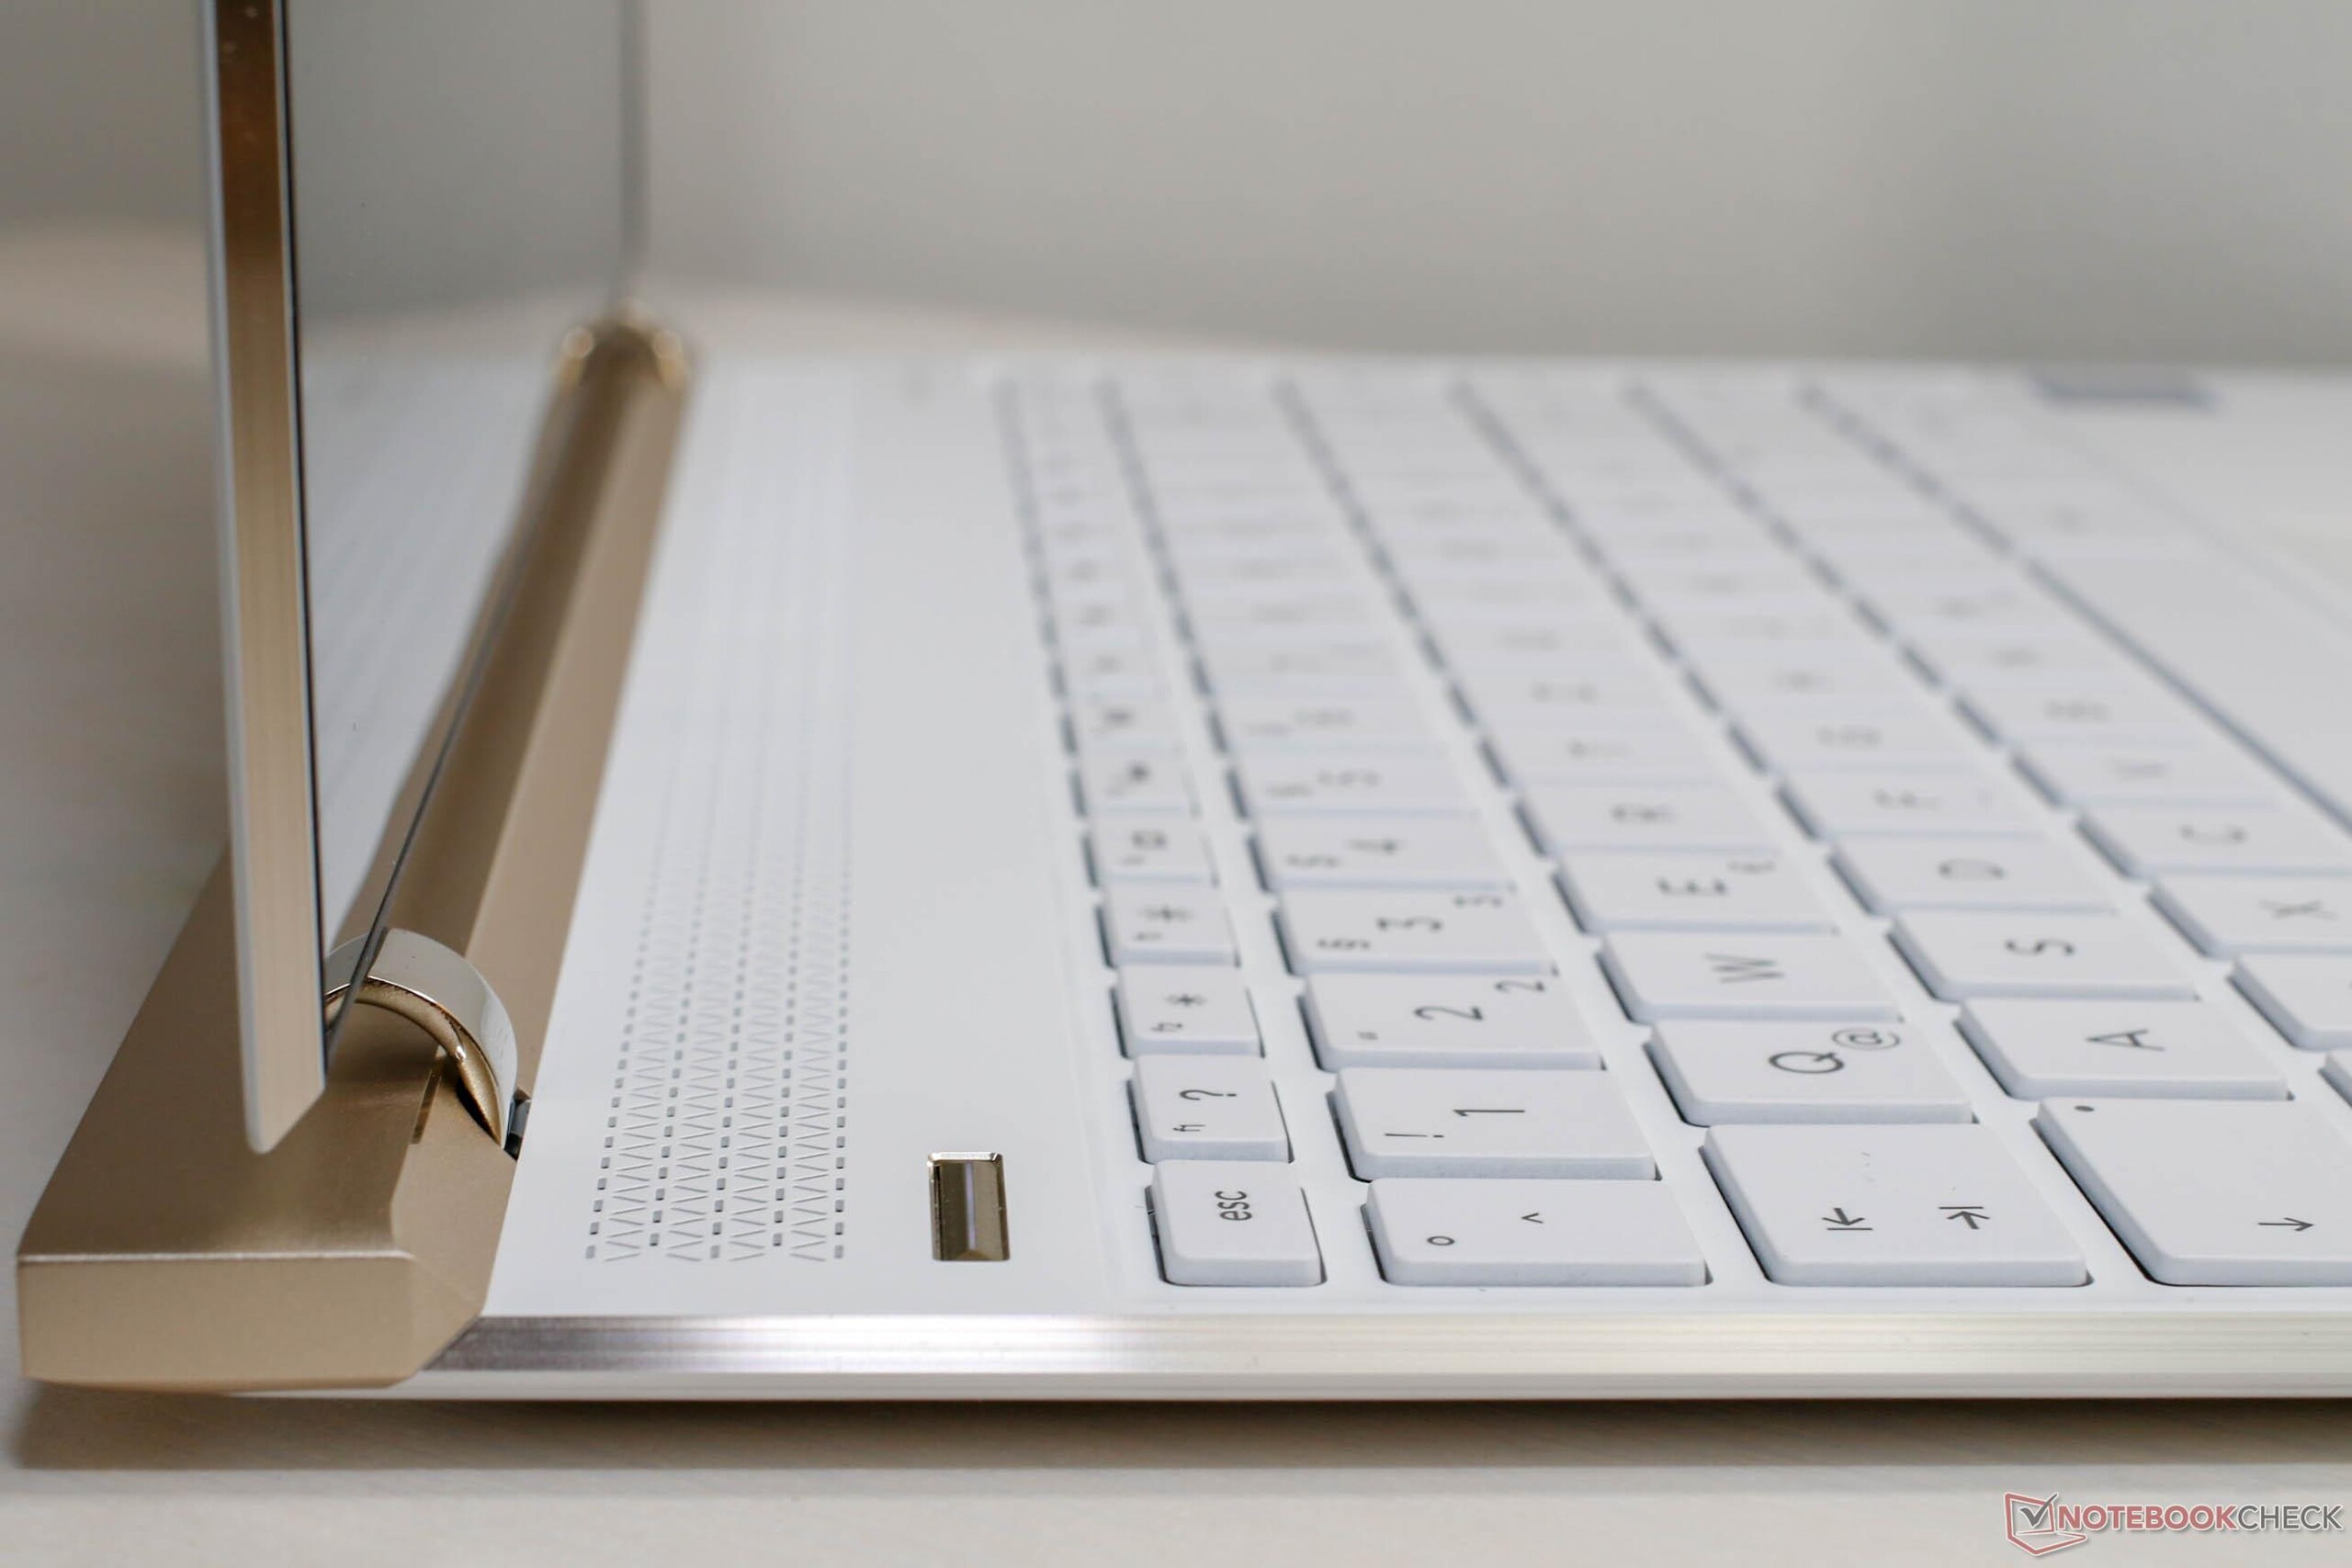
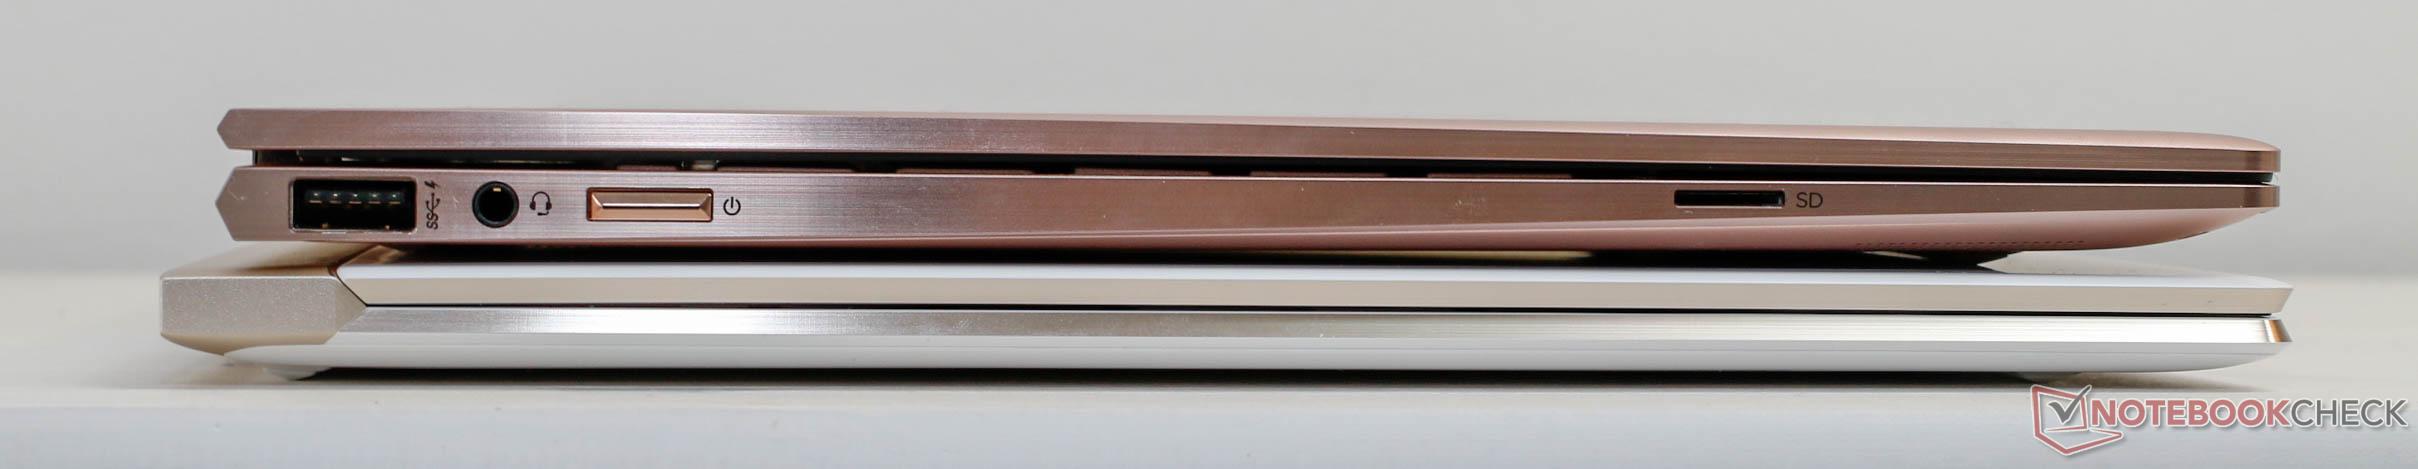
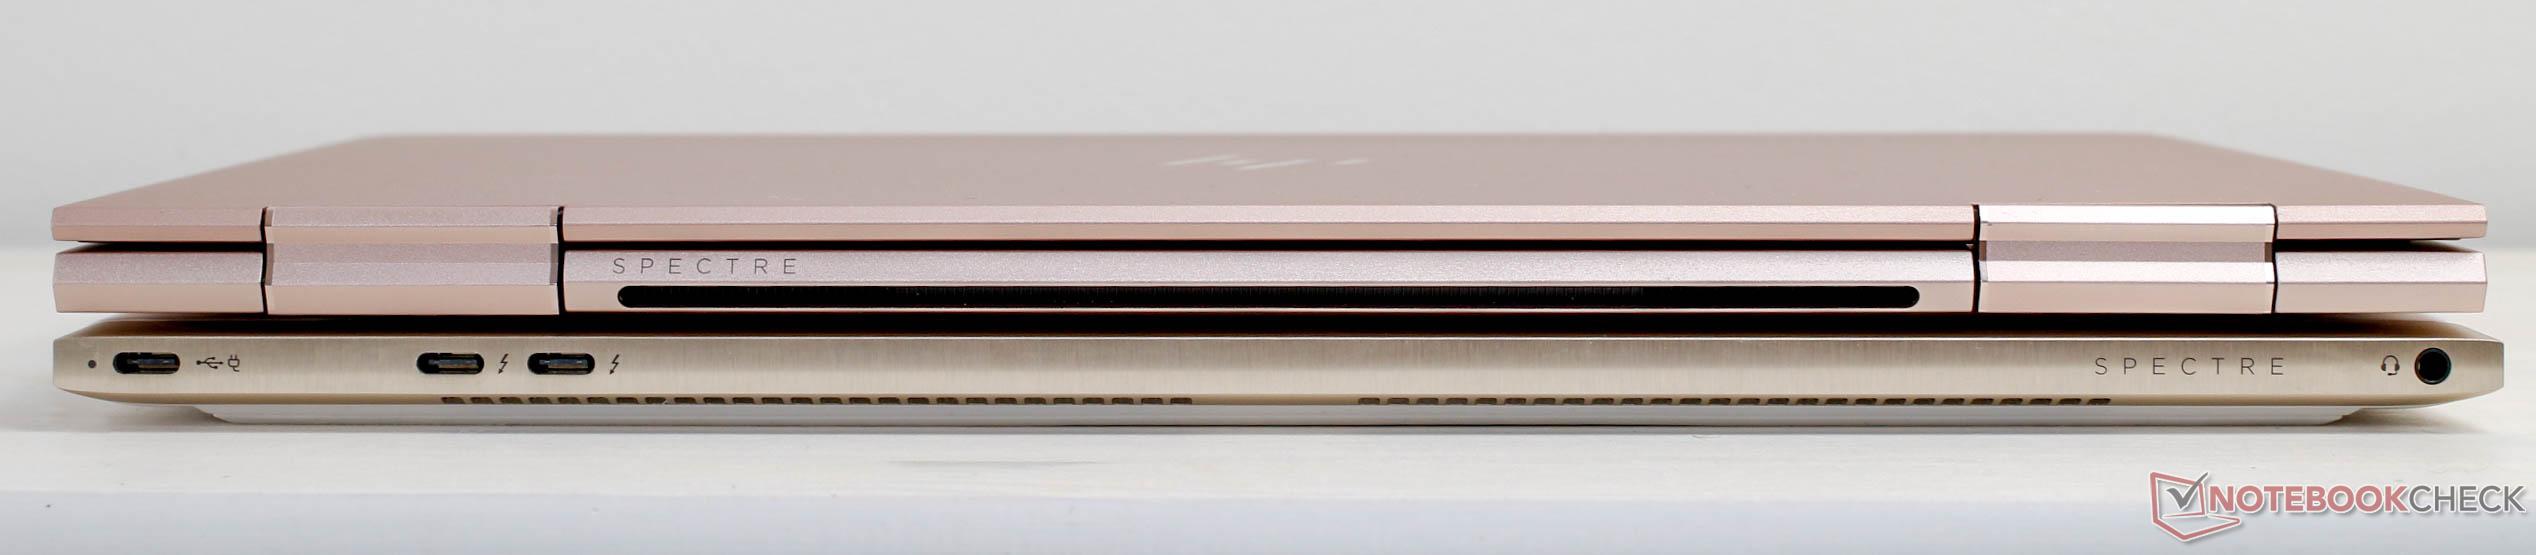
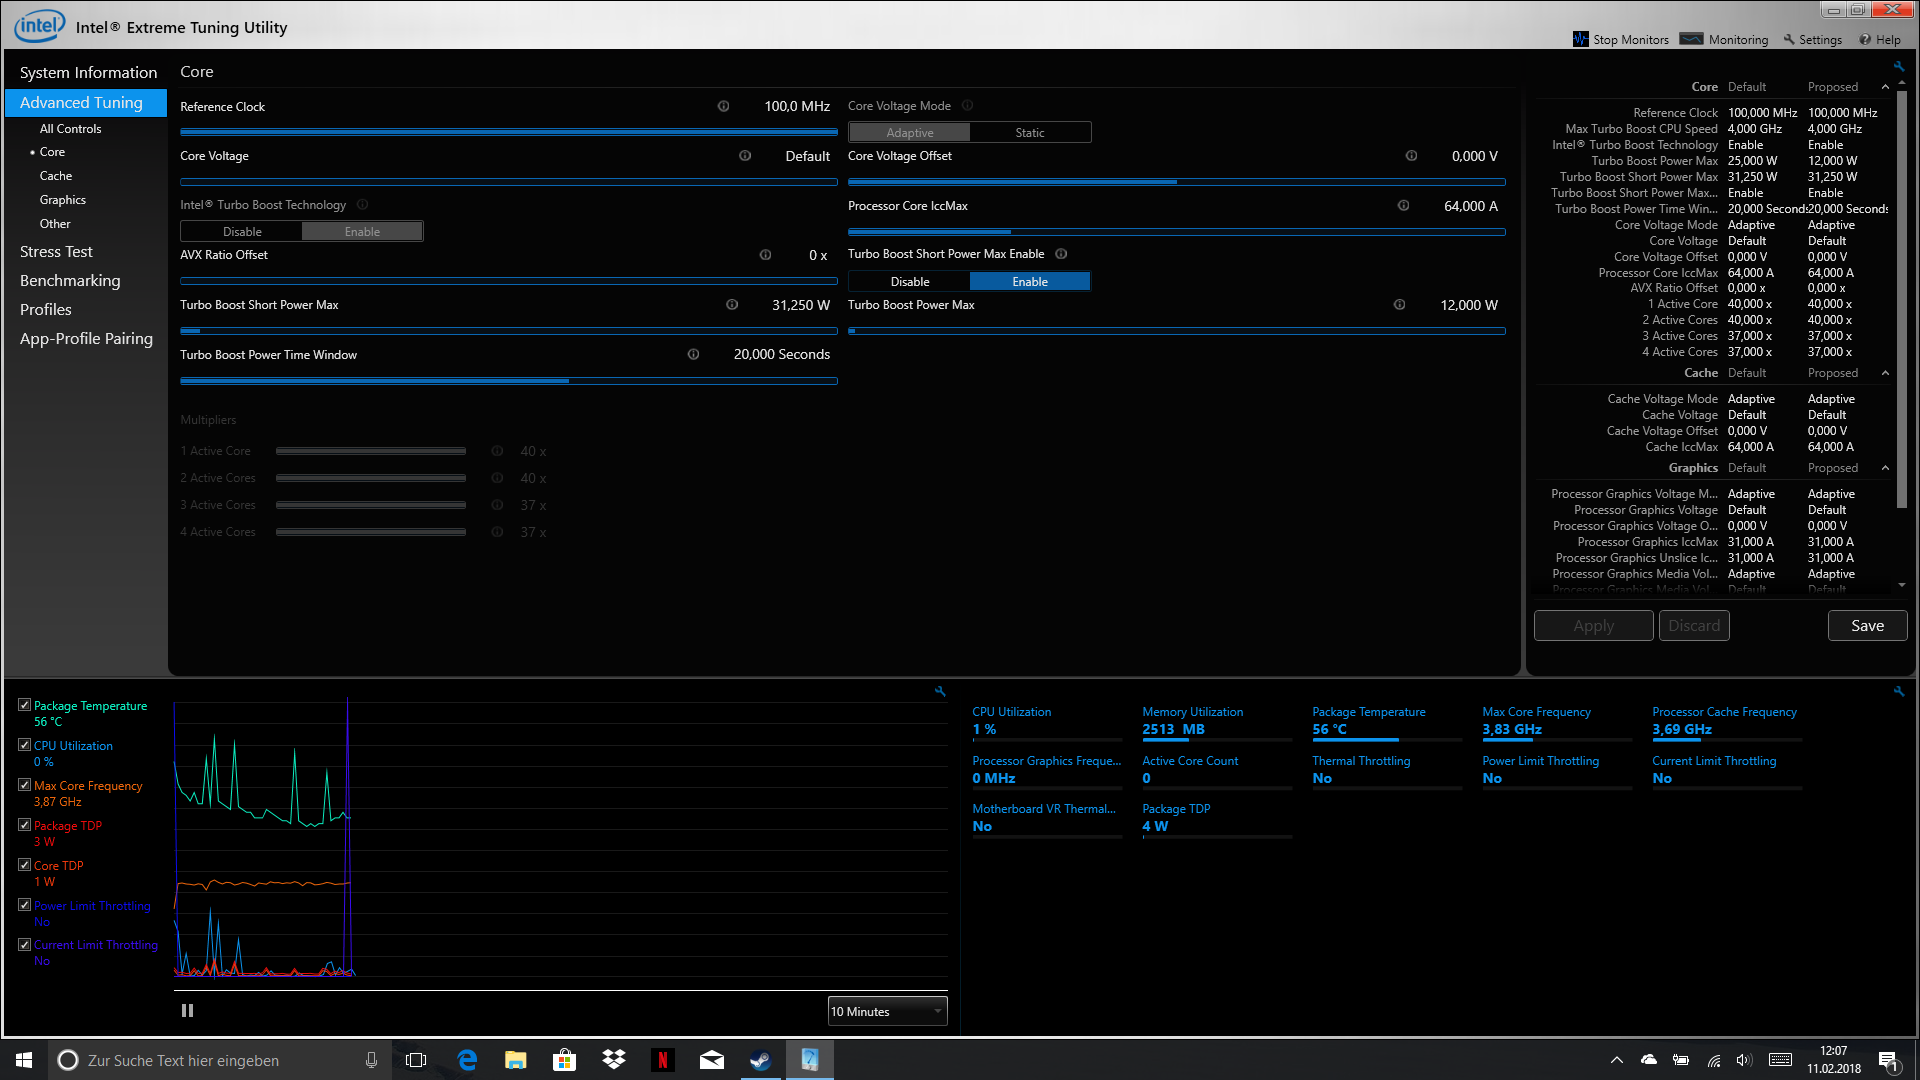
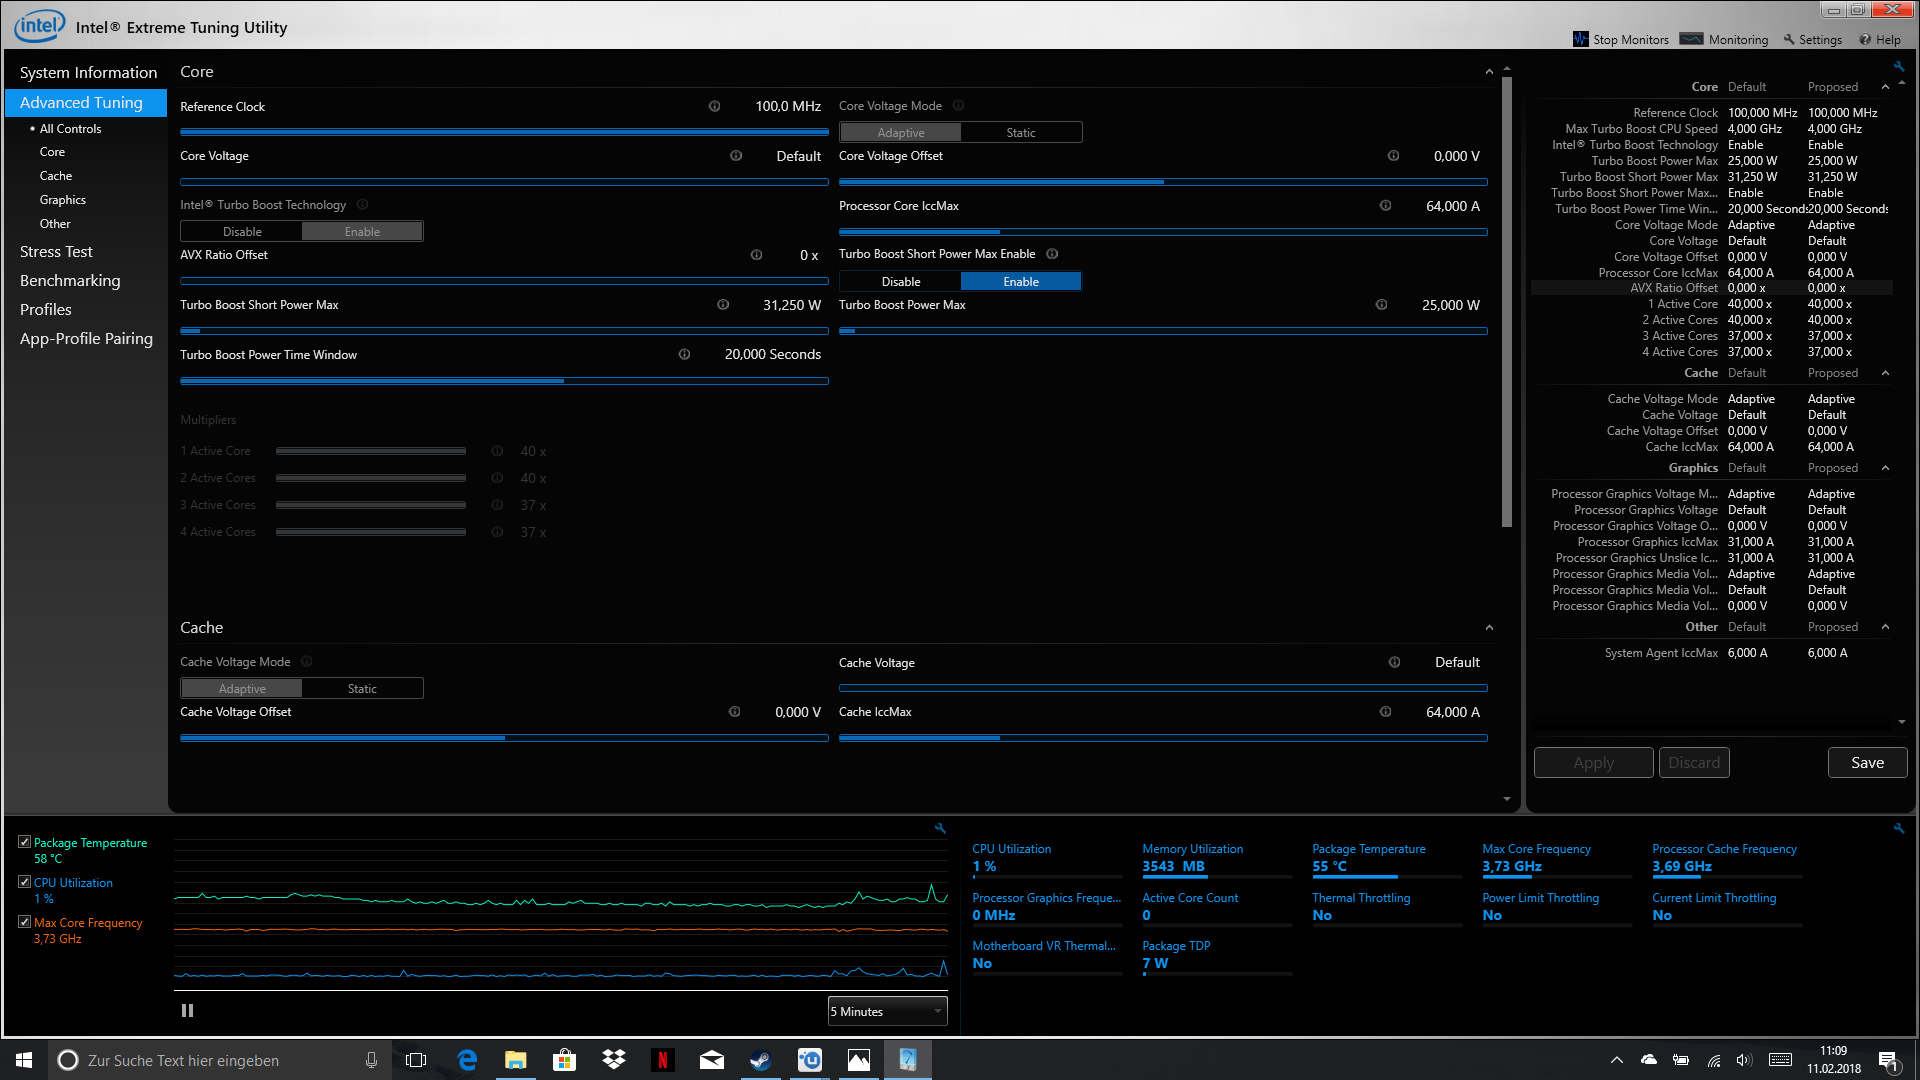
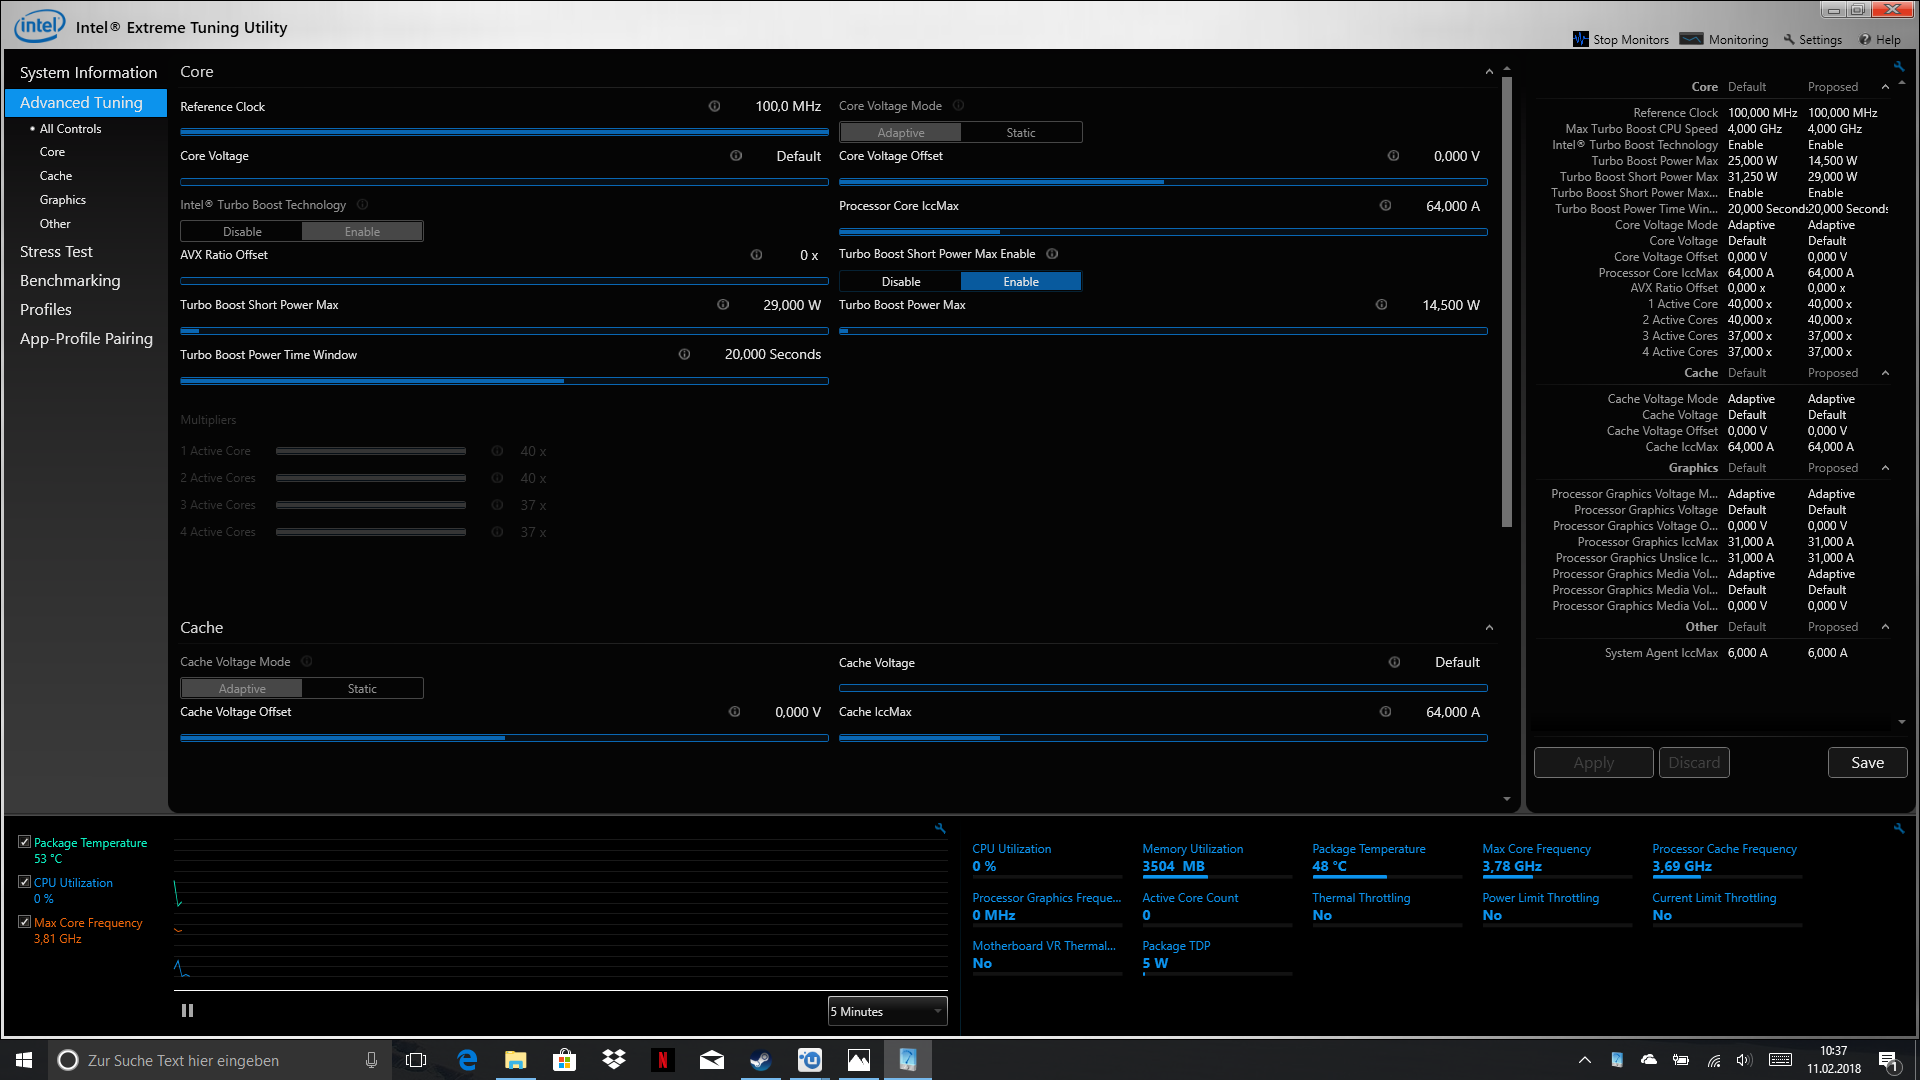
Det faktum att HP har gått balansgång mellan bra prestanda, bärbarhet och design blir tydlig i dom många kompromisser tillverkaren har fått göra. Det tunna höljet verkar tillräckligt robust, men kan ändå lätt böjas. Ju tunnare hölje desto svårare är det att förse tillräckligt med kylning åt enheten. Detta är troligen anledningen till att HP valt en så återhållsam inställning för turbo boost. Detta har å andra sidan haft en positiv inverkan på energiförbrukningen. Men trots det så begränsar batteriet på 43.7 Wh kraftigt enhetens bärbarhet och Spectre 13 kommer inte stå sig en hel arbetsdag i Full-HD, för att inte tala om i 4K. Den begränsade öppningsvinkeln kombinerat med den reflekterande skärmen kan också påverka enhetens bärbarhet, särskilt för användare som hoppas på att använda den i sitt knä på tåget, till exempel. Vi noterade inte något spoltjut under vår testperiod.
HP only offers very good configuration options for the Spectre 13, although the variety of available configurations could be a little larger. You can choose between a Full-HD or 4K display, NVMe M.2 SSD with 360 GB, 512 GB and 1 TB, and either 8 or 16 GB of RAM (DDR3-2133). Unfortunately, HP does not enable us to put together a selection of the available components ourselves.
As mentioned above, the HP Spectre x360 offers more stability and mobility (battery runtime and opening angle). If you are looking for a light, slim, and high-quality laptop that also looks great, the Spectre 13 from HP might be for you.
HP Spectre 13-af033ng
- 02/27/2018 v6 (old)
Daniel Puschina
Price comparison
