Test: Acer Predator 17 (7700HQ, GTX 1070, UHD) (sammanfattning)

| SD Card Reader | |
| average JPG Copy Test (av. of 3 runs) | |
| Schenker XMG U727 2017 | |
| MSI GT72VR 7RE-433 | |
| Acer Predator 17 X GX-792-76DL | |
| Acer Predator 17 G9-793-70PJ | |
| Asus G752VS-XB78K | |
| maximum AS SSD Seq Read Test (1GB) | |
| Schenker XMG U727 2017 | |
| MSI GT72VR 7RE-433 | |
| Acer Predator 17 X GX-792-76DL | |
| Acer Predator 17 G9-793-70PJ | |
| Asus G752VS-XB78K | |
| Networking | |
| iperf3 transmit AX12 | |
| Acer Predator 17 X GX-792-76DL | |
| Acer Predator 17 G9-793-70PJ | |
| MSI GT72VR 7RE-433 | |
| Schenker XMG U727 2017 | |
| iperf3 receive AX12 | |
| Acer Predator 17 G9-793-70PJ | |
| Schenker XMG U727 2017 | |
| Acer Predator 17 X GX-792-76DL | |
| MSI GT72VR 7RE-433 | |
| |||||||||||||||||||||||||
Distribution av ljusstyrkan: 84 %
Mitt på batteriet: 343 cd/m²
Kontrast: 1183:1 (Svärta: 0.29 cd/m²)
ΔE ColorChecker Calman: 4.01 | ∀{0.5-29.43 Ø4.72}
ΔE Greyscale Calman: 4.7 | ∀{0.09-98 Ø4.97}
100% sRGB (Argyll 1.6.3 3D)
88% AdobeRGB 1998 (Argyll 1.6.3 3D)
99.1% AdobeRGB 1998 (Argyll 3D)
99.9% sRGB (Argyll 3D)
86.4% Display P3 (Argyll 3D)
Gamma: 2.4
CCT: 6451 K
| Acer Predator 17 G9-793-70PJ AU Optronics B173ZAN01.0 (AUO109B), 3840x2160 | MSI GT72VR 7RE-433 Chi Mei N173HHE-G32 (CMN1747), 1920x1080 | Asus G752VS-XB78K LG Philips LP173WF4-SPF3 (LGD04E8), 1920x1080 | Acer Predator 17 X GX-792-76DL LP173WF4-SPF5 (LGD056D), 1920x1080 | Schenker XMG U727 2017 AU Optronics B173ZAN01.0 (AUO109B), 3840x2160 | |
|---|---|---|---|---|---|
| Display | -23% | -25% | -26% | 0% | |
| Display P3 Coverage (%) | 86.4 | 68.3 -21% | 66.9 -23% | 66 -24% | 86.6 0% |
| sRGB Coverage (%) | 99.9 | 86.7 -13% | 85.2 -15% | 83.7 -16% | 99.9 0% |
| AdobeRGB 1998 Coverage (%) | 99.1 | 63.4 -36% | 62.3 -37% | 61.2 -38% | 99.5 0% |
| Response Times | 58% | 19% | 1% | 2% | |
| Response Time Grey 50% / Grey 80% * (ms) | 50 ? | 29 ? 42% | 38 ? 24% | 45 ? 10% | 44 ? 12% |
| Response Time Black / White * (ms) | 25.6 ? | 7 ? 73% | 22 ? 14% | 28 ? -9% | 28 ? -9% |
| PWM Frequency (Hz) | |||||
| Screen | -44% | -6% | -9% | 8% | |
| Brightness middle (cd/m²) | 343 | 299 -13% | 328 -4% | 380 11% | 362 6% |
| Brightness (cd/m²) | 328 | 277 -16% | 317 -3% | 362 10% | 344 5% |
| Brightness Distribution (%) | 84 | 87 4% | 88 5% | 91 8% | 85 1% |
| Black Level * (cd/m²) | 0.29 | 0.27 7% | 0.3 -3% | 0.37 -28% | 0.35 -21% |
| Contrast (:1) | 1183 | 1107 -6% | 1093 -8% | 1027 -13% | 1034 -13% |
| Colorchecker dE 2000 * | 4.01 | 9.65 -141% | 3.74 7% | 4.12 -3% | 2.46 39% |
| Colorchecker dE 2000 max. * | 6.03 | 15.43 -156% | 8.97 -49% | 8.19 -36% | 4.26 29% |
| Greyscale dE 2000 * | 4.7 | 9.68 -106% | 2.67 43% | 3.95 16% | 2.9 38% |
| Gamma | 2.4 92% | 1.89 116% | 2.41 91% | 2.47 89% | 2.31 95% |
| CCT | 6451 101% | 11652 56% | 6861 95% | 6539 99% | 6120 106% |
| Color Space (Percent of AdobeRGB 1998) (%) | 88 | 75 -15% | 56 -36% | 55 -37% | 88 0% |
| Color Space (Percent of sRGB) (%) | 100 | 100 0% | 85 -15% | 84 -16% | 100 0% |
| Totalt genomsnitt (program/inställningar) | -3% /
-26% | -4% /
-7% | -11% /
-11% | 3% /
6% |
* ... mindre är bättre
Visa svarstider
| ↔ Svarstid svart till vitt | ||
|---|---|---|
| 25.6 ms ... stiga ↗ och falla ↘ kombinerat | ↗ 11.2 ms stiga | 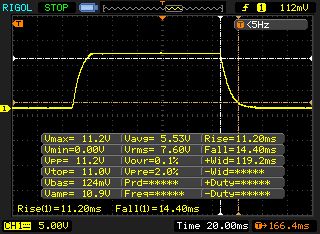 |
| ↘ 14.4 ms hösten | ||
| Skärmen visar relativt långsamma svarsfrekvenser i våra tester och kan vara för långsam för spelare. I jämförelse sträcker sig alla testade enheter från 0.1 (minst) till 240 (maximalt) ms. » 61 % av alla enheter är bättre. Detta innebär att den uppmätta svarstiden är sämre än genomsnittet av alla testade enheter (19.8 ms). | ||
| ↔ Svarstid 50 % grått till 80 % grått | ||
| 50 ms ... stiga ↗ och falla ↘ kombinerat | ↗ 24.4 ms stiga | 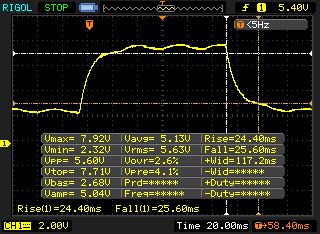 |
| ↘ 25.6 ms hösten | ||
| Skärmen visar långsamma svarsfrekvenser i våra tester och kommer att vara otillfredsställande för spelare. I jämförelse sträcker sig alla testade enheter från 0.165 (minst) till 636 (maximalt) ms. » 86 % av alla enheter är bättre. Detta innebär att den uppmätta svarstiden är sämre än genomsnittet av alla testade enheter (31 ms). | ||
Skärmflimmer / PWM (Puls-Width Modulation)
| Skärmflimmer / PWM upptäcktes inte | 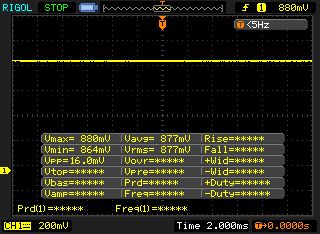 | ||
Som jämförelse: 52 % av alla testade enheter använder inte PWM för att dämpa skärmen. Om PWM upptäcktes mättes ett medelvärde av 7772 (minst: 5 - maximum: 343500) Hz. | |||
| Cinebench R15 | |
| CPU Single 64Bit | |
| Schenker XMG U727 2017 | |
| Acer Predator 17 X GX-792-76DL | |
| Asus G752VS-XB78K | |
| MSI GT72VR 7RE-433 | |
| Acer Predator 17 G9-793-70PJ | |
| CPU Multi 64Bit | |
| Schenker XMG U727 2017 | |
| Acer Predator 17 X GX-792-76DL | |
| Asus G752VS-XB78K | |
| MSI GT72VR 7RE-433 | |
| Acer Predator 17 G9-793-70PJ | |
| Cinebench R11.5 | |
| CPU Single 64Bit | |
| Schenker XMG U727 2017 | |
| Acer Predator 17 X GX-792-76DL | |
| MSI GT72VR 7RE-433 | |
| Acer Predator 17 G9-793-70PJ | |
| Asus G752VS-XB78K | |
| CPU Multi 64Bit | |
| Schenker XMG U727 2017 | |
| Acer Predator 17 X GX-792-76DL | |
| Asus G752VS-XB78K | |
| MSI GT72VR 7RE-433 | |
| Acer Predator 17 G9-793-70PJ | |
| PCMark 8 | |
| Home Score Accelerated v2 | |
| Acer Predator 17 X GX-792-76DL | |
| Asus G752VS-XB78K | |
| MSI GT72VR 7RE-433 | |
| Schenker XMG U727 2017 | |
| Acer Predator 17 G9-793-70PJ | |
| Work Score Accelerated v2 | |
| Acer Predator 17 X GX-792-76DL | |
| Asus G752VS-XB78K | |
| MSI GT72VR 7RE-433 | |
| Schenker XMG U727 2017 | |
| Acer Predator 17 G9-793-70PJ | |
| PCMark 7 - Score | |
| Schenker XMG U727 2017 | |
| Acer Predator 17 X GX-792-76DL | |
| Asus G752VS-XB78K | |
| Acer Predator 17 G9-793-70PJ | |
| MSI GT72VR 7RE-433 | |
| PCMark 7 Score | 6692 poäng | |
| PCMark 8 Home Score Accelerated v2 | 4395 poäng | |
| PCMark 8 Work Score Accelerated v2 | 4541 poäng | |
Hjälp | ||
| Acer Predator 17 G9-793-70PJ Toshiba NVMe THNSN5512GPU7 | MSI GT72VR 7RE-433 Kingston RBU-SNS8152S3256GG5 | Asus G752VS-XB78K Toshiba NVMe THNSN5512GPU7 | Acer Predator 17 X GX-792-76DL Toshiba NVMe THNSN5512GPU7 | Schenker XMG U727 2017 Samsung SM961 MZVPW256 m.2 PCI-e | |
|---|---|---|---|---|---|
| AS SSD | -45% | 5% | 38% | ||
| Seq Read (MB/s) | 2237 | 509 -77% | 2261 1% | 2746 23% | |
| Seq Write (MB/s) | 1230 | 282.1 -77% | 1338 9% | 1445 17% | |
| 4K Read (MB/s) | 37.51 | 40.04 7% | 39.52 5% | 56.8 51% | |
| 4K Write (MB/s) | 120.8 | 95.8 -21% | 133.8 11% | 175.9 46% | |
| Score Total (Points) | 2547 | 1142 -55% | 2581 1% | 3938 55% |

| 3DMark | |
| 1920x1080 Fire Strike Graphics | |
| Acer Predator 17 X GX-792-76DL | |
| Schenker XMG U727 2017 | |
| MSI GT72VR 7RE-433 | |
| Acer Predator 17 G9-793-70PJ | |
| Asus G752VS-XB78K | |
| 2560x1440 Time Spy Graphics | |
| Acer Predator 17 X GX-792-76DL | |
| Schenker XMG U727 2017 | |
| MSI GT72VR 7RE-433 | |
| Asus G752VS-XB78K | |
| Acer Predator 17 G9-793-70PJ | |
| 3DMark 11 - 1280x720 Performance GPU | |
| Schenker XMG U727 2017 | |
| Acer Predator 17 X GX-792-76DL | |
| MSI GT72VR 7RE-433 | |
| Acer Predator 17 G9-793-70PJ | |
| Asus G752VS-XB78K | |
| 3DMark 11 Performance | 16430 poäng | |
| 3DMark Cloud Gate Standard Score | 27050 poäng | |
| 3DMark Fire Strike Score | 13353 poäng | |
| 3DMark Time Spy Score | 5059 poäng | |
Hjälp | ||
| låg | med. | hög | ultra | 4K | |
|---|---|---|---|---|---|
| The Witcher 3 (2015) | 104 | 59.4 | 38.7 | ||
| For Honor (2017) | 142 | 106 | 43.6 | ||
| Ghost Recon Wildlands (2017) | 84.6 | 49.5 | 32.3 | ||
| Mass Effect Andromeda (2017) | 77.7 | 68.9 | 31.6 | ||
| Warhammer 40.000: Dawn of War III (2017) | 57.8 | 51.4 | 18.2 | ||
| Prey (2017) | 134 | 129 | 46.7 |
Ljudnivå
| Låg belastning |
| 32 / 35 / 38 dB(A) |
| Hårddisk |
| 35 dB(A) |
| Hög belastning |
| 42 / 50 dB(A) |
 | ||
30 dB tyst 40 dB(A) hörbar 50 dB(A) högt ljud |
||
min: | ||
| Acer Predator 17 G9-793-70PJ i7-7700HQ, GeForce GTX 1070 Mobile | MSI GT72VR 7RE-433 i7-7700HQ, GeForce GTX 1070 Mobile | Asus G752VS-XB78K 6820HK, GeForce GTX 1070 Mobile | Acer Predator 17 X GX-792-76DL i7-7820HK, GeForce GTX 1080 Mobile | Schenker XMG U727 2017 i7-7700K, GeForce GTX 1080 Mobile | |
|---|---|---|---|---|---|
| Noise | 4% | 7% | 1% | -2% | |
| av / miljö * (dB) | 31 | 31 -0% | 30 3% | 30 3% | 30 3% |
| Idle Minimum * (dB) | 32 | 34 -6% | 31 3% | 33 -3% | 31 3% |
| Idle Average * (dB) | 35 | 35 -0% | 32 9% | 35 -0% | 34 3% |
| Idle Maximum * (dB) | 38 | 37 3% | 33 13% | 37 3% | 37 3% |
| Load Average * (dB) | 42 | 37 12% | 40 5% | 40 5% | 44 -5% |
| Witcher 3 ultra * (dB) | 44 | 51 -16% | |||
| Load Maximum * (dB) | 50 | 44 12% | 47 6% | 50 -0% | 52 -4% |
* ... mindre är bättre
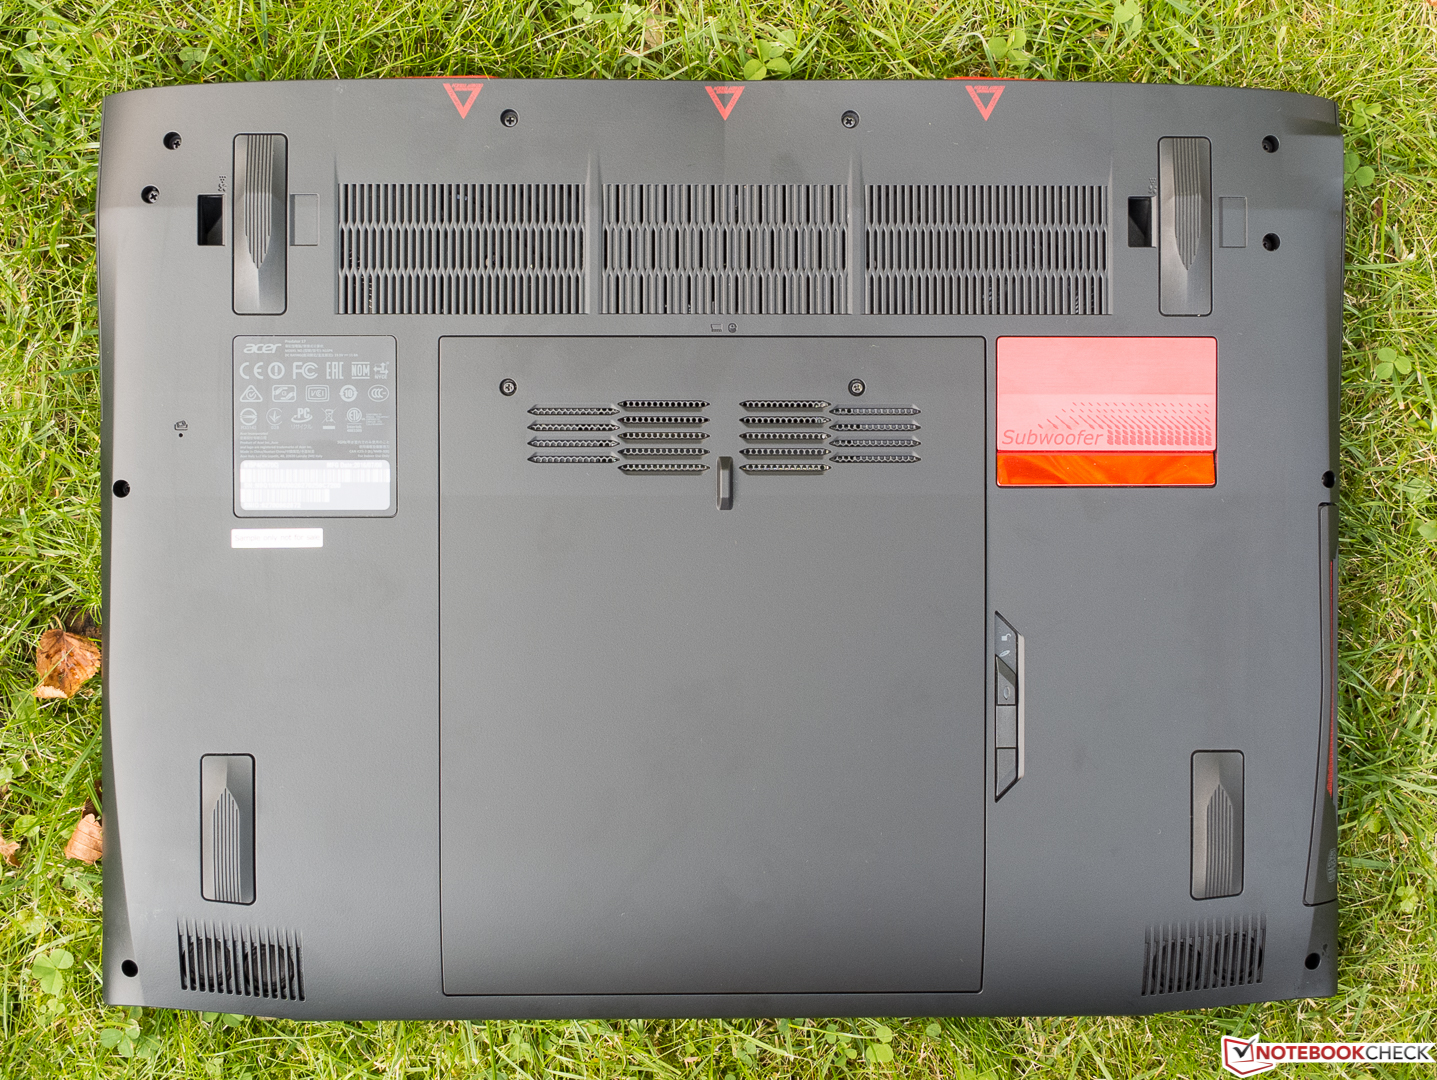
(+) Den maximala temperaturen på ovansidan är 39.1 °C / 102 F, jämfört med genomsnittet av 40.4 °C / 105 F , allt från 21.2 till 68.8 °C för klassen Gaming.
(±) Botten värms upp till maximalt 42.1 °C / 108 F, jämfört med genomsnittet av 43.2 °C / 110 F
(+) Vid tomgångsbruk är medeltemperaturen för ovansidan 25.3 °C / 78 F, jämfört med enhetsgenomsnittet på 33.9 °C / ### class_avg_f### F.
(±) När du spelar The Witcher 3 är medeltemperaturen för ovansidan 33.3 °C / 92 F, jämfört med enhetsgenomsnittet på 33.9 °C / ## #class_avg_f### F.
(+) Handledsstöden och pekplattan är kallare än hudtemperaturen med maximalt 31.8 °C / 89.2 F och är därför svala att ta på.
(-) Medeltemperaturen för handledsstödsområdet på liknande enheter var 28.8 °C / 83.8 F (-3 °C / -5.4 F).
| Acer Predator 17 G9-793-70PJ i7-7700HQ, GeForce GTX 1070 Mobile | MSI GT72VR 7RE-433 i7-7700HQ, GeForce GTX 1070 Mobile | Asus G752VS-XB78K 6820HK, GeForce GTX 1070 Mobile | Acer Predator 17 X GX-792-76DL i7-7820HK, GeForce GTX 1080 Mobile | Schenker XMG U727 2017 i7-7700K, GeForce GTX 1080 Mobile | |
|---|---|---|---|---|---|
| Heat | -5% | -9% | -14% | -27% | |
| Maximum Upper Side * (°C) | 39.1 | 41.5 -6% | 42.9 -10% | 44.2 -13% | 47.5 -21% |
| Maximum Bottom * (°C) | 42.1 | 50.6 -20% | 41.5 1% | 43 -2% | 56 -33% |
| Idle Upper Side * (°C) | 27.9 | 26.4 5% | 31.6 -13% | 32.4 -16% | 34.5 -24% |
| Idle Bottom * (°C) | 26.1 | 25.4 3% | 29.5 -13% | 32.8 -26% | 33.6 -29% |
* ... mindre är bättre
Acer Predator 17 G9-793-70PJ ljudanalys
(+) | högtalare kan spela relativt högt (87 dB)
Bas 100 - 315 Hz
(±) | reducerad bas - i genomsnitt 5.5% lägre än medianen
(±) | linjäriteten för basen är genomsnittlig (8% delta till föregående frekvens)
Mellan 400 - 2000 Hz
(+) | balanserad mellan - endast 2.9% från medianen
(+) | mids är linjära (3.5% delta till föregående frekvens)
Högsta 2 - 16 kHz
(±) | reducerade toppar - i genomsnitt 5.2% lägre än medianen
(+) | toppar är linjära (6.2% delta till föregående frekvens)
Totalt 100 - 16 000 Hz
(+) | det totala ljudet är linjärt (10.3% skillnad mot median)
Jämfört med samma klass
» 6% av alla testade enheter i den här klassen var bättre, 2% liknande, 93% sämre
» Den bästa hade ett delta på 6%, genomsnittet var 18%, sämst var 132%
Jämfört med alla testade enheter
» 5% av alla testade enheter var bättre, 1% liknande, 94% sämre
» Den bästa hade ett delta på 4%, genomsnittet var 24%, sämst var 134%
MSI GT72VR 7RE-433 ljudanalys
(+) | högtalare kan spela relativt högt (87 dB)
Bas 100 - 315 Hz
(±) | reducerad bas - i genomsnitt 5.4% lägre än medianen
(±) | linjäriteten för basen är genomsnittlig (11.3% delta till föregående frekvens)
Mellan 400 - 2000 Hz
(±) | högre mellan - i genomsnitt 5% högre än median
(+) | mids är linjära (4.1% delta till föregående frekvens)
Högsta 2 - 16 kHz
(+) | balanserade toppar - endast 4.7% från medianen
(+) | toppar är linjära (5.7% delta till föregående frekvens)
Totalt 100 - 16 000 Hz
(+) | det totala ljudet är linjärt (11.7% skillnad mot median)
Jämfört med samma klass
» 11% av alla testade enheter i den här klassen var bättre, 4% liknande, 85% sämre
» Den bästa hade ett delta på 6%, genomsnittet var 18%, sämst var 132%
Jämfört med alla testade enheter
» 8% av alla testade enheter var bättre, 3% liknande, 89% sämre
» Den bästa hade ett delta på 4%, genomsnittet var 24%, sämst var 134%
| Av/Standby | |
| Låg belastning | |
| Hög belastning |
|
Förklaring:
min: | |
| Acer Predator 17 G9-793-70PJ i7-7700HQ, GeForce GTX 1070 Mobile | MSI GT72VR 7RE-433 i7-7700HQ, GeForce GTX 1070 Mobile | Asus G752VS-XB78K 6820HK, GeForce GTX 1070 Mobile | Acer Predator 17 X GX-792-76DL i7-7820HK, GeForce GTX 1080 Mobile | Schenker XMG U727 2017 i7-7700K, GeForce GTX 1080 Mobile | |
|---|---|---|---|---|---|
| Power Consumption | 16% | 5% | -7% | -43% | |
| Idle Minimum * (Watt) | 23 | 20 13% | 24 -4% | 27 -17% | 32 -39% |
| Idle Average * (Watt) | 33 | 27 18% | 31 6% | 32 3% | 43 -30% |
| Idle Maximum * (Watt) | 40 | 31 22% | 36 10% | 41 -2% | 51 -27% |
| Load Average * (Watt) | 94 | 86 9% | 94 -0% | 102 -9% | 138 -47% |
| Witcher 3 ultra * (Watt) | 177 | 279 -58% | |||
| Load Maximum * (Watt) | 228 | 184 19% | 204 11% | 248 -9% | 350 -54% |
* ... mindre är bättre
| Acer Predator 17 G9-793-70PJ i7-7700HQ, GeForce GTX 1070 Mobile, 88 Wh | MSI GT72VR 7RE-433 i7-7700HQ, GeForce GTX 1070 Mobile, 83 Wh | Asus G752VS-XB78K 6820HK, GeForce GTX 1070 Mobile, 90 Wh | Acer Predator 17 X GX-792-76DL i7-7820HK, GeForce GTX 1080 Mobile, 88.8 Wh | Schenker XMG U727 2017 i7-7700K, GeForce GTX 1080 Mobile, 89 Wh | |
|---|---|---|---|---|---|
| Batteridrifttid | 1% | -5% | 4% | -15% | |
| Reader / Idle (h) | 5.4 | 5.3 -2% | 5.2 -4% | 5.2 -4% | 3.7 -31% |
| WiFi v1.3 (h) | 3.6 | 3.8 6% | 3.5 -3% | 4.2 17% | 2.8 -22% |
| Load (h) | 1.5 | 1.5 0% | 1.4 -7% | 1.5 0% | 1.6 7% |
| H.264 (h) | 3.8 | 3.1 | 3.4 |
För
Emot

Läs originaltestet i sin helhet på engelska här.
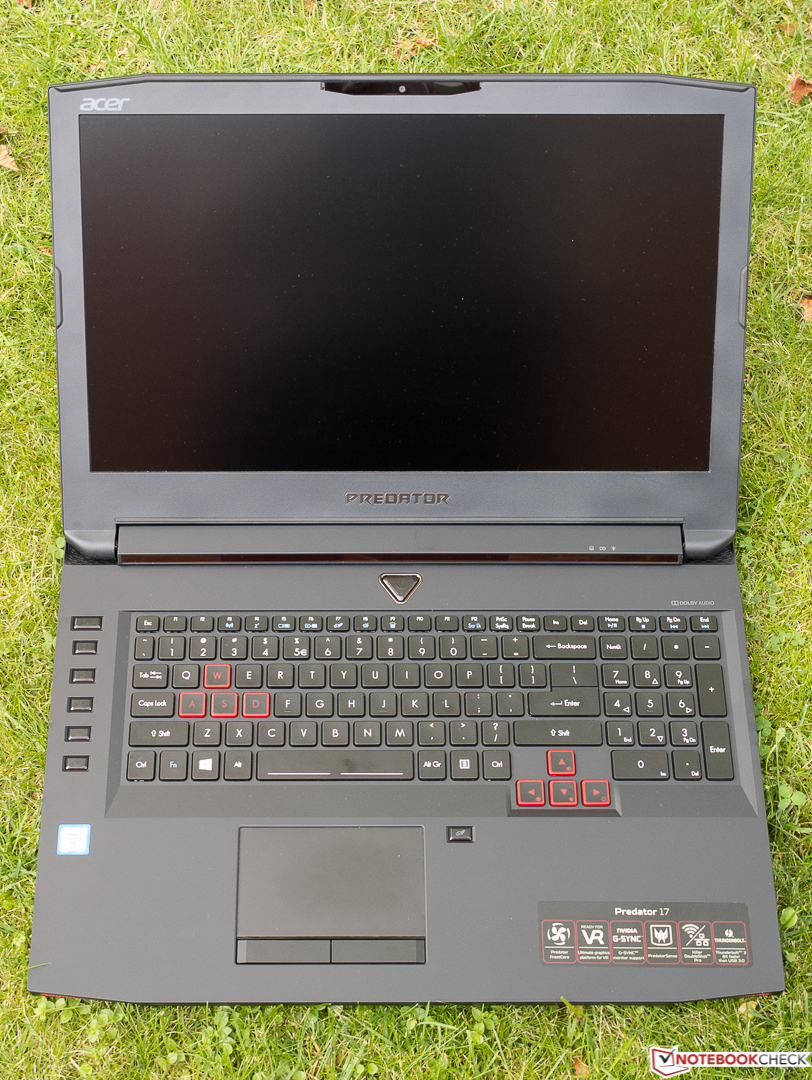
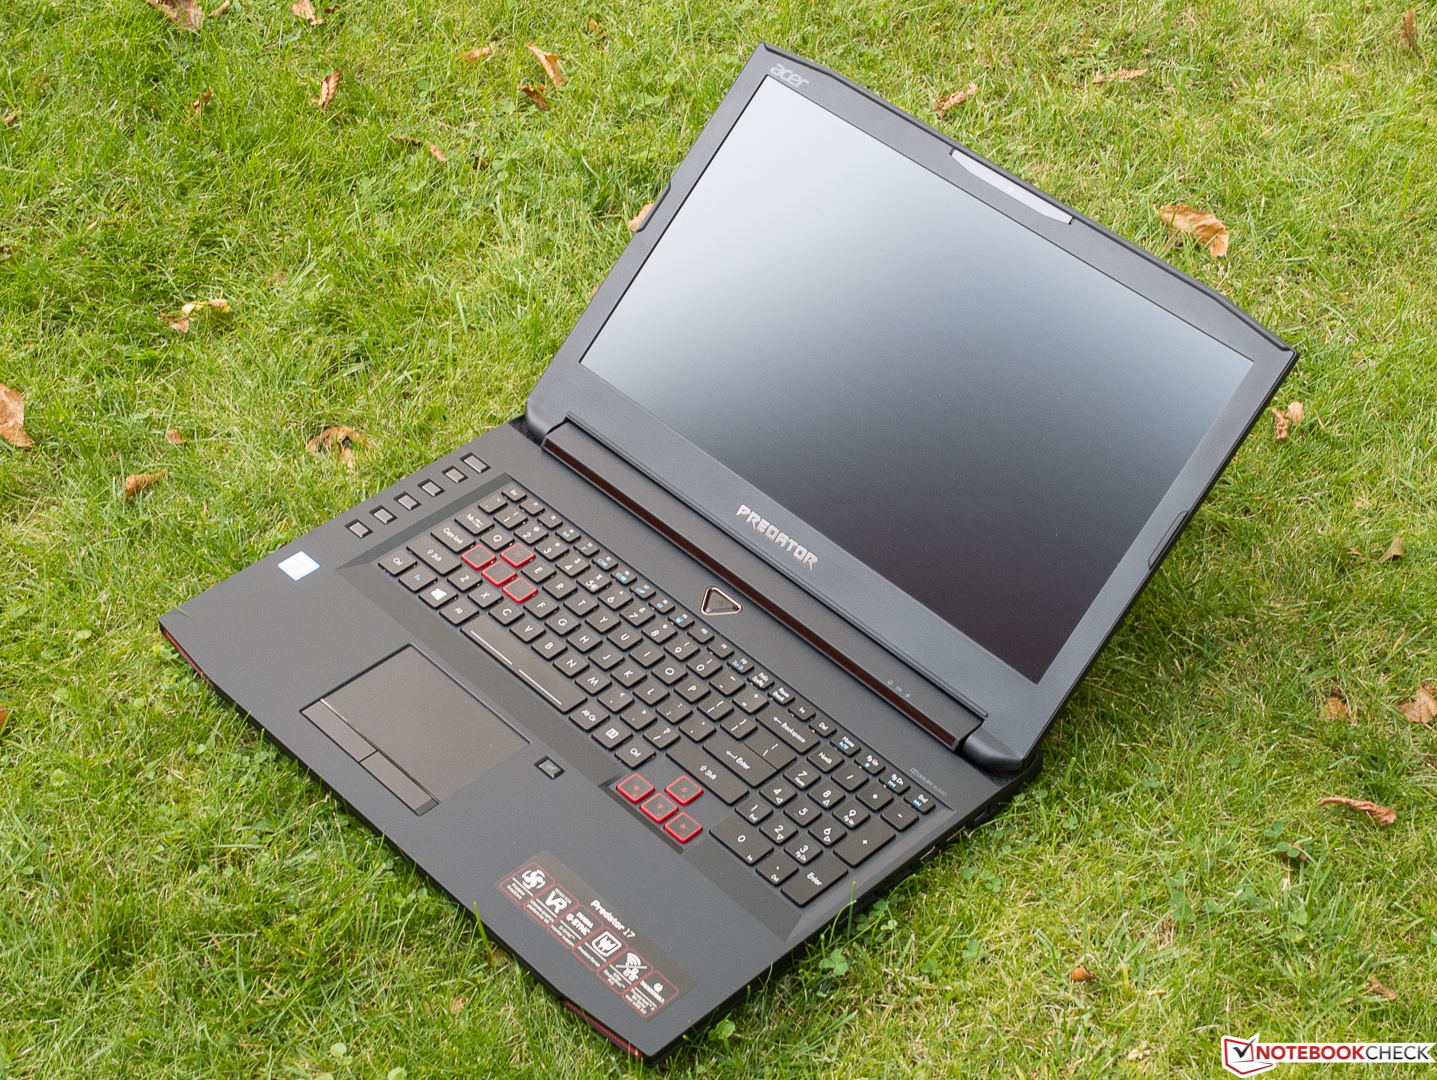
Vårt intryck sedan testet av den lika visuellt extravaganta Skylake-versionen är i stort sätt oförändrat.
Tillsammans med den uppgraderade hårdvaran får Kaby-Lake-versionen också en utmärkt UHD-panel, som placerar sig i toppen i de flesta discipliner, inklusive betraktningsvinklar, kontrast och färgrymd.
Dessutom är prestandan förstklassig och kan ökas ytterligare ytterligare med “PredatorSense” (GPU-överklockning). Datorn är också redo för framtiden med 32 GB RAM, hög lagringskapacitet (SSD/HDD-kombination) och en Thunderbolt-3-port.
Nackdelarna är maskinens storlek och vikt – den som ofta transporterar sin speldator borde istället titta närmare på en mer kompakt enhet som stöder Optimus (eftersom de tenderar att ha bättre batteritid). Men det är förstås inget problem om man, som de flesta, mest använder datorn på en och samma plats.
Acer Predator 17 G9-793-70PJ
- 05/20/2017 v6 (old)
Florian Glaser