Recension av HP EliteBook Dragonfly Max: Sure View har sina för- och nackdelar ↺
Testgrupp
Gradering | Datum | Modell | Vikt | Höjd | Storlek | Upplösning | Pris |
|---|---|---|---|---|---|---|---|
| 90.8 % v7 (old) | 06/2021 | HP Elite Dragonfly Max i7-1185G7, Iris Xe G7 96EUs | 1.2 kg | 16 mm | 13.30" | 1920x1080 | |
| 87.8 % v7 (old) | 09/2021 | HP Spectre x360 13-aw2003dx i5-1135G7, Iris Xe G7 80EUs | 1.2 kg | 16.9 mm | 13.30" | 3840x2160 | |
| 91.1 % v7 (old) | Lenovo ThinkPad X13 Yoga G2 i7-1165G7, Iris Xe G7 96EUs | 1.2 kg | 15.39 mm | 13.30" | 2560x1600 | ||
| 86.9 % v7 (old) | 06/2021 | MSI Summit E13 Flip Evo A11MT i7-1185G7, Iris Xe G7 96EUs | 1.4 kg | 14.9 mm | 13.40" | 1920x1200 | |
| 86.3 % v7 (old) | 10/2020 | Asus ZenBook Flip S UX371 i7-1165G7, Iris Xe G7 96EUs | 1.2 kg | 13.9 mm | 13.30" | 3840x2160 | |
| 90.3 % v7 (old) | 04/2020 | HP Elite Dragonfly-8MK79EA i5-8265U, UHD Graphics 620 | 1.1 kg | 16.1 mm | 13.30" | 1920x1080 |
| Networking | |
| iperf3 transmit AX12 | |
| Lenovo ThinkPad X13 Yoga G2 | |
| HP Elite Dragonfly-8MK79EA | |
| HP Elite Dragonfly Max | |
| HP Spectre x360 13-aw2003dx | |
| Asus ZenBook Flip S UX371 | |
| MSI Summit E13 Flip Evo A11MT | |
| iperf3 receive AX12 | |
| HP Elite Dragonfly-8MK79EA | |
| HP Spectre x360 13-aw2003dx | |
| Lenovo ThinkPad X13 Yoga G2 | |
| HP Elite Dragonfly Max | |
| Asus ZenBook Flip S UX371 | |
| MSI Summit E13 Flip Evo A11MT | |


| |||||||||||||||||||||||||
Distribution av ljusstyrkan: 75 %
Mitt på batteriet: 777.5 cd/m²
Kontrast: 1767:1 (Svärta: 0.44 cd/m²)
ΔE ColorChecker Calman: 1.62 | ∀{0.5-29.43 Ø4.72}
calibrated: 1.32
ΔE Greyscale Calman: 1.6 | ∀{0.09-98 Ø4.97}
94.8% sRGB (Argyll 1.6.3 3D)
72.3% AdobeRGB 1998 (Argyll 1.6.3 3D)
Gamma: 2.2
CCT: 6538 K
| HP Elite Dragonfly Max InfoVision X133NVFL R0, IPS, 13.3", 1920x1080 | HP Spectre x360 13-aw2003dx Samsung SDC4149, OLED, 13.3", 3840x2160 | Lenovo ThinkPad X13 Yoga G2 LP133WQ1-SPF2, IPS LED, 13.3", 2560x1600 | MSI Summit E13 Flip Evo A11MT Sharp LQ134N1JW53, IPS, 13.4", 1920x1200 | Asus ZenBook Flip S UX371 SDC4147, OLED, 13.3", 3840x2160 | HP Elite Dragonfly-8MK79EA AUO5E2D, IPS, 13.3", 1920x1080 | |
|---|---|---|---|---|---|---|
| Display | ||||||
| Display P3 Coverage (%) | 70 | 68.3 | 69.8 | 99.9 | 69 | |
| sRGB Coverage (%) | 88.5 | 99.1 | 98.8 | 100 | 99.4 | |
| AdobeRGB 1998 Coverage (%) | 81.2 | 70.3 | 70.6 | 100 | 70.9 | |
| Response Times | 93% | -8% | -41% | 94% | -21% | |
| Response Time Grey 50% / Grey 80% * (ms) | 44.8 ? | 2.8 ? 94% | 52 ? -16% | 64 ? -43% | 2 ? 96% | 60.8 ? -36% |
| Response Time Black / White * (ms) | 32 ? | 2.8 ? 91% | 32 ? -0% | 44 ? -38% | 2.8 ? 91% | 33.8 ? -6% |
| PWM Frequency (Hz) | 242.7 ? | 59.5 ? | ||||
| Screen | -96% | 9% | 0% | -30% | -4% | |
| Brightness middle (cd/m²) | 777.5 | 355 -54% | 460 -41% | 551.3 -29% | 365 -53% | 411 -47% |
| Brightness (cd/m²) | 727 | 368 -49% | 423 -42% | 517 -29% | 372 -49% | 388 -47% |
| Brightness Distribution (%) | 75 | 93 24% | 85 13% | 91 21% | 91 21% | 87 16% |
| Black Level * (cd/m²) | 0.44 | 0.33 25% | 0.37 16% | 0.03 93% | 0.22 50% | |
| Contrast (:1) | 1767 | 1394 -21% | 1490 -16% | 12167 589% | 1868 6% | |
| Colorchecker dE 2000 * | 1.62 | 5.74 -254% | 1 38% | 1.45 10% | 7.6 -369% | 1.8 -11% |
| Colorchecker dE 2000 max. * | 5.26 | 9.52 -81% | 1.5 71% | 2.86 46% | 12.9 -145% | 4.1 22% |
| Colorchecker dE 2000 calibrated * | 1.32 | 6.69 -407% | 0.8 39% | 1.7 -29% | 4.1 -211% | 1 24% |
| Greyscale dE 2000 * | 1.6 | 2.2 -38% | 1.2 25% | 1.3 19% | 5.4 -238% | 2.5 -56% |
| Gamma | 2.2 100% | 2.03 108% | 2.26 97% | 2.14 103% | 1.6 138% | 2.26 97% |
| CCT | 6538 99% | 6505 100% | 6652 98% | 6580 99% | 6327 103% | 6448 101% |
| Color Space (Percent of AdobeRGB 1998) (%) | 72.3 | 73.6 2% | 64.4 -11% | 65 -10% | 92 27% | 64.7 -11% |
| Color Space (Percent of sRGB) (%) | 94.8 | 88.6 -7% | 99.12 5% | 99 4% | 100 5% | 99.3 5% |
| Totalt genomsnitt (program/inställningar) | -2% /
-62% | 1% /
7% | -21% /
-6% | 32% /
-11% | -13% /
-7% |
* ... mindre är bättre
Visa svarstider
| ↔ Svarstid svart till vitt | ||
|---|---|---|
| 32 ms ... stiga ↗ och falla ↘ kombinerat | ↗ 18.8 ms stiga | 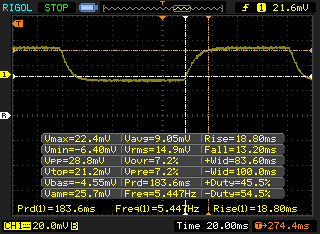 |
| ↘ 13.2 ms hösten | ||
| Skärmen visar långsamma svarsfrekvenser i våra tester och kommer att vara otillfredsställande för spelare. I jämförelse sträcker sig alla testade enheter från 0.1 (minst) till 240 (maximalt) ms. » 86 % av alla enheter är bättre. Detta innebär att den uppmätta svarstiden är sämre än genomsnittet av alla testade enheter (19.9 ms). | ||
| ↔ Svarstid 50 % grått till 80 % grått | ||
| 44.8 ms ... stiga ↗ och falla ↘ kombinerat | ↗ 20.4 ms stiga | 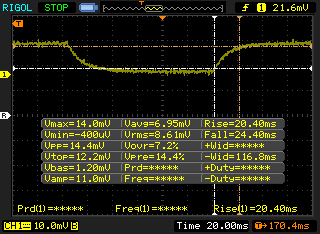 |
| ↘ 24.4 ms hösten | ||
| Skärmen visar långsamma svarsfrekvenser i våra tester och kommer att vara otillfredsställande för spelare. I jämförelse sträcker sig alla testade enheter från 0.165 (minst) till 636 (maximalt) ms. » 76 % av alla enheter är bättre. Detta innebär att den uppmätta svarstiden är sämre än genomsnittet av alla testade enheter (31.1 ms). | ||
Skärmflimmer / PWM (Puls-Width Modulation)
| Skärmflimmer / PWM upptäcktes inte | 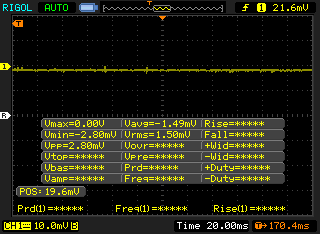 | ||
Som jämförelse: 52 % av alla testade enheter använder inte PWM för att dämpa skärmen. Om PWM upptäcktes mättes ett medelvärde av 7784 (minst: 5 - maximum: 343500) Hz. | |||
Cinebench R23: Multi Core | Single Core
Cinebench R15: CPU Multi 64Bit | CPU Single 64Bit
Blender: v2.79 BMW27 CPU
7-Zip 18.03: 7z b 4 -mmt1 | 7z b 4
Geekbench 5.5: Single-Core | Multi-Core
HWBOT x265 Benchmark v2.2: 4k Preset
LibreOffice : 20 Documents To PDF
R Benchmark 2.5: Overall mean
| Cinebench R20 / CPU (Multi Core) | |
| Lenovo IdeaPad 5 14ALC05 82LM005YGE | |
| Acer Swift 3 SF314-42-R4XJ | |
| HP Envy x360 13-ay0010nr | |
| Genomsnitt Intel Core i7-1185G7 (1425 - 2493, n=28) | |
| HP Spectre x360 13-aw2003dx | |
| Acer Spin 5 SP513-54N-79EY | |
| Lenovo ThinkPad X13 Yoga G2 | |
| HP Elite Dragonfly Max | |
| Samsung Galaxy Book Flex 13.3 | |
| HP EliteBook x360 830 G6 | |
| HP Elite Dragonfly-8MK79EA | |
| Cinebench R20 / CPU (Single Core) | |
| Genomsnitt Intel Core i7-1185G7 (489 - 593, n=28) | |
| Lenovo ThinkPad X13 Yoga G2 | |
| HP Elite Dragonfly Max | |
| HP Spectre x360 13-aw2003dx | |
| Acer Swift 3 SF314-42-R4XJ | |
| Lenovo IdeaPad 5 14ALC05 82LM005YGE | |
| Acer Spin 5 SP513-54N-79EY | |
| HP Envy x360 13-ay0010nr | |
| Samsung Galaxy Book Flex 13.3 | |
| HP EliteBook x360 830 G6 | |
| HP Elite Dragonfly-8MK79EA | |
| Cinebench R23 / Multi Core | |
| Lenovo IdeaPad 5 14ALC05 82LM005YGE | |
| Genomsnitt Intel Core i7-1185G7 (3610 - 6383, n=24) | |
| HP Spectre x360 13-aw2003dx | |
| Lenovo ThinkPad X13 Yoga G2 | |
| HP Elite Dragonfly Max | |
| Cinebench R23 / Single Core | |
| Genomsnitt Intel Core i7-1185G7 (1251 - 1532, n=24) | |
| HP Elite Dragonfly Max | |
| HP Spectre x360 13-aw2003dx | |
| Lenovo ThinkPad X13 Yoga G2 | |
| Lenovo IdeaPad 5 14ALC05 82LM005YGE | |
| Cinebench R15 / CPU Multi 64Bit | |
| Lenovo IdeaPad 5 14ALC05 82LM005YGE | |
| Acer Swift 3 SF314-42-R4XJ | |
| Genomsnitt Intel Core i7-1185G7 (617 - 1066, n=32) | |
| HP Envy x360 13-ay0010nr | |
| Lenovo ThinkPad X13 Yoga G2 | |
| HP Spectre x360 13-aw2003dx | |
| Acer Spin 5 SP513-54N-79EY | |
| HP Elite Dragonfly Max | |
| Samsung Galaxy Book Flex 13.3 | |
| HP EliteBook x360 830 G6 | |
| HP Elite Dragonfly-8MK79EA | |
| Cinebench R15 / CPU Single 64Bit | |
| Genomsnitt Intel Core i7-1185G7 (168 - 230, n=27) | |
| Lenovo ThinkPad X13 Yoga G2 | |
| HP Spectre x360 13-aw2003dx | |
| Acer Swift 3 SF314-42-R4XJ | |
| Acer Spin 5 SP513-54N-79EY | |
| HP Envy x360 13-ay0010nr | |
| Lenovo IdeaPad 5 14ALC05 82LM005YGE | |
| HP Elite Dragonfly Max | |
| Samsung Galaxy Book Flex 13.3 | |
| HP EliteBook x360 830 G6 | |
| HP Elite Dragonfly-8MK79EA | |
| Blender / v2.79 BMW27 CPU | |
| Samsung Galaxy Book Flex 13.3 | |
| HP Elite Dragonfly-8MK79EA | |
| Lenovo ThinkPad X13 Yoga G2 | |
| HP Elite Dragonfly Max | |
| Acer Spin 5 SP513-54N-79EY | |
| HP Spectre x360 13-aw2003dx | |
| HP Envy x360 13-ay0010nr | |
| Genomsnitt Intel Core i7-1185G7 (478 - 745, n=28) | |
| Acer Swift 3 SF314-42-R4XJ | |
| Lenovo IdeaPad 5 14ALC05 82LM005YGE | |
| 7-Zip 18.03 / 7z b 4 -mmt1 | |
| Genomsnitt Intel Core i7-1185G7 (3678 - 5507, n=27) | |
| HP Elite Dragonfly Max | |
| Lenovo ThinkPad X13 Yoga G2 | |
| HP Spectre x360 13-aw2003dx | |
| HP EliteBook x360 830 G6 | |
| Acer Spin 5 SP513-54N-79EY | |
| Lenovo IdeaPad 5 14ALC05 82LM005YGE | |
| Acer Swift 3 SF314-42-R4XJ | |
| HP Envy x360 13-ay0010nr | |
| Samsung Galaxy Book Flex 13.3 | |
| HP Elite Dragonfly-8MK79EA | |
| 7-Zip 18.03 / 7z b 4 | |
| Lenovo IdeaPad 5 14ALC05 82LM005YGE | |
| Acer Swift 3 SF314-42-R4XJ | |
| Genomsnitt Intel Core i7-1185G7 (18812 - 27693, n=27) | |
| HP Envy x360 13-ay0010nr | |
| HP Spectre x360 13-aw2003dx | |
| HP Elite Dragonfly Max | |
| Acer Spin 5 SP513-54N-79EY | |
| Lenovo ThinkPad X13 Yoga G2 | |
| HP EliteBook x360 830 G6 | |
| HP Elite Dragonfly-8MK79EA | |
| Samsung Galaxy Book Flex 13.3 | |
| Geekbench 5.5 / Single-Core | |
| HP Elite Dragonfly Max | |
| Genomsnitt Intel Core i7-1185G7 (1398 - 1626, n=21) | |
| Lenovo ThinkPad X13 Yoga G2 | |
| HP Spectre x360 13-aw2003dx | |
| Samsung Galaxy Book Flex 13.3 | |
| Acer Spin 5 SP513-54N-79EY | |
| Lenovo IdeaPad 5 14ALC05 82LM005YGE | |
| Acer Swift 3 SF314-42-R4XJ | |
| HP Envy x360 13-ay0010nr | |
| Geekbench 5.5 / Multi-Core | |
| Lenovo IdeaPad 5 14ALC05 82LM005YGE | |
| Genomsnitt Intel Core i7-1185G7 (4620 - 5944, n=21) | |
| HP Elite Dragonfly Max | |
| HP Spectre x360 13-aw2003dx | |
| Acer Swift 3 SF314-42-R4XJ | |
| HP Envy x360 13-ay0010nr | |
| Samsung Galaxy Book Flex 13.3 | |
| Lenovo ThinkPad X13 Yoga G2 | |
| Acer Spin 5 SP513-54N-79EY | |
| HWBOT x265 Benchmark v2.2 / 4k Preset | |
| Lenovo IdeaPad 5 14ALC05 82LM005YGE | |
| Acer Swift 3 SF314-42-R4XJ | |
| HP Envy x360 13-ay0010nr | |
| Genomsnitt Intel Core i7-1185G7 (5.02 - 8.13, n=27) | |
| HP Spectre x360 13-aw2003dx | |
| HP Elite Dragonfly Max | |
| Lenovo ThinkPad X13 Yoga G2 | |
| HP Elite Dragonfly-8MK79EA | |
| Samsung Galaxy Book Flex 13.3 | |
| LibreOffice / 20 Documents To PDF | |
| Lenovo IdeaPad 5 14ALC05 82LM005YGE | |
| HP Envy x360 13-ay0010nr | |
| Acer Swift 3 SF314-42-R4XJ | |
| Samsung Galaxy Book Flex 13.3 | |
| HP Spectre x360 13-aw2003dx | |
| Acer Spin 5 SP513-54N-79EY | |
| Genomsnitt Intel Core i7-1185G7 (41.3 - 61.7, n=26) | |
| HP Elite Dragonfly Max | |
| Lenovo ThinkPad X13 Yoga G2 | |
| R Benchmark 2.5 / Overall mean | |
| Samsung Galaxy Book Flex 13.3 | |
| HP Spectre x360 13-aw2003dx | |
| Acer Swift 3 SF314-42-R4XJ | |
| HP Envy x360 13-ay0010nr | |
| Lenovo ThinkPad X13 Yoga G2 | |
| Lenovo IdeaPad 5 14ALC05 82LM005YGE | |
| HP Elite Dragonfly Max | |
| Genomsnitt Intel Core i7-1185G7 (0.55 - 0.615, n=27) | |
* ... mindre är bättre
| PCMark 10 Score | 4932 poäng | |
Hjälp | ||
| DPC Latencies / LatencyMon - interrupt to process latency (max), Web, Youtube, Prime95 | |
| HP Elite Dragonfly Max | |
| MSI Summit E13 Flip Evo A11MT | |
| HP Spectre x360 13-aw2003dx | |
| Lenovo ThinkPad X13 Yoga G2 | |
| Asus ZenBook Flip S UX371 | |
* ... mindre är bättre
| HP Elite Dragonfly Max Toshiba XG6 KXG60ZNV512G | HP Envy 13-ba1475ng Intel SSD 660p SSDPEKNW512G8 | Dell XPS 13 9305 Core i5 FHD Samsung PM9A1 MZVL2512HCJQ | Microsoft Surface Laptop 4 13 i7 Samsung PM991 MZ9LQ512HALU | Dell Latitude 5310-GXX0D SK Hynix BC511 HFM512GDJTNI | |
|---|---|---|---|---|---|
| AS SSD | -22% | 15% | -24% | -14% | |
| Seq Read (MB/s) | 2700 | 1608 -40% | 2629 -3% | 1821 -33% | 1975 -27% |
| Seq Write (MB/s) | 1483 | 659 -56% | 1270 -14% | 794 -46% | 1002 -32% |
| 4K Read (MB/s) | 48.73 | 51.3 5% | 65.2 34% | 47.54 -2% | 51.8 6% |
| 4K Write (MB/s) | 126.4 | 151.8 20% | 182.5 44% | 141.6 12% | 121.7 -4% |
| 4K-64 Read (MB/s) | 819 | 322.1 -61% | 1032 26% | 782 -5% | 806 -2% |
| 4K-64 Write (MB/s) | 1252 | 800 -36% | 1257 0% | 766 -39% | 780 -38% |
| Access Time Read * (ms) | 0.066 | 0.077 -17% | 0.07 -6% | 0.191 -189% | 0.04 39% |
| Access Time Write * (ms) | 0.093 | 0.046 51% | 0.023 75% | 0.027 71% | 0.031 67% |
| Score Read (Points) | 1138 | 534 -53% | 1360 20% | 1012 -11% | 1055 -7% |
| Score Write (Points) | 1527 | 1018 -33% | 1567 3% | 987 -35% | 1002 -34% |
| Score Total (Points) | 3197 | 1797 -44% | 3573 12% | 2477 -23% | 2562 -20% |
| Copy ISO MB/s (MB/s) | 1927 | 961 -50% | 1430 -26% | 1243 -35% | 742 -61% |
| Copy Program MB/s (MB/s) | 573 | 753 31% | 782 36% | 628 10% | 389.9 -32% |
| Copy Game MB/s (MB/s) | 1145 | 896 -22% | 1177 3% | 976 -15% | 556 -51% |
| CrystalDiskMark 5.2 / 6 | -14% | -2% | -20% | -5% | |
| Write 4K (MB/s) | 99 | 133.5 35% | 136.9 38% | 118.2 19% | 145.5 47% |
| Read 4K (MB/s) | 52.3 | 39.66 -24% | 47.34 -9% | 37.54 -28% | 48.83 -7% |
| Write Seq (MB/s) | 1765 | 907 -49% | 1150 -35% | 1017 -42% | 1067 -40% |
| Read Seq (MB/s) | 2065 | 1481 -28% | 2052 -1% | 926 -55% | 1133 -45% |
| Write 4K Q32T1 (MB/s) | 291.7 | 446.2 53% | 433 48% | 354.2 21% | 420.3 44% |
| Read 4K Q32T1 (MB/s) | 314 | 335.1 7% | 293 -7% | 352.6 12% | 462.6 47% |
| Write Seq Q32T1 (MB/s) | 2549 | 975 -62% | 1148 -55% | 1174 -54% | 1077 -58% |
| Read Seq Q32T1 (MB/s) | 3282 | 1874 -43% | 3427 4% | 2261 -31% | 2302 -30% |
| Totalt genomsnitt (program/inställningar) | -18% /
-19% | 7% /
9% | -22% /
-23% | -10% /
-11% |
* ... mindre är bättre

DiskSpd Read Loop, Queue Depth 8
| 3DMark 11 Performance | 4639 poäng | |
| 3DMark Cloud Gate Standard Score | 12813 poäng | |
| 3DMark Fire Strike Score | 3149 poäng | |
| 3DMark Time Spy Score | 1260 poäng | |
Hjälp | ||
| Strange Brigade | |
| 1280x720 lowest AF:1 | |
| MSI Summit E13 Flip Evo A11MT | |
| Lenovo ThinkPad X13 Yoga G2 | |
| Dell XPS 13 9310 OLED | |
| Genomsnitt Intel Iris Xe Graphics G7 96EUs (48.5 - 115.1, n=172) | |
| HP Elite Dragonfly Max | |
| Lenovo IdeaPad 5 14ALC05 82LM005YGE | |
| 1920x1080 medium AA:medium AF:4 | |
| MSI Summit E13 Flip Evo A11MT | |
| Genomsnitt Intel Iris Xe Graphics G7 96EUs (18.2 - 51.4, n=170) | |
| Lenovo ThinkPad X13 Yoga G2 | |
| Dell XPS 13 9310 OLED | |
| Lenovo IdeaPad 5 14ALC05 82LM005YGE | |
| HP Elite Dragonfly Max | |
| 1920x1080 high AA:high AF:8 | |
| MSI Summit E13 Flip Evo A11MT | |
| Dell XPS 13 9310 OLED | |
| Genomsnitt Intel Iris Xe Graphics G7 96EUs (15.4 - 39.8, n=169) | |
| Lenovo ThinkPad X13 Yoga G2 | |
| Lenovo IdeaPad 5 14ALC05 82LM005YGE | |
| HP Elite Dragonfly Max | |
| 1920x1080 ultra AA:ultra AF:16 | |
| MSI Summit E13 Flip Evo A11MT | |
| Genomsnitt Intel Iris Xe Graphics G7 96EUs (13.2 - 31.7, n=167) | |
| Lenovo ThinkPad X13 Yoga G2 | |
| Dell XPS 13 9310 OLED | |
| Lenovo IdeaPad 5 14ALC05 82LM005YGE | |
| HP Elite Dragonfly Max | |
| låg | med. | hög | ultra | |
|---|---|---|---|---|
| The Witcher 3 (2015) | 72.4 | 48.2 | 28.9 | 13.6 |
| Dota 2 Reborn (2015) | 71.8 | 47.4 | 35.1 | 35.2 |
| Final Fantasy XV Benchmark (2018) | 26.5 | 15.3 | 11.2 | |
| X-Plane 11.11 (2018) | 23.3 | 29.5 | 26.4 | |
| Strange Brigade (2018) | 76.4 | 27.7 | 23.1 | 18.5 |
| HP Elite Dragonfly Max Iris Xe G7 96EUs, i7-1185G7, Toshiba XG6 KXG60ZNV512G | HP Spectre x360 13-aw2003dx Iris Xe G7 80EUs, i5-1135G7, Intel Optane Memory H10 with Solid State Storage 32GB + 512GB HBRPEKNX0202A(L/H) | Lenovo ThinkPad X13 Yoga G2 Iris Xe G7 96EUs, i7-1165G7, WDC PC SN730 SDBQNTY-1T00 | MSI Summit E13 Flip Evo A11MT Iris Xe G7 96EUs, i7-1185G7, Phison 1TB SM2801T24GKBB4S-E162 | Asus ZenBook Flip S UX371 Iris Xe G7 96EUs, i7-1165G7, WDC PC SN730 SDBPNTY-1T00 | HP Elite Dragonfly-8MK79EA UHD Graphics 620, i5-8265U, Intel Optane Memory H10 with Solid State Storage 32GB + 512GB HBRPEKNX0202A(L/H) | |
|---|---|---|---|---|---|---|
| Noise | -11% | -0% | -17% | -9% | -14% | |
| av / miljö * (dB) | 24.9 | 25.3 -2% | 24 4% | 24.5 2% | 29 -16% | 29.5 -18% |
| Idle Minimum * (dB) | 24.9 | 25.4 -2% | 24 4% | 24.7 1% | 29 -16% | 29.5 -18% |
| Idle Average * (dB) | 24.9 | 25.4 -2% | 24 4% | 24.7 1% | 29 -16% | 30 -20% |
| Idle Maximum * (dB) | 24.9 | 25.4 -2% | 24 4% | 26.4 -6% | 29 -16% | 30.3 -22% |
| Load Average * (dB) | 29.7 | 25.4 14% | 32.72 -10% | 37.8 -27% | 30.9 -4% | 31.6 -6% |
| Witcher 3 ultra * (dB) | 31.3 | 44.6 -42% | 41.4 -32% | 30.9 1% | ||
| Load Maximum * (dB) | 31.3 | 44.8 -43% | 33.88 -8% | 48.8 -56% | 30.9 1% | 31.6 -1% |
* ... mindre är bättre
Ljudnivå
| Låg belastning |
| 24.9 / 24.9 / 24.9 dB(A) |
| Hög belastning |
| 29.7 / 31.3 dB(A) |
 | ||
30 dB tyst 40 dB(A) hörbar 50 dB(A) högt ljud |
||
min: | ||
(+) Den maximala temperaturen på ovansidan är 39.4 °C / 103 F, jämfört med genomsnittet av 35.4 °C / 96 F , allt från 19.6 till 60 °C för klassen Convertible.
(-) Botten värms upp till maximalt 50 °C / 122 F, jämfört med genomsnittet av 36.9 °C / 98 F
(+) Vid tomgångsbruk är medeltemperaturen för ovansidan 28.5 °C / 83 F, jämfört med enhetsgenomsnittet på 30.3 °C / ### class_avg_f### F.
(+) Handledsstöden och pekplattan är kallare än hudtemperaturen med maximalt 28 °C / 82.4 F och är därför svala att ta på.
(±) Medeltemperaturen för handledsstödsområdet på liknande enheter var 28 °C / 82.4 F (0 °C / 0 F).
HP Elite Dragonfly Max ljudanalys
(+) | högtalare kan spela relativt högt (87.1 dB)
Bas 100 - 315 Hz
(±) | reducerad bas - i genomsnitt 11.4% lägre än medianen
(±) | linjäriteten för basen är genomsnittlig (11.8% delta till föregående frekvens)
Mellan 400 - 2000 Hz
(+) | balanserad mellan - endast 2.7% från medianen
(+) | mids är linjära (3.1% delta till föregående frekvens)
Högsta 2 - 16 kHz
(+) | balanserade toppar - endast 4.4% från medianen
(+) | toppar är linjära (5.4% delta till föregående frekvens)
Totalt 100 - 16 000 Hz
(+) | det totala ljudet är linjärt (10.2% skillnad mot median)
Jämfört med samma klass
» 6% av alla testade enheter i den här klassen var bättre, 2% liknande, 92% sämre
» Den bästa hade ett delta på 6%, genomsnittet var 20%, sämst var 57%
Jämfört med alla testade enheter
» 5% av alla testade enheter var bättre, 1% liknande, 94% sämre
» Den bästa hade ett delta på 4%, genomsnittet var 24%, sämst var 134%
Apple MacBook 12 (Early 2016) 1.1 GHz ljudanalys
(+) | högtalare kan spela relativt högt (83.6 dB)
Bas 100 - 315 Hz
(±) | reducerad bas - i genomsnitt 11.3% lägre än medianen
(±) | linjäriteten för basen är genomsnittlig (14.2% delta till föregående frekvens)
Mellan 400 - 2000 Hz
(+) | balanserad mellan - endast 2.4% från medianen
(+) | mids är linjära (5.5% delta till föregående frekvens)
Högsta 2 - 16 kHz
(+) | balanserade toppar - endast 2% från medianen
(+) | toppar är linjära (4.5% delta till föregående frekvens)
Totalt 100 - 16 000 Hz
(+) | det totala ljudet är linjärt (10.2% skillnad mot median)
Jämfört med samma klass
» 7% av alla testade enheter i den här klassen var bättre, 2% liknande, 91% sämre
» Den bästa hade ett delta på 5%, genomsnittet var 18%, sämst var 53%
Jämfört med alla testade enheter
» 5% av alla testade enheter var bättre, 1% liknande, 94% sämre
» Den bästa hade ett delta på 4%, genomsnittet var 24%, sämst var 134%
| Av/Standby | |
| Låg belastning | |
| Hög belastning |
|
Förklaring:
min: | |
| HP Elite Dragonfly Max i7-1185G7, Iris Xe G7 96EUs, Toshiba XG6 KXG60ZNV512G, IPS, 1920x1080, 13.3" | HP Spectre x360 13-aw2003dx i5-1135G7, Iris Xe G7 80EUs, Intel Optane Memory H10 with Solid State Storage 32GB + 512GB HBRPEKNX0202A(L/H), OLED, 3840x2160, 13.3" | MSI Summit E13 Flip Evo A11MT i7-1185G7, Iris Xe G7 96EUs, Phison 1TB SM2801T24GKBB4S-E162, IPS, 1920x1200, 13.4" | Asus ZenBook Flip S UX371 i7-1165G7, Iris Xe G7 96EUs, WDC PC SN730 SDBPNTY-1T00, OLED, 3840x2160, 13.3" | HP Elite Dragonfly-8MK79EA i5-8265U, UHD Graphics 620, Intel Optane Memory H10 with Solid State Storage 32GB + 512GB HBRPEKNX0202A(L/H), IPS, 1920x1080, 13.3" | |
|---|---|---|---|---|---|
| Power Consumption | -19% | -23% | -23% | 15% | |
| Idle Minimum * (Watt) | 2.9 | 5.7 -97% | 4.8 -66% | 6.1 -110% | 3.5 -21% |
| Idle Average * (Watt) | 9.9 | 8.4 15% | 8.4 15% | 10.6 -7% | 5.1 48% |
| Idle Maximum * (Watt) | 10.4 | 8.8 15% | 8.6 17% | 13.8 -33% | 8.1 22% |
| Load Average * (Watt) | 37.1 | 38.9 -5% | 47.1 -27% | 32.2 13% | 35.6 4% |
| Witcher 3 ultra * (Watt) | 31.5 | 40.5 -29% | 51.6 -64% | 28.3 10% | |
| Load Maximum * (Watt) | 58.8 | 66.9 -14% | 65.9 -12% | 64.7 -10% | 44.7 24% |
* ... mindre är bättre
| HP Elite Dragonfly Max i7-1185G7, Iris Xe G7 96EUs, 56 Wh | HP Spectre x360 13-aw2003dx i5-1135G7, Iris Xe G7 80EUs, 60 Wh | Lenovo ThinkPad X13 Yoga G2 i7-1165G7, Iris Xe G7 96EUs, 52.8 Wh | MSI Summit E13 Flip Evo A11MT i7-1185G7, Iris Xe G7 96EUs, 70 Wh | Asus ZenBook Flip S UX371 i7-1165G7, Iris Xe G7 96EUs, 67 Wh | HP Elite Dragonfly-8MK79EA i5-8265U, UHD Graphics 620, 56.2 Wh | |
|---|---|---|---|---|---|---|
| Batteridrifttid | -47% | -23% | -21% | -21% | -6% | |
| Reader / Idle (h) | 28.7 | 11.9 -59% | 21.1 -26% | |||
| WiFi v1.3 (h) | 11 | 6.1 -45% | 9.3 -15% | 11.2 2% | 6.7 -39% | 10.1 -8% |
| Load (h) | 2.9 | 1.8 -38% | 2 -31% | 1.8 -38% | 2.8 -3% | 2.8 -3% |
För
Emot
Omdöme: Prova på Sure View själv innan du bestämmer dig
Läs den fullständiga versionen av den här recensionen på engelska här.
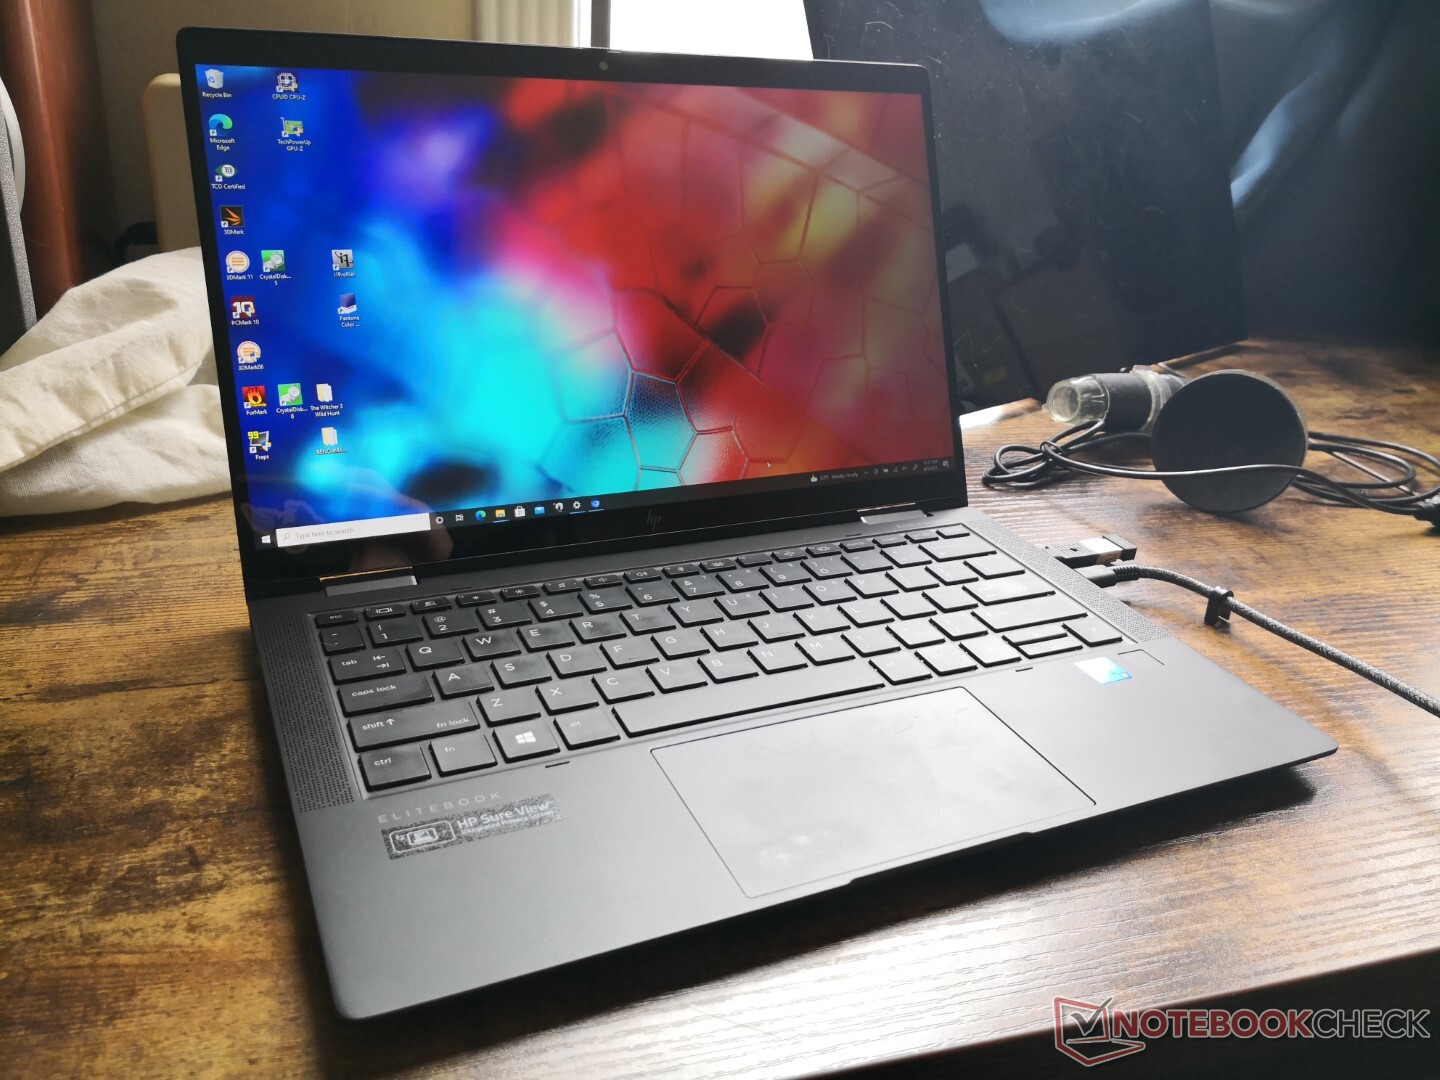
Kvalitetsmässigt och visuellt sett reflekterar Dragonfly Max sitt höga pris och framstår som det flaggskepp bland omvandlingsbara kontorsmaskiner som den är. Den är både liten och lätt utan att behöva offra robusthet, säkerhet eller funktionalitet. Det finns helt enkelt inga andra omvandlingsbara modeller som både har 5G-anslutbarhet, webbkamera på 5 MP, skärmalternativ på 1000 nits och Intel vPro.
Den har lägre CPU- och GPU-prestanda än de flesta andra bärbara datorer med Tiger Lake U, men den är fortfarande snabbare än någon modell med Whiskey Lake U eller någon äldre modell. Byter du upp dig från en enhet som kom innan Intels 10:e generation kommer du definitivt se en tydlig ökning i prestanda, men du kan eventuellt vilja överväga modeller med högre TDP, exempelvis Spectre x360 13 eller MSI Summit E13 Flip, om du behöver ren ULV-prestanda.
Klä Spectre x360 13 i en proffsig kostym och slips och du får EliteBook Dragonfly Max. Den prioriterar Sure View och lågt fläktljud lite för mycket med resultatet att den får suddigare bild och lägre prestanda jämfört med andra bärbara datorer på 13.3 tum med Intels 11:e generation.
Det finns en aspekt som sänker hela datorn och det är Sure View, för den funktionen minskar kraftigt användarens visuella upplevelse. Tanken är att göra det svårare för folk vid sidan om att se vad som är på skärmen, men detta kommer på bekostnad av ljusstyrka och tydlighet för den som faktiskt använder datorn. Det värsta är att problemen är kvar även om man slår av Sure View.
För att få den bästa upplevelsen av Dragonfly Max rekommenderar vi att du testar två varianter - en med Sure View och en utan – för att se den stora skillnaden och sen avgöra om funktionen är värd investeringen. Själva datorn lyckas i nästan alla andra kategorier och är verkligen värd att titta närmare på.
HP Elite Dragonfly Max
- 06/06/2021 v7 (old)
Allen Ngo
Price comparison
