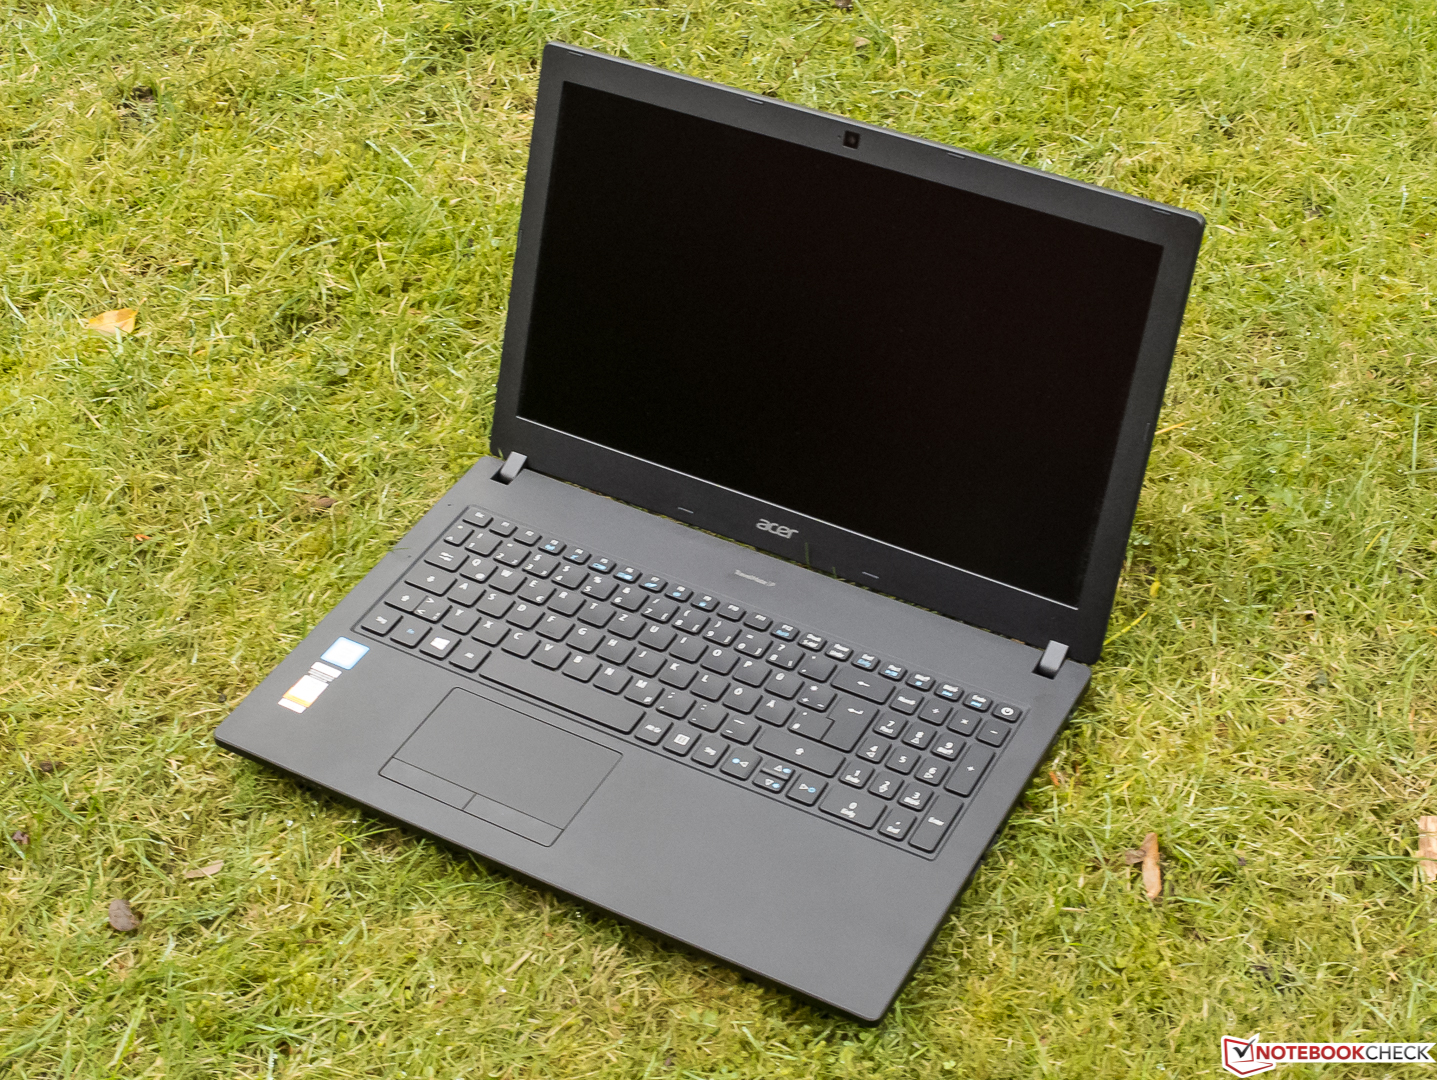
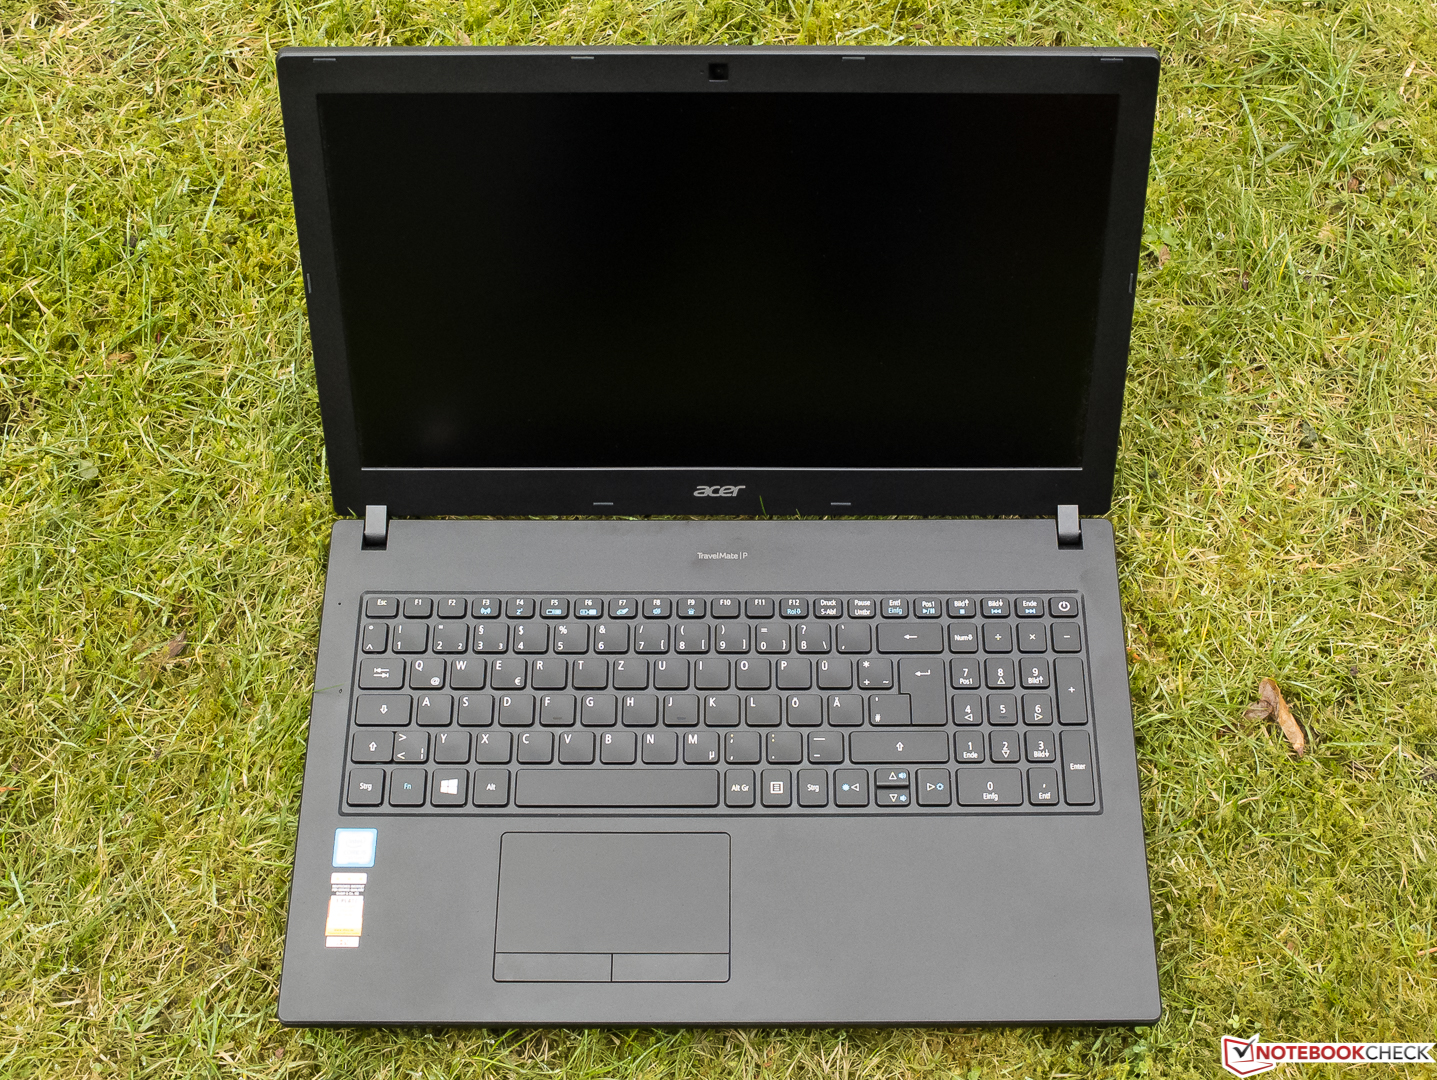
Test: Acer TravelMate P2510 (i5-7200U, 256 GB SSD, IPS) Laptop (Sammanfattning)

| SD Card Reader | |
| average JPG Copy Test (av. of 3 runs) | |
| Dell Latitude 5580 (Toshiba Exceria Pro SDXC 64 GB UHS-II) | |
| Acer TravelMate P2510-M-51ZQ (Toshiba Exceria Pro SDXC 64 GB UHS-II) | |
| HP 15-bs103ng (Toshiba Exceria Pro SDXC 64 GB UHS-II) | |
| Lenovo V510-15IKB 80WQ0002GE (Toshiba Exceria Pro SDXC 64 GB UHS-II) | |
| maximum AS SSD Seq Read Test (1GB) | |
| Dell Latitude 5580 (Toshiba Exceria Pro SDXC 64 GB UHS-II) | |
| Lenovo V510-15IKB 80WQ0002GE (Toshiba Exceria Pro SDXC 64 GB UHS-II) | |
| HP 15-bs103ng (Toshiba Exceria Pro SDXC 64 GB UHS-II) | |
| Acer TravelMate P2510-M-51ZQ (Toshiba Exceria Pro SDXC 64 GB UHS-II) | |
| Networking | |
| iperf3 transmit AX12 | |
| Acer TravelMate P2510-M-51ZQ | |
| Dell Latitude 5580 | |
| HP 15-bs103ng | |
| Lenovo V510-15IKB 80WQ0002GE | |
| iperf3 receive AX12 | |
| Acer TravelMate P2510-M-51ZQ | |
| Dell Latitude 5580 | |
| Lenovo V510-15IKB 80WQ0002GE | |
| HP 15-bs103ng | |
| |||||||||||||||||||||||||
Distribution av ljusstyrkan: 78 %
Mitt på batteriet: 216 cd/m²
Kontrast: 672:1 (Svärta: 0.32 cd/m²)
ΔE ColorChecker Calman: 5.15 | ∀{0.5-29.43 Ø4.71}
ΔE Greyscale Calman: 4.25 | ∀{0.09-98 Ø4.96}
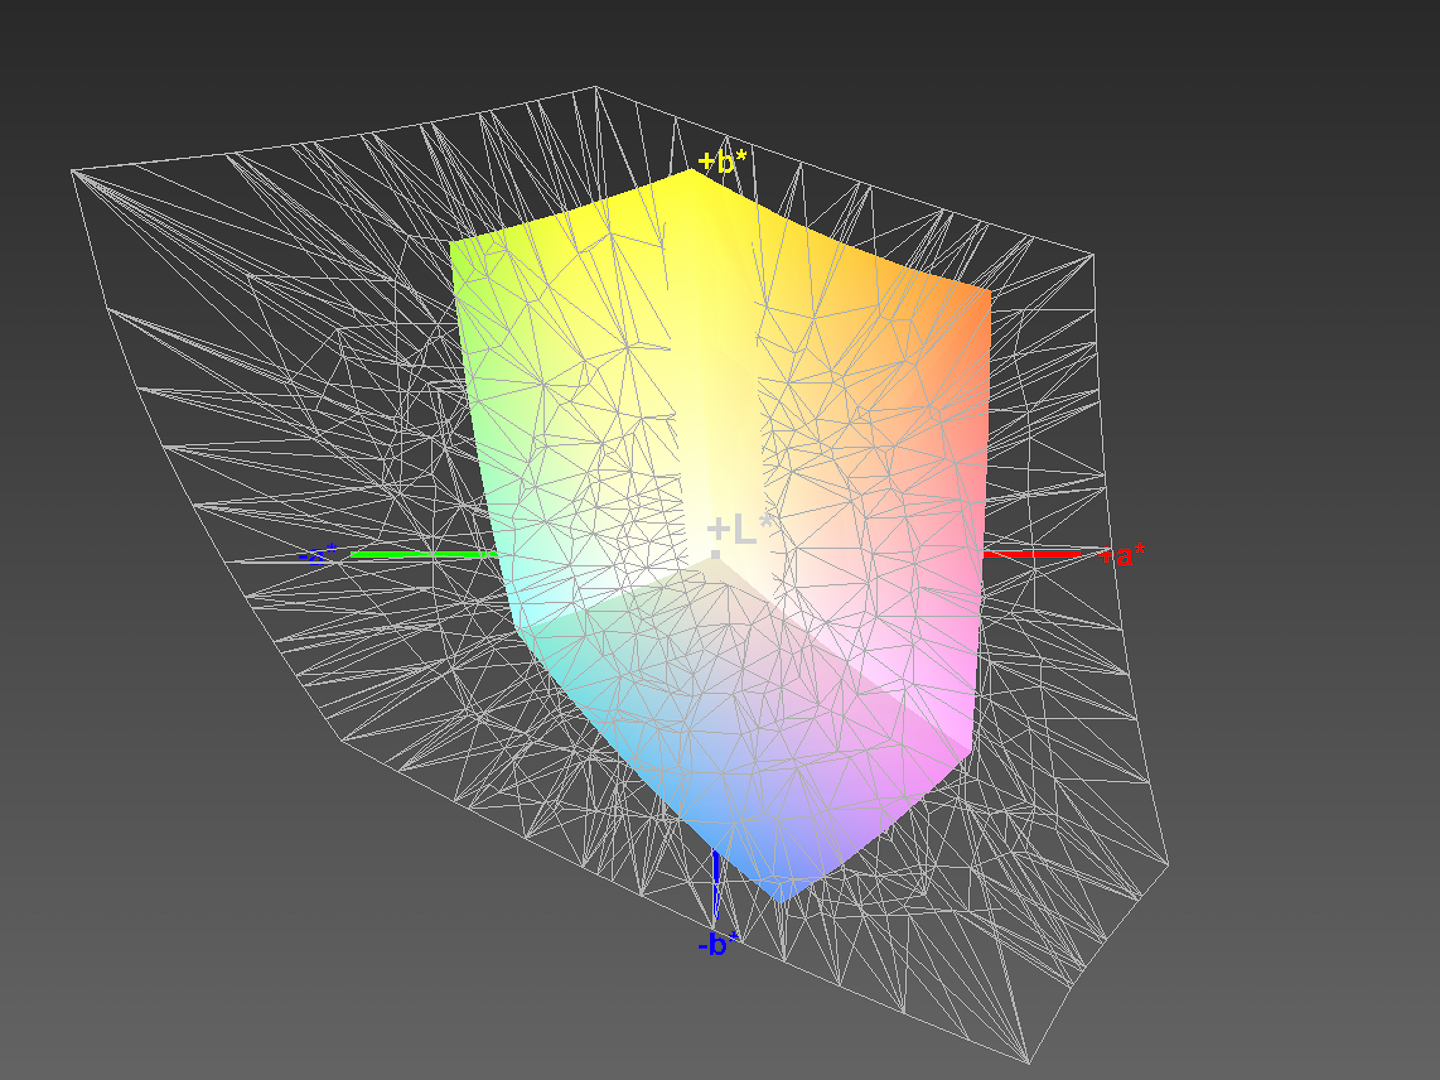
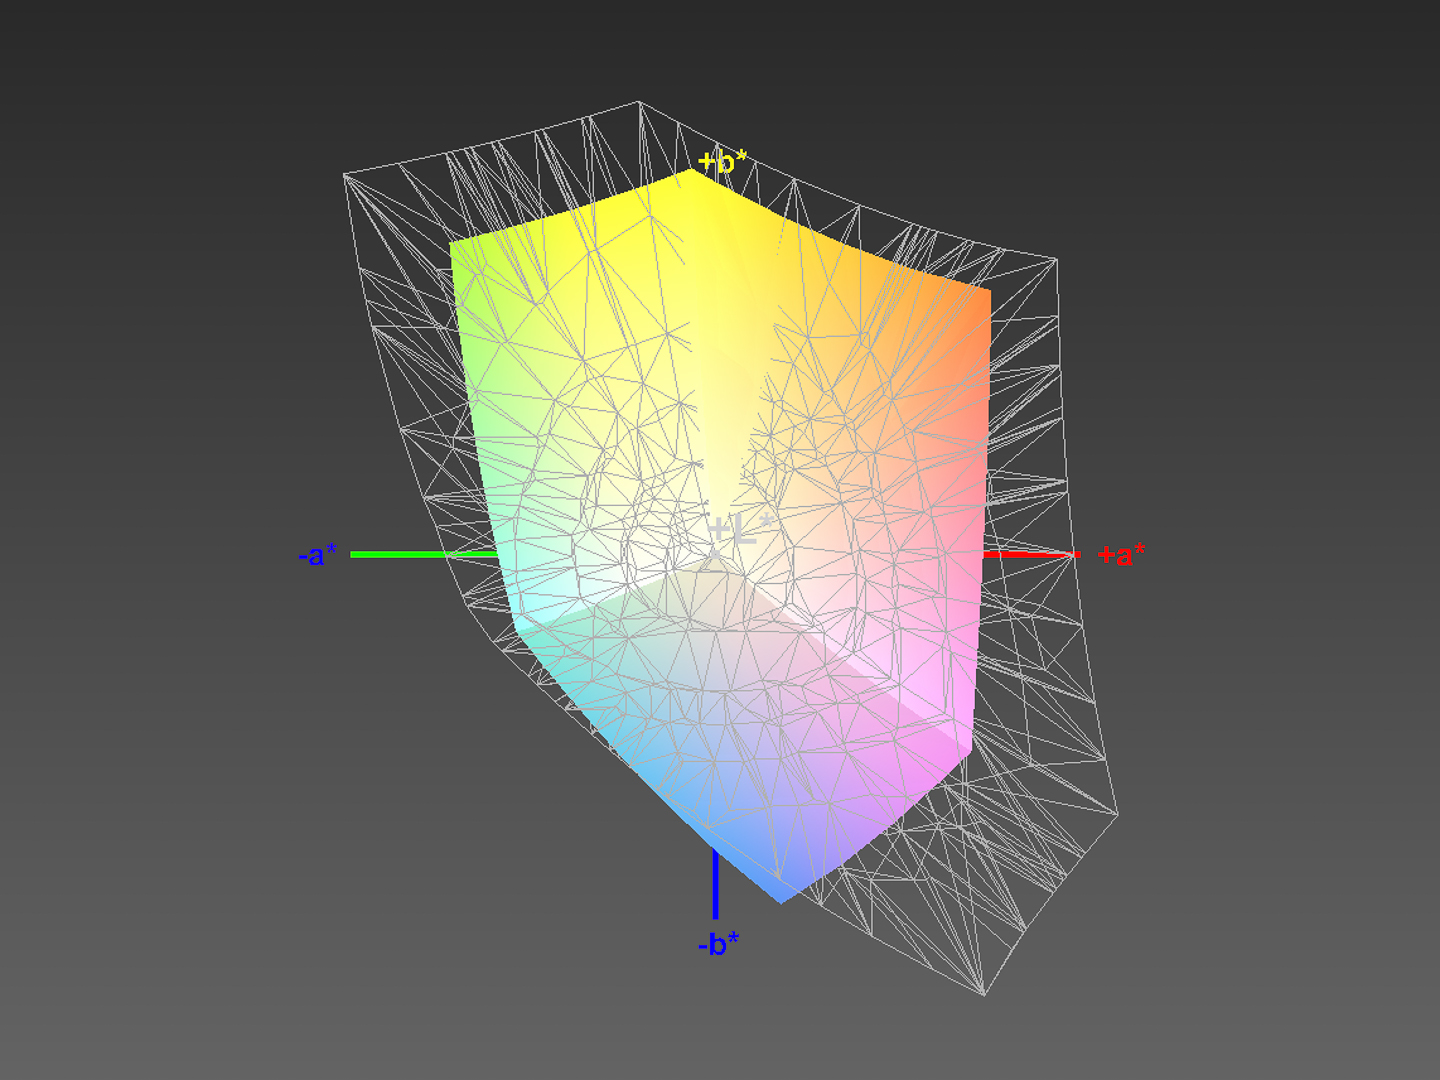
63% sRGB (Argyll 1.6.3 3D)
40% AdobeRGB 1998 (Argyll 1.6.3 3D)
43.94% AdobeRGB 1998 (Argyll 3D)
63.2% sRGB (Argyll 3D)
42.44% Display P3 (Argyll 3D)
Gamma: 2.61
CCT: 6603 K
| Acer TravelMate P2510-M-51ZQ Chi Mei CMN15D3 / N156HCE-EAA, , 1920x1080, 15.6" | Dell Latitude 5580 BOE NV15N42, , 1920x1080, 15.6" | HP 15-bs103ng AU Optronics, , 1920x1080, 15.6" | Lenovo V510-15IKB 80WQ0002GE LG Philips LP156WF6-SPK3, , 1920x1080, 15.6" | |
|---|---|---|---|---|
| Display | -3% | -14% | -9% | |
| Display P3 Coverage (%) | 42.44 | 41.57 -2% | 36.55 -14% | 38.8 -9% |
| sRGB Coverage (%) | 63.2 | 60.7 -4% | 55 -13% | 58.1 -8% |
| AdobeRGB 1998 Coverage (%) | 43.94 | 42.94 -2% | 37.76 -14% | 40.12 -9% |
| Response Times | 1% | 17% | 10% | |
| Response Time Grey 50% / Grey 80% * (ms) | 45 ? | 43 ? 4% | 44 ? 2% | 39 ? 13% |
| Response Time Black / White * (ms) | 32 ? | 33 ? -3% | 22 ? 31% | 30 ? 6% |
| PWM Frequency (Hz) | 25000 ? | 1020 ? | 20000 ? | |
| Screen | 18% | -57% | 6% | |
| Brightness middle (cd/m²) | 215 | 234 9% | 241 12% | 256 19% |
| Brightness (cd/m²) | 198 | 224 13% | 235 19% | 252 27% |
| Brightness Distribution (%) | 78 | 84 8% | 84 8% | 87 12% |
| Black Level * (cd/m²) | 0.32 | 0.18 44% | 0.43 -34% | 0.3 6% |
| Contrast (:1) | 672 | 1300 93% | 560 -17% | 853 27% |
| Colorchecker dE 2000 * | 5.15 | 5.3 -3% | 13.62 -164% | 5.4 -5% |
| Colorchecker dE 2000 max. * | 10.89 | 9.09 17% | 22.81 -109% | 9.36 14% |
| Greyscale dE 2000 * | 4.25 | 4 6% | 15.19 -257% | 5.37 -26% |
| Gamma | 2.61 84% | 2.46 89% | 2.13 103% | 2.58 85% |
| CCT | 6603 98% | 6441 101% | 17407 37% | 6795 96% |
| Color Space (Percent of AdobeRGB 1998) (%) | 40 | 39 -2% | 35 -12% | 37 -7% |
| Color Space (Percent of sRGB) (%) | 63 | 60 -5% | 55 -13% | 58 -8% |
| Totalt genomsnitt (program/inställningar) | 5% /
12% | -18% /
-38% | 2% /
3% |
* ... mindre är bättre
Visa svarstider
| ↔ Svarstid svart till vitt | ||
|---|---|---|
| 32 ms ... stiga ↗ och falla ↘ kombinerat | ↗ 18 ms stiga | 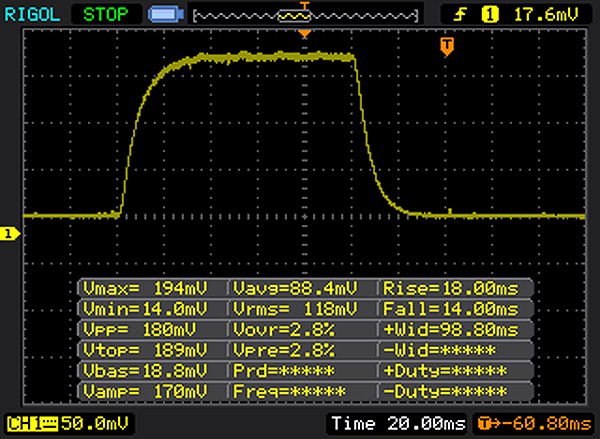 |
| ↘ 14 ms hösten | ||
| Skärmen visar långsamma svarsfrekvenser i våra tester och kommer att vara otillfredsställande för spelare. I jämförelse sträcker sig alla testade enheter från 0.1 (minst) till 240 (maximalt) ms. » 86 % av alla enheter är bättre. Detta innebär att den uppmätta svarstiden är sämre än genomsnittet av alla testade enheter (19.8 ms). | ||
| ↔ Svarstid 50 % grått till 80 % grått | ||
| 45 ms ... stiga ↗ och falla ↘ kombinerat | ↗ 27 ms stiga | 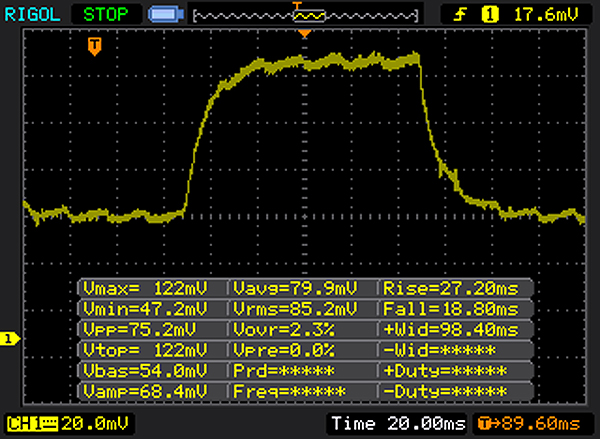 |
| ↘ 18 ms hösten | ||
| Skärmen visar långsamma svarsfrekvenser i våra tester och kommer att vara otillfredsställande för spelare. I jämförelse sträcker sig alla testade enheter från 0.165 (minst) till 636 (maximalt) ms. » 77 % av alla enheter är bättre. Detta innebär att den uppmätta svarstiden är sämre än genomsnittet av alla testade enheter (30.9 ms). | ||
Skärmflimmer / PWM (Puls-Width Modulation)
| Skärmflimmer / PWM upptäckt | 25000 Hz | ≤ 80 % ljusstyrka inställning | 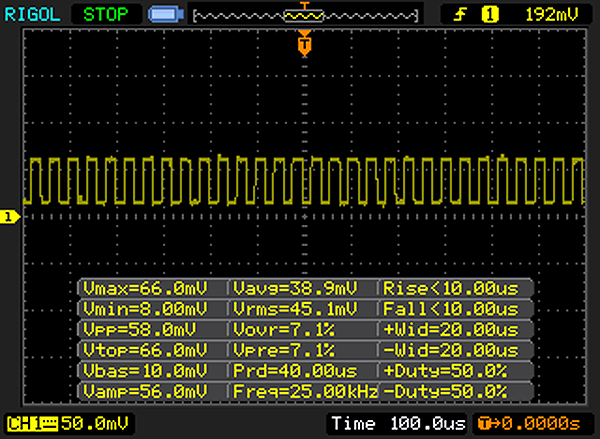 |
Displayens bakgrundsbelysning flimrar vid 25000 Hz (i värsta fall, t.ex. med PWM) Flimrande upptäckt vid en ljusstyrkeinställning på 80 % och lägre. Det ska inte finnas något flimmer eller PWM över denna ljusstyrkeinställning. Frekvensen för 25000 Hz är ganska hög, så de flesta användare som är känsliga för PWM bör inte märka något flimmer. Som jämförelse: 52 % av alla testade enheter använder inte PWM för att dämpa skärmen. Om PWM upptäcktes mättes ett medelvärde av 7744 (minst: 5 - maximum: 343500) Hz. | |||
| Cinebench R15 | |
| CPU Single 64Bit | |
| Dell Latitude 5580 | |
| HP 15-bs103ng | |
| Lenovo V510-15IKB 80WQ0002GE | |
| Acer TravelMate P2510-M-51ZQ | |
| CPU Multi 64Bit | |
| HP 15-bs103ng | |
| Dell Latitude 5580 | |
| Acer TravelMate P2510-M-51ZQ | |
| Lenovo V510-15IKB 80WQ0002GE | |
| PCMark 8 | |
| Home Score Accelerated v2 | |
| Acer TravelMate P2510-M-51ZQ | |
| Lenovo V510-15IKB 80WQ0002GE | |
| HP 15-bs103ng | |
| Dell Latitude 5580 | |
| Work Score Accelerated v2 | |
| HP 15-bs103ng | |
| Acer TravelMate P2510-M-51ZQ | |
| PCMark 8 Home Score Accelerated v2 | 3715 poäng | |
| PCMark 8 Work Score Accelerated v2 | 4592 poäng | |
Hjälp | ||
| Acer TravelMate P2510-M-51ZQ SK Hynix HFS256G39TND-N210A | HP 15-bs103ng Samsung SSD PM871a MZNLN256HMHQ | Lenovo V510-15IKB 80WQ0002GE Samsung CM871a MZNTY256HDHP | |
|---|---|---|---|
| CrystalDiskMark 3.0 | 23% | 24% | |
| Read Seq (MB/s) | 498.1 | 504 1% | 532 7% |
| Write Seq (MB/s) | 260.1 | 466.2 79% | 511 96% |
| Read 512 (MB/s) | 328.5 | 443.7 35% | 414.8 26% |
| Write 512 (MB/s) | 260.9 | 398.4 53% | 307.7 18% |
| Read 4k (MB/s) | 32.59 | 38.81 19% | 39.51 21% |
| Write 4k (MB/s) | 84.2 | 94.6 12% | 108.1 28% |
| Read 4k QD32 (MB/s) | 359.7 | 295.2 -18% | 361.6 1% |
| Write 4k QD32 (MB/s) | 262 | 266.6 2% | 253 -3% |

| 3DMark 11 - 1280x720 Performance GPU | |
| HP 15-bs103ng | |
| Acer TravelMate P2510-M-51ZQ | |
| Lenovo V510-15IKB 80WQ0002GE | |
| Dell Latitude 5580 | |
| 3DMark | |
| 1280x720 Cloud Gate Standard Graphics | |
| Acer TravelMate P2510-M-51ZQ | |
| HP 15-bs103ng | |
| 1920x1080 Fire Strike Graphics | |
| Acer TravelMate P2510-M-51ZQ | |
| HP 15-bs103ng | |
| 3DMark 11 Performance | 1692 poäng | |
| 3DMark Cloud Gate Standard Score | 6501 poäng | |
| 3DMark Fire Strike Score | 938 poäng | |
Hjälp | ||
| låg | med. | hög | ultra | |
|---|---|---|---|---|
| The Witcher 3 (2015) | 14.9 | |||
| Rise of the Tomb Raider (2016) | 18.9 | |||
| Farming Simulator 17 (2016) | 85.5 | 55.4 | 22.8 |
Ljudnivå
| Låg belastning |
| 31.8 / 31.8 / 31.8 dB(A) |
| Hög belastning |
| 36.6 / 36.5 dB(A) |
 | ||
30 dB tyst 40 dB(A) hörbar 50 dB(A) högt ljud |
||
min: | ||
(+) Den maximala temperaturen på ovansidan är 32 °C / 90 F, jämfört med genomsnittet av 34.3 °C / 94 F , allt från 21.2 till 62.5 °C för klassen Office.
(+) Botten värms upp till maximalt 35.5 °C / 96 F, jämfört med genomsnittet av 36.8 °C / 98 F
(+) Vid tomgångsbruk är medeltemperaturen för ovansidan 23.9 °C / 75 F, jämfört med enhetsgenomsnittet på 29.5 °C / ### class_avg_f### F.
(+) Handledsstöden och pekplattan är kallare än hudtemperaturen med maximalt 23.9 °C / 75 F och är därför svala att ta på.
(+) Medeltemperaturen för handledsstödsområdet på liknande enheter var 27.6 °C / 81.7 F (+3.7 °C / 6.7 F).
Acer TravelMate P2510-M-51ZQ ljudanalys
(-) | inte särskilt höga högtalare (70.8 dB)
Bas 100 - 315 Hz
(-) | nästan ingen bas - i genomsnitt 16.3% lägre än medianen
(+) | basen är linjär (5.4% delta till föregående frekvens)
Mellan 400 - 2000 Hz
(±) | reducerade mids - i genomsnitt 5.1% lägre än median
(+) | mids är linjära (4.7% delta till föregående frekvens)
Högsta 2 - 16 kHz
(+) | balanserade toppar - endast 3.6% från medianen
(+) | toppar är linjära (3.4% delta till föregående frekvens)
Totalt 100 - 16 000 Hz
(±) | linjäriteten för det totala ljudet är genomsnittlig (18.4% skillnad mot median)
Jämfört med samma klass
» 33% av alla testade enheter i den här klassen var bättre, 7% liknande, 59% sämre
» Den bästa hade ett delta på 7%, genomsnittet var 21%, sämst var 53%
Jämfört med alla testade enheter
» 41% av alla testade enheter var bättre, 8% liknande, 51% sämre
» Den bästa hade ett delta på 4%, genomsnittet var 23%, sämst var 134%
Dell Latitude 5580 ljudanalys
(-) | inte särskilt höga högtalare (71 dB)
Bas 100 - 315 Hz
(±) | reducerad bas - i genomsnitt 14.1% lägre än medianen
(+) | basen är linjär (4.8% delta till föregående frekvens)
Mellan 400 - 2000 Hz
(+) | balanserad mellan - endast 3.8% från medianen
(+) | mids är linjära (5.4% delta till föregående frekvens)
Högsta 2 - 16 kHz
(+) | balanserade toppar - endast 2% från medianen
(+) | toppar är linjära (2.1% delta till föregående frekvens)
Totalt 100 - 16 000 Hz
(±) | linjäriteten för det totala ljudet är genomsnittlig (15% skillnad mot median)
Jämfört med samma klass
» 14% av alla testade enheter i den här klassen var bättre, 4% liknande, 82% sämre
» Den bästa hade ett delta på 7%, genomsnittet var 21%, sämst var 53%
Jämfört med alla testade enheter
» 21% av alla testade enheter var bättre, 4% liknande, 75% sämre
» Den bästa hade ett delta på 4%, genomsnittet var 23%, sämst var 134%
HP 15-bs103ng ljudanalys
(-) | inte särskilt höga högtalare (70.5 dB)
Bas 100 - 315 Hz
(-) | nästan ingen bas - i genomsnitt 22.8% lägre än medianen
(±) | linjäriteten för basen är genomsnittlig (14.1% delta till föregående frekvens)
Mellan 400 - 2000 Hz
(+) | balanserad mellan - endast 2.1% från medianen
(+) | mids är linjära (5% delta till föregående frekvens)
Högsta 2 - 16 kHz
(+) | balanserade toppar - endast 2.4% från medianen
(±) | linjäriteten för toppar är genomsnittlig (7.7% delta till föregående frekvens)
Totalt 100 - 16 000 Hz
(±) | linjäriteten för det totala ljudet är genomsnittlig (18% skillnad mot median)
Jämfört med samma klass
» 30% av alla testade enheter i den här klassen var bättre, 7% liknande, 62% sämre
» Den bästa hade ett delta på 7%, genomsnittet var 21%, sämst var 53%
Jämfört med alla testade enheter
» 38% av alla testade enheter var bättre, 8% liknande, 54% sämre
» Den bästa hade ett delta på 4%, genomsnittet var 23%, sämst var 134%
Lenovo V510-15IKB 80WQ0002GE ljudanalys
(-) | inte särskilt höga högtalare (71 dB)
Bas 100 - 315 Hz
(±) | reducerad bas - i genomsnitt 11.7% lägre än medianen
(±) | linjäriteten för basen är genomsnittlig (8.8% delta till föregående frekvens)
Mellan 400 - 2000 Hz
(+) | balanserad mellan - endast 1.8% från medianen
(+) | mids är linjära (4% delta till föregående frekvens)
Högsta 2 - 16 kHz
(+) | balanserade toppar - endast 3.5% från medianen
(±) | linjäriteten för toppar är genomsnittlig (7.2% delta till föregående frekvens)
Totalt 100 - 16 000 Hz
(+) | det totala ljudet är linjärt (14.3% skillnad mot median)
Jämfört med samma klass
» 11% av alla testade enheter i den här klassen var bättre, 4% liknande, 85% sämre
» Den bästa hade ett delta på 7%, genomsnittet var 21%, sämst var 53%
Jämfört med alla testade enheter
» 18% av alla testade enheter var bättre, 4% liknande, 78% sämre
» Den bästa hade ett delta på 4%, genomsnittet var 23%, sämst var 134%
| Av/Standby | |
| Låg belastning | |
| Hög belastning |
|
Förklaring:
min: | |
| Acer TravelMate P2510-M-51ZQ i5-7200U, HD Graphics 620, SK Hynix HFS256G39TND-N210A, IPS, 1920x1080, 15.6" | Dell Latitude 5580 i5-7300U, HD Graphics 620, Toshiba MQ01ACF050, IPS, 1920x1080, 15.6" | HP 15-bs103ng i5-8250U, Radeon 520, Samsung SSD PM871a MZNLN256HMHQ, TN LED, 1920x1080, 15.6" | Lenovo V510-15IKB 80WQ0002GE i5-7200U, HD Graphics 620, Samsung CM871a MZNTY256HDHP, IPS, 1920x1080, 15.6" | |
|---|---|---|---|---|
| Power Consumption | -25% | -3% | -20% | |
| Idle Minimum * (Watt) | 3.4 | 4.3 -26% | 3.2 6% | 4 -18% |
| Idle Average * (Watt) | 5.8 | 10.1 -74% | 5.8 -0% | 9.6 -66% |
| Idle Maximum * (Watt) | 8 | 11.8 -48% | 6.3 21% | 9.7 -21% |
| Load Average * (Watt) | 38 | 32 16% | 34 11% | 27.7 27% |
| Load Maximum * (Watt) | 32 | 29 9% | 49 -53% | 38.4 -20% |
* ... mindre är bättre
| Acer TravelMate P2510-M-51ZQ i5-7200U, HD Graphics 620, 48 Wh | Dell Latitude 5580 i5-7300U, HD Graphics 620, 68 Wh | HP 15-bs103ng i5-8250U, Radeon 520, 41.6 Wh | Lenovo V510-15IKB 80WQ0002GE i5-7200U, HD Graphics 620, 32 Wh | |
|---|---|---|---|---|
| Batteridrifttid | 16% | -8% | -57% | |
| Reader / Idle (h) | 15.2 | 14.8 -3% | ||
| WiFi v1.3 (h) | 8.8 | 10.2 16% | 7.9 -10% | 3.8 -57% |
| Load (h) | 1.9 | 1.7 -11% | ||
| H.264 (h) | 7.6 |
För
Emot
Det här är en förkortad version av denna recension. Läs originaltexten på engelska här.
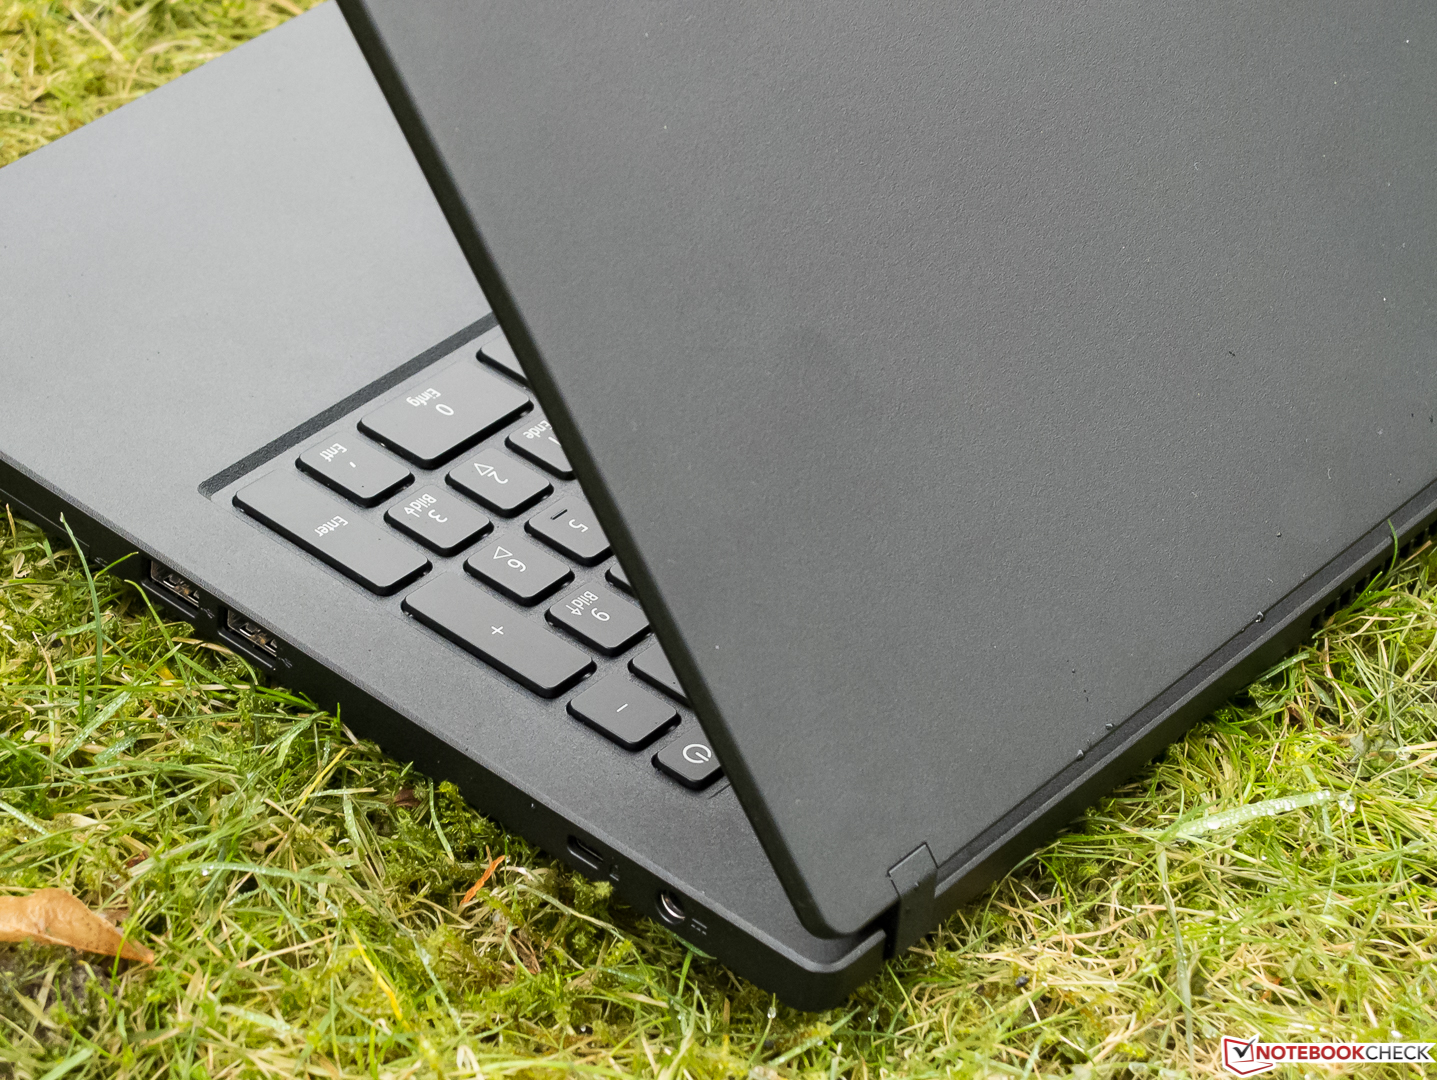
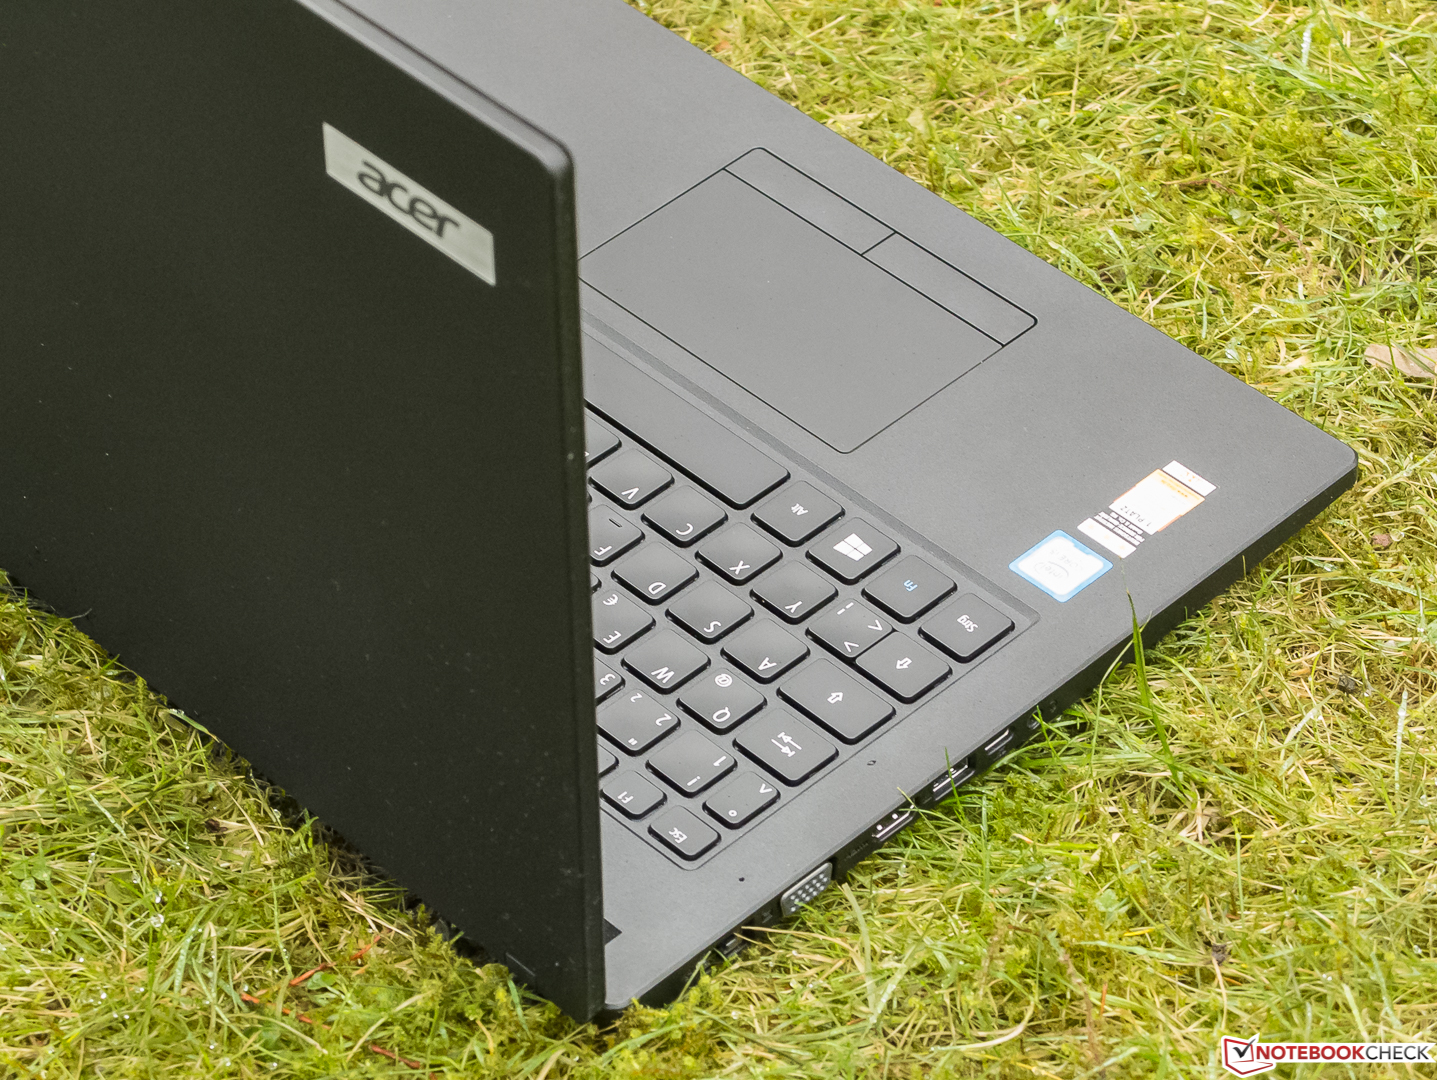
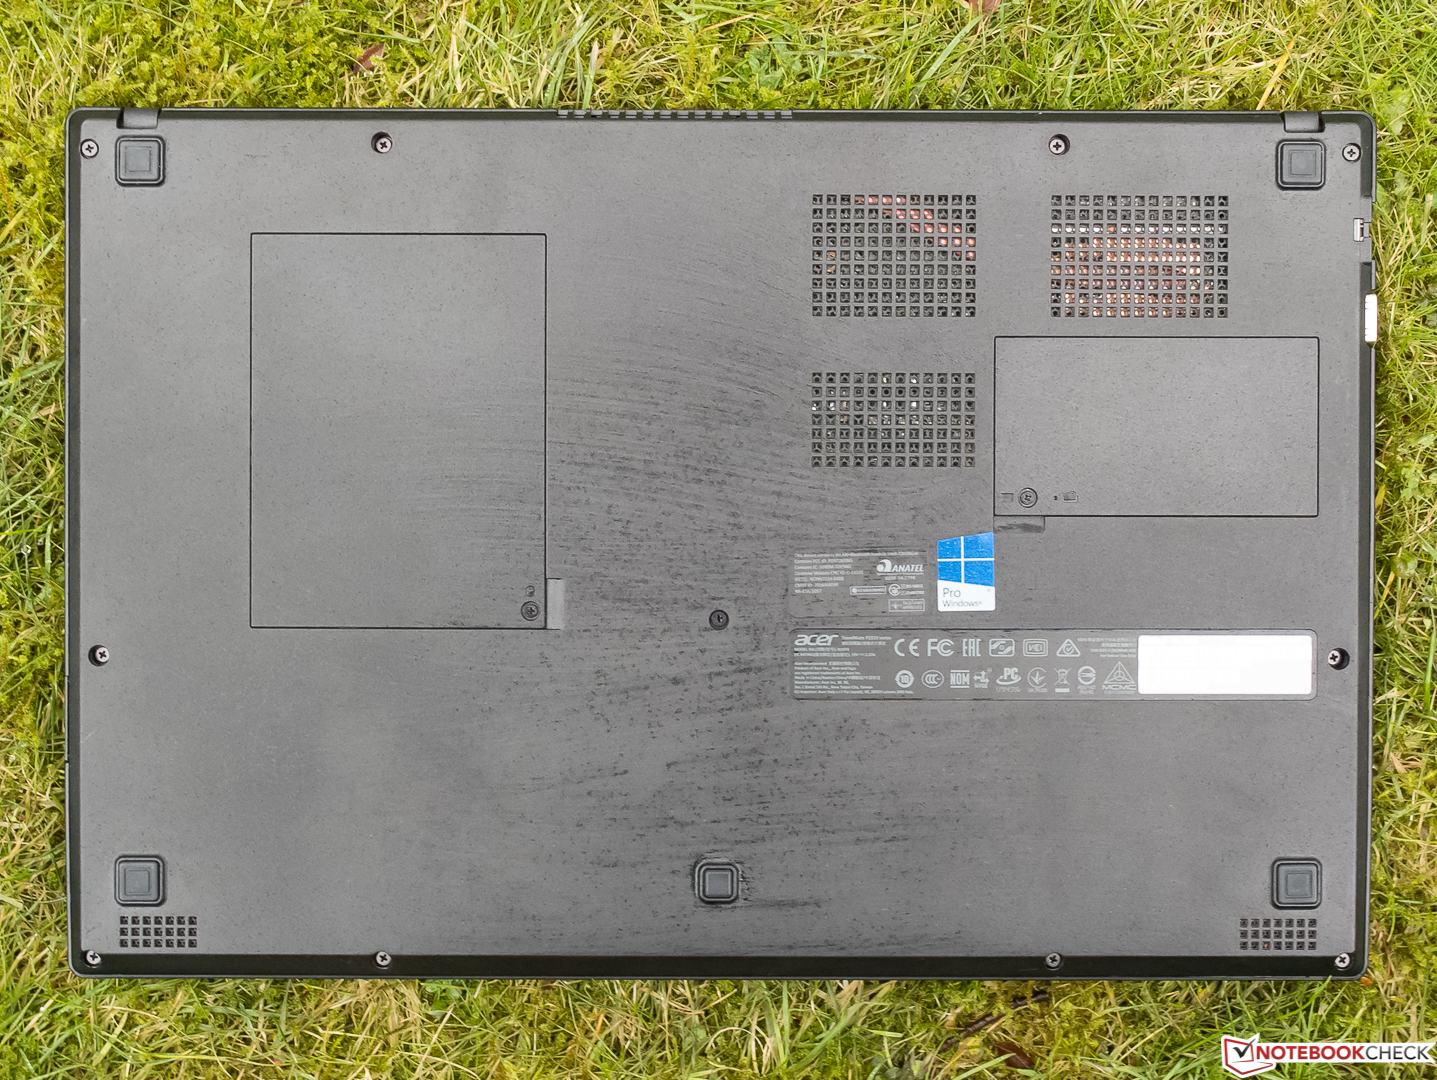
Huruvida problemen med det böjda höljet bara rörde vår testenhet eller inte så måste vi alltid utvärdera det som tilldelats oss. Poängen i denna kategori blir motsvarande låga.
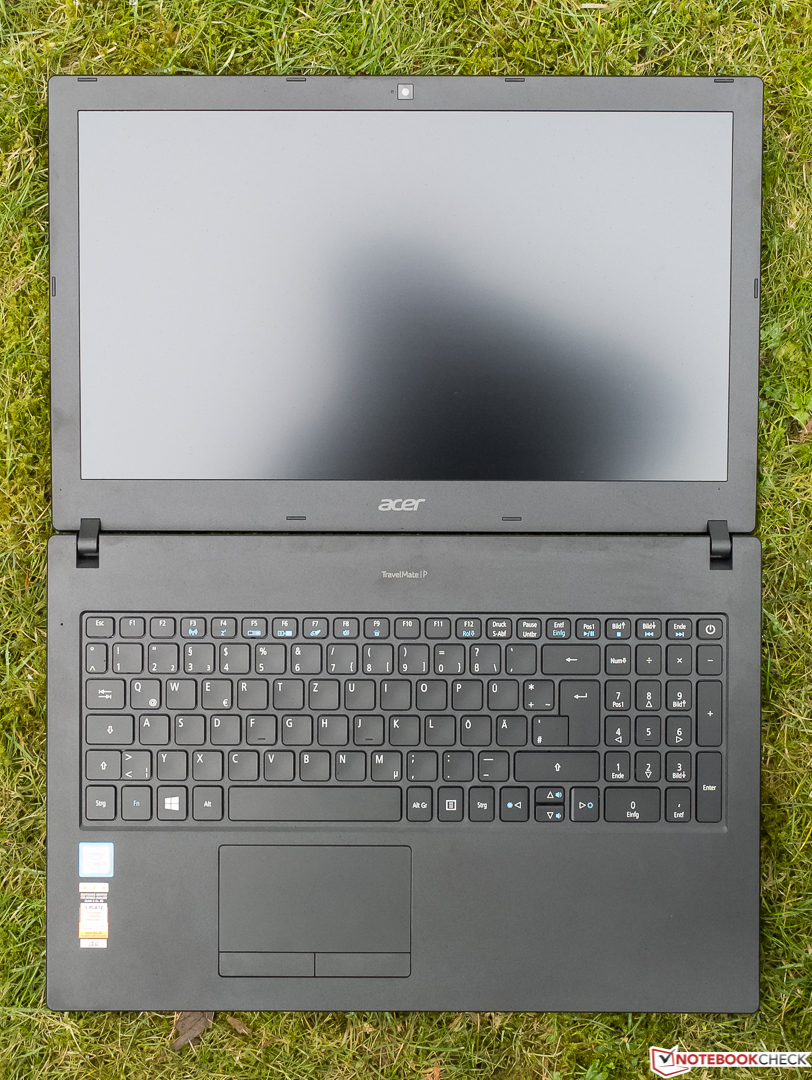
Om vi lägger höljet åt sidan så får vi ett väldigt positivt intryck, särskilt med tanke på det låga priset för denna instegsmodell. Budgetmedvetna köpare med kontors-ambitioner kommer troligen har förbiseende med skärmens svagheter samt den långsamma kortläsaren. Fördelarna från listan över det positiva såsom bra inmatningsenheter, snabbt WLAN, TPM och väldigt hygglig batteritid är troligen viktigare då. Från en teknisk synvinkel ser allt bra ut och TravelMate erbjuder konstant prestanda samtidigt som den håller sig tyst och sval.
Med TravelMate P2510-M-51ZQ presenterar Acer faktiskt en framgångsrik kontorslaptop med ett bra förhållande mellan pris och prestanda, men på grund av dom betydande kvalitetesdefekterna på vår testenhet så måste vi hålla inne med vår köprekommendation.
Acer TravelMate P2510-M-51ZQ
- 03/03/2018 v6 (old)
Sven Kloevekorn