Test: Dell Latitude 5490 (i5-8350U, FHD) Laptop (Sammanfattning)
| SD Card Reader | |
| average JPG Copy Test (av. of 3 runs) | |
| Dell Latitude 5490-TD70X (Toshiba Exceria Pro SDXC 64 GB UHS-II) | |
| Dell Latitude 5480 (Toshiba Exceria Pro SDXC 64 GB UHS-II) | |
| Acer TravelMate P648-G2-M-73T0 (Toshiba Exceria Pro SDXC 64 GB UHS-II) | |
| Lenovo ThinkPad T470-20HD002HGE (Toshiba Exceria Pro SDXC 64 GB UHS-II) | |
| HP EliteBook 840 G4-Z2V49ET ABD (Toshiba Exceria Pro SDXC 64 GB UHS-II) | |
| Fujitsu LifeBook U747 (Toshiba Exceria Pro SDXC 64 GB UHS-II) | |
| Genomsnitt av klass Office (19.8 - 198.5, n=22, senaste 2 åren) | |
| maximum AS SSD Seq Read Test (1GB) | |
| Dell Latitude 5480 (Toshiba Exceria Pro SDXC 64 GB UHS-II) | |
| Dell Latitude 5490-TD70X (Toshiba Exceria Pro SDXC 64 GB UHS-II) | |
| Lenovo ThinkPad T470-20HD002HGE (Toshiba Exceria Pro SDXC 64 GB UHS-II) | |
| Acer TravelMate P648-G2-M-73T0 (Toshiba Exceria Pro SDXC 64 GB UHS-II) | |
| HP EliteBook 840 G4-Z2V49ET ABD (Toshiba Exceria Pro SDXC 64 GB UHS-II) | |
| Fujitsu LifeBook U747 (Toshiba Exceria Pro SDXC 64 GB UHS-II) | |
| Genomsnitt av klass Office (27.4 - 249, n=21, senaste 2 åren) | |
| |||||||||||||||||||||||||
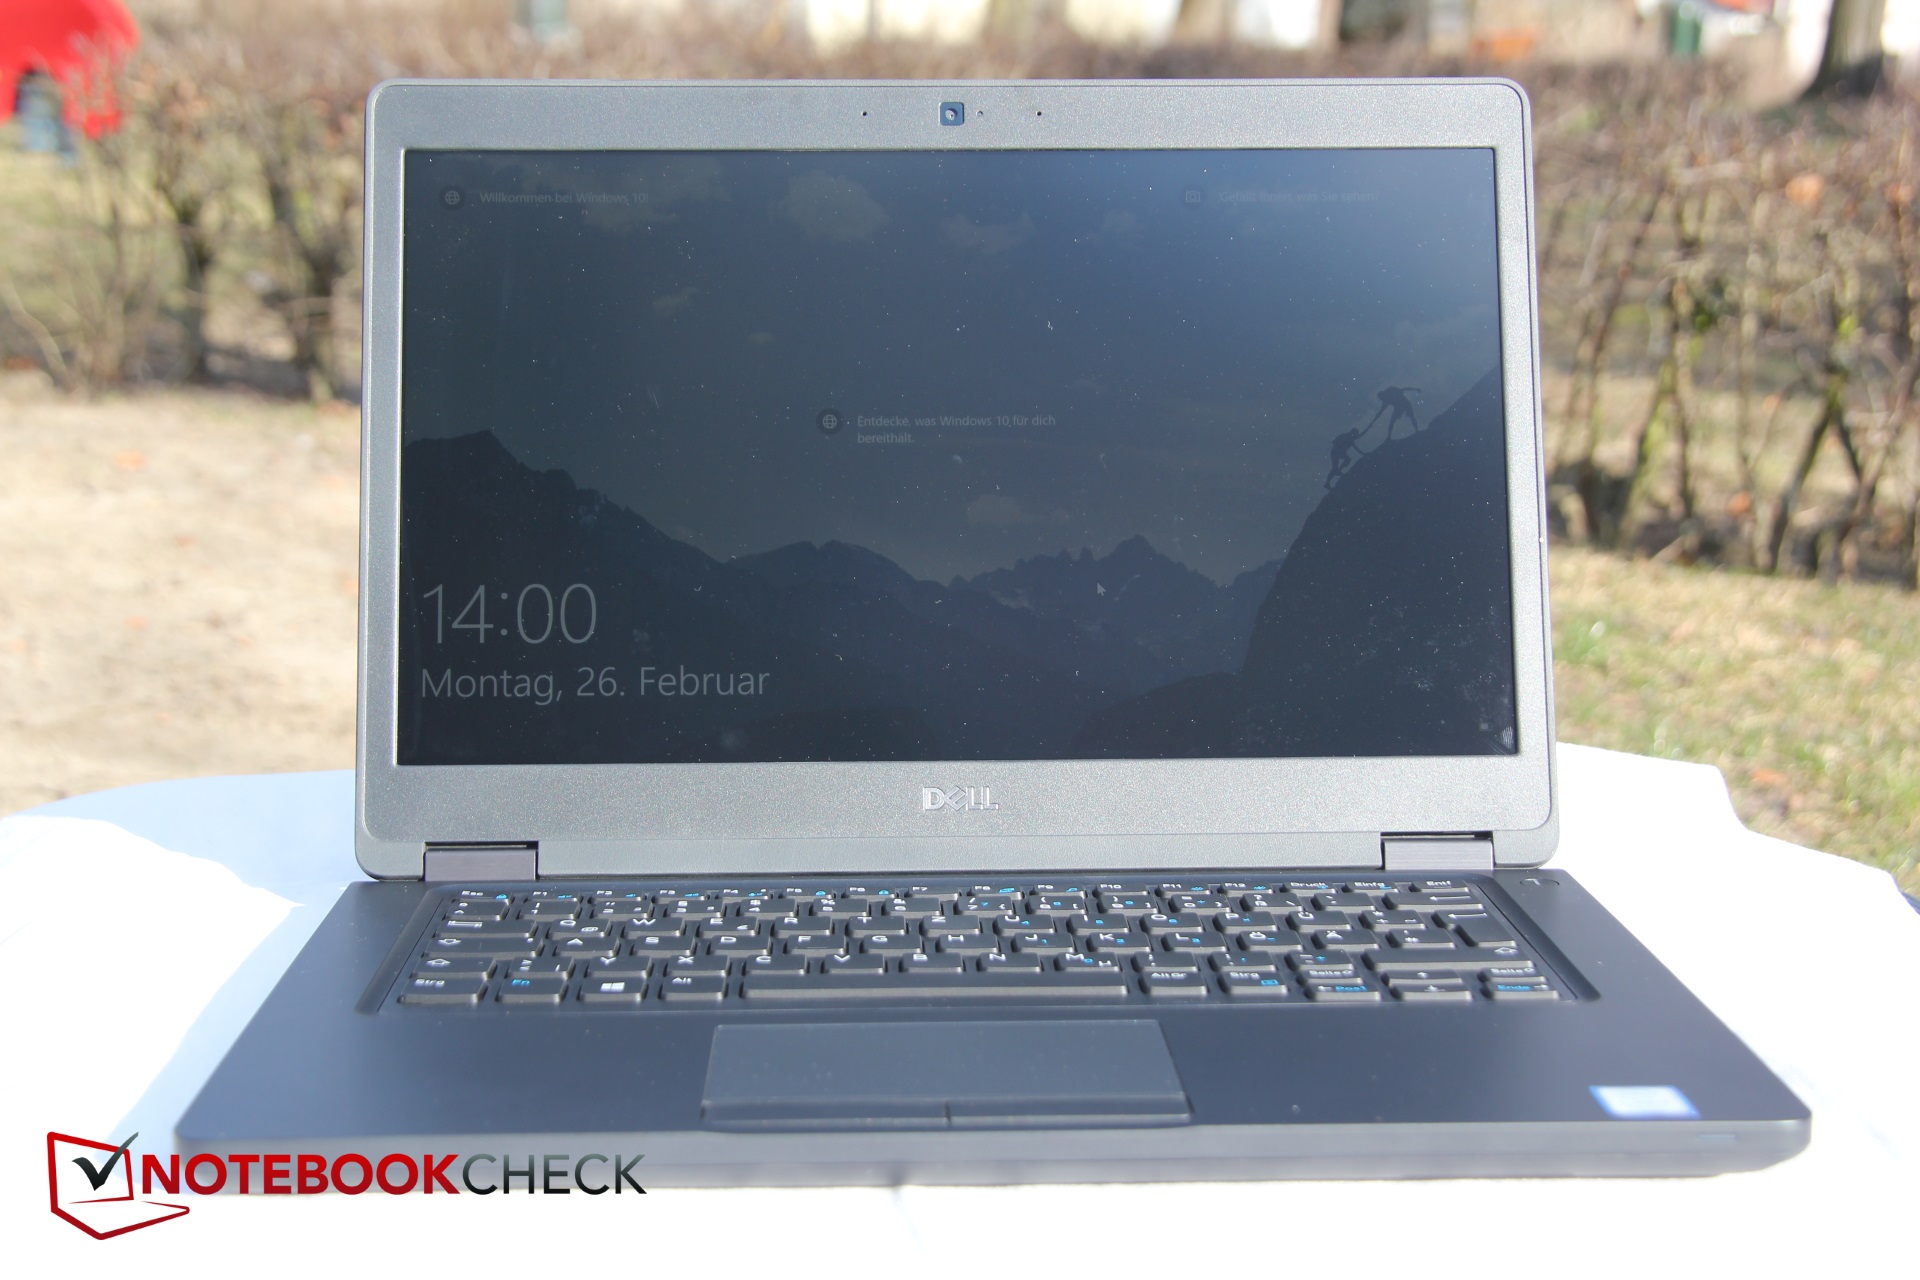
Distribution av ljusstyrkan: 88 %
Mitt på batteriet: 223 cd/m²
Kontrast: 1195:1 (Svärta: 0.19 cd/m²)
ΔE ColorChecker Calman: 5.6 | ∀{0.5-29.43 Ø4.71}
ΔE Greyscale Calman: 2.4 | ∀{0.09-98 Ø4.96}
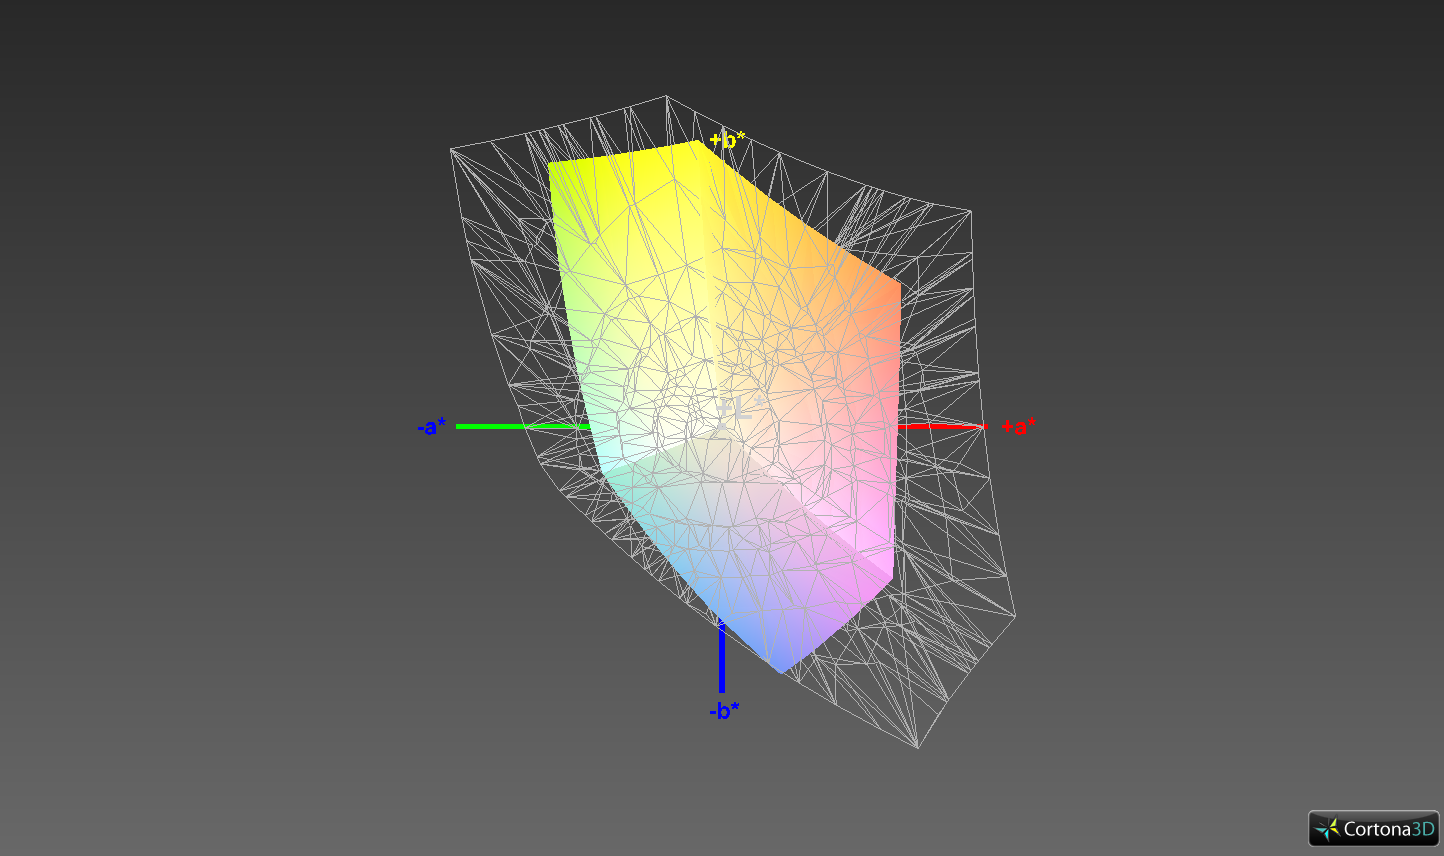
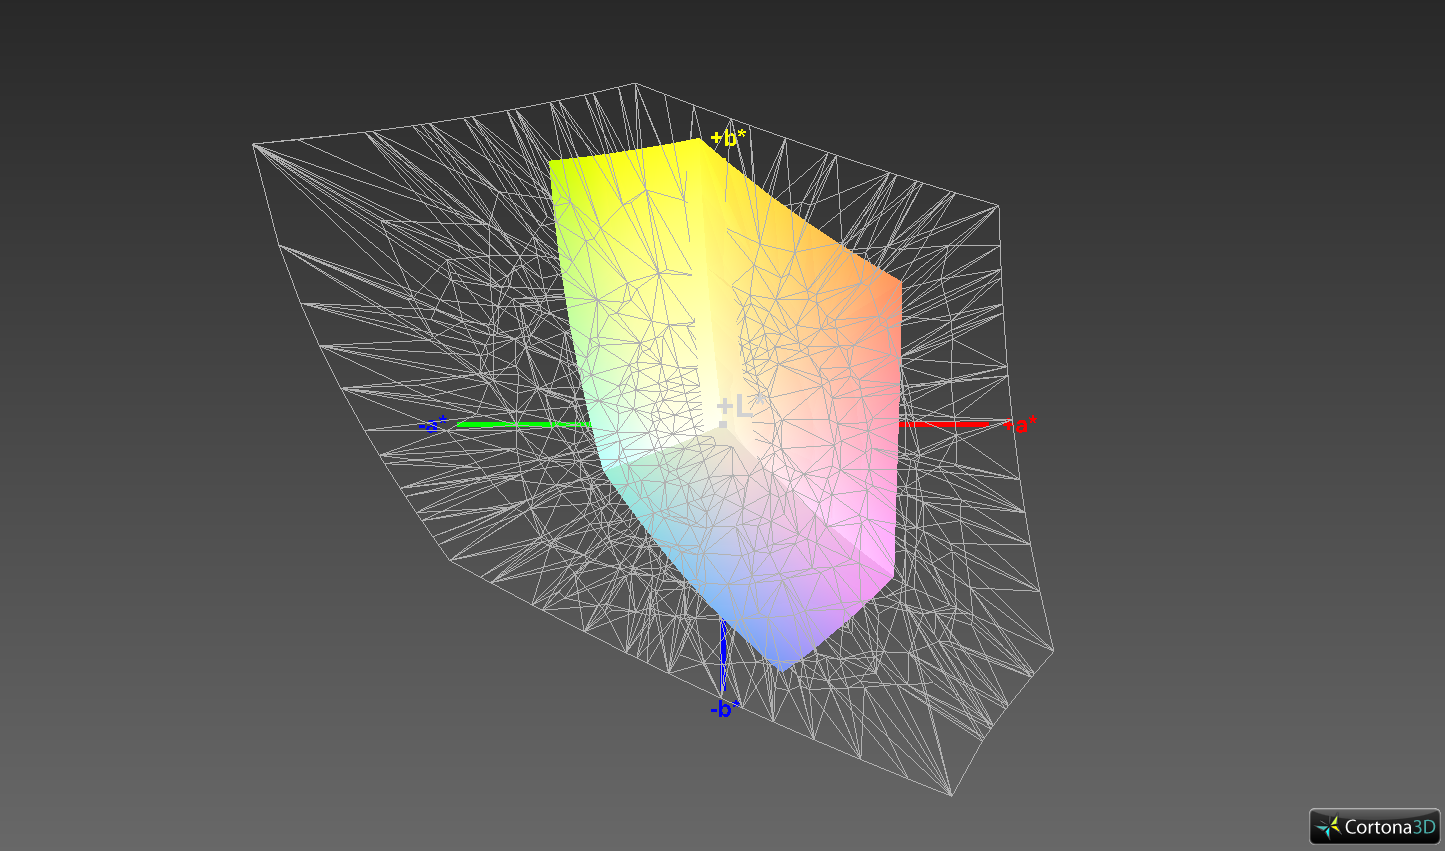
54.4% sRGB (Argyll 1.6.3 3D)
34.5% AdobeRGB 1998 (Argyll 1.6.3 3D)
37.48% AdobeRGB 1998 (Argyll 3D)
54.6% sRGB (Argyll 3D)
36.28% Display P3 (Argyll 3D)
Gamma: 2.44
CCT: 6506 K
| Dell Latitude 5490-TD70X AU Optronics AUO263D, , 1920x1080, 14" | Dell Latitude 5480 LG Philips LGD0553, , 1920x1080, 14" | HP EliteBook 840 G4-Z2V49ET ABD AUO123D, , 1920x1080, 14" | Acer TravelMate P648-G2-M-73T0 1920x1080, 14" | Lenovo ThinkPad T470-20HD002HGE N140HCA-EAB, , 1920x1080, 14" | Fujitsu LifeBook U747 LG LP140WF3, , 1920x1080, 14" | |
|---|---|---|---|---|---|---|
| Display | 12% | 52% | 76% | 14% | 67% | |
| Display P3 Coverage (%) | 36.28 | 40.62 12% | 55.8 54% | 67.2 85% | 41.6 15% | 66.1 82% |
| sRGB Coverage (%) | 54.6 | 61.2 12% | 80.7 48% | 90.8 66% | 61.9 13% | 84.8 55% |
| AdobeRGB 1998 Coverage (%) | 37.48 | 41.96 12% | 57.7 54% | 66.4 77% | 43.06 15% | 62 65% |
| Response Times | 23% | 22% | 20% | 1% | 25% | |
| Response Time Grey 50% / Grey 80% * (ms) | 46.9 ? | 32.8 ? 30% | 39 ? 17% | 38 ? 19% | 41.6 ? 11% | 36 ? 23% |
| Response Time Black / White * (ms) | 31.2 ? | 26.4 ? 15% | 23 ? 26% | 25 ? 20% | 34 ? -9% | 23.2 ? 26% |
| PWM Frequency (Hz) | ||||||
| Screen | -3% | -60% | 14% | -9% | 10% | |
| Brightness middle (cd/m²) | 227 | 215.9 -5% | 346 52% | 275 21% | 306 35% | 291 28% |
| Brightness (cd/m²) | 211 | 205 -3% | 317 50% | 253 20% | 287 36% | 296 40% |
| Brightness Distribution (%) | 88 | 90 2% | 86 -2% | 85 -3% | 88 0% | 84 -5% |
| Black Level * (cd/m²) | 0.19 | 0.22 -16% | 0.86 -353% | 0.25 -32% | 0.3 -58% | 0.32 -68% |
| Contrast (:1) | 1195 | 981 -18% | 402 -66% | 1100 -8% | 1020 -15% | 909 -24% |
| Colorchecker dE 2000 * | 5.6 | 5.1 9% | 8.64 -54% | 3.49 38% | 6.2 -11% | 4.3 23% |
| Colorchecker dE 2000 max. * | 22.4 | 15.6 30% | 13.58 39% | 6.77 70% | 13.6 39% | 7.5 67% |
| Greyscale dE 2000 * | 2.4 | 4 -67% | 11.24 -368% | 4.91 -105% | 5.8 -142% | 4.3 -79% |
| Gamma | 2.44 90% | 2.41 91% | 2.62 84% | 2.39 92% | 2.04 108% | 2.31 95% |
| CCT | 6506 100% | 6856 95% | 12530 52% | 6271 104% | 6277 104% | 6529 100% |
| Color Space (Percent of AdobeRGB 1998) (%) | 34.5 | 41.96 22% | 52 51% | 59 71% | 39.62 15% | 55.46 61% |
| Color Space (Percent of sRGB) (%) | 54.4 | 61.15 12% | 80 47% | 91 67% | 61.44 13% | 84.77 56% |
| Totalt genomsnitt (program/inställningar) | 11% /
3% | 5% /
-27% | 37% /
27% | 2% /
-3% | 34% /
23% |
* ... mindre är bättre
Visa svarstider
| ↔ Svarstid svart till vitt | ||
|---|---|---|
| 31.2 ms ... stiga ↗ och falla ↘ kombinerat | ↗ 18 ms stiga | 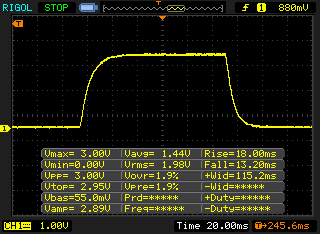 |
| ↘ 13.2 ms hösten | ||
| Skärmen visar långsamma svarsfrekvenser i våra tester och kommer att vara otillfredsställande för spelare. I jämförelse sträcker sig alla testade enheter från 0.1 (minst) till 240 (maximalt) ms. » 84 % av alla enheter är bättre. Detta innebär att den uppmätta svarstiden är sämre än genomsnittet av alla testade enheter (19.8 ms). | ||
| ↔ Svarstid 50 % grått till 80 % grått | ||
| 46.9 ms ... stiga ↗ och falla ↘ kombinerat | ↗ 23.6 ms stiga | 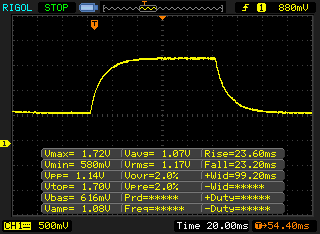 |
| ↘ 23.3 ms hösten | ||
| Skärmen visar långsamma svarsfrekvenser i våra tester och kommer att vara otillfredsställande för spelare. I jämförelse sträcker sig alla testade enheter från 0.165 (minst) till 636 (maximalt) ms. » 81 % av alla enheter är bättre. Detta innebär att den uppmätta svarstiden är sämre än genomsnittet av alla testade enheter (31 ms). | ||
Skärmflimmer / PWM (Puls-Width Modulation)
| Skärmflimmer / PWM upptäcktes inte | 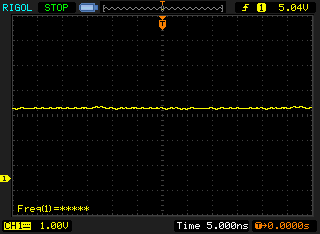 | ||
Som jämförelse: 52 % av alla testade enheter använder inte PWM för att dämpa skärmen. Om PWM upptäcktes mättes ett medelvärde av 7757 (minst: 5 - maximum: 343500) Hz. | |||

| Cinebench R10 | |
| Rendering Single CPUs 64Bit | |
| Genomsnitt av klass Office (11106 - 15443, n=7, senaste 2 åren) | |
| Dell Latitude 5490-TD70X | |
| Genomsnitt Intel Core i5-8350U (n=1) | |
| Rendering Multiple CPUs 64Bit | |
| Genomsnitt av klass Office (48700 - 80160, n=7, senaste 2 åren) | |
| Dell Latitude 5490-TD70X | |
| Genomsnitt Intel Core i5-8350U (n=1) | |
| PCMark 8 Home Score Accelerated v2 | 3695 poäng | |
| PCMark 8 Work Score Accelerated v2 | 4774 poäng | |
Hjälp | ||
| Dell Latitude 5490-TD70X Toshiba KSG60ZMV512G | Dell Latitude 5480 Toshiba SG5 256GB THNSNK256GVN8 | HP EliteBook 840 G4-Z2V49ET ABD Samsung PM961 MZVLW256HEHP | Acer TravelMate P648-G2-M-73T0 SK Hynix HFS256G39TND-N210A | Lenovo ThinkPad T470-20HD002HGE Samsung PM961 NVMe MZVLW512HMJP | Fujitsu LifeBook U747 Samsung MZYTY256HDHP | |
|---|---|---|---|---|---|---|
| CrystalDiskMark 3.0 | -6% | 131% | 1% | 100% | 6% | |
| Read Seq (MB/s) | 465.1 | 469.4 1% | 1819 291% | 518 11% | 1155 148% | 504 8% |
| Write Seq (MB/s) | 425 | 264.8 -38% | 1263 197% | 267.2 -37% | 1076 153% | 497.8 17% |
| Read 512 (MB/s) | 410.1 | 408.1 0% | 922 125% | 562 37% | 811 98% | 396.7 -3% |
| Write 512 (MB/s) | 360.7 | 265.5 -26% | 804 123% | 263.5 -27% | 862 139% | 283.4 -21% |
| Read 4k (MB/s) | 27.34 | 24.66 -10% | 61.4 125% | 32.88 20% | 55.5 103% | 35.73 31% |
| Write 4k (MB/s) | 89 | 114.8 29% | 157.1 77% | 85.6 -4% | 134.6 51% | 87.8 -1% |
| Read 4k QD32 (MB/s) | 295.6 | 380.3 29% | 513 74% | 351.3 19% | 496.2 68% | 399.1 35% |
| Write 4k QD32 (MB/s) | 300.2 | 207.2 -31% | 410.2 37% | 265.2 -12% | 425.4 42% | 249.7 -17% |

| 3DMark 11 Performance | 1770 poäng | |
| 3DMark Cloud Gate Standard Score | 7903 poäng | |
| 3DMark Fire Strike Score | 918 poäng | |
Hjälp | ||
| låg | med. | hög | ultra | |
|---|---|---|---|---|
| The Witcher 3 (2015) | 14.61 | 9.63 | ||
| Rise of the Tomb Raider (2016) | 18.68 | 11.1 | 5.5 | |
| Rocket League (2017) | 57.4 | 21.47 | 15.01 |
| Rise of the Tomb Raider | |
| 1024x768 Lowest Preset | |
| Genomsnitt Intel UHD Graphics 620 (10.4 - 110.7, n=82) | |
| Dell Latitude 5490-TD70X | |
| Lenovo ThinkPad T470-20HD002HGE | |
| Acer TravelMate P648-G2-M-73T0 | |
| Fujitsu LifeBook U747 | |
| 1366x768 Medium Preset AF:2x | |
| Genomsnitt Intel UHD Graphics 620 (6.5 - 49.3, n=62) | |
| Lenovo ThinkPad T470-20HD002HGE | |
| Dell Latitude 5490-TD70X | |
| Acer TravelMate P648-G2-M-73T0 | |
| 1920x1080 High Preset AA:FX AF:4x | |
| Genomsnitt Intel UHD Graphics 620 (4.9 - 32, n=42) | |
| Dell Latitude 5490-TD70X | |
| Acer TravelMate P648-G2-M-73T0 | |
| Rocket League | |
| 1280x720 Performance | |
| Genomsnitt Intel UHD Graphics 620 (20.1 - 95, n=26) | |
| Dell Latitude 5490-TD70X | |
| 1920x1080 Performance | |
| Genomsnitt Intel UHD Graphics 620 (17.1 - 78.4, n=13) | |
| Dell Latitude 5490-TD70X | |
| 1920x1080 Quality AA:Medium FX | |
| Genomsnitt Intel UHD Graphics 620 (13.1 - 43, n=24) | |
| Dell Latitude 5490-TD70X | |
| 1920x1080 High Quality AA:High FX | |
| Genomsnitt Intel UHD Graphics 620 (13.2 - 24.7, n=21) | |
| Dell Latitude 5490-TD70X | |
| The Witcher 3 | |
| 1024x768 Low Graphics & Postprocessing | |
| Genomsnitt av klass Office (32.2 - 135, n=3, senaste 2 åren) | |
| Genomsnitt Intel UHD Graphics 620 (8.8 - 50.9, n=64) | |
| Dell Latitude 5490-TD70X | |
| Lenovo ThinkPad T470-20HD002HGE | |
| HP EliteBook 840 G4-Z2V49ET ABD | |
| 1366x768 Medium Graphics & Postprocessing | |
| Genomsnitt av klass Office (44.7 - 90.4, n=3, senaste 2 åren) | |
| Genomsnitt Intel UHD Graphics 620 (8 - 27.9, n=29) | |
| Dell Latitude 5490-TD70X | |
| Dell Latitude 5490-TD70X UHD Graphics 620, i5-8350U, Toshiba KSG60ZMV512G | Dell Latitude 5480 HD Graphics 620, i7-7600U, Toshiba SG5 256GB THNSNK256GVN8 | HP EliteBook 840 G4-Z2V49ET ABD HD Graphics 620, i5-7200U, Samsung PM961 MZVLW256HEHP | Acer TravelMate P648-G2-M-73T0 HD Graphics 620, i7-7500U, SK Hynix HFS256G39TND-N210A | Lenovo ThinkPad T470-20HD002HGE HD Graphics 620, i5-7200U, Samsung PM961 NVMe MZVLW512HMJP | Fujitsu LifeBook U747 HD Graphics 620, i5-7200U, Samsung MZYTY256HDHP | |
|---|---|---|---|---|---|---|
| Noise | -7% | 0% | 1% | 7% | 8% | |
| av / miljö * (dB) | 28.8 | 31 -8% | 30.6 -6% | 28 3% | 28.2 2% | |
| Idle Minimum * (dB) | 28.8 | 29.6 -3% | 31 -8% | 30.6 -6% | 28 3% | 28.2 2% |
| Idle Average * (dB) | 28.8 | 29.6 -3% | 31 -8% | 30.6 -6% | 28 3% | 28.2 2% |
| Idle Maximum * (dB) | 30.9 | 29.6 4% | 31 -0% | 31 -0% | 29.4 5% | 28.2 9% |
| Load Average * (dB) | 35.6 | 42 -18% | 33.5 6% | 34.5 3% | 31.4 12% | 31.2 12% |
| Load Maximum * (dB) | 41.4 | 47.1 -14% | 33.7 19% | 32.4 22% | 34.6 16% | 33 20% |
* ... mindre är bättre
Ljudnivå
| Låg belastning |
| 28.8 / 28.8 / 30.9 dB(A) |
| Hög belastning |
| 35.6 / 41.4 dB(A) |
 | ||
30 dB tyst 40 dB(A) hörbar 50 dB(A) högt ljud |
||
min: | ||
(+) Den maximala temperaturen på ovansidan är 38.3 °C / 101 F, jämfört med genomsnittet av 34.3 °C / 94 F , allt från 21.2 till 62.5 °C för klassen Office.
(±) Botten värms upp till maximalt 44.7 °C / 112 F, jämfört med genomsnittet av 36.8 °C / 98 F
(+) Vid tomgångsbruk är medeltemperaturen för ovansidan 22.9 °C / 73 F, jämfört med enhetsgenomsnittet på 29.5 °C / ### class_avg_f### F.
(+) Handledsstöden och pekplattan är kallare än hudtemperaturen med maximalt 31.2 °C / 88.2 F och är därför svala att ta på.
(-) Medeltemperaturen för handledsstödsområdet på liknande enheter var 27.5 °C / 81.5 F (-3.7 °C / -6.7 F).
Dell Latitude 5490-TD70X ljudanalys
(+) | högtalare kan spela relativt högt (89.7 dB)
Bas 100 - 315 Hz
(-) | nästan ingen bas - i genomsnitt 20% lägre än medianen
(+) | basen är linjär (6.7% delta till föregående frekvens)
Mellan 400 - 2000 Hz
(+) | balanserad mellan - endast 4.1% från medianen
(+) | mids är linjära (5.4% delta till föregående frekvens)
Högsta 2 - 16 kHz
(+) | balanserade toppar - endast 4.2% från medianen
(+) | toppar är linjära (5.8% delta till föregående frekvens)
Totalt 100 - 16 000 Hz
(±) | linjäriteten för det totala ljudet är genomsnittlig (15.4% skillnad mot median)
Jämfört med samma klass
» 16% av alla testade enheter i den här klassen var bättre, 4% liknande, 80% sämre
» Den bästa hade ett delta på 7%, genomsnittet var 21%, sämst var 53%
Jämfört med alla testade enheter
» 23% av alla testade enheter var bättre, 4% liknande, 73% sämre
» Den bästa hade ett delta på 4%, genomsnittet var 23%, sämst var 134%
Apple MacBook 12 (Early 2016) 1.1 GHz ljudanalys
(+) | högtalare kan spela relativt högt (83.6 dB)
Bas 100 - 315 Hz
(±) | reducerad bas - i genomsnitt 11.3% lägre än medianen
(±) | linjäriteten för basen är genomsnittlig (14.2% delta till föregående frekvens)
Mellan 400 - 2000 Hz
(+) | balanserad mellan - endast 2.4% från medianen
(+) | mids är linjära (5.5% delta till föregående frekvens)
Högsta 2 - 16 kHz
(+) | balanserade toppar - endast 2% från medianen
(+) | toppar är linjära (4.5% delta till föregående frekvens)
Totalt 100 - 16 000 Hz
(+) | det totala ljudet är linjärt (10.2% skillnad mot median)
Jämfört med samma klass
» 7% av alla testade enheter i den här klassen var bättre, 2% liknande, 90% sämre
» Den bästa hade ett delta på 5%, genomsnittet var 18%, sämst var 53%
Jämfört med alla testade enheter
» 5% av alla testade enheter var bättre, 1% liknande, 94% sämre
» Den bästa hade ett delta på 4%, genomsnittet var 23%, sämst var 134%
| Av/Standby | |
| Låg belastning | |
| Hög belastning |
|
Förklaring:
min: | |
| Dell Latitude 5490-TD70X i5-8350U, UHD Graphics 620, Toshiba KSG60ZMV512G, IPS, 1920x1080, 14" | Dell Latitude 5480 i7-7600U, HD Graphics 620, Toshiba SG5 256GB THNSNK256GVN8, IPS, 1920x1080, 14" | HP EliteBook 840 G4-Z2V49ET ABD i5-7200U, HD Graphics 620, Samsung PM961 MZVLW256HEHP, TN, 1920x1080, 14" | Acer TravelMate P648-G2-M-73T0 i7-7500U, HD Graphics 620, SK Hynix HFS256G39TND-N210A, IPS, 1920x1080, 14" | Lenovo ThinkPad T470-20HD002HGE i5-7200U, HD Graphics 620, Samsung PM961 NVMe MZVLW512HMJP, IPS, 1920x1080, 14" | Fujitsu LifeBook U747 i5-7200U, HD Graphics 620, Samsung MZYTY256HDHP, IPS LED, 1920x1080, 14" | |
|---|---|---|---|---|---|---|
| Power Consumption | -12% | 14% | -16% | 14% | -4% | |
| Idle Minimum * (Watt) | 3.3 | 6.64 -101% | 2.9 12% | 4.8 -45% | 3.21 3% | 4.11 -25% |
| Idle Average * (Watt) | 5.54 | 6.67 -20% | 5.6 -1% | 7.9 -43% | 6.15 -11% | 7.87 -42% |
| Idle Maximum * (Watt) | 6.59 | 7.78 -18% | 8.15 -24% | 10.7 -62% | 6.82 -3% | 8.74 -33% |
| Load Average * (Watt) | 42.4 | 30.83 27% | 30.6 28% | 35 17% | 28.5 33% | 30.2 29% |
| Load Maximum * (Watt) | 67.6 | 31.7 53% | 31 54% | 31.6 53% | 34.5 49% | 32.4 52% |
* ... mindre är bättre
| Dell Latitude 5490-TD70X i5-8350U, UHD Graphics 620, 68 Wh | Dell Latitude 5480 i7-7600U, HD Graphics 620, 68 Wh | HP EliteBook 840 G4-Z2V49ET ABD i5-7200U, HD Graphics 620, 51 Wh | Acer TravelMate P648-G2-M-73T0 i7-7500U, HD Graphics 620, 54 Wh | Lenovo ThinkPad T470-20HD002HGE i5-7200U, HD Graphics 620, 48 Wh | Fujitsu LifeBook U747 i5-7200U, HD Graphics 620, 50 Wh | Genomsnitt av klass Office | |
|---|---|---|---|---|---|---|---|
| Batteridrifttid | 23% | 2% | -12% | -20% | -29% | 3% | |
| Reader / Idle (h) | 25.9 | 24.1 -7% | 19.3 -25% | 18.1 -30% | 13 -50% | 24.5 ? -5% | |
| H.264 (h) | 13.2 | 9.9 -25% | 10.4 -21% | 8.2 -38% | 15.5 ? 17% | ||
| WiFi v1.3 (h) | 15 | 16.1 7% | 9.5 -37% | 11.2 -25% | 7.3 -51% | 7.2 -52% | 13.2 ? -12% |
| Load (h) | 1.6 | 2.7 69% | 3.1 94% | 1.9 19% | 1.8 13% | 2 25% | 1.808 ? 13% |
För
Emot
Läs den fullständiga versionen av den här recensionen på engelska här.
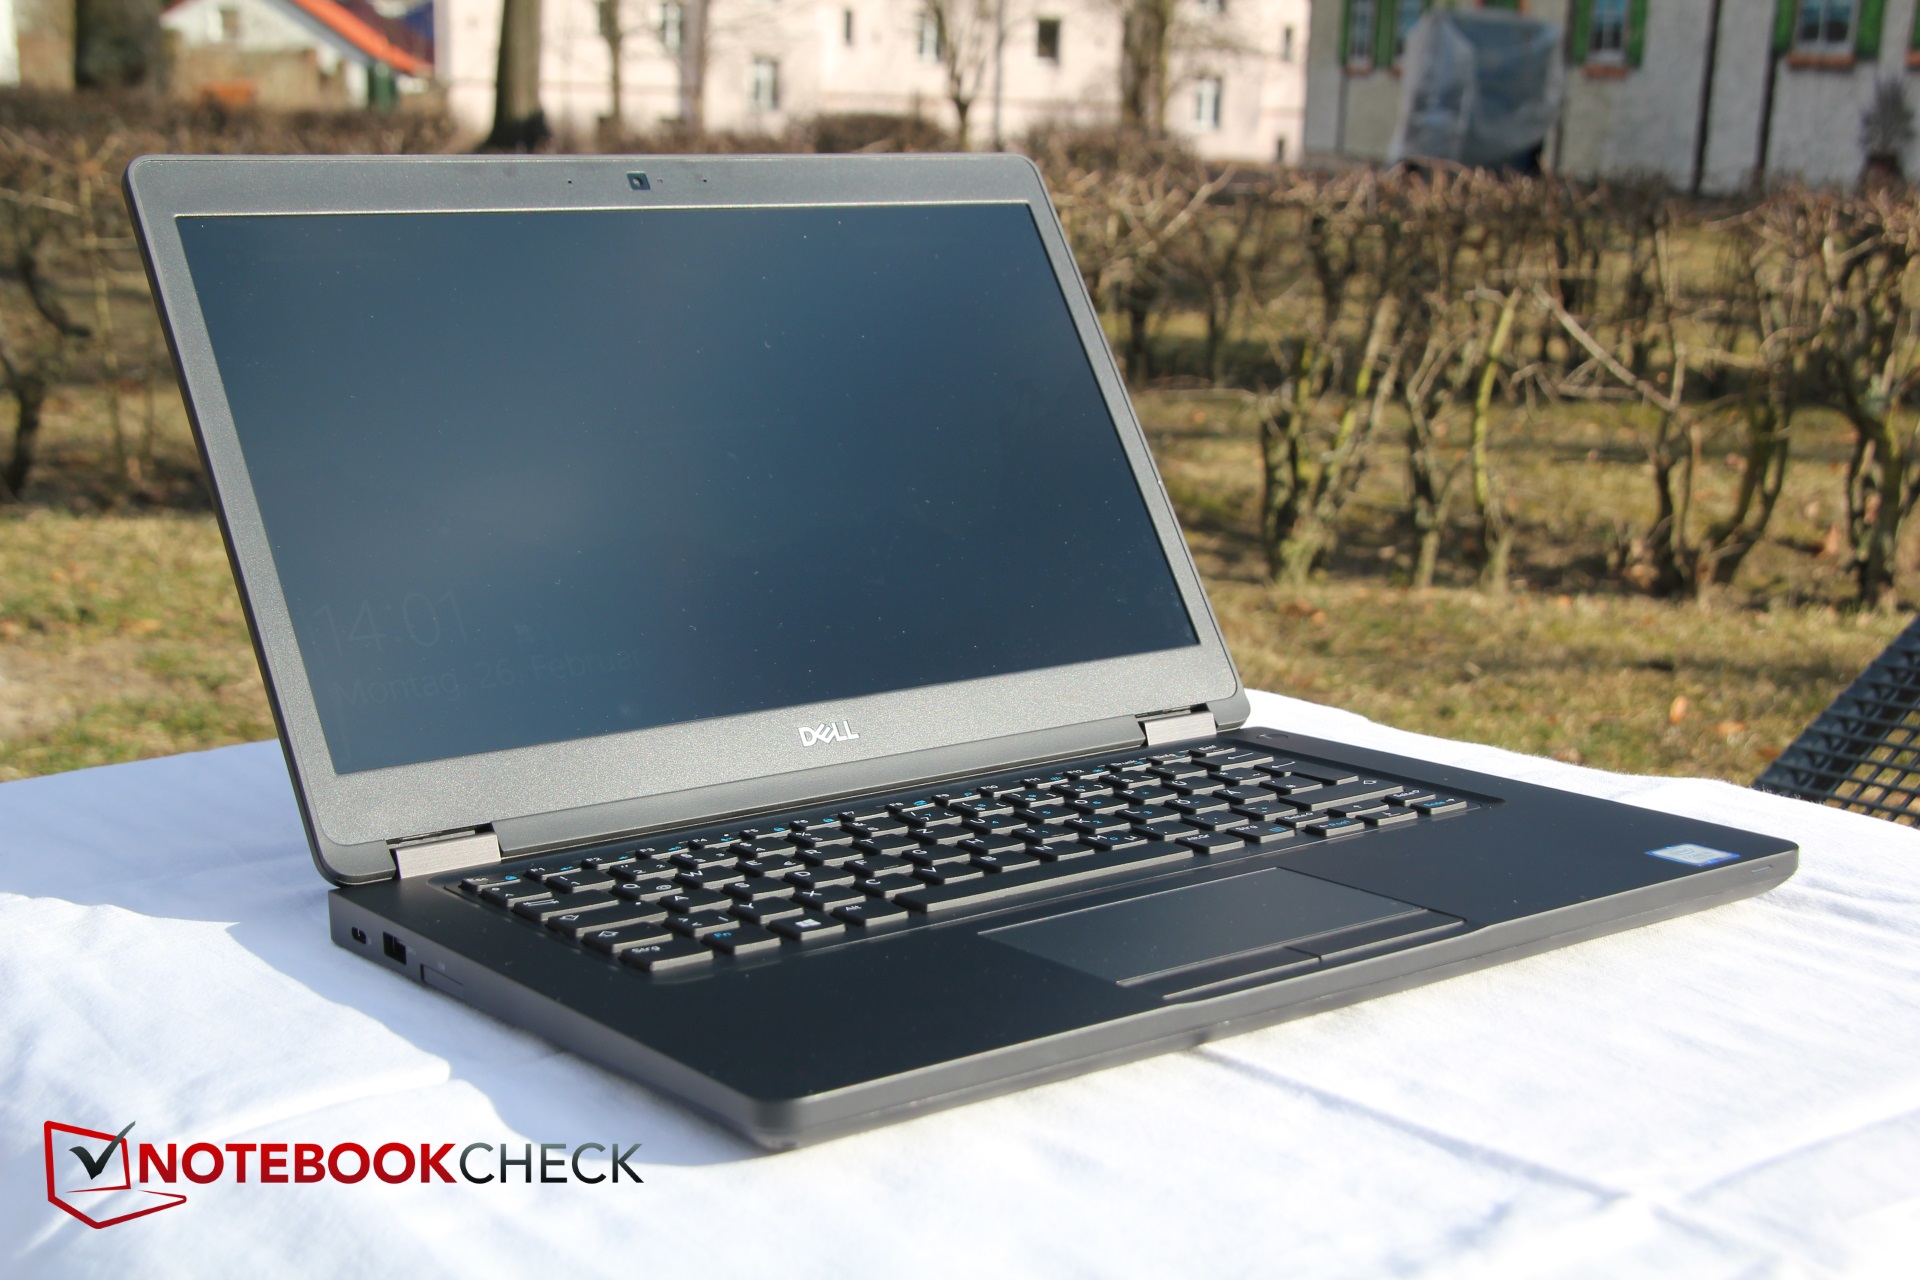
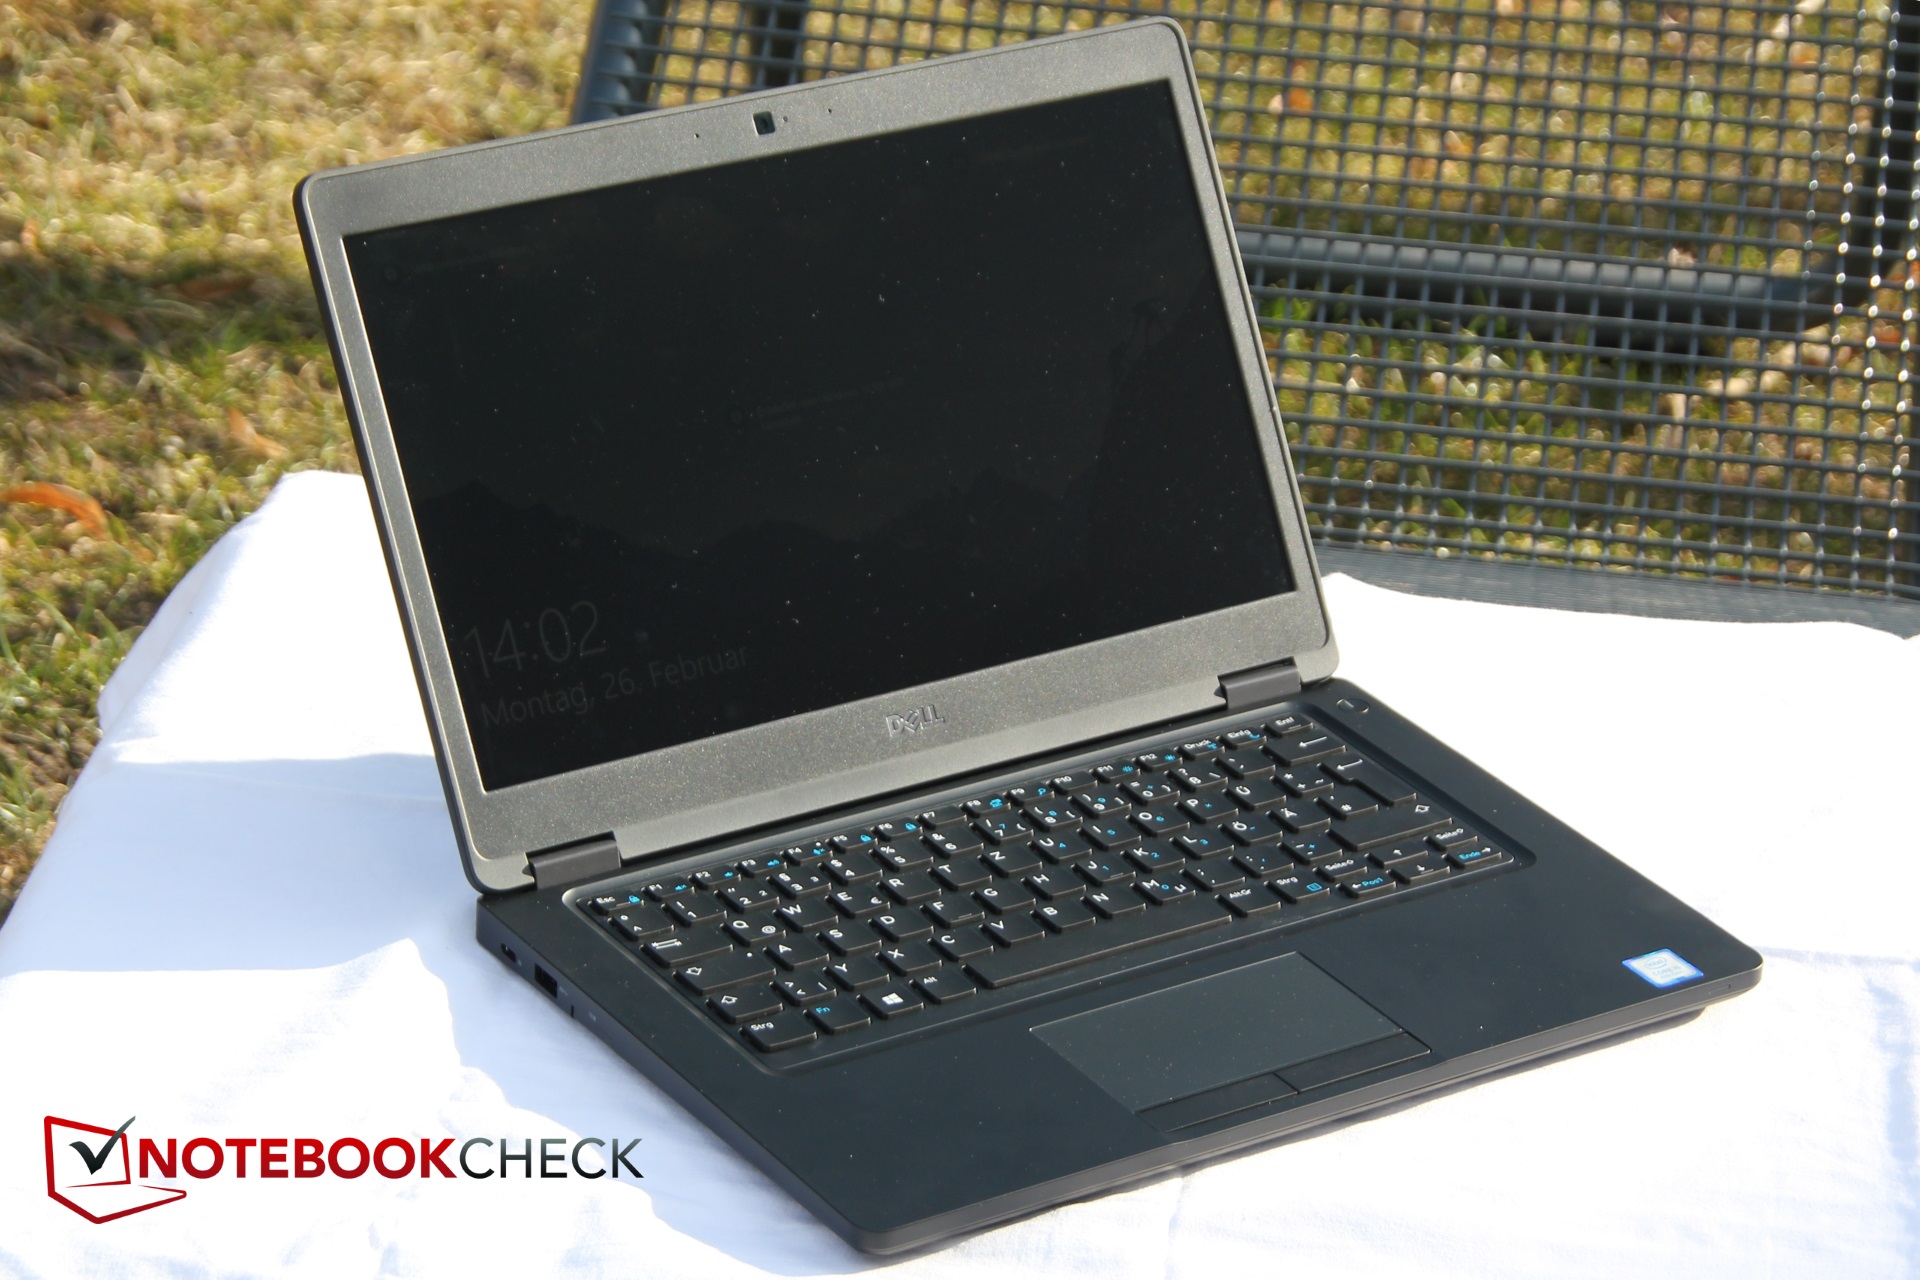
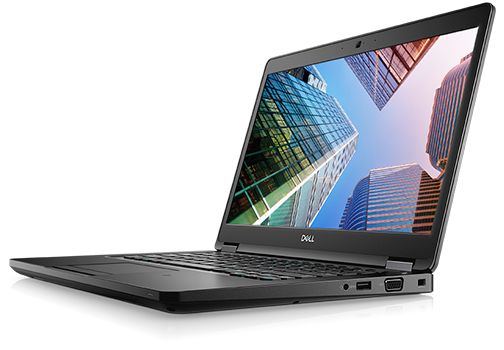
Dell Latitude 5490 har många positiva sidor, särskilt för företag och deras anställda: vid kontorsarbete är den väldigt effektiv och, tack vare den nästan fläktlösa driften, väldigt tyst. Inmatningsenheterna är också av hög kvalitet, men den största fördelen med denna laptop är dess otroliga batteritid, som möjliggör dagslång användning vid mindre krävande uppgifter. Den starka samlingen säkerhetsfunktioner som finns som tillval kan vara ett minst lika viktigt argument för köp.
Det är därför vi blir så ledsna att se att Dell inte har åtgärdat den största kritiken som riktats åt föregångaren: den mörka skärmen. Även om den erbjuder bättre kontrast och svärta än innan så är den fortfarande inte särskilt ljusstark. Dessutom lider den av bedrövliga reaktionstider och missfärgningar. Fläktljudet vid belastning kunde också förbättrats.
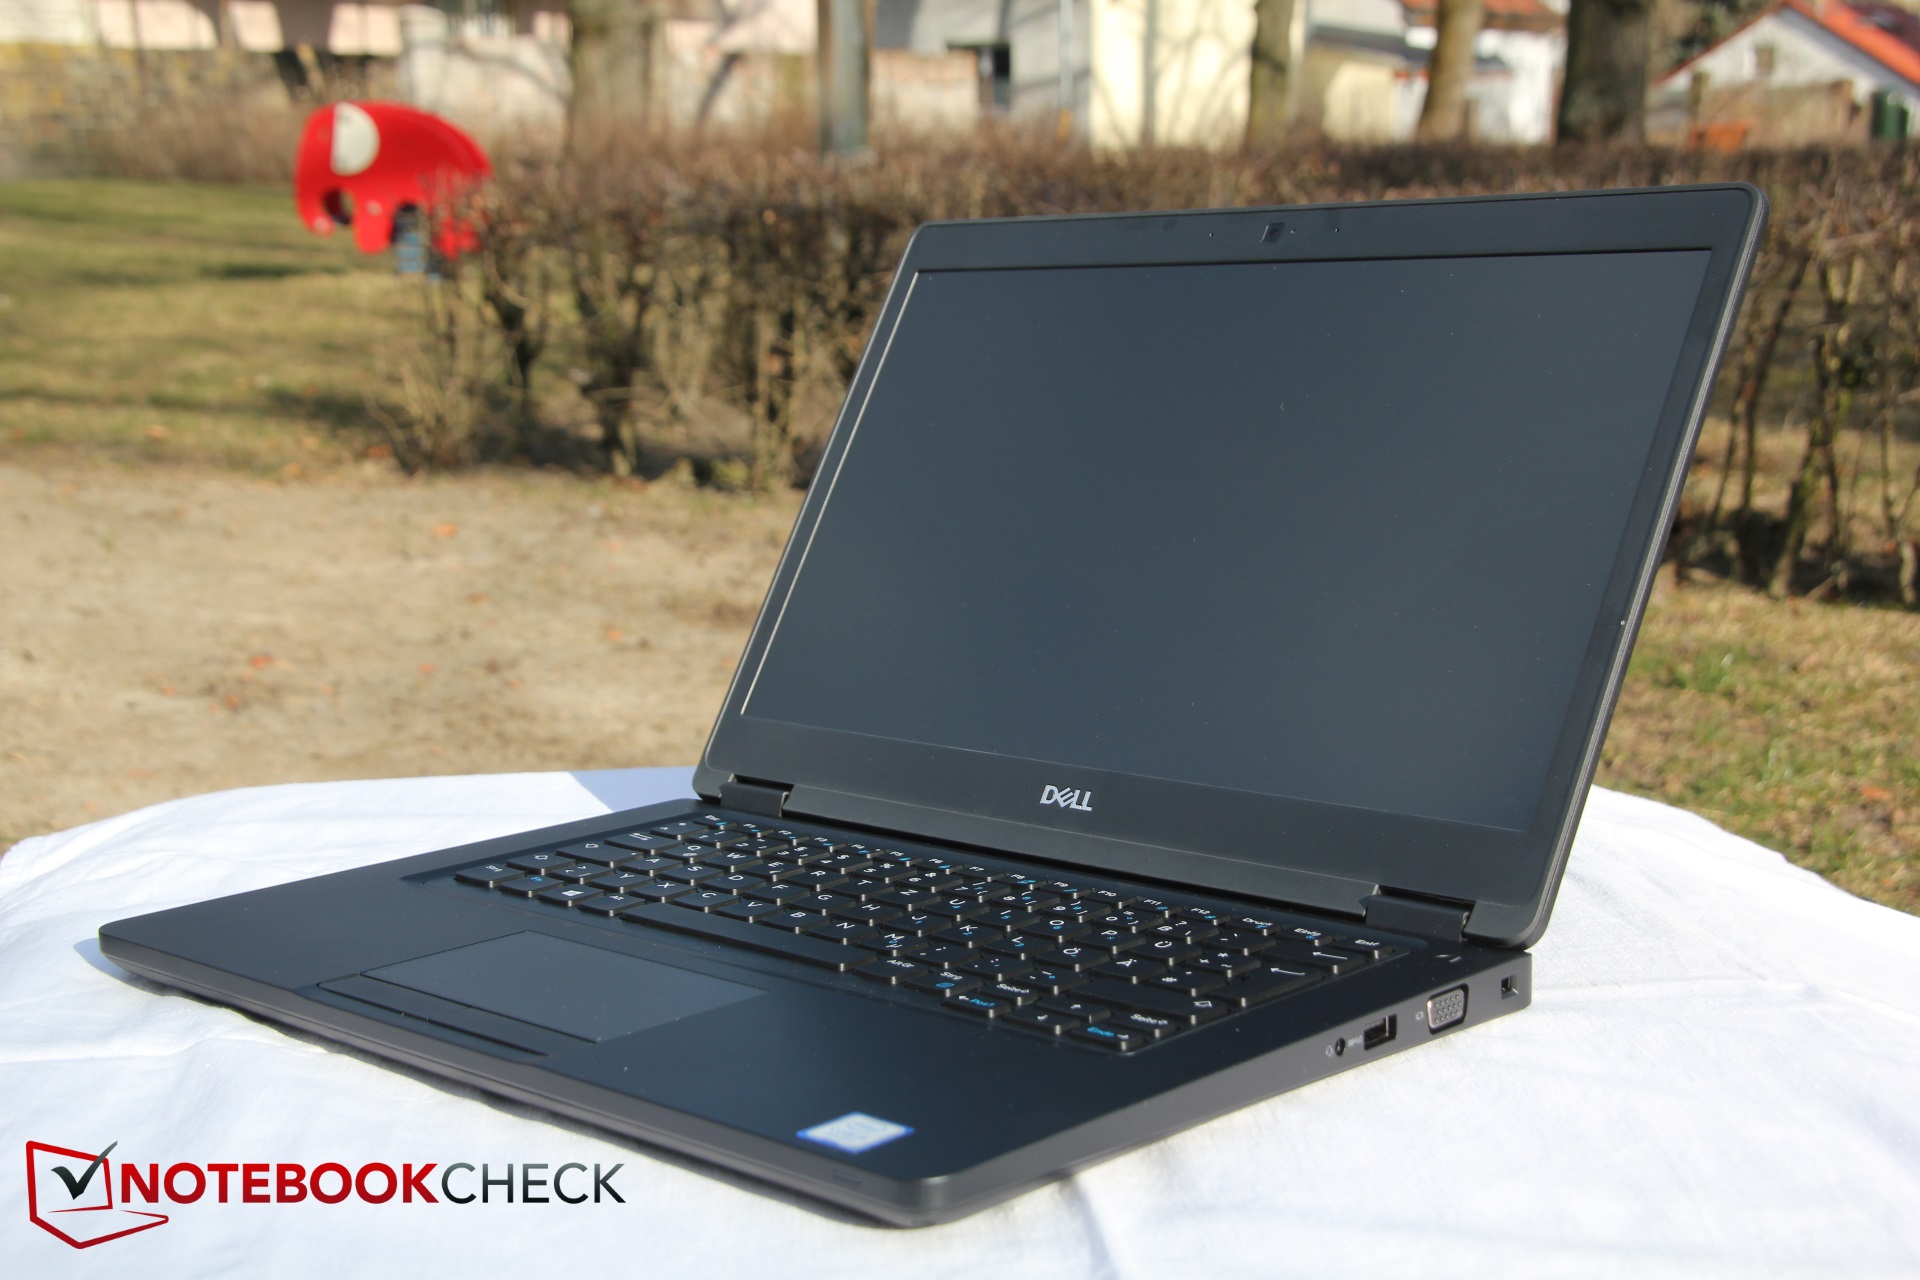
5490 är tydligt riktad huvudsakligen mot företag och deras anställda. Men man måste vara noggrann när man väljer mellan dom otaliga konfigurationer som finns tillgängliga för att få den önskade uppsättningen funktioner. För mindre säkerhetsmedvetna köpare finns det definitivt lättare, mindre och vid belastning tystare alternativ som ofta dessutom är billigare. Dom som är intresserade får en säker, kraftfull och uthållig företagslaptop som tyvärr har en väldigt mörk skärm.
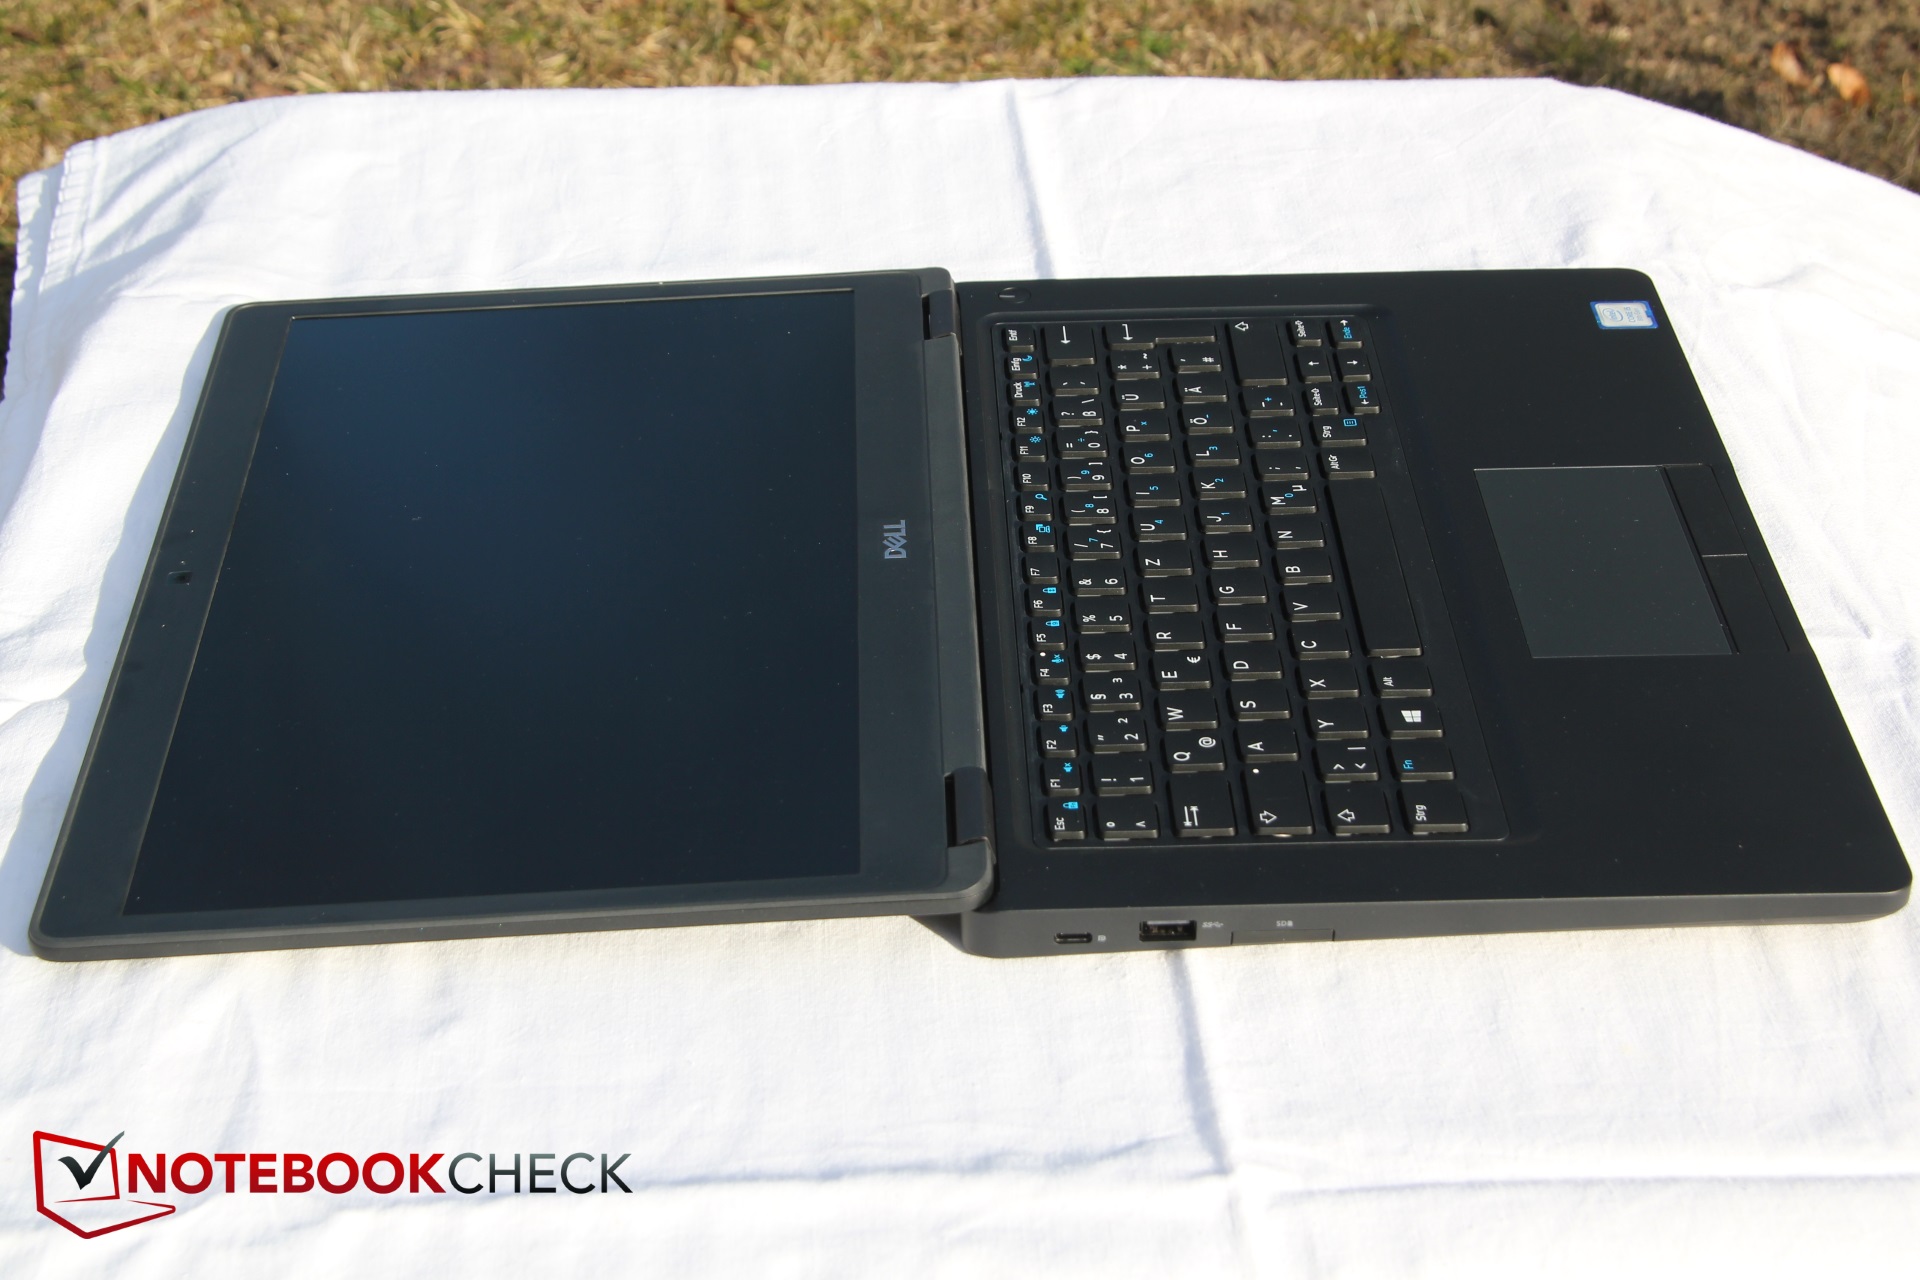
5490 är aningen tunnare än sin föregångare, men dess Kaby-Lake refresh resulterar bara stundom i förbättrad prestanda när det kommer till verkliga scenarier. I många applikationer så är 5480 faktiskt aningen snabbare. Det kan därför vara värt att ta en titt på föregångaren, även om det behöver nämnas att 5480 ibland låter ännu mer vid belastning.
Dell Latitude 5490-TD70X
- 03/04/2018 v6 (old)
Christian Hintze