Test: Dell Inspiron 17 3000 3780 (i7-8565U, Radeon 520) Laptop (Sammanfattning)
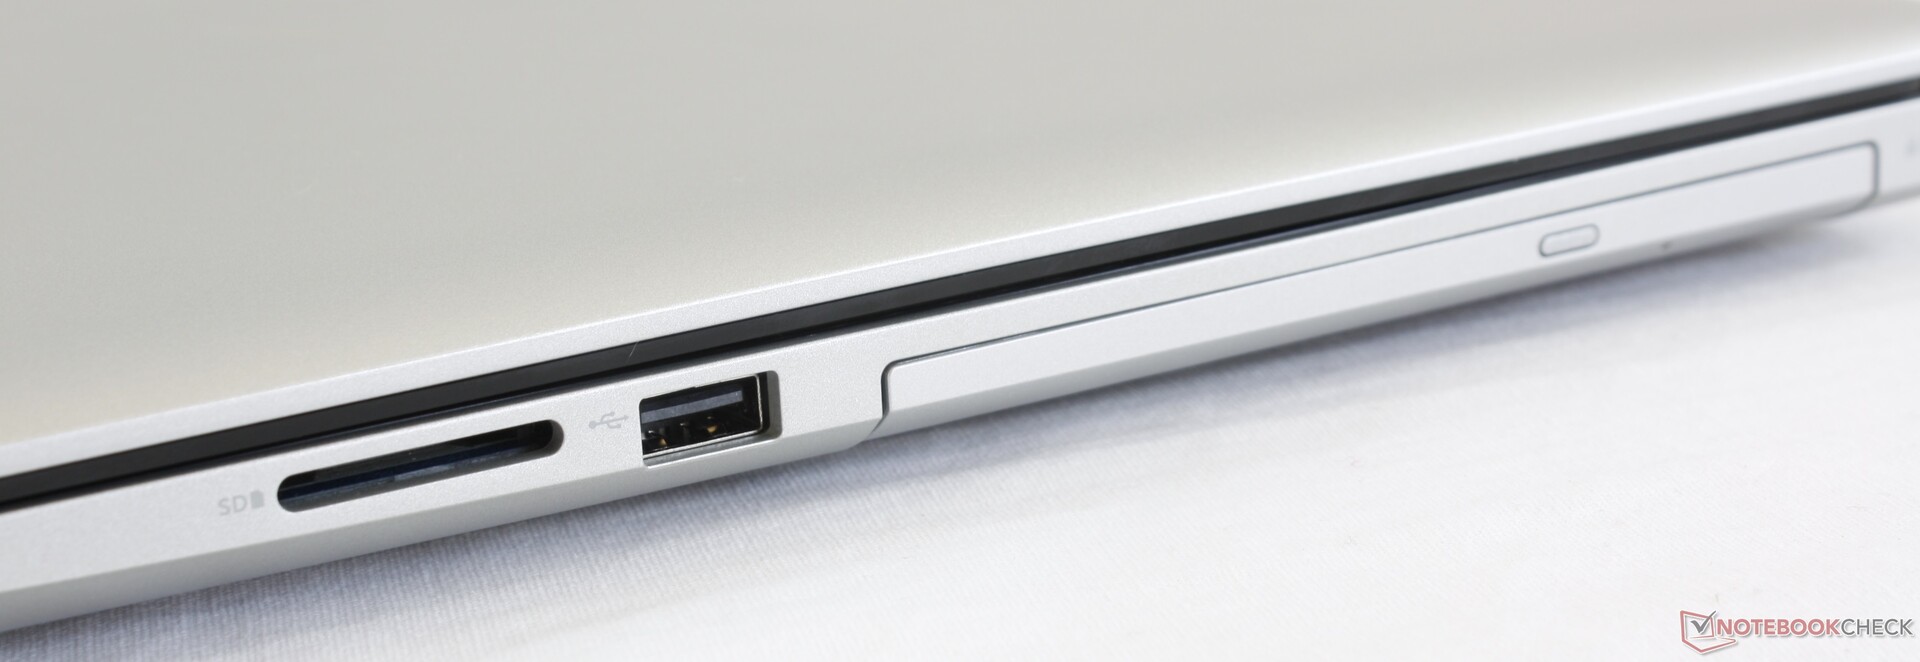
| SD Card Reader | |
| average JPG Copy Test (av. of 3 runs) | |
| Lenovo ThinkPad P71-20HK0004GE | |
| HP ProBook 470 G5 (Toshiba Exceria Pro SDXC 64 GB UHS-II) | |
| Dell Inspiron 17 3780 (Toshiba Exceria Pro SDXC 64 GB UHS-II) | |
| Dell Inspiron 17-7786 (Toshiba Exceria Pro SDXC 64 GB UHS-II) | |
| Lenovo V320-17IKB-81CN000MGE (Toshiba Exceria Pro SDXC 64 GB UHS-II) | |
| maximum AS SSD Seq Read Test (1GB) | |
| Lenovo ThinkPad P71-20HK0004GE | |
| HP ProBook 470 G5 (Toshiba Exceria Pro SDXC 64 GB UHS-II) | |
| Dell Inspiron 17 3780 (Toshiba Exceria Pro SDXC 64 GB UHS-II) | |
| Dell Inspiron 17-7786 (Toshiba Exceria Pro SDXC 64 GB UHS-II) | |
| Lenovo V320-17IKB-81CN000MGE (Toshiba Exceria Pro SDXC 64 GB UHS-II) | |
| Networking | |
| iperf3 transmit AX12 | |
| HP ProBook 470 G5 | |
| Dell Inspiron 17-7786 | |
| Lenovo ThinkPad P71-20HK0004GE | |
| Dell Inspiron 17 3780 | |
| Lenovo V320-17IKB-81CN000MGE | |
| iperf3 receive AX12 | |
| Lenovo ThinkPad P71-20HK0004GE | |
| Dell Inspiron 17-7786 | |
| HP ProBook 470 G5 | |
| Dell Inspiron 17 3780 | |
| Lenovo V320-17IKB-81CN000MGE | |
| |||||||||||||||||||||||||
Distribution av ljusstyrkan: 84 %
Mitt på batteriet: 322.9 cd/m²
Kontrast: 1242:1 (Svärta: 0.26 cd/m²)
ΔE ColorChecker Calman: 4.19 | ∀{0.5-29.43 Ø4.71}
calibrated: 3.55
ΔE Greyscale Calman: 4.5 | ∀{0.09-98 Ø4.96}
88.4% sRGB (Argyll 1.6.3 3D)
57.6% AdobeRGB 1998 (Argyll 1.6.3 3D)
64.6% AdobeRGB 1998 (Argyll 3D)
88.9% sRGB (Argyll 3D)
63.7% Display P3 (Argyll 3D)
Gamma: 1.97
CCT: 7041 K
| Dell Inspiron 17 3780 AU Optronics B173HAN01.3, IPS, 17.3", 1920x1080 | Dell Inspiron 17-7786 LG Philips, 173W4F, IPS, 17.3", 1920x1080 | Lenovo V320-17IKB-81CN000MGE LG Philips LP173WF4-SPF5, IPS, 17.3", 1920x1080 | HP ProBook 470 G5 LG Philips, IPS, 17.3", 1920x1080 | Dell Inspiron 17-5770-0357 AUO109D (AU Optronics), IPS, 17.3", 1920x1080 | HP 17-ca0013ng LG Philips LGD059E, IPS, 17.3", 1920x1080 | |
|---|---|---|---|---|---|---|
| Display | -5% | -4% | -2% | 0% | 0% | |
| Display P3 Coverage (%) | 63.7 | 64.8 2% | 65.4 3% | 66.1 4% | 63.9 0% | 67 5% |
| sRGB Coverage (%) | 88.9 | 81.6 -8% | 82 -8% | 84.4 -5% | 88.7 0% | 86.4 -3% |
| AdobeRGB 1998 Coverage (%) | 64.6 | 59.7 -8% | 60 -7% | 61.8 -4% | 64.8 0% | 63.2 -2% |
| Response Times | 20% | 24% | 21% | 23% | 30% | |
| Response Time Grey 50% / Grey 80% * (ms) | 46 ? | 38 ? 17% | 33 ? 28% | 36 ? 22% | 38 ? 17% | 33 ? 28% |
| Response Time Black / White * (ms) | 35.2 ? | 27 ? 23% | 28 ? 20% | 28 ? 20% | 25 ? 29% | 24 ? 32% |
| PWM Frequency (Hz) | 119000 ? | |||||
| Screen | -12% | -8% | -16% | 9% | -14% | |
| Brightness middle (cd/m²) | 322.9 | 343 6% | 414 28% | 400 24% | 279 -14% | 394 22% |
| Brightness (cd/m²) | 322 | 313 -3% | 375 16% | 374 16% | 262 -19% | 352 9% |
| Brightness Distribution (%) | 84 | 82 -2% | 82 -2% | 87 4% | 85 1% | 83 -1% |
| Black Level * (cd/m²) | 0.26 | 0.37 -42% | 0.41 -58% | 0.63 -142% | 0.18 31% | 0.35 -35% |
| Contrast (:1) | 1242 | 927 -25% | 1010 -19% | 635 -49% | 1550 25% | 1126 -9% |
| Colorchecker dE 2000 * | 4.19 | 4.8 -15% | 4.5 -7% | 4.34 -4% | 3.58 15% | 6.08 -45% |
| Colorchecker dE 2000 max. * | 7.04 | 10.35 -47% | 9.59 -36% | 8.29 -18% | 5.98 15% | 10.88 -55% |
| Colorchecker dE 2000 calibrated * | 3.55 | 4.57 -29% | 2.8 21% | |||
| Greyscale dE 2000 * | 4.5 | 3.51 22% | 3.13 30% | 3.51 22% | 2.75 39% | 7.22 -60% |
| Gamma | 1.97 112% | 2.19 100% | 2.41 91% | 2.45 90% | 2.57 86% | 2.48 89% |
| CCT | 7041 92% | 6188 105% | 6198 105% | 6570 99% | 6836 95% | 7997 81% |
| Color Space (Percent of AdobeRGB 1998) (%) | 57.6 | 54 -6% | 54 -6% | 55 -5% | 58 1% | 57 -1% |
| Color Space (Percent of sRGB) (%) | 88.4 | 81 -8% | 82 -7% | 84 -5% | 88 0% | 86 -3% |
| Totalt genomsnitt (program/inställningar) | 1% /
-6% | 4% /
-3% | 1% /
-8% | 11% /
9% | 5% /
-6% |
* ... mindre är bättre
Visa svarstider
| ↔ Svarstid svart till vitt | ||
|---|---|---|
| 35.2 ms ... stiga ↗ och falla ↘ kombinerat | ↗ 22 ms stiga | 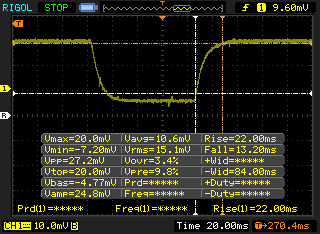 |
| ↘ 13.2 ms hösten | ||
| Skärmen visar långsamma svarsfrekvenser i våra tester och kommer att vara otillfredsställande för spelare. I jämförelse sträcker sig alla testade enheter från 0.1 (minst) till 240 (maximalt) ms. » 93 % av alla enheter är bättre. Detta innebär att den uppmätta svarstiden är sämre än genomsnittet av alla testade enheter (19.8 ms). | ||
| ↔ Svarstid 50 % grått till 80 % grått | ||
| 46 ms ... stiga ↗ och falla ↘ kombinerat | ↗ 24.4 ms stiga | 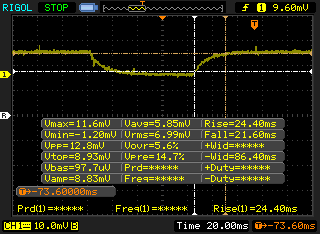 |
| ↘ 21.6 ms hösten | ||
| Skärmen visar långsamma svarsfrekvenser i våra tester och kommer att vara otillfredsställande för spelare. I jämförelse sträcker sig alla testade enheter från 0.165 (minst) till 636 (maximalt) ms. » 79 % av alla enheter är bättre. Detta innebär att den uppmätta svarstiden är sämre än genomsnittet av alla testade enheter (31 ms). | ||
Skärmflimmer / PWM (Puls-Width Modulation)
| Skärmflimmer / PWM upptäcktes inte | 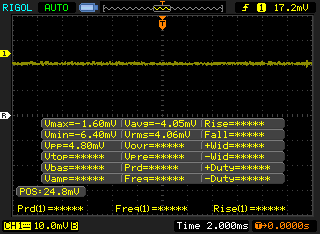 | ||
Som jämförelse: 52 % av alla testade enheter använder inte PWM för att dämpa skärmen. Om PWM upptäcktes mättes ett medelvärde av 7754 (minst: 5 - maximum: 343500) Hz. | |||
| Cinebench R15 | |
| CPU Single 64Bit | |
| Dell G7 15-7588 | |
| Genomsnitt Intel Core i7-8565U (138.3 - 193, n=51) | |
| Dell G3 15 3579 | |
| Dell Inspiron 17 3780 | |
| Dell Latitude 15 3590-K8JP | |
| Dell XPS 13 9360 FHD i7 Iris | |
| Dell XPS 13 9380 2019 | |
| Dell Vostro 15-5568 | |
| Dell Inspiron 15 5579-9672 | |
| HP ProBook 445 G6 | |
| HP 250 G6 4BD30ES | |
| CPU Multi 64Bit | |
| Dell G7 15-7588 | |
| Dell G3 15 3579 | |
| Dell XPS 13 9380 2019 | |
| HP ProBook 445 G6 | |
| Genomsnitt Intel Core i7-8565U (452 - 815, n=52) | |
| Dell Inspiron 17 3780 | |
| Dell Latitude 15 3590-K8JP | |
| Dell Inspiron 15 5579-9672 | |
| Dell Vostro 15-5568 | |
| Dell XPS 13 9360 FHD i7 Iris | |
| HP 250 G6 4BD30ES | |
| PCMark 10 | |
| Score | |
| Dell Inspiron 17 3780 | |
| Dell Inspiron 17-7786 | |
| Lenovo V320-17IKB-81CN000MGE | |
| HP ProBook 470 G5 | |
| Dell Inspiron 17-5770-0357 | |
| Essentials | |
| Dell Inspiron 17 3780 | |
| Dell Inspiron 17-7786 | |
| Lenovo V320-17IKB-81CN000MGE | |
| Dell Inspiron 17-5770-0357 | |
| HP ProBook 470 G5 | |
| Productivity | |
| Dell Inspiron 17 3780 | |
| Dell Inspiron 17-7786 | |
| Lenovo V320-17IKB-81CN000MGE | |
| Dell Inspiron 17-5770-0357 | |
| HP ProBook 470 G5 | |
| Digital Content Creation | |
| Dell Inspiron 17-7786 | |
| Dell Inspiron 17 3780 | |
| Lenovo V320-17IKB-81CN000MGE | |
| Dell Inspiron 17-5770-0357 | |
| HP ProBook 470 G5 | |
| PCMark 8 | |
| Home Score Accelerated v2 | |
| Dell Inspiron 17-7786 | |
| Lenovo V320-17IKB-81CN000MGE | |
| HP ProBook 470 G5 | |
| Dell Inspiron 17-5770-0357 | |
| Dell Inspiron 17 3780 | |
| HP 17-ca0013ng | |
| Work Score Accelerated v2 | |
| Dell Inspiron 17 3780 | |
| Dell Inspiron 17-7786 | |
| HP ProBook 470 G5 | |
| Lenovo V320-17IKB-81CN000MGE | |
| Dell Inspiron 17-5770-0357 | |
| PCMark 8 Home Score Accelerated v2 | 3509 poäng | |
| PCMark 8 Work Score Accelerated v2 | 5260 poäng | |
| PCMark 10 Score | 4594 poäng | |
Hjälp | ||
| Dell Inspiron 17 3780 SK Hynix BC501 NVMe 256 GB | Lenovo V320-17IKB-81CN000MGE Liteonit CV3-DE256 | HP ProBook 470 G5 Intel SSD 600p SSDPEKKW256G7 | Dell Inspiron 17-5770-0357 SK hynix SC311 M.2 | HP 17-ca0013ng Toshiba KBG30ZMV256G | |
|---|---|---|---|---|---|
| AS SSD | -53% | -23% | -68% | -42% | |
| Seq Read (MB/s) | 1061 | 520 -51% | 1257 18% | 492.1 -54% | 1334 26% |
| Seq Write (MB/s) | 491.4 | 259.4 -47% | 461.8 -6% | 182.1 -63% | 760 55% |
| 4K Read (MB/s) | 39.13 | 21.59 -45% | 26.95 -31% | 25.6 -35% | 37.67 -4% |
| 4K Write (MB/s) | 104 | 53.6 -48% | 90.6 -13% | 68.8 -34% | 72 -31% |
| 4K-64 Read (MB/s) | 505 | 329.4 -35% | 279.4 -45% | 159.1 -68% | 629 25% |
| 4K-64 Write (MB/s) | 314.8 | 215.4 -32% | 429.4 36% | 73.4 -77% | 259 -18% |
| Access Time Read * (ms) | 0.063 | 0.084 -33% | 0.109 -73% | 0.128 -103% | 0.085 -35% |
| Access Time Write * (ms) | 0.034 | 0.072 -112% | 0.039 -15% | 0.061 -79% | 0.204 -500% |
| Score Read (Points) | 650 | 403 -38% | 432 -34% | 234 -64% | 800 23% |
| Score Write (Points) | 468 | 295 -37% | 566 21% | 160 -66% | 407 -13% |
| Score Total (Points) | 1434 | 897 -37% | 1188 -17% | 509 -65% | 1596 11% |
| Copy ISO MB/s (MB/s) | 876 | 305 -65% | 549 -37% | 162.8 -81% | 574 -34% |
| Copy Program MB/s (MB/s) | 653 | 99.2 -85% | 209.2 -68% | 107.8 -83% | 219.2 -66% |
| Copy Game MB/s (MB/s) | 512 | 147.8 -71% | 248.6 -51% | 130.9 -74% | 374 -27% |
* ... mindre är bättre

| 3DMark 11 | |
| 1280x720 Performance GPU | |
| Dell G7 15-7588 | |
| Lenovo ThinkPad P71-20HK0004GE | |
| Dell G3 15 3579 | |
| Dell Inspiron 17-7786 | |
| Dell Latitude 14 5495 | |
| Dell Latitude 15 3590-K8JP | |
| Dell Vostro 15-5568 | |
| HP ProBook 470 G5 | |
| Dell Inspiron 17 3780 | |
| Dell XPS 13 9360 FHD i7 Iris | |
| Genomsnitt AMD Radeon 520 (1877 - 2156, n=2) | |
| Dell XPS 13 9380 2019 | |
| 1280x720 Performance Combined | |
| Dell G7 15-7588 | |
| Lenovo ThinkPad P71-20HK0004GE | |
| Dell G3 15 3579 | |
| Dell Inspiron 17-7786 | |
| Dell Latitude 15 3590-K8JP | |
| Dell Vostro 15-5568 | |
| Dell Inspiron 17 3780 | |
| Dell Latitude 14 5495 | |
| HP ProBook 470 G5 | |
| Genomsnitt AMD Radeon 520 (1605 - 2149, n=2) | |
| Dell XPS 13 9360 FHD i7 Iris | |
| Dell XPS 13 9380 2019 | |
| 3DMark | |
| 1280x720 Cloud Gate Standard Graphics | |
| Dell G7 15-7588 | |
| Lenovo ThinkPad P71-20HK0004GE | |
| Dell G3 15 3579 | |
| Dell Inspiron 17-7786 | |
| Dell Vostro 15-5568 | |
| Dell XPS 13 9360 FHD i7 Iris | |
| Dell Latitude 14 5495 | |
| Dell Inspiron 17 3780 | |
| Dell XPS 13 9380 2019 | |
| Dell Latitude 15 3590-K8JP | |
| HP ProBook 470 G5 | |
| Genomsnitt AMD Radeon 520 (6156 - 10669, n=2) | |
| 1920x1080 Fire Strike Graphics | |
| Dell G7 15-7588 | |
| Lenovo ThinkPad P71-20HK0004GE | |
| Dell G3 15 3579 | |
| Dell Inspiron 17-7786 | |
| Dell Vostro 15-5568 | |
| Dell Latitude 15 3590-K8JP | |
| Dell Latitude 14 5495 | |
| HP ProBook 470 G5 | |
| Dell Inspiron 17 3780 | |
| Dell XPS 13 9360 FHD i7 Iris | |
| Genomsnitt AMD Radeon 520 (1022 - 1616, n=2) | |
| 1920x1080 Ice Storm Extreme Graphics | |
| Dell Inspiron 17-7786 | |
| HP ProBook 470 G5 | |
| Genomsnitt AMD Radeon 520 (n=1) | |
| 2560x1440 Time Spy Graphics | |
| Lenovo ThinkPad P71-20HK0004GE | |
| Dell Inspiron 17-7786 | |
| HP ProBook 470 G5 | |
| Dell Inspiron 17 3780 | |
| Dell XPS 13 9360 FHD i7 Iris | |
| Genomsnitt AMD Radeon 520 (335 - 459, n=2) | |
| 3DMark 11 Performance | 2409 poäng | |
| 3DMark Cloud Gate Standard Score | 8971 poäng | |
| 3DMark Fire Strike Score | 1511 poäng | |
| 3DMark Time Spy Score | 526 poäng | |
Hjälp | ||
| The Witcher 3 | |
| 1024x768 Low Graphics & Postprocessing | |
| Genomsnitt av klass Multimedia (68 - 169, n=4, senaste 2 åren) | |
| Dell Inspiron 17 3780 | |
| Genomsnitt AMD Radeon 520 (n=1) | |
| 1366x768 Medium Graphics & Postprocessing | |
| Genomsnitt av klass Multimedia (41 - 73, n=2, senaste 2 åren) | |
| Dell Inspiron 17 3780 | |
| Genomsnitt AMD Radeon 520 (n=1) | |
| 1920x1080 High Graphics & Postprocessing (Nvidia HairWorks Off) | |
| Genomsnitt av klass Multimedia (22 - 224, n=7, senaste 2 åren) | |
| Dell Inspiron 17 3780 | |
| Genomsnitt AMD Radeon 520 (n=1) | |
| 1920x1080 Ultra Graphics & Postprocessing (HBAO+) | |
| Genomsnitt av klass Multimedia (11 - 121, n=7, senaste 2 åren) | |
| Dell Inspiron 17 3780 | |
| Genomsnitt AMD Radeon 520 (n=1) | |
| låg | med. | hög | ultra | |
|---|---|---|---|---|
| BioShock Infinite (2013) | 82.4 | 43.7 | 36.3 | 11.7 |
| The Witcher 3 (2015) | 29.7 | 18.7 | 10.2 | 5.8 |
| Rise of the Tomb Raider (2016) | 36 | 20.8 | 9.8 | 7.4 |
| Dell Inspiron 17 3780 Radeon 520, i7-8565U, SK Hynix BC501 NVMe 256 GB | Dell Inspiron 17-7786 GeForce MX150, i7-8565U, KBG30ZMS128G | Lenovo V320-17IKB-81CN000MGE UHD Graphics 620, i5-8250U, Liteonit CV3-DE256 | HP ProBook 470 G5 GeForce 930MX, i5-8250U, Intel SSD 600p SSDPEKKW256G7 | Dell Inspiron 17-5770-0357 UHD Graphics 620, i5-8250U, SK hynix SC311 M.2 | HP 17-ca0013ng Vega 8, R5 2500U, Toshiba KBG30ZMV256G | |
|---|---|---|---|---|---|---|
| Noise | 6% | 7% | 7% | -0% | 3% | |
| av / miljö * (dB) | 28.1 | 30.3 -8% | 30.4 -8% | 30.5 -9% | 30.1 -7% | 30.6 -9% |
| Idle Minimum * (dB) | 31.7 | 30.7 3% | 30.4 4% | 30.5 4% | 31.1 2% | 32.8 -3% |
| Idle Average * (dB) | 31.8 | 30.7 3% | 30 6% | 30.5 4% | 31.1 2% | 32.8 -3% |
| Idle Maximum * (dB) | 31.8 | 30.7 3% | 31.4 1% | 30.5 4% | 31.1 2% | 32.8 -3% |
| Load Average * (dB) | 38.7 | 33.4 14% | 34.1 12% | 33 15% | 44.4 -15% | 34.2 12% |
| Load Maximum * (dB) | 48.5 | 38.7 20% | 36.4 25% | 38 22% | 41.7 14% | 36.4 25% |
* ... mindre är bättre
Ljudnivå
| Låg belastning |
| 31.7 / 31.8 / 31.8 dB(A) |
| Hög belastning |
| 38.7 / 48.5 dB(A) |
 | ||
30 dB tyst 40 dB(A) hörbar 50 dB(A) högt ljud |
||
min: | ||
(-) Den maximala temperaturen på ovansidan är 49 °C / 120 F, jämfört med genomsnittet av 36.8 °C / 98 F , allt från 21 till 71 °C för klassen Multimedia.
(+) Botten värms upp till maximalt 39.6 °C / 103 F, jämfört med genomsnittet av 39.1 °C / 102 F
(+) Vid tomgångsbruk är medeltemperaturen för ovansidan 27.4 °C / 81 F, jämfört med enhetsgenomsnittet på 31.3 °C / ### class_avg_f### F.
(+) Handledsstöden och pekplattan är kallare än hudtemperaturen med maximalt 27.4 °C / 81.3 F och är därför svala att ta på.
(±) Medeltemperaturen för handledsstödsområdet på liknande enheter var 28.7 °C / 83.7 F (+1.3 °C / 2.4 F).
Apple MacBook 12 (Early 2016) 1.1 GHz ljudanalys
(+) | högtalare kan spela relativt högt (83.6 dB)
Bas 100 - 315 Hz
(±) | reducerad bas - i genomsnitt 11.3% lägre än medianen
(±) | linjäriteten för basen är genomsnittlig (14.2% delta till föregående frekvens)
Mellan 400 - 2000 Hz
(+) | balanserad mellan - endast 2.4% från medianen
(+) | mids är linjära (5.5% delta till föregående frekvens)
Högsta 2 - 16 kHz
(+) | balanserade toppar - endast 2% från medianen
(+) | toppar är linjära (4.5% delta till föregående frekvens)
Totalt 100 - 16 000 Hz
(+) | det totala ljudet är linjärt (10.2% skillnad mot median)
Jämfört med samma klass
» 7% av alla testade enheter i den här klassen var bättre, 2% liknande, 90% sämre
» Den bästa hade ett delta på 5%, genomsnittet var 18%, sämst var 53%
Jämfört med alla testade enheter
» 5% av alla testade enheter var bättre, 1% liknande, 94% sämre
» Den bästa hade ett delta på 4%, genomsnittet var 23%, sämst var 134%
| Av/Standby | |
| Låg belastning | |
| Hög belastning |
|
Förklaring:
min: | |
| Dell Inspiron 17 3780 i7-8565U, Radeon 520, SK Hynix BC501 NVMe 256 GB, IPS, 1920x1080, 17.3" | Dell Inspiron 17-7786 i7-8565U, GeForce MX150, KBG30ZMS128G, IPS, 1920x1080, 17.3" | Lenovo V320-17IKB-81CN000MGE i5-8250U, UHD Graphics 620, Liteonit CV3-DE256, IPS, 1920x1080, 17.3" | HP ProBook 470 G5 i5-8250U, GeForce 930MX, Intel SSD 600p SSDPEKKW256G7, IPS, 1920x1080, 17.3" | Dell Inspiron 17-5770-0357 i5-8250U, UHD Graphics 620, SK hynix SC311 M.2, IPS, 1920x1080, 17.3" | HP 17-ca0013ng R5 2500U, Vega 8, Toshiba KBG30ZMV256G, IPS, 1920x1080, 17.3" | |
|---|---|---|---|---|---|---|
| Power Consumption | 3% | 20% | 14% | 23% | -12% | |
| Idle Minimum * (Watt) | 5 | 4.2 16% | 4.3 14% | 3.4 32% | 4.08 18% | 7.6 -52% |
| Idle Average * (Watt) | 10.9 | 9.4 14% | 10.2 6% | 9.6 12% | 8.45 22% | 12.9 -18% |
| Idle Maximum * (Watt) | 12 | 12.9 -8% | 10.5 12% | 11.8 2% | 9.6 20% | 13.7 -14% |
| Load Average * (Watt) | 49.6 | 56 -13% | 34 31% | 43 13% | 40.2 19% | 44 11% |
| Load Maximum * (Watt) | 66.9 | 63.4 5% | 42 37% | 61 9% | 41.4 38% | 57.1 15% |
* ... mindre är bättre
| Dell Inspiron 17 3780 i7-8565U, Radeon 520, 42 Wh | Dell Inspiron 17-7786 i7-8565U, GeForce MX150, 56 Wh | Lenovo V320-17IKB-81CN000MGE i5-8250U, UHD Graphics 620, 30 Wh | HP ProBook 470 G5 i5-8250U, GeForce 930MX, 48 Wh | Dell Inspiron 17-5770-0357 i5-8250U, UHD Graphics 620, 42 Wh | HP 17-ca0013ng R5 2500U, Vega 8, 40.6 Wh | |
|---|---|---|---|---|---|---|
| Batteridrifttid | 105% | 2% | 99% | 34% | -10% | |
| Reader / Idle (h) | 9.6 | 16.6 73% | 10.5 9% | 18.7 95% | 11.7 22% | |
| WiFi v1.3 (h) | 4.2 | 9 114% | 4.4 5% | 8.1 93% | 6.1 45% | 3.8 -10% |
| Load (h) | 1.1 | 2.5 127% | 1 -9% | 2.3 109% | 1.5 36% |
För
Emot
Läs den fullständiga versionen av den här recensionen på engelska här.
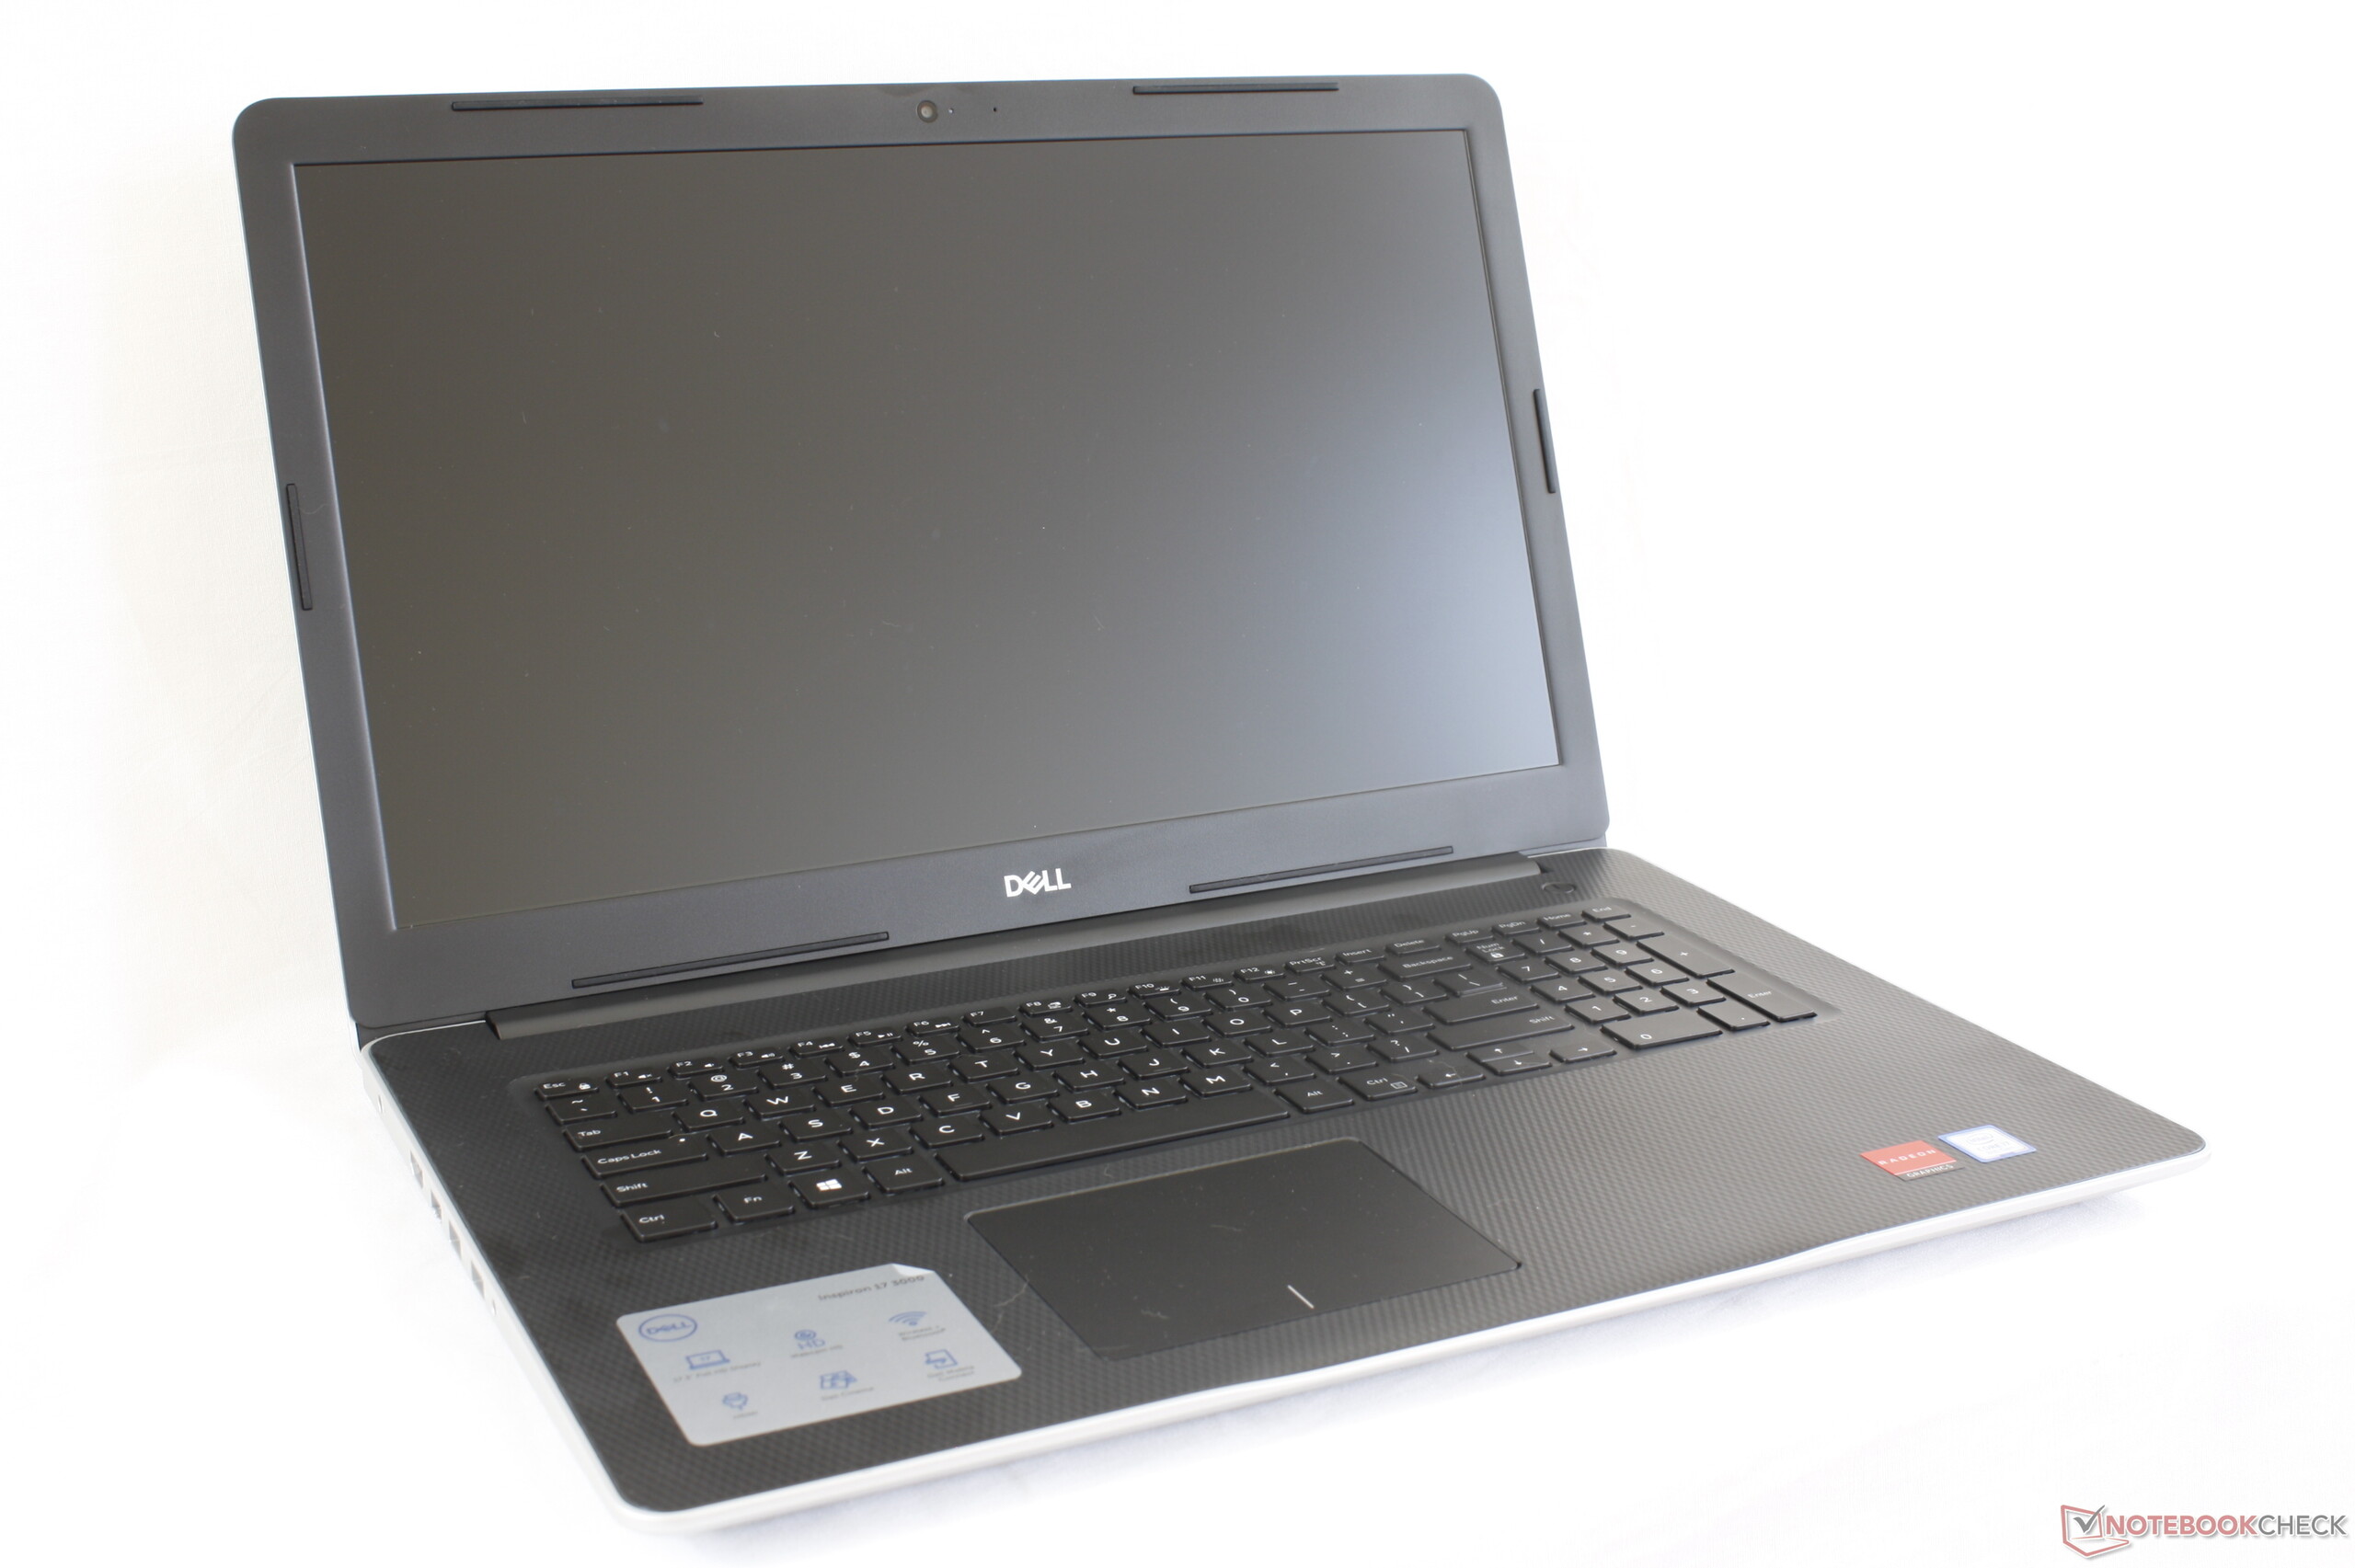
De mest tilltalande egenskaperna med Inspiron 17 3780 är att den har en IPS-skärm med 1080p-upplösning som standard och att den är billig. Konkurrerande system som Asus VivoBook 17 kan ha skärmar med lägre upplösning och erbjuder bara 1080p som ett onödigt dyrt tillval.
Om du överväger Inspiron 17 3780 rekommenderar vi att du hoppar över det dyrare alternativet med en dedikerad Radeon 520 GPU då den har både riktigt dålig grafikprestanda och låg prestanda per watt. Om du behöver GPU-stsyrka är Lenovo IdeaPad 330-17IKB med GeForce MX150-grafik ett bättre alternativ. Om du däremot i huvudsak ska syssla med ordbehandling, surfande och videoströmning räcker Inspiron 15-varianterna med Core i5-8265U eller Ryzen 5 2500U.
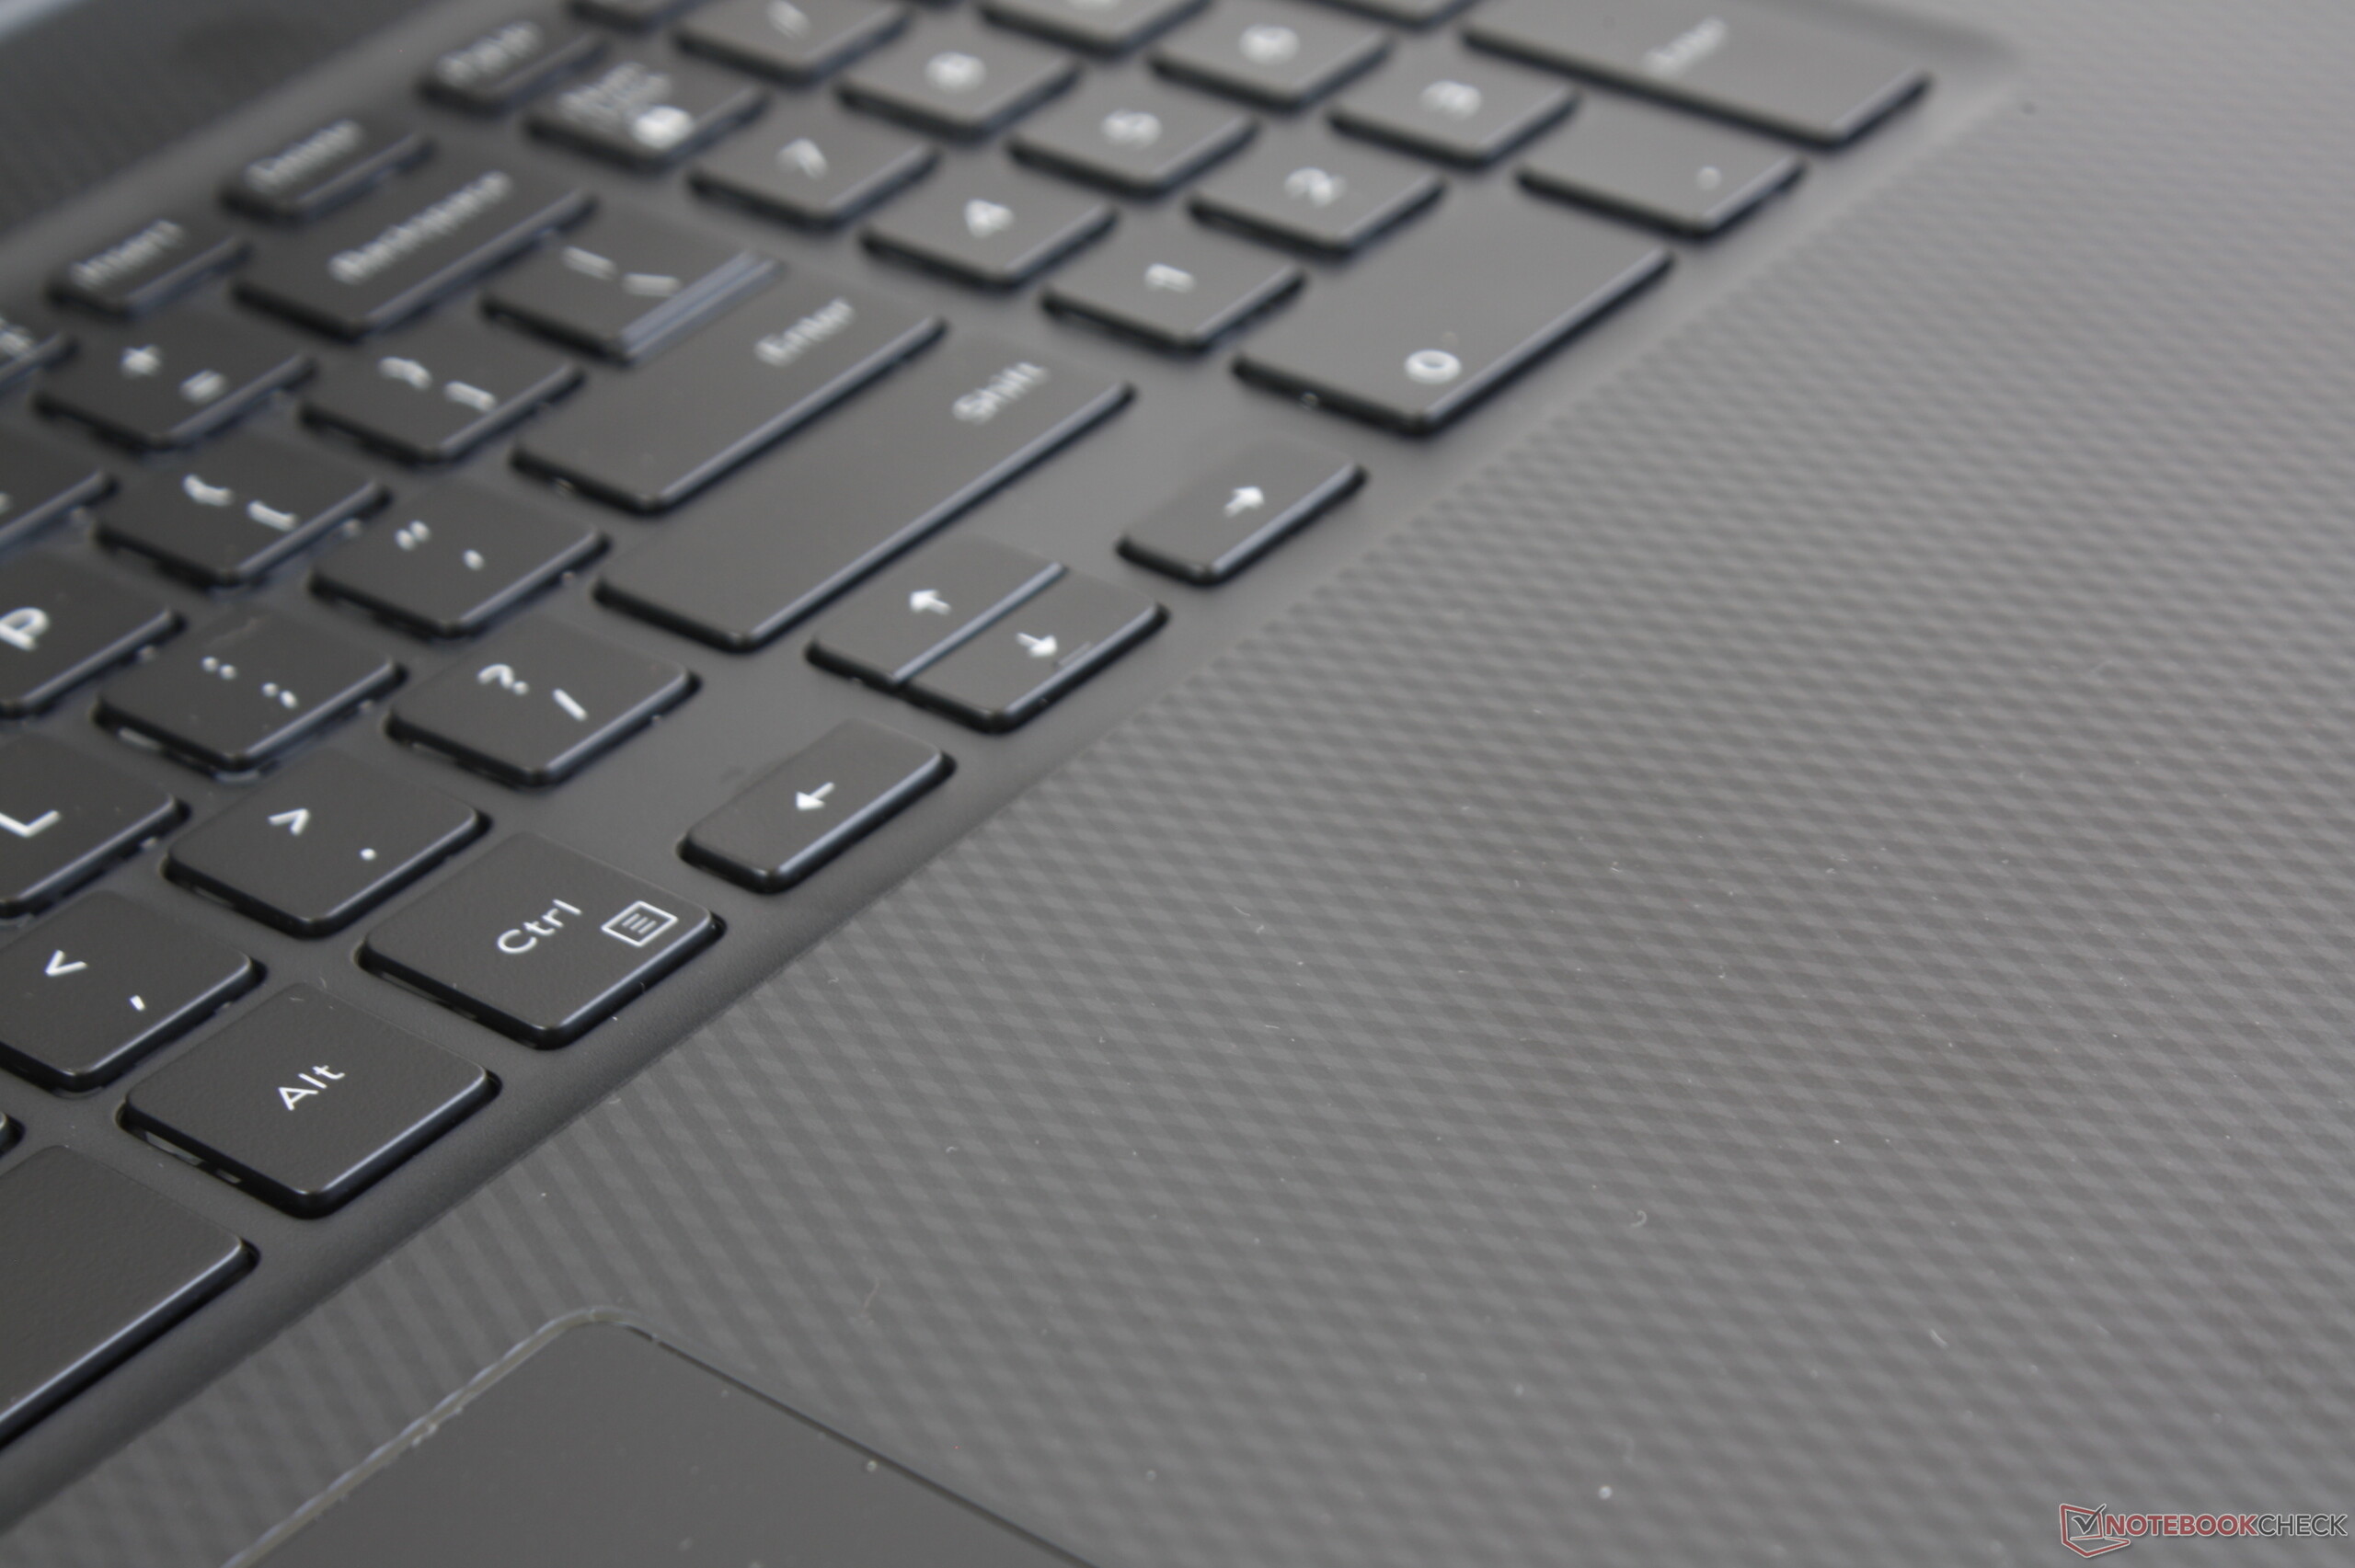
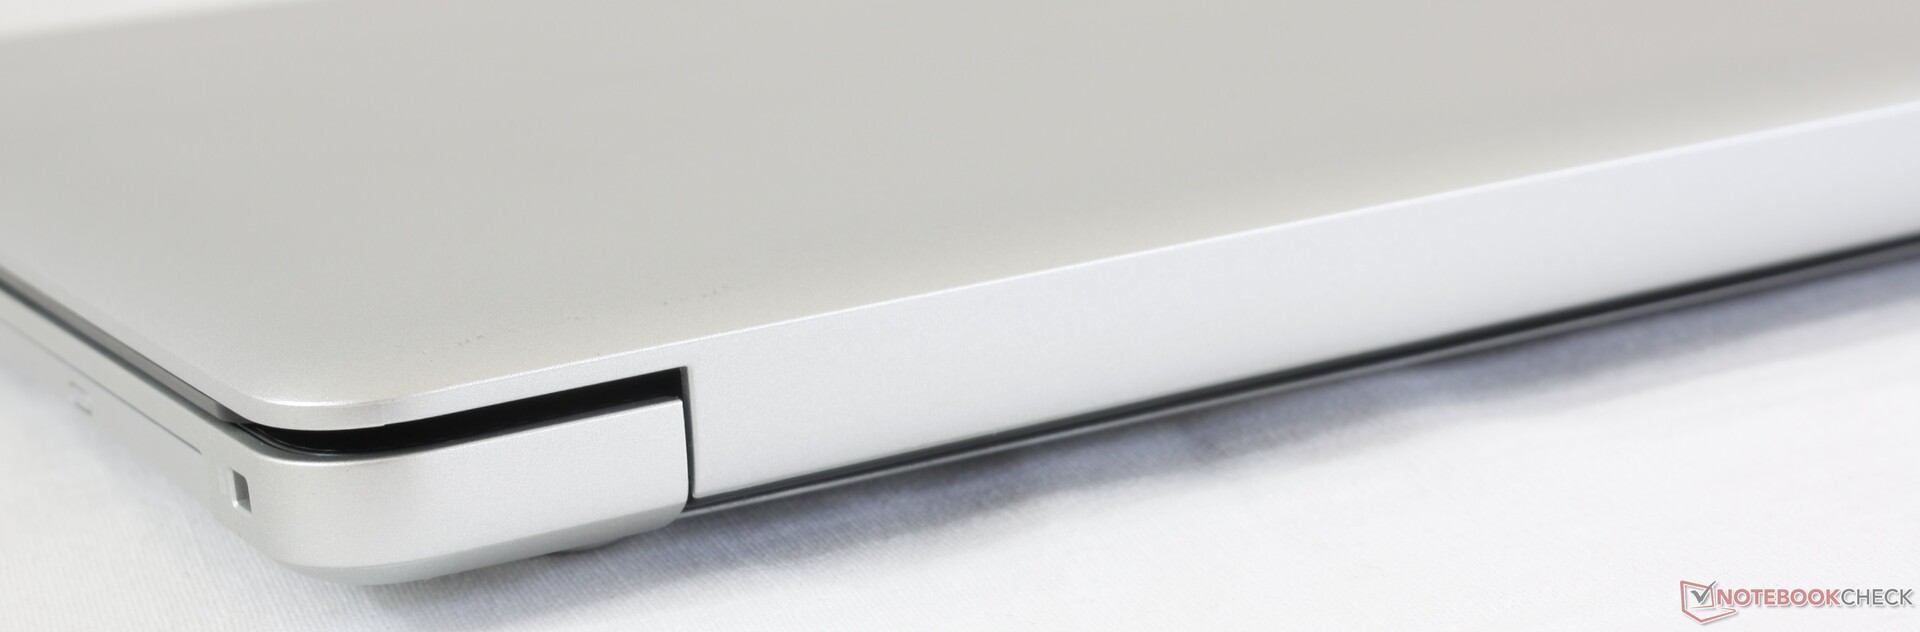
Vi hoppas att framtida revideringar åtgärdar några av de större bristerna utan att priset behöver öka. Det gäller i huvudsak den tjocka infattningen, den mjuka klickplattan, det numeriska tangentbordets mjuka knappar och bristen på USB C; saker som begränsar användarupplevelsen och systemets mångsidighet.
Undvik varianten med Radeon 520 och den billiga Inspiron 17 3780 kommer att bli en skaplig hemmalaptop för vardagsuppgifter och videoströmning. Investera i en primär SSD-enhet istället för en Core i7-processor och du får märkbart snabbare systemprestanda.
Dell Inspiron 17 3780
- 05/11/2019 v6 (old)
Allen Ngo
Price comparison
