Test: HP ProBook 470 G5 (i5-8250U, 930MX, SSD, FHD) Laptop (Sammanfattning)
| SD Card Reader | |
| average JPG Copy Test (av. of 3 runs) | |
| HP ProBook 470 G5 (Toshiba Exceria Pro SDXC 64 GB UHS-II) | |
| HP ProBook 470 G4 (Toshiba Exceria Pro SDXC 64 GB UHS-II) | |
| Acer Aspire E5-774G-78NA | |
| Lenovo V320-17IKB 81AH0002GE (Toshiba Exceria Pro SDXC 64 GB UHS-II) | |
| HP 17-bs103ng (Toshiba Exceria Pro SDXC 64 GB UHS-II) | |
| maximum AS SSD Seq Read Test (1GB) | |
| HP ProBook 470 G5 (Toshiba Exceria Pro SDXC 64 GB UHS-II) | |
| HP ProBook 470 G4 (Toshiba Exceria Pro SDXC 64 GB UHS-II) | |
| Acer Aspire E5-774G-78NA | |
| Lenovo V320-17IKB 81AH0002GE (Toshiba Exceria Pro SDXC 64 GB UHS-II) | |
| HP 17-bs103ng (Toshiba Exceria Pro SDXC 64 GB UHS-II) | |
| Networking | |
| iperf3 transmit AX12 | |
| HP ProBook 470 G5 | |
| Lenovo V320-17IKB 81AH0002GE | |
| HP 17-bs103ng | |
| iperf3 receive AX12 | |
| HP ProBook 470 G5 | |
| Lenovo V320-17IKB 81AH0002GE | |
| HP 17-bs103ng | |
| |||||||||||||||||||||||||
Distribution av ljusstyrkan: 87 %
Mitt på batteriet: 400 cd/m²
Kontrast: 635:1 (Svärta: 0.63 cd/m²)
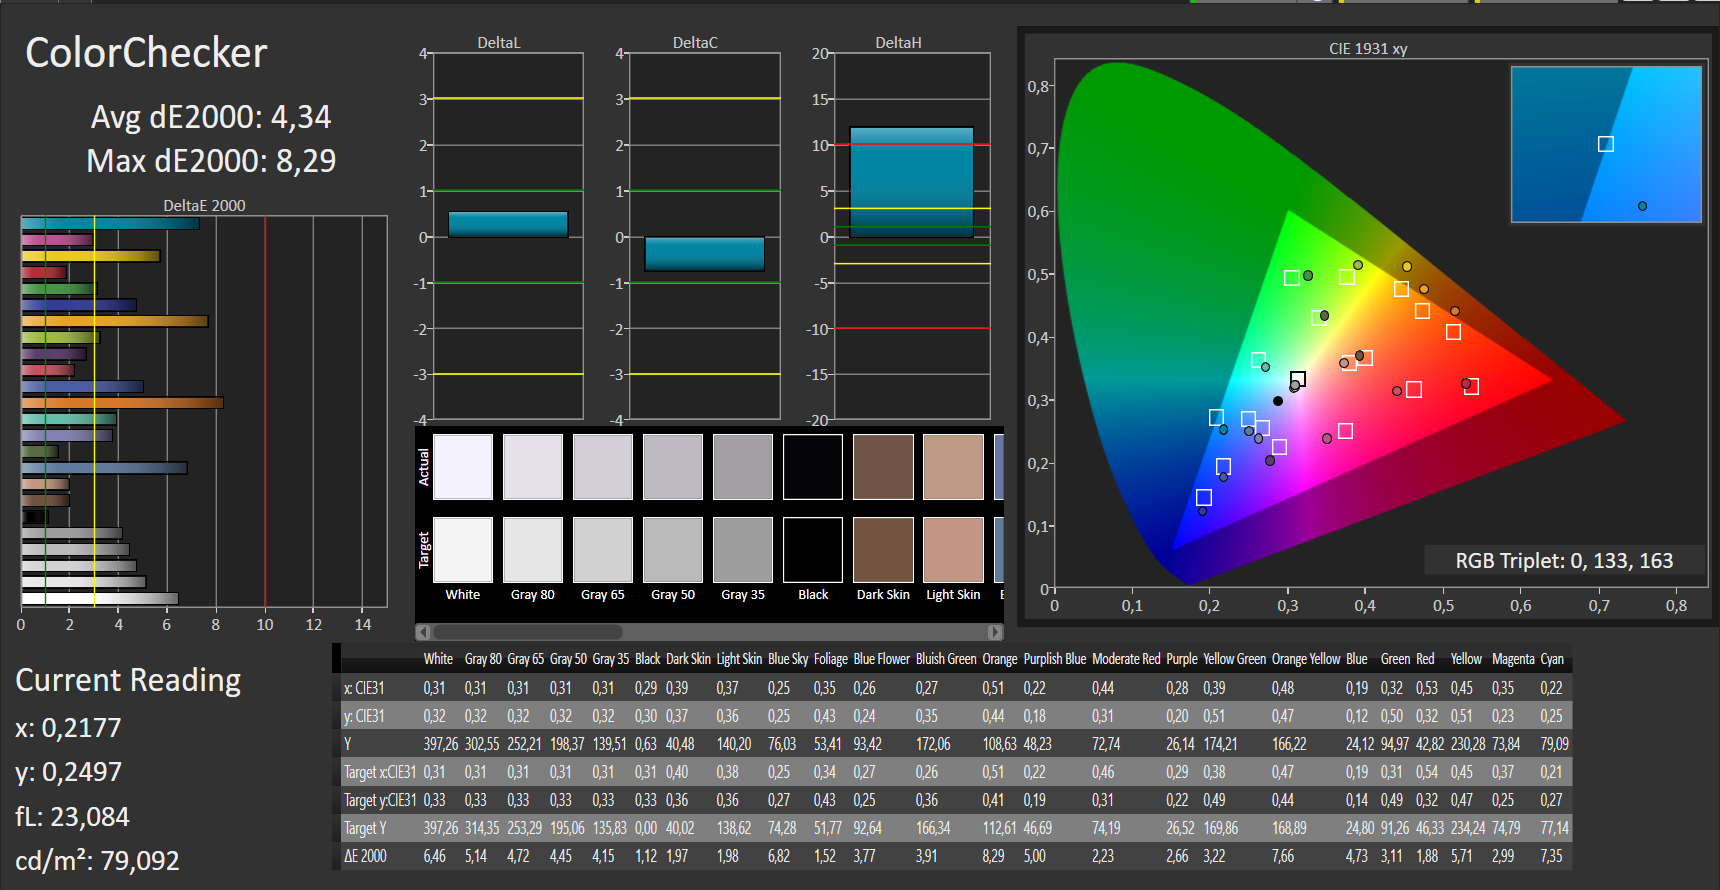
ΔE ColorChecker Calman: 4.34 | ∀{0.5-29.43 Ø4.73}
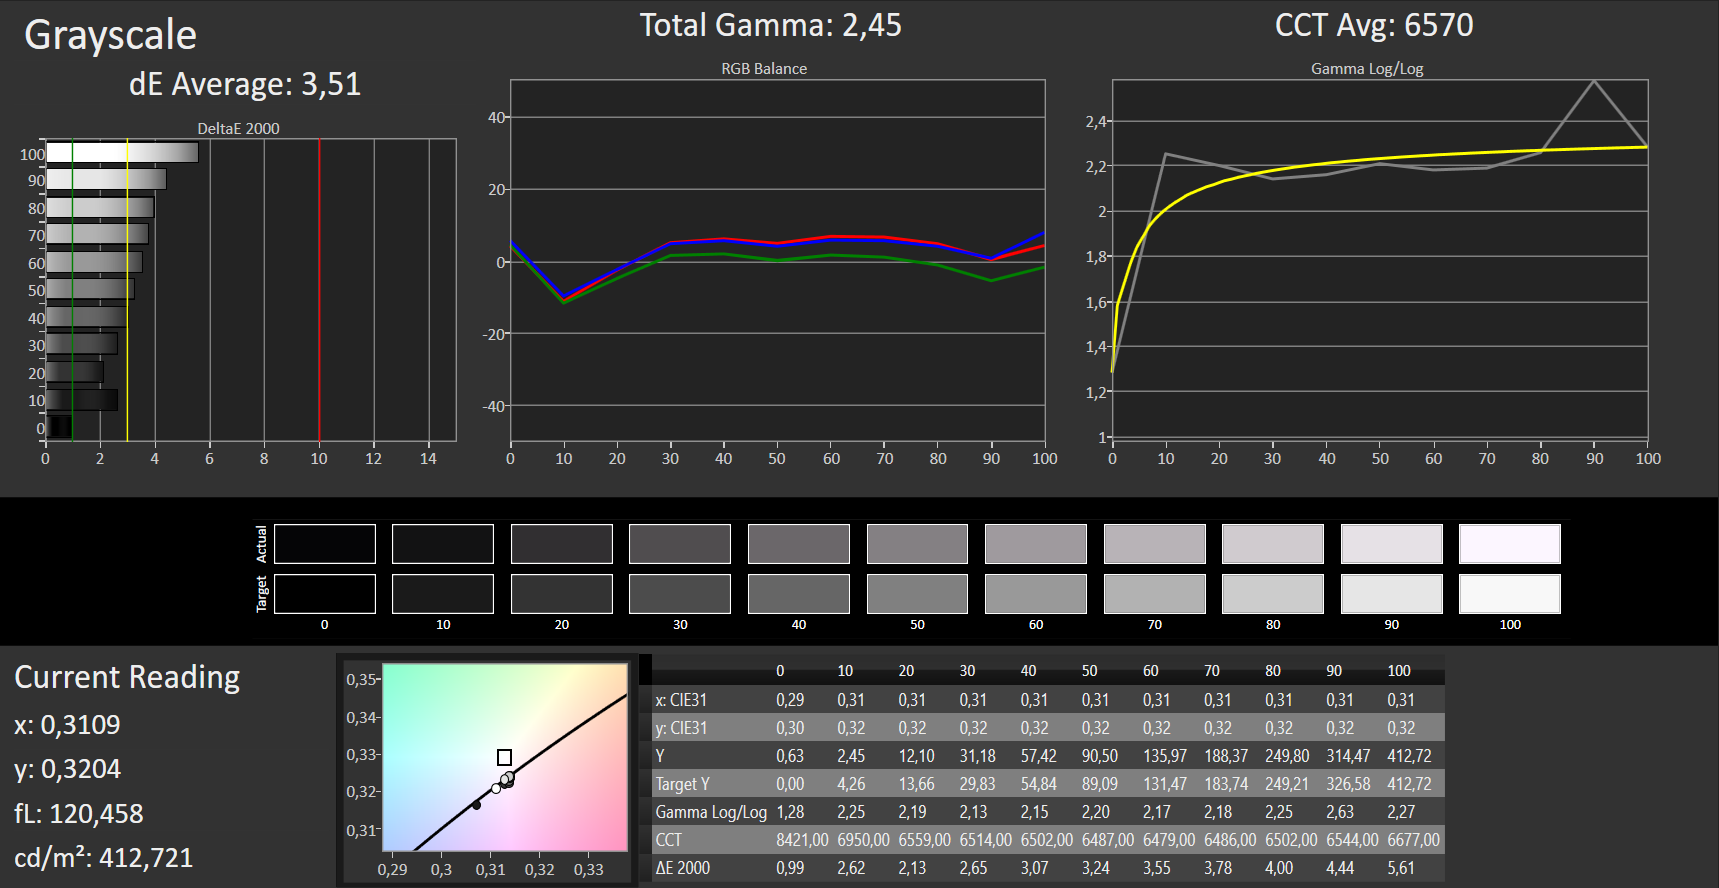
ΔE Greyscale Calman: 3.51 | ∀{0.09-98 Ø4.97}
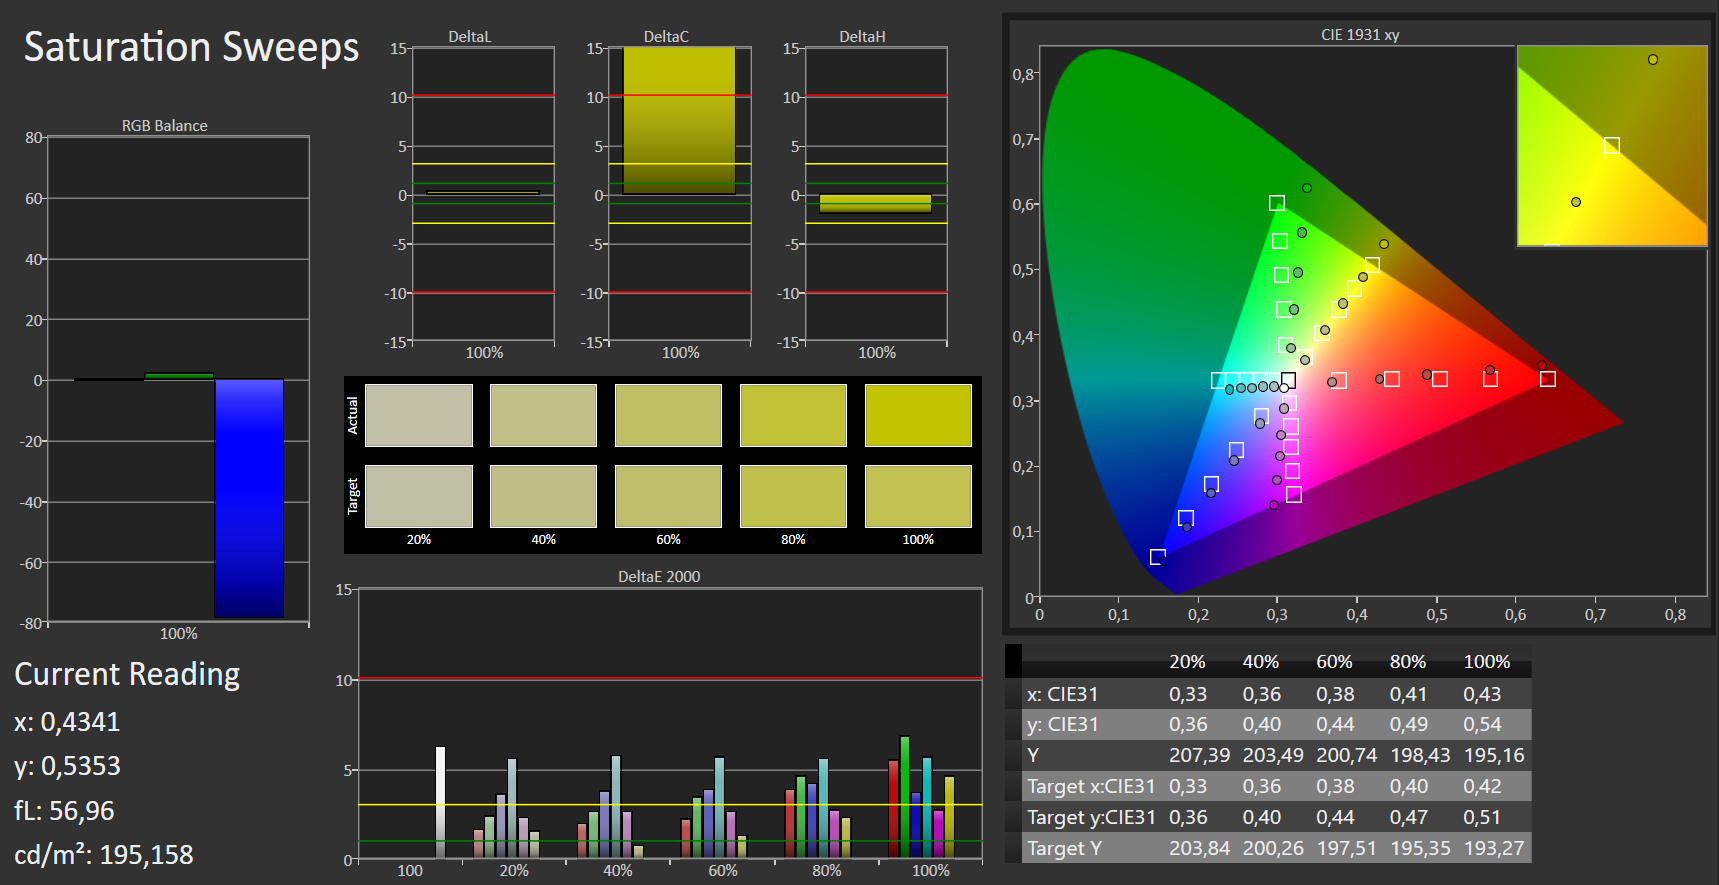
84% sRGB (Argyll 1.6.3 3D)
55% AdobeRGB 1998 (Argyll 1.6.3 3D)
61.8% AdobeRGB 1998 (Argyll 3D)
84.4% sRGB (Argyll 3D)
66.1% Display P3 (Argyll 3D)
Gamma: 2.45
CCT: 6570 K
| HP ProBook 470 G5 IPS, 1920x1080, 17.3" | HP ProBook 470 G4 LED IPS, 1920x1080, 17.3" | Lenovo V320-17IKB 81AH0002GE IPS, 1920x1080, 17.3" | HP 17-bs103ng TN LED, 1600x900, 17.3" | Acer Aspire E5-774G-78NA TN LED, 1920x1080, 17.3" | |
|---|---|---|---|---|---|
| Display | 4% | 0% | -17% | 11% | |
| Display P3 Coverage (%) | 66.1 | 64.1 -3% | 66.5 1% | 51.2 -23% | 72.3 9% |
| sRGB Coverage (%) | 84.4 | 92 9% | 84.5 0% | 73.8 -13% | 94.8 12% |
| AdobeRGB 1998 Coverage (%) | 61.8 | 65.7 6% | 61.8 0% | 52.8 -15% | 69.3 12% |
| Response Times | -8% | 9% | 16% | 1% | |
| Response Time Grey 50% / Grey 80% * (ms) | 36 ? | 44 ? -22% | 35 ? 3% | 45 ? -25% | 43 ? -19% |
| Response Time Black / White * (ms) | 28 ? | 26 ? 7% | 24 ? 14% | 12 ? 57% | 22 ? 21% |
| PWM Frequency (Hz) | 119000 ? | 1000 ? | |||
| Screen | 22% | 3% | -61% | -24% | |
| Brightness middle (cd/m²) | 400 | 361 -10% | 412 3% | 234 -41% | 320 -20% |
| Brightness (cd/m²) | 374 | 322 -14% | 377 1% | 202 -46% | 302 -19% |
| Brightness Distribution (%) | 87 | 84 -3% | 83 -5% | 74 -15% | 86 -1% |
| Black Level * (cd/m²) | 0.63 | 0.24 62% | 0.39 38% | 0.48 24% | 0.4 37% |
| Contrast (:1) | 635 | 1504 137% | 1056 66% | 488 -23% | 800 26% |
| Colorchecker dE 2000 * | 4.34 | 3.4 22% | 5.04 -16% | 10.28 -137% | 7.78 -79% |
| Colorchecker dE 2000 max. * | 8.29 | 6.6 20% | 8.84 -7% | 18.5 -123% | 12.74 -54% |
| Greyscale dE 2000 * | 3.51 | 4 -14% | 5.28 -50% | 12.78 -264% | 8.87 -153% |
| Gamma | 2.45 90% | 2.17 101% | 2.44 90% | 2.5 88% | 2.27 97% |
| CCT | 6570 99% | 6879 94% | 6900 94% | 13604 48% | 8979 72% |
| Color Space (Percent of AdobeRGB 1998) (%) | 55 | 59.6 8% | 55 0% | 59 7% | 62 13% |
| Color Space (Percent of sRGB) (%) | 84 | 91.6 9% | 84 0% | 92 10% | 95 13% |
| Totalt genomsnitt (program/inställningar) | 6% /
14% | 4% /
3% | -21% /
-42% | -4% /
-13% |
* ... mindre är bättre
Skärmflimmer / PWM (Puls-Width Modulation)
| Skärmflimmer / PWM upptäcktes inte | ||
Som jämförelse: 52 % av alla testade enheter använder inte PWM för att dämpa skärmen. Om PWM upptäcktes mättes ett medelvärde av 7798 (minst: 5 - maximum: 343500) Hz. | ||
Visa svarstider
| ↔ Svarstid svart till vitt | ||
|---|---|---|
| 28 ms ... stiga ↗ och falla ↘ kombinerat | ↗ 16 ms stiga | 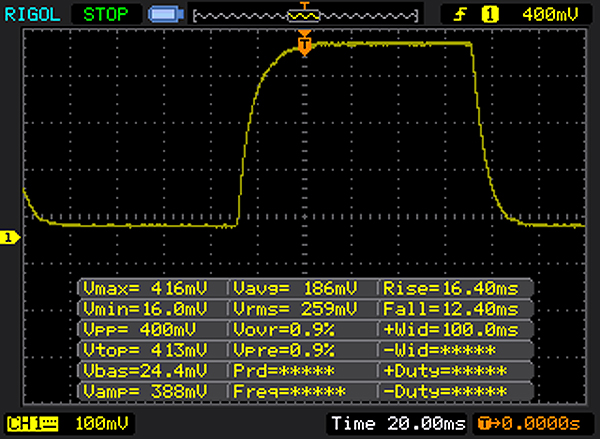 |
| ↘ 12 ms hösten | ||
| Skärmen visar relativt långsamma svarsfrekvenser i våra tester och kan vara för långsam för spelare. I jämförelse sträcker sig alla testade enheter från 0.1 (minst) till 240 (maximalt) ms. » 71 % av alla enheter är bättre. Detta innebär att den uppmätta svarstiden är sämre än genomsnittet av alla testade enheter (19.9 ms). | ||
| ↔ Svarstid 50 % grått till 80 % grått | ||
| 36 ms ... stiga ↗ och falla ↘ kombinerat | ↗ 18 ms stiga |  |
| ↘ 18 ms hösten | ||
| Skärmen visar långsamma svarsfrekvenser i våra tester och kommer att vara otillfredsställande för spelare. I jämförelse sträcker sig alla testade enheter från 0.165 (minst) till 636 (maximalt) ms. » 50 % av alla enheter är bättre. Detta innebär att den uppmätta svarstiden är sämre än genomsnittet av alla testade enheter (31.1 ms). | ||
| Cinebench R15 | |
| CPU Single 64Bit | |
| Acer Aspire 7 A717-71G-72VY | |
| MSI GS63VR 7RG-005 | |
| Acer Aspire 7 A715-71G-53TU | |
| HP ProBook 470 G4 | |
| HP 17-bs103ng | |
| HP ProBook 470 G5 | |
| Lenovo Legion Y520-15IKBN 80WK0042GE | |
| Acer Aspire E5-774G-78NA | |
| Lenovo V320-17IKB 81AH0002GE | |
| CPU Multi 64Bit | |
| MSI GS63VR 7RG-005 | |
| Acer Aspire 7 A717-71G-72VY | |
| HP ProBook 470 G5 | |
| HP 17-bs103ng | |
| Lenovo Legion Y520-15IKBN 80WK0042GE | |
| Acer Aspire 7 A715-71G-53TU | |
| HP ProBook 470 G4 | |
| Acer Aspire E5-774G-78NA | |
| Lenovo V320-17IKB 81AH0002GE | |
| Cinebench R10 | |
| Rendering Multiple CPUs 32Bit | |
| MSI GS63VR 7RG-005 | |
| HP ProBook 470 G5 | |
| Acer Aspire 7 A715-71G-53TU | |
| Lenovo Legion Y520-15IKBN 80WK0042GE | |
| HP 17-bs103ng | |
| HP ProBook 470 G4 | |
| Lenovo V320-17IKB 81AH0002GE | |
| Acer Aspire E5-774G-78NA | |
| Rendering Single 32Bit | |
| MSI GS63VR 7RG-005 | |
| HP ProBook 470 G4 | |
| Acer Aspire 7 A715-71G-53TU | |
| HP ProBook 470 G5 | |
| HP 17-bs103ng | |
| Lenovo Legion Y520-15IKBN 80WK0042GE | |
| Lenovo V320-17IKB 81AH0002GE | |
| Acer Aspire E5-774G-78NA | |
| Geekbench 3 | |
| 32 Bit Multi-Core Score | |
| MSI GS63VR 7RG-005 | |
| HP 17-bs103ng | |
| HP ProBook 470 G5 | |
| Lenovo Legion Y520-15IKBN 80WK0042GE | |
| Acer Aspire E5-774G-78NA | |
| Lenovo V320-17IKB 81AH0002GE | |
| 32 Bit Single-Core Score | |
| MSI GS63VR 7RG-005 | |
| Acer Aspire E5-774G-78NA | |
| HP 17-bs103ng | |
| HP ProBook 470 G5 | |
| Lenovo V320-17IKB 81AH0002GE | |
| Lenovo Legion Y520-15IKBN 80WK0042GE | |
| Geekbench 4.0 | |
| 64 Bit Multi-Core Score | |
| MSI GS63VR 7RG-005 | |
| HP 17-bs103ng | |
| HP ProBook 470 G5 | |
| Lenovo Legion Y520-15IKBN 80WK0042GE | |
| Lenovo V320-17IKB 81AH0002GE | |
| 64 Bit Single-Core Score | |
| MSI GS63VR 7RG-005 | |
| Lenovo Legion Y520-15IKBN 80WK0042GE | |
| HP ProBook 470 G5 | |
| HP 17-bs103ng | |
| Lenovo V320-17IKB 81AH0002GE | |
| Geekbench 4.4 | |
| 64 Bit Multi-Core Score | |
| MSI GS63VR 7RG-005 | |
| HP 17-bs103ng | |
| HP ProBook 470 G5 | |
| Lenovo Legion Y520-15IKBN 80WK0042GE | |
| Lenovo V320-17IKB 81AH0002GE | |
| 64 Bit Single-Core Score | |
| MSI GS63VR 7RG-005 | |
| HP ProBook 470 G5 | |
| HP 17-bs103ng | |
| Lenovo Legion Y520-15IKBN 80WK0042GE | |
| Lenovo V320-17IKB 81AH0002GE | |
| JetStream 1.1 - 1.1 Total | |
| MSI GS63VR 7RG-005 (Edge 41) | |
| HP 17-bs103ng (Edge 41) | |
| Acer Aspire 7 A715-71G-53TU (EDGE: 41.16299.15.0) | |
| Lenovo Legion Y520-15IKBN 80WK0042GE (Edge 40) | |
| HP ProBook 470 G5 (Edge 41) | |
| Acer Aspire E5-774G-78NA (Edge 38.14393.0.0) | |
| Lenovo V320-17IKB 81AH0002GE (Edge 40) | |
| Octane V2 - Total Score | |
| MSI GS63VR 7RG-005 (Edge 41) | |
| HP ProBook 470 G4 | |
| Acer Aspire 7 A715-71G-53TU (EDGE: 41.16299.15.0) | |
| HP ProBook 470 G5 (Edge 41) | |
| Lenovo Legion Y520-15IKBN 80WK0042GE (Edge 40) | |
| Acer Aspire E5-774G-78NA (Edge 38.14393.0.0) | |
| Lenovo V320-17IKB 81AH0002GE (Edge 40) | |
| Mozilla Kraken 1.1 - Total | |
| Lenovo V320-17IKB 81AH0002GE (Edge 40) | |
| Acer Aspire E5-774G-78NA (Edge 38.14393.0.0) | |
| Lenovo Legion Y520-15IKBN 80WK0042GE (Edge 40) | |
| HP ProBook 470 G5 (Edge 41) | |
| Acer Aspire 7 A715-71G-53TU (EDGE: 41.16299.15.0) | |
| MSI GS63VR 7RG-005 (Edge 41) | |
* ... mindre är bättre
| PCMark 7 Score | 5862 poäng | |
| PCMark 8 Home Score Accelerated v2 | 3844 poäng | |
| PCMark 8 Creative Score Accelerated v2 | 4888 poäng | |
| PCMark 8 Work Score Accelerated v2 | 4922 poäng | |
| PCMark 10 Score | 3372 poäng | |
Hjälp | ||
| PCMark 8 | |
| Home Score Accelerated v2 | |
| HP ProBook 470 G5 | |
| HP 17-bs103ng | |
| Lenovo V320-17IKB 81AH0002GE | |
| Acer Aspire E5-774G-78NA | |
| HP ProBook 470 G4 | |
| Work Score Accelerated v2 | |
| HP ProBook 470 G5 | |
| HP ProBook 470 G4 | |
| HP 17-bs103ng | |
| Lenovo V320-17IKB 81AH0002GE | |
| Acer Aspire E5-774G-78NA | |

| HP ProBook 470 G5 Intel SSD 600p SSDPEKKW256G7 | HP ProBook 470 G4 SanDisk Z400s SD8SNAT-256G | Lenovo V320-17IKB 81AH0002GE SK Hynix HFS256G3BTND | HP 17-bs103ng Seagate Mobile HDD 1TB ST1000LM035 | Acer Aspire E5-774G-78NA Lite-On CV1-8B256 | Schenker XMG Core 15 Samsung SSD 960 Evo 250GB m.2 NVMe | |
|---|---|---|---|---|---|---|
| CrystalDiskMark 3.0 | -46% | -40% | -95% | -33% | 47% | |
| Read Seq (MB/s) | 1113 | 472 -58% | 473.7 -57% | 73 -93% | 520 -53% | 1338 20% |
| Write Seq (MB/s) | 592 | 323 -45% | 260.8 -56% | 80.1 -86% | 332.8 -44% | 1188 101% |
| Read 512 (MB/s) | 831 | 337 -59% | 29.93 -96% | 382.8 -54% | 780 -6% | |
| Write 512 (MB/s) | 596 | 263.3 -56% | 72.3 -88% | 357.7 -40% | 1006 69% | |
| Read 4k (MB/s) | 32.12 | 16.9 -47% | 29.41 -8% | 0.399 -99% | 32.31 1% | 58.3 82% |
| Write 4k (MB/s) | 111.3 | 81.4 -27% | 73.3 -34% | 0.502 -100% | 85.1 -24% | 134 20% |
| Read 4k QD32 (MB/s) | 289.3 | 148 -49% | 298.3 3% | 0.707 -100% | 277.7 -4% | 577 99% |
| Write 4k QD32 (MB/s) | 520 | 254 -51% | 242.5 -53% | 0.704 -100% | 269.8 -48% | 481.9 -7% |
| 3DMark 06 Standard Score | 13529 poäng | |
| 3DMark 11 Performance | 2568 poäng | |
| 3DMark Ice Storm Standard Score | 71571 poäng | |
| 3DMark Cloud Gate Standard Score | 8611 poäng | |
| 3DMark Fire Strike Score | 1491 poäng | |
| 3DMark Fire Strike Extreme Score | 718 poäng | |
| 3DMark Time Spy Score | 564 poäng | |
Hjälp | ||
| 3DMark 11 - 1280x720 Performance GPU | |
| Acer Aspire E5-774G-78NA | |
| HP ProBook 470 G5 | |
| HP 17-bs103ng | |
| HP ProBook 470 G4 | |
| Lenovo Ideapad 110-17IKB 80VK0001GE | |
| Lenovo V320-17IKB 81AH0002GE | |
| HP 17-y044ng | |
| 3DMark | |
| 1280x720 Cloud Gate Standard Graphics | |
| Acer Aspire E5-774G-78NA | |
| HP ProBook 470 G4 | |
| HP ProBook 470 G5 | |
| Lenovo V320-17IKB 81AH0002GE | |
| HP 17-bs103ng | |
| 1920x1080 Fire Strike Graphics | |
| Acer Aspire E5-774G-78NA | |
| HP ProBook 470 G5 | |
| HP ProBook 470 G4 | |
| HP 17-bs103ng | |
| Lenovo V320-17IKB 81AH0002GE | |
| låg | med. | hög | ultra | |
|---|---|---|---|---|
| StarCraft 2 (2010) | 300.2 | 83.3 | 45.9 | 24.7 |
| Diablo III (2012) | 139.2 | 94.6 | 80 | 47.1 |
| Tomb Raider (2013) | 136 | 65.4 | 36.4 | 17.7 |
| BioShock Infinite (2013) | 93.7 | 53.1 | 43.9 | 14.6 |
| Sims 4 (2014) | 186 | 81.2 | 40.3 | 30.4 |
| Dragon Age: Inquisition (2014) | 55.2 | 35.8 | 12.1 | 8.2 |
| Battlefield Hardline (2015) | 83.1 | 57.4 | 19.4 | 11.8 |
| The Witcher 3 (2015) | 30.5 | 18.5 | 10 | 6 |
| Dota 2 Reborn (2015) | 91 | 74 | 35.5 | 33.2 |
| World of Warships (2015) | 122 | 85.5 | 38.7 | 24.4 |
| Overwatch (2016) | 74.2 | 52.2 | 23.3 | 14.8 |
| Mirror's Edge Catalyst (2016) | 42.1 | 25.6 | 11.3 | 8.7 |
| Farming Simulator 17 (2016) | 133.8 | 85.1 | 34.6 | 23.8 |
| For Honor (2017) | 43.4 | 14.2 | 13.6 | 10.4 |
| Ghost Recon Wildlands (2017) | 26.4 | 10.8 | 9.7 | 3.1 |
| Prey (2017) | 56 | 21.2 | 17.6 | 14.9 |
| Rocket League (2017) | 89.6 | 30.9 | 21.3 | |
| Team Fortress 2 (2017) | 105 | 100 | 75 | 41 |
| Playerunknown's Battlegrounds (PUBG) (2017) | 41.4 | 16.7 | 14.7 | 9.1 |
| F1 2017 (2017) | 45 | 21 | 16 | 13 |
| FIFA 18 (2017) | 124 | 65.2 | 52 | 49.9 |
| Middle-earth: Shadow of War (2017) | 30 | 12 | 9 | 7 |
| ELEX (2017) | 27.1 | 12.8 | 10.2 | 7.4 |
| Destiny 2 (2017) | 30 | 13.1 | 10.8 | 7.9 |
| Assassin´s Creed Origins (2017) | 23 | 10 | 9 | 7 |
| Call of Duty WWII (2017) | 60 | 36.3 | 16.9 | 11.7 |
| Need for Speed Payback (2017) | 30.9 | 15.3 | 12.5 | 12 |
| Star Wars Battlefront 2 (2017) | 43 | 16.2 | 13.6 | 10 |
| BioShock Infinite - 1366x768 High Preset | |
| Acer Aspire 5 A517-51G-80L | |
| Acer Aspire E5-774G-78NA | |
| HP ProBook 470 G5 | |
| HP 17-bs103ng | |
| Lenovo V320-17IKB 81AH0002GE | |
| HP 17-y044ng | |
| Lenovo Ideapad 110-17IKB 80VK0001GE | |
| Tomb Raider - 1366x768 Normal Preset AA:FX AF:4x | |
| Acer Aspire E5-774G-78NA | |
| HP ProBook 470 G5 | |
| HP 17-bs103ng | |
| Lenovo V320-17IKB 81AH0002GE | |
| Lenovo Ideapad 110-17IKB 80VK0001GE | |
| The Witcher 3 - 1024x768 Low Graphics & Postprocessing | |
| Acer Aspire E5-774G-78NA | |
| HP ProBook 470 G5 | |
| HP ProBook 470 G4 | |
Ljudnivå
| Låg belastning |
| 30.5 / 30.5 / 30.5 dB(A) |
| Hög belastning |
| 33 / 38 dB(A) |
 | ||
30 dB tyst 40 dB(A) hörbar 50 dB(A) högt ljud |
||
min: | ||
| HP ProBook 470 G5 i5-8250U, GeForce 930MX | HP ProBook 470 G4 i7-7500U, GeForce 930MX | Lenovo V320-17IKB 81AH0002GE i5-7200U, HD Graphics 620 | HP 17-bs103ng i5-8250U, Radeon 530 | Acer Aspire E5-774G-78NA 6500U, GeForce 940MX | |
|---|---|---|---|---|---|
| Noise | -6% | 0% | -2% | -7% | |
| av / miljö * (dB) | 30.5 | 29.7 3% | 30 2% | 30.4 -0% | 31.2 -2% |
| Idle Minimum * (dB) | 30.5 | 29.7 3% | 30.5 -0% | 32.6 -7% | 33.2 -9% |
| Idle Average * (dB) | 30.5 | 31.7 -4% | 30.5 -0% | 32.6 -7% | 33.2 -9% |
| Idle Maximum * (dB) | 30.5 | 31.7 -4% | 30.5 -0% | 32.6 -7% | 33.7 -10% |
| Load Average * (dB) | 33 | 37.8 -15% | 35 -6% | 32.8 1% | 36 -9% |
| Load Maximum * (dB) | 38 | 45.9 -21% | 35.8 6% | 34.2 10% | 40 -5% |
* ... mindre är bättre
(+) Den maximala temperaturen på ovansidan är 38.4 °C / 101 F, jämfört med genomsnittet av 34.3 °C / 94 F , allt från 21.2 till 62.5 °C för klassen Office.
(±) Botten värms upp till maximalt 40.1 °C / 104 F, jämfört med genomsnittet av 36.8 °C / 98 F
(+) Vid tomgångsbruk är medeltemperaturen för ovansidan 24.4 °C / 76 F, jämfört med enhetsgenomsnittet på 29.5 °C / ### class_avg_f### F.
(+) Handledsstöden och pekplattan är kallare än hudtemperaturen med maximalt 26.3 °C / 79.3 F och är därför svala att ta på.
(±) Medeltemperaturen för handledsstödsområdet på liknande enheter var 27.5 °C / 81.5 F (+1.2 °C / 2.2 F).
| HP ProBook 470 G5 i5-8250U, GeForce 930MX | HP ProBook 470 G4 i7-7500U, GeForce 930MX | Lenovo V320-17IKB 81AH0002GE i5-7200U, HD Graphics 620 | HP 17-bs103ng i5-8250U, Radeon 530 | Acer Aspire E5-774G-78NA 6500U, GeForce 940MX | |
|---|---|---|---|---|---|
| Heat | -16% | -6% | 7% | -8% | |
| Maximum Upper Side * (°C) | 38.4 | 40 -4% | 37.3 3% | 30 22% | 37.1 3% |
| Maximum Bottom * (°C) | 40.1 | 46 -15% | 37 8% | 28.3 29% | 48 -20% |
| Idle Upper Side * (°C) | 25.4 | 29.9 -18% | 28.7 -13% | 27.2 -7% | 26.1 -3% |
| Idle Bottom * (°C) | 24.9 | 31.2 -25% | 30.1 -21% | 29 -16% | 27.6 -11% |
* ... mindre är bättre
HP ProBook 470 G5 ljudanalys
(-) | inte särskilt höga högtalare (71.7 dB)
Bas 100 - 315 Hz
(-) | nästan ingen bas - i genomsnitt 25.6% lägre än medianen
(±) | linjäriteten för basen är genomsnittlig (8.8% delta till föregående frekvens)
Mellan 400 - 2000 Hz
(+) | balanserad mellan - endast 3.6% från medianen
(±) | linjäriteten för mids är genomsnittlig (7.5% delta till föregående frekvens)
Högsta 2 - 16 kHz
(+) | balanserade toppar - endast 4% från medianen
(+) | toppar är linjära (4.1% delta till föregående frekvens)
Totalt 100 - 16 000 Hz
(±) | linjäriteten för det totala ljudet är genomsnittlig (22.2% skillnad mot median)
Jämfört med samma klass
» 58% av alla testade enheter i den här klassen var bättre, 9% liknande, 33% sämre
» Den bästa hade ett delta på 7%, genomsnittet var 21%, sämst var 53%
Jämfört med alla testade enheter
» 64% av alla testade enheter var bättre, 6% liknande, 29% sämre
» Den bästa hade ett delta på 4%, genomsnittet var 24%, sämst var 134%
Apple MacBook 12 (Early 2016) 1.1 GHz ljudanalys
(+) | högtalare kan spela relativt högt (83.6 dB)
Bas 100 - 315 Hz
(±) | reducerad bas - i genomsnitt 11.3% lägre än medianen
(±) | linjäriteten för basen är genomsnittlig (14.2% delta till föregående frekvens)
Mellan 400 - 2000 Hz
(+) | balanserad mellan - endast 2.4% från medianen
(+) | mids är linjära (5.5% delta till föregående frekvens)
Högsta 2 - 16 kHz
(+) | balanserade toppar - endast 2% från medianen
(+) | toppar är linjära (4.5% delta till föregående frekvens)
Totalt 100 - 16 000 Hz
(+) | det totala ljudet är linjärt (10.2% skillnad mot median)
Jämfört med samma klass
» 7% av alla testade enheter i den här klassen var bättre, 2% liknande, 91% sämre
» Den bästa hade ett delta på 5%, genomsnittet var 18%, sämst var 53%
Jämfört med alla testade enheter
» 5% av alla testade enheter var bättre, 1% liknande, 94% sämre
» Den bästa hade ett delta på 4%, genomsnittet var 24%, sämst var 134%
| Av/Standby | |
| Låg belastning | |
| Hög belastning |
|
Förklaring:
min: | |
| HP ProBook 470 G5 i5-8250U, GeForce 930MX | HP ProBook 470 G4 i7-7500U, GeForce 930MX | Lenovo V320-17IKB 81AH0002GE i5-7200U, HD Graphics 620 | HP 17-bs103ng i5-8250U, Radeon 530 | Acer Aspire E5-774G-78NA 6500U, GeForce 940MX | |
|---|---|---|---|---|---|
| Power Consumption | -3% | 12% | 32% | -38% | |
| Idle Minimum * (Watt) | 3.4 | 4.3 -26% | 3.8 -12% | 3.5 -3% | 8.2 -141% |
| Idle Average * (Watt) | 9.6 | 8.8 8% | 9.6 -0% | 6.4 33% | 12.6 -31% |
| Idle Maximum * (Watt) | 11.8 | 9.4 20% | 10.4 12% | 6.9 42% | 13 -10% |
| Load Average * (Watt) | 43 | 51.2 -19% | 35.4 18% | 28.1 35% | 51 -19% |
| Load Maximum * (Watt) | 61 | 60.5 1% | 34 44% | 28.2 54% | 54.6 10% |
* ... mindre är bättre
| HP ProBook 470 G5 i5-8250U, GeForce 930MX, 48 Wh | HP ProBook 470 G4 i7-7500U, GeForce 930MX, 48 Wh | Lenovo V320-17IKB 81AH0002GE i5-7200U, HD Graphics 620, 35 Wh | HP 17-bs103ng i5-8250U, Radeon 530, 41.6 Wh | Acer Aspire E5-774G-78NA 6500U, GeForce 940MX, 41 Wh | |
|---|---|---|---|---|---|
| Batteridrifttid | -2% | -38% | -28% | -40% | |
| Reader / Idle (h) | 18.7 | 14.5 -22% | 12.7 -32% | 11.7 -37% | |
| H.264 (h) | 7.6 | 8.8 16% | 4.8 -37% | 5 -34% | |
| WiFi v1.3 (h) | 8.1 | 7.3 -10% | 5 -38% | 5.8 -28% | 5.4 -33% |
| Load (h) | 2.3 | 2.5 9% | 1.3 -43% | 1 -57% |
För
Emot
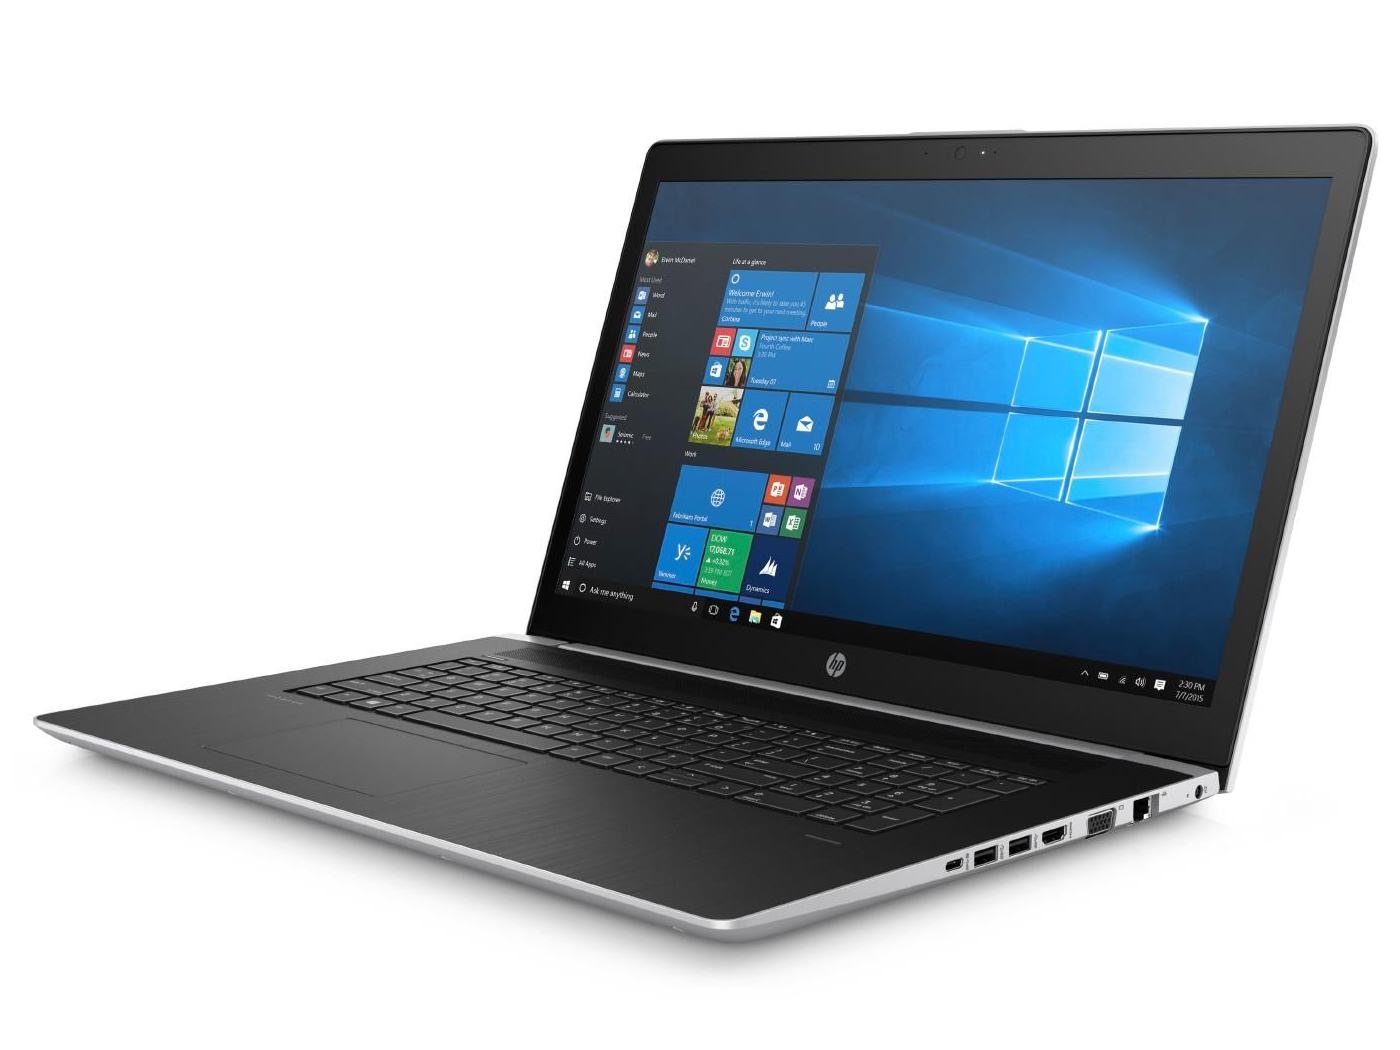
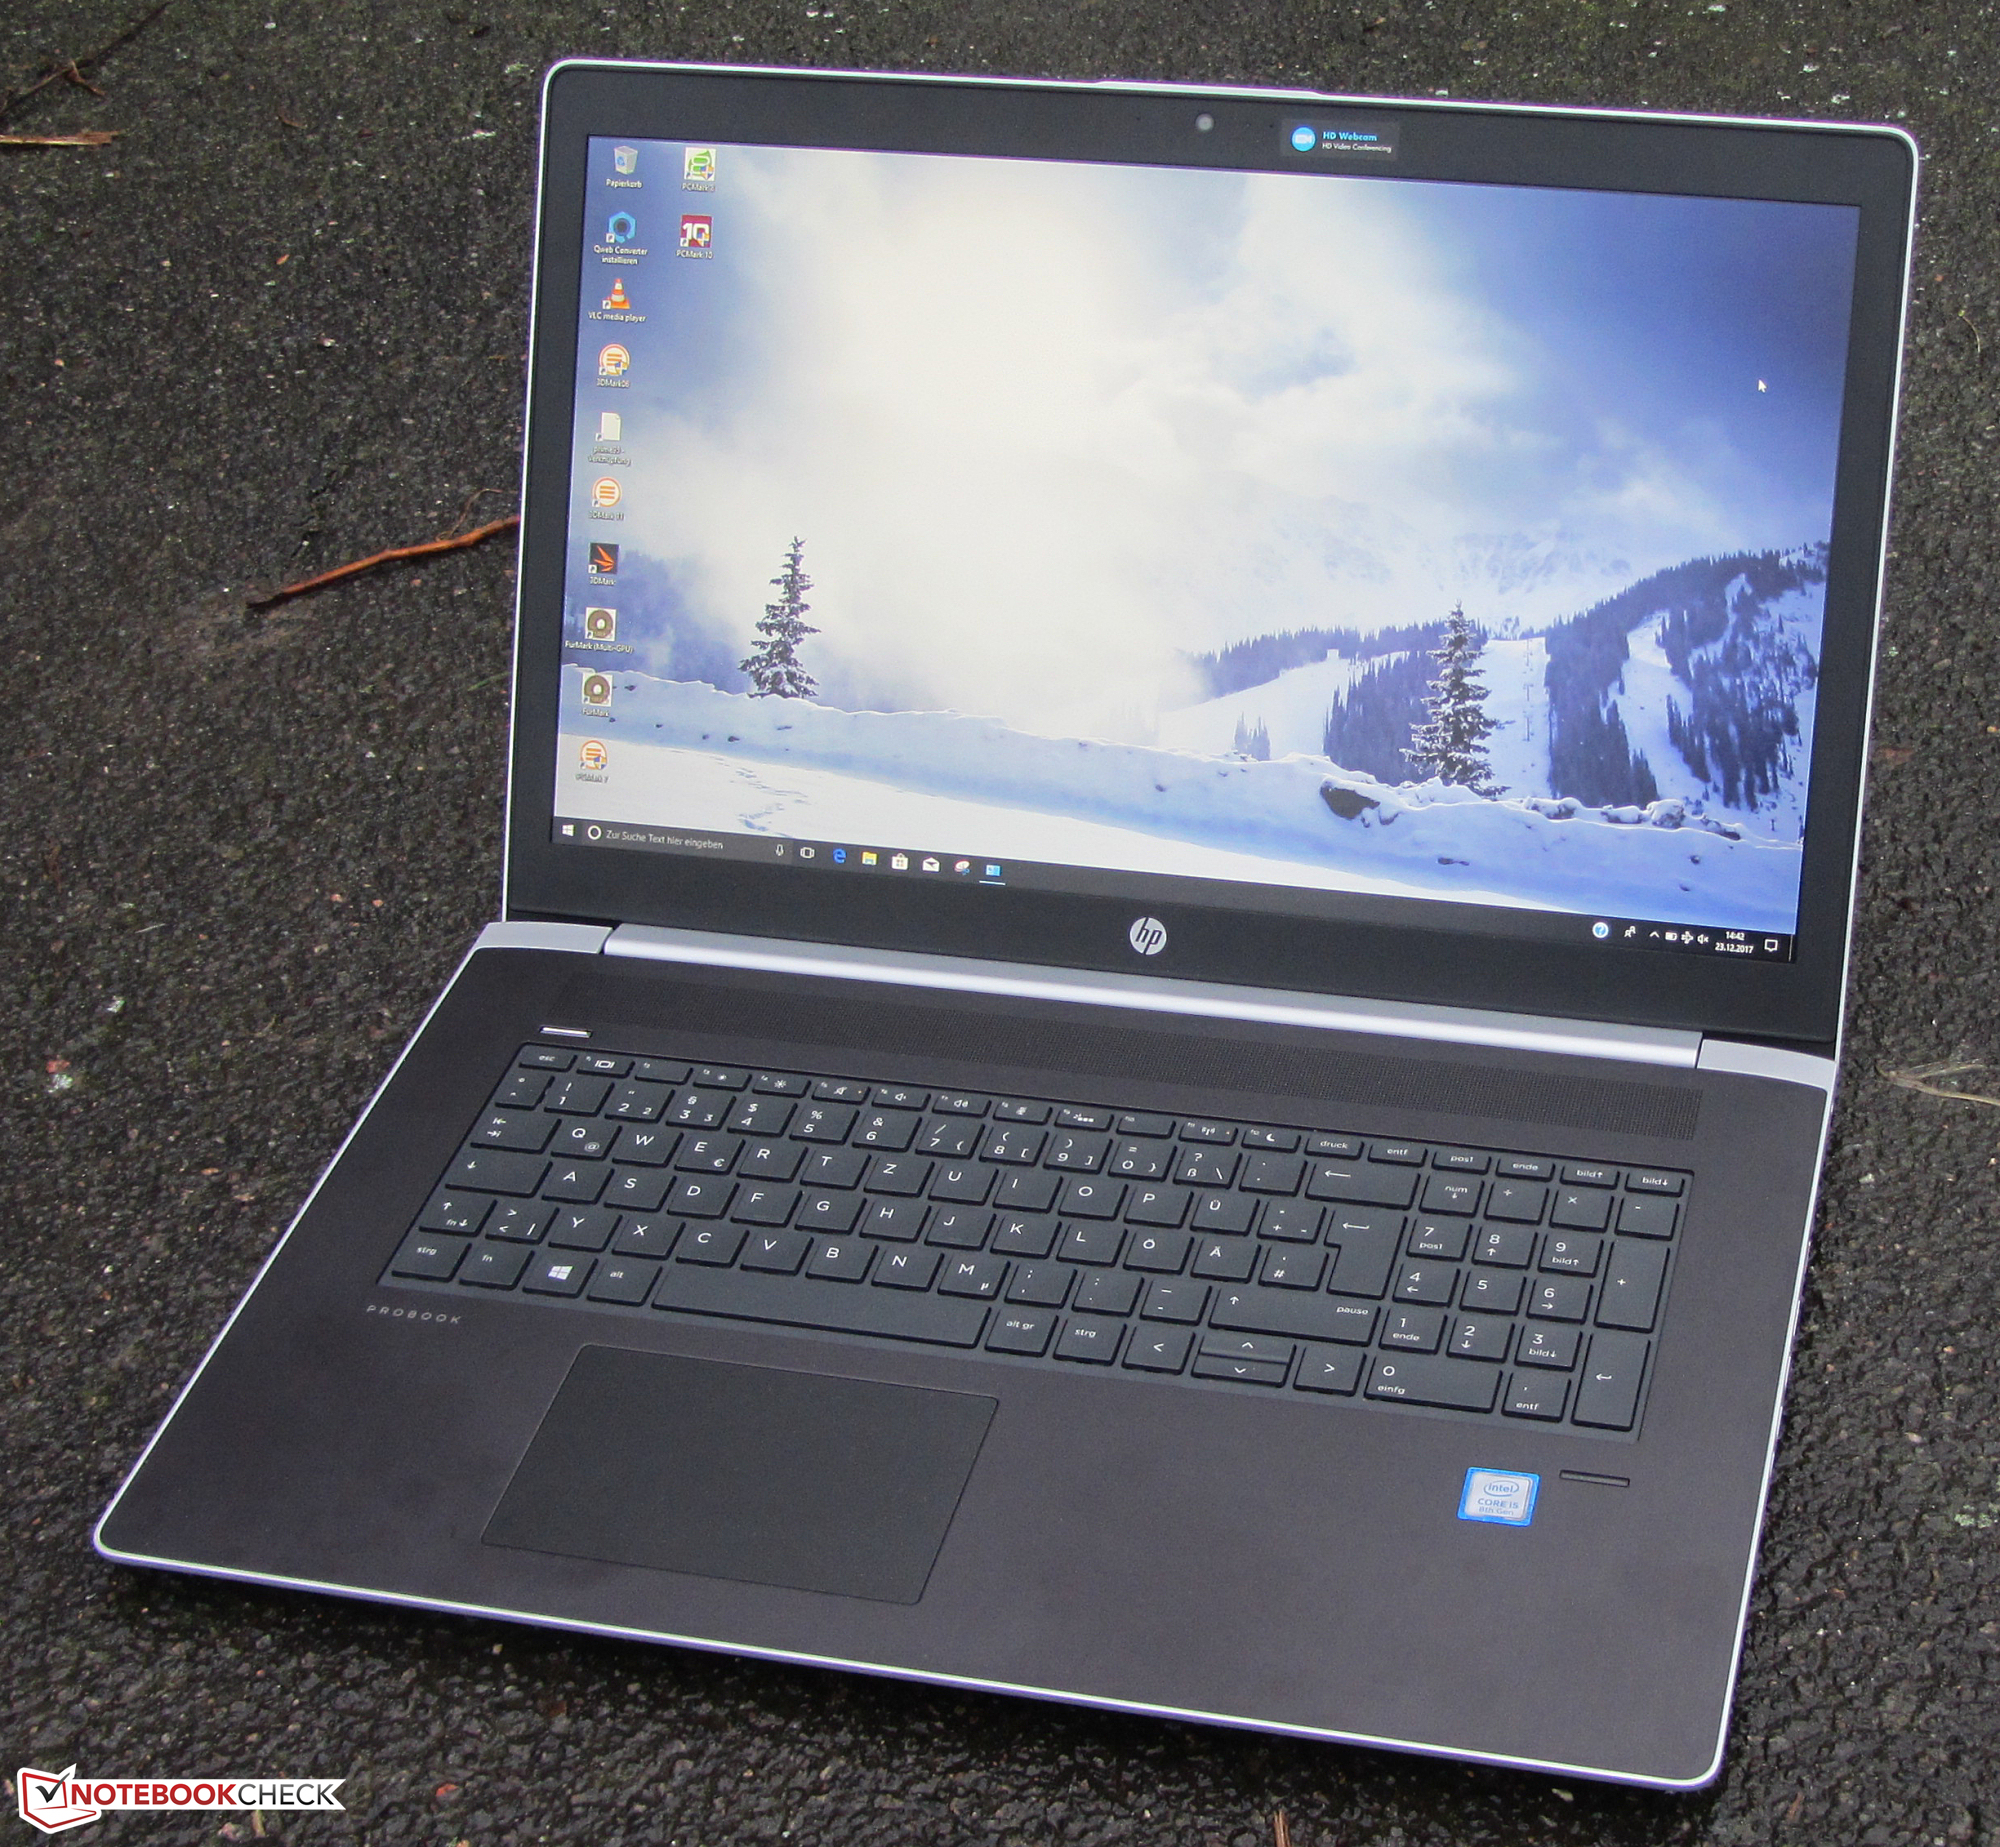
ProBook 470 G5 är den 6:e generationen av HP:s 17.3-tums företagslaptop (stamfadern var känd som ProBook 470 G0). Som förväntat så kommer en del av ändringarna Hewlett Packard utfört - som att ta bort den optiska enheten eller ta bort dom dedikerade knapparna för att aktivera/avaktivera dom trådlösa enheterna eller högtalarna - att göra en del personer väldigt upprörda.
ProBook 470 G5 är en välavrundad 17.3-tums arbetsenhet med rum för förbättring.
Denna laptop har designats för företagsanvändning så väl som för personlig användning. Tack vare dess fyrkärniga ULV-processor så finns rikligt med prestanda tillgänglig vid alla tillfällen och enheten tillåter till och med blygsamt spelande tack vare sitt dedikerade GeForce 930MX-grafikkort. Men vi hade hellre önskat oss en snabbare GPU. ProBook håller sig åtminstone väldigt sval och tyst oavsett belastning.
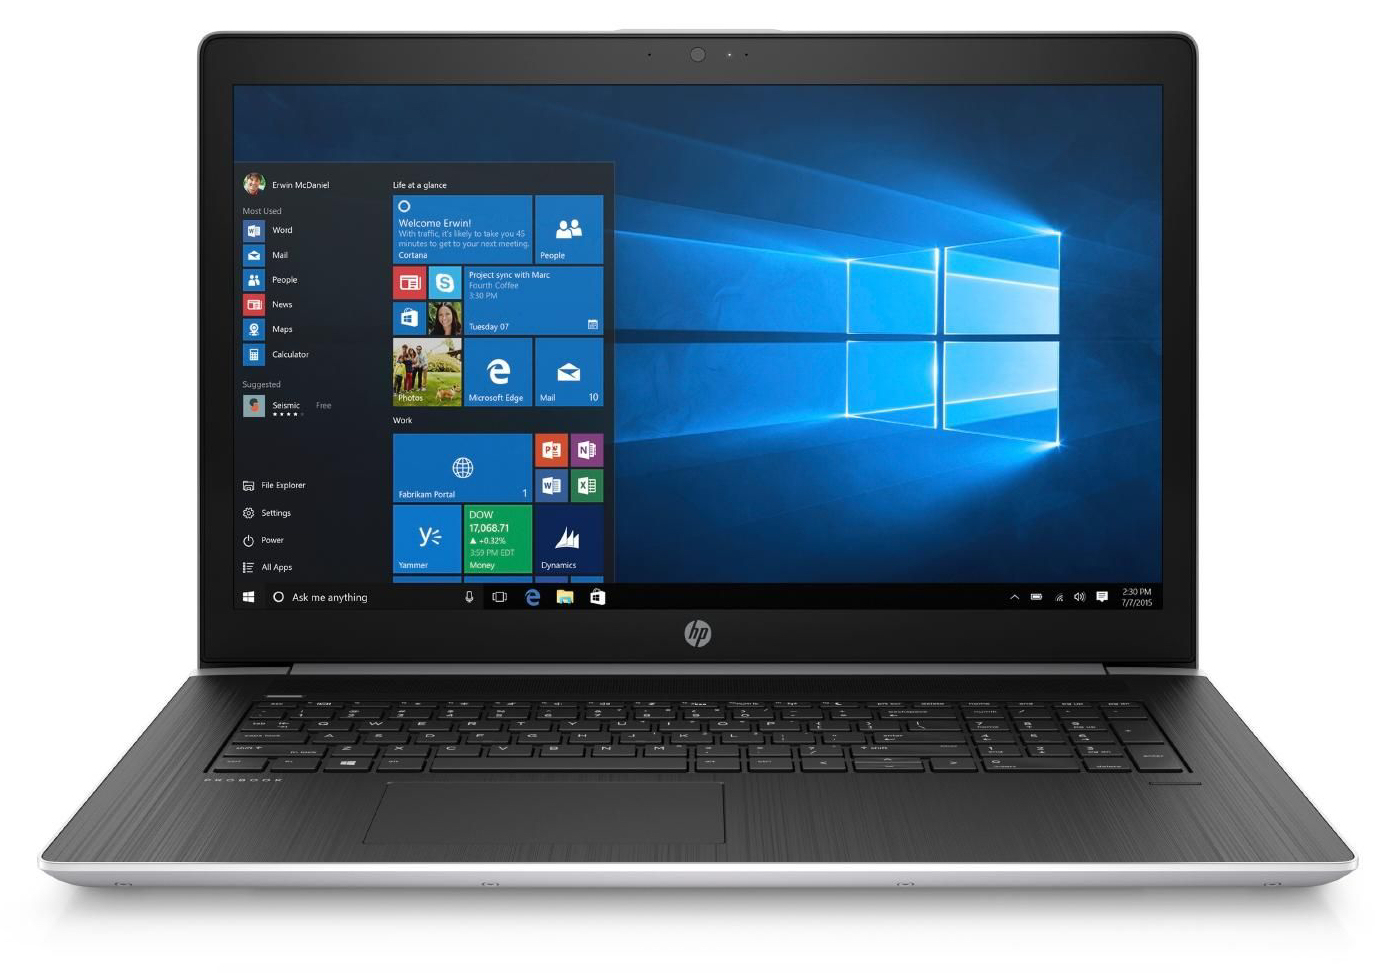
Systemprestandan var tillräcklig tack vare dess snabba NVMe SSD, och att ersätta SSD:n med en modell med mer utrymme går smidigt tack vare dom två dedikerade service-luckorna i botten. IPS FHD-skärmen levererar fantastiska betraktningsvinklar och väldigt hög ljusstyrka även om kontrasten får erkännas vara på den låga sidan.
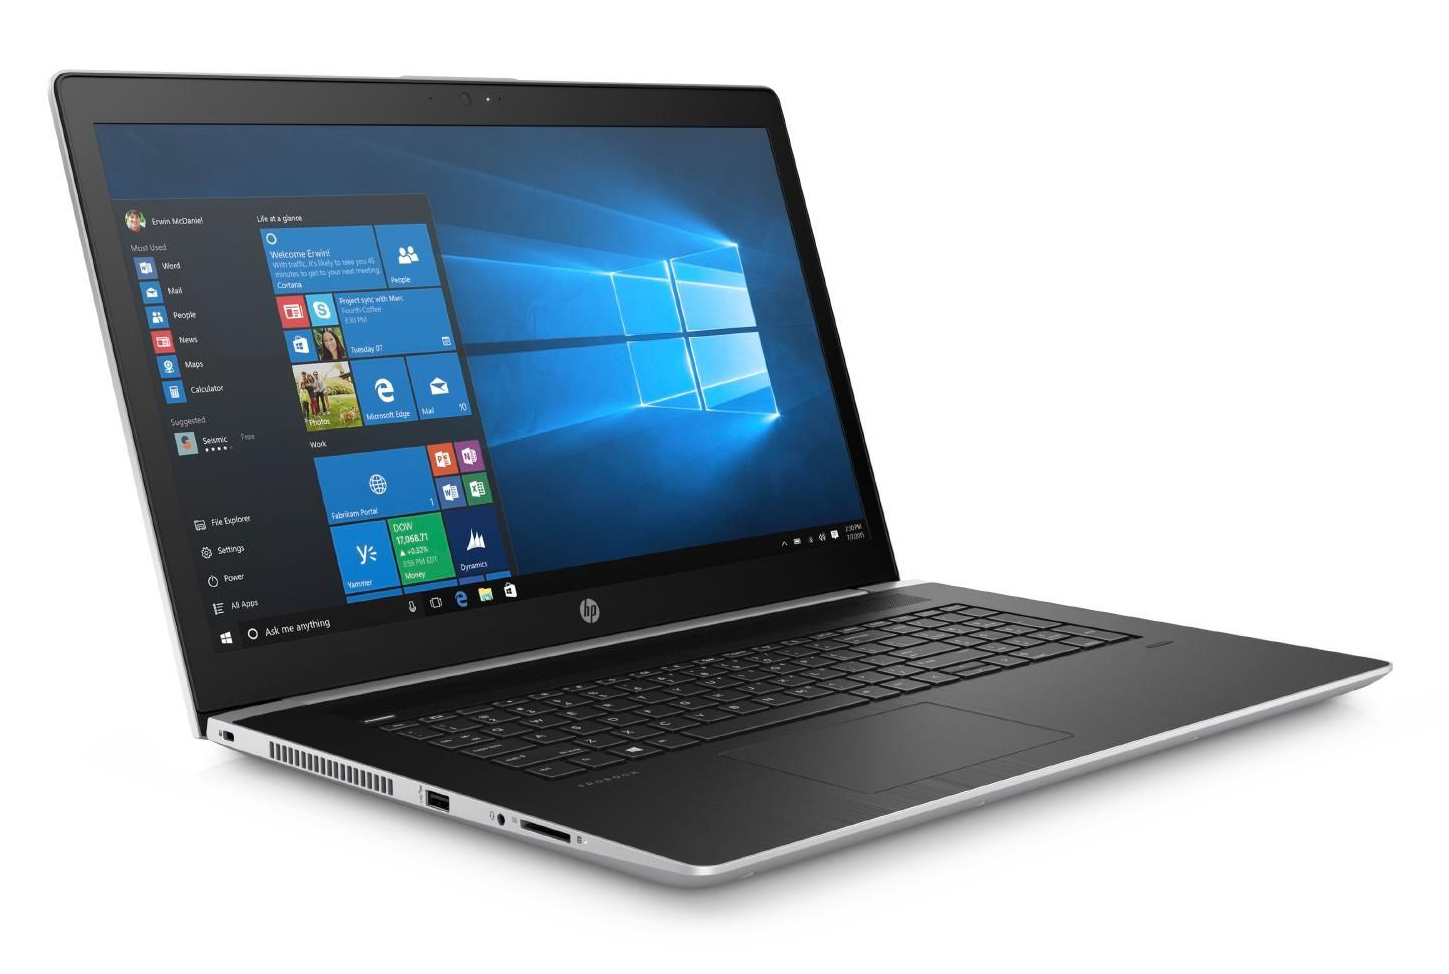
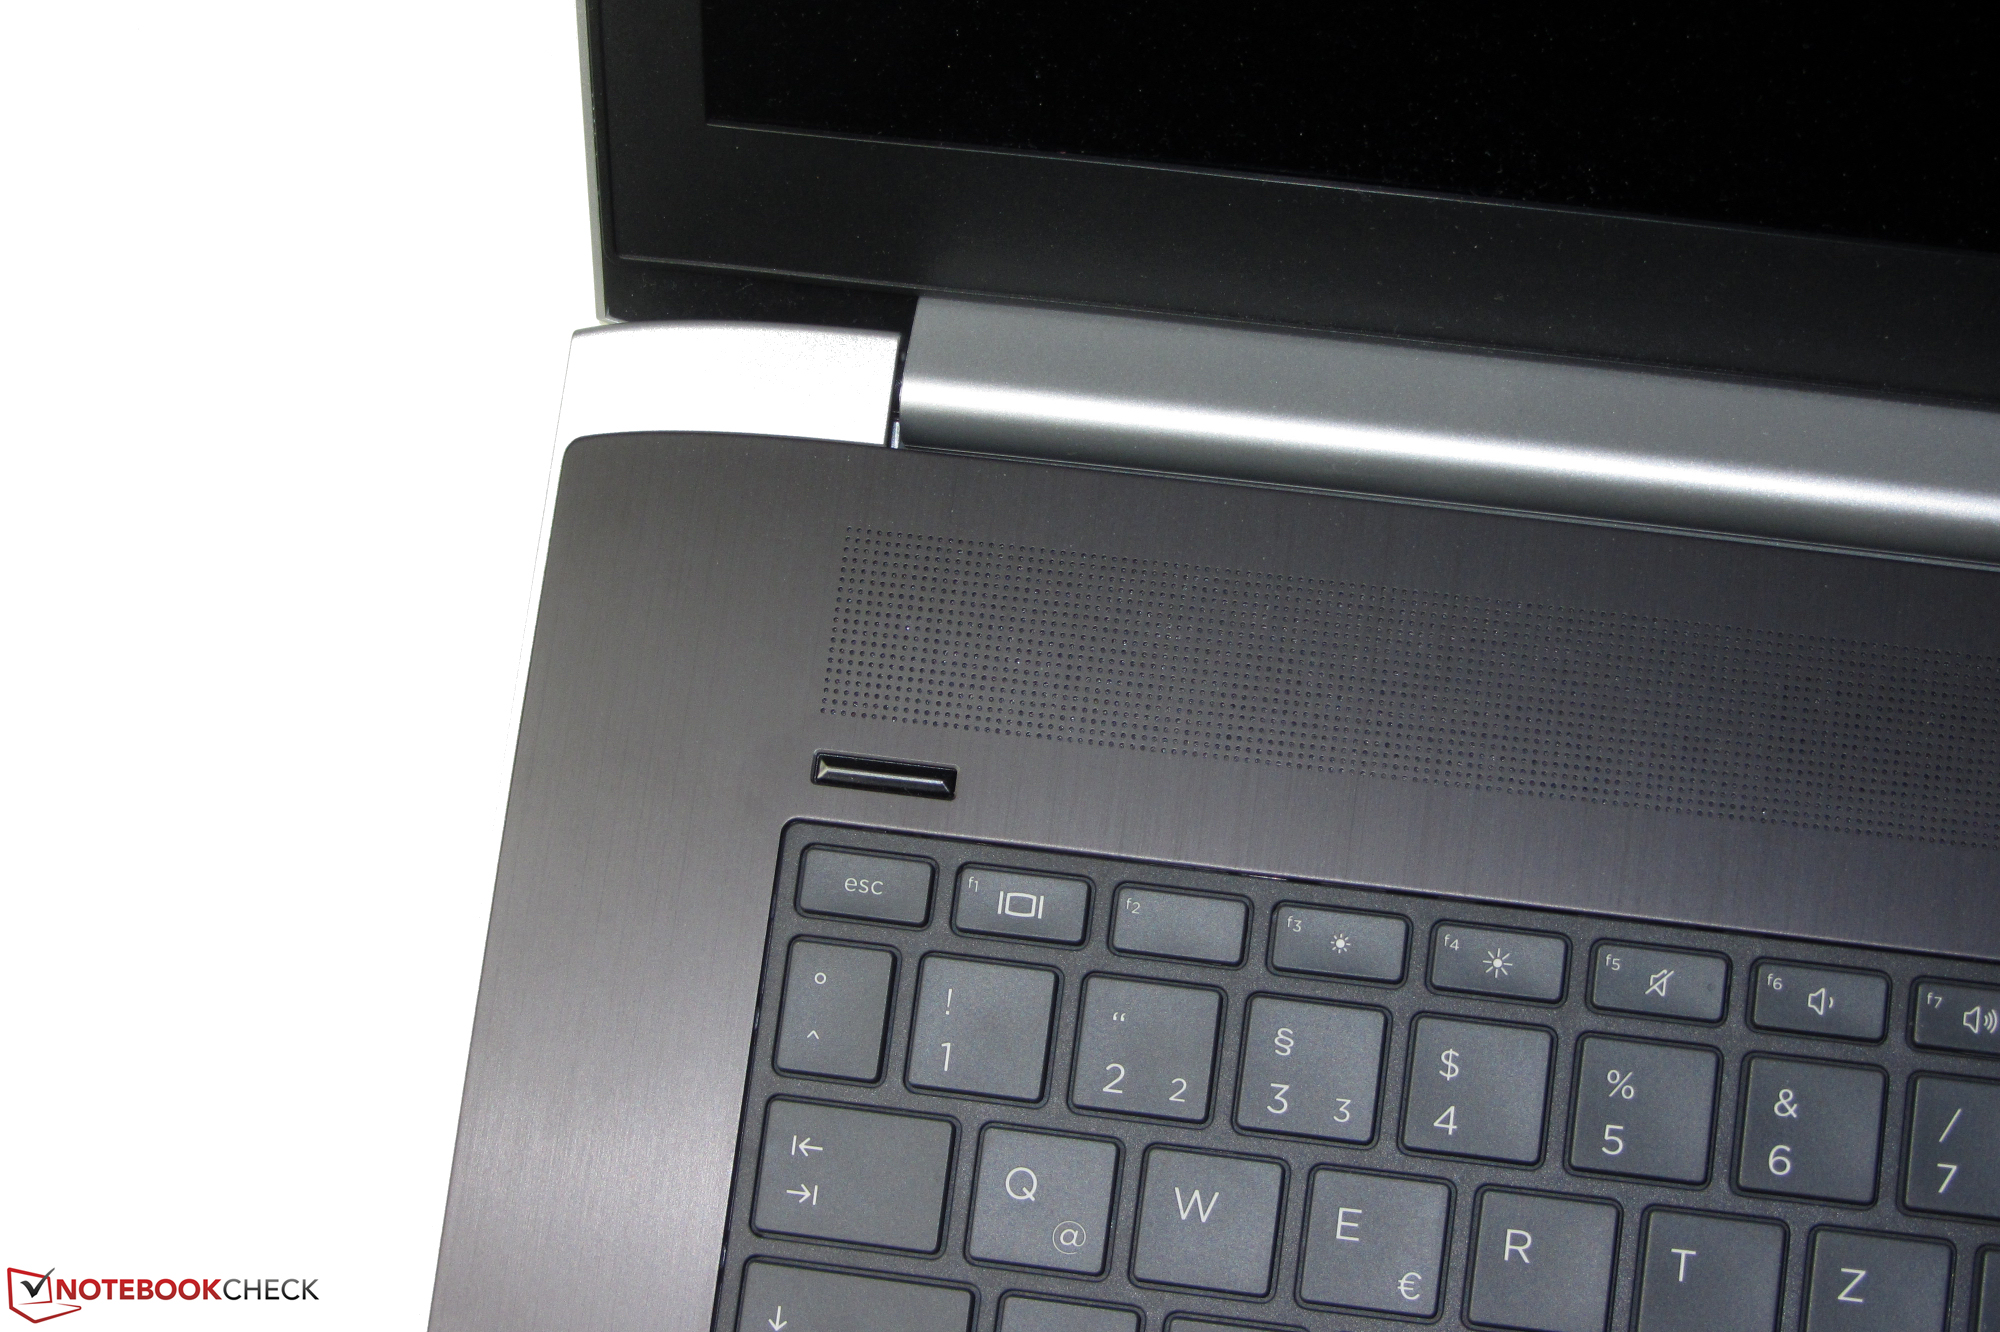
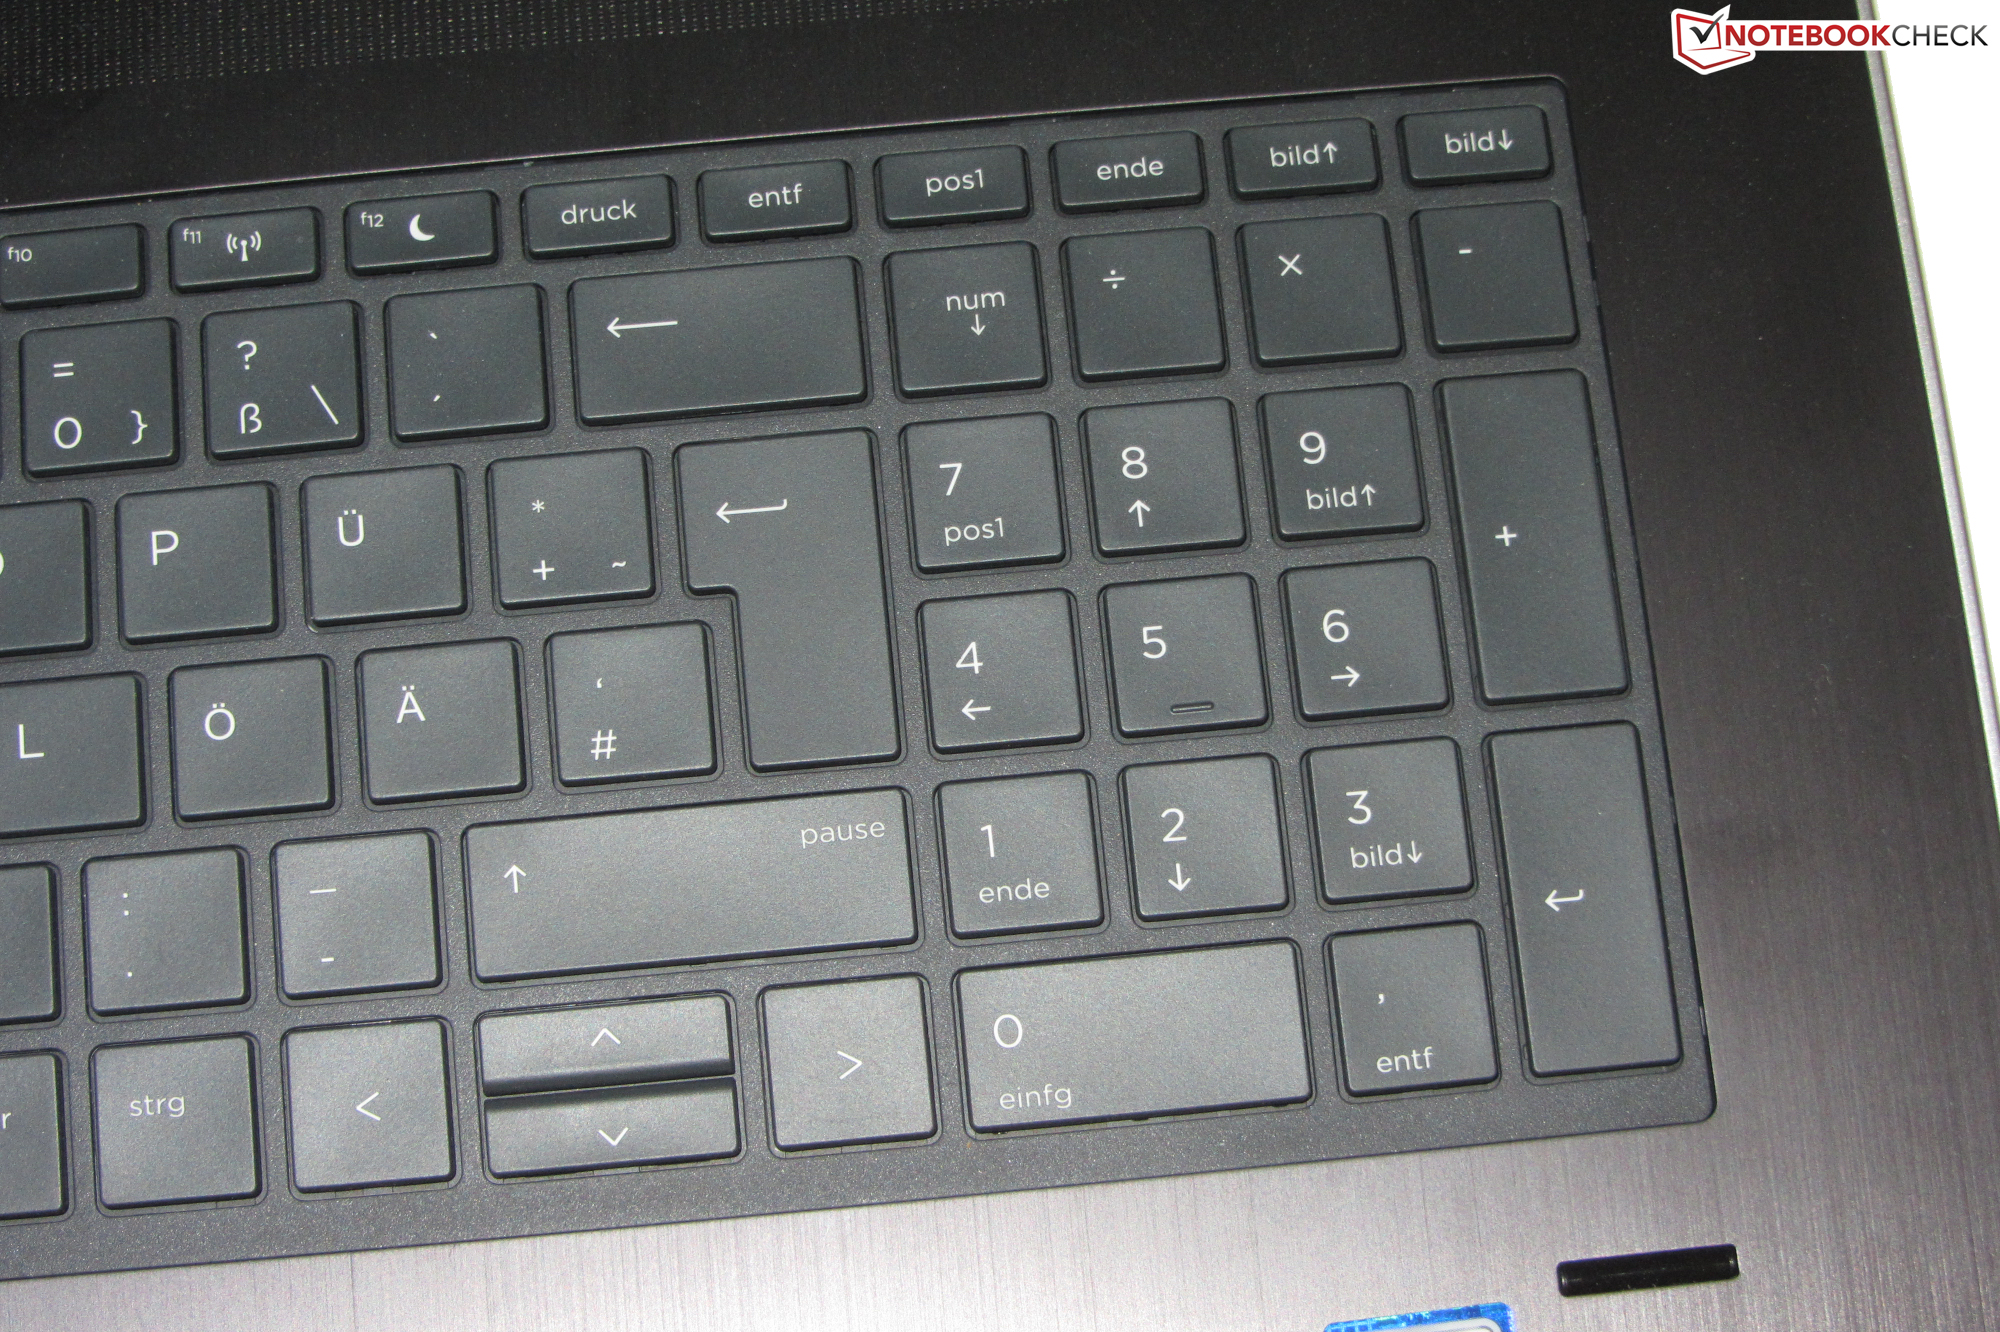
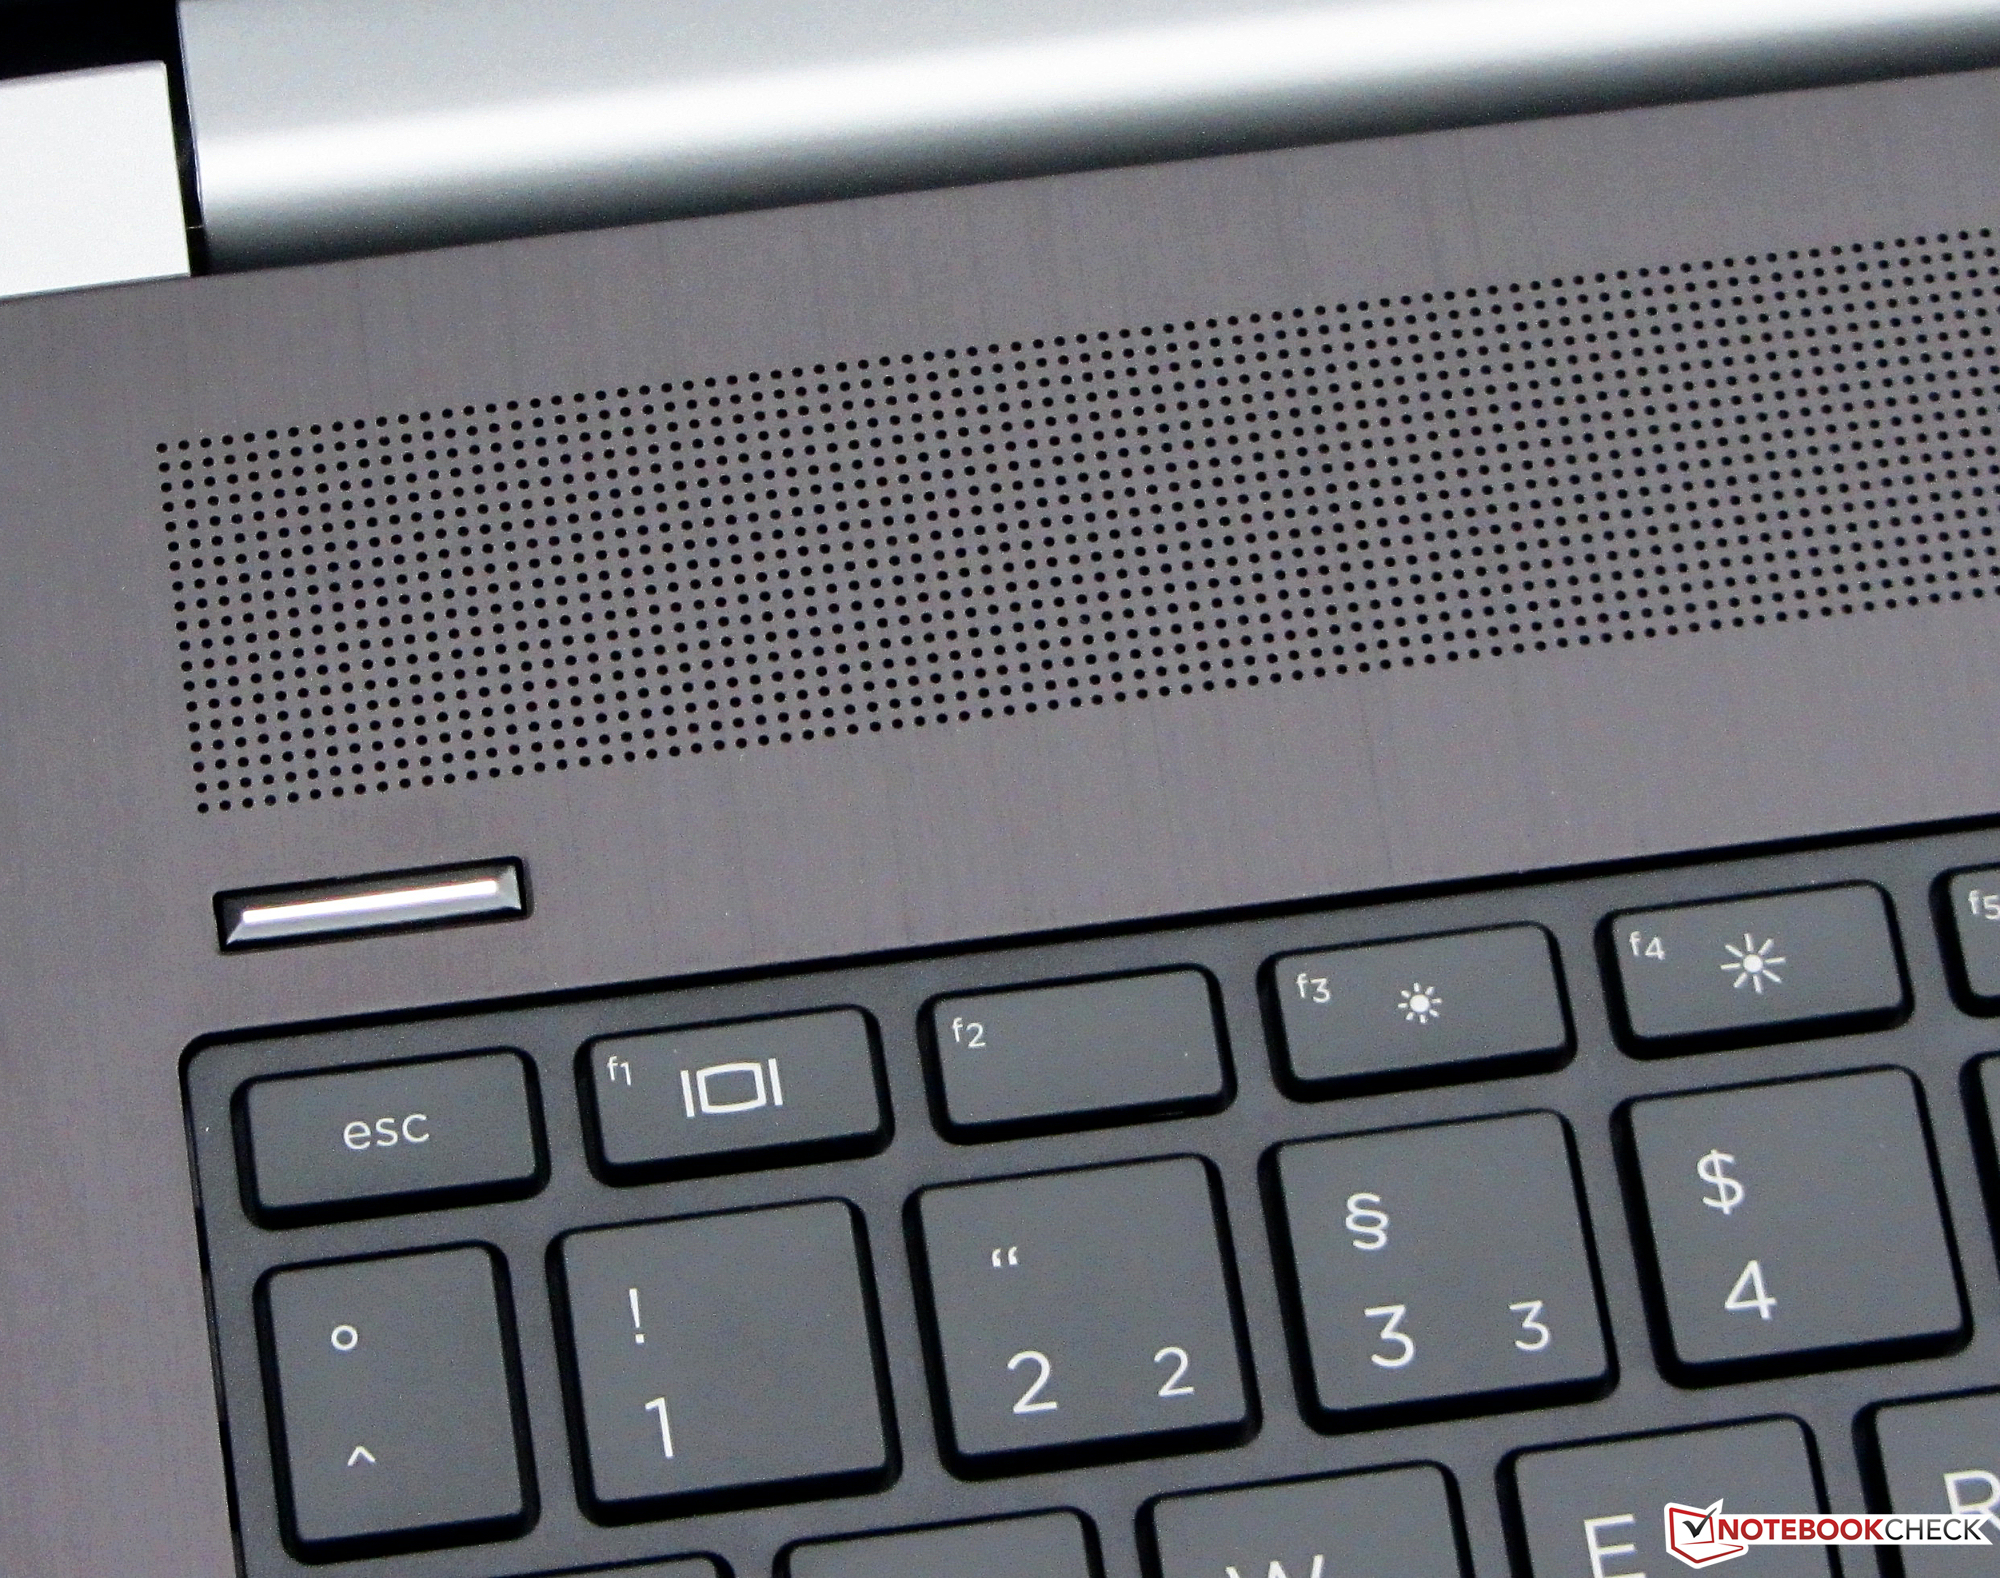
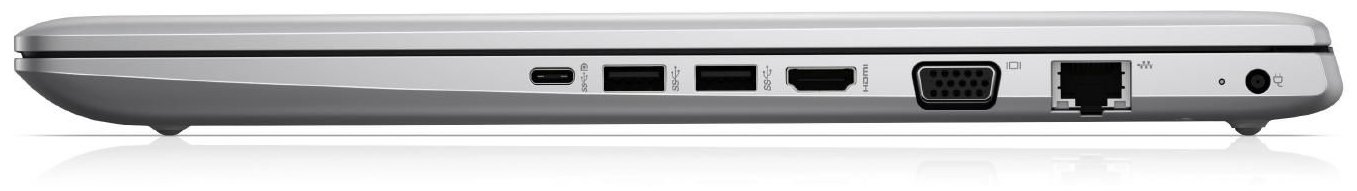
Batteritiden var utmärkt och ProBook 470 G5 kan definitivt beskrivas som väldigt portabel i det hänséendet. Precis som sin föregångare så kommer den senaste versionen av ProBook med ett utmärkt tangentbord med två nivåer av bakgrundsbelysning. Garantin är begränsad till ett år som standard istället för dom två år vi hade förväntat oss från en kvalitetsenhet som den här. Vi hade också verkligen tyckt om en Thunderbolt 3 istället för USB 3.1 Gen 1-porten. En sådan hade varit ännu mer mångsidig och mycket mer lämpad för en modern företagslaptop.
HP ProBook 470 G5
- 01/01/2018 v6 (old)
Sascha Mölck
Price comparison
