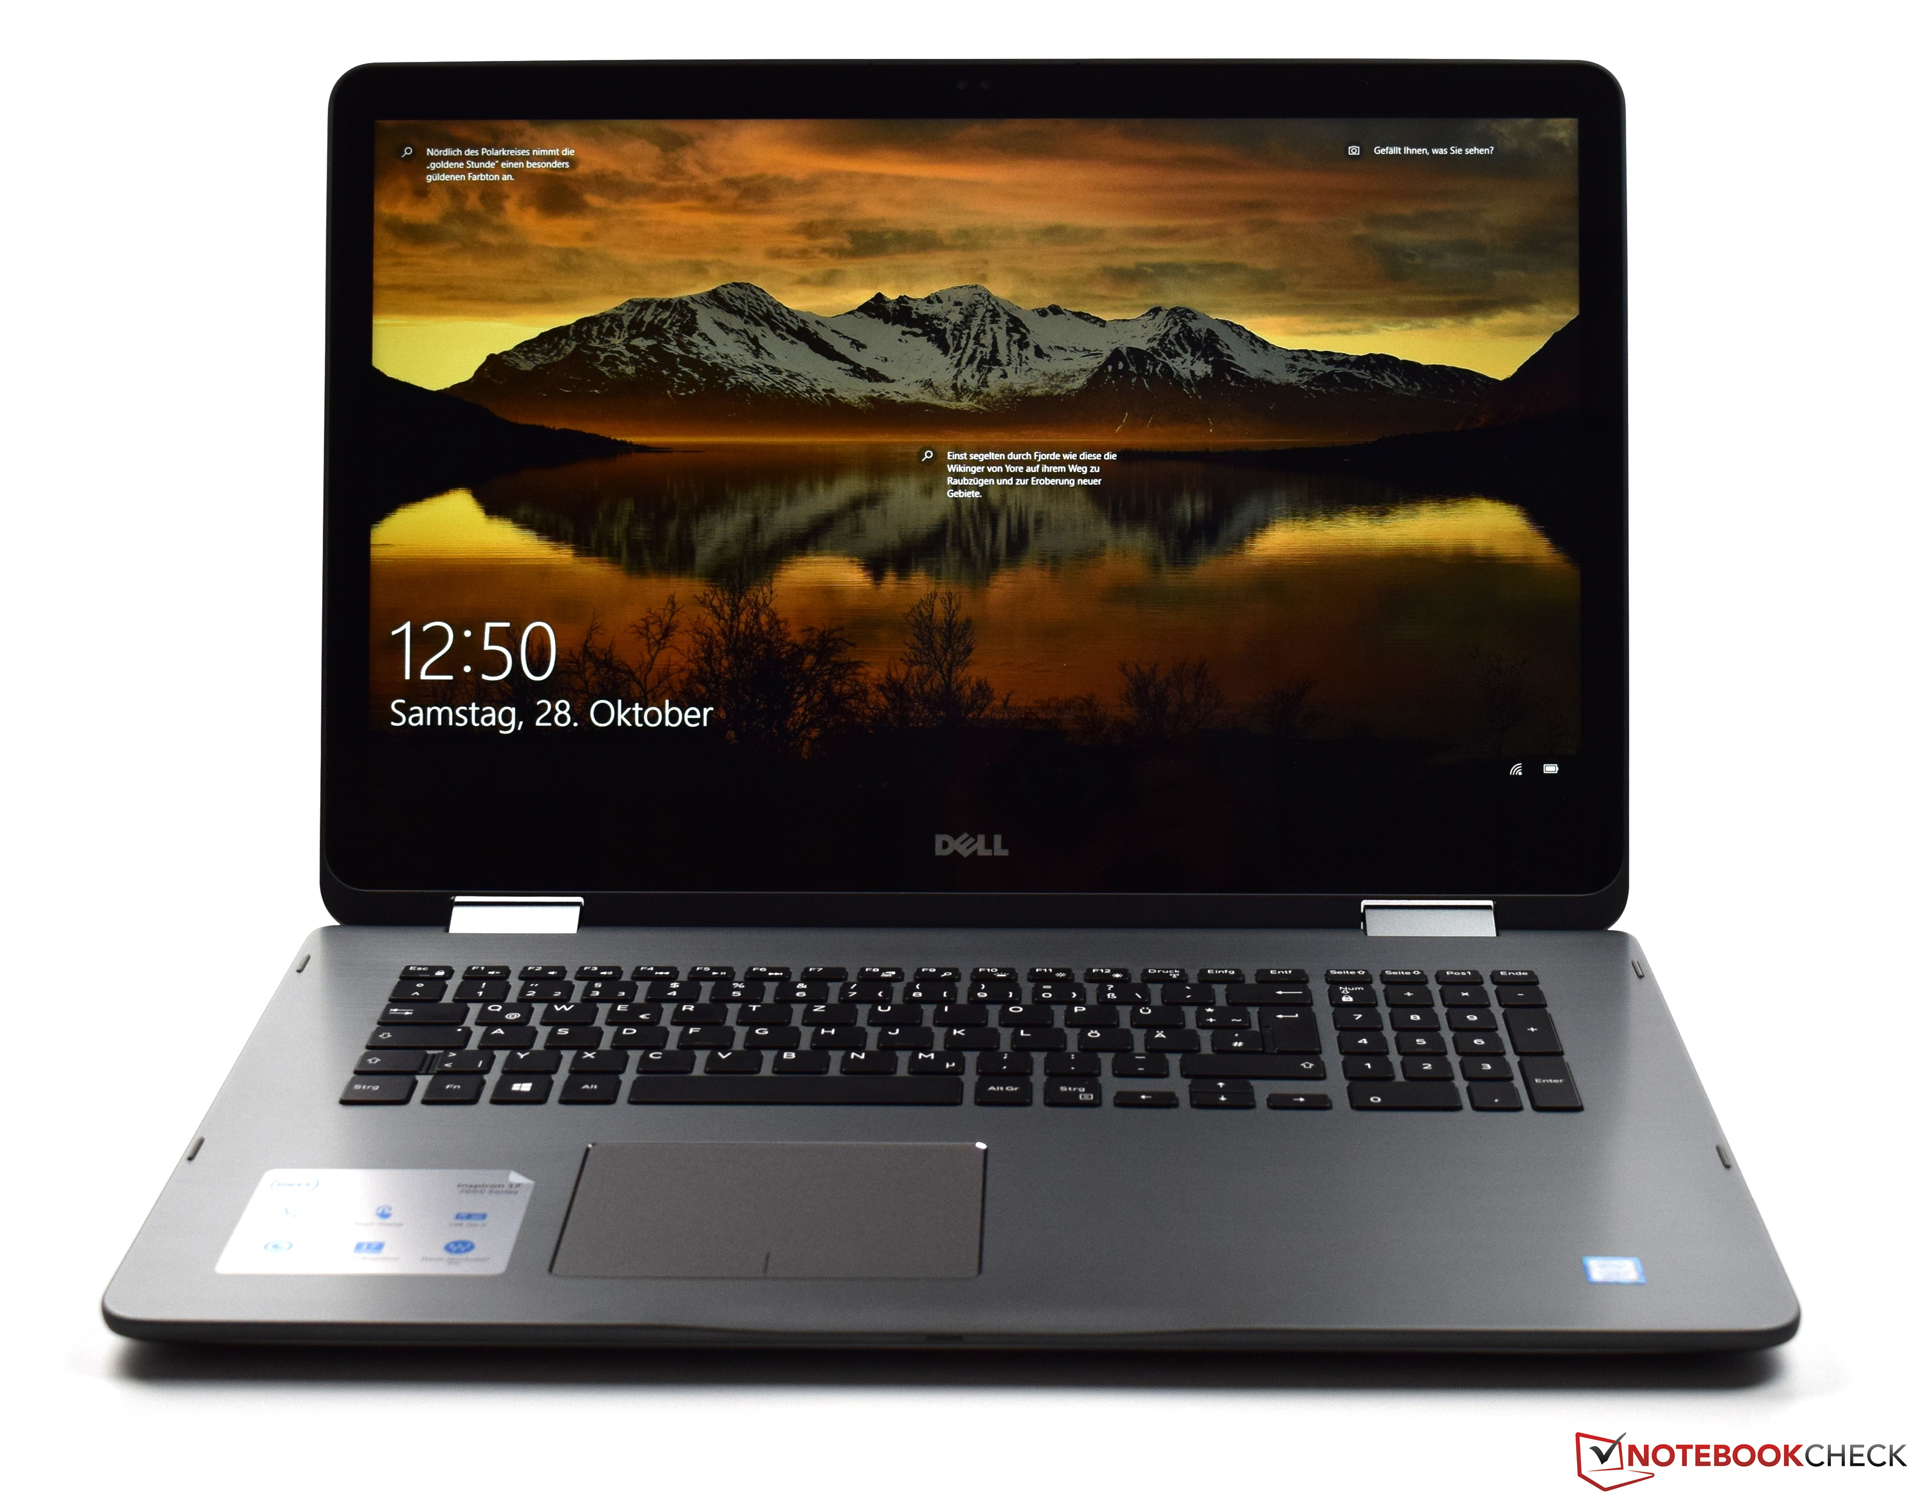
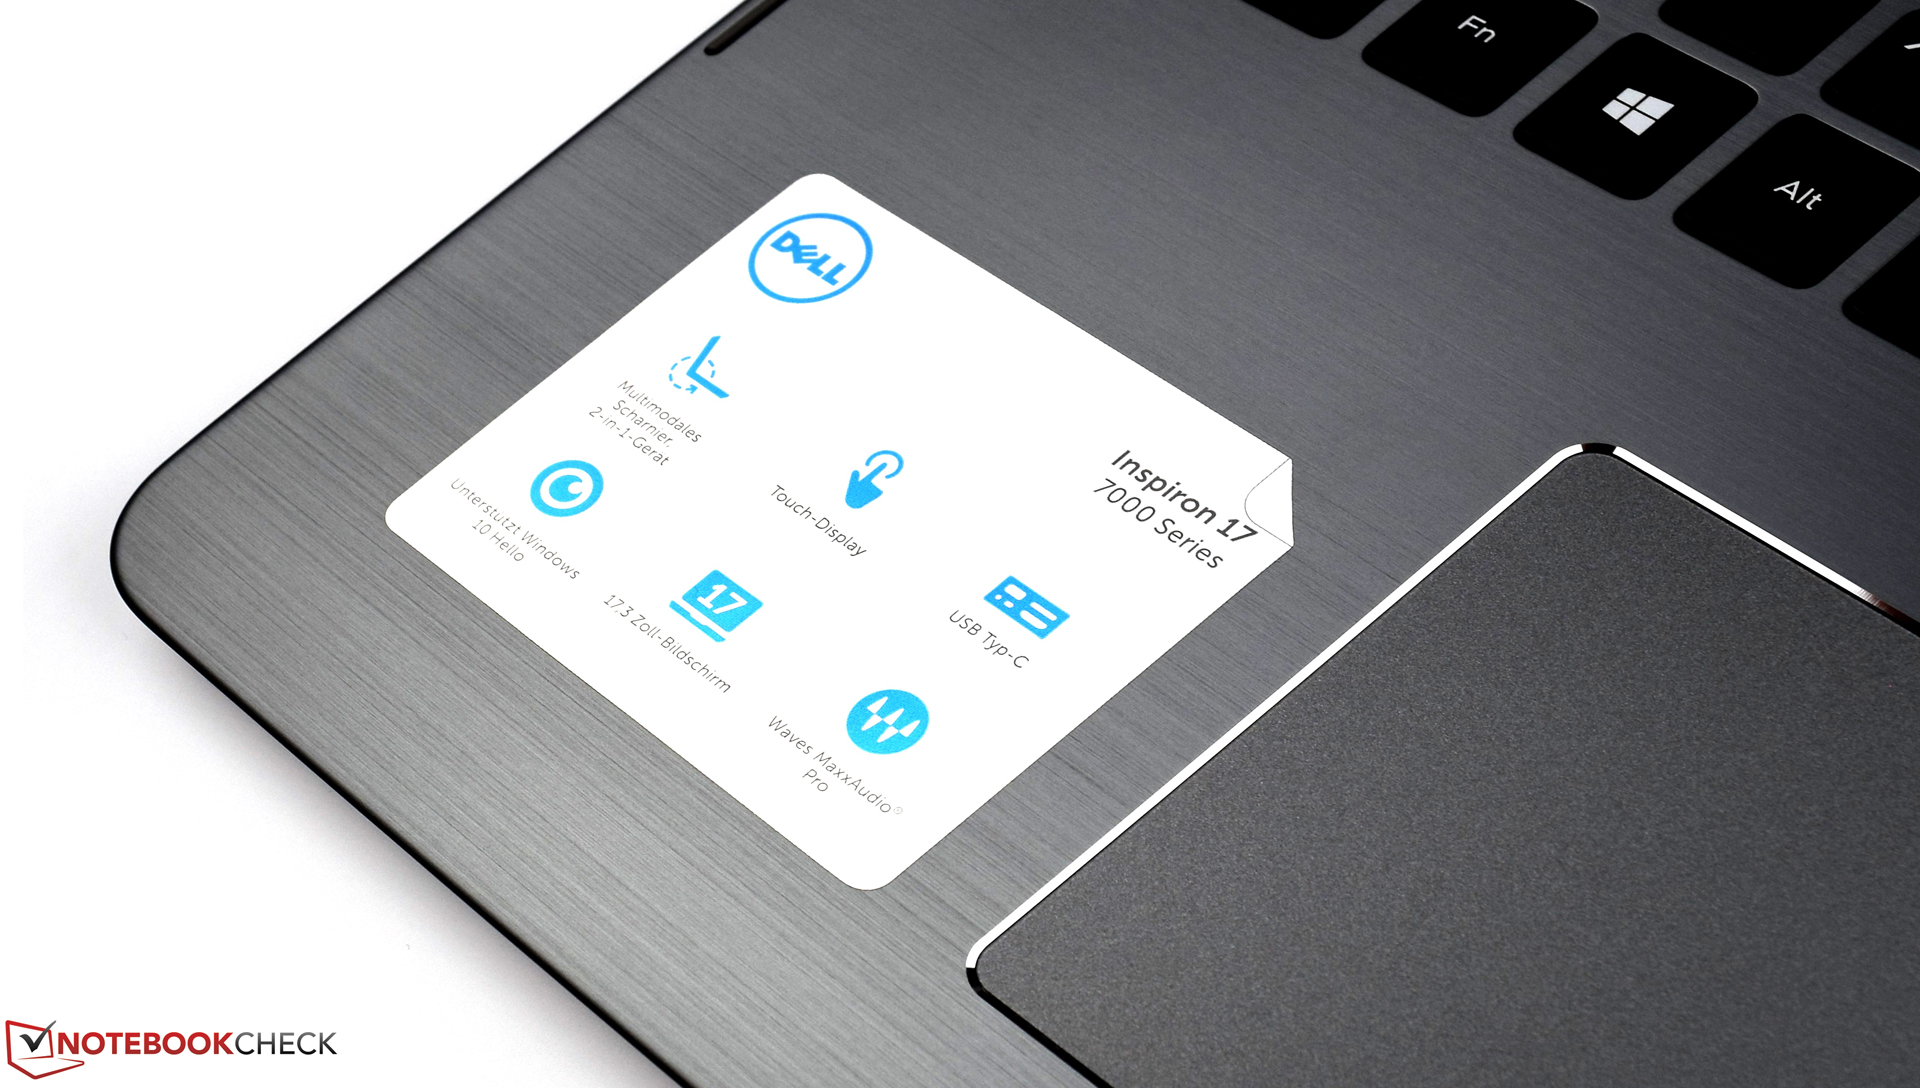
Test: Dell Inspiron 17 7773 (i7-8550U, 16 GB, 17" Touch) Omvandlingsbar (Sammanfattning)
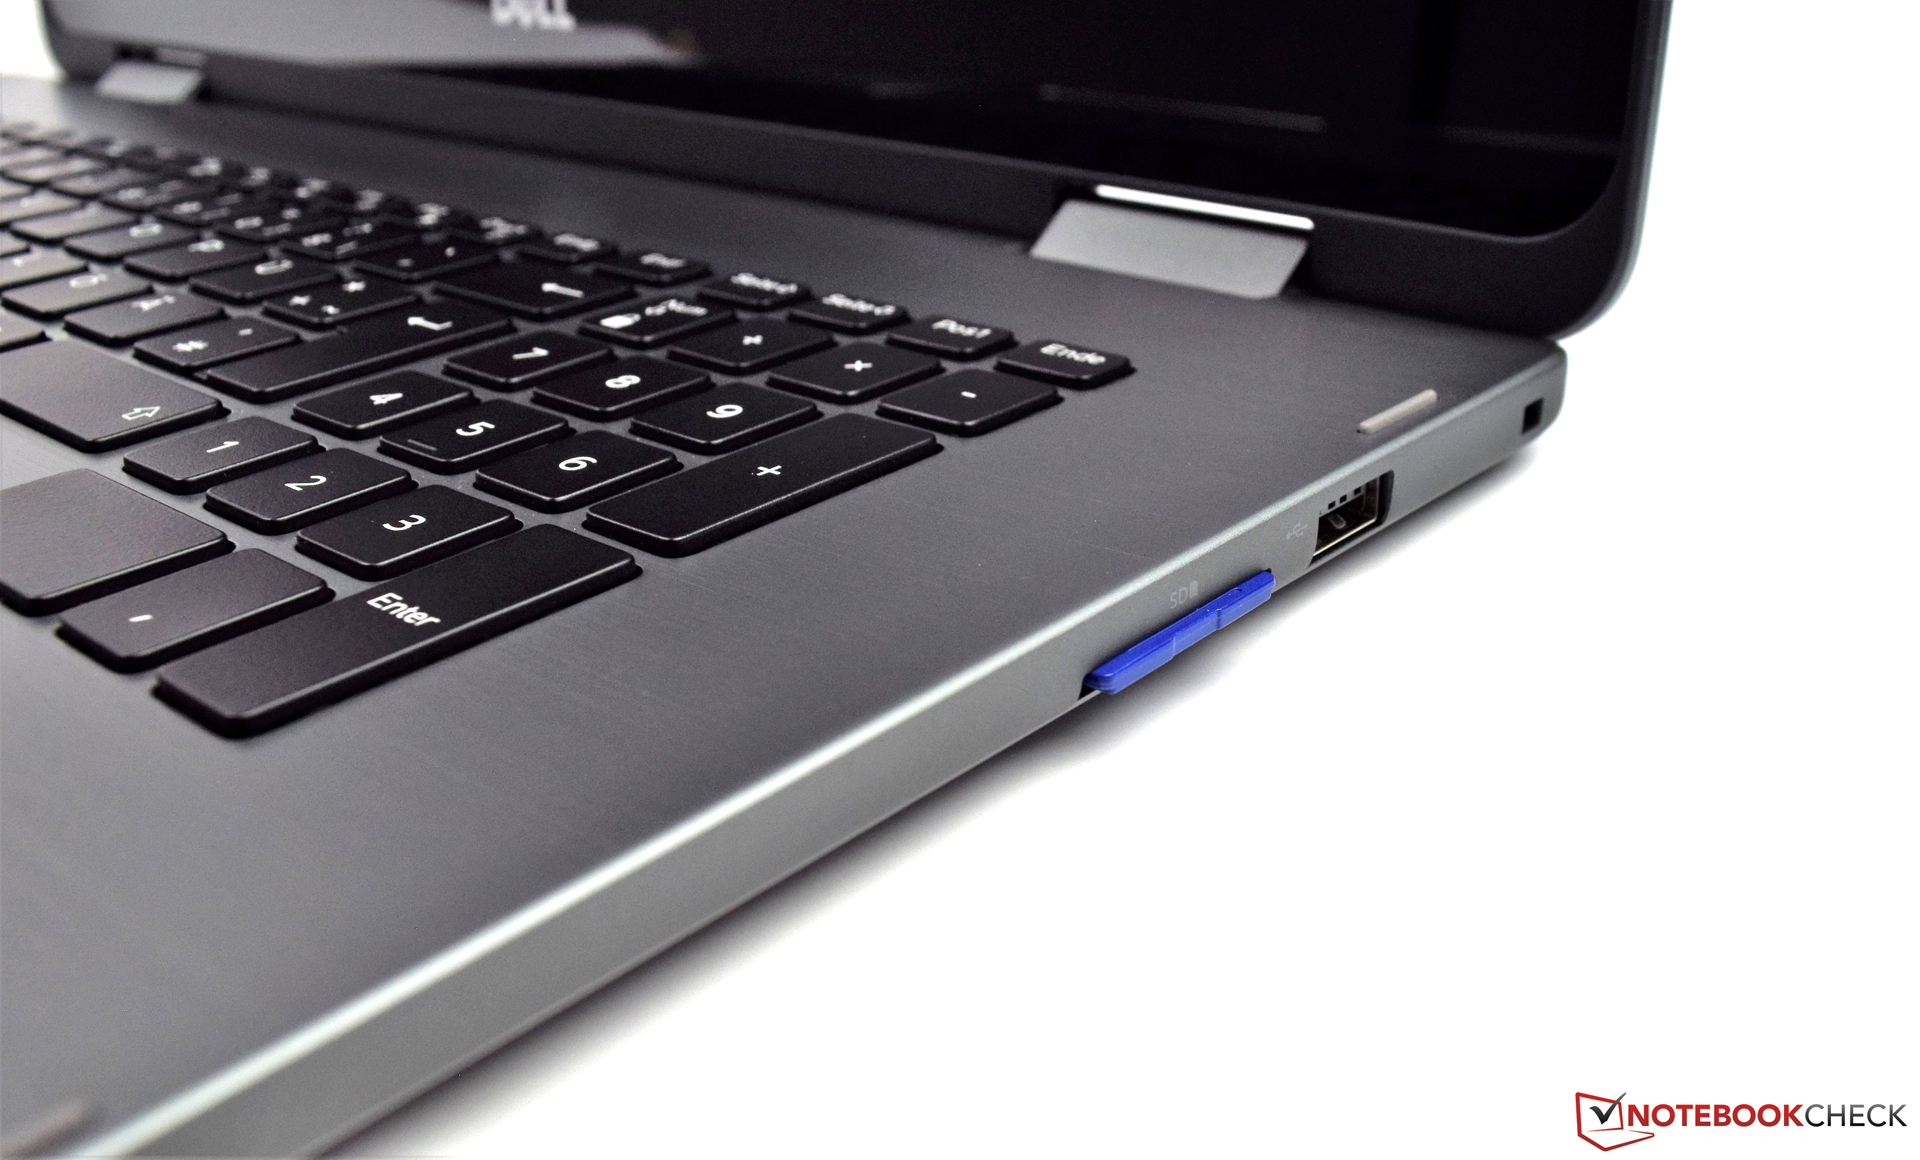
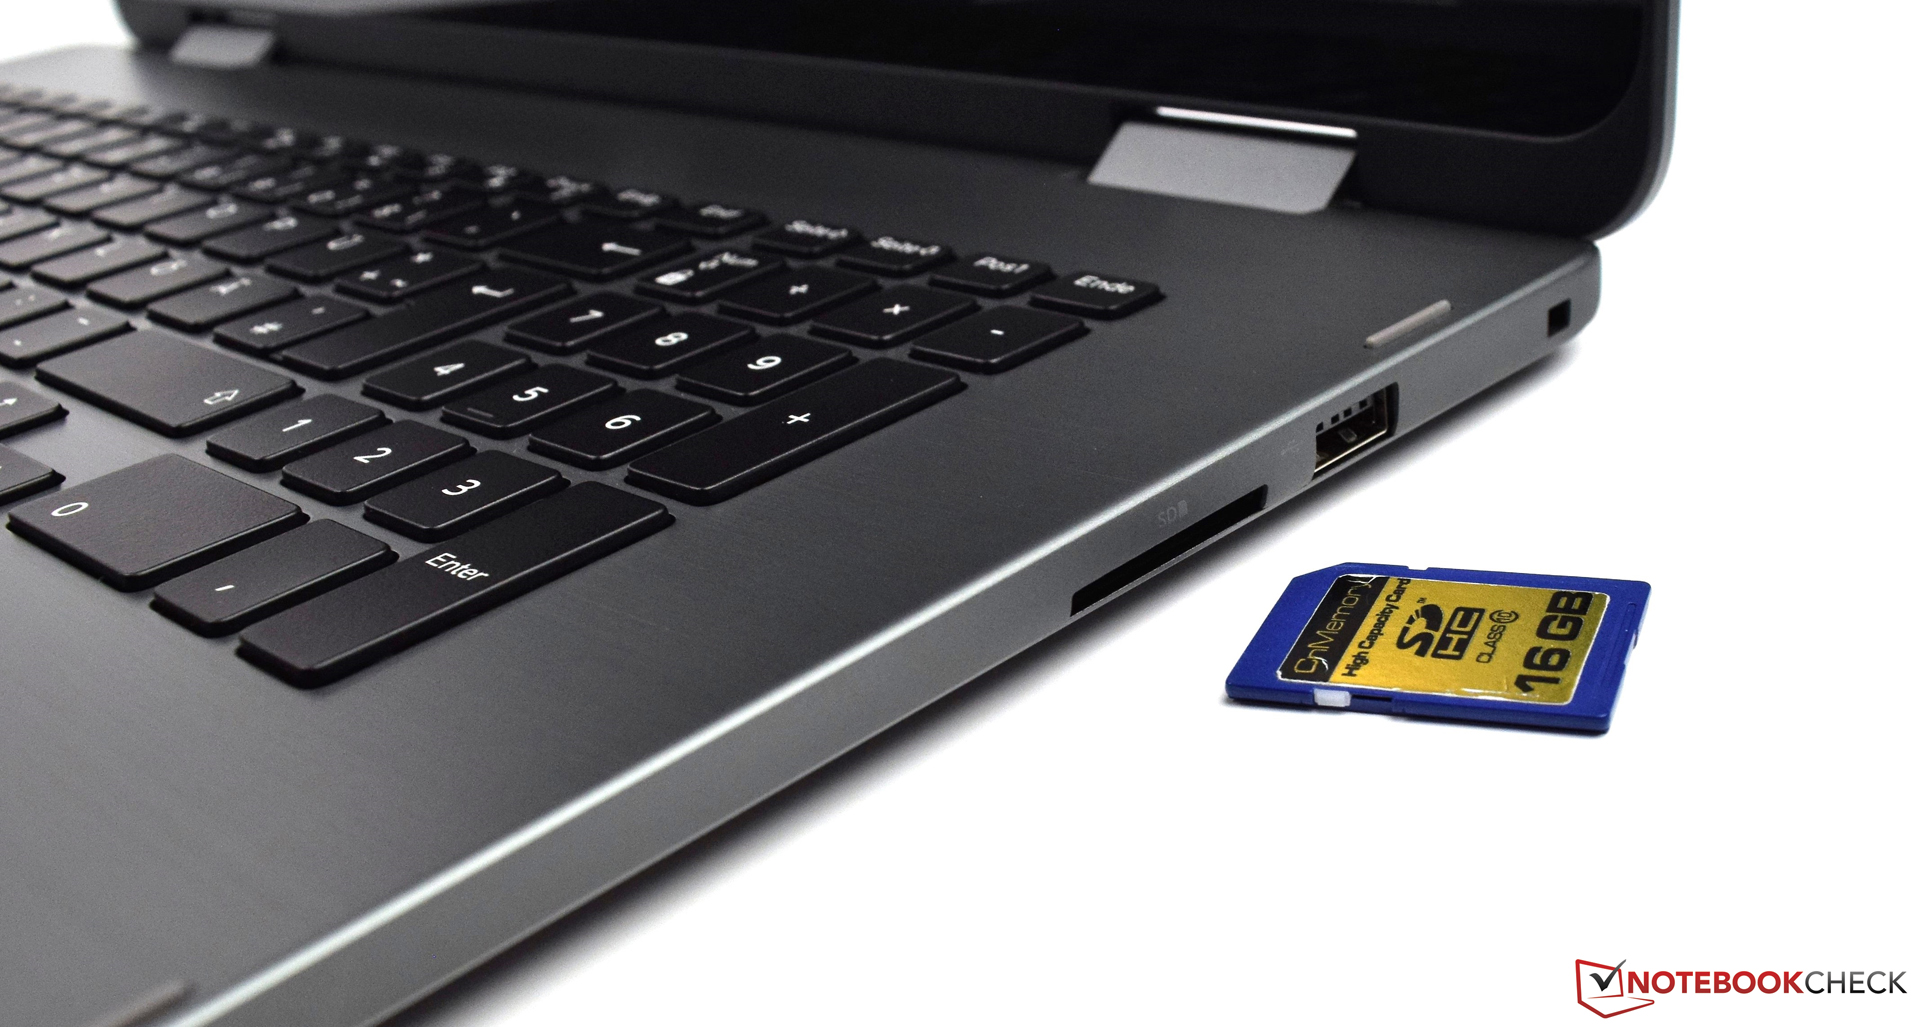
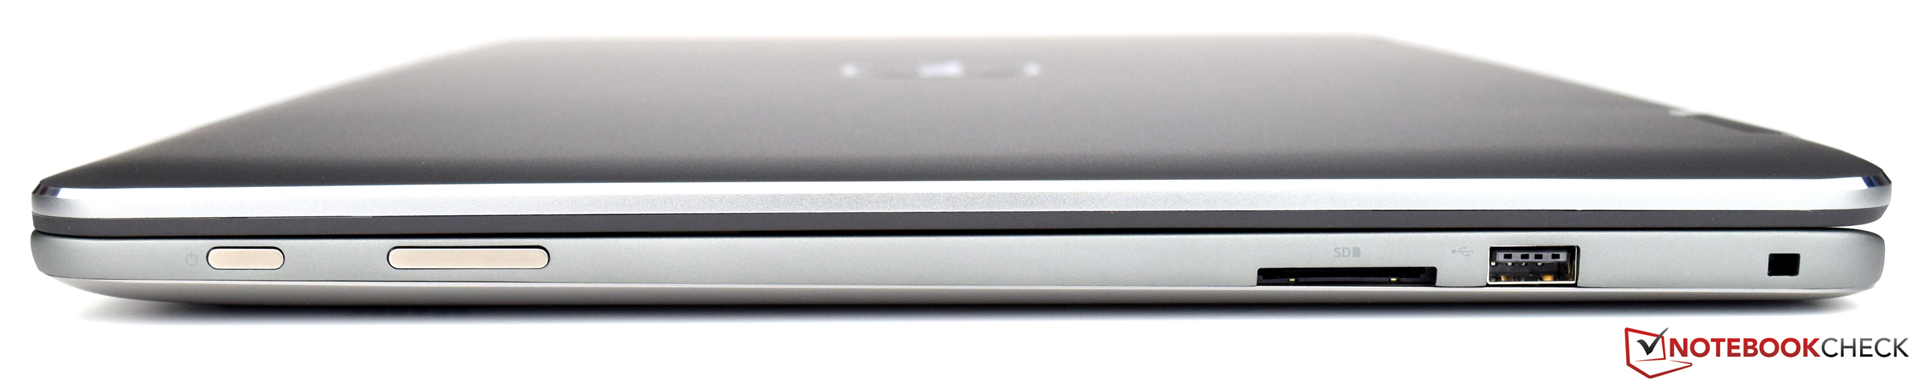
| SD Card Reader | |
| average JPG Copy Test (av. of 3 runs) | |
| HP Omen 17-w206ng (Toshiba Exceria Pro SDXC 64 GB UHS-II) | |
| Acer Aspire 5 A517-51G-80L (Toshiba Exceria Pro SDXC 64 GB UHS-II) | |
| Acer Aspire 7 A717-71G-72VY (Toshiba Exceria Pro SDXC 64 GB UHS-II) | |
| Dell Inspiron 17-7773-0043 (Toshiba Exceria Pro SDXC 64 GB UHS-II) | |
| Acer Aspire Nitro BE VN7-793G-5811 (Toshiba Exceria Pro SDXC 64 GB UHS-II) | |
| Dell Inspiron 17 7778 | |
| maximum AS SSD Seq Read Test (1GB) | |
| HP Omen 17-w206ng (Toshiba Exceria Pro SDXC 64 GB UHS-II) | |
| Acer Aspire 7 A717-71G-72VY (Toshiba Exceria Pro SDXC 64 GB UHS-II) | |
| Acer Aspire 5 A517-51G-80L (Toshiba Exceria Pro SDXC 64 GB UHS-II) | |
| Dell Inspiron 17-7773-0043 (Toshiba Exceria Pro SDXC 64 GB UHS-II) | |
| Dell Inspiron 17 7778 | |
| Acer Aspire Nitro BE VN7-793G-5811 (Toshiba Exceria Pro SDXC 64 GB UHS-II) | |
| Networking | |
| iperf3 transmit AX12 | |
| Acer Aspire Nitro BE VN7-793G-5811 | |
| HP Omen 17-w206ng | |
| Acer Aspire 7 A717-71G-72VY | |
| Dell Inspiron 17-7773-0043 | |
| Acer Aspire 5 A517-51G-80L | |
| iperf3 receive AX12 | |
| HP Omen 17-w206ng | |
| Acer Aspire Nitro BE VN7-793G-5811 | |
| Acer Aspire 7 A717-71G-72VY | |
| Acer Aspire 5 A517-51G-80L | |
| Dell Inspiron 17-7773-0043 | |
| |||||||||||||||||||||||||
Distribution av ljusstyrkan: 77 %
Mitt på batteriet: 323 cd/m²
Kontrast: 1538:1 (Svärta: 0.21 cd/m²)
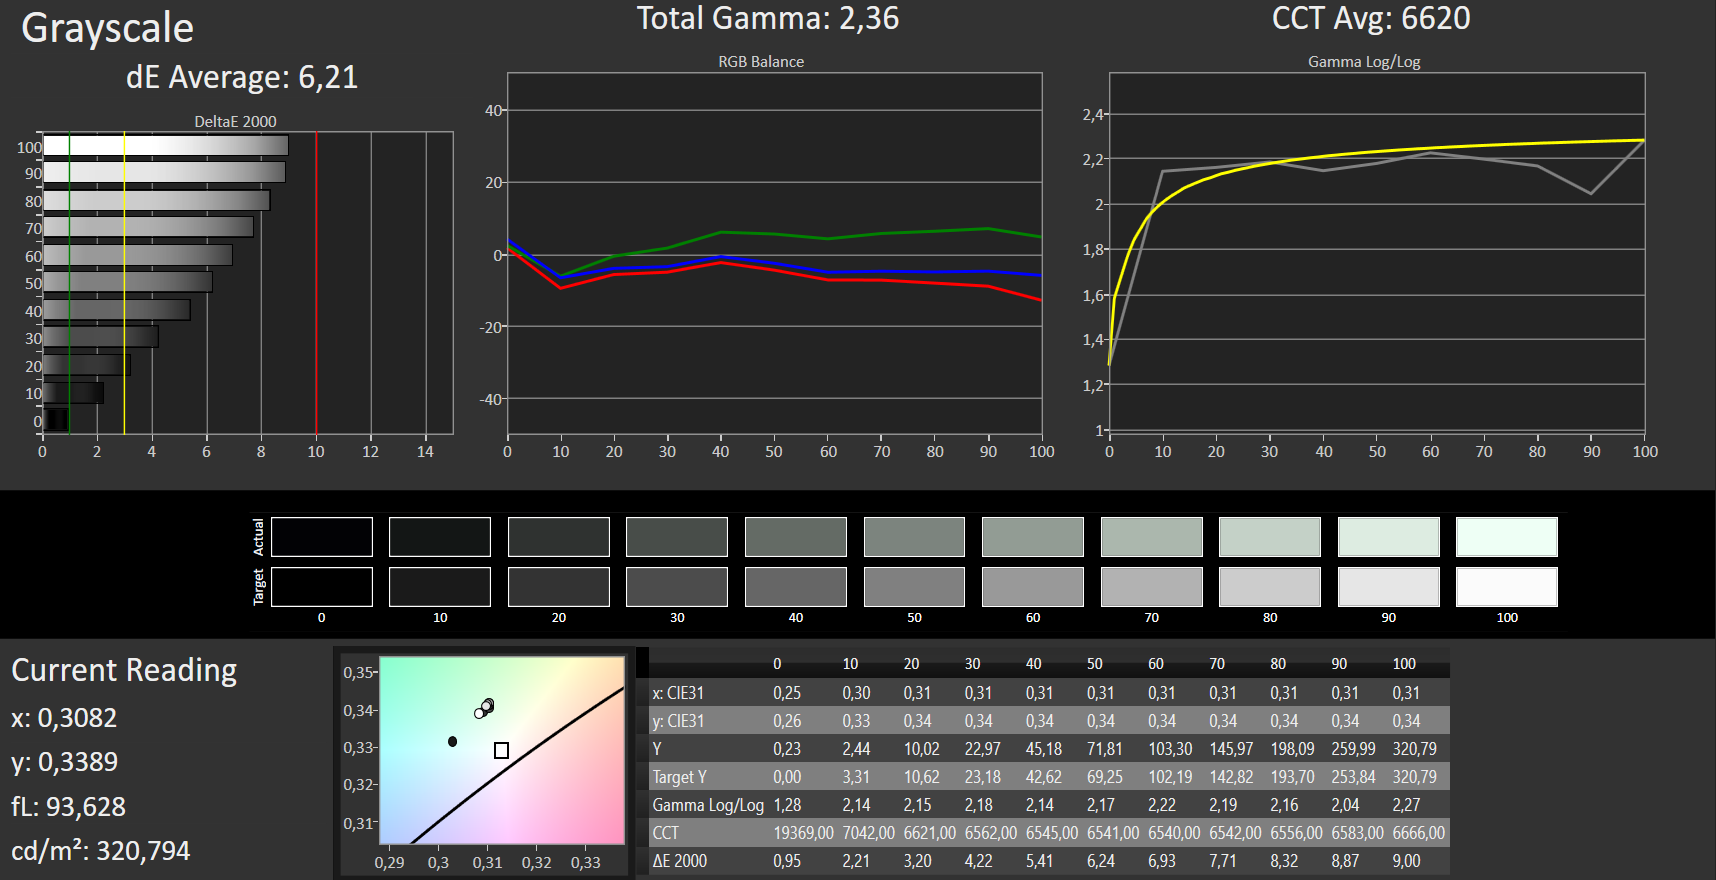
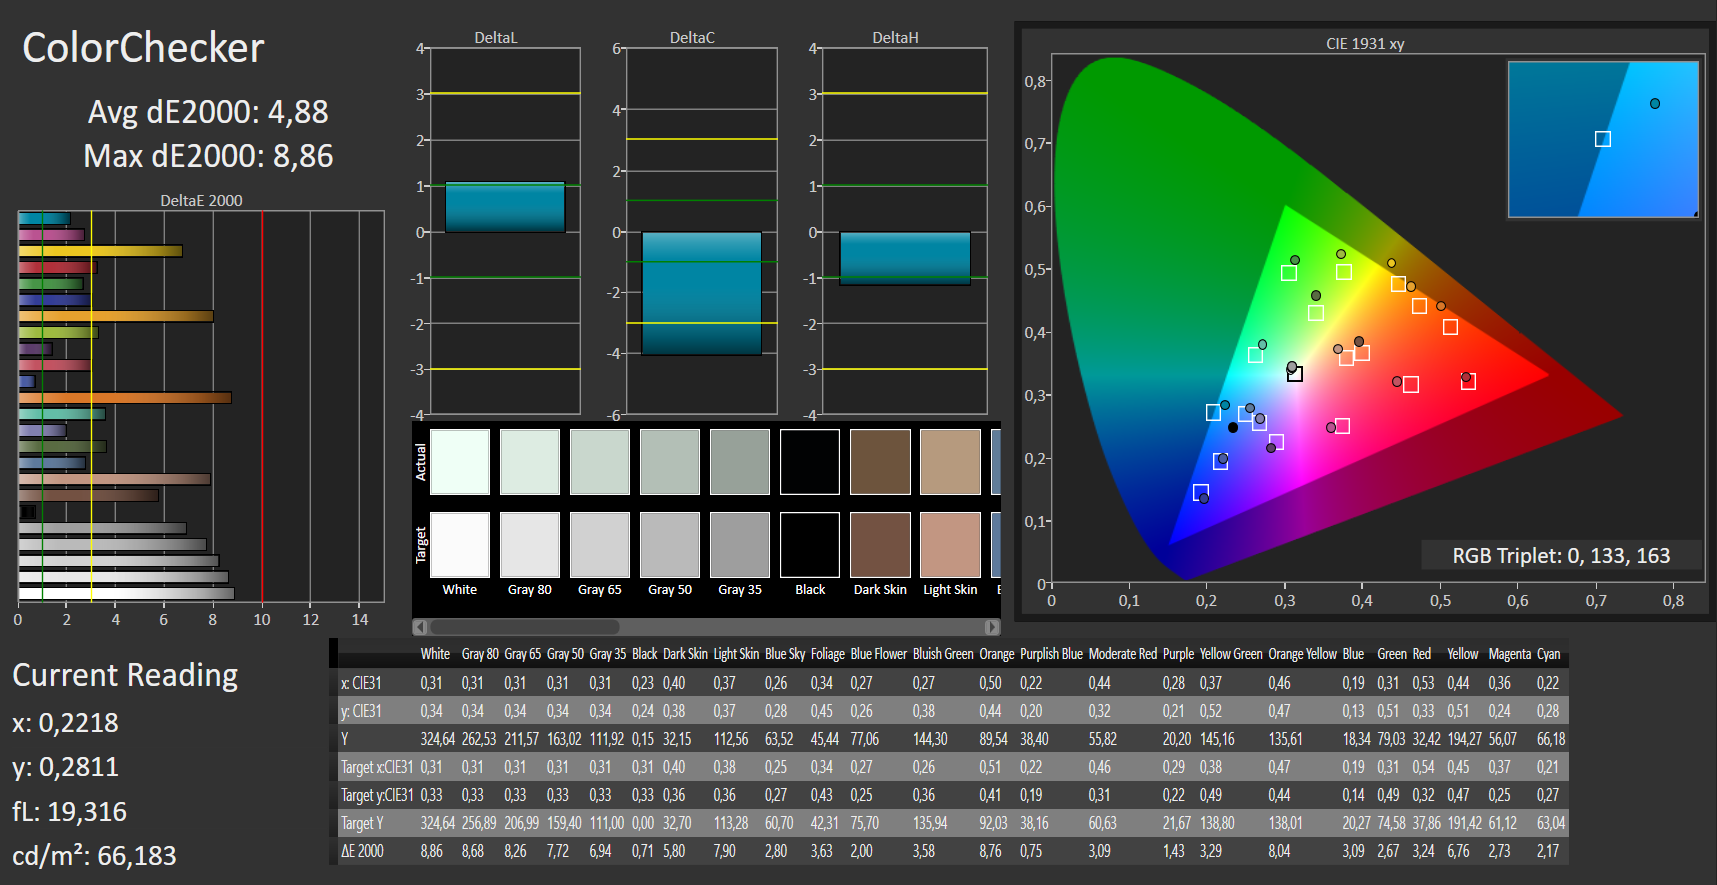
ΔE ColorChecker Calman: 4.88 | ∀{0.5-29.43 Ø4.71}
ΔE Greyscale Calman: 6.21 | ∀{0.09-98 Ø4.96}
92% sRGB (Argyll 1.6.3 3D)
60% AdobeRGB 1998 (Argyll 1.6.3 3D)
67.2% AdobeRGB 1998 (Argyll 3D)
91.9% sRGB (Argyll 3D)
67.4% Display P3 (Argyll 3D)
Gamma: 2.36
CCT: 6620 K
| Dell Inspiron 17-7773-0043 Chi Mei CMN1738, 1920x1080, 17.3" | Dell Inspiron 17 7778 LG Philips LGD 0513 / 173WF4, 1920x1080, 17.3" | Acer Aspire 5 A517-51G-80L LG Display, LP173WF4-SPF5, 1920x1080, 17.3" | Acer Aspire Nitro BE VN7-793G-5811 AU Optronics, 1920x1080, 17.3" | HP Omen 17-w206ng Chi Mei CMN1738, 1920x1080, 17.3" | Acer Aspire 7 A717-71G-72VY LG Philips LGD056D / LP173WF4-SPF5, 1920x1080, 17.3" | |
|---|---|---|---|---|---|---|
| Display | -4% | -6% | -6% | 0% | -5% | |
| Display P3 Coverage (%) | 67.4 | 67.4 0% | 66.3 -2% | 63.1 -6% | 67.2 0% | 66.2 -2% |
| sRGB Coverage (%) | 91.9 | 86.3 -6% | 84.2 -8% | 86.5 -6% | 93.1 1% | 85.2 -7% |
| AdobeRGB 1998 Coverage (%) | 67.2 | 63.1 -6% | 61.6 -8% | 63.3 -6% | 67.4 0% | 62.3 -7% |
| Response Times | 16% | -7% | 5% | 6% | 5% | |
| Response Time Grey 50% / Grey 80% * (ms) | 40 ? | 36 ? 10% | 41 ? -2% | 38 ? 5% | 38 ? 5% | 41 ? -2% |
| Response Time Black / White * (ms) | 28 ? | 22 ? 21% | 31 ? -11% | 27 ? 4% | 26 ? 7% | 25 ? 11% |
| PWM Frequency (Hz) | 1000 ? | 122000 ? | 200 ? | 125000 ? | ||
| Screen | -16% | 7% | -4% | -1% | -20% | |
| Brightness middle (cd/m²) | 323 | 327 1% | 397 23% | 301 -7% | 318 -2% | 382 18% |
| Brightness (cd/m²) | 290 | 314 8% | 364 26% | 270 -7% | 295 2% | 357 23% |
| Brightness Distribution (%) | 77 | 87 13% | 84 9% | 79 3% | 79 3% | 86 12% |
| Black Level * (cd/m²) | 0.21 | 0.3 -43% | 0.29 -38% | 0.38 -81% | 0.25 -19% | 0.38 -81% |
| Contrast (:1) | 1538 | 1090 -29% | 1369 -11% | 792 -49% | 1272 -17% | 1005 -35% |
| Colorchecker dE 2000 * | 4.88 | 6.75 -38% | 3.88 20% | 3.49 28% | 4.7 4% | 6.9 -41% |
| Colorchecker dE 2000 max. * | 8.86 | 11.82 -33% | 8.22 7% | 7.49 15% | 8.8 1% | 13.14 -48% |
| Greyscale dE 2000 * | 6.21 | 7.91 -27% | 3.1 50% | 1.88 70% | 5 19% | 8.22 -32% |
| Gamma | 2.36 93% | 2.31 95% | 2.59 85% | 2.35 94% | 2.28 96% | 2.39 92% |
| CCT | 6620 98% | 7642 85% | 6570 99% | 6587 99% | 7374 88% | 7580 86% |
| Color Space (Percent of AdobeRGB 1998) (%) | 60 | 57 -5% | 55 -8% | 56 -7% | 61 2% | 56 -7% |
| Color Space (Percent of sRGB) (%) | 92 | 86 -7% | 84 -9% | 86 -7% | 93 1% | 85 -8% |
| Totalt genomsnitt (program/inställningar) | -1% /
-9% | -2% /
3% | -2% /
-3% | 2% /
0% | -7% /
-14% |
* ... mindre är bättre
Visa svarstider
| ↔ Svarstid svart till vitt | ||
|---|---|---|
| 28 ms ... stiga ↗ och falla ↘ kombinerat | ↗ 17 ms stiga | 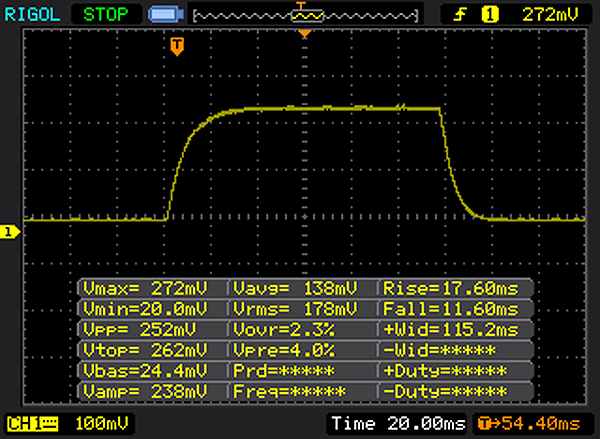 |
| ↘ 11 ms hösten | ||
| Skärmen visar relativt långsamma svarsfrekvenser i våra tester och kan vara för långsam för spelare. I jämförelse sträcker sig alla testade enheter från 0.1 (minst) till 240 (maximalt) ms. » 71 % av alla enheter är bättre. Detta innebär att den uppmätta svarstiden är sämre än genomsnittet av alla testade enheter (19.8 ms). | ||
| ↔ Svarstid 50 % grått till 80 % grått | ||
| 40 ms ... stiga ↗ och falla ↘ kombinerat | ↗ 22 ms stiga | 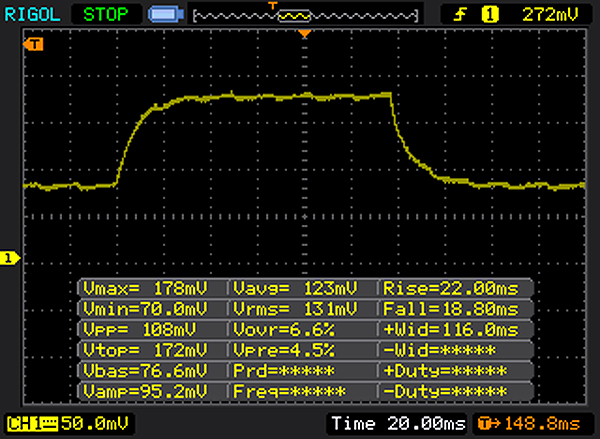 |
| ↘ 18 ms hösten | ||
| Skärmen visar långsamma svarsfrekvenser i våra tester och kommer att vara otillfredsställande för spelare. I jämförelse sträcker sig alla testade enheter från 0.165 (minst) till 636 (maximalt) ms. » 61 % av alla enheter är bättre. Detta innebär att den uppmätta svarstiden är sämre än genomsnittet av alla testade enheter (31 ms). | ||
Skärmflimmer / PWM (Puls-Width Modulation)
| Skärmflimmer / PWM upptäckt | 1000 Hz | ≤ 90 % ljusstyrka inställning | 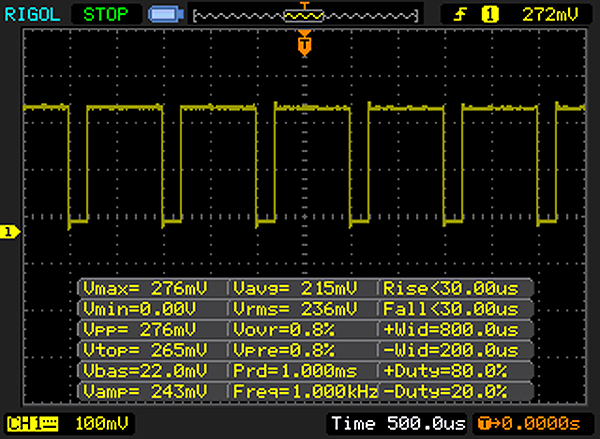 |
Displayens bakgrundsbelysning flimrar vid 1000 Hz (i värsta fall, t.ex. med PWM) Flimrande upptäckt vid en ljusstyrkeinställning på 90 % och lägre. Det ska inte finnas något flimmer eller PWM över denna ljusstyrkeinställning. Frekvensen för 1000 Hz är ganska hög, så de flesta användare som är känsliga för PWM bör inte märka något flimmer. Som jämförelse: 52 % av alla testade enheter använder inte PWM för att dämpa skärmen. Om PWM upptäcktes mättes ett medelvärde av 7754 (minst: 5 - maximum: 343500) Hz. | |||
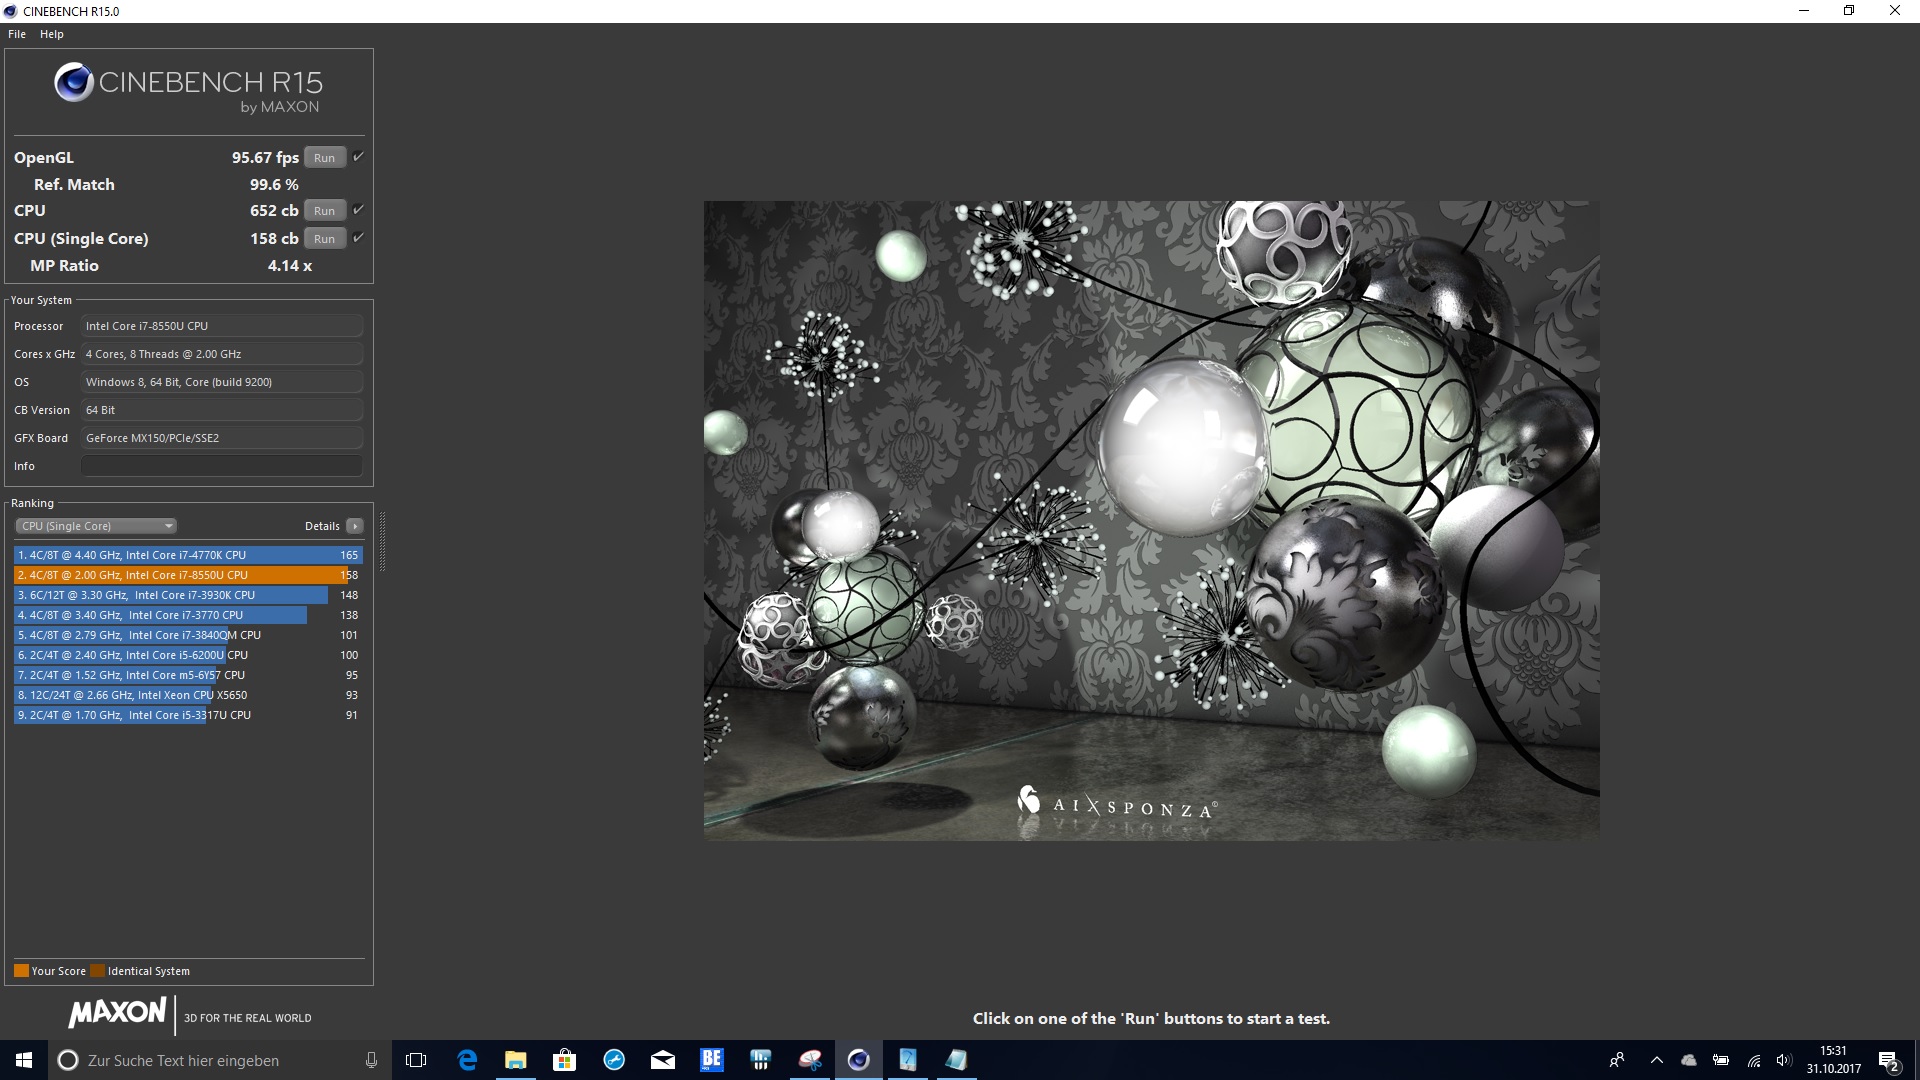
| Cinebench R15 | |
| CPU Single 64Bit | |
| Acer Aspire 5 A517-51G-80L | |
| HP Omen 17-w206ng | |
| Acer Aspire 7 A717-71G-72VY | |
| Dell Inspiron 17-7773-0043 | |
| Acer Aspire Nitro BE VN7-793G-5811 | |
| Dell Inspiron 17 7778 | |
| CPU Multi 64Bit | |
| HP Omen 17-w206ng | |
| Acer Aspire 7 A717-71G-72VY | |
| Dell Inspiron 17-7773-0043 | |
| Acer Aspire 5 A517-51G-80L | |
| Acer Aspire Nitro BE VN7-793G-5811 | |
| Dell Inspiron 17 7778 | |
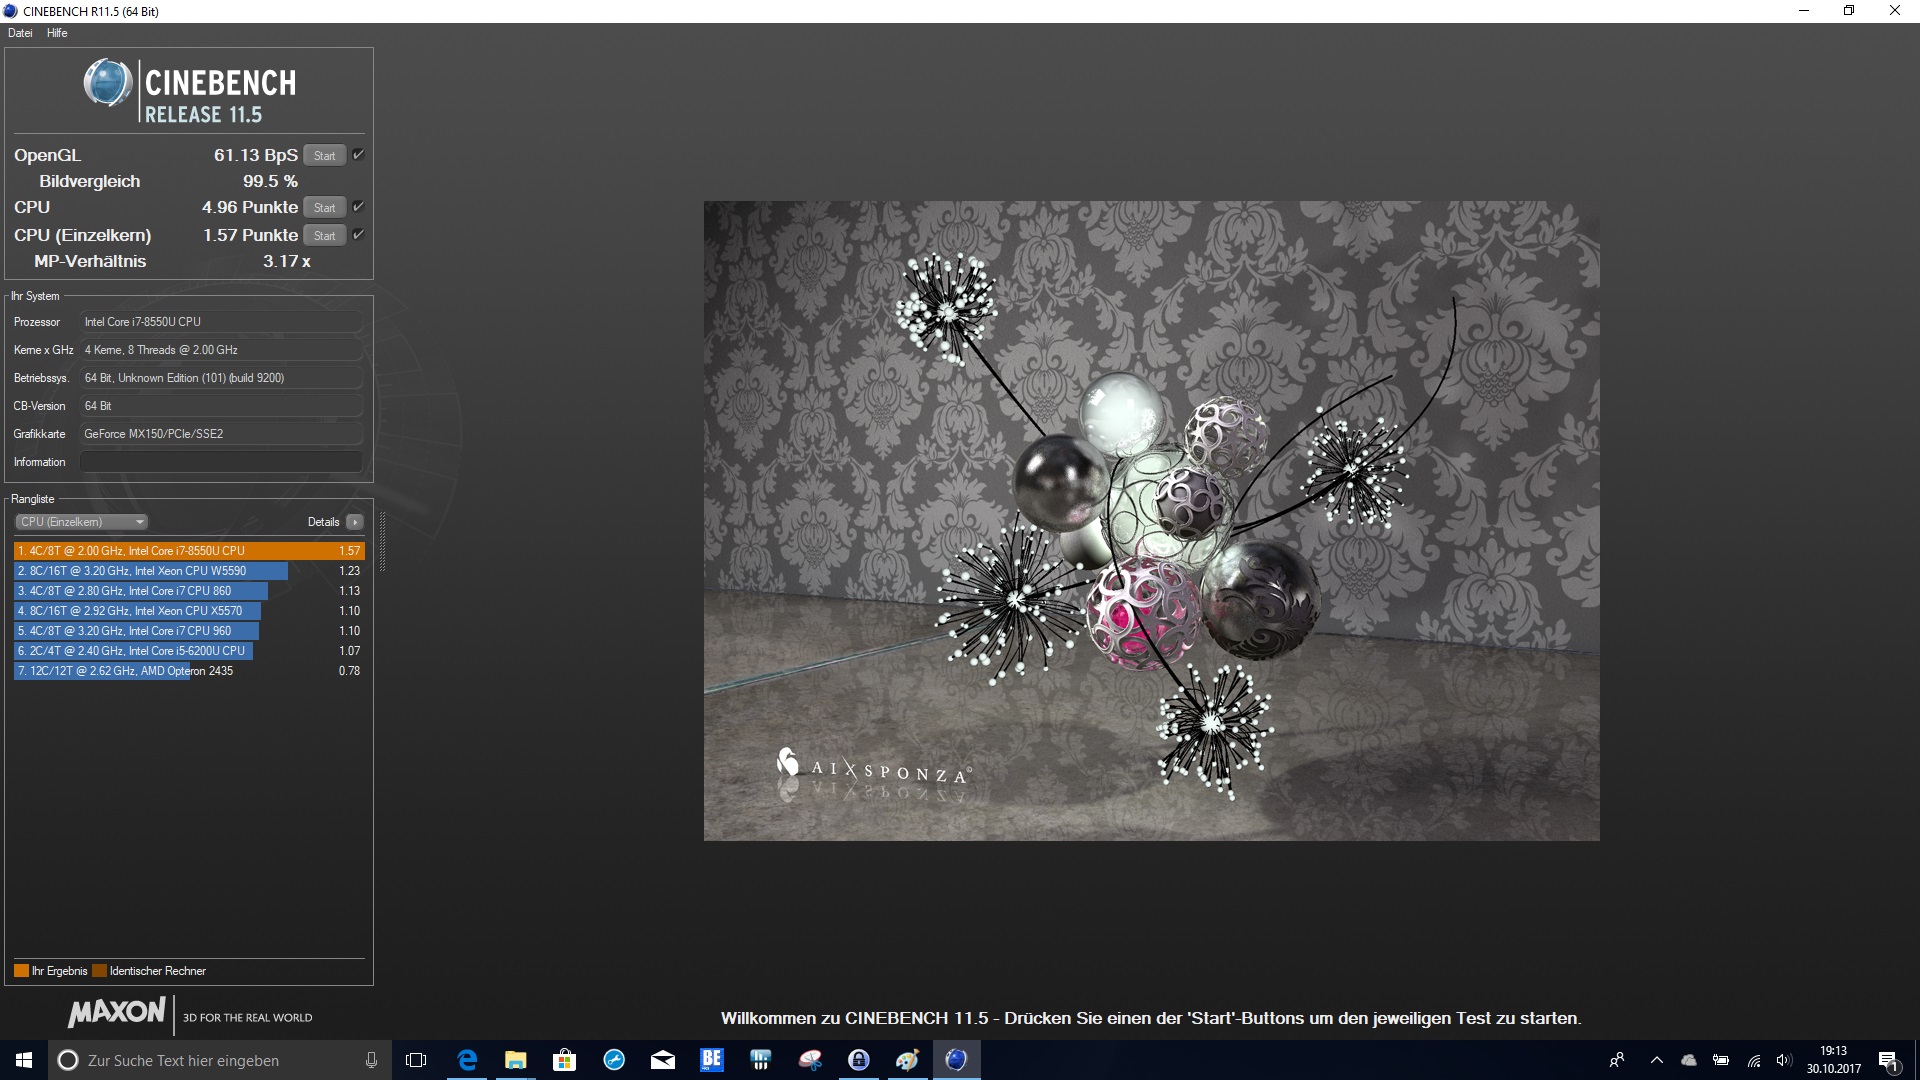
| Cinebench R11.5 | |
| CPU Single 64Bit | |
| Acer Aspire 5 A517-51G-80L | |
| HP Omen 17-w206ng | |
| Dell Inspiron 17-7773-0043 | |
| CPU Multi 64Bit | |
| HP Omen 17-w206ng | |
| Acer Aspire 5 A517-51G-80L | |
| Dell Inspiron 17-7773-0043 | |
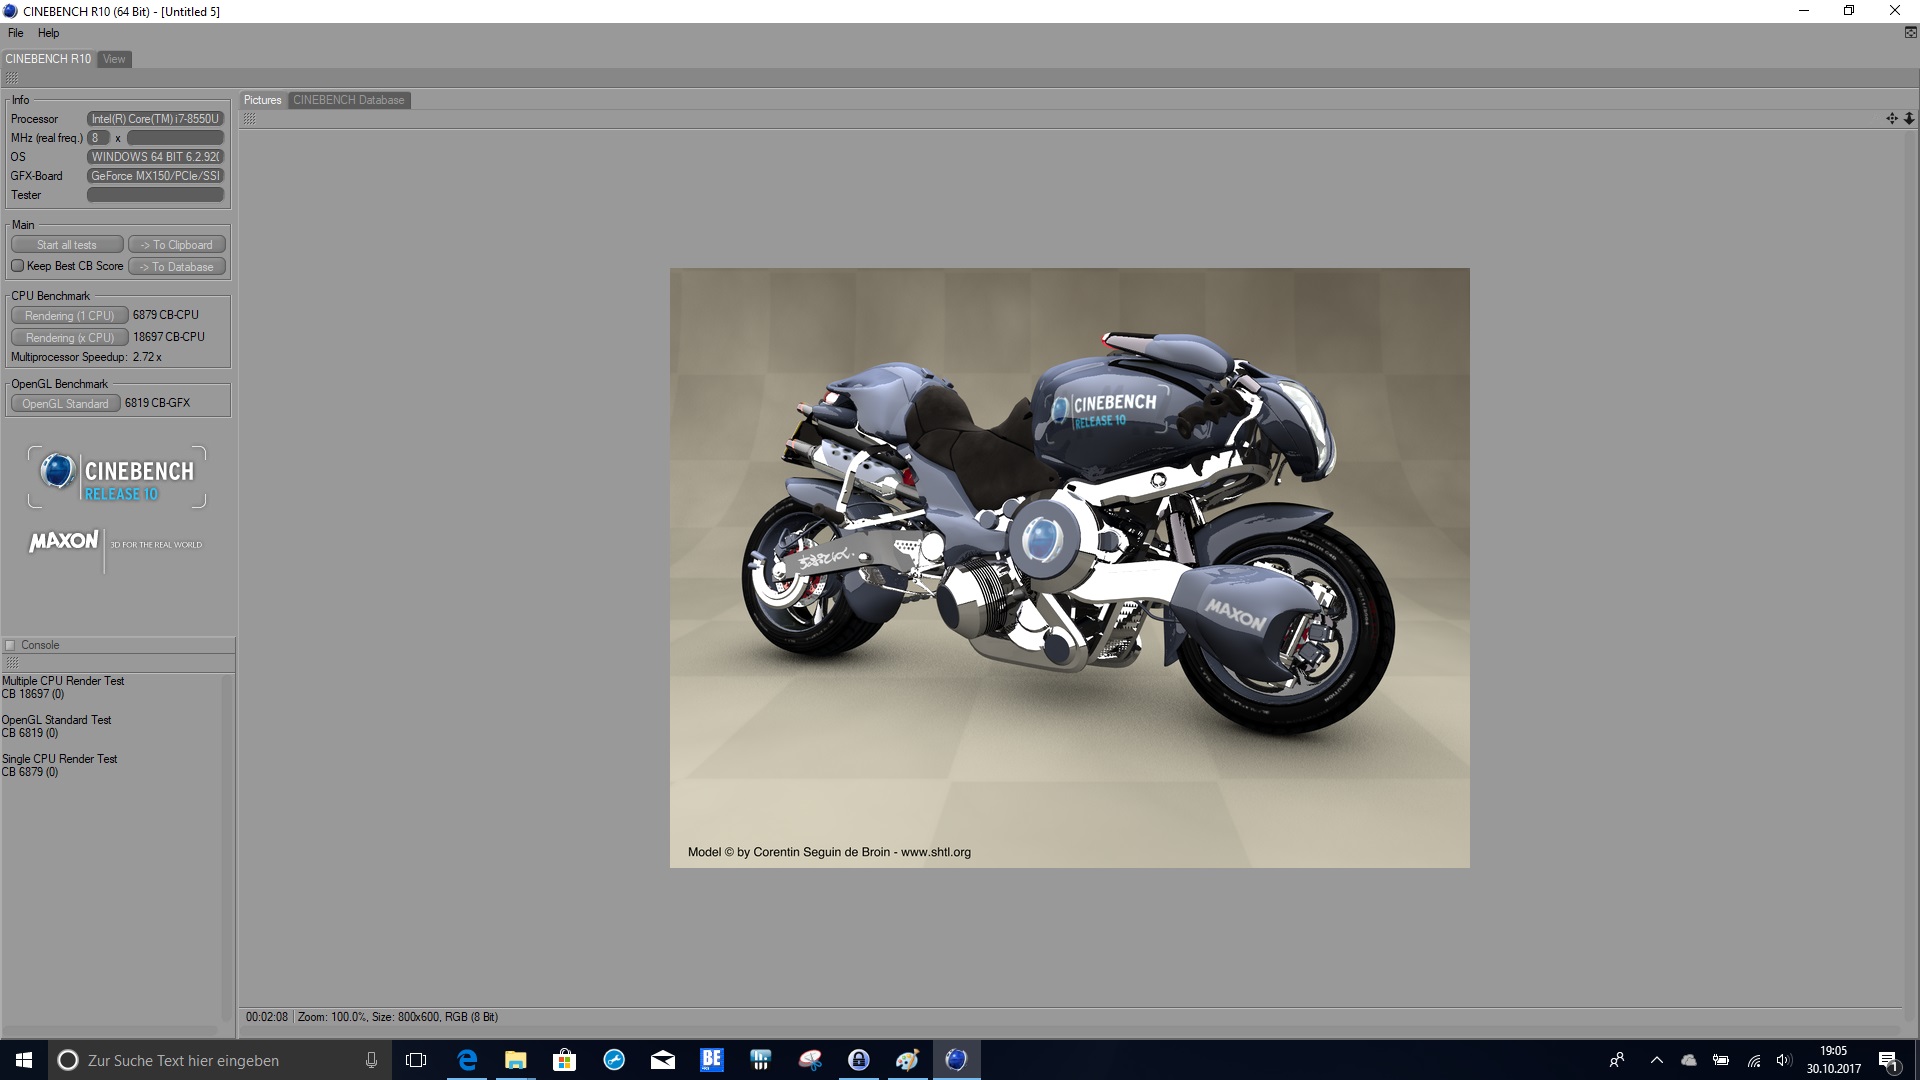
| Cinebench R10 | |
| Rendering Single CPUs 64Bit | |
| Acer Aspire 5 A517-51G-80L | |
| HP Omen 17-w206ng | |
| Dell Inspiron 17-7773-0043 | |
| Rendering Multiple CPUs 64Bit | |
| HP Omen 17-w206ng | |
| Acer Aspire 5 A517-51G-80L | |
| Dell Inspiron 17-7773-0043 | |
| JetStream 1.1 - 1.1 Total | |
| Acer Aspire 5 A517-51G-80L | |
| HP Omen 17-w206ng | |
| Acer Aspire Nitro BE VN7-793G-5811 | |
| Dell Inspiron 17-7773-0043 | |
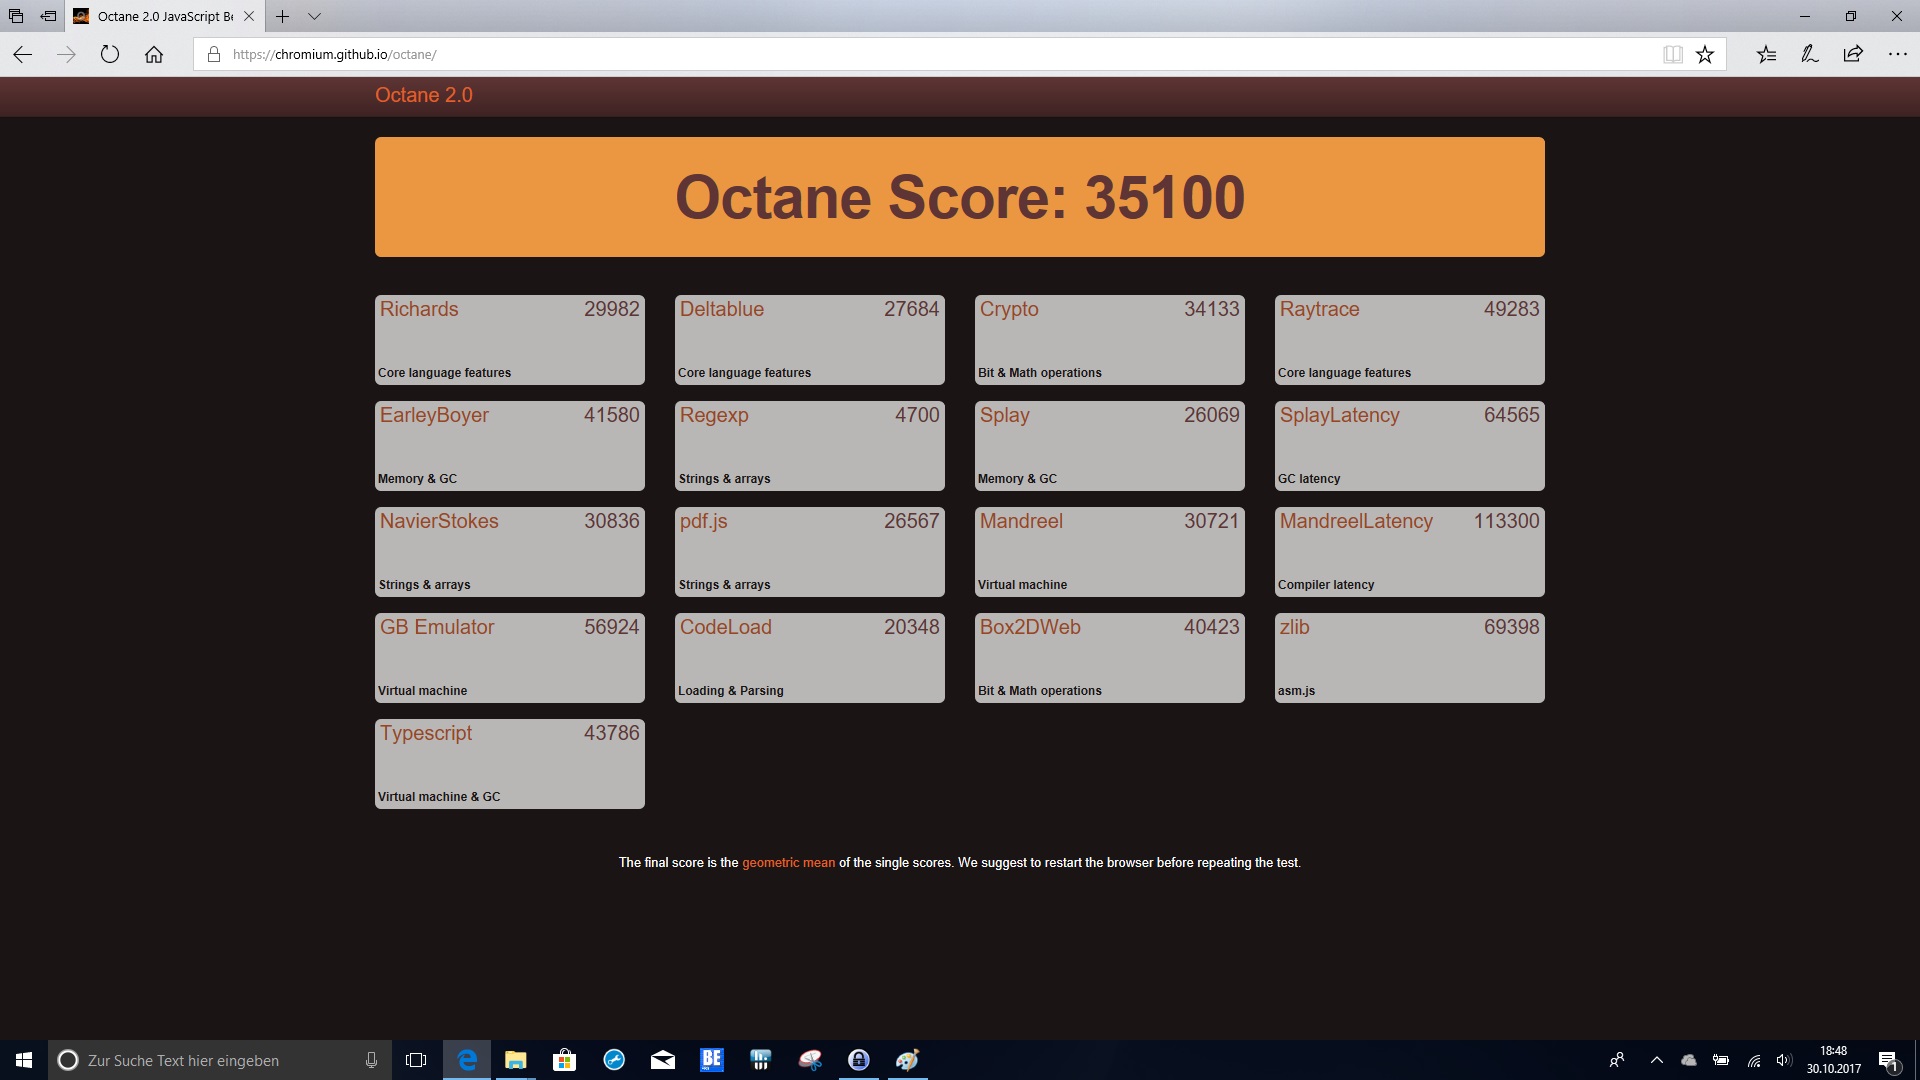
| Octane V2 - Total Score | |
| Acer Aspire 5 A517-51G-80L | |
| Dell Inspiron 17-7773-0043 | |
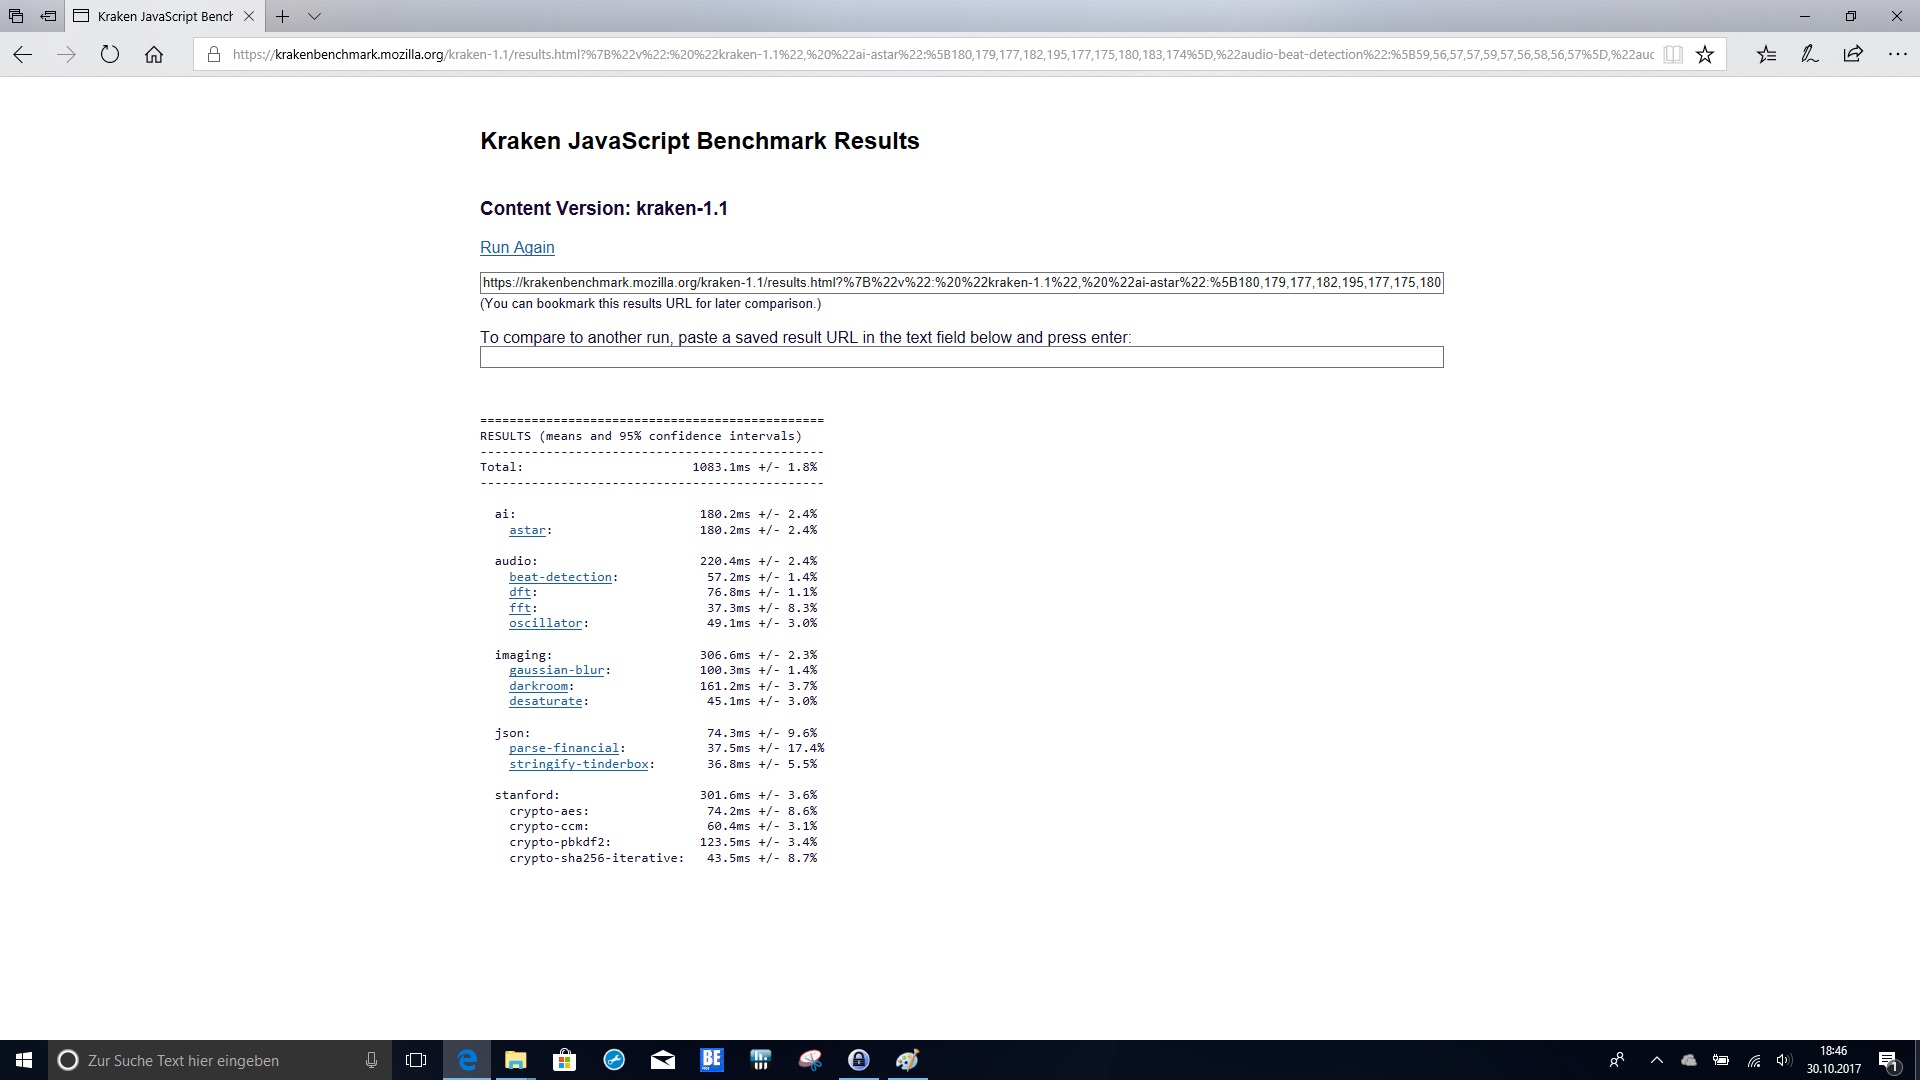
| Mozilla Kraken 1.1 - Total | |
| Dell Inspiron 17-7773-0043 | |
| Acer Aspire 5 A517-51G-80L | |
* ... mindre är bättre

| PCMark 8 | |
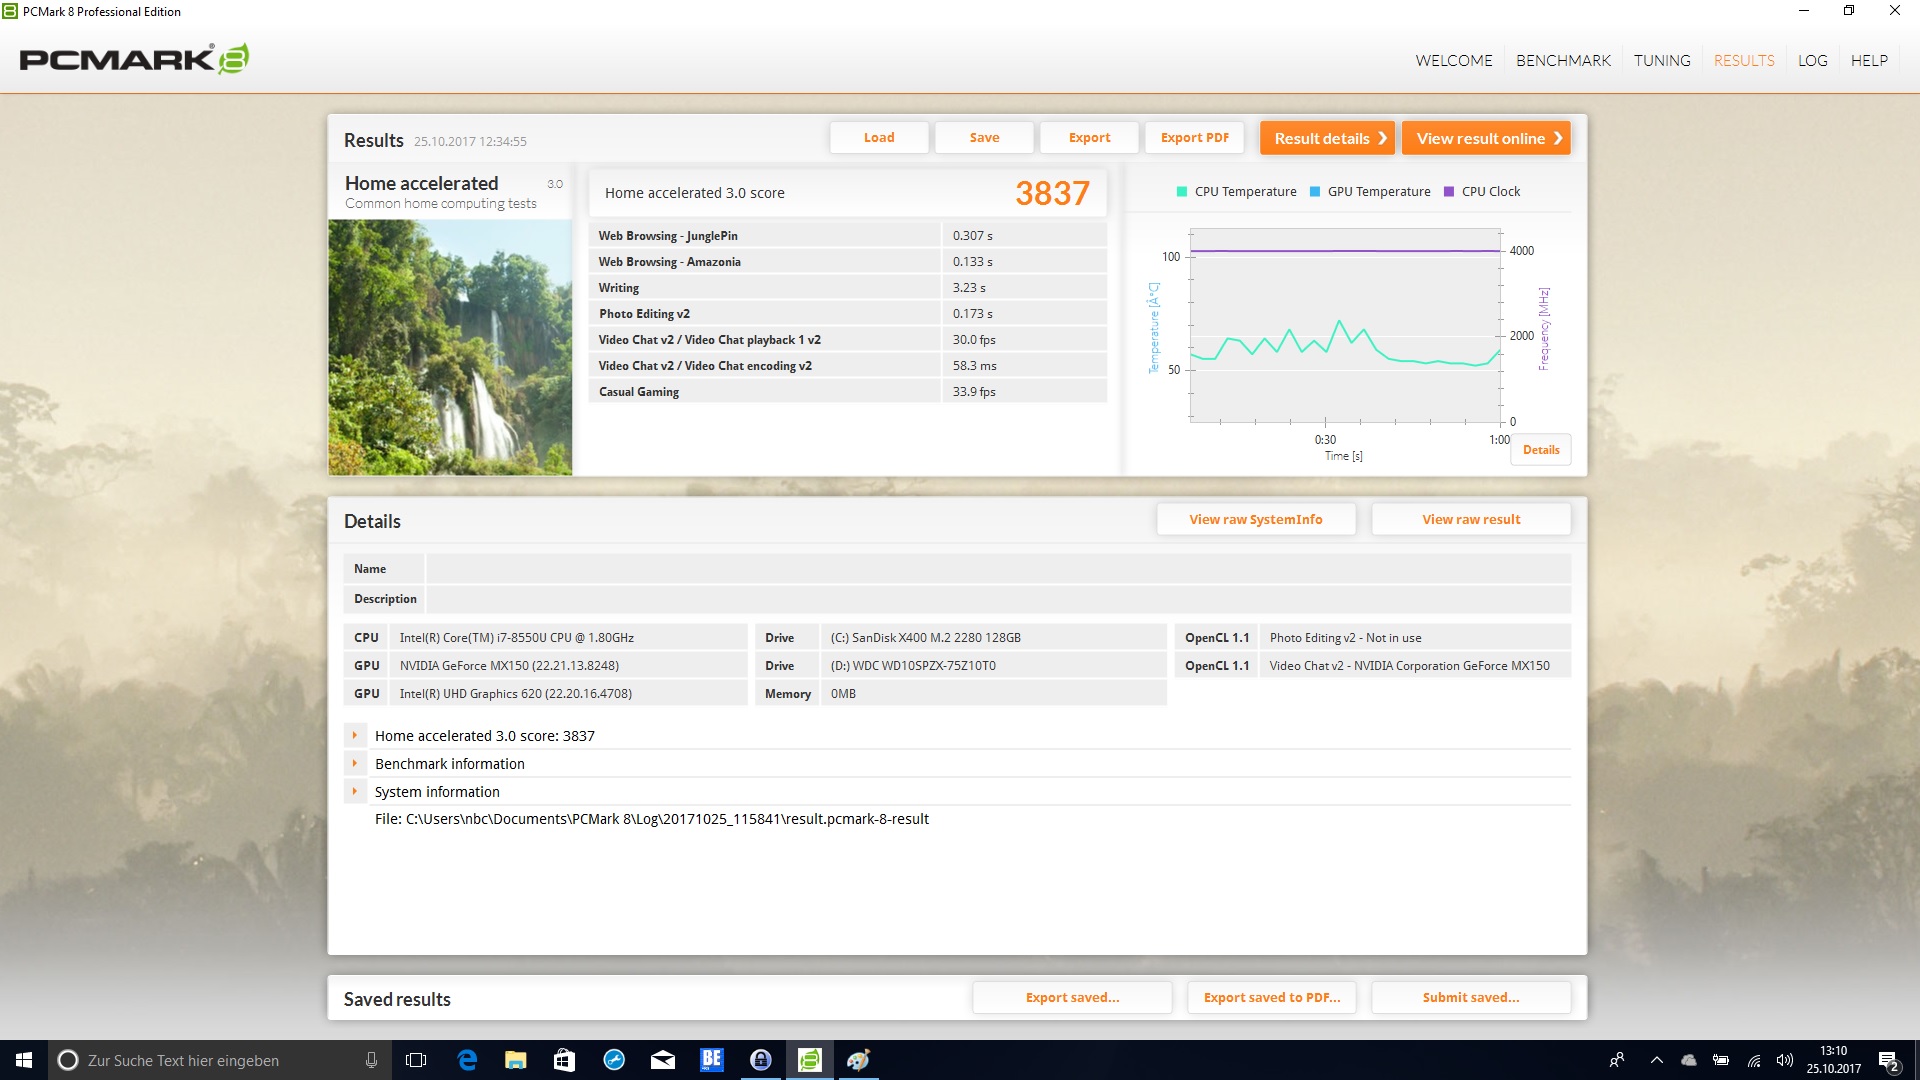
| Home Score Accelerated v2 | |
| HP Omen 17-w206ng | |
| Acer Aspire 5 A517-51G-80L | |
| Dell Inspiron 17-7773-0043 | |
| Dell Inspiron 17 7778 | |
| Acer Aspire 7 A717-71G-72VY | |
| Acer Aspire Nitro BE VN7-793G-5811 | |
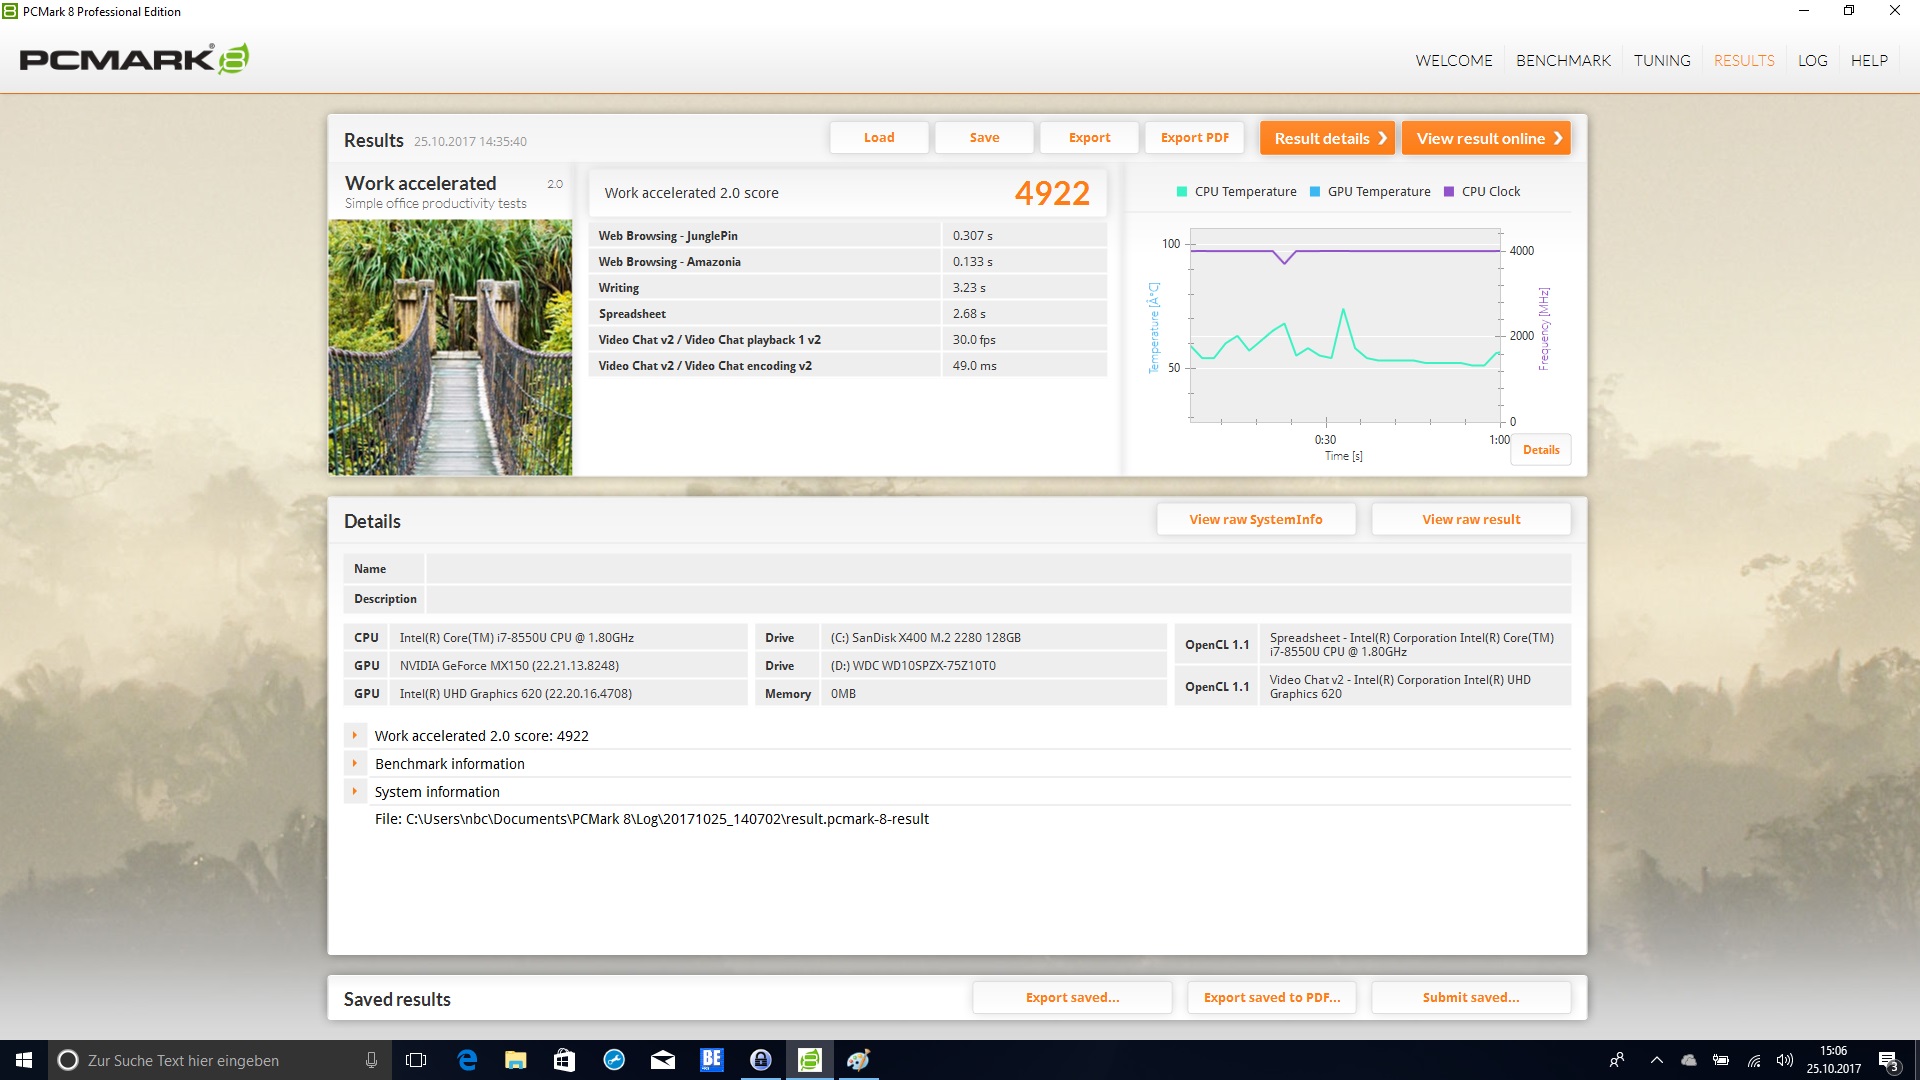
| Work Score Accelerated v2 | |
| Acer Aspire 5 A517-51G-80L | |
| Dell Inspiron 17-7773-0043 | |
| Acer Aspire 7 A717-71G-72VY | |
| Dell Inspiron 17 7778 | |
| Acer Aspire Nitro BE VN7-793G-5811 | |
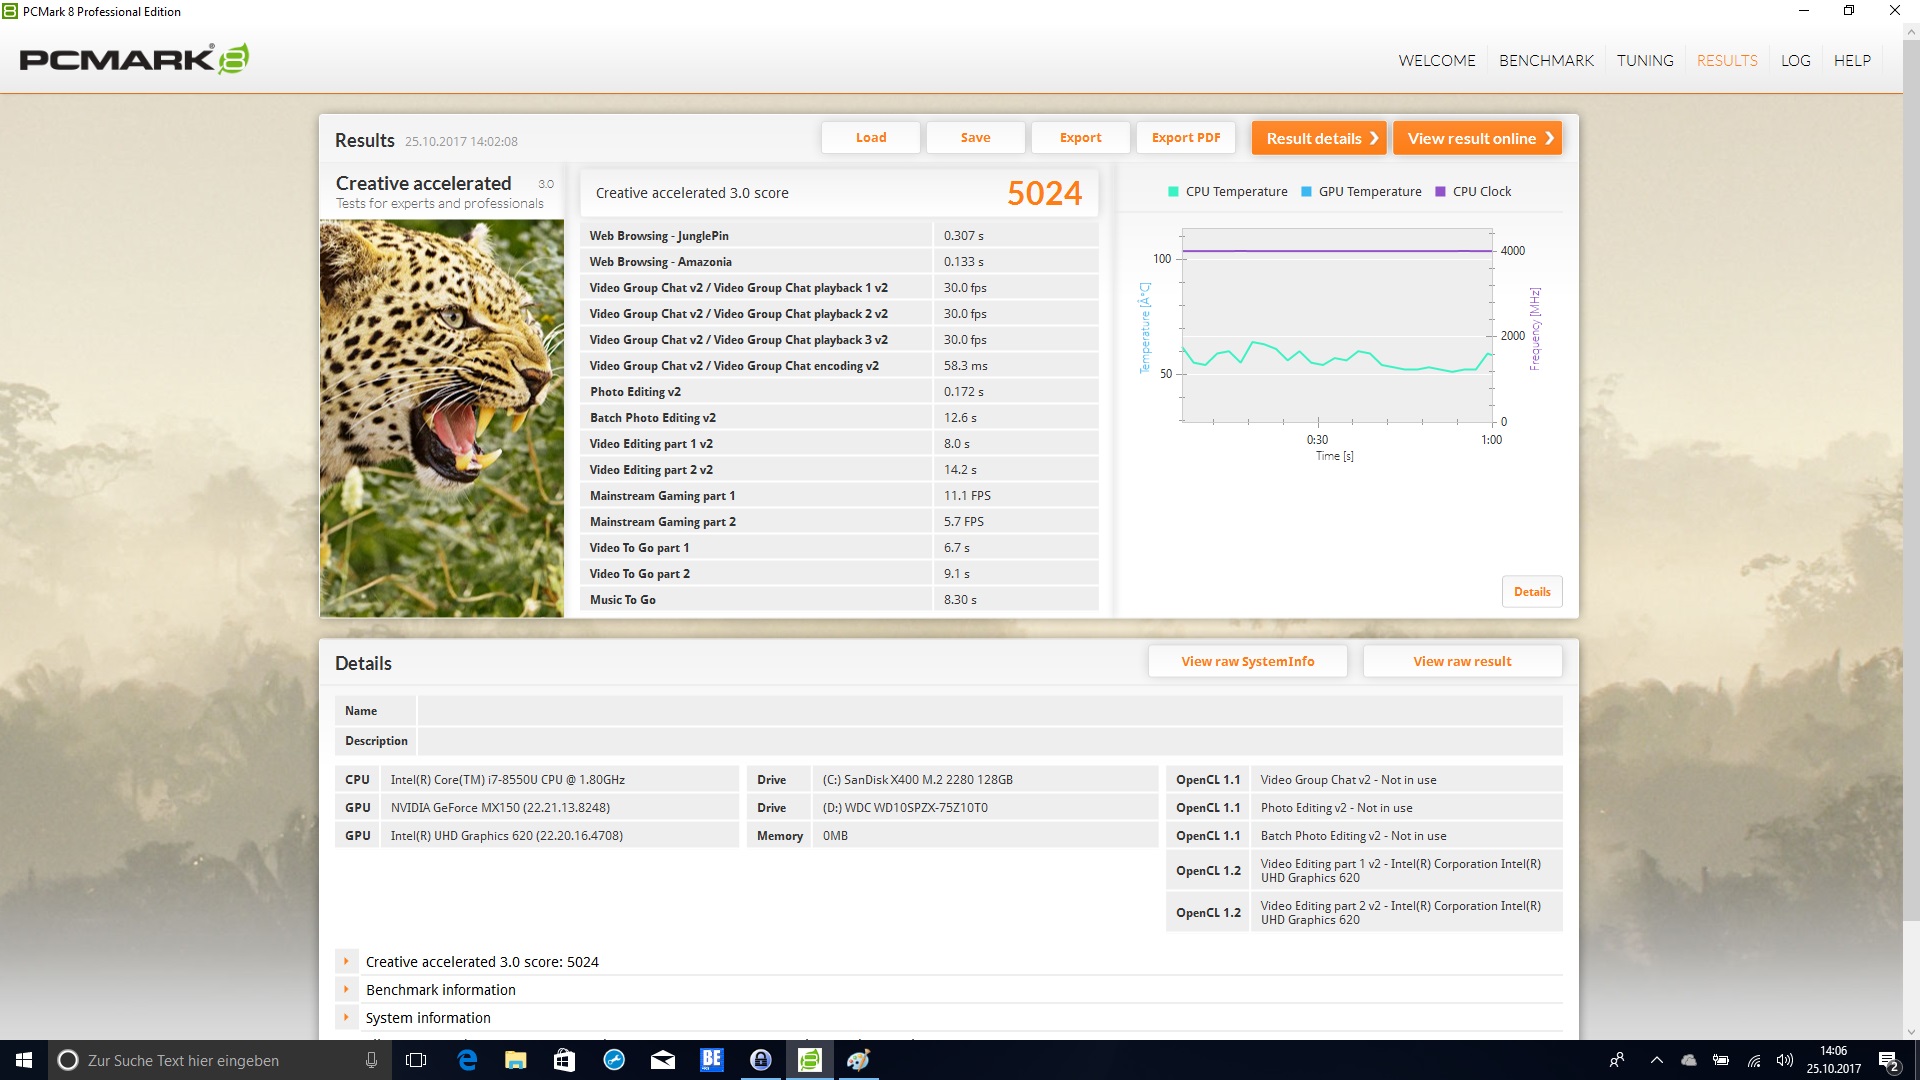
| Creative Score Accelerated v2 | |
| Acer Aspire 5 A517-51G-80L | |
| Dell Inspiron 17-7773-0043 | |
| Acer Aspire Nitro BE VN7-793G-5811 | |
| PCMark 10 | |
| Score | |
| Acer Aspire 5 A517-51G-80L | |
| Dell Inspiron 17-7773-0043 | |
| Productivity | |
| Acer Aspire 5 A517-51G-80L | |
| Dell Inspiron 17-7773-0043 | |
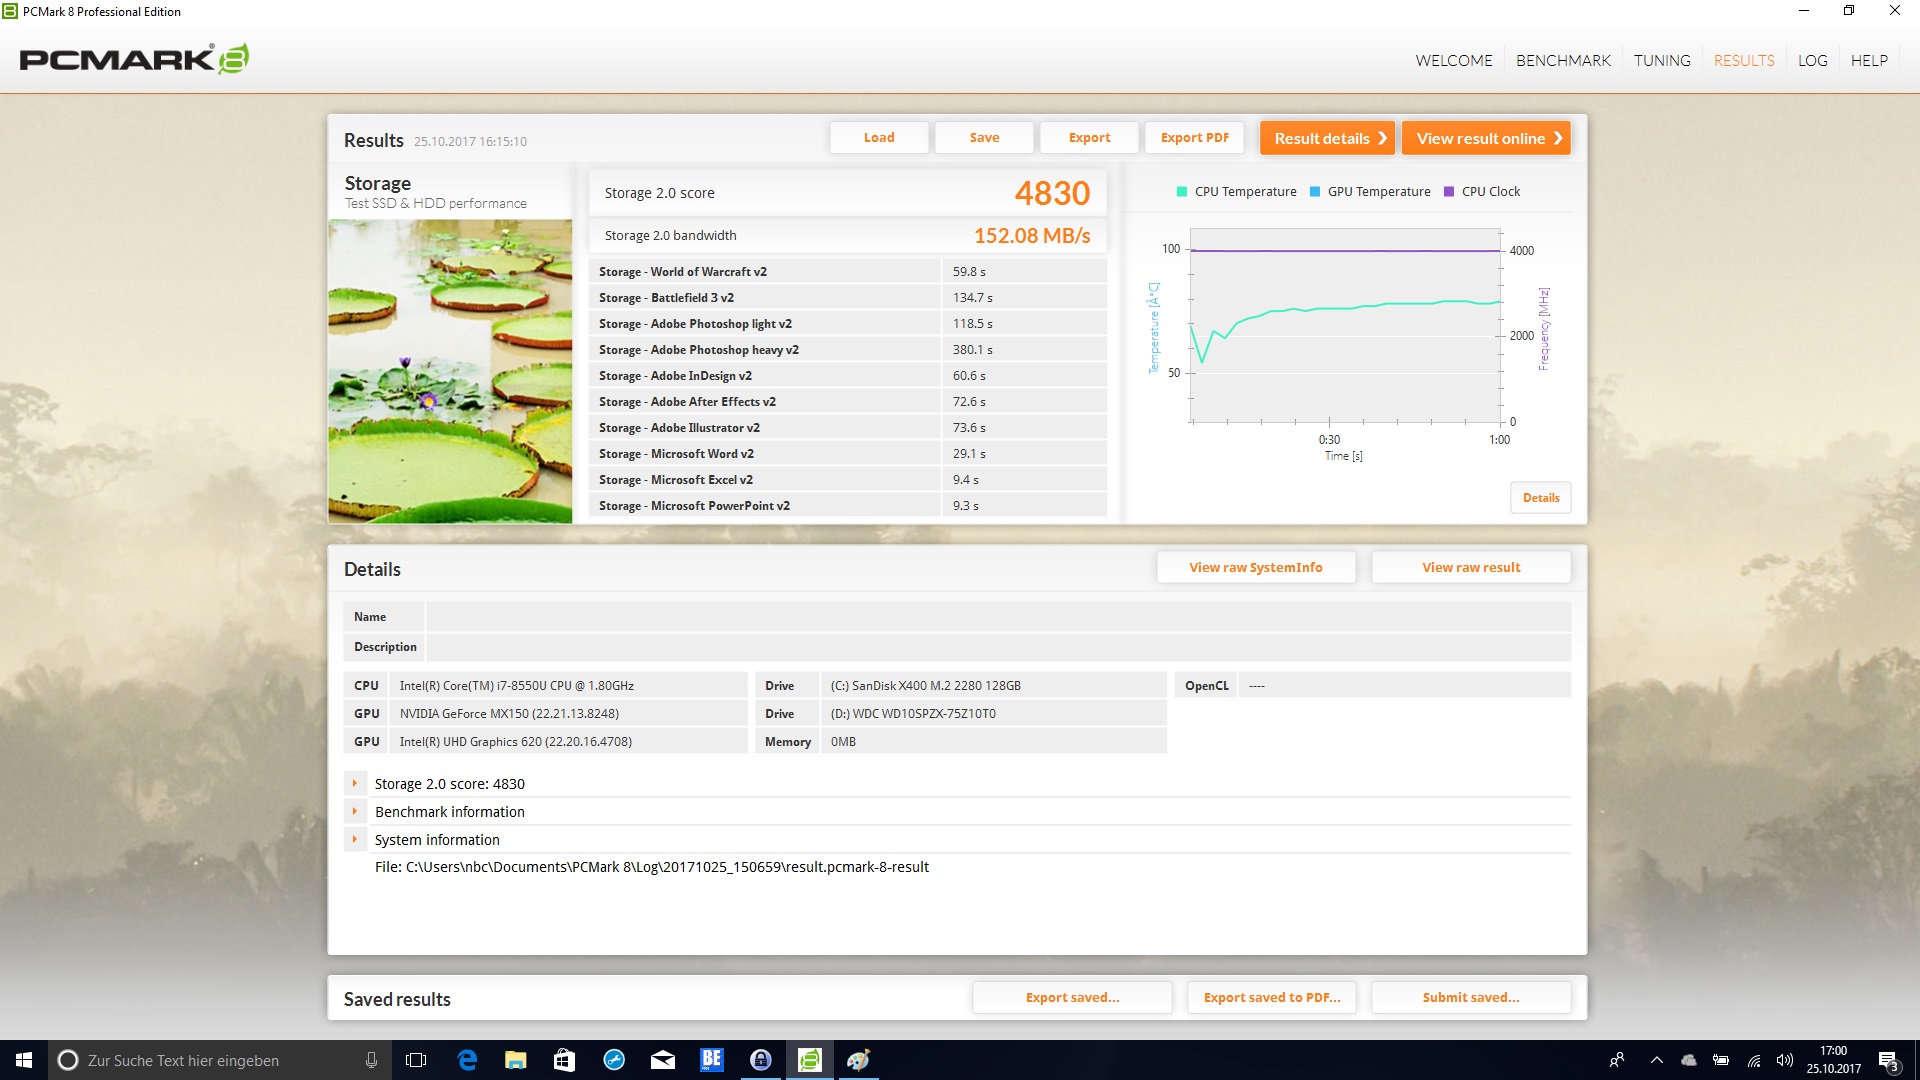
| PCMark 8 Home Score Accelerated v2 | 3837 poäng | |
| PCMark 8 Creative Score Accelerated v2 | 5024 poäng | |
| PCMark 8 Work Score Accelerated v2 | 4922 poäng | |
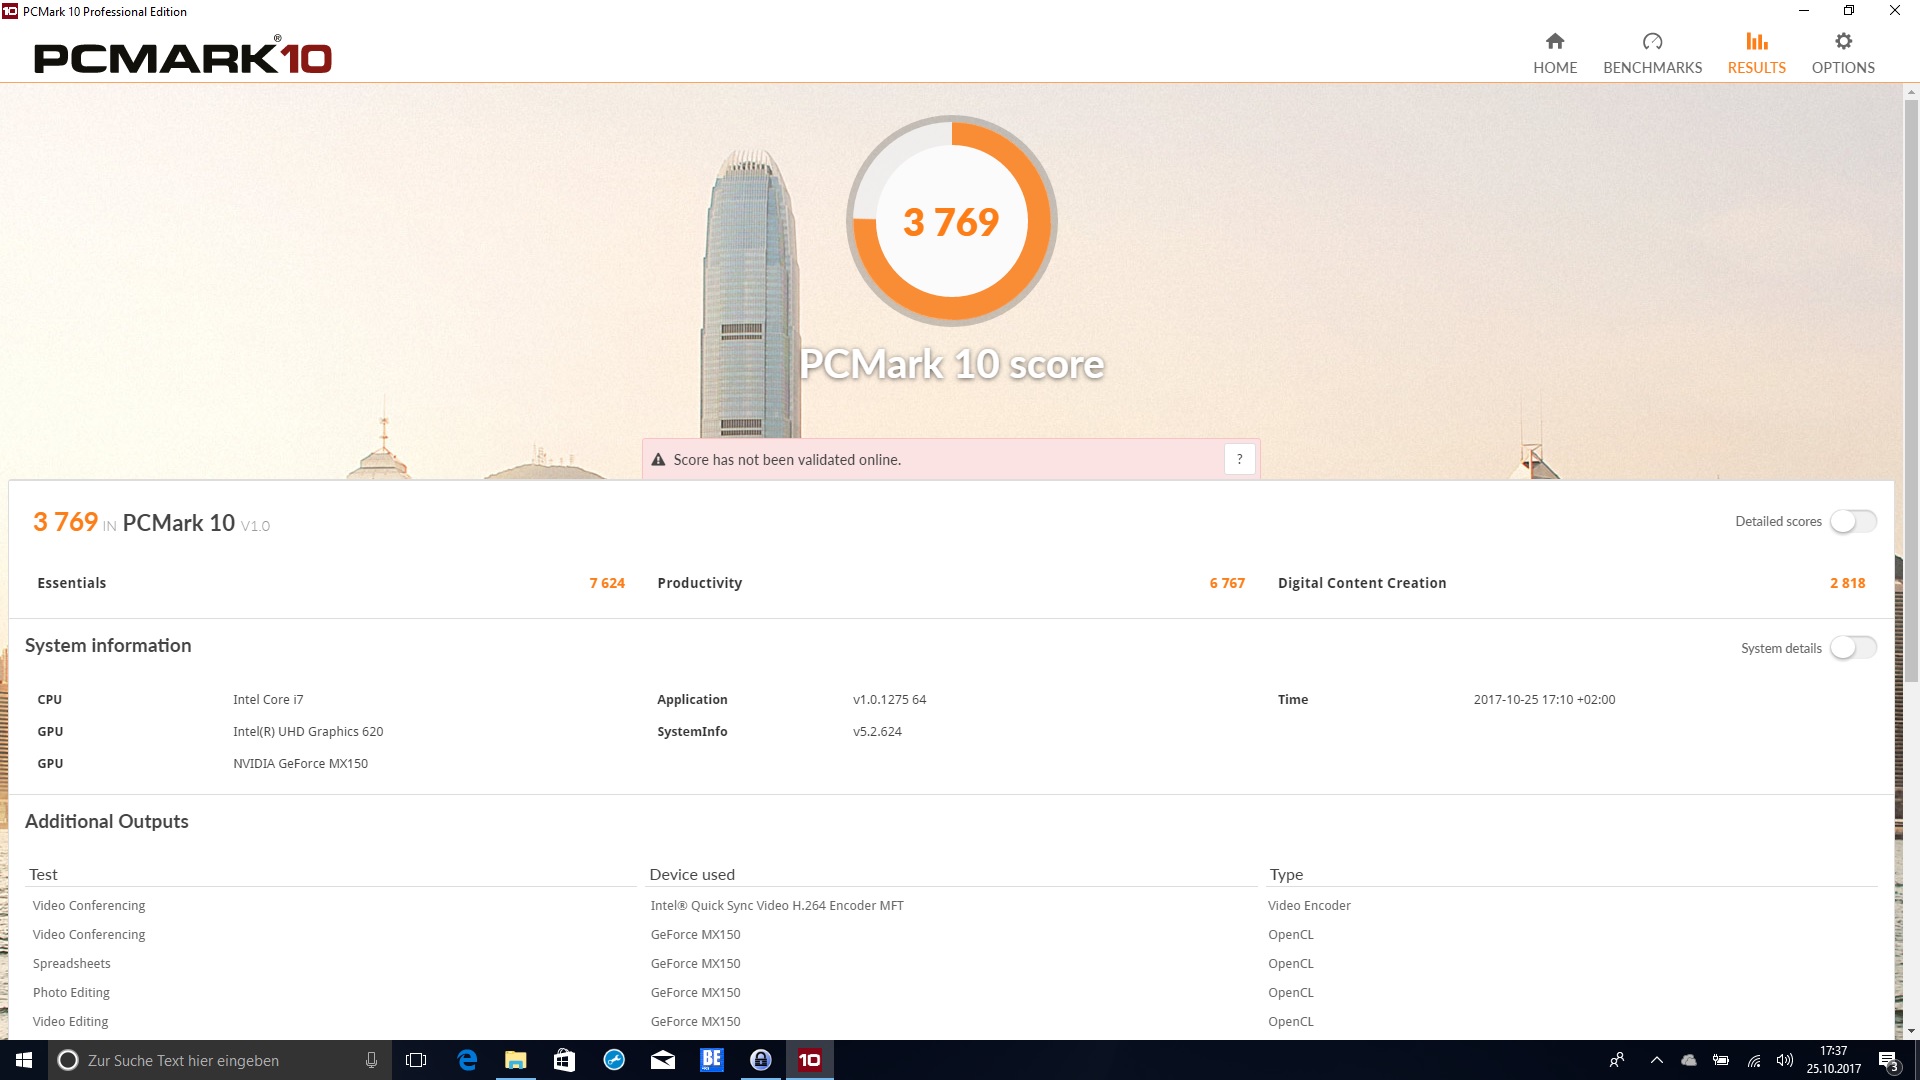
| PCMark 10 Score | 3769 poäng | |
Hjälp | ||
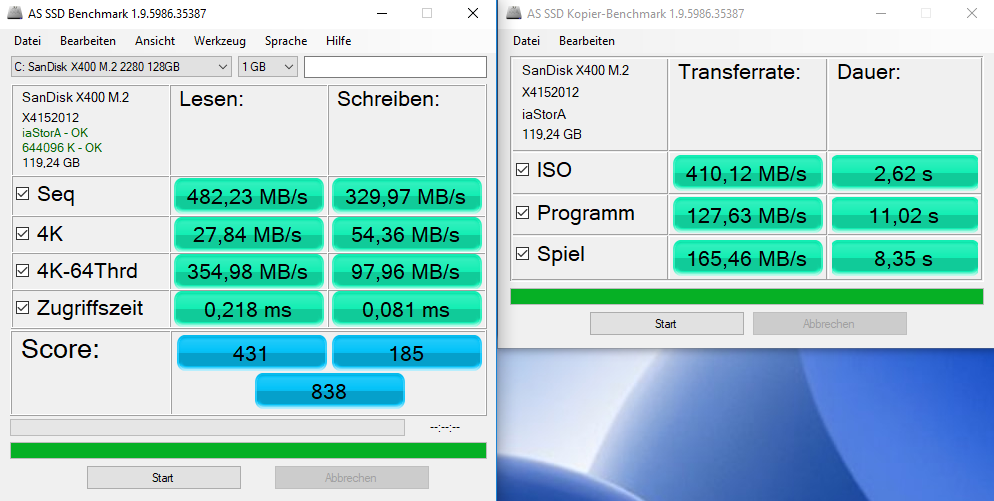
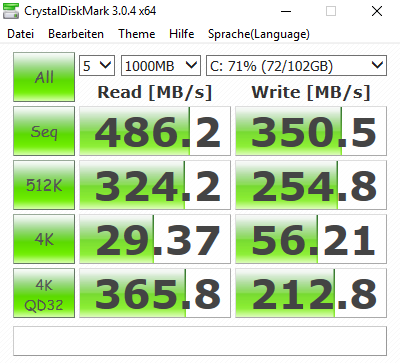
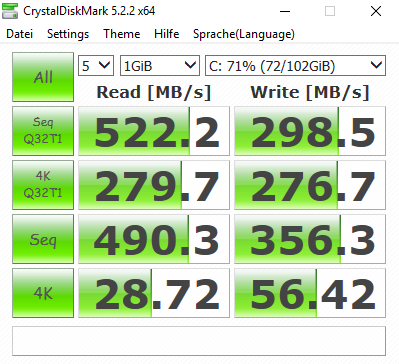
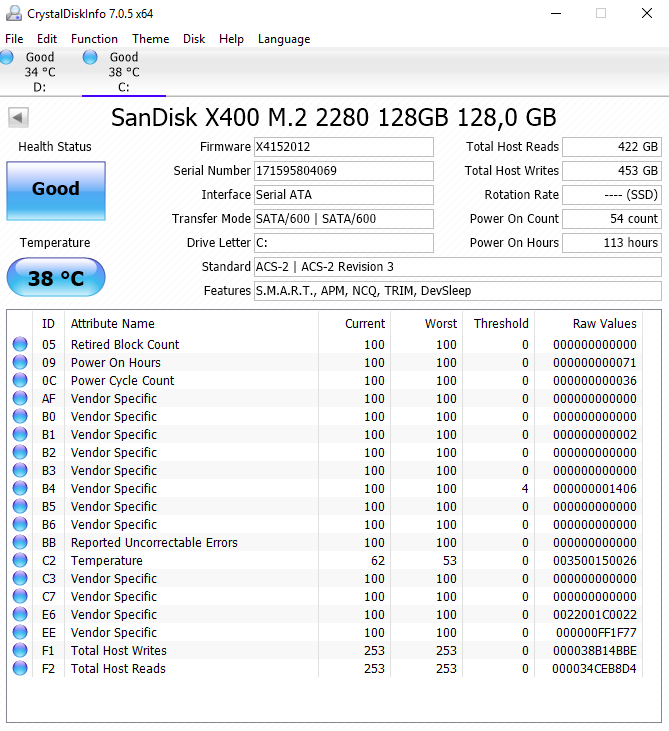
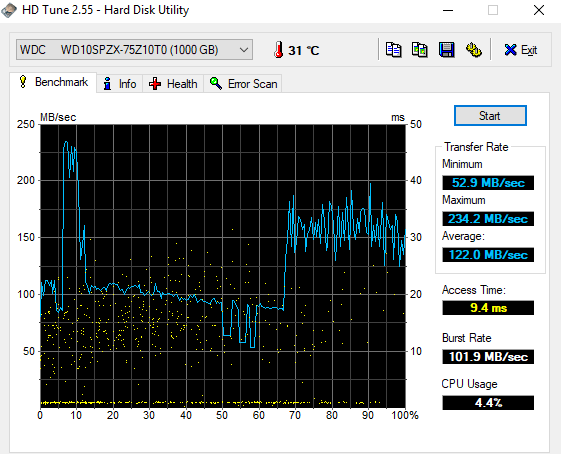
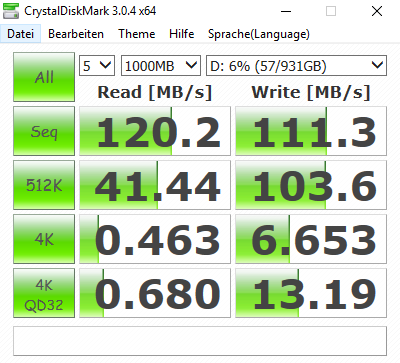
| Dell Inspiron 17-7773-0043 SanDisk X400 M.2 2280 128GB | Dell Inspiron 17 7778 Liteonit CV3-CE512 | Acer Aspire 5 A517-51G-80L Micron 1100 MTFDDAV256TBN | Acer Aspire Nitro BE VN7-793G-5811 Seagate Mobile HDD 1TB ST1000LM035 | HP Omen 17-w206ng Samsung PM961 MZVLW256HEHP | Acer Aspire 7 A717-71G-72VY Toshiba MQ01ABD100 | |
|---|---|---|---|---|---|---|
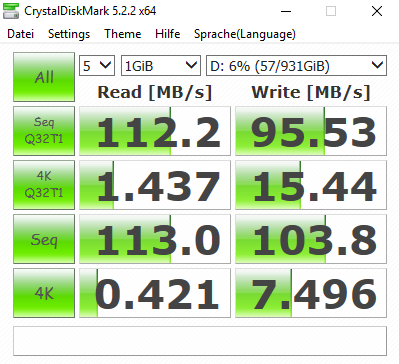
| CrystalDiskMark 3.0 | 13% | 5% | -86% | 165% | -91% | |
| Read Seq (MB/s) | 486.2 | 486.4 0% | 480.1 -1% | 117.6 -76% | 1606 230% | 108.7 -78% |
| Write Seq (MB/s) | 350.5 | 438.4 25% | 385.6 10% | 109.1 -69% | 1176 236% | 100.7 -71% |
| Read 512 (MB/s) | 324.2 | 232.8 -28% | 295.6 -9% | 39.93 -88% | 846 161% | 29.74 -91% |
| Write 512 (MB/s) | 254.8 | 386.7 52% | 302.5 19% | 98.6 -61% | 805 216% | 28.06 -89% |
| Read 4k (MB/s) | 29.37 | 32.3 10% | 27.58 -6% | 0.435 -99% | 59.9 104% | 0.345 -99% |
| Write 4k (MB/s) | 56.2 | 65.8 17% | 81.4 45% | 3.152 -94% | 155.6 177% | 0.78 -99% |
| Read 4k QD32 (MB/s) | 365.8 | 334.4 -9% | 247.4 -32% | 1.008 -100% | 588 61% | 0.688 -100% |
| Write 4k QD32 (MB/s) | 212.8 | 289.5 36% | 237.7 12% | 4.705 -98% | 505 137% | 0.767 -100% |

| 3DMark | |
| 1280x720 Cloud Gate Standard Graphics | |
| Acer Aspire 7 A717-71G-72VY | |
| Acer Aspire Nitro BE VN7-793G-5811 | |
| Dell Inspiron 17-7773-0043 | |
| Acer Aspire 5 A517-51G-80L | |
| Dell Inspiron 17 7778 | |
| 1920x1080 Fire Strike Graphics | |
| Acer Aspire 7 A717-71G-72VY | |
| Acer Aspire Nitro BE VN7-793G-5811 | |
| Acer Aspire 5 A517-51G-80L | |
| Dell Inspiron 17-7773-0043 | |
| Dell Inspiron 17 7778 | |
| 3DMark 11 - 1280x720 Performance GPU | |
| Acer Aspire 7 A717-71G-72VY | |
| Acer Aspire Nitro BE VN7-793G-5811 | |
| HP Omen 17-w206ng | |
| Acer Aspire 5 A517-51G-80L | |
| Dell Inspiron 17-7773-0043 | |
| Dell Inspiron 17 7778 | |
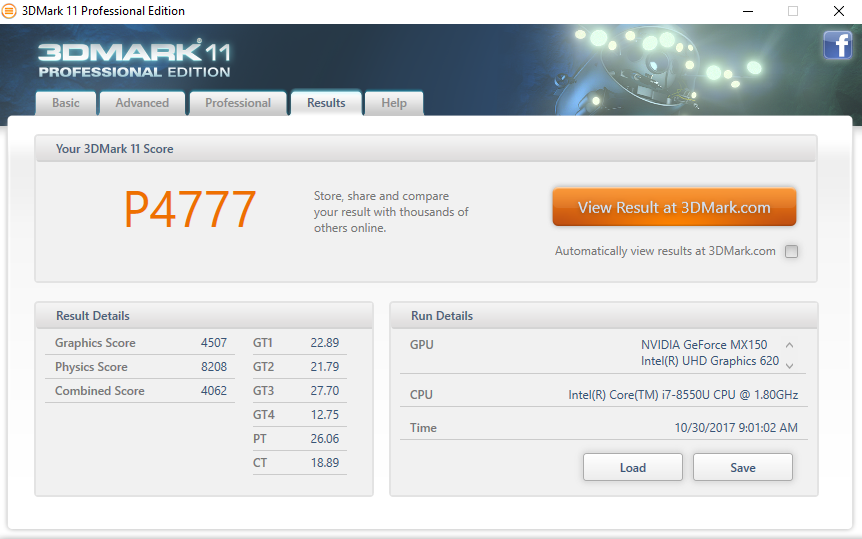
| 3DMark 11 Performance | 4777 poäng | |
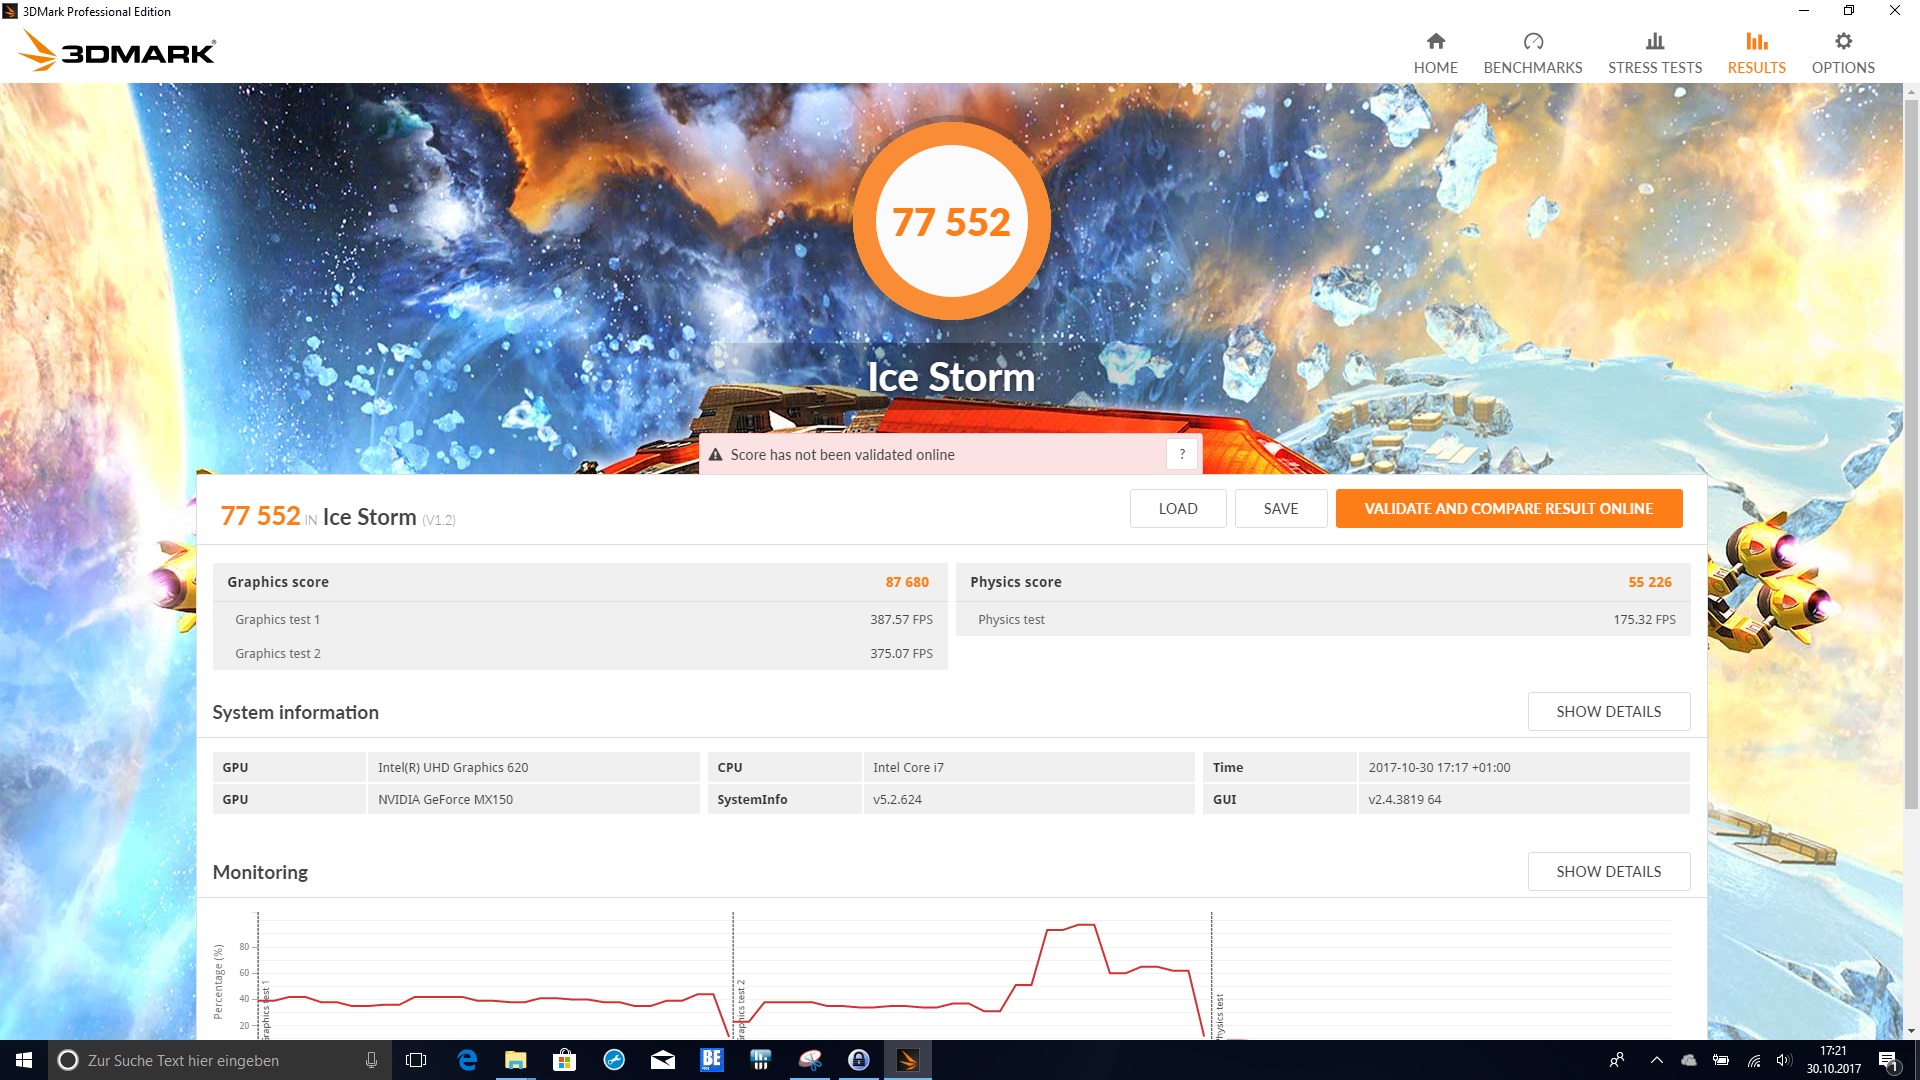
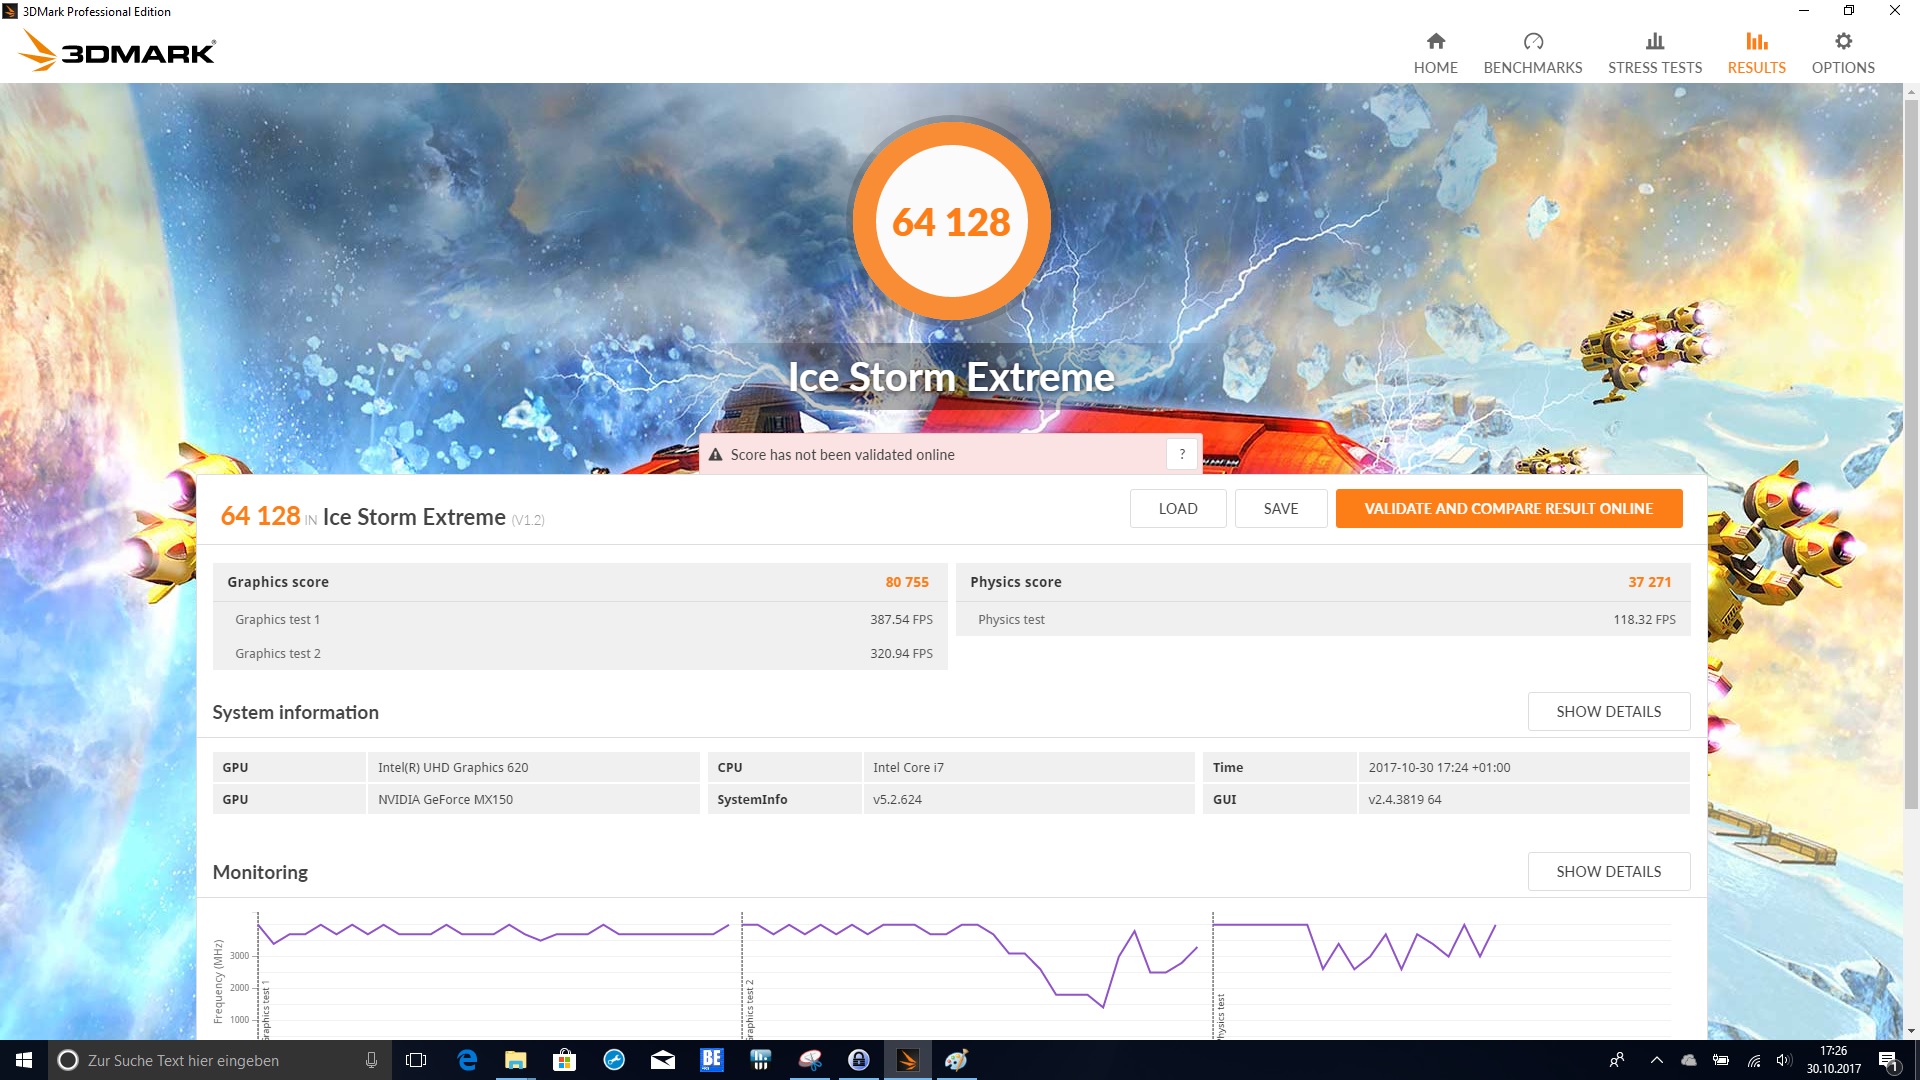
| 3DMark Ice Storm Standard Score | 77552 poäng | |
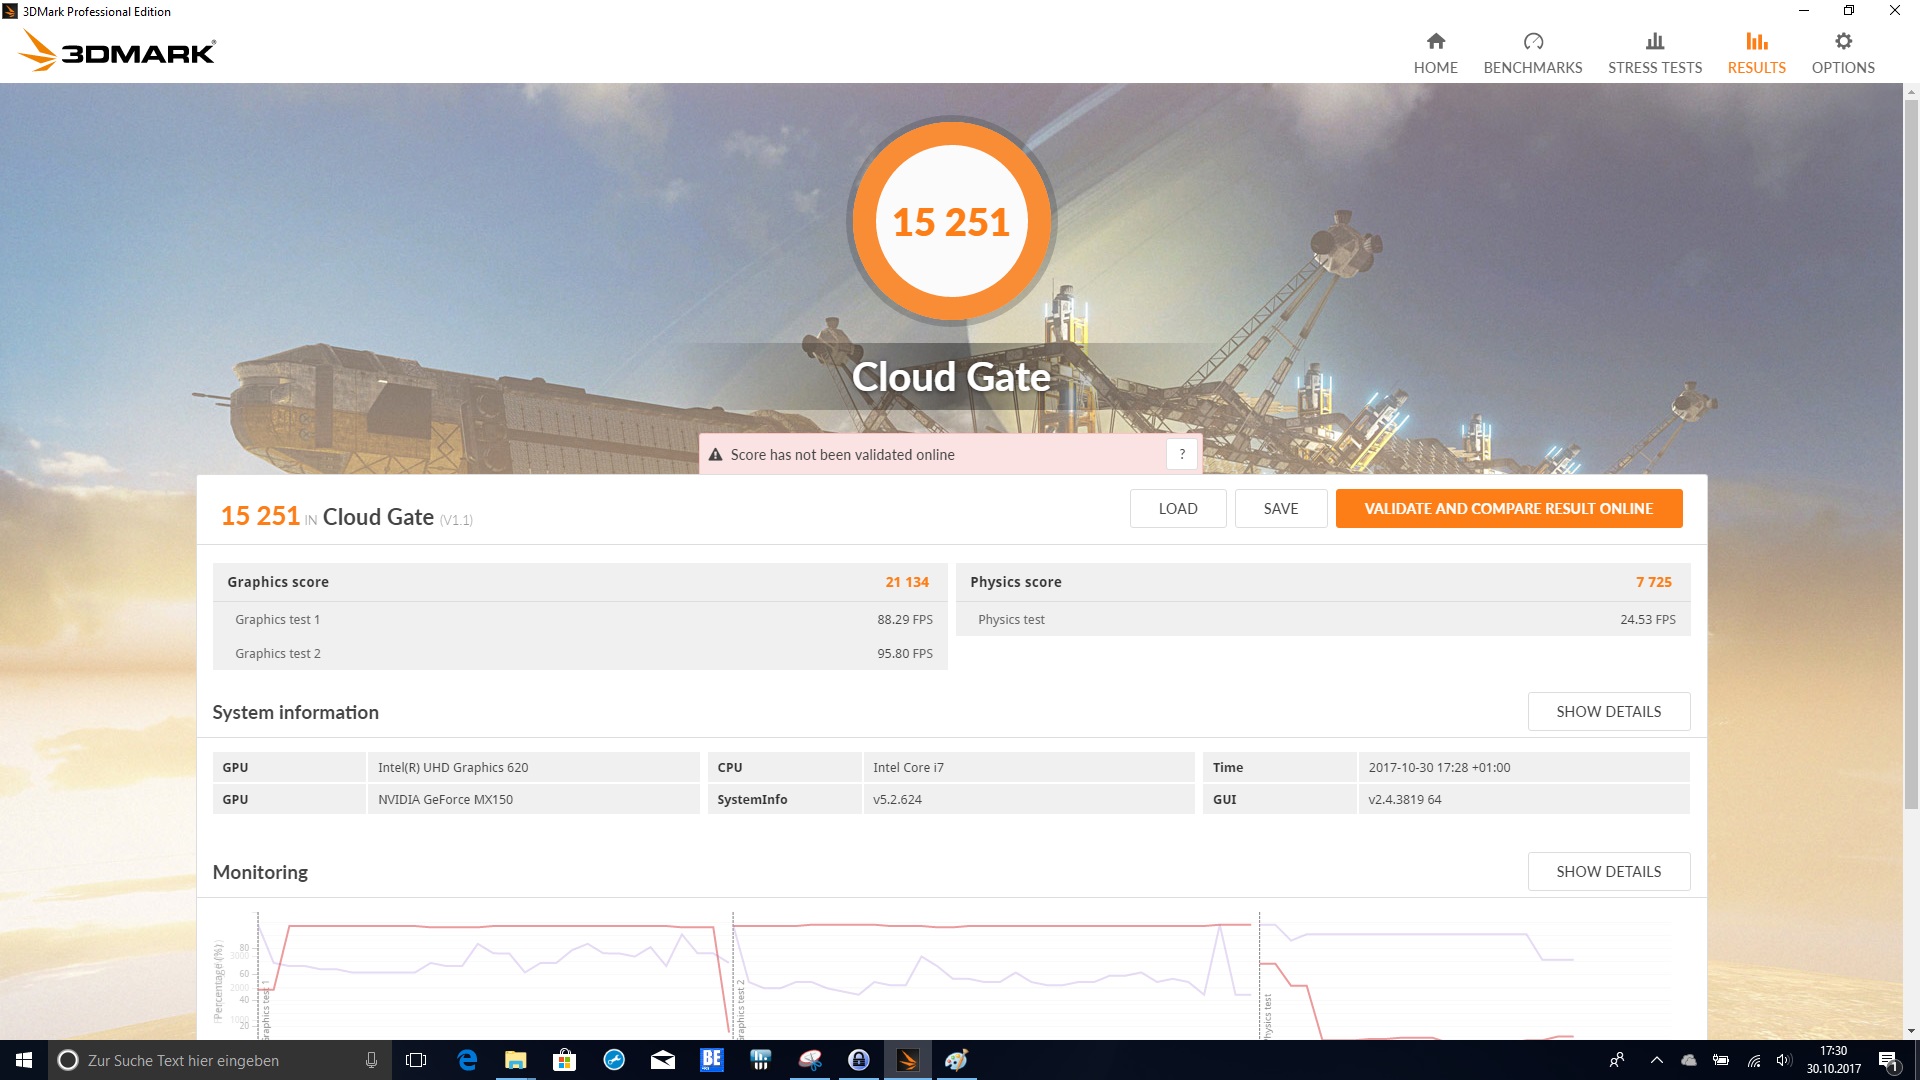
| 3DMark Cloud Gate Standard Score | 15251 poäng | |
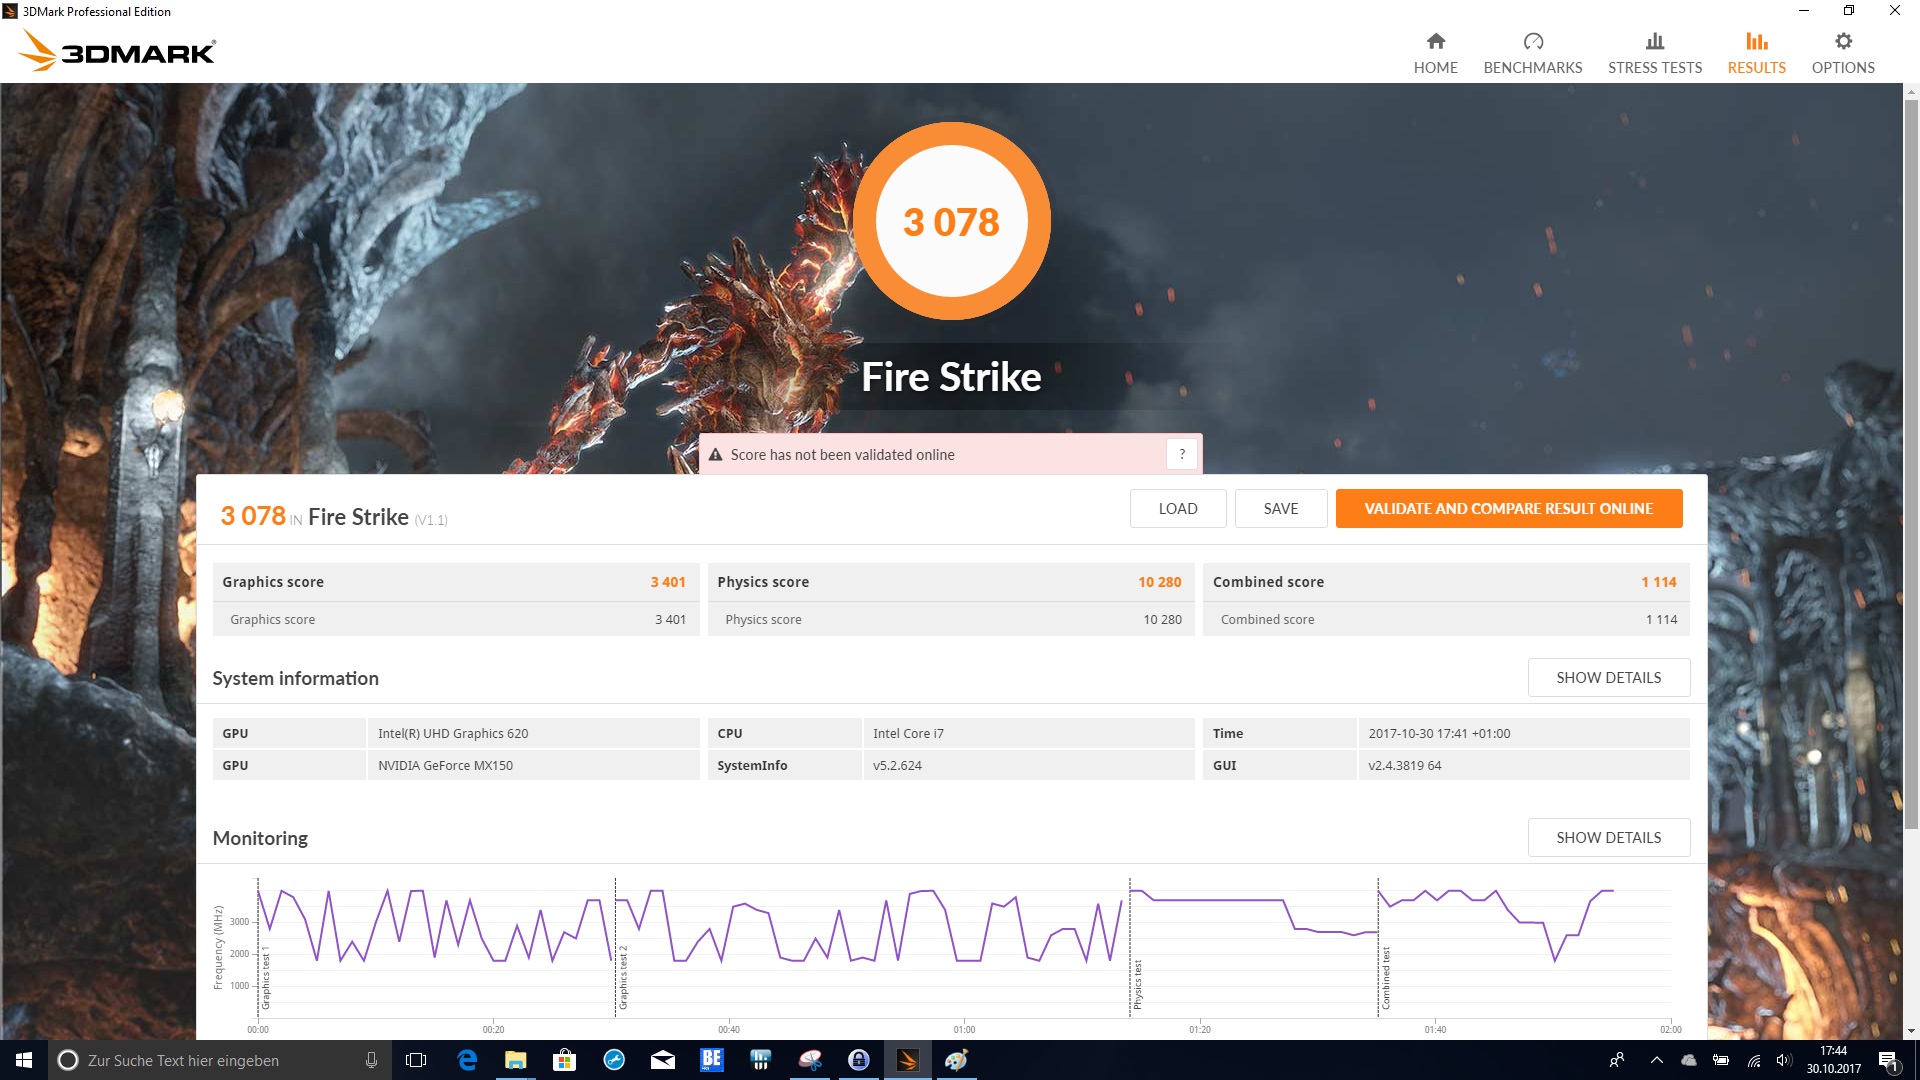
| 3DMark Fire Strike Score | 3078 poäng | |
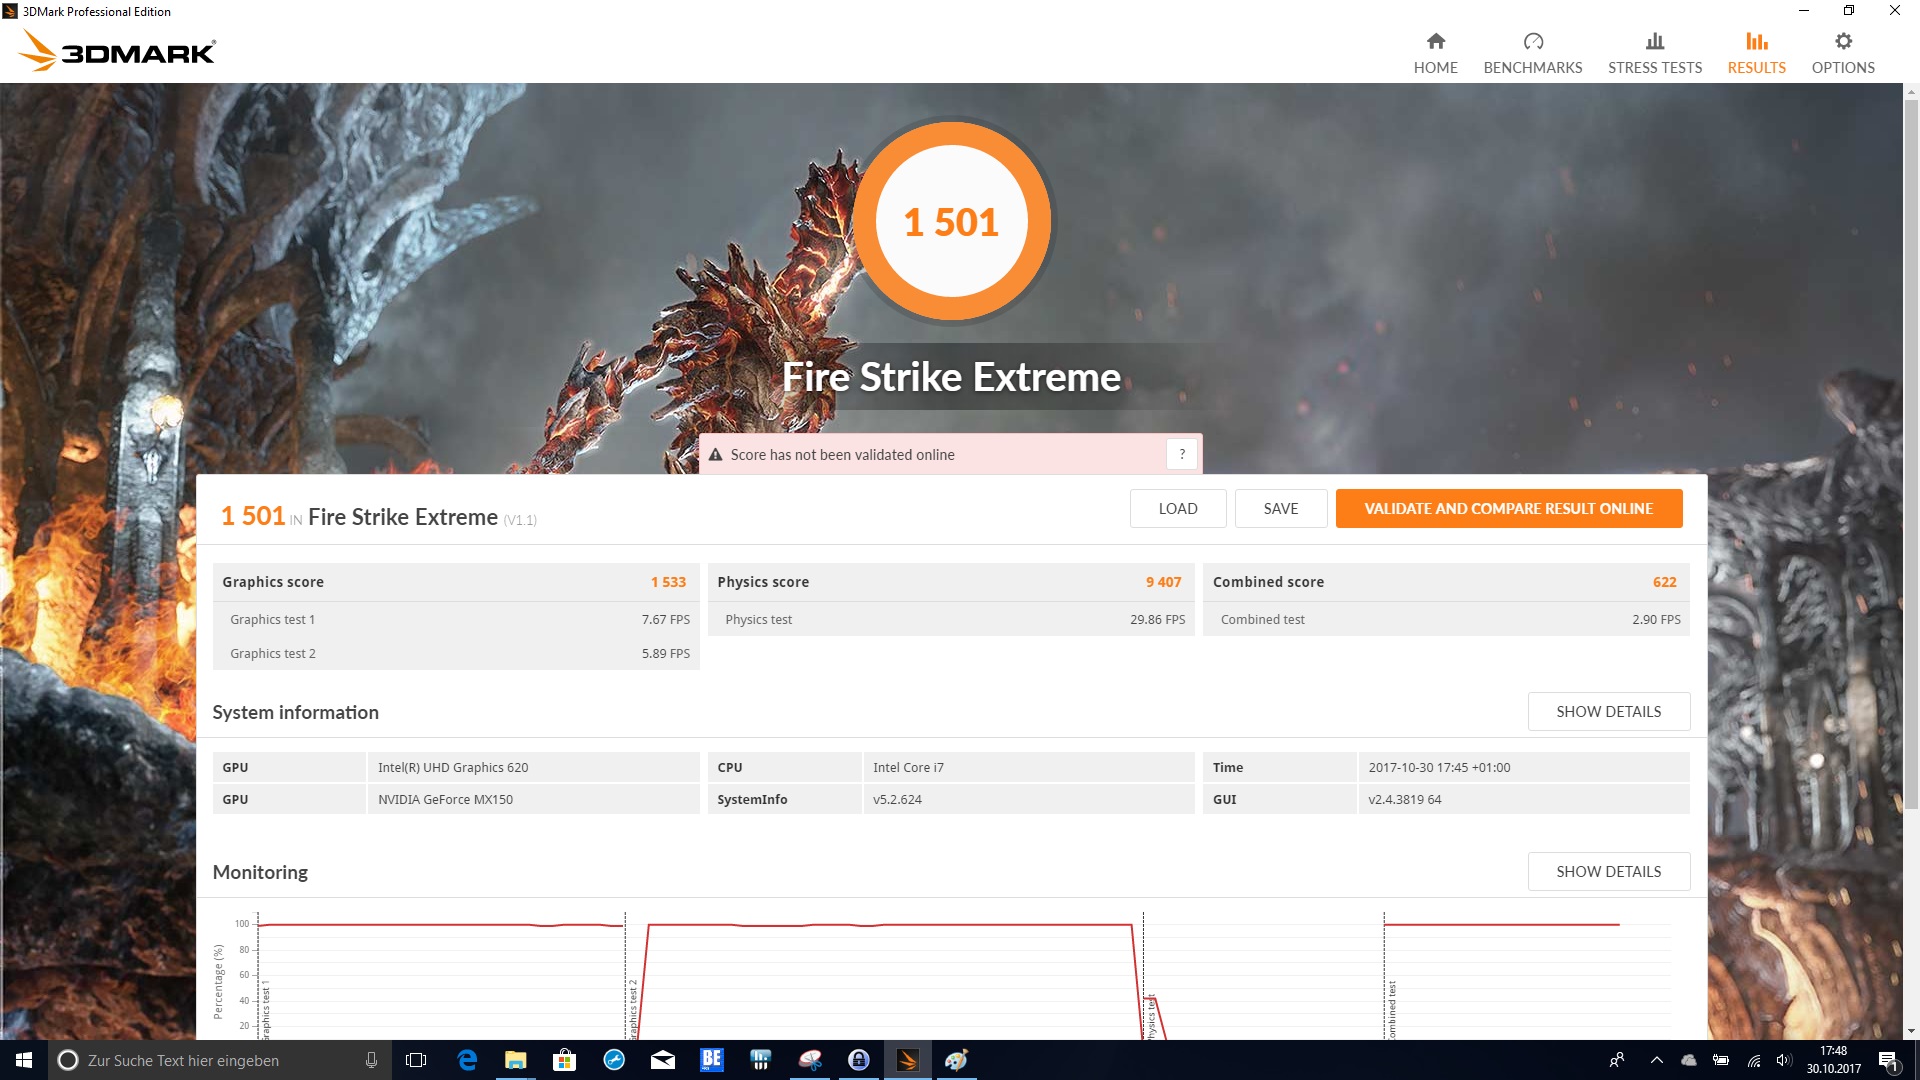
| 3DMark Fire Strike Extreme Score | 1501 poäng | |
Hjälp | ||
| låg | med. | hög | ultra | |
|---|---|---|---|---|
| BioShock Infinite (2013) | 170 | 85.9 | 70.4 | 30.5 |
| Battlefield 4 (2013) | 111.1 | 66.7 | 26 | 17.9 |
| Rise of the Tomb Raider (2016) | 61.1 | 32.4 | 18.4 | 15.2 |
Ljudnivå
| Låg belastning |
| 30.6 / 30.6 / 32.2 dB(A) |
| Hög belastning |
| 40.5 / 39.5 dB(A) |
 | ||
30 dB tyst 40 dB(A) hörbar 50 dB(A) högt ljud |
||
min: | ||
| Dell Inspiron 17-7773-0043 GeForce MX150, i5-8550U, SanDisk X400 M.2 2280 128GB | Dell Inspiron 17 7778 GeForce 940MX, 6500U, Liteonit CV3-CE512 | Acer Aspire 5 A517-51G-80L GeForce MX150, i5-8550U, Micron 1100 MTFDDAV256TBN | Acer Aspire Nitro BE VN7-793G-5811 GeForce GTX 1050 Ti Mobile, i5-7300HQ, Seagate Mobile HDD 1TB ST1000LM035 | HP Omen 17-w206ng GeForce GTX 1050 Ti Mobile, i7-7700HQ, Samsung PM961 MZVLW256HEHP | Acer Aspire 7 A717-71G-72VY GeForce GTX 1060 Mobile, i7-7700HQ, Toshiba MQ01ABD100 | |
|---|---|---|---|---|---|---|
| Noise | -5% | 7% | 3% | -14% | 0% | |
| av / miljö * (dB) | 30.3 | 32.1 -6% | 29.4 3% | 29.7 2% | 30 1% | 30.1 1% |
| Idle Minimum * (dB) | 30.6 | 32.1 -5% | 30.1 2% | 30.2 1% | 34 -11% | 31.4 -3% |
| Idle Average * (dB) | 30.6 | 32.1 -5% | 30.1 2% | 30.2 1% | 35 -14% | 31.4 -3% |
| Idle Maximum * (dB) | 32.2 | 34 -6% | 29.7 8% | 30.6 5% | 36 -12% | 31.7 2% |
| Load Average * (dB) | 40.5 | 40.3 -0% | 34.4 15% | 33.8 17% | 47 -16% | 35.2 13% |
| Load Maximum * (dB) | 39.5 | 42.6 -8% | 34.4 13% | 42.6 -8% | 52 -32% | 43.5 -10% |
| Witcher 3 ultra * (dB) | 39.5 | 48 | 39.9 |
* ... mindre är bättre
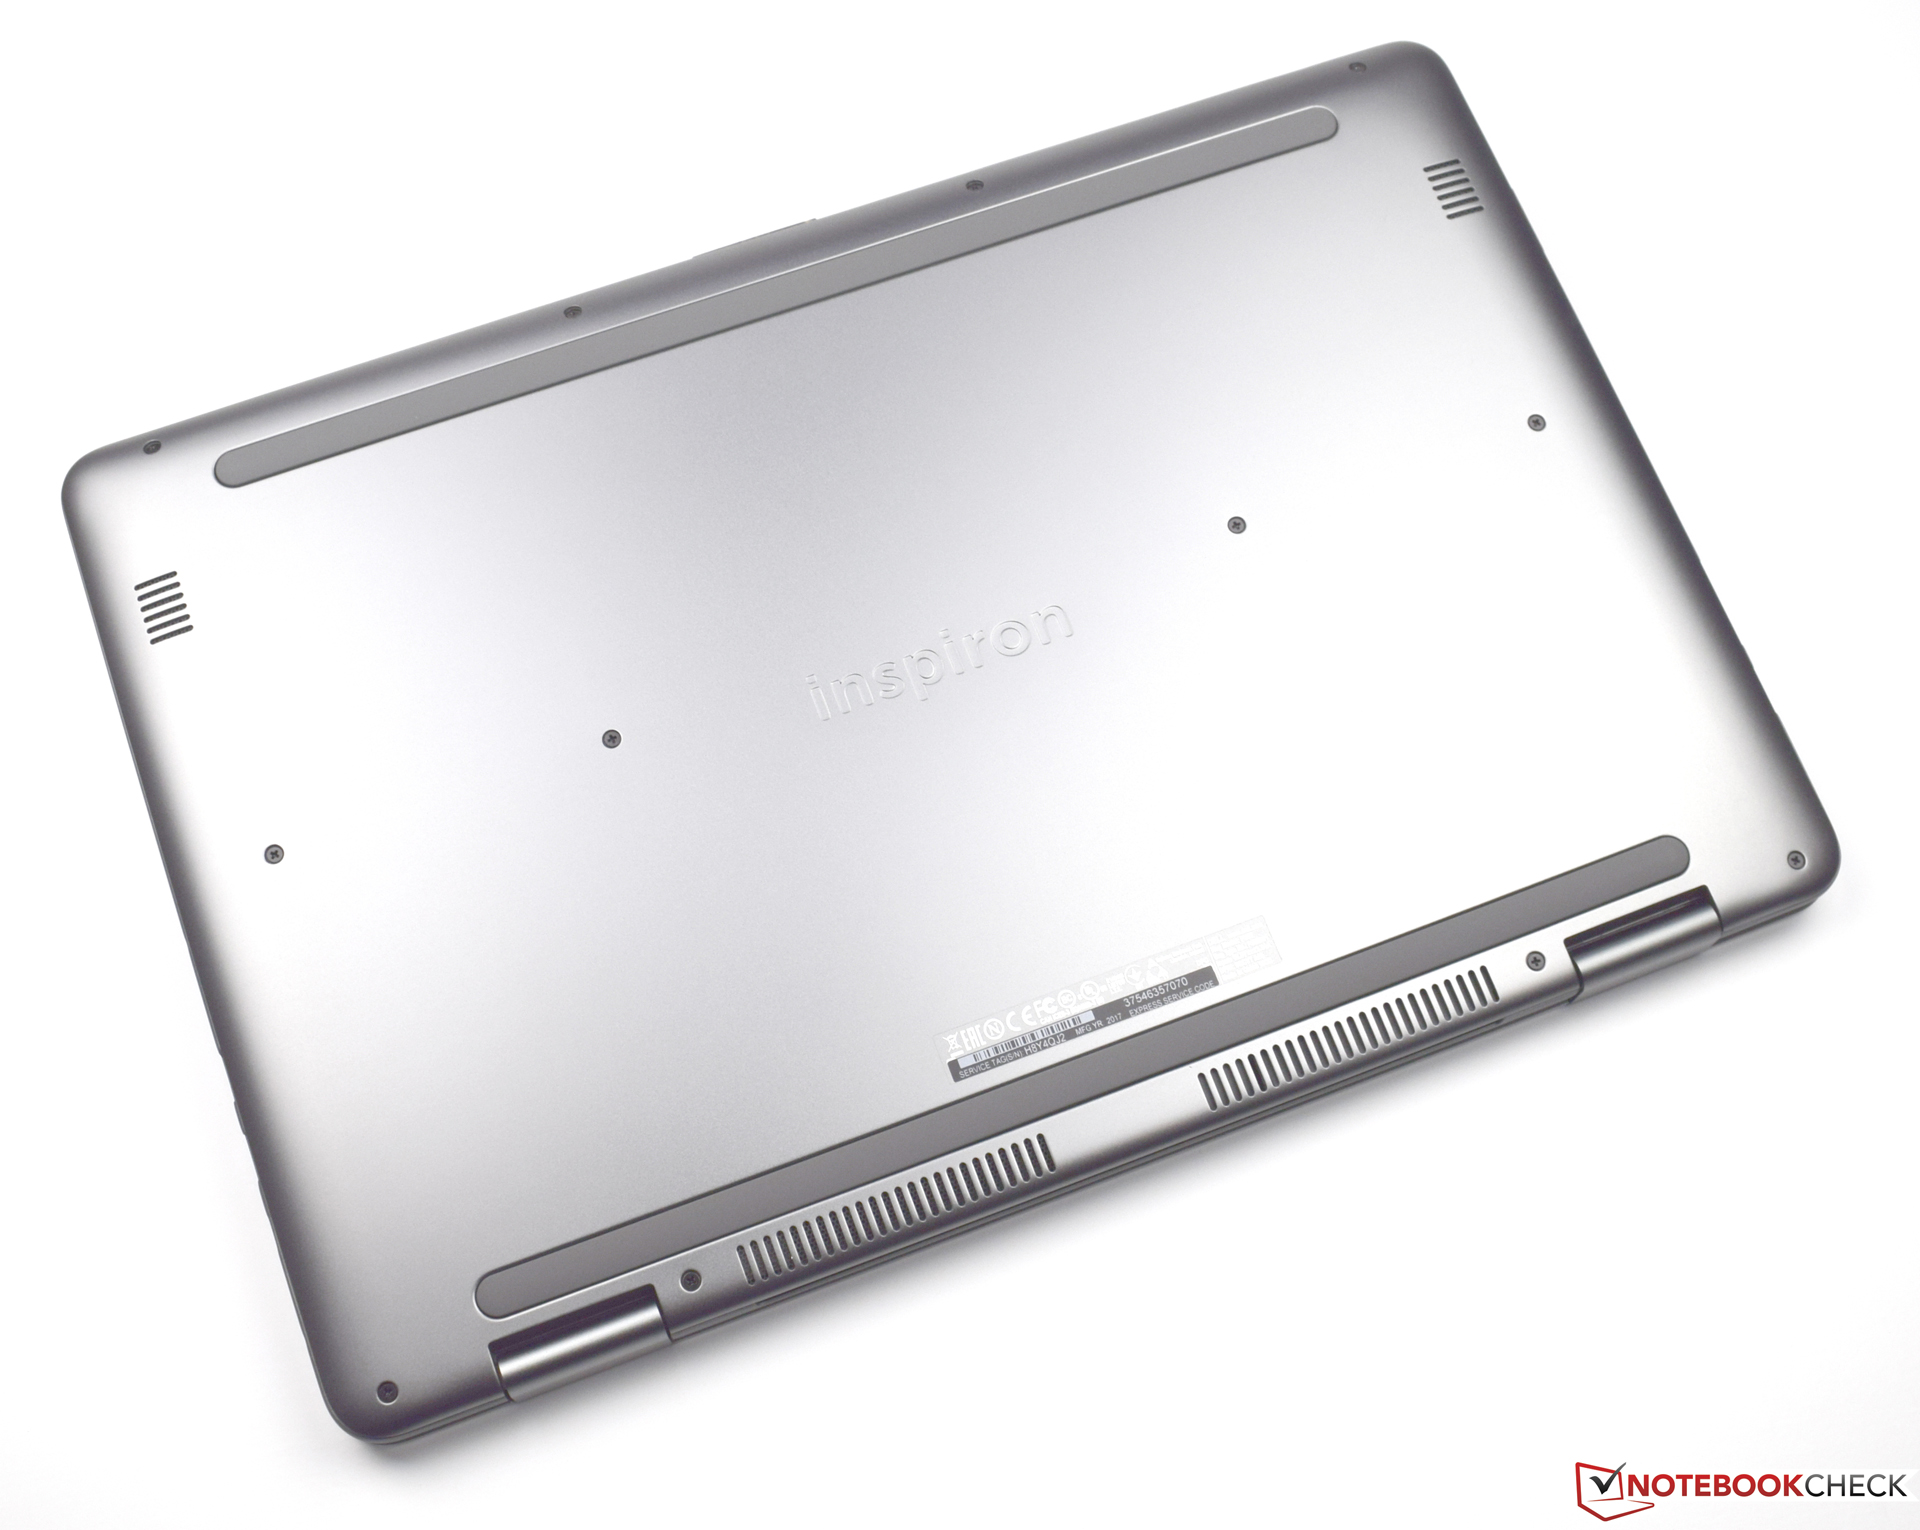
(±) Den maximala temperaturen på ovansidan är 42.7 °C / 109 F, jämfört med genomsnittet av 36.8 °C / 98 F , allt från 21 till 71 °C för klassen Multimedia.
(-) Botten värms upp till maximalt 47.2 °C / 117 F, jämfört med genomsnittet av 39.1 °C / 102 F
(+) Vid tomgångsbruk är medeltemperaturen för ovansidan 27.3 °C / 81 F, jämfört med enhetsgenomsnittet på 31.3 °C / ### class_avg_f### F.
(+) Handledsstöden och pekplattan är kallare än hudtemperaturen med maximalt 29.2 °C / 84.6 F och är därför svala att ta på.
(±) Medeltemperaturen för handledsstödsområdet på liknande enheter var 28.7 °C / 83.7 F (-0.5 °C / -0.9 F).
| Dell Inspiron 17-7773-0043 GeForce MX150, i5-8550U, SanDisk X400 M.2 2280 128GB | Dell Inspiron 17 7778 GeForce 940MX, 6500U, Liteonit CV3-CE512 | Acer Aspire 5 A517-51G-80L GeForce MX150, i5-8550U, Micron 1100 MTFDDAV256TBN | Acer Aspire Nitro BE VN7-793G-5811 GeForce GTX 1050 Ti Mobile, i5-7300HQ, Seagate Mobile HDD 1TB ST1000LM035 | HP Omen 17-w206ng GeForce GTX 1050 Ti Mobile, i7-7700HQ, Samsung PM961 MZVLW256HEHP | Acer Aspire 7 A717-71G-72VY GeForce GTX 1060 Mobile, i7-7700HQ, Toshiba MQ01ABD100 | |
|---|---|---|---|---|---|---|
| Heat | -4% | 14% | -1% | -14% | -7% | |
| Maximum Upper Side * (°C) | 42.7 | 44.7 -5% | 40.4 5% | 48 -12% | 55.6 -30% | 48 -12% |
| Maximum Bottom * (°C) | 47.2 | 45.5 4% | 37 22% | 40.8 14% | 57.7 -22% | 46.6 1% |
| Idle Upper Side * (°C) | 28.4 | 31 -9% | 25.3 11% | 29.9 -5% | 32.2 -13% | 31.1 -10% |
| Idle Bottom * (°C) | 29.7 | 31.4 -6% | 24.7 17% | 29.8 -0% | 27.2 8% | 31.7 -7% |
* ... mindre är bättre
Dell Inspiron 17-7773-0043 ljudanalys
(-) | inte särskilt höga högtalare (67.2 dB)
Bas 100 - 315 Hz
(±) | reducerad bas - i genomsnitt 14.8% lägre än medianen
(±) | linjäriteten för basen är genomsnittlig (12.9% delta till föregående frekvens)
Mellan 400 - 2000 Hz
(+) | balanserad mellan - endast 4.1% från medianen
(+) | mids är linjära (6.4% delta till föregående frekvens)
Högsta 2 - 16 kHz
(+) | balanserade toppar - endast 3.3% från medianen
(±) | linjäriteten för toppar är genomsnittlig (8.7% delta till föregående frekvens)
Totalt 100 - 16 000 Hz
(±) | linjäriteten för det totala ljudet är genomsnittlig (18.5% skillnad mot median)
Jämfört med samma klass
» 57% av alla testade enheter i den här klassen var bättre, 7% liknande, 36% sämre
» Den bästa hade ett delta på 5%, genomsnittet var 17%, sämst var 45%
Jämfört med alla testade enheter
» 42% av alla testade enheter var bättre, 8% liknande, 51% sämre
» Den bästa hade ett delta på 4%, genomsnittet var 23%, sämst var 134%
Acer Aspire 5 A517-51G-80L ljudanalys
(-) | inte särskilt höga högtalare (71.9 dB)
Bas 100 - 315 Hz
(-) | nästan ingen bas - i genomsnitt 15.8% lägre än medianen
(+) | basen är linjär (5% delta till föregående frekvens)
Mellan 400 - 2000 Hz
(+) | balanserad mellan - endast 3.5% från medianen
(±) | linjäriteten för mids är genomsnittlig (7.6% delta till föregående frekvens)
Högsta 2 - 16 kHz
(+) | balanserade toppar - endast 3.6% från medianen
(+) | toppar är linjära (6.9% delta till föregående frekvens)
Totalt 100 - 16 000 Hz
(±) | linjäriteten för det totala ljudet är genomsnittlig (16.3% skillnad mot median)
Jämfört med samma klass
» 41% av alla testade enheter i den här klassen var bättre, 8% liknande, 51% sämre
» Den bästa hade ett delta på 5%, genomsnittet var 17%, sämst var 45%
Jämfört med alla testade enheter
» 27% av alla testade enheter var bättre, 6% liknande, 68% sämre
» Den bästa hade ett delta på 4%, genomsnittet var 23%, sämst var 134%
| Av/Standby | |
| Låg belastning | |
| Hög belastning |
|
Förklaring:
min: | |
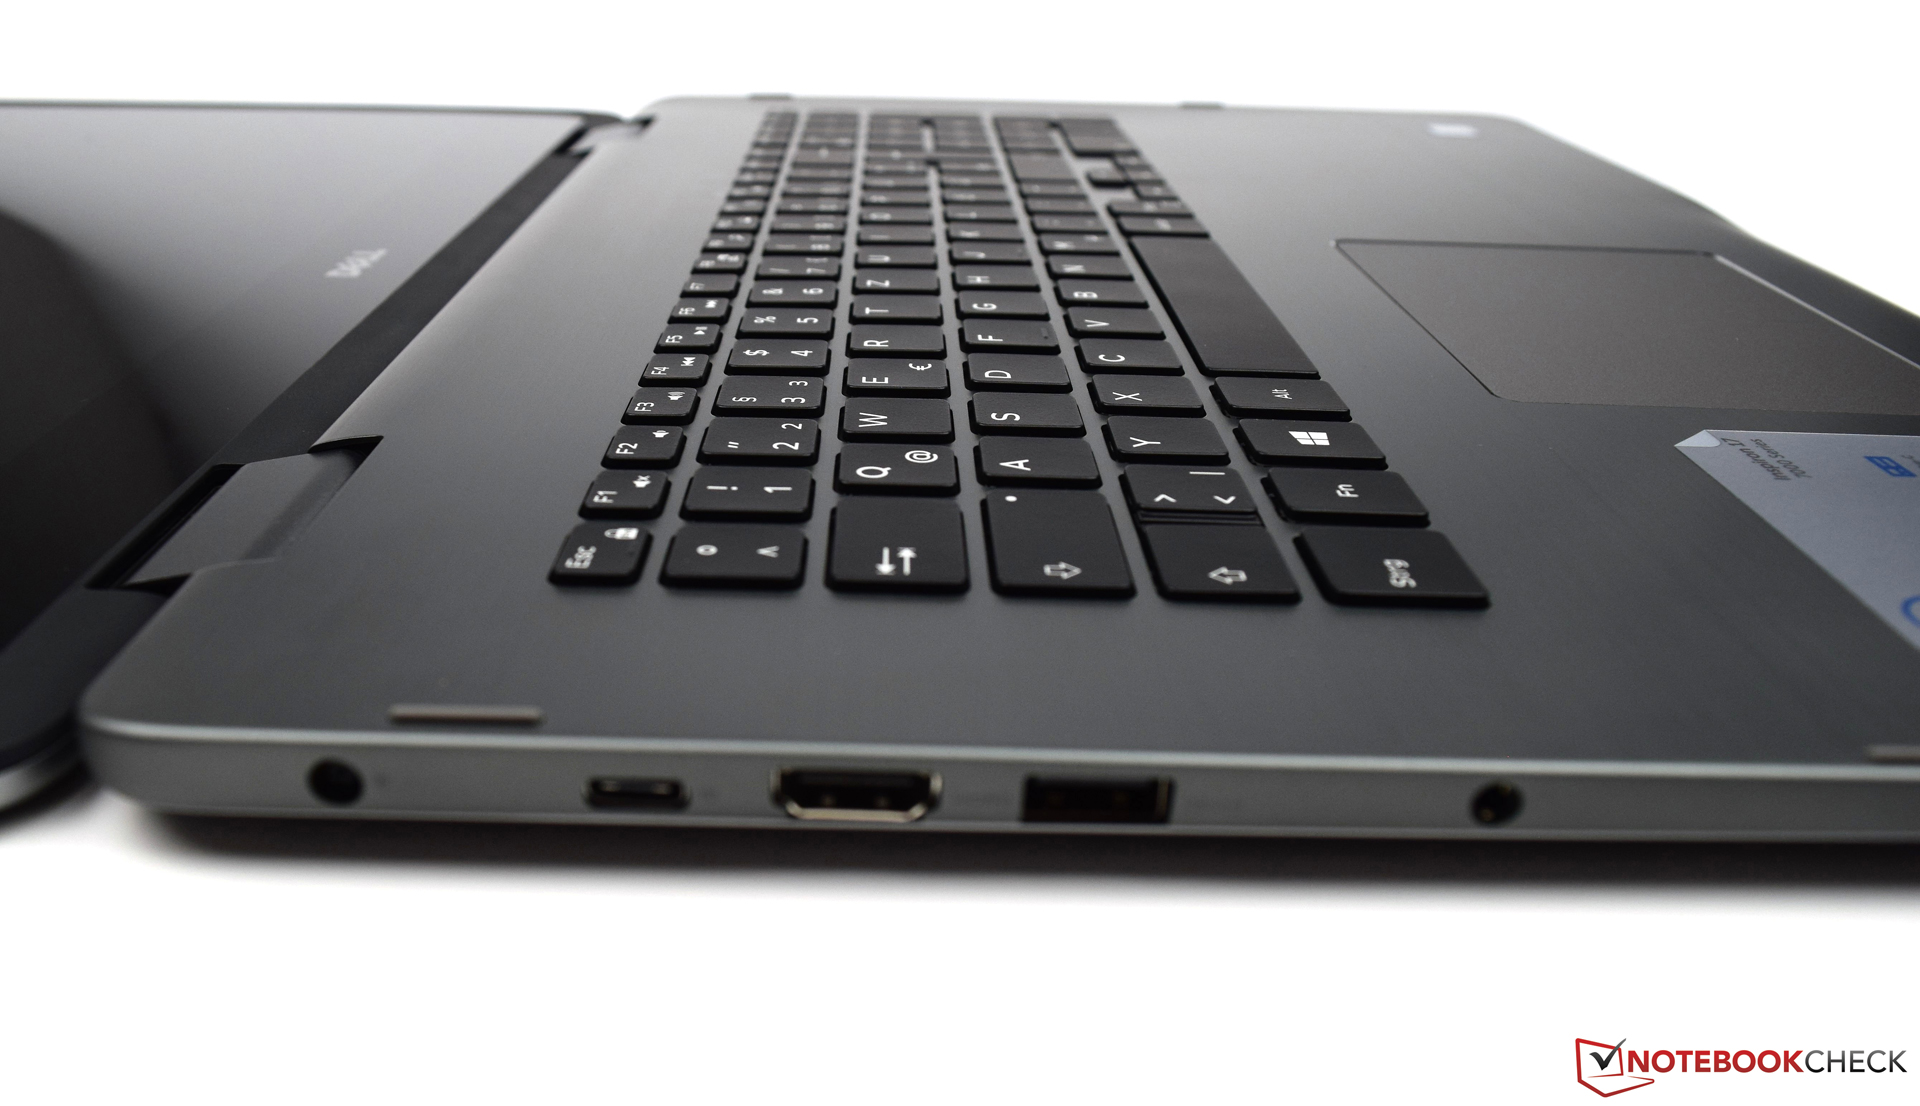
| Dell Inspiron 17-7773-0043 i5-8550U, GeForce MX150, SanDisk X400 M.2 2280 128GB, IPS, 1920x1080, 17.3" | Dell Inspiron 17 7778 6500U, GeForce 940MX, Liteonit CV3-CE512, IPS, 1920x1080, 17.3" | Acer Aspire 5 A517-51G-80L i5-8550U, GeForce MX150, Micron 1100 MTFDDAV256TBN, aSi TFT, IPS, 1920x1080, 17.3" | Acer Aspire Nitro BE VN7-793G-5811 i5-7300HQ, GeForce GTX 1050 Ti Mobile, Seagate Mobile HDD 1TB ST1000LM035, IPS, 1920x1080, 17.3" | HP Omen 17-w206ng i7-7700HQ, GeForce GTX 1050 Ti Mobile, Samsung PM961 MZVLW256HEHP, IPS, 1920x1080, 17.3" | Acer Aspire 7 A717-71G-72VY i7-7700HQ, GeForce GTX 1060 Mobile, Toshiba MQ01ABD100, IPS, 1920x1080, 17.3" | |
|---|---|---|---|---|---|---|
| Power Consumption | 8% | 10% | -47% | -88% | -47% | |
| Idle Minimum * (Watt) | 5.5 | 5.6 -2% | 4.1 25% | 8.7 -58% | 11 -100% | 7 -27% |
| Idle Average * (Watt) | 11.6 | 11.2 3% | 9.3 20% | 12.4 -7% | 18 -55% | 12.3 -6% |
| Idle Maximum * (Watt) | 12.4 | 11.9 4% | 9.8 21% | 15.4 -24% | 24 -94% | 14.2 -15% |
| Load Average * (Watt) | 65 | 46 29% | 64 2% | 73 -12% | 84 -29% | 72.6 -12% |
| Load Maximum * (Watt) | 56 | 53 5% | 66.4 -19% | 130 -132% | 146 -161% | 153 -173% |
| Witcher 3 ultra * (Watt) | 98 | 101 | 125 |
* ... mindre är bättre

| Dell Inspiron 17-7773-0043 i5-8550U, GeForce MX150, 56 Wh | Dell Inspiron 17 7778 6500U, GeForce 940MX, 56 Wh | Acer Aspire 5 A517-51G-80L i5-8550U, GeForce MX150, 48 Wh | Acer Aspire Nitro BE VN7-793G-5811 i5-7300HQ, GeForce GTX 1050 Ti Mobile, 52.5 Wh | HP Omen 17-w206ng i7-7700HQ, GeForce GTX 1050 Ti Mobile, 62 Wh | Acer Aspire 7 A717-71G-72VY i7-7700HQ, GeForce GTX 1060 Mobile, 48 Wh | |
|---|---|---|---|---|---|---|
| Batteridrifttid | 1% | -21% | -32% | -12% | -30% | |
| Reader / Idle (h) | 14.7 | 13.5 -8% | 9.3 -37% | 13.3 -10% | 9.2 -37% | |
| H.264 (h) | 6.2 | 5.4 -13% | 4.7 -24% | |||
| WiFi v1.3 (h) | 6.8 | 8.3 22% | 6.3 -7% | 4.6 -32% | 6.3 -7% | 5.6 -18% |
| Load (h) | 2 | 1.8 -10% | 1.5 -25% | 1.6 -20% | 1.2 -40% |
För
Emot

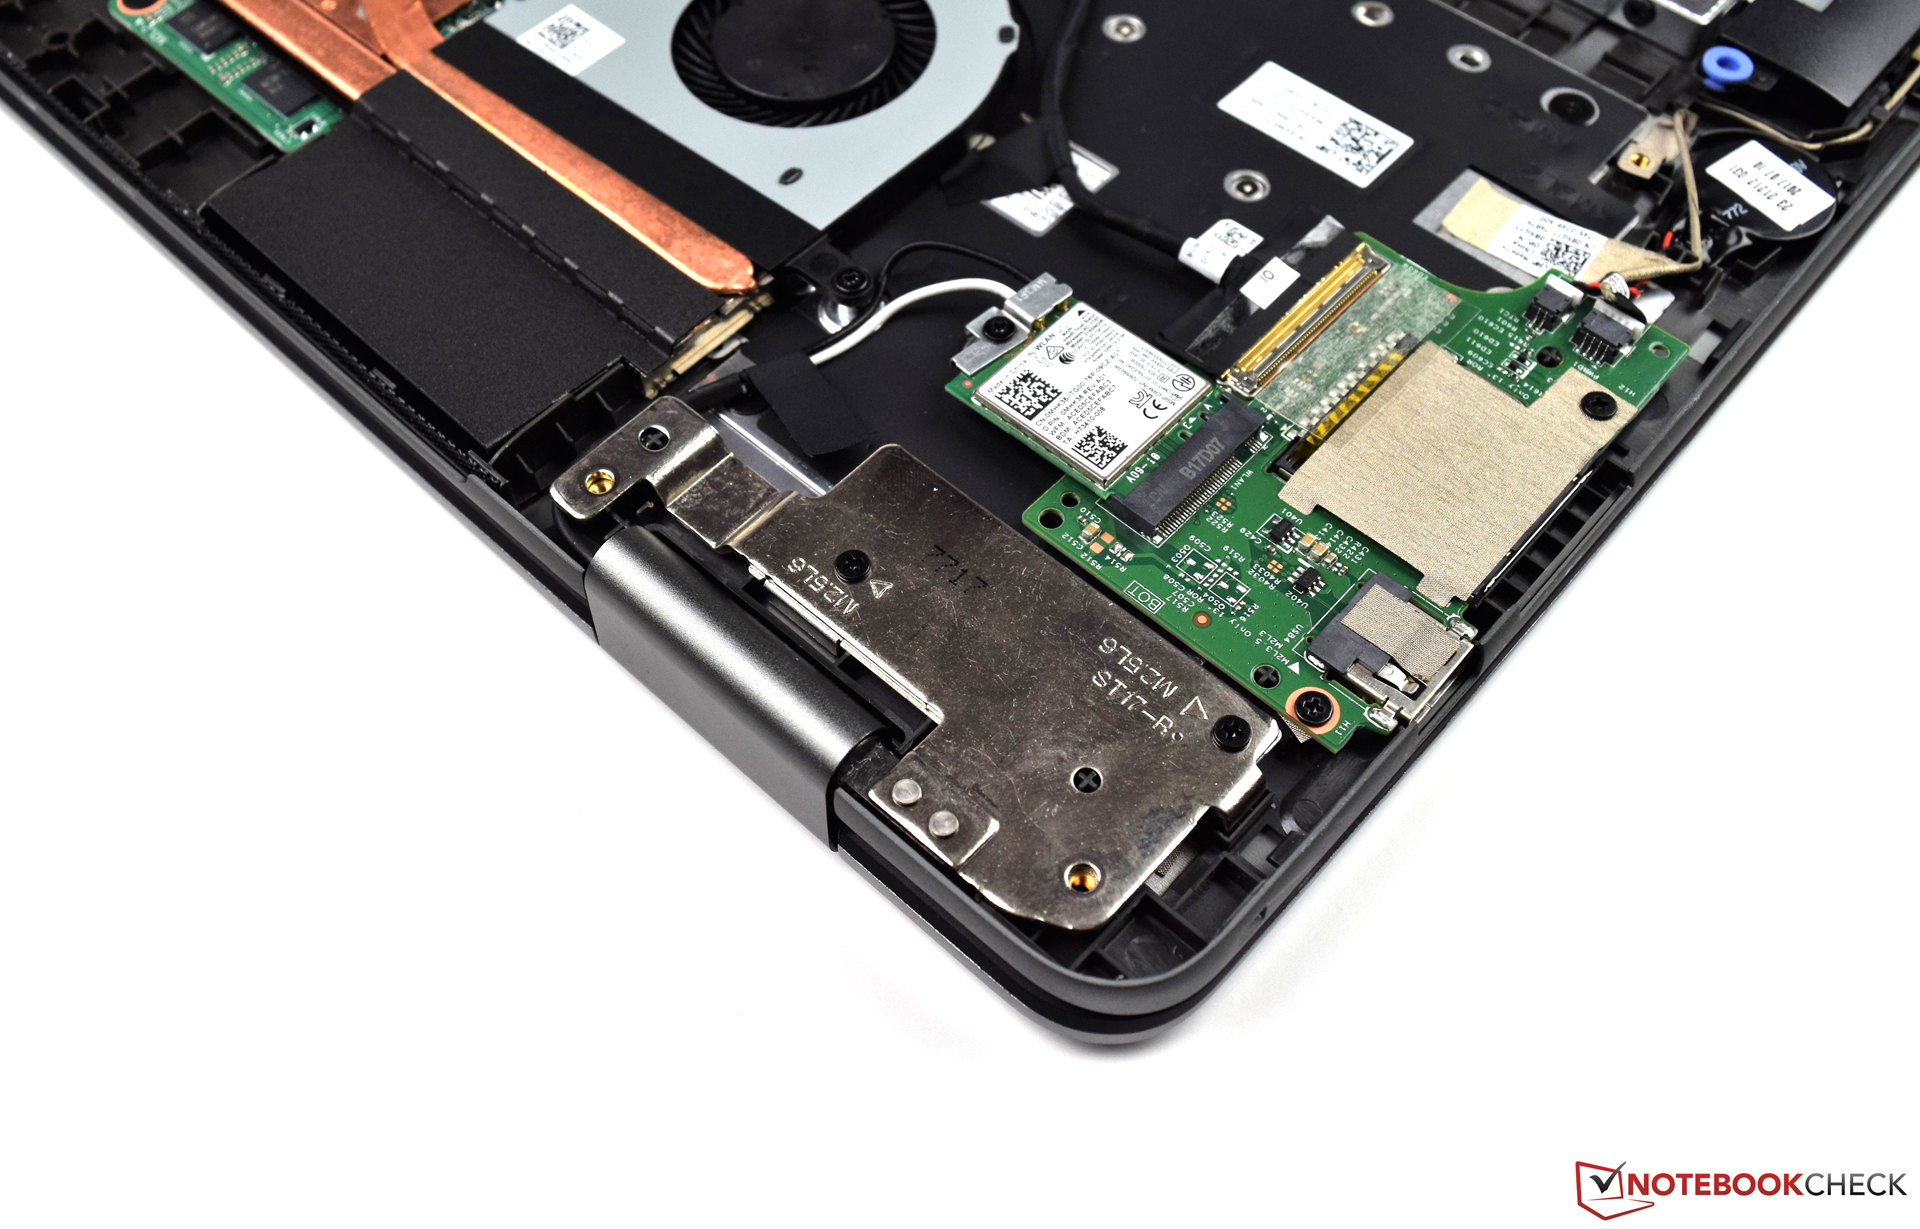
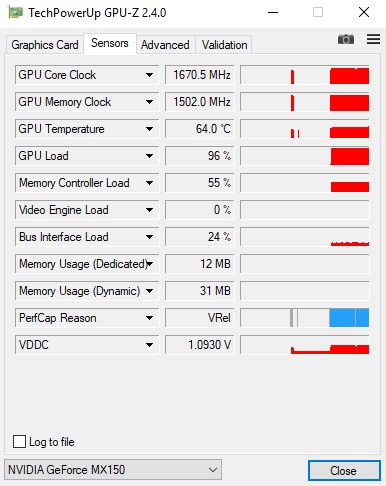
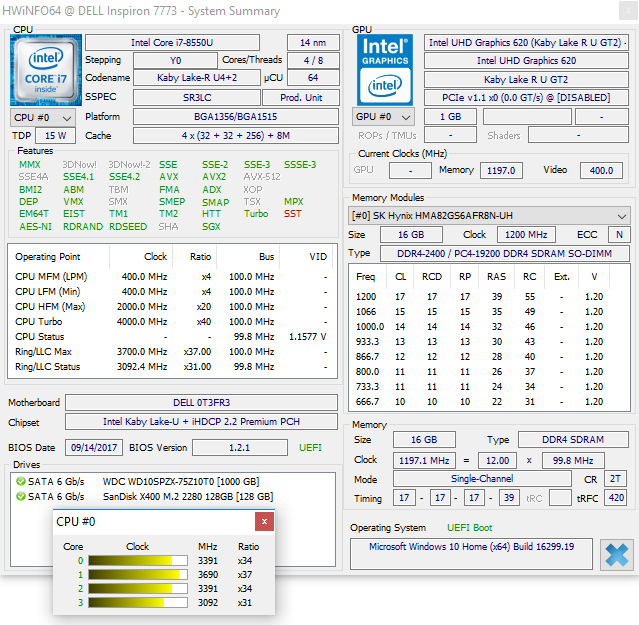
Det får erkännas att Dell Inspiron 17 7773 inte har mycket konkurrens utöver sin direkta föregångare. I vårt test övertygar denna sällsynta omvandlingsbara 17-tums modell med väldigt bra prestanda. Intel Core i7-8550U ger en perfekt bas för krävande program. Väl tilltagna 16 GB DDR4-RAM spelar också en viktig roll, precis som den förnuftiga lagringskombinationen av både Solid State-disk och konventionell hårddisk. Dell Inspiron 17 7773 är listad i vår onlinebutik för ca 12 000 SEK (1199 Euro). Något som särskilt är värt beröm är inkluderingen av ett Nvidia GeForce MX150, svilket utökar dom möjliga användningsområdena.
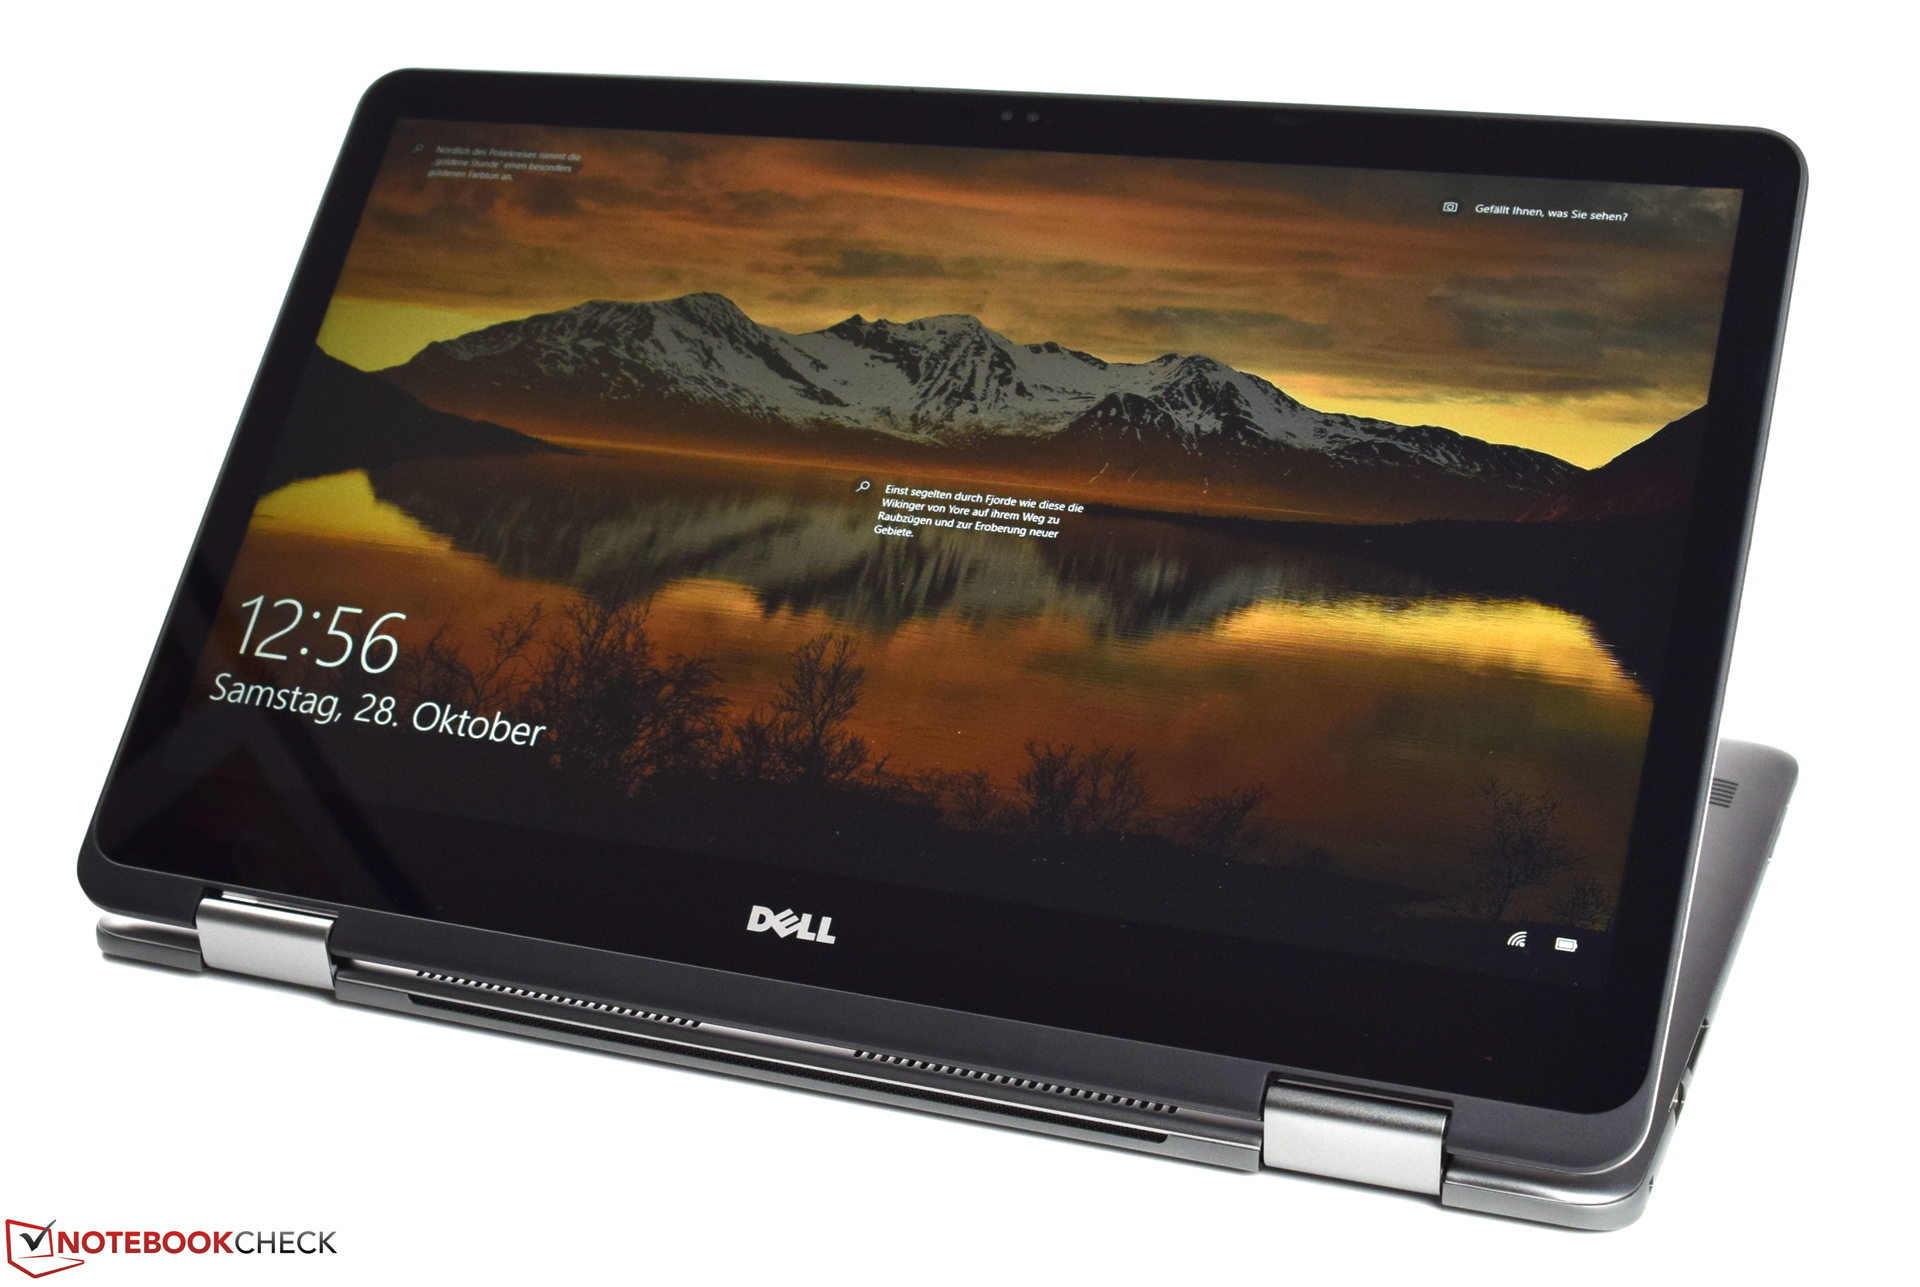
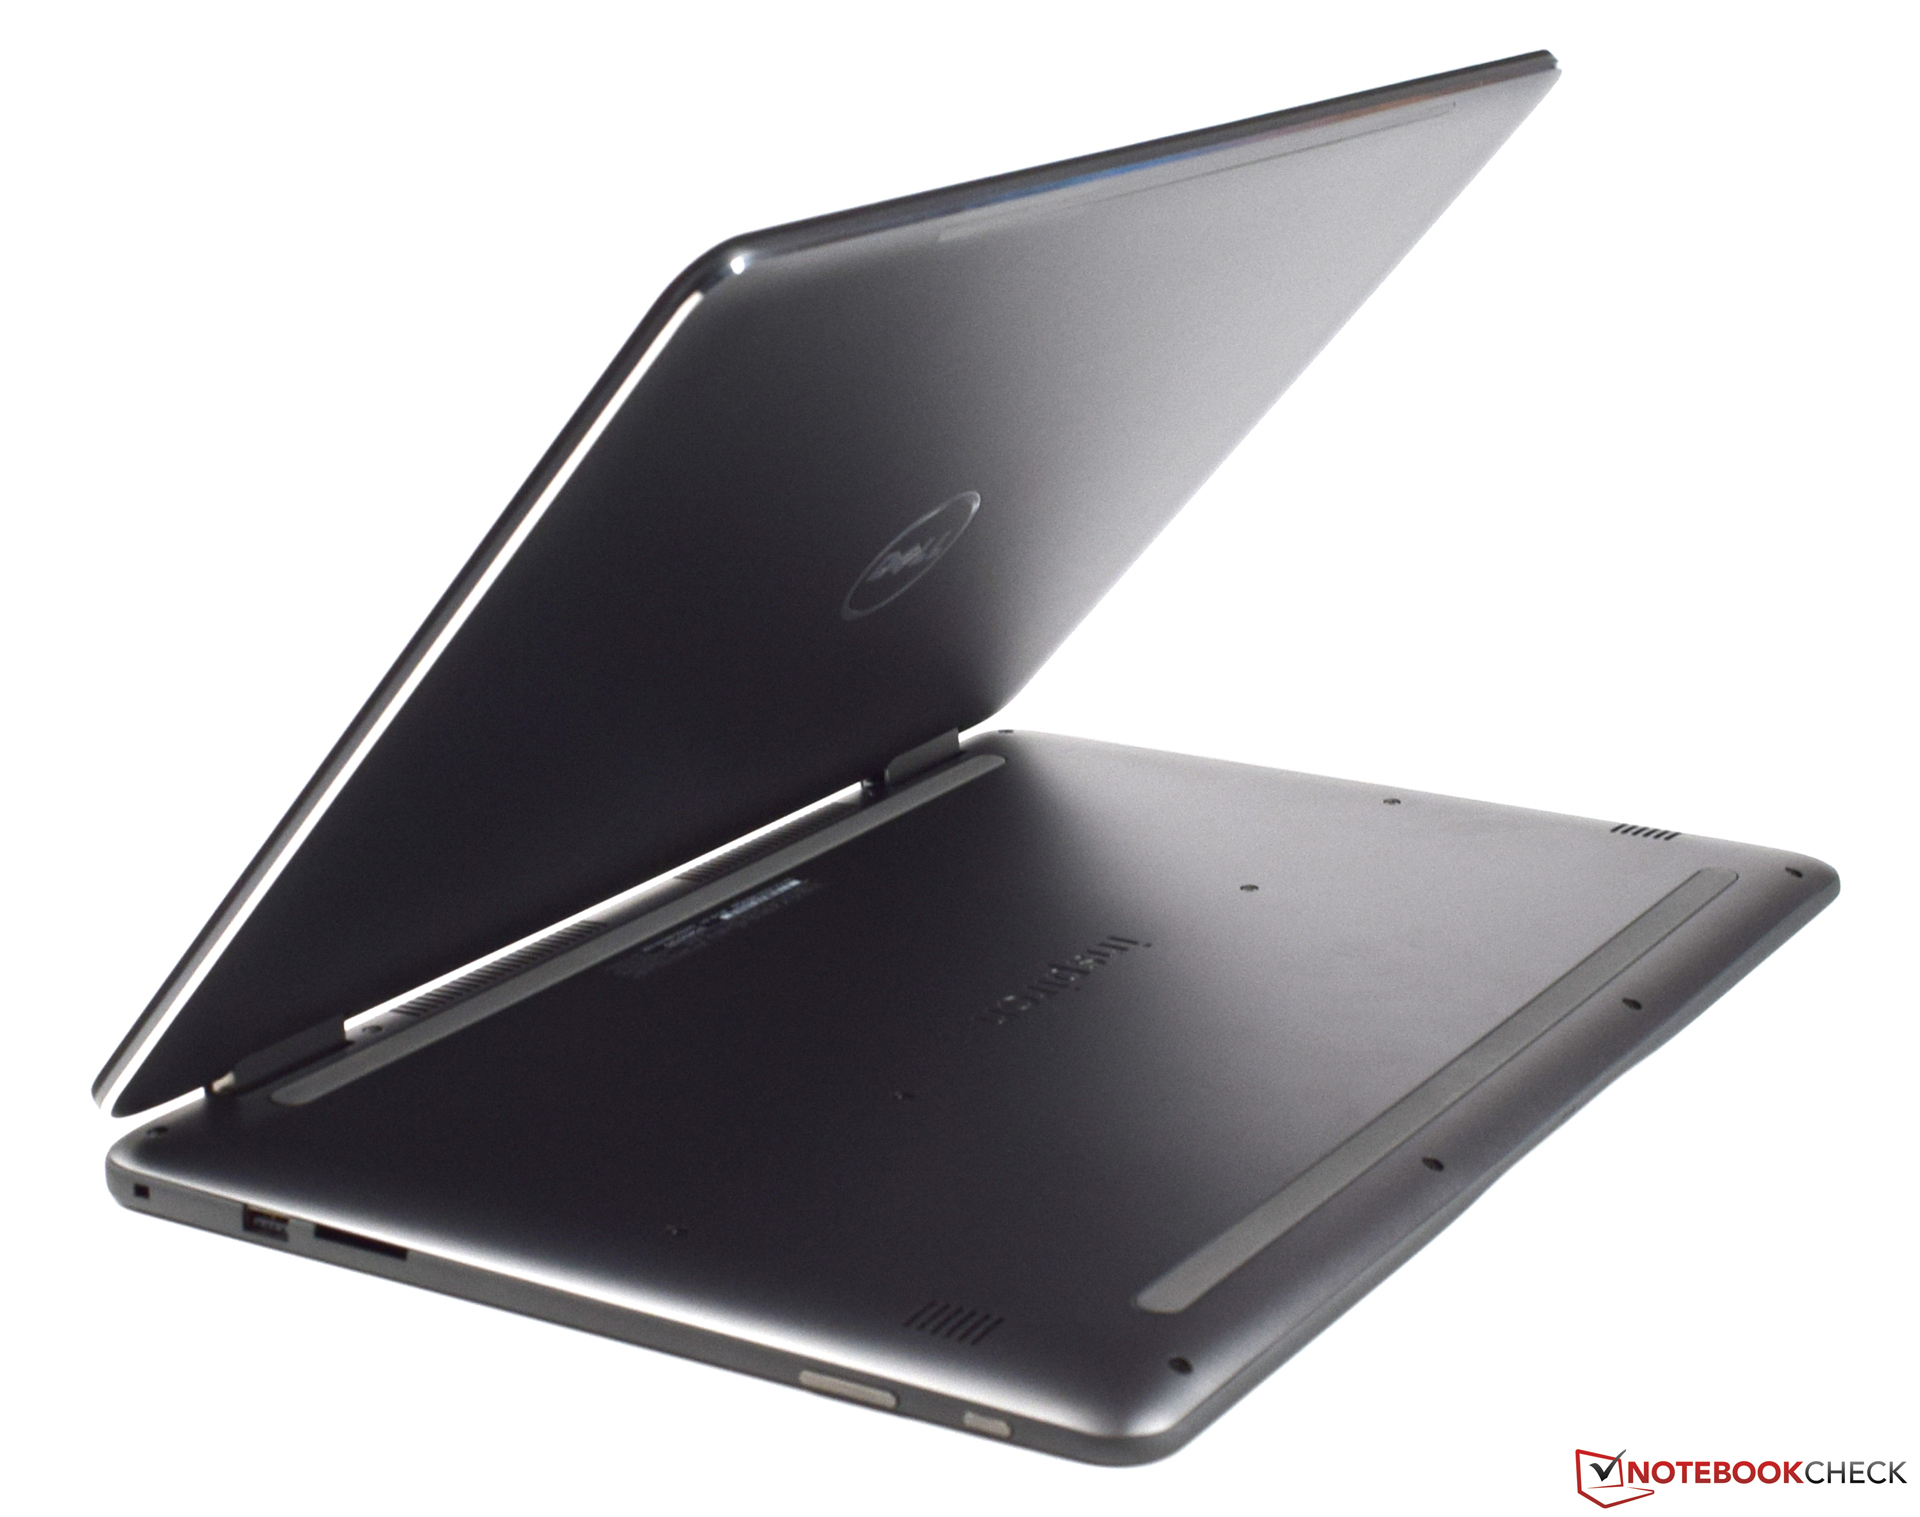
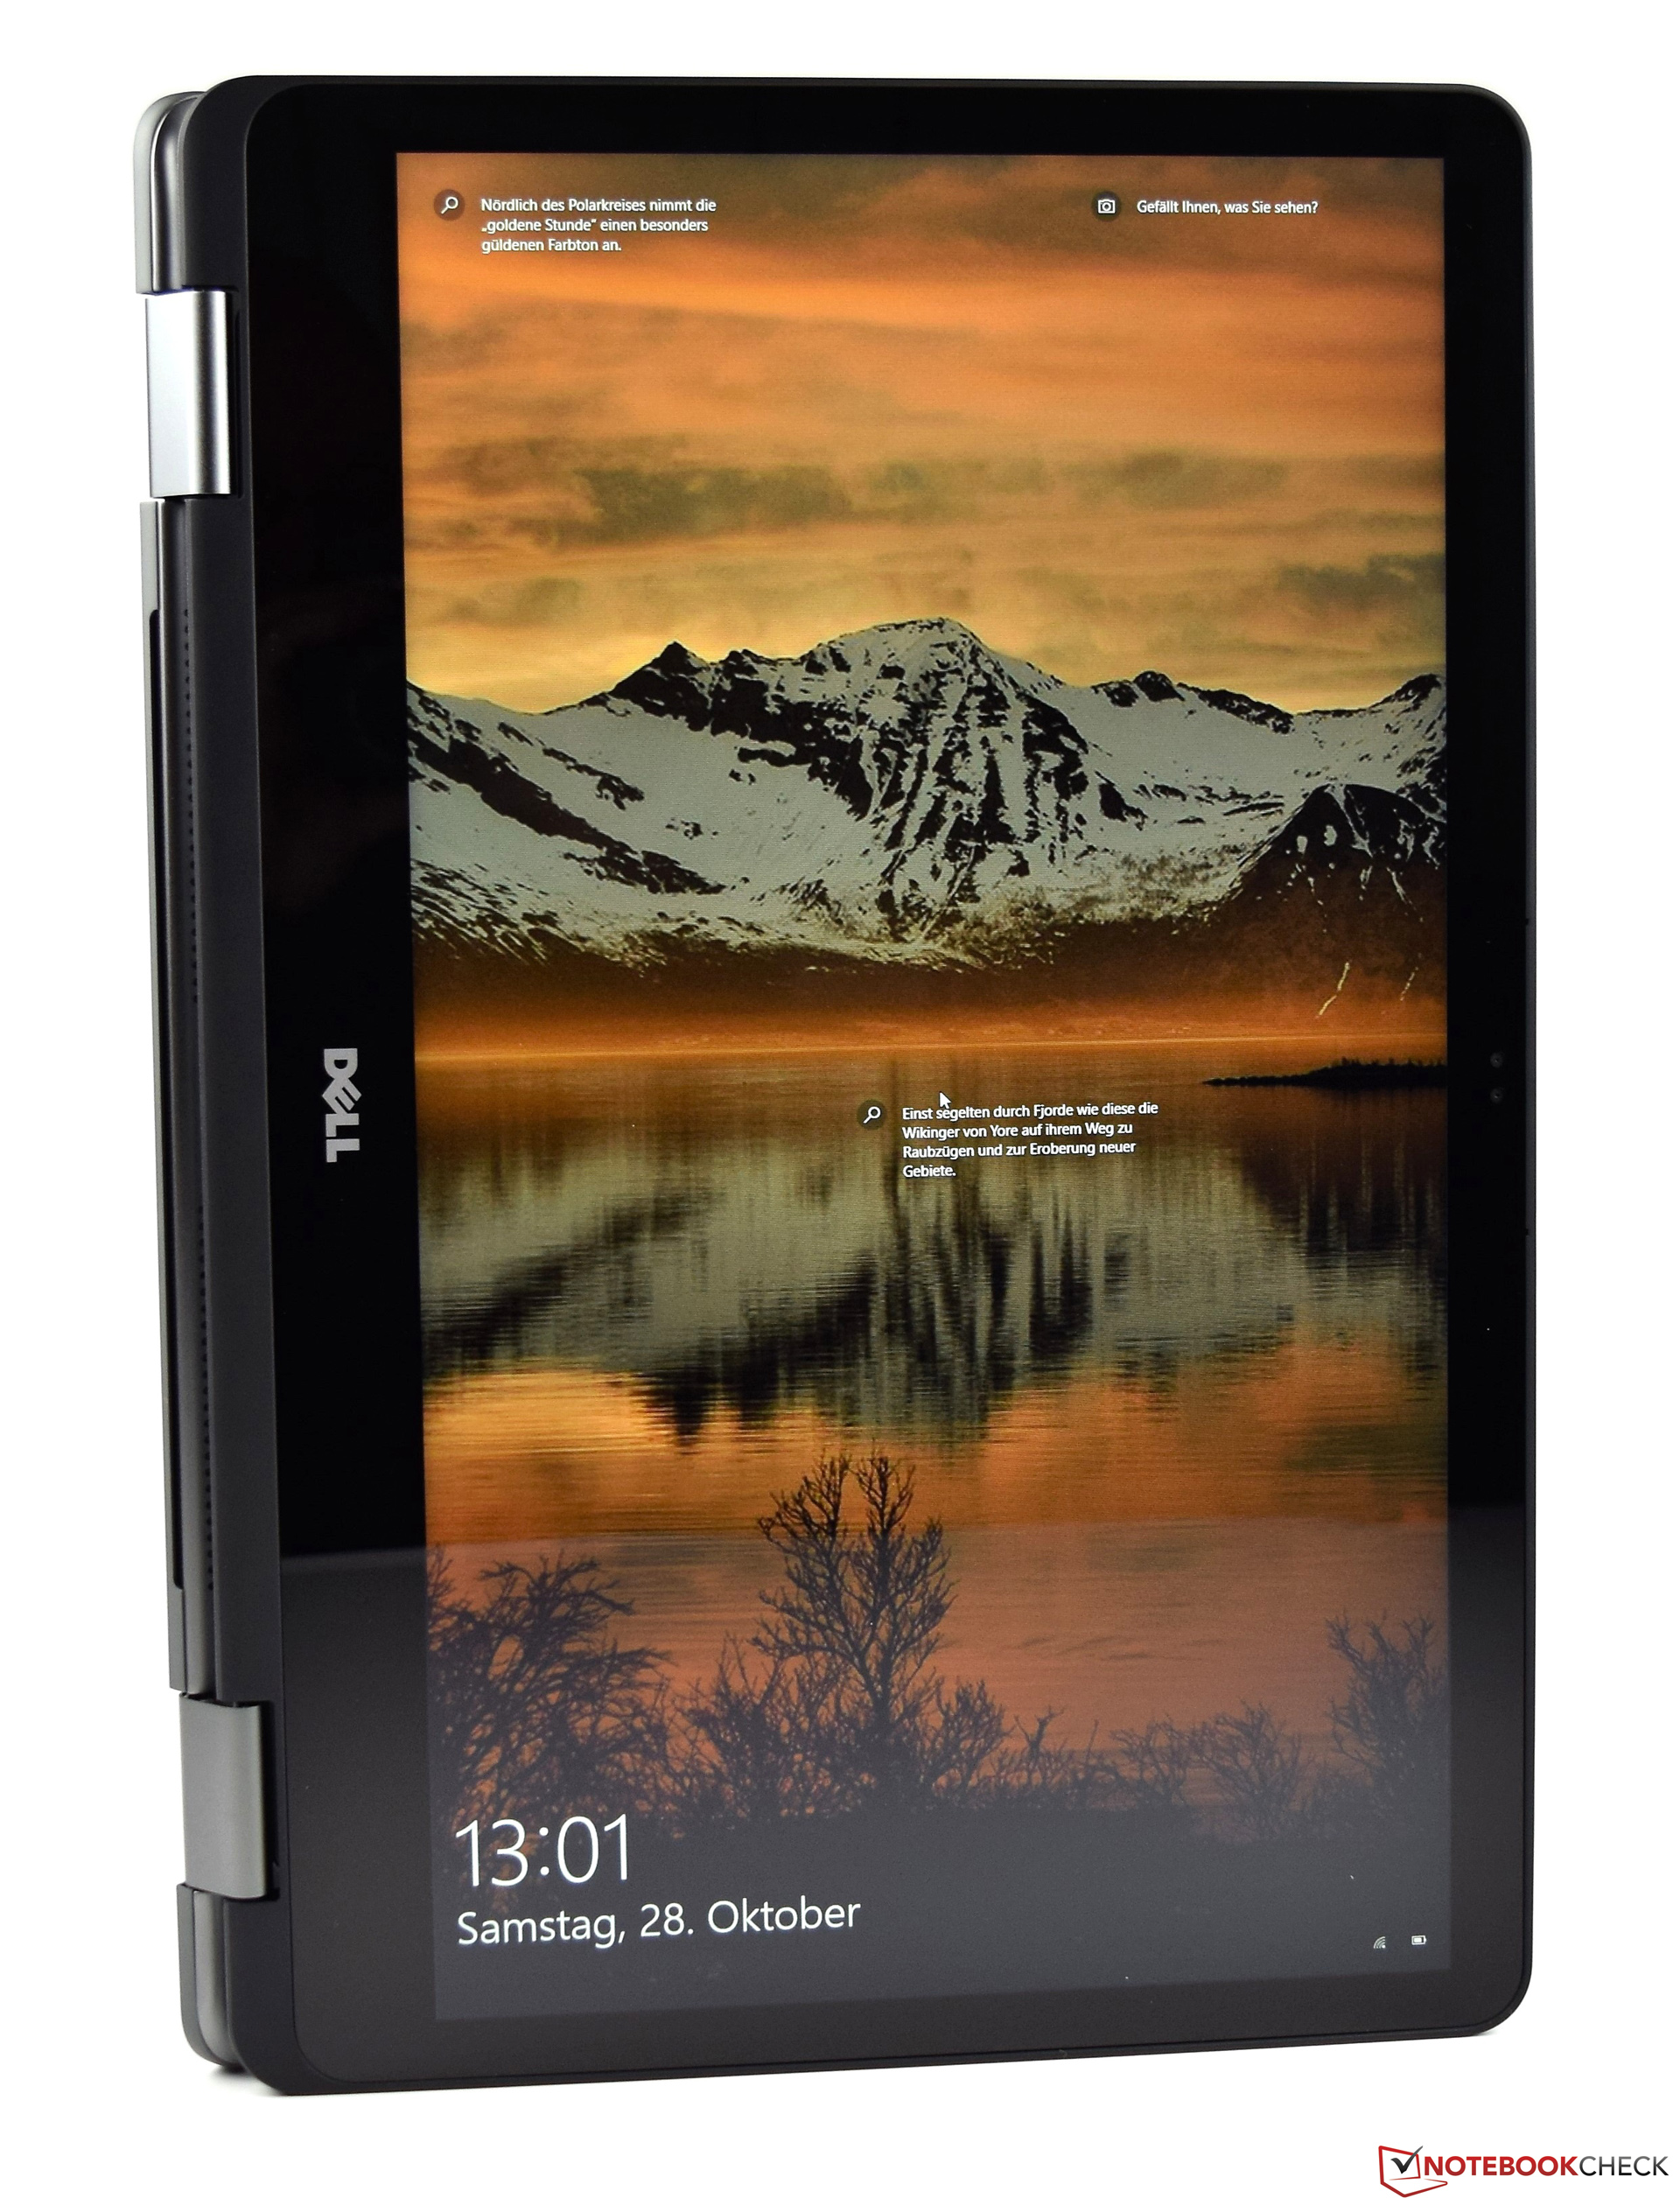
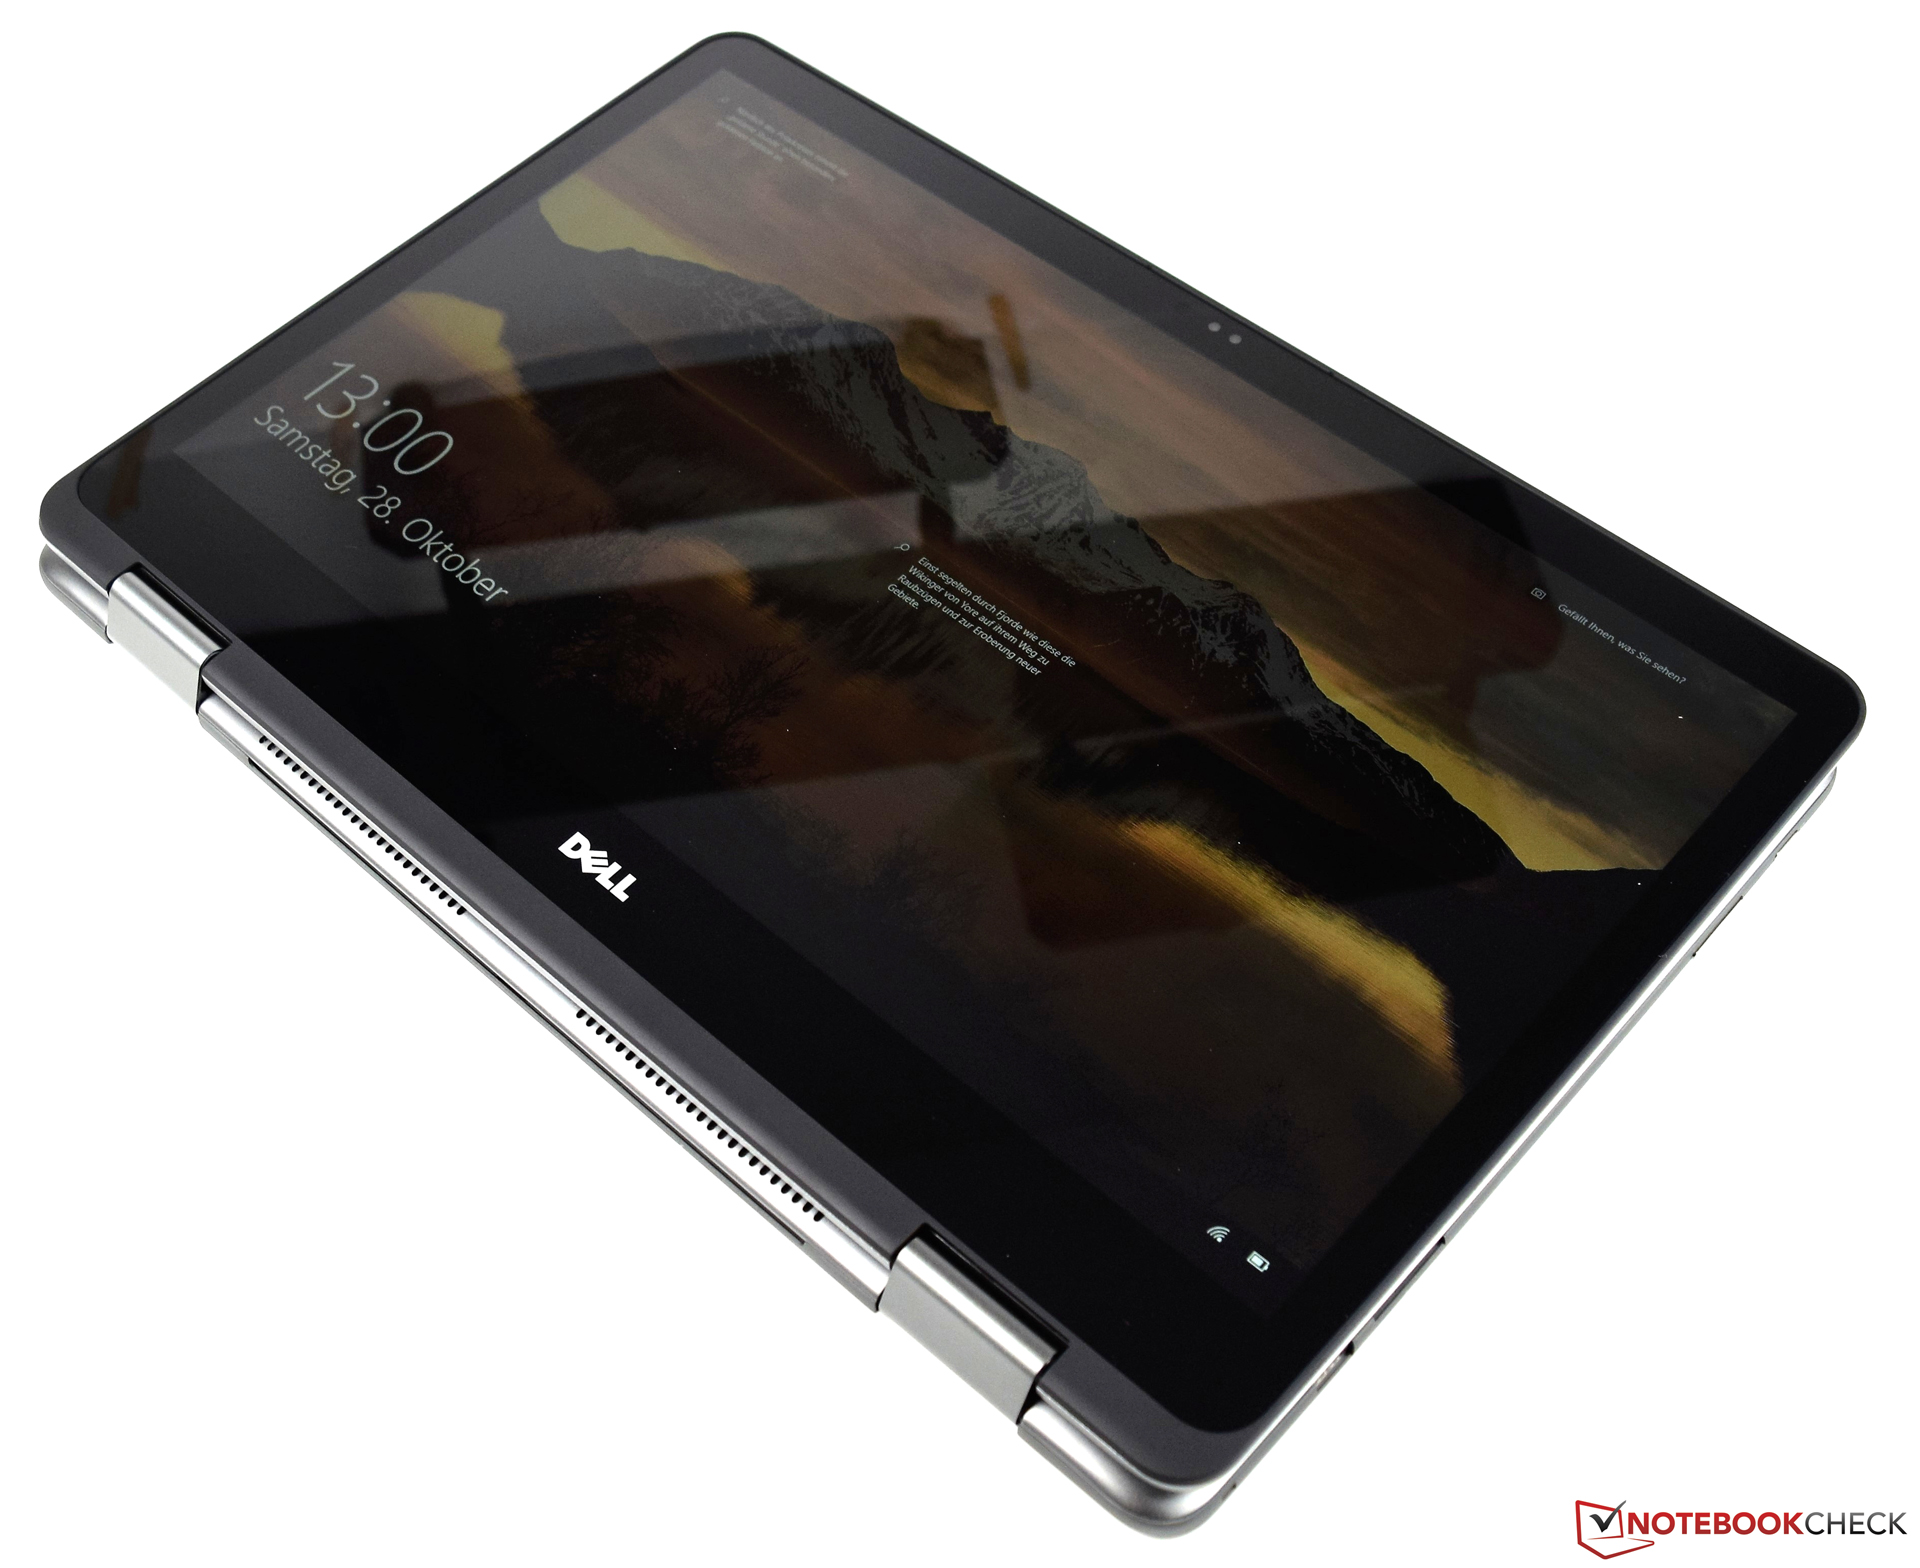
Även om Dell Inspiron 17 7773 troligen inte är för alla så belönas köpare med en hyfsad portion prestanda. Dessutom är den enorma omvandlingsbara modellen väldigt flexibel i fråga om användningsområden och har nästan ingen konkurrens.
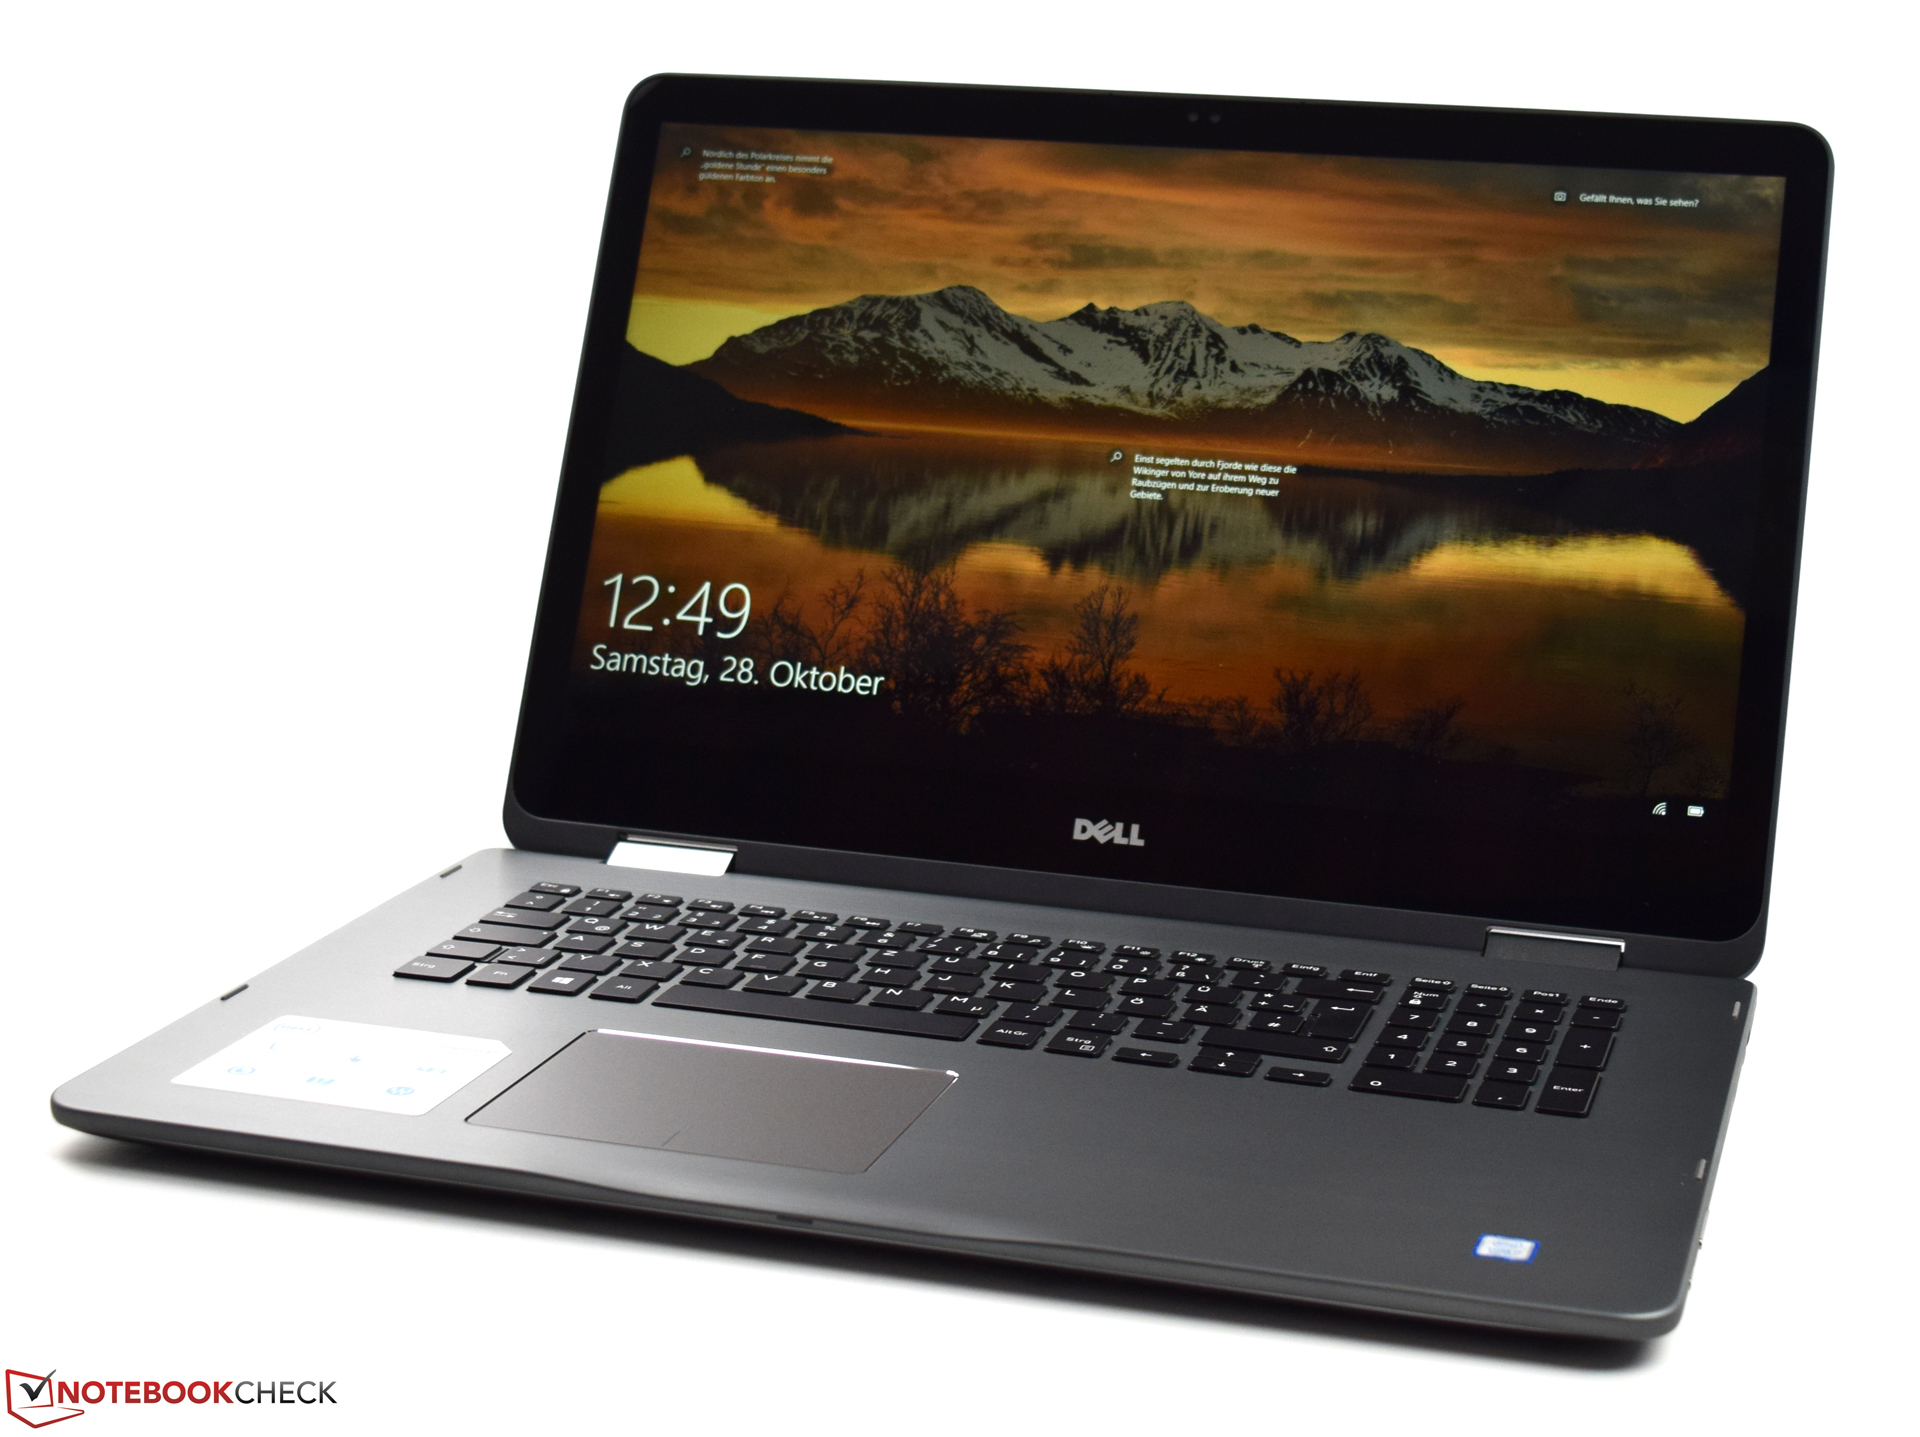
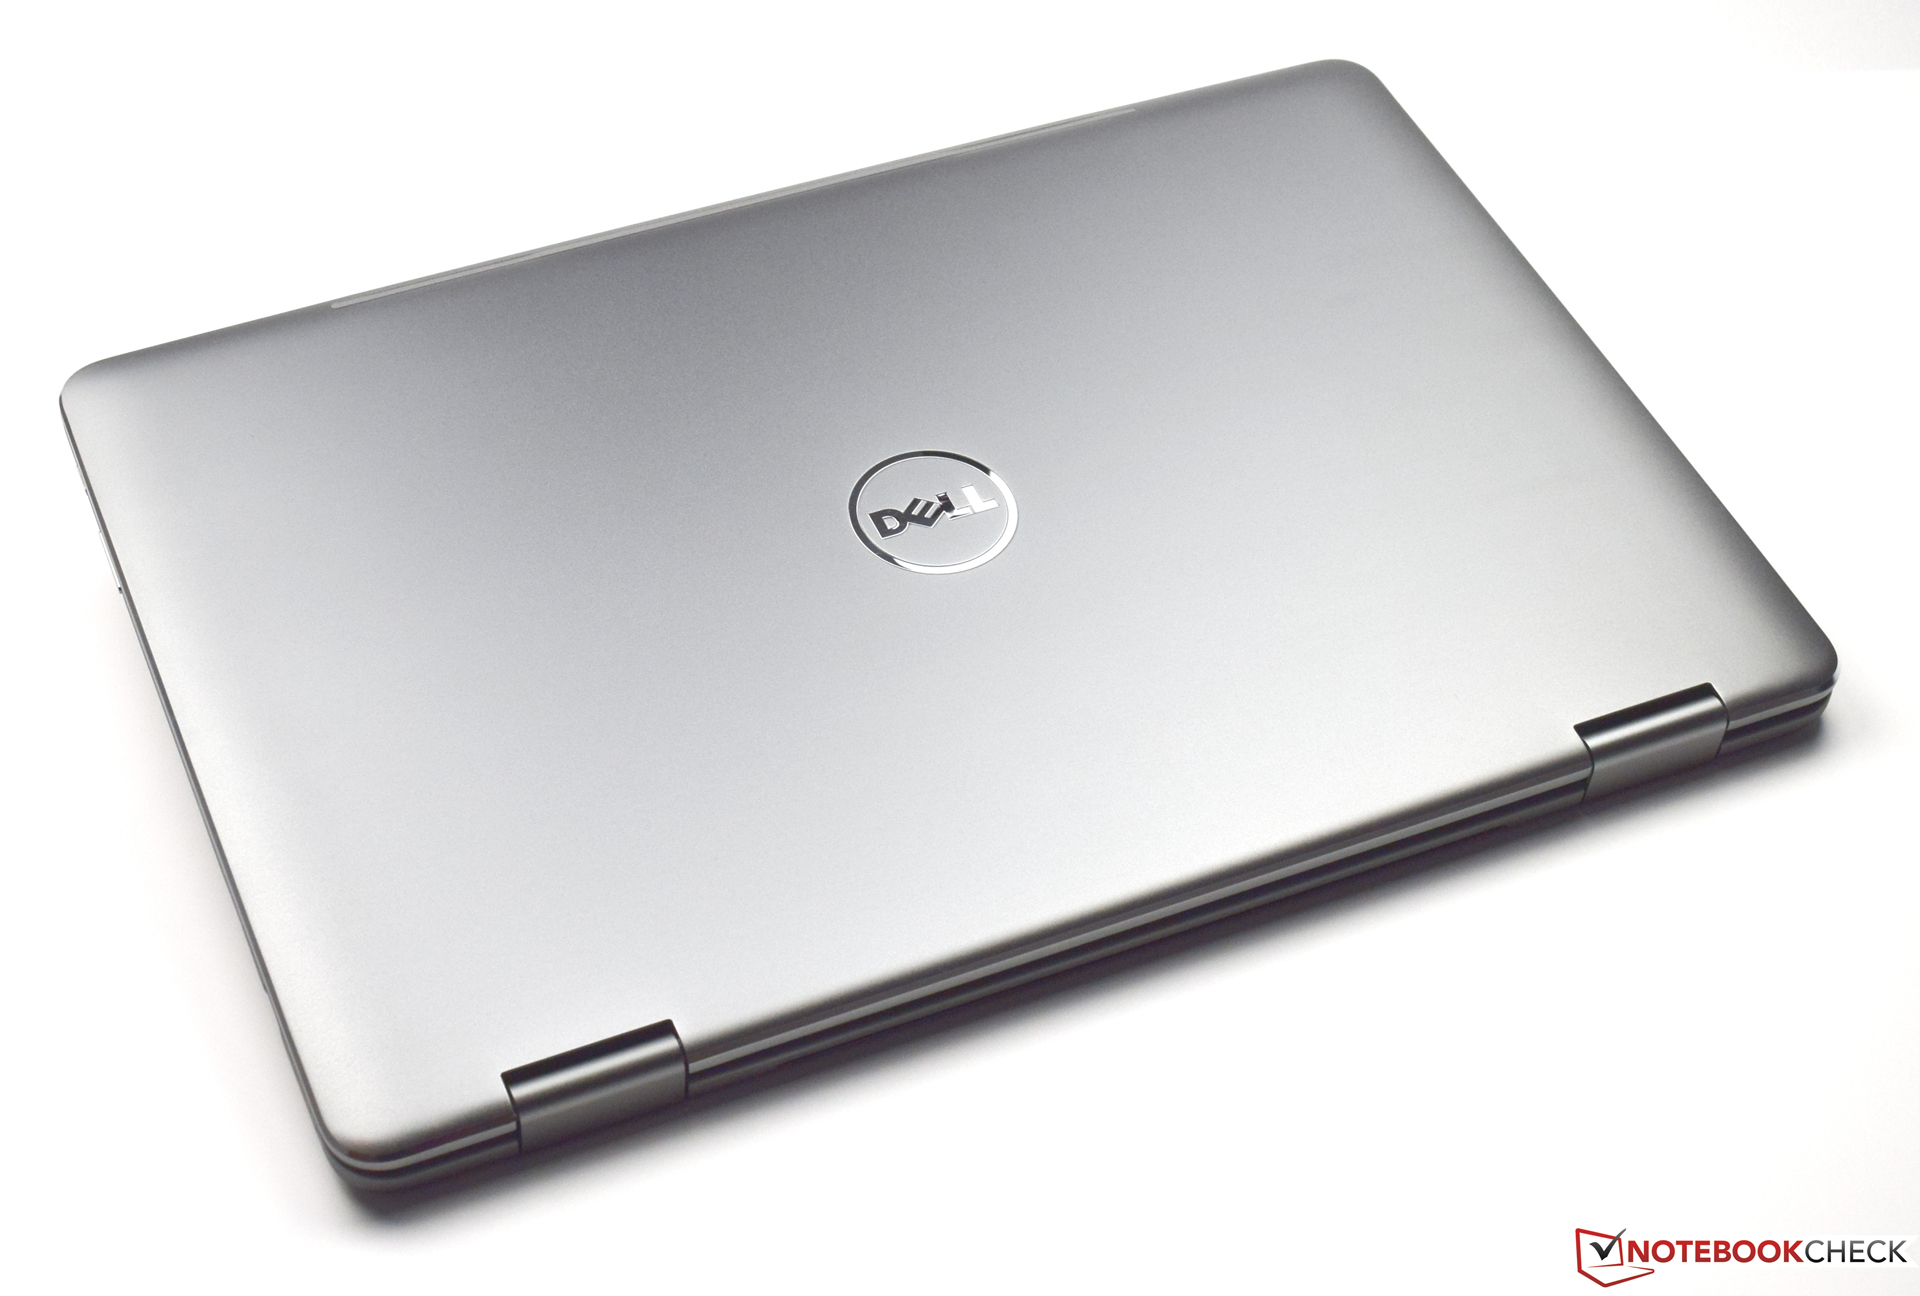
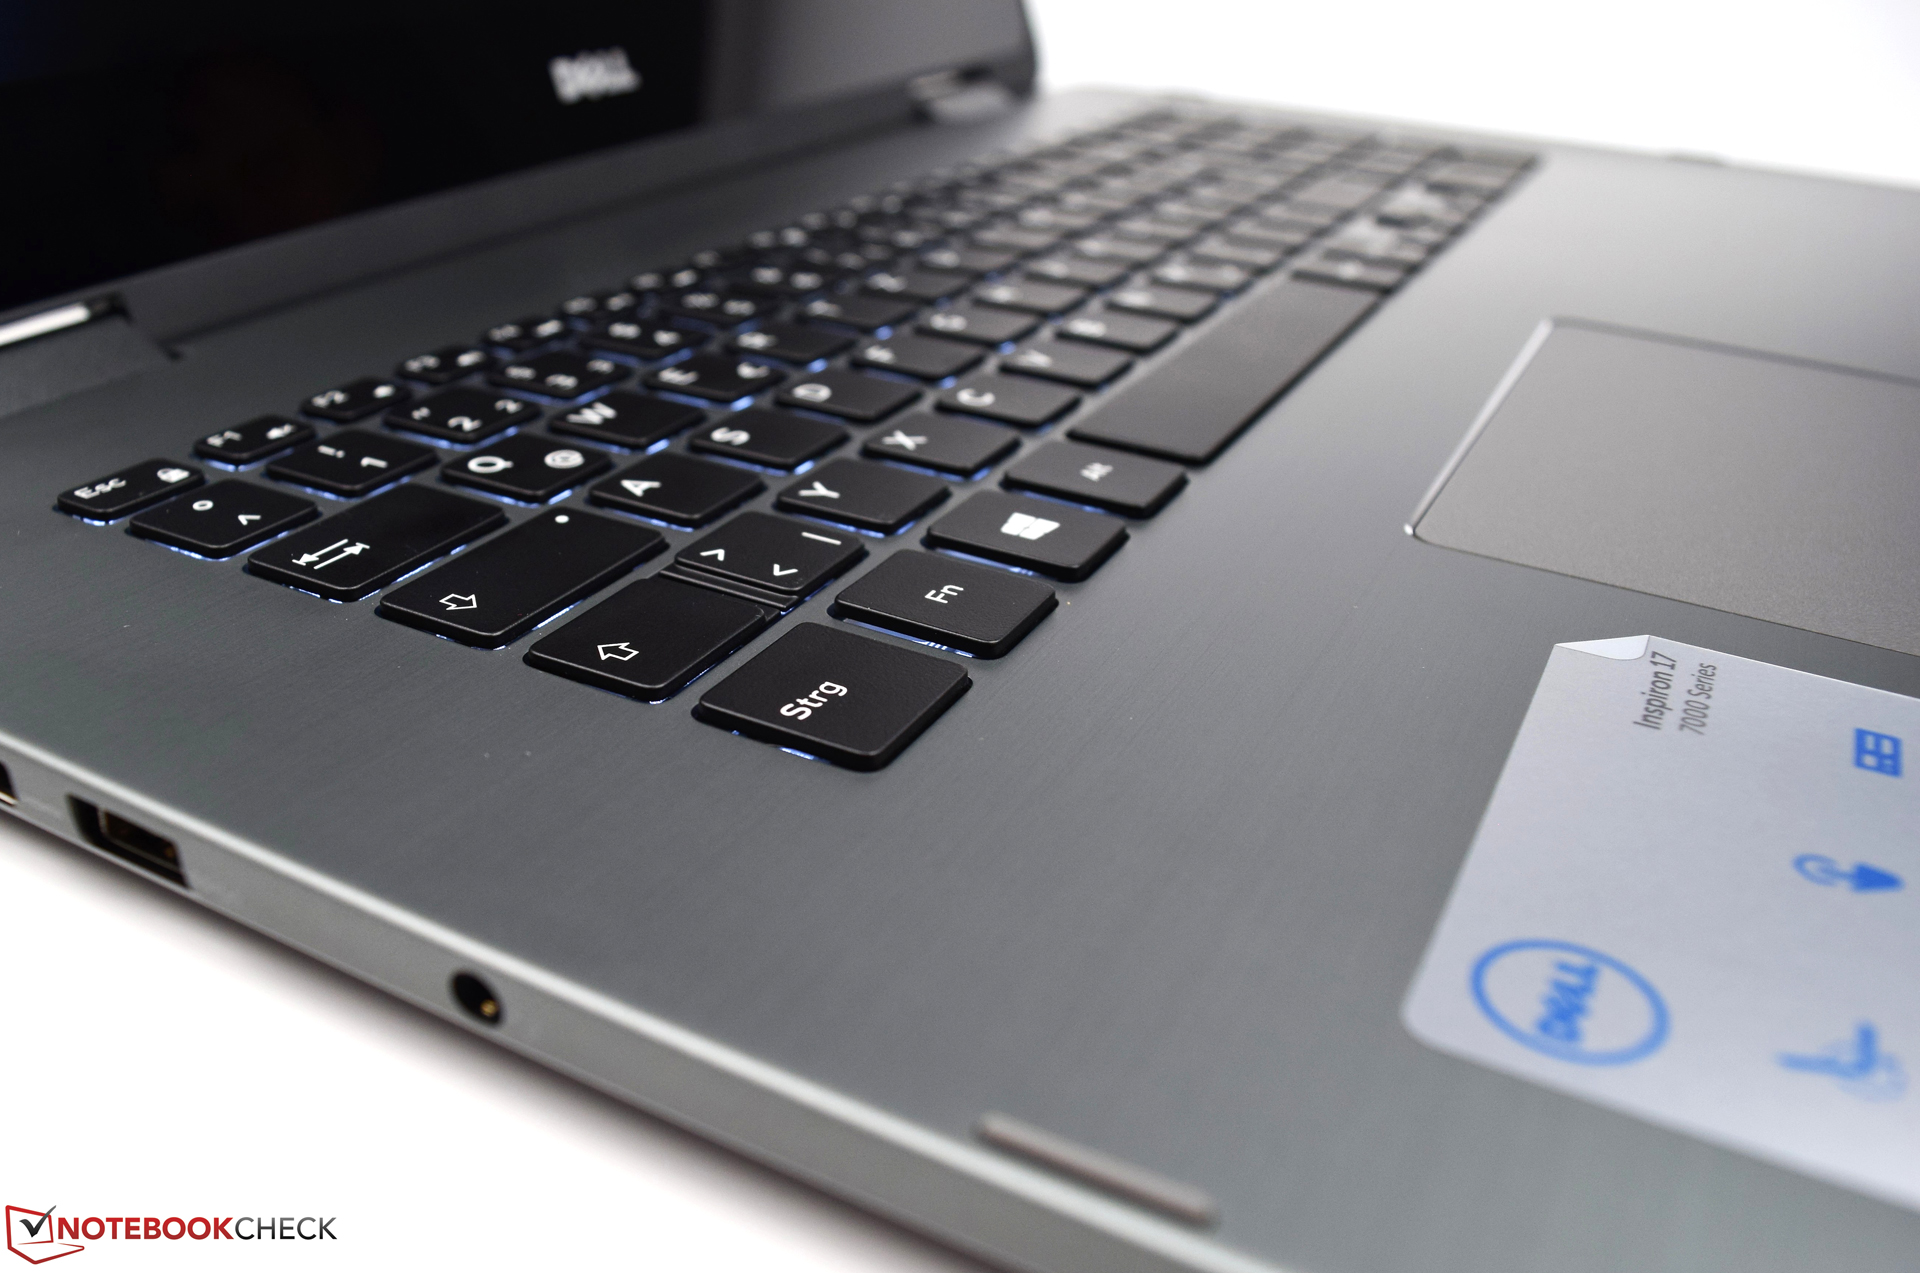
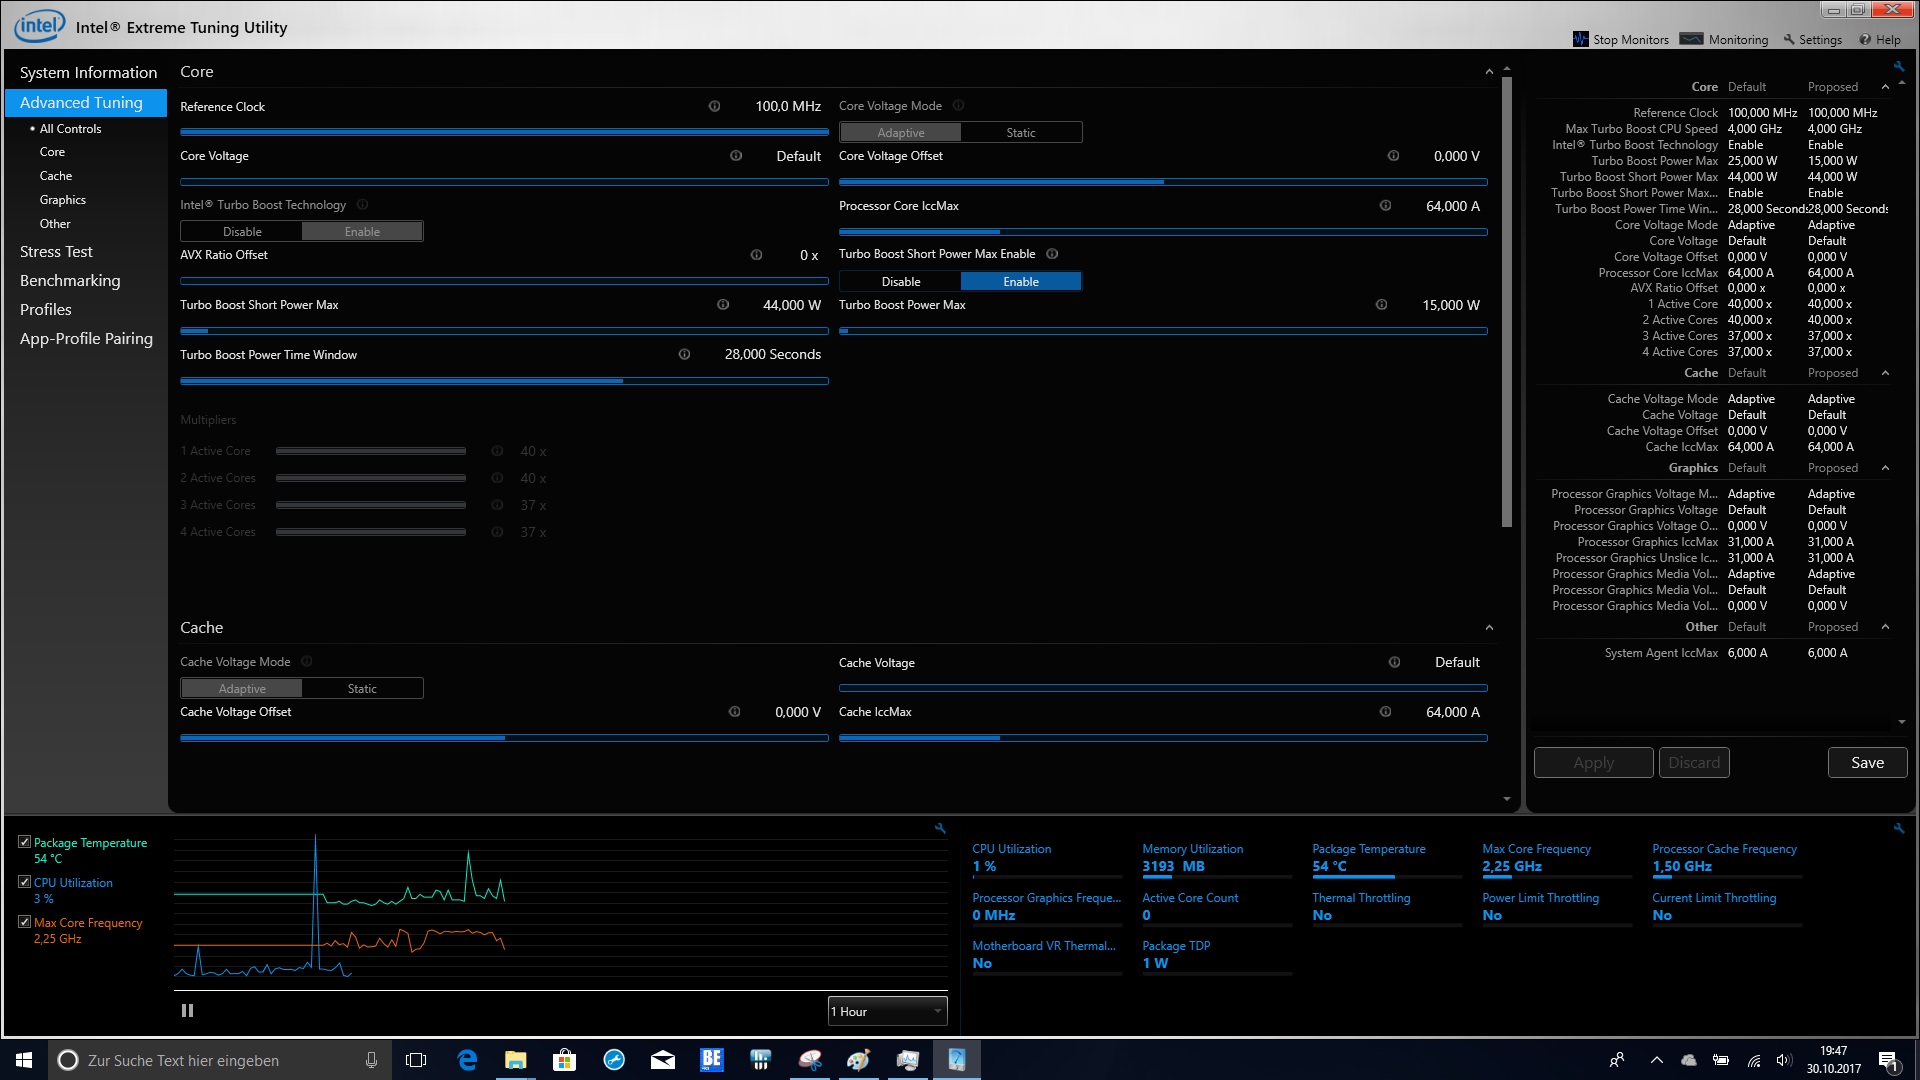
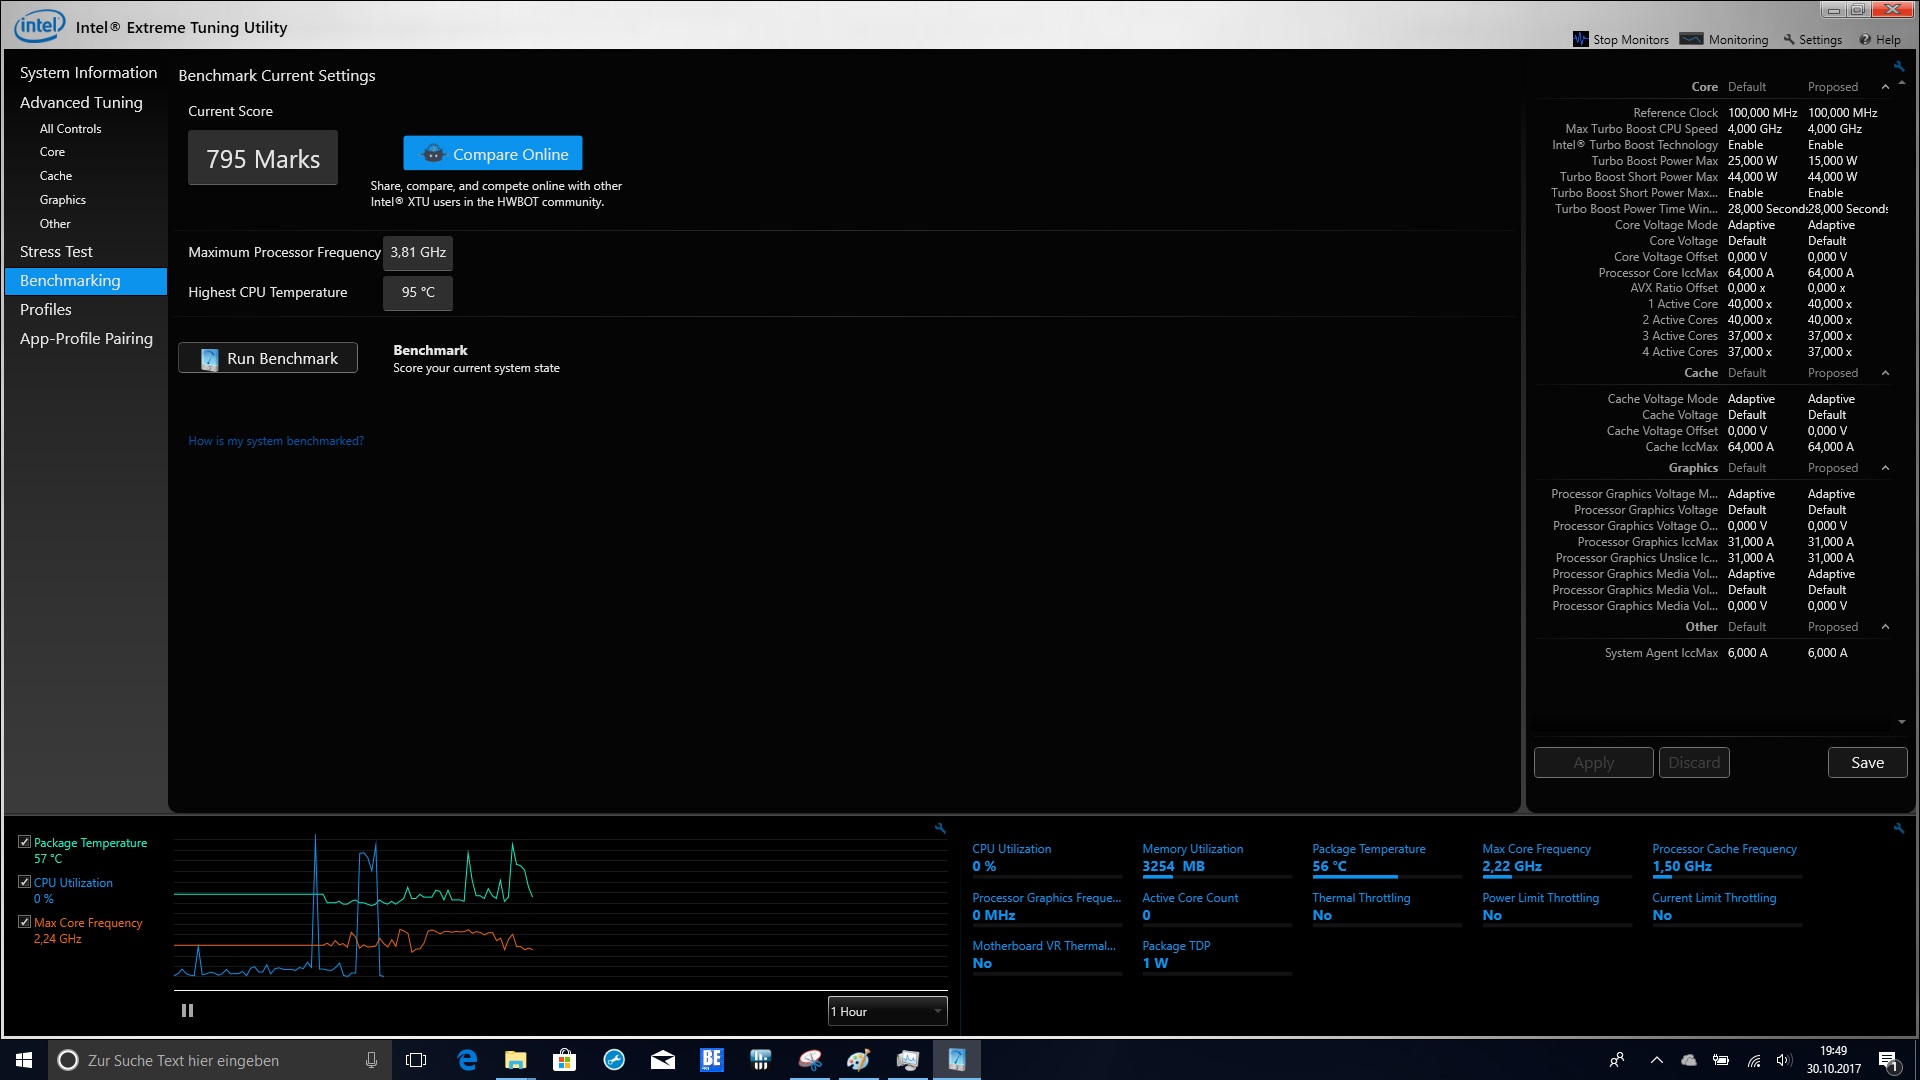
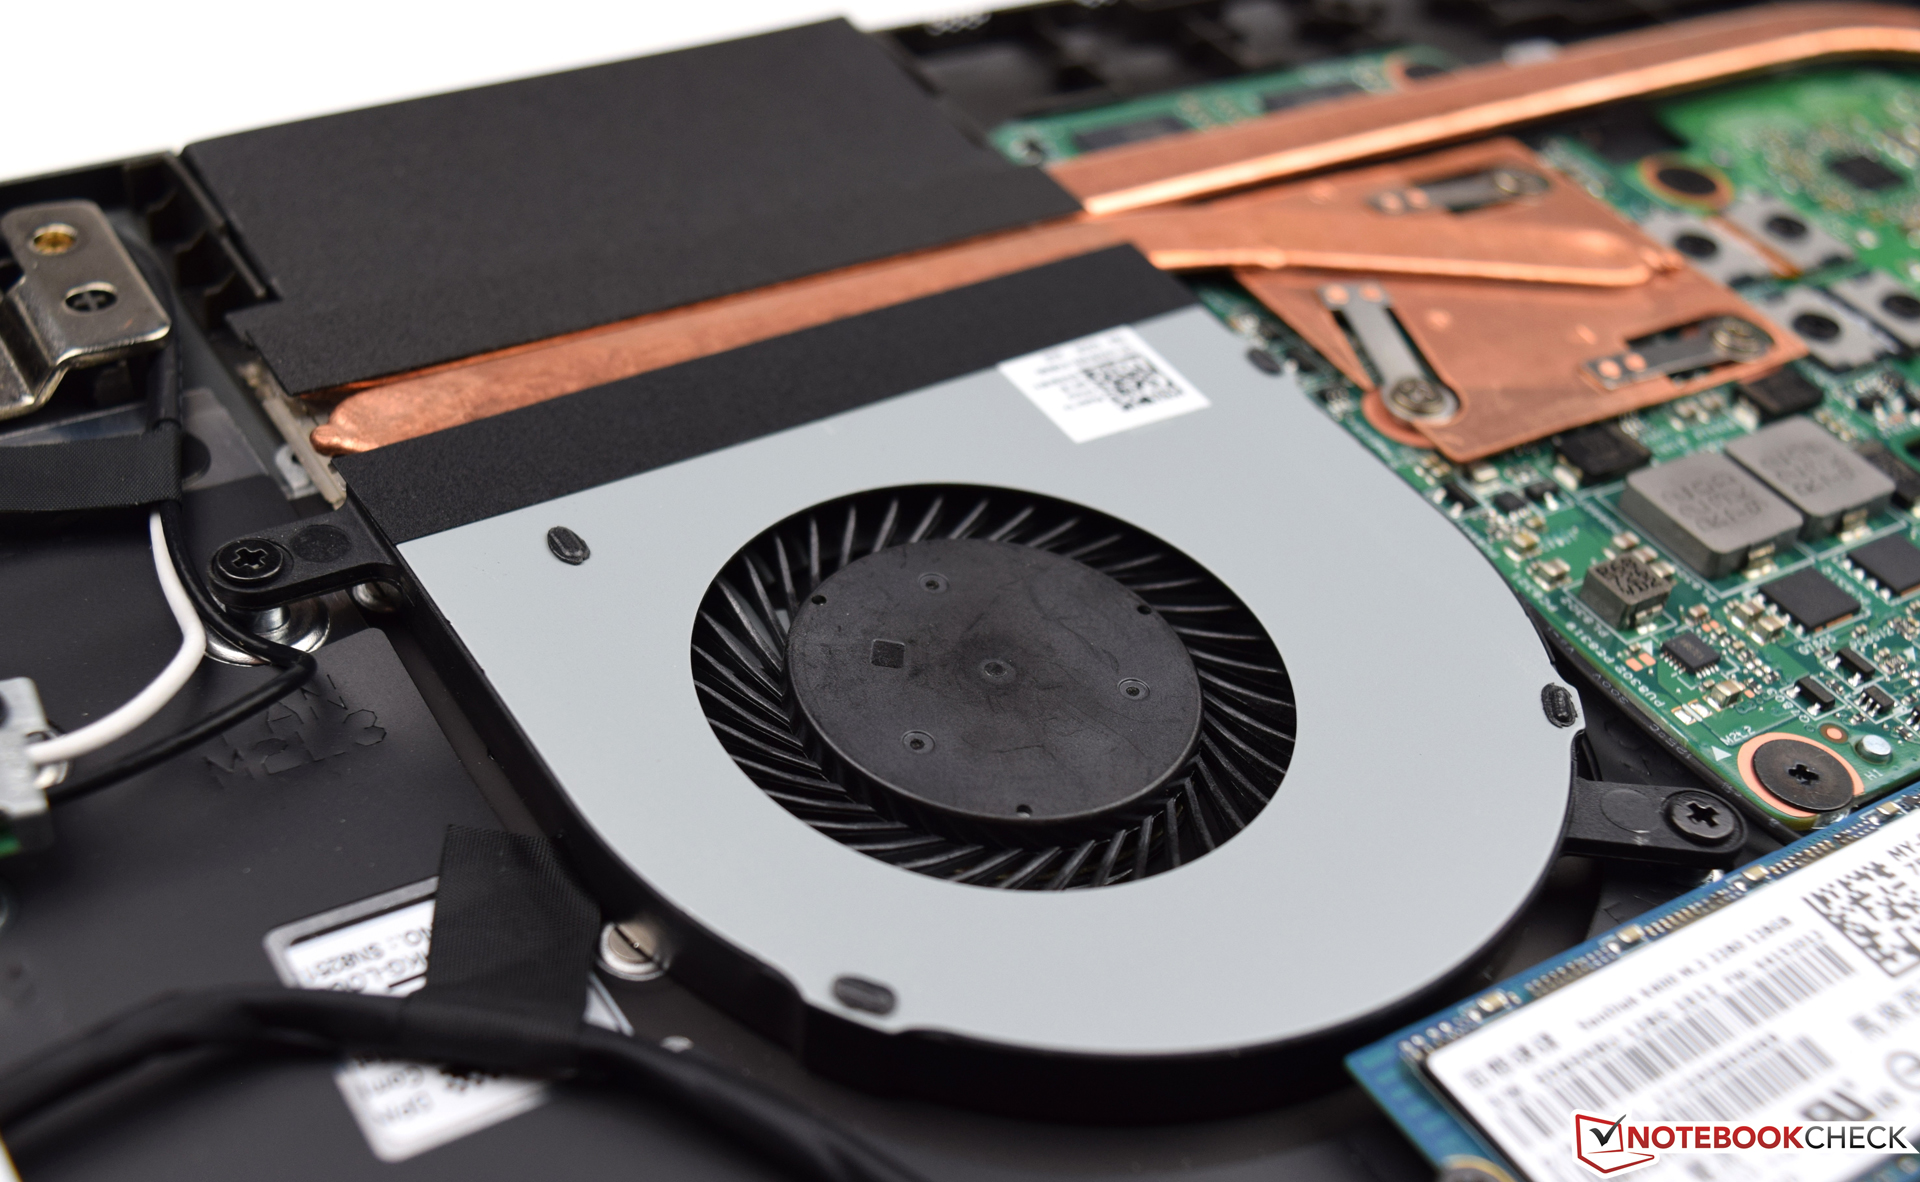
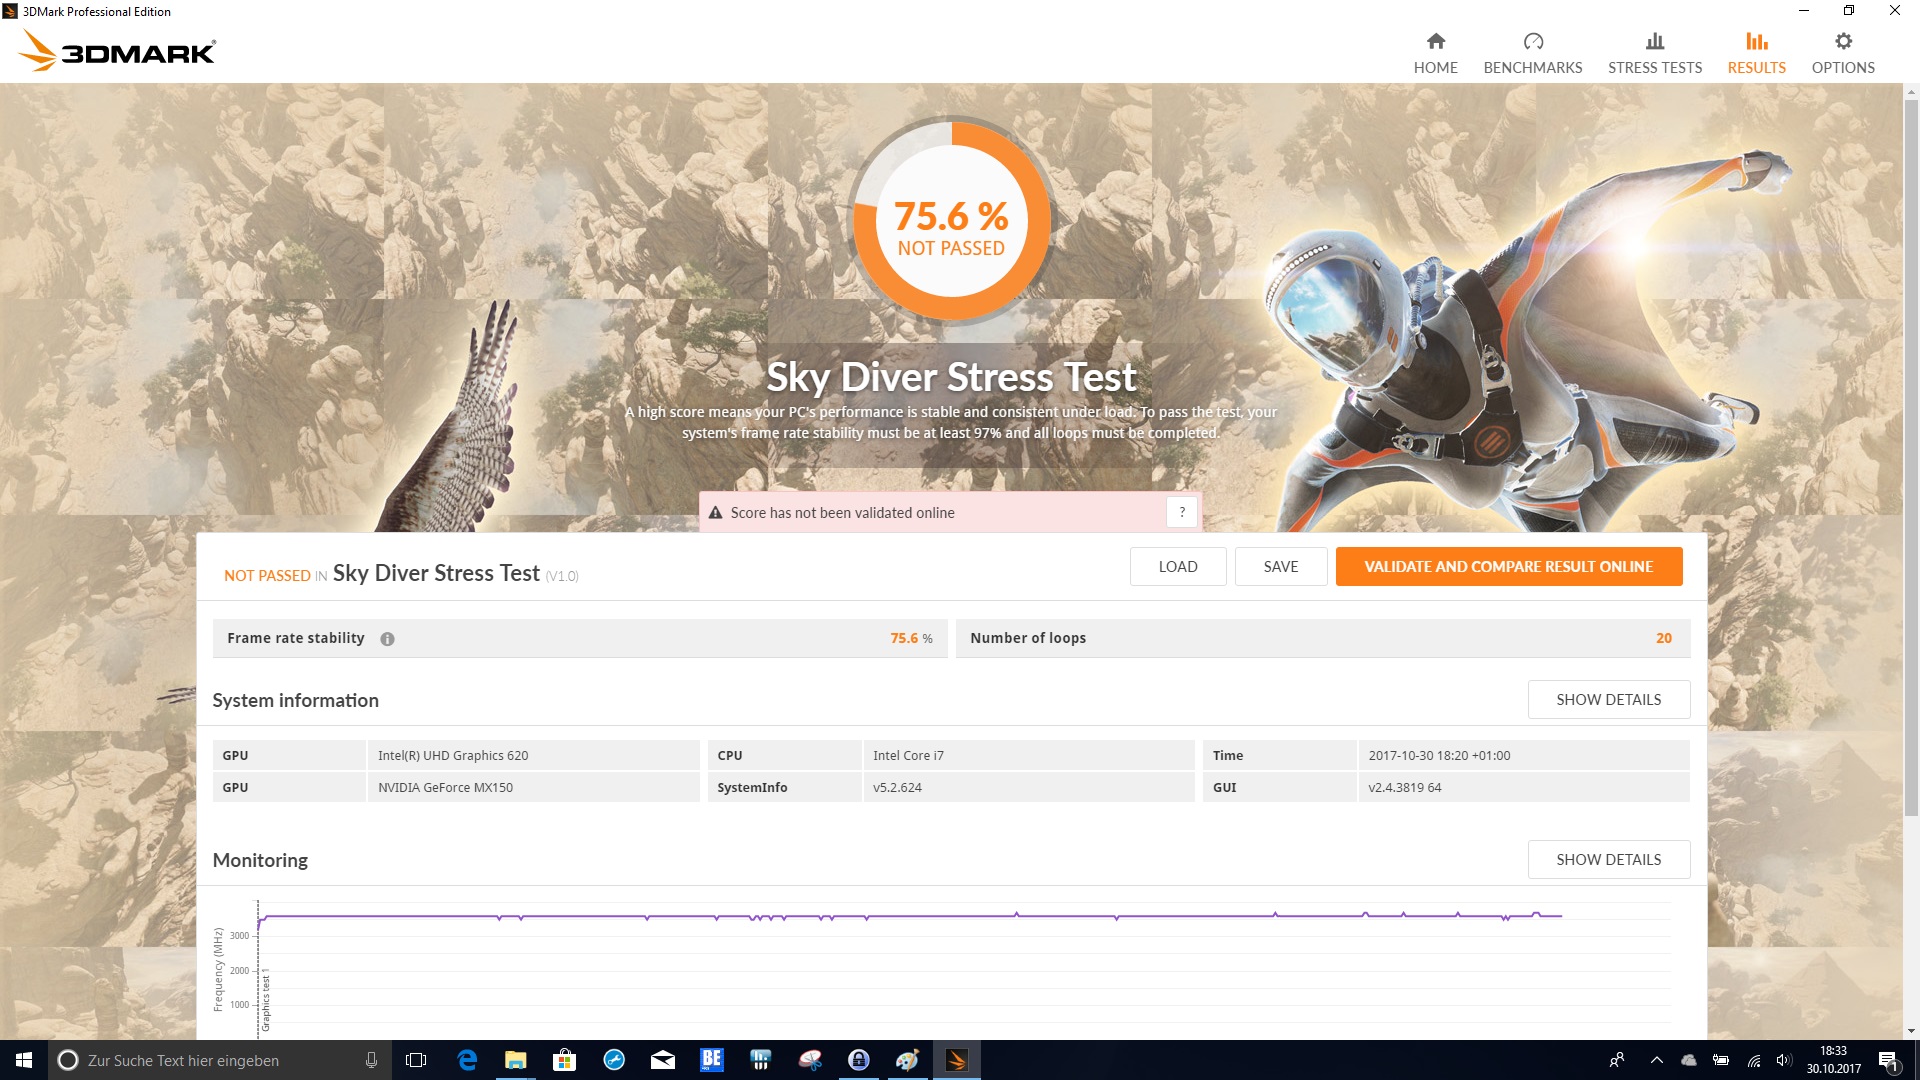
Den eleganta, anspråkslösa designen övertygade oss särskilt i testet. Materialvalen, som ger en väldigt bra stabilitet till enheten, är också lyckade. Med skärmen och tangentbordet kunde tillverkaren ha tagit till sig en del klagomål för att kunna förbättra dom små men viktiga inkonsekvenserna i nästa uppdatering. Grafikkortets tendens till strypning står också ut som negativt även om dess påverkan på prestandan inte är så stor. Men överlag är Dell Inspiron 17 7773 en väldigt bra multimediaenhet med alla fördelarna hos en omvandlingsbar.
Dell Inspiron 17-7773-0043
- 11/06/2017 v6 (old)
Sebastian Bade