Test: Lenovo Yoga 920-13IKB (i7-8550U, FHD) Omvandlingsbar (Sammanfattning)
| SD Card Reader | |
| maximum SDCardreader Maximum Transfer Rate | |
| average SDCardreader Average Transfer Rate |
| Networking | |
| iperf3 transmit AX12 | |
| Asus ZenBook Flip S UX370 | |
| Lenovo Yoga 920-13IKB-80Y7 | |
| Dell Latitude 5289 | |
| Dell XPS 13-9365 2-in-1 | |
| iperf3 receive AX12 | |
| Lenovo Yoga 920-13IKB-80Y7 | |
| Dell Latitude 5289 | |
| Asus ZenBook Flip S UX370 | |
| Dell XPS 13-9365 2-in-1 | |
| |||||||||||||||||||||||||
Distribution av ljusstyrkan: 81 %
Mitt på batteriet: 297.9 cd/m²
Kontrast: 677:1 (Svärta: 0.44 cd/m²)
ΔE ColorChecker Calman: 5.1 | ∀{0.5-29.43 Ø4.71}
ΔE Greyscale Calman: 6.7 | ∀{0.09-98 Ø4.96}
91.7% sRGB (Argyll 1.6.3 3D)
64.1% AdobeRGB 1998 (Argyll 1.6.3 3D)
64.1% AdobeRGB 1998 (Argyll 3D)
91.7% sRGB (Argyll 3D)
62.5% Display P3 (Argyll 3D)
Gamma: 2.9
CCT: 6839 K
| Lenovo Yoga 920-13IKB-80Y7 AU Optronics B139HAN03.0, IPS, 13.9", 1920x1080 | Dell XPS 13-9365 2-in-1 IPS, 13.3", 1920x1080 | HP Spectre x360 13-w023dx Chi Mei CMN1367, IPS, 13.3", 1920x1080 | Asus ZenBook Flip S UX370 AUO B133HAN04.2, a-Si TFT-LCD, WLED, 13.3", 1920x1080 | Dell Latitude 5289 BOE NV12N51, IPS LED, 12.5", 1920x1080 | HP Spectre x360 13-ac033dx LG Philips LGD054D, IPS, 13.3", 3840x2160 | |
|---|---|---|---|---|---|---|
| Display | -23% | 2% | 0% | -31% | 9% | |
| Display P3 Coverage (%) | 62.5 | 47.32 -24% | 65.4 5% | 64 2% | 42.79 -32% | 69.4 11% |
| sRGB Coverage (%) | 91.7 | 71.1 -22% | 90.4 -1% | 90 -2% | 64.3 -30% | 96.8 6% |
| AdobeRGB 1998 Coverage (%) | 64.1 | 48.83 -24% | 65.8 3% | 64.9 1% | 44.21 -31% | 71.1 11% |
| Response Times | -4% | 20% | 6% | 6% | 4% | |
| Response Time Grey 50% / Grey 80% * (ms) | 46 ? | 48 ? -4% | 33.2 ? 28% | 44 ? 4% | 42 ? 9% | 42 ? 9% |
| Response Time Black / White * (ms) | 31.6 ? | 32.8 ? -4% | 28 ? 11% | 29 ? 8% | 31 ? 2% | 32 ? -1% |
| PWM Frequency (Hz) | 1042 ? | 531 ? | ||||
| Screen | 11% | 5% | 26% | 18% | 30% | |
| Brightness middle (cd/m²) | 297.9 | 322.6 8% | 334.6 12% | 334 12% | 336 13% | 302.6 2% |
| Brightness (cd/m²) | 278 | 306 10% | 319 15% | 321 15% | 320 15% | 282 1% |
| Brightness Distribution (%) | 81 | 91 12% | 90 11% | 86 6% | 90 11% | 83 2% |
| Black Level * (cd/m²) | 0.44 | 0.19 57% | 0.336 24% | 0.25 43% | 0.34 23% | 0.25 43% |
| Contrast (:1) | 677 | 1698 151% | 996 47% | 1336 97% | 988 46% | 1210 79% |
| Colorchecker dE 2000 * | 5.1 | 7.7 -51% | 6.21 -22% | 4.24 17% | 3.45 32% | 2.4 53% |
| Colorchecker dE 2000 max. * | 11 | 11.1 -1% | 12 -9% | 6.03 45% | 7.95 28% | 4.9 55% |
| Greyscale dE 2000 * | 6.7 | 7.9 -18% | 7.71 -15% | 3.92 41% | 1.68 75% | 2.8 58% |
| Gamma | 2.9 76% | 2.88 76% | 2.36 93% | 2.68 82% | 2.49 88% | 2.2 100% |
| CCT | 6839 95% | 7044 92% | 6458 101% | 6758 96% | 6782 96% | 6333 103% |
| Color Space (Percent of AdobeRGB 1998) (%) | 64.1 | 44.1 -31% | 58.6 -9% | 58 -10% | 41 -36% | 65.5 2% |
| Color Space (Percent of sRGB) (%) | 91.7 | 69.9 -24% | 90 -2% | 90 -2% | 64 -30% | 97.1 6% |
| Totalt genomsnitt (program/inställningar) | -5% /
2% | 9% /
7% | 11% /
18% | -2% /
6% | 14% /
22% |
* ... mindre är bättre
Visa svarstider
| ↔ Svarstid svart till vitt | ||
|---|---|---|
| 31.6 ms ... stiga ↗ och falla ↘ kombinerat | ↗ 18.4 ms stiga | 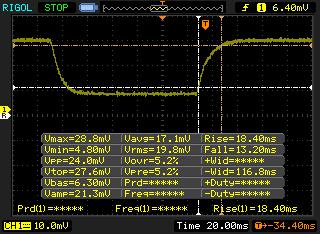 |
| ↘ 13.2 ms hösten | ||
| Skärmen visar långsamma svarsfrekvenser i våra tester och kommer att vara otillfredsställande för spelare. I jämförelse sträcker sig alla testade enheter från 0.1 (minst) till 240 (maximalt) ms. » 85 % av alla enheter är bättre. Detta innebär att den uppmätta svarstiden är sämre än genomsnittet av alla testade enheter (19.8 ms). | ||
| ↔ Svarstid 50 % grått till 80 % grått | ||
| 46 ms ... stiga ↗ och falla ↘ kombinerat | ↗ 20.8 ms stiga | 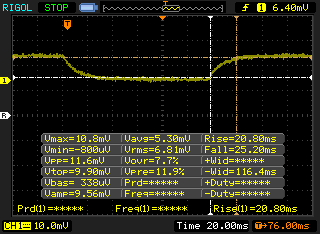 |
| ↘ 25.2 ms hösten | ||
| Skärmen visar långsamma svarsfrekvenser i våra tester och kommer att vara otillfredsställande för spelare. I jämförelse sträcker sig alla testade enheter från 0.165 (minst) till 636 (maximalt) ms. » 79 % av alla enheter är bättre. Detta innebär att den uppmätta svarstiden är sämre än genomsnittet av alla testade enheter (31 ms). | ||
Skärmflimmer / PWM (Puls-Width Modulation)
| Skärmflimmer / PWM upptäcktes inte | 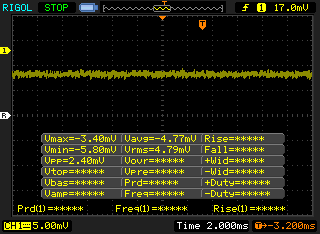 | ||
Som jämförelse: 52 % av alla testade enheter använder inte PWM för att dämpa skärmen. Om PWM upptäcktes mättes ett medelvärde av 7757 (minst: 5 - maximum: 343500) Hz. | |||
| Cinebench R15 | |
| CPU Single 64Bit | |
| Lenovo Yoga 920-13IKB-80Y7 | |
| Dell XPS 13 i7-8550U | |
| Lenovo Yoga 910-13IKB-80VF004CGE | |
| Dell Latitude 5289 | |
| Dell XPS 13-9365 2-in-1 | |
| Asus ZenBook Flip S UX370 | |
| HP Spectre x360 13-w023dx | |
| CPU Multi 64Bit | |
| Dell XPS 13 i7-8550U | |
| Lenovo Yoga 920-13IKB-80Y7 | |
| Lenovo Yoga 910-13IKB-80VF004CGE | |
| Dell Latitude 5289 | |
| HP Spectre x360 13-w023dx | |
| Asus ZenBook Flip S UX370 | |
| Dell XPS 13-9365 2-in-1 | |
| Cinebench R11.5 | |
| CPU Single 64Bit | |
| Lenovo Yoga 920-13IKB-80Y7 | |
| HP Spectre x360 13-w023dx | |
| Dell XPS 13 i7-8550U | |
| Dell XPS 13-9365 2-in-1 | |
| Asus ZenBook Flip S UX370 | |
| CPU Multi 64Bit | |
| Dell XPS 13 i7-8550U | |
| Lenovo Yoga 920-13IKB-80Y7 | |
| HP Spectre x360 13-w023dx | |
| Asus ZenBook Flip S UX370 | |
| Dell XPS 13-9365 2-in-1 | |
| Cinebench R10 | |
| Rendering Multiple CPUs 32Bit | |
| Dell XPS 13 i7-8550U | |
| Lenovo Yoga 920-13IKB-80Y7 | |
| HP Spectre x360 13-w023dx | |
| Asus ZenBook Flip S UX370 | |
| Dell XPS 13-9365 2-in-1 | |
| Rendering Single 32Bit | |
| Lenovo Yoga 920-13IKB-80Y7 | |
| HP Spectre x360 13-w023dx | |
| Dell XPS 13 i7-8550U | |
| Dell XPS 13-9365 2-in-1 | |
| Asus ZenBook Flip S UX370 | |
| wPrime 2.10 - 1024m | |
| Dell XPS 13-9365 2-in-1 | |
| HP Spectre x360 13-w023dx | |
| Lenovo Yoga 920-13IKB-80Y7 | |
* ... mindre är bättre
| PCMark 8 | |
| Home Score Accelerated v2 | |
| Lenovo Yoga 920-13IKB-80Y7 | |
| HP Spectre x360 13-w023dx | |
| Lenovo Yoga 910-13IKB-80VF004CGE | |
| Dell Latitude 5289 | |
| Asus ZenBook Flip S UX370 | |
| Dell XPS 13 i7-8550U | |
| Dell XPS 13-9365 2-in-1 | |
| HP Spectre x360 13-ac033dx | |
| Work Score Accelerated v2 | |
| Lenovo Yoga 920-13IKB-80Y7 | |
| HP Spectre x360 13-w023dx | |
| Dell Latitude 5289 | |
| Dell XPS 13-9365 2-in-1 | |
| Asus ZenBook Flip S UX370 | |
| Dell XPS 13 i7-8550U | |
| HP Spectre x360 13-ac033dx | |
| Creative Score Accelerated v2 | |
| Lenovo Yoga 920-13IKB-80Y7 | |
| HP Spectre x360 13-w023dx | |
| Dell XPS 13 i7-8550U | |
| HP Spectre x360 13-ac033dx | |
| Asus ZenBook Flip S UX370 | |
| Dell XPS 13-9365 2-in-1 | |
| PCMark 8 Home Score Accelerated v2 | 3999 poäng | |
| PCMark 8 Creative Score Accelerated v2 | 5342 poäng | |
| PCMark 8 Work Score Accelerated v2 | 5154 poäng | |
| PCMark 10 Score | 4012 poäng | |
Hjälp | ||
| Lenovo Yoga 920-13IKB-80Y7 Samsung PM961 MZVLW256HEHP | Dell XPS 13-9365 2-in-1 Toshiba NVMe THNSN5256GPUK | HP Spectre x360 13-w023dx Samsung PM951 NVMe MZVLV512 | Asus ZenBook Flip S UX370 SanDisk SD8SN8U256G1002 | Dell Latitude 5289 SanDisk X400 256GB, SATA (SD8SB8U-256G) | HP Spectre x360 13-ac033dx Samsung PM961 NVMe MZVLW512HMJP | |
|---|---|---|---|---|---|---|
| CrystalDiskMark 3.0 | -35% | -25% | -59% | -67% | 1% | |
| Write 4k QD32 (MB/s) | 573 | 250.2 -56% | 361.2 -37% | 170.8 -70% | 158.8 -72% | 225.6 -61% |
| Read 4k QD32 (MB/s) | 432.9 | 411 -5% | 535 24% | 385.4 -11% | 306.2 -29% | 518 20% |
| Write 4k (MB/s) | 142.4 | 121.2 -15% | 137.9 -3% | 57 -60% | 27.92 -80% | 139.4 -2% |
| Read 4k (MB/s) | 56.2 | 32.93 -41% | 42.66 -24% | 29.7 -47% | 22.73 -60% | 54.7 -3% |
| Write 512 (MB/s) | 832 | 410.7 -51% | 571 -31% | 291.5 -65% | 255.6 -69% | 1229 48% |
| Read 512 (MB/s) | 1252 | 966 -23% | 679 -46% | 315.7 -75% | 260.8 -79% | 865 -31% |
| Write Seq (MB/s) | 1125 | 629 -44% | 571 -49% | 432.5 -62% | 406.4 -64% | 1550 38% |
| Read Seq (MB/s) | 2070 | 1206 -42% | 1376 -34% | 455.9 -78% | 423.7 -80% | 2065 0% |

| 3DMark 11 | |
| 1280x720 Performance GPU | |
| HP Envy 13-ad006ng | |
| Dell XPS 13 9360 FHD i7 Iris | |
| Dell XPS 13 i7-8550U | |
| Lenovo Yoga 920-13IKB-80Y7 | |
| Dell Latitude 5289 | |
| Asus ZenBook Flip S UX370 | |
| HP Spectre x360 13-ac033dx | |
| Dell XPS 13-9365 2-in-1 | |
| 1280x720 Performance Combined | |
| HP Envy 13-ad006ng | |
| Dell XPS 13 9360 FHD i7 Iris | |
| Dell XPS 13 i7-8550U | |
| Lenovo Yoga 920-13IKB-80Y7 | |
| HP Spectre x360 13-ac033dx | |
| Dell Latitude 5289 | |
| Asus ZenBook Flip S UX370 | |
| Dell XPS 13-9365 2-in-1 | |
| 3DMark | |
| 1280x720 Cloud Gate Standard Graphics | |
| HP Envy 13-ad006ng | |
| Dell XPS 13 9360 FHD i7 Iris | |
| Lenovo Yoga 920-13IKB-80Y7 | |
| Dell XPS 13 i7-8550U | |
| Asus ZenBook Flip S UX370 | |
| Dell Latitude 5289 | |
| Dell XPS 13-9365 2-in-1 | |
| HP Spectre x360 13-ac033dx | |
| 1920x1080 Fire Strike Graphics | |
| HP Envy 13-ad006ng | |
| Dell XPS 13 9360 FHD i7 Iris | |
| Dell XPS 13 i7-8550U | |
| Lenovo Yoga 920-13IKB-80Y7 | |
| Dell Latitude 5289 | |
| Asus ZenBook Flip S UX370 | |
| HP Spectre x360 13-ac033dx | |
| Dell XPS 13-9365 2-in-1 | |
| 1920x1080 Ice Storm Extreme Graphics | |
| Lenovo Yoga 920-13IKB-80Y7 | |
| Asus ZenBook Flip S UX370 | |
| Dell XPS 13 i7-8550U | |
| Dell XPS 13-9365 2-in-1 | |
| HP Spectre x360 13-ac033dx | |
| 3DMark 11 Performance | 1915 poäng | |
| 3DMark Ice Storm Standard Score | 74895 poäng | |
| 3DMark Cloud Gate Standard Score | 8519 poäng | |
| 3DMark Fire Strike Score | 1052 poäng | |
| 3DMark Fire Strike Extreme Score | 489 poäng | |
Hjälp | ||
| BioShock Infinite | |
| 1920x1080 Ultra Preset, DX11 (DDOF) (sortera efter värde) | |
| Lenovo Yoga 920-13IKB-80Y7 | |
| Asus ZenBook Flip S UX370 | |
| Dell XPS 13 i7-8550U | |
| HP Envy 13-ad006ng | |
| Dell XPS 13 9360 FHD i7 Iris | |
| 1366x768 High Preset (sortera efter värde) | |
| Lenovo Yoga 920-13IKB-80Y7 | |
| Asus ZenBook Flip S UX370 | |
| Dell XPS 13 i7-8550U | |
| HP Envy 13-ad006ng | |
| Dell XPS 13 9360 FHD i7 Iris | |
| Rise of the Tomb Raider | |
| 1920x1080 High Preset AA:FX AF:4x (sortera efter värde) | |
| Lenovo Yoga 920-13IKB-80Y7 | |
| Asus ZenBook Flip S UX370 | |
| Dell XPS 13 i7-8550U | |
| HP Envy 13-ad006ng | |
| 1366x768 Medium Preset AF:2x (sortera efter värde) | |
| Lenovo Yoga 920-13IKB-80Y7 | |
| Asus ZenBook Flip S UX370 | |
| Dell XPS 13 i7-8550U | |
| HP Envy 13-ad006ng | |
| låg | med. | hög | ultra | |
|---|---|---|---|---|
| BioShock Infinite (2013) | 67.1 | 36.2 | 30.5 | 10.1 |
| Rise of the Tomb Raider (2016) | 22.9 | 12.7 | 6.8 |
Ljudnivå
| Låg belastning |
| 28 / 28.8 / 30.3 dB(A) |
| Hög belastning |
| 34.5 / 34.3 dB(A) |
 | ||
30 dB tyst 40 dB(A) hörbar 50 dB(A) högt ljud |
||
min: | ||
| Lenovo Yoga 920-13IKB-80Y7 UHD Graphics 620, i5-8550U, Samsung PM961 MZVLW256HEHP | HP Spectre x360 13-w023dx HD Graphics 620, i7-7500U, Samsung PM951 NVMe MZVLV512 | Asus ZenBook Flip S UX370 HD Graphics 620, i5-7200U, SanDisk SD8SN8U256G1002 | Dell Latitude 5289 HD Graphics 620, i5-7300U, SanDisk X400 256GB, SATA (SD8SB8U-256G) | HP Spectre x360 13-ac033dx HD Graphics 620, i7-7500U, Samsung PM961 NVMe MZVLW512HMJP | Lenovo Yoga 910-13IKB-80VF004CGE HD Graphics 620, i7-7500U, Samsung PM951 NVMe MZVLV512 | |
|---|---|---|---|---|---|---|
| Noise | -6% | -3% | -5% | -10% | -9% | |
| av / miljö * (dB) | 28 | 29.1 -4% | 30.5 -9% | 30.5 -9% | 28.7 -2% | 31.7 -13% |
| Idle Minimum * (dB) | 28 | 29.1 -4% | 30.5 -9% | 30.5 -9% | 28.7 -2% | 31.7 -13% |
| Idle Average * (dB) | 28.8 | 29.1 -1% | 30.5 -6% | 30.5 -6% | 34.2 -19% | 31.7 -10% |
| Idle Maximum * (dB) | 30.3 | 31.2 -3% | 30.5 -1% | 30.5 -1% | 35.8 -18% | 31.7 -5% |
| Load Average * (dB) | 34.5 | 37.3 -8% | 34.2 1% | 36 -4% | 35.8 -4% | 38.4 -11% |
| Load Maximum * (dB) | 34.3 | 39.6 -15% | 32.5 5% | 34.6 -1% | 39.6 -15% | 34.7 -1% |
* ... mindre är bättre
(±) Den maximala temperaturen på ovansidan är 44.4 °C / 112 F, jämfört med genomsnittet av 35.4 °C / 96 F , allt från 19.6 till 60 °C för klassen Convertible.
(±) Botten värms upp till maximalt 42.8 °C / 109 F, jämfört med genomsnittet av 36.9 °C / 98 F
(+) Vid tomgångsbruk är medeltemperaturen för ovansidan 20.8 °C / 69 F, jämfört med enhetsgenomsnittet på 30.3 °C / ### class_avg_f### F.
(+) Handledsstöden och pekplattan är kallare än hudtemperaturen med maximalt 31.8 °C / 89.2 F och är därför svala att ta på.
(-) Medeltemperaturen för handledsstödsområdet på liknande enheter var 28 °C / 82.4 F (-3.8 °C / -6.8 F).
Lenovo Yoga 920-13IKB-80Y7 ljudanalys
(-) | inte särskilt höga högtalare (65.7 dB)
Bas 100 - 315 Hz
(±) | reducerad bas - i genomsnitt 14.7% lägre än medianen
(-) | basen är inte linjär (15.7% delta till föregående frekvens)
Mellan 400 - 2000 Hz
(+) | balanserad mellan - endast 2.3% från medianen
(+) | mids är linjära (5.5% delta till föregående frekvens)
Högsta 2 - 16 kHz
(+) | balanserade toppar - endast 2.9% från medianen
(+) | toppar är linjära (6.8% delta till föregående frekvens)
Totalt 100 - 16 000 Hz
(±) | linjäriteten för det totala ljudet är genomsnittlig (18.5% skillnad mot median)
Jämfört med samma klass
» 41% av alla testade enheter i den här klassen var bättre, 8% liknande, 51% sämre
» Den bästa hade ett delta på 6%, genomsnittet var 20%, sämst var 57%
Jämfört med alla testade enheter
» 42% av alla testade enheter var bättre, 8% liknande, 51% sämre
» Den bästa hade ett delta på 4%, genomsnittet var 23%, sämst var 134%
Apple MacBook 12 (Early 2016) 1.1 GHz ljudanalys
(+) | högtalare kan spela relativt högt (83.6 dB)
Bas 100 - 315 Hz
(±) | reducerad bas - i genomsnitt 11.3% lägre än medianen
(±) | linjäriteten för basen är genomsnittlig (14.2% delta till föregående frekvens)
Mellan 400 - 2000 Hz
(+) | balanserad mellan - endast 2.4% från medianen
(+) | mids är linjära (5.5% delta till föregående frekvens)
Högsta 2 - 16 kHz
(+) | balanserade toppar - endast 2% från medianen
(+) | toppar är linjära (4.5% delta till föregående frekvens)
Totalt 100 - 16 000 Hz
(+) | det totala ljudet är linjärt (10.2% skillnad mot median)
Jämfört med samma klass
» 7% av alla testade enheter i den här klassen var bättre, 2% liknande, 90% sämre
» Den bästa hade ett delta på 5%, genomsnittet var 18%, sämst var 53%
Jämfört med alla testade enheter
» 5% av alla testade enheter var bättre, 1% liknande, 94% sämre
» Den bästa hade ett delta på 4%, genomsnittet var 23%, sämst var 134%
| Av/Standby | |
| Låg belastning | |
| Hög belastning |
|
Förklaring:
min: | |
| Lenovo Yoga 920-13IKB-80Y7 i5-8550U, UHD Graphics 620, Samsung PM961 MZVLW256HEHP, IPS, 1920x1080, 13.9" | HP Spectre x360 13-w023dx i7-7500U, HD Graphics 620, Samsung PM951 NVMe MZVLV512, IPS, 1920x1080, 13.3" | Asus ZenBook Flip S UX370 i5-7200U, HD Graphics 620, SanDisk SD8SN8U256G1002, a-Si TFT-LCD, WLED, 1920x1080, 13.3" | HP Spectre x360 13-ac033dx i7-7500U, HD Graphics 620, Samsung PM961 NVMe MZVLW512HMJP, IPS, 3840x2160, 13.3" | Lenovo Yoga 910-13IKB-80VF004CGE i7-7500U, HD Graphics 620, Samsung PM951 NVMe MZVLV512, IPS, 3840x2160, 13.9" | Dell XPS 13-9365 2-in-1 i7-7Y75, HD Graphics 615, Toshiba NVMe THNSN5256GPUK, IPS, 1920x1080, 13.3" | Dell XPS 13 i7-8550U i5-8550U, UHD Graphics 620, Toshiba XG5 KXG50ZNV256G, IGZO IPS, 3200x1800, 13.3" | |
|---|---|---|---|---|---|---|---|
| Power Consumption | -15% | 11% | -32% | -8% | 26% | -9% | |
| Idle Minimum * (Watt) | 3.1 | 5.5 -77% | 2.6 16% | 5.3 -71% | 4.3 -39% | 3.1 -0% | 4.1 -32% |
| Idle Average * (Watt) | 6.6 | 6.7 -2% | 5.3 20% | 9.6 -45% | 6.3 5% | 4.3 35% | 5.8 12% |
| Idle Maximum * (Watt) | 7 | 7.1 -1% | 8.5 -21% | 10.1 -44% | 9 -29% | 4.9 30% | 6 14% |
| Load Average * (Watt) | 35.2 | 33.1 6% | 29 18% | 34.4 2% | 32.7 7% | 24.3 31% | 42.5 -21% |
| Load Maximum * (Watt) | 34.6 | 35.2 -2% | 27 22% | 34.8 -1% | 28.8 17% | 22.8 34% | 41.4 -20% |
* ... mindre är bättre
| Lenovo Yoga 920-13IKB-80Y7 i5-8550U, UHD Graphics 620, 70 Wh | HP Spectre x360 13-w023dx i7-7500U, HD Graphics 620, 57.8 Wh | Asus ZenBook Flip S UX370 i5-7200U, HD Graphics 620, 39 Wh | Dell Latitude 5289 i5-7300U, HD Graphics 620, 60 Wh | HP Spectre x360 13-ac033dx i7-7500U, HD Graphics 620, 57.8 Wh | Lenovo Yoga 910-13IKB-80VF004CGE i7-7500U, HD Graphics 620, 78 Wh | Dell XPS 13-9365 2-in-1 i7-7Y75, HD Graphics 615, 46 Wh | |
|---|---|---|---|---|---|---|---|
| Batteridrifttid | -19% | -21% | 3% | -30% | -5% | -5% | |
| Reader / Idle (h) | 27.6 | 20.6 -25% | 15.6 -43% | 28.8 4% | 13.2 -52% | 17.8 -36% | 16.2 -41% |
| WiFi v1.3 (h) | 11.4 | 9.3 -18% | 8.1 -29% | 11.8 4% | 9 -21% | 10.7 -6% | 11.4 0% |
| Load (h) | 2.3 | 2 -13% | 2.5 9% | 2.3 0% | 1.9 -17% | 2.9 26% | 2.9 26% |
För
Emot
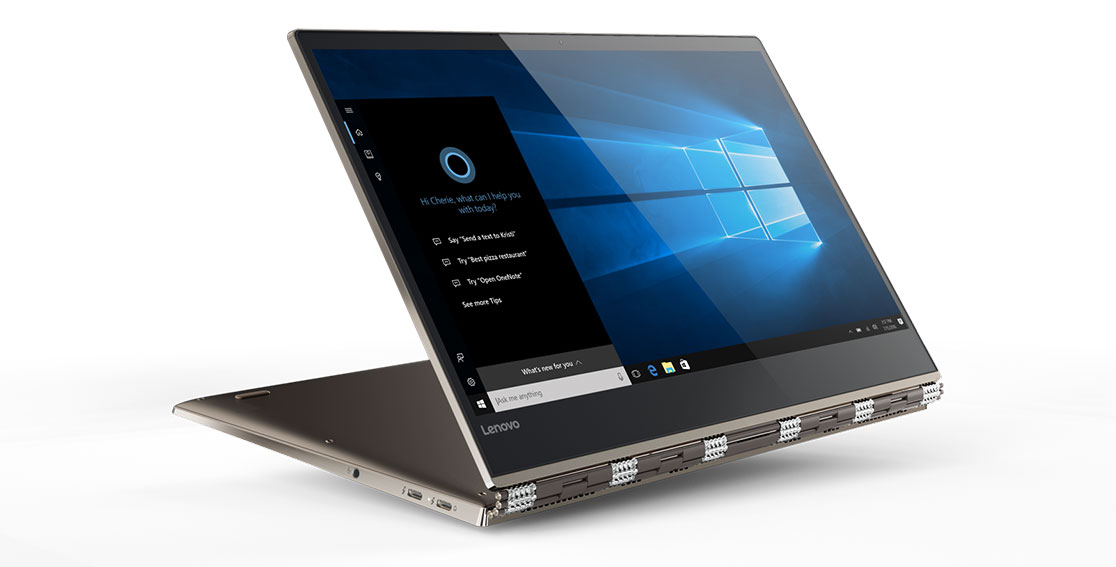
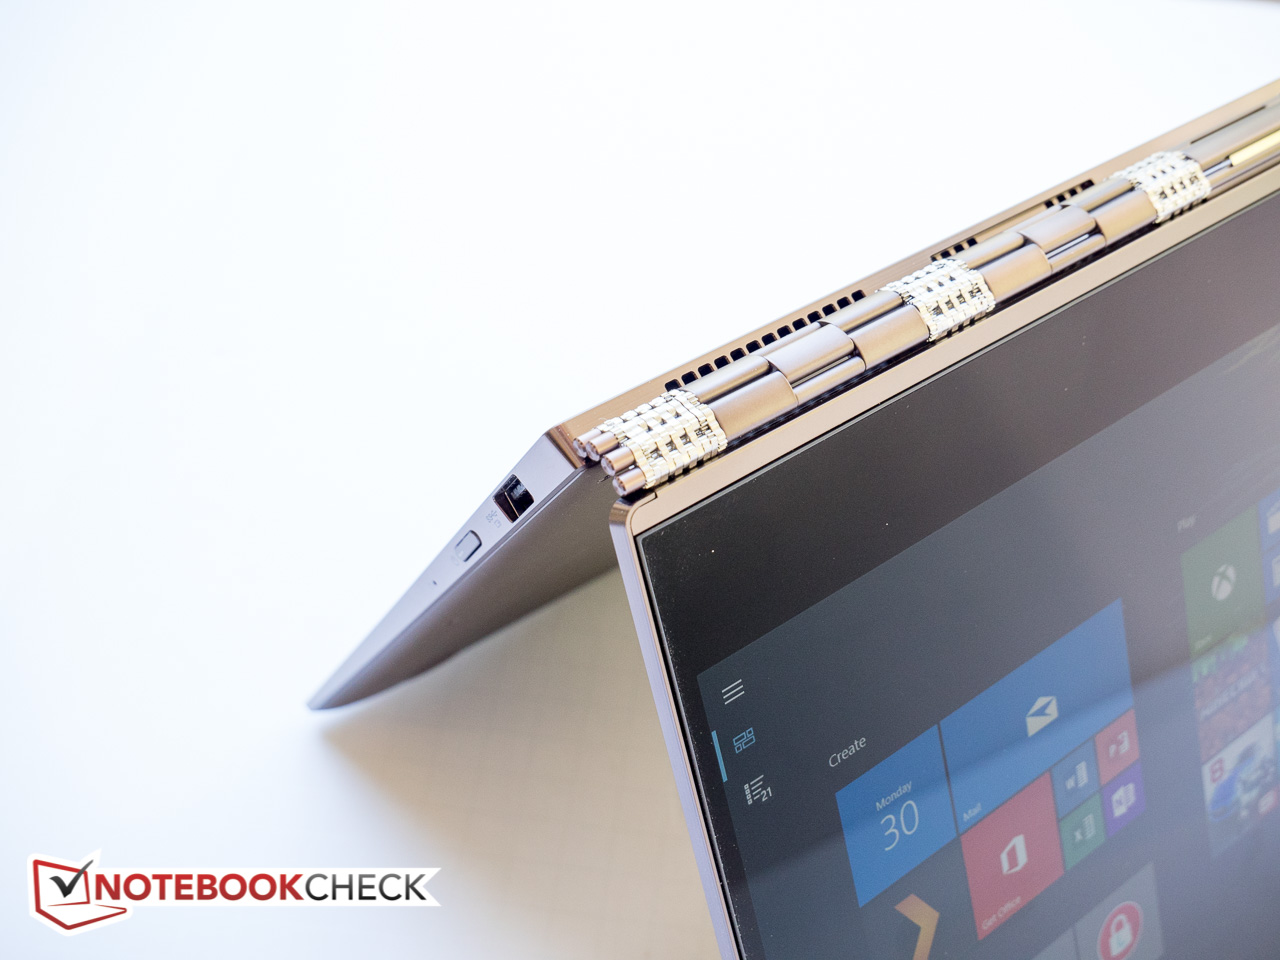
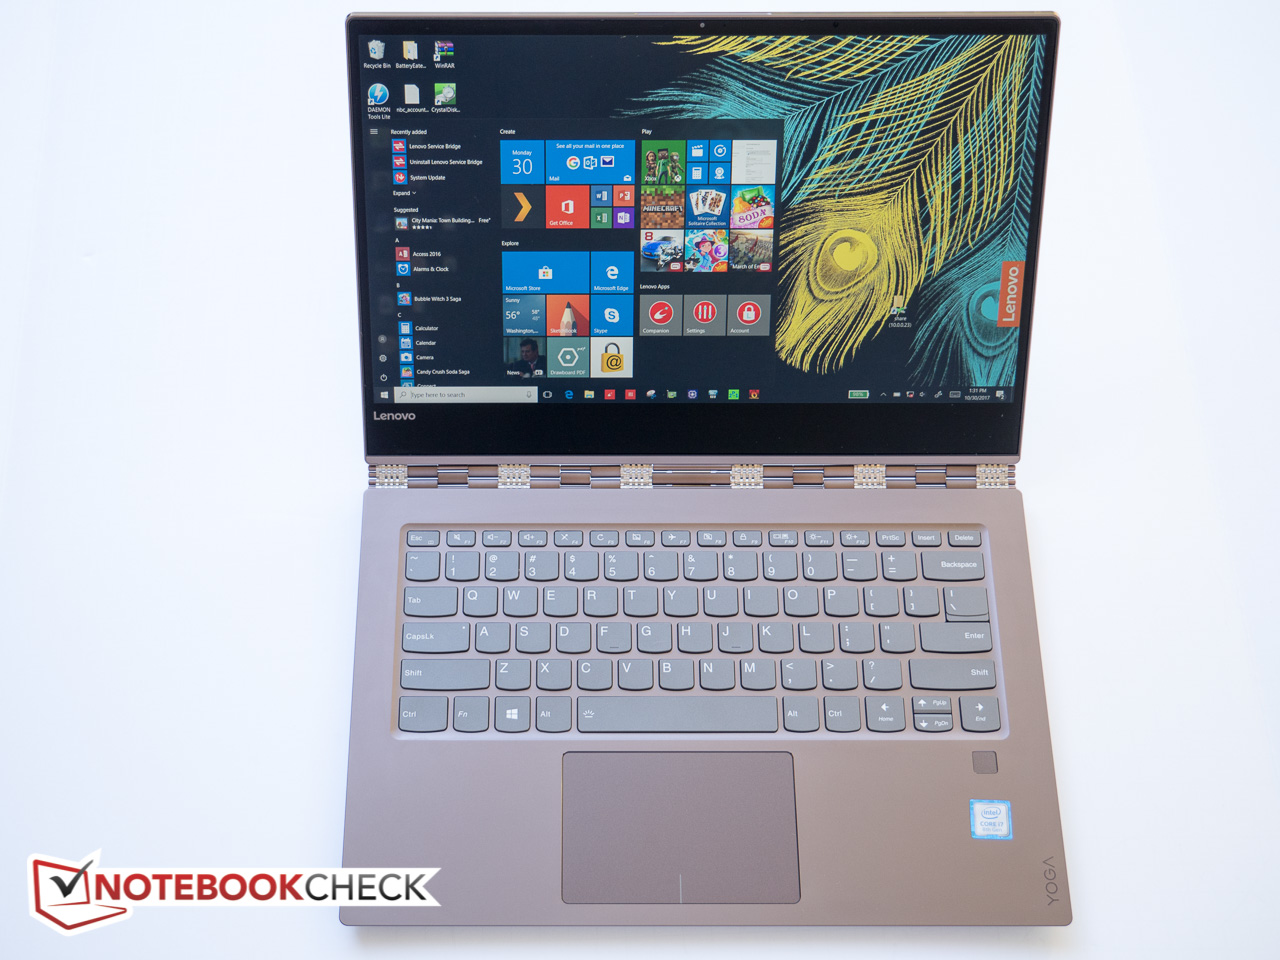
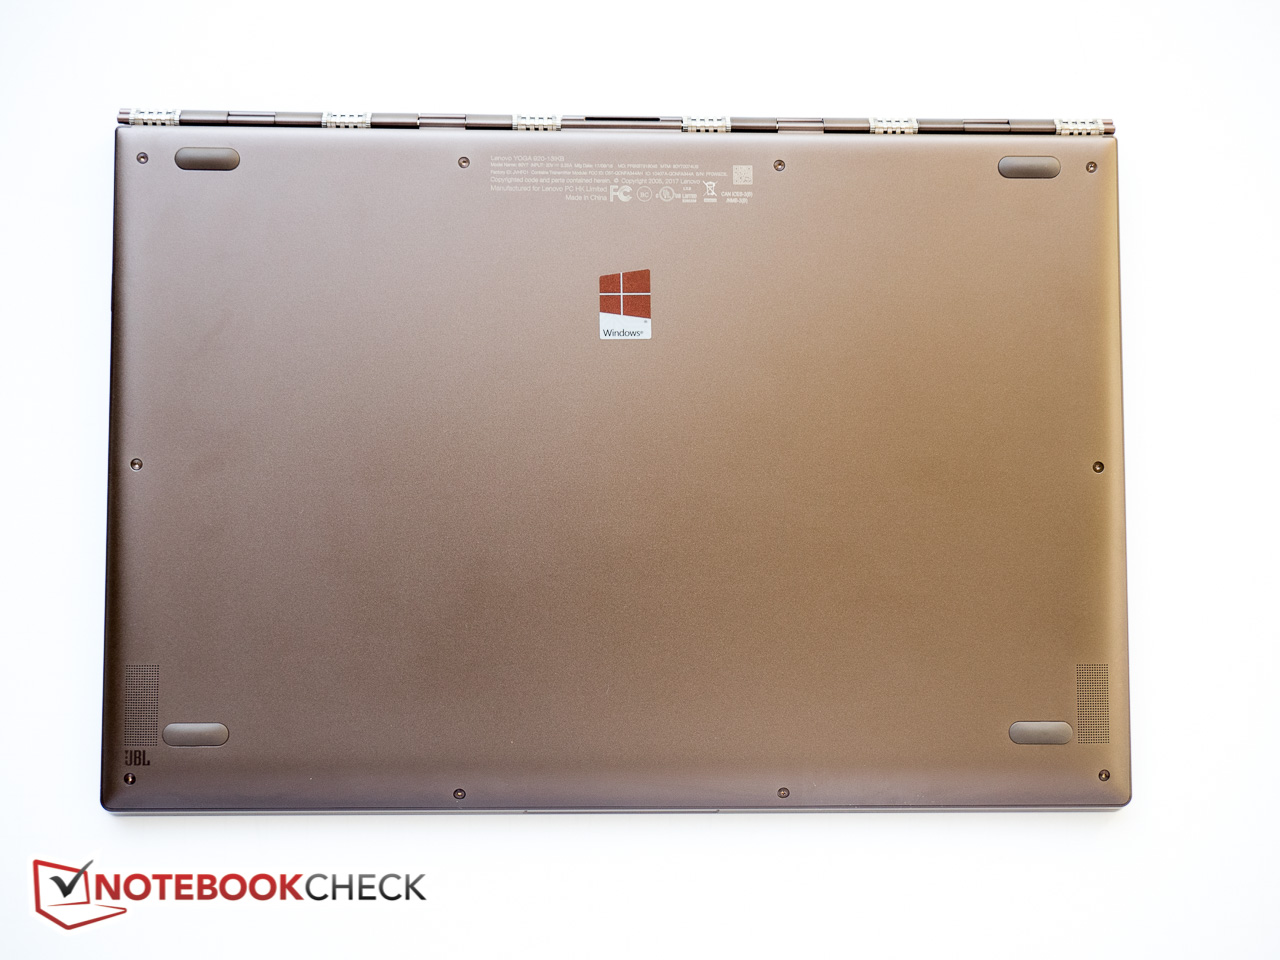
Den nya och omdesignade Yoga 920 är den bästa Yoga-modellen i 900-serien och långt från en enkel hårdvaru-uppgradering. Prestandan har definitivt gått upp med en nya fyrakärnig CPU och en blixtsnabb NVMe SSD, men Lenovo har också förbättrat andra områden: den nya omvandlingsbara modellen har nu 2st Thunderbolt 3-portar, en förbättrad placering av webkameran, ett ändrat tangentbord, den stödjer en aktiv stylus för första gången och håller längre på en laddning. Lenovo tog uppenbarligen till sig återkoppling från kunder, vilket är uppfriskande att se.
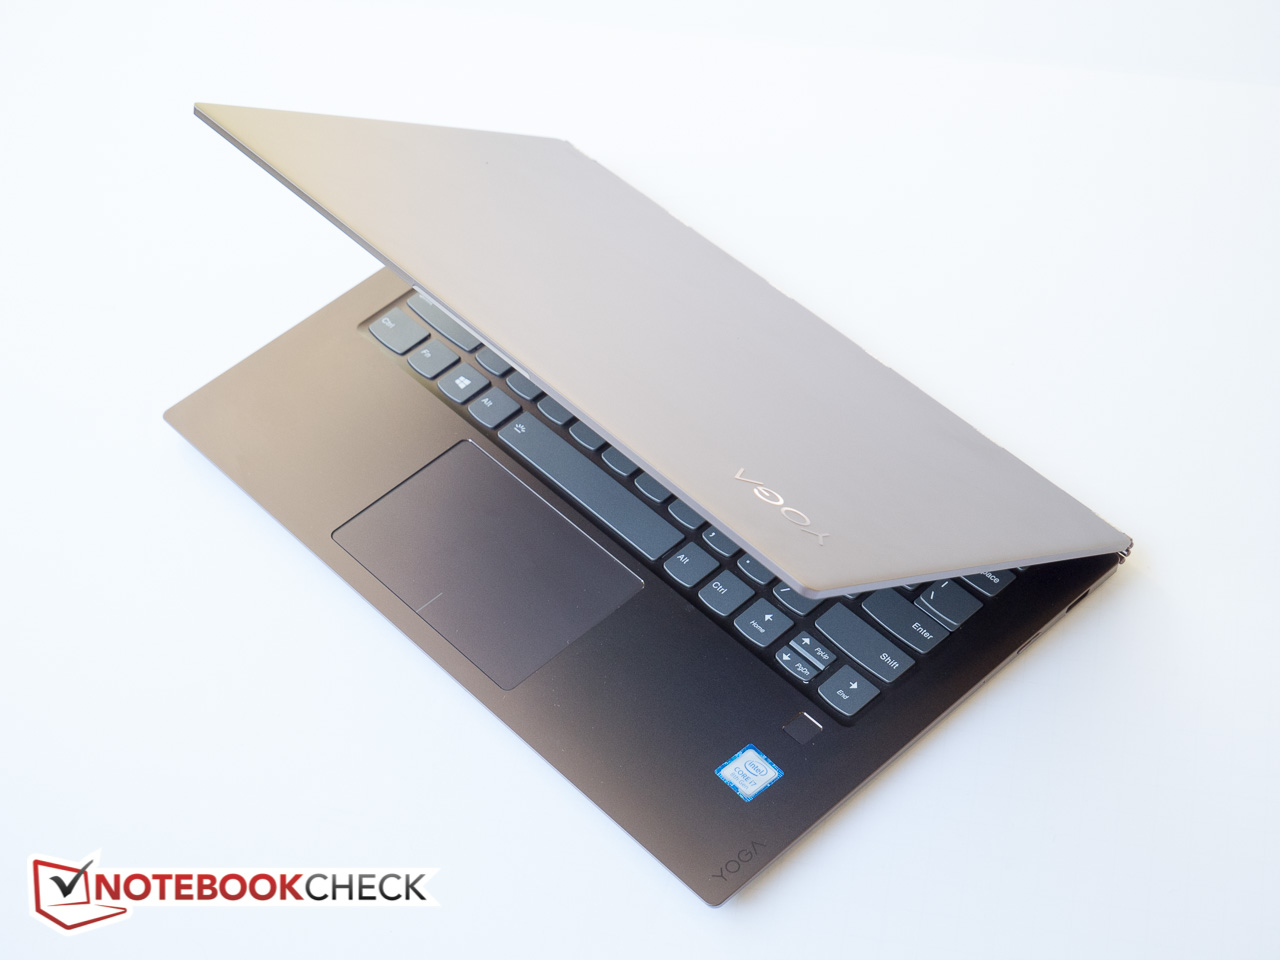
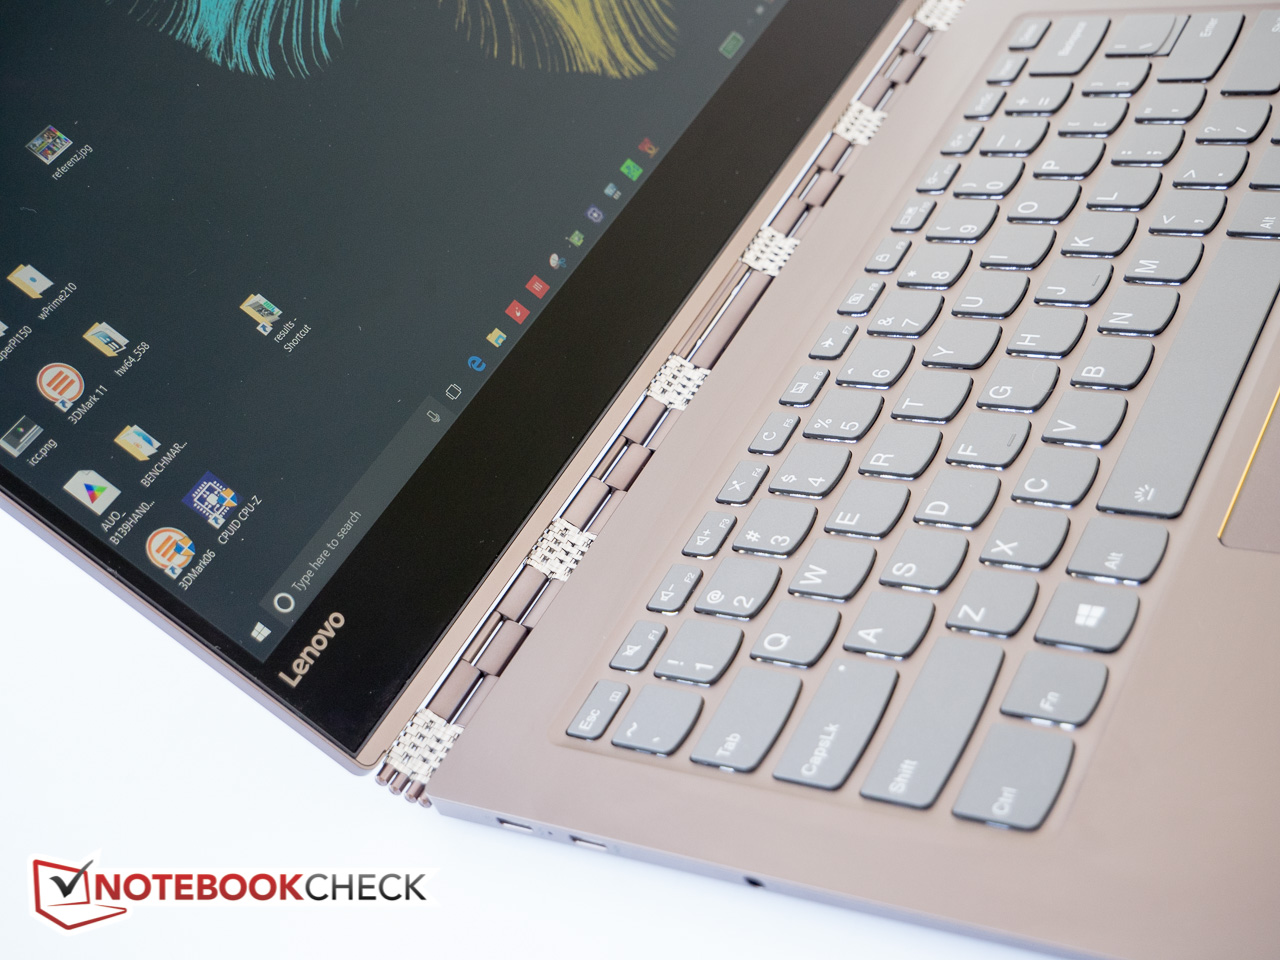
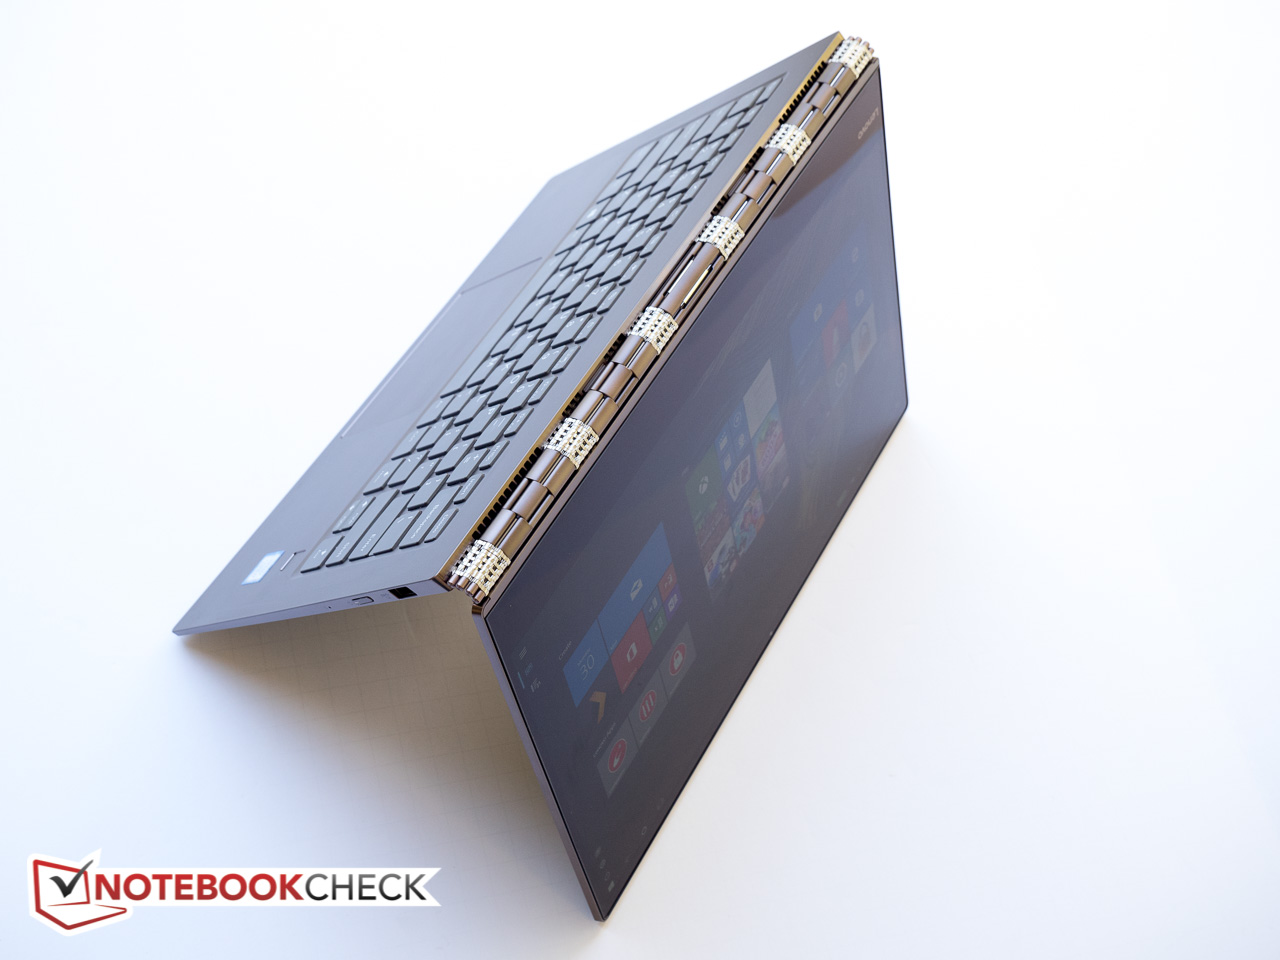
Aluminium-chassit är vackert och dessutom hyfsat robust och klockrems-gångjärnens design är iögonfallande. Skärmen kunde dock ha varit lite ljusstarkare och kontrast-ration och gråskale-exaktheten kunde också varit bättre. Sen är det frågan om storleken: Yoga är fortfarande en av dom större omvandlingsbara modellerna där ute, vilket gör att den inte är lätt att hålla i surfplatte-läge. En del användare kan dock uppskatta den extra skärmytan. Avsaknaden av en "Lift'n Lock"-funktion likt på Thinkpad lämnar också Yogas knappar blottade, så man behöver vara försiktig för att undvika skada. Strypningen under tung belastning inskränker den höga prestanda-potentialen hos dom extra CPU-kärnorna något, men helhetsprestandan har fortfarande gått upp, så vi skulle inte klassa det som en stor nackdel. Ytterligare ett plus, det irriterande visslande ljudet vi stötte på i vår recension av föregångaren Yoga 910 är definitivt inte längre ett problem.
Yoga 920 är en väldigt väldesignad och attraktiv 2-i-1. Användare som överväger omvandlingsbara modeller på 13.3 tum som HP Spectre x360 eller Dell XPS 13 borde definitivt också ta en titt på den aningen större Yoga.
Lenovo Yoga 920-13IKB-80Y7
- 11/02/2017 v6 (old)
Bernhard Pechlaner
Price comparison
