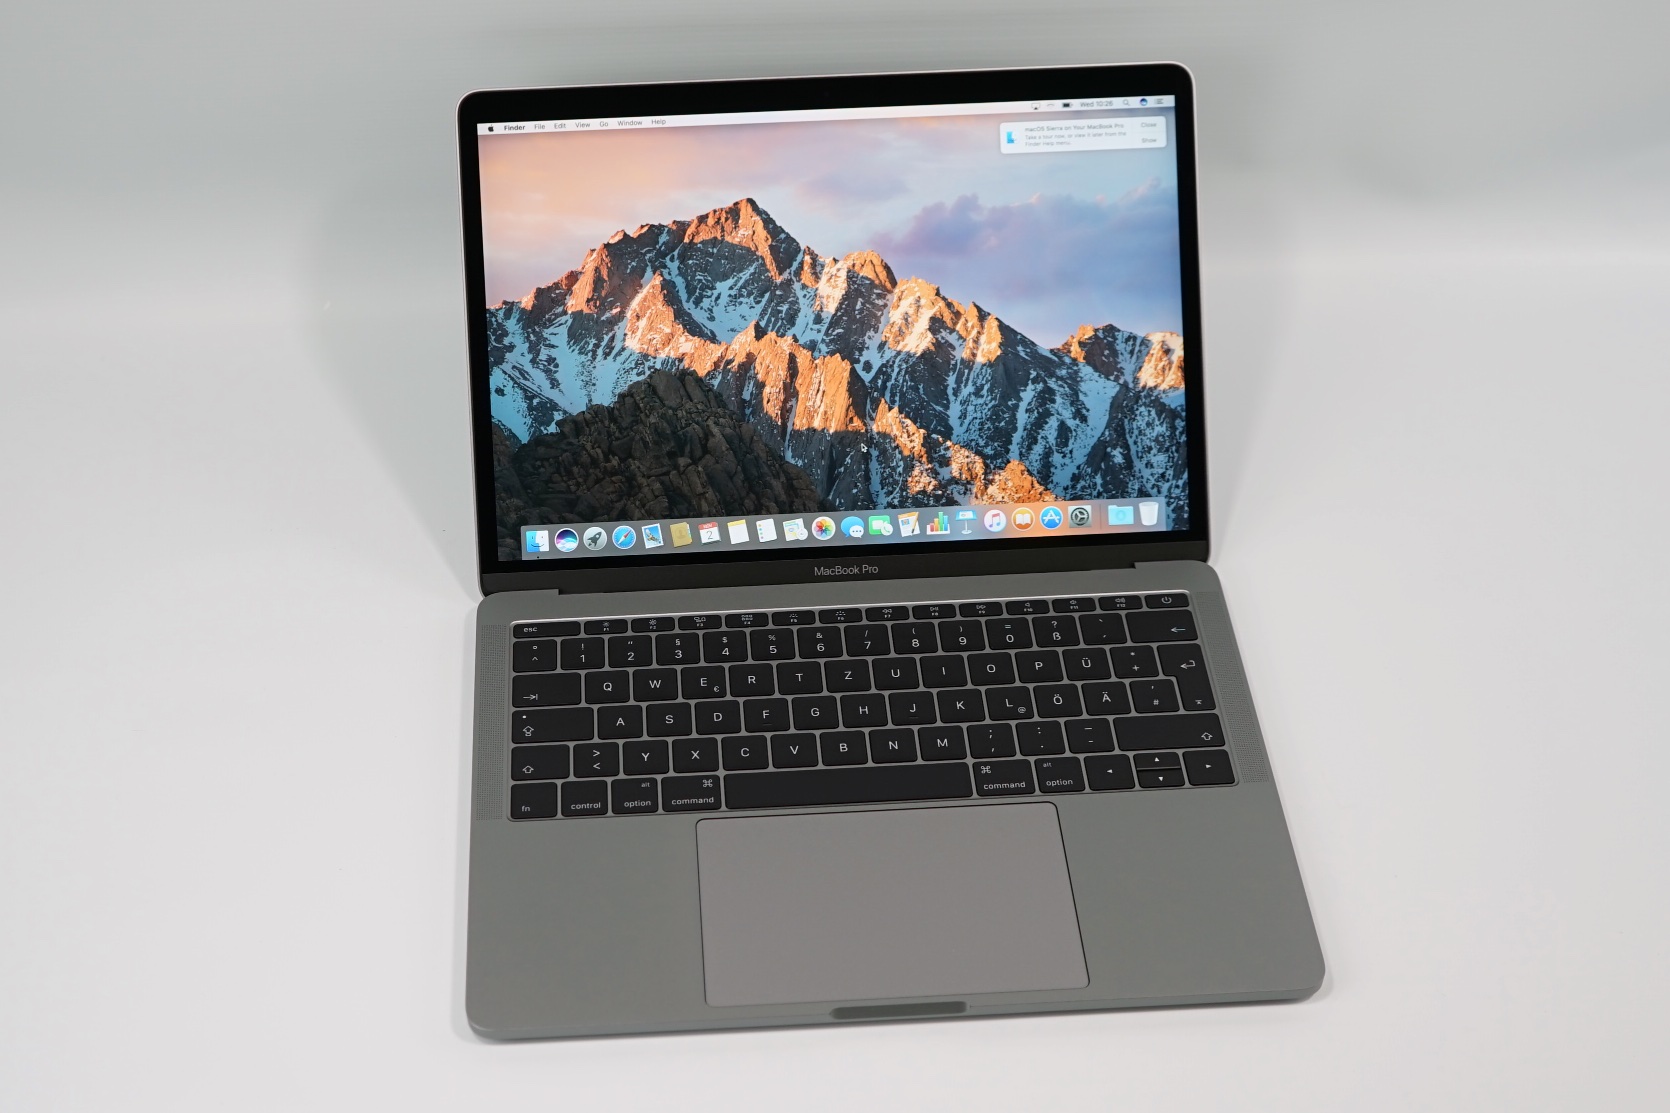
Test: Apple MacBook Pro 13 (2017, i5, utan Touch Bar) (sammanfattning)
| |||||||||||||||||||||||||
Distribution av ljusstyrkan: 92 %
Mitt på batteriet: 588 cd/m²
Kontrast: 1307:1 (Svärta: 0.45 cd/m²)
ΔE ColorChecker Calman: 1.7 | ∀{0.5-29.43 Ø4.72}
ΔE Greyscale Calman: 1.9 | ∀{0.09-98 Ø4.97}
99.94% sRGB (Argyll 1.6.3 3D)
77.92% AdobeRGB 1998 (Argyll 1.6.3 3D)
87.1% AdobeRGB 1998 (Argyll 3D)
99.9% sRGB (Argyll 3D)
99.2% Display P3 (Argyll 3D)
Gamma: 2.33
CCT: 6738 K
| Apple MacBook Pro 13 2017 APPA033, , 2560x1600, 13.3" | Apple MacBook Pro 13 2016 APPA034, , 2560x1600, 13.3" | Apple MacBook Pro 13 2017 Touchbar i5 APPA034, , 2560x1600, 13.3" | Lenovo ThinkPad X1 Carbon 2017-20HR0021GE B140HAN03_1, , 1920x1080, 14" | Razer Blade Stealth QHD i7-7500U Sharp SHP142F (LQ125T1JW02), , 2560x1440, 12.5" | Dell XPS 13 9360 QHD+ i7 Sharp SHP144A, , 3200x1800, 13.3" | |
|---|---|---|---|---|---|---|
| Display | -1% | -1% | -26% | -18% | -25% | |
| Display P3 Coverage (%) | 99.2 | 97.1 -2% | 98.6 -1% | 61.6 -38% | 68.7 -31% | 62.8 -37% |
| sRGB Coverage (%) | 99.9 | 99.8 0% | 100 0% | 87.6 -12% | 95.8 -4% | 89.4 -11% |
| AdobeRGB 1998 Coverage (%) | 87.1 | 86.7 0% | 86.5 -1% | 62.6 -28% | 69.9 -20% | 64.6 -26% |
| Response Times | -45% | -15% | -9% | -1% | -2% | |
| Response Time Grey 50% / Grey 80% * (ms) | 42.8 ? | 47.2 ? -10% | 48 ? -12% | 48 ? -12% | 37 ? 14% | 43.6 ? -2% |
| Response Time Black / White * (ms) | 28.8 ? | 51.6 ? -79% | 33.6 ? -17% | 30.4 ? -6% | 33.4 ? -16% | 29.2 ? -1% |
| PWM Frequency (Hz) | 119000 ? | 200 ? | ||||
| Screen | -3% | 15% | -42% | -48% | -43% | |
| Brightness middle (cd/m²) | 588 | 600 2% | 551 -6% | 278 -53% | 402 -32% | 396.2 -33% |
| Brightness (cd/m²) | 561 | 564 1% | 514 -8% | 271 -52% | 382 -32% | 357 -36% |
| Brightness Distribution (%) | 92 | 89 -3% | 88 -4% | 91 -1% | 88 -4% | 84 -9% |
| Black Level * (cd/m²) | 0.45 | 0.57 -27% | 0.48 -7% | 0.16 64% | 0.45 -0% | 0.266 41% |
| Contrast (:1) | 1307 | 1053 -19% | 1148 -12% | 1738 33% | 893 -32% | 1489 14% |
| Colorchecker dE 2000 * | 1.7 | 1.5 12% | 0.8 53% | 4.5 -165% | 3.6 -112% | 3.9 -129% |
| Colorchecker dE 2000 max. * | 3.5 | 2.9 17% | 1.4 60% | 8.4 -140% | 7.5 -114% | 7.58 -117% |
| Greyscale dE 2000 * | 1.9 | 2 -5% | 1 47% | 3.2 -68% | 4.3 -126% | 4.16 -119% |
| Gamma | 2.33 94% | 2.27 97% | 2.16 102% | 2.02 109% | 2.1 105% | 2.31 95% |
| CCT | 6738 96% | 6855 95% | 6672 97% | 7042 92% | 6572 99% | 6514 100% |
| Color Space (Percent of AdobeRGB 1998) (%) | 77.92 | 77 -1% | 57 -27% | 62.3 -20% | 57.5 -26% | |
| Color Space (Percent of sRGB) (%) | 99.94 | 92 -8% | 87.5 -12% | 95.7 -4% | 88.7 -11% | |
| Totalt genomsnitt (program/inställningar) | -16% /
-8% | -0% /
7% | -26% /
-34% | -22% /
-36% | -23% /
-33% |
* ... mindre är bättre

| Cinebench R15 | |
| CPU Single 64Bit | |
| Microsoft Surface Pro (2017) i7 | |
| Apple MacBook Pro 15 2017 (2.8 GHz, 555) | |
| Apple MacBook Pro 15 2017 (2.8 GHz, 555) | |
| Dell XPS 13 9360 FHD i7 Iris | |
| Apple MacBook Pro 13 2017 | |
| Apple MacBook Pro 13 2017 | |
| Dell Latitude 5580 | |
| Apple MacBook Pro 13 2017 Touchbar i5 | |
| Razer Blade Stealth QHD i7-7500U | |
| Asus Zenbook UX3430UQ-GV012T | |
| Apple MacBook Pro 13 2016 | |
| Apple MacBook Pro 13 2016 | |
| Lenovo ThinkPad X1 Carbon 2017-20HR0021GE | |
| CPU Multi 64Bit | |
| Apple MacBook Pro 15 2017 (2.8 GHz, 555) | |
| Apple MacBook Pro 15 2017 (2.8 GHz, 555) | |
| Microsoft Surface Pro (2017) i7 | |
| Apple MacBook Pro 13 2017 Touchbar i5 | |
| Apple MacBook Pro 13 2017 | |
| Apple MacBook Pro 13 2017 | |
| Razer Blade Stealth QHD i7-7500U | |
| Asus Zenbook UX3430UQ-GV012T | |
| Dell XPS 13 9360 FHD i7 Iris | |
| Dell Latitude 5580 | |
| Lenovo ThinkPad X1 Carbon 2017-20HR0021GE | |
| Apple MacBook Pro 13 2016 | |
| Apple MacBook Pro 13 2016 | |
Ljudnivå
| Låg belastning |
| 30.2 / 30.2 / 30.2 dB(A) |
| Hög belastning |
| 32.9 / 39.3 dB(A) |
 | ||
30 dB tyst 40 dB(A) hörbar 50 dB(A) högt ljud |
||
min: | ||
(±) Den maximala temperaturen på ovansidan är 43.5 °C / 110 F, jämfört med genomsnittet av 35.9 °C / 97 F , allt från 21.4 till 59 °C för klassen Subnotebook.
(±) Botten värms upp till maximalt 40.6 °C / 105 F, jämfört med genomsnittet av 39.2 °C / 103 F
(+) Vid tomgångsbruk är medeltemperaturen för ovansidan 26.1 °C / 79 F, jämfört med enhetsgenomsnittet på 30.8 °C / ### class_avg_f### F.
(+) Handledsstöden och pekplattan når maximal hudtemperatur (32.7 °C / 90.9 F) och är därför inte varma.
(-) Medeltemperaturen för handledsstödsområdet på liknande enheter var 28.2 °C / 82.8 F (-4.5 °C / -8.1 F).
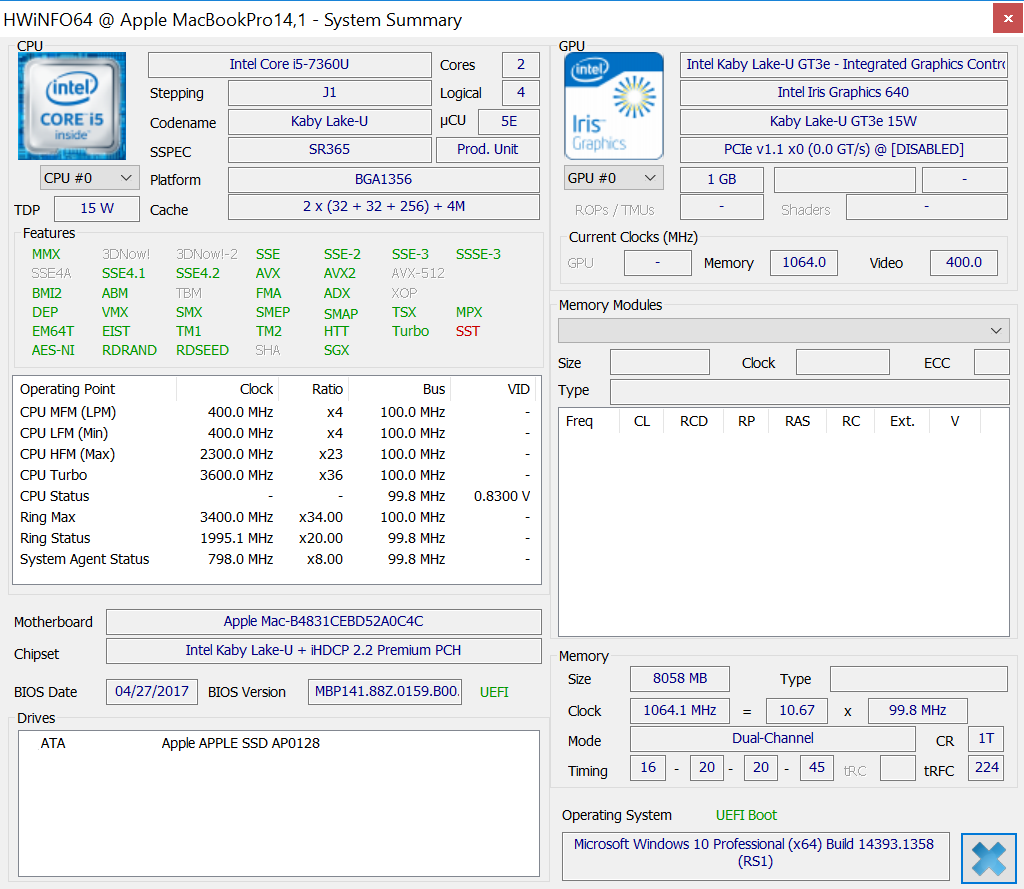
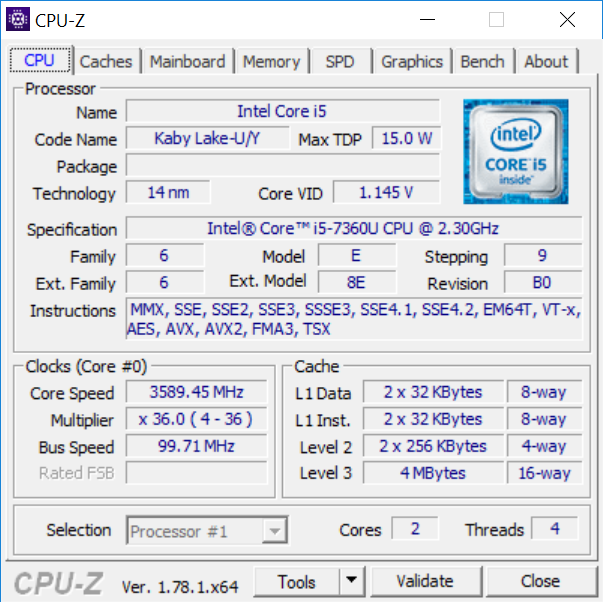
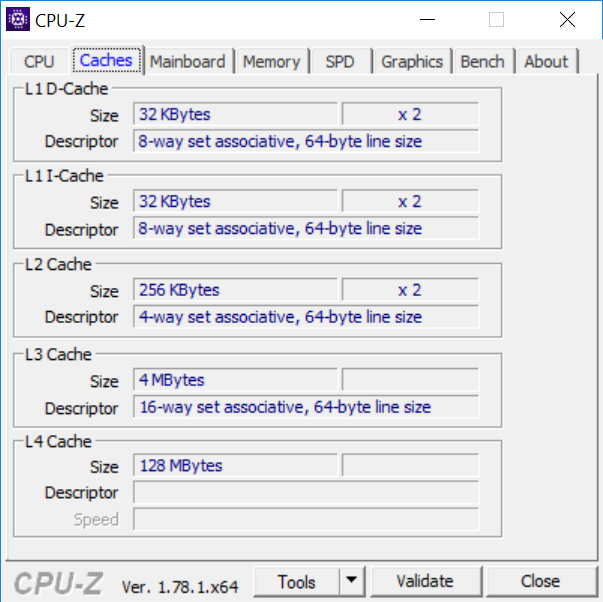
| Apple MacBook Pro 13 2017 i5-7360U, Iris Plus Graphics 640, 54.5 Wh | Apple MacBook Pro 13 2016 6360U, Iris Graphics 540, 54 Wh | Dell XPS 13 9360 QHD+ i7 i7-7500U, HD Graphics 620, 60 Wh | Apple MacBook Pro 13 2017 Touchbar i5 i5-7267U, Iris Plus Graphics 650, 49.2 Wh | Apple MacBook Pro 15 2017 (2.8 GHz, 555) i7-7700HQ, Radeon Pro 555, 76 Wh | Lenovo ThinkPad X1 Carbon 2017-20HR0021GE i5-7200U, HD Graphics 620, 57 Wh | |
|---|---|---|---|---|---|---|
| Batteridrifttid | 0% | -25% | -24% | -6% | -20% | |
| WiFi v1.3 (h) | 11.4 | 11.4 0% | 8.6 -25% | 8.7 -24% | 10.7 -6% | 9.1 -20% |
| Witcher 3 ultra (h) | 1.5 |
Läs det kompletta originaltestet på engelska här.
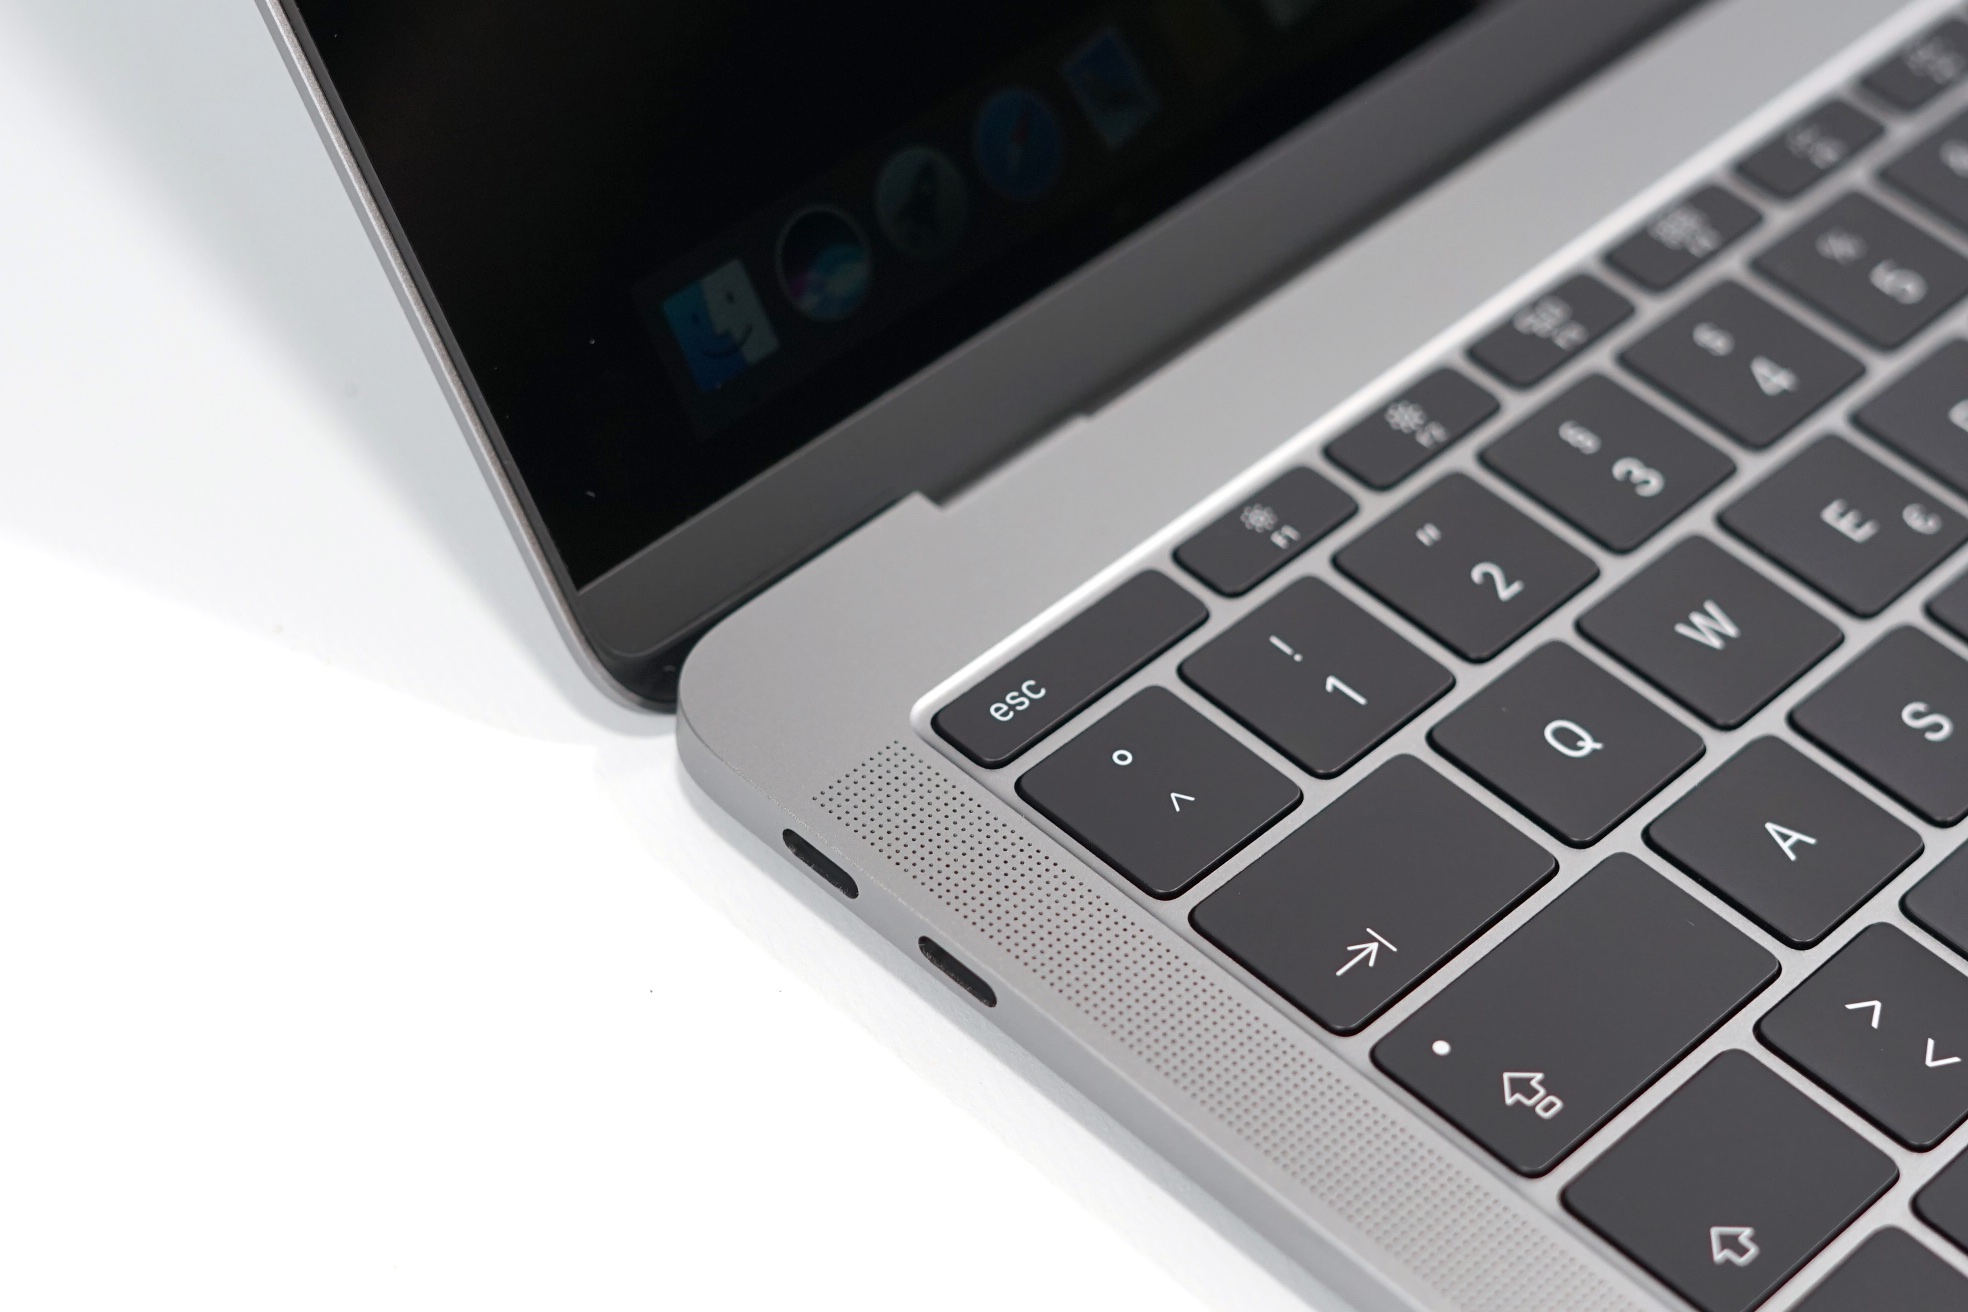
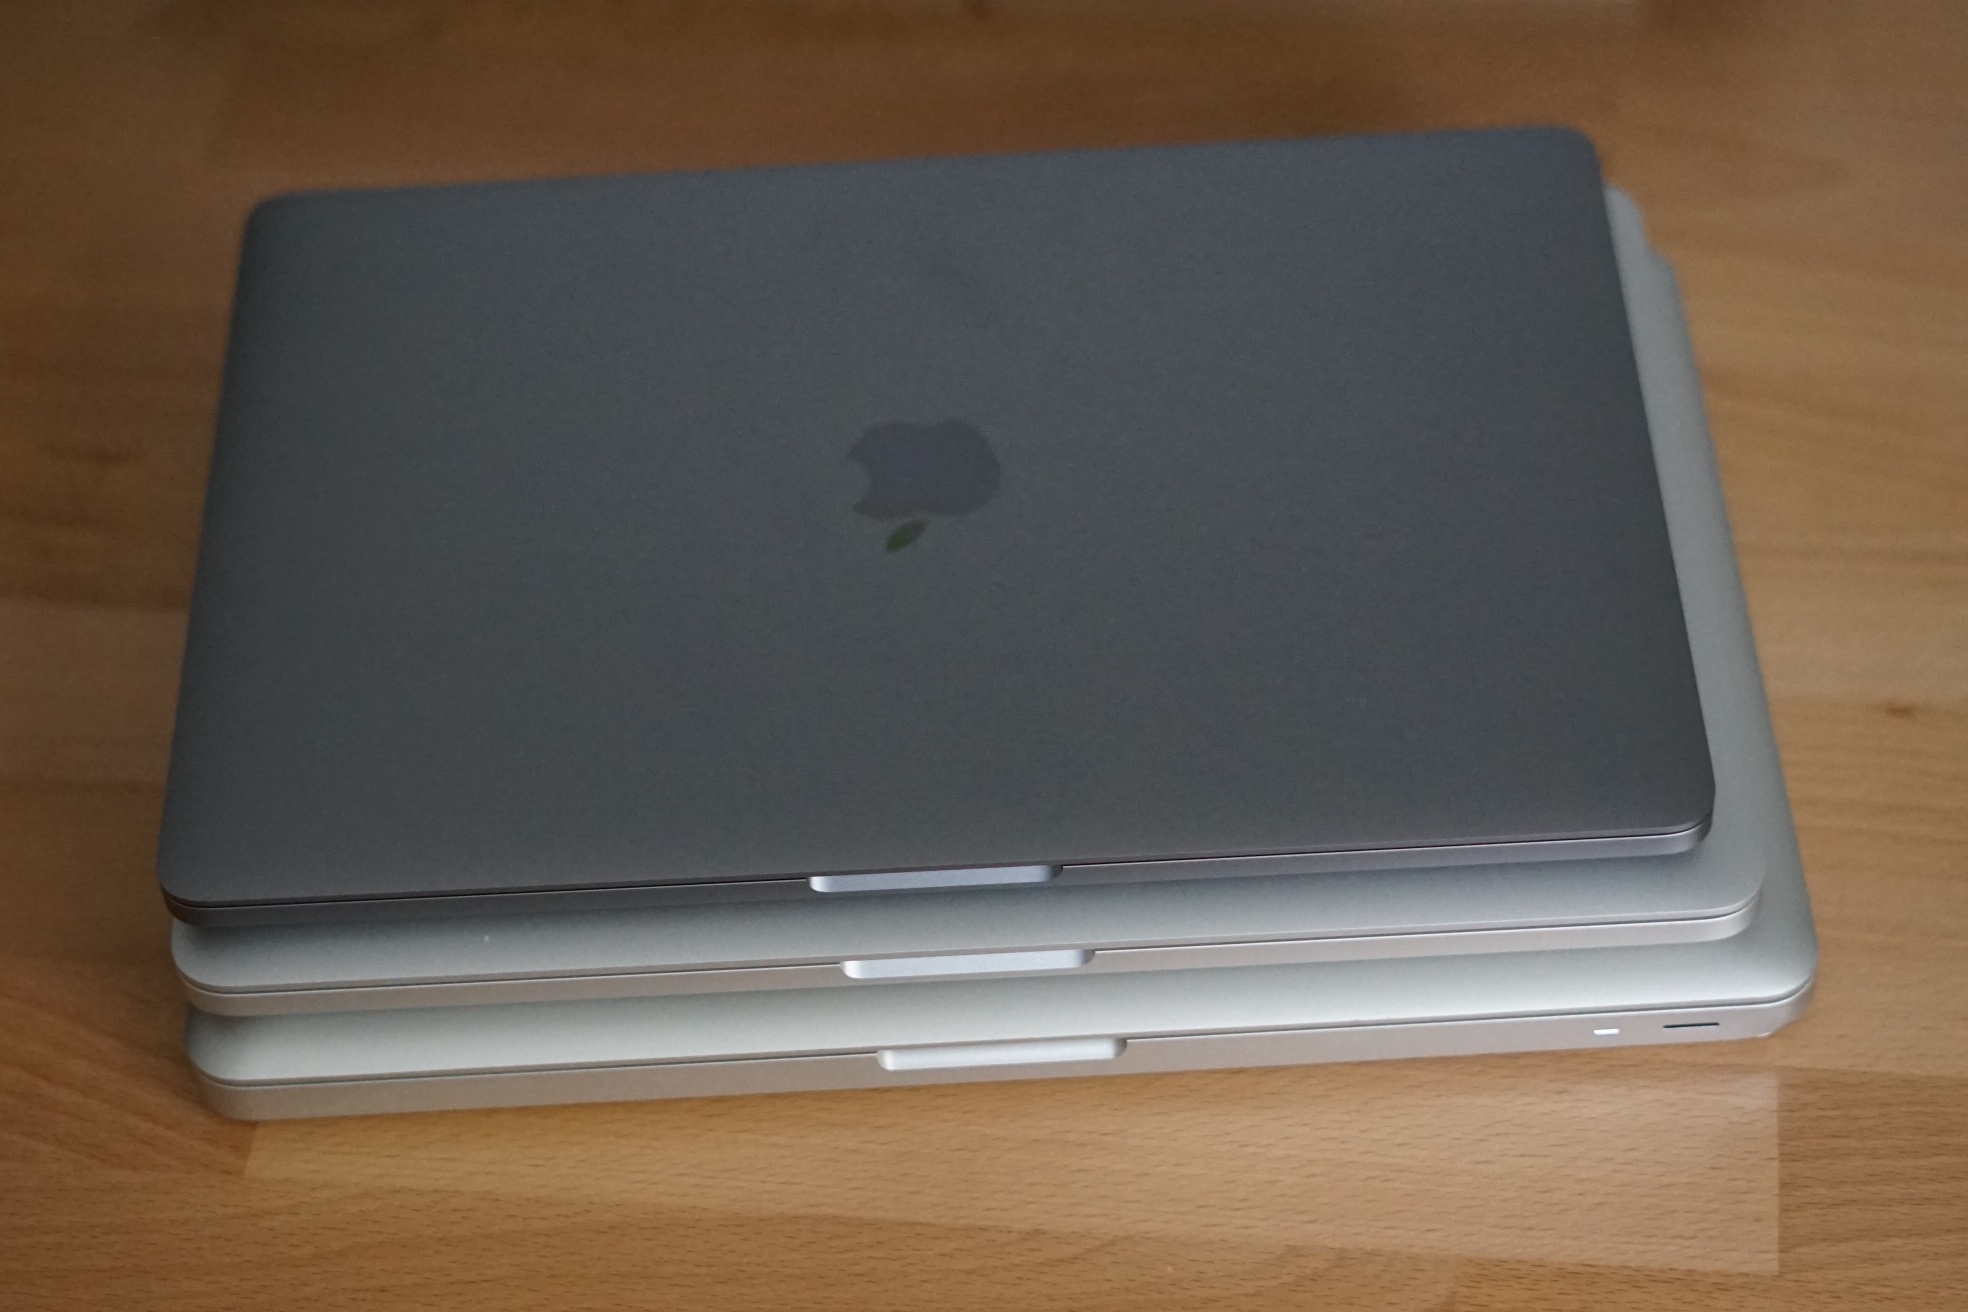
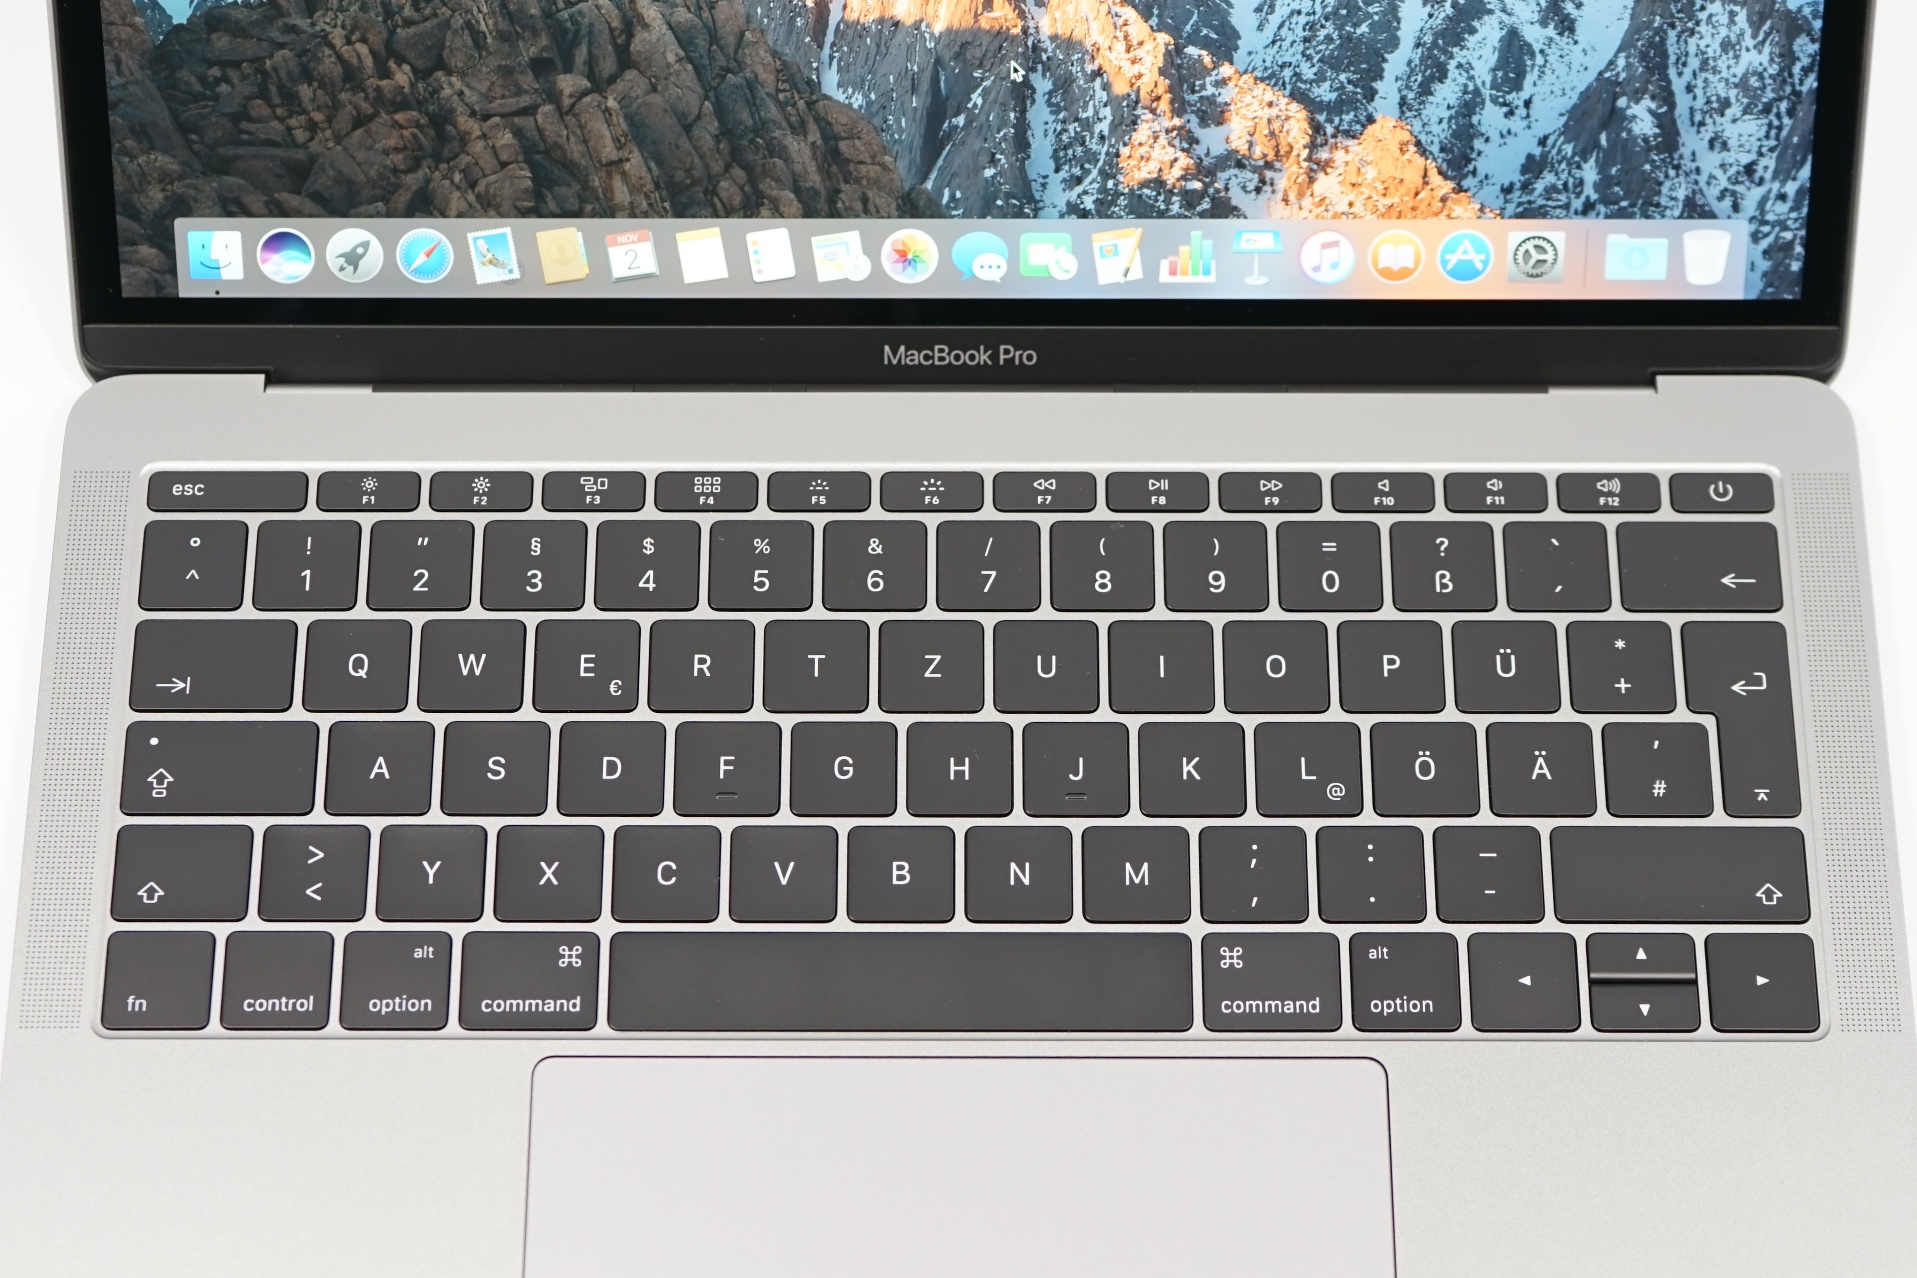
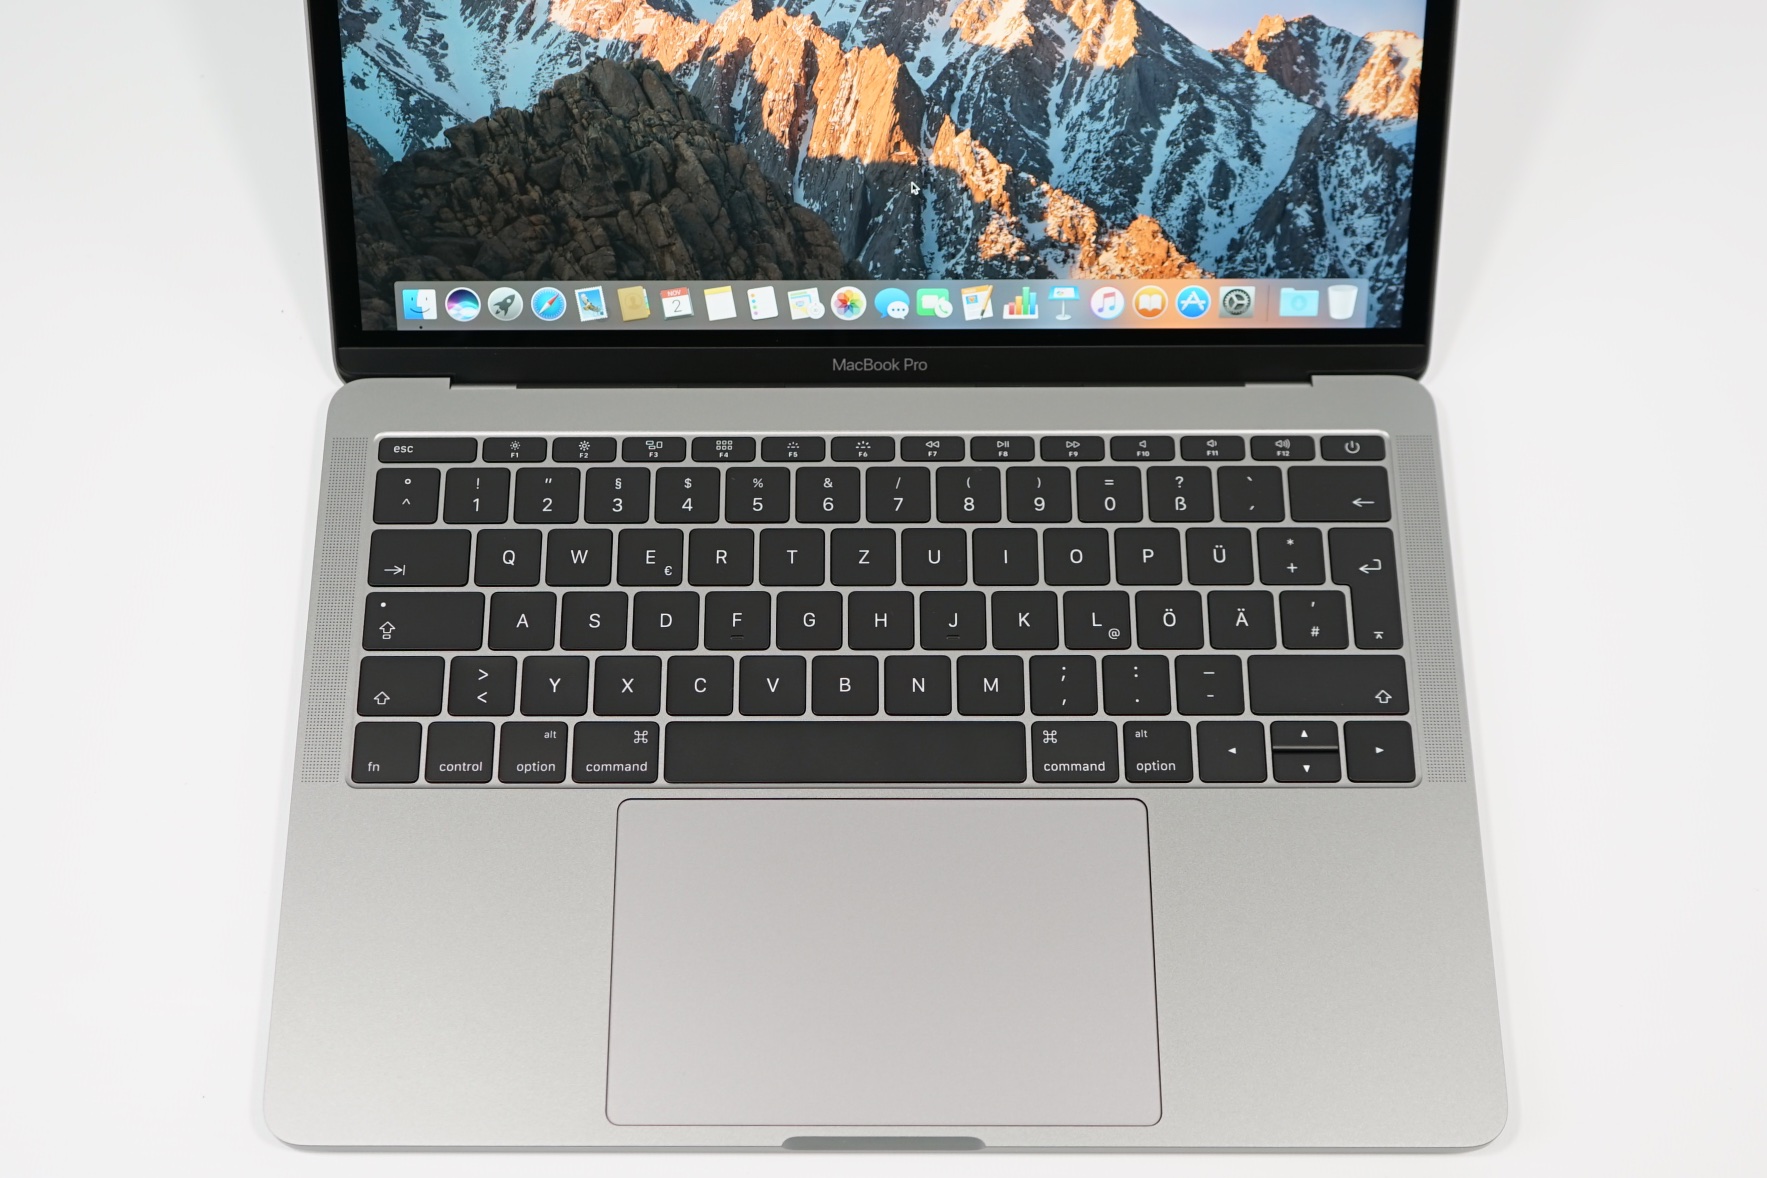
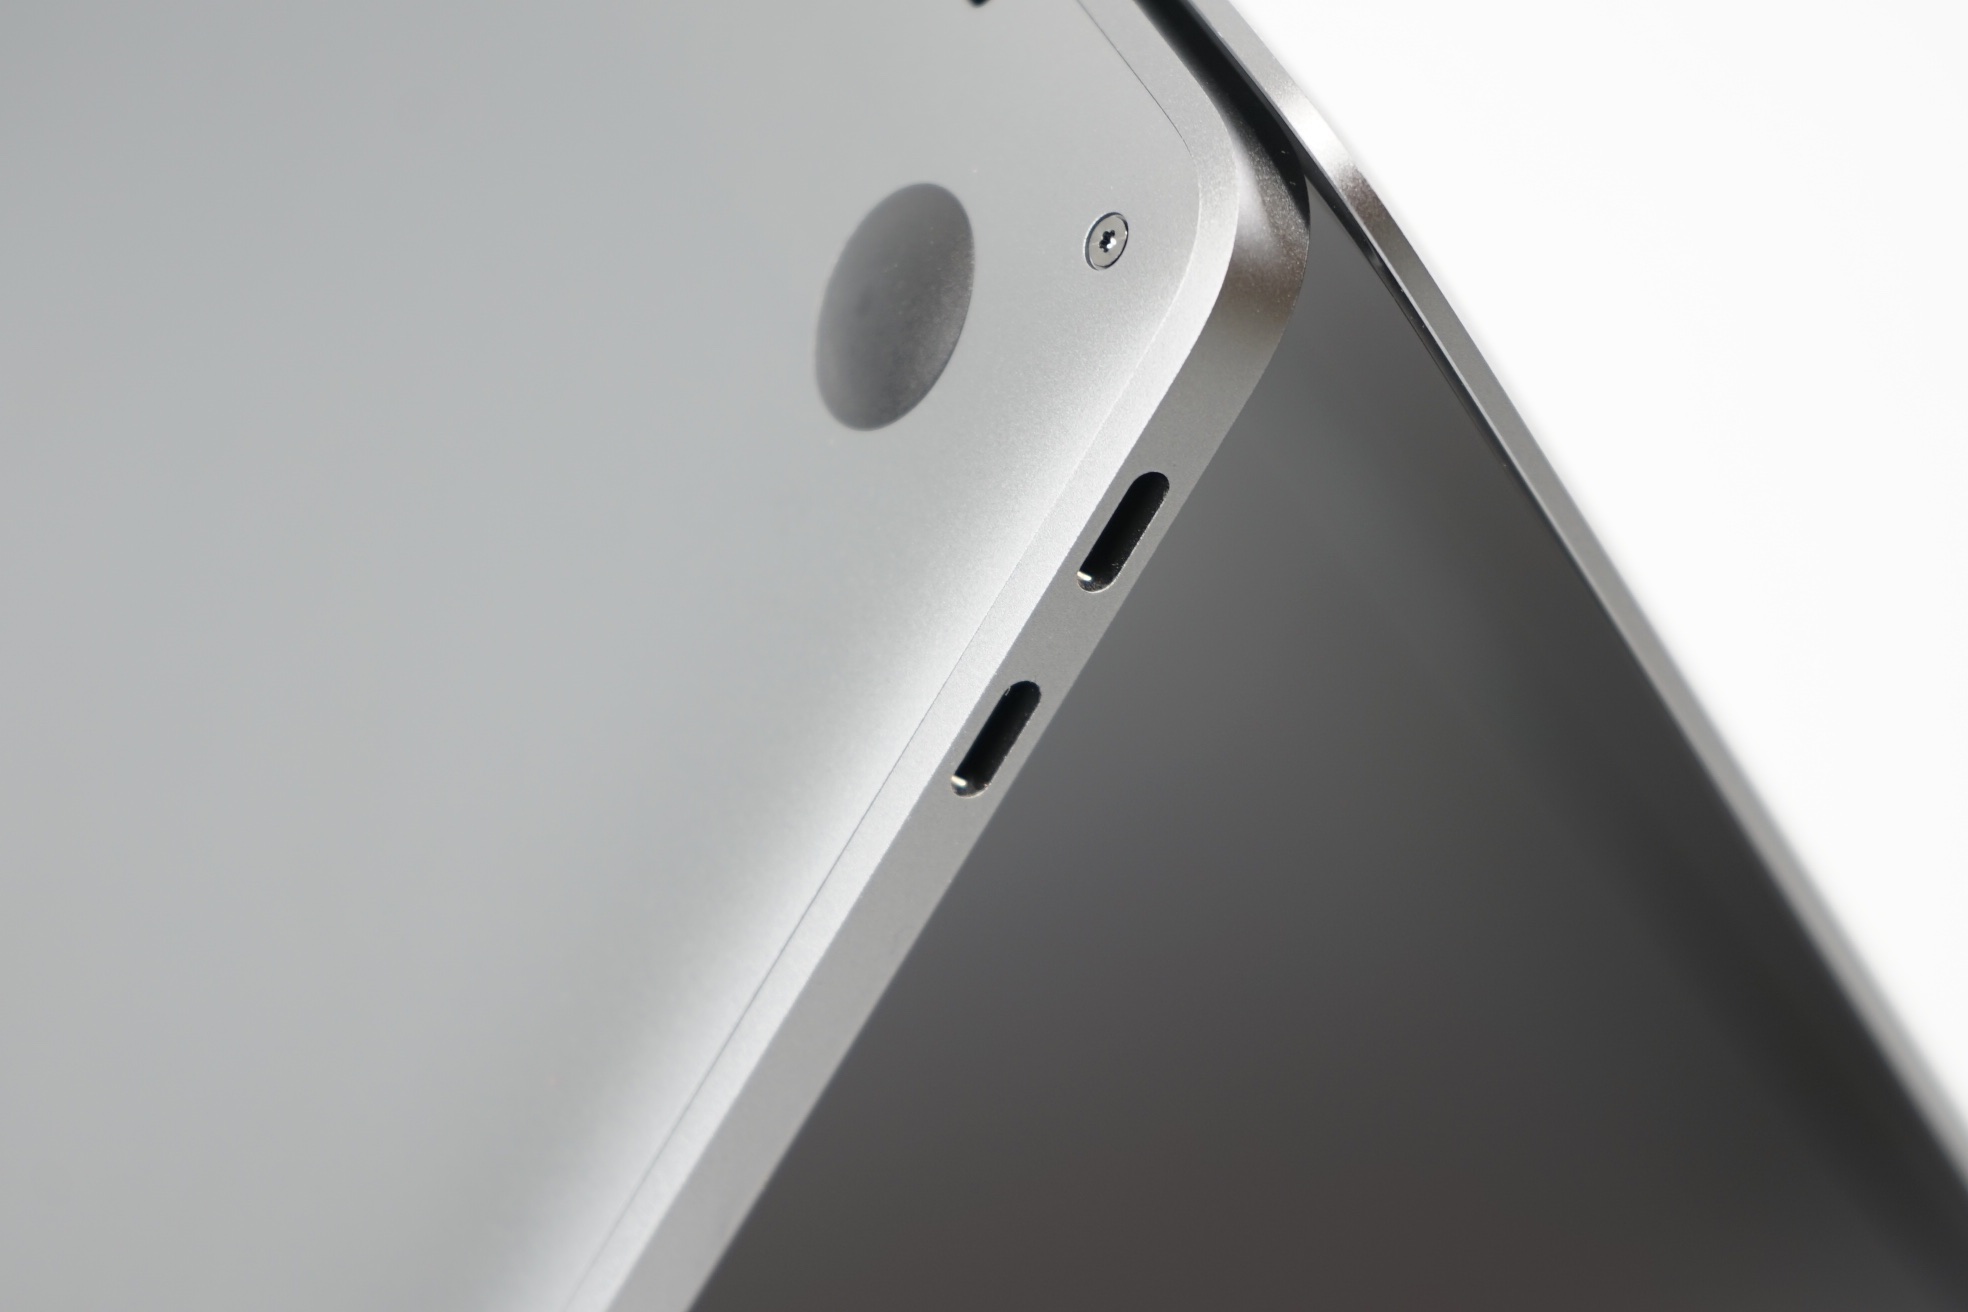
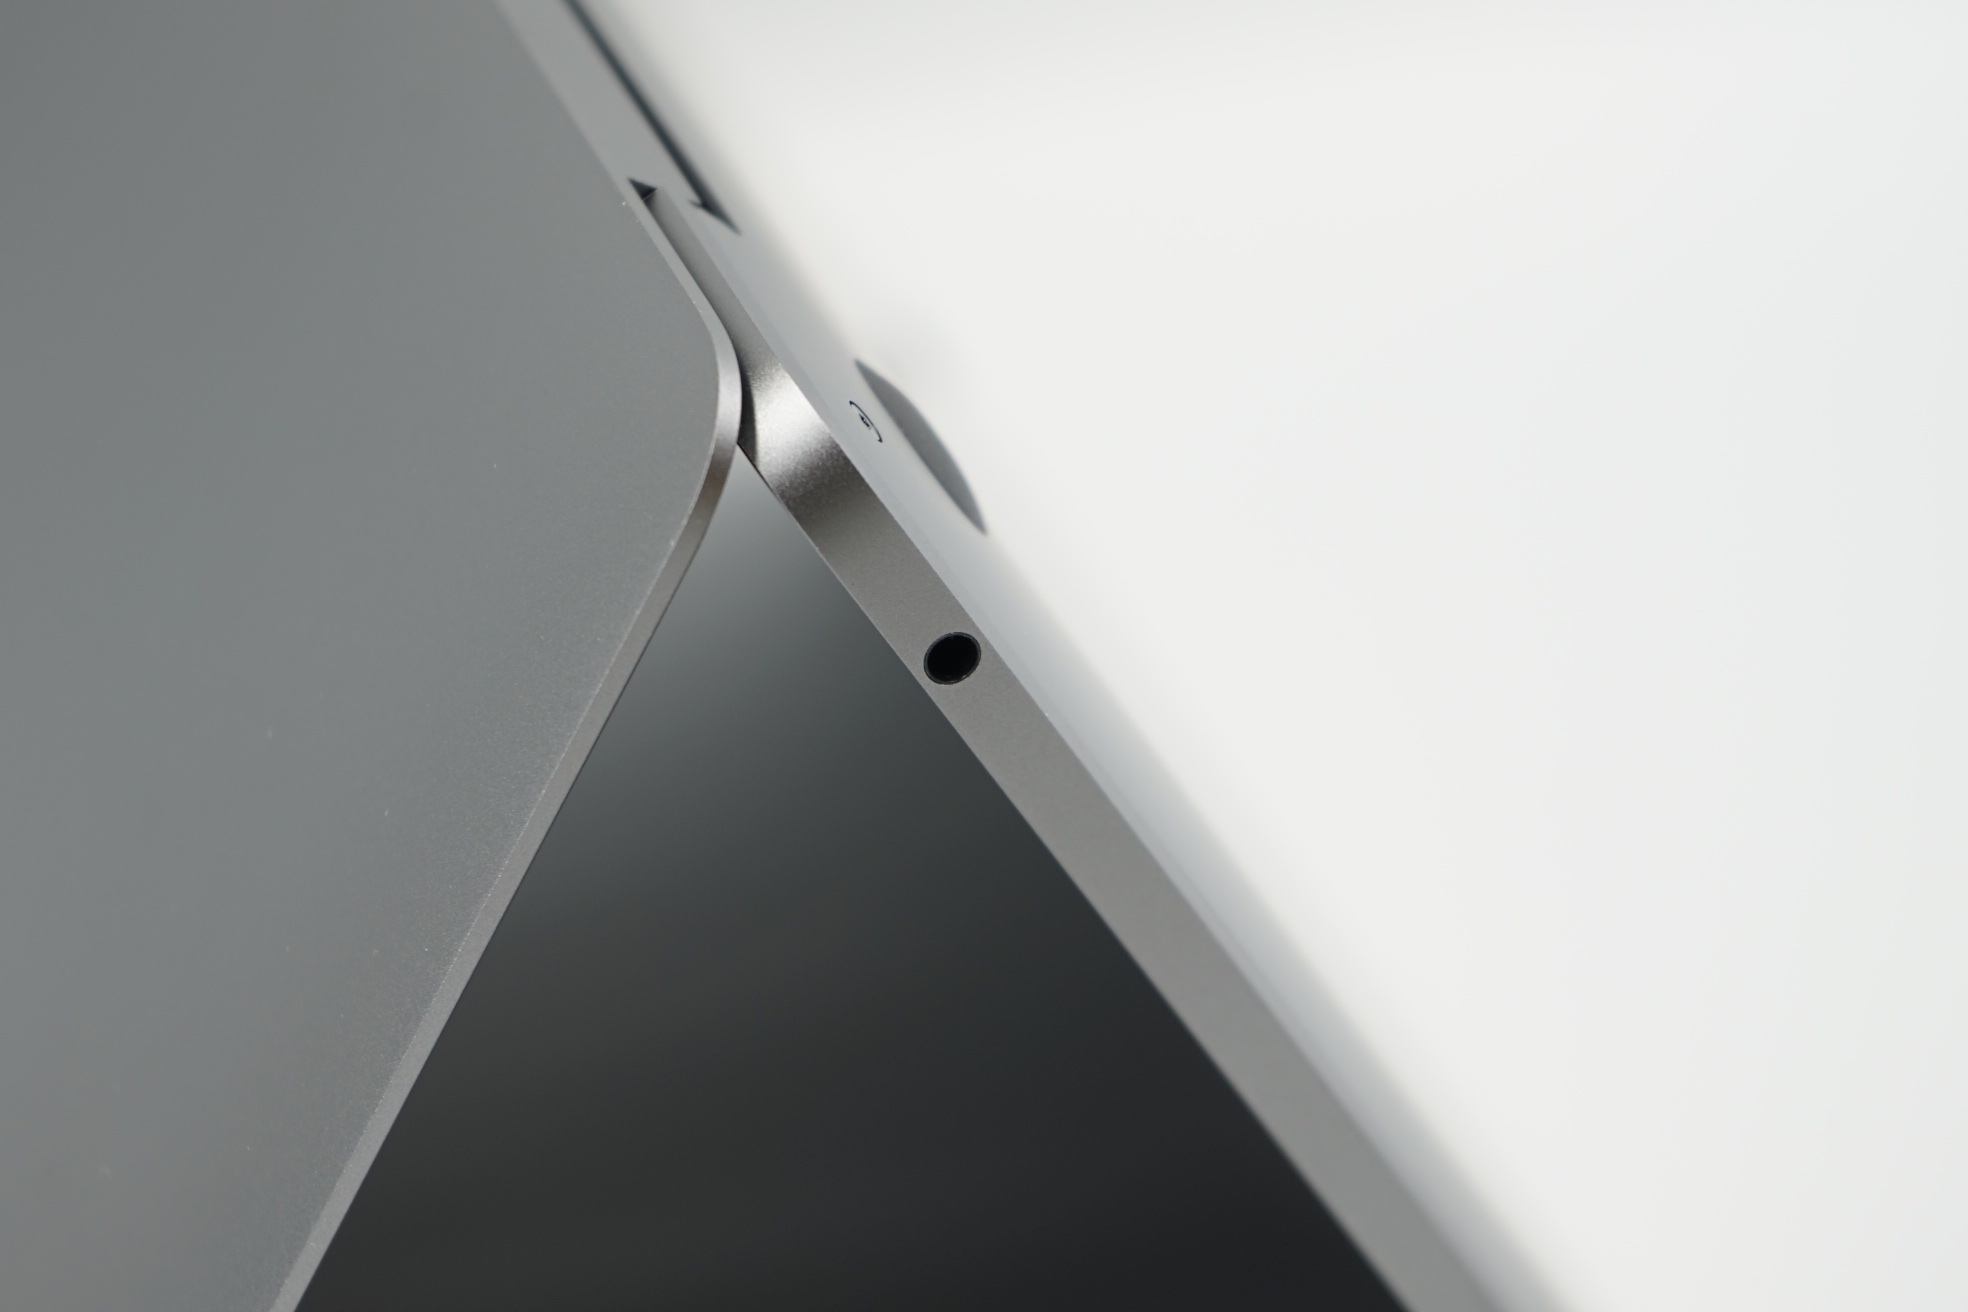
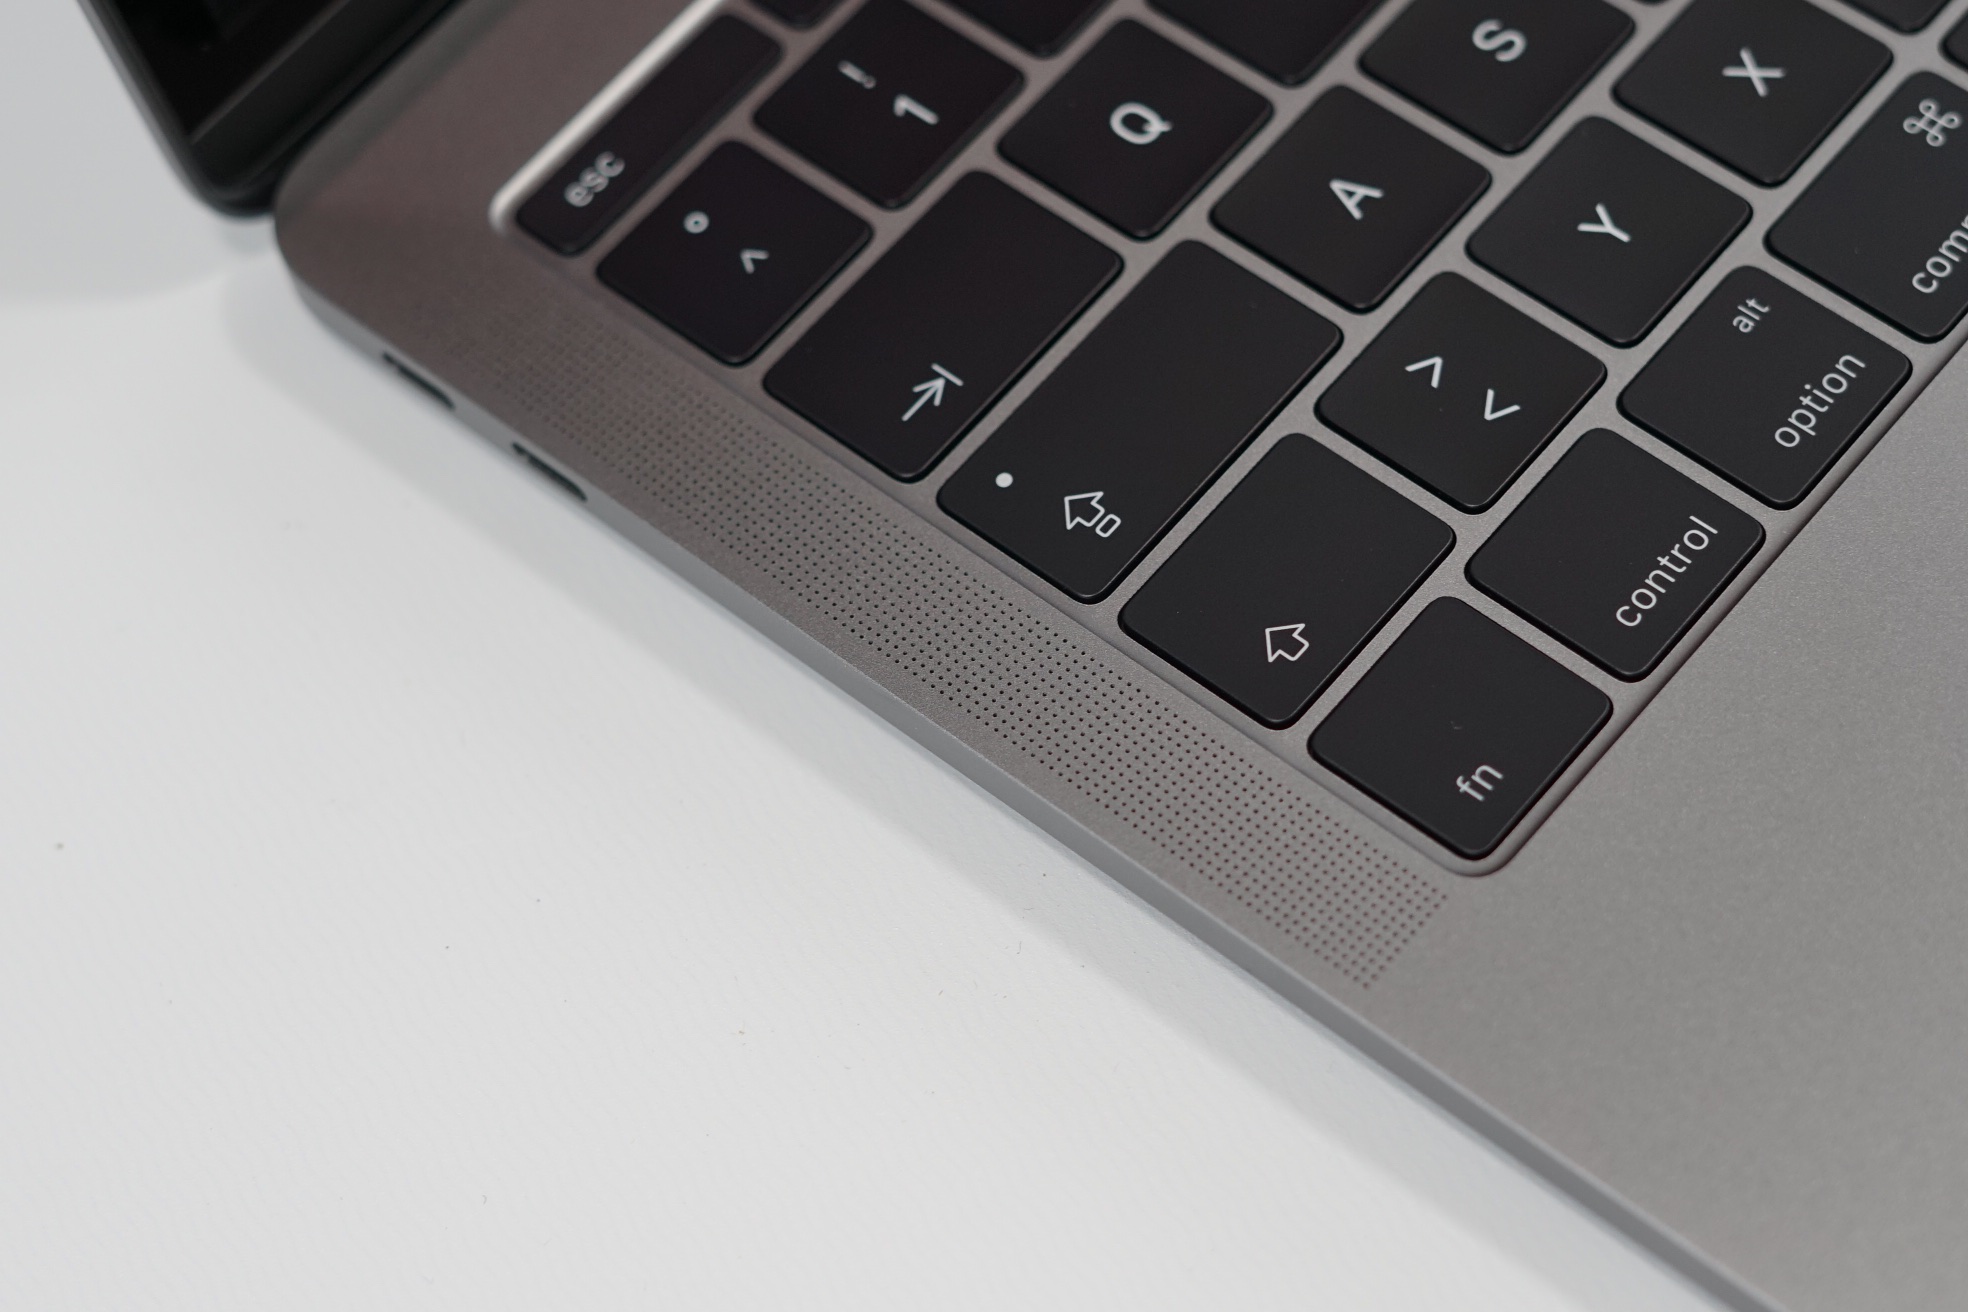
En av de största skillnaderna mellan de två olika 13-tumsmodellerna av MacBook Pro är inte bara den lilla pekskärmen ovanför tangentbordet, utan också kylningen. Den dyrare modellen har en mer kraftfull lösning med två fläktar, medan den här testmodellen bara har en.
Det är vanligtvis inga problem i praktiken, eftersom fläkten oftast är inaktiv, men så fort du utsätter datorn för belastning hör du skillnaden. Vi uppskattade inte det högfrekventa ljudet, som låter värre än siffrorna antyder.
En stor fördel är däremot batteritiden med wifi, och hur 13-tummaren presterar i olika andra scenarion. Apples billigare 13-tummare kan faktiskt vara det bättre alternativet för vardaglig, enklare användning.
Price comparison
