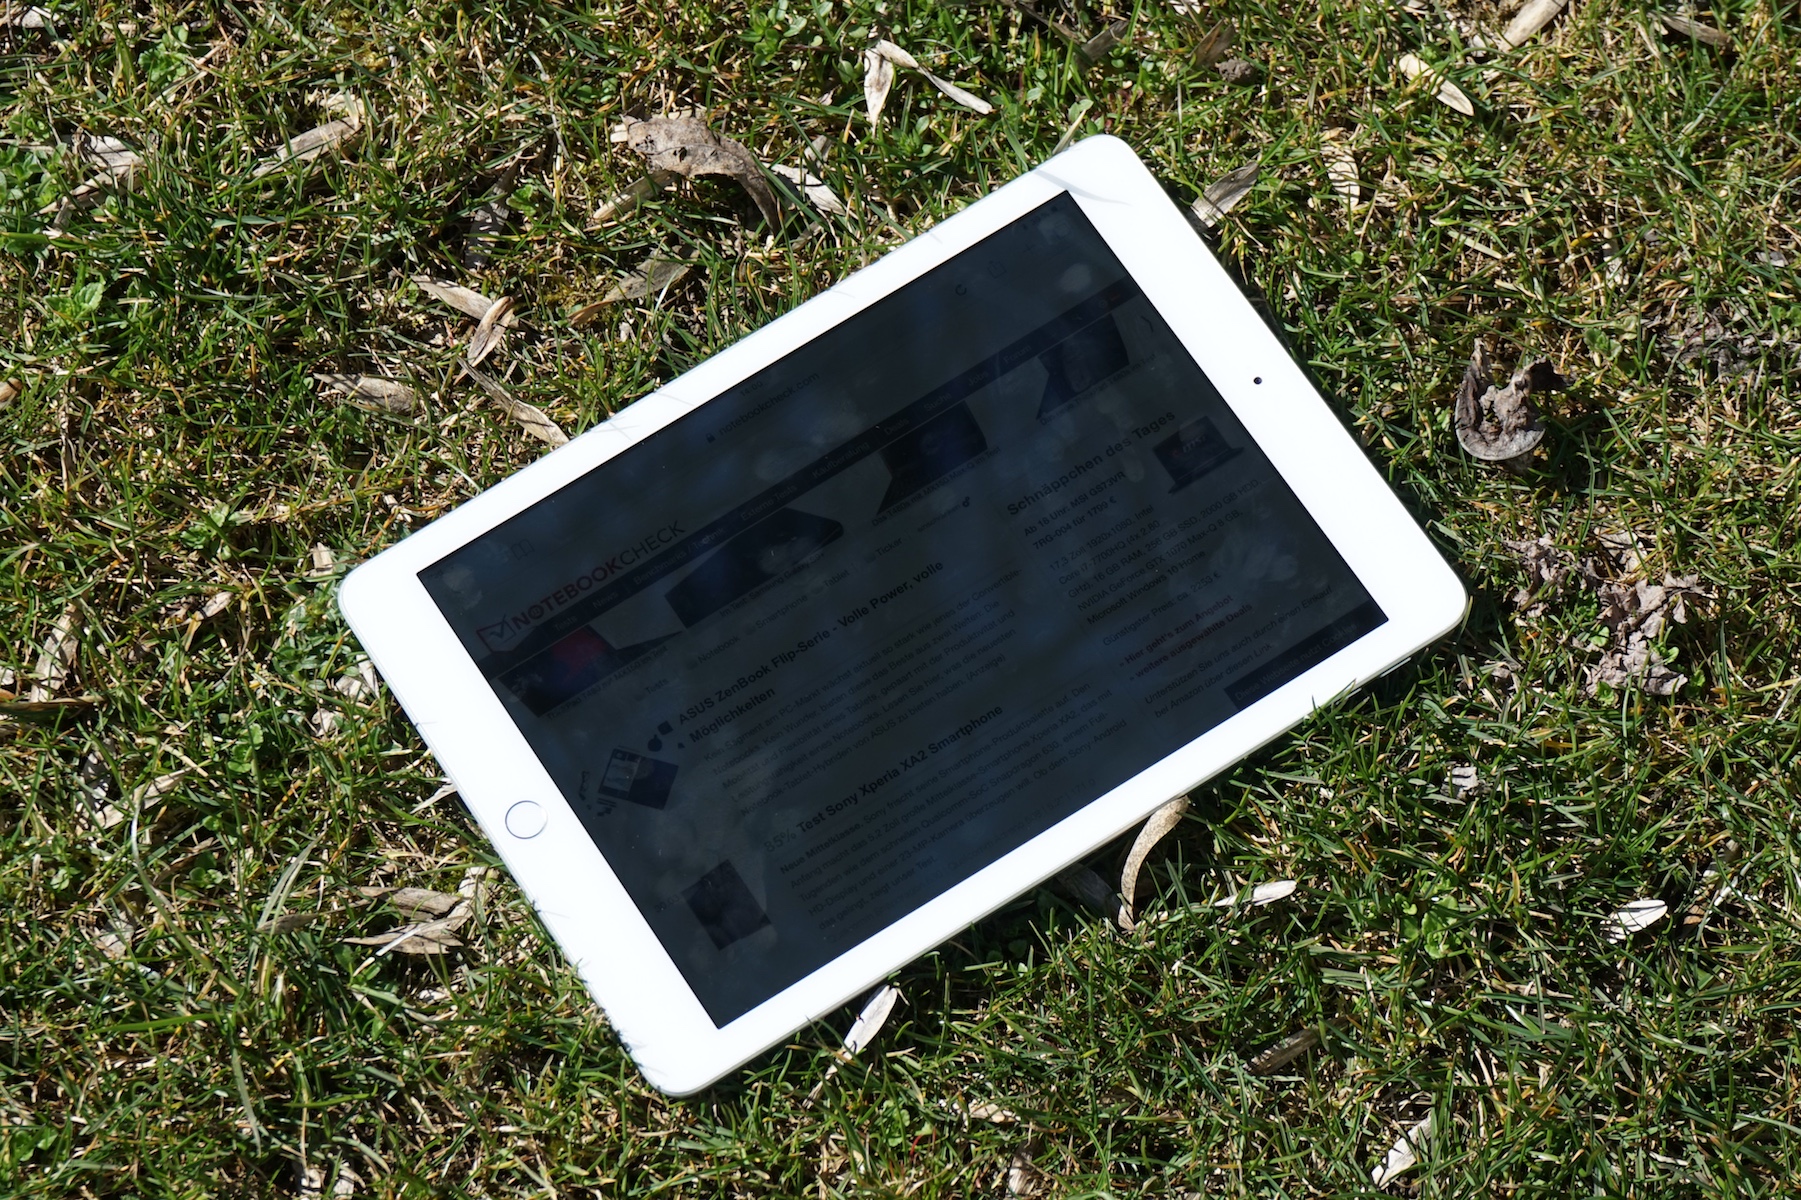
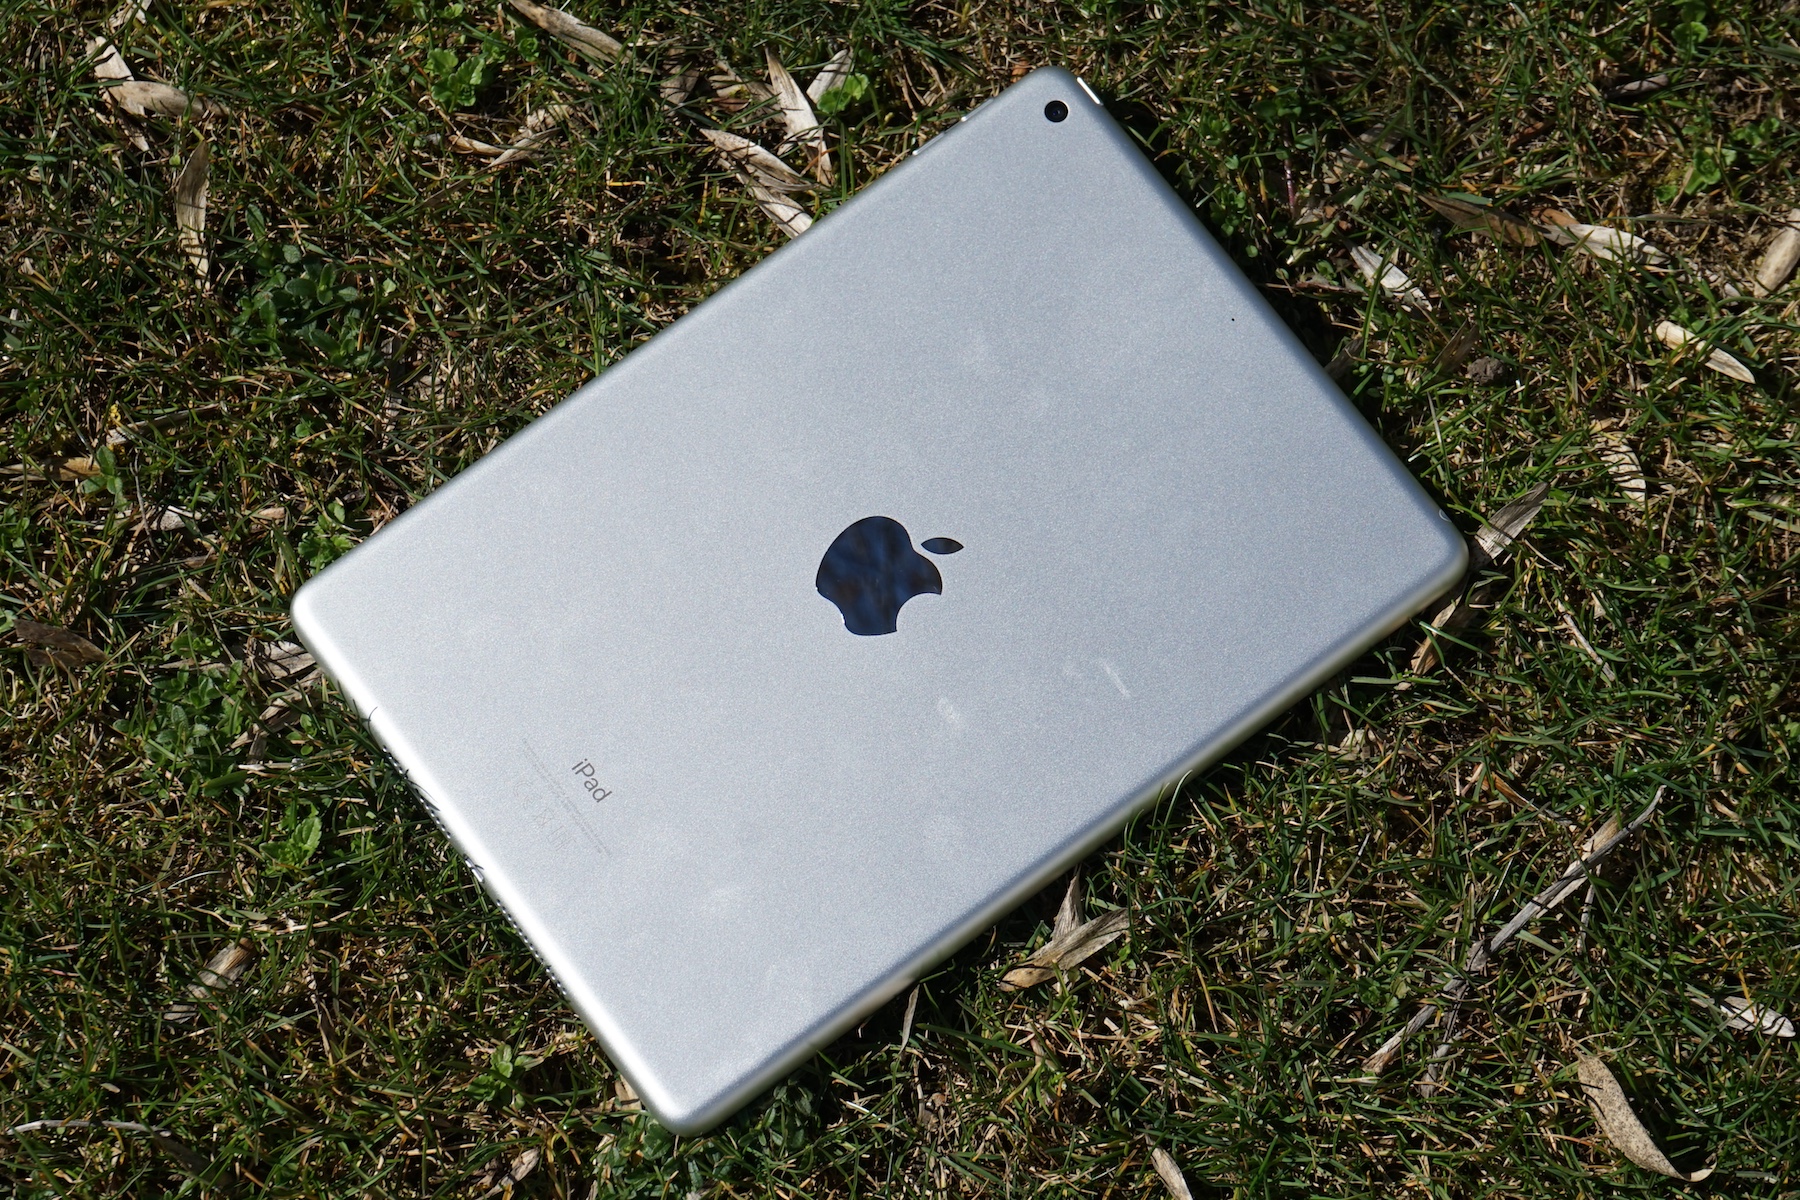
Test: Apple iPad 6 2018 Surfplatta (Sammanfattning)

| |||||||||||||||||||||||||
Distribution av ljusstyrkan: 92 %
Mitt på batteriet: 530 cd/m²
Kontrast: 869:1 (Svärta: 0.61 cd/m²)
ΔE ColorChecker Calman: 1.2 | ∀{0.5-29.43 Ø4.71}
ΔE Greyscale Calman: 1 | ∀{0.09-98 Ø4.96}
97.5% sRGB (Calman 2D)
Gamma: 2.28
CCT: 6588 K
| Apple iPad 6 2018 IPS, 2048x1536, 9.7" | Apple iPad (2017) IPS, 2048x1536, 9.7" | Apple iPad Pro 10.5 2017 IPS, 2224x1668, 10.5" | Apple iPad Pro 12.9 2017 IPS, 2732x2048, 12.9" | Samsung Galaxy Tab S3 SM-T825 Super AMOLED, 2048x1526, 9.7" | Huawei MediaPad M5 10.8 IPS, 2560x1600, 10.8" | |
|---|---|---|---|---|---|---|
| Screen | -10% | -13% | 20% | -22% | -48% | |
| Brightness middle (cd/m²) | 530 | 514 -3% | 634 20% | 650 23% | 452 -15% | 382 -28% |
| Brightness (cd/m²) | 513 | 485 -5% | 625 22% | 614 20% | 468 -9% | 378 -26% |
| Brightness Distribution (%) | 92 | 88 -4% | 87 -5% | 90 -2% | 82 -11% | 92 0% |
| Black Level * (cd/m²) | 0.61 | 0.46 25% | 0.39 36% | 0.42 31% | 0.24 61% | |
| Contrast (:1) | 869 | 1117 29% | 1626 87% | 1548 78% | 1592 83% | |
| Colorchecker dE 2000 * | 1.2 | 1.4 -17% | 1.9 -58% | 1 17% | 1.8 -50% | 2.8 -133% |
| Colorchecker dE 2000 max. * | 3.2 | 2.9 9% | 3.9 -22% | 1.9 41% | 4 -25% | 6 -88% |
| Greyscale dE 2000 * | 1 | 2.1 -110% | 2.8 -180% | 1.5 -50% | 1.2 -20% | 3.5 -250% |
| Gamma | 2.28 96% | 2.22 99% | 2.26 97% | 2.25 98% | 2.11 104% | 2.33 94% |
| CCT | 6588 99% | 6647 98% | 7027 93% | 6734 97% | 6500 100% | 6903 94% |
| Color Space (Percent of AdobeRGB 1998) (%) | 82.32 | |||||
| Color Space (Percent of sRGB) (%) | 99.06 |
* ... mindre är bättre
Skärmflimmer / PWM (Puls-Width Modulation)
| Skärmflimmer / PWM upptäcktes inte |   | ||
Som jämförelse: 52 % av alla testade enheter använder inte PWM för att dämpa skärmen. Om PWM upptäcktes mättes ett medelvärde av 7757 (minst: 5 - maximum: 343500) Hz. | |||
Visa svarstider
| ↔ Svarstid svart till vitt | ||
|---|---|---|
| 25.9 ms ... stiga ↗ och falla ↘ kombinerat | ↗ 14.4 ms stiga | 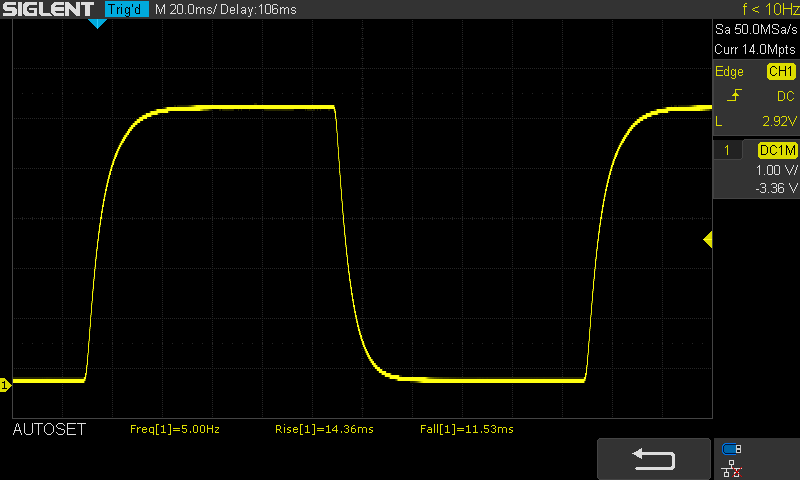 |
| ↘ 11.5 ms hösten | ||
| Skärmen visar relativt långsamma svarsfrekvenser i våra tester och kan vara för långsam för spelare. I jämförelse sträcker sig alla testade enheter från 0.1 (minst) till 240 (maximalt) ms. » 62 % av alla enheter är bättre. Detta innebär att den uppmätta svarstiden är sämre än genomsnittet av alla testade enheter (19.8 ms). | ||
| ↔ Svarstid 50 % grått till 80 % grått | ||
| 26.4 ms ... stiga ↗ och falla ↘ kombinerat | ↗ 17.7 ms stiga | 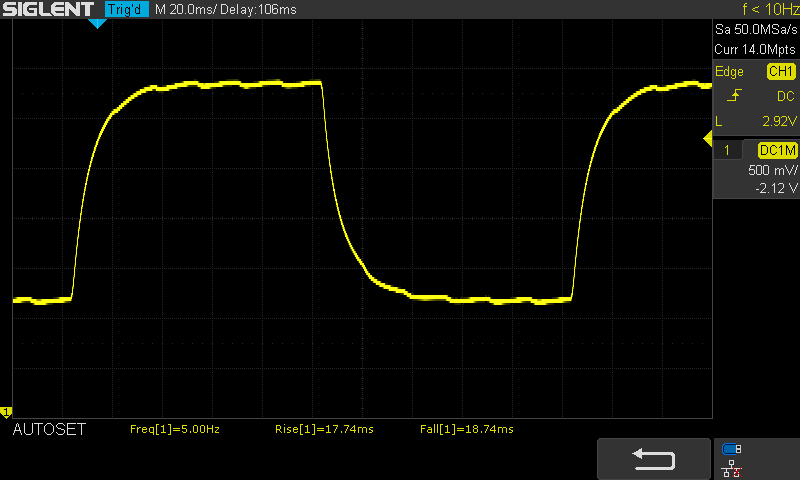 |
| ↘ 18.7 ms hösten | ||
| Skärmen visar relativt långsamma svarsfrekvenser i våra tester och kan vara för långsam för spelare. I jämförelse sträcker sig alla testade enheter från 0.165 (minst) till 636 (maximalt) ms. » 36 % av alla enheter är bättre. Det betyder att den uppmätta svarstiden är bättre än genomsnittet av alla testade enheter (31 ms). | ||
| Basemark X 1.1 | |
| Medium Quality | |
| Samsung Galaxy Tab S3 SM-T825 | |
| Samsung Galaxy Tab S3 SM-T825 | |
| High Quality | |
| Samsung Galaxy Tab S3 SM-T825 | |
| Basemark ES 3.1 / Metal - offscreen Overall Score | |
| Genomsnitt av klass Tablet (255 - 5784, n=6, senaste 2 åren) | |
| Apple iPad 6 2018 | |
| Apple iPhone 7 | |
| Apple iPhone 7 | |
| Genomsnitt Apple A10 Fusion (1059 - 1693, n=5) | |
| Apple iPad (2017) | |
| Samsung Galaxy Tab S3 SM-T825 | |
| Octane V2 - Total Score | |
| Genomsnitt av klass Tablet (1633 - 138481, n=71, senaste 2 åren) | |
| Apple iPhone X (IOS 11.1.2) | |
| Apple iPhone 8 Plus | |
| Apple iPhone 8 | |
| Apple iPad Pro 12.9 2017 (Safari Mobile 10) | |
| Apple iPad Pro 10.5 2017 (Safari Mobile 10) | |
| Apple iPad 6 2018 (Safari Mobile 11.3) | |
| Genomsnitt Apple A10 Fusion (19783 - 27967, n=5) | |
| Apple iPhone 7 (Safari Mobile 10.0) | |
| Apple iPad (2017) | |
| Apple iPad Mini 4 (Safari iOS 9) | |
| Samsung Galaxy Tab S3 SM-T825 (Samsung Browser 5.2) | |
| Huawei MediaPad M5 10.8 (Chrome 65) | |
| Samsung Galaxy Tab Active 2 | |
| Huawei MediaPad M2 10 inch (Chrome 49) | |
| WebXPRT 2015 - Overall | |
| Apple iPhone 8 Plus | |
| Apple iPhone 8 | |
| Apple iPhone X (Safari Mobile 11.0) | |
| Apple iPad Pro 10.5 2017 (Safari Mobile 10) | |
| Apple iPad Pro 12.9 2017 (Safari Mobile 10) | |
| Apple iPad (2017) | |
| Apple iPhone 7 (Safari Mobile 10.0) | |
| Genomsnitt Apple A10 Fusion (200 - 204, n=3) | |
| Apple iPad 6 2018 (Safari Mobile 11.3) | |
| Apple iPad Mini 4 (Safari iOS 9) | |
| Samsung Galaxy Tab S3 SM-T825 (Samsung Browser 5.2) | |
| Huawei MediaPad M5 10.8 (Chrome 65) | |
| Huawei MediaPad M2 10 inch (Chrome 49) | |
| Samsung Galaxy Tab Active 2 | |
| JetStream 1.1 - 1.1 Total | |
| Apple iPhone X (IOS 11.1.1) | |
| Apple iPhone 8 Plus | |
| Apple iPhone 8 | |
| Apple iPad Pro 12.9 2017 (Safari Mobile 10) | |
| Apple iPad Pro 10.5 2017 (Safari Mobile 10) | |
| Genomsnitt Apple A10 Fusion (165.9 - 172.6, n=4) | |
| Apple iPad 6 2018 (Safari Mobile 11.3) | |
| Apple iPhone 7 (Safari Mobile 10.0) | |
| Apple iPad (2017) | |
| Samsung Galaxy Tab S3 SM-T825 (Samsung Browser 5.2) | |
| Huawei MediaPad M5 10.8 (Chrome 65) | |
| Huawei MediaPad M2 10 inch (Chrome 49) | |
| Samsung Galaxy Tab Active 2 | |
| Mozilla Kraken 1.1 - Total | |
| Huawei MediaPad M2 10 inch (Chrome 49) | |
| Samsung Galaxy Tab Active 2 | |
| Huawei MediaPad M5 10.8 (Chrome 65) | |
| Apple iPad Mini 4 (Safari iOS 9) | |
| Samsung Galaxy Tab S3 SM-T825 (Samsung Browser 5.2) | |
| Genomsnitt av klass Tablet (243 - 16233, n=65, senaste 2 åren) | |
| Apple iPad (2017) | |
| Genomsnitt Apple A10 Fusion (1026 - 1531, n=5) | |
| Apple iPhone 7 (Safari Mobile 10.0) | |
| Apple iPad 6 2018 (Safari Mobile 11.3) | |
| Apple iPad Pro 10.5 2017 (Safari Mobile 10) | |
| Apple iPad Pro 12.9 2017 (Safari Mobile 10) | |
| Apple iPhone 8 | |
| Apple iPhone 8 Plus | |
| Apple iPhone X (IOS 11.1.2) | |
* ... mindre är bättre
(+) Den maximala temperaturen på ovansidan är 38 °C / 100 F, jämfört med genomsnittet av 33.7 °C / 93 F , allt från 20.7 till 53.2 °C för klassen Tablet.
(+) Botten värms upp till maximalt 39 °C / 102 F, jämfört med genomsnittet av 33.2 °C / 92 F
Apple iPad 6 2018 ljudanalys
(±) | högtalarljudstyrkan är genomsnittlig men bra (75.7 dB)
Bas 100 - 315 Hz
(±) | reducerad bas - i genomsnitt 11.2% lägre än medianen
(±) | linjäriteten för basen är genomsnittlig (11.9% delta till föregående frekvens)
Mellan 400 - 2000 Hz
(+) | balanserad mellan - endast 1.3% från medianen
(+) | mids är linjära (5.9% delta till föregående frekvens)
Högsta 2 - 16 kHz
(+) | balanserade toppar - endast 3.3% från medianen
(±) | linjäriteten för toppar är genomsnittlig (11% delta till föregående frekvens)
Totalt 100 - 16 000 Hz
(+) | det totala ljudet är linjärt (13.3% skillnad mot median)
Jämfört med samma klass
» 24% av alla testade enheter i den här klassen var bättre, 4% liknande, 71% sämre
» Den bästa hade ett delta på 7%, genomsnittet var 20%, sämst var 129%
Jämfört med alla testade enheter
» 14% av alla testade enheter var bättre, 3% liknande, 83% sämre
» Den bästa hade ett delta på 4%, genomsnittet var 23%, sämst var 134%
Apple iPad Pro 10.5 2017 ljudanalys
(+) | högtalare kan spela relativt högt (84.6 dB)
Bas 100 - 315 Hz
(±) | reducerad bas - i genomsnitt 10.4% lägre än medianen
(±) | linjäriteten för basen är genomsnittlig (12.3% delta till föregående frekvens)
Mellan 400 - 2000 Hz
(±) | högre mellan - i genomsnitt 5.8% högre än median
(+) | mids är linjära (4.3% delta till föregående frekvens)
Högsta 2 - 16 kHz
(±) | högre toppar - i genomsnitt 6.6% högre än medianen
(±) | linjäriteten för toppar är genomsnittlig (7% delta till föregående frekvens)
Totalt 100 - 16 000 Hz
(±) | linjäriteten för det totala ljudet är genomsnittlig (16.1% skillnad mot median)
Jämfört med samma klass
» 37% av alla testade enheter i den här klassen var bättre, 6% liknande, 57% sämre
» Den bästa hade ett delta på 7%, genomsnittet var 20%, sämst var 129%
Jämfört med alla testade enheter
» 26% av alla testade enheter var bättre, 5% liknande, 69% sämre
» Den bästa hade ett delta på 4%, genomsnittet var 23%, sämst var 134%
Apple iPad Pro 12.9 2017 ljudanalys
(±) | högtalarljudstyrkan är genomsnittlig men bra (81.2 dB)
Bas 100 - 315 Hz
(±) | reducerad bas - i genomsnitt 5.7% lägre än medianen
(±) | linjäriteten för basen är genomsnittlig (10.7% delta till föregående frekvens)
Mellan 400 - 2000 Hz
(+) | balanserad mellan - endast 1.6% från medianen
(+) | mids är linjära (5.1% delta till föregående frekvens)
Högsta 2 - 16 kHz
(+) | balanserade toppar - endast 4.7% från medianen
(+) | toppar är linjära (5.9% delta till föregående frekvens)
Totalt 100 - 16 000 Hz
(+) | det totala ljudet är linjärt (8.9% skillnad mot median)
Jämfört med samma klass
» 2% av alla testade enheter i den här klassen var bättre, 2% liknande, 96% sämre
» Den bästa hade ett delta på 7%, genomsnittet var 20%, sämst var 129%
Jämfört med alla testade enheter
» 3% av alla testade enheter var bättre, 1% liknande, 97% sämre
» Den bästa hade ett delta på 4%, genomsnittet var 23%, sämst var 134%
Apple iPad (2017) ljudanalys
(+) | högtalare kan spela relativt högt (86.1 dB)
Bas 100 - 315 Hz
(-) | nästan ingen bas - i genomsnitt 17.5% lägre än medianen
(±) | linjäriteten för basen är genomsnittlig (10.8% delta till föregående frekvens)
Mellan 400 - 2000 Hz
(+) | balanserad mellan - endast 2.8% från medianen
(+) | mids är linjära (5.3% delta till föregående frekvens)
Högsta 2 - 16 kHz
(±) | högre toppar - i genomsnitt 8.5% högre än medianen
(+) | toppar är linjära (3.9% delta till föregående frekvens)
Totalt 100 - 16 000 Hz
(±) | linjäriteten för det totala ljudet är genomsnittlig (19% skillnad mot median)
Jämfört med samma klass
» 52% av alla testade enheter i den här klassen var bättre, 5% liknande, 43% sämre
» Den bästa hade ett delta på 7%, genomsnittet var 20%, sämst var 129%
Jämfört med alla testade enheter
» 45% av alla testade enheter var bättre, 7% liknande, 47% sämre
» Den bästa hade ett delta på 4%, genomsnittet var 23%, sämst var 134%
Huawei MediaPad M2 10 inch ljudanalys
(+) | högtalare kan spela relativt högt (91.2 dB)
Bas 100 - 315 Hz
(-) | nästan ingen bas - i genomsnitt 25.1% lägre än medianen
(±) | linjäriteten för basen är genomsnittlig (11.9% delta till föregående frekvens)
Mellan 400 - 2000 Hz
(+) | balanserad mellan - endast 1.6% från medianen
(+) | mids är linjära (3.1% delta till föregående frekvens)
Högsta 2 - 16 kHz
(+) | balanserade toppar - endast 3.8% från medianen
(+) | toppar är linjära (3.1% delta till föregående frekvens)
Totalt 100 - 16 000 Hz
(±) | linjäriteten för det totala ljudet är genomsnittlig (17.7% skillnad mot median)
Jämfört med samma klass
» 44% av alla testade enheter i den här klassen var bättre, 6% liknande, 50% sämre
» Den bästa hade ett delta på 7%, genomsnittet var 20%, sämst var 129%
Jämfört med alla testade enheter
» 35% av alla testade enheter var bättre, 8% liknande, 57% sämre
» Den bästa hade ett delta på 4%, genomsnittet var 23%, sämst var 134%
| Av/Standby | |
| Låg belastning | |
| Hög belastning |
|
Förklaring:
min: | |
| Apple iPad 6 2018 mAh | Apple iPad Pro 10.5 2017 8134 mAh | Apple iPad Pro 12.9 2017 10875 mAh | Apple iPad (2017) 8.827 mAh | Apple iPhone 8 Plus 2691 mAh | Apple iPhone X 2716 mAh | Apple iPhone 8 1821 mAh | Apple iPad Mini 4 mAh | Samsung Galaxy Tab S3 SM-T825 6000 mAh | Huawei MediaPad M5 10.8 7500 mAh | Samsung Galaxy Tab Active 2 4450 mAh | Apple iPhone 7 1960 mAh | Huawei MediaPad M2 10 inch 6660 mAh | Genomsnitt av klass Tablet | |
|---|---|---|---|---|---|---|---|---|---|---|---|---|---|---|
| Power Consumption | 26% | 10% | 9% | 61% | 63% | 70% | 52% | 40% | 23% | 61% | 74% | 41% | 22% | |
| Idle Minimum * (Watt) | 2.2 | 1.44 35% | 1.55 30% | 2.06 6% | 0.72 67% | 1.03 53% | 0.54 75% | 0.8 64% | 2.08 5% | 2.01 9% | 0.89 60% | 0.54 75% | 1.6 27% | 2.21 ? -0% |
| Idle Average * (Watt) | 7.8 | 6.12 22% | 8.58 -10% | 7.42 5% | 2.45 69% | 2.4 69% | 1.63 79% | 3.6 54% | 3.5 55% | 5.4 31% | 3.13 60% | 1.51 81% | 4.13 47% | 4.01 ? 49% |
| Idle Maximum * (Watt) | 7.9 | 6.14 22% | 8.59 -9% | 7.47 5% | 2.52 68% | 2.6 67% | 1.67 79% | 3.9 51% | 3.58 55% | 5.44 31% | 3.36 57% | 1.54 81% | 4.22 47% | 4.4 ? 44% |
| Load Average * (Watt) | 12.6 | 8.55 32% | 10.09 20% | 9.45 25% | 3.84 70% | 2.96 77% | 2.74 78% | 6.1 52% | 6.97 45% | 8.55 32% | 3.93 69% | 3.75 70% | 6.57 48% | 8.92 ? 29% |
| Load Maximum * (Watt) | 12.8 | 10.62 17% | 10.61 17% | 12.31 4% | 9.02 30% | 6.6 48% | 7.78 39% | 8 37% | 7.4 42% | 11.53 10% | 5.45 57% | 5.01 61% | 8.32 35% | 14.4 ? -13% |
* ... mindre är bättre
| Apple iPad 6 2018 mAh | Apple iPad (2017) 8.827 mAh | Apple iPad Pro 10.5 2017 8134 mAh | Apple iPad Pro 12.9 2017 10875 mAh | Samsung Galaxy Tab S3 SM-T825 6000 mAh | Samsung Galaxy Tab Active 2 4450 mAh | Huawei MediaPad M2 10 inch 6660 mAh | |
|---|---|---|---|---|---|---|---|
| Batteridrifttid | 15% | 2% | 21% | 55% | 69% | 20% | |
| WiFi v1.3 (h) | 11.9 | 12.7 7% | 11.6 -3% | 12.3 3% | 12.7 7% | 14.9 25% | 11.6 -3% |
| Load (h) | 3.1 | 3.8 23% | 3.3 6% | 4.3 39% | 6.3 103% | 6.6 113% | 4.4 42% |
| Reader / Idle (h) | 24.9 | 33.9 | 48.7 | 31.7 | 22.6 | 16.5 | |
| H.264 (h) | 14.1 | 10.5 | 11.3 | 9.2 | 8.2 | 10 |
För
Emot
Läs den fullständiga versionen av den här recensionen på engelska här.
2018 års modell av iPad (sjätte generationen) är den lilla uppdatering som specifikationsbladet anger. Den är snabbare, men en utdaterad SoC och stöd för Apple Pencil är dom viktigaste nya funktionerna. Både batteritid och energiförbrukning får lida av dessa uppdateringar, men är generellt sätt ändå bra.
Temperaturutvecklingen oroar oss inte och skärmen är fortfarande väldigt bra. Mellanrummet mellan glaset och skärmpanelen är inte optimalt, men i gengäld är enheten lättare att laga om skärmen går sönder. Huruvida iPad kan konkurrera med Chromebooks i skolor är dock tveksamt. Priset med Pencil och tangentbord är mycket högre. Detta betyder att mjukvaran behöver göra skillnaden och Apple kan oftast få poäng på högkvalitativa appar.
Är den nya iPad-modellen billig? Den kostar runt 700 kronor mindre än sitt mindre syskon iPad Mini, och Pro-modellerna börjar från 5 500 kronor i Apples onlinebutik. Bra Android-surfplattor med jämförbara skärmar finns redan tillgängliga för mindre än 3000 kronor.
Apple iPad 6 2018
- 09/16/2019 v7 (old)
Klaus Hinum, J. Simon Leitner
Price comparison
