Test: Apple iPad 2017 (sammanfattning)

| Networking | |
| iperf3 transmit AX12 | |
| Apple iPhone 7 (Klaus I211) | |
| Apple iPad (2017) | |
| Samsung Galaxy S7 | |
| iperf3 receive AX12 | |
| Apple iPhone 7 (Klaus I211) | |
| Apple iPad (2017) | |
| Samsung Galaxy S7 | |

| |||||||||||||||||||||||||
Distribution av ljusstyrkan: 88 %
Mitt på batteriet: 514 cd/m²
Kontrast: 1117:1 (Svärta: 0.46 cd/m²)
ΔE ColorChecker Calman: 1.4 | ∀{0.5-29.43 Ø4.71}
ΔE Greyscale Calman: 2.1 | ∀{0.09-98 Ø4.96}
97.4% sRGB (Calman 2D)
Gamma: 2.22
CCT: 6647 K
| Apple iPad (2017) IPS, 2048x1536, 9.7" | Apple iPad Air 1 2013 IPS, 2048x1536, 9.7" | Apple iPad Pro 9.7 IPS, 2048x1536, 9.7" | Apple iPad Pro 12.9 IPS, 2732x2048, 12.9" | Google Pixel C LTPS, 2560x1800, 10.2" | Huawei MediaPad T2 10.0 Pro IPS, 1920x1200, 10.1" | |
|---|---|---|---|---|---|---|
| Screen | -10% | 10% | -11% | -75% | -79% | |
| Brightness middle (cd/m²) | 514 | 473 -8% | 523 2% | 399 -22% | 487 -5% | 392 -24% |
| Brightness (cd/m²) | 485 | 442 -9% | 500 3% | 393 -19% | 510 5% | 385 -21% |
| Brightness Distribution (%) | 88 | 90 2% | 93 6% | 92 5% | 91 3% | 91 3% |
| Black Level * (cd/m²) | 0.46 | 0.41 11% | 0.52 -13% | 0.22 52% | 0.39 15% | 0.59 -28% |
| Contrast (:1) | 1117 | 1154 3% | 1006 -10% | 1814 62% | 1249 12% | 664 -41% |
| Colorchecker dE 2000 * | 1.4 | 2.82 -101% | 1.1 21% | 2.96 -111% | 5.24 -274% | 4.5 -221% |
| Colorchecker dE 2000 max. * | 2.9 | 1.9 34% | 7.8 -169% | |||
| Greyscale dE 2000 * | 2.1 | 1.45 31% | 1.4 33% | 3 -43% | 7.95 -279% | 4.8 -129% |
| Gamma | 2.22 99% | 2.47 89% | 2.11 104% | 2.21 100% | 2.16 102% | 2.47 89% |
| CCT | 6647 98% | 6768 96% | 6662 98% | 7049 92% | 6565 99% | 7426 88% |
| Color Space (Percent of AdobeRGB 1998) (%) | 62.97 | 71.15 | ||||
| Color Space (Percent of sRGB) (%) | 99.55 | 97.87 |
* ... mindre är bättre
Skärmflimmer / PWM (Puls-Width Modulation)
| Skärmflimmer / PWM upptäcktes inte | 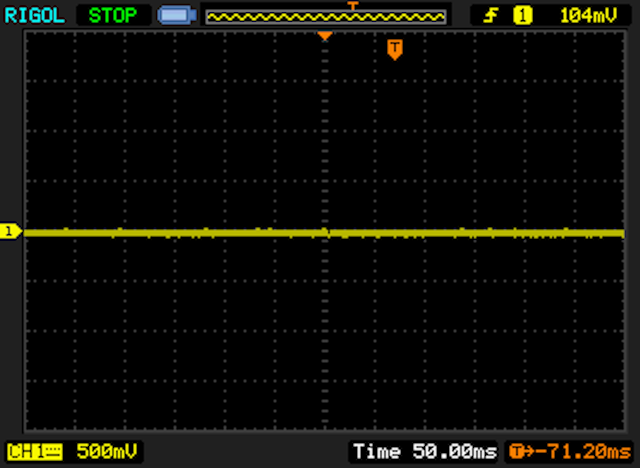 | ||
Som jämförelse: 52 % av alla testade enheter använder inte PWM för att dämpa skärmen. Om PWM upptäcktes mättes ett medelvärde av 7754 (minst: 5 - maximum: 343500) Hz. | |||
Visa svarstider
| ↔ Svarstid svart till vitt | ||
|---|---|---|
| 26 ms ... stiga ↗ och falla ↘ kombinerat | ↗ 15 ms stiga | 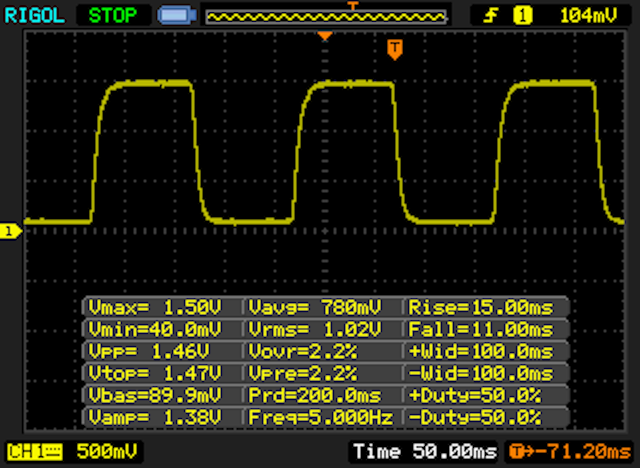 |
| ↘ 11 ms hösten | ||
| Skärmen visar relativt långsamma svarsfrekvenser i våra tester och kan vara för långsam för spelare. I jämförelse sträcker sig alla testade enheter från 0.1 (minst) till 240 (maximalt) ms. » 63 % av alla enheter är bättre. Detta innebär att den uppmätta svarstiden är sämre än genomsnittet av alla testade enheter (19.8 ms). | ||
| ↔ Svarstid 50 % grått till 80 % grått | ||
| 40 ms ... stiga ↗ och falla ↘ kombinerat | ↗ 23 ms stiga | 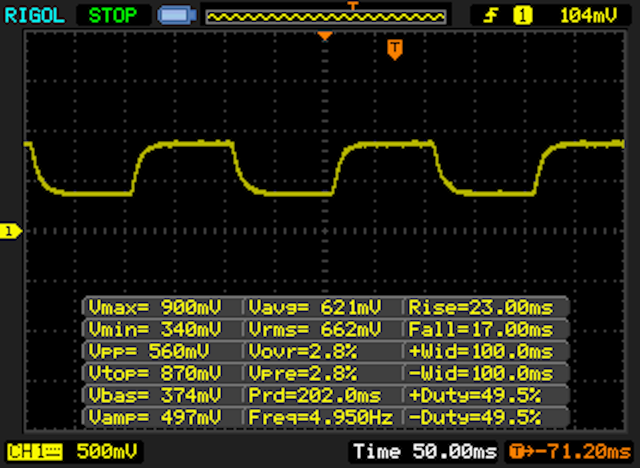 |
| ↘ 17 ms hösten | ||
| Skärmen visar långsamma svarsfrekvenser i våra tester och kommer att vara otillfredsställande för spelare. I jämförelse sträcker sig alla testade enheter från 0.165 (minst) till 636 (maximalt) ms. » 61 % av alla enheter är bättre. Detta innebär att den uppmätta svarstiden är sämre än genomsnittet av alla testade enheter (31 ms). | ||
| AnTuTu v6 - Total Score | |
| Apple iPad Pro 12.9 | |
| Apple iPad Pro 9.7 | |
| Samsung Galaxy Tab S3 SM-T825 | |
| Apple iPhone 7 | |
| Apple iPad (2017) | |
| Google Pixel C | |
| Huawei MediaPad T2 10.0 Pro | |
| GFXBench 3.0 | |
| on screen Manhattan Onscreen OGL | |
| Apple iPhone 7 | |
| Apple iPad Pro 9.7 | |
| Samsung Galaxy Tab S3 SM-T825 | |
| Apple iPad Pro 12.9 | |
| Apple iPad (2017) | |
| Google Pixel C | |
| Huawei MediaPad T2 10.0 Pro | |
| 1920x1080 1080p Manhattan Offscreen | |
| Apple iPad Pro 12.9 | |
| Apple iPhone 7 | |
| Apple iPad Pro 9.7 | |
| Samsung Galaxy Tab S3 SM-T825 | |
| Apple iPad (2017) | |
| Google Pixel C | |
| Huawei MediaPad T2 10.0 Pro | |
| GFXBench 3.1 | |
| on screen Manhattan ES 3.1 Onscreen | |
| Apple iPhone 7 | |
| Apple iPad Pro 12.9 | |
| Apple iPad Pro 9.7 | |
| Samsung Galaxy Tab S3 SM-T825 | |
| Apple iPad (2017) | |
| Google Pixel C | |
| 1920x1080 Manhattan ES 3.1 Offscreen | |
| Apple iPad Pro 12.9 | |
| Apple iPhone 7 | |
| Apple iPad Pro 9.7 | |
| Samsung Galaxy Tab S3 SM-T825 | |
| Google Pixel C | |
| Apple iPad (2017) | |
| Basemark ES 3.1 / Metal - offscreen Overall Score | |
| Apple iPad Pro 12.9 | |
| Apple iPhone 7 | |
| Apple iPhone 7 | |
| Apple iPad Pro 9.7 | |
| Apple iPad (2017) | |
| Google Pixel C | |
| Samsung Galaxy Tab S3 SM-T825 | |
| Octane V2 - Total Score | |
| Apple iPhone 7 | |
| Apple iPad Pro 12.9 | |
| Apple iPad Pro 9.7 | |
| Apple iPad (2017) | |
| Samsung Galaxy Tab S3 SM-T825 | |
| Google Pixel C | |
| Apple iPad Air 1 2013 | |
| Huawei MediaPad T2 10.0 Pro | |
| Mozilla Kraken 1.1 - Total | |
| Huawei MediaPad T2 10.0 Pro | |
| Apple iPad Air 1 2013 | |
| Google Pixel C | |
| Samsung Galaxy Tab S3 SM-T825 | |
| Apple iPad Pro 9.7 | |
| Apple iPad Pro 12.9 | |
| Apple iPad (2017) | |
| Apple iPhone 7 | |
| JetStream 1.1 - 1.1 Total | |
| Apple iPhone 7 | |
| Apple iPad Pro 9.7 | |
| Apple iPad Pro 12.9 | |
| Apple iPad (2017) | |
| Google Pixel C | |
| Samsung Galaxy Tab S3 SM-T825 | |
| Huawei MediaPad T2 10.0 Pro | |
| WebXPRT 2015 - Overall | |
| Apple iPad Pro 9.7 | |
| Apple iPad Pro 12.9 | |
| Apple iPad (2017) | |
| Apple iPhone 7 | |
| Samsung Galaxy Tab S3 SM-T825 | |
| Google Pixel C | |
| Huawei MediaPad T2 10.0 Pro | |
* ... mindre är bättre
| PassMark PerformanceTest Mobile V1 - Disk Tests | |
| Apple iPad Pro 12.9 | |
| Apple iPad Pro 9.7 | |
| Apple iPad (2017) | |
| Apple iPhone 7 | |
| Apple iPad Air 1 2013 | |
| Google Pixel C | |
| BaseMark OS II - Memory | |
| Apple iPad Pro 9.7 | |
| Apple iPad Pro 12.9 | |
| Samsung Galaxy Tab S3 SM-T825 | |
| Apple iPad (2017) | |
| Apple iPhone 7 | |
| Google Pixel C | |
| Huawei MediaPad T2 10.0 Pro | |
(+) Den maximala temperaturen på ovansidan är 35.2 °C / 95 F, jämfört med genomsnittet av 33.7 °C / 93 F , allt från 20.7 till 53.2 °C för klassen Tablet.
(+) Botten värms upp till maximalt 37.7 °C / 100 F, jämfört med genomsnittet av 33.2 °C / 92 F
(+) Vid tomgångsbruk är medeltemperaturen för ovansidan 31 °C / 88 F, jämfört med enhetsgenomsnittet på 30 °C / ### class_avg_f### F.
Apple iPad (2017) ljudanalys
(+) | högtalare kan spela relativt högt (86.1 dB)
Bas 100 - 315 Hz
(-) | nästan ingen bas - i genomsnitt 17.5% lägre än medianen
(±) | linjäriteten för basen är genomsnittlig (10.8% delta till föregående frekvens)
Mellan 400 - 2000 Hz
(+) | balanserad mellan - endast 2.8% från medianen
(+) | mids är linjära (5.3% delta till föregående frekvens)
Högsta 2 - 16 kHz
(±) | högre toppar - i genomsnitt 8.5% högre än medianen
(+) | toppar är linjära (3.9% delta till föregående frekvens)
Totalt 100 - 16 000 Hz
(±) | linjäriteten för det totala ljudet är genomsnittlig (19% skillnad mot median)
Jämfört med samma klass
» 52% av alla testade enheter i den här klassen var bättre, 5% liknande, 43% sämre
» Den bästa hade ett delta på 7%, genomsnittet var 20%, sämst var 129%
Jämfört med alla testade enheter
» 45% av alla testade enheter var bättre, 7% liknande, 47% sämre
» Den bästa hade ett delta på 4%, genomsnittet var 23%, sämst var 134%
Apple iPad Pro 9.7 ljudanalys
(+) | högtalare kan spela relativt högt (90.6 dB)
Bas 100 - 315 Hz
(-) | nästan ingen bas - i genomsnitt 23.2% lägre än medianen
(±) | linjäriteten för basen är genomsnittlig (8.6% delta till föregående frekvens)
Mellan 400 - 2000 Hz
(+) | balanserad mellan - endast 4.7% från medianen
(+) | mids är linjära (4.9% delta till föregående frekvens)
Högsta 2 - 16 kHz
(+) | balanserade toppar - endast 4.6% från medianen
(+) | toppar är linjära (4.1% delta till föregående frekvens)
Totalt 100 - 16 000 Hz
(±) | linjäriteten för det totala ljudet är genomsnittlig (16.8% skillnad mot median)
Jämfört med samma klass
» 41% av alla testade enheter i den här klassen var bättre, 4% liknande, 55% sämre
» Den bästa hade ett delta på 7%, genomsnittet var 20%, sämst var 129%
Jämfört med alla testade enheter
» 30% av alla testade enheter var bättre, 8% liknande, 63% sämre
» Den bästa hade ett delta på 4%, genomsnittet var 23%, sämst var 134%
| Av/Standby | |
| Låg belastning | |
| Hög belastning |
|
Förklaring:
min: | |
| Apple iPad (2017) 8.827 mAh | Apple iPad Pro 9.7 7306 mAh | Apple iPad Pro 12.9 10307 mAh | Apple iPad Air 1 2013 mAh | Google Pixel C mAh | Huawei MediaPad T2 10.0 Pro 6600 mAh | |
|---|---|---|---|---|---|---|
| Power Consumption | 5% | -31% | 15% | 16% | 34% | |
| Idle Minimum * (Watt) | 2.06 | 1.71 17% | 2.69 -31% | 1.8 13% | 1.82 12% | 1.58 23% |
| Idle Average * (Watt) | 7.42 | 7.55 -2% | 10.95 -48% | 5.9 20% | 4.26 43% | 4.12 44% |
| Idle Maximum * (Watt) | 7.47 | 7.62 -2% | 11.14 -49% | 7.1 5% | 4.33 42% | 4.15 44% |
| Load Average * (Watt) | 9.45 | 8.39 11% | 11.54 -22% | 7.5 21% | 9.82 -4% | 6.2 34% |
| Load Maximum * (Watt) | 12.31 | 12.08 2% | 12.8 -4% | 10.4 16% | 13.99 -14% | 9.27 25% |
* ... mindre är bättre
| Apple iPad (2017) 8.827 mAh | Apple iPad Pro 9.7 7306 mAh | Apple iPad Pro 12.9 10307 mAh | Apple iPad Air 1 2013 mAh | Samsung Galaxy Tab S3 SM-T825 6000 mAh | Google Pixel C mAh | Huawei MediaPad T2 10.0 Pro 6600 mAh | |
|---|---|---|---|---|---|---|---|
| Batteridrifttid | -2% | -5% | -5% | 15% | 10% | -22% | |
| Reader / Idle (h) | 24.9 | 30.8 24% | 32.2 29% | 23.8 -4% | 31.7 27% | 34.8 40% | 20.5 -18% |
| H.264 (h) | 14.1 | 11.8 -16% | 10.5 -26% | 10.7 -24% | 9.2 -35% | 12.3 -13% | 9.9 -30% |
| WiFi v1.3 (h) | 12.7 | 13 2% | 11.6 -9% | 12.7 0% | 10.6 -17% | 6.9 -46% | |
| Load (h) | 3.8 | 3.1 -18% | 3.3 -13% | 4.3 13% | 6.3 66% | 4.9 29% | 4.1 8% |
| WiFi (h) | 9.2 |
För
Emot
Läs originaltestet på engelska här.
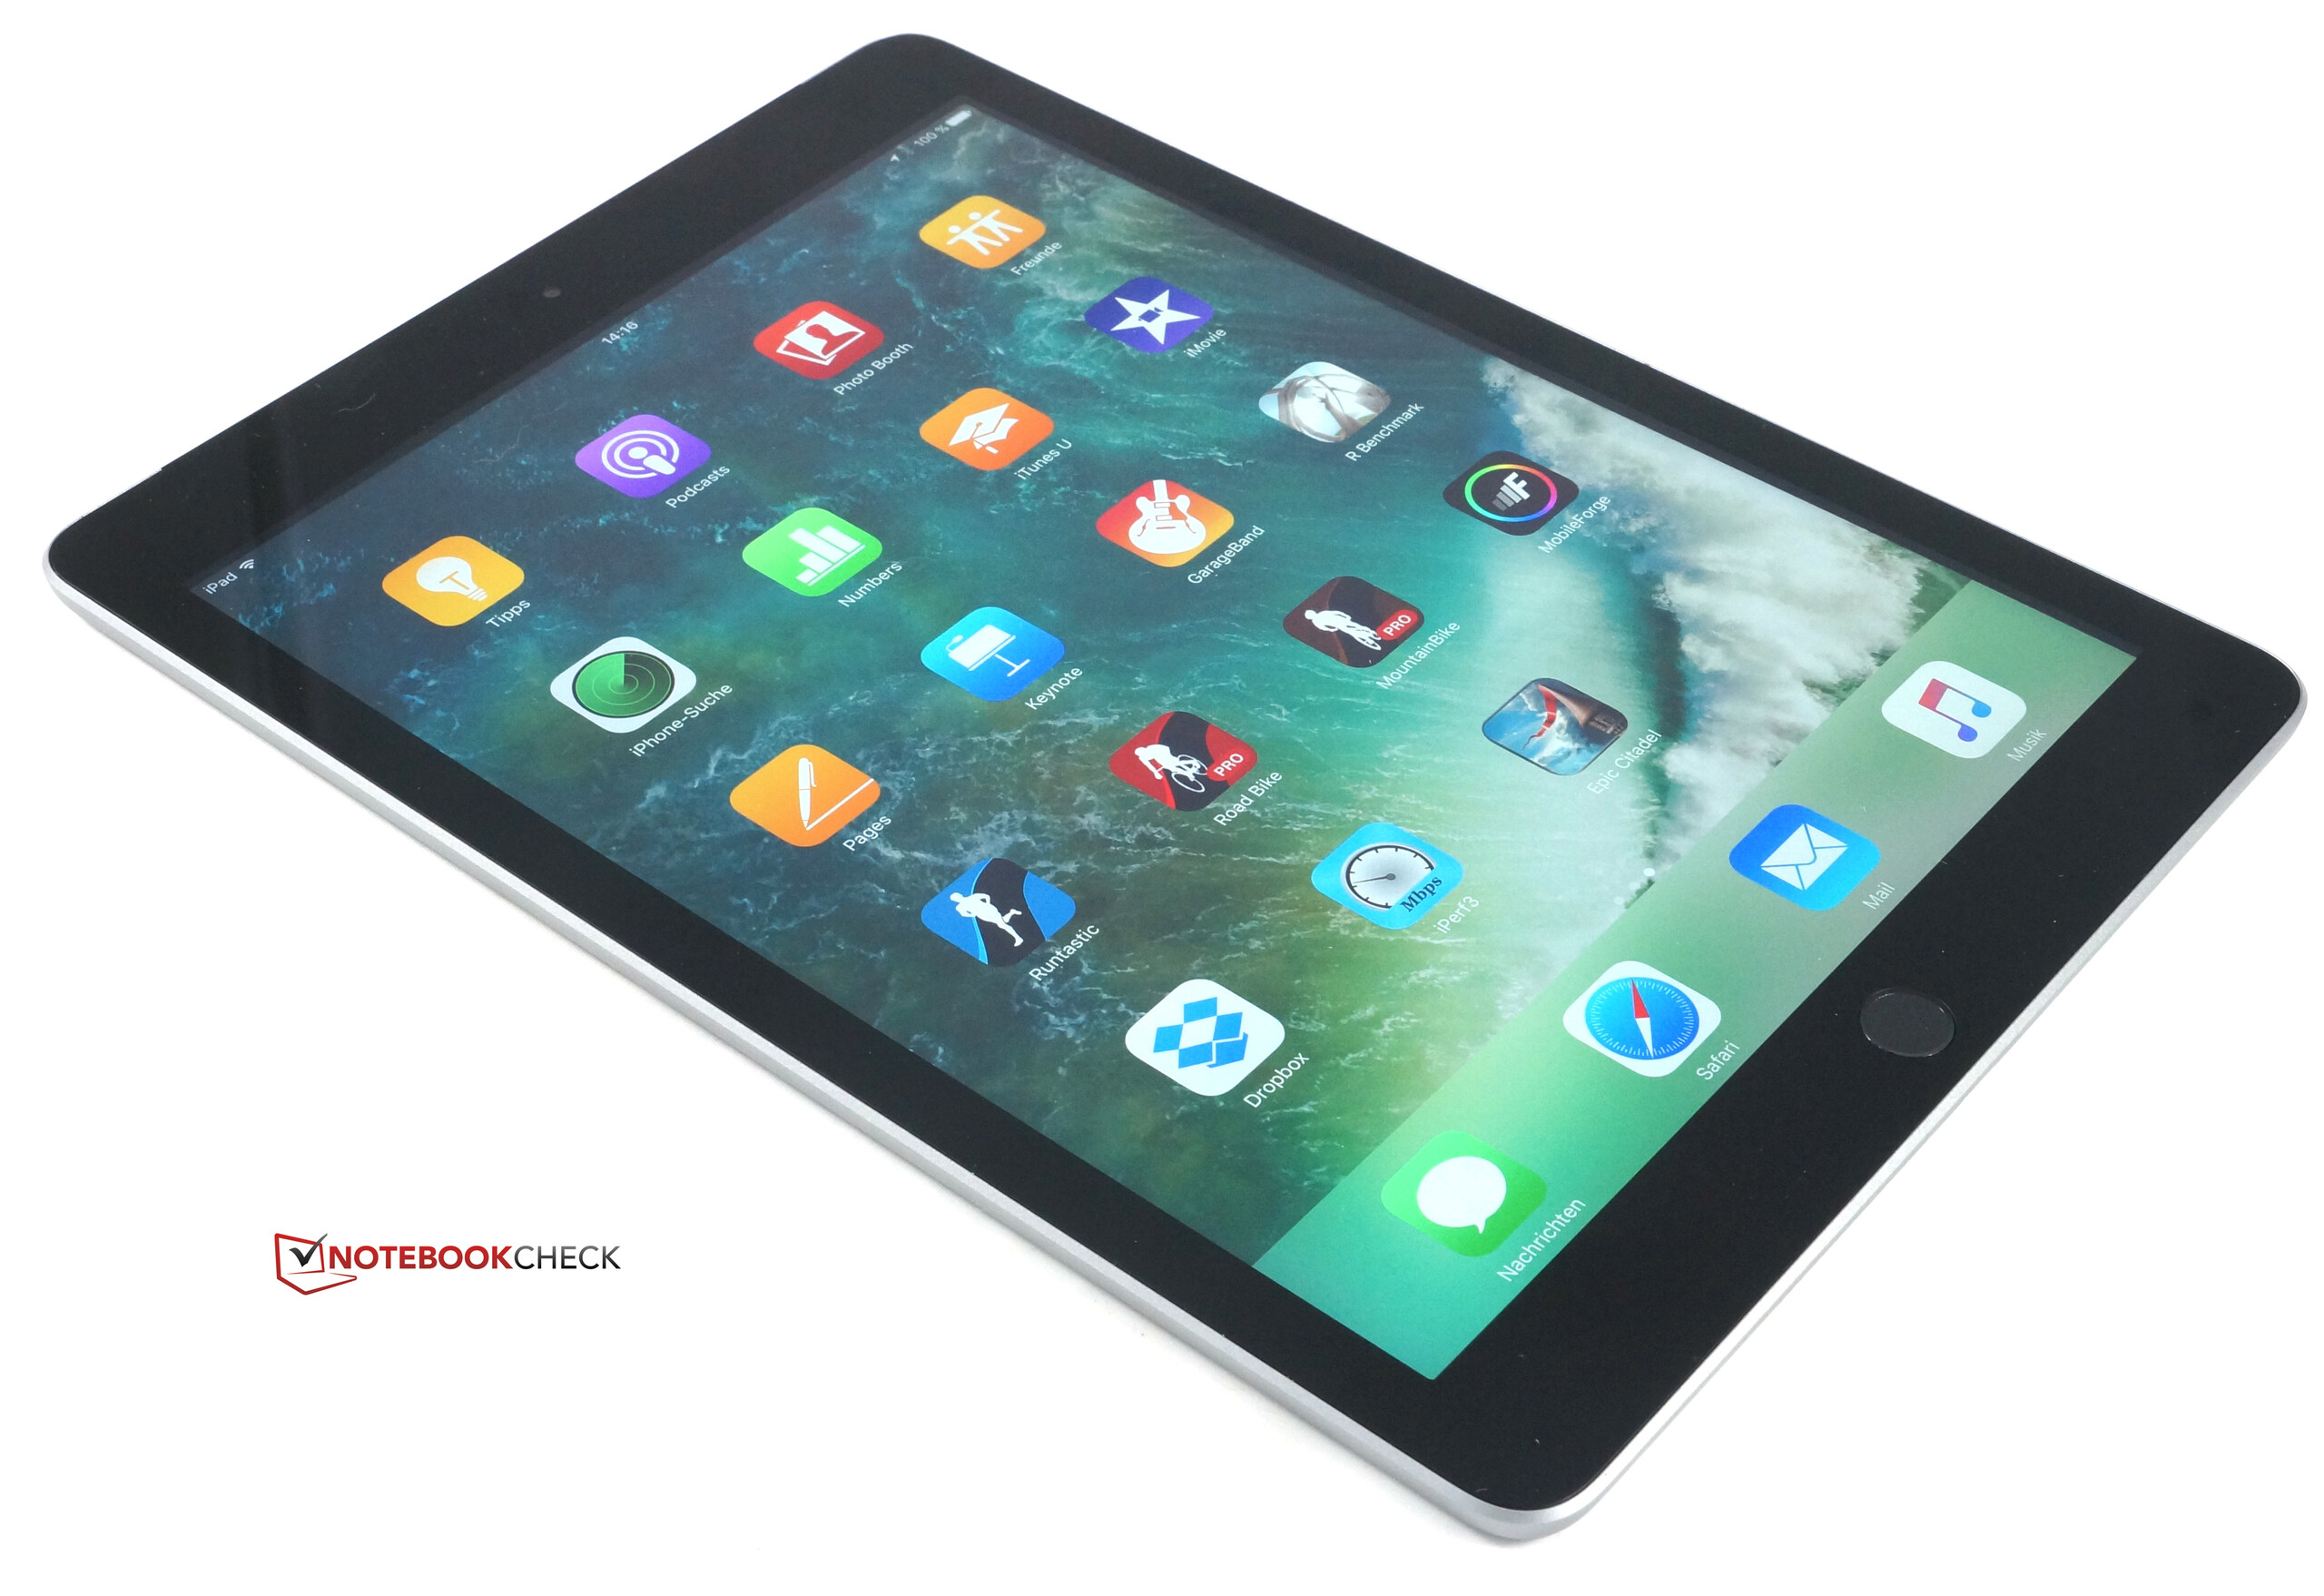
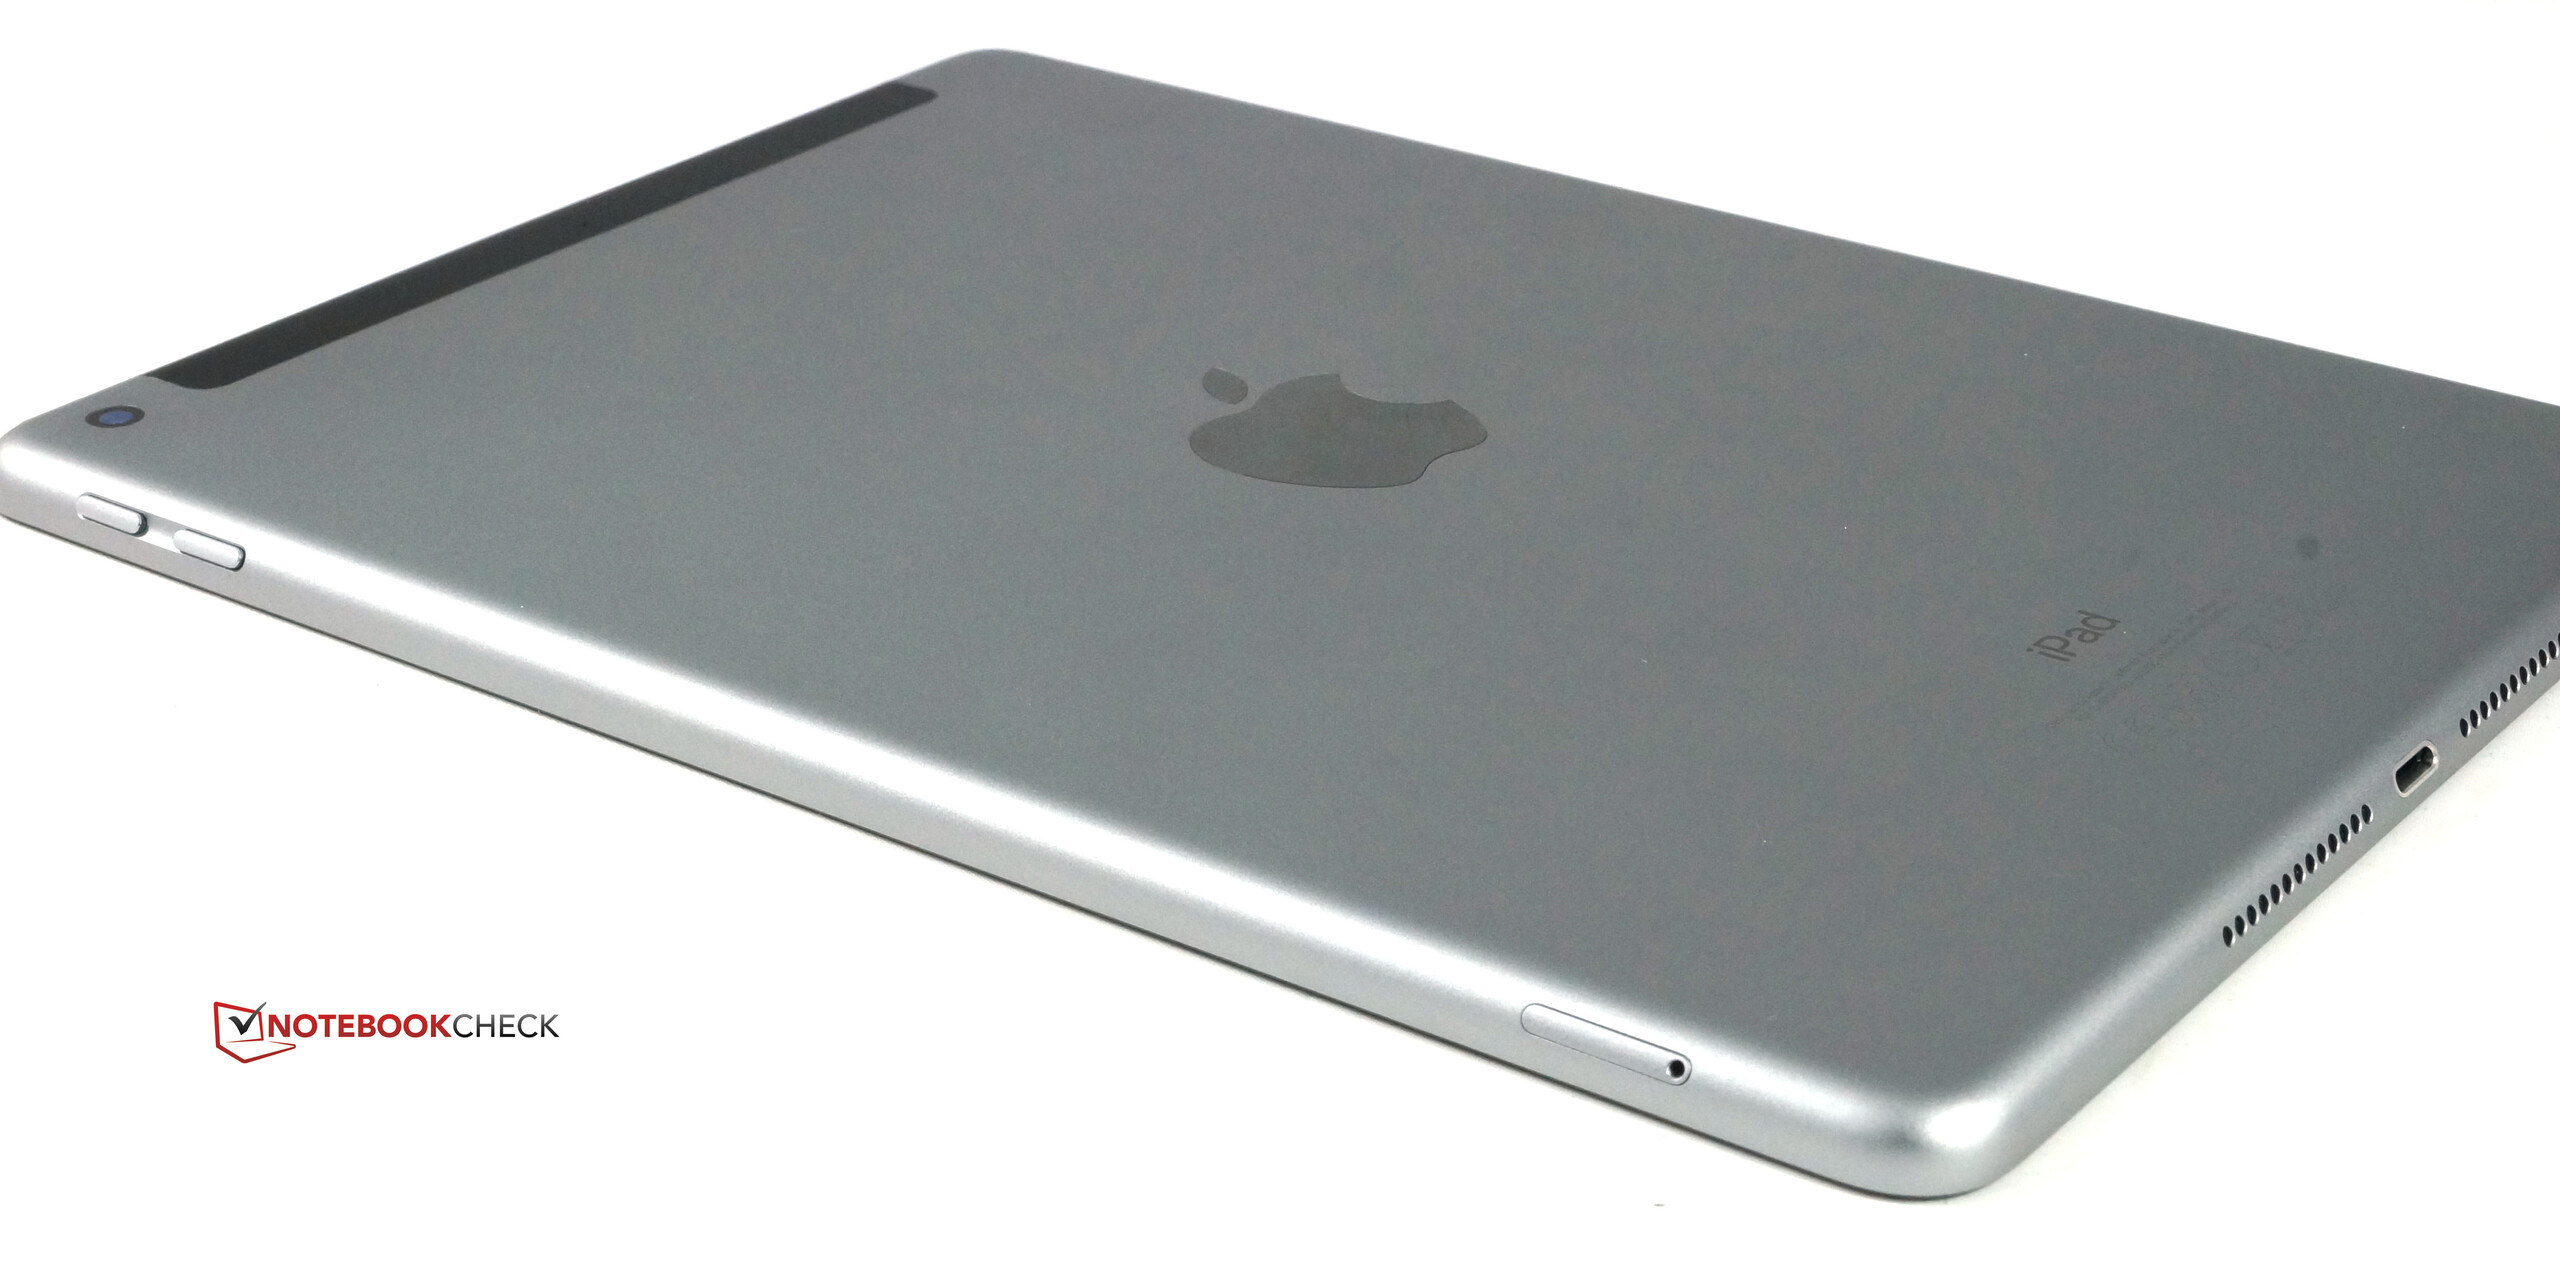
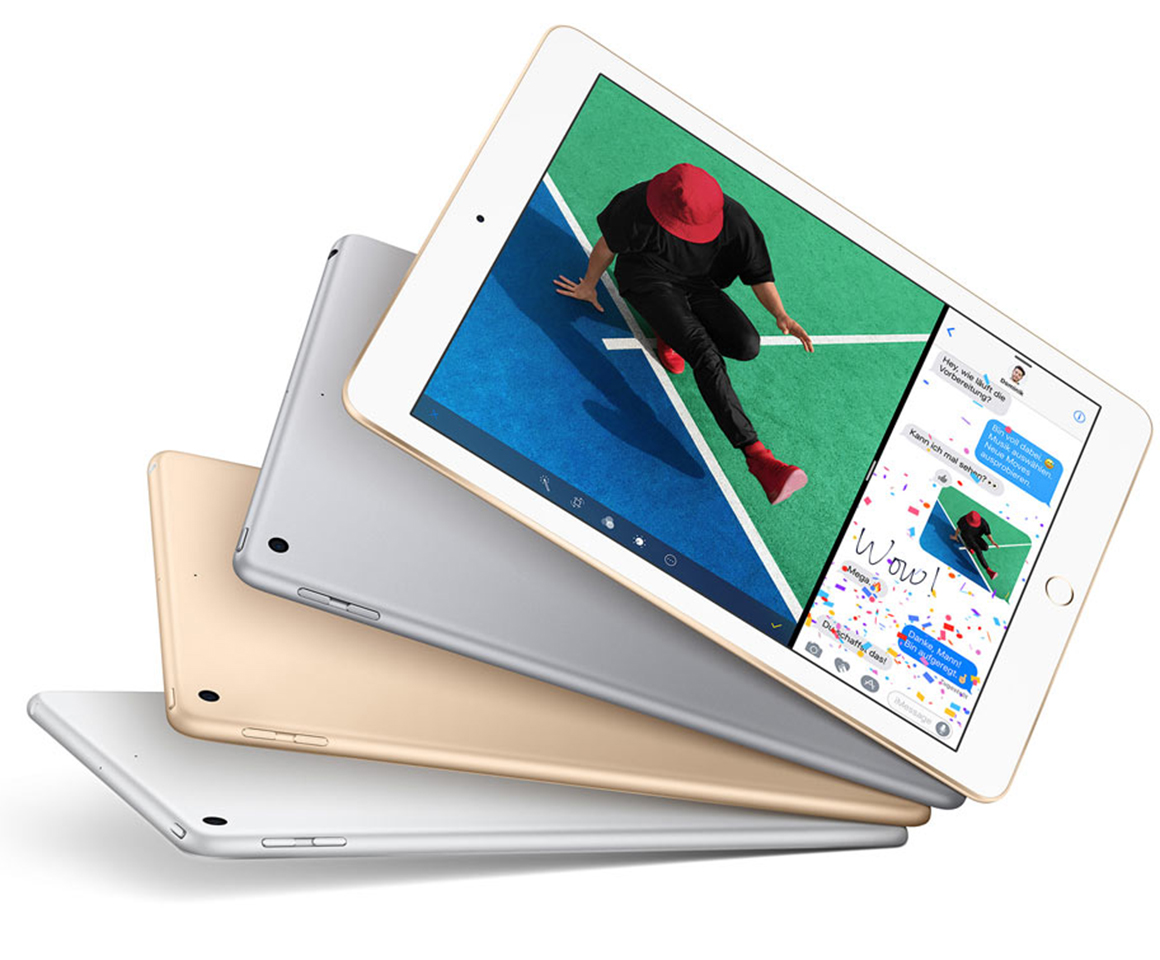
”Gammalt vin i nya flaskor” är något vi hör ganska ofta när en tillverkare uppdaterar en förmodat gammal produkt – speciellt när den är utrustad med daterad teknik. Detsamma gäller också Apples senaste iPad. IOS-plattan från 2017 är just det: återvunnen, med daterad hårdvara i ett ännu äldre hölje. Å andra sidan kostar instegsmodellen bara 4000 kr, vilket nästan är ett fynd för att vara en iPad.
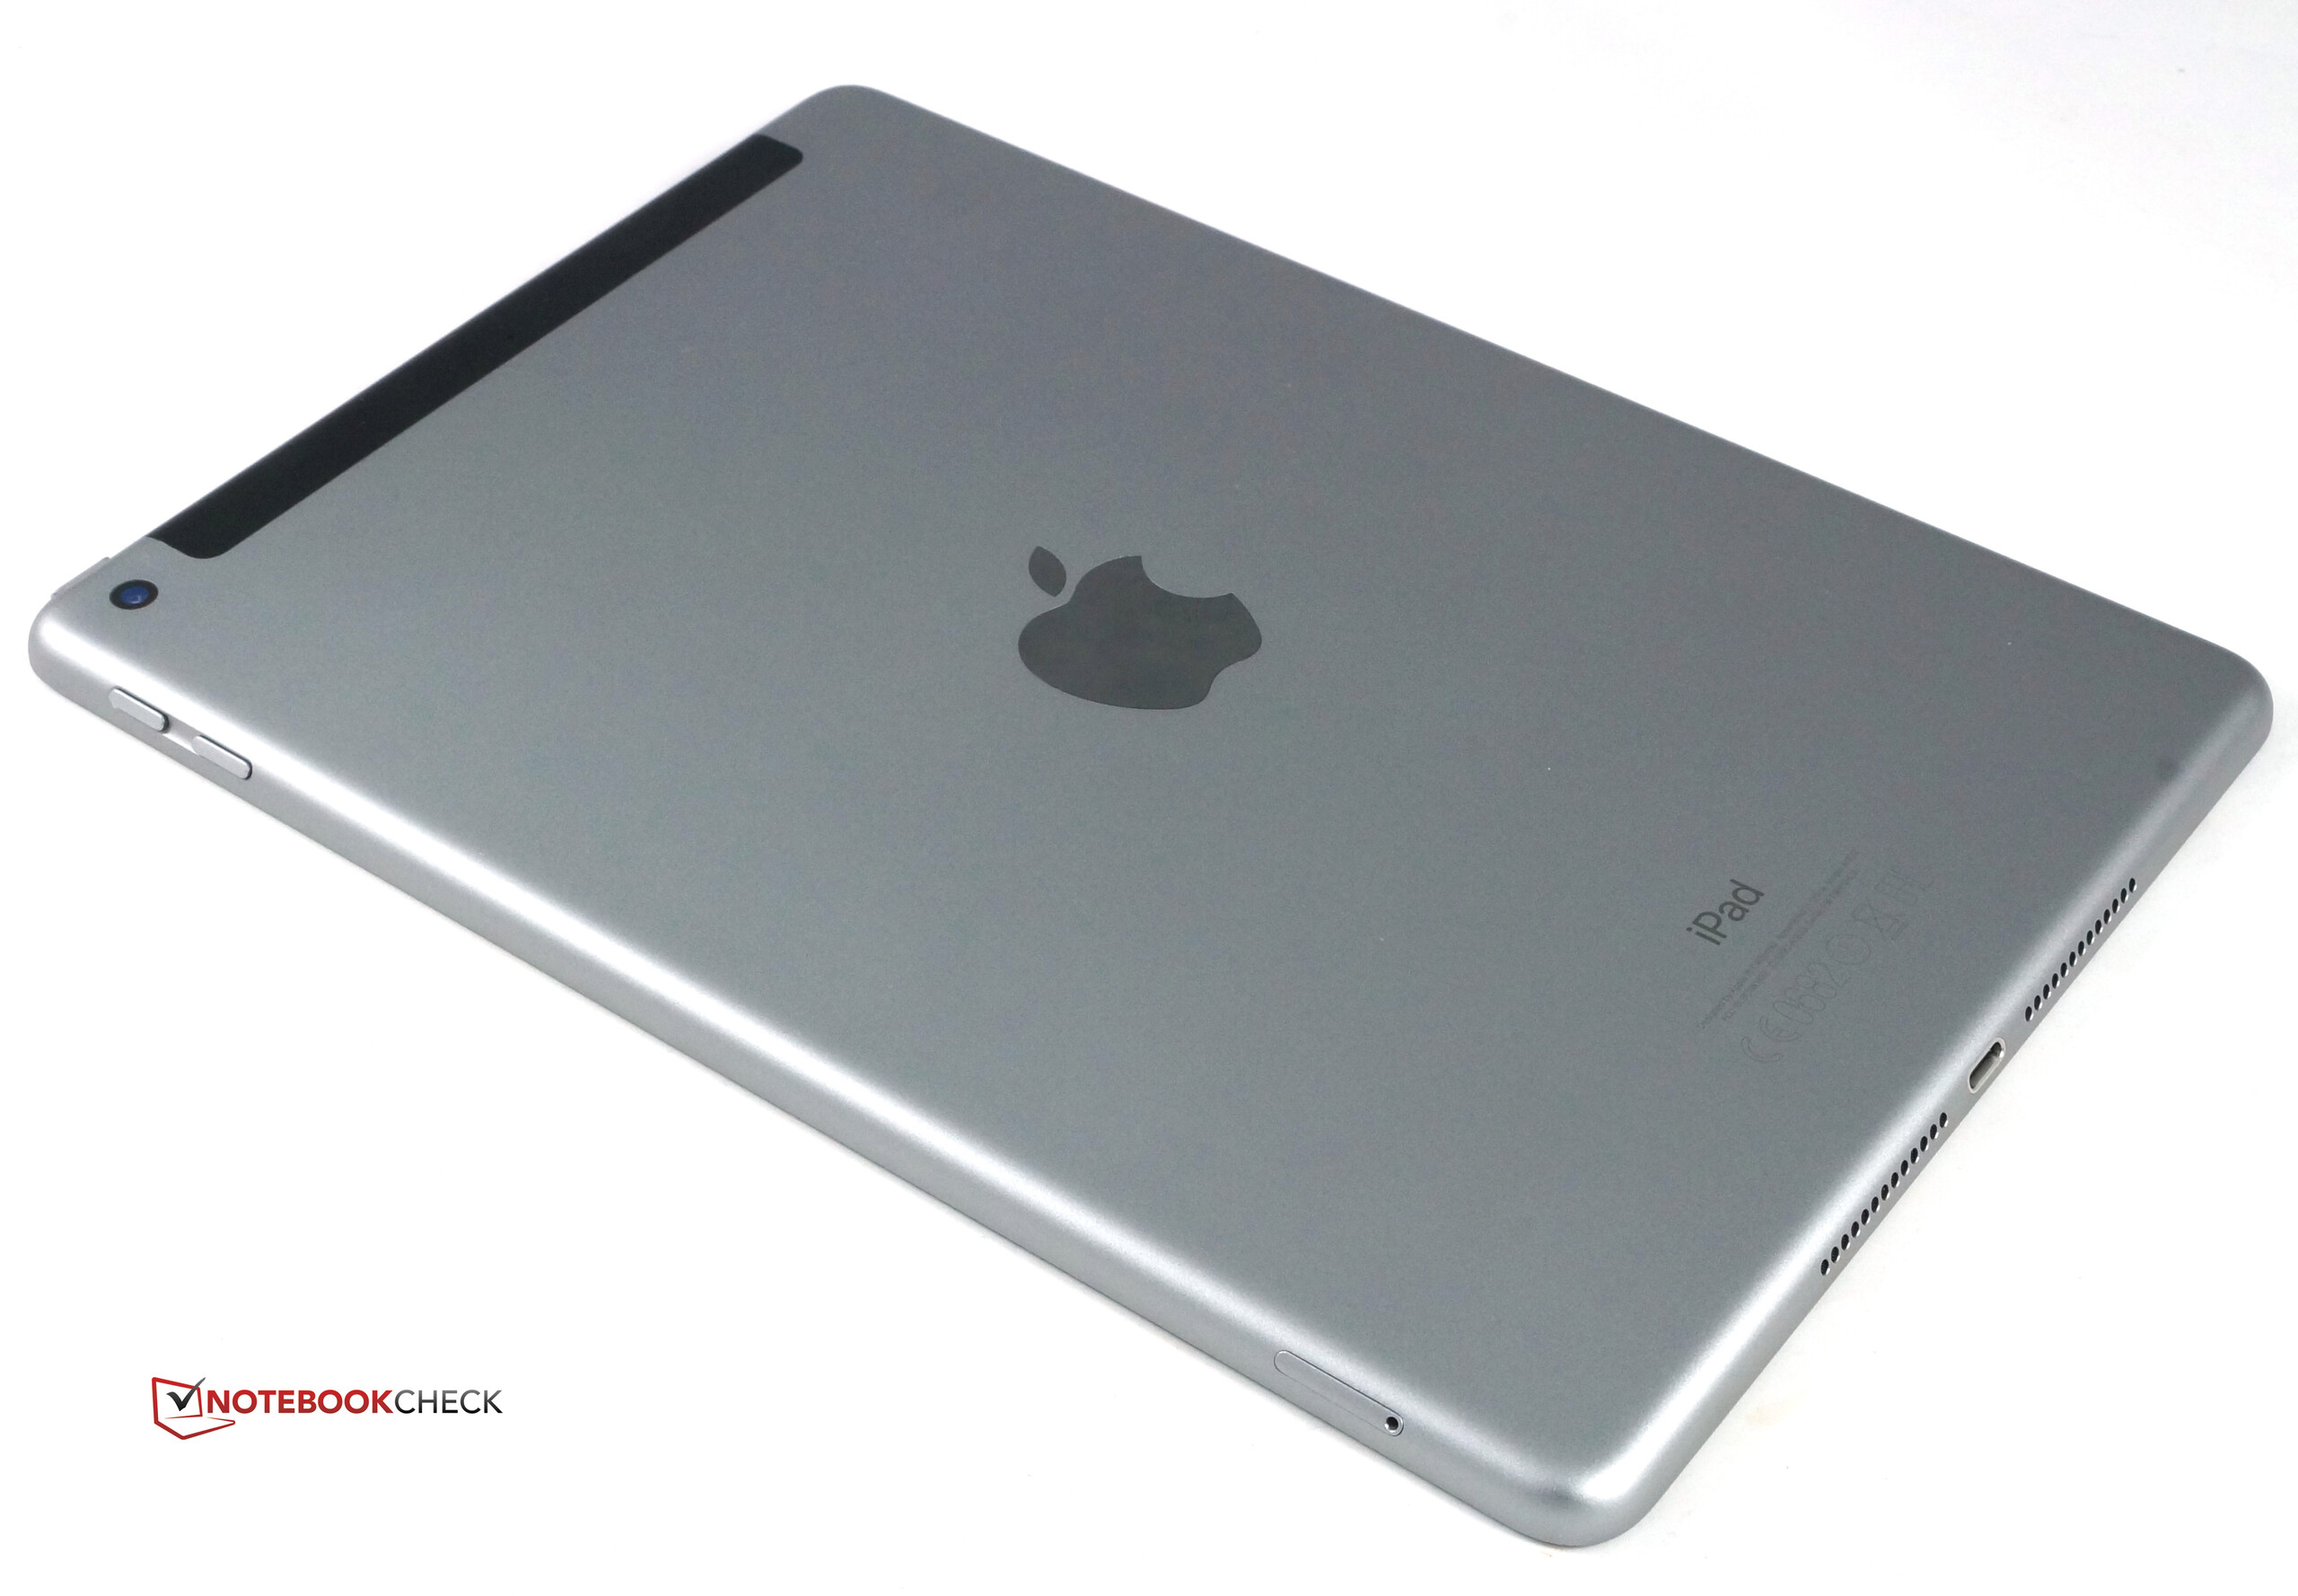
En närmare titt tar dessutom snabbt ta bort mycket av den förstnämnda kritiken. Jo, A9-kretsen är gammal, men prestandan står sig fortfarande mycket bra i konkurrensen. Och visst, höljet har funnits i några år och hade redan ersatts av en tunnare variant, men byggkvalitet och material håller fortfarande toppklass.
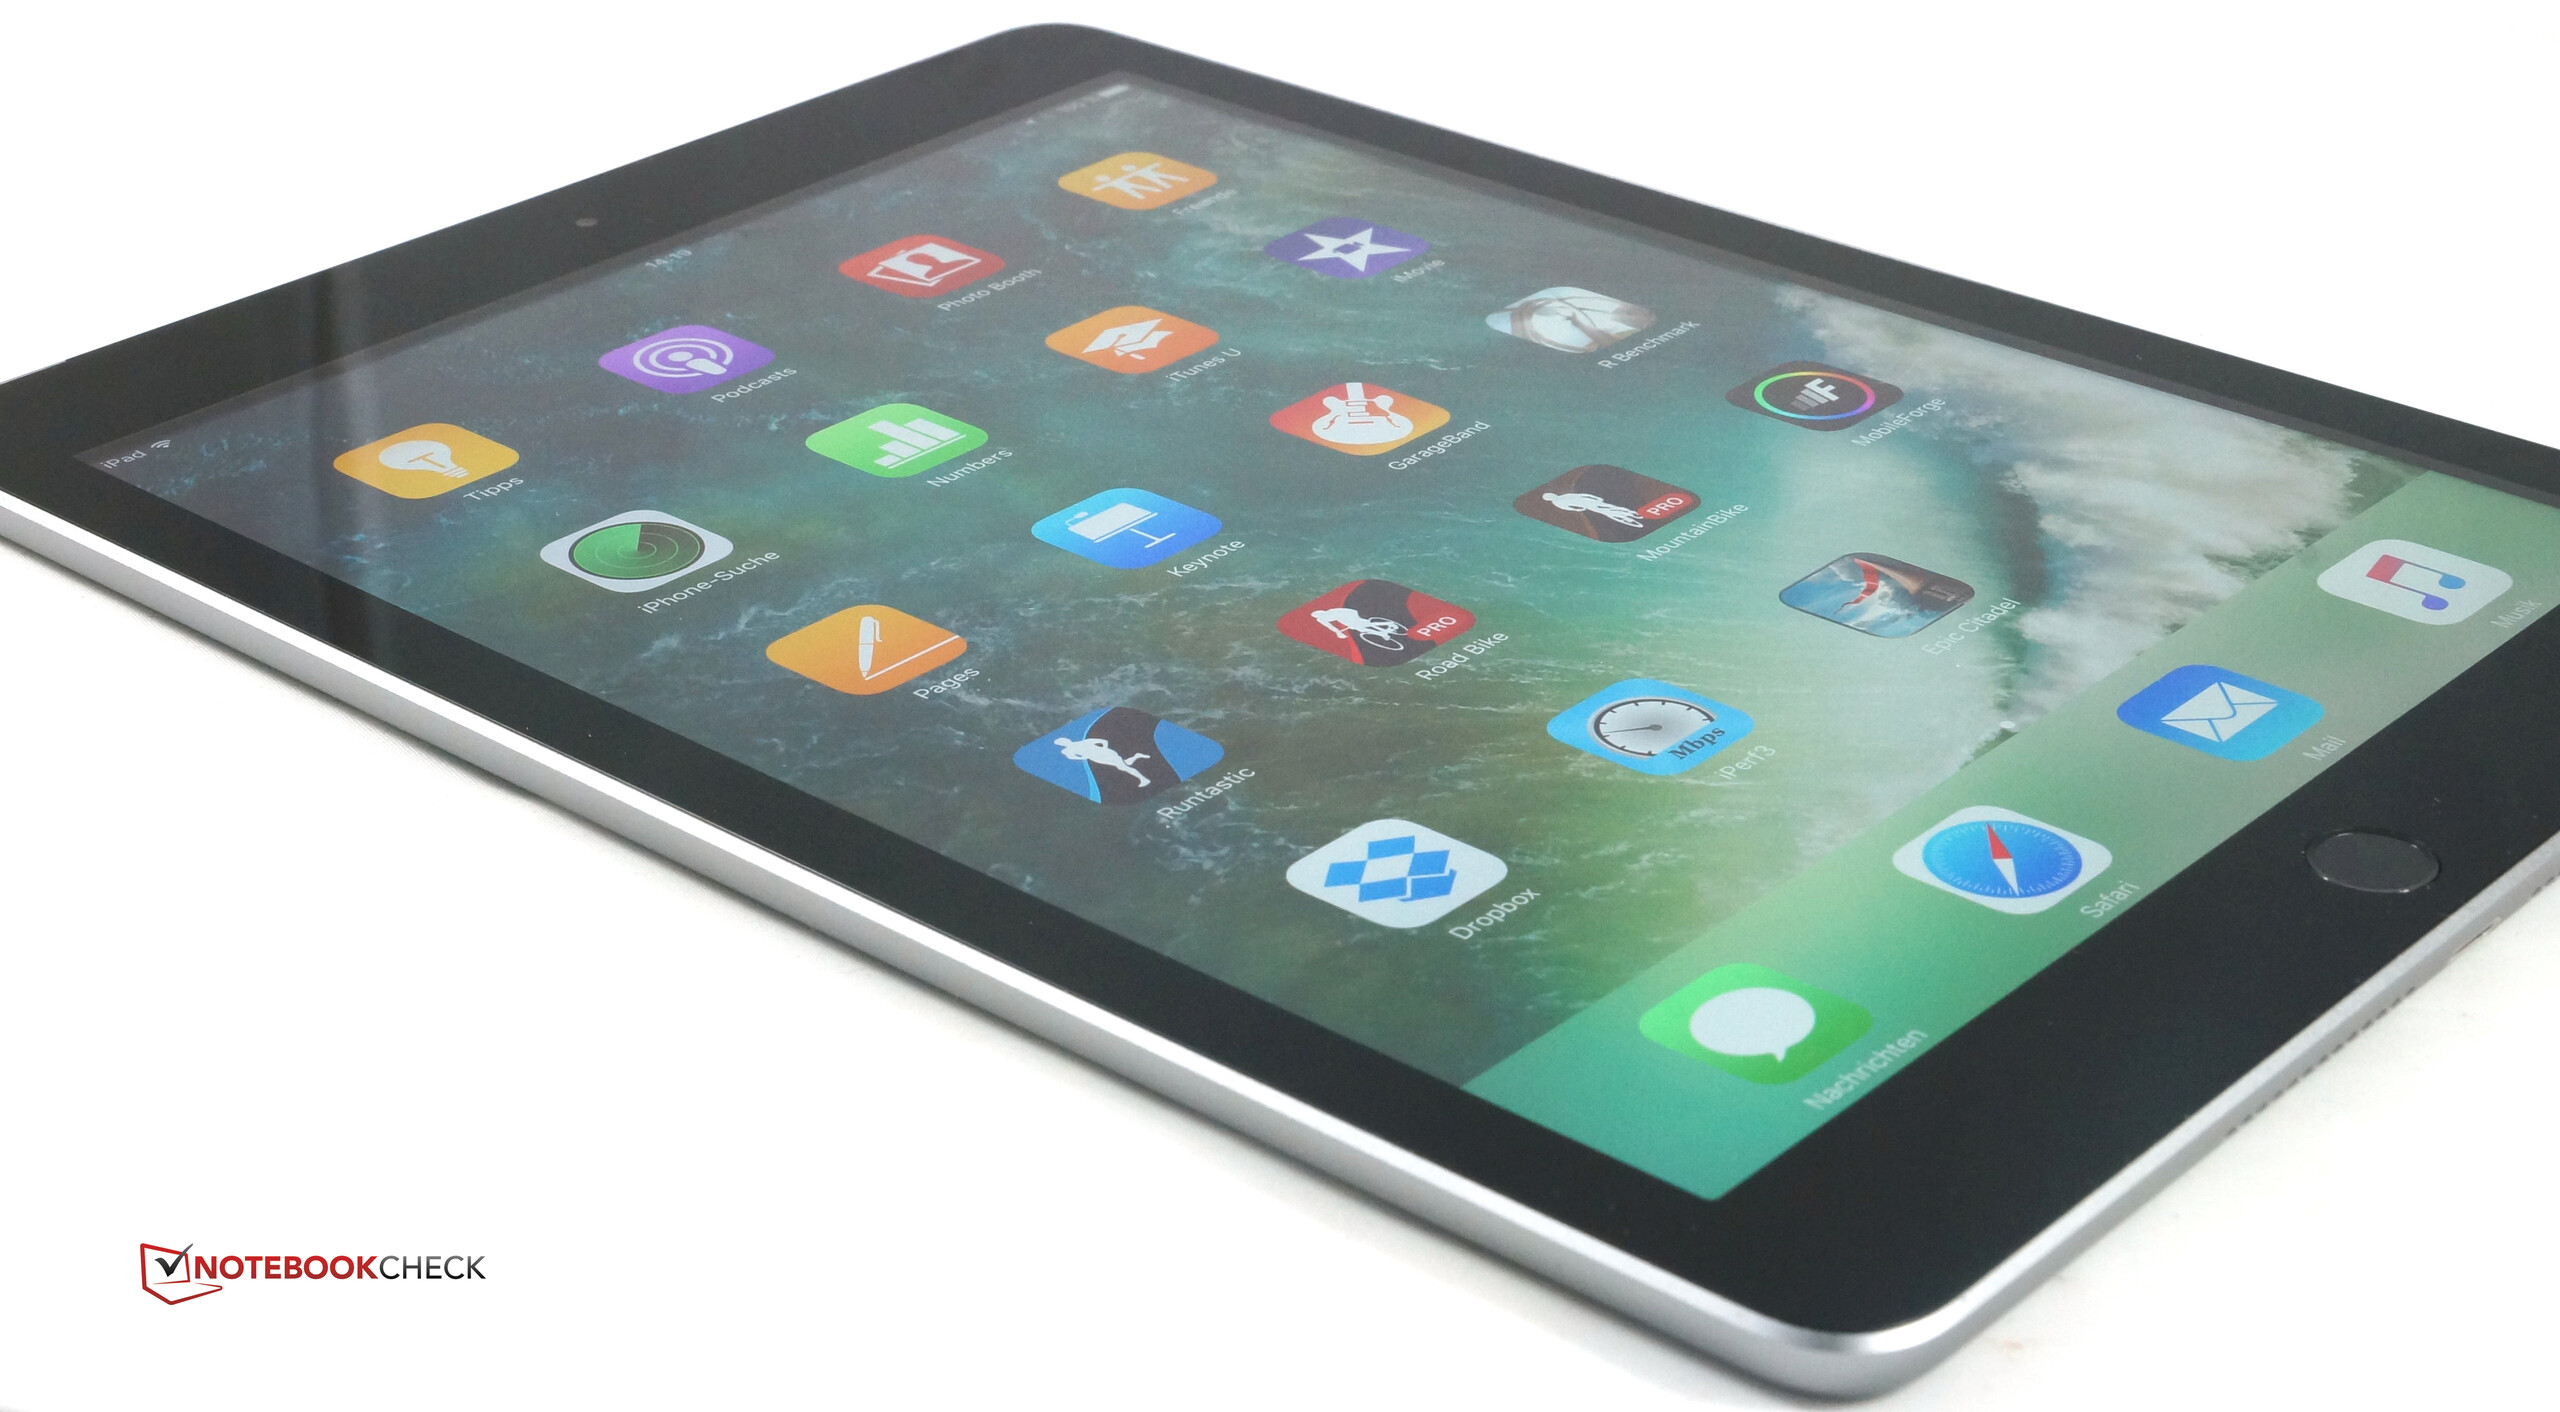
Apple har också förbättrat vissa aspekter av nya iPad jämfört med den egentliga förlagan iPad Air. Systemkretsen är snabbare, skärmen är mycket mer ljusstark och batteritiden är ännu bättre. Kombinerat med den snabba Wi-Fi-modulen, många LTE-band, en utmärkt GPS-mottagare och en användbar kamera, ser det gamla vinet plötsligt mycket mer tilltalande ut.
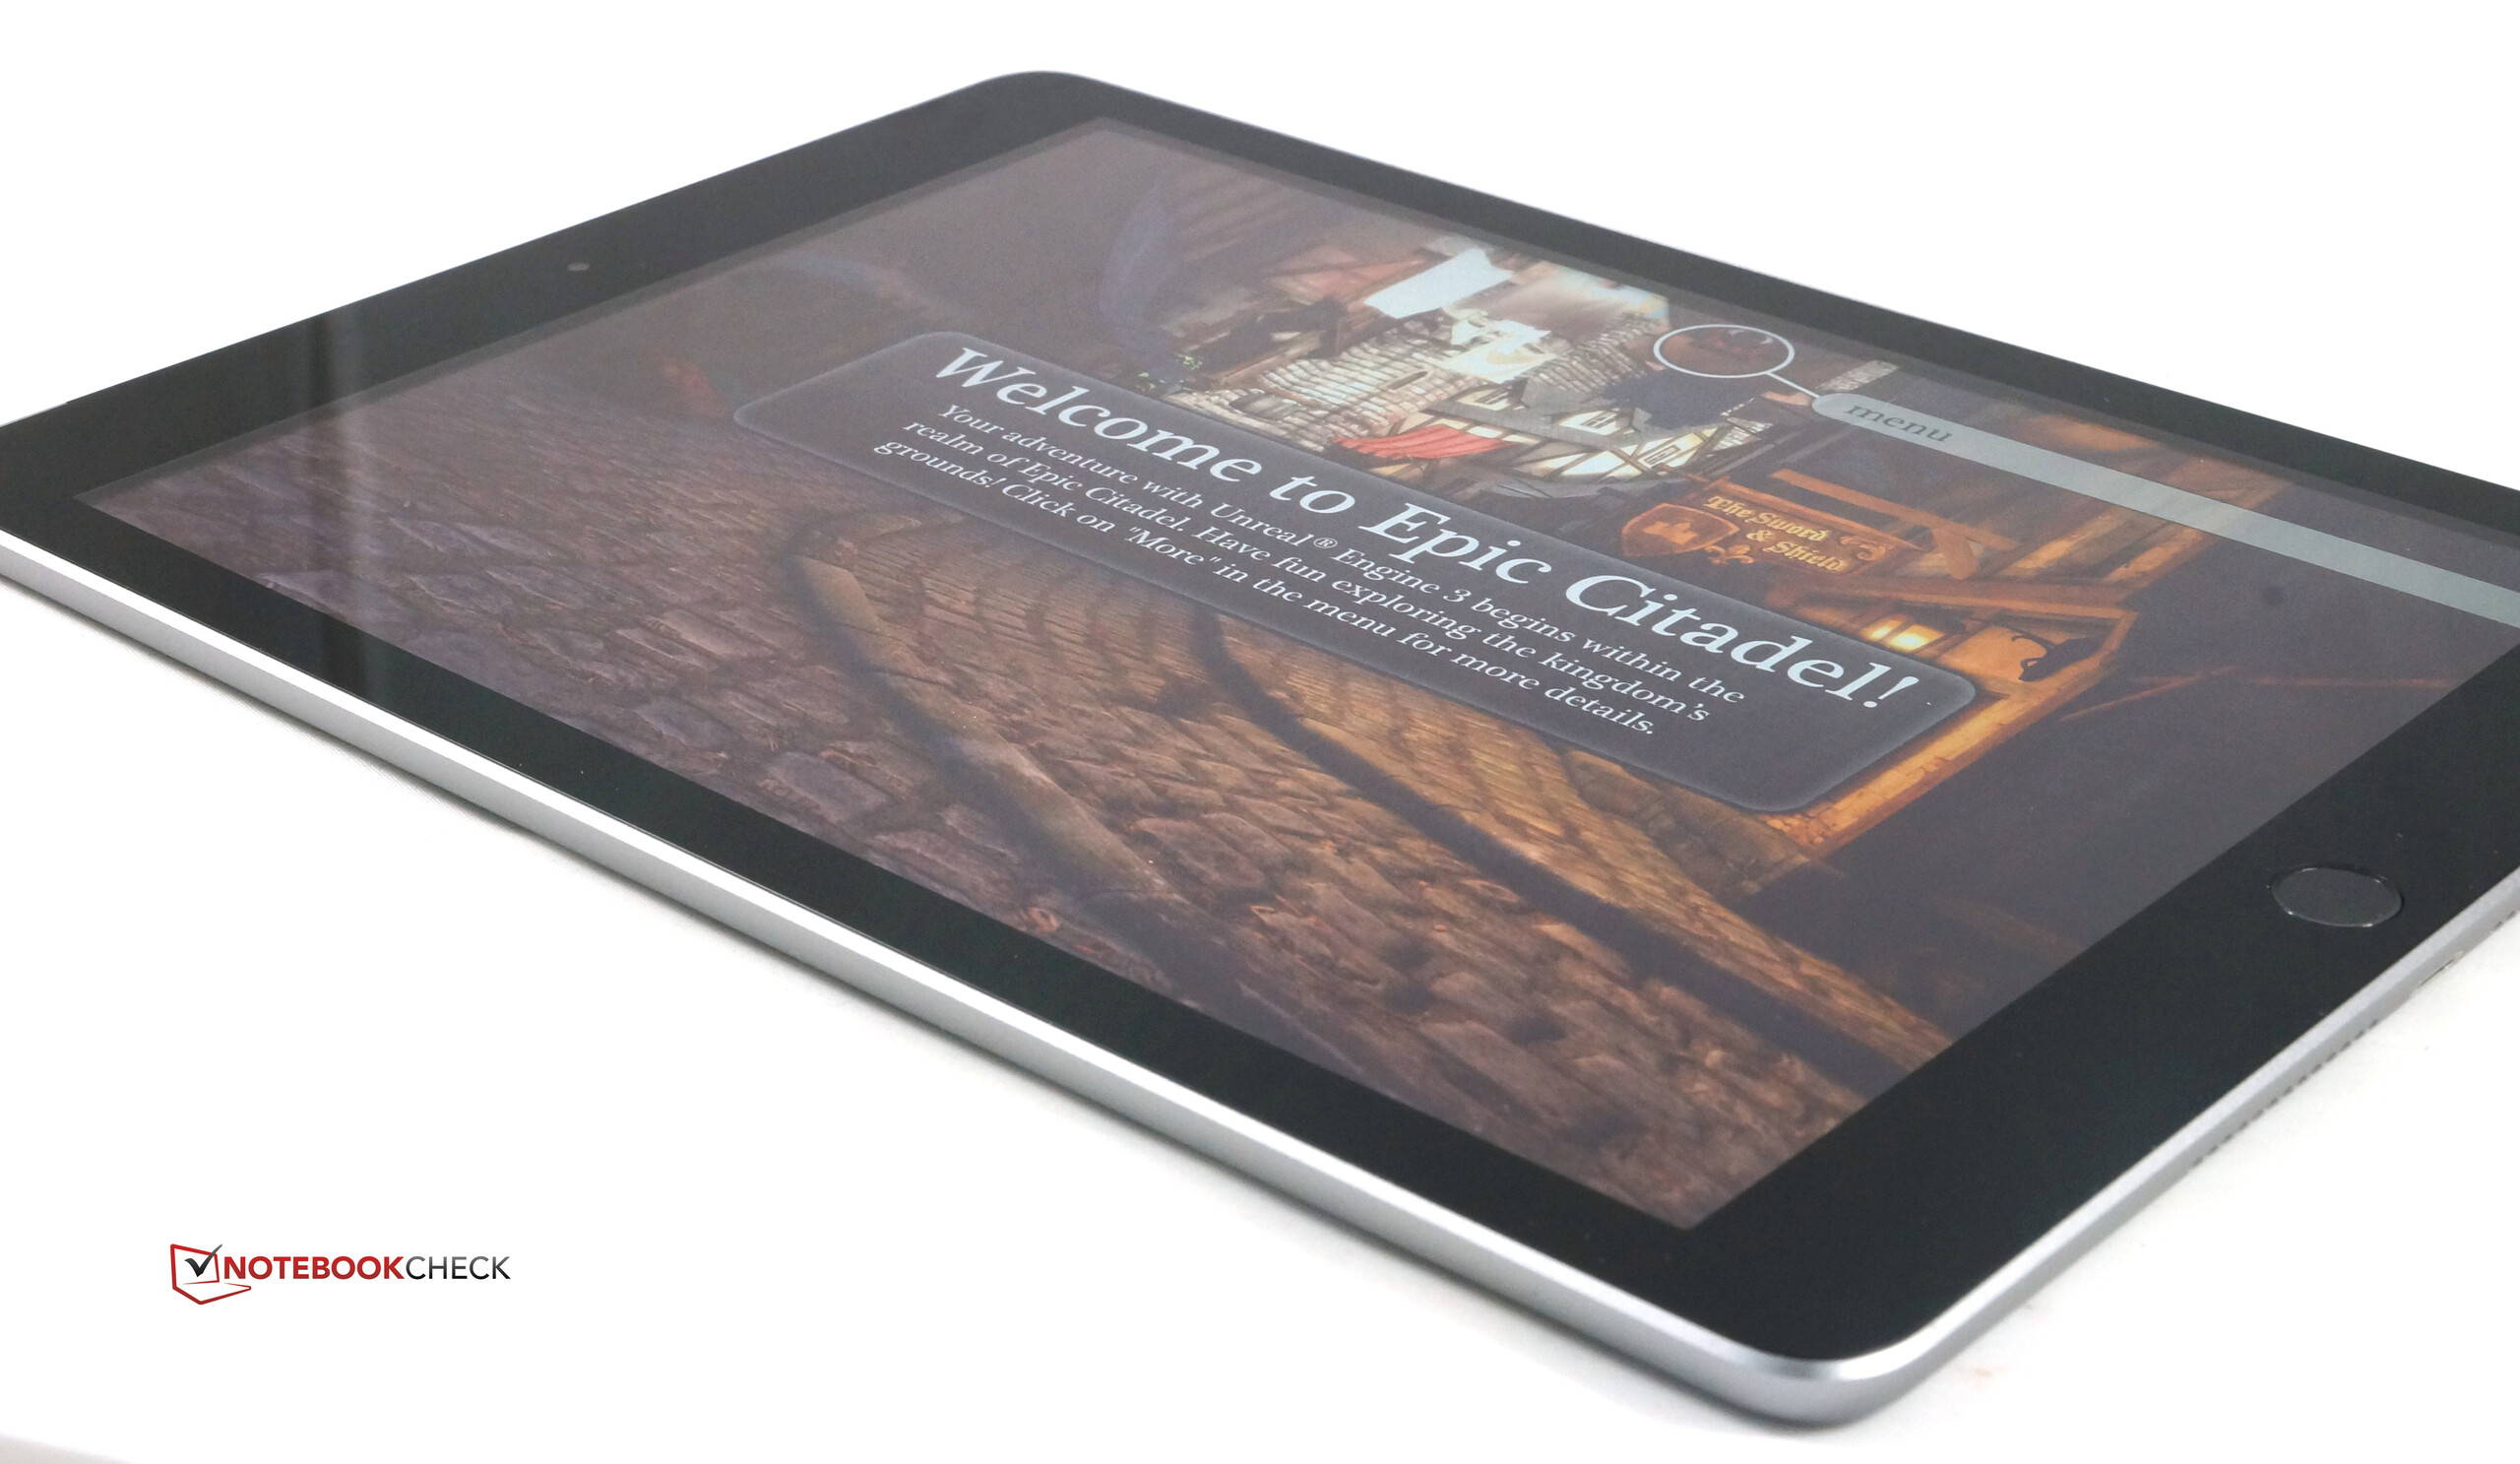
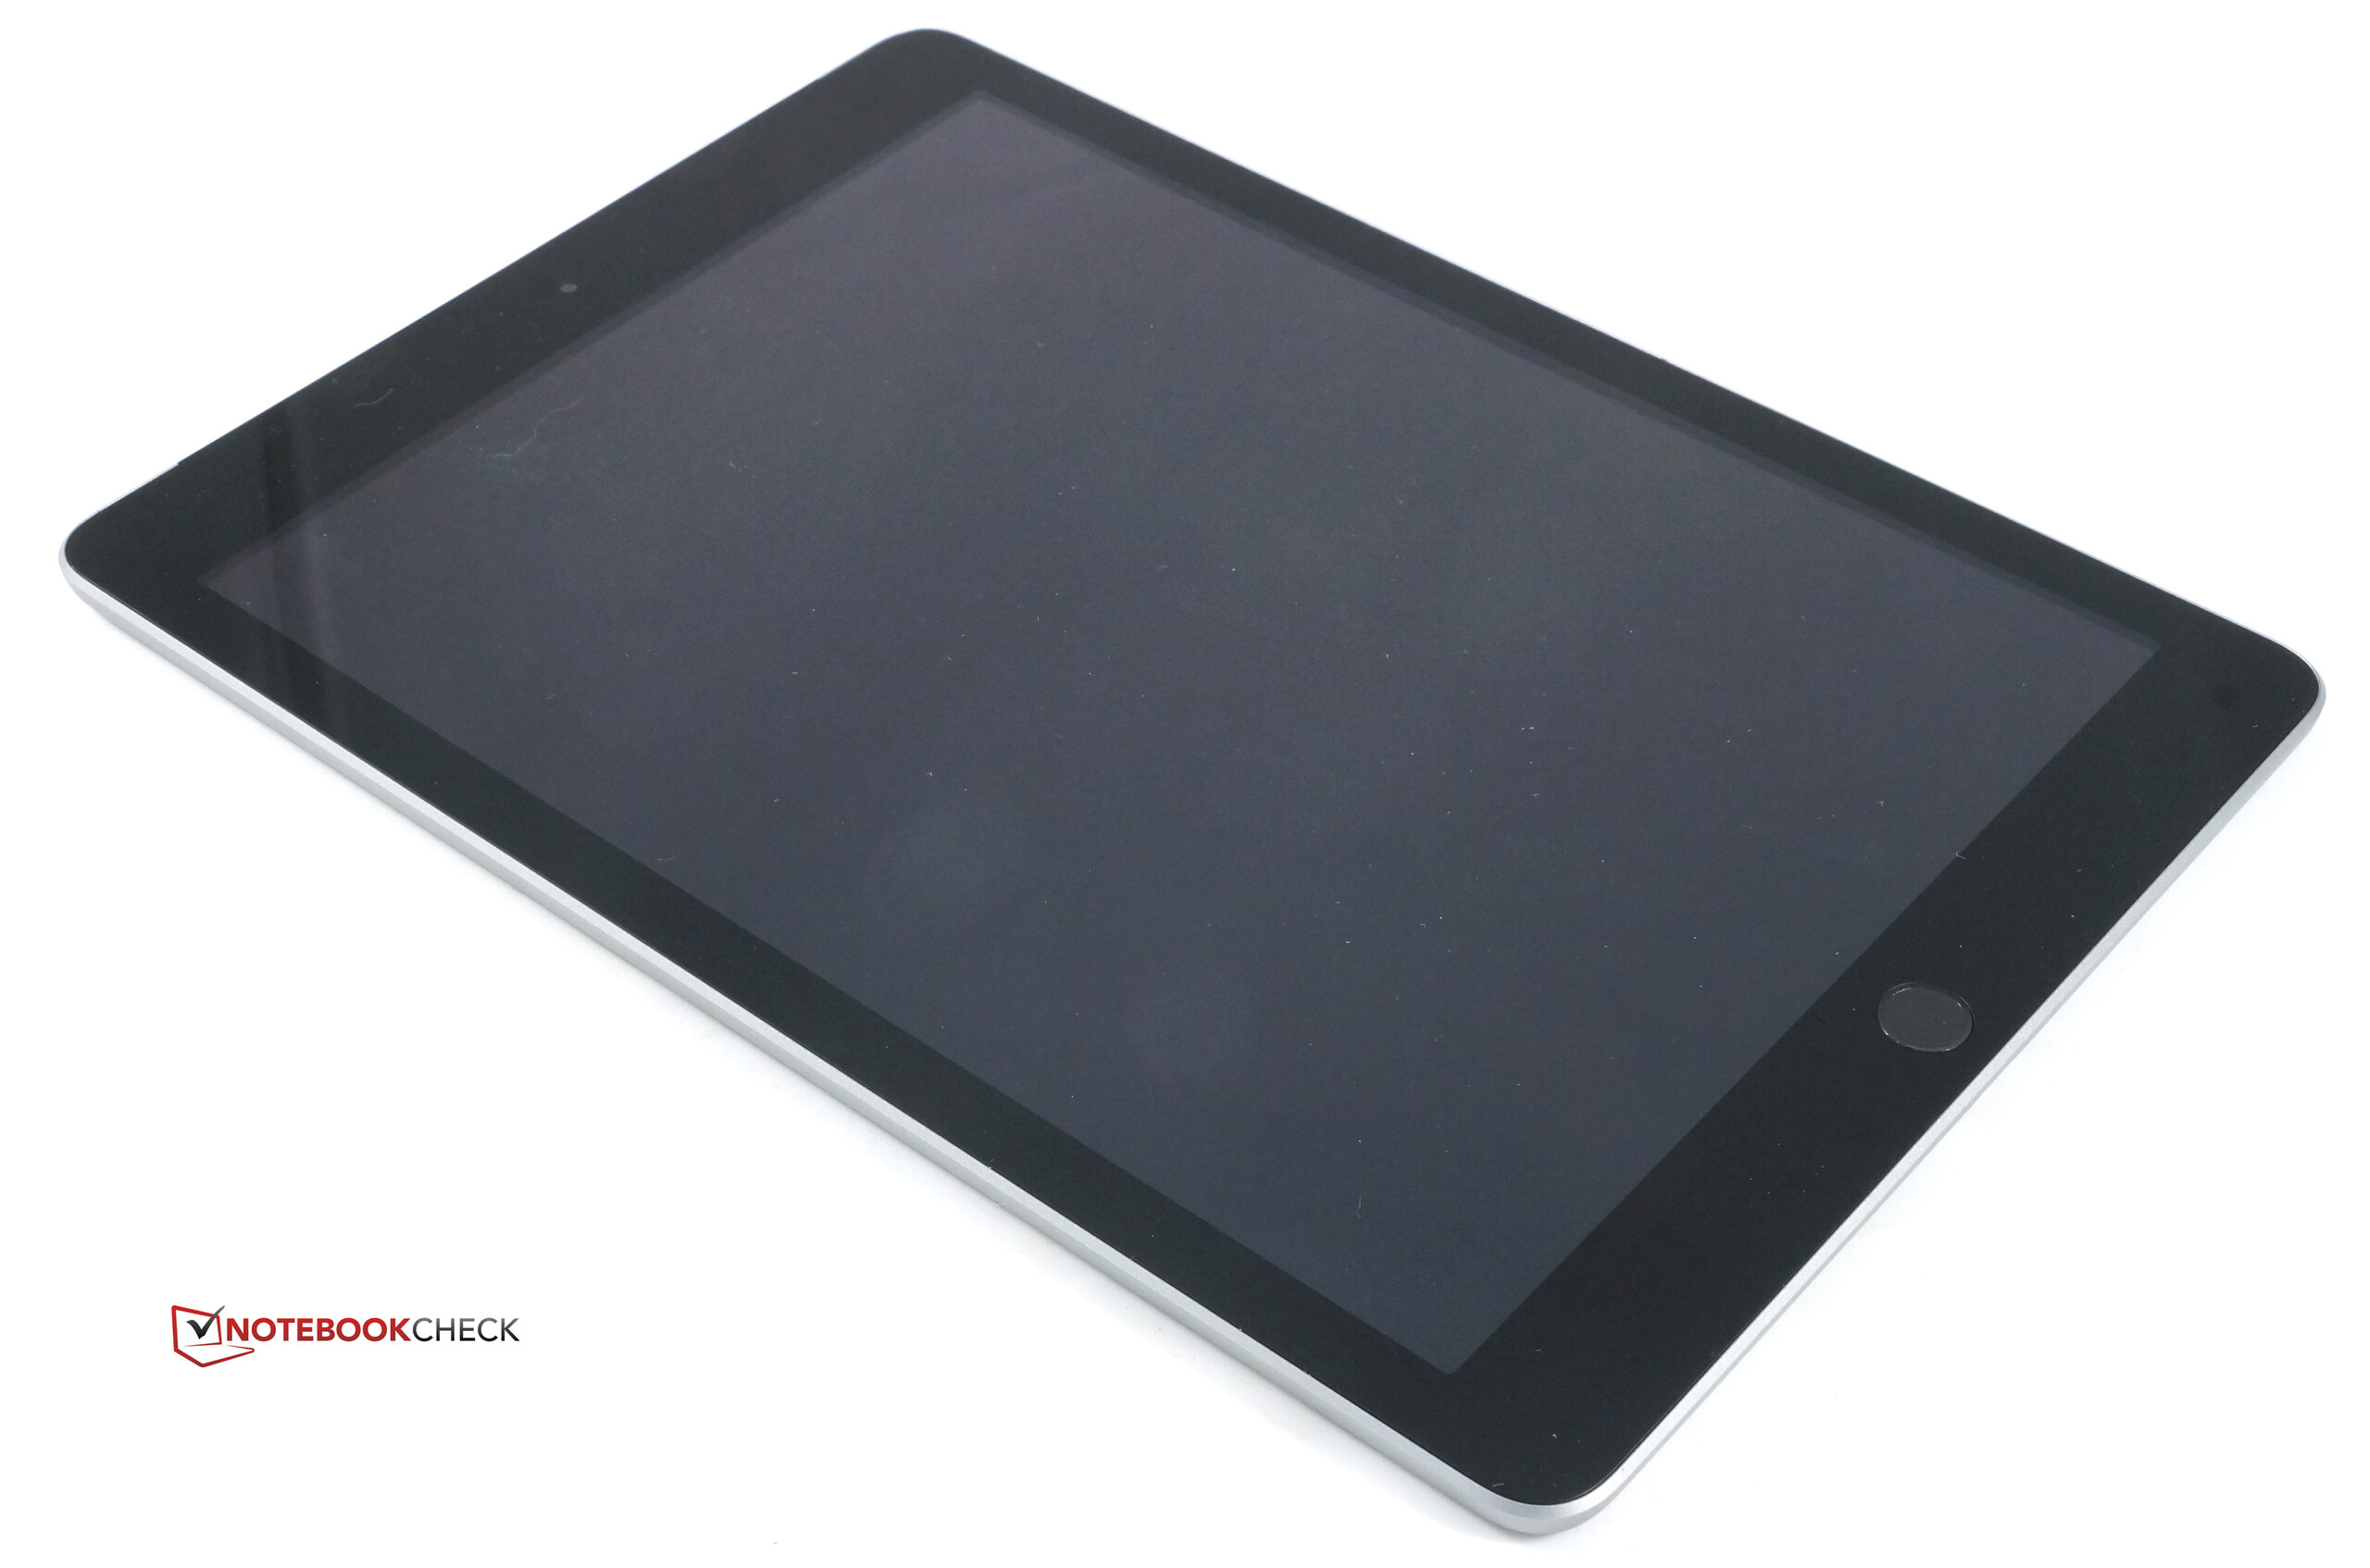
Några nackdelar kvarstår trots allt. Bristen på en helt laminerad skärm innebär att solljus förvandlar surfplattan till en spegel. Det här är ett irriterande steg tillbaka för alla som redan använde en iPad Mini 4 eller Air 2. Att nya iPad "bara" täcker sRGB-färgrymden är ett mindre problem för de flesta, liksom avsaknaden av stöd för Apple Pencil.
För att sammanfatta är nya Apple iPad nästan otroligt bra. Den har knappast någon konkurrens i prestandaväg förutom andra Apple-plattor, trots den daterade hårdvaran. Totalbetyget blir alltså skyhögt, men det beror delvis på bristen på konkurrens.
Apple iPad (2017)
- 03/31/2018 v6 (old)
Patrick Afschar Kaboli
Price comparison
