Test: Acer TravelMate P2410 (i7-8550U, MX130) Laptop (Sammanfattning)

| SD Card Reader | |
| average JPG Copy Test (av. of 3 runs) | |
| HP Spectre x360 15-ch011nr (Toshiba Exceria Pro SDXC 64 GB UHS-II) | |
| Dell XPS 13 i7-8550U | |
| Lenovo ThinkPad T480-20L6S01V00 (Toshiba Exceria Pro SDXC 64 GB UHS-II) | |
| Genomsnitt av klass Office (19.8 - 198.5, n=22, senaste 2 åren) | |
| Asus VivoBook 15 F510UF-ES71 (Toshiba Exceria Pro SDXC 64 GB UHS-II) | |
| Acer TravelMate P2510-M-51ZQ (Toshiba Exceria Pro SDXC 64 GB UHS-II) | |
| Acer TravelMate 2410-G2-MG-82E6 (Toshiba Exceria Pro SDXC 64 GB UHS-II) | |
| maximum AS SSD Seq Read Test (1GB) | |
| HP Spectre x360 15-ch011nr (Toshiba Exceria Pro SDXC 64 GB UHS-II) | |
| Dell XPS 13 i7-8550U | |
| Lenovo ThinkPad T480-20L6S01V00 (Toshiba Exceria Pro SDXC 64 GB UHS-II) | |
| Genomsnitt av klass Office (27.4 - 249, n=21, senaste 2 åren) | |
| Asus VivoBook 15 F510UF-ES71 (Toshiba Exceria Pro SDXC 64 GB UHS-II) | |
| Acer TravelMate P2510-M-51ZQ (Toshiba Exceria Pro SDXC 64 GB UHS-II) | |
| Acer TravelMate 2410-G2-MG-82E6 (Toshiba Exceria Pro SDXC 64 GB UHS-II) | |

| |||||||||||||||||||||||||
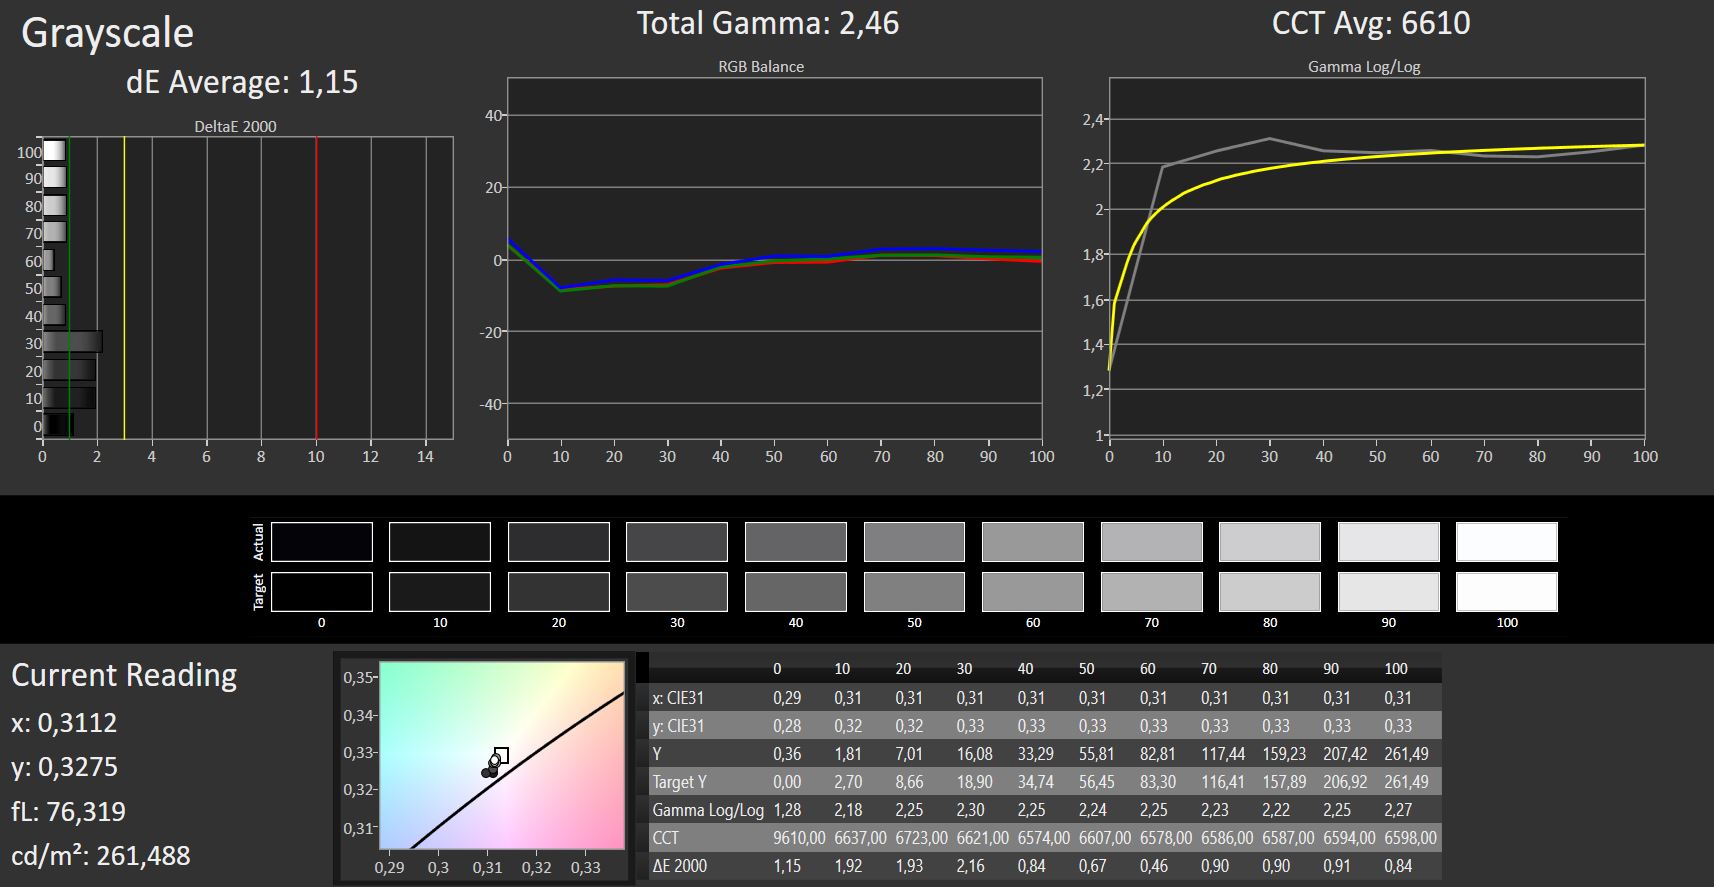
Distribution av ljusstyrkan: 85 %
Mitt på batteriet: 265 cd/m²
Kontrast: 716:1 (Svärta: 0.37 cd/m²)
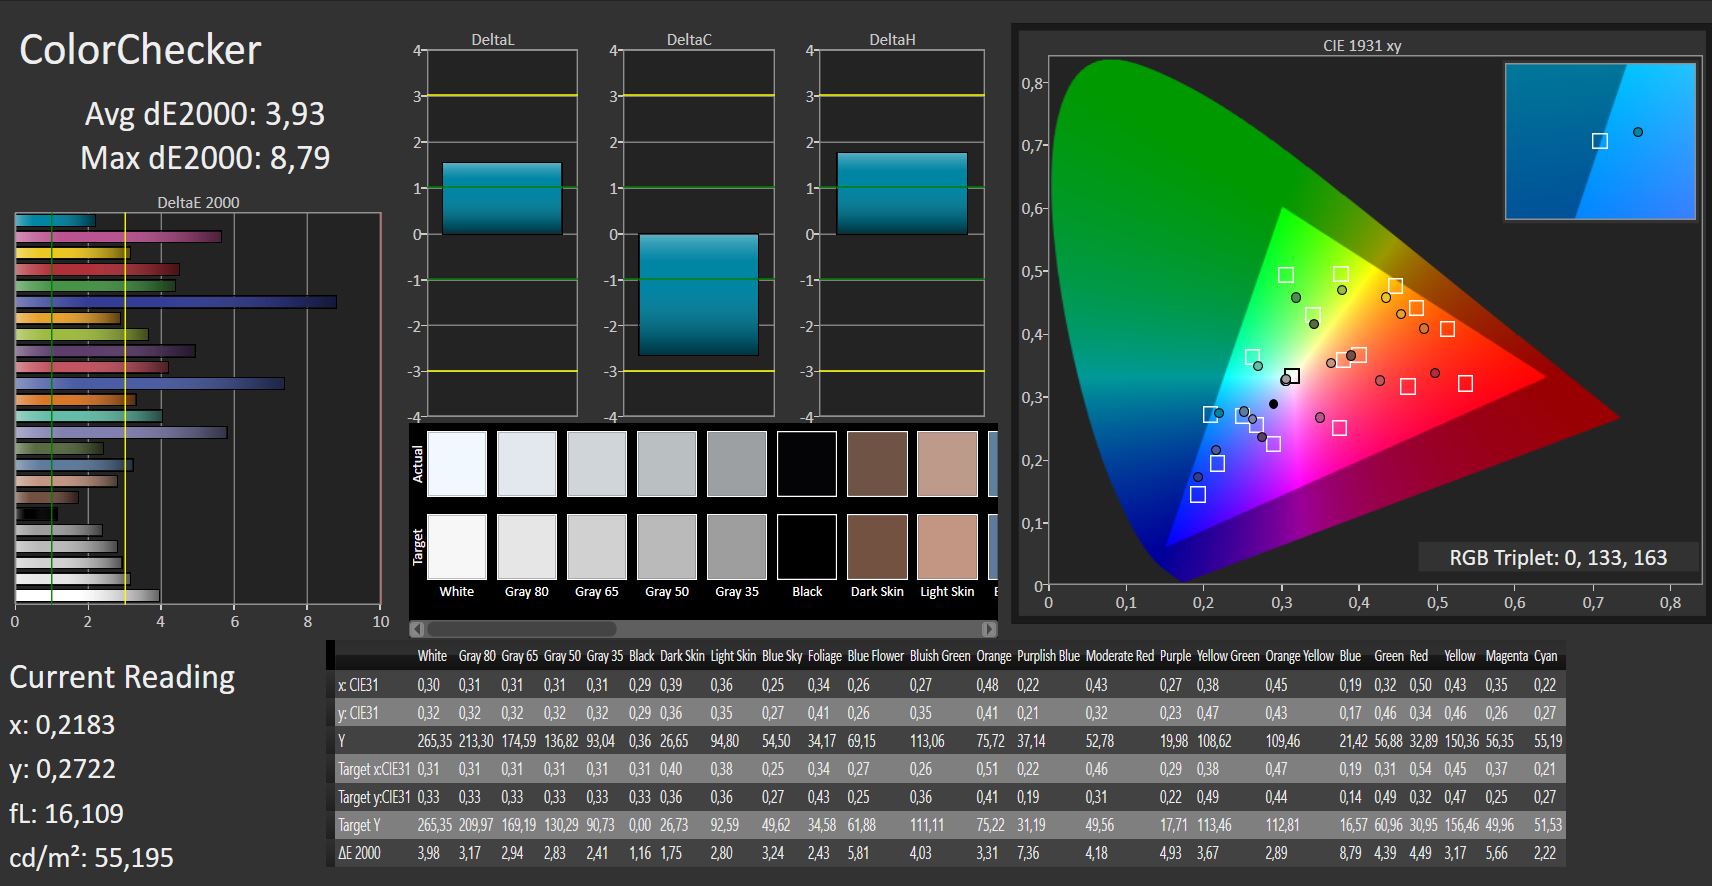
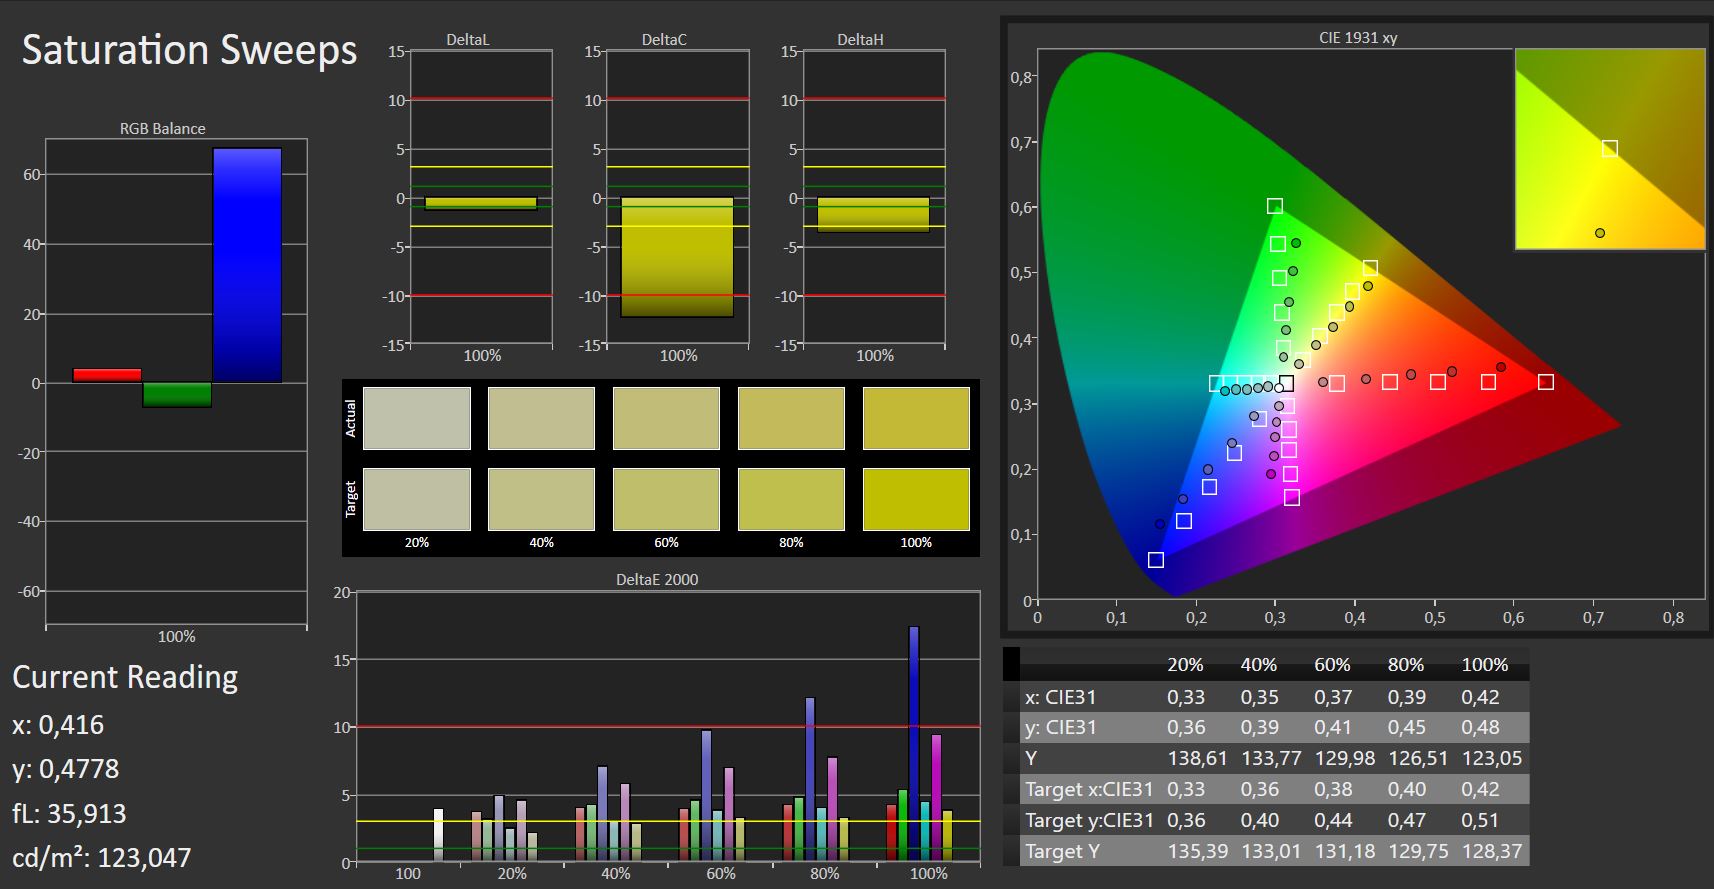
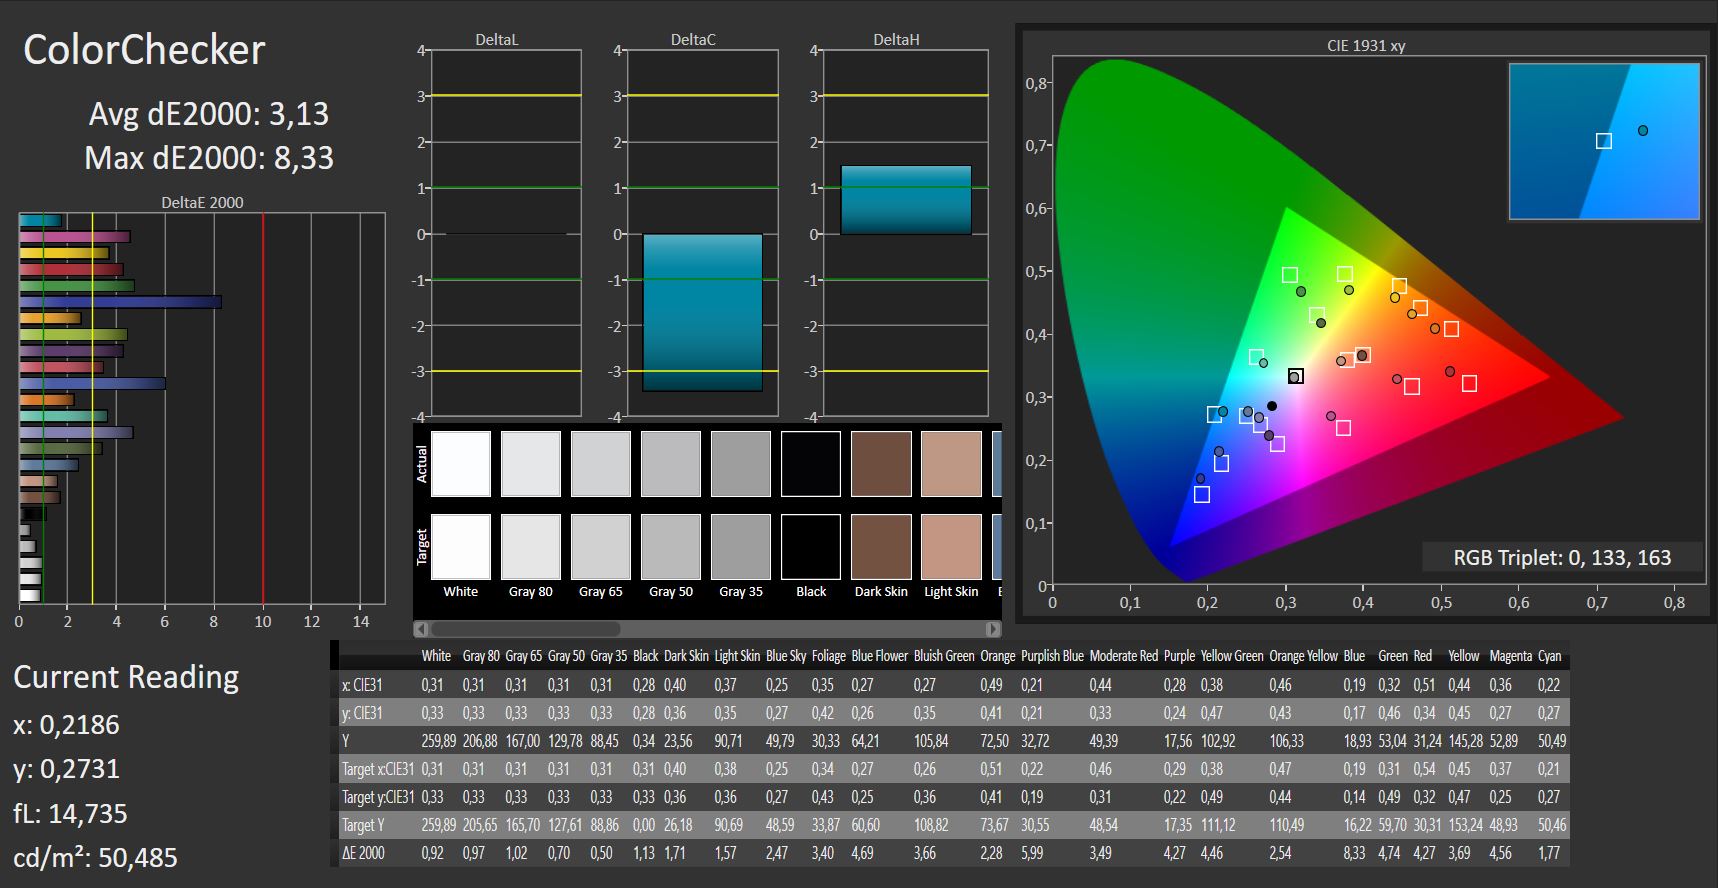
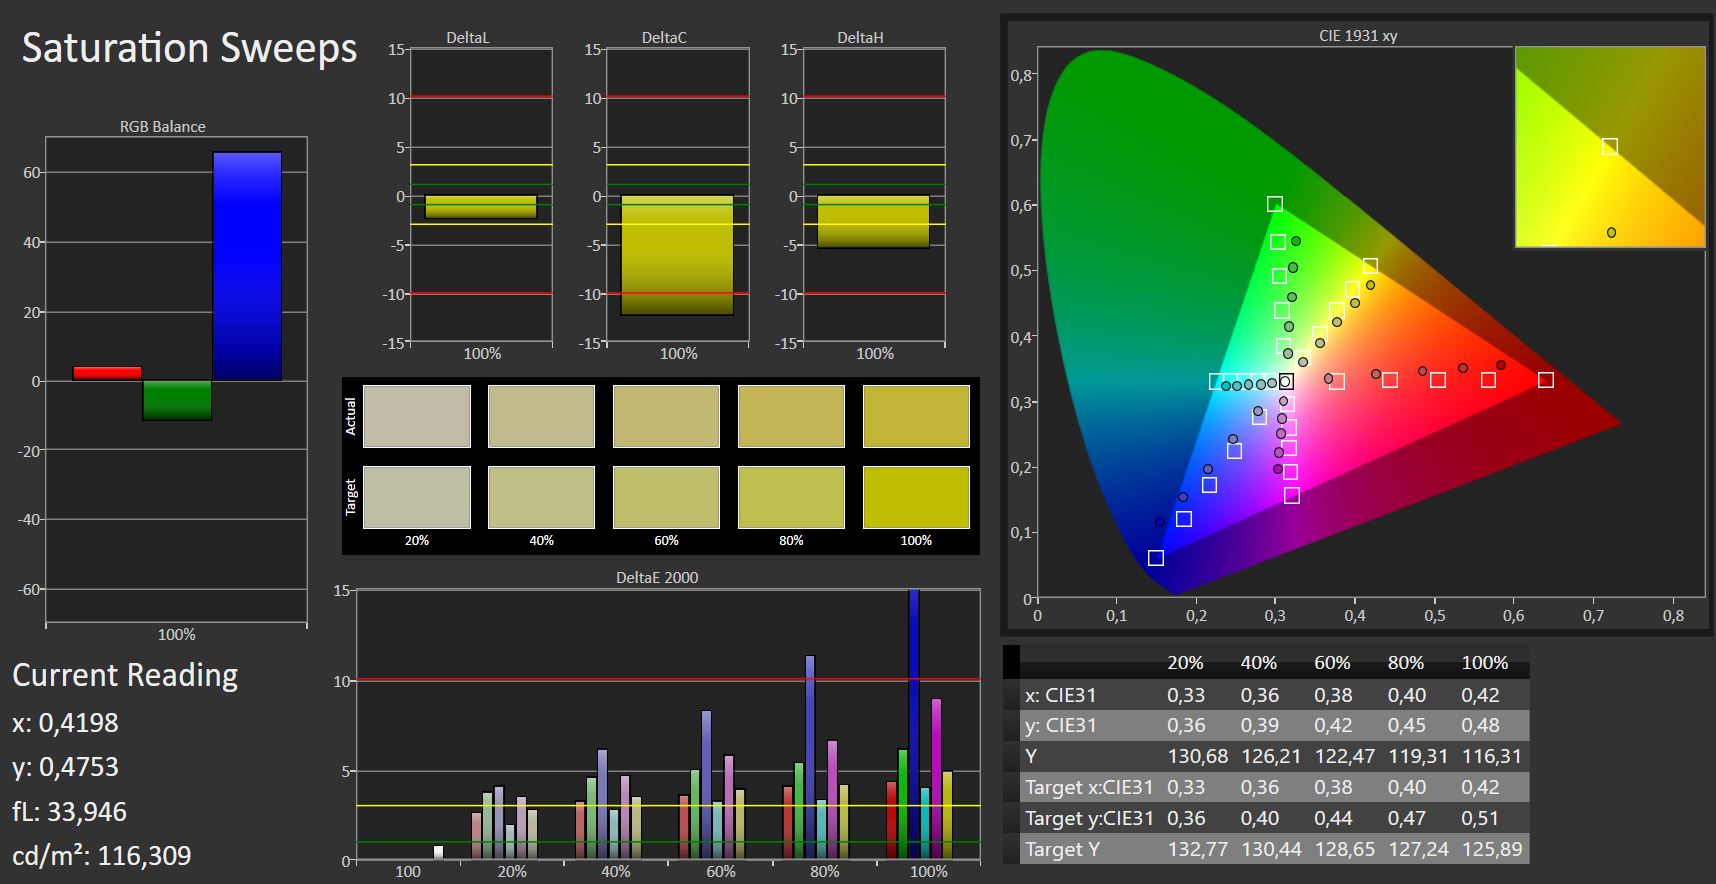
ΔE ColorChecker Calman: 3.93 | ∀{0.5-29.43 Ø4.71}
calibrated: 3.13
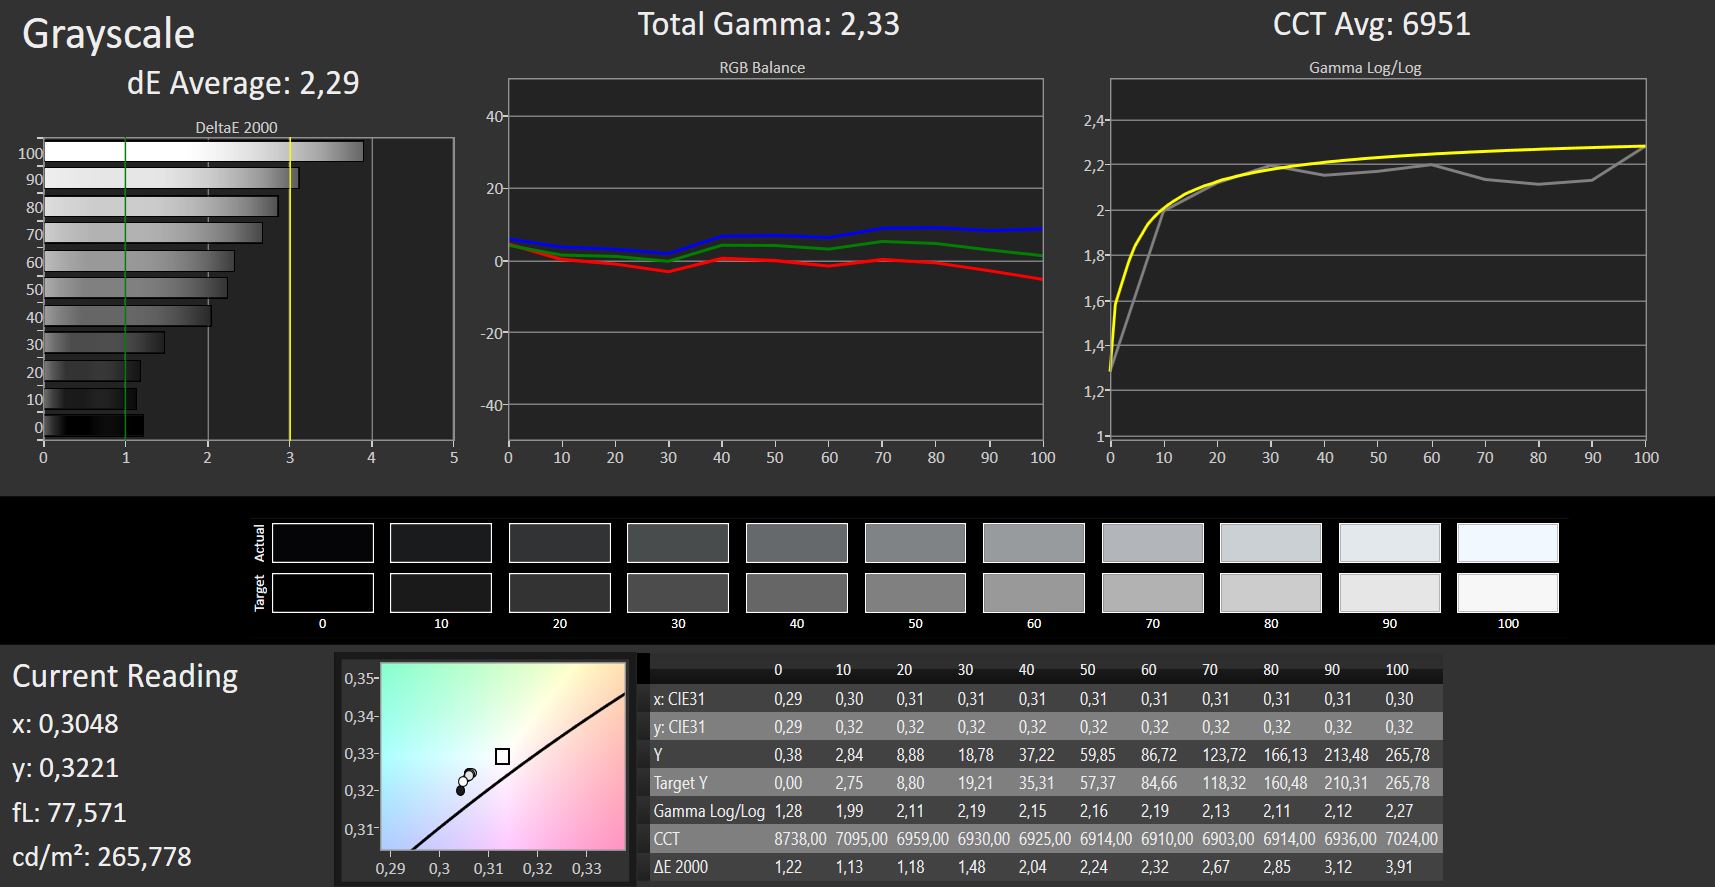
ΔE Greyscale Calman: 2.29 | ∀{0.09-98 Ø4.96}
60% sRGB (Argyll 1.6.3 3D)
38% AdobeRGB 1998 (Argyll 1.6.3 3D)
41.65% AdobeRGB 1998 (Argyll 3D)
60.4% sRGB (Argyll 3D)
40.28% Display P3 (Argyll 3D)
Gamma: 2.33
CCT: 6951 K
| Acer TravelMate 2410-G2-MG-82E6 CMN N140HCA-EAB, , 1920x1080, 14" | Acer TravelMate P2510-M-51ZQ Chi Mei CMN15D3 / N156HCE-EAA, , 1920x1080, 15.6" | Lenovo IdeaPad 530s-14IKB AUO B140QAN02.3, , 2560x1440, 14" | Asus VivoBook 15 F510UF-ES71 LG Philips LP156WF9-SPK2, , 1920x1080, 15.6" | Lenovo ThinkPad T480-20L6S01V00 Lenovo LP140WF6-SPB7, , 1920x1080, 14" | HP Spectre x360 15-ch011nr BOE0730, , 3840x2160, 15.6" | |
|---|---|---|---|---|---|---|
| Display | 5% | 60% | -2% | -3% | 60% | |
| Display P3 Coverage (%) | 40.28 | 42.44 5% | 65.5 63% | 39.35 -2% | 39.24 -3% | 68.5 70% |
| sRGB Coverage (%) | 60.4 | 63.2 5% | 96.2 59% | 59.2 -2% | 58.8 -3% | 90.7 50% |
| AdobeRGB 1998 Coverage (%) | 41.65 | 43.94 5% | 66.1 59% | 40.65 -2% | 40.56 -3% | 66.3 59% |
| Response Times | -33% | -51% | 9% | -4% | -14% | |
| Response Time Grey 50% / Grey 80% * (ms) | 34 ? | 45 ? -32% | 58.4 ? -72% | 27.2 ? 20% | 35.6 ? -5% | 38 ? -12% |
| Response Time Black / White * (ms) | 24 ? | 32 ? -33% | 31.2 ? -30% | 24.8 ? -3% | 24.8 ? -3% | 27.6 ? -15% |
| PWM Frequency (Hz) | 25000 ? | 25000 ? | 943 ? | |||
| Screen | -17% | 1% | -18% | -14% | -8% | |
| Brightness middle (cd/m²) | 265 | 215 -19% | 311 17% | 257 -3% | 307 16% | 329.3 24% |
| Brightness (cd/m²) | 239 | 198 -17% | 293 23% | 246 3% | 295 23% | 316 32% |
| Brightness Distribution (%) | 85 | 78 -8% | 85 0% | 89 5% | 90 6% | 84 -1% |
| Black Level * (cd/m²) | 0.37 | 0.32 14% | 0.2 46% | 0.34 8% | 0.25 32% | 0.31 16% |
| Contrast (:1) | 716 | 672 -6% | 1555 117% | 756 6% | 1228 72% | 1062 48% |
| Colorchecker dE 2000 * | 3.93 | 5.15 -31% | 6 -53% | 4.54 -16% | 5.7 -45% | 4.78 -22% |
| Colorchecker dE 2000 max. * | 8.79 | 10.89 -24% | 11.6 -32% | 16 -82% | 21.3 -142% | 11.75 -34% |
| Colorchecker dE 2000 calibrated * | 3.13 | 1.6 49% | 3.61 -15% | 4.7 -50% | 3.51 -12% | |
| Greyscale dE 2000 * | 2.29 | 4.25 -86% | 8.7 -280% | 4.6 -101% | 3.7 -62% | 7.9 -245% |
| Gamma | 2.33 94% | 2.61 84% | 2.19 100% | 2.44 90% | 2.11 104% | 2.24 98% |
| CCT | 6951 94% | 6603 98% | 8426 77% | 7096 92% | 7353 88% | 8323 78% |
| Color Space (Percent of AdobeRGB 1998) (%) | 38 | 40 5% | 60.9 60% | 37.5 -1% | 37.4 -2% | 58.8 55% |
| Color Space (Percent of sRGB) (%) | 60 | 63 5% | 96 60% | 59.2 -1% | 58.7 -2% | 90.4 51% |
| Totalt genomsnitt (program/inställningar) | -15% /
-14% | 3% /
5% | -4% /
-12% | -7% /
-11% | 13% /
4% |
* ... mindre är bättre
Visa svarstider
| ↔ Svarstid svart till vitt | ||
|---|---|---|
| 24 ms ... stiga ↗ och falla ↘ kombinerat | ↗ 13 ms stiga | 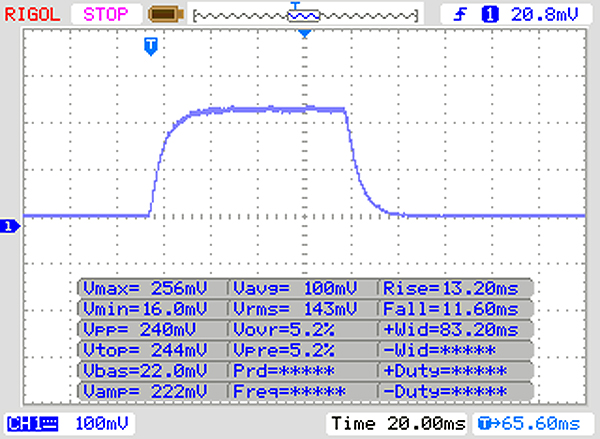 |
| ↘ 11 ms hösten | ||
| Skärmen visar bra svarsfrekvens i våra tester, men kan vara för långsam för konkurrenskraftiga spelare. I jämförelse sträcker sig alla testade enheter från 0.1 (minst) till 240 (maximalt) ms. » 54 % av alla enheter är bättre. Detta innebär att den uppmätta svarstiden är sämre än genomsnittet av alla testade enheter (19.8 ms). | ||
| ↔ Svarstid 50 % grått till 80 % grått | ||
| 34 ms ... stiga ↗ och falla ↘ kombinerat | ↗ 16 ms stiga | 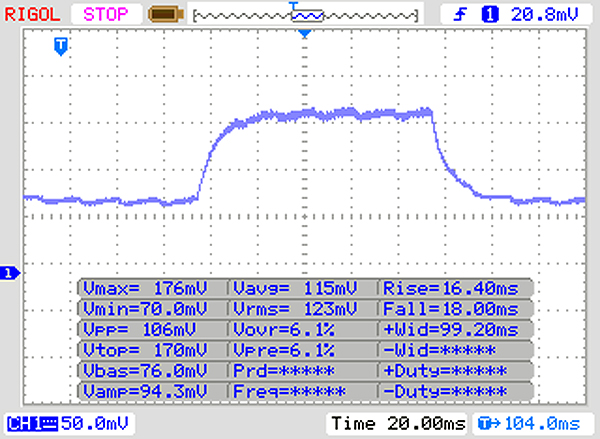 |
| ↘ 18 ms hösten | ||
| Skärmen visar långsamma svarsfrekvenser i våra tester och kommer att vara otillfredsställande för spelare. I jämförelse sträcker sig alla testade enheter från 0.165 (minst) till 636 (maximalt) ms. » 47 % av alla enheter är bättre. Detta innebär att den uppmätta svarstiden är sämre än genomsnittet av alla testade enheter (30.9 ms). | ||
Skärmflimmer / PWM (Puls-Width Modulation)
| Skärmflimmer / PWM upptäckt | 25000 Hz | ≤ 10 % ljusstyrka inställning | 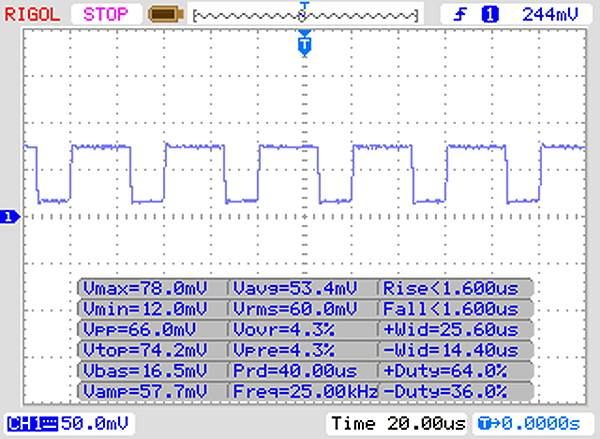 |
Displayens bakgrundsbelysning flimrar vid 25000 Hz (i värsta fall, t.ex. med PWM) Flimrande upptäckt vid en ljusstyrkeinställning på 10 % och lägre. Det ska inte finnas något flimmer eller PWM över denna ljusstyrkeinställning. Frekvensen för 25000 Hz är ganska hög, så de flesta användare som är känsliga för PWM bör inte märka något flimmer. Som jämförelse: 52 % av alla testade enheter använder inte PWM för att dämpa skärmen. Om PWM upptäcktes mättes ett medelvärde av 7744 (minst: 5 - maximum: 343500) Hz. | |||
| PCMark 8 Home Score Accelerated v2 | 3663 poäng | |
| PCMark 8 Work Score Accelerated v2 | 4811 poäng | |
Hjälp | ||
| Acer TravelMate 2410-G2-MG-82E6 SK Hynix HFS256G39TND-N210A | Acer TravelMate P2510-M-51ZQ SK Hynix HFS256G39TND-N210A | Lenovo IdeaPad 530s-14IKB SK Hynix PC401 512GB M.2 (HFS512GD9TNG) | Lenovo ThinkPad T480-20L6S01V00 Samsung SSD PM981 MZVLB512HAJQ | Genomsnitt SK Hynix HFS256G39TND-N210A | |
|---|---|---|---|---|---|
| CrystalDiskMark 3.0 | 3% | 88% | 89% | -6% | |
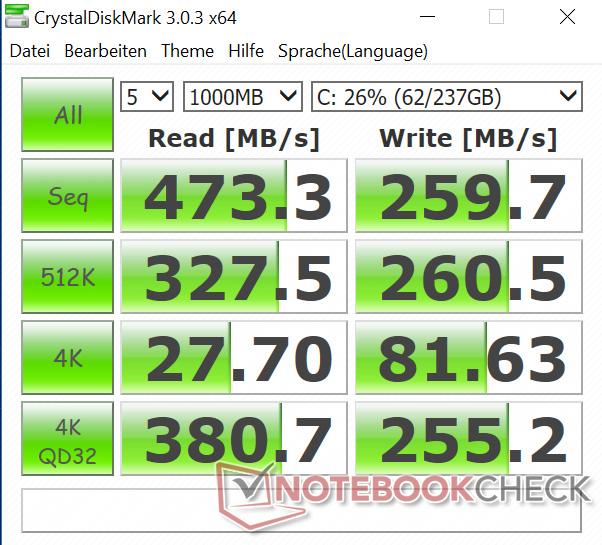
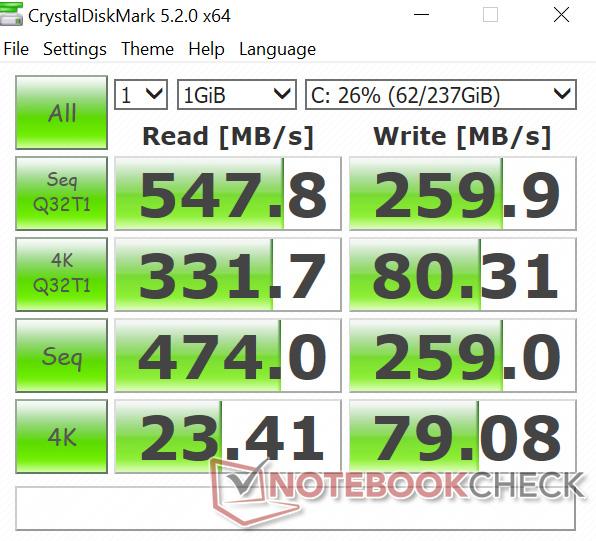
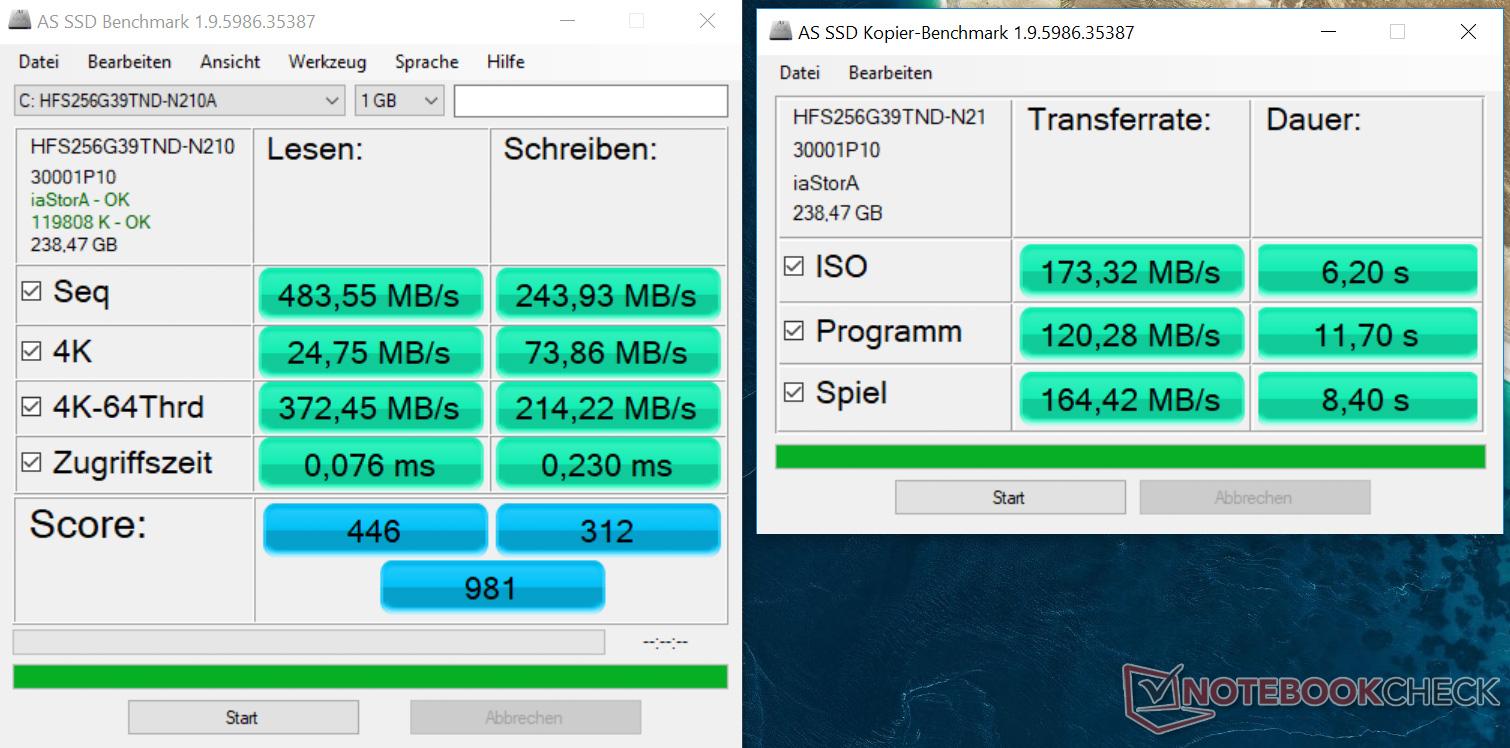
| Read Seq (MB/s) | 473.3 | 498.1 5% | 1360 187% | 922 95% | 482 ? 2% |
| Write Seq (MB/s) | 259.7 | 260.1 0% | 733 182% | 928 257% | 246 ? -5% |
| Read 512 (MB/s) | 327.5 | 328.5 0% | 769 135% | 561 71% | 328 ? 0% |
| Write 512 (MB/s) | 260.5 | 260.9 0% | 642 146% | 567 118% | 243 ? -7% |
| Read 4k (MB/s) | 27.7 | 32.59 18% | 39.83 44% | 64.4 132% | 28 ? 1% |
| Write 4k (MB/s) | 81.6 | 84.2 3% | 100 23% | 108 32% | 74.8 ? -8% |
| Read 4k QD32 (MB/s) | 380.7 | 359.7 -6% | 330.3 -13% | 383.4 1% | 323 ? -15% |
| Write 4k QD32 (MB/s) | 255.2 | 262 3% | 260.2 2% | 271.4 6% | 220 ? -14% |

| 3DMark 06 Standard Score | 17997 poäng | |
| 3DMark 11 Performance | 3096 poäng | |
| 3DMark Cloud Gate Standard Score | 11141 poäng | |
| 3DMark Fire Strike Score | 2203 poäng | |
Hjälp | ||
| Far Cry 5 | |
| 1280x720 Low Preset AA:T | |
| Genomsnitt av klass Office (38 - 99, n=13, senaste 2 åren) | |
| Asus Zenbook UX3430UN-GV174T | |
| Lenovo IdeaPad 530s-14IKB | |
| Acer TravelMate 2410-G2-MG-82E6 | |
| Genomsnitt NVIDIA GeForce MX130 (21 - 32, n=2) | |
| Asus VivoBook 15 X542UF-DM143T | |
| HP 14-ma0312ng | |
| 1920x1080 Medium Preset AA:T | |
| Genomsnitt av klass Office (21 - 59, n=13, senaste 2 åren) | |
| Lenovo IdeaPad 530s-14IKB | |
| Asus Zenbook UX3430UN-GV174T | |
| Asus VivoBook 15 X542UF-DM143T | |
| Acer TravelMate 2410-G2-MG-82E6 | |
| Genomsnitt NVIDIA GeForce MX130 (14 - 14, n=2) | |
| 1920x1080 High Preset AA:T | |
| Genomsnitt av klass Office (19 - 54, n=13, senaste 2 åren) | |
| Lenovo IdeaPad 530s-14IKB | |
| Asus VivoBook 15 X542UF-DM143T | |
| Acer TravelMate 2410-G2-MG-82E6 | |
| Genomsnitt NVIDIA GeForce MX130 (13 - 13, n=2) | |
| 1920x1080 Ultra Preset AA:T | |
| Genomsnitt av klass Office (18 - 52, n=13, senaste 2 åren) | |
| Lenovo IdeaPad 530s-14IKB | |
| Asus VivoBook 15 X542UF-DM143T | |
| Acer TravelMate 2410-G2-MG-82E6 | |
| Genomsnitt NVIDIA GeForce MX130 (12 - 12, n=2) | |
| Final Fantasy XV Benchmark | |
| 1280x720 Lite Quality | |
| Genomsnitt av klass Office (16.5 - 171.2, n=73, senaste 2 åren) | |
| Acer TravelMate 2410-G2-MG-82E6 | |
| Genomsnitt NVIDIA GeForce MX130 (22.5 - 25.8, n=4) | |
| Acer Aspire 5 A515-51G-509A | |
| HP Spectre 13-af033ng | |
| Lenovo V110-15IKB 80TH001WGE | |
| Dell Latitude 7390 | |
| 1920x1080 Standard Quality | |
| Genomsnitt av klass Office (7.86 - 105.7, n=73, senaste 2 åren) | |
| Acer TravelMate 2410-G2-MG-82E6 | |
| Genomsnitt NVIDIA GeForce MX130 (12.1 - 12.6, n=3) | |
| HP Spectre x360 13-ae048ng | |
| HP Spectre 13-af033ng | |
| 1920x1080 High Quality | |
| Genomsnitt av klass Office (8.09 - 79.5, n=71, senaste 2 åren) | |
| Genomsnitt NVIDIA GeForce MX130 (6.7 - 7.74, n=3) | |
| Acer TravelMate 2410-G2-MG-82E6 | |
| HP Spectre x360 13-ae048ng | |
| låg | med. | hög | ultra | |
|---|---|---|---|---|
| Rise of the Tomb Raider (2016) | 48.1 | 28.6 | 15.6 | |
| Final Fantasy XV Benchmark (2018) | 25.8 | 12.6 | 7 | |
| Far Cry 5 (2018) | 32 | 14 | 13 | 12 |
Ljudnivå
| Låg belastning |
| 30.8 / 30.8 / 30.8 dB(A) |
| Hårddisk |
| 31.7 dB(A) |
| Hög belastning |
| 42.7 / 39.7 dB(A) |
 | ||
30 dB tyst 40 dB(A) hörbar 50 dB(A) högt ljud |
||
min: | ||
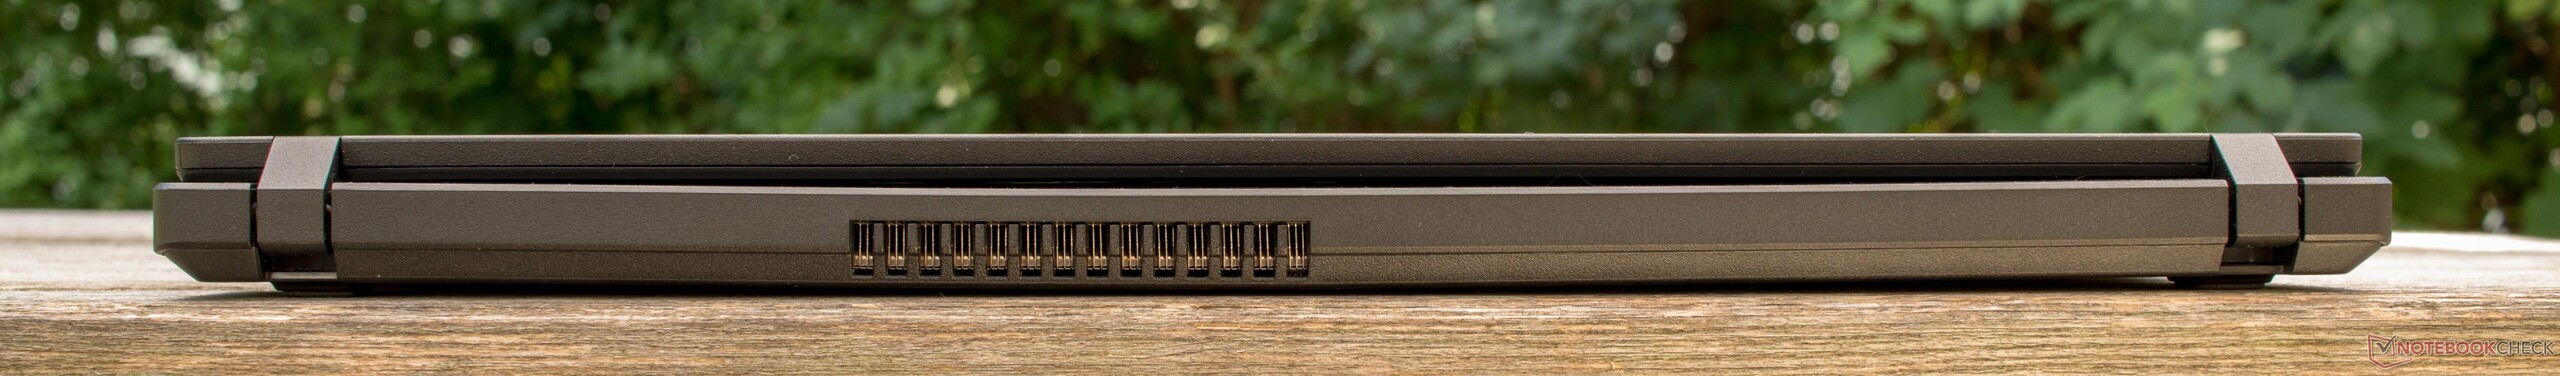
(-) Den maximala temperaturen på ovansidan är 47.3 °C / 117 F, jämfört med genomsnittet av 34.3 °C / 94 F , allt från 21.2 till 62.5 °C för klassen Office.
(-) Botten värms upp till maximalt 47.8 °C / 118 F, jämfört med genomsnittet av 36.8 °C / 98 F
(+) Vid tomgångsbruk är medeltemperaturen för ovansidan 25.7 °C / 78 F, jämfört med enhetsgenomsnittet på 29.5 °C / ### class_avg_f### F.
(+) Handledsstöden och pekplattan är kallare än hudtemperaturen med maximalt 27.4 °C / 81.3 F och är därför svala att ta på.
(±) Medeltemperaturen för handledsstödsområdet på liknande enheter var 27.6 °C / 81.7 F (+0.2 °C / 0.4 F).
Acer TravelMate 2410-G2-MG-82E6 ljudanalys
(-) | inte särskilt höga högtalare (70 dB)
Bas 100 - 315 Hz
(-) | nästan ingen bas - i genomsnitt 29.2% lägre än medianen
(±) | linjäriteten för basen är genomsnittlig (9.3% delta till föregående frekvens)
Mellan 400 - 2000 Hz
(±) | reducerade mids - i genomsnitt 5.3% lägre än median
(+) | mids är linjära (5.9% delta till föregående frekvens)
Högsta 2 - 16 kHz
(+) | balanserade toppar - endast 3.2% från medianen
(+) | toppar är linjära (3.4% delta till föregående frekvens)
Totalt 100 - 16 000 Hz
(±) | linjäriteten för det totala ljudet är genomsnittlig (24.4% skillnad mot median)
Jämfört med samma klass
» 71% av alla testade enheter i den här klassen var bättre, 7% liknande, 21% sämre
» Den bästa hade ett delta på 7%, genomsnittet var 21%, sämst var 53%
Jämfört med alla testade enheter
» 74% av alla testade enheter var bättre, 6% liknande, 20% sämre
» Den bästa hade ett delta på 4%, genomsnittet var 23%, sämst var 134%
Asus VivoBook 15 F510UF-ES71 ljudanalys
(-) | inte särskilt höga högtalare (69.4 dB)
Bas 100 - 315 Hz
(±) | reducerad bas - i genomsnitt 13.2% lägre än medianen
(±) | linjäriteten för basen är genomsnittlig (11.5% delta till föregående frekvens)
Mellan 400 - 2000 Hz
(+) | balanserad mellan - endast 2.7% från medianen
(±) | linjäriteten för mids är genomsnittlig (7% delta till föregående frekvens)
Högsta 2 - 16 kHz
(+) | balanserade toppar - endast 4.5% från medianen
(+) | toppar är linjära (6% delta till föregående frekvens)
Totalt 100 - 16 000 Hz
(±) | linjäriteten för det totala ljudet är genomsnittlig (22% skillnad mot median)
Jämfört med samma klass
» 78% av alla testade enheter i den här klassen var bättre, 4% liknande, 17% sämre
» Den bästa hade ett delta på 5%, genomsnittet var 17%, sämst var 45%
Jämfört med alla testade enheter
» 64% av alla testade enheter var bättre, 6% liknande, 30% sämre
» Den bästa hade ett delta på 4%, genomsnittet var 23%, sämst var 134%
Lenovo IdeaPad 530s-14IKB ljudanalys
(±) | högtalarljudstyrkan är genomsnittlig men bra (78.1 dB)
Bas 100 - 315 Hz
(-) | nästan ingen bas - i genomsnitt 17.2% lägre än medianen
(±) | linjäriteten för basen är genomsnittlig (14.5% delta till föregående frekvens)
Mellan 400 - 2000 Hz
(+) | balanserad mellan - endast 2.4% från medianen
(+) | mids är linjära (6.4% delta till föregående frekvens)
Högsta 2 - 16 kHz
(+) | balanserade toppar - endast 3.6% från medianen
(±) | linjäriteten för toppar är genomsnittlig (8.3% delta till föregående frekvens)
Totalt 100 - 16 000 Hz
(±) | linjäriteten för det totala ljudet är genomsnittlig (16.8% skillnad mot median)
Jämfört med samma klass
» 43% av alla testade enheter i den här klassen var bättre, 8% liknande, 49% sämre
» Den bästa hade ett delta på 5%, genomsnittet var 18%, sämst var 53%
Jämfört med alla testade enheter
» 30% av alla testade enheter var bättre, 7% liknande, 63% sämre
» Den bästa hade ett delta på 4%, genomsnittet var 23%, sämst var 134%
| Av/Standby | |
| Låg belastning | |
| Hög belastning |
|
Förklaring:
min: | |
| Acer TravelMate 2410-G2-MG-82E6 i5-8550U, GeForce MX130, SK Hynix HFS256G39TND-N210A, IPS, 1920x1080, 14" | Acer TravelMate P2510-M-51ZQ i5-7200U, HD Graphics 620, SK Hynix HFS256G39TND-N210A, IPS, 1920x1080, 15.6" | Lenovo ThinkPad T480-20L6S01V00 i5-8550U, GeForce MX150, Samsung SSD PM981 MZVLB512HAJQ, IPS, 1920x1080, 14" | Lenovo IdeaPad 530s-14IKB i5-8550U, GeForce MX150, SK Hynix PC401 512GB M.2 (HFS512GD9TNG), IPS, 2560x1440, 14" | HP Spectre x360 15-ch011nr i5-8550U, GeForce MX150, SK hynix PC401 NVMe 500 GB, IPS, 3840x2160, 15.6" | Dell XPS 13 i7-8550U i5-8550U, UHD Graphics 620, Toshiba XG5 KXG50ZNV256G, IGZO IPS, 3200x1800, 13.3" | Genomsnitt NVIDIA GeForce MX130 | Genomsnitt av klass Office | |
|---|---|---|---|---|---|---|---|---|
| Power Consumption | 17% | -13% | 0% | -47% | 13% | -14% | -7% | |
| Idle Minimum * (Watt) | 3.5 | 3.4 3% | 3.6 -3% | 3.9 -11% | 5.3 -51% | 4.1 -17% | 4.54 ? -30% | 4.25 ? -21% |
| Idle Average * (Watt) | 5.9 | 5.8 2% | 7.1 -20% | 5.76 2% | 9.8 -66% | 5.8 2% | 6.98 ? -18% | 7.3 ? -24% |
| Idle Maximum * (Watt) | 8.2 | 8 2% | 9.5 -16% | 7.14 13% | 12.6 -54% | 6 27% | 9.08 ? -11% | 8.57 ? -5% |
| Load Average * (Watt) | 57.3 | 38 34% | 63.9 -12% | 50.8 11% | 73 -27% | 42.5 26% | 54.1 ? 6% | 43.8 ? 24% |
| Load Maximum * (Watt) | 57.9 | 32 45% | 67.3 -16% | 65.8 -14% | 80 -38% | 41.4 28% | 66.4 ? -15% | 64.5 ? -11% |
| Witcher 3 ultra * (Watt) | 53.9 | 67.6 |
* ... mindre är bättre
| Acer TravelMate 2410-G2-MG-82E6 i5-8550U, GeForce MX130, 48 Wh | Acer TravelMate P2510-M-51ZQ i5-7200U, HD Graphics 620, 48 Wh | Asus VivoBook 15 F510UF-ES71 i5-8550U, GeForce MX130, 42 Wh | Lenovo IdeaPad 530s-14IKB i5-8550U, GeForce MX150, 45 Wh | Lenovo ThinkPad T480-20L6S01V00 i5-8550U, GeForce MX150, 72 Wh | HP Spectre x360 15-ch011nr i5-8550U, GeForce MX150, 84 Wh | Dell XPS 13 i7-8550U i5-8550U, UHD Graphics 620, 60 Wh | Genomsnitt av klass Office | |
|---|---|---|---|---|---|---|---|---|
| Batteridrifttid | 10% | -47% | -9% | 46% | 31% | 29% | 49% | |
| H.264 (h) | 8.9 | 7.1 -20% | 10.6 19% | 15.4 ? 73% | ||||
| WiFi v1.3 (h) | 7.4 | 8.8 19% | 3.9 -47% | 8.7 18% | 13.2 78% | 10.4 41% | 9.8 32% | 13.2 ? 78% |
| Load (h) | 1.9 | 1.9 0% | 1.4 -26% | 2.7 42% | 2.3 21% | 2.4 26% | 1.808 ? -5% | |
| Reader / Idle (h) | 15.2 | 14.7 | 27.9 | 15.5 | 18.5 | 22.2 ? |
För
Emot
Läs den fullständiga versionen av den här recensionen på engelska här.
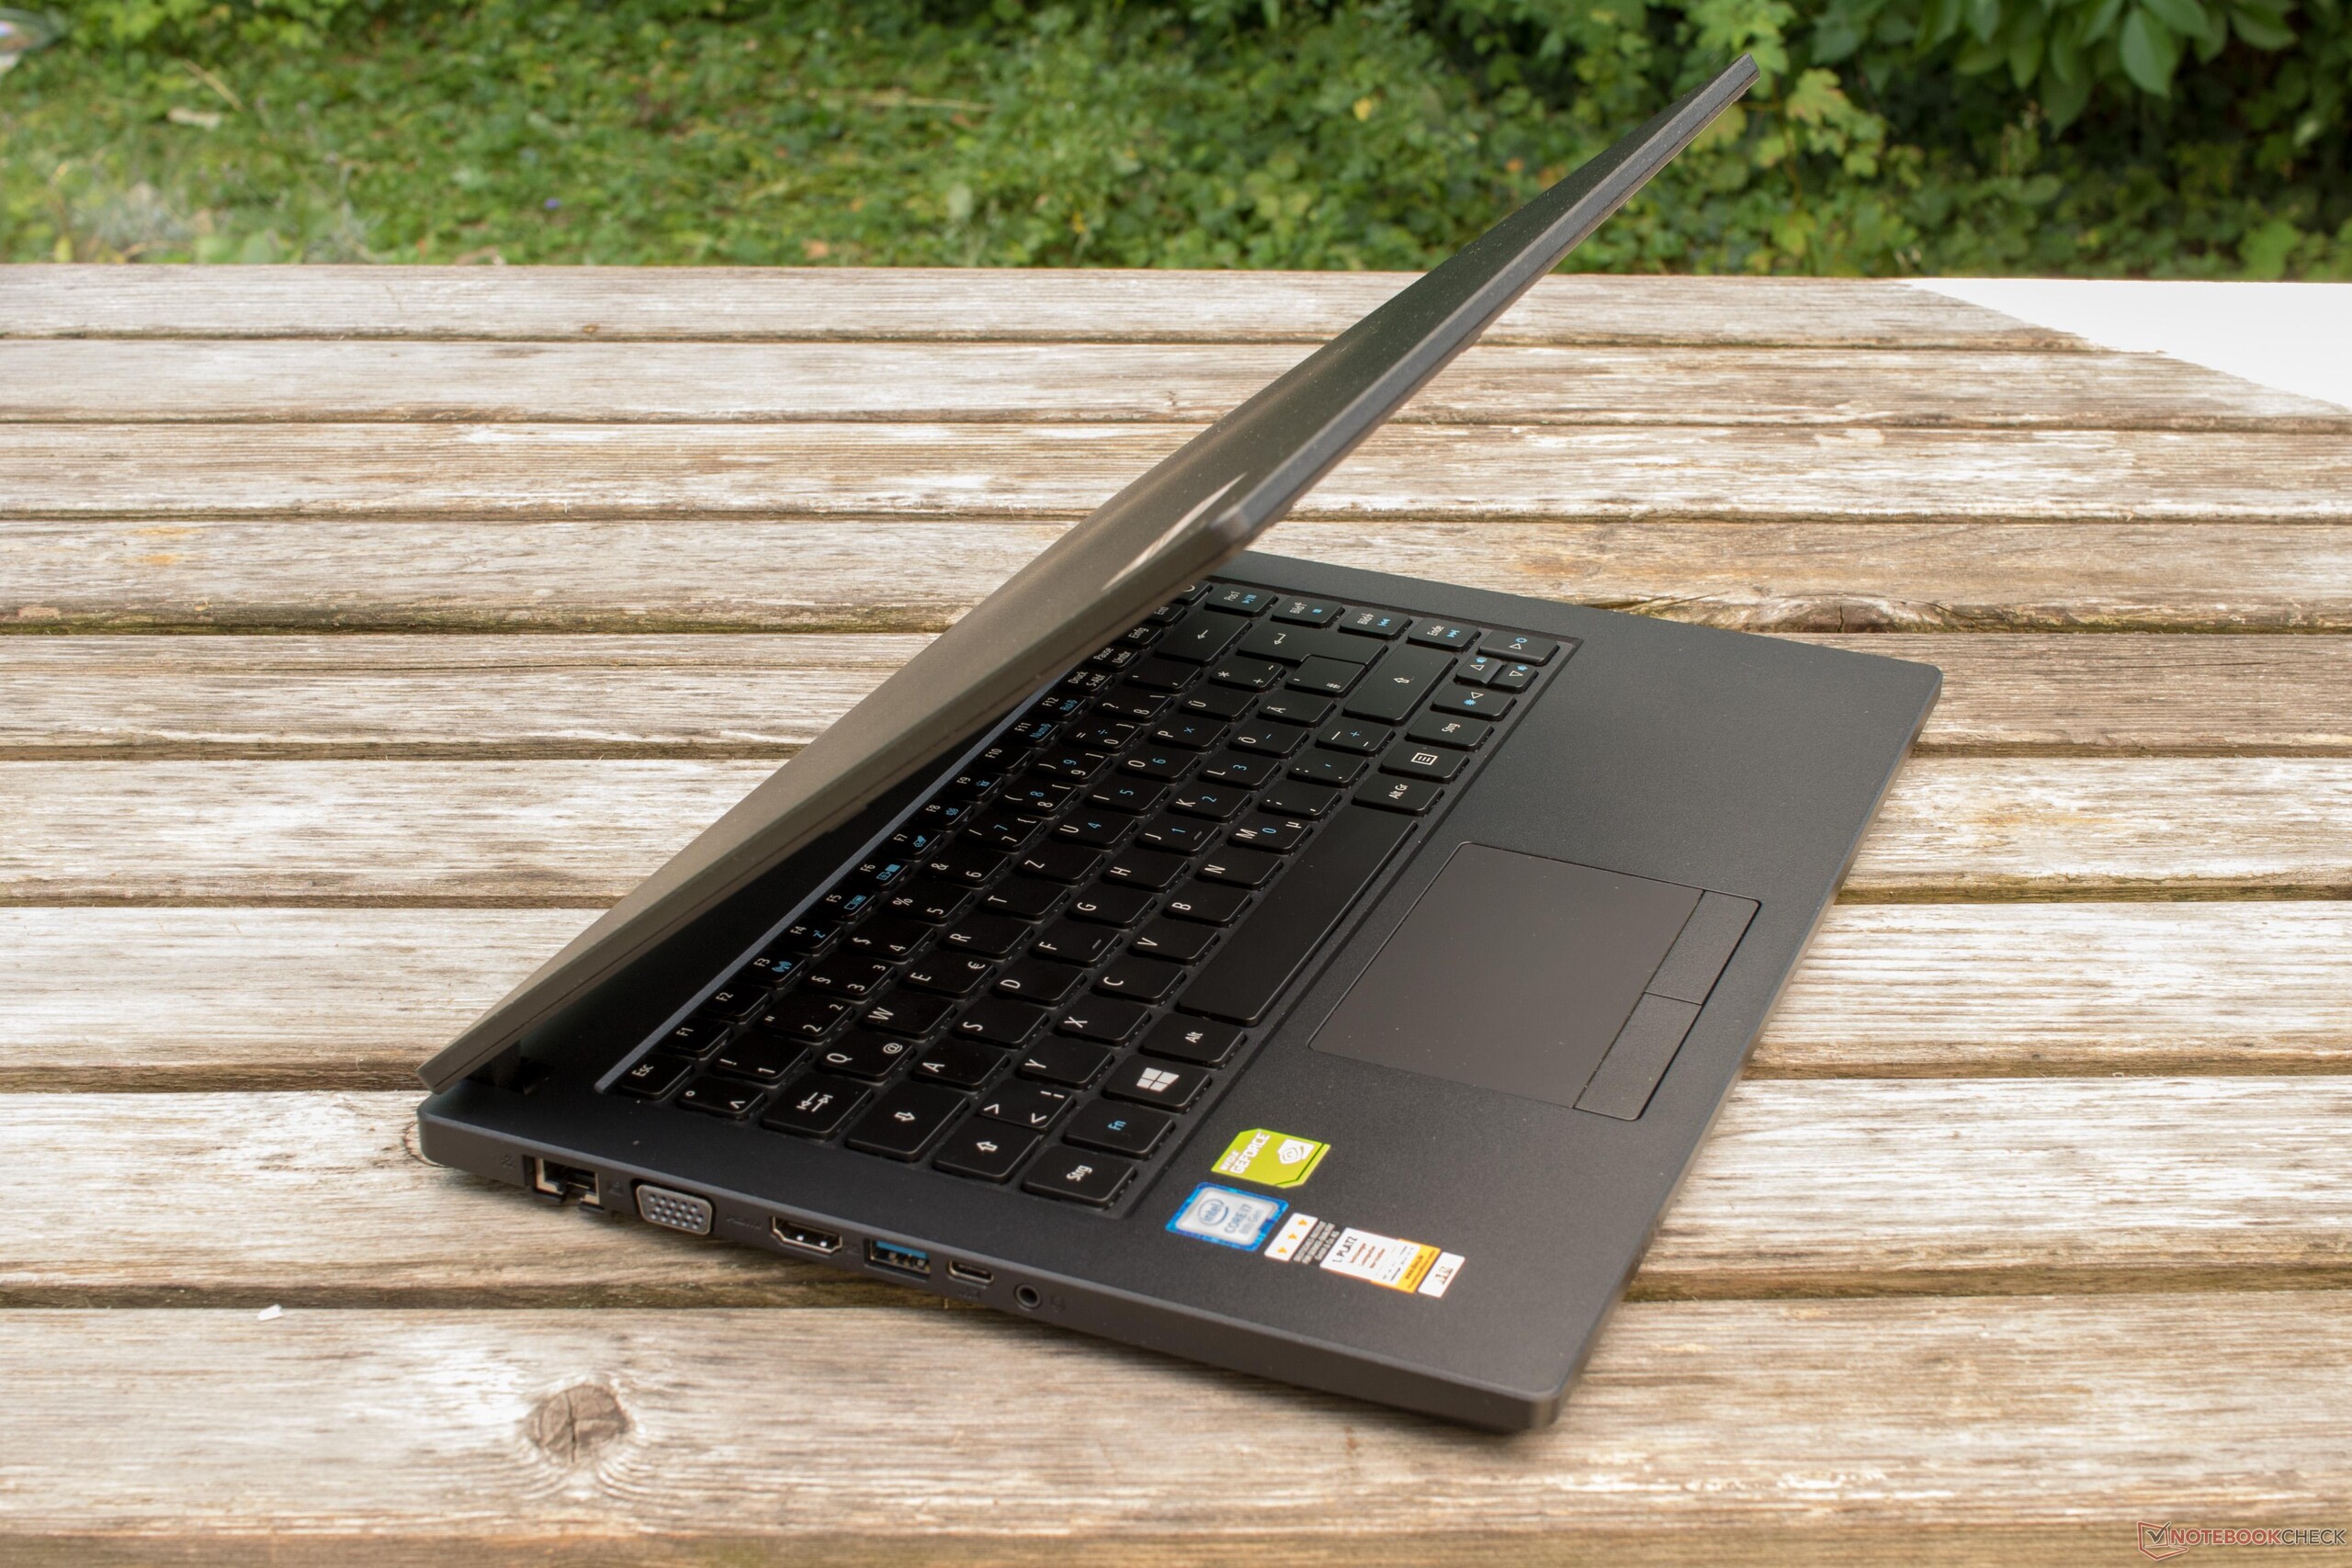
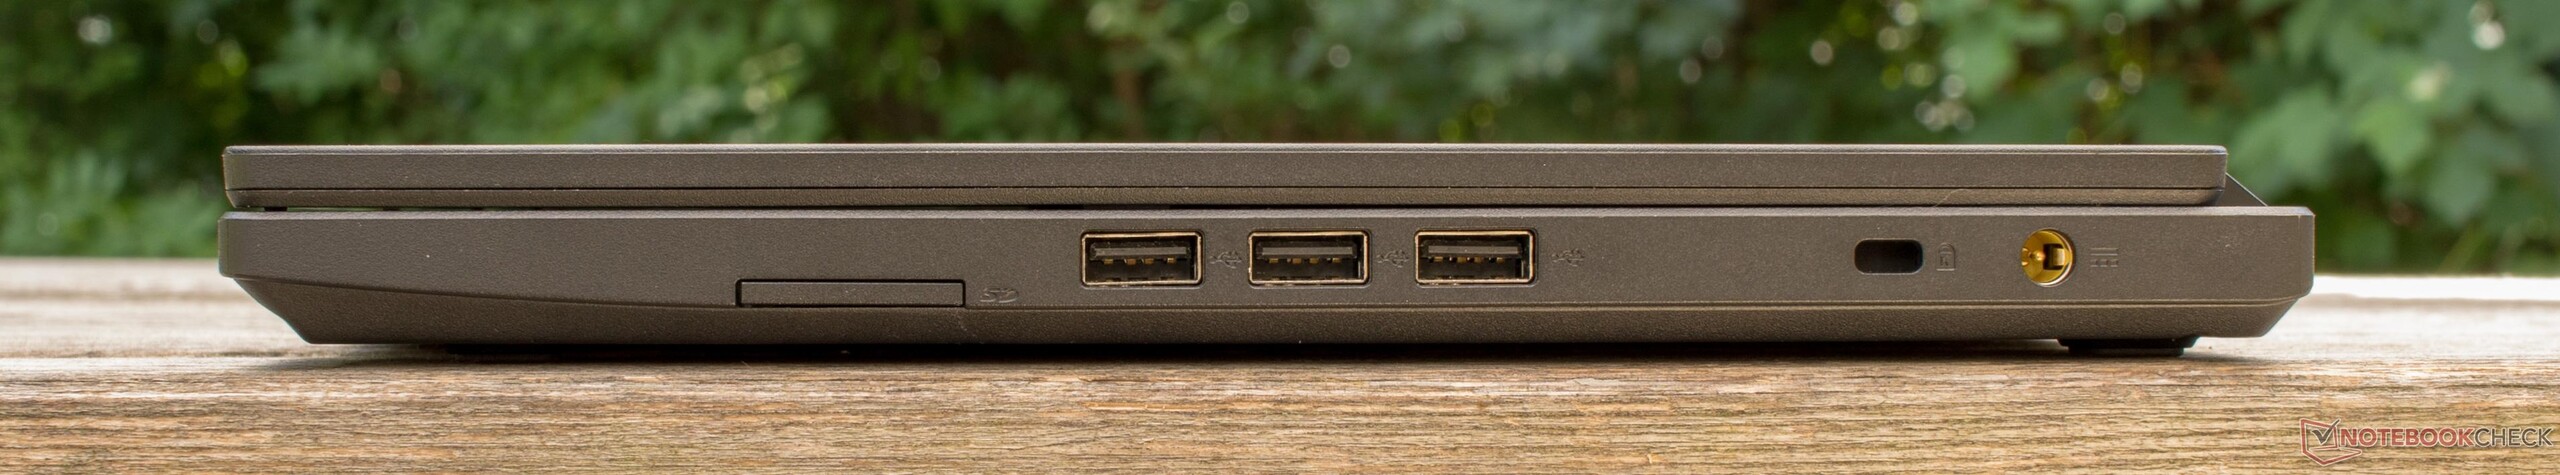
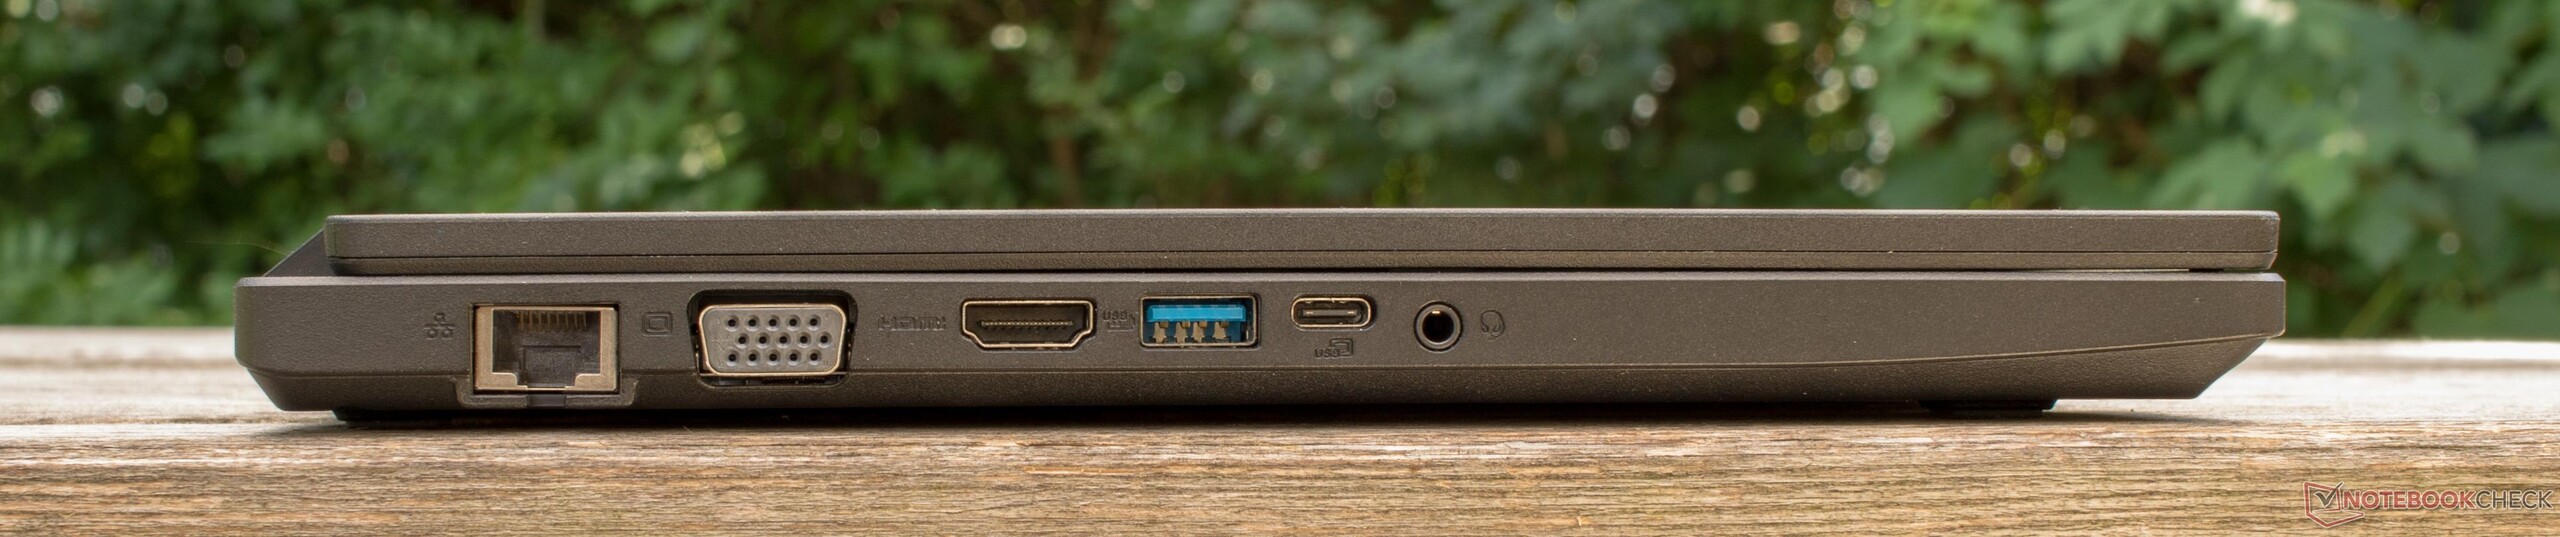
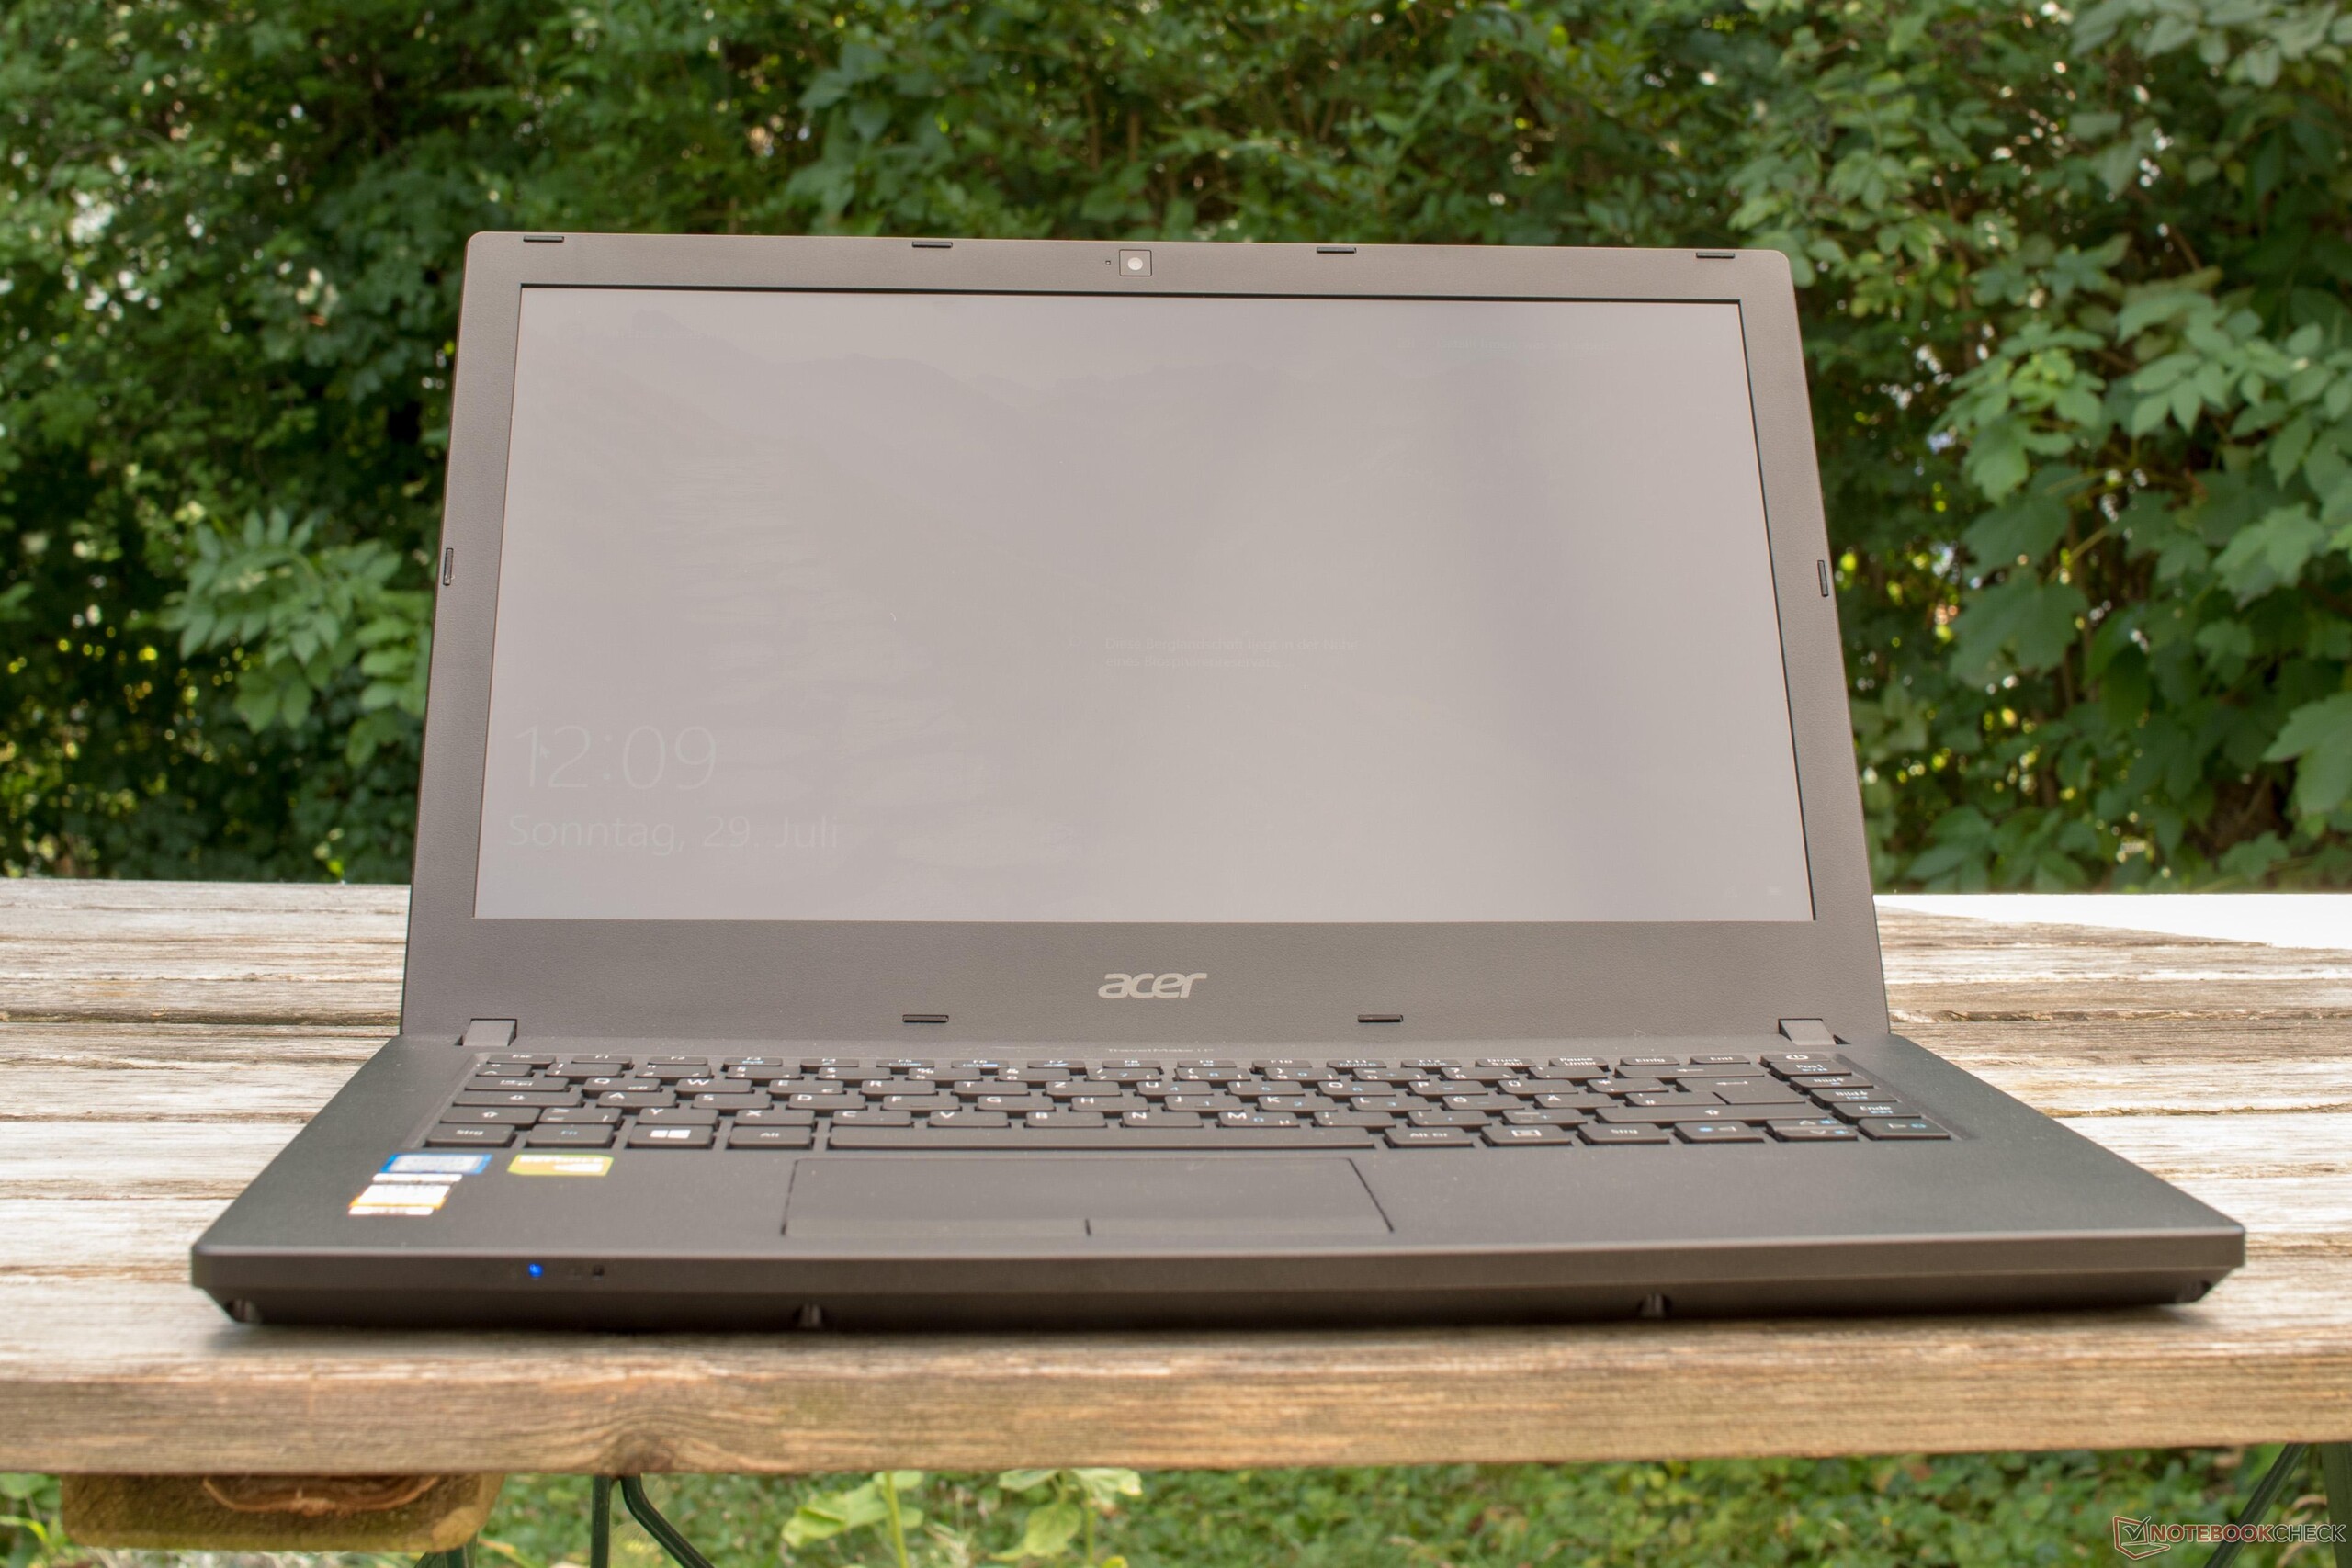
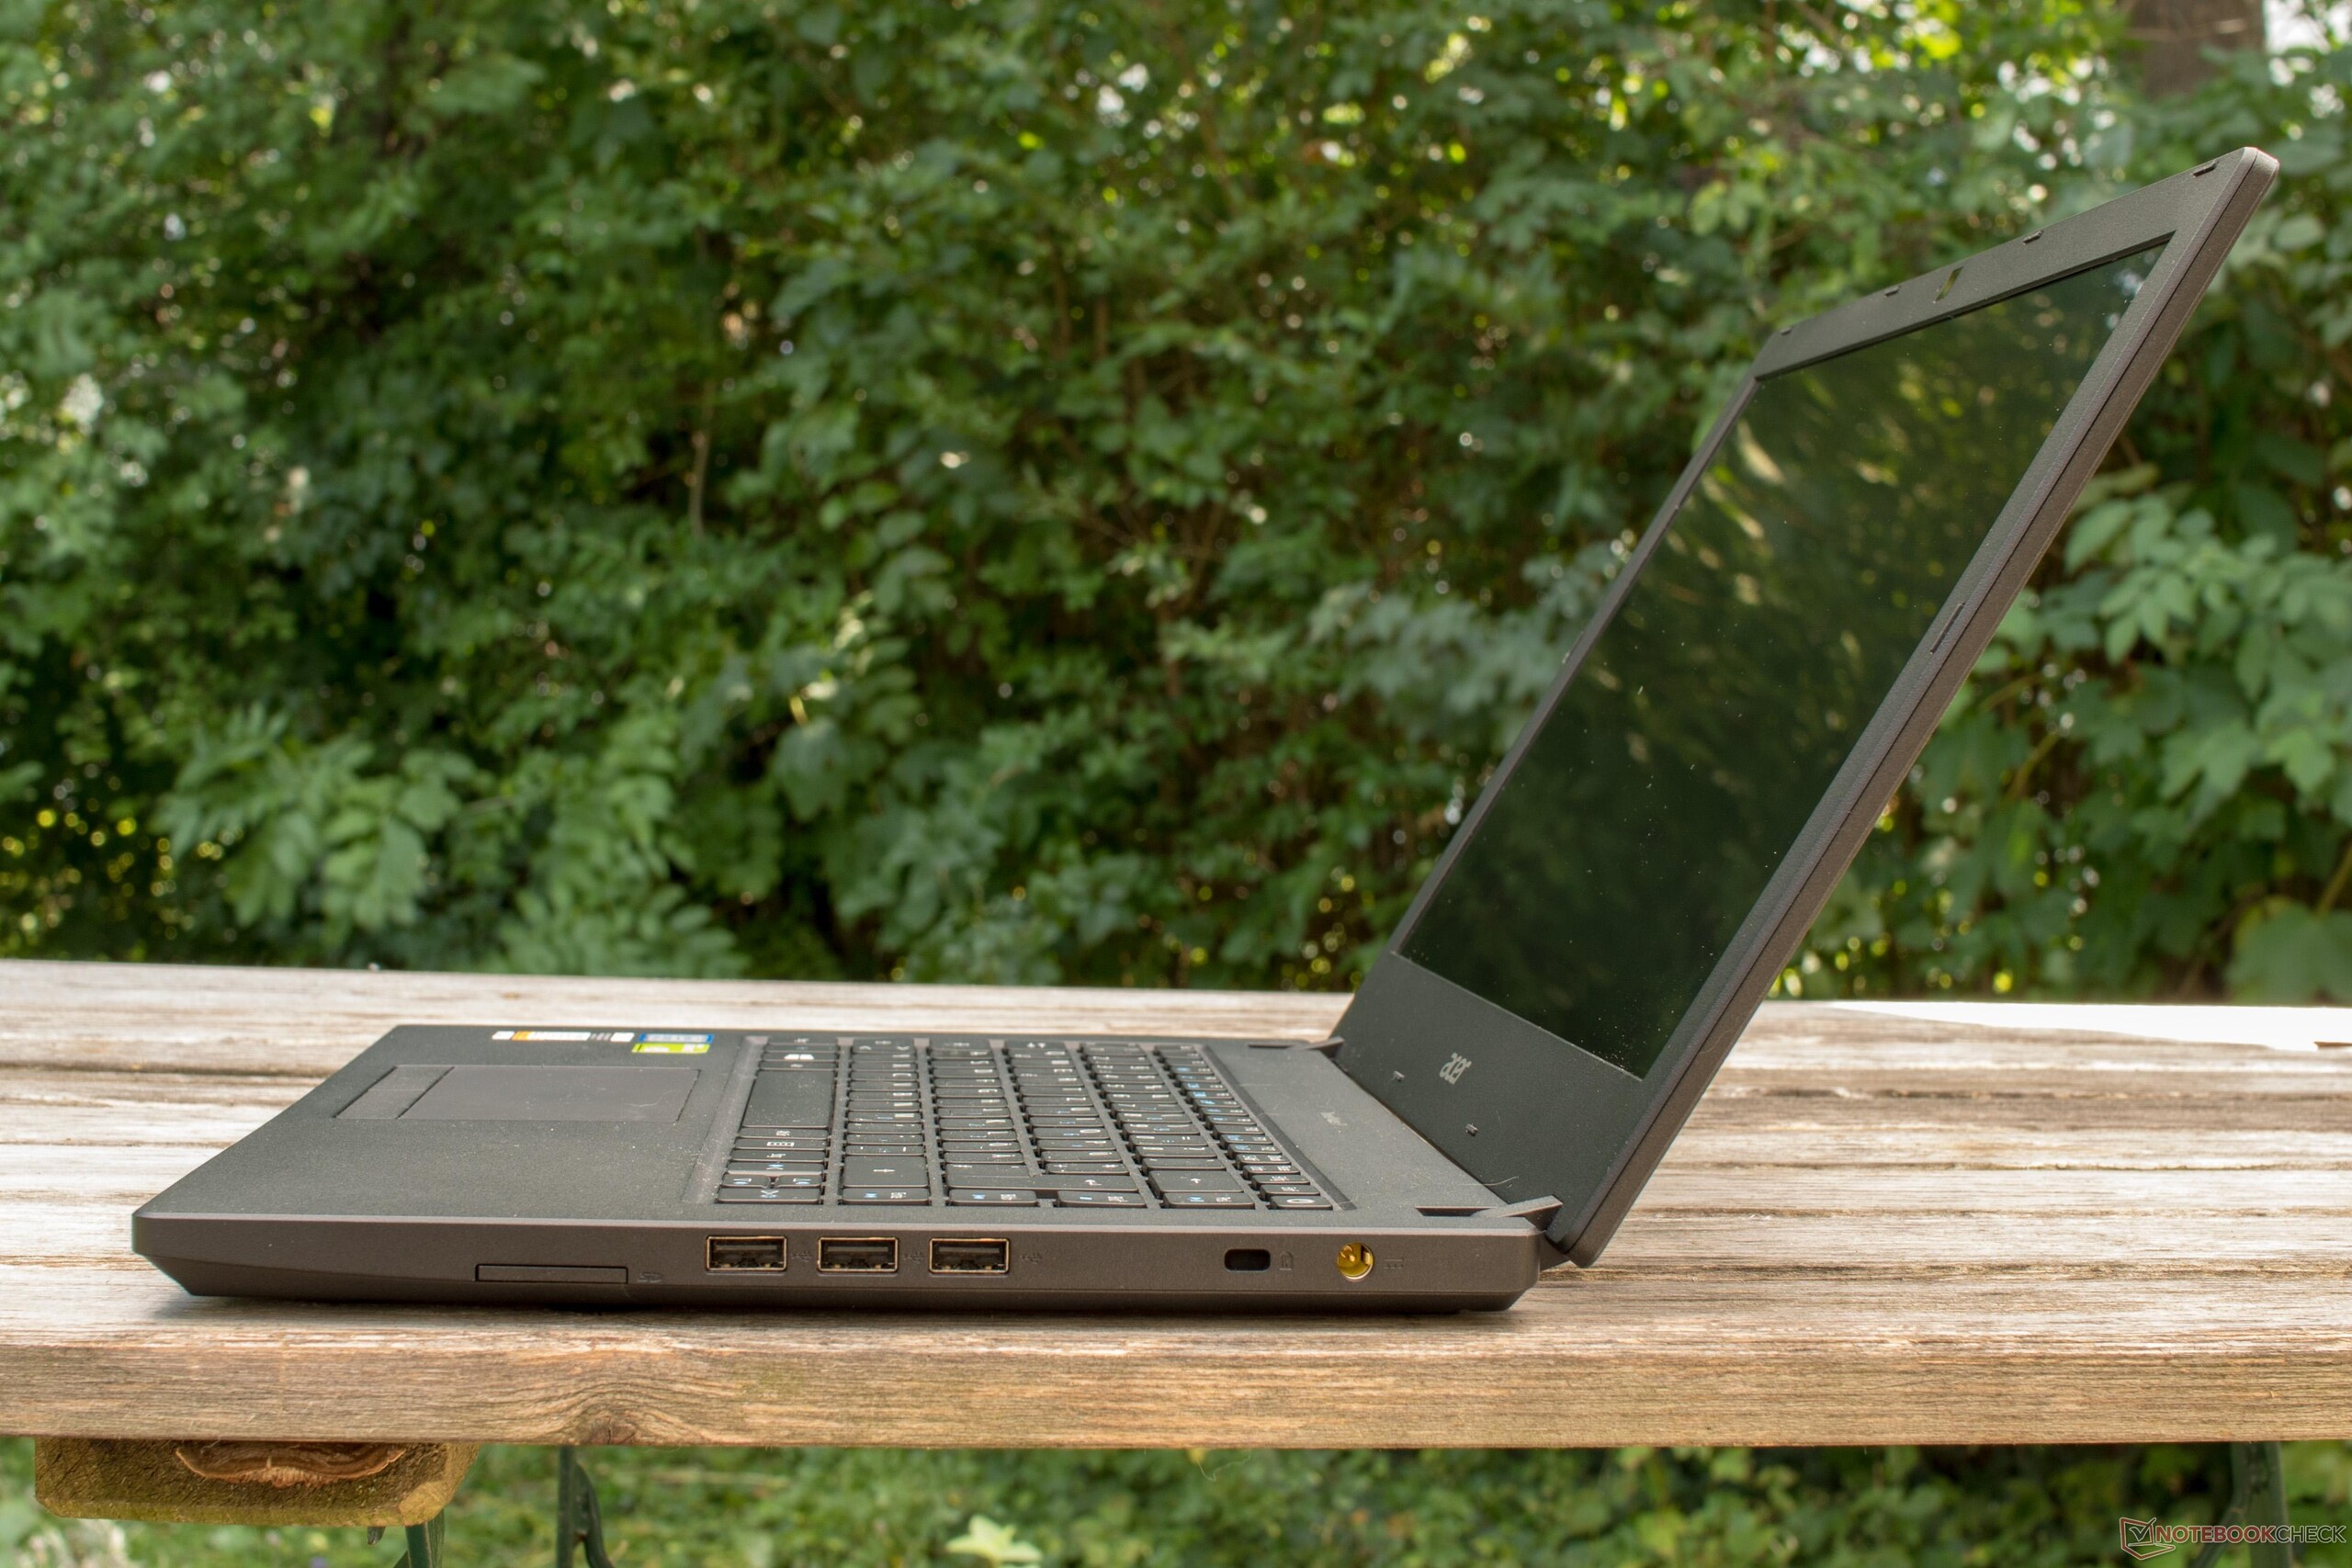
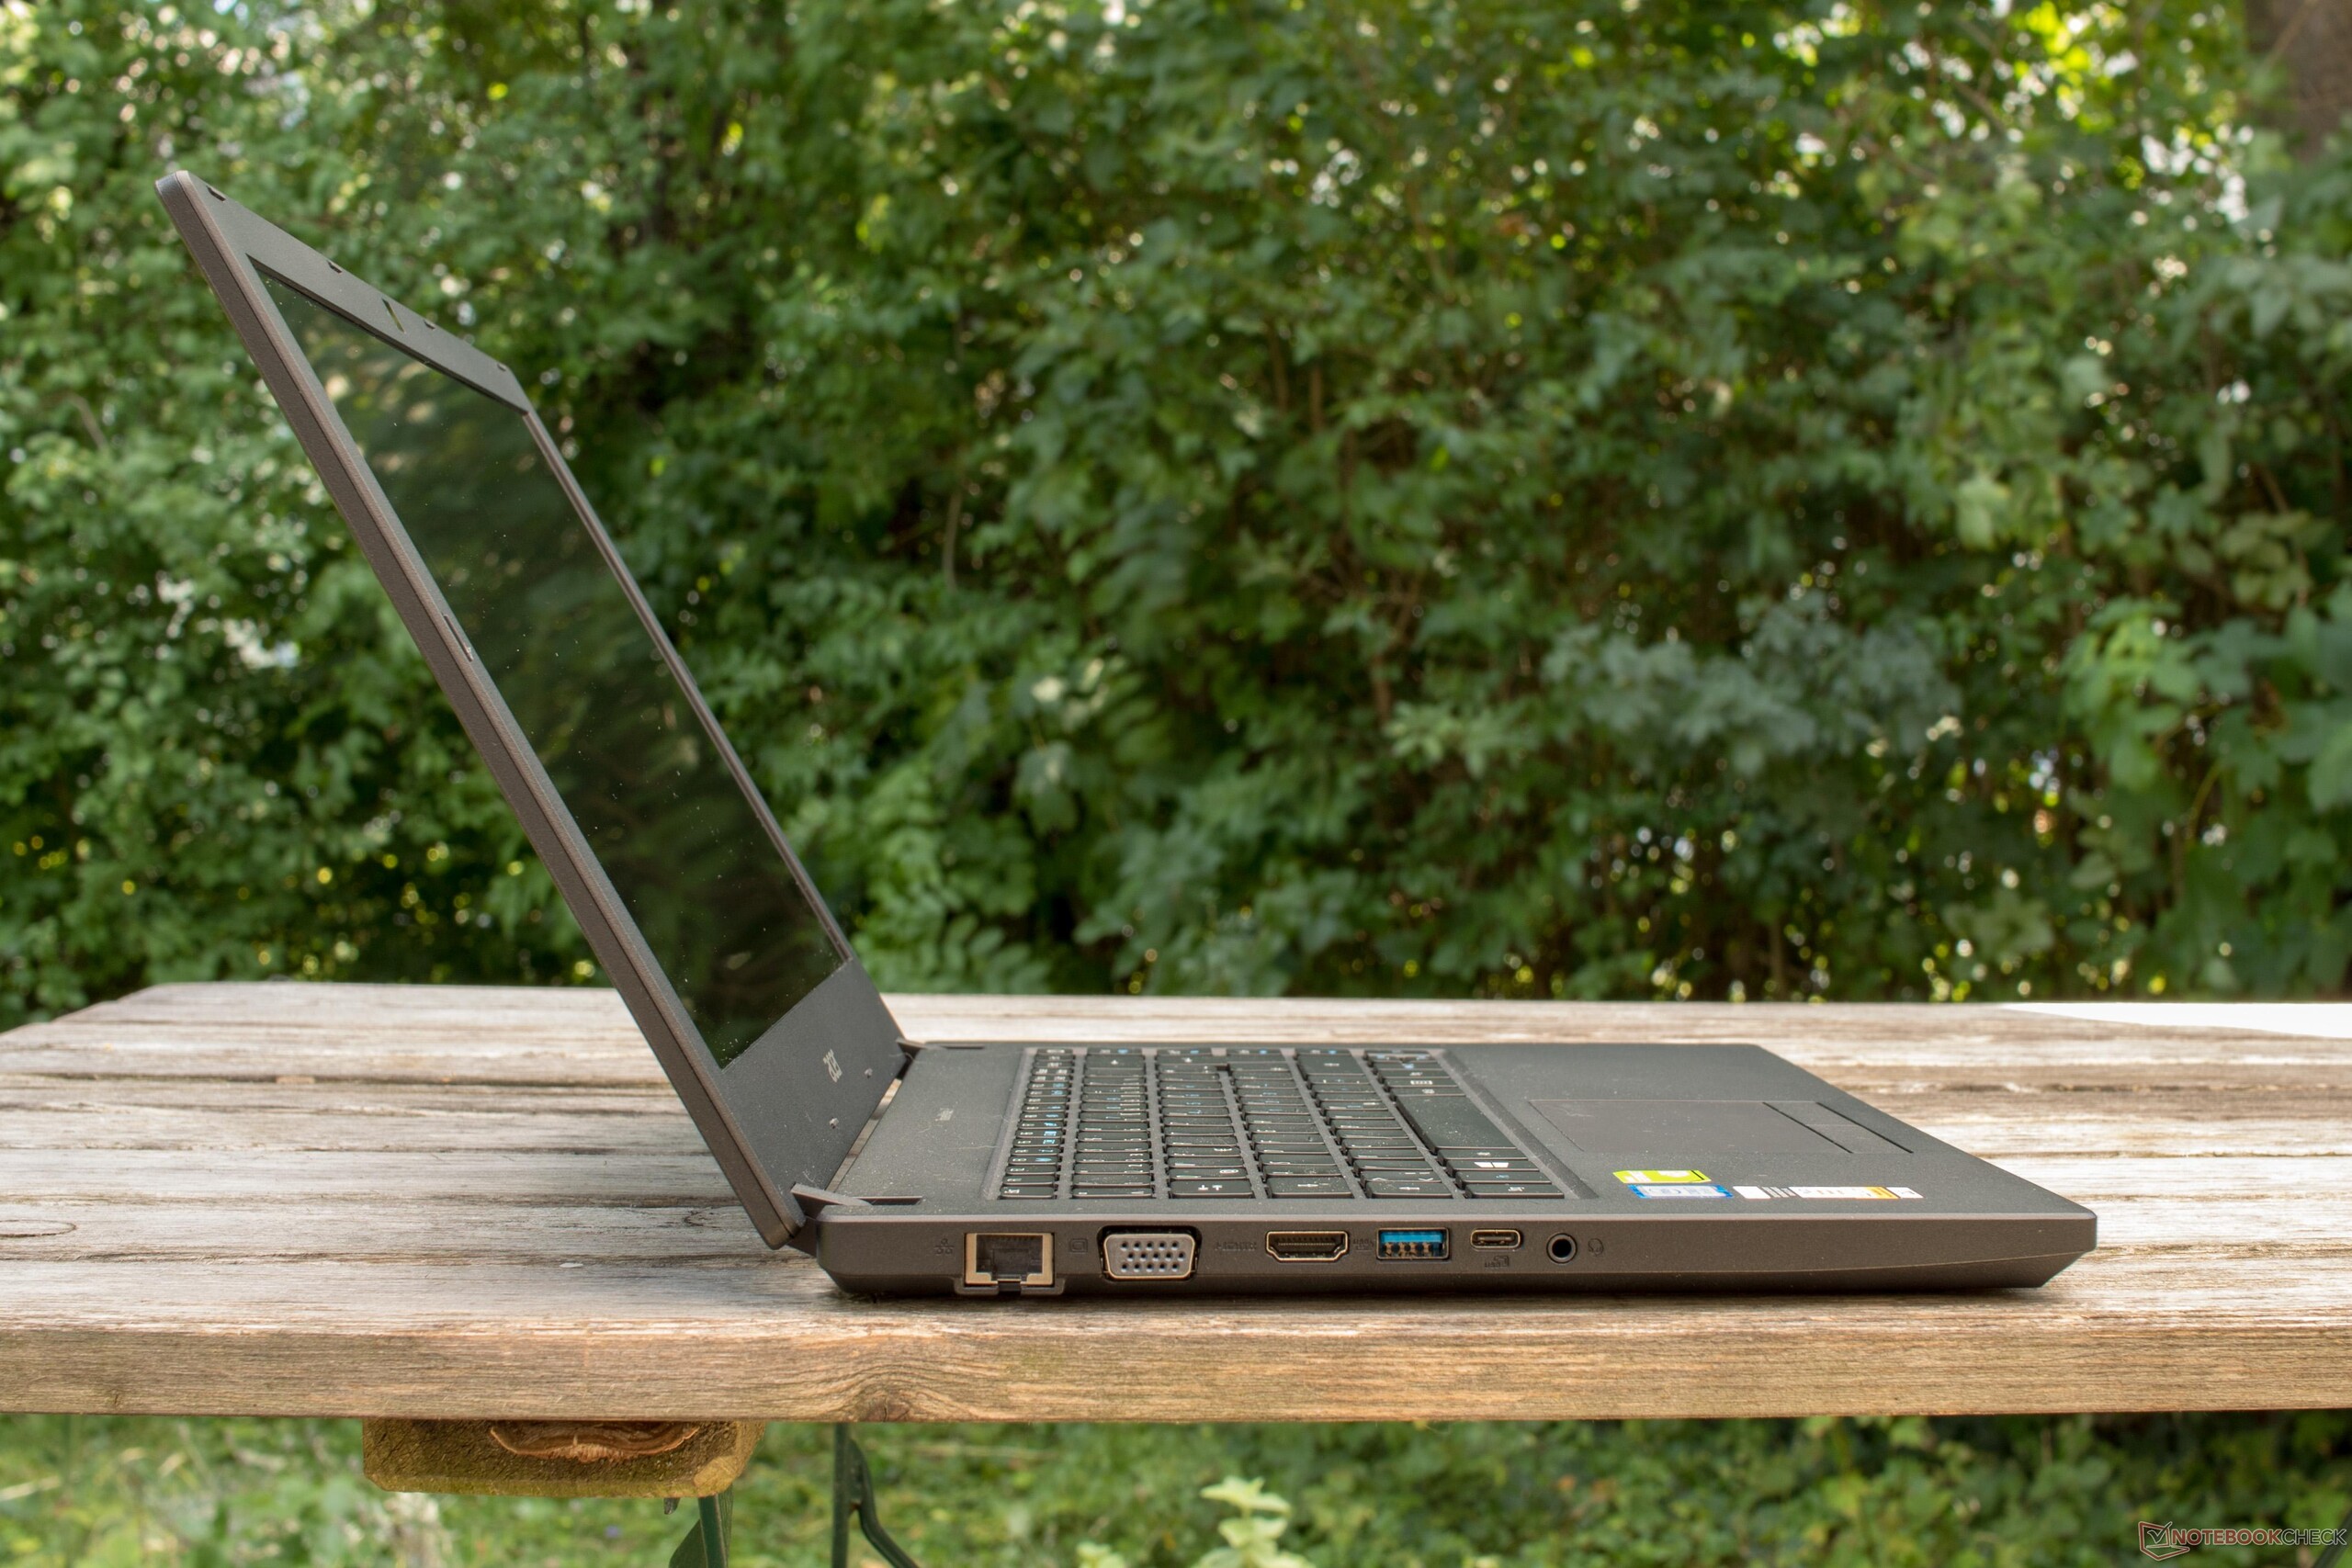
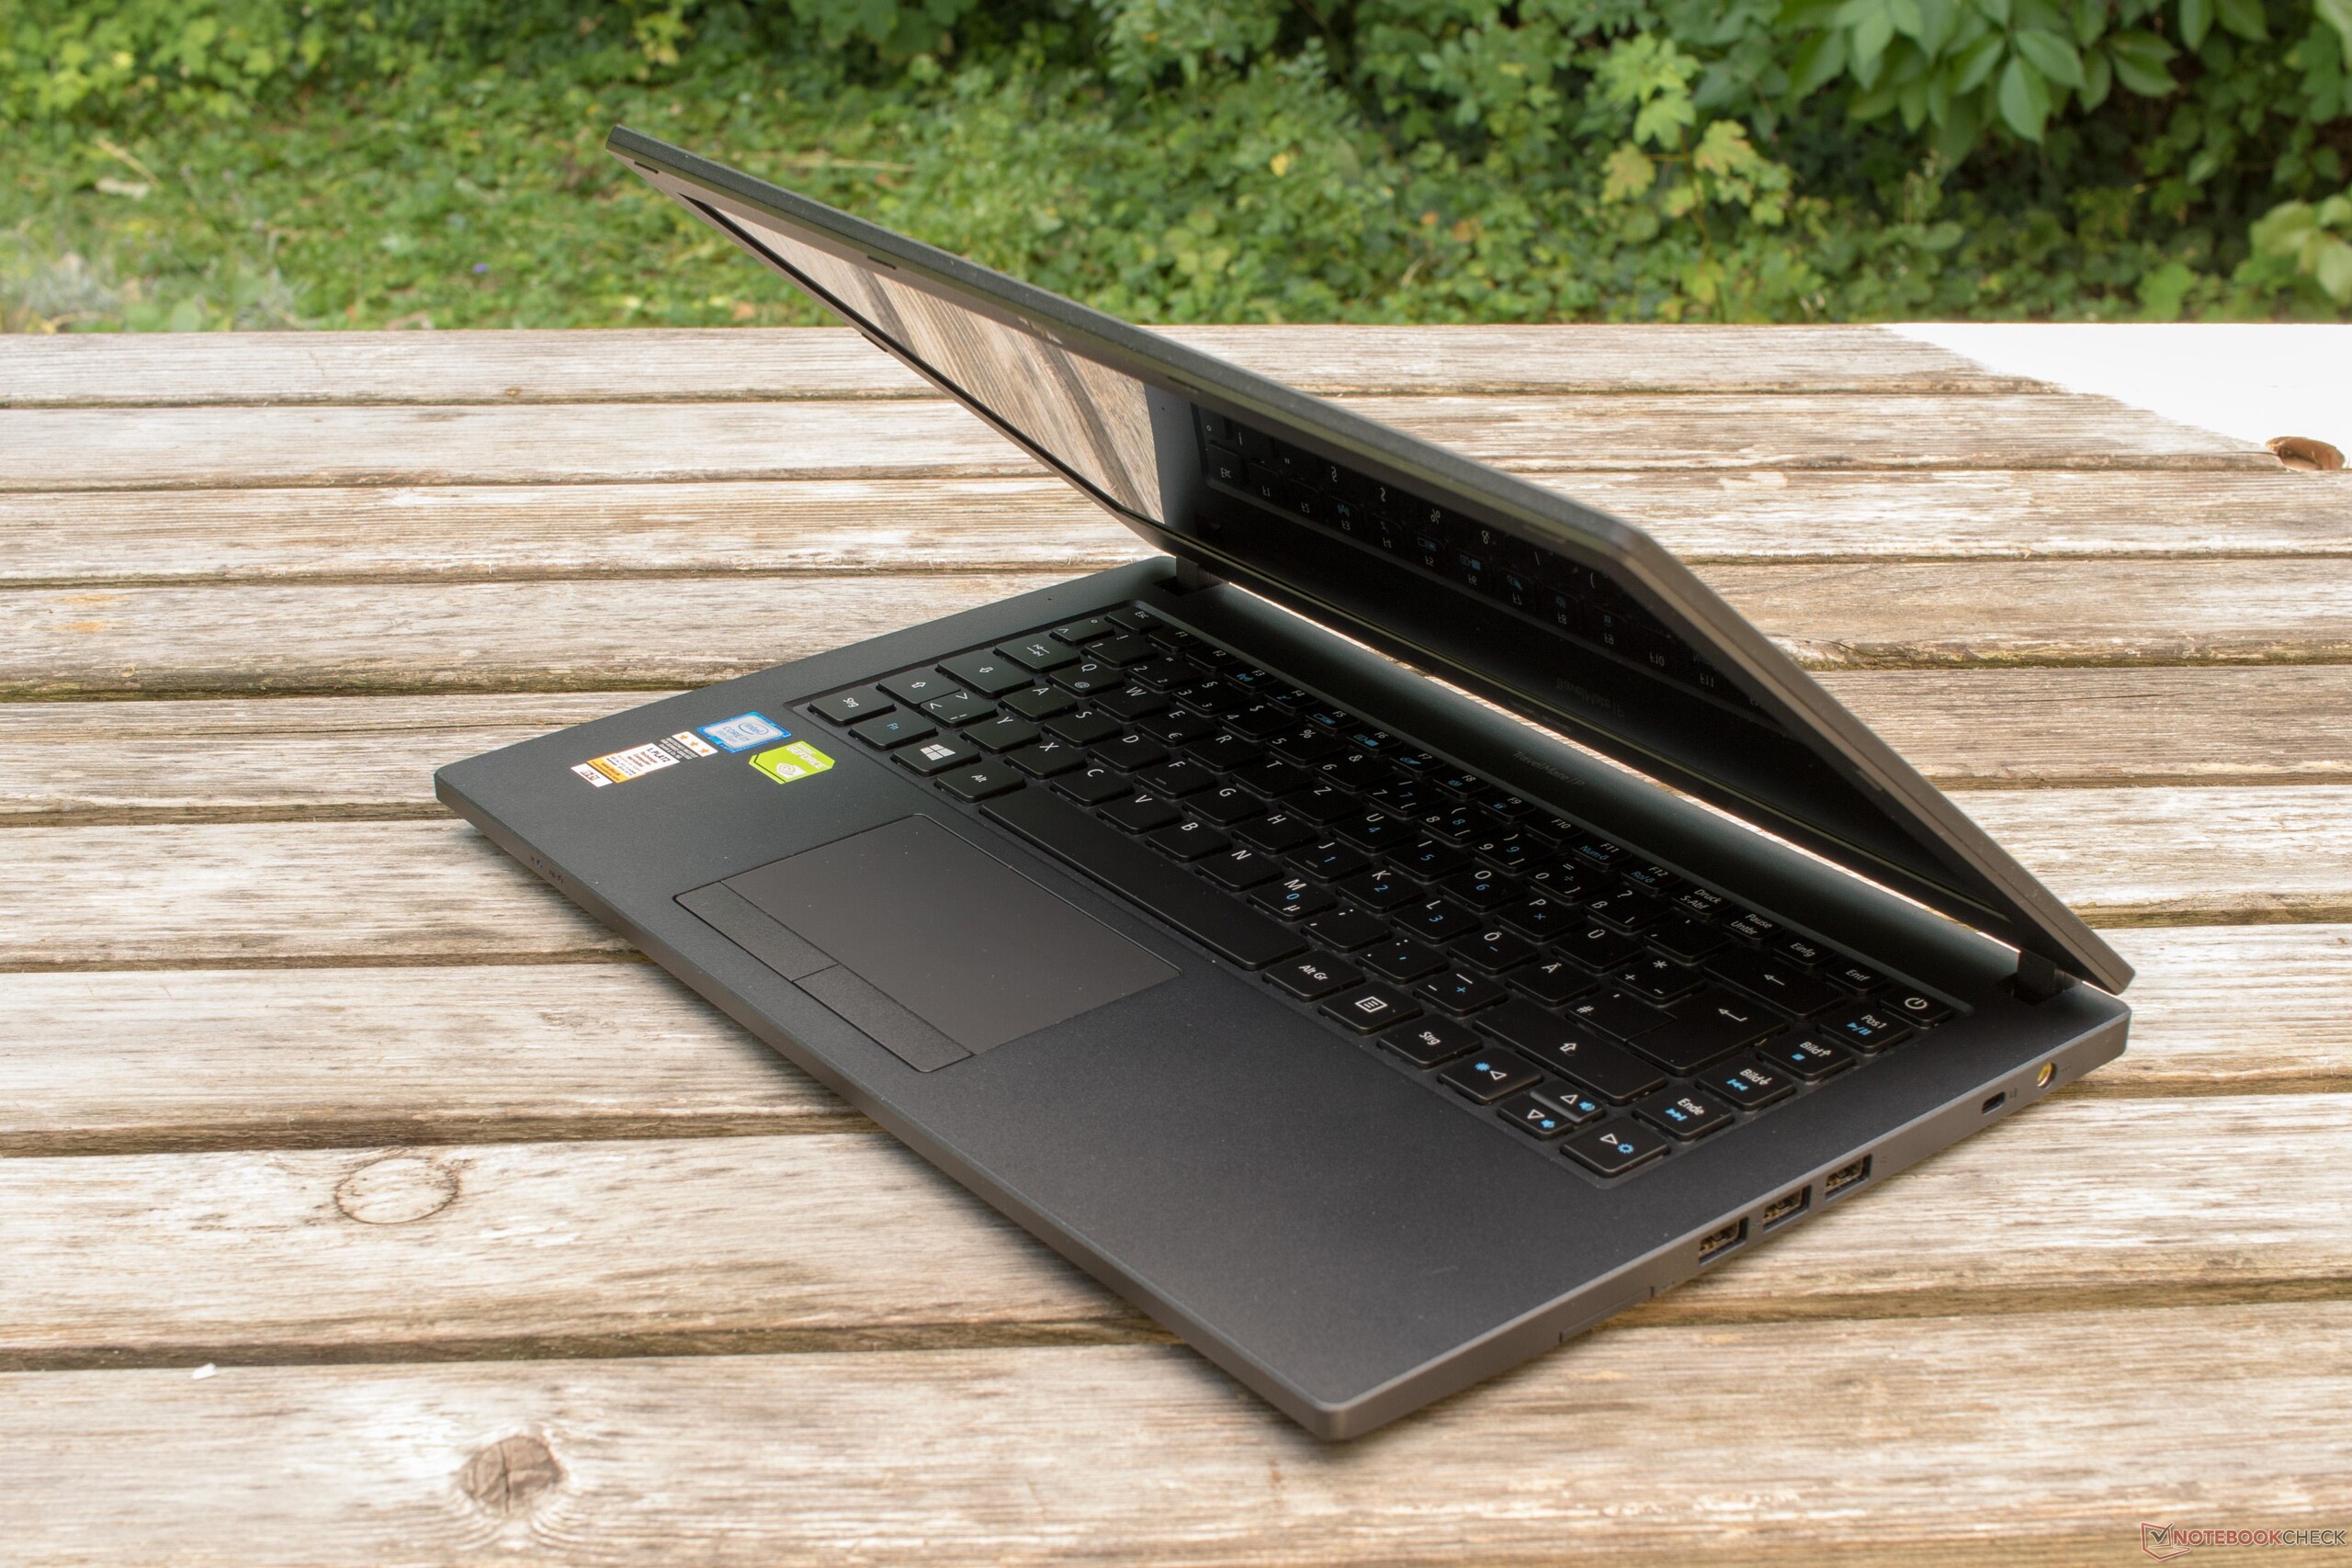
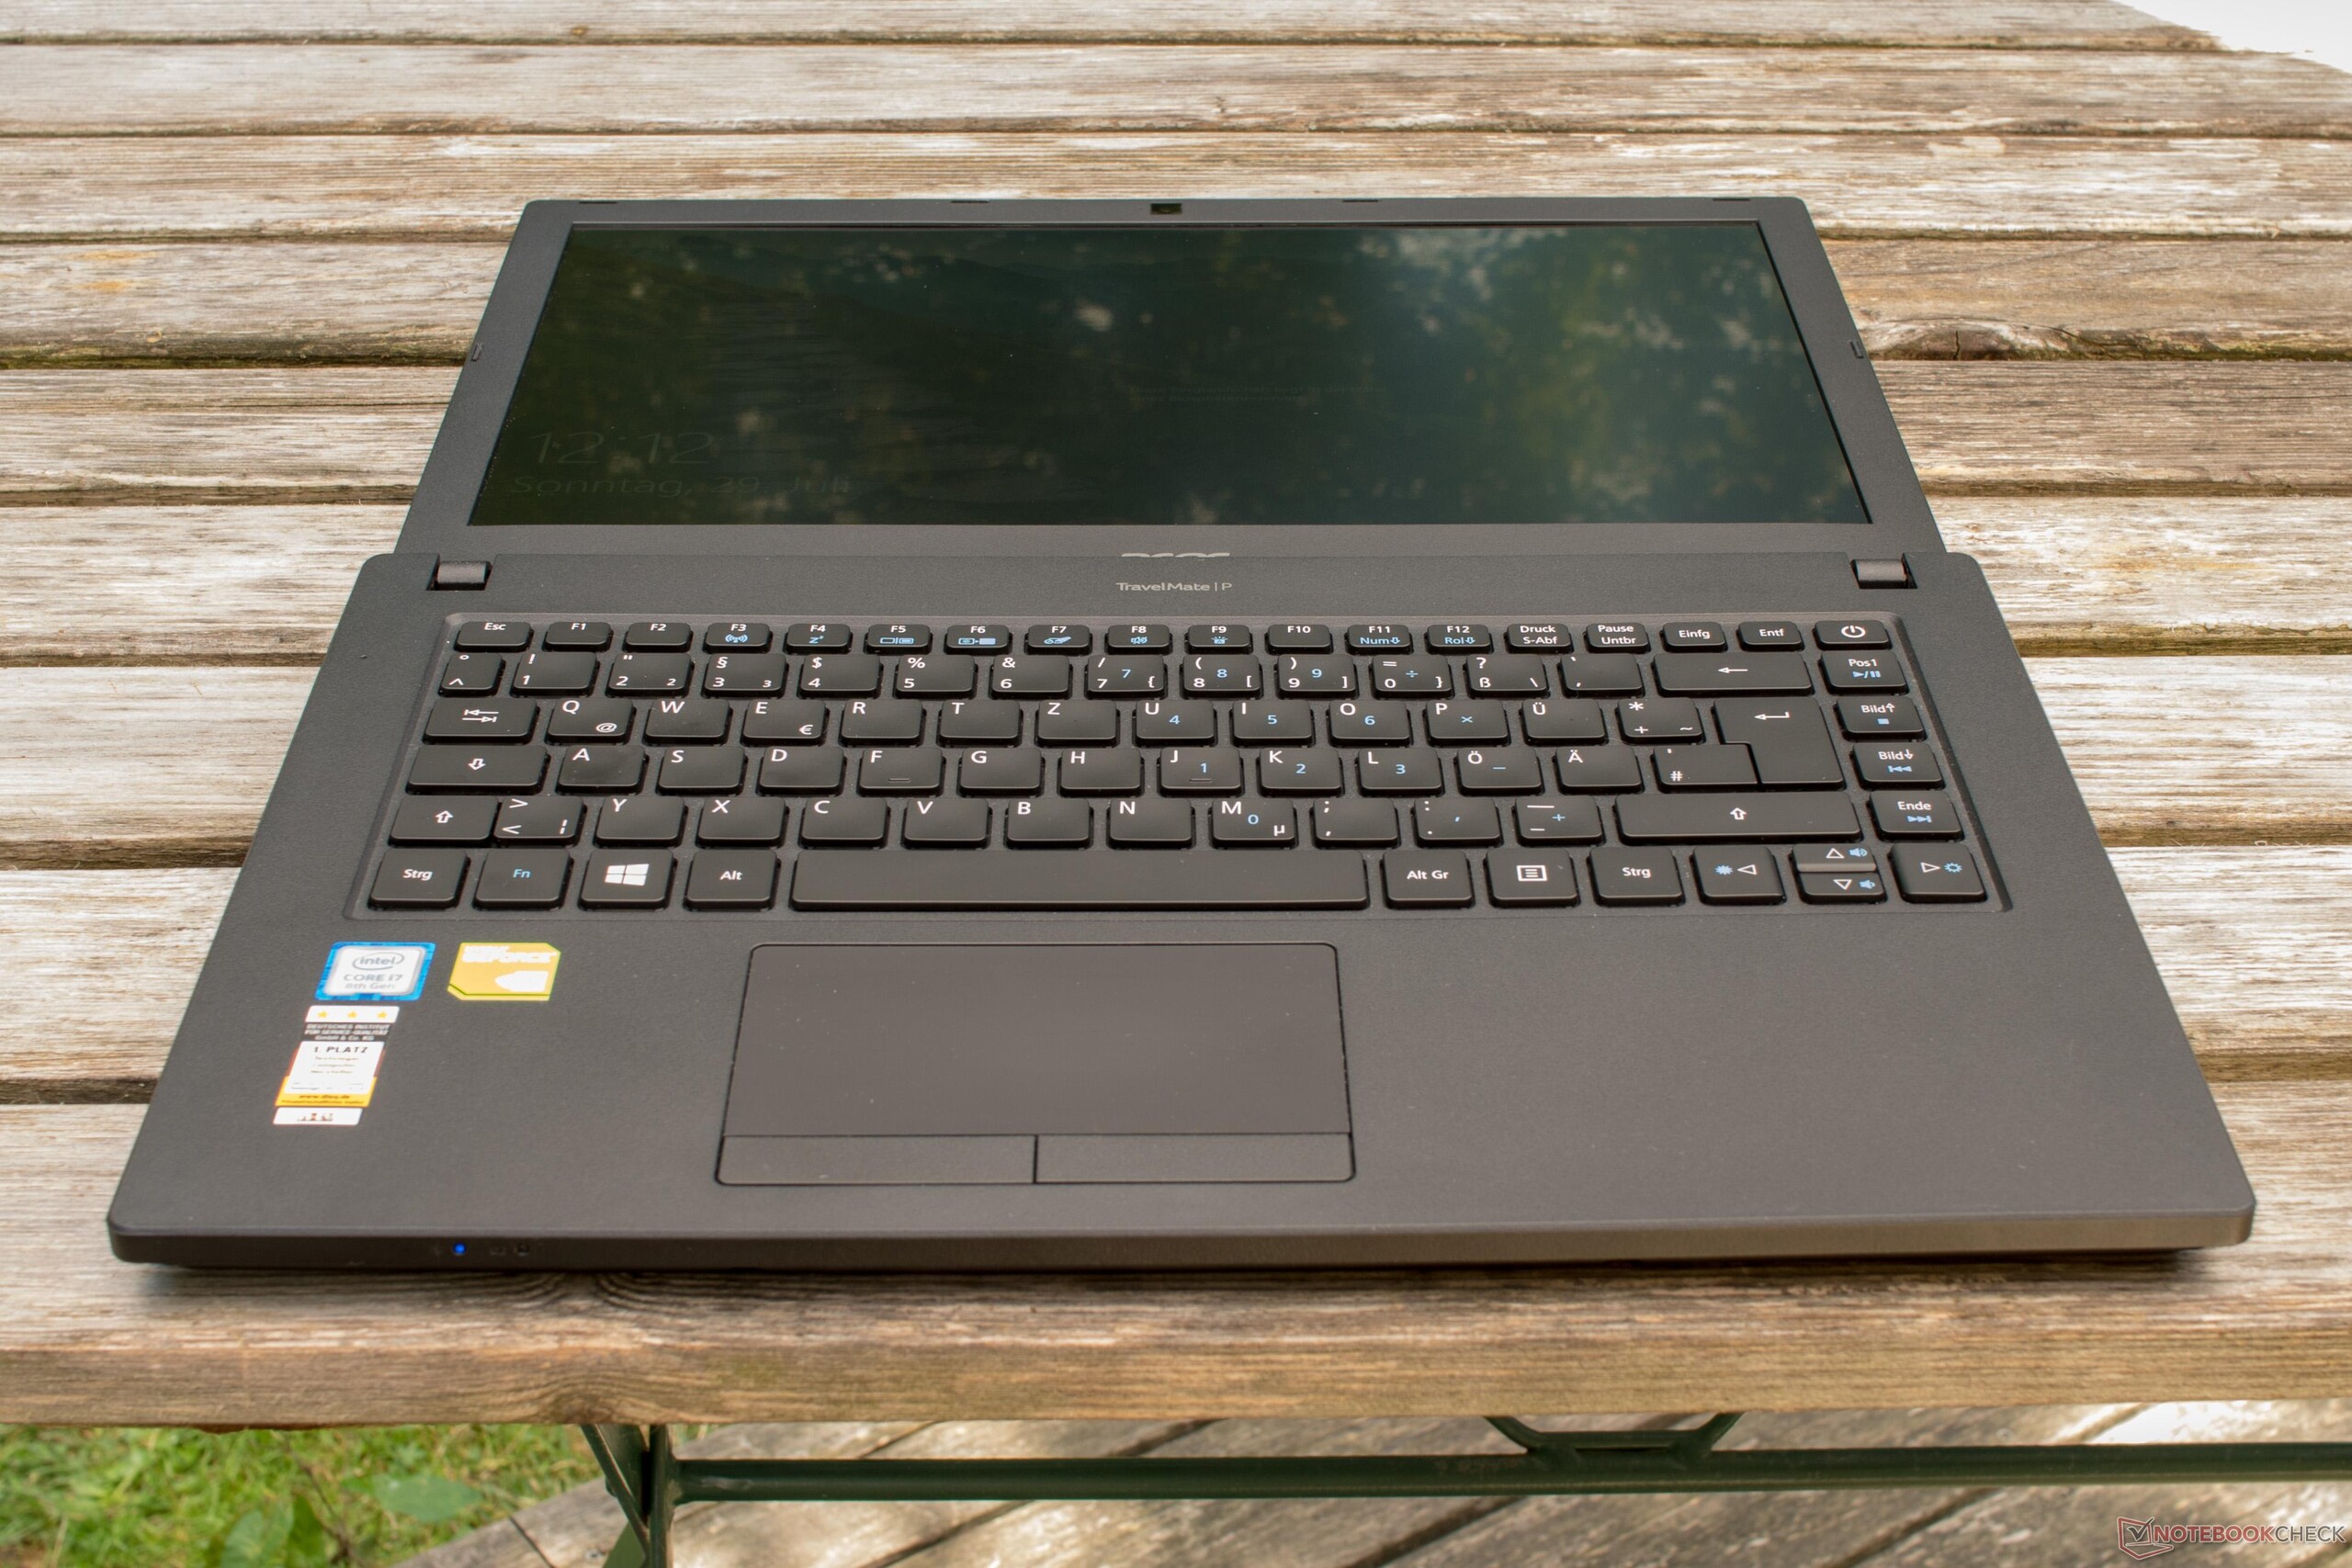
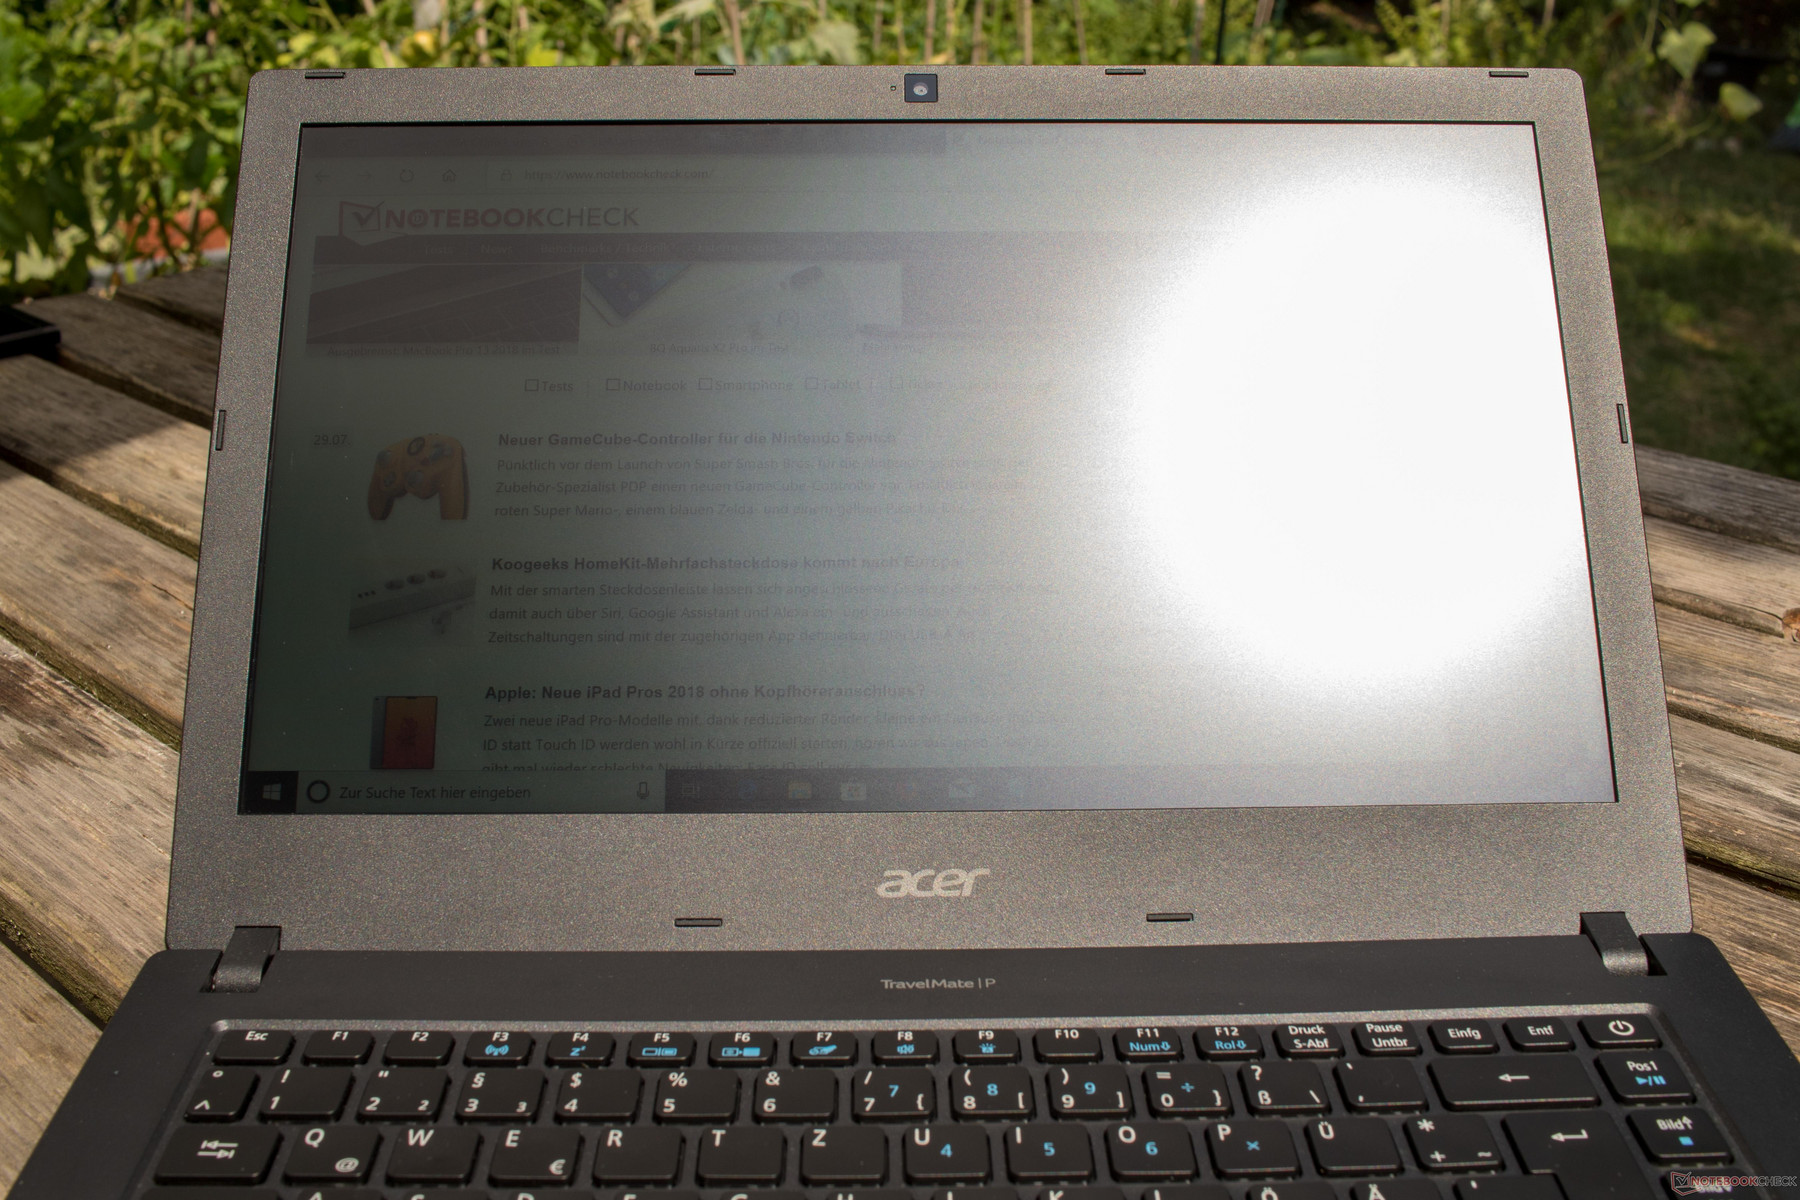
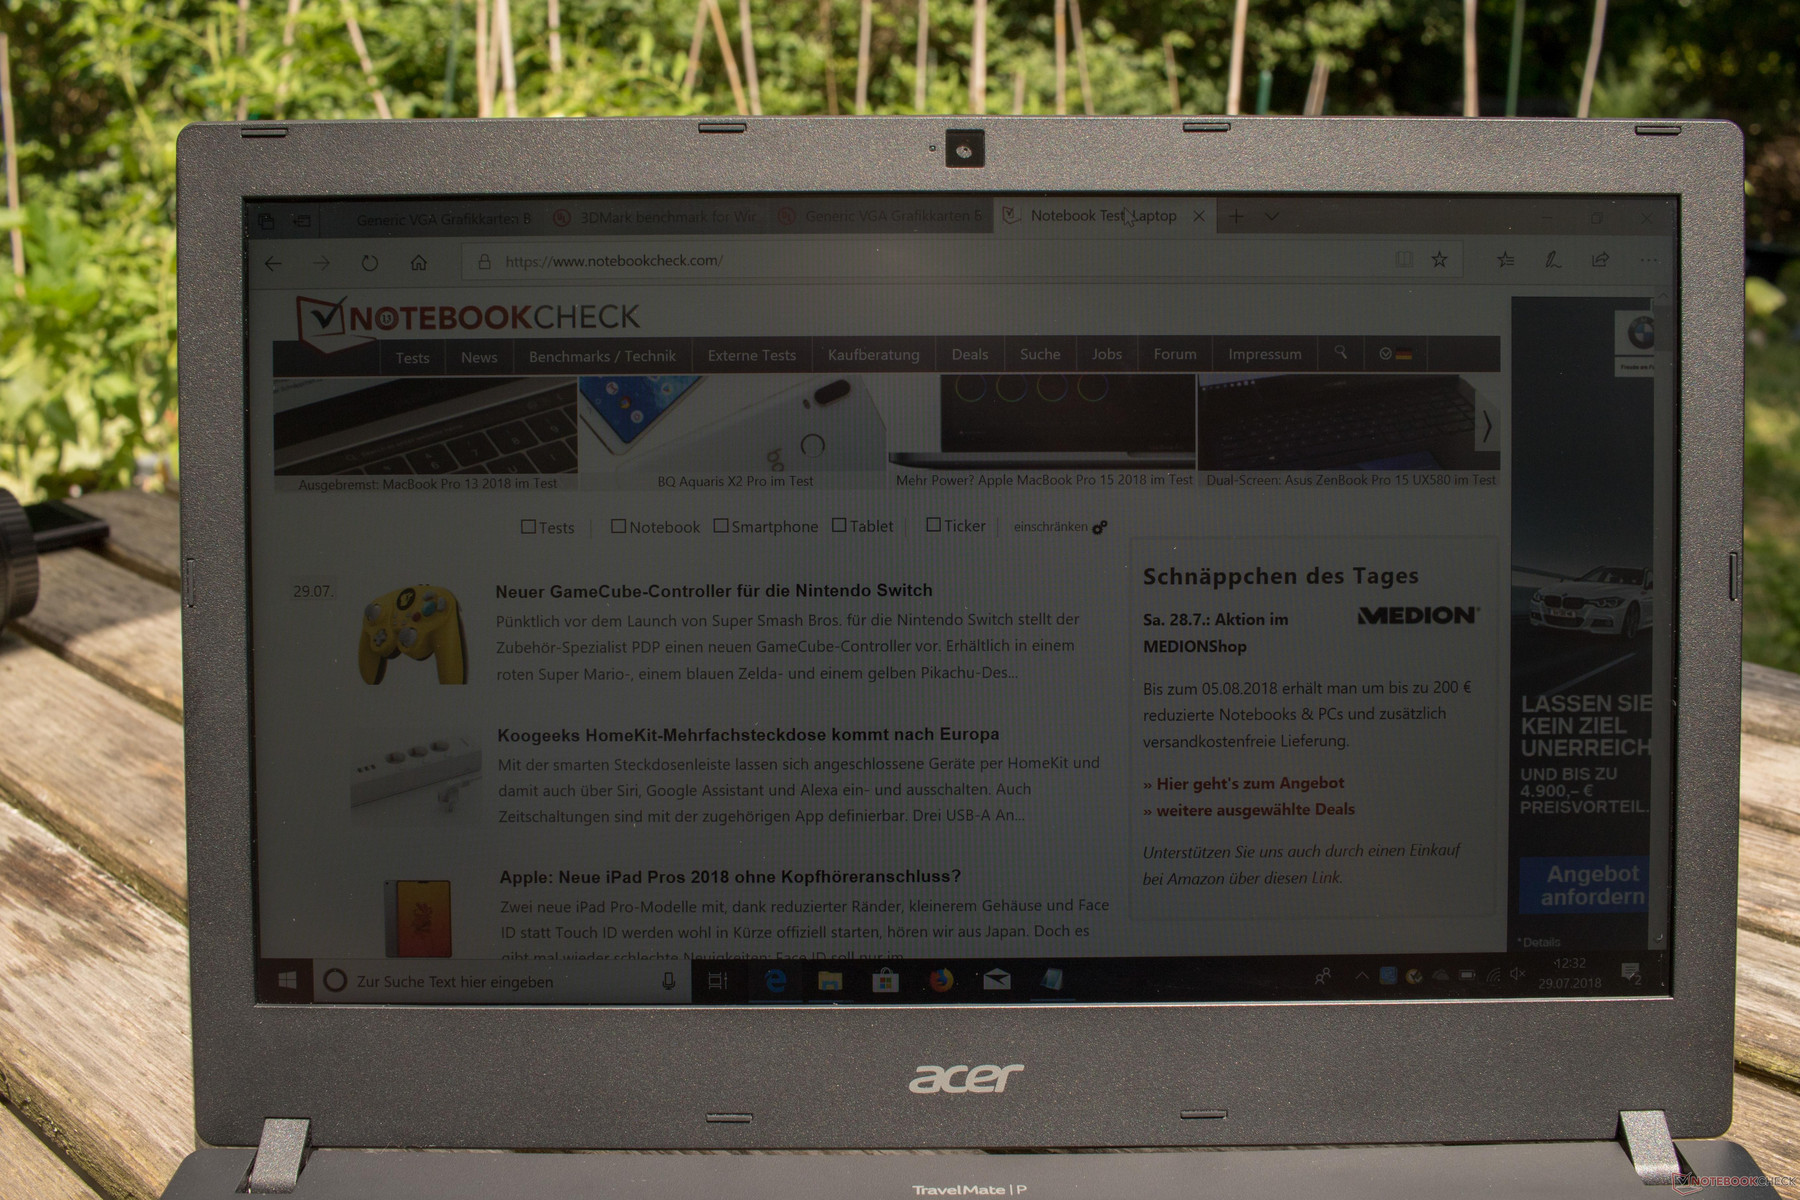
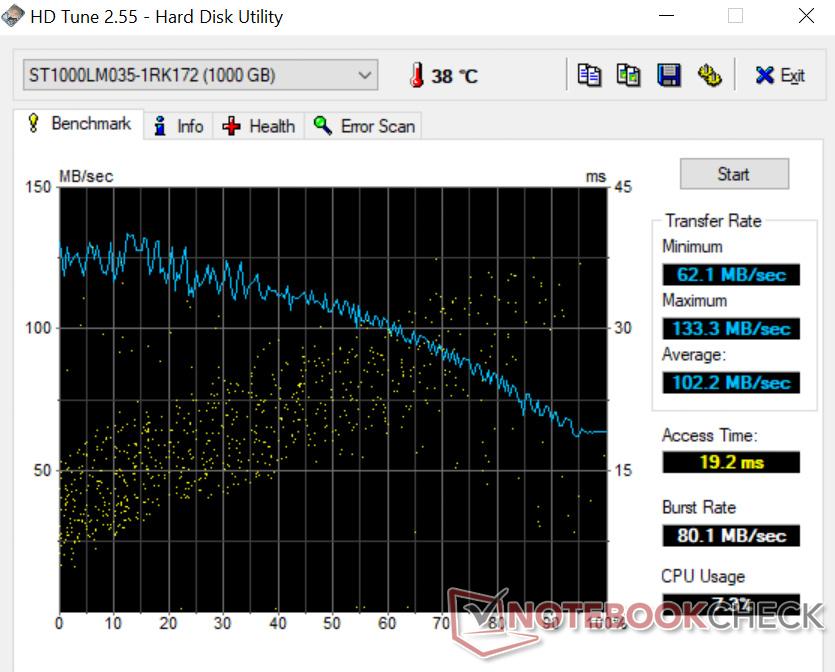
Innan vi skrev den här recensionen hoppades vi att Acer TravelMate P2410 skulle vara ett stabilt, portabelt och mångsidigt, men inte för flashigt, arbetsverktyg. Det är precis dessa förväntningar som har uppfyllts, då variationen av portar (även om bara en USB Typ A 3.0 finns tillgänglig), skärmen som kan användas utomhus, en extra HDD på 1 TB, den tillfredsställande batteritiden på 48 Wh samt ett pris på bara straxt över 10.000 kronor då enheten testades indikerar ett bra förhållande mellan pris och prestanda. Dessutom kan du njuta av ett dedikerat GeForce MX130, även om du inte får förvänta dig för mycket när det kommer till grafik-krävande spel. Den räcker dock till för enstaka spelande då och då.
Det finns, förstås, en del saker som Acer kunde ha löst annorlunda, som fläkten som alltid blåser eller det bakgrundsbelysa tangentbordet som inte kan ställas in.
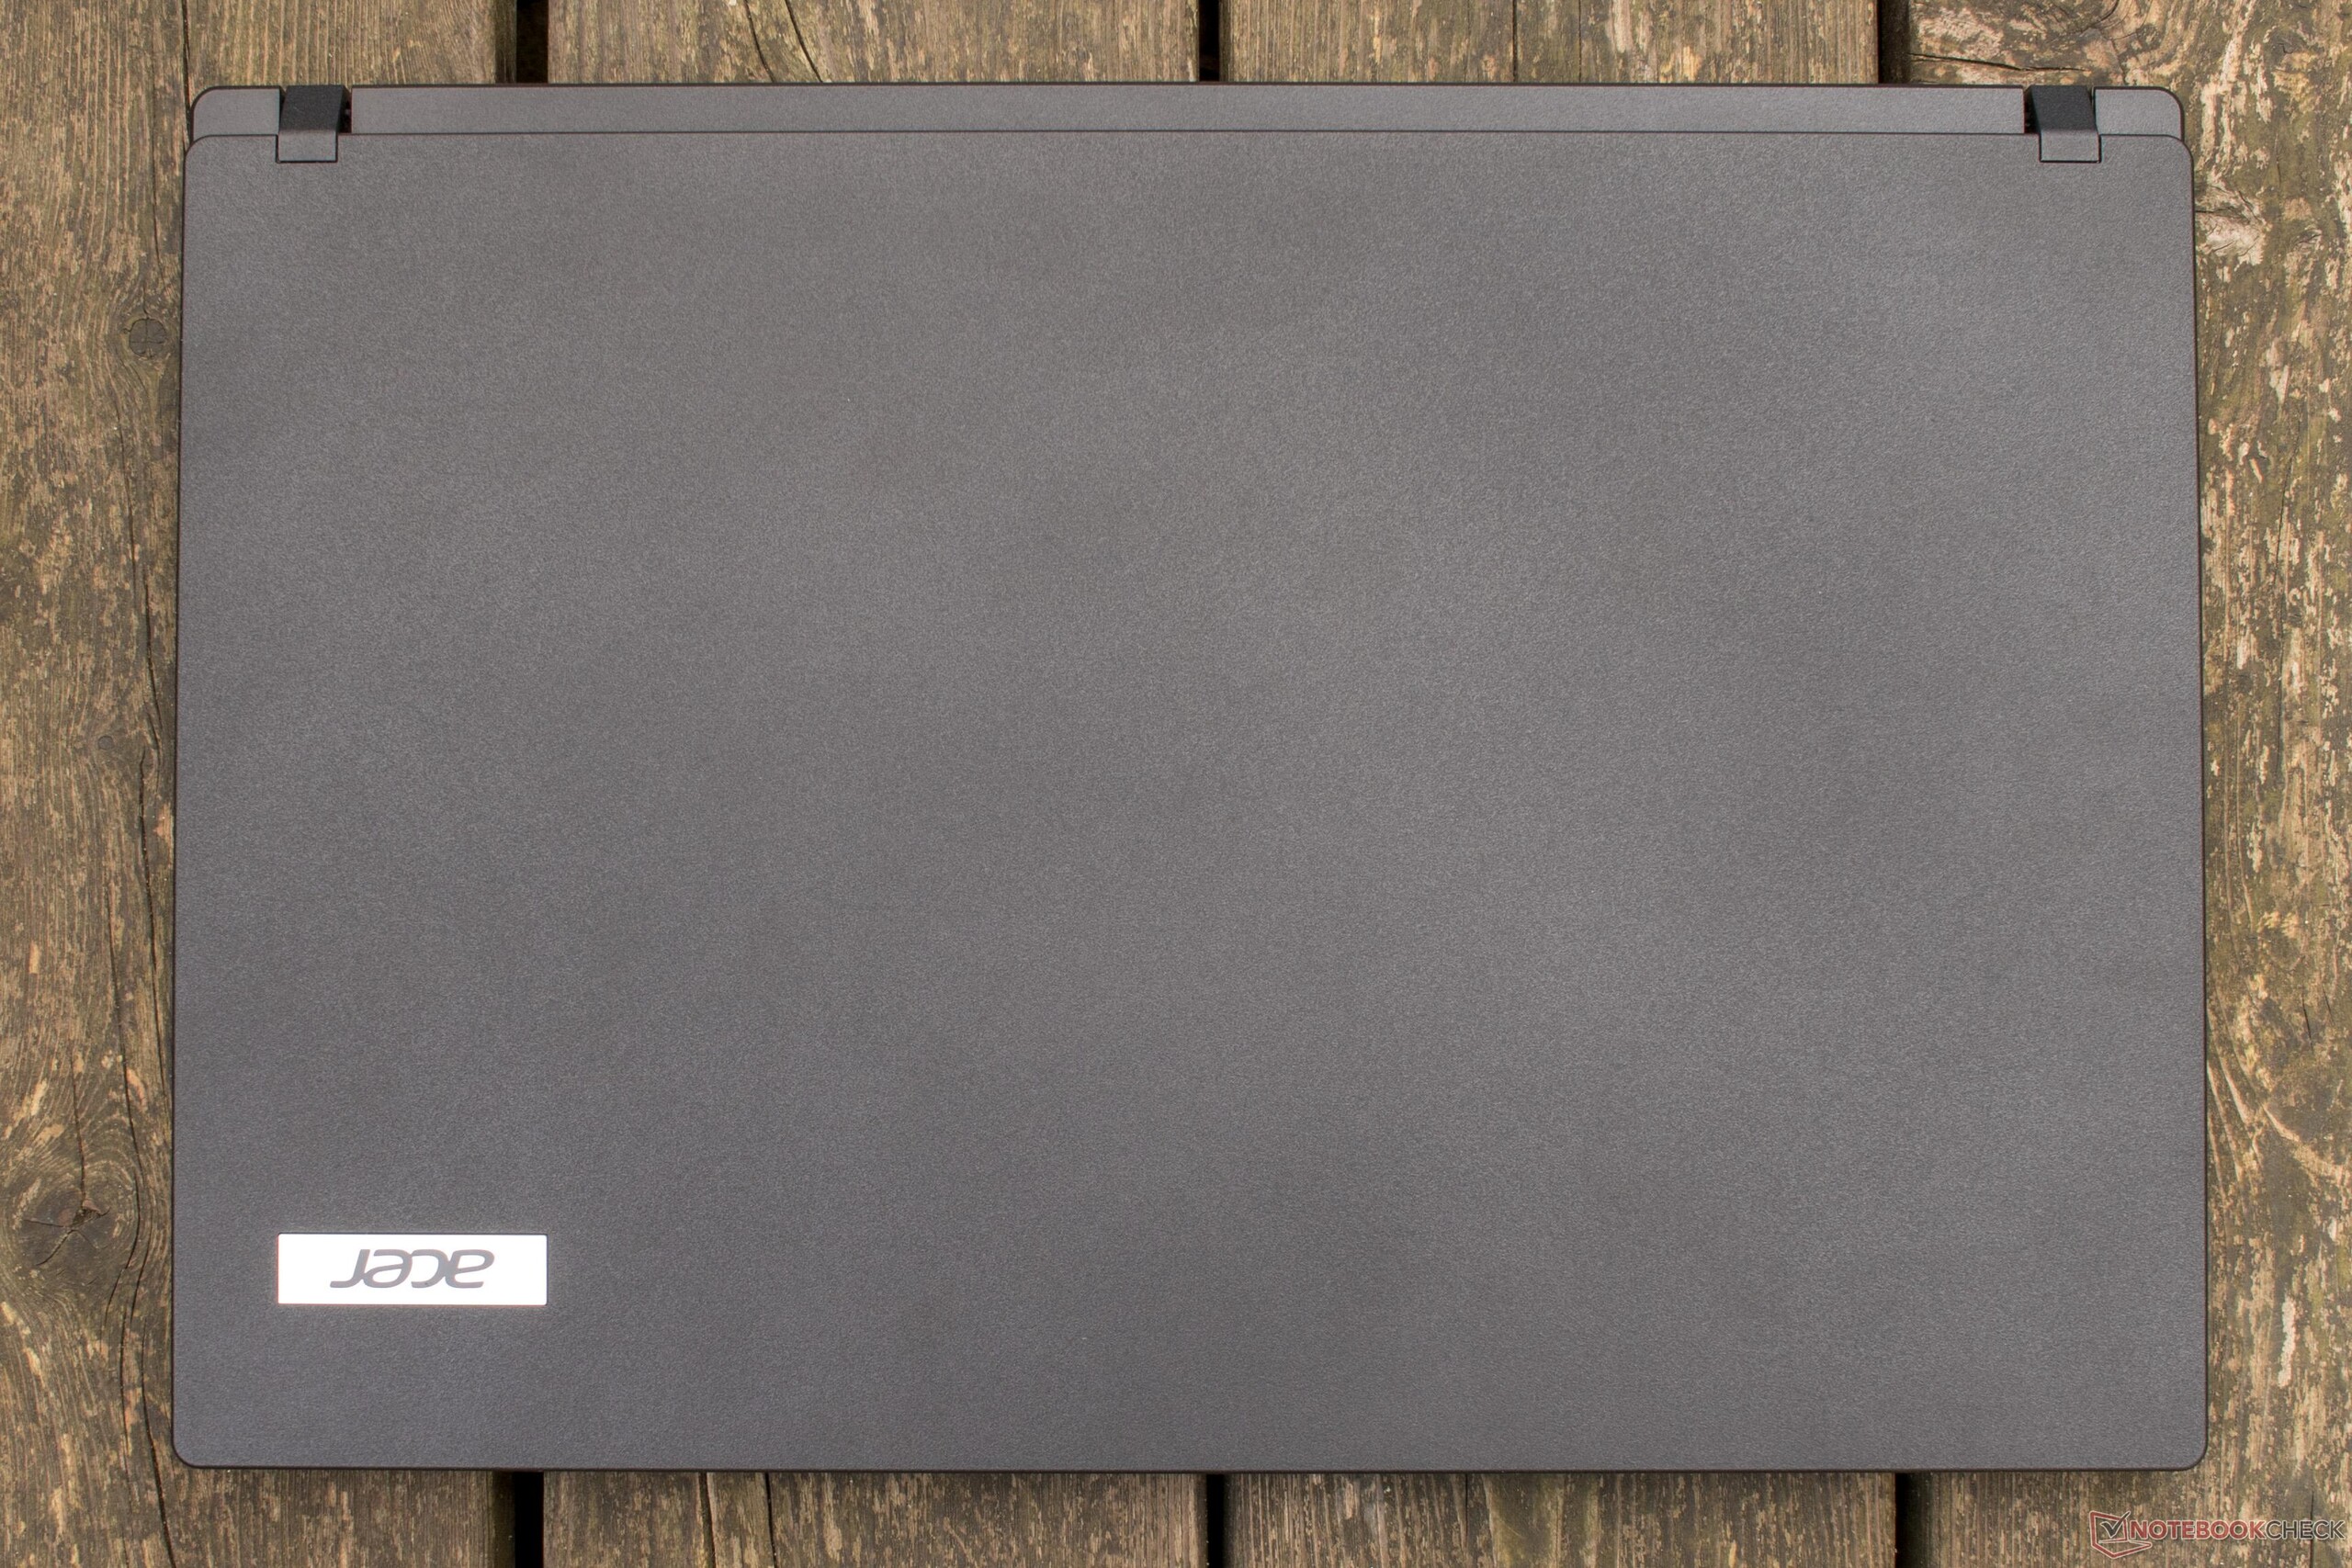
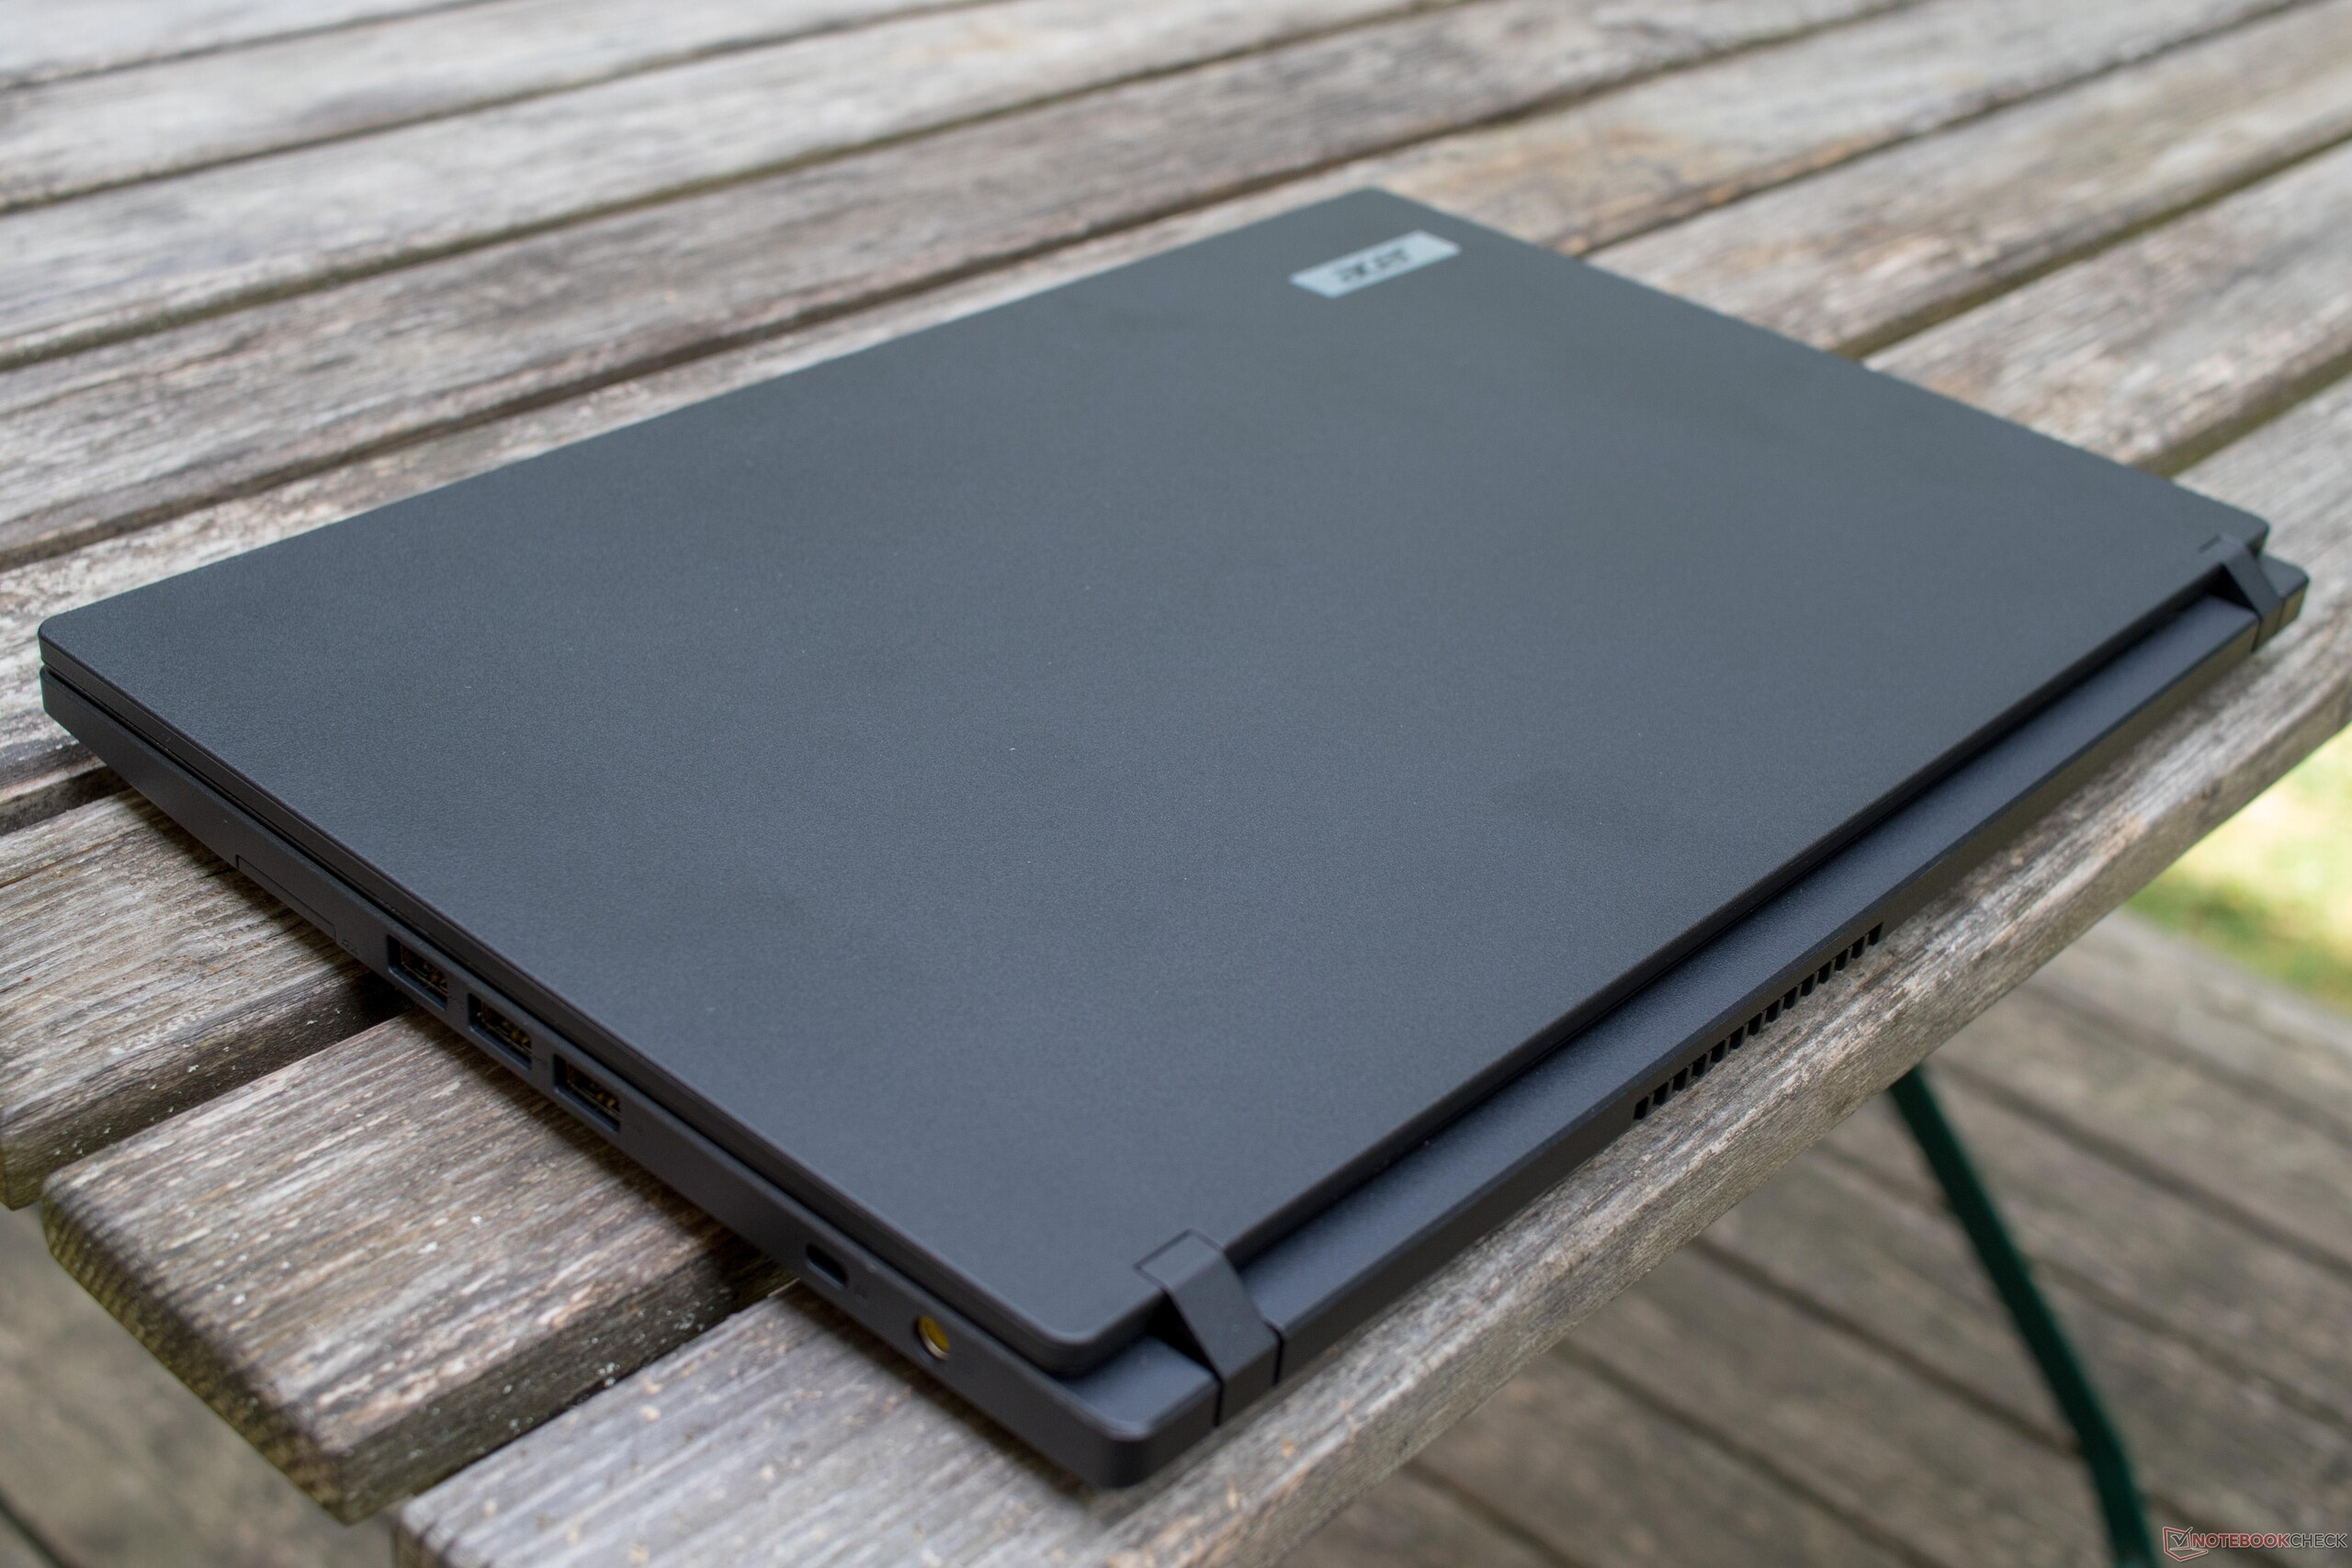
Det hade varit bättre att använda ett material av högre kvalitet, särskilt till området kring gångjärnen, till basen eller helt enkelt för att ge lite variation till det enkla svarta med ett annorlunda designelement eller två. Men detta är helt och hållet en fråga om smak och är sekundärt för den som efterfrågar ett system som är tillräckligt snabbt för kontorsarbete och har många anslutningsmöjligheter. Men den som anser att ren plast inte är ett alternativ att överväga och istället värdesätter design, känsla och ädlare material får välja en annan enhet. TravelMate P648 kostar ungefär lika mycket men är utrustad med Intel Core i7-7500U, HD Graphics 620 och har detaljer i aluminium, kolfiberförstärkt plast samt gångjärn i metall.
Acer TravelMate 2410-G2-MG-82E6
- 08/22/2018 v6 (old)
Daniel Puschina