Recension av Gigabyte G5 KE: Bärbar dator i mellanklassen som kollar de flesta rutorna
Gigabyte erbjuder flera olika klasser av bärbara datorer baserat på prestanda och budget. Medan Aorus- och Aero-serierna är inriktade på segmenten för premiumspel och innehållsskapande är de traditionella Gigabyte-varianterna som G5 och G7 inriktade på en mer vanlig spelpublik.
Vi har tidigare recenserat den 17,3-tums Gigabyte G7 KE och nu får vi testa 15,6-tums Gigabyte G5 KE med i stort sett liknande specifikationer.
Vår Gigabyte G5 KE-enhet är utrustad med en Intel 12th gen Core i5-12500H processor, Nvidia GeForce RTX 3060 GPU för bärbar dator, 16 GB RAM, 512 GB SSD och en 15,6-tums IPS-panel med 144 Hz.
Den här konfigurationen kostar dig ₹94 990 (1 155 USD) på den indiska marknaden. I den här recensionen tar vi Gigabyte G5 KE på prov och ser om den kan mäta sig med sina kollegor från mellanklassegmentet för spel.
Potentiella konkurrenter i jämförelse
Gradering | Datum | Modell | Vikt | Höjd | Storlek | Upplösning | Pris |
|---|---|---|---|---|---|---|---|
| 81.8 % v7 (old) | 04/2023 | Gigabyte G5 KE i5-12500H, GeForce RTX 3060 Laptop GPU | 2 kg | 23.9 mm | 15.60" | 1920x1080 | |
| 82.8 % v7 (old) | 10/2022 | Lenovo IdeaPad Gaming 3 15IAH7 i5-12500H, GeForce RTX 3050 Ti Laptop GPU | 2.4 kg | 26 mm | 15.60" | 1920x1080 | |
| 83.3 % v7 (old) | 01/2023 | Gigabyte G7 KE i5-12500H, GeForce RTX 3060 Laptop GPU | 2.6 kg | 25 mm | 17.30" | 1920x1080 | |
| 87.4 % v7 (old) | 09/2022 | Honor MagicBook 14 2022 i5-12500H, GeForce RTX 2050 Mobile | 1.6 kg | 16.9 mm | 14.00" | 2160x1440 | |
| 87.9 % v7 (old) | 01/2023 | Schenker XMG Core 15 (M22) R7 6800H, GeForce RTX 3060 Laptop GPU | 2.1 kg | 23 mm | 15.60" | 2560x1440 | |
| 86.1 % v7 (old) | 10/2022 | Dell G16 7620 i7-12700H, GeForce RTX 3060 Laptop GPU | 2.6 kg | 26.9 mm | 16.00" | 2560x1600 | |
| 82.3 % v7 (old) | 09/2022 | Gigabyte A5 K1 R5 5600H, GeForce RTX 3060 Laptop GPU | 2.2 kg | 34 mm | 15.60" | 1920x1080 | |
| 87.2 % v7 (old) | 03/2022 | Asus TUF Gaming F15 FX507ZM i7-12700H, GeForce RTX 3060 Laptop GPU | 2.1 kg | 24.95 mm | 15.60" | 1920x1080 | |
| 84.3 % v7 (old) | 10/2021 | HP Victus 16-e0179ng R7 5800H, GeForce RTX 3060 Laptop GPU | 2.5 kg | 23.5 mm | 16.10" | 1920x1080 |
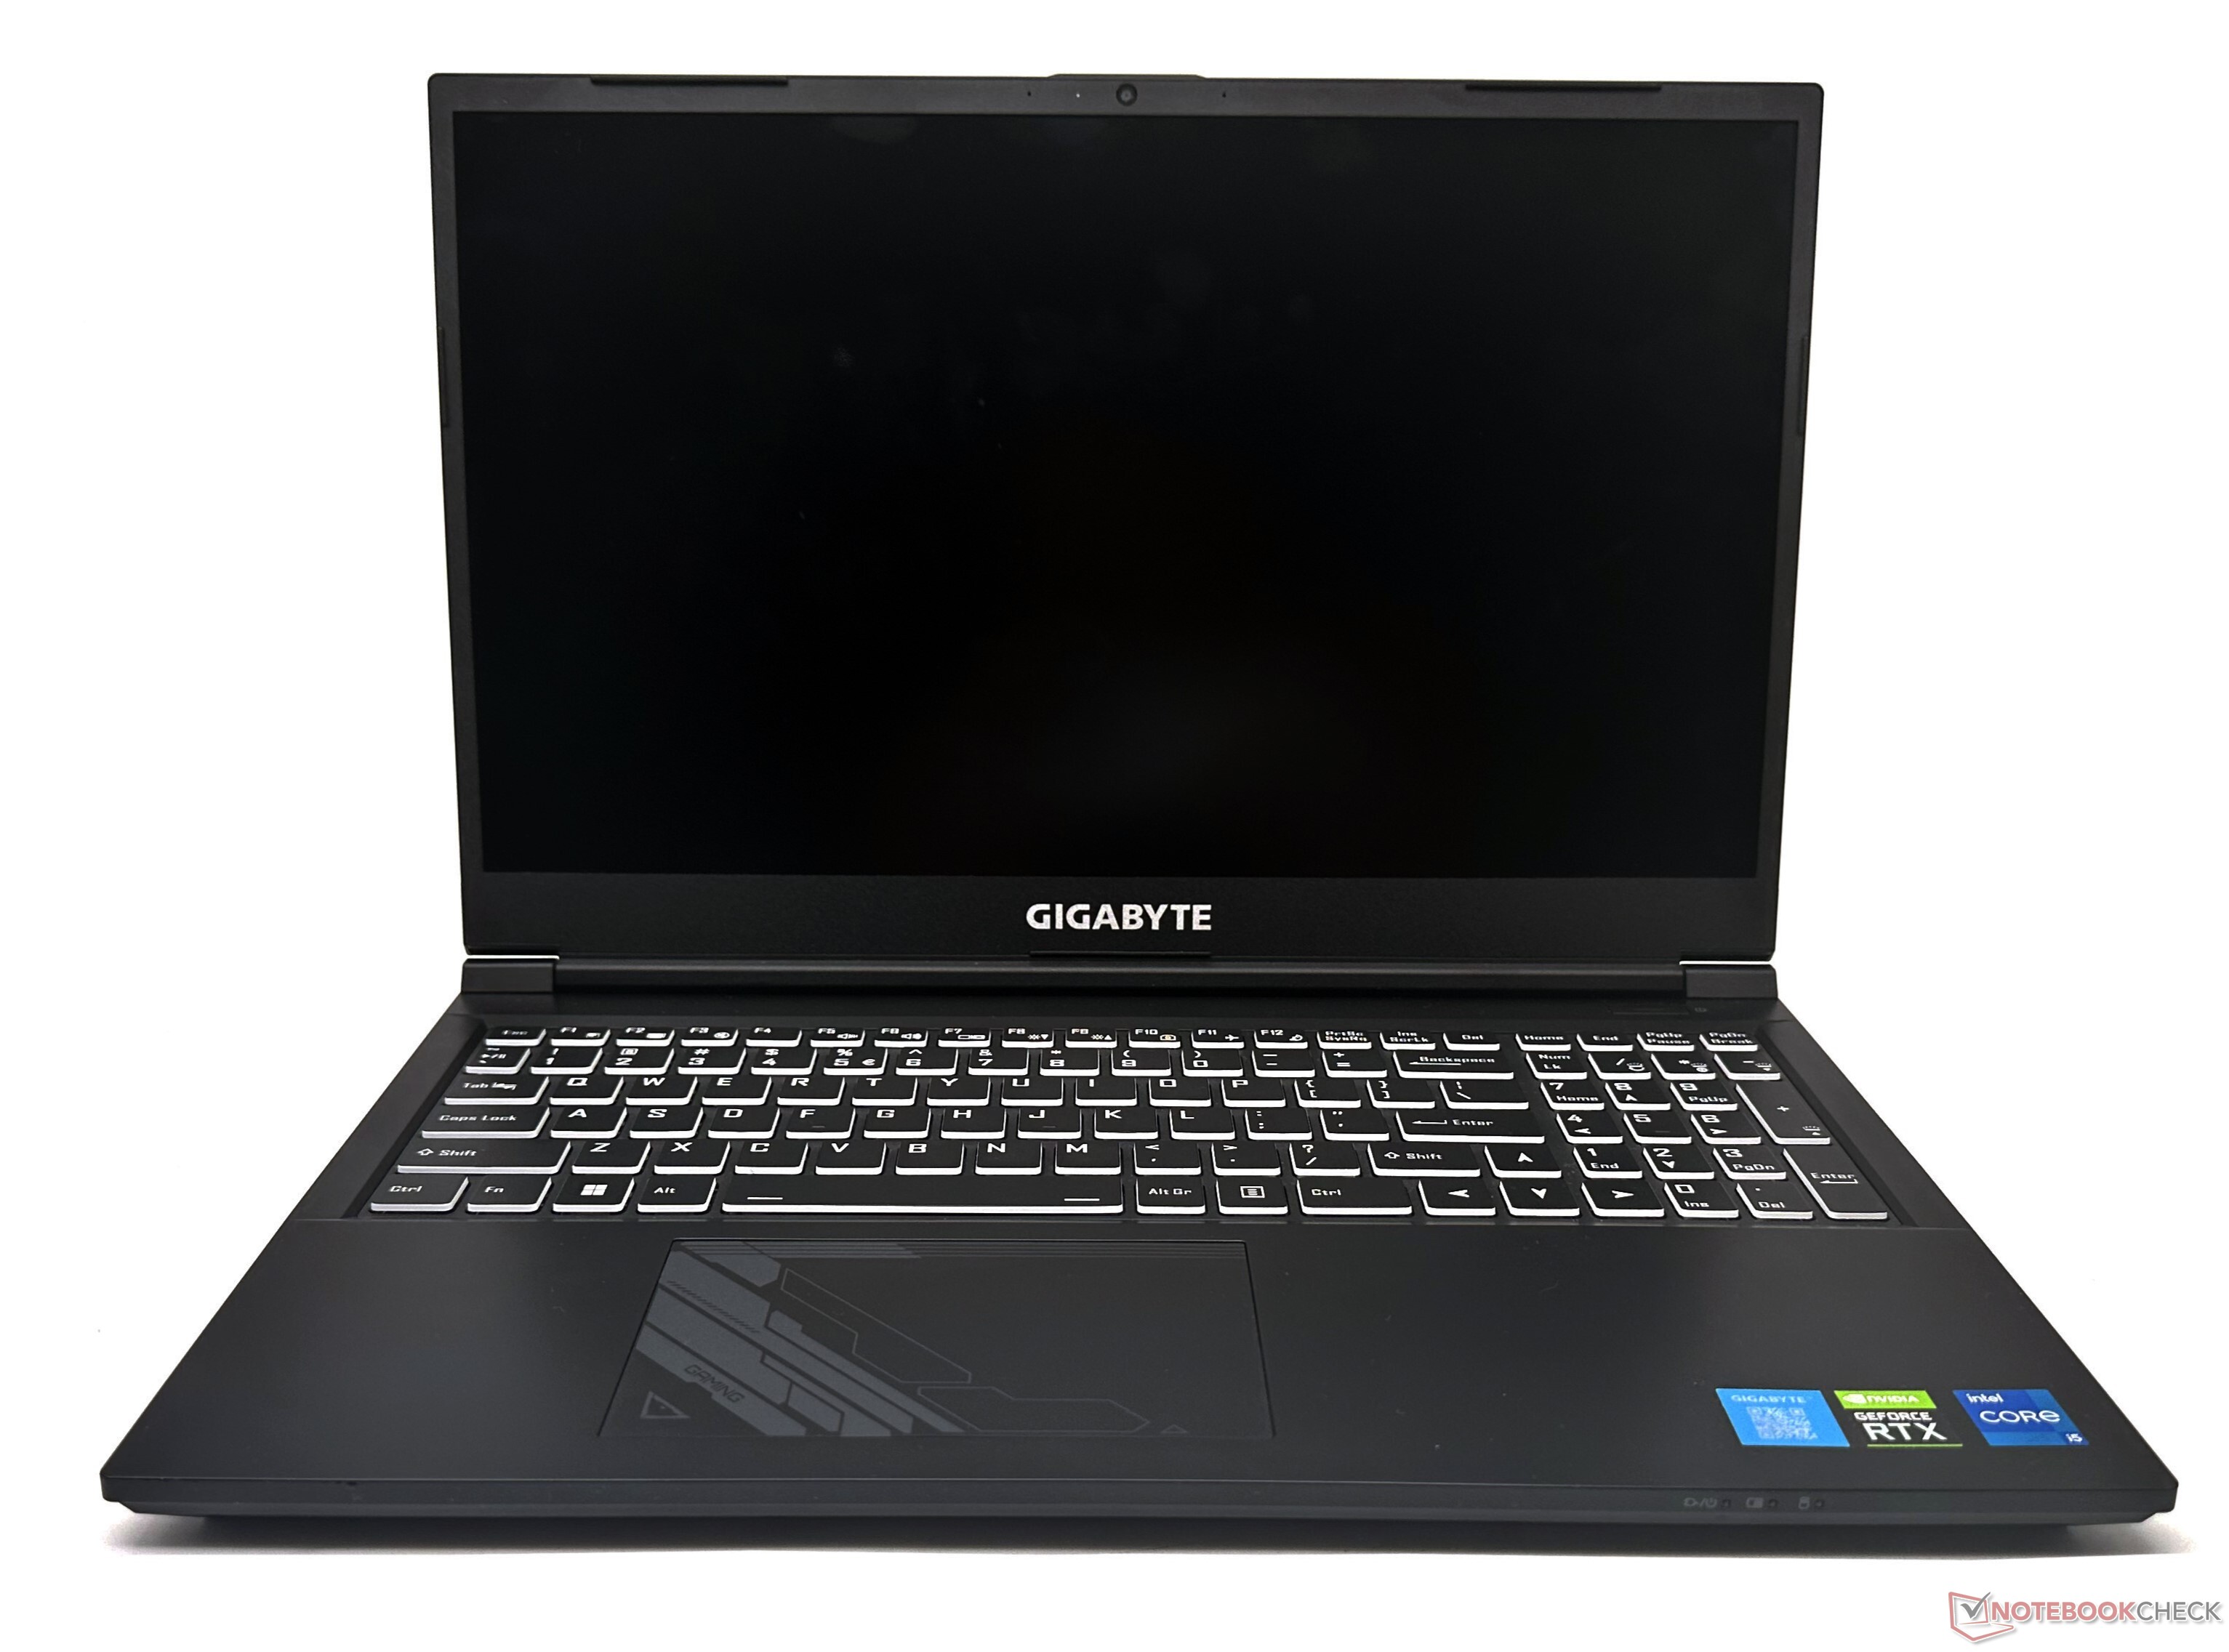
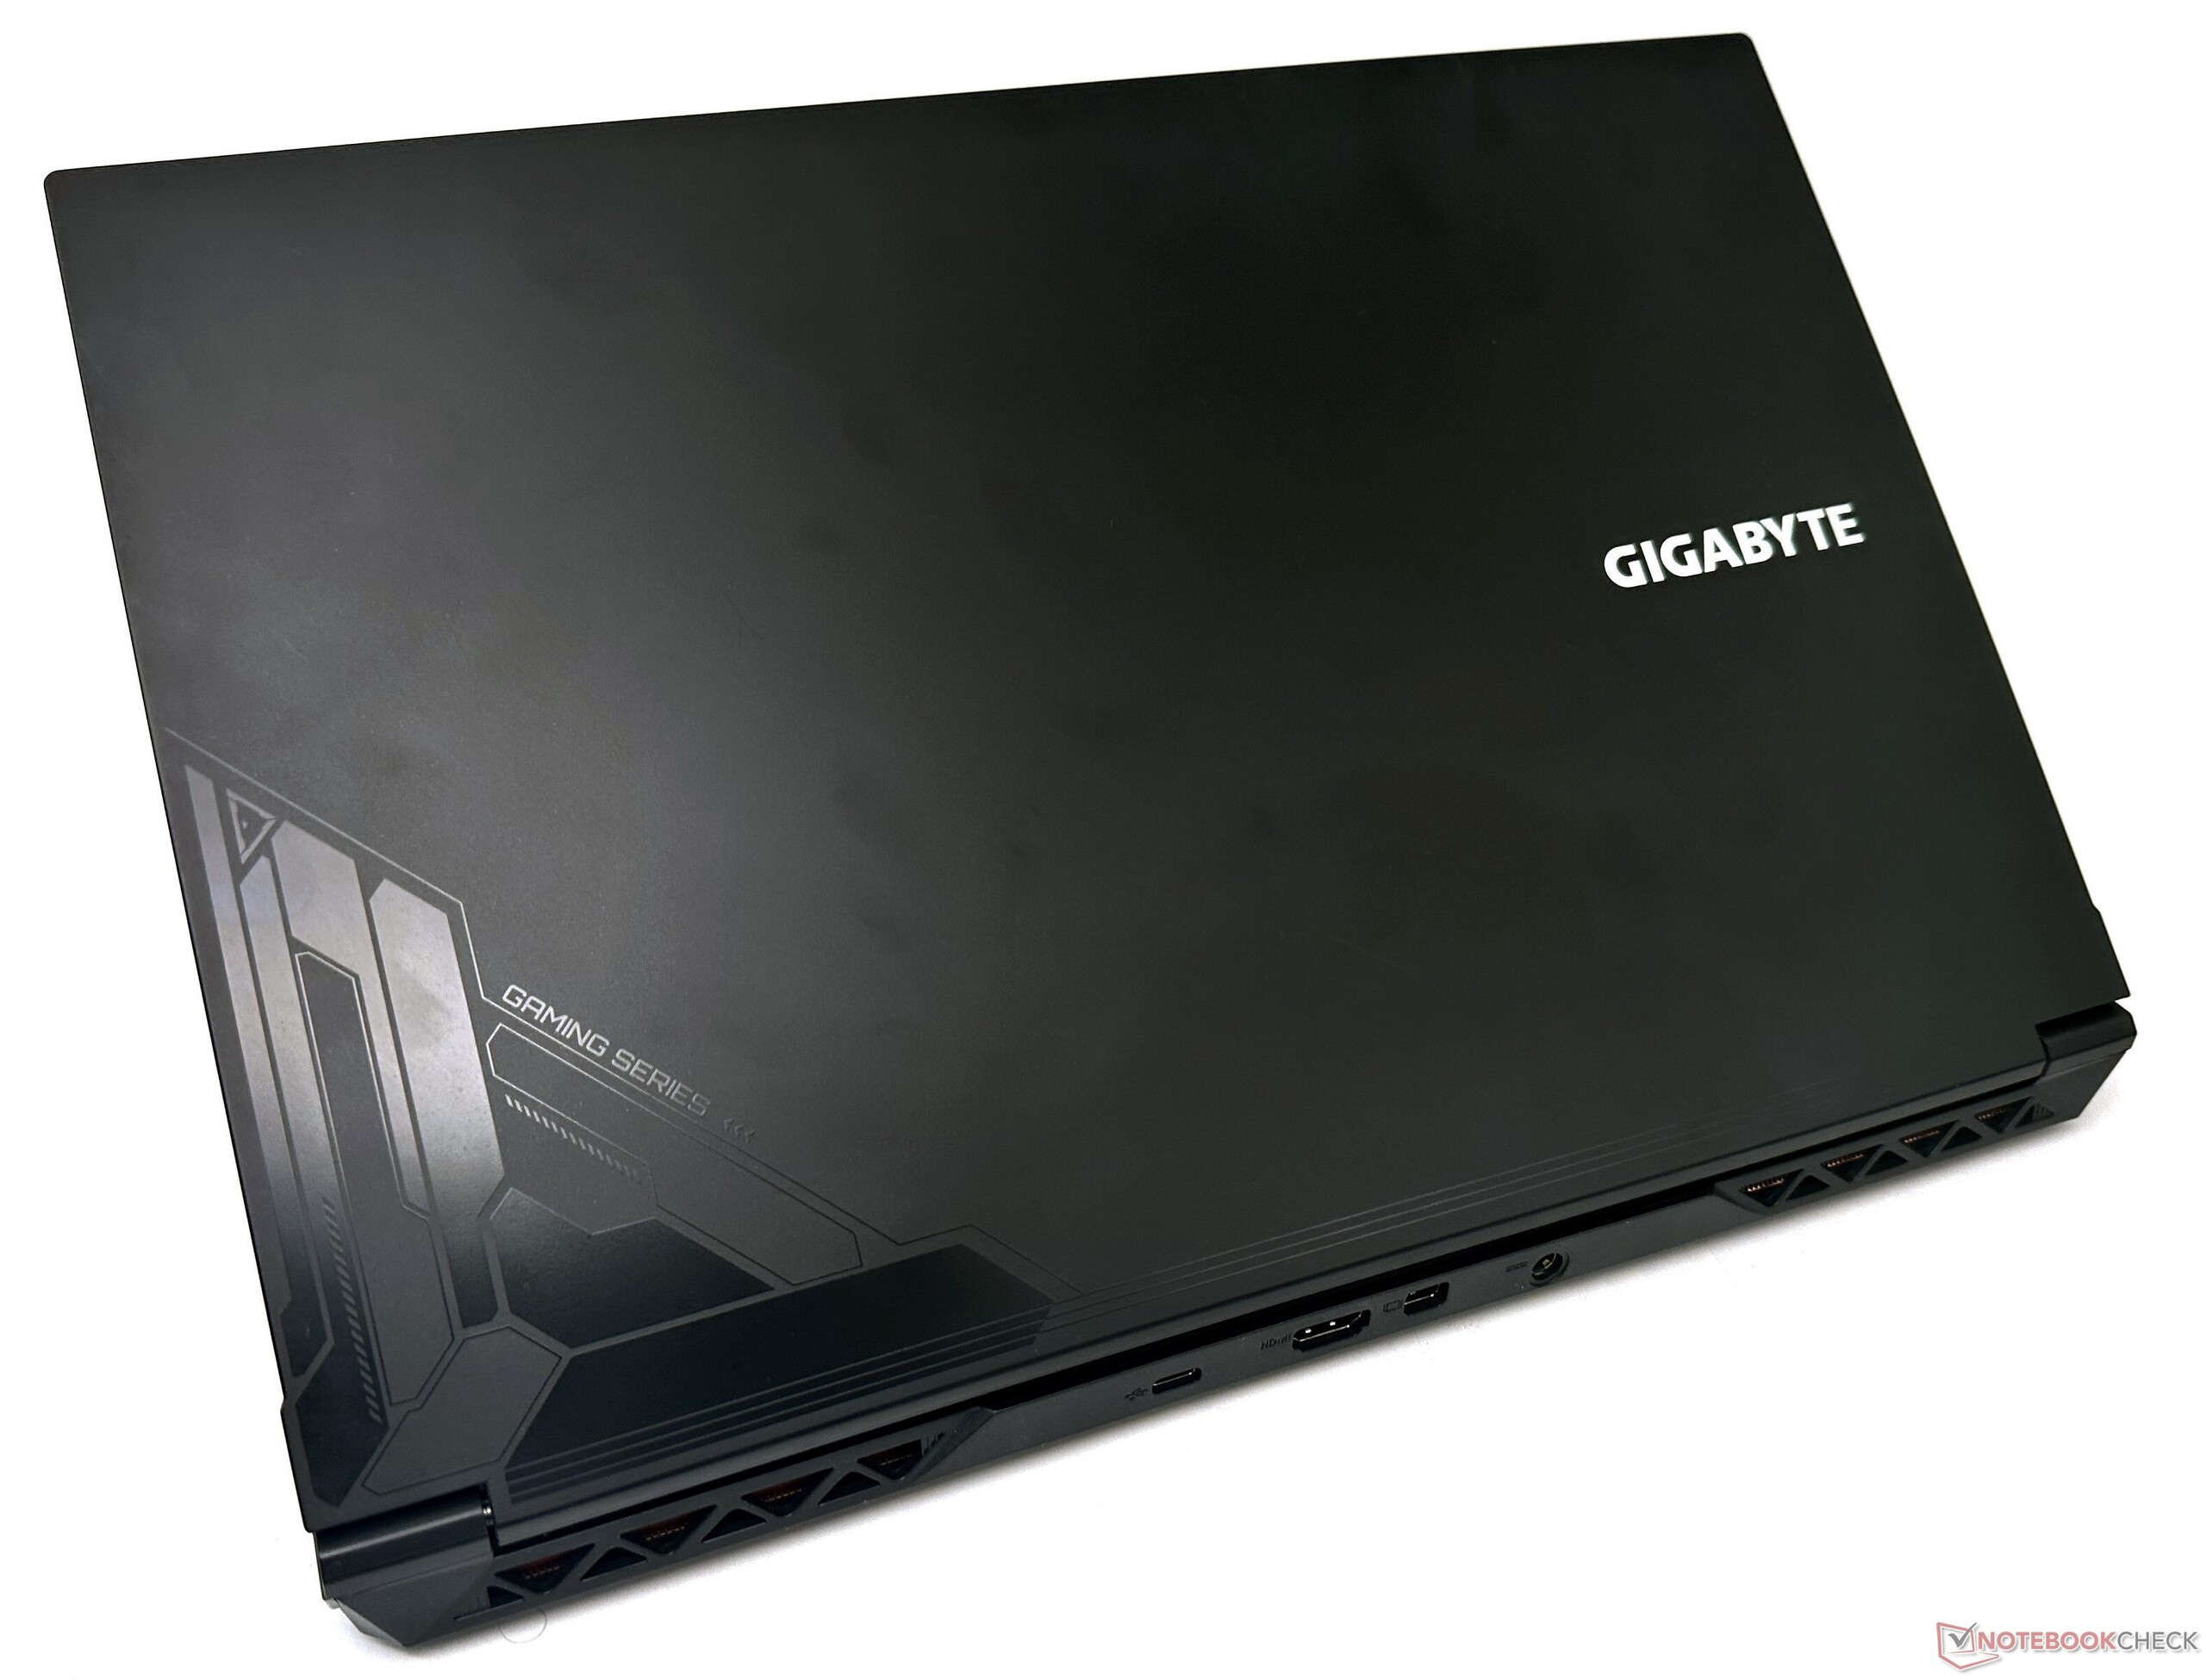
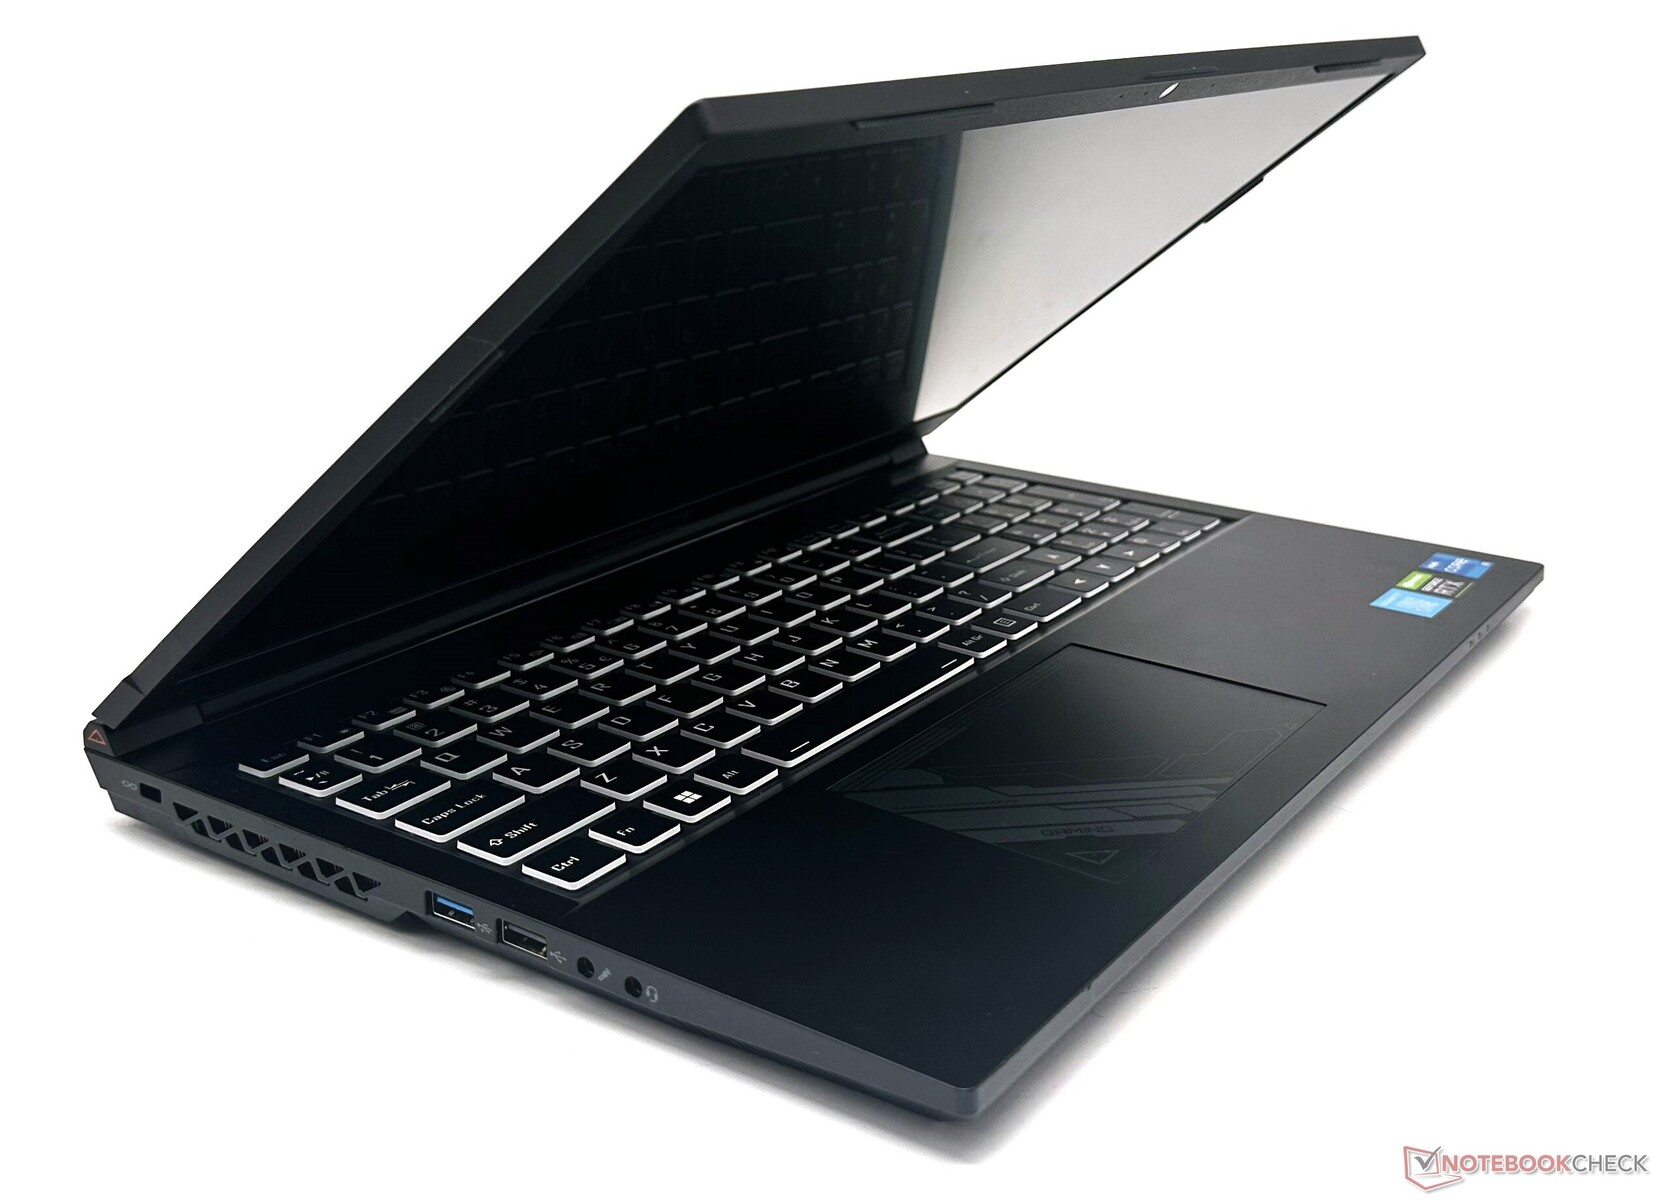
Chassi: Huvudsakligen plast med viss flexibilitet
Gigabyte G5 KE:s konstruktion är i linje med vad som förväntas i denna prisklass. Det är i huvudsak en Clevo-design som är helt i plast med släta, matta ytor med några subtila accenter på baksidan av locket och på pekplattan.
Med 23,9 mm är G5 KE:s tjocklek likvärdig med konkurrenterna i det här segmentet, samtidigt som den är betydligt tunnare än Gigabyte A5 K1.
G5 KE:s chassi är inte det mest styva som vi har sett - det finns en avsevärd böjning under tryck i tangentbordsdäcket och locket kan ge efter i vridning. Användarna kommer dock troligen inte att uppleva detta vid daglig användning.
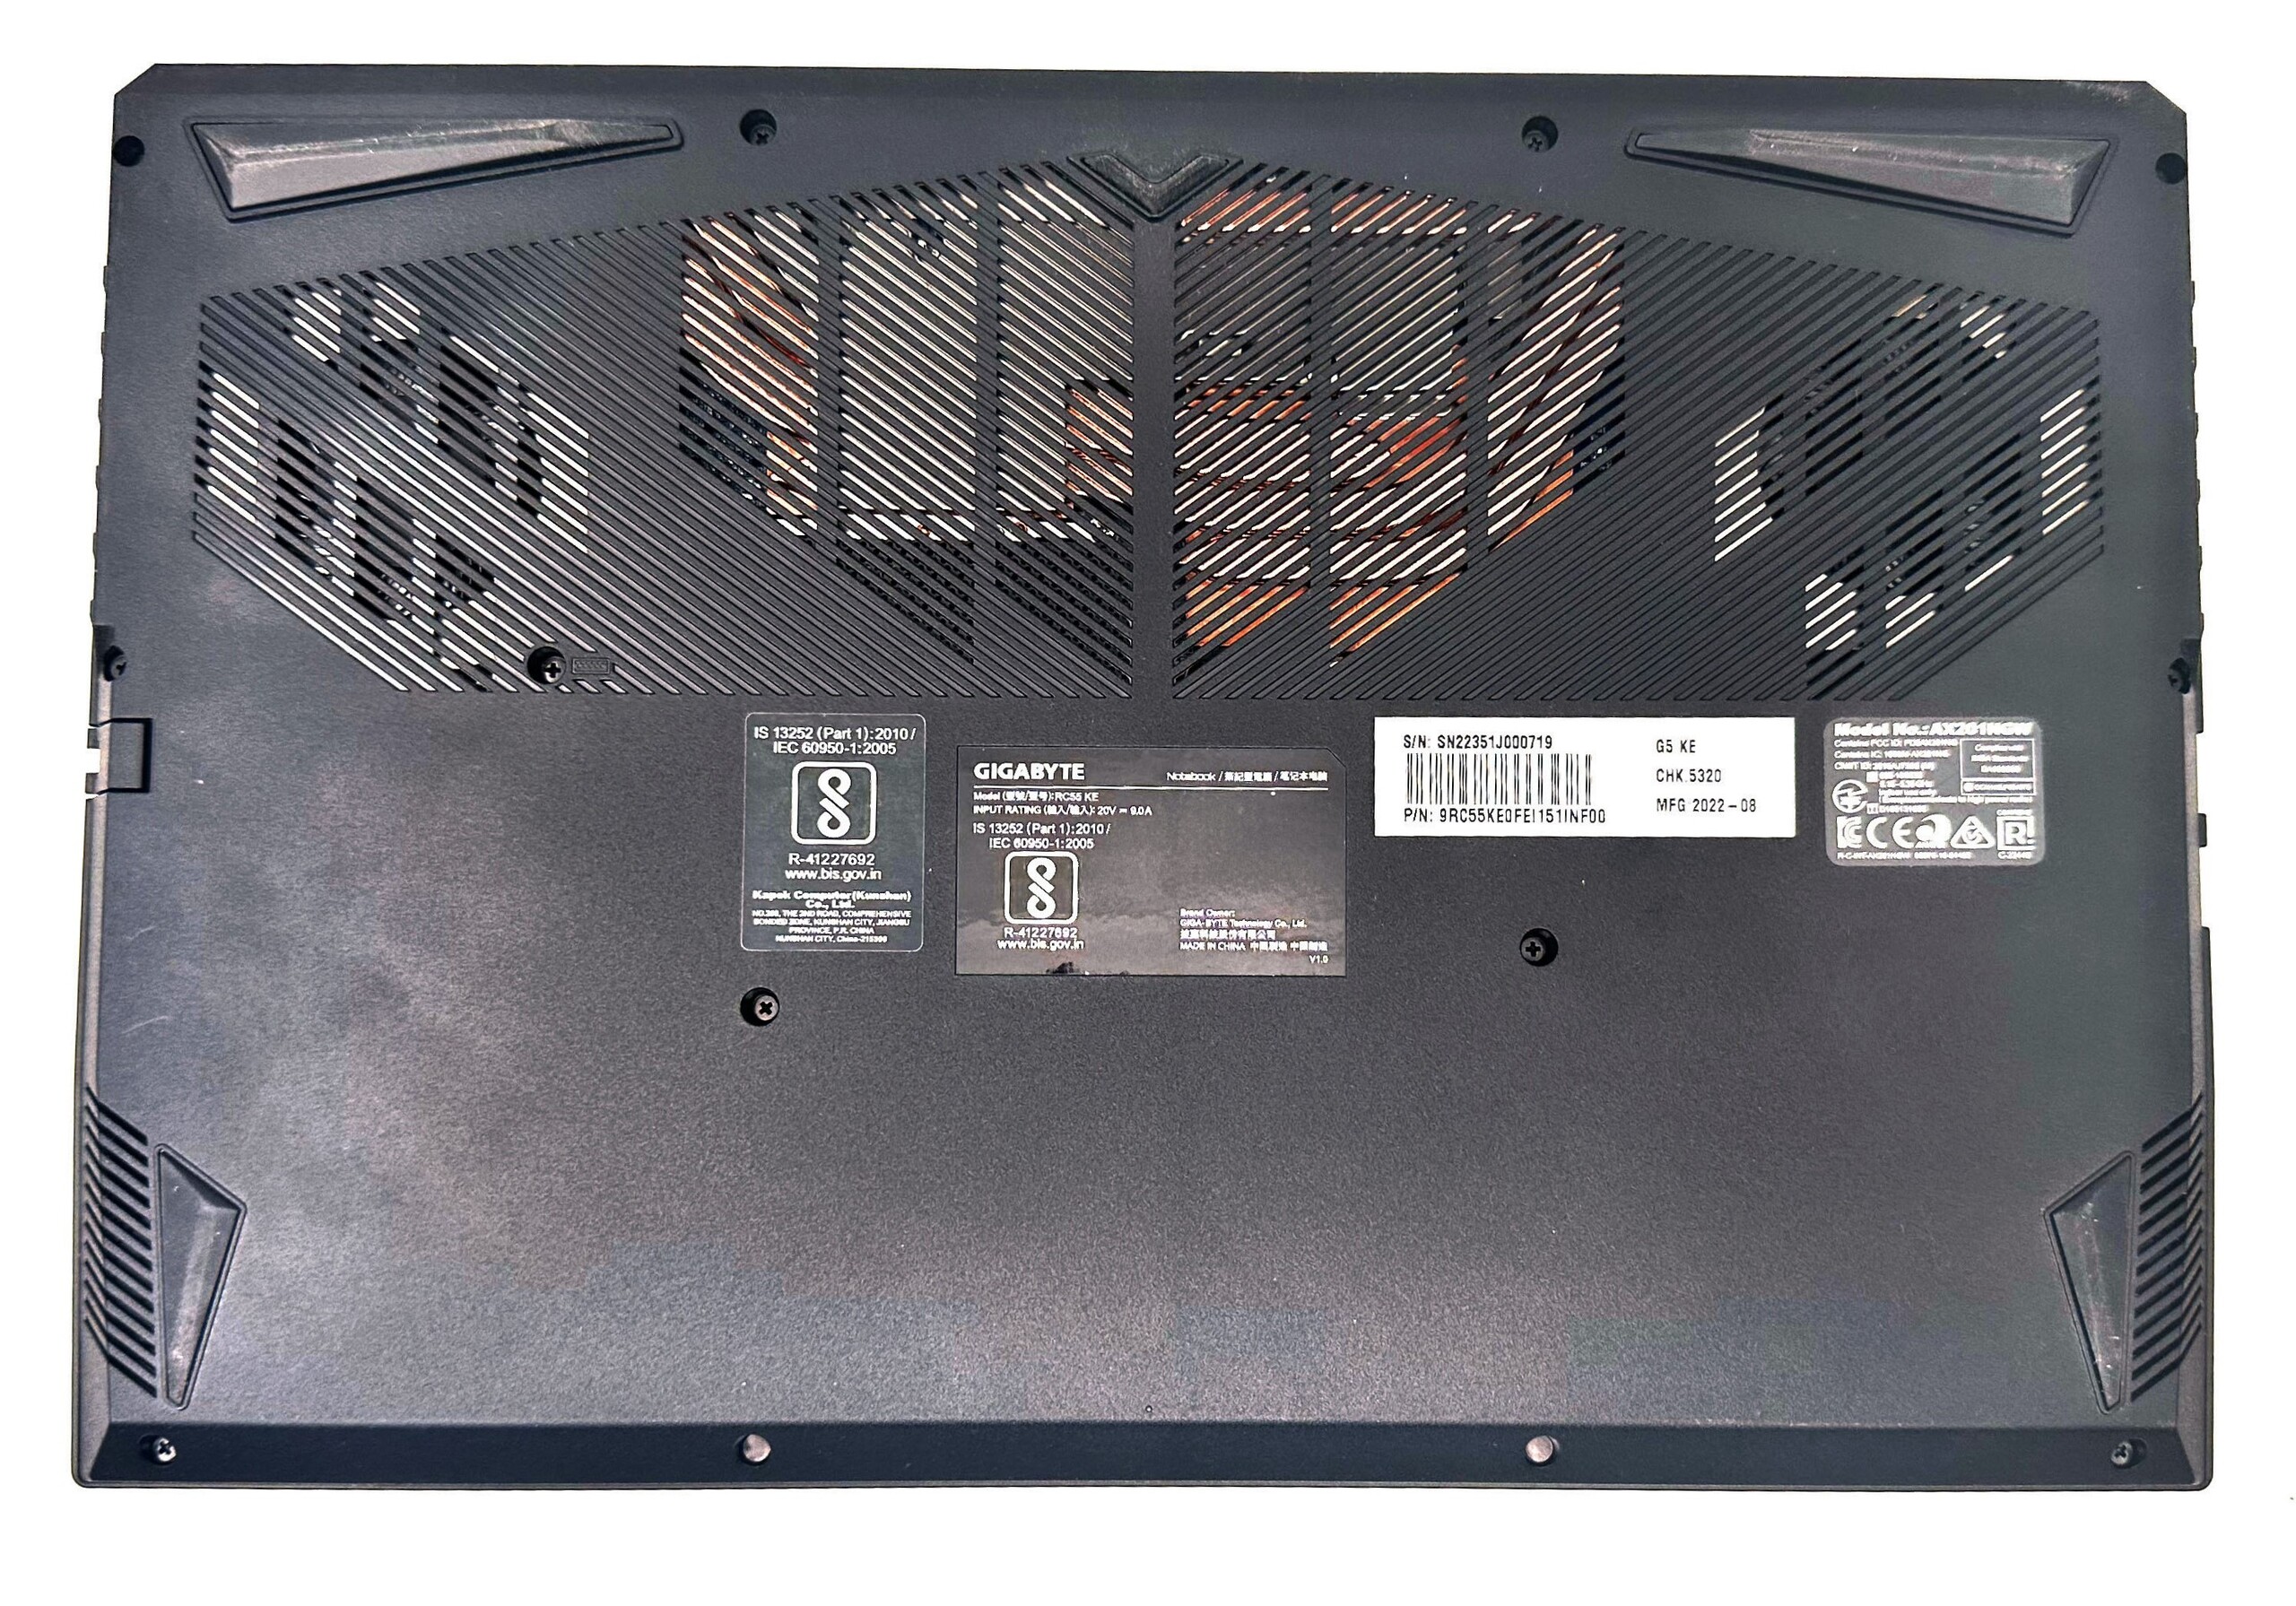
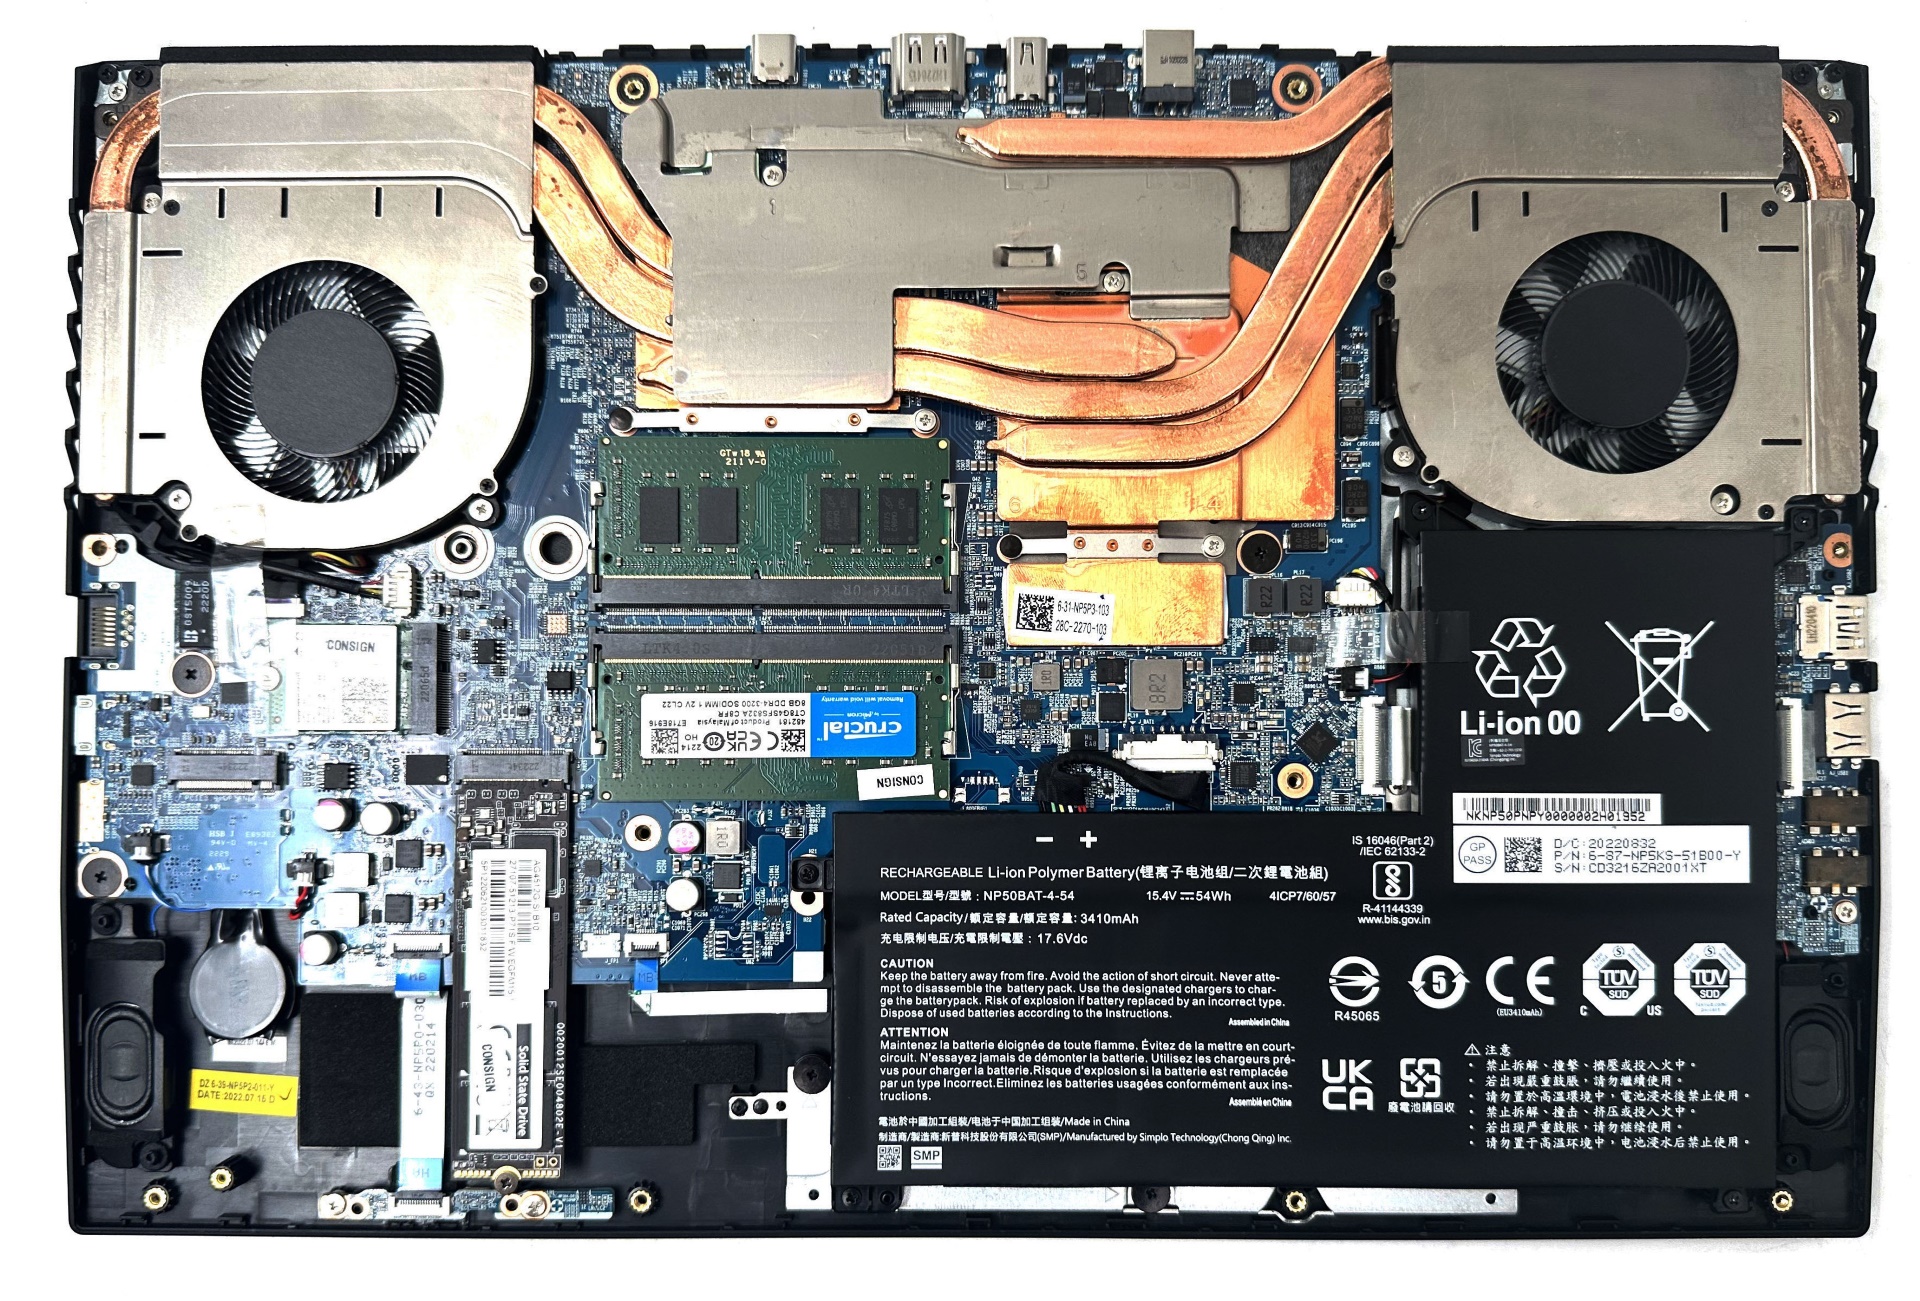
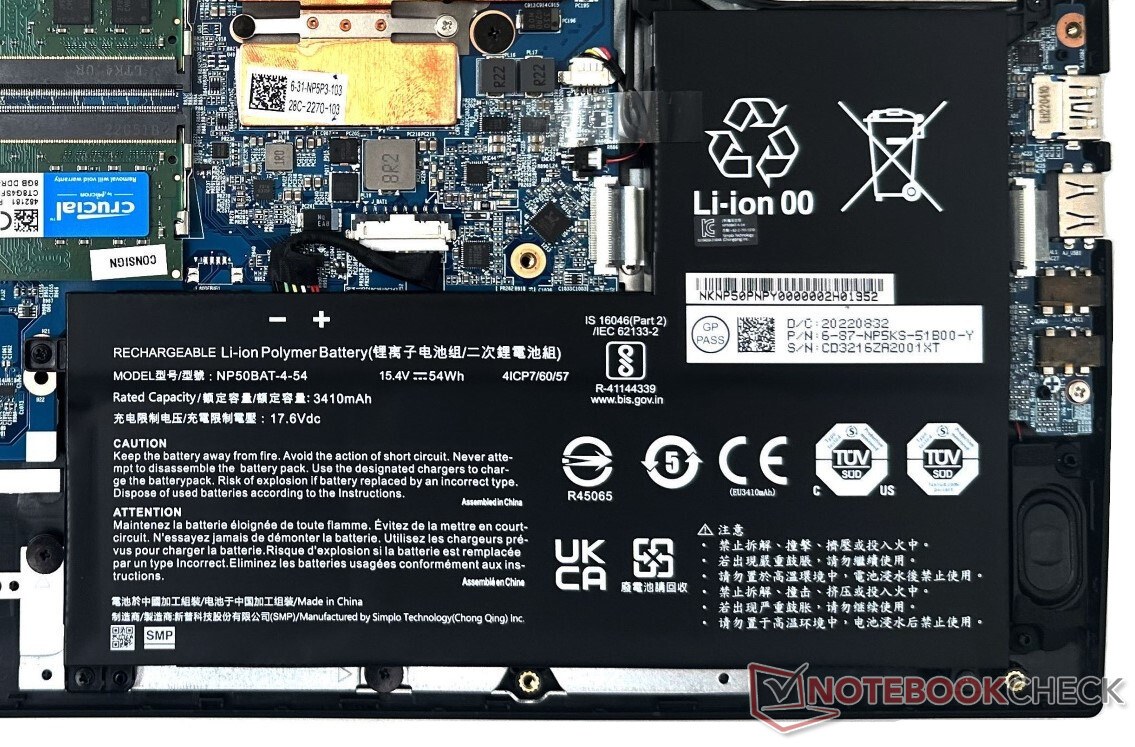
Genom att öppna de 13 Philips-skruvarna avslöjas de inre delarna. DDR4 RAM-minne, WLAN-kortet och SSD-enheterna kan bytas ut och uppgraderas vid behov.

Anslutningsmöjligheter: Adekvat val av portar och stabilt Wi-Fi
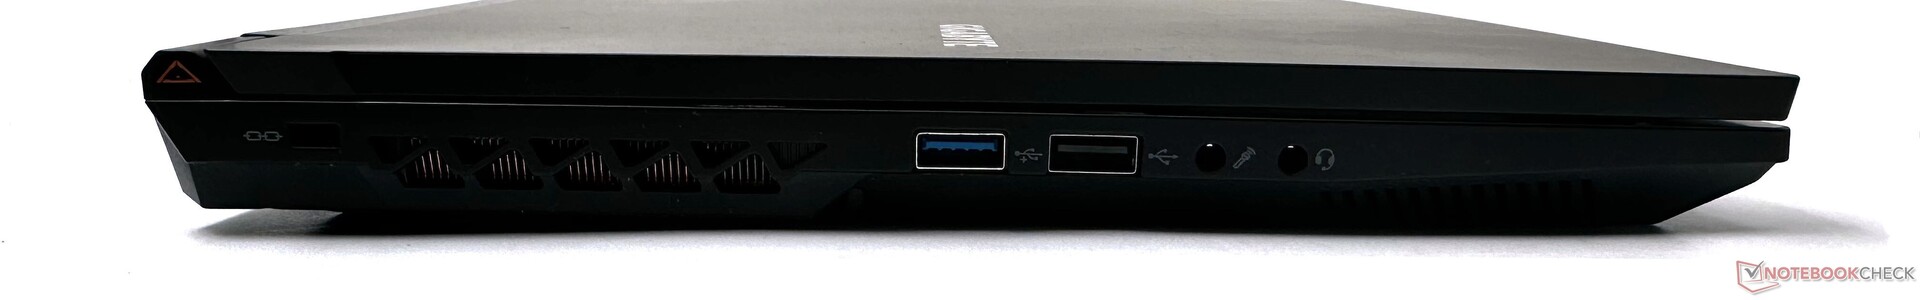
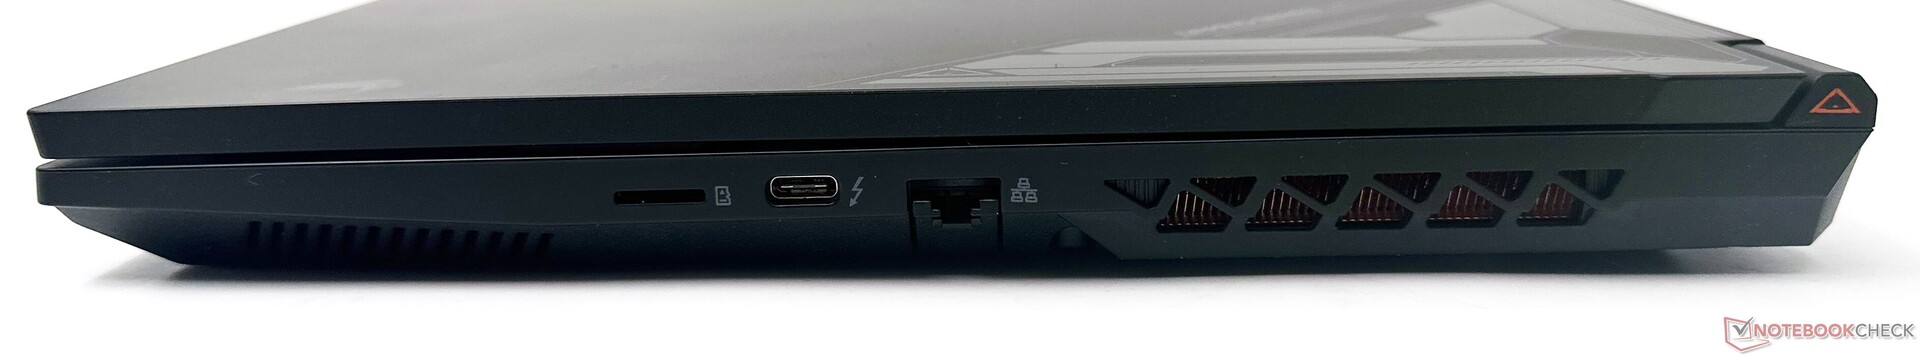
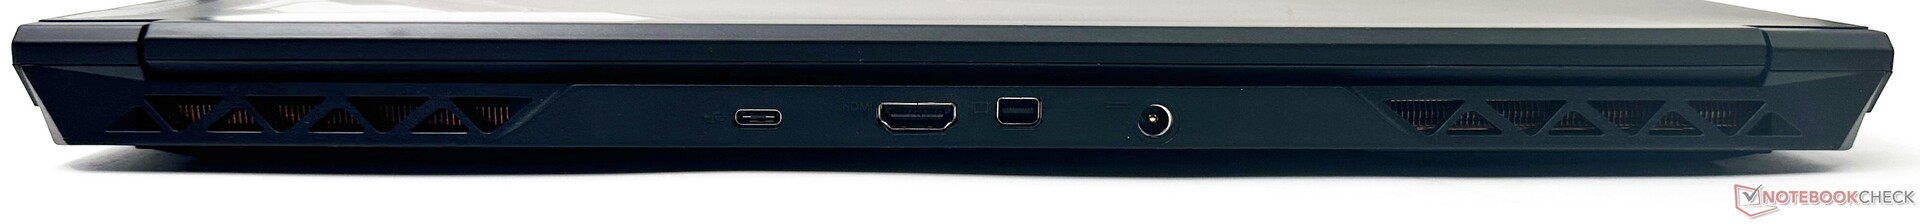
G5 KE har ett väl avrundat portval med en kombination av USB Type-A- och Type-C-portar, inklusive Thunderbolt 4. Närvaron av en mini-DisplayPort 1.4 utöver HDMI 2.1-out bidrar till enkel anslutning till 4K-skärmar med hög uppdateringsfrekvens.
Portarna utgör inget hinder när du ansluter flera enheter. En dedikerad mikrofonport - en sällsynthet nuförtiden - är praktisk för att ansluta högkvalitativa mikrofoner, eller så kan den konfigureras om för att stödja flerkanaligt ljud.
Läshastigheterna för microSD-kort kunde ha varit bättre, men G5 KE har inte mycket konkurrens i denna aspekt.
| SD Card Reader | |
| average JPG Copy Test (av. of 3 runs) | |
| Genomsnitt av klass Gaming (20.9 - 210, n=54, senaste 2 åren) | |
| Gigabyte G5 KE (AV PRO microSD 128 GB V60) | |
| Schenker XMG Core 15 (M22) (AV PRO microSD 128 GB V60) | |
| HP Victus 16-e0179ng (AV PRO microSD 128 GB V60) | |
| maximum AS SSD Seq Read Test (1GB) | |
| Genomsnitt av klass Gaming (25.5 - 261, n=51, senaste 2 åren) | |
| Gigabyte G5 KE (AV PRO microSD 128 GB V60) | |
| Gigabyte G7 KE (AV PRO microSD 128 GB V60) | |
| Schenker XMG Core 15 (M22) (AV PRO microSD 128 GB V60) | |
| HP Victus 16-e0179ng (AV PRO microSD 128 GB V60) | |
G5 KE erbjuder inte Wi-Fi 6E. Trots detta observerade vi mycket bra och ganska jämn genomströmning i 5 GHz-bandet när vi testade med vår referensrouter Asus ROG Rapture GT-AXE11000.
720p-kameran visar stora färgskillnader och bilderna saknar skärpa. Det borde ändå vara användbart för ett eller två videosamtal.


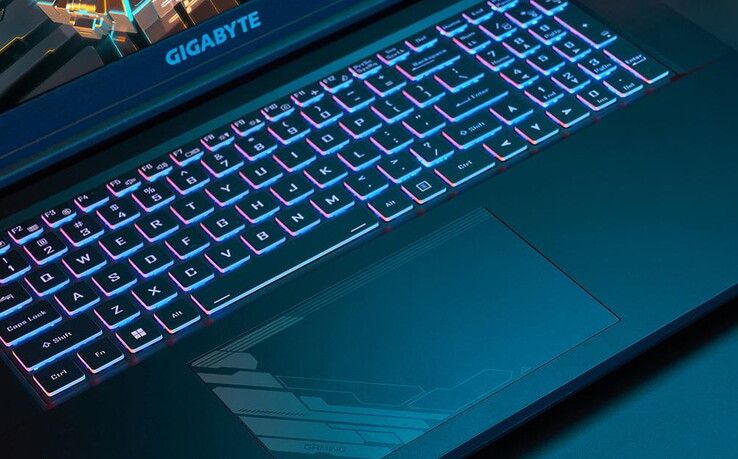
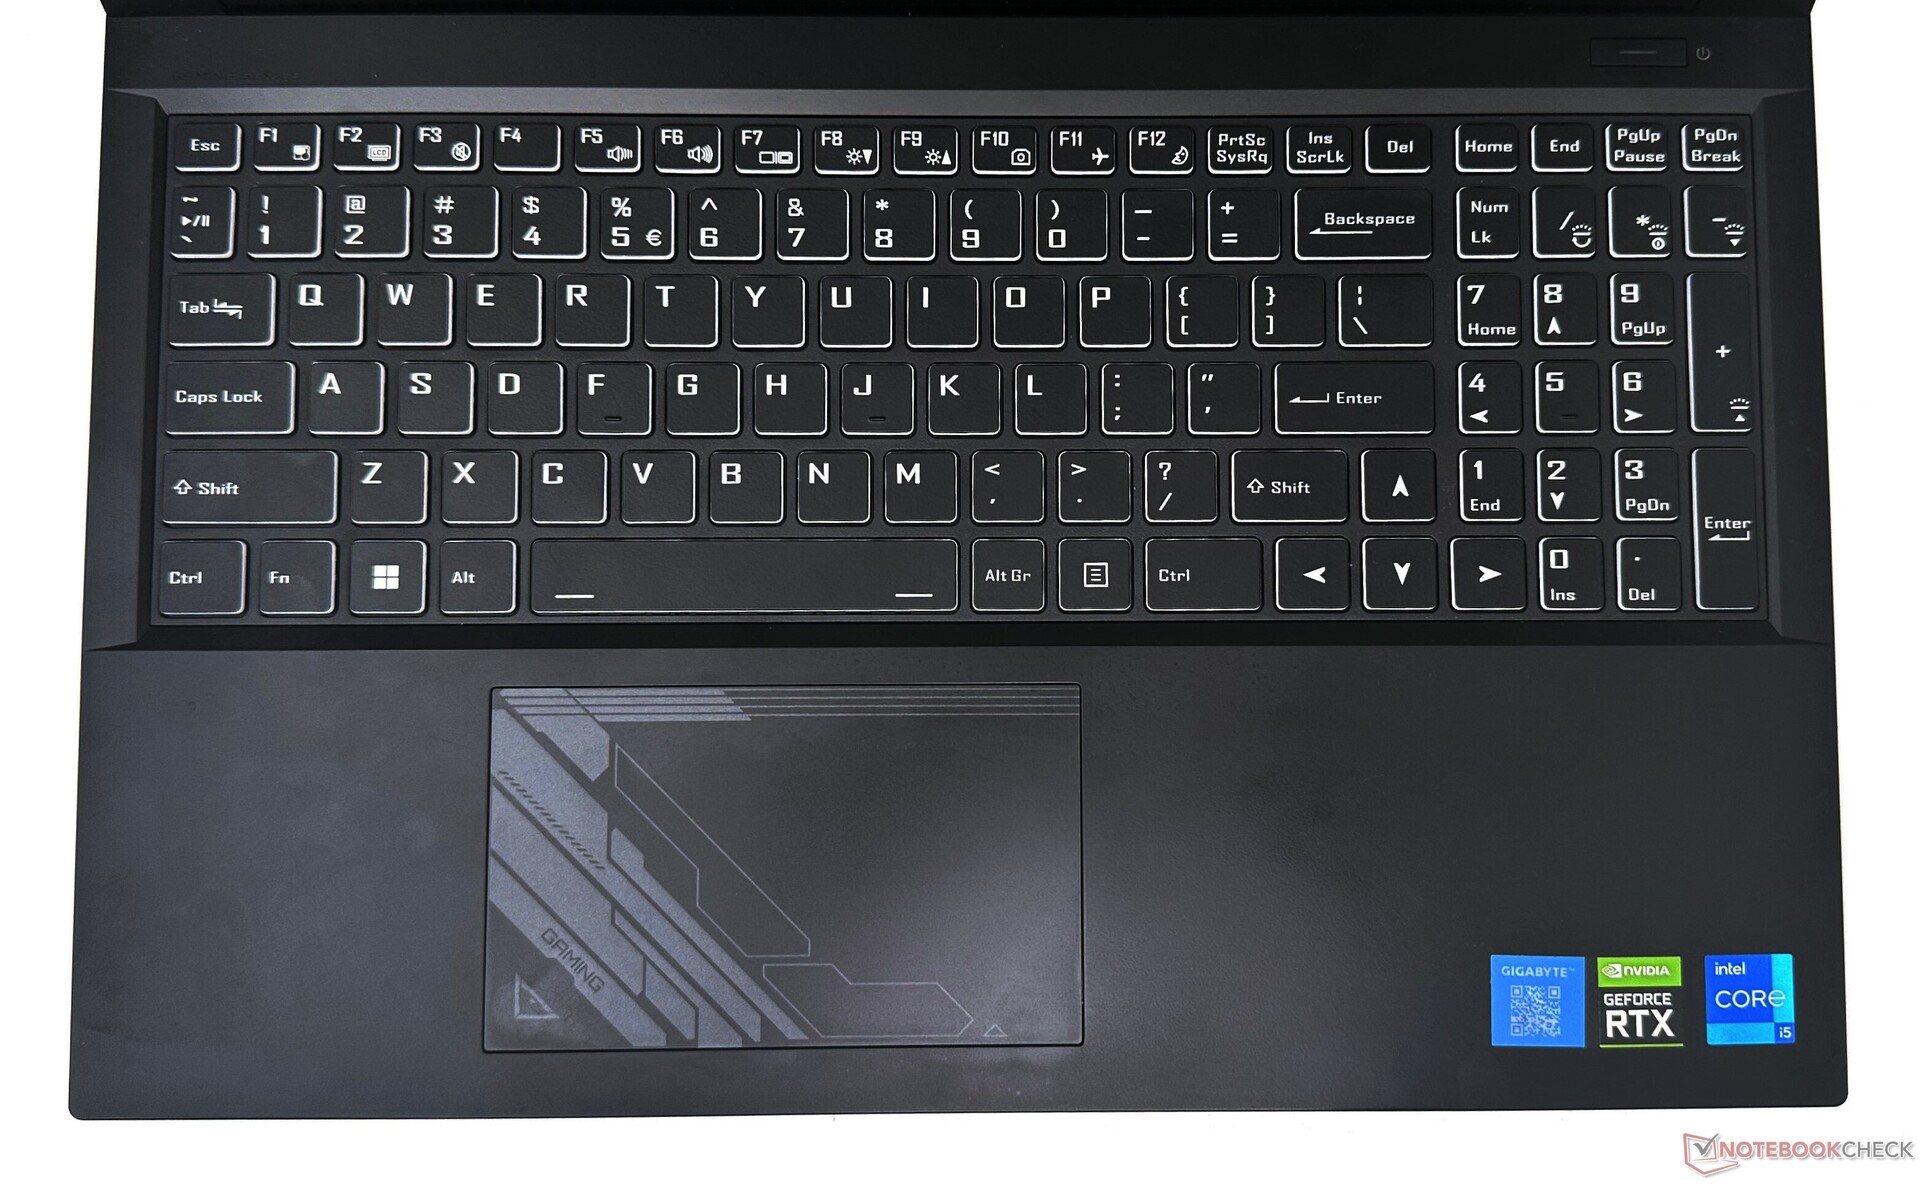
Inmatningsenheter: Fullstora piltangenter
Chiclet-tangentbordet har en bra rörlighet och aktivering. Skrivandet känns dock lite svampigt och den taktila återkopplingen är lite bristfällig. Piltangenterna i full storlek gör det möjligt att navigera bekvämt i dokument och kalkylblad.
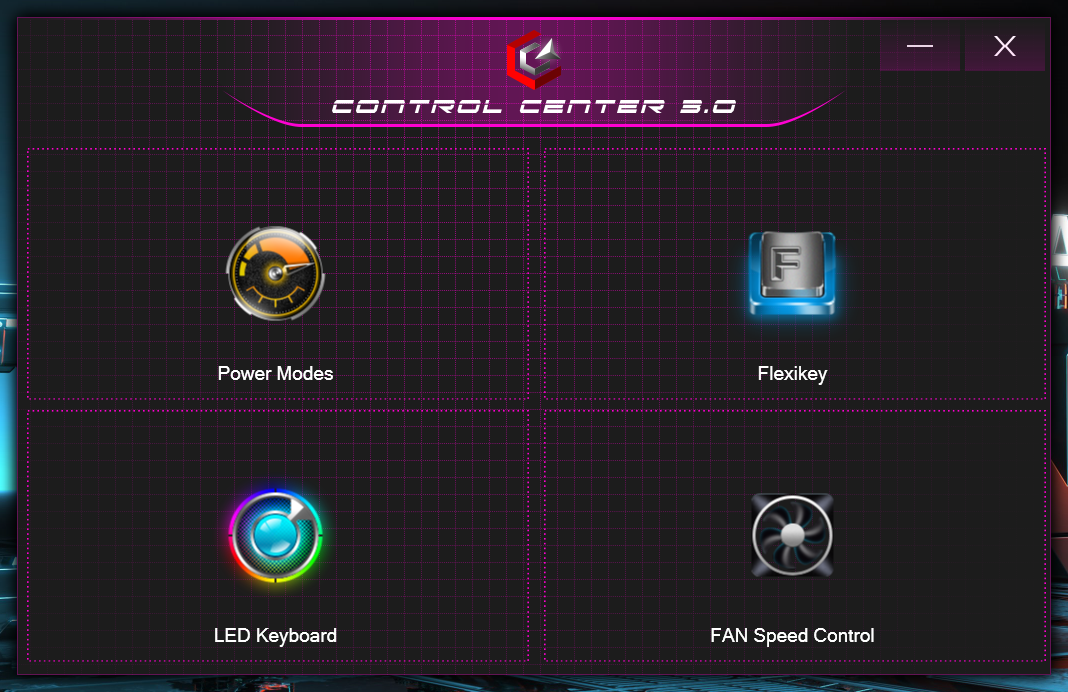
RGB-bakgrundsbelysningen kan justeras i fyra steg. Det här är inte ett RGB-tangentbord med flera zoner, men viss anpassning är möjlig via programvaran Control Center 3.0.
Pekplattan på 12 cm x 7,5 cm är tillräckligt rymlig, stöder Windows Precision -gester och ger en bra glidupplevelse med minimalt motstånd. Hela ytan fungerar som en vänster musknapp. Klickarna har kort resväg och god taktilitet.
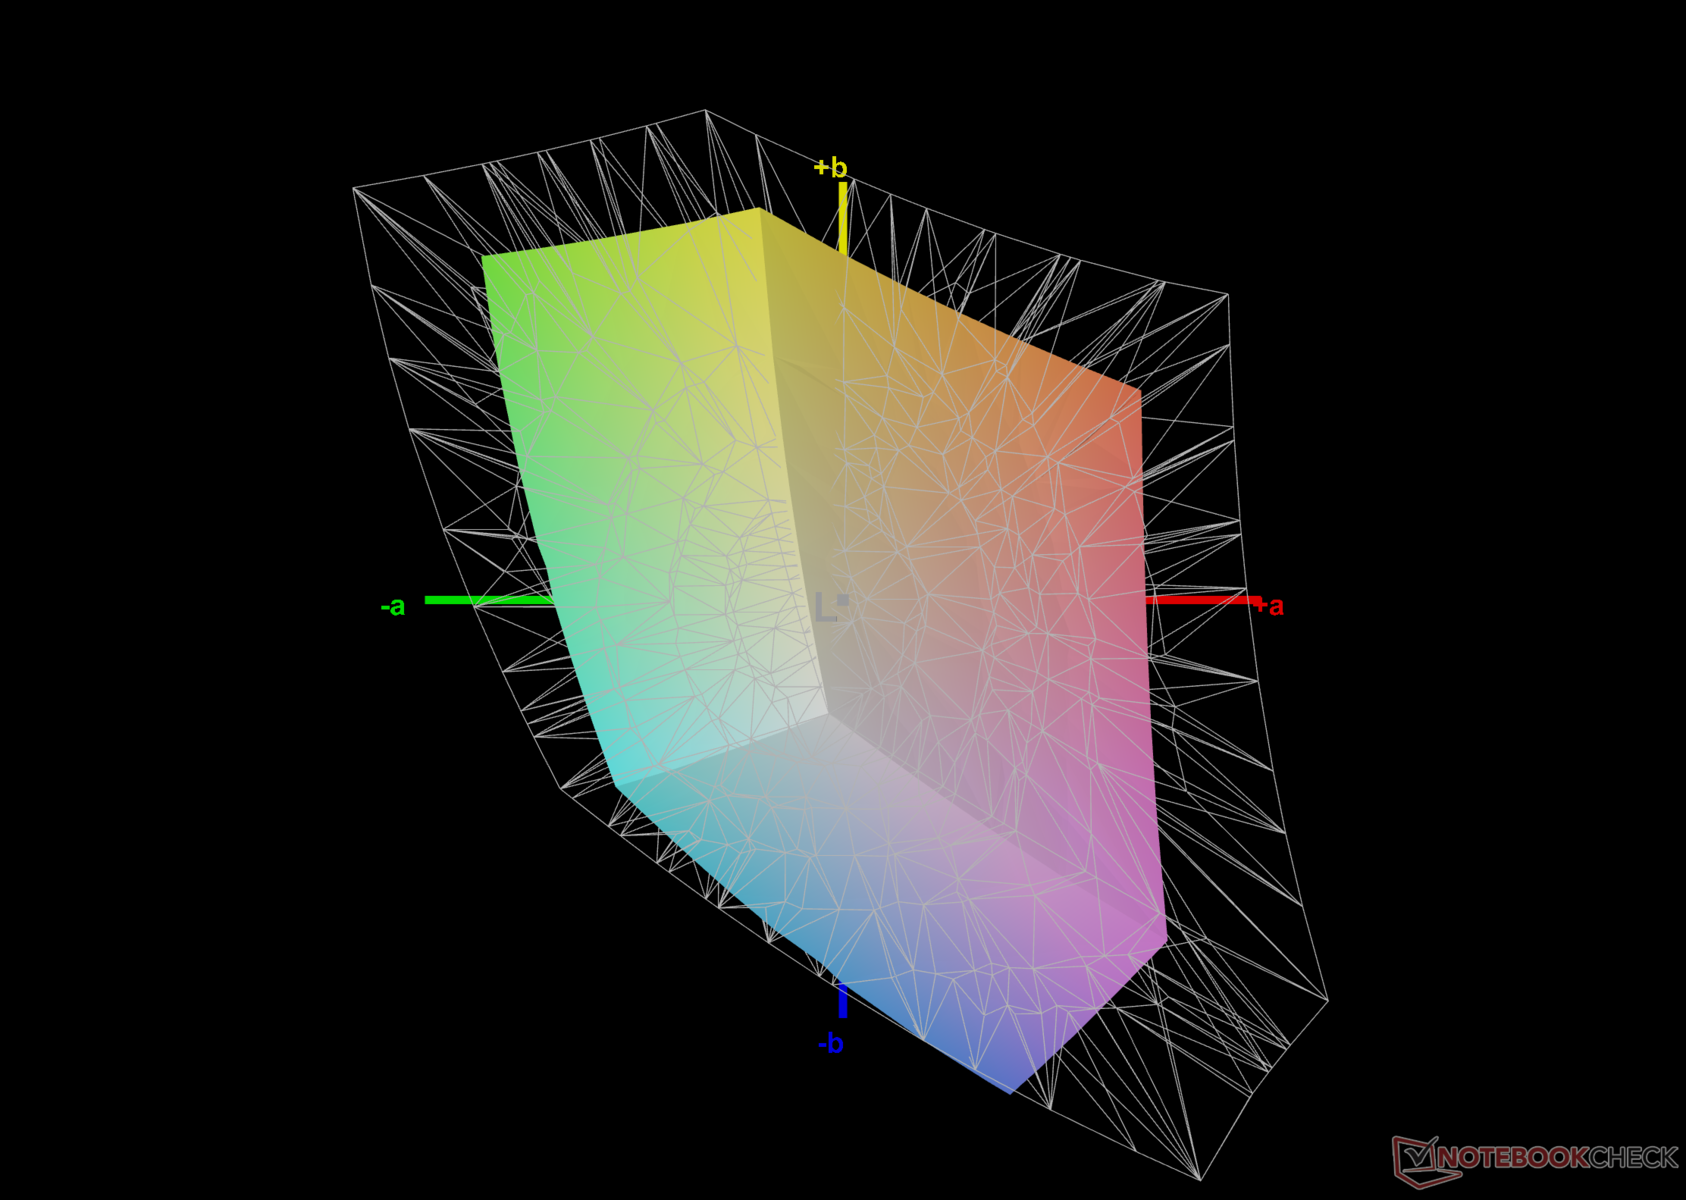
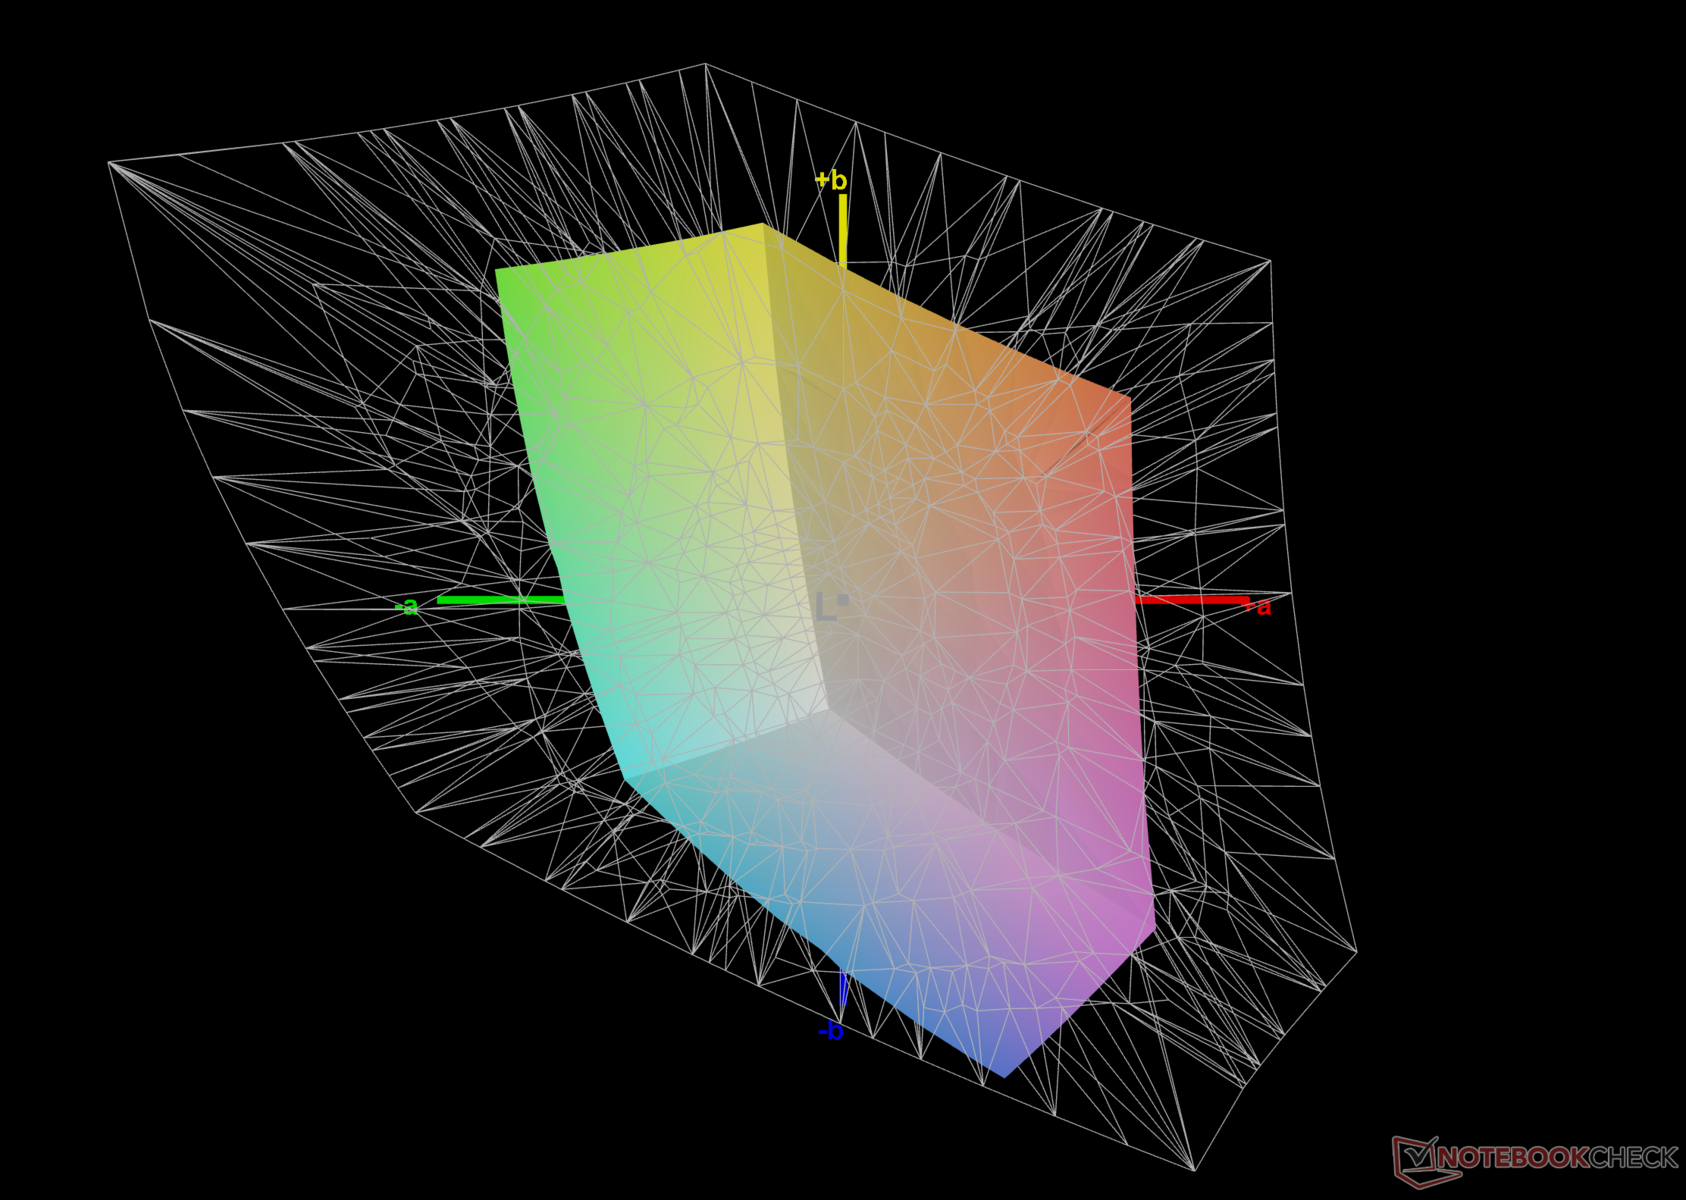
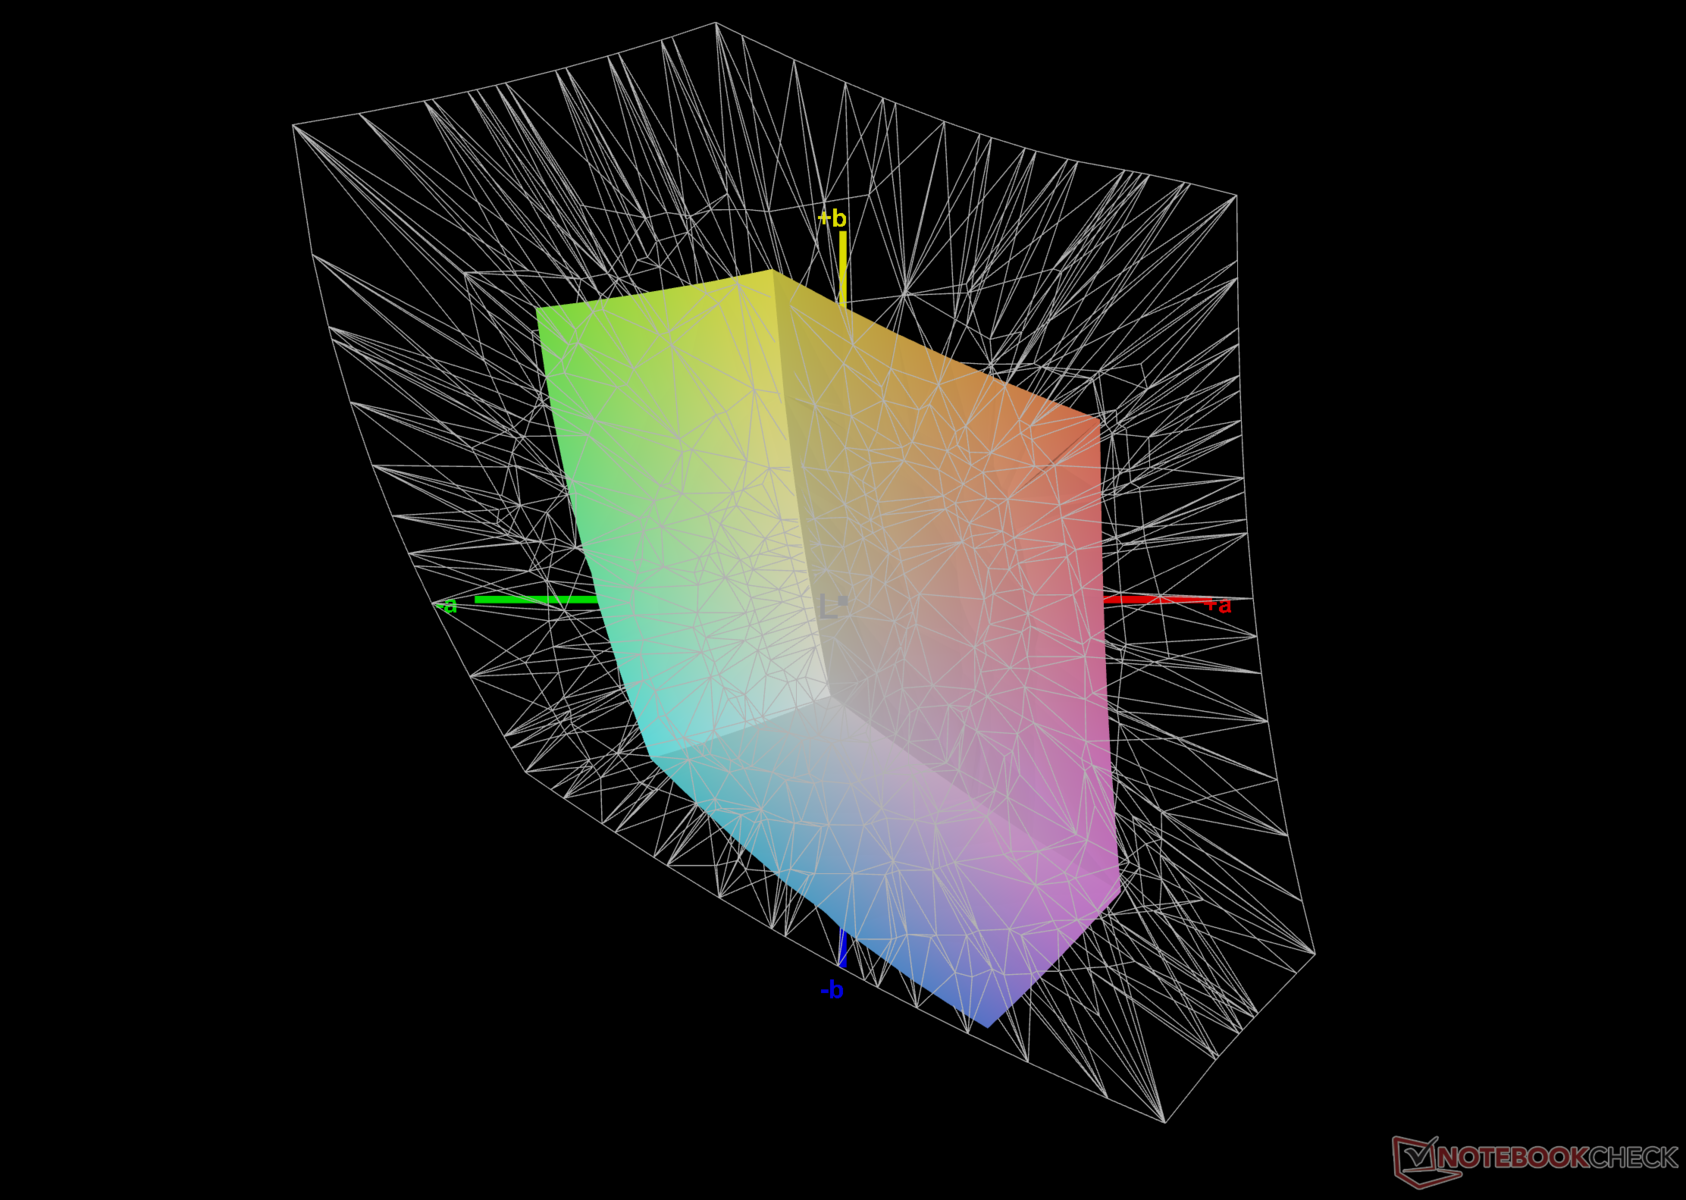
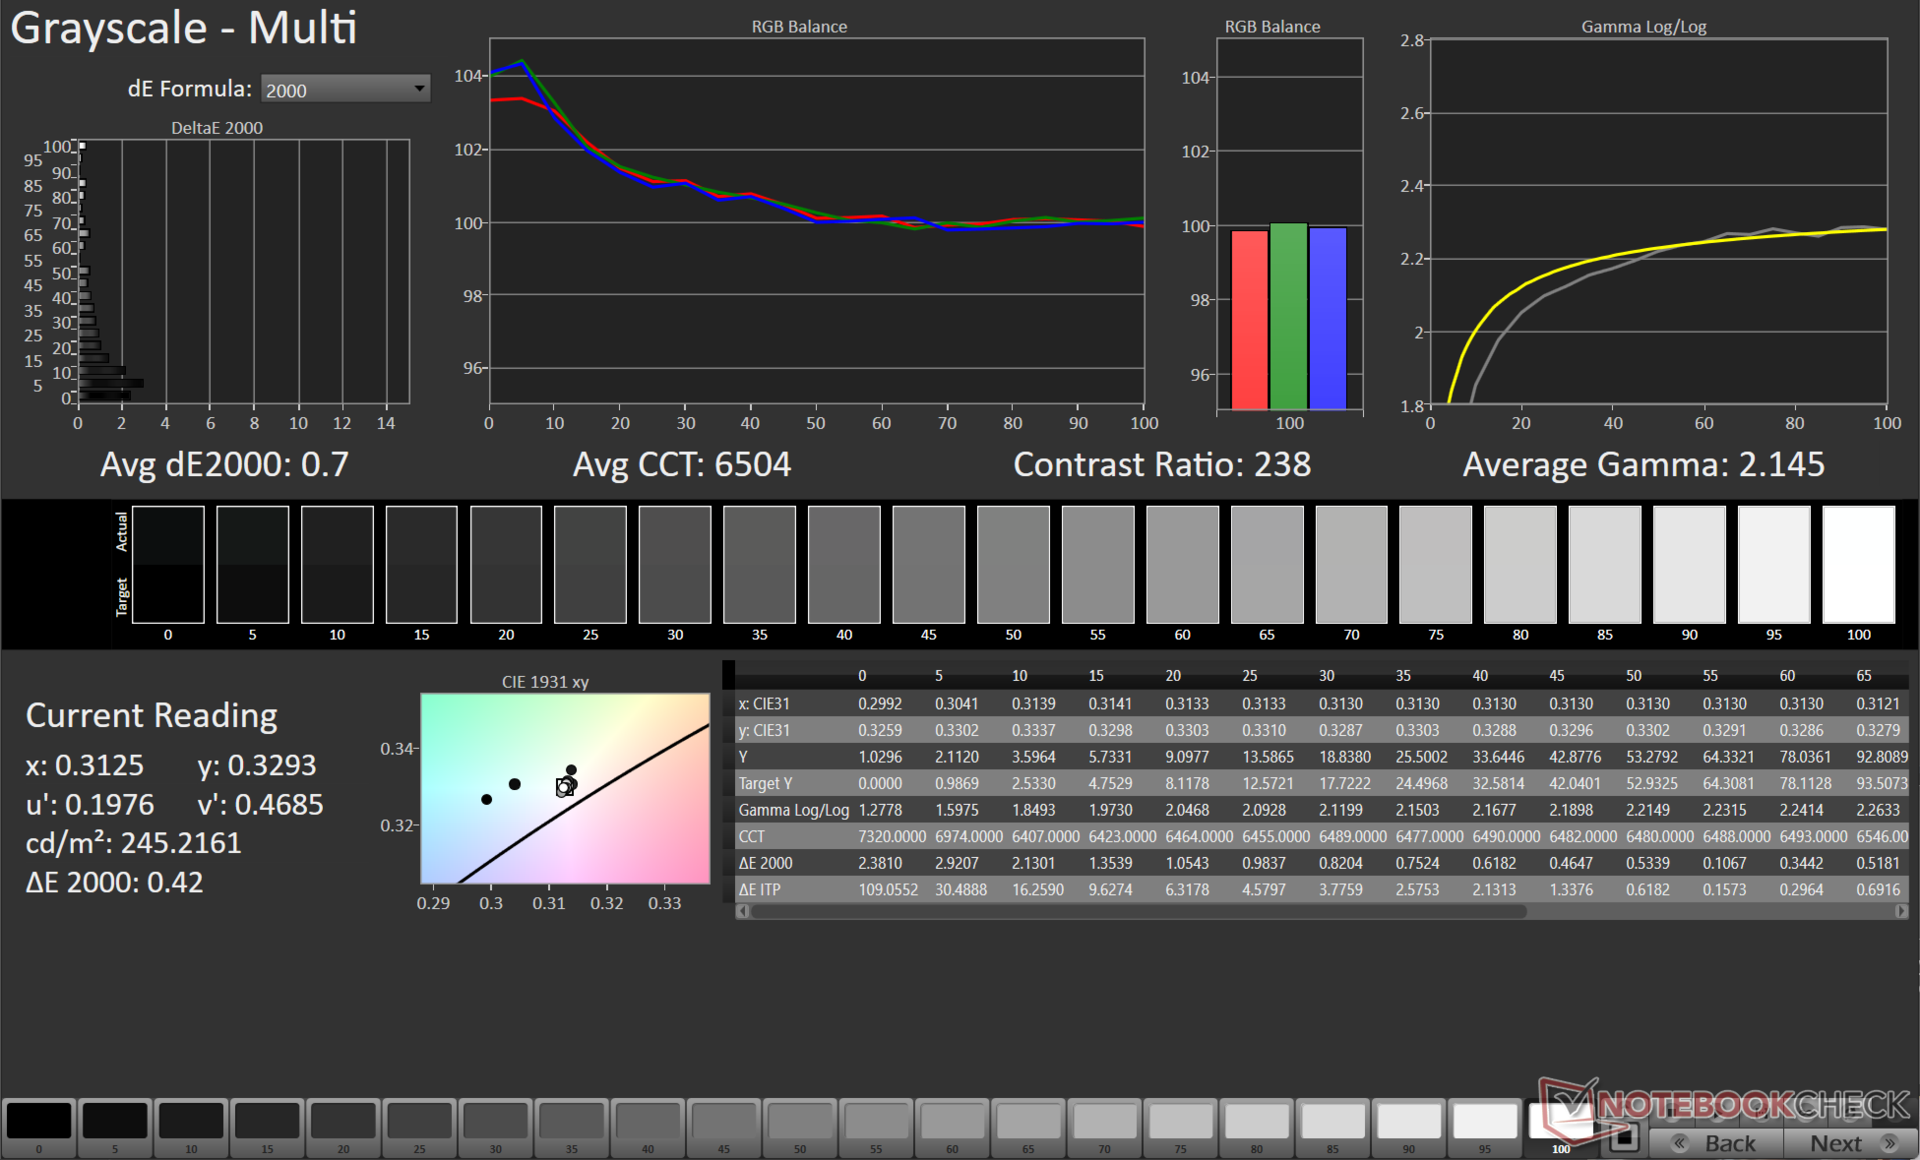
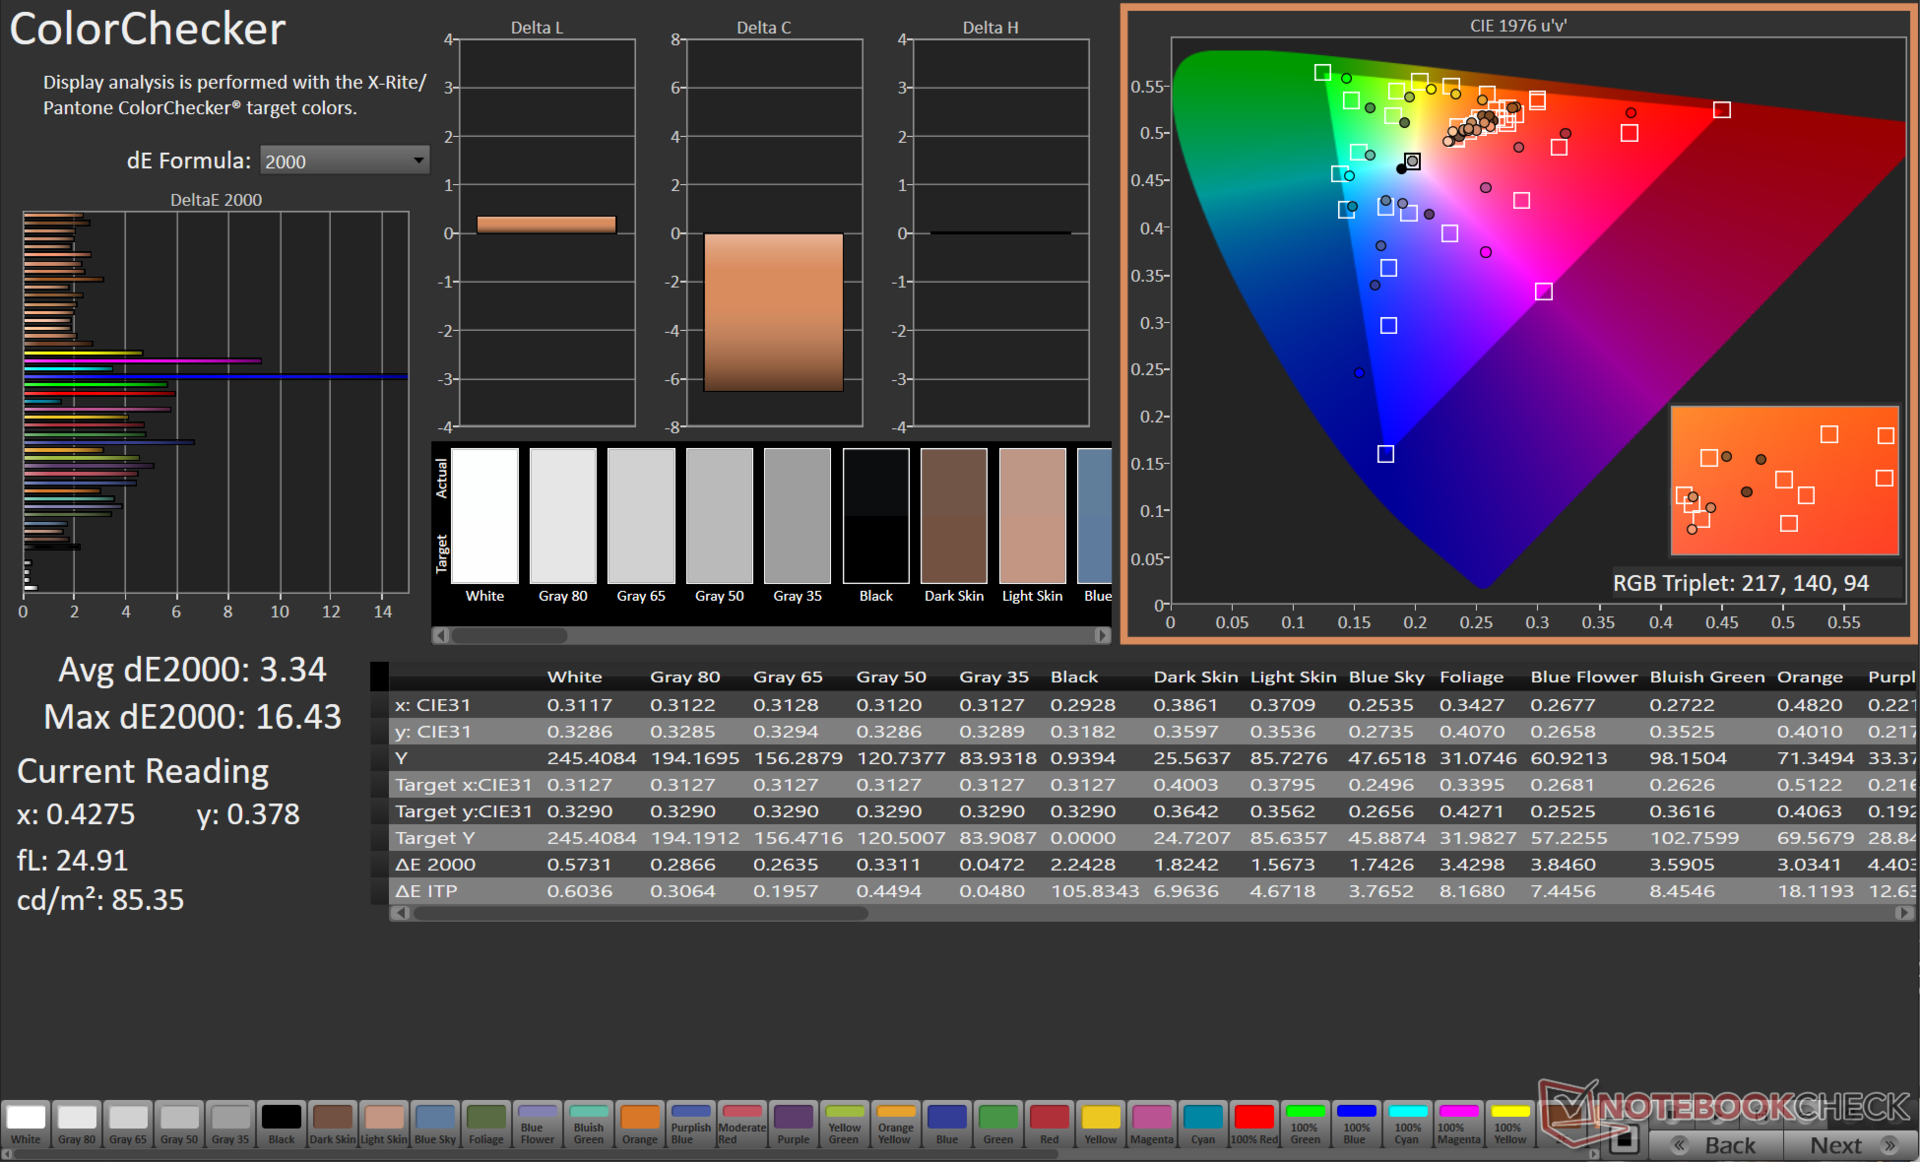
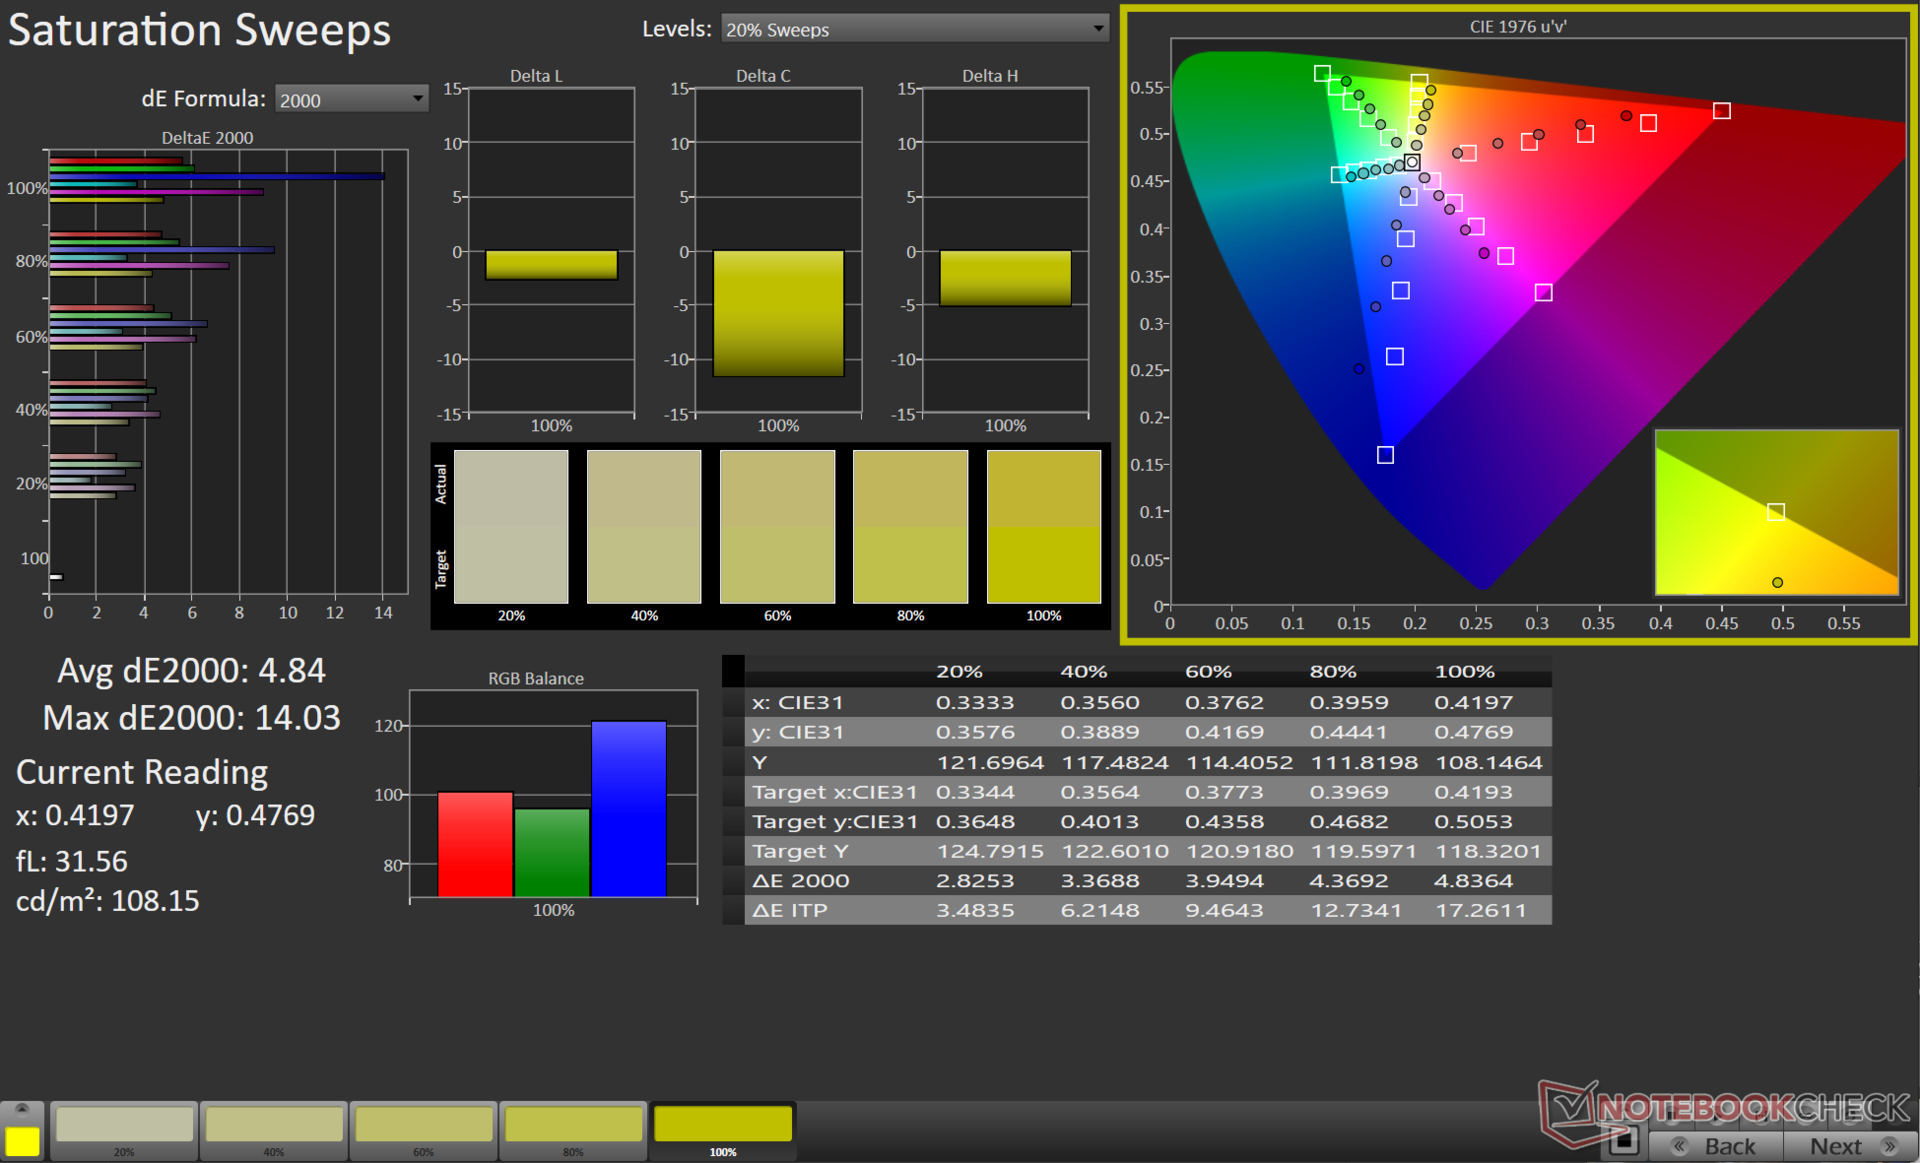
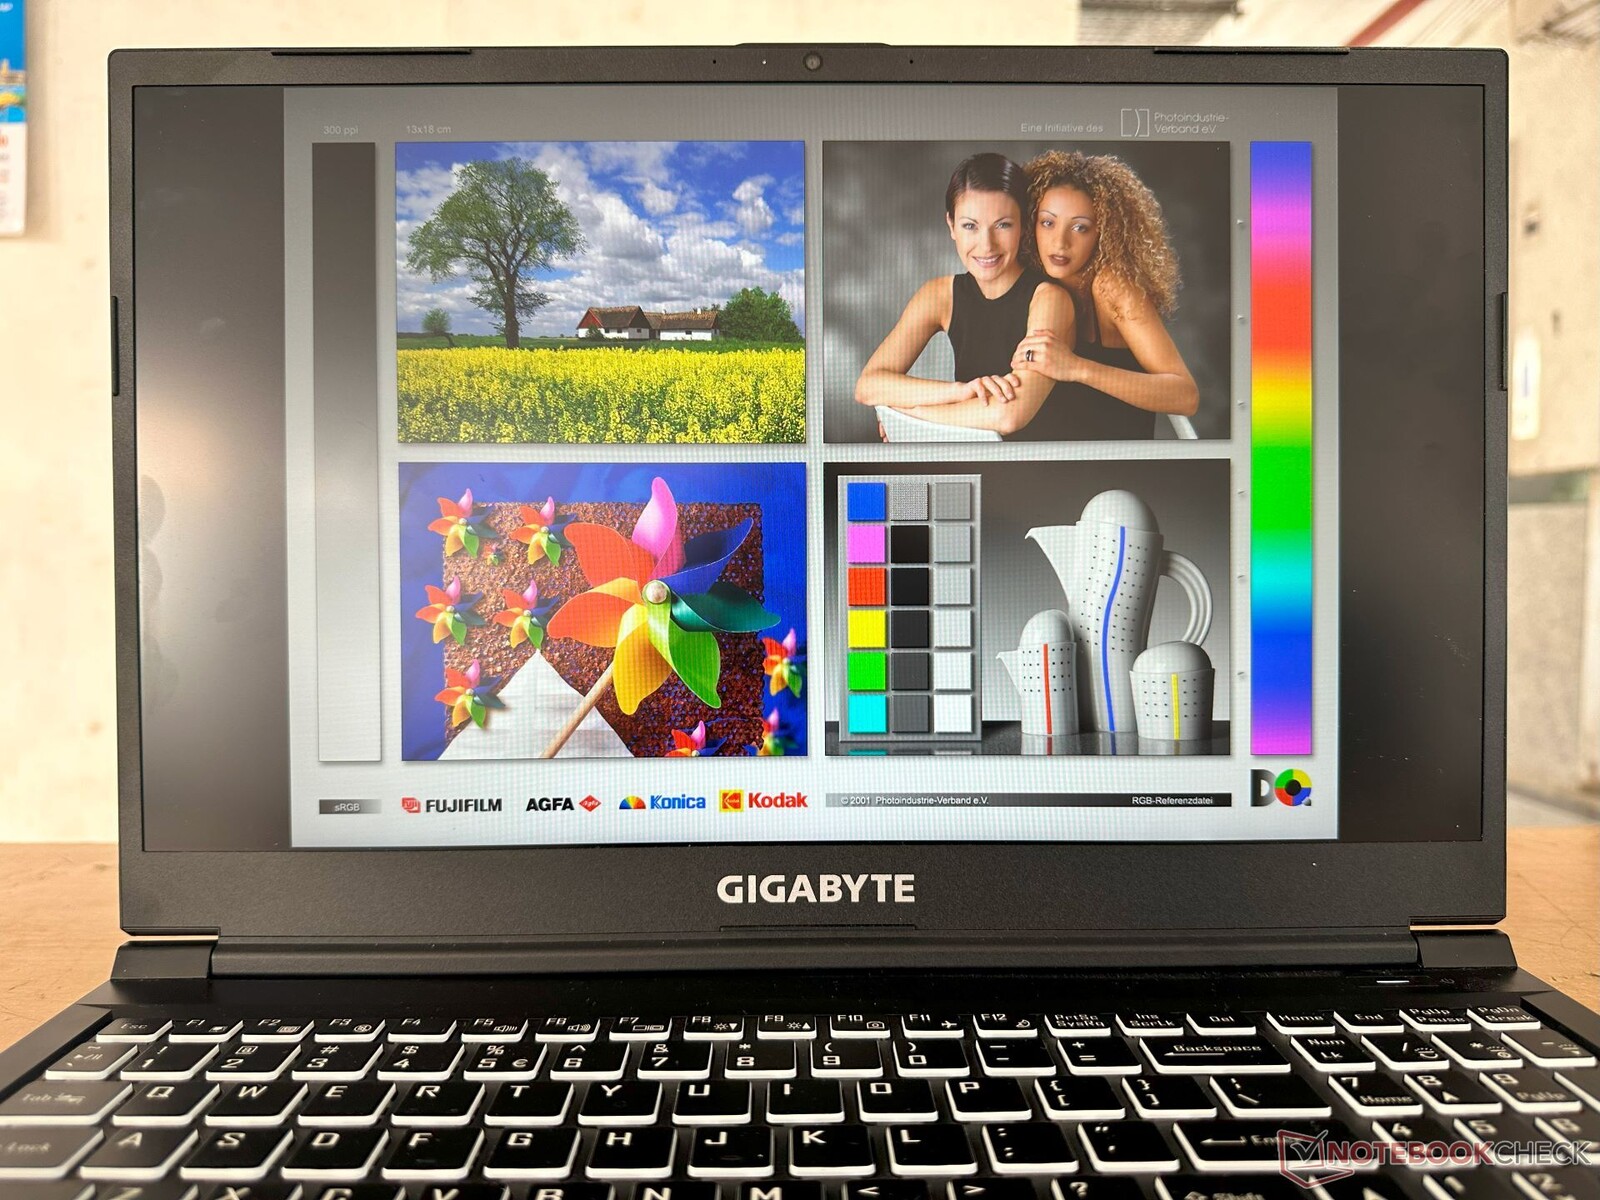
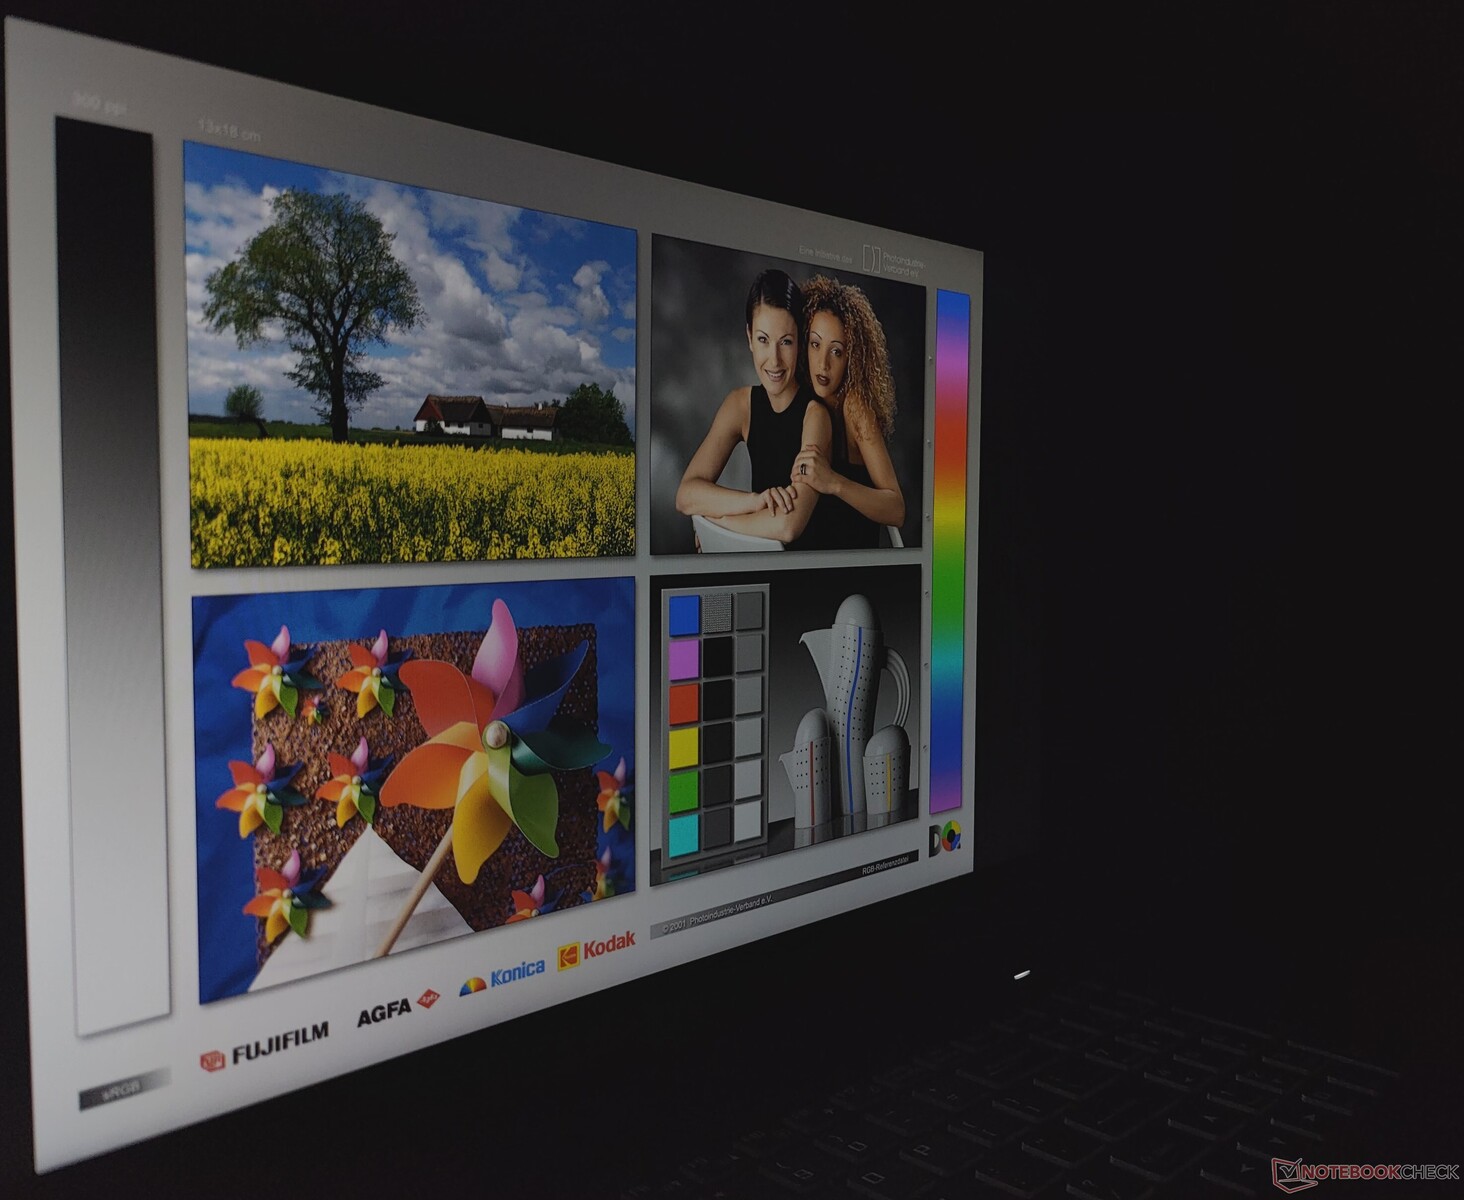
Visa: Dålig färgomfångstäckning med höga svarstider och ingen PWM
Gigabyte G5 KE:s 1080p 144 Hz Chi Mei-panel börjar visa sin ålder vid det här laget. Vi har sett den här panelen tidigare i 2021 Gigabyte G5 GD och Asus TUF Gaming F15 FX506HM. Konkurrensen har gått vidare till bättre paneler med en mycket bredare färgomfångstäckning.
Ljusfördelningen är hyfsad med 85 %, men färgomfånget är dåligt för en bärbar dator från 2023 med en sRGB-täckning på bara cirka 61 %.

| |||||||||||||||||||||||||
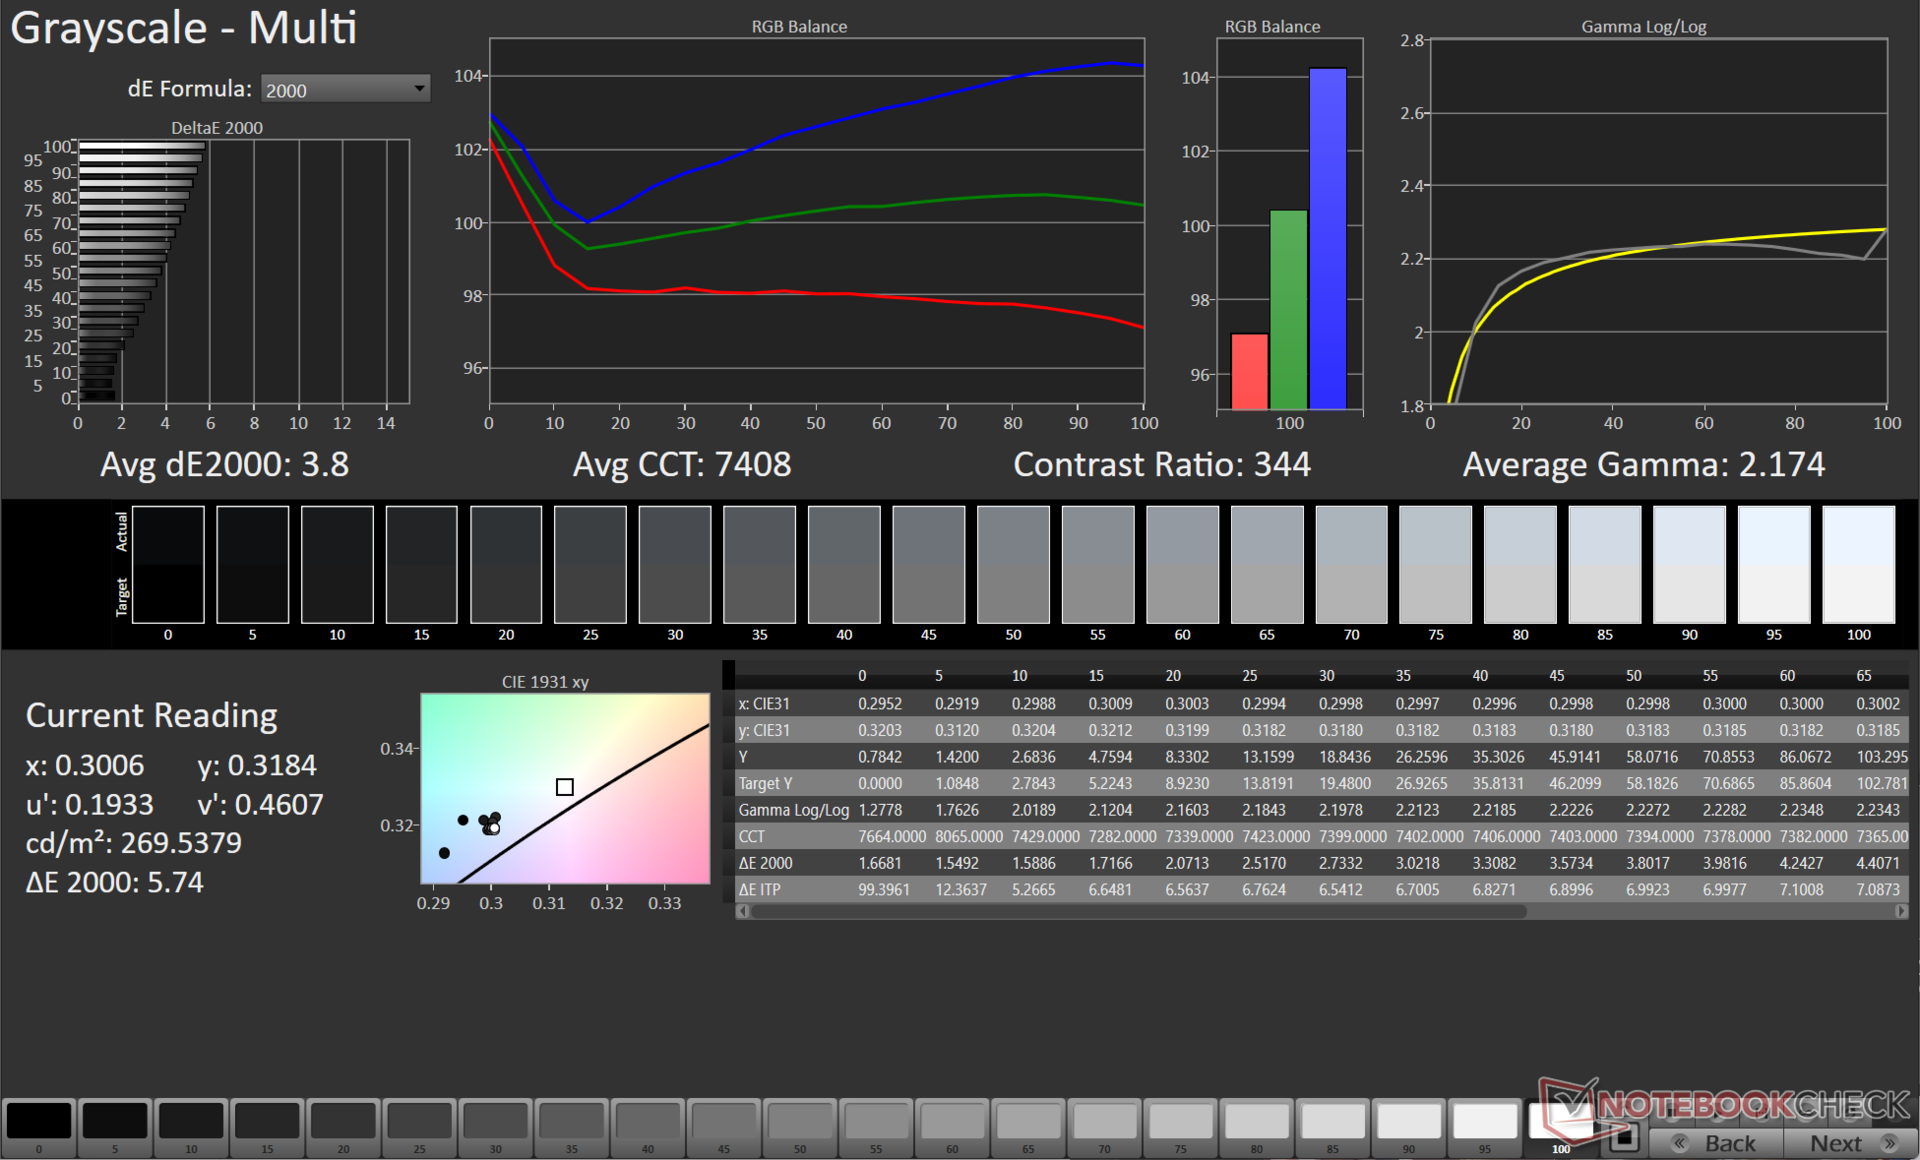
Distribution av ljusstyrkan: 85 %
Mitt på batteriet: 266 cd/m²
Kontrast: 538:1 (Svärta: 0.5 cd/m²)
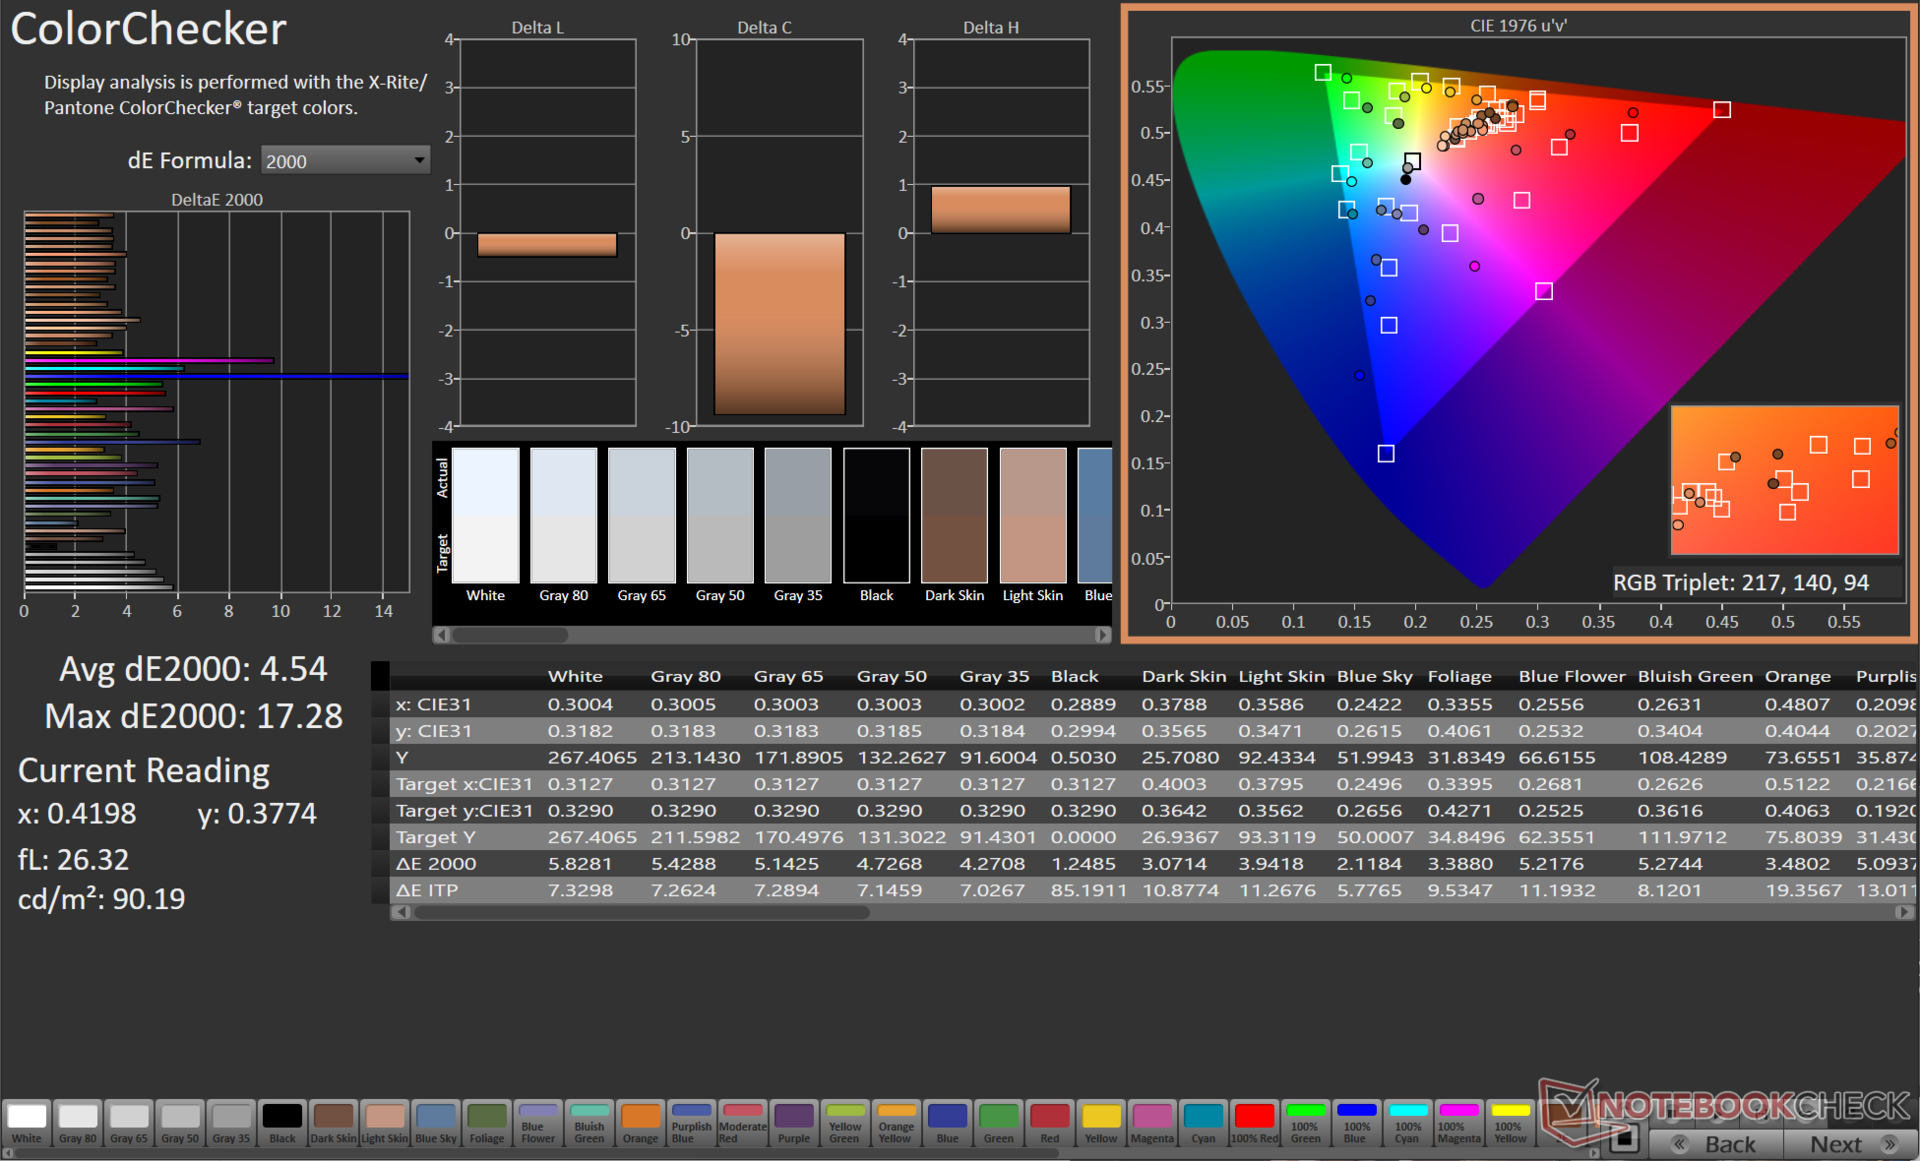
ΔE ColorChecker Calman: 4.54 | ∀{0.5-29.43 Ø4.73}
calibrated: 3.34
ΔE Greyscale Calman: 3.8 | ∀{0.09-98 Ø4.97}
42.1% AdobeRGB 1998 (Argyll 3D)
61% sRGB (Argyll 3D)
40.7% Display P3 (Argyll 3D)
Gamma: 2.17
CCT: 7408 K
| Gigabyte G5 KE Chi Mei N156HRA-EA1, , 1920x1080, 15.6" | Lenovo IdeaPad Gaming 3 15IAH7 Lenovo LEN156FHD, , 1920x1080, 15.6" | Gigabyte G7 KE AU Optronics B173HAN05.1, , 1920x1080, 17.3" | Honor MagicBook 14 2022 HD140ZB-01A, , 2160x1440, 14" | Schenker XMG Core 15 (M22) CSOT MNF601CA1-1, , 2560x1440, 15.6" | Dell G16 7620 BOE NE16QDM, , 2560x1600, 16" | Gigabyte A5 K1 BOEhydis NV156FHM-N4K (BOE08B3), , 1920x1080, 15.6" | Asus TUF Gaming F15 FX507ZM TL156VDXP0101, , 1920x1080, 15.6" | HP Victus 16-e0179ng BOE09BE, , 1920x1080, 16.1" | |
|---|---|---|---|---|---|---|---|---|---|
| Display | 66% | 69% | 64% | 66% | 65% | 56% | 62% | 72% | |
| Display P3 Coverage (%) | 40.7 | 69.1 70% | 70.4 73% | 67.9 67% | 68.8 69% | 68.3 68% | 64.4 58% | 66.4 63% | 72.6 78% |
| sRGB Coverage (%) | 61 | 99.2 63% | 99.8 64% | 98.5 61% | 99.3 63% | 98 61% | 92.5 52% | 97 59% | 100 64% |
| AdobeRGB 1998 Coverage (%) | 42.1 | 69.9 66% | 71.7 70% | 68.7 63% | 69.9 66% | 70.5 67% | 66.1 57% | 68.5 63% | 73.5 75% |
| Response Times | 53% | 68% | -41% | 50% | 56% | 48% | 55% | 44% | |
| Response Time Grey 50% / Grey 80% * (ms) | 26.64 ? | 13 ? 51% | 5 ? 81% | 37.2 ? -40% | 16 ? 40% | 8.6 ? 68% | 14.5 ? 46% | 5.6 ? 79% | 9.6 ? 64% |
| Response Time Black / White * (ms) | 18.65 ? | 8.4 ? 55% | 8.3 ? 55% | 26.3 ? -41% | 7.6 ? 59% | 10.4 ? 44% | 9.5 ? 49% | 12.8 ? 31% | 14.4 ? 23% |
| PWM Frequency (Hz) | 28400 ? | ||||||||
| Screen | 40% | 61% | 57% | 40% | 49% | 31% | 52% | 43% | |
| Brightness middle (cd/m²) | 269 | 338 26% | 307 14% | 330 23% | 378 41% | 369.4 37% | 295 10% | 353.7 31% | 361 34% |
| Brightness (cd/m²) | 248 | 329 33% | 301 21% | 320 29% | 371 50% | 348 40% | 281 13% | 340 37% | 341 38% |
| Brightness Distribution (%) | 85 | 92 8% | 93 9% | 90 6% | 93 9% | 83 -2% | 83 -2% | 89 5% | 88 4% |
| Black Level * (cd/m²) | 0.5 | 0.27 46% | 0.2 60% | 0.21 58% | 0.33 34% | 0.32 36% | 0.29 42% | 0.34 32% | 0.3 40% |
| Contrast (:1) | 538 | 1252 133% | 1535 185% | 1571 192% | 1145 113% | 1154 114% | 1017 89% | 1040 93% | 1203 124% |
| Colorchecker dE 2000 * | 4.54 | 2.88 37% | 1.32 71% | 1.8 60% | 2.84 37% | 1.78 61% | 4.36 4% | 1.74 62% | 2.44 46% |
| Colorchecker dE 2000 max. * | 17.28 | 9.35 46% | 4.6 73% | 4.7 73% | 5.51 68% | 4.41 74% | 6.92 60% | 3.63 79% | 6.37 63% |
| Colorchecker dE 2000 calibrated * | 3.34 | 1.22 63% | 1.03 69% | 1.6 52% | 2.75 18% | 1.22 63% | 1.2 64% | 0.5 85% | 1.26 62% |
| Greyscale dE 2000 * | 3.8 | 5 -32% | 2.1 45% | 3 21% | 4.08 -7% | 3.2 16% | 3.9 -3% | 2.1 45% | 4.6 -21% |
| Gamma | 2.17 101% | 2.162 102% | 2.247 98% | 2.18 101% | 2.4 92% | 2.2 100% | 2.106 104% | 2.3 96% | 2.268 97% |
| CCT | 7408 88% | 7497 87% | 6815 95% | 6697 97% | 5841 111% | 6750 96% | 7300 89% | 6257 104% | 6609 98% |
| Totalt genomsnitt (program/inställningar) | 53% /
48% | 66% /
64% | 27% /
45% | 52% /
47% | 57% /
53% | 45% /
39% | 56% /
55% | 53% /
50% |
* ... mindre är bättre
Vår kalibreringsrutin med X-Rite i1Basic Pro 3-spektrofotometern och Calman Ultimate-kalibreringsmjukvara för färgkalibrering från Portrait Displays resulterar i ett avsevärt förbättrat värde för Grayscale Delta E 2000.
Det finns dock inte mycket utrymme för att förbättra ColorChecker-värdena. De 100 % blå och 100 % magenta färgerna bidrar till stora avvikelser i färgprecisionen.
Den kalibrerade ICC-profilen kan laddas ner från länken ovan.
Visa svarstider
| ↔ Svarstid svart till vitt | ||
|---|---|---|
| 18.65 ms ... stiga ↗ och falla ↘ kombinerat | ↗ 10.83 ms stiga | 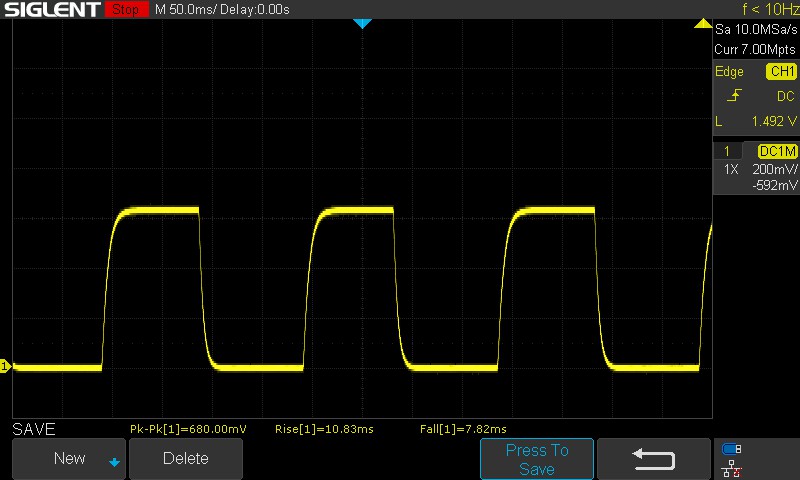 |
| ↘ 7.82 ms hösten | ||
| Skärmen visar bra svarsfrekvens i våra tester, men kan vara för långsam för konkurrenskraftiga spelare. I jämförelse sträcker sig alla testade enheter från 0.1 (minst) till 240 (maximalt) ms. » 41 % av alla enheter är bättre. Det betyder att den uppmätta svarstiden liknar genomsnittet av alla testade enheter (19.9 ms). | ||
| ↔ Svarstid 50 % grått till 80 % grått | ||
| 26.64 ms ... stiga ↗ och falla ↘ kombinerat | ↗ 12.52 ms stiga | 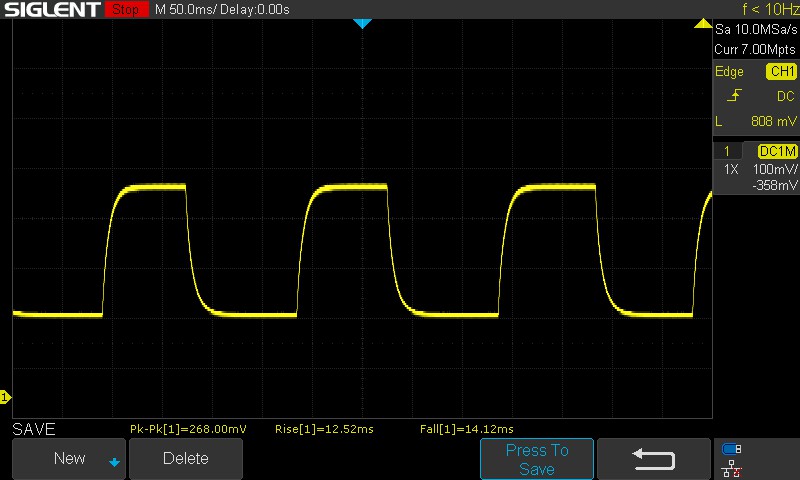 |
| ↘ 14.12 ms hösten | ||
| Skärmen visar relativt långsamma svarsfrekvenser i våra tester och kan vara för långsam för spelare. I jämförelse sträcker sig alla testade enheter från 0.165 (minst) till 636 (maximalt) ms. » 36 % av alla enheter är bättre. Det betyder att den uppmätta svarstiden är bättre än genomsnittet av alla testade enheter (31.1 ms). | ||
Skärmflimmer / PWM (Puls-Width Modulation)
| Skärmflimmer / PWM upptäcktes inte | 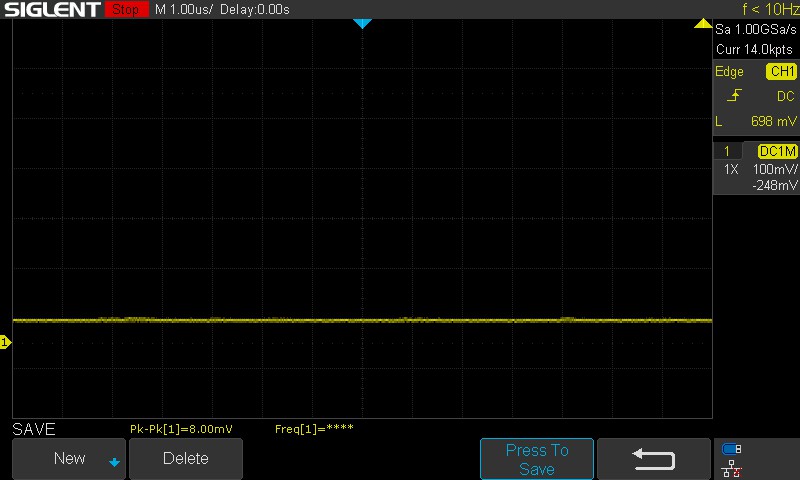 | ||
| ≤ 100 cd/m² ljusstyrka | |||
Som jämförelse: 52 % av alla testade enheter använder inte PWM för att dämpa skärmen. Om PWM upptäcktes mättes ett medelvärde av 7794 (minst: 5 - maximum: 343500) Hz. | |||
Skärmens svarstider, särskilt övergångarna från 50 % grått till 80 % grått, är lite för långsamma för en bärbar dator för spel. Vi observerade ingen PWM vid alla testade ljusstyrkanivåer.
Se vår artikel om PWM och även vår rankingtabell för mer information och jämförelser mellan testade enheter.
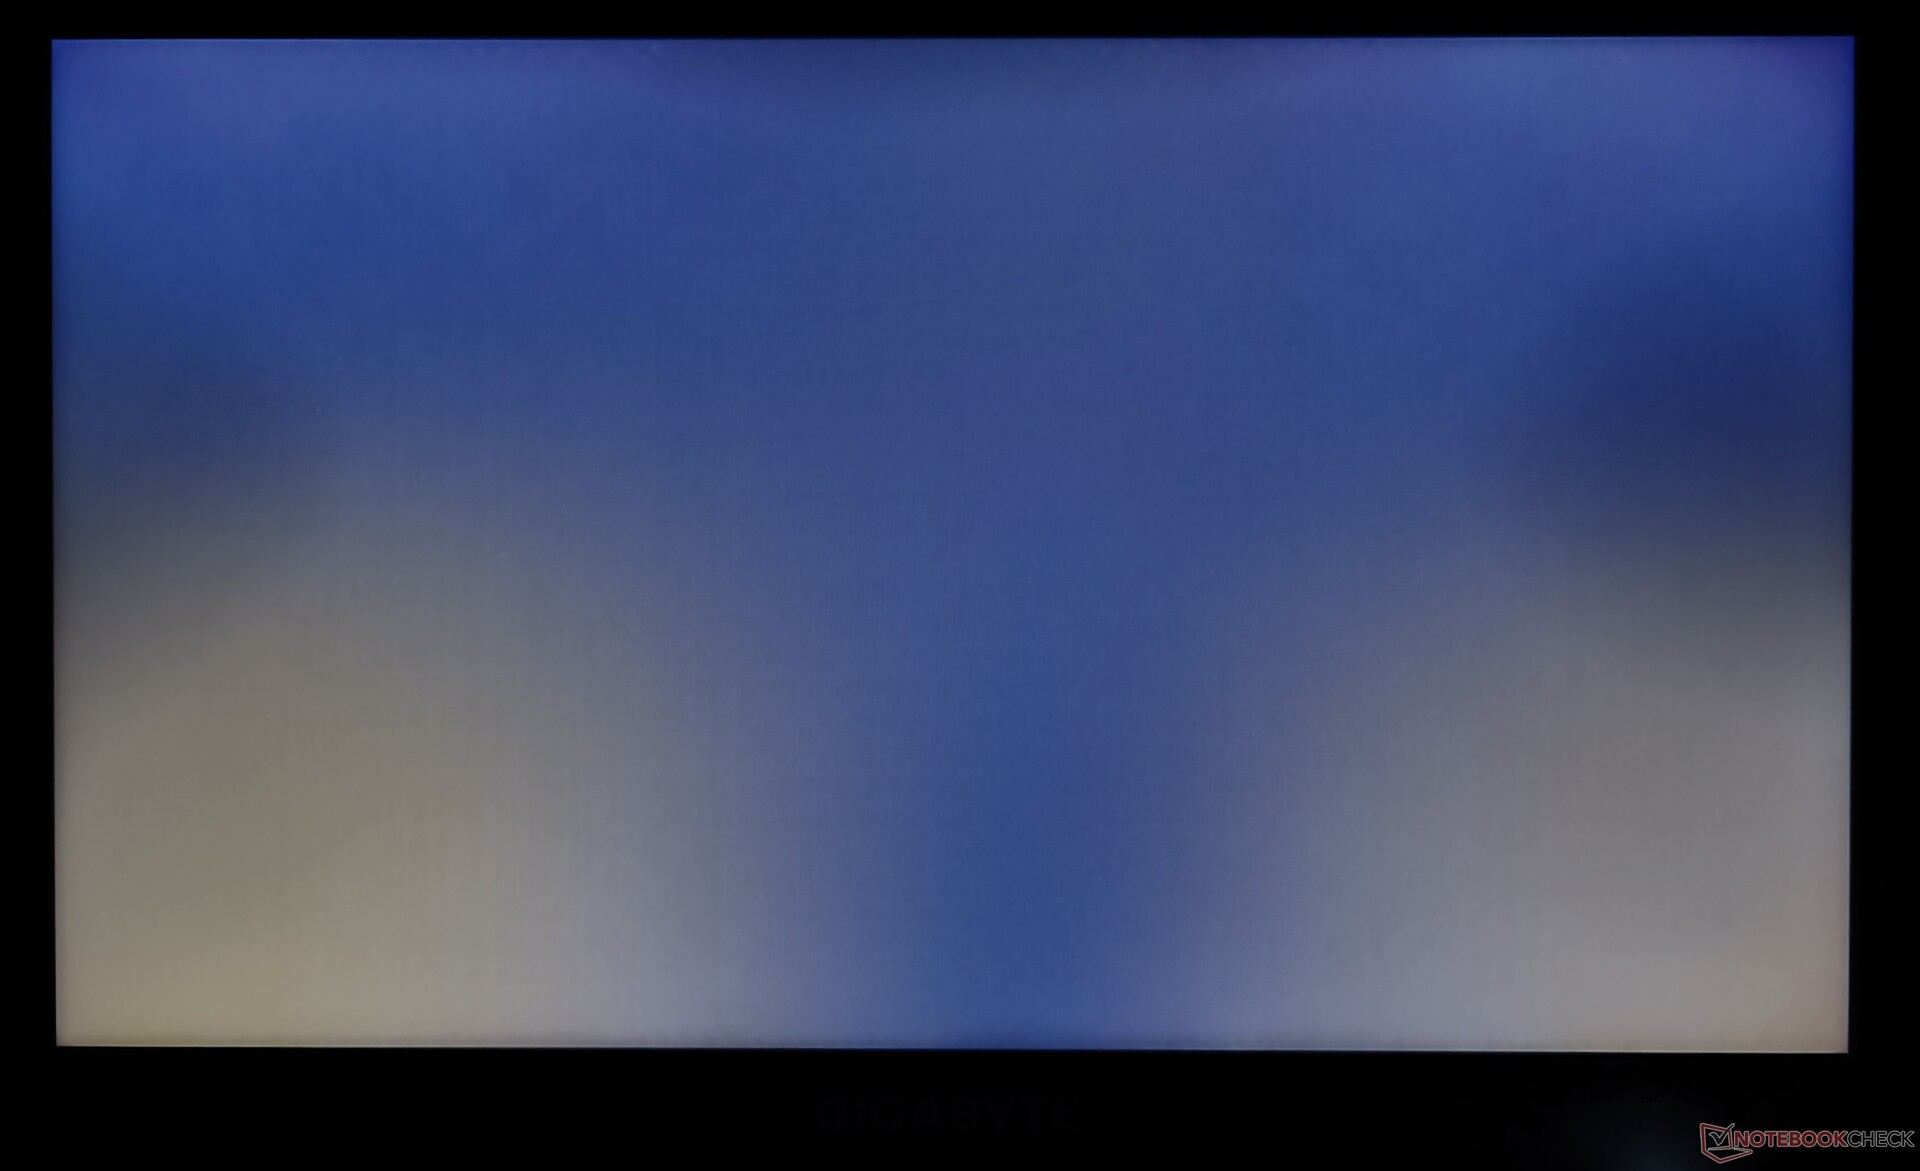
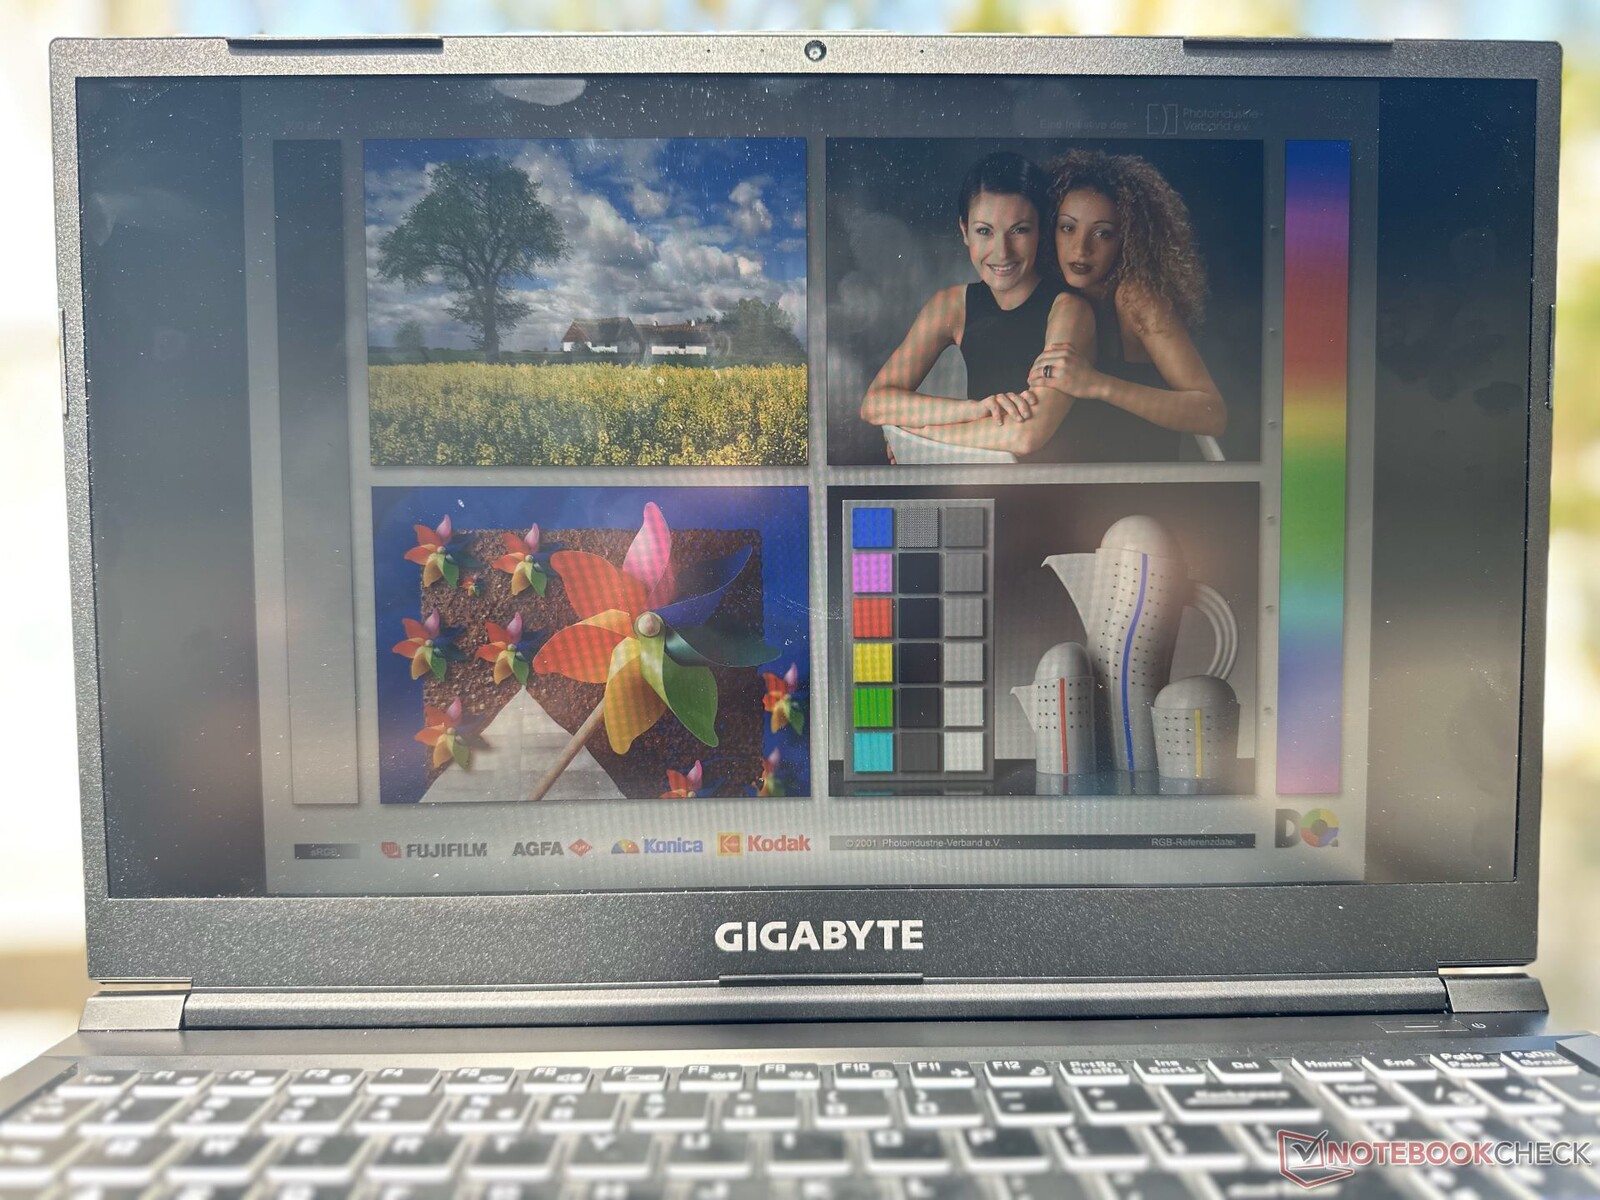
Utomhus kan du läsa så länge som det inte faller direkt solljus på skärmen. Ljusstyrka och färginformation går förlorad vid extrema betraktningsvinklar.

Prestanda: Core i5-12500H och RTX 3060-kombination ger inga större överraskningar
Gigabyte erbjuder G5 i två varianter: G5 KE och G5 ME som har 12C/16TIntel Core i5-12500H PROCESSOR. Medan G5 KE erbjuder en Nvidia GeForce RTX 3060 GPU för bärbar datorfår G5 ME nöja sig med en RTX 3050 Ti GPU för bärbar dator och saknar en Thunderbolt 4-port.
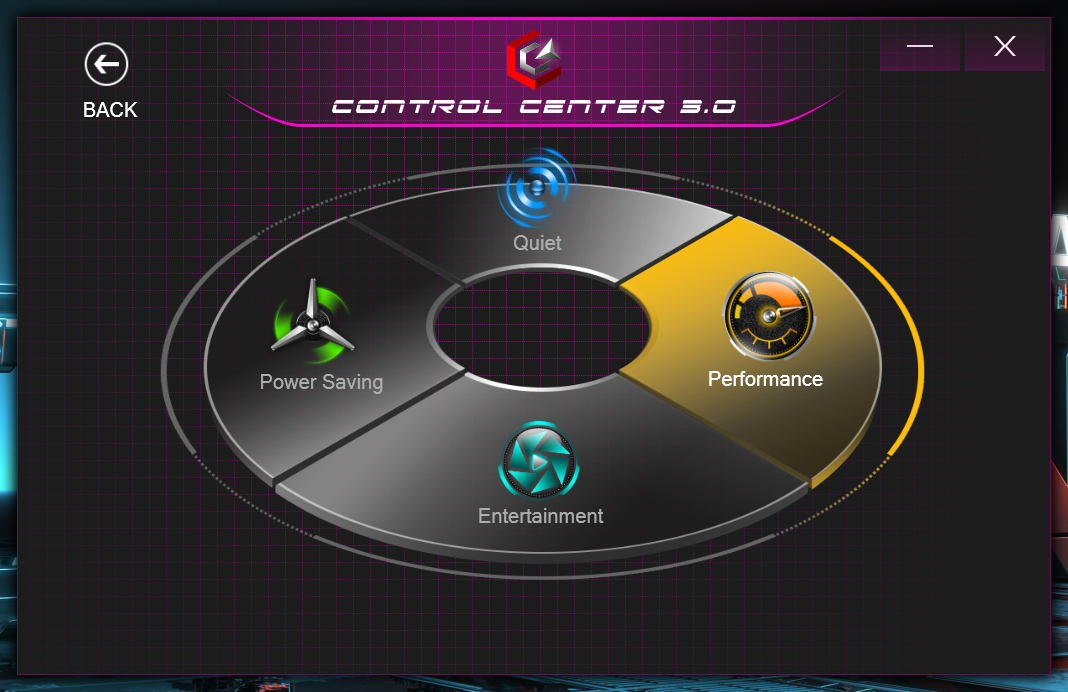
G5 KE erbjuder fyra prestandalägen enligt tabellen nedan:
| Prestandaläge | PL1 (PBP) / Tau | PL2 (MTP) / Tau |
|---|---|---|
| Tyst | 15 W / 8 s | 30 W / 2,44 ms |
| Energisparare | 30 W / 8 s | 30 W / 2,44 ms |
| Underhållning | 50 W / 28 s | 115 W / 2,44 ms |
| Prestanda | 115 W / 80 s | 135 W / 2,44 ms |
Vi använde prestandaprofilen för alla riktmärken medan batteritesterna kördes i energisparläge. Clevos Control Center 3.0 gör det möjligt att välja olika prestandaprofiler och inställningar för fläkthastighet.
Processor
G5 KE:s Core i5-12500H ligger i närheten av den i G7 KE och även i närheten av den AMD Ryzen 7 6800H i XMG Core 15 (M22) i kumulativa CPU-poäng. Den släpar dock efter med 15 % jämfört med den Core i7-12700H i Asus TUF Gaming F15.
Den uthålliga prestandan i vårt Cinebench R15 multi-core loop-test är bra för det mesta, förutom en minimal tillfällig nedgång i poäng i mitten av körningen.
Cinebench R15 Multi Loop
Cinebench R20: CPU (Single Core) | CPU (Multi Core)
Cinebench R15: CPU Single 64Bit | CPU Multi 64Bit
Blender: v2.79 BMW27 CPU
7-Zip 18.03: 7z b 4 -mmt1 | 7z b 4
Geekbench 5.5: Single-Core | Multi-Core
HWBOT x265 Benchmark v2.2: 4k Preset
LibreOffice : 20 Documents To PDF
R Benchmark 2.5: Overall mean
| CPU Performance rating | |
| Genomsnitt av klass Gaming | |
| Asus TUF Gaming F15 FX507ZM | |
| Dell G16 7620 | |
| Gigabyte G7 KE | |
| Schenker XMG Core 15 (M22) | |
| Gigabyte G5 KE | |
| Honor MagicBook 14 2022 | |
| Lenovo IdeaPad Gaming 3 15IAH7 | |
| Genomsnitt Intel Core i5-12500H | |
| HP Victus 16-e0179ng | |
| Gigabyte A5 K1 | |
| Cinebench R20 / CPU (Single Core) | |
| Genomsnitt av klass Gaming (442 - 895, n=111, senaste 2 åren) | |
| Asus TUF Gaming F15 FX507ZM | |
| Dell G16 7620 | |
| Gigabyte G7 KE | |
| Lenovo IdeaPad Gaming 3 15IAH7 | |
| Honor MagicBook 14 2022 | |
| Genomsnitt Intel Core i5-12500H (602 - 656, n=9) | |
| Gigabyte G5 KE | |
| Schenker XMG Core 15 (M22) | |
| HP Victus 16-e0179ng | |
| Gigabyte A5 K1 | |
| Cinebench R20 / CPU (Multi Core) | |
| Genomsnitt av klass Gaming (4029 - 16108, n=111, senaste 2 åren) | |
| Asus TUF Gaming F15 FX507ZM | |
| Dell G16 7620 | |
| Lenovo IdeaPad Gaming 3 15IAH7 | |
| Schenker XMG Core 15 (M22) | |
| Gigabyte G7 KE | |
| Genomsnitt Intel Core i5-12500H (4687 - 5640, n=9) | |
| Gigabyte G5 KE | |
| Honor MagicBook 14 2022 | |
| HP Victus 16-e0179ng | |
| Gigabyte A5 K1 | |
| Cinebench R15 / CPU Single 64Bit | |
| Genomsnitt av klass Gaming (188.8 - 343, n=111, senaste 2 åren) | |
| Asus TUF Gaming F15 FX507ZM | |
| Schenker XMG Core 15 (M22) | |
| Gigabyte G7 KE | |
| Lenovo IdeaPad Gaming 3 15IAH7 | |
| Dell G16 7620 | |
| Gigabyte G5 KE | |
| Honor MagicBook 14 2022 | |
| Genomsnitt Intel Core i5-12500H (220 - 250, n=9) | |
| HP Victus 16-e0179ng | |
| Gigabyte A5 K1 | |
| Cinebench R15 / CPU Multi 64Bit | |
| Genomsnitt av klass Gaming (1578 - 6271, n=111, senaste 2 åren) | |
| Asus TUF Gaming F15 FX507ZM | |
| Dell G16 7620 | |
| Schenker XMG Core 15 (M22) | |
| Lenovo IdeaPad Gaming 3 15IAH7 | |
| Gigabyte G7 KE | |
| Genomsnitt Intel Core i5-12500H (1970 - 2283, n=10) | |
| Gigabyte G5 KE | |
| Honor MagicBook 14 2022 | |
| Honor MagicBook 14 2022 | |
| HP Victus 16-e0179ng | |
| Gigabyte A5 K1 | |
| Blender / v2.79 BMW27 CPU | |
| Gigabyte A5 K1 | |
| Honor MagicBook 14 2022 | |
| HP Victus 16-e0179ng | |
| Genomsnitt Intel Core i5-12500H (223 - 288, n=9) | |
| Gigabyte G5 KE | |
| Gigabyte G7 KE | |
| Lenovo IdeaPad Gaming 3 15IAH7 | |
| Schenker XMG Core 15 (M22) | |
| Dell G16 7620 | |
| Asus TUF Gaming F15 FX507ZM | |
| Genomsnitt av klass Gaming (80 - 330, n=109, senaste 2 åren) | |
| 7-Zip 18.03 / 7z b 4 -mmt1 | |
| Genomsnitt av klass Gaming (4199 - 7436, n=110, senaste 2 åren) | |
| Schenker XMG Core 15 (M22) | |
| HP Victus 16-e0179ng | |
| Gigabyte G7 KE | |
| Lenovo IdeaPad Gaming 3 15IAH7 | |
| Gigabyte A5 K1 | |
| Gigabyte G5 KE | |
| Asus TUF Gaming F15 FX507ZM | |
| Dell G16 7620 | |
| Genomsnitt Intel Core i5-12500H (5151 - 5563, n=9) | |
| Honor MagicBook 14 2022 | |
| 7-Zip 18.03 / 7z b 4 | |
| Genomsnitt av klass Gaming (33491 - 148086, n=110, senaste 2 åren) | |
| Asus TUF Gaming F15 FX507ZM | |
| Dell G16 7620 | |
| Schenker XMG Core 15 (M22) | |
| HP Victus 16-e0179ng | |
| Gigabyte G5 KE | |
| Gigabyte G7 KE | |
| Honor MagicBook 14 2022 | |
| Genomsnitt Intel Core i5-12500H (44105 - 54380, n=9) | |
| Gigabyte A5 K1 | |
| Lenovo IdeaPad Gaming 3 15IAH7 | |
| Geekbench 5.5 / Single-Core | |
| Genomsnitt av klass Gaming (986 - 2474, n=110, senaste 2 åren) | |
| Asus TUF Gaming F15 FX507ZM | |
| Honor MagicBook 14 2022 | |
| Gigabyte G7 KE | |
| Dell G16 7620 | |
| Gigabyte G5 KE | |
| Lenovo IdeaPad Gaming 3 15IAH7 | |
| Genomsnitt Intel Core i5-12500H (1471 - 1693, n=9) | |
| Schenker XMG Core 15 (M22) | |
| HP Victus 16-e0179ng | |
| Gigabyte A5 K1 | |
| Geekbench 5.5 / Multi-Core | |
| Genomsnitt av klass Gaming (6460 - 27010, n=110, senaste 2 åren) | |
| Asus TUF Gaming F15 FX507ZM | |
| Dell G16 7620 | |
| Honor MagicBook 14 2022 | |
| Gigabyte G7 KE | |
| Gigabyte G5 KE | |
| Schenker XMG Core 15 (M22) | |
| Genomsnitt Intel Core i5-12500H (7962 - 10828, n=9) | |
| Lenovo IdeaPad Gaming 3 15IAH7 | |
| HP Victus 16-e0179ng | |
| Gigabyte A5 K1 | |
| HWBOT x265 Benchmark v2.2 / 4k Preset | |
| Genomsnitt av klass Gaming (11.5 - 44.3, n=110, senaste 2 åren) | |
| Asus TUF Gaming F15 FX507ZM | |
| Dell G16 7620 | |
| Schenker XMG Core 15 (M22) | |
| Gigabyte G7 KE | |
| Gigabyte G5 KE | |
| Lenovo IdeaPad Gaming 3 15IAH7 | |
| HP Victus 16-e0179ng | |
| Genomsnitt Intel Core i5-12500H (12 - 16.6, n=9) | |
| Honor MagicBook 14 2022 | |
| Gigabyte A5 K1 | |
| LibreOffice / 20 Documents To PDF | |
| Gigabyte A5 K1 | |
| Schenker XMG Core 15 (M22) | |
| Gigabyte G5 KE | |
| HP Victus 16-e0179ng | |
| Dell G16 7620 | |
| Asus TUF Gaming F15 FX507ZM | |
| Genomsnitt av klass Gaming (19 - 88.8, n=110, senaste 2 åren) | |
| Lenovo IdeaPad Gaming 3 15IAH7 | |
| Genomsnitt Intel Core i5-12500H (40.1 - 58.5, n=9) | |
| Gigabyte G7 KE | |
| Honor MagicBook 14 2022 | |
| R Benchmark 2.5 / Overall mean | |
| Gigabyte A5 K1 | |
| HP Victus 16-e0179ng | |
| Lenovo IdeaPad Gaming 3 15IAH7 | |
| Genomsnitt Intel Core i5-12500H (0.4748 - 0.535, n=9) | |
| Dell G16 7620 | |
| Honor MagicBook 14 2022 | |
| Gigabyte G5 KE | |
| Schenker XMG Core 15 (M22) | |
| Gigabyte G7 KE | |
| Asus TUF Gaming F15 FX507ZM | |
| Genomsnitt av klass Gaming (0.3439 - 0.759, n=111, senaste 2 åren) | |
* ... mindre är bättre
Våra engagerade Intel Core i5-12500Hsida innehåller mer information och jämförelser av riktmärken.
Systemets prestanda
G5 KE:s totala PCMark 10-prestanda är i nivå med bärbara datorer baserade på Core i7-12700H, med märkbara försprång i CrossMark jämfört med Schenker XMG Core 15 (M22) med Ryzen 7 6800H-drift.
CrossMark: Overall | Productivity | Creativity | Responsiveness
| PCMark 10 / Score | |
| Genomsnitt av klass Gaming (5828 - 11574, n=95, senaste 2 åren) | |
| Asus TUF Gaming F15 FX507ZM | |
| Schenker XMG Core 15 (M22) | |
| Dell G16 7620 | |
| Gigabyte G5 KE | |
| Lenovo IdeaPad Gaming 3 15IAH7 | |
| Genomsnitt Intel Core i5-12500H, NVIDIA GeForce RTX 3060 Laptop GPU (6126 - 7201, n=2) | |
| HP Victus 16-e0179ng | |
| Honor MagicBook 14 2022 | |
| Gigabyte A5 K1 | |
| Gigabyte G7 KE | |
| PCMark 10 / Essentials | |
| Gigabyte G5 KE | |
| Schenker XMG Core 15 (M22) | |
| Genomsnitt Intel Core i5-12500H, NVIDIA GeForce RTX 3060 Laptop GPU (10301 - 11150, n=2) | |
| Genomsnitt av klass Gaming (8810 - 12600, n=99, senaste 2 åren) | |
| Honor MagicBook 14 2022 | |
| Asus TUF Gaming F15 FX507ZM | |
| Gigabyte G7 KE | |
| Dell G16 7620 | |
| Gigabyte A5 K1 | |
| Lenovo IdeaPad Gaming 3 15IAH7 | |
| HP Victus 16-e0179ng | |
| PCMark 10 / Productivity | |
| Genomsnitt av klass Gaming (6845 - 18766, n=97, senaste 2 åren) | |
| Schenker XMG Core 15 (M22) | |
| Lenovo IdeaPad Gaming 3 15IAH7 | |
| Gigabyte G5 KE | |
| Genomsnitt Intel Core i5-12500H, NVIDIA GeForce RTX 3060 Laptop GPU (9038 - 9475, n=2) | |
| Asus TUF Gaming F15 FX507ZM | |
| Gigabyte G7 KE | |
| HP Victus 16-e0179ng | |
| Dell G16 7620 | |
| Honor MagicBook 14 2022 | |
| Gigabyte A5 K1 | |
| PCMark 10 / Digital Content Creation | |
| Genomsnitt av klass Gaming (7602 - 19657, n=97, senaste 2 åren) | |
| Asus TUF Gaming F15 FX507ZM | |
| Dell G16 7620 | |
| Schenker XMG Core 15 (M22) | |
| Gigabyte G5 KE | |
| Lenovo IdeaPad Gaming 3 15IAH7 | |
| HP Victus 16-e0179ng | |
| Genomsnitt Intel Core i5-12500H, NVIDIA GeForce RTX 3060 Laptop GPU (6703 - 9593, n=2) | |
| Honor MagicBook 14 2022 | |
| Gigabyte A5 K1 | |
| Gigabyte G7 KE | |
| CrossMark / Overall | |
| Genomsnitt av klass Gaming (1366 - 2409, n=97, senaste 2 åren) | |
| Gigabyte G7 KE | |
| Honor MagicBook 14 2022 | |
| Genomsnitt Intel Core i5-12500H, NVIDIA GeForce RTX 3060 Laptop GPU (1752 - 1824, n=2) | |
| Dell G16 7620 | |
| Gigabyte G5 KE | |
| Schenker XMG Core 15 (M22) | |
| CrossMark / Productivity | |
| Genomsnitt av klass Gaming (1386 - 2254, n=97, senaste 2 åren) | |
| Gigabyte G7 KE | |
| Genomsnitt Intel Core i5-12500H, NVIDIA GeForce RTX 3060 Laptop GPU (1720 - 1804, n=2) | |
| Honor MagicBook 14 2022 | |
| Gigabyte G5 KE | |
| Dell G16 7620 | |
| Schenker XMG Core 15 (M22) | |
| CrossMark / Creativity | |
| Honor MagicBook 14 2022 | |
| Genomsnitt av klass Gaming (1343 - 2729, n=97, senaste 2 åren) | |
| Dell G16 7620 | |
| Gigabyte G7 KE | |
| Genomsnitt Intel Core i5-12500H, NVIDIA GeForce RTX 3060 Laptop GPU (1778 - 1800, n=2) | |
| Gigabyte G5 KE | |
| Schenker XMG Core 15 (M22) | |
| CrossMark / Responsiveness | |
| Gigabyte G7 KE | |
| Genomsnitt Intel Core i5-12500H, NVIDIA GeForce RTX 3060 Laptop GPU (1771 - 1966, n=2) | |
| Gigabyte G5 KE | |
| Honor MagicBook 14 2022 | |
| Genomsnitt av klass Gaming (1226 - 2334, n=97, senaste 2 åren) | |
| Dell G16 7620 | |
| Schenker XMG Core 15 (M22) | |
| PCMark 8 Home Score Accelerated v2 | 5554 poäng | |
| PCMark 8 Work Score Accelerated v2 | 5937 poäng | |
| PCMark 10 Score | 7201 poäng | |
Hjälp | ||
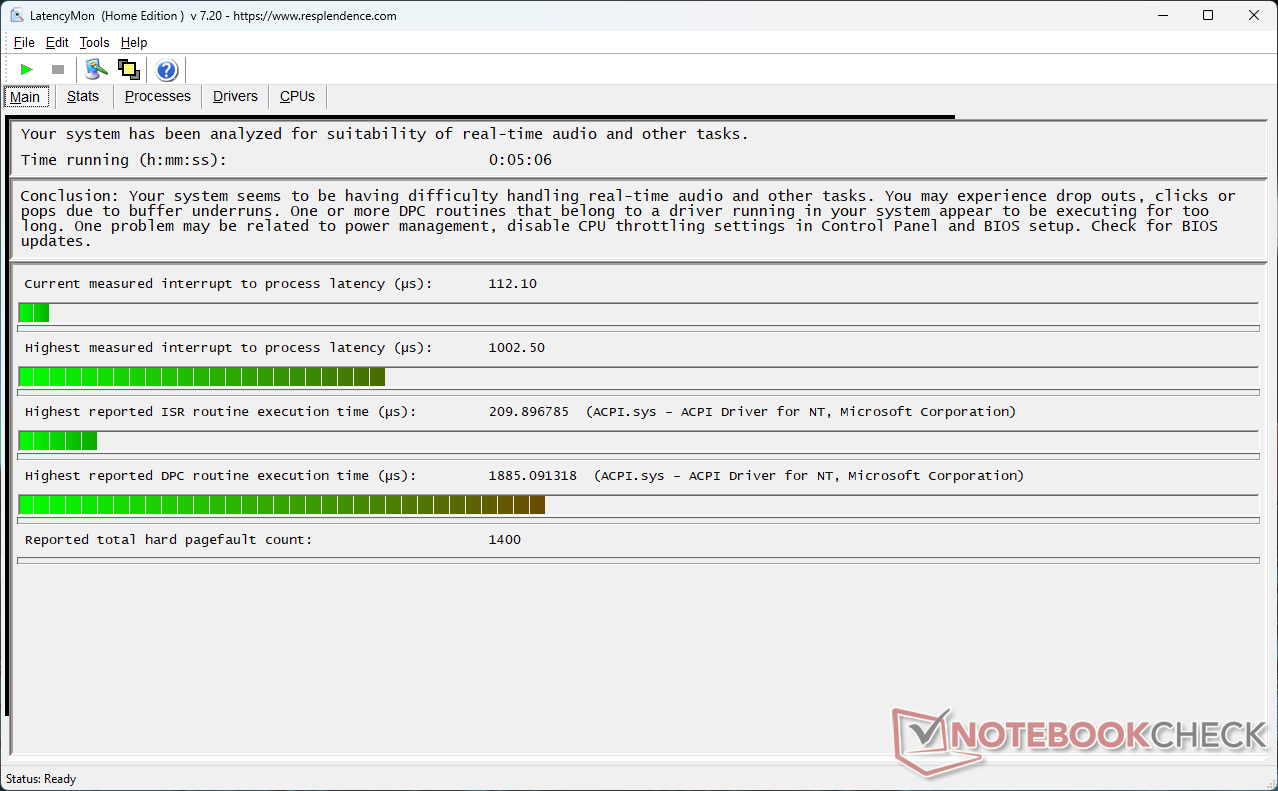
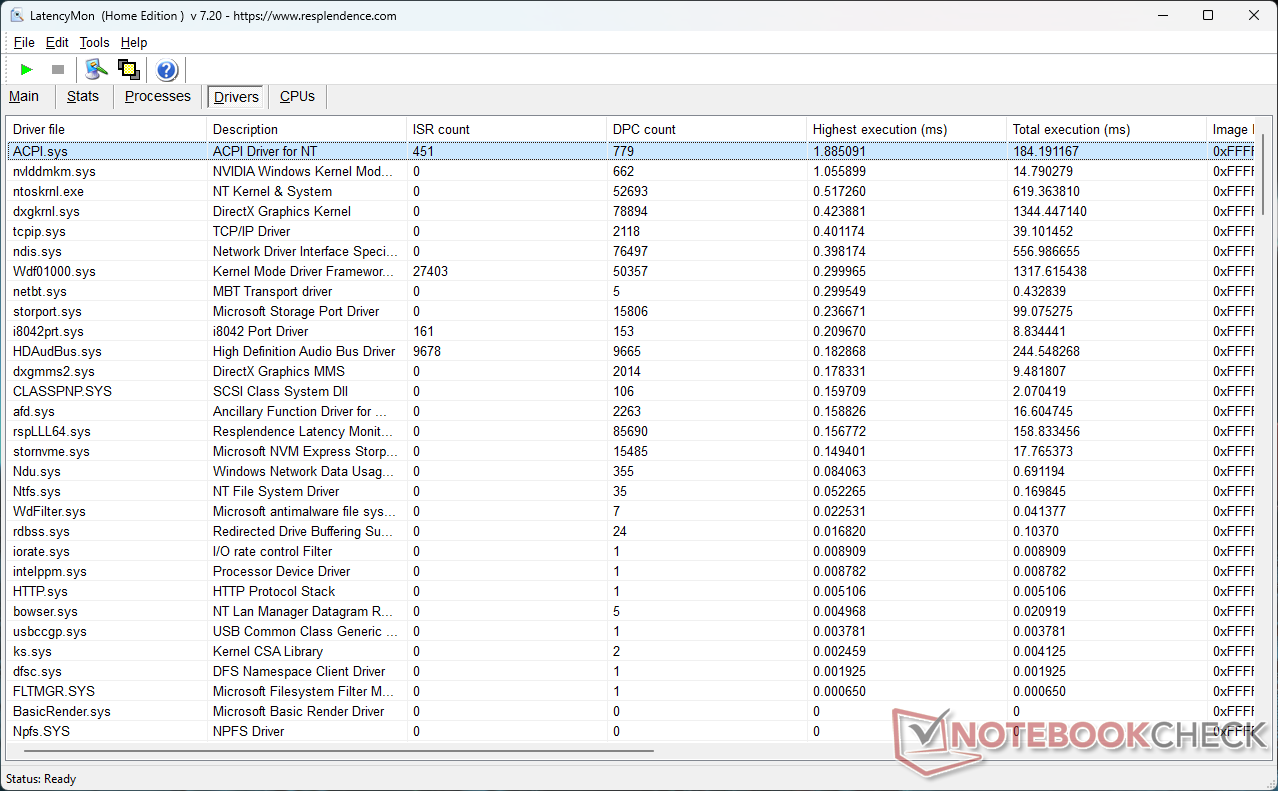
DPC-latenstid
G5 KE:s DPC-latenstid är bättre än de flesta av konkurrenterna, men värdena är fortfarande på den högre sidan.
| DPC Latencies / LatencyMon - interrupt to process latency (max), Web, Youtube, Prime95 | |
| Schenker XMG Core 15 (M22) | |
| Gigabyte G7 KE | |
| Lenovo IdeaPad Gaming 3 15IAH7 | |
| HP Victus 16-e0179ng | |
| Gigabyte A5 K1 | |
| Gigabyte G5 KE | |
| Dell G16 7620 | |
| Asus TUF Gaming F15 FX507ZM | |
| Honor MagicBook 14 2022 | |
* ... mindre är bättre
Se vårDPC-latency Rakingför fler jämförelser av latenstider mellan granskade enheter.
Lagringsenheter
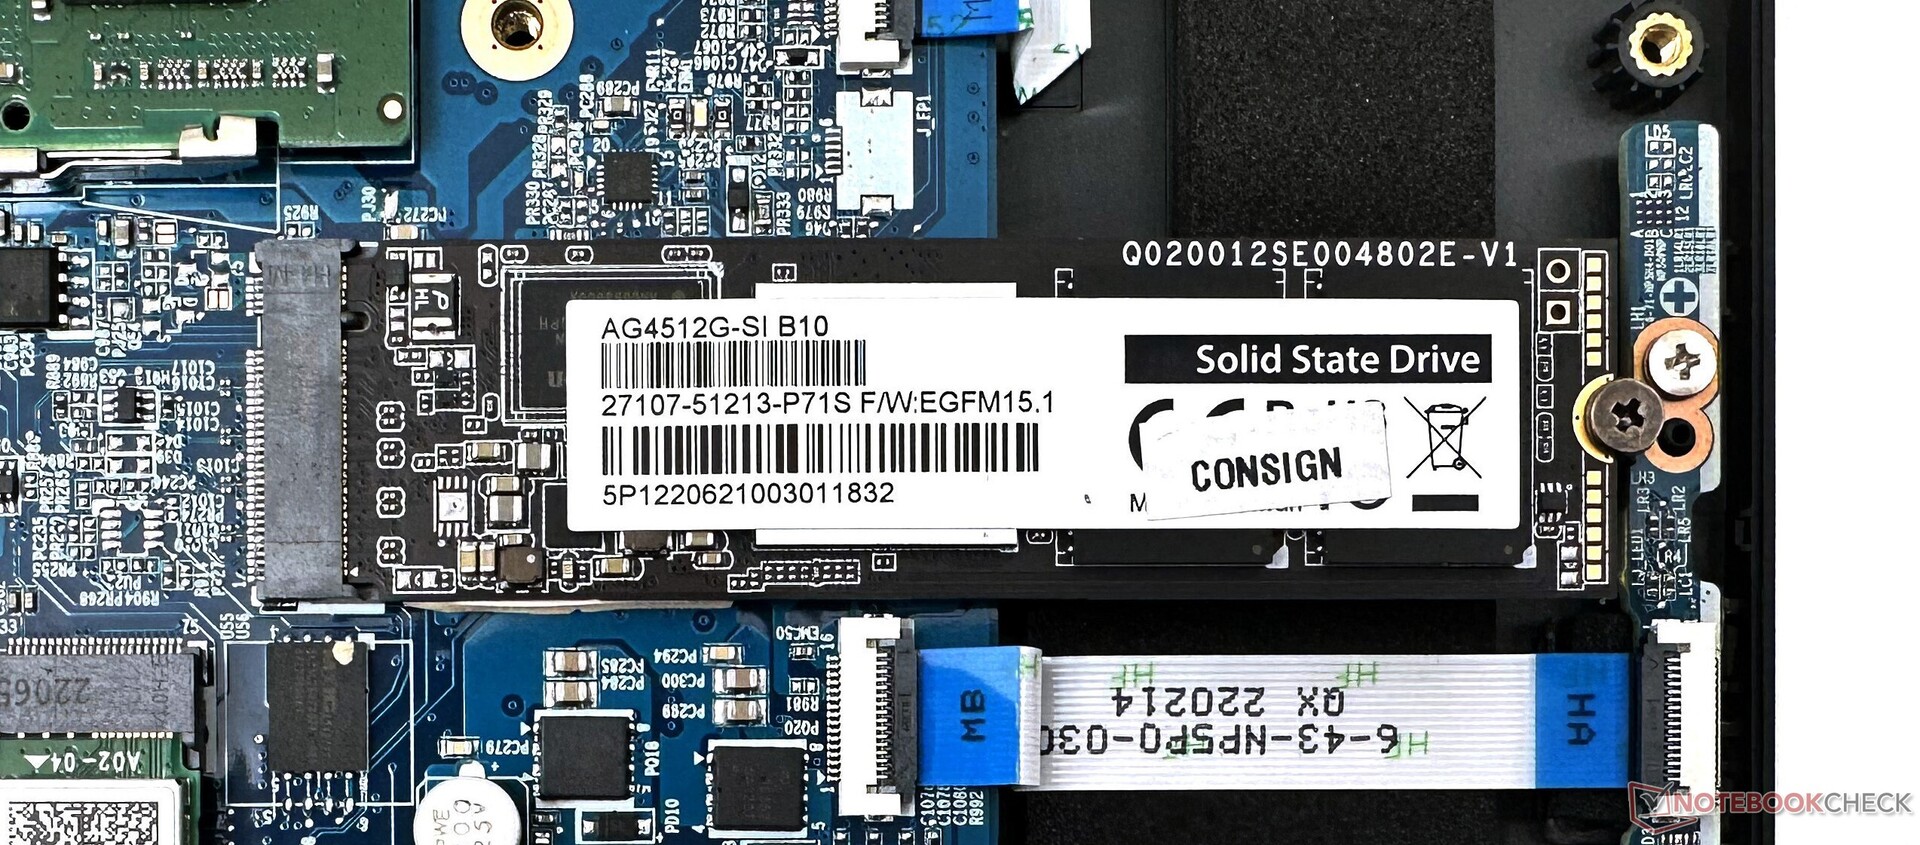
Vår G5 KE-enhet kom med en 512 GB Gigabyte NVMe SSD. Vi anser dock att 1 TB-varianten av denna enhet i G7 KE är bättre i nästan alla avseenden. SSD-enheten drabbas av drastisk strypning i vårt DiskSpd-läsningsloop-test.
En andra NVMe SSD kan installeras, men det finns inget utrymme för att lägga till en 2,5-tums SATA-enhet.
| Gigabyte G5 KE Gigabyte AG4512G-SI B10 | Lenovo IdeaPad Gaming 3 15IAH7 Intel SSD 660p SSDPEKNW512G8 | Gigabyte G7 KE Gigabyte AG470S1TB-SI B10 | Honor MagicBook 14 2022 Samsung PM9A1 MZVL2512HCJQ | Asus TUF Gaming F15 FX507ZM SK Hynix HFM001TD3JX013N | HP Victus 16-e0179ng WDC PC SN730 SDBPNTY-1T00 | Genomsnitt Gigabyte AG4512G-SI B10 | Genomsnitt av klass Gaming | |
|---|---|---|---|---|---|---|---|---|
| CrystalDiskMark 5.2 / 6 | -42% | 22% | 43% | -8% | -16% | 0% | 25% | |
| Write 4K (MB/s) | 303.3 | 64 -79% | 363.1 20% | 229.88 -24% | 217.7 -28% | 157.3 -48% | 303 ? 0% | 202 ? -33% |
| Read 4K (MB/s) | 64.25 | 77.05 20% | 59.23 -8% | 91.45 42% | 70.1 9% | 49 -24% | 64.3 ? 0% | 78.1 ? 22% |
| Write Seq (MB/s) | 2258 | 93.07 -96% | 2605 15% | 2844 26% | 2983 32% | 2258 ? 0% | 3703 ? 64% | |
| Read Seq (MB/s) | 2561 | 2570 0% | 2337 -9% | 2492 -3% | 2247 -12% | 2561 ? 0% | 3592 ? 40% | |
| Write 4K Q32T1 (MB/s) | 620.6 | 184.6 -70% | 806.9 30% | 627.94 1% | 408.3 -34% | 395 -36% | 621 ? 0% | 611 ? -2% |
| Read 4K Q32T1 (MB/s) | 866.2 | 461.5 -47% | 1019 18% | 868.92 0% | 524 -40% | 557 -36% | 866 ? 0% | 715 ? -17% |
| Write Seq Q32T1 (MB/s) | 2264.3 | 1659 -27% | 3612 60% | 5118.5 126% | 3011 33% | 3094 37% | 2264 ? 0% | 5192 ? 129% |
| Read Seq Q32T1 (MB/s) | 4717.3 | 2936 -38% | 7067 50% | 6866.5 46% | 3553 -25% | 2871 -39% | 4717 ? 0% | 6958 ? 47% |
| Write 4K Q8T8 (MB/s) | 2239.2 | 2910.25 30% | 2239 ? 0% | 1306 ? -42% | ||||
| Read 4K Q8T8 (MB/s) | 1188.1 | 2687.03 126% | 1188 ? 0% | 1633 ? 37% | ||||
| AS SSD | -48% | 39% | 28% | -23% | -21% | 0% | 18% | |
| Seq Read (MB/s) | 3697.92 | 2432.02 -34% | 4540.75 23% | 5233 42% | 3013 -19% | 2383 -36% | 3698 ? 0% | 5490 ? 48% |
| Seq Write (MB/s) | 2106.21 | 1229.14 -42% | 3805.55 81% | 3857 83% | 2768 31% | 2466 17% | 2106 ? 0% | 3914 ? 86% |
| 4K Read (MB/s) | 82.5 | 75.66 -8% | 99.79 21% | 85.14 3% | 66.9 -19% | 44.14 -46% | 82.5 ? 0% | 70 ? -15% |
| 4K Write (MB/s) | 312.09 | 242.19 -22% | 325.41 4% | 216.33 -31% | 184.8 -41% | 117.5 -62% | 312 ? 0% | 215 ? -31% |
| 4K-64 Read (MB/s) | 1675.54 | 441.63 -74% | 2914.54 74% | 2468.58 47% | 1923 15% | 1734 3% | 1676 ? 0% | 1633 ? -3% |
| 4K-64 Write (MB/s) | 1865.08 | 1218.61 -35% | 2915.33 56% | 3003.26 61% | 2198 18% | 2088 12% | 1865 ? 0% | 2875 ? 54% |
| Access Time Read * (ms) | 0.066 | 0.073 -11% | 0.094 -42% | 0.023 65% | 0.03 55% | 0.049 26% | 0.066 ? -0% | 0.06415 ? 3% |
| Access Time Write * (ms) | 0.013 | 0.033 -154% | 0.012 8% | 0.02 -54% | 0.081 -523% | 0.032 -146% | 0.013 ? -0% | 0.03953 ? -204% |
| Score Read (Points) | 2128 | 760 -64% | 3468 63% | 3077 45% | 2291 8% | 2017 -5% | 2128 ? 0% | 2252 ? 6% |
| Score Write (Points) | 2388 | 1584 -34% | 3621 52% | 3605 51% | 2660 11% | 2452 3% | 2388 ? 0% | 3481 ? 46% |
| Score Total (Points) | 5541 | 2702 -51% | 8837 59% | 8195 48% | 6117 10% | 5503 -1% | 5541 ? 0% | 6815 ? 23% |
| Copy ISO MB/s (MB/s) | 1077.37 | 1949.01 81% | 2093.45 94% | 2143 99% | 1077 ? 0% | 3074 ? 185% | ||
| Copy Program MB/s (MB/s) | 827.5 | 1079.42 30% | 447.36 -46% | 871 5% | 828 ? 0% | 951 ? 15% | ||
| Copy Game MB/s (MB/s) | 1460.58 | 2042.84 40% | 1195.09 -18% | 1840 26% | 1461 ? 0% | 2035 ? 39% | ||
| Totalt genomsnitt (program/inställningar) | -45% /
-46% | 31% /
33% | 36% /
34% | -16% /
-18% | -19% /
-19% | 0% /
0% | 22% /
21% |
* ... mindre är bättre

Disk Throttling: DiskSpd Read Loop, Queue Depth 8
Kolla in vår dedikerade SSD- och HDD-jämförelser för fler jämförelser av lagringsenheter.
GPU-prestanda
115 W Nvidia GeForce RTX 3060 GPU för bärbar dator presterar på samma sätt i 3DMark-testerna. G5 KE visar bra försprång jämfört med HP Victus i syntetiska tester på grund av TGP-konfigurationen på 95 W i den senare.
| 3DMark 11 Performance | 26505 poäng | |
| 3DMark Ice Storm Standard Score | 188480 poäng | |
| 3DMark Cloud Gate Standard Score | 53162 poäng | |
| 3DMark Fire Strike Score | 19966 poäng | |
| 3DMark Fire Strike Extreme Score | 10252 poäng | |
| 3DMark Time Spy Score | 8922 poäng | |
Hjälp | ||
Spelprestanda
Gigabyte G5 KE:s spelprestanda liknar andra RTX 3060-baserade bärbara datorer som vi har testat och lyckas till och med gå om G7 KE med samma konfiguration i flera spel.
Vi märkte inga märkbara bildförluster när vi stressade den bärbara datorn med The Witcher 3 i 1080p Ultra.
The Witcher 3 FPS Chart
| Cyberpunk 2077 1.6 | |
| 1920x1080 High Preset | |
| Dell G16 7620 | |
| Gigabyte G5 KE | |
| Genomsnitt NVIDIA GeForce RTX 3060 Laptop GPU (42.2 - 87.7, n=14) | |
| Gigabyte G7 KE | |
| Honor MagicBook 14 2022 | |
| 1920x1080 Ultra Preset | |
| Gigabyte G5 KE | |
| Dell G16 7620 | |
| Genomsnitt NVIDIA GeForce RTX 3060 Laptop GPU (40 - 78.8, n=16) | |
| Gigabyte G7 KE | |
| Honor MagicBook 14 2022 | |
| F1 2021 | |
| 1920x1080 High Preset AA:T AF:16x | |
| Gigabyte G5 KE | |
| Genomsnitt NVIDIA GeForce RTX 3060 Laptop GPU (119 - 227, n=9) | |
| Honor MagicBook 14 2022 | |
| 1920x1080 Ultra High Preset + Raytracing AA:T AF:16x | |
| Gigabyte G5 KE | |
| Genomsnitt NVIDIA GeForce RTX 3060 Laptop GPU (67 - 112.8, n=9) | |
| Honor MagicBook 14 2022 | |
| låg | med. | hög | ultra | |
|---|---|---|---|---|
| GTA V (2015) | 183.4 | 179.9 | 172.8 | 103 |
| The Witcher 3 (2015) | 333 | 255 | 168.7 | 87.6 |
| Dota 2 Reborn (2015) | 168.5 | 153.1 | 144.8 | 137.5 |
| Final Fantasy XV Benchmark (2018) | 179.3 | 118.9 | 90.3 | |
| X-Plane 11.11 (2018) | 118.4 | 105.6 | 86.7 | |
| Far Cry 5 (2018) | 159 | 134 | 129 | 118 |
| Strange Brigade (2018) | 385 | 216 | 175.3 | 153.3 |
| F1 2021 (2021) | 303 | 200 | 177.9 | 105.1 |
| Cyberpunk 2077 1.6 (2022) | 105.4 | 85.3 | 72.5 | 68 |
| F1 22 (2022) | 197 | 189.4 | 153.3 | 55.9 |
Kolla in vår dedikerade Nvidia GeForce RTX 3060 GPU för bärbar dator sida och även vår uttömmande jämförelselista för spel för mer information och jämförelser av prestanda.
Emissions: High surface temperatures and fan noise under load
Systembrus
I det testade prestandaläget är ljudet från systemet vid tomgång något högre, ca 31 dB(A). Fläktljudet når upp till 55 dB(A) oavsett belastning.
Gigabyte verkar ha begränsat fläktljudet till under 30 dB(A) i Quiet-profilen. Endast Testet
Witcher 3 resulterar i höga utsläpp av fläktljud i profilen Power Saving, vilket illustreras i tabellen nedan
.| Prestanda Läge | Tomgång dB(A) | Medelvärde av belastning dB(A) | Högsta belastning dB(A) | Witcher 3 dB(A) |
|---|---|---|---|---|
| Tyst | 22.21 | 25.73 | 24.64 | 27.62 |
| Energibesparing | 22,65 | 24,75 | 24,62 | 49,05 |
| Underhållning | 22,63 | 54,67 | 55,52 | 53,11 |
| Prestanda | 31.05 | 55.66 | 55.51 | 55.65 |
Ljudnivå
| Låg belastning |
| 31.05 / 31.05 / 31.05 dB(A) |
| Hög belastning |
| 55.66 / 55.51 dB(A) |
 | ||
30 dB tyst 40 dB(A) hörbar 50 dB(A) högt ljud |
||
min: | ||
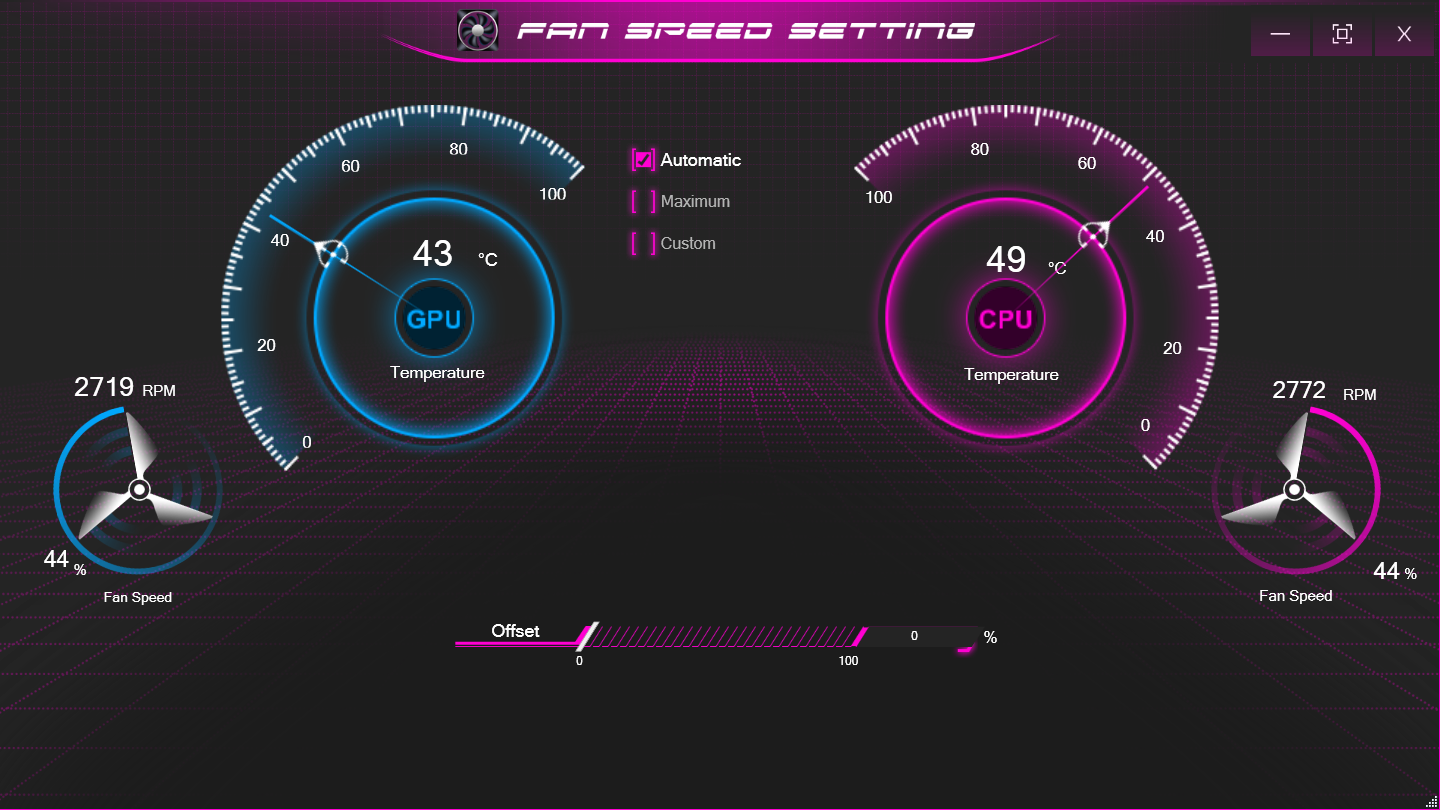
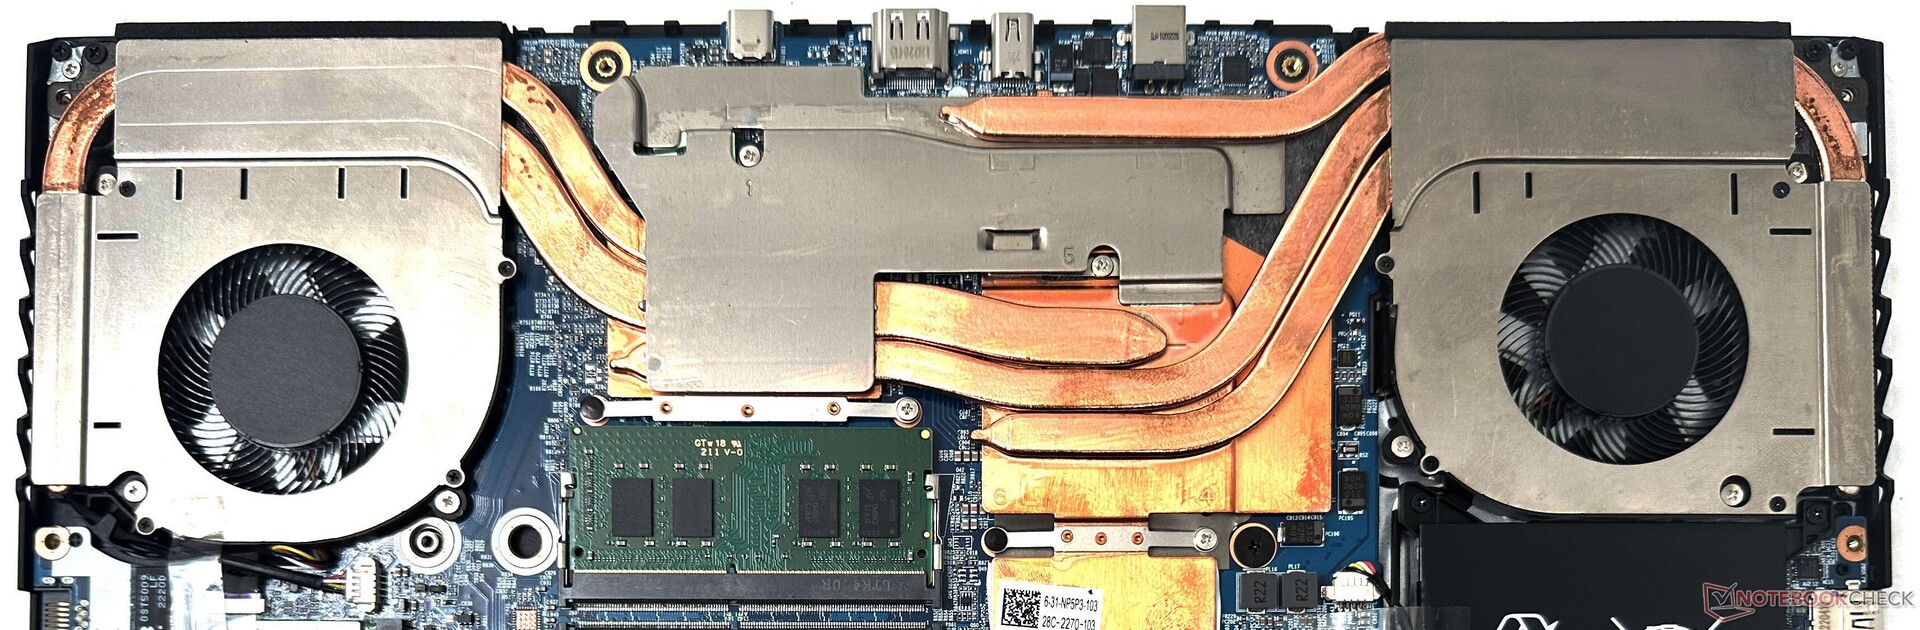
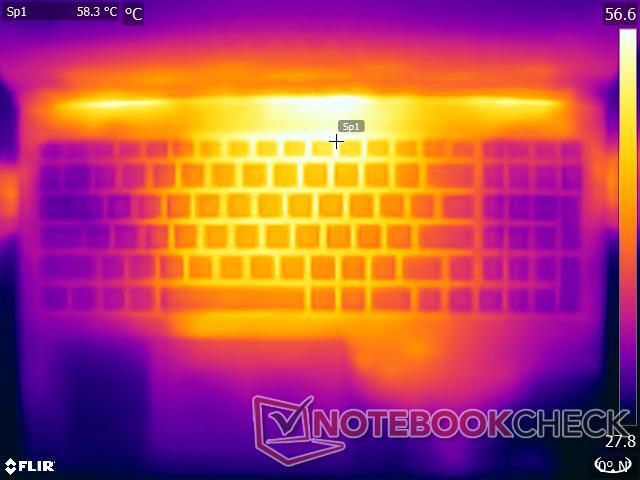
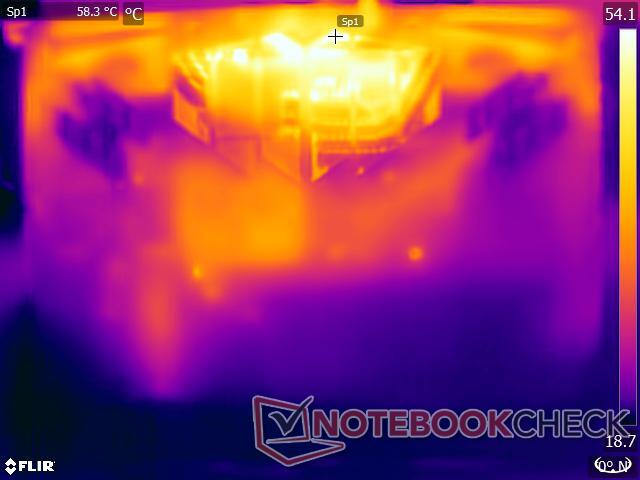
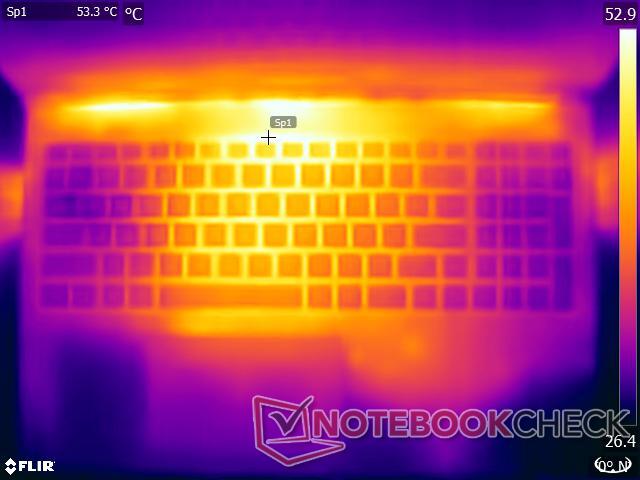
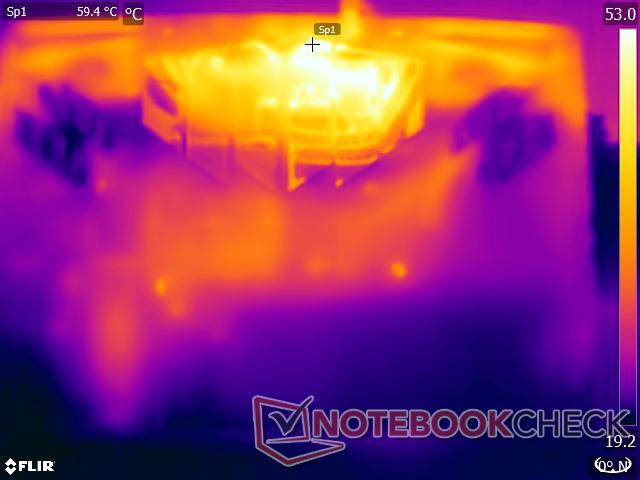
Temperatur
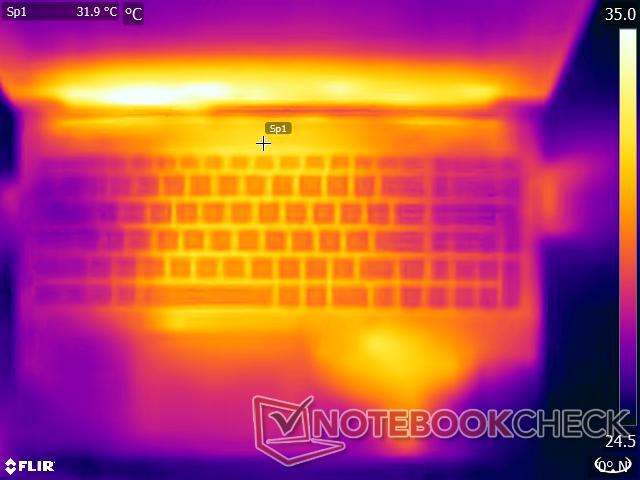
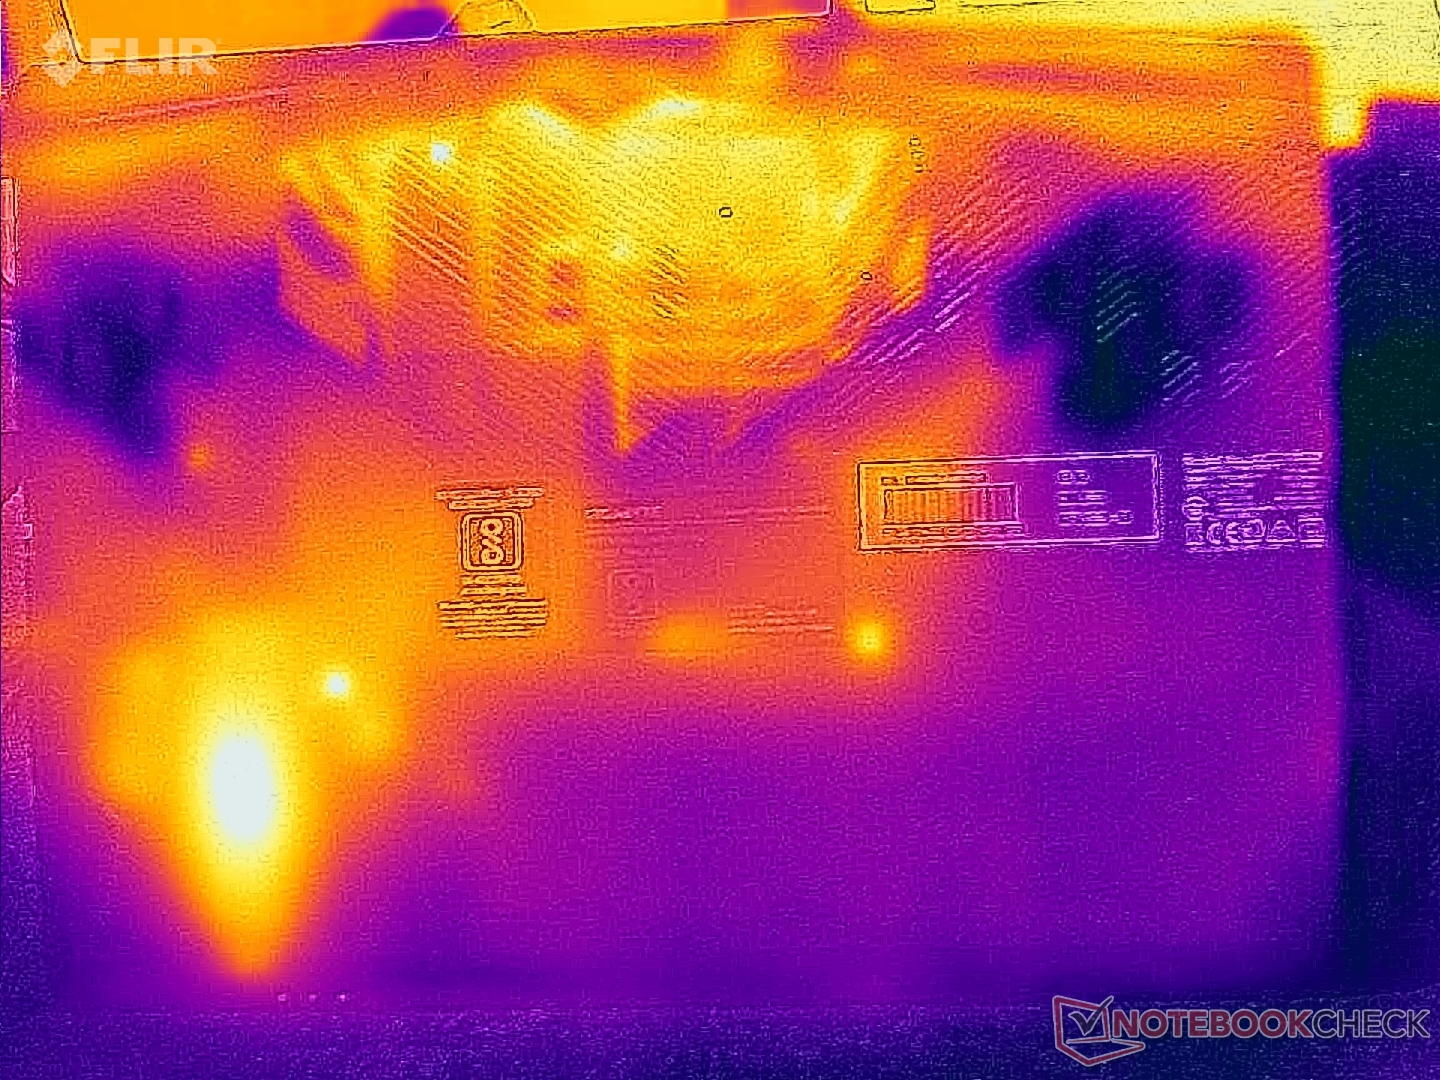
Gigabyte G5 KE:s fyrdubbla värmepipesystem med dubbla fläktar gör ett hyggligt jobb med att hålla kärntemperaturerna under kontroll, men yttemperaturerna kan stiga upp till 52,6 °C på ovansidan och upp till 62,4 °C på undersidan vid hög belastning.
Pekplattans område kan också bli ganska varmt.
(-) Den maximala temperaturen på ovansidan är 52.6 °C / 127 F, jämfört med genomsnittet av 40.4 °C / 105 F , allt från 21.2 till 68.8 °C för klassen Gaming.
(-) Botten värms upp till maximalt 62.4 °C / 144 F, jämfört med genomsnittet av 43.2 °C / 110 F
(±) Vid tomgångsbruk är medeltemperaturen för ovansidan 32 °C / 90 F, jämfört med enhetsgenomsnittet på 33.9 °C / ### class_avg_f### F.
(-) När du spelar The Witcher 3 är medeltemperaturen för ovansidan 42.9 °C / 109 F, jämfört med enhetsgenomsnittet på 33.9 °C / ## #class_avg_f### F.
(-) Handledsstöden och pekplattan kan bli väldigt varma vid beröring med maximalt 41.2 °C / 106.2 F.
(-) Medeltemperaturen för handledsstödsområdet på liknande enheter var 28.8 °C / 83.8 F (-12.4 °C / -22.4 F).
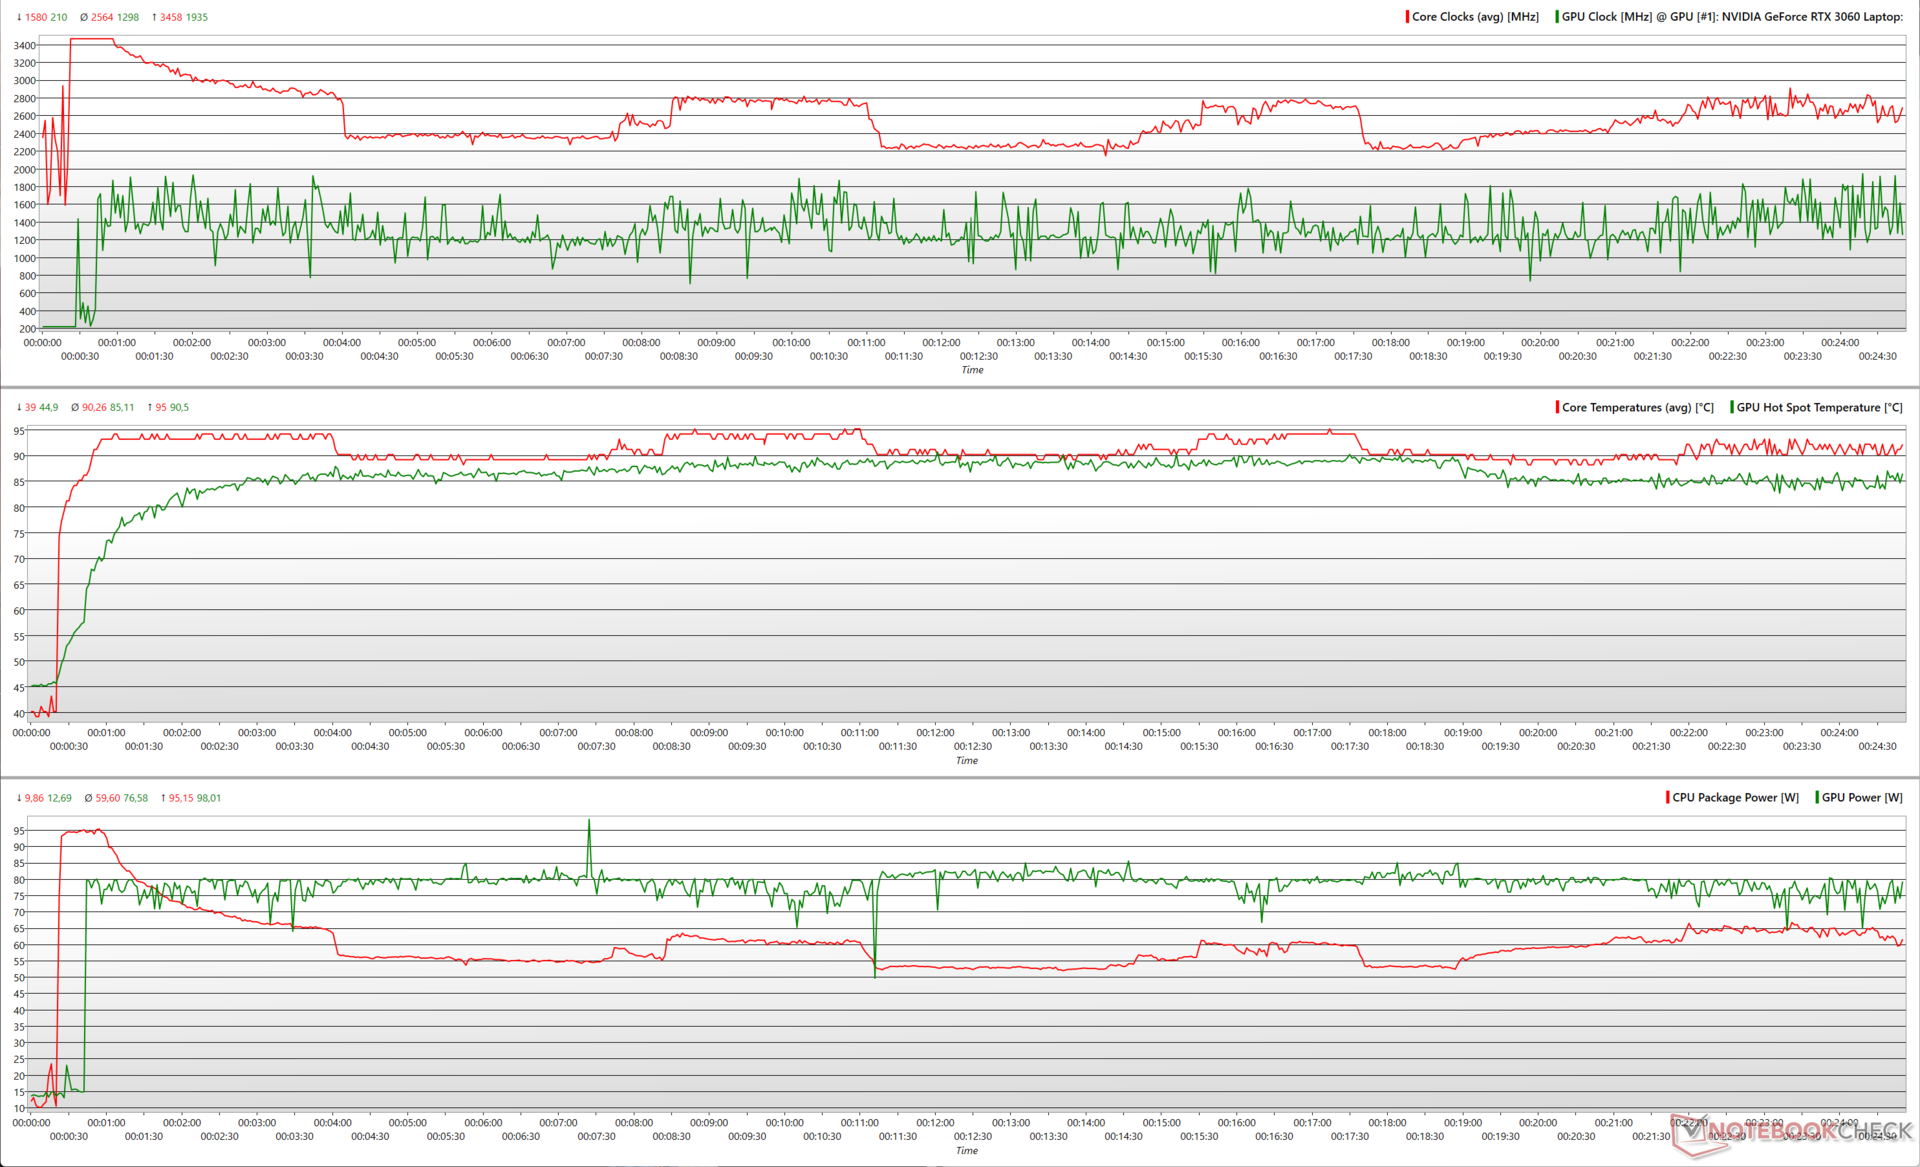
Vid en kombinerad Prime95- och FurMark-belastning når Core i5-12500H kortvarigt en topp på cirka 3,5 GHz vid 95 W innan den sjunker till cirka 2,5 GHz vid 60 W i genomsnitt. RTX 3060 Laptop GPU:n ligger på cirka 75,6 W i genomsnitt, men uppnår en topp på 98 W, vilket resulterar i en maximal kärnklocka på 1,9 GHz.
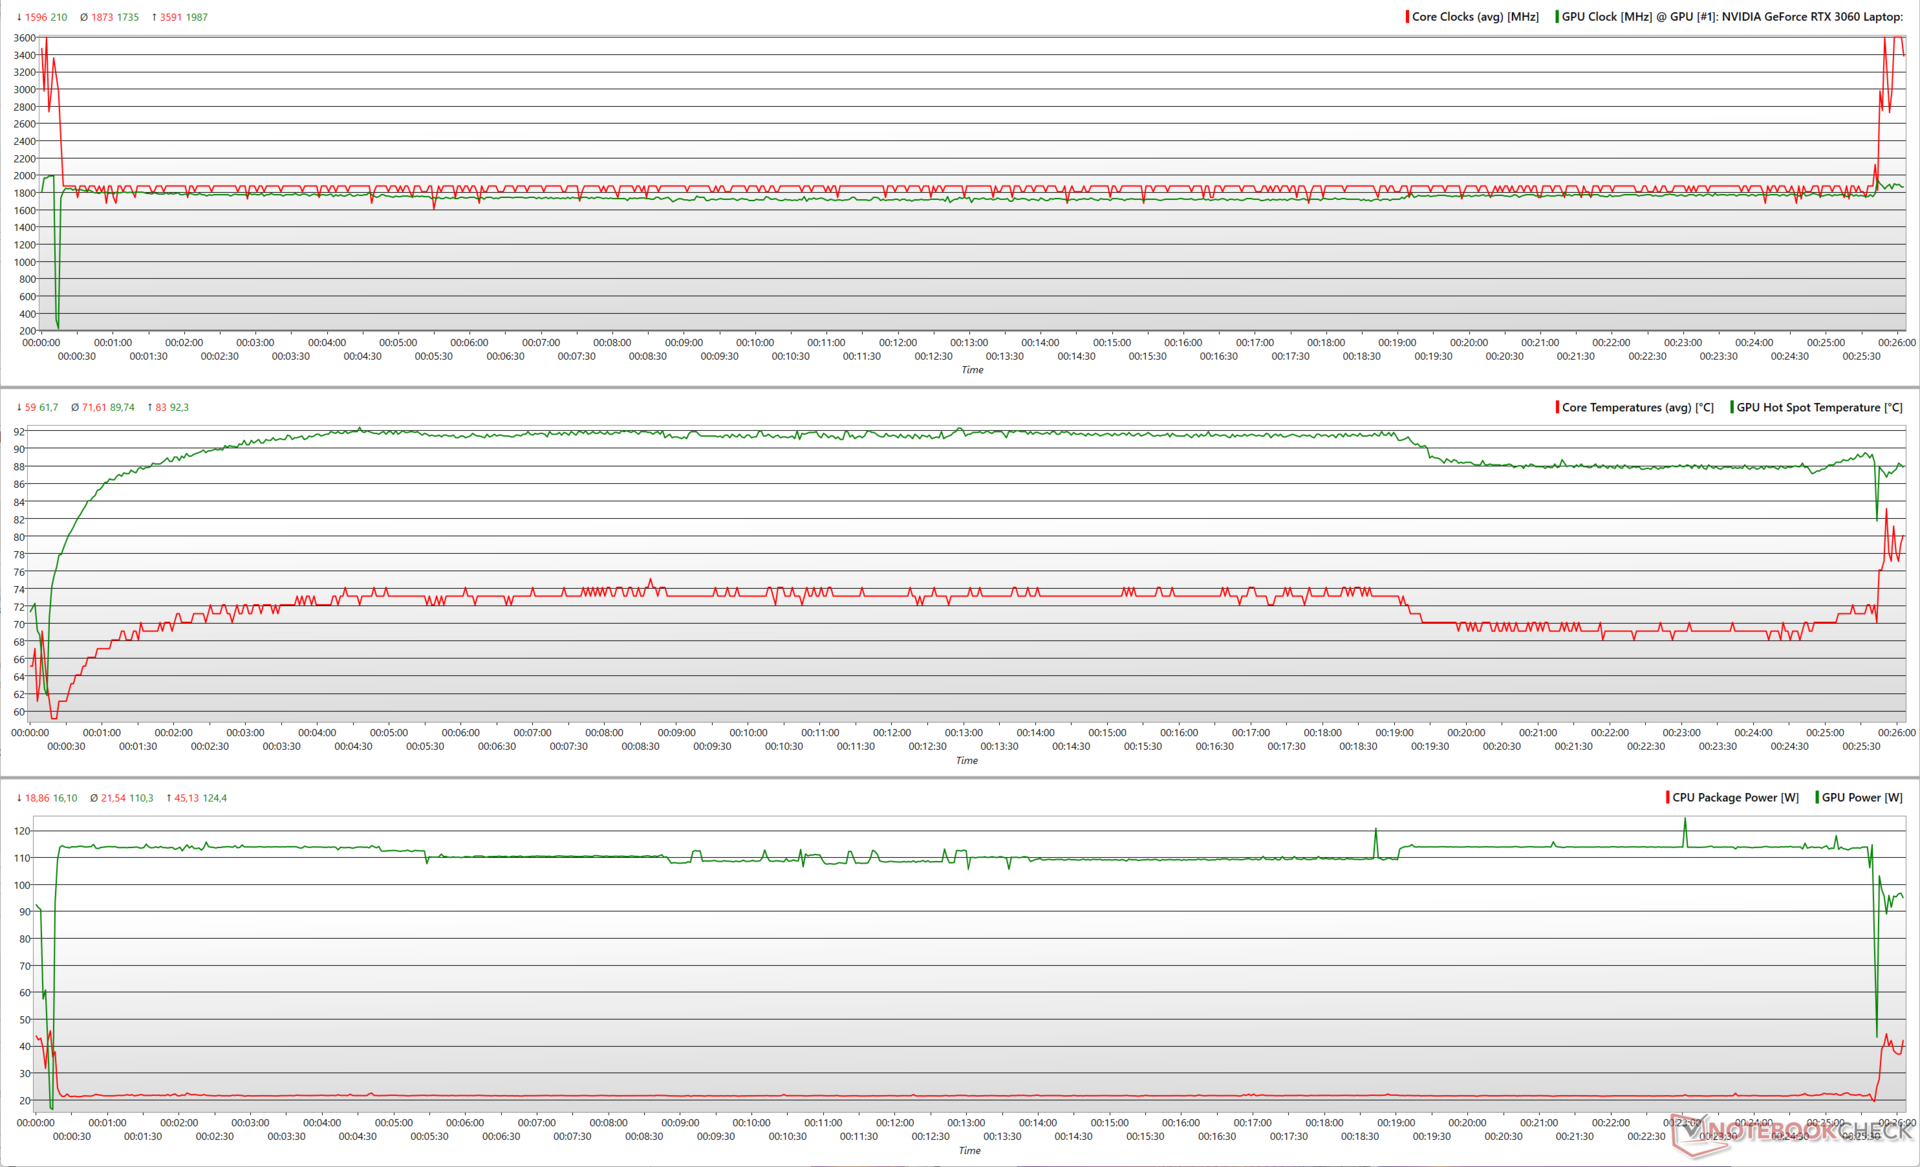
Vi ser liknande toppklockor under The Witcher 3 -stressen, men den genomsnittliga CPU-paketkraften sjunker ytterligare till cirka 21,5 W, vilket gör att RTX 3060 förbrukar upp till 110 W i genomsnitt.
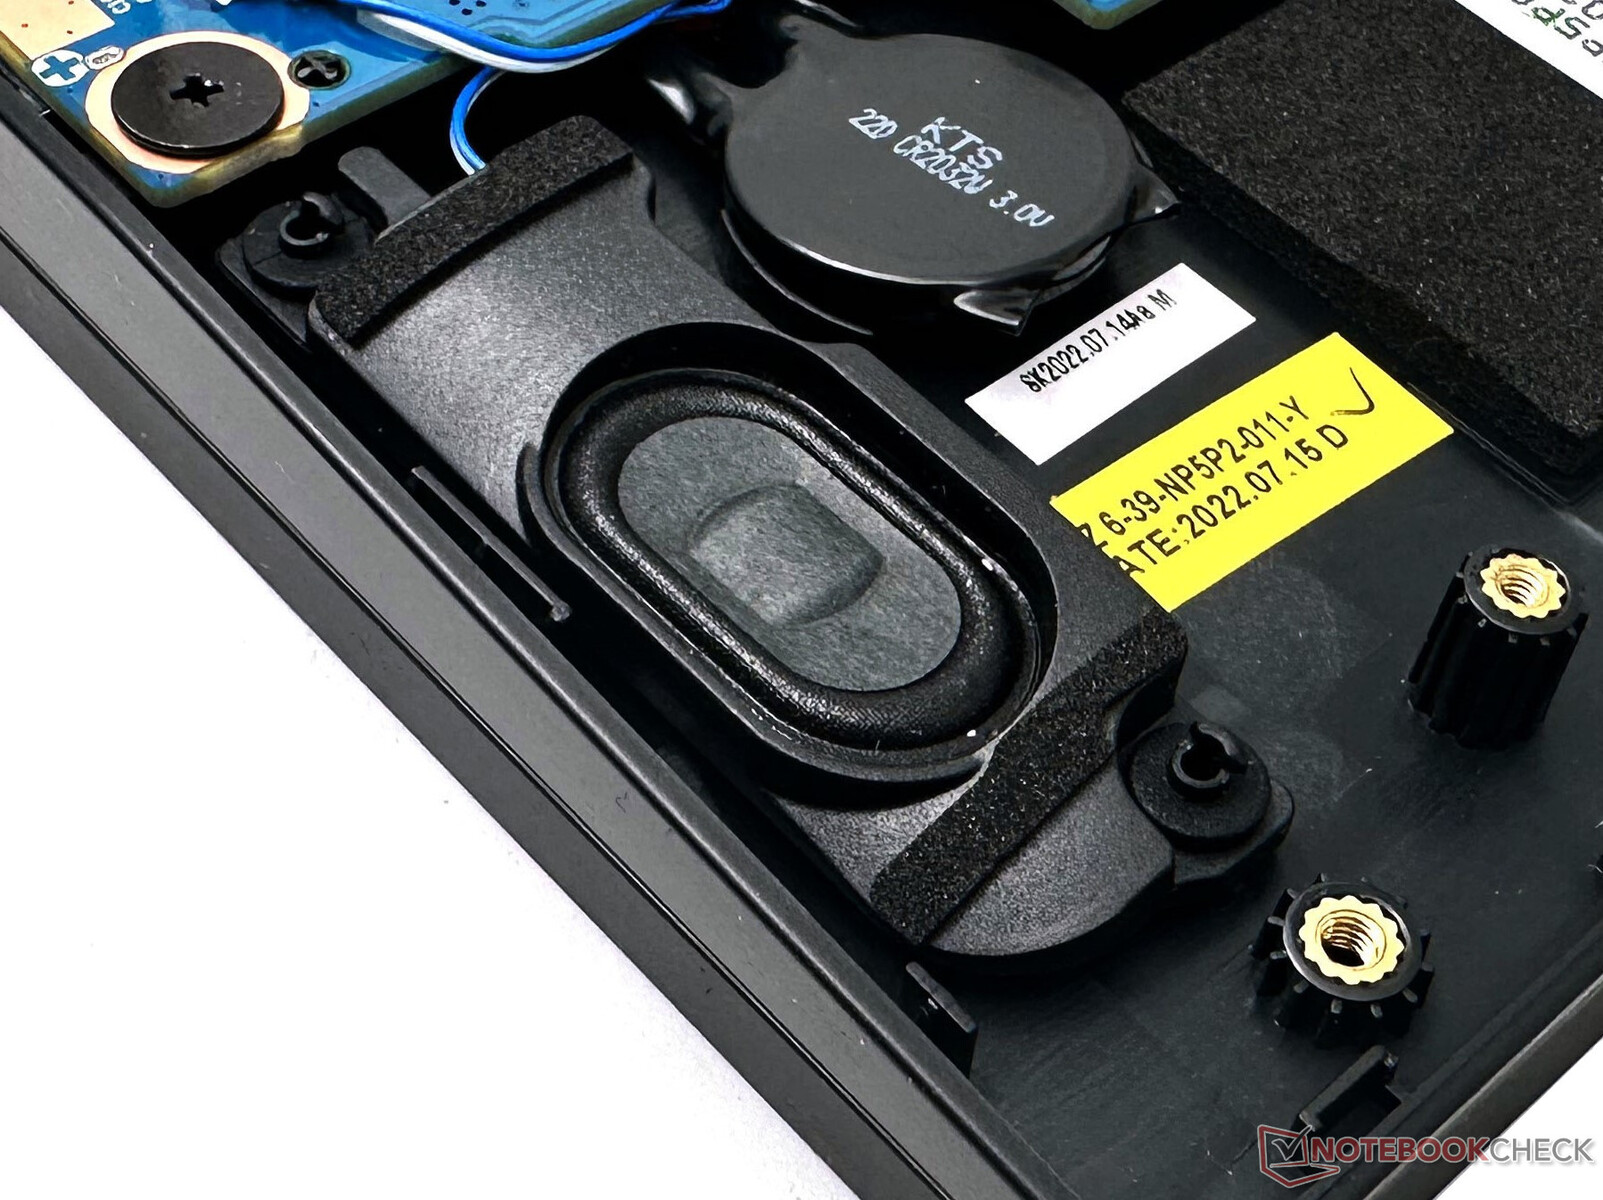
Högtalare
G5 KE:s högtalare är för det mesta ganska bra med en ljudstyrka på nära 75 dB(A). Bassresponsen är nästan obefintlig, men medel- och högljudda ljud återges på ett hyggligt sätt.
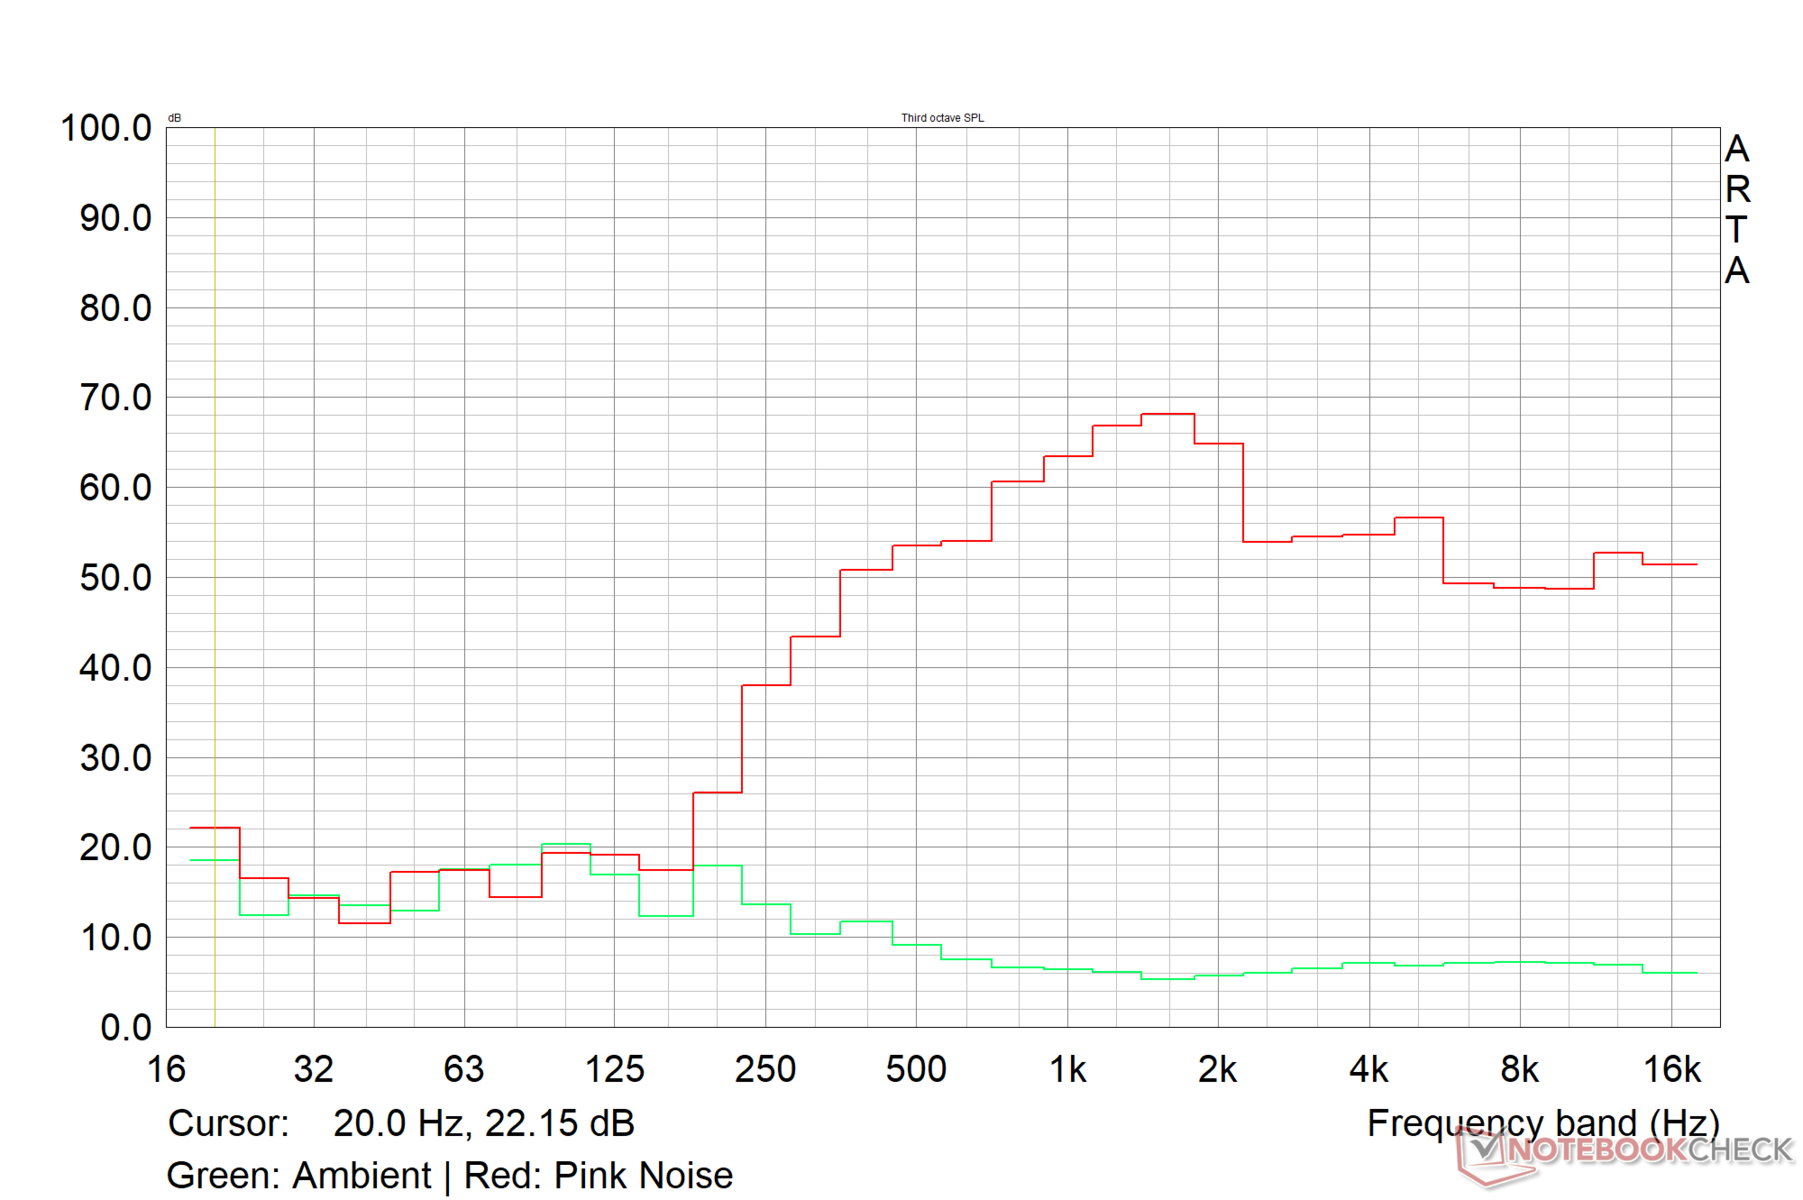
Gigabyte G5 KE ljudanalys
(±) | högtalarljudstyrkan är genomsnittlig men bra (73.6 dB)
Bas 100 - 315 Hz
(-) | nästan ingen bas - i genomsnitt 25.5% lägre än medianen
(±) | linjäriteten för basen är genomsnittlig (12% delta till föregående frekvens)
Mellan 400 - 2000 Hz
(±) | högre mellan - i genomsnitt 8.1% högre än median
(±) | linjäriteten för mids är genomsnittlig (7.7% delta till föregående frekvens)
Högsta 2 - 16 kHz
(+) | balanserade toppar - endast 2.9% från medianen
(+) | toppar är linjära (6.7% delta till föregående frekvens)
Totalt 100 - 16 000 Hz
(±) | linjäriteten för det totala ljudet är genomsnittlig (25.1% skillnad mot median)
Jämfört med samma klass
» 90% av alla testade enheter i den här klassen var bättre, 3% liknande, 7% sämre
» Den bästa hade ett delta på 6%, genomsnittet var 18%, sämst var 132%
Jämfört med alla testade enheter
» 77% av alla testade enheter var bättre, 5% liknande, 18% sämre
» Den bästa hade ett delta på 4%, genomsnittet var 24%, sämst var 134%
Apple MacBook Pro 16 2021 M1 Pro ljudanalys
(+) | högtalare kan spela relativt högt (84.7 dB)
Bas 100 - 315 Hz
(+) | bra bas - bara 3.8% från medianen
(+) | basen är linjär (5.2% delta till föregående frekvens)
Mellan 400 - 2000 Hz
(+) | balanserad mellan - endast 1.3% från medianen
(+) | mids är linjära (2.1% delta till föregående frekvens)
Högsta 2 - 16 kHz
(+) | balanserade toppar - endast 1.9% från medianen
(+) | toppar är linjära (2.7% delta till föregående frekvens)
Totalt 100 - 16 000 Hz
(+) | det totala ljudet är linjärt (4.6% skillnad mot median)
Jämfört med samma klass
» 0% av alla testade enheter i den här klassen var bättre, 0% liknande, 100% sämre
» Den bästa hade ett delta på 5%, genomsnittet var 17%, sämst var 45%
Jämfört med alla testade enheter
» 0% av alla testade enheter var bättre, 0% liknande, 100% sämre
» Den bästa hade ett delta på 4%, genomsnittet var 24%, sämst var 134%
Energiförvaltning: Sparsam strömförbrukning vid tomgång med medelmåttig batteritid
Effektförbrukning
Gigabyte G5 KE är betydligt mer sparsam när det gäller strömförbrukning än G7 KE, särskilt i tomgång.
The Lenovo IdeaPad Gaming 3's RTX 3050 Ti GPU för bärbar dator och HP Victus kombination av en 95 W RTX 3060 och en 95 W RTX 3060 Ryzen 7 5800H hjälper dessa enheter att förbruka jämförelsevis mindre ström totalt sett.
| Av/Standby | |
| Låg belastning | |
| Hög belastning |
|
Förklaring:
min: | |
| Gigabyte G5 KE i5-12500H, GeForce RTX 3060 Laptop GPU, IPS, 1920x1080, 15.6" | Lenovo IdeaPad Gaming 3 15IAH7 i5-12500H, GeForce RTX 3050 Ti Laptop GPU, IPS, 1920x1080, 15.6" | Gigabyte G7 KE i5-12500H, GeForce RTX 3060 Laptop GPU, IPS, 1920x1080, 17.3" | Schenker XMG Core 15 (M22) R7 6800H, GeForce RTX 3060 Laptop GPU, IPS, 2560x1440, 15.6" | Dell G16 7620 i7-12700H, GeForce RTX 3060 Laptop GPU, IPS, 2560x1600, 16" | Asus TUF Gaming F15 FX507ZM i7-12700H, GeForce RTX 3060 Laptop GPU, IPS, 1920x1080, 15.6" | HP Victus 16-e0179ng R7 5800H, GeForce RTX 3060 Laptop GPU, IPS, 1920x1080, 16.1" | Genomsnitt NVIDIA GeForce RTX 3060 Laptop GPU | Genomsnitt av klass Gaming | |
|---|---|---|---|---|---|---|---|---|---|
| Power Consumption | 9% | -33% | -14% | -42% | -8% | 9% | -18% | -41% | |
| Idle Minimum * (Watt) | 7.66 | 8 -4% | 15 -96% | 11.8 -54% | 14.4 -88% | 6.3 18% | 5 35% | 10.4 ? -36% | 13.2 ? -72% |
| Idle Average * (Watt) | 10.3 | 10 3% | 17 -65% | 14.7 -43% | 17.8 -73% | 9.8 5% | 10 3% | 14.5 ? -41% | 18.9 ? -83% |
| Idle Maximum * (Watt) | 16.05 | 16 -0% | 24 -50% | 15 7% | 31.5 -96% | 26.5 -65% | 20 -25% | 21.4 ? -33% | 24.3 ? -51% |
| Load Average * (Watt) | 115.8 | 99 15% | 111 4% | 100 14% | 101.2 13% | 103.8 10% | 108 7% | 109.3 ? 6% | 108 ? 7% |
| Witcher 3 ultra * (Watt) | 168.7 | 144.6 14% | 174.1 -3% | 184 -9% | 176.9 -5% | 189 -12% | 145 14% | ||
| Load Maximum * (Watt) | 234.6 | 168 28% | 208 11% | 237 -1% | 242.9 -4% | 241.9 -3% | 189 19% | 206 ? 12% | 254 ? -8% |
* ... mindre är bättre
Power Consumption: The Witcher 3 / Stress test
Power Consumption: External monitor
Batteritid
Gigabyte G5 KE:s batteritid är på den lägre sidan även vid en minskad ljusstyrka på 150 nits. Detta är dock inte ovanligt med bärbara datorer för spel.
I likhet med våra observationer med G7 KE noterade vi en drastiskt låg drifttid på strax över två timmar i vårt loop-test för uppspelning av H.264 1080p-video i loop vid 150 nits, även med alla enheter och OS-patchar uppdaterade.
För
Emot
Domslut: Mainstream-gamer med oundvikliga kompromisser
Medan Gigabyte snart kommer att göra en mängd uppdaterade Intel 13th gen och RTX 40-serien Aorus, Aero och Gigabyte bärbara datorer tillgängliga under de kommande veckorna, är G5 KE med en Intel Core i5-12500H CPU och Nvidia RTX 3060 GPU för bärbara datorer fortfarande ett bra alternativ för vanliga spelare.
Gigabyte utnyttjar kombinationen Core i5-12500H och RTX 3060 Laptop GPU på ett bra sätt, och vi hittar inga oönskade problem med den totala prestandan. Kylningsarrangemanget med dubbla fläktar och fyra värmerör gör bra ifrån sig för att se till att den underliggande hårdvaran inte stryps under belastning.
Gigabyte G5 KE framstår som en kapabel mainstream laptop för 1080p Ultra gaming med mycket bra CPU- och GPU-prestanda. Den brister dock på andra områden som kan vara kritiska eller inte beroende på dina prioriteringar.
Med det sagt är skärmen undermålig jämfört med 2023 års standarder, särskilt när konkurrerande enheter som t.ex Lenovo IdeaPad Gaming 3, Schenker XMG Core 15 (M22),Asus TUF Gaming F15och Gigabytes egen G7 KE erbjuder mycket överlägsna paneler med bred färgskala och snabba svarstider.
Andra framträdande brister är en SSD som stryps drastiskt under belastning, höga yttemperaturer, högljudda fläktar och dålig batteritid vid videouppspelning.
Om dessa kompromisser inte spelar någon större roll för dig är Gigabyte G5 KE en hyfsad bärbar dator i mellanklassen för FHD-spel från en ren prestationssynpunkt som bör tjäna dig väl in i 2023.
Pris och tillgänglighet
I Indien säljs Gigabyte G5 KE för närvarande på Flipkart till ett rabatterat pris av ₹94 990 medan Amazon India erbjuder G5 ME med RTX 3050 Ti för ₹95 901.
G5 KE med en RTX 3060 är lite svår att hitta på internationella marknader eftersom den bärbara datorn håller på att ersättas av en RTX 4050- eller RTX 4060-baserad konfiguration.
Gigabyte G5 KE
- 04/24/2023 v7 (old)
Vaidyanathan Subramaniam
Genomskinlighet
Valet av enheter som ska granskas görs av vår redaktion. Testprovet gavs till författaren som ett lån av tillverkaren eller återförsäljaren för denna recension. Långivaren hade inget inflytande på denna recension och inte heller fick tillverkaren en kopia av denna recension innan publiceringen. Det fanns ingen skyldighet att publicera denna recension. Som ett oberoende medieföretag är Notebookcheck inte föremål för auktoritet från tillverkare, återförsäljare eller förlag.
This is how Notebookcheck is testingEvery year, Notebookcheck independently reviews hundreds of laptops and smartphones using standardized procedures to ensure that all results are comparable. We have continuously developed our test methods for around 20 years and set industry standards in the process. In our test labs, high-quality measuring equipment is utilized by experienced technicians and editors. These tests involve a multi-stage validation process. Our complex rating system is based on hundreds of well-founded measurements and benchmarks, which maintains objectivity.
Price comparison

