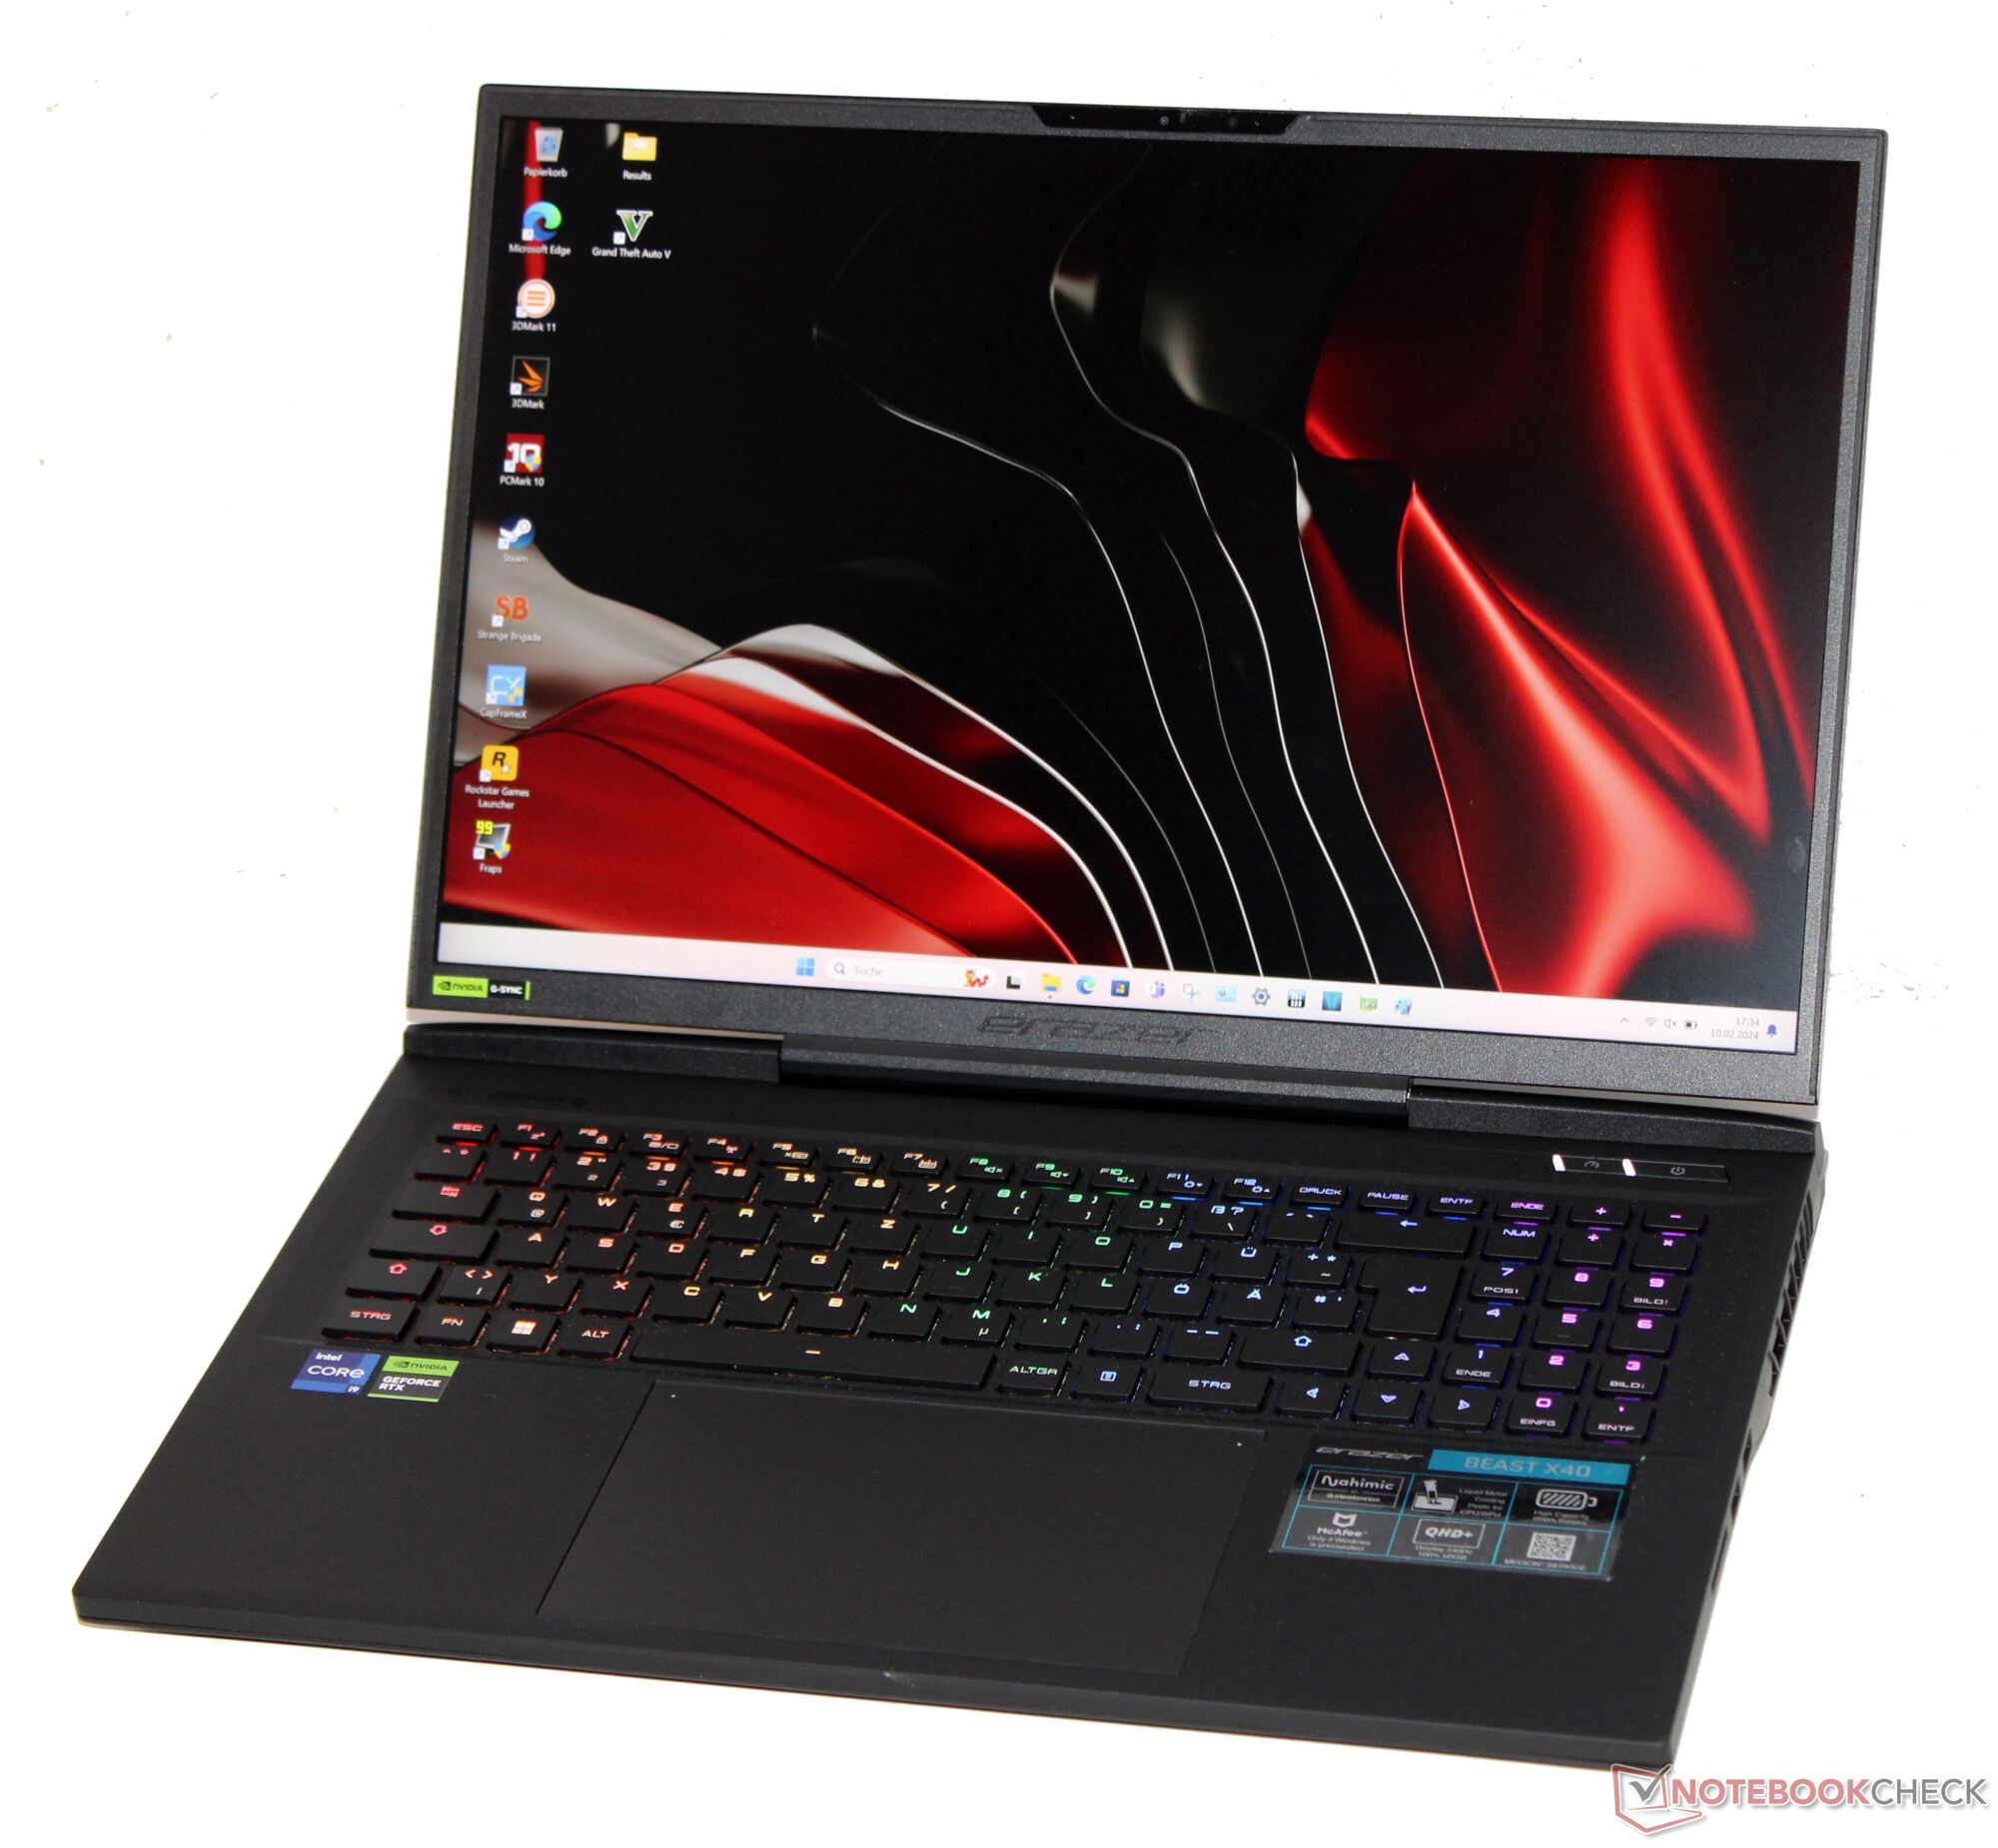
Medion Erazer Beast X40 (2024) Recension: Avancerad bärbar gamingdator med RTX 4090 och mekaniskt tangentbord

Medion Beast X40 är en av de mest kraftfulla bärbara datorerna som finns tillgängliga för närvarande. Intel Raptor Lake, Nvidia Ada Lovelace, 2 TB lagringsutrymme och 32 GB RAM-minne gör att datorn klarar streaming, rendering och spel samtidigt som den kostar en bomb på cirka 4 000 euro.
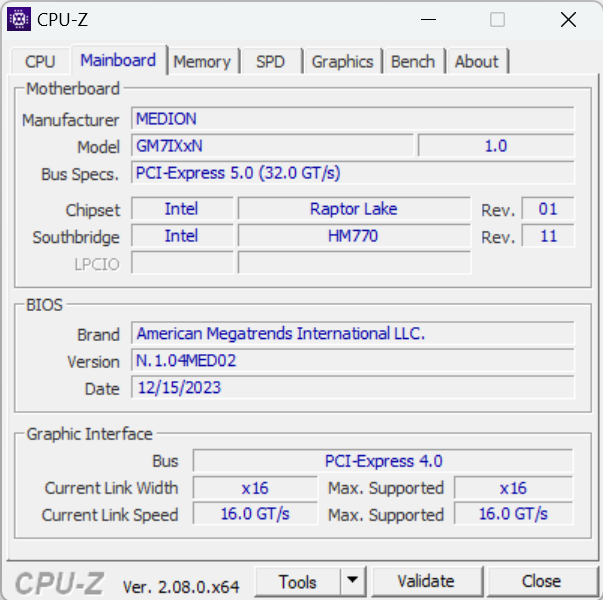
Precis som var fallet med föregångareär det ett Tongfang barebone-chassi (GM7IX9N) som ligger till grund för konstruktionen av Beast X40. Konkurrensen inkluderar bärbara speldatorer som Asus ROG Strix Scar 17 G733PYV, den Schenker Key 17 Pro (Tidig 23)och MSI Titan 18 HX A14VIG.
Potentiella konkurrenter i jämförelse
Gradering | Datum | Modell | Vikt | Höjd | Storlek | Upplösning | Pris |
|---|---|---|---|---|---|---|---|
| 89.2 % v7 (old) | 02/2024 | Medion Erazer Beast X40 2024 i9-14900HX, GeForce RTX 4090 Laptop GPU | 2.9 kg | 36 mm | 17.00" | 2560x1600 | |
| 87.2 % v7 (old) | 08/2023 | Asus ROG Strix Scar 17 G733PYV-LL053X R9 7945HX3D, GeForce RTX 4090 Laptop GPU | 2.9 kg | 28.3 mm | 17.30" | 2560x1440 | |
| 85.5 % v7 (old) | 06/2023 | Schenker Key 17 Pro (Early 23) i9-13900HX, GeForce RTX 4090 Laptop GPU | 3.4 kg | 24.9 mm | 17.30" | 3840x2160 | |
| 88.3 % v7 (old) | 02/2024 | Asus ROG Strix Scar 18 G834JYR (2024) i9-14900HX, GeForce RTX 4090 Laptop GPU | 3.1 kg | 30.8 mm | 18.00" | 2560x1600 | |
| 88.8 % v7 (old) | 01/2024 | MSI Titan 18 HX A14VIG i9-14900HX, GeForce RTX 4090 Laptop GPU | 3.6 kg | 32.1 mm | 18.00" | 3840x2400 |
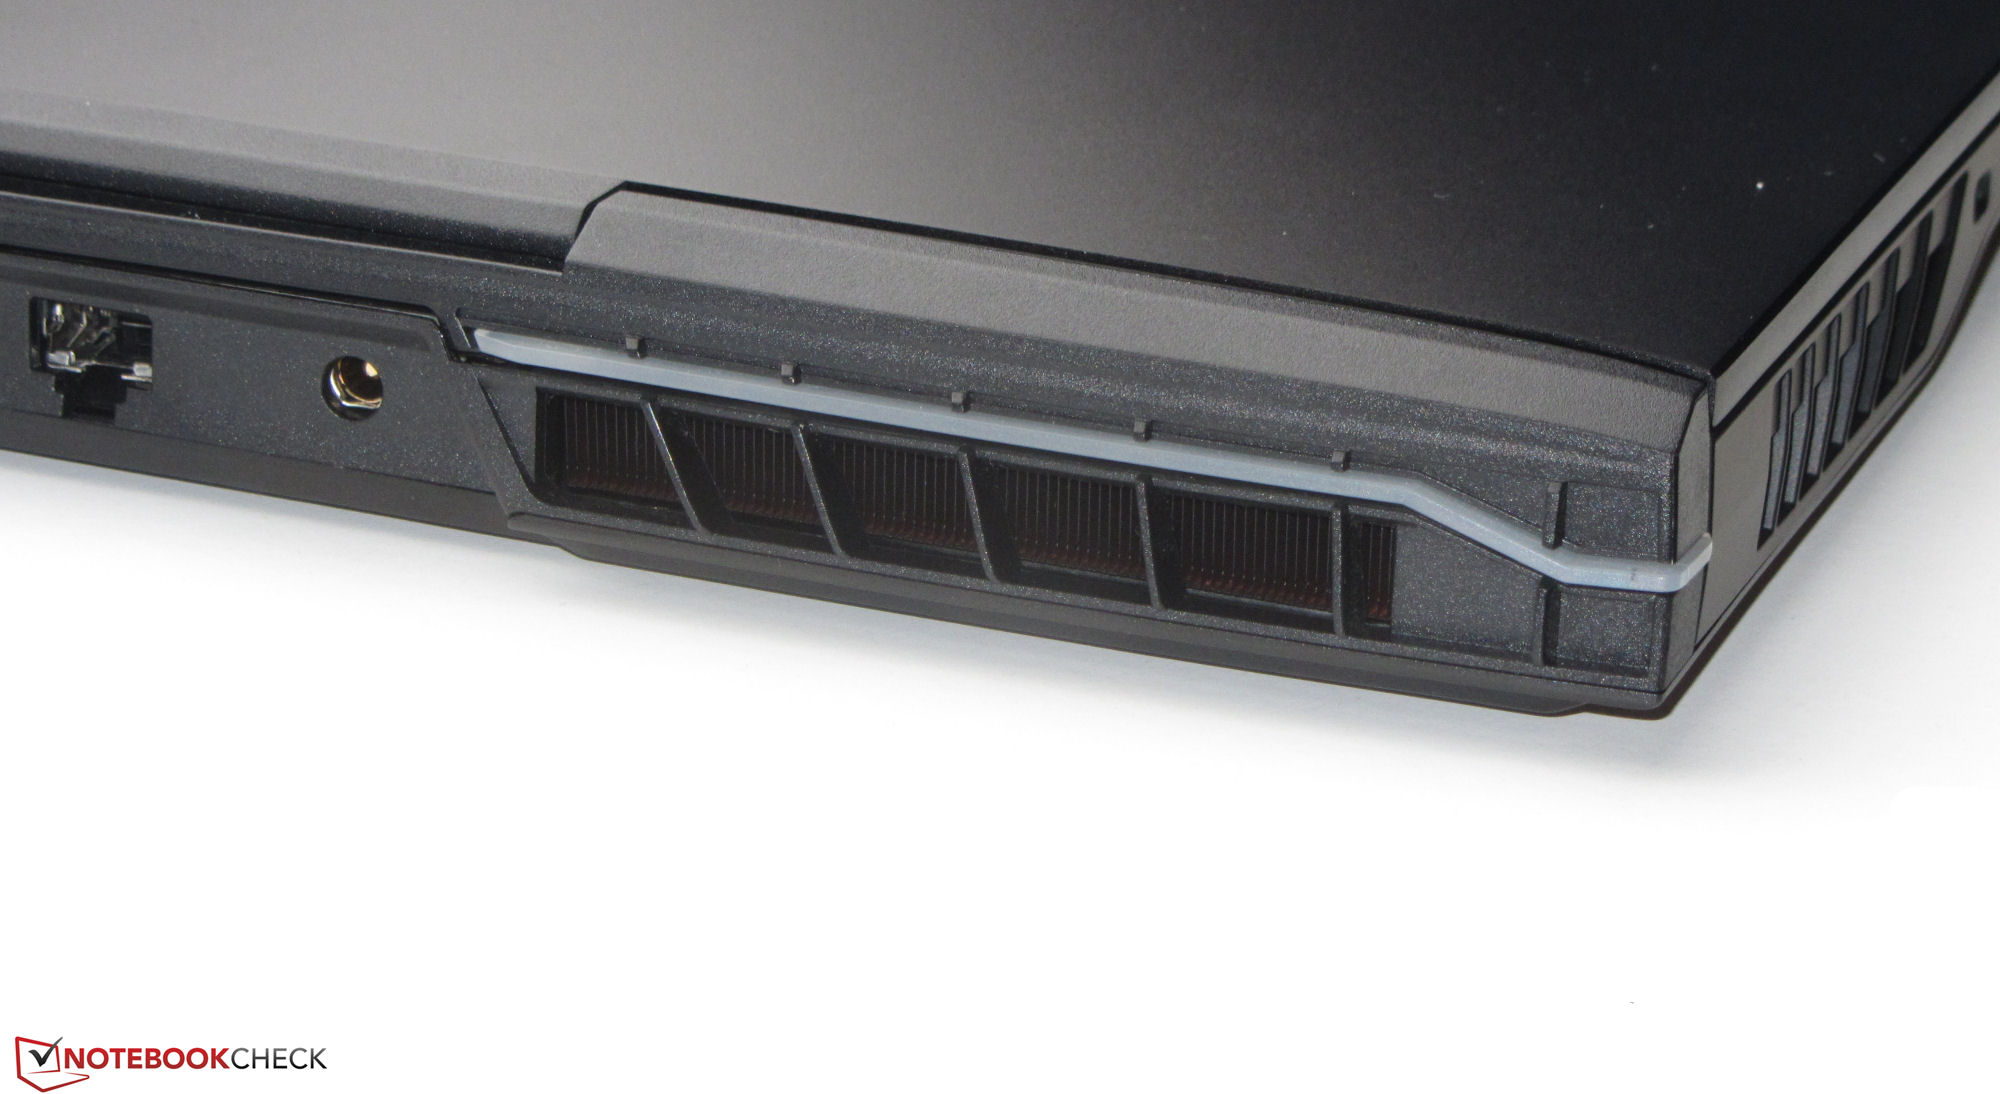
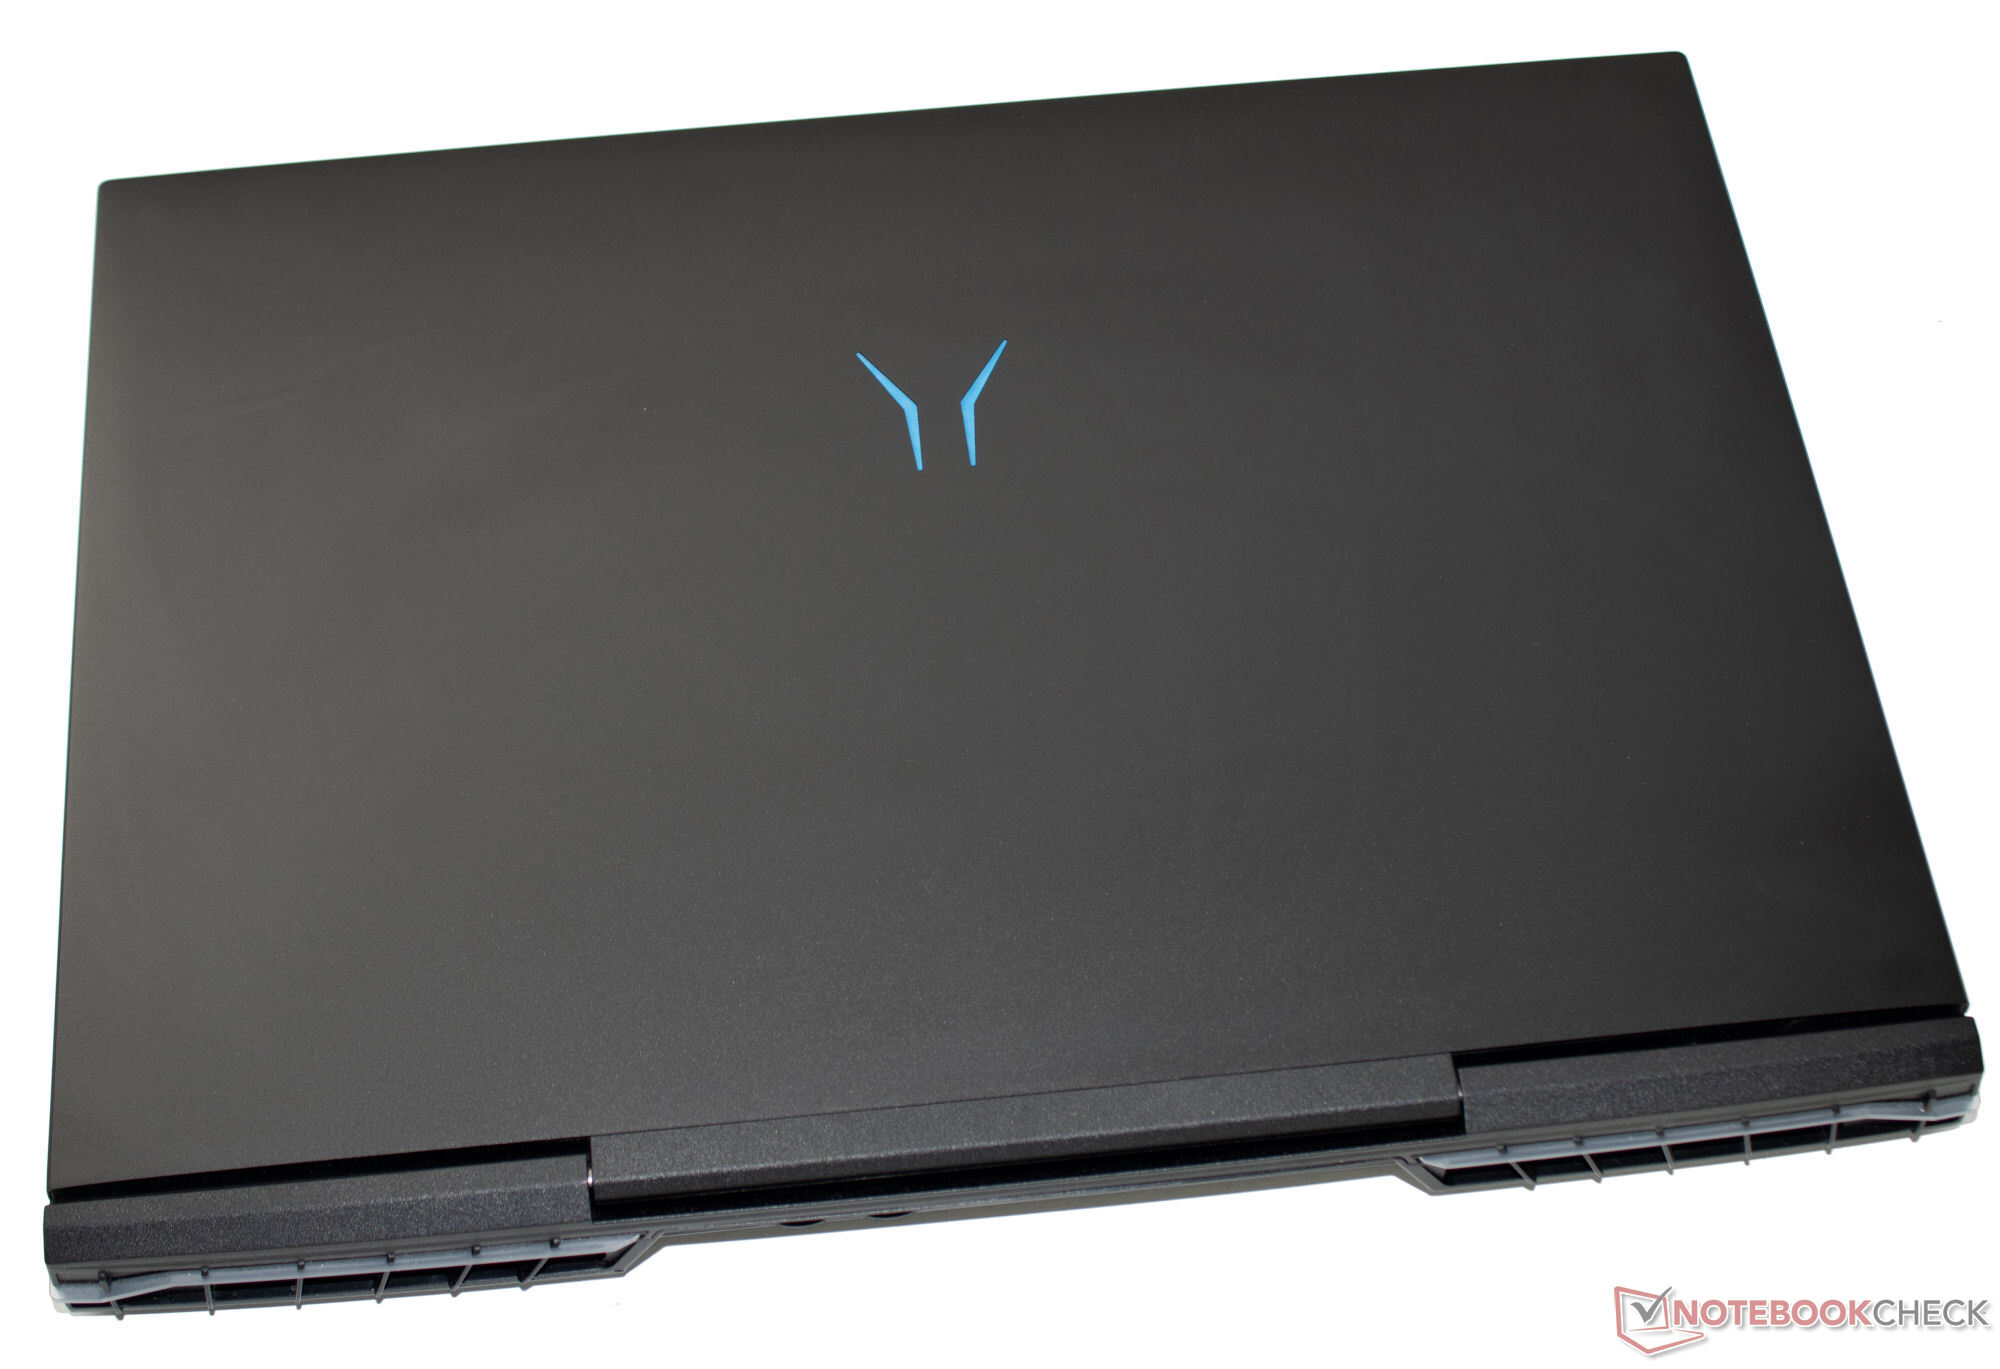
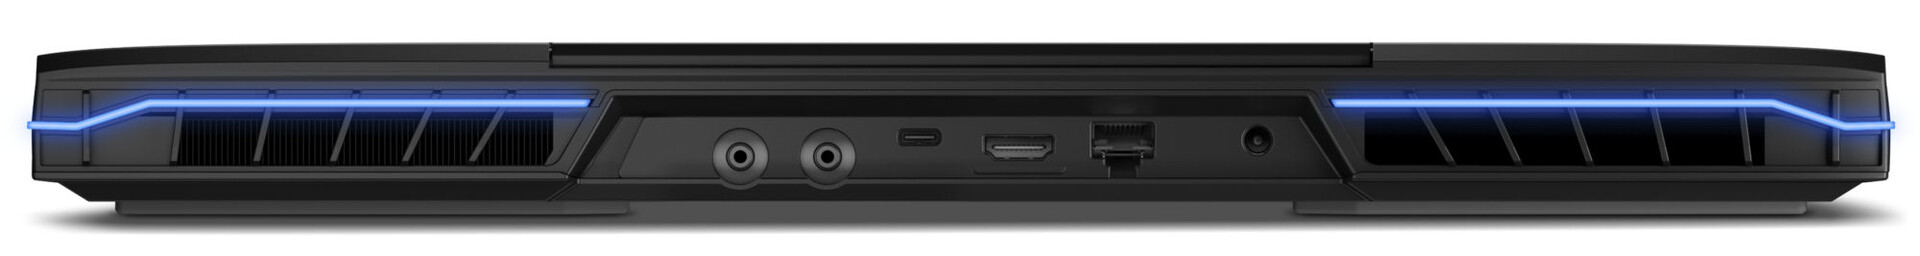
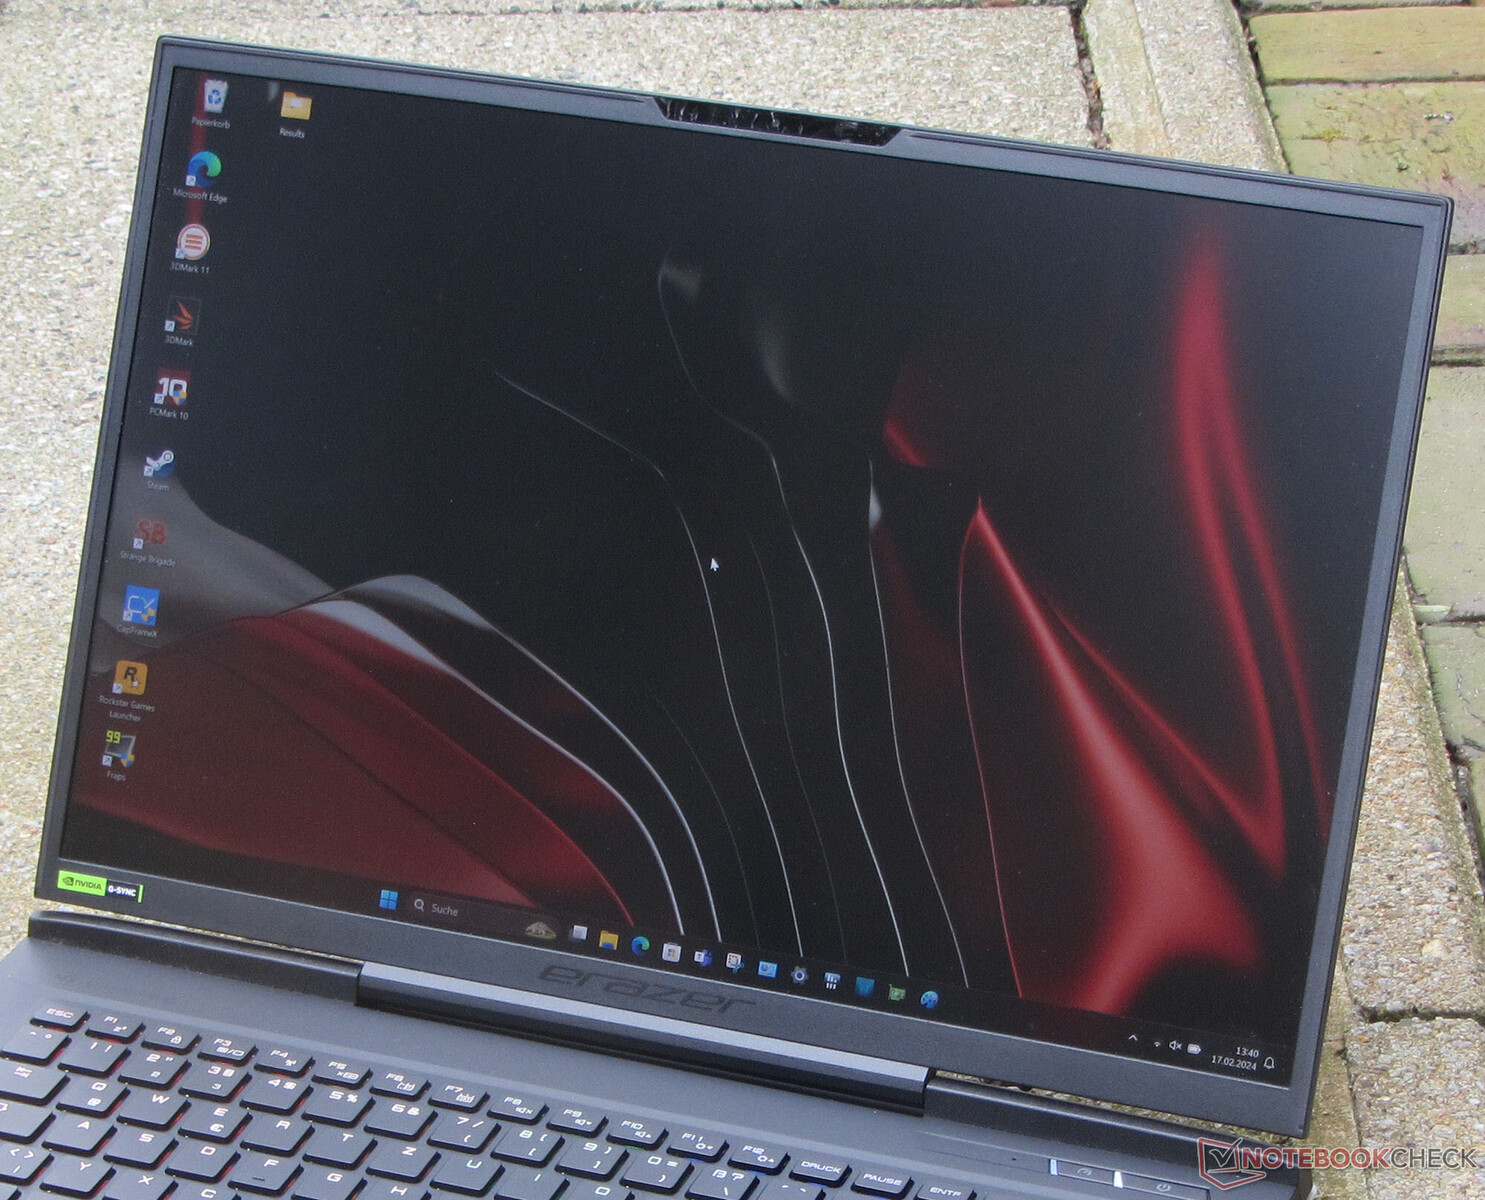
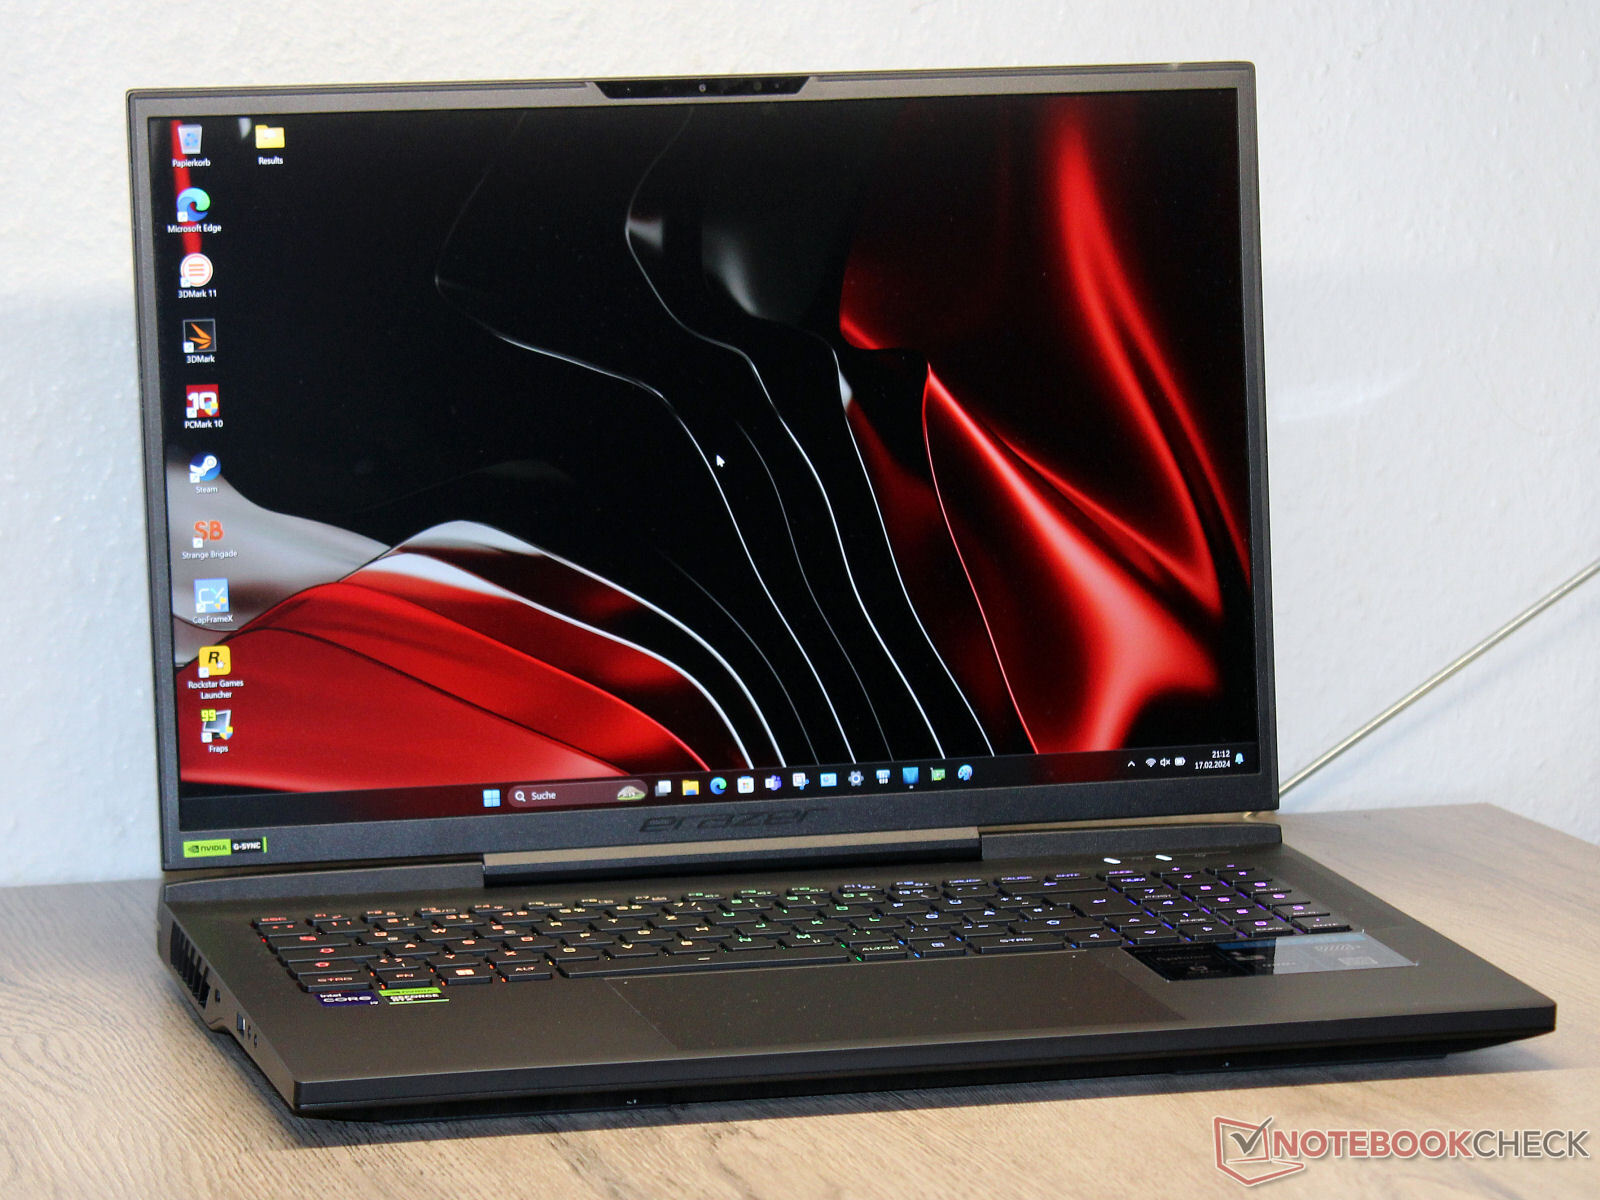
Chassi och funktioner: Beast X40 erbjuder Thunderbolt 4
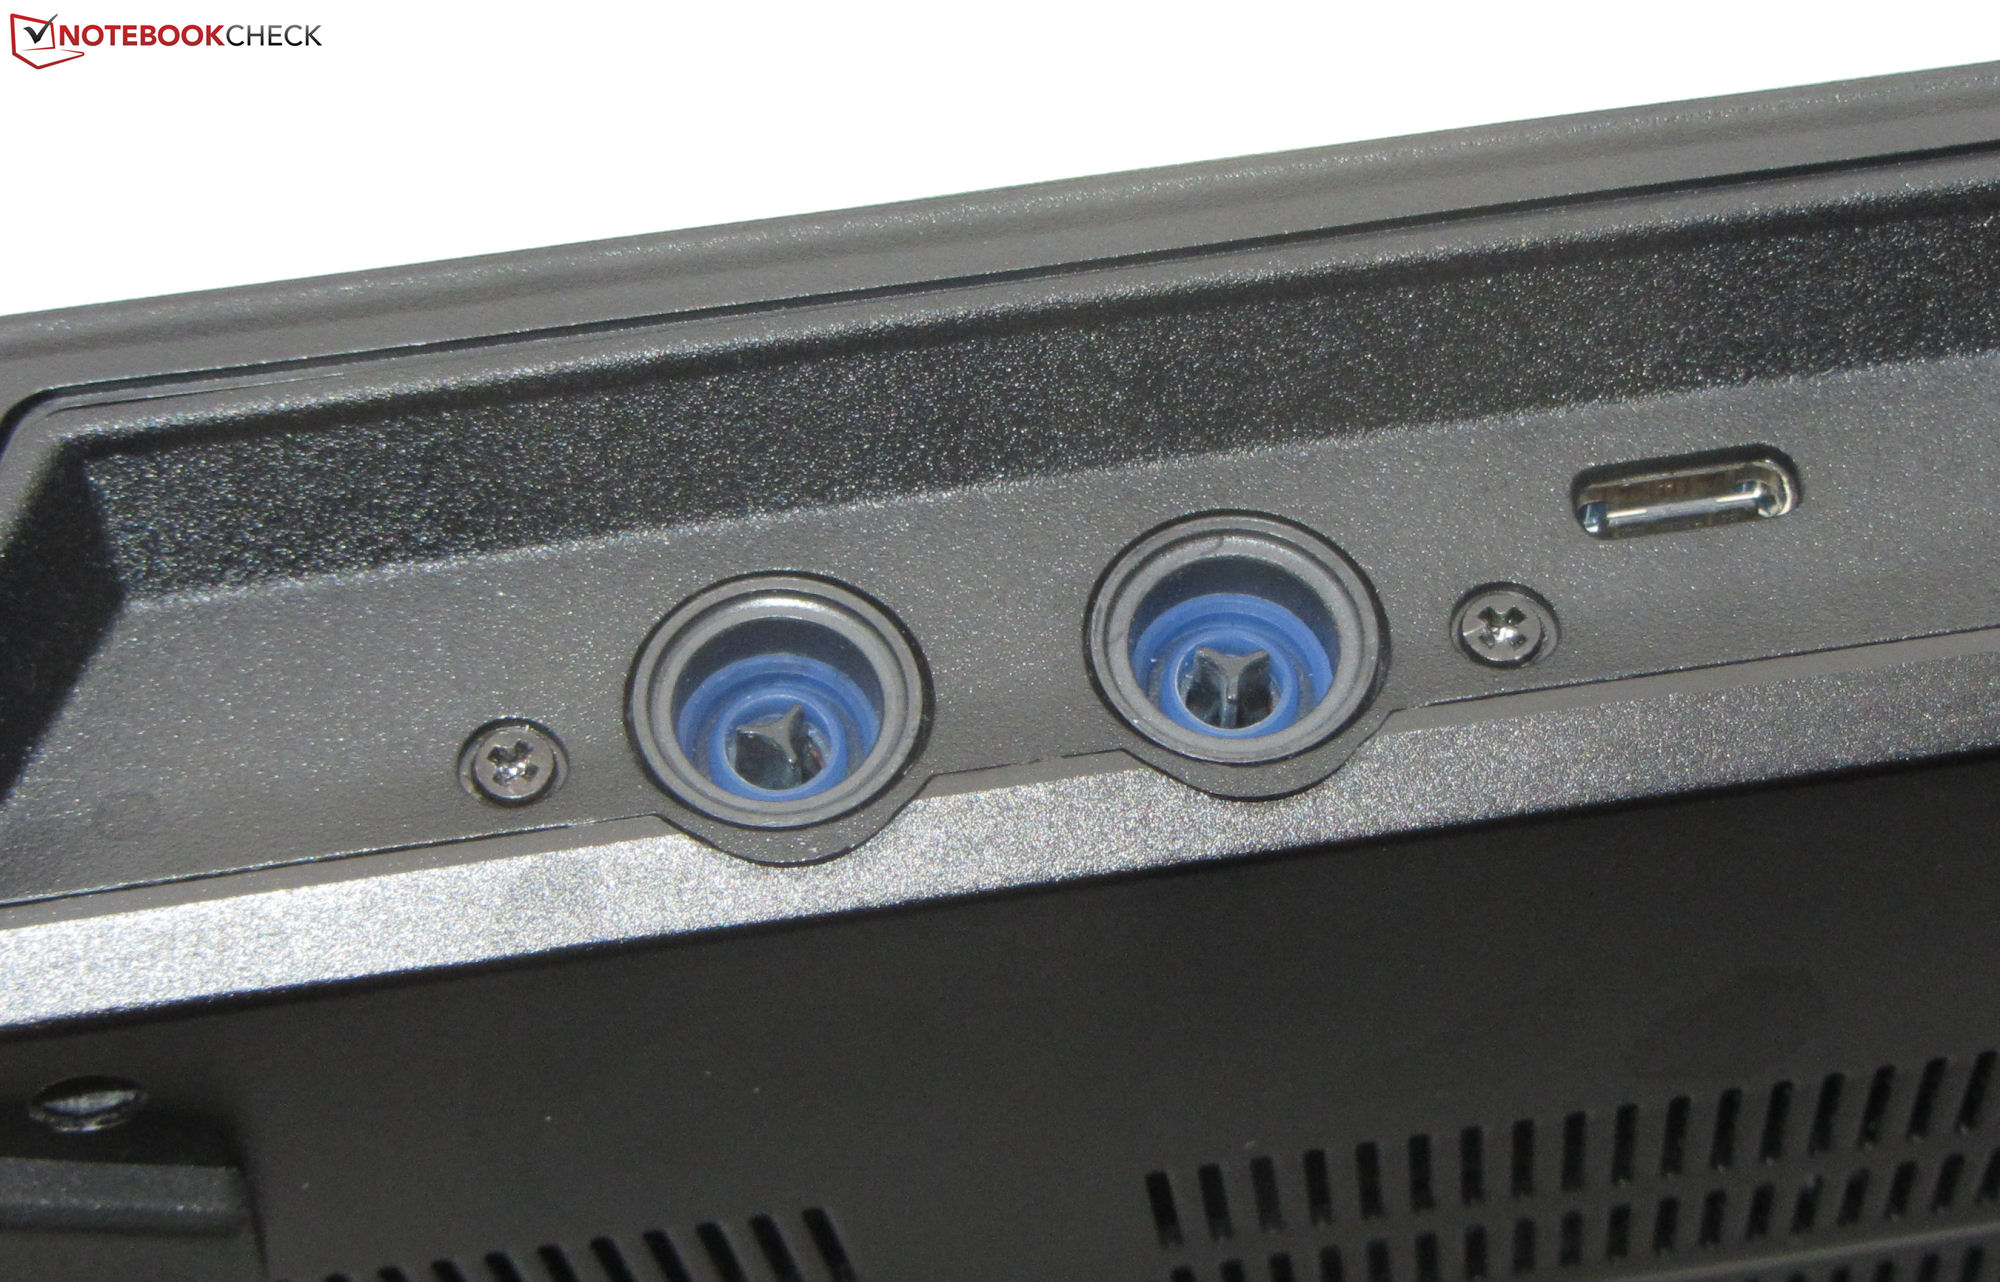
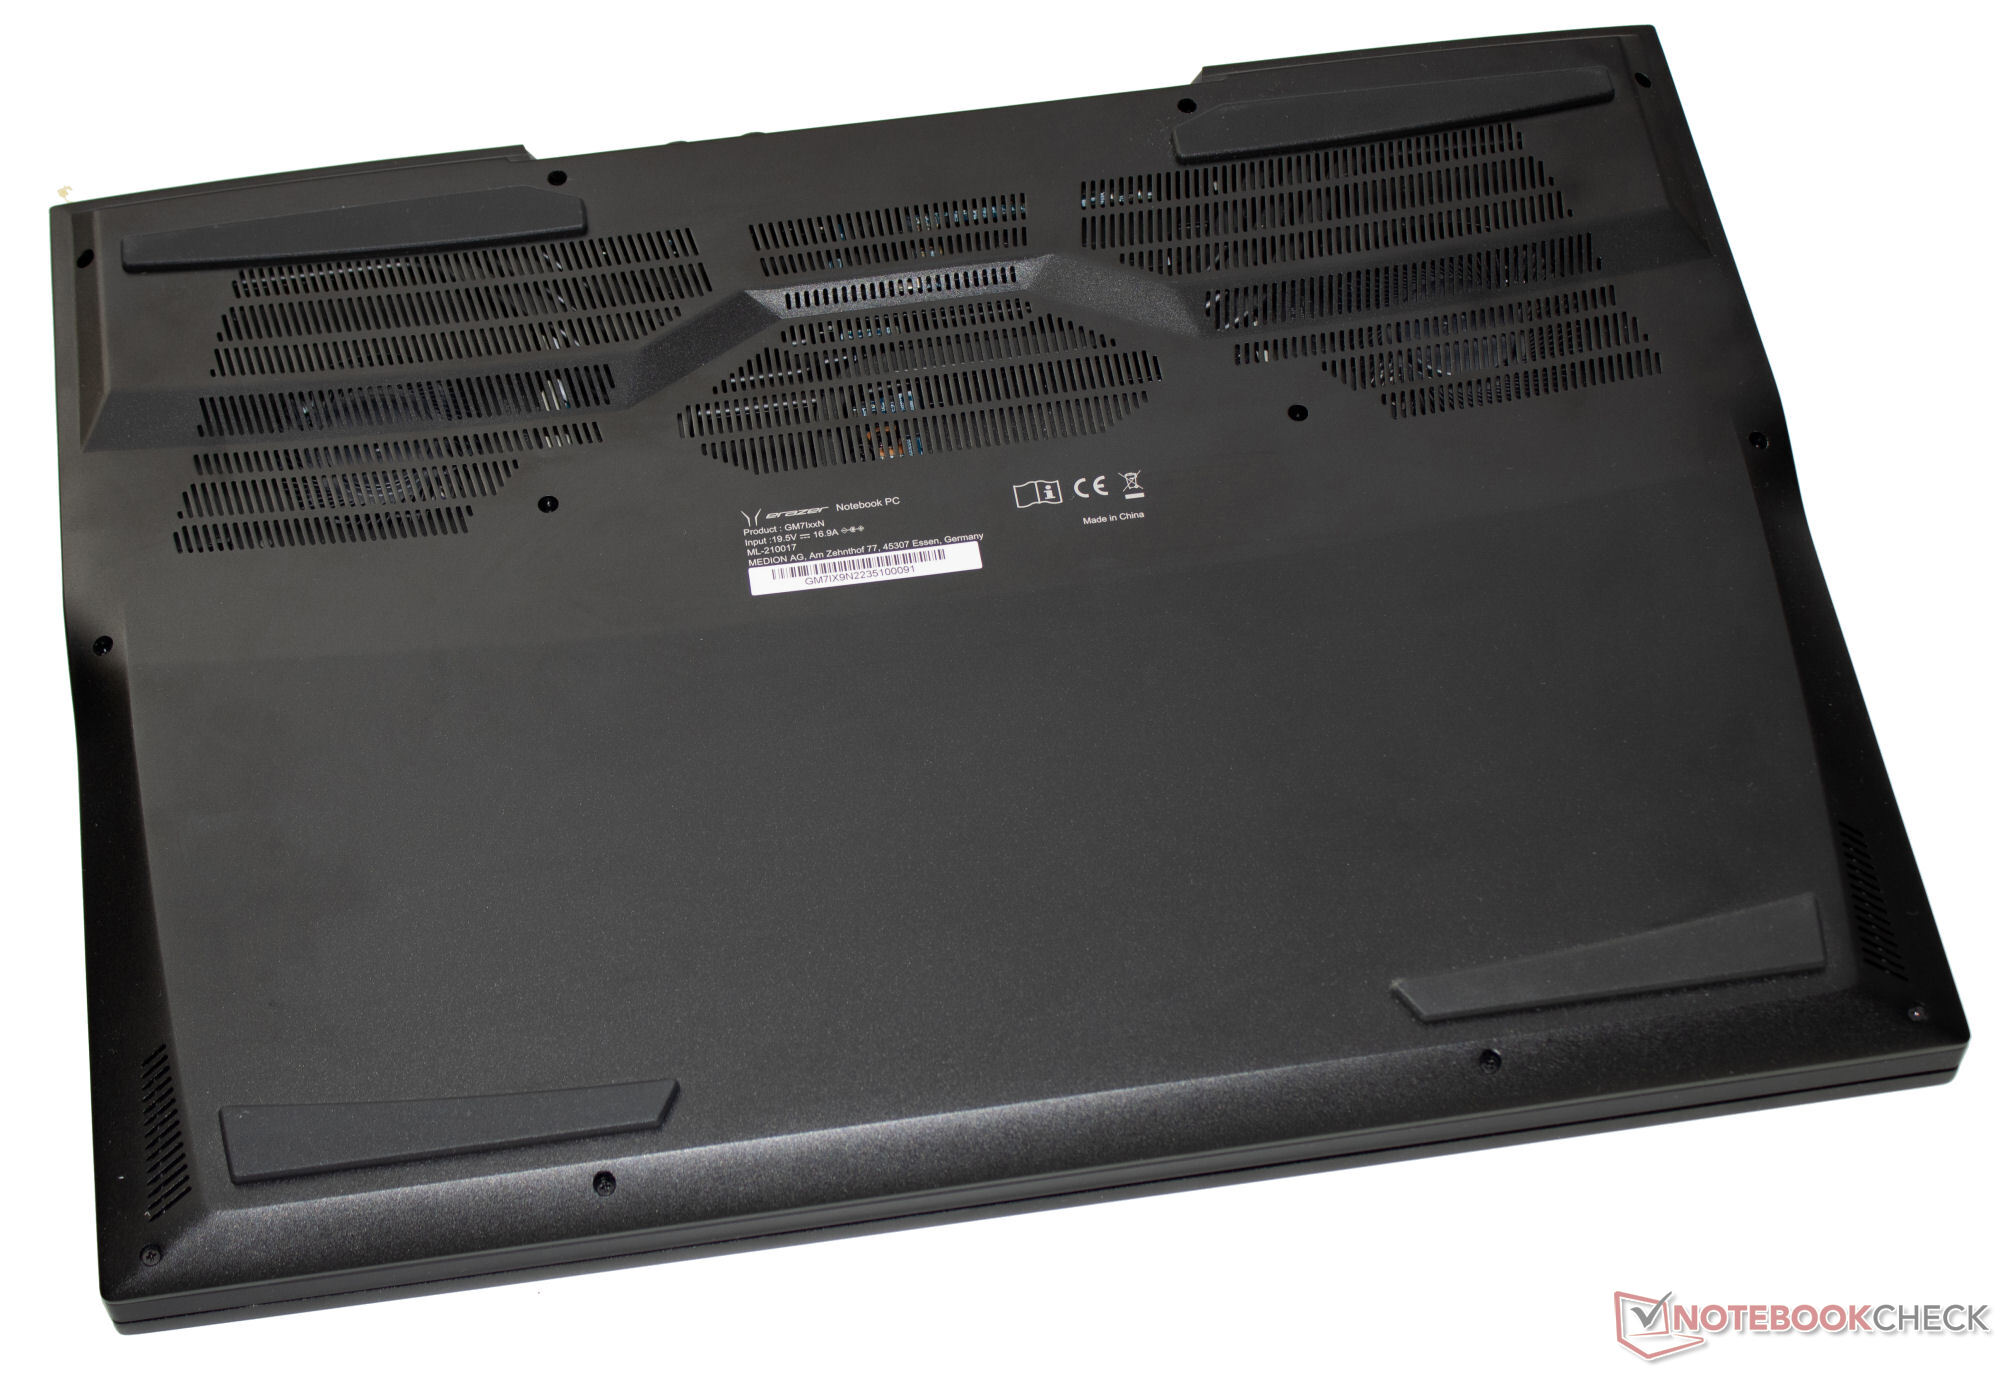
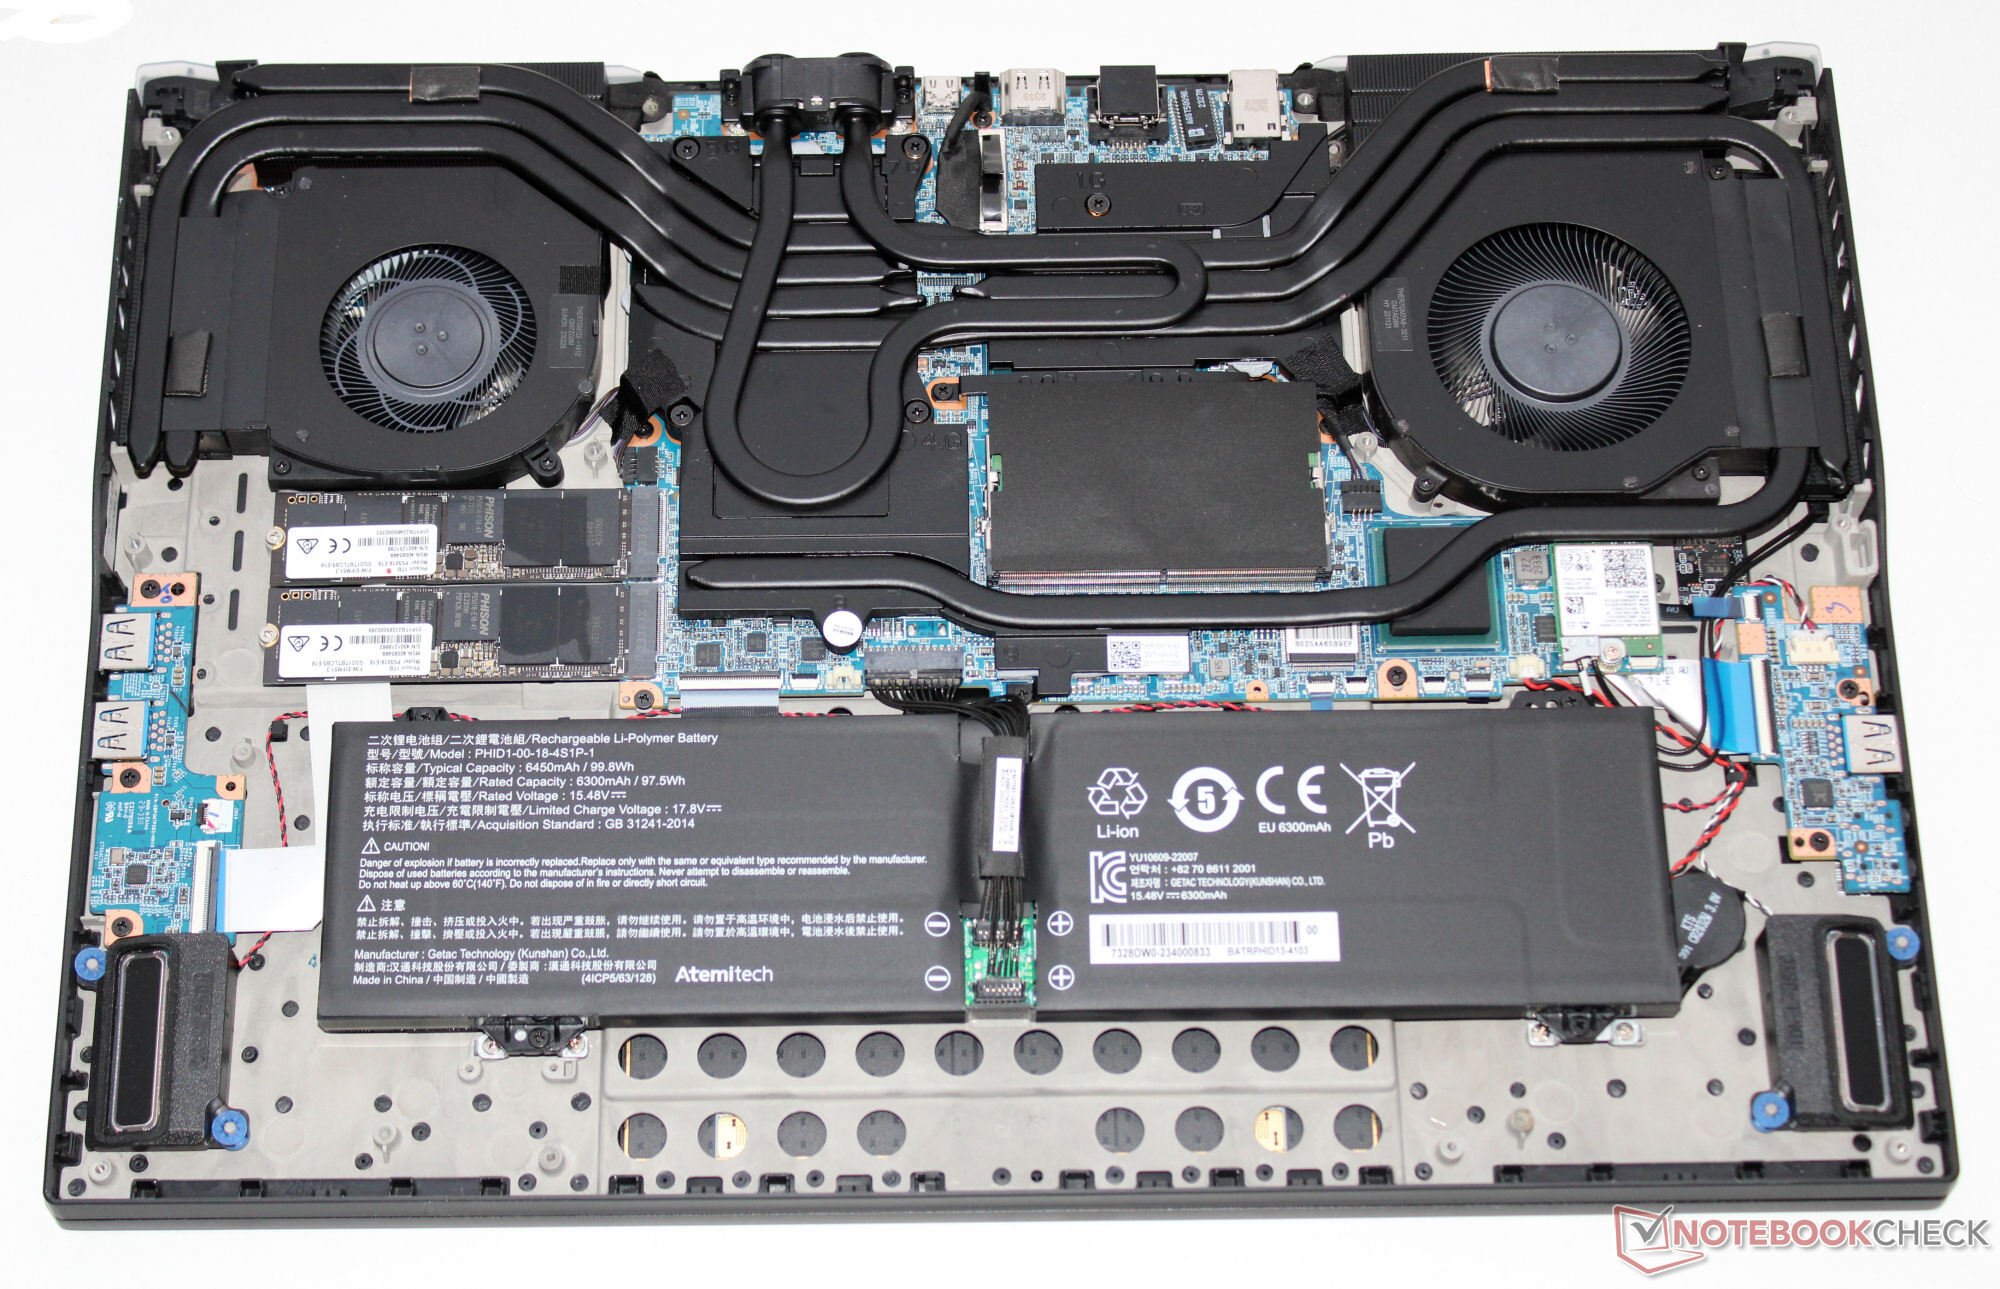
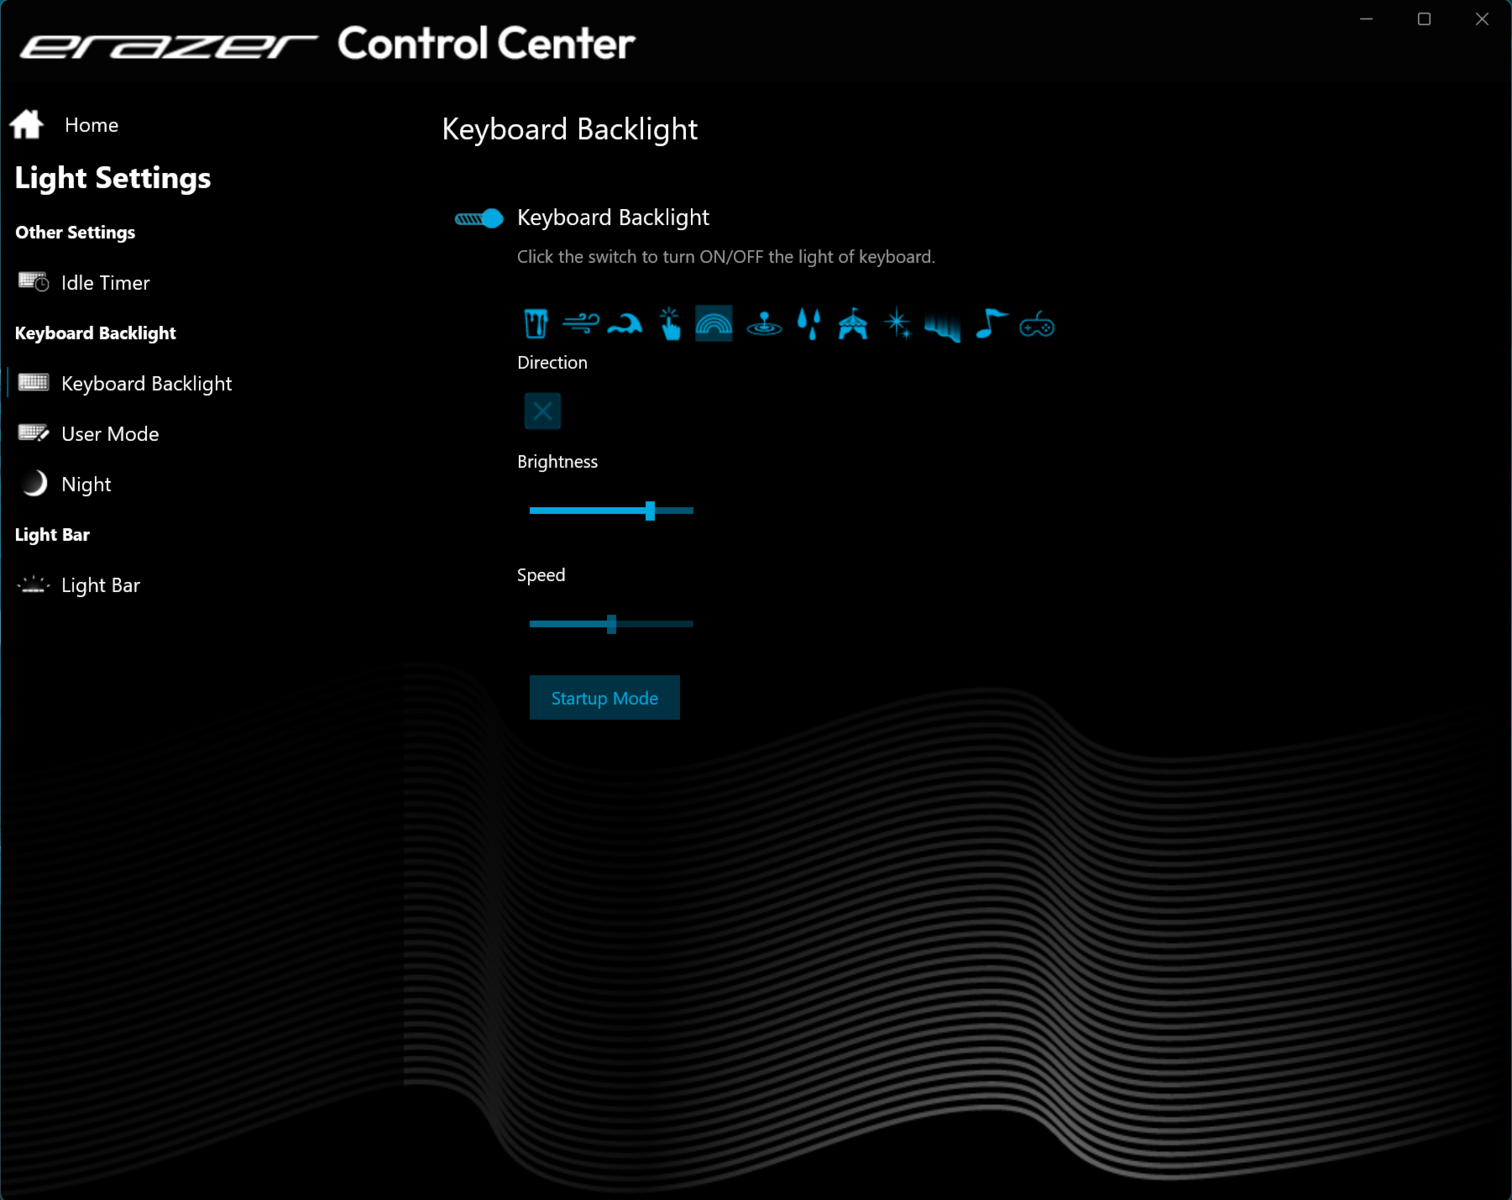
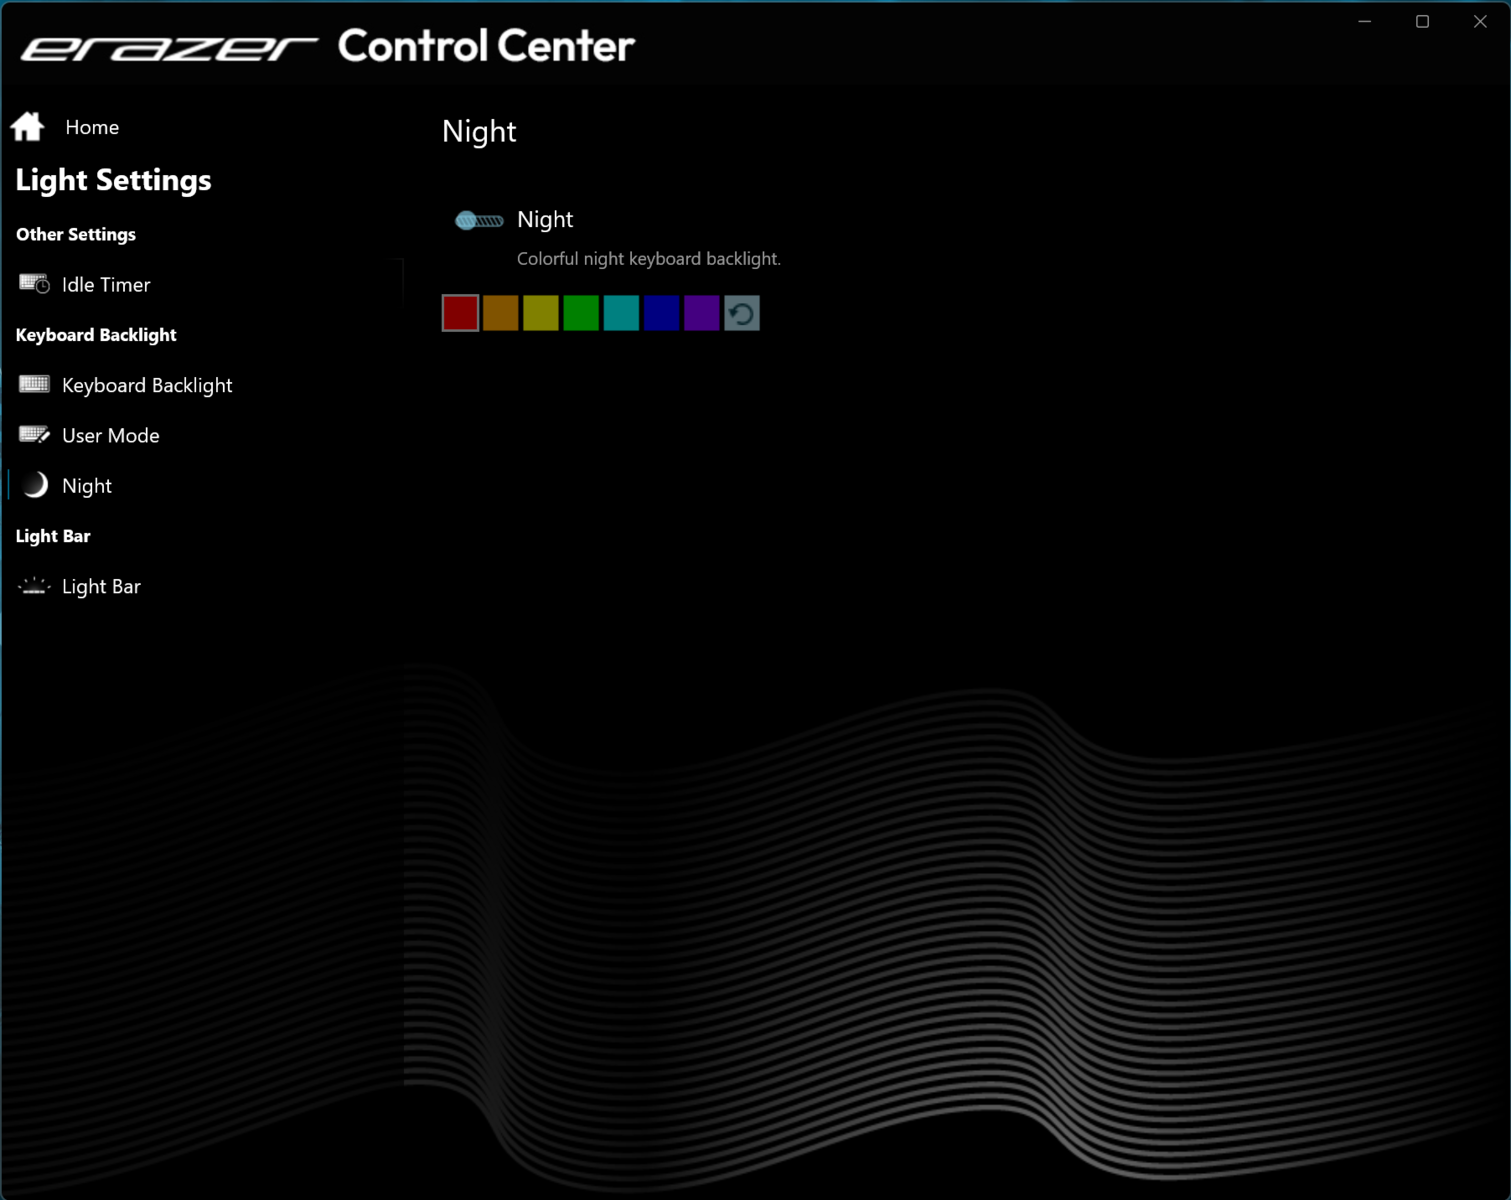
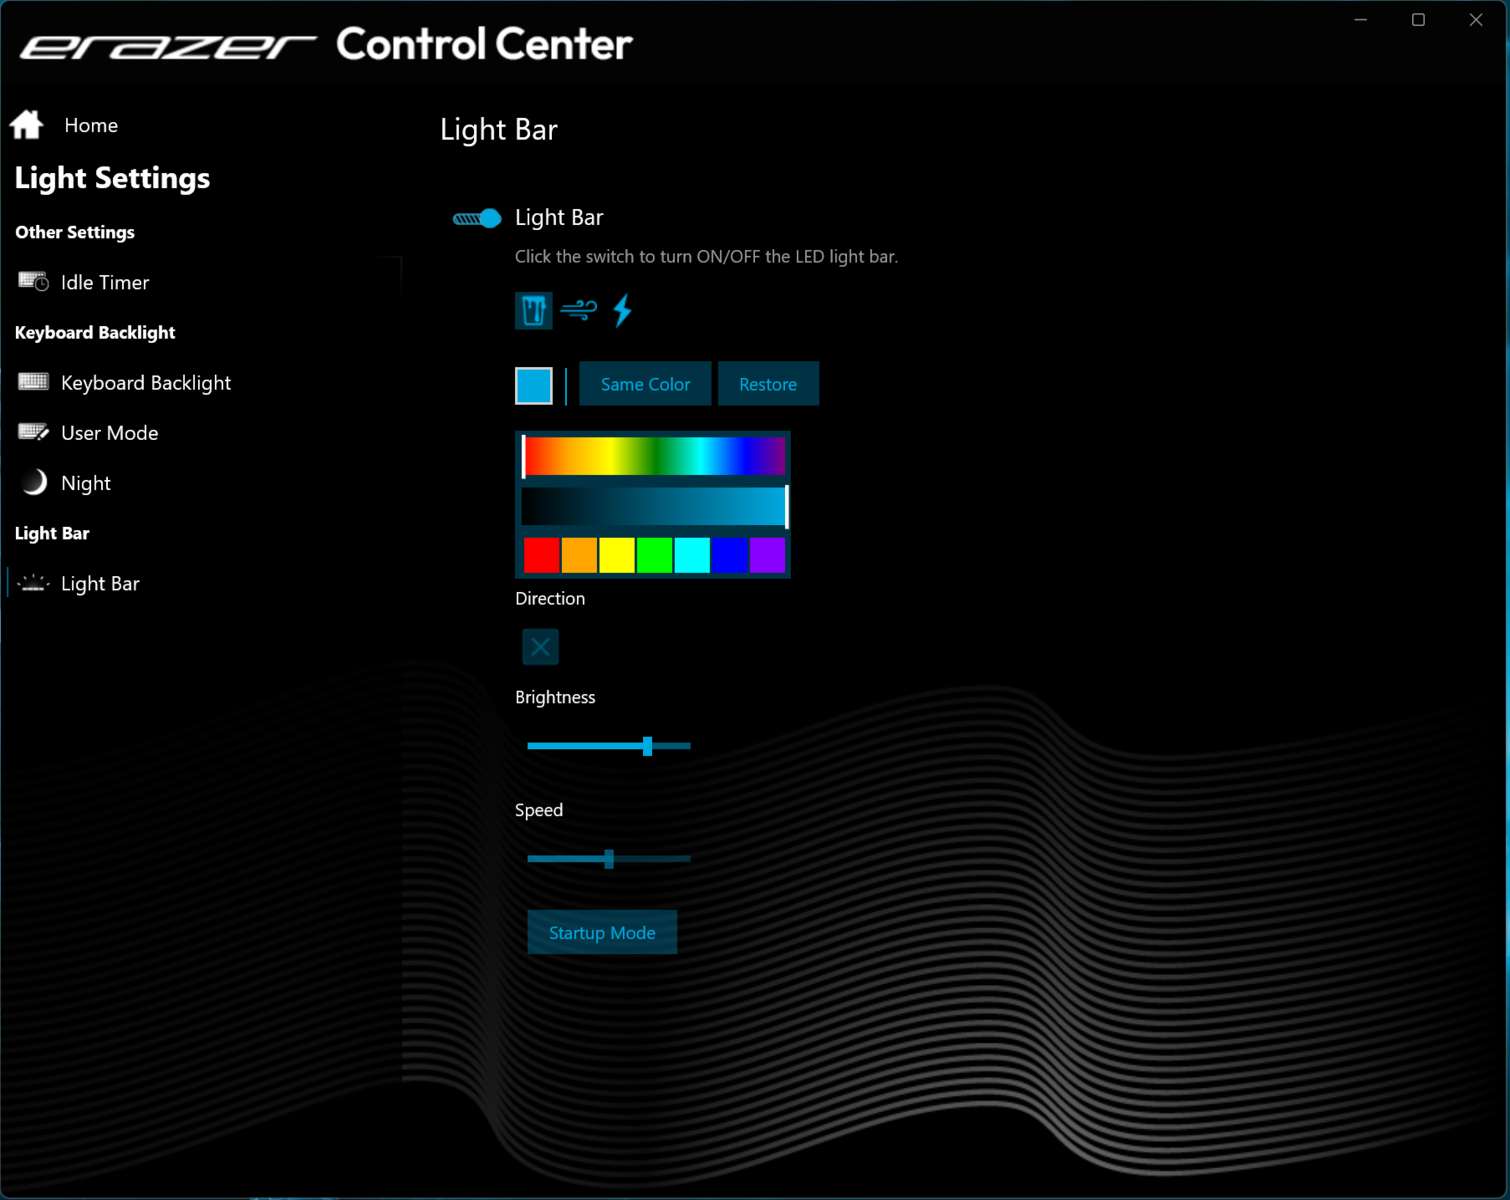
Tekniken i Beast X40 är inrymd i ett robust, elegant designat, mattsvart metallhölje med släta ytor. Basenheten är täckt med en halkfri gummibeläggning. Två RGB LED-remsor ovanför de bakre luftuttagen, den upplysta logotypen på locket och RGB-tangentbelysningen ger en extra färgklick. Batteriet (skruvat, inte limmat) och de andra interna komponenterna är åtkomliga efter att bottenpanelen har tagits bort.
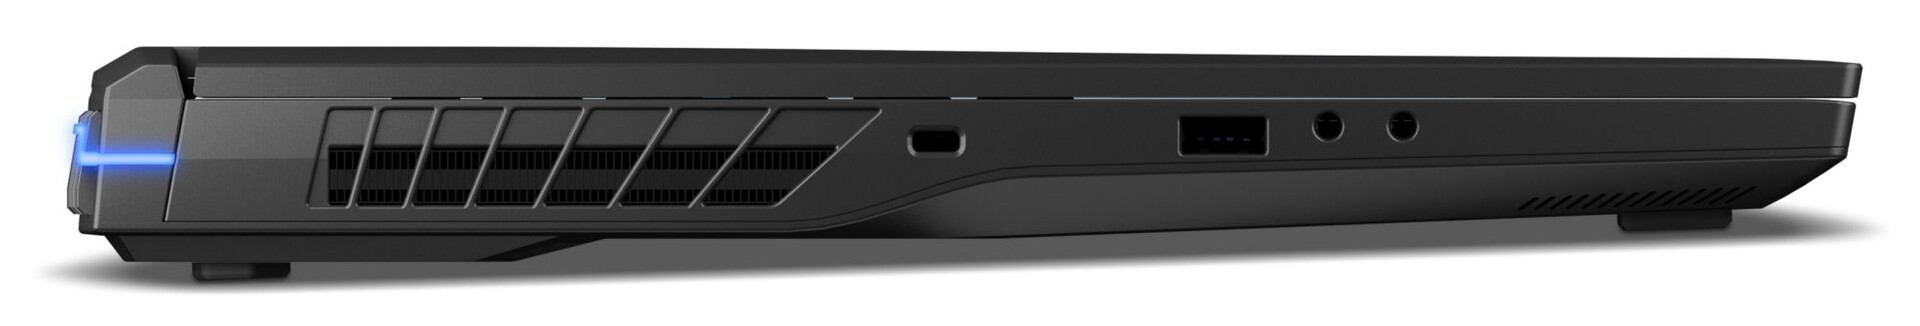
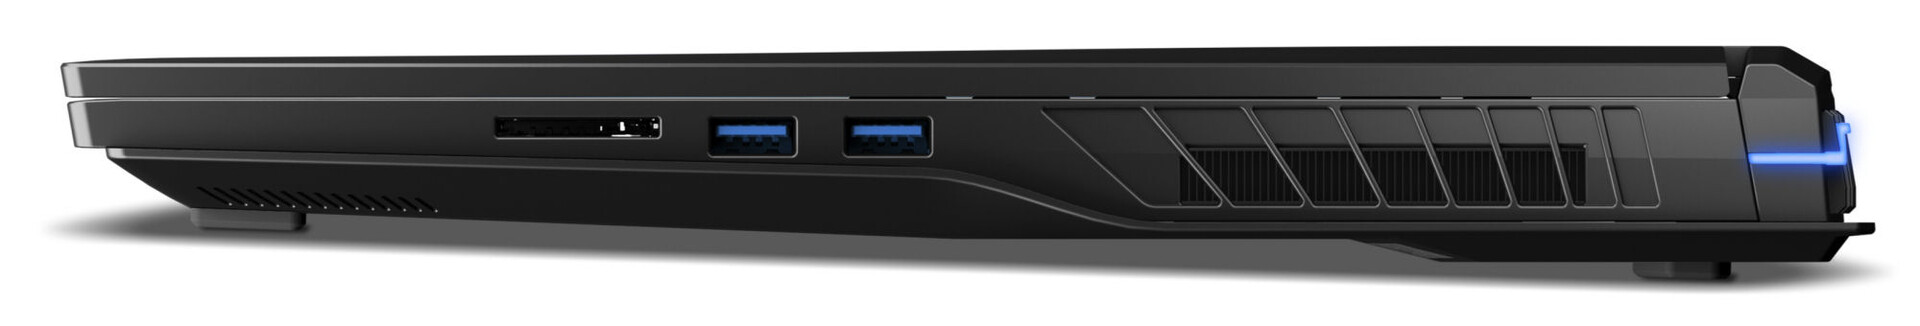
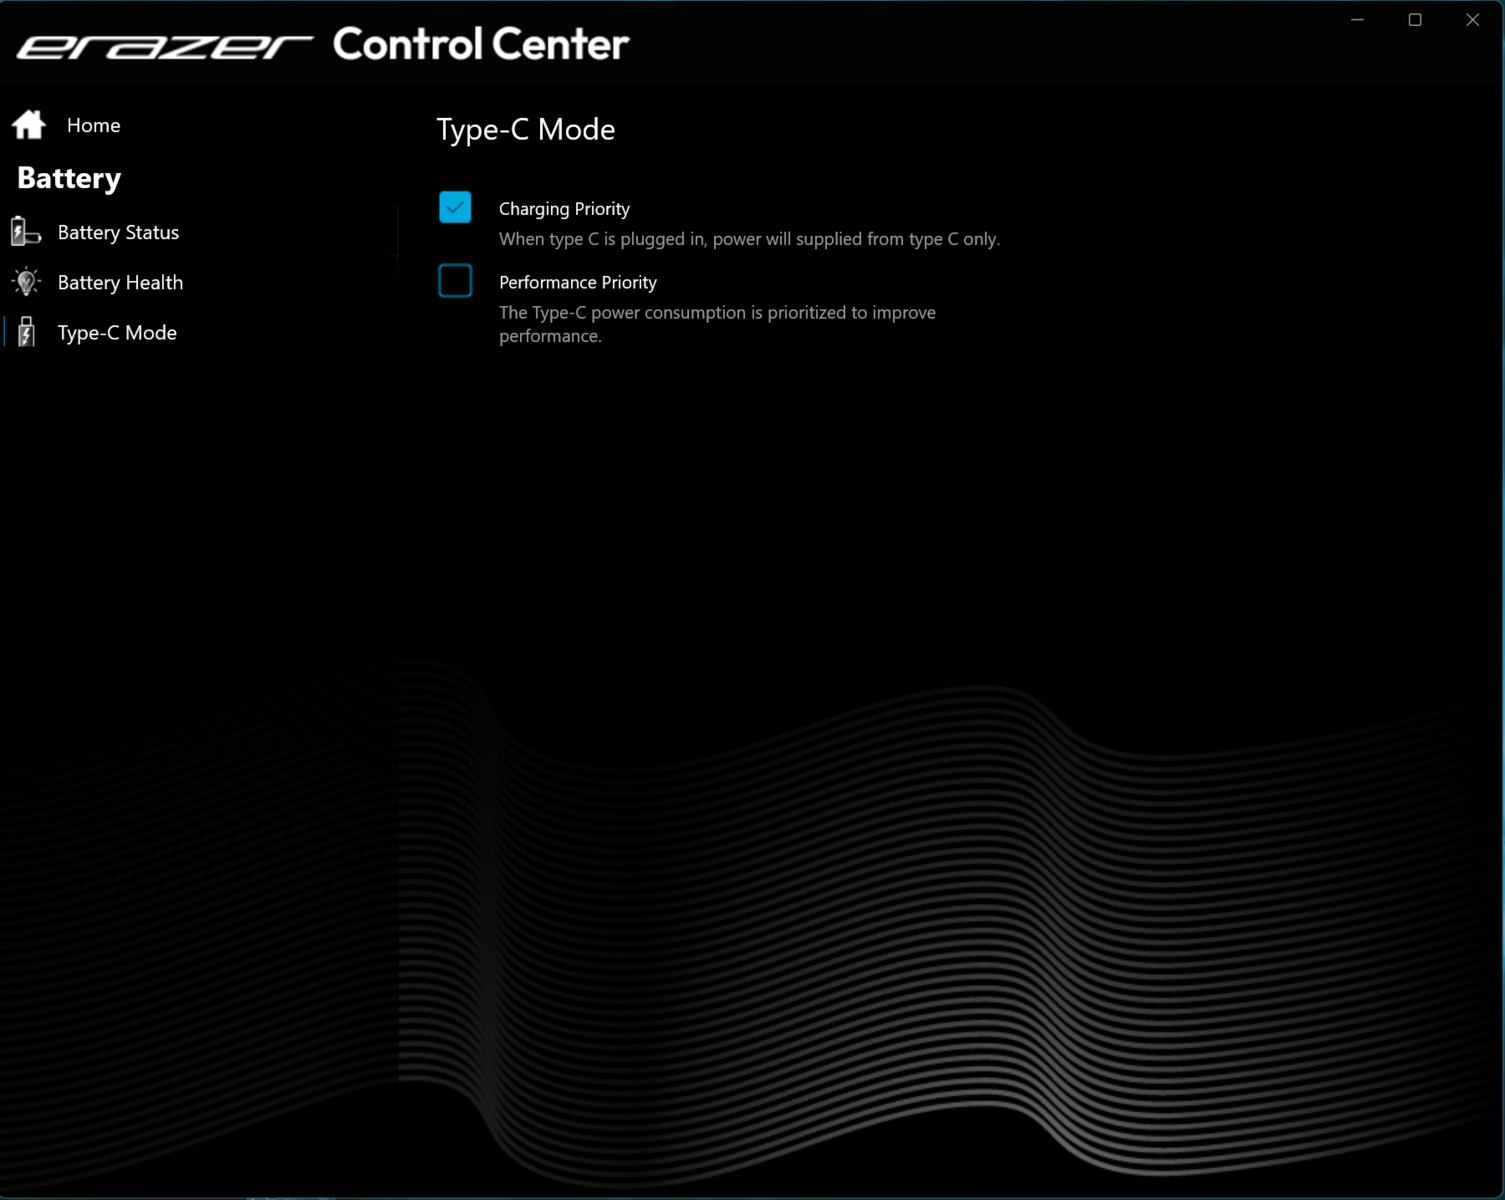
Erazer har tre USB-A-portar (2x USB 3.2 Gen 1 och 1x USB 3.2 Gen 2) och en USB Type-C-port i form av Thunderbolt 4. Vi kan bekräfta att den senare kan mata ut en DisplayPort-signal och stöder Power Delivery. Totalt har den bärbara datorn två videoutgångar (HDMI 2.1 och DisplayPort).
Vi testade SD-minneskortläsaren med vårt referens AV Pro SD microSD 128 GB V60-kort och fann att den erbjuder läshastigheter över genomsnittet. Webbkameran på 1080p ingår som standard.
Erazer Beast X40 använder ett Intel Wi-Fi 6E AX211-chip medan trådbundna anslutningar hanteras av en Realtek RTL8125 2.5 GbE-styrenhet. Den bärbara datorn erbjuder solid Wi-Fi-prestanda i våra tester med Asus ROG Rapture GT-AXE11000 referensrouter utan andra Wi-Fi-enheter i omedelbar närhet och på ett kort avstånd mellan den bärbara datorn och serverdatorn.
| SD Card Reader | |
| average JPG Copy Test (av. of 3 runs) | |
| Genomsnitt av klass Gaming (20.9 - 210, n=54, senaste 2 åren) | |
| MSI Titan 18 HX A14VIG (Toshiba Exceria Pro SDXC 64 GB UHS-II) | |
| Medion Erazer Beast X40 (AV PRO microSD 128 GB V60) | |
| Medion Erazer Beast X40 2024 (AV PRO microSD 128 GB V60) | |
| maximum AS SSD Seq Read Test (1GB) | |
| Genomsnitt av klass Gaming (25.5 - 261, n=51, senaste 2 åren) | |
| MSI Titan 18 HX A14VIG (Toshiba Exceria Pro SDXC 64 GB UHS-II) | |
| Medion Erazer Beast X40 2024 (AV PRO microSD 128 GB V60) | |
| Medion Erazer Beast X40 (AV PRO microSD 128 GB V60) | |


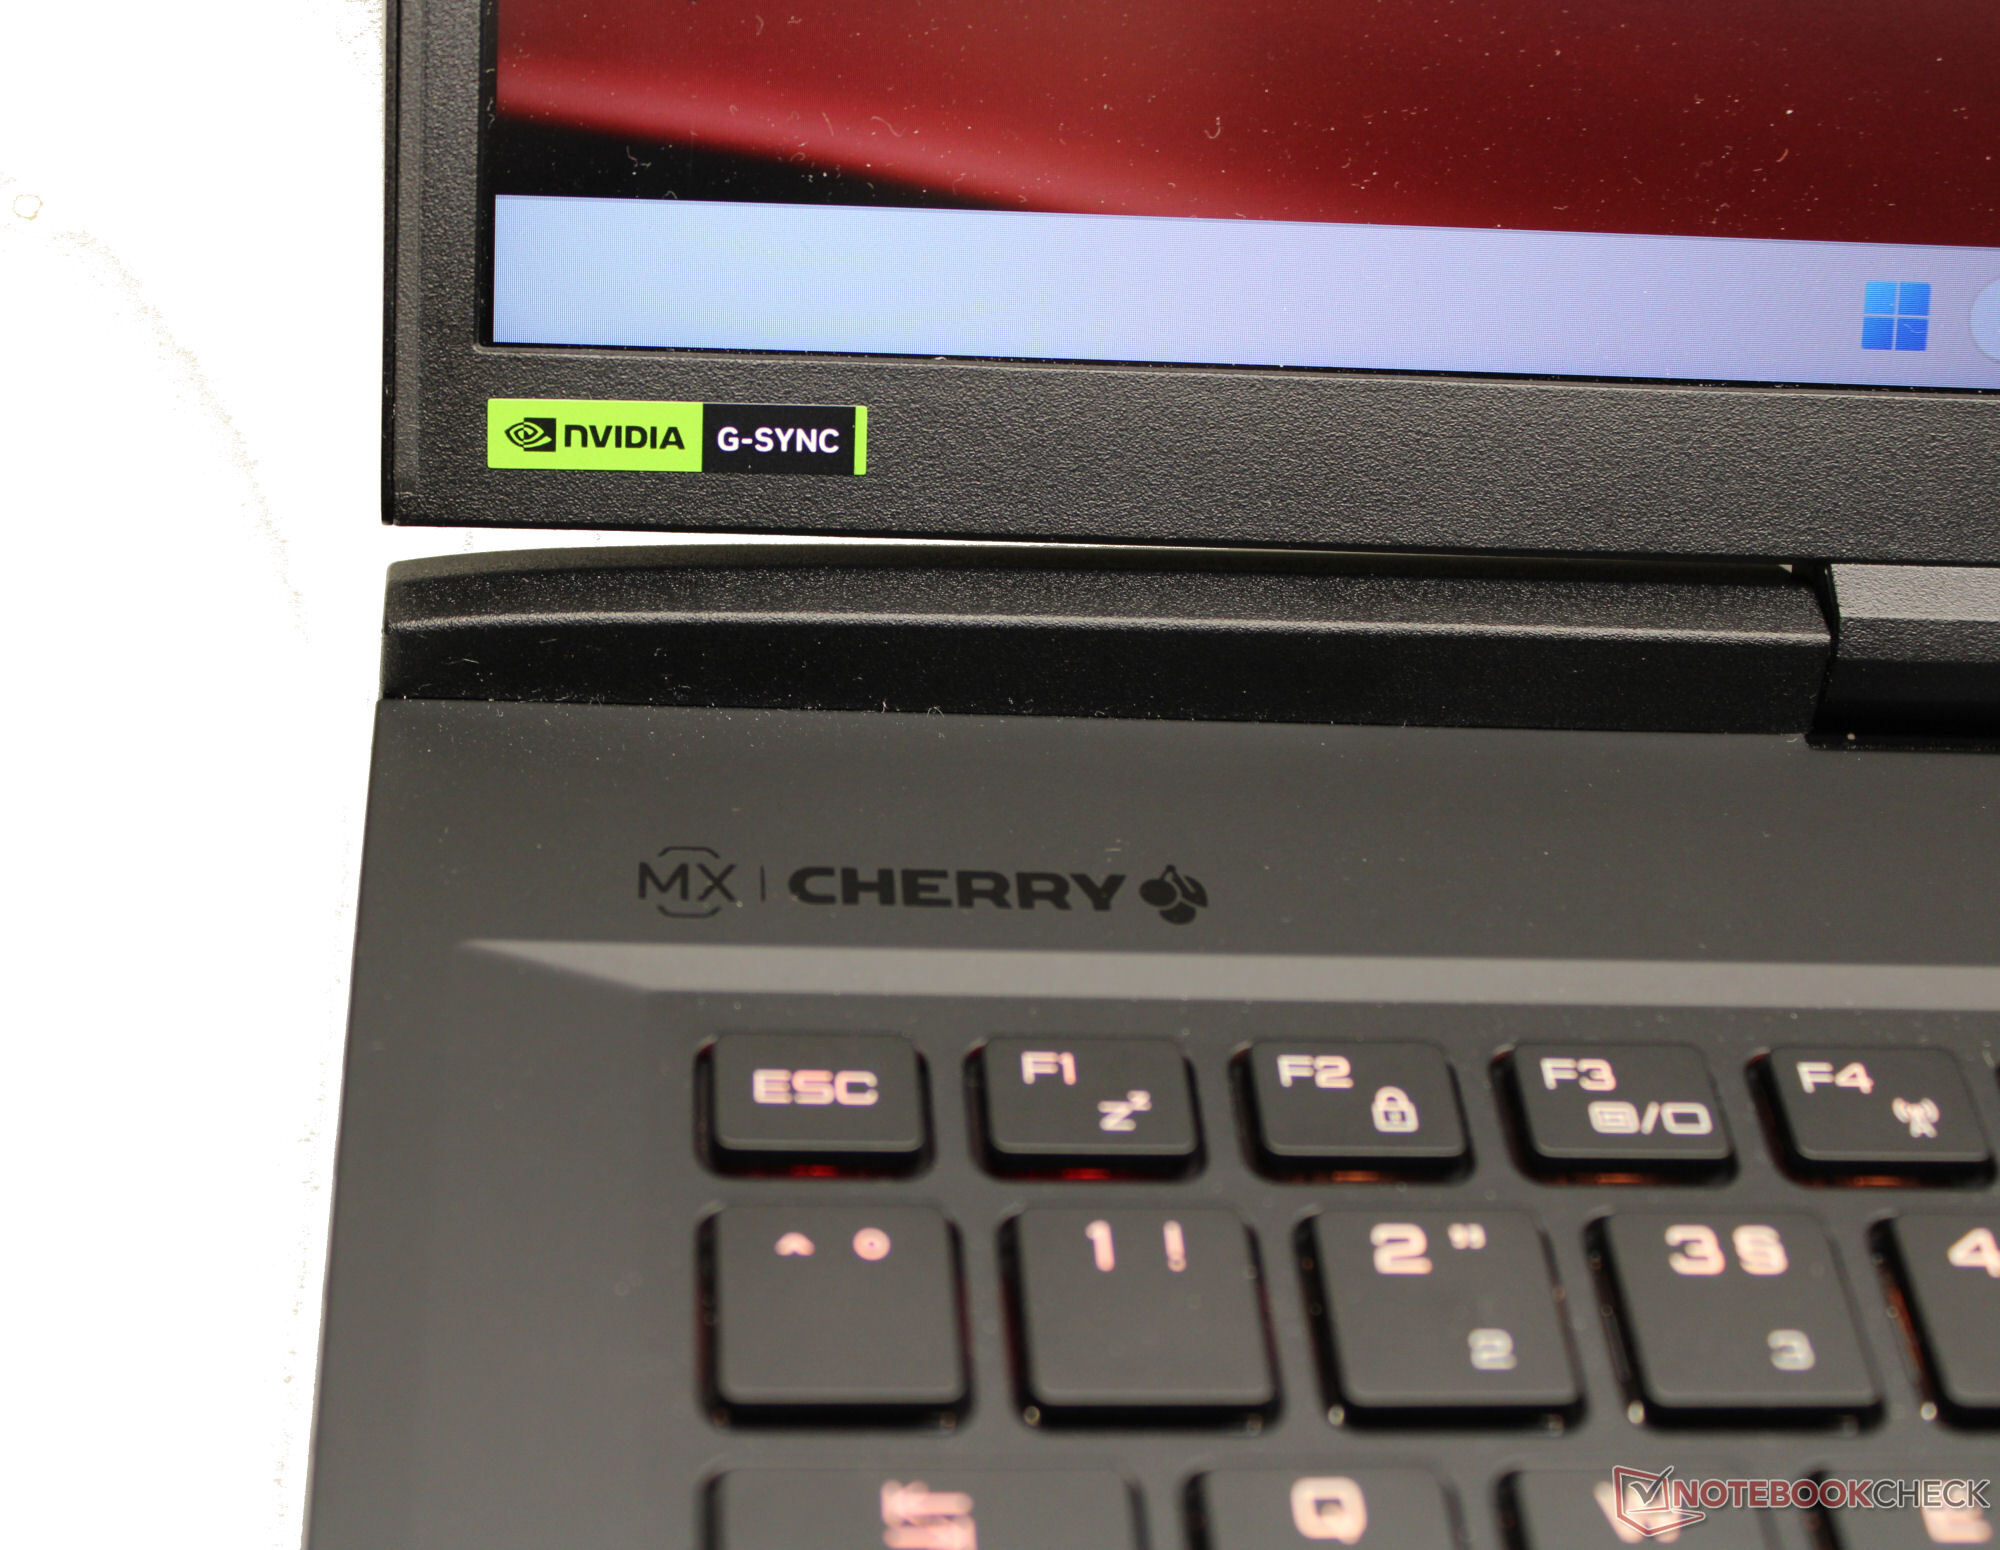
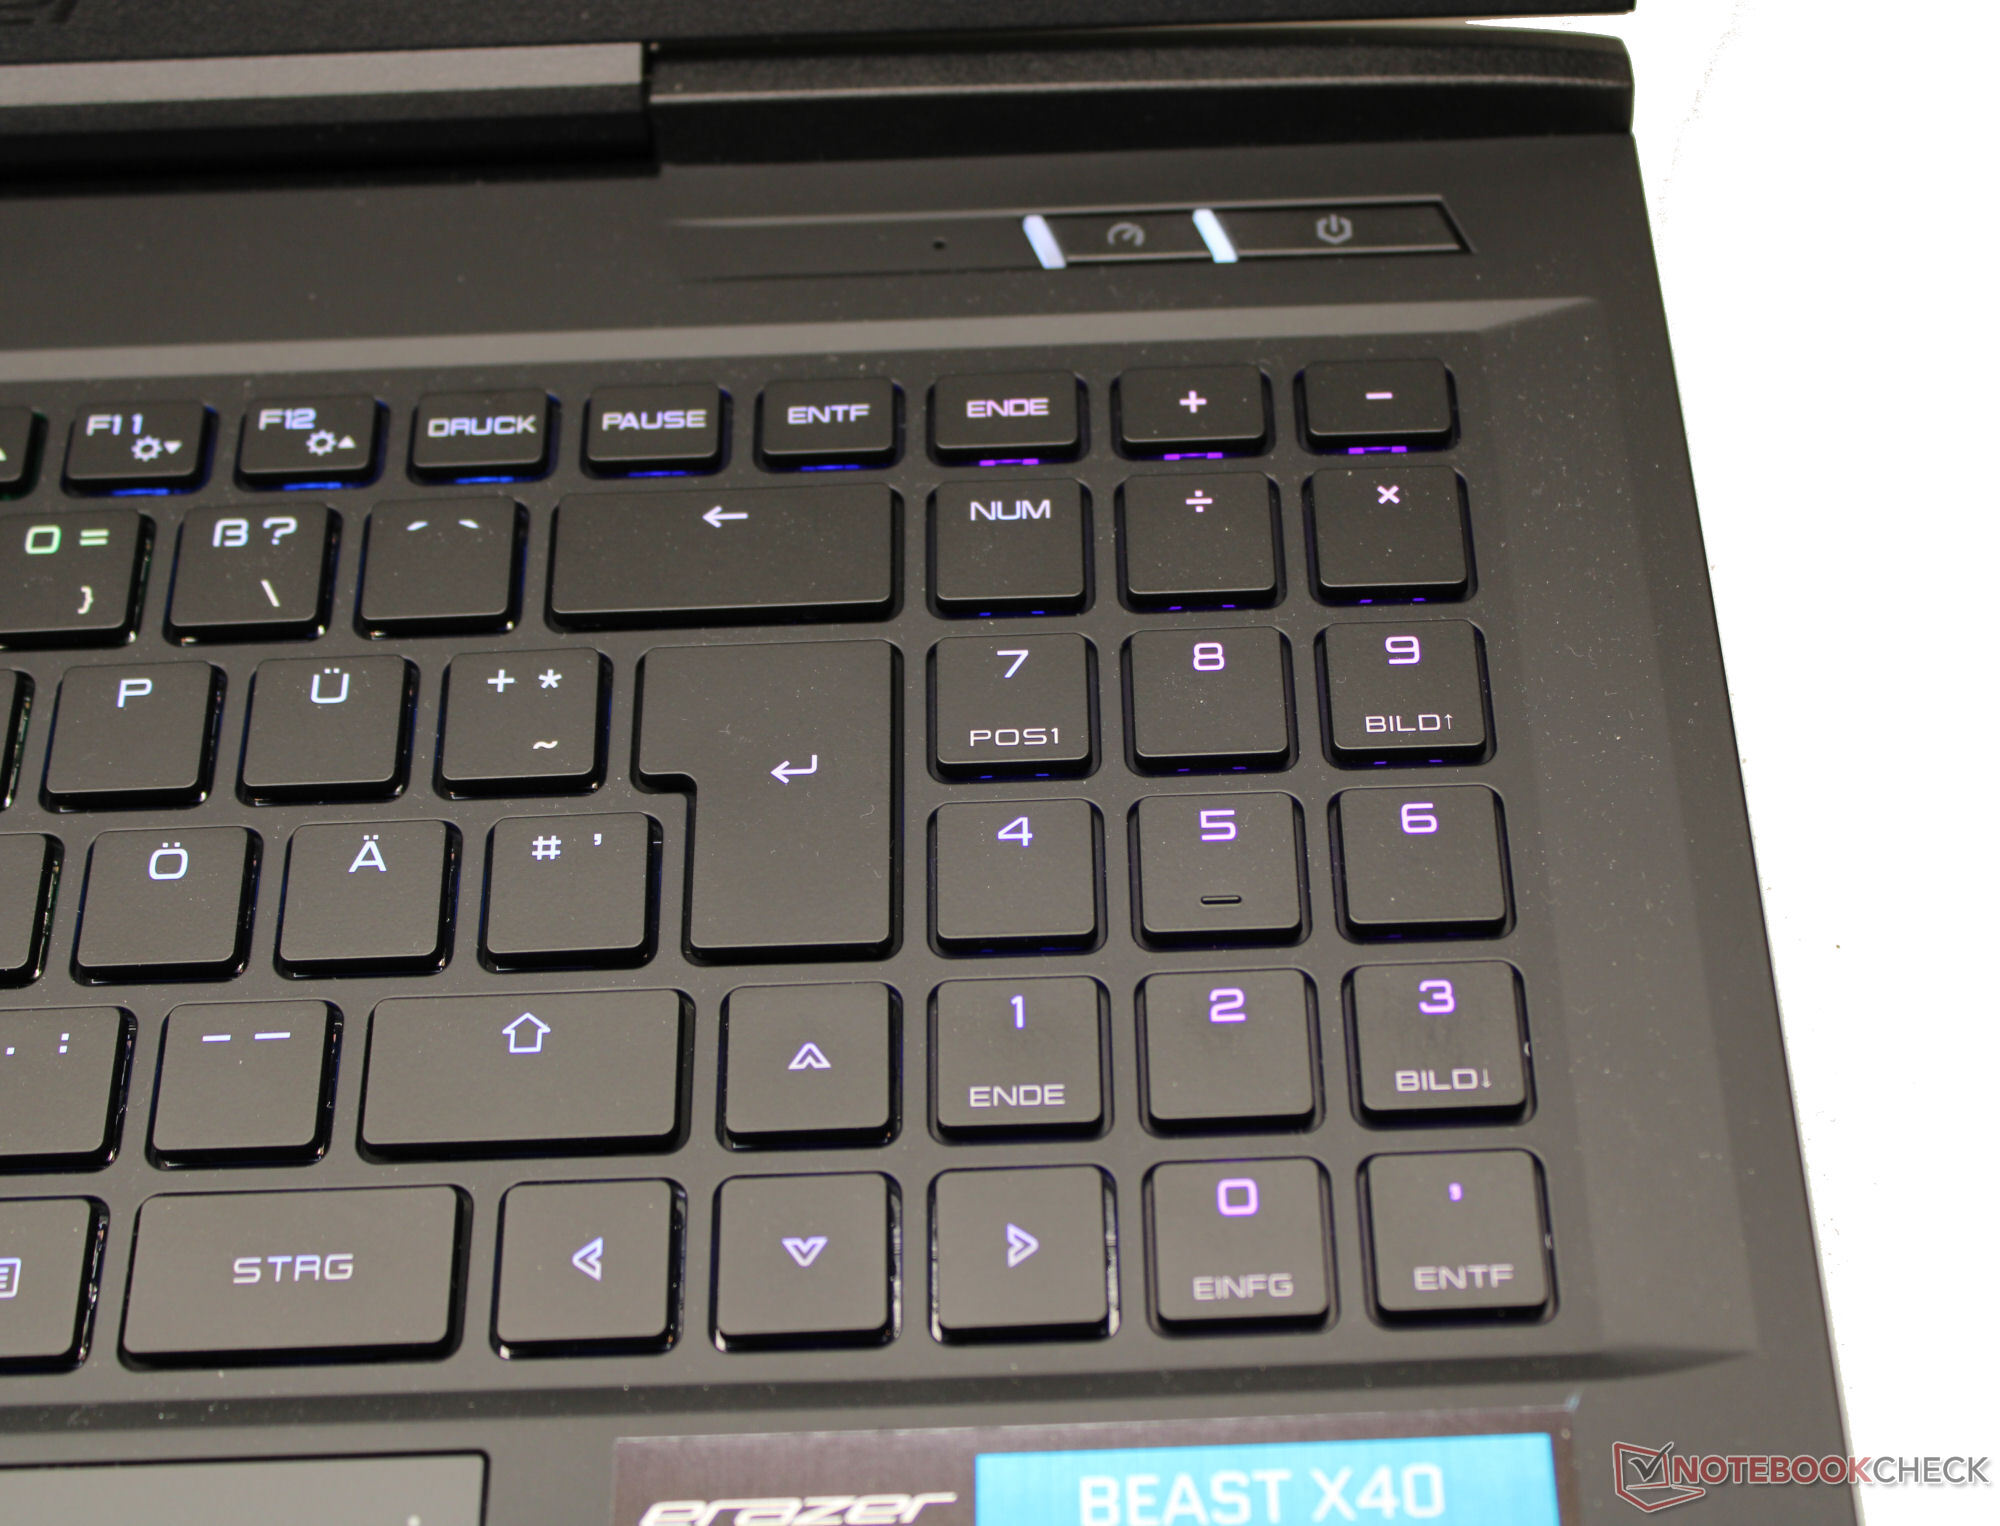
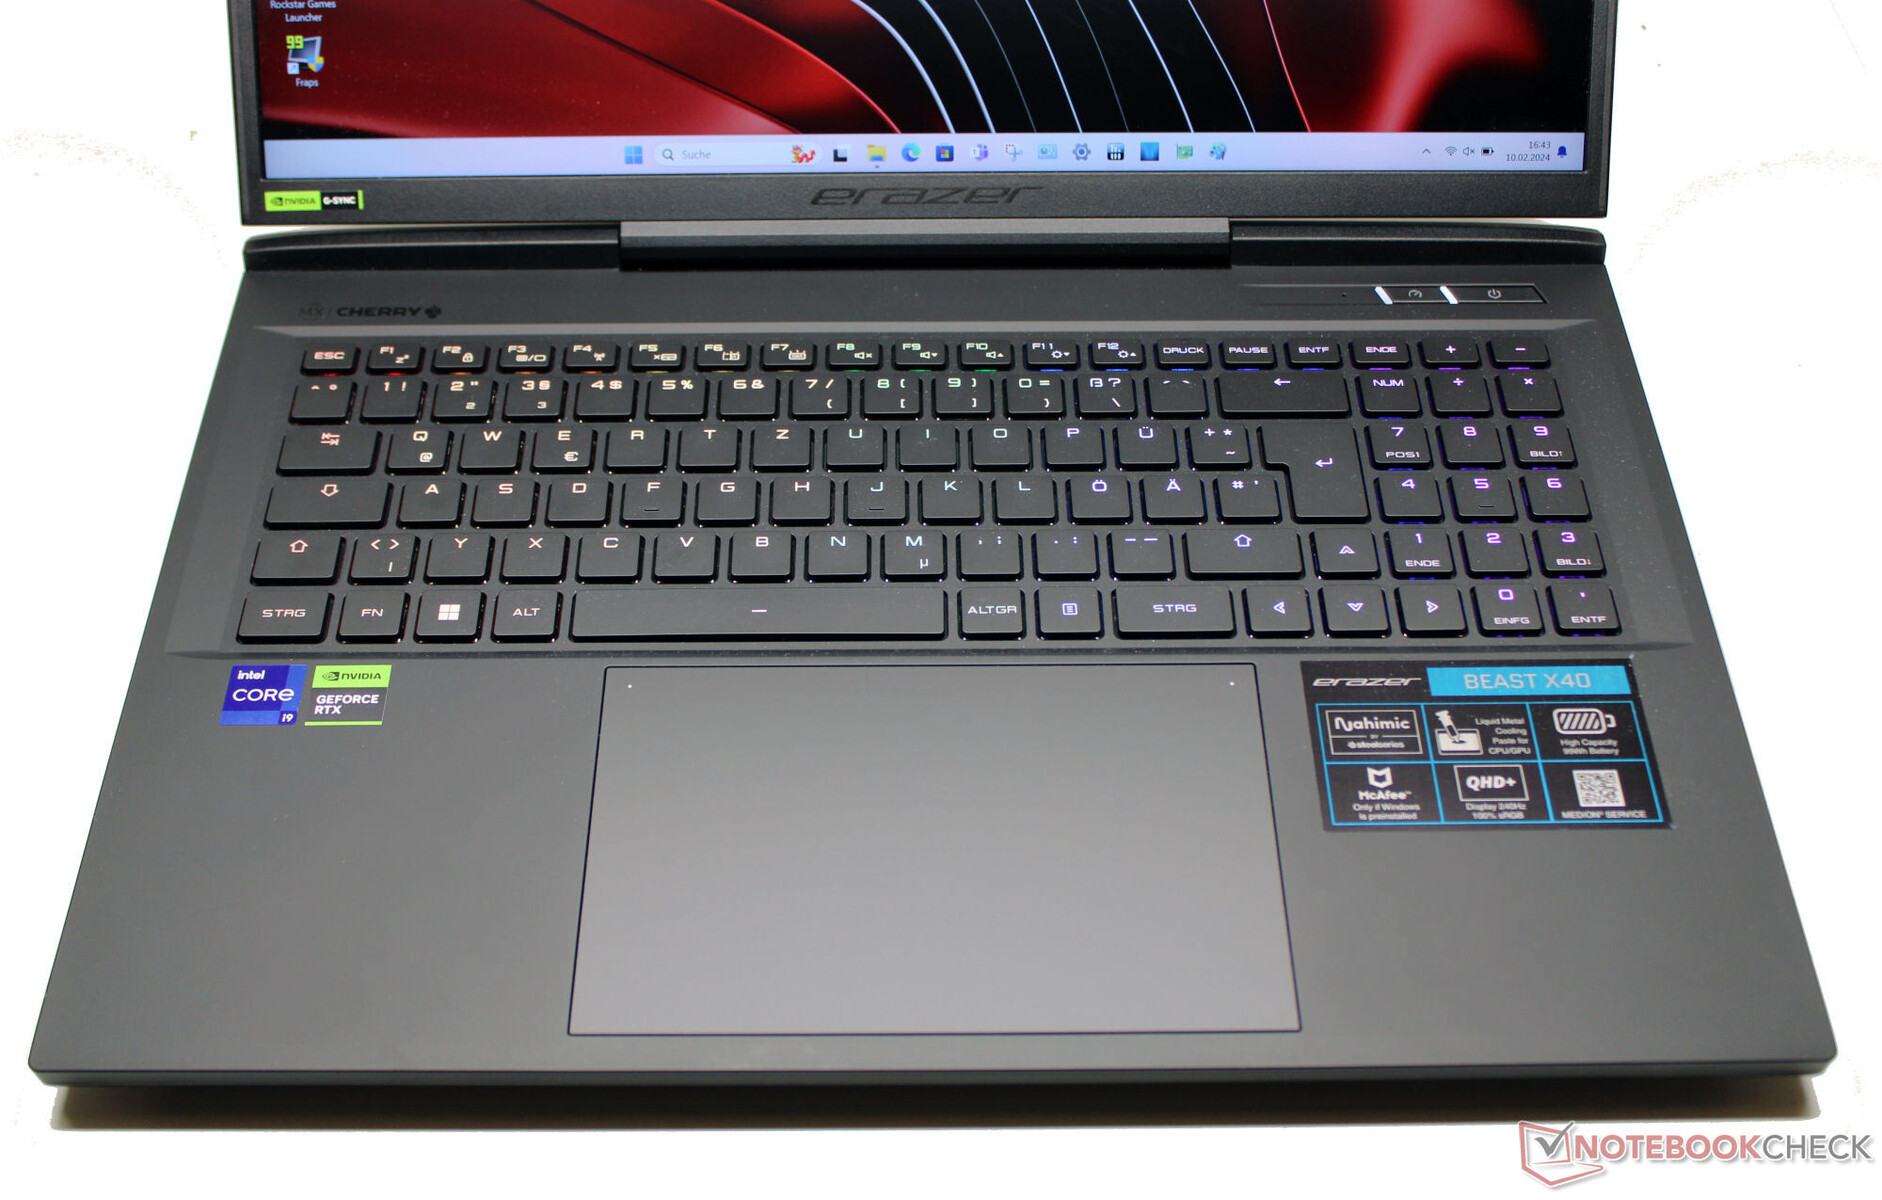
Inmatningsenheter: Mekaniskt tangentbord med Cherry MX-brytare
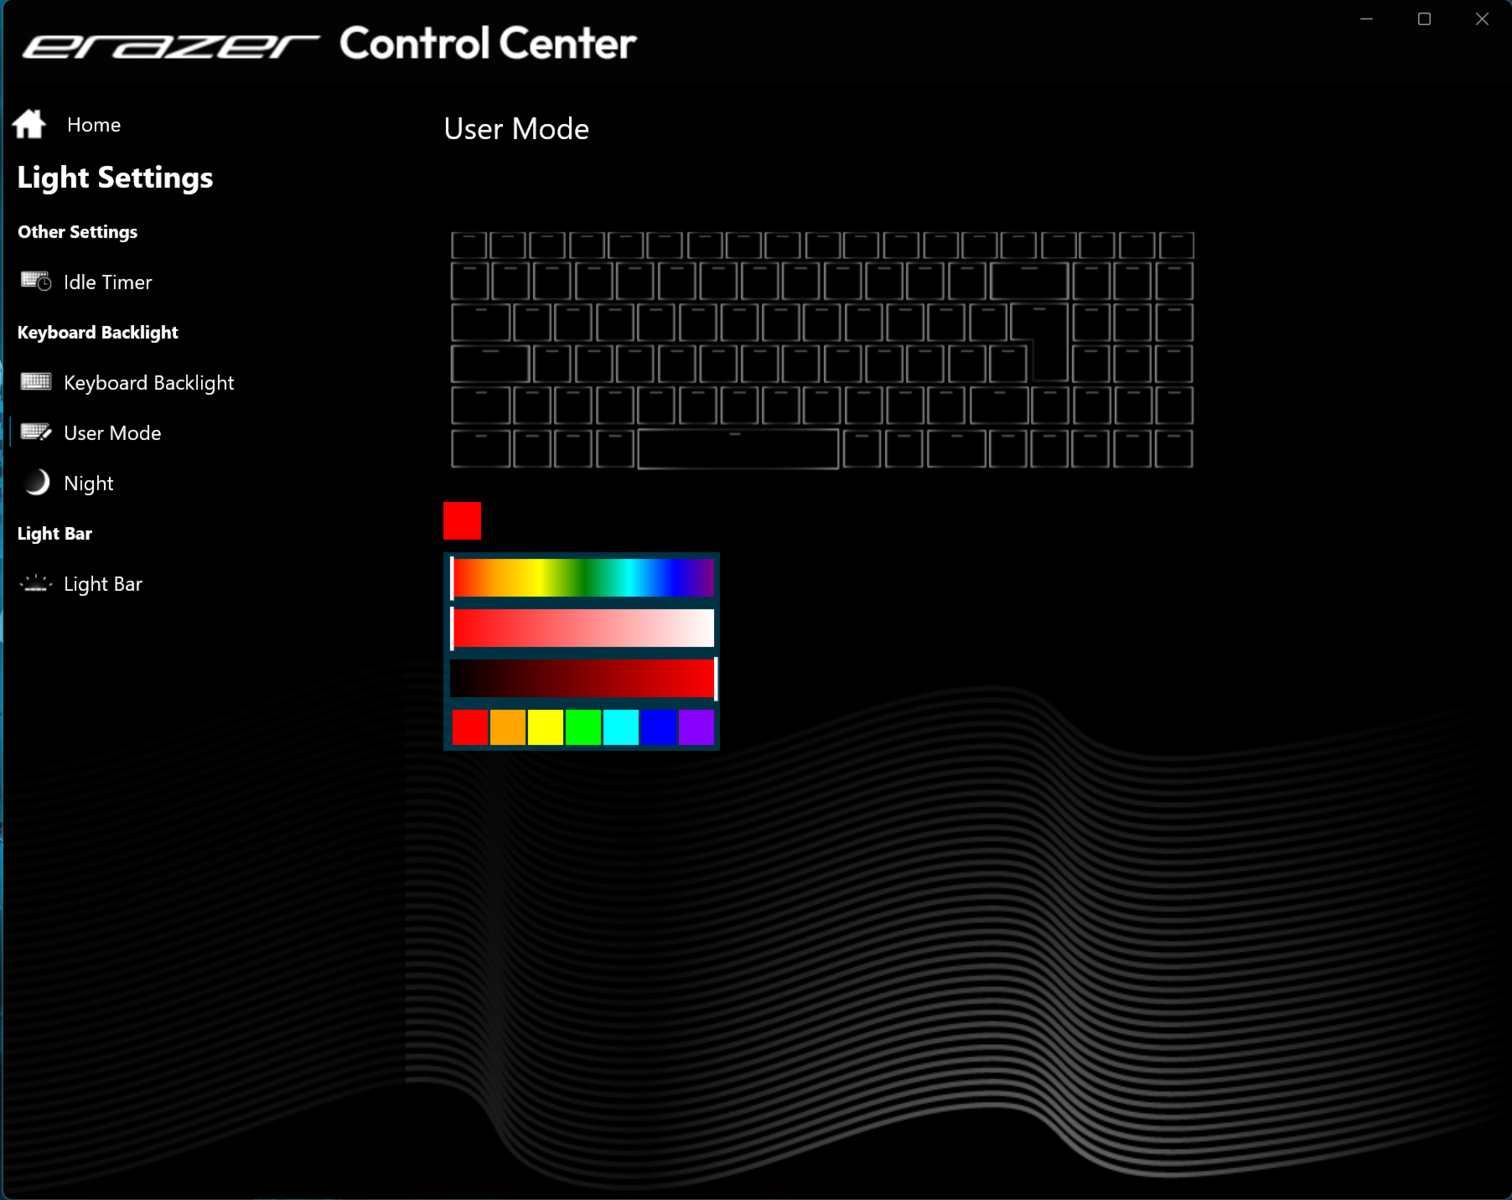
Beast X40:s mekaniska tangentbord ger poäng med sin fylliga skrivkänsla och exakta inmatningar. Cherry MX-brytarna ger en medium slaglängd och en tydligt hörbar och förnimbar tryckpunkt. En sifferknappsats och individuell RGB-tangentbelysning avrundar det harmoniska tangentbordet.
Multi-touch-pekplattan (15,5 x 10 cm) har en kort slaglängd och en tydlig tryckpunkt. Den kan avaktiveras helt eller bara på ena sidan (höger).
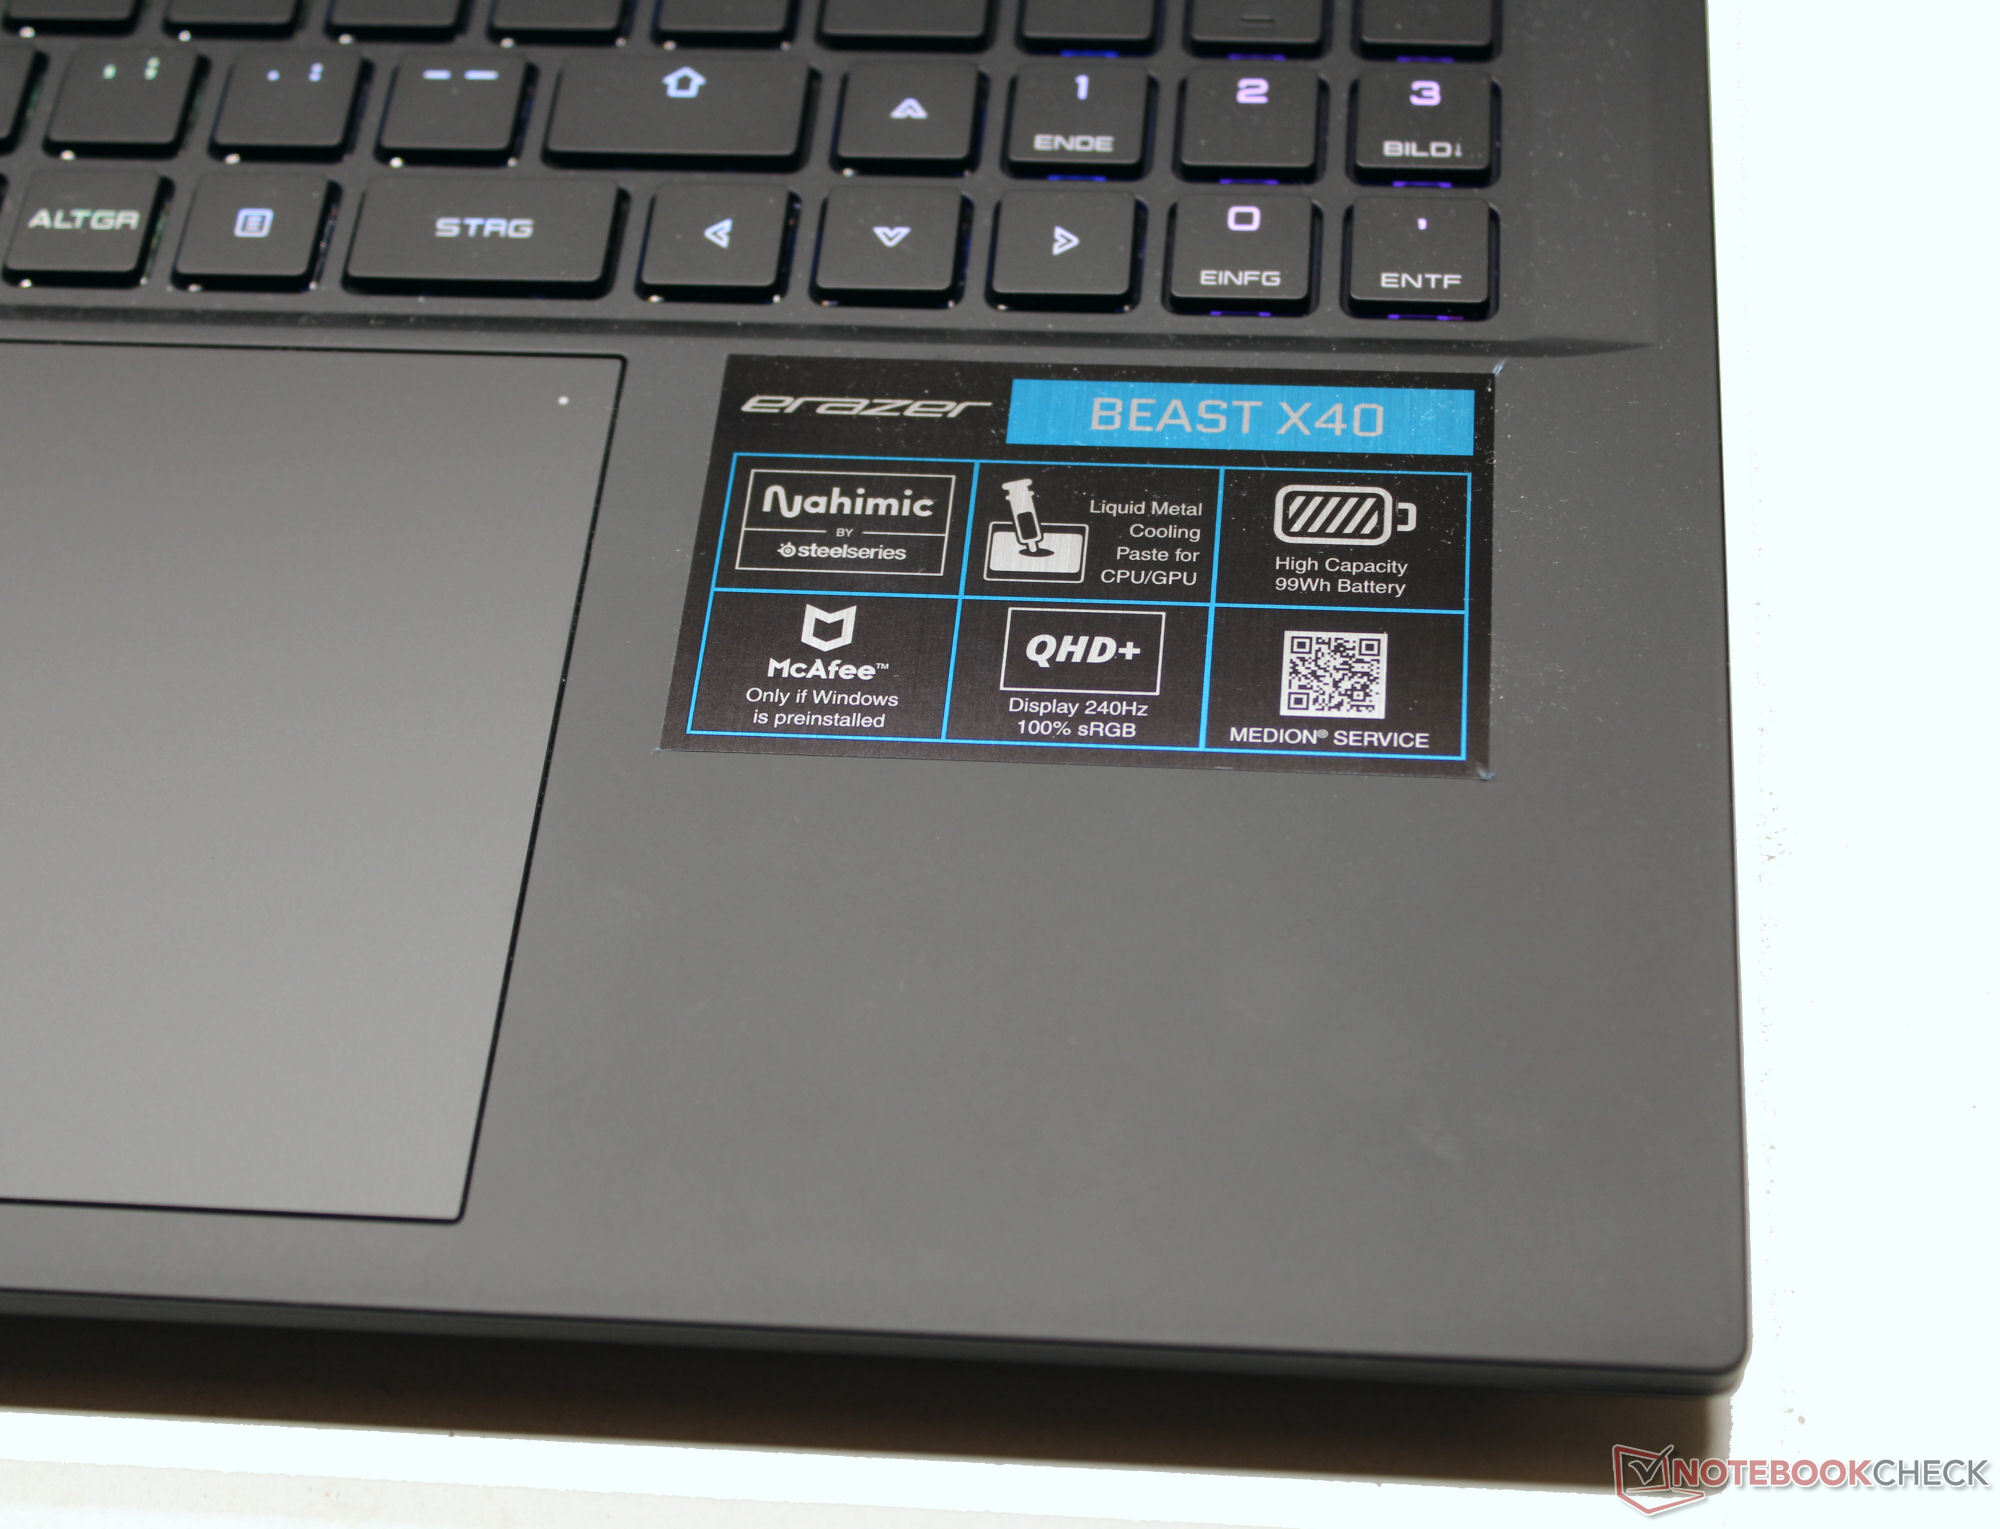
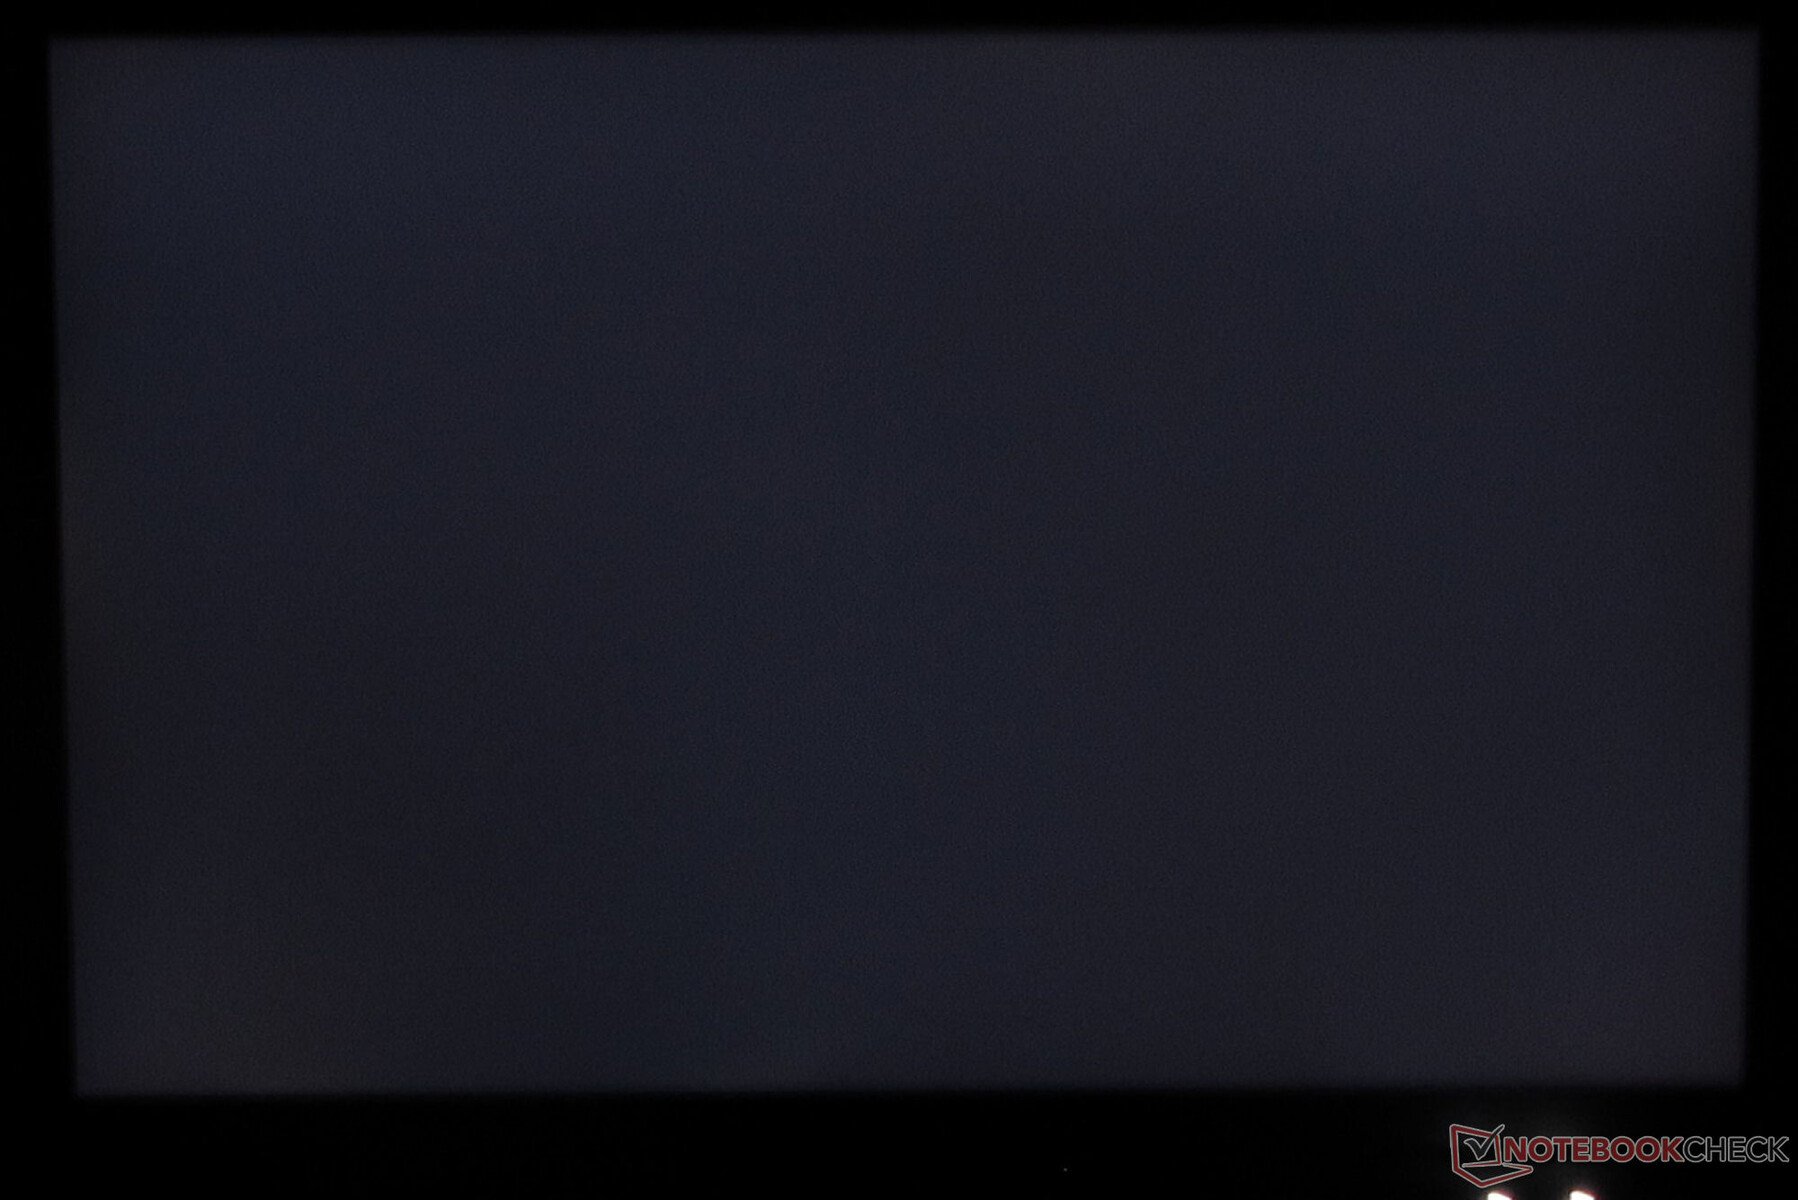
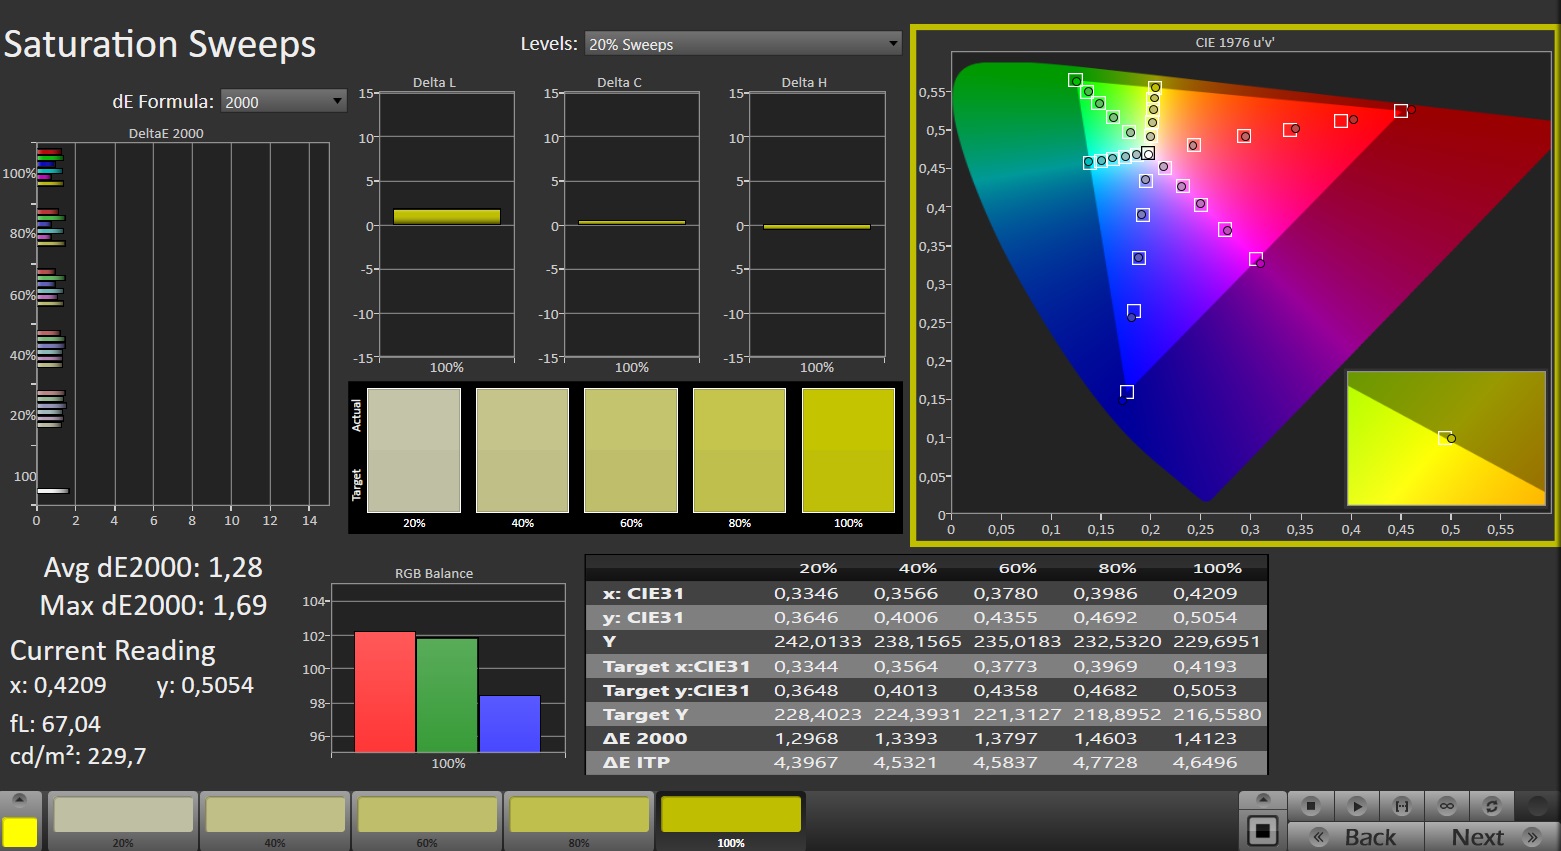
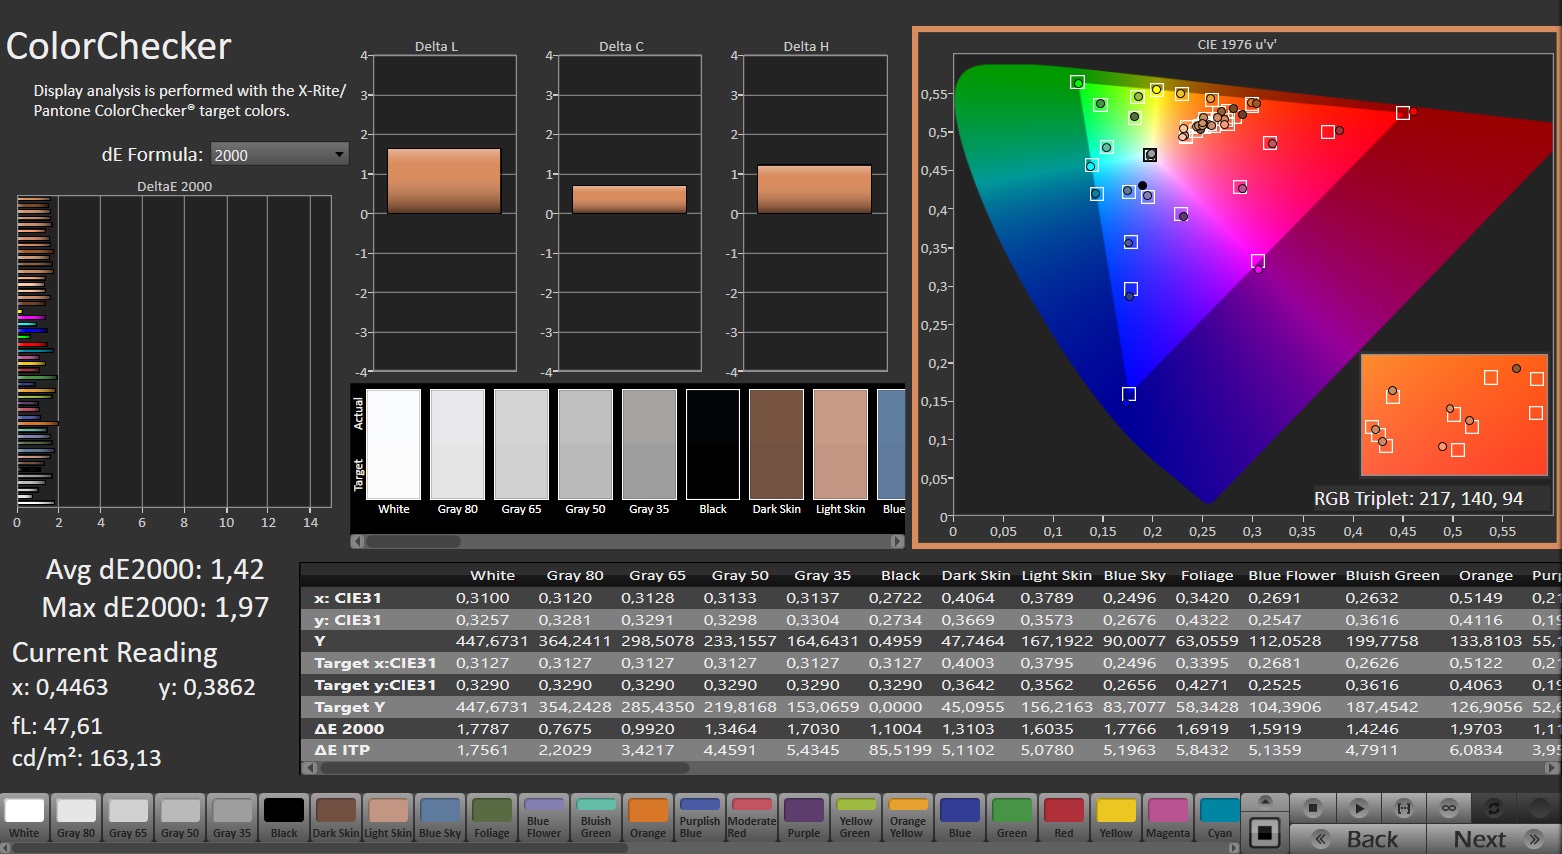
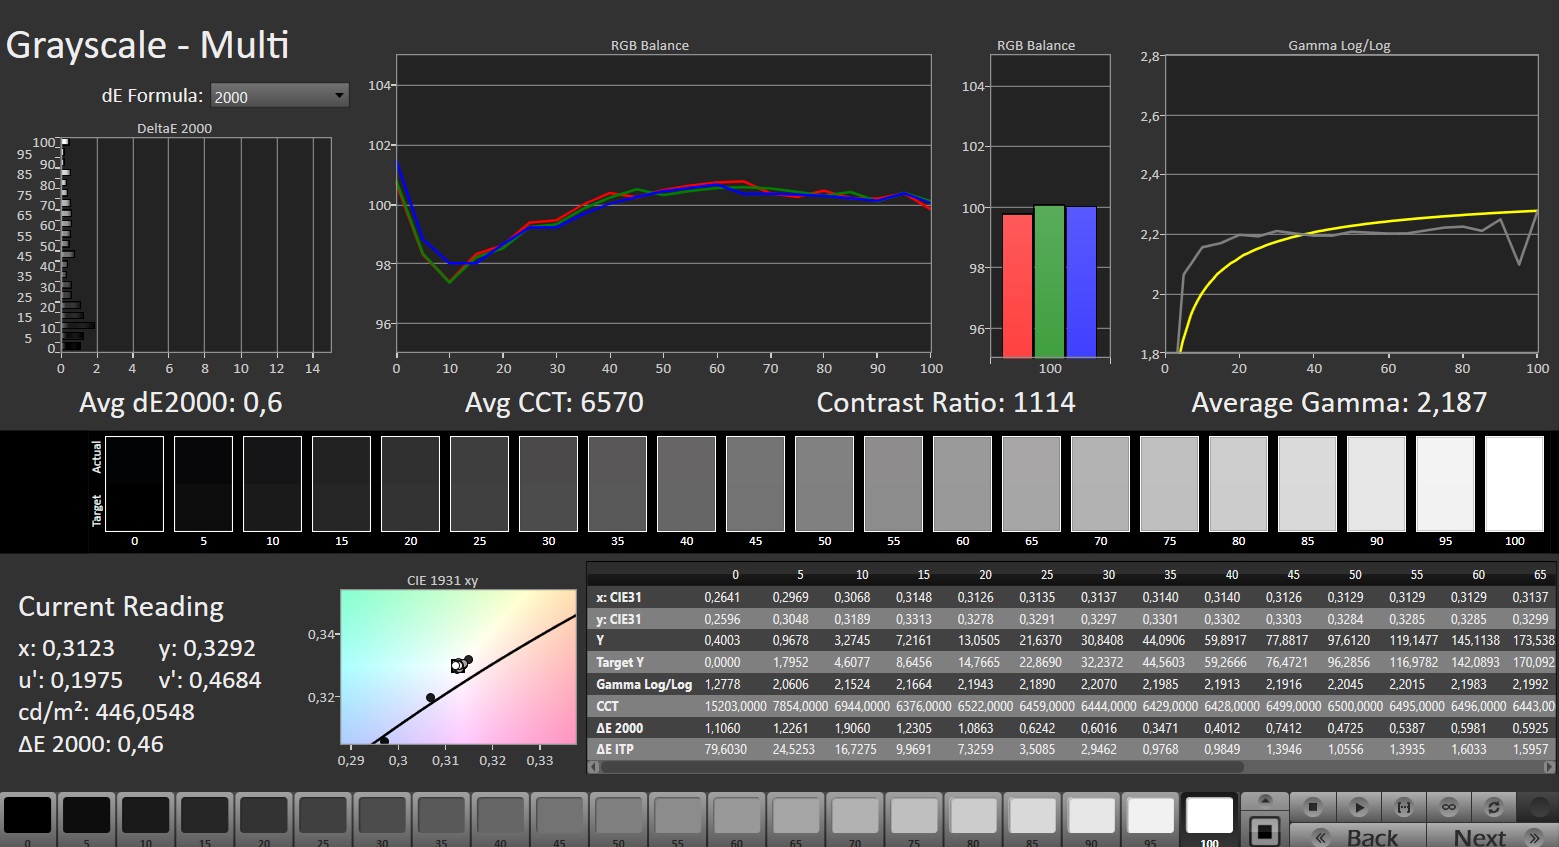
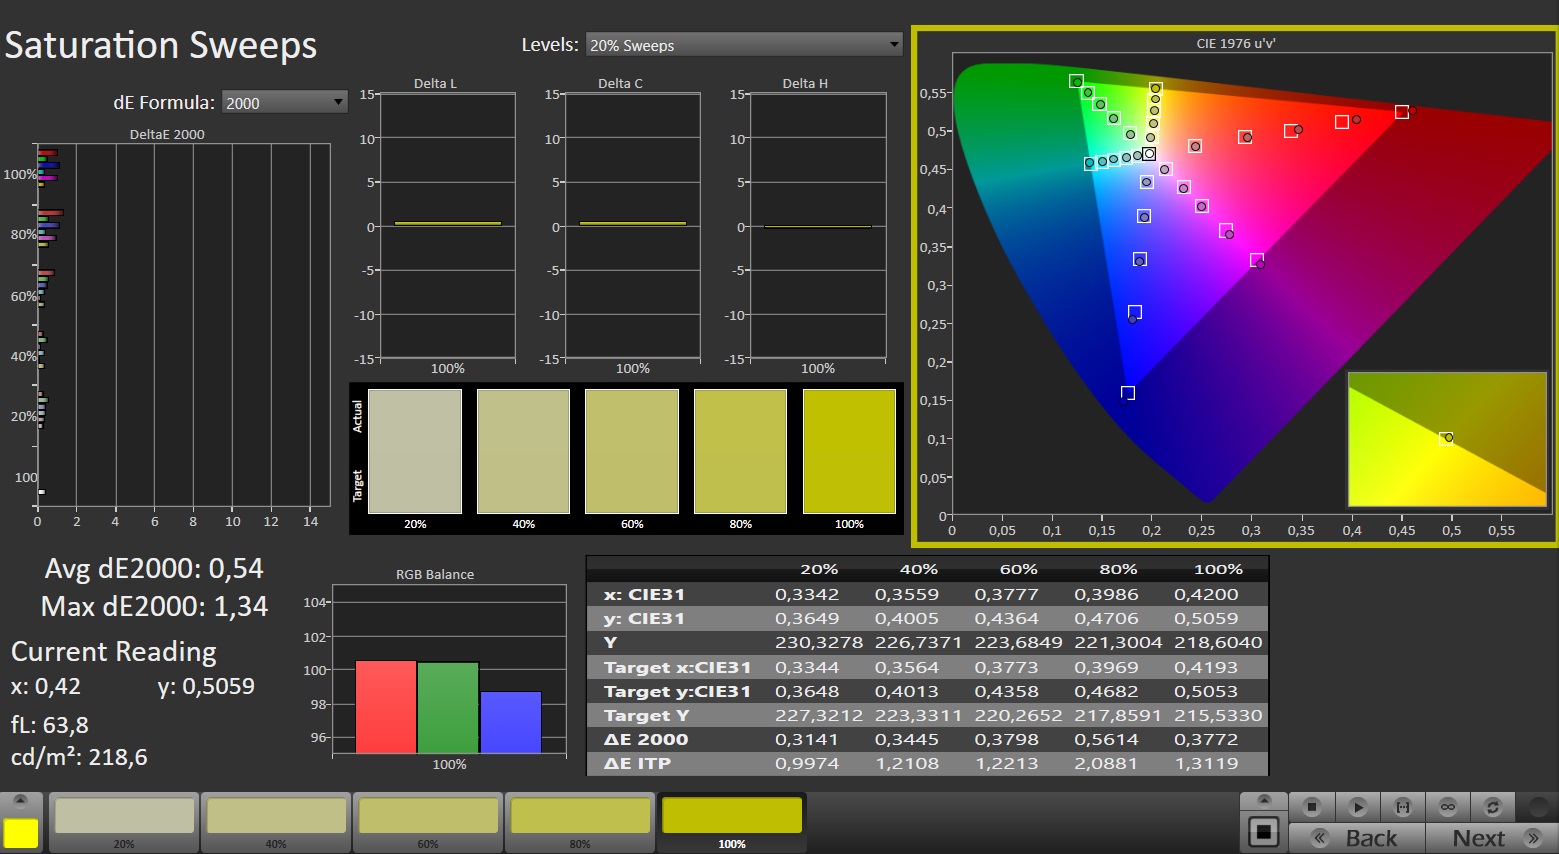
Bildskärm: QHD+ med hyfsad sRGB-täckning
2024 Beast X40 har samma matta QHD+ 240 Hz-skärm (2 560 x 1 600 pixlar) som utvecklats av BOE och som liknar 2023 Beast X40. Panelen har bra ljusstyrka, korta svarstider, höga bildfrekvenser och uppvisar inte PWM-flimmer.
Medion erbjuder för närvarande inga andra displayalternativ att välja mellan.
| |||||||||||||||||||||||||
Distribution av ljusstyrkan: 87 %
Mitt på batteriet: 422 cd/m²
Kontrast: 1005:1 (Svärta: 0.42 cd/m²)
ΔE ColorChecker Calman: 1.42 | ∀{0.5-29.43 Ø4.71}
calibrated: 0.7
ΔE Greyscale Calman: 1.2 | ∀{0.09-98 Ø4.96}
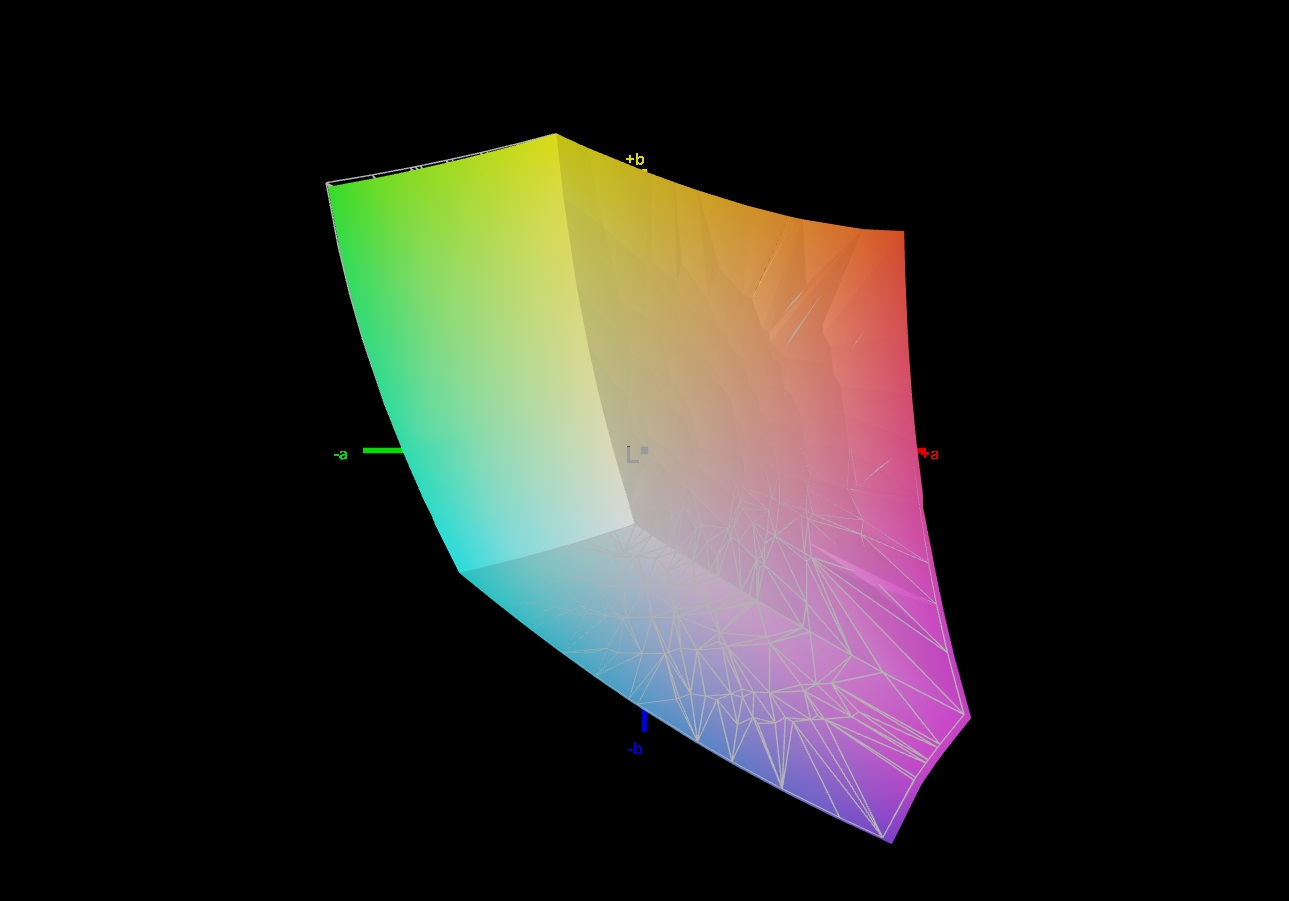
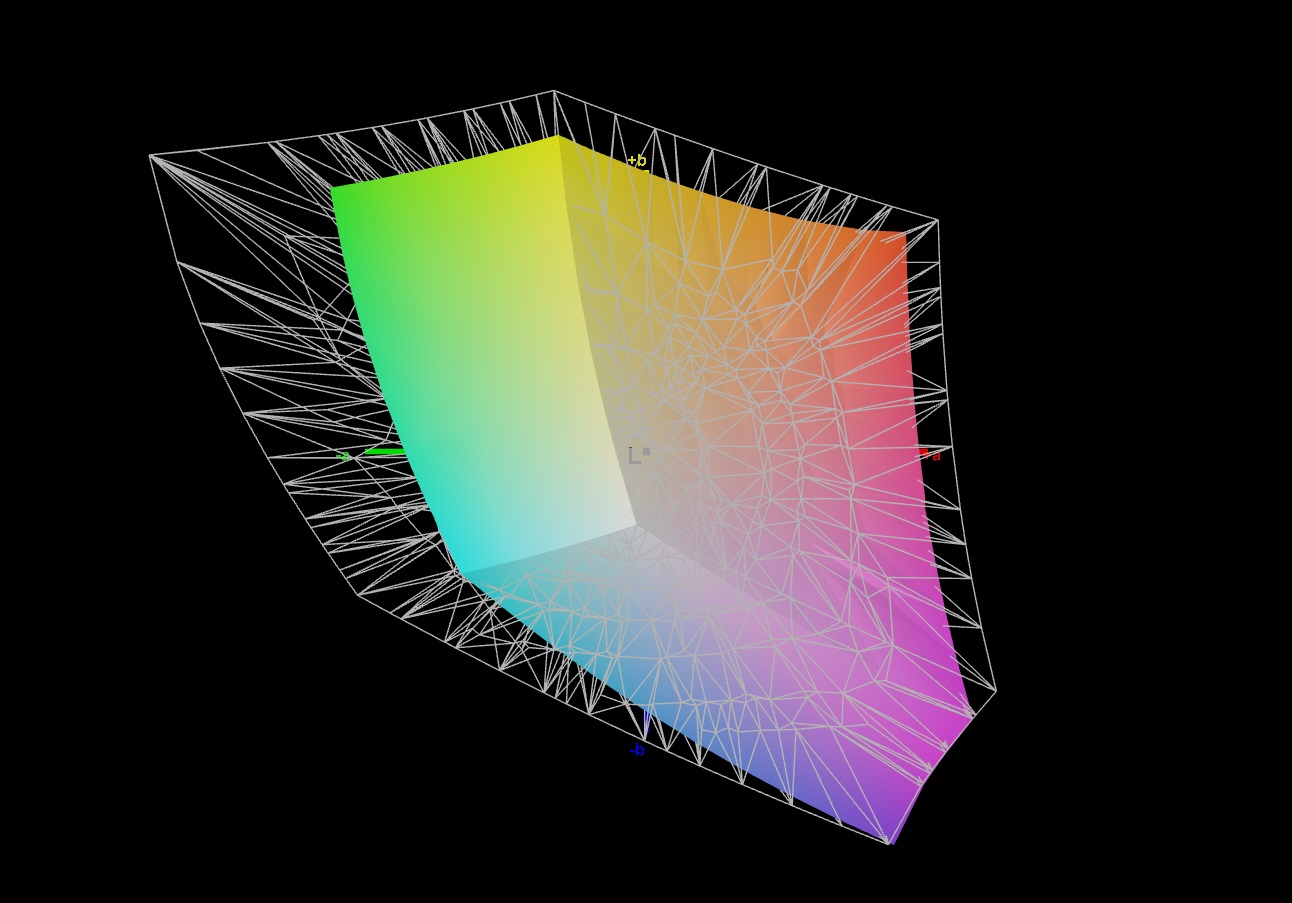
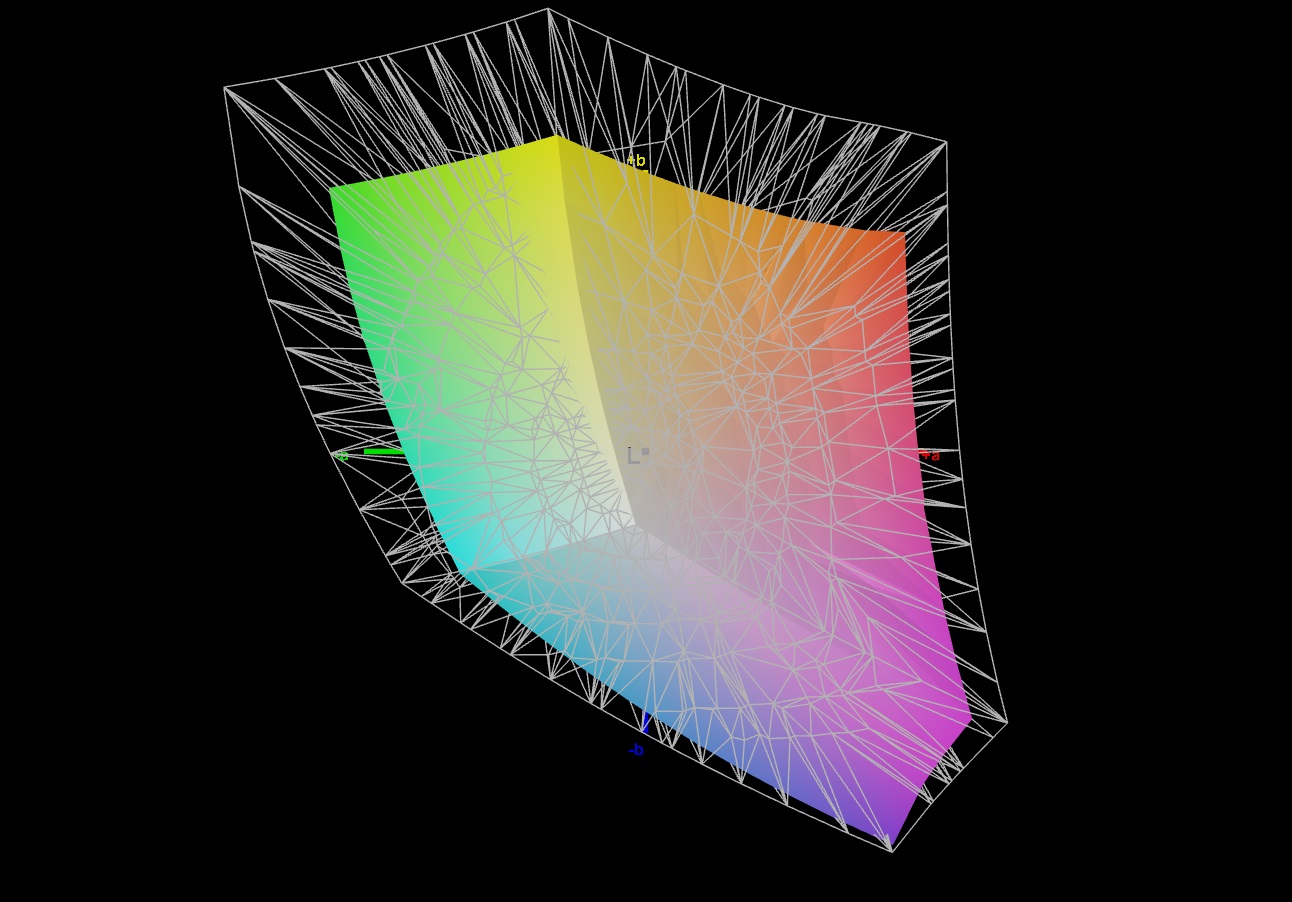
69% AdobeRGB 1998 (Argyll 3D)
99.5% sRGB (Argyll 3D)
68.1% Display P3 (Argyll 3D)
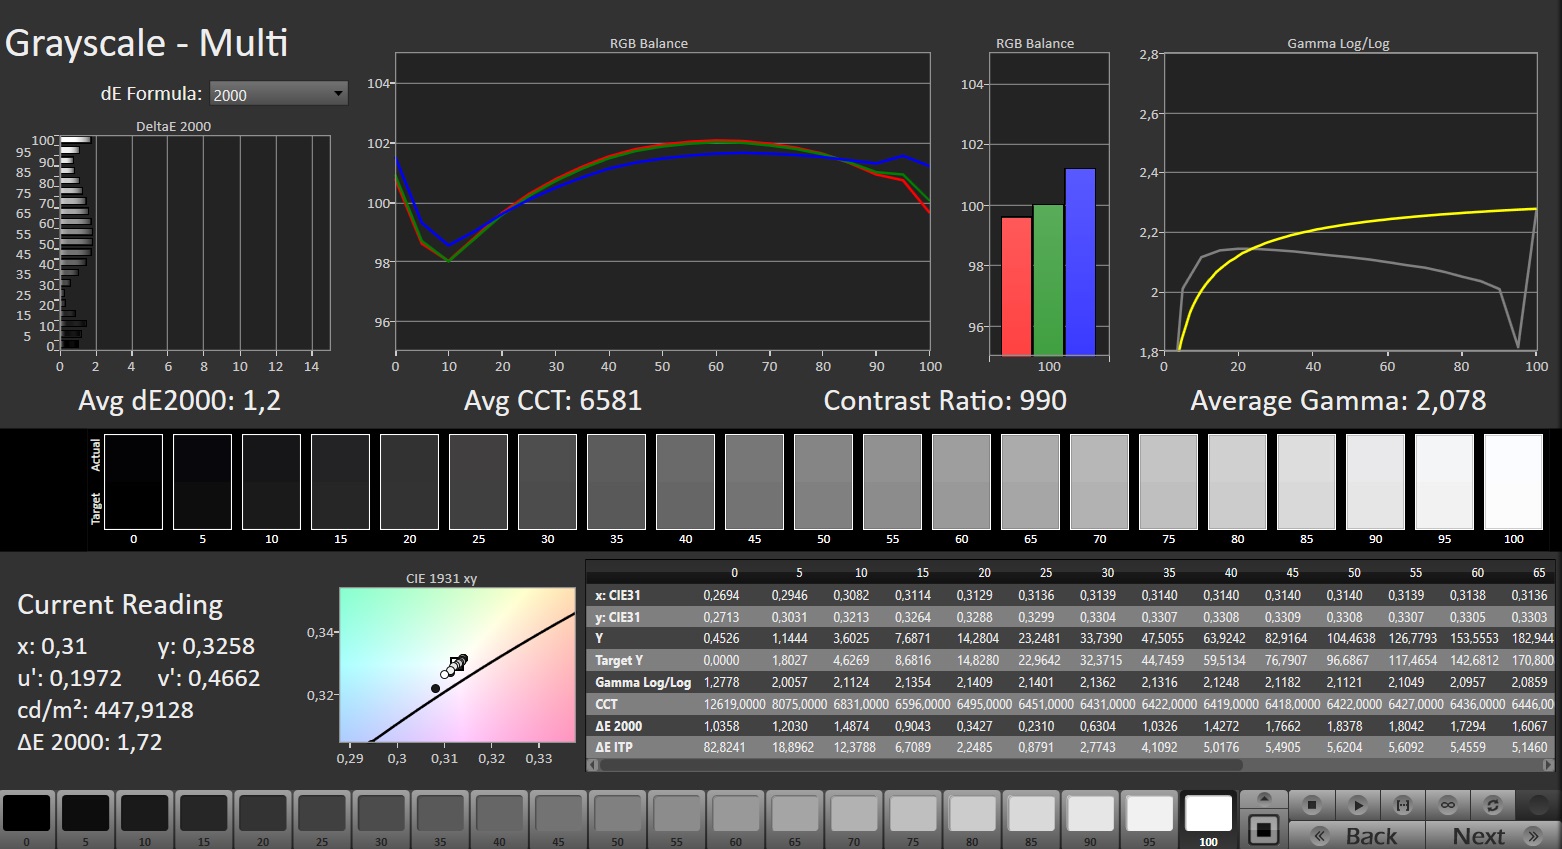
Gamma: 2.078
CCT: 6581 K
| Medion Erazer Beast X40 2024 BOE NE170QDM-NZ1, IPS, 2560x1600, 17" | Schenker Key 17 Pro (Early 23) BOE CQ NE173QUM-NY1, IPS, 3840x2160, 17.3" | Asus ROG Strix Scar 17 G733PY-XS96 NE173QHM-NZ2, IPS, 2560x1440, 17.3" | Asus ROG Strix Scar 18 G834JYR (2024) BOE NE180QDM-NM1, Mini LED, 2560x1600, 18" | MSI Titan 18 HX A14VIG AU Optronics B180ZAN01.0, Mini-LED, 3840x2400, 18" | Medion Erazer Beast X40 BOE NE170QDM-NZ1, IPS, 2560x1600, 17" | |
|---|---|---|---|---|---|---|
| Display | 21% | 23% | 26% | 23% | 1% | |
| Display P3 Coverage (%) | 68.1 | 96.4 42% | 98 44% | 99.9 47% | 98.1 44% | 68.6 1% |
| sRGB Coverage (%) | 99.5 | 99.9 0% | 100 1% | 100 1% | 99.8 0% | 99.8 0% |
| AdobeRGB 1998 Coverage (%) | 69 | 84.3 22% | 85.6 24% | 90 30% | 86.2 25% | 69.4 1% |
| Response Times | -15% | -9% | -29% | -530% | -3% | |
| Response Time Grey 50% / Grey 80% * (ms) | 11.7 ? | 14.8 ? -26% | 6.2 ? 47% | 12 ? -3% | 8.6 ? 26% | 11.3 ? 3% |
| Response Time Black / White * (ms) | 6.9 ? | 7.2 ? -4% | 11.4 ? -65% | 10.7 ? -55% | 81.8 ? -1086% | 7.5 ? -9% |
| PWM Frequency (Hz) | 5733 ? | 2592 ? | ||||
| Screen | -0% | -6% | 166% | -119% | -29% | |
| Brightness middle (cd/m²) | 422 | 487 15% | 322.5 -24% | 937 122% | 467.5 11% | 384 -9% |
| Brightness (cd/m²) | 388 | 485 25% | 317 -18% | 934 141% | 459 18% | 377 -3% |
| Brightness Distribution (%) | 87 | 87 0% | 86 -1% | 89 2% | 90 3% | 90 3% |
| Black Level * (cd/m²) | 0.42 | 0.51 -21% | 0.29 31% | 0.066 84% | 0.45 -7% | |
| Contrast (:1) | 1005 | 955 -5% | 1112 11% | 14197 1313% | 853 -15% | |
| Colorchecker dE 2000 * | 1.42 | 1.51 -6% | 1.15 19% | 1.52 -7% | 3.77 -165% | 2.05 -44% |
| Colorchecker dE 2000 max. * | 1.97 | 2.19 -11% | 3.03 -54% | 2.82 -43% | 6.12 -211% | 3.64 -85% |
| Colorchecker dE 2000 calibrated * | 0.7 | 0.56 20% | 1.21 -73% | 2.94 -320% | 0.74 -6% | |
| Greyscale dE 2000 * | 1.2 | 1.2 -0% | 1.7 -42% | 1.7 -42% | 3.2 -167% | 2.3 -92% |
| Gamma | 2.078 106% | 2.273 97% | 2.27 97% | 2.042 108% | 2.43 91% | 2.017 109% |
| CCT | 6581 99% | 6451 101% | 6299 103% | 6578 99% | 6478 100% | 6546 99% |
| Totalt genomsnitt (program/inställningar) | 2% /
2% | 3% /
-1% | 54% /
108% | -209% /
-152% | -10% /
-19% |
* ... mindre är bättre
Displayen visar bra färgåtergivning från fabrik: Med en avvikelse på ca 1,4 uppfylls målet (DeltaE < 3). Kalibreringen minskar avvikelsen till 0,7 och säkerställer mer balanserade gråskalor.
Panelen kan återge sRGB-färgrymden fullständigt, men inte AdobeRGB och DCI P3-färgrymderna. Konkurrenternas bildskärmar erbjuder mer här.

Visa svarstider
| ↔ Svarstid svart till vitt | ||
|---|---|---|
| 6.9 ms ... stiga ↗ och falla ↘ kombinerat | ↗ 2.8 ms stiga | 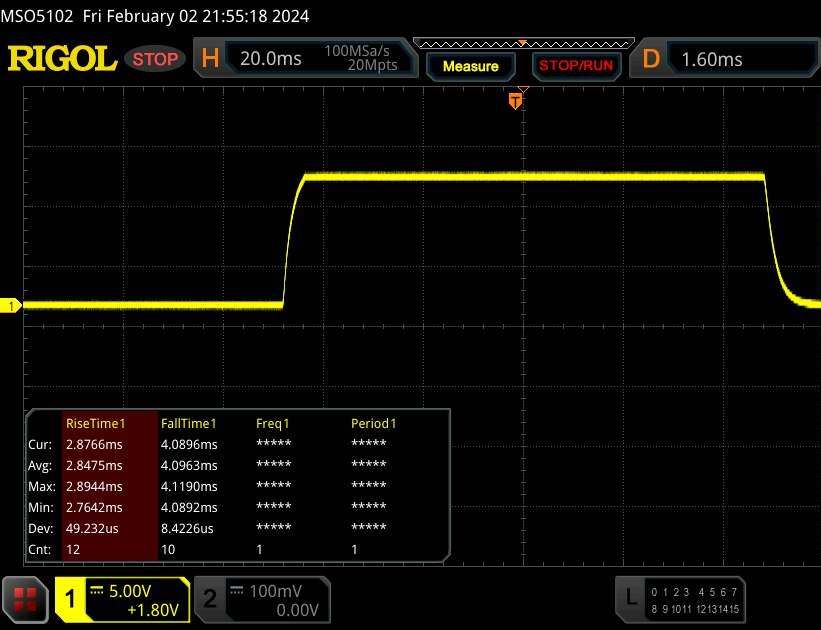 |
| ↘ 4.1 ms hösten | ||
| Skärmen visar väldigt snabba svarsfrekvenser i våra tester och borde vara mycket väl lämpad för fartfyllt spel. I jämförelse sträcker sig alla testade enheter från 0.1 (minst) till 240 (maximalt) ms. » 21 % av alla enheter är bättre. Det betyder att den uppmätta svarstiden är bättre än genomsnittet av alla testade enheter (19.8 ms). | ||
| ↔ Svarstid 50 % grått till 80 % grått | ||
| 11.7 ms ... stiga ↗ och falla ↘ kombinerat | ↗ 5.7 ms stiga | 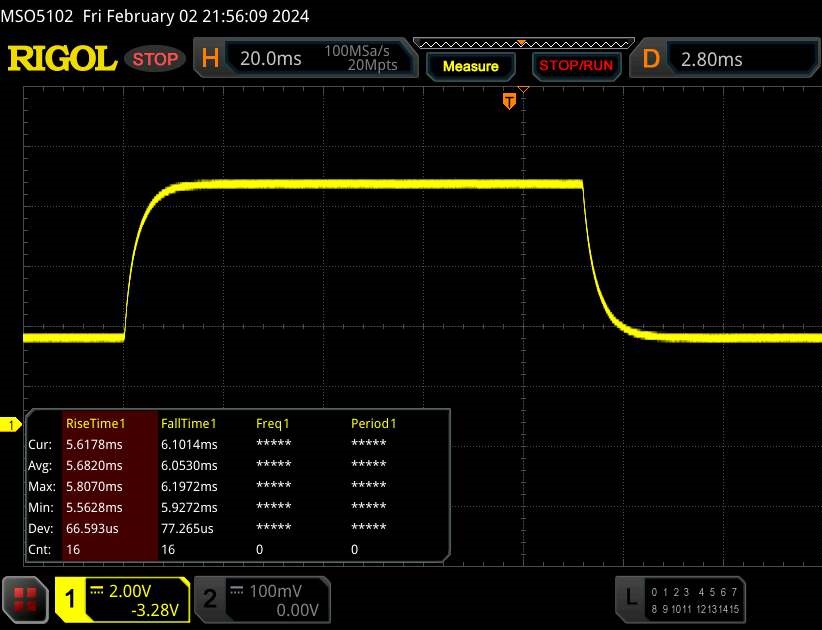 |
| ↘ 6 ms hösten | ||
| Skärmen visar bra svarsfrekvens i våra tester, men kan vara för långsam för konkurrenskraftiga spelare. I jämförelse sträcker sig alla testade enheter från 0.165 (minst) till 636 (maximalt) ms. » 25 % av alla enheter är bättre. Det betyder att den uppmätta svarstiden är bättre än genomsnittet av alla testade enheter (31 ms). | ||
Skärmflimmer / PWM (Puls-Width Modulation)
| Skärmflimmer / PWM upptäcktes inte | 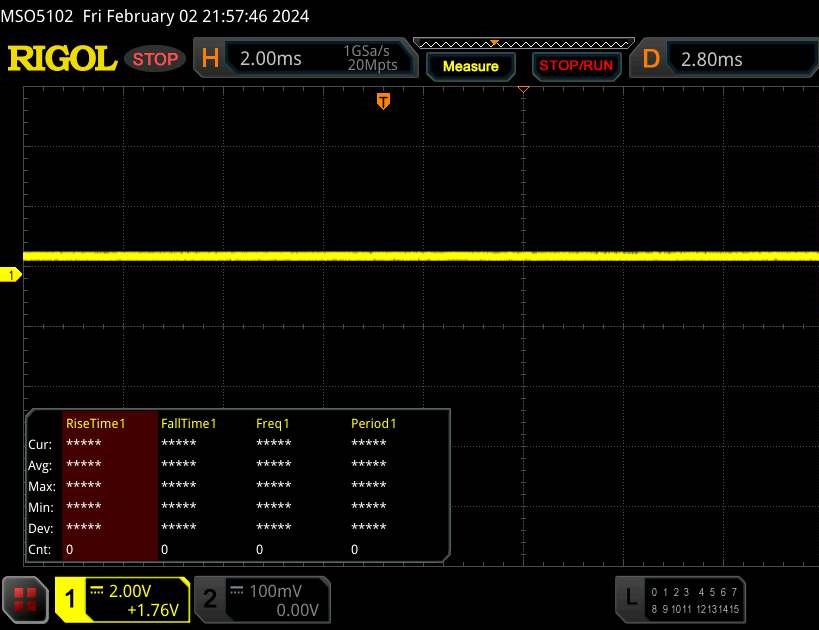 | ||
Som jämförelse: 52 % av alla testade enheter använder inte PWM för att dämpa skärmen. Om PWM upptäcktes mättes ett medelvärde av 7757 (minst: 5 - maximum: 343500) Hz. | |||
Den betraktningsvinkelstabila IPS-panelen kan läsas från alla positioner. Det går att läsa av displayen utomhus om solen inte är för stark.
Prestanda: Medion Beast X40 levereras med avancerad hårdvara
Medions high-end notebook gör en bra figur i alla prestandakrävande tillämpningsområden (t.ex. spel, rendering). Den nödvändiga beräkningskraften kommer från Raptor Lake och Ada Lovelace. Denna X40-modell finns tillgänglig för cirka 4 000 euro. Billigare versioner finns redan från 2 500 euro. Som tillval erbjuder Medion ett vattenkylningssystem (ca 200 euro), vilket kan leda till en liten prestandaökning och lägre utsläpp.
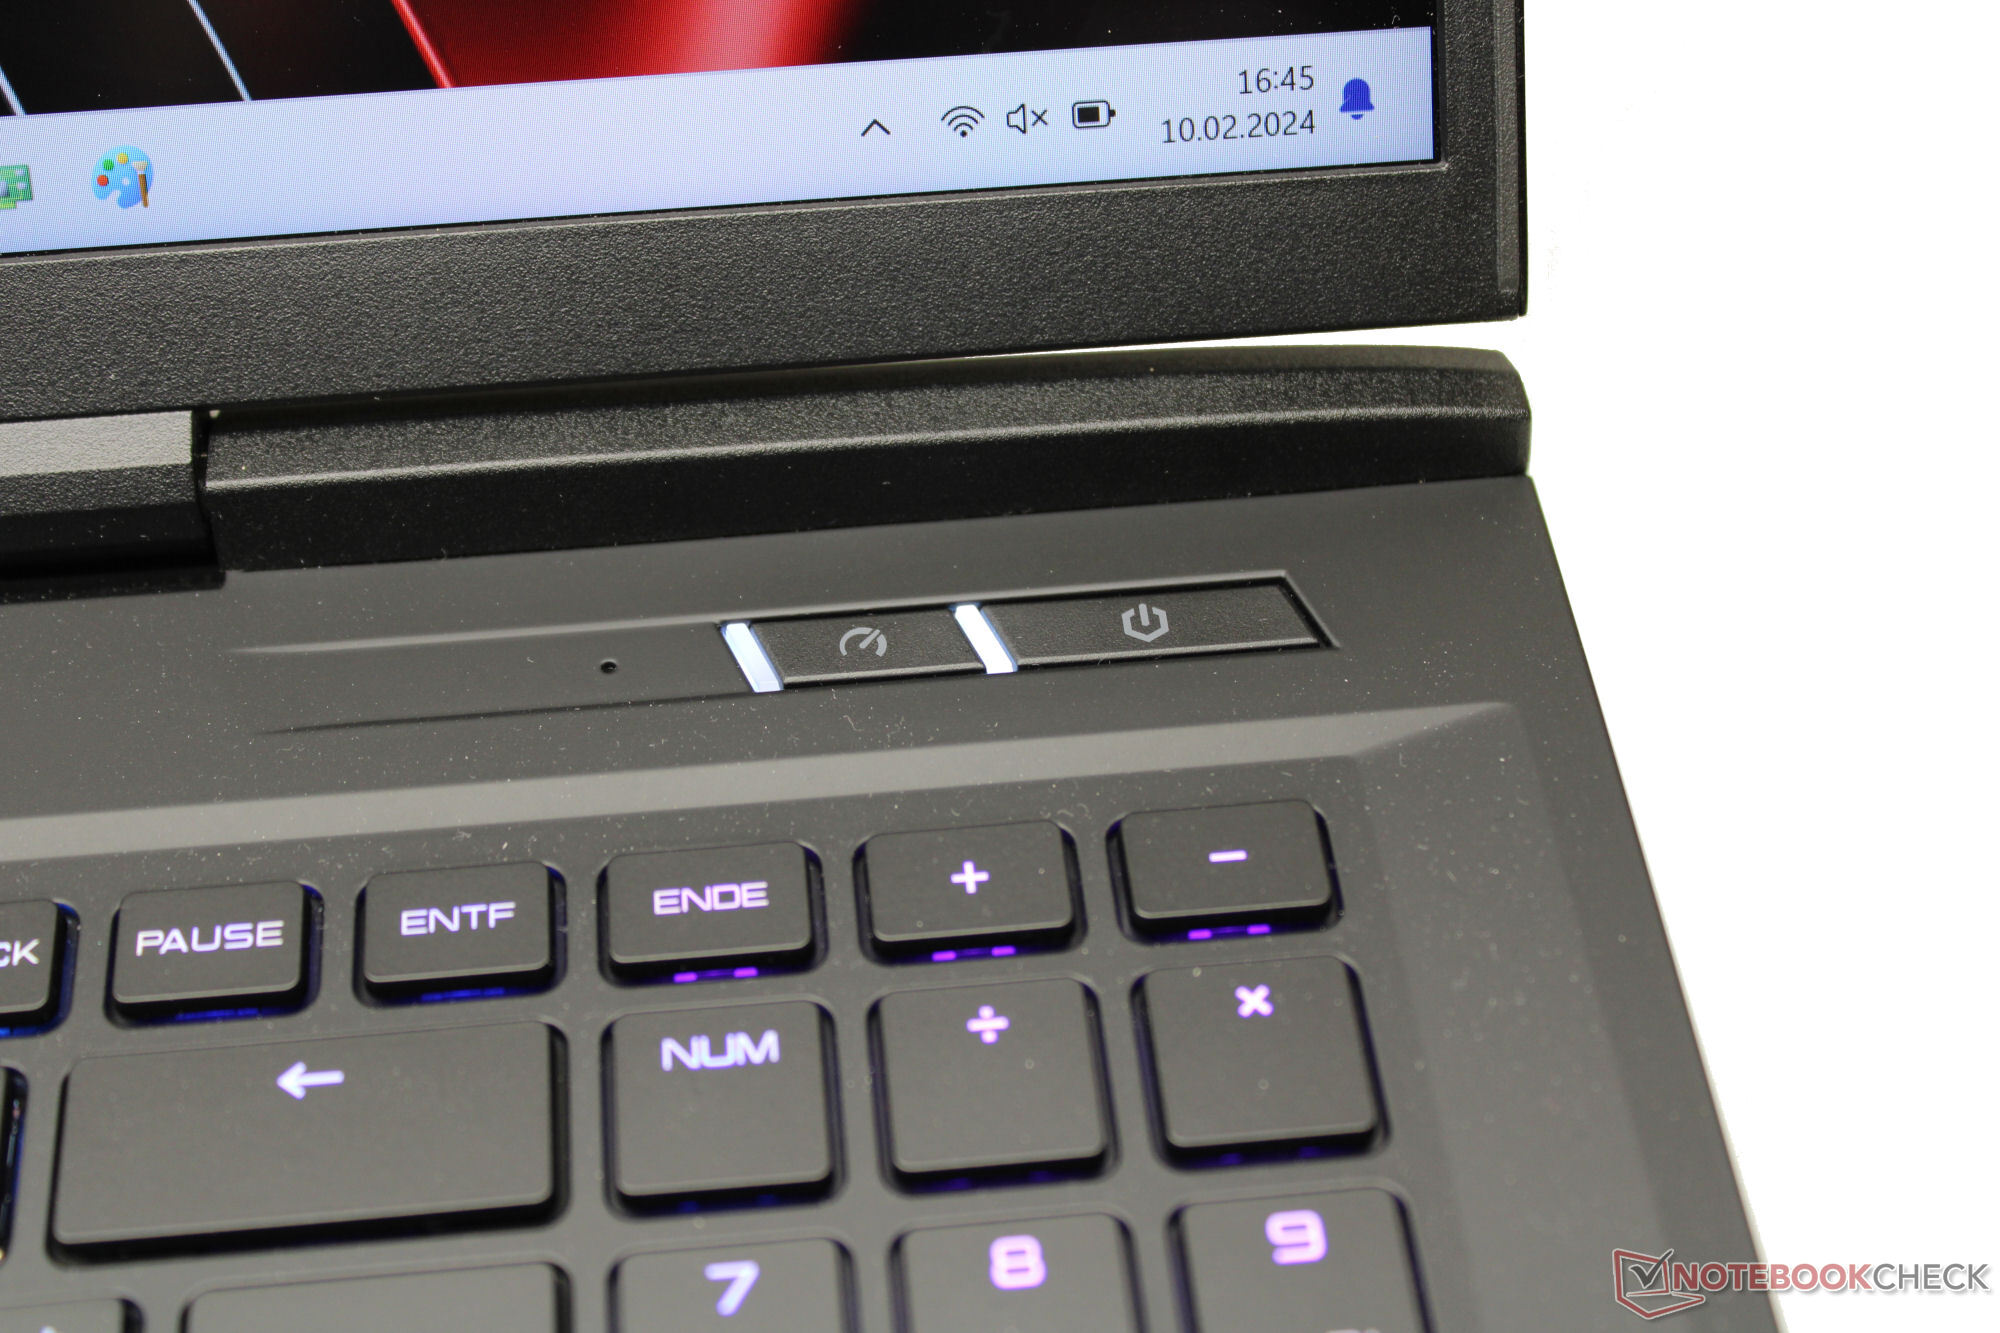
Testförhållanden
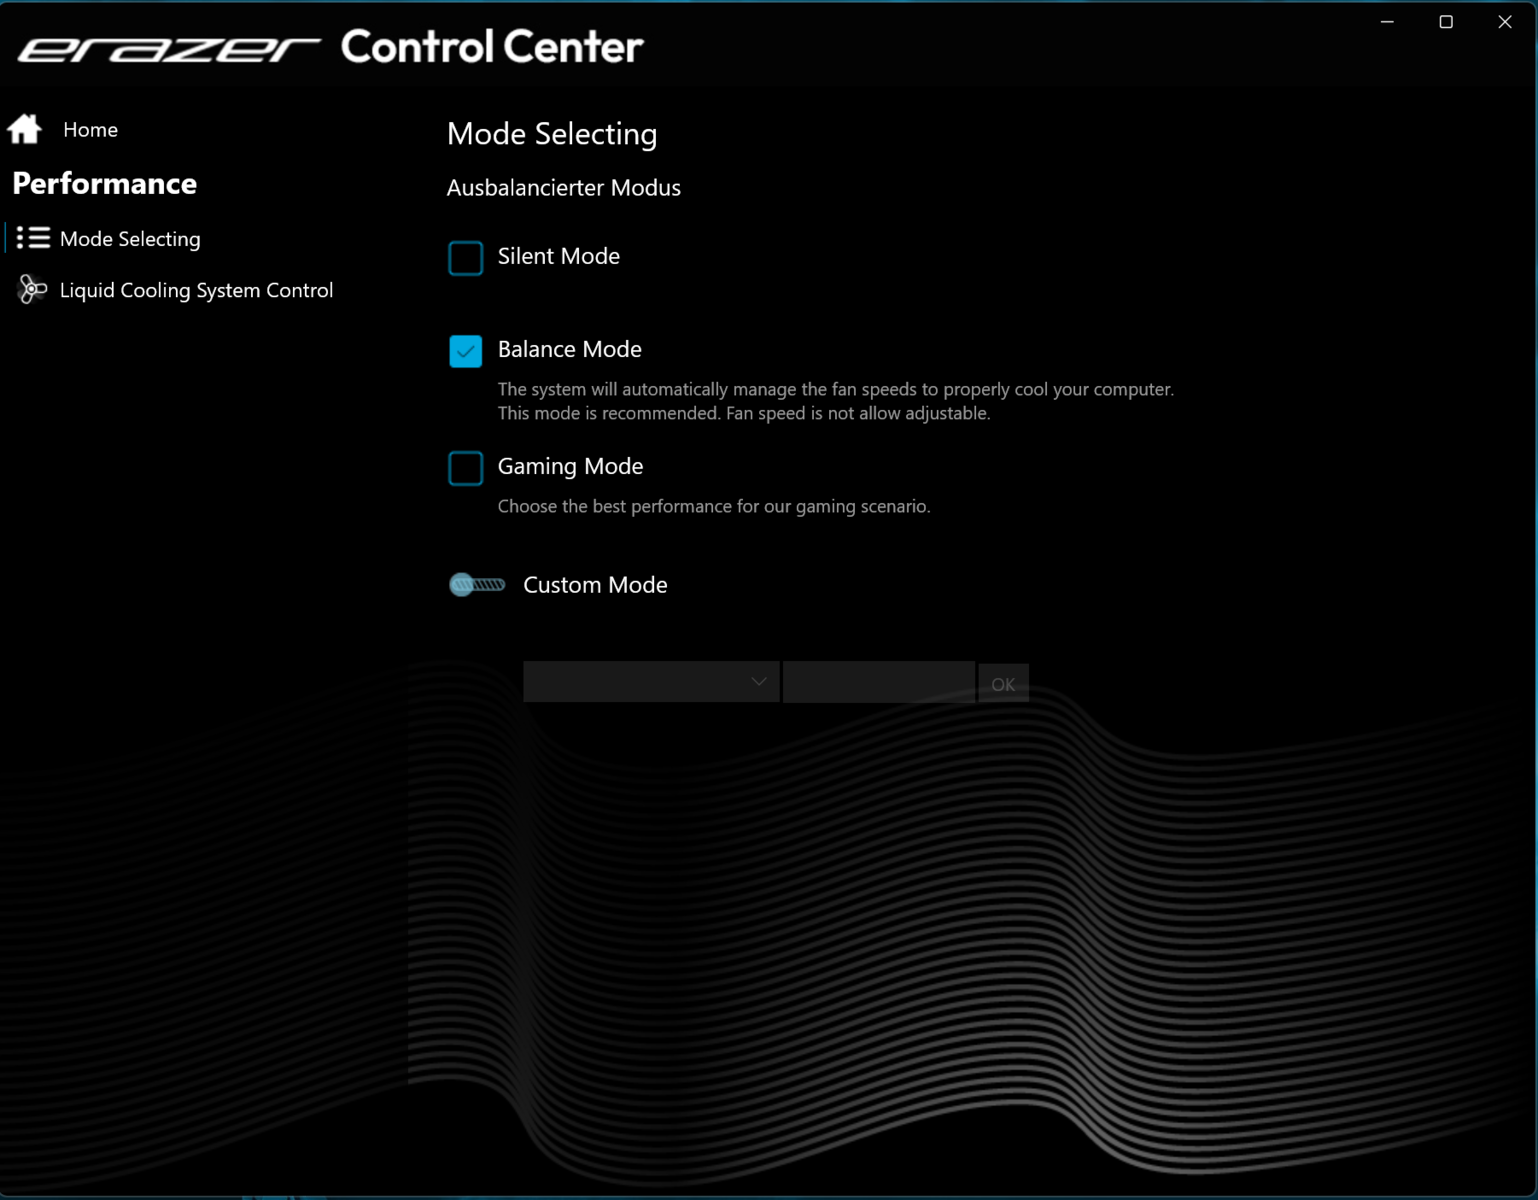
En särskild knapp bredvid strömknappen gör att du snabbt kan växla mellan de tre tillverkarspecifika prestandalägena (se tabellen nedan). Lägena "Balance Mode" (benchmarks) och "Silent Mode" (batteritester) användes.
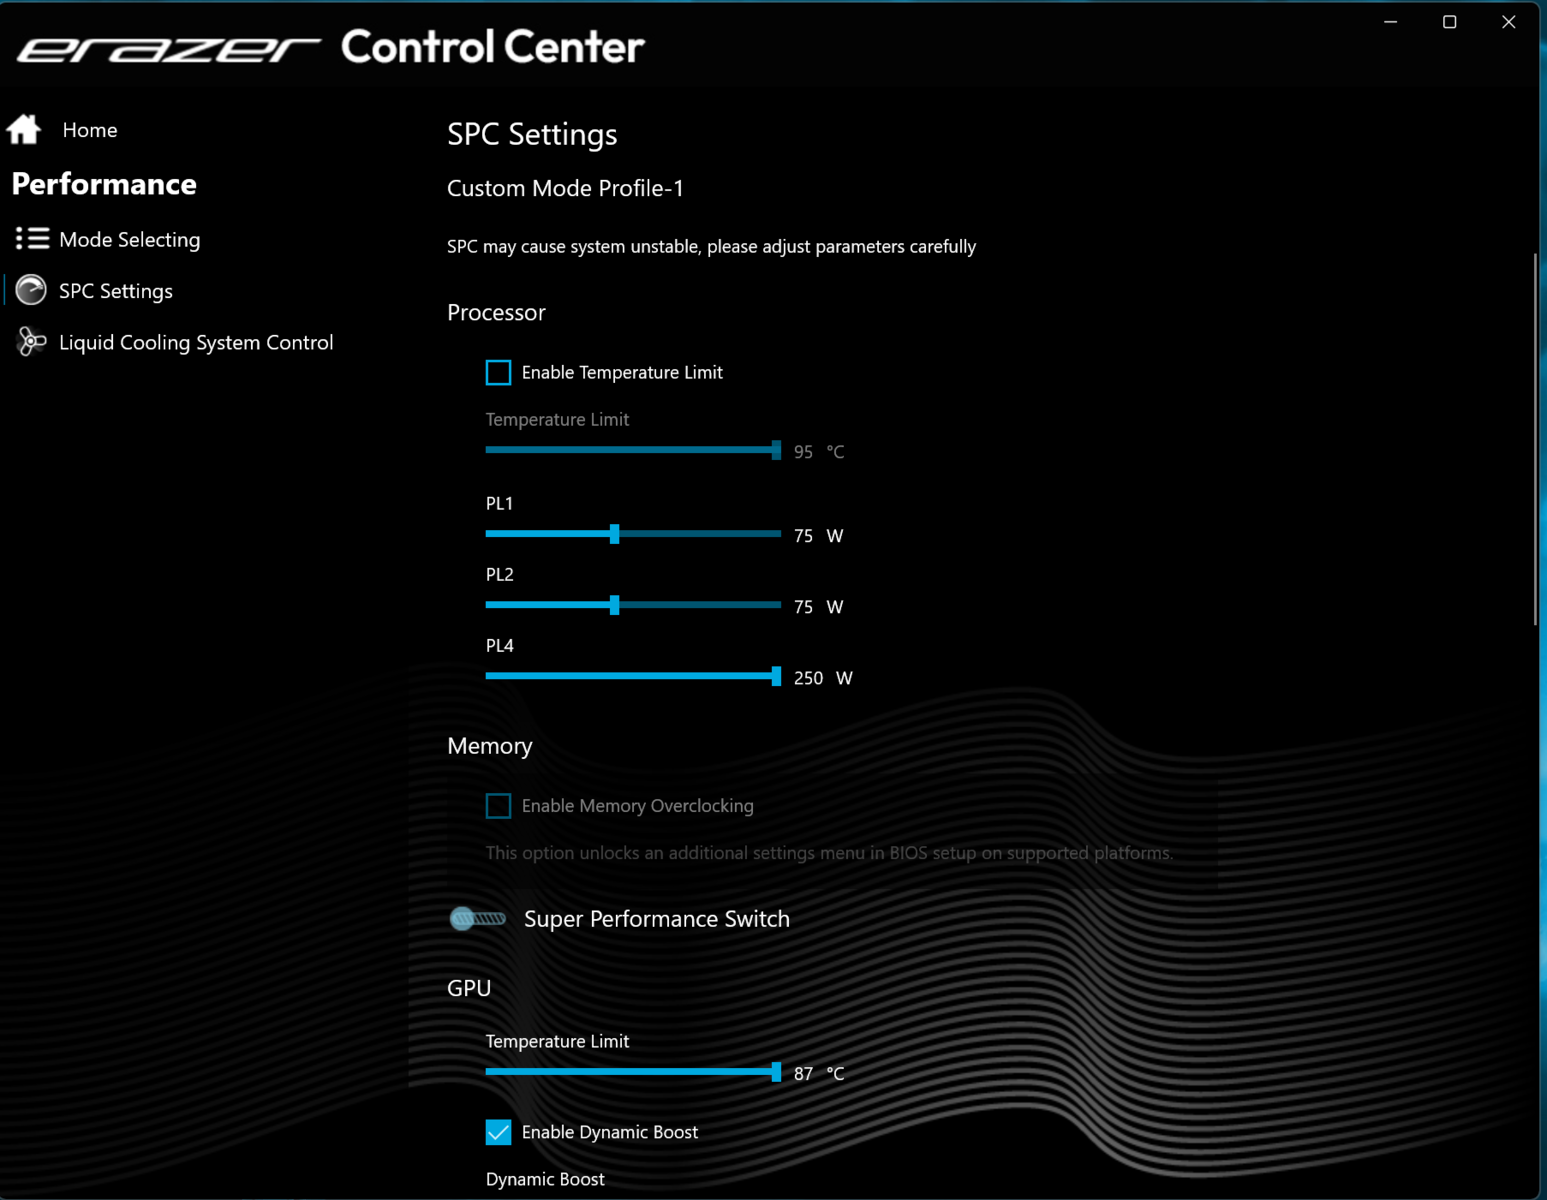
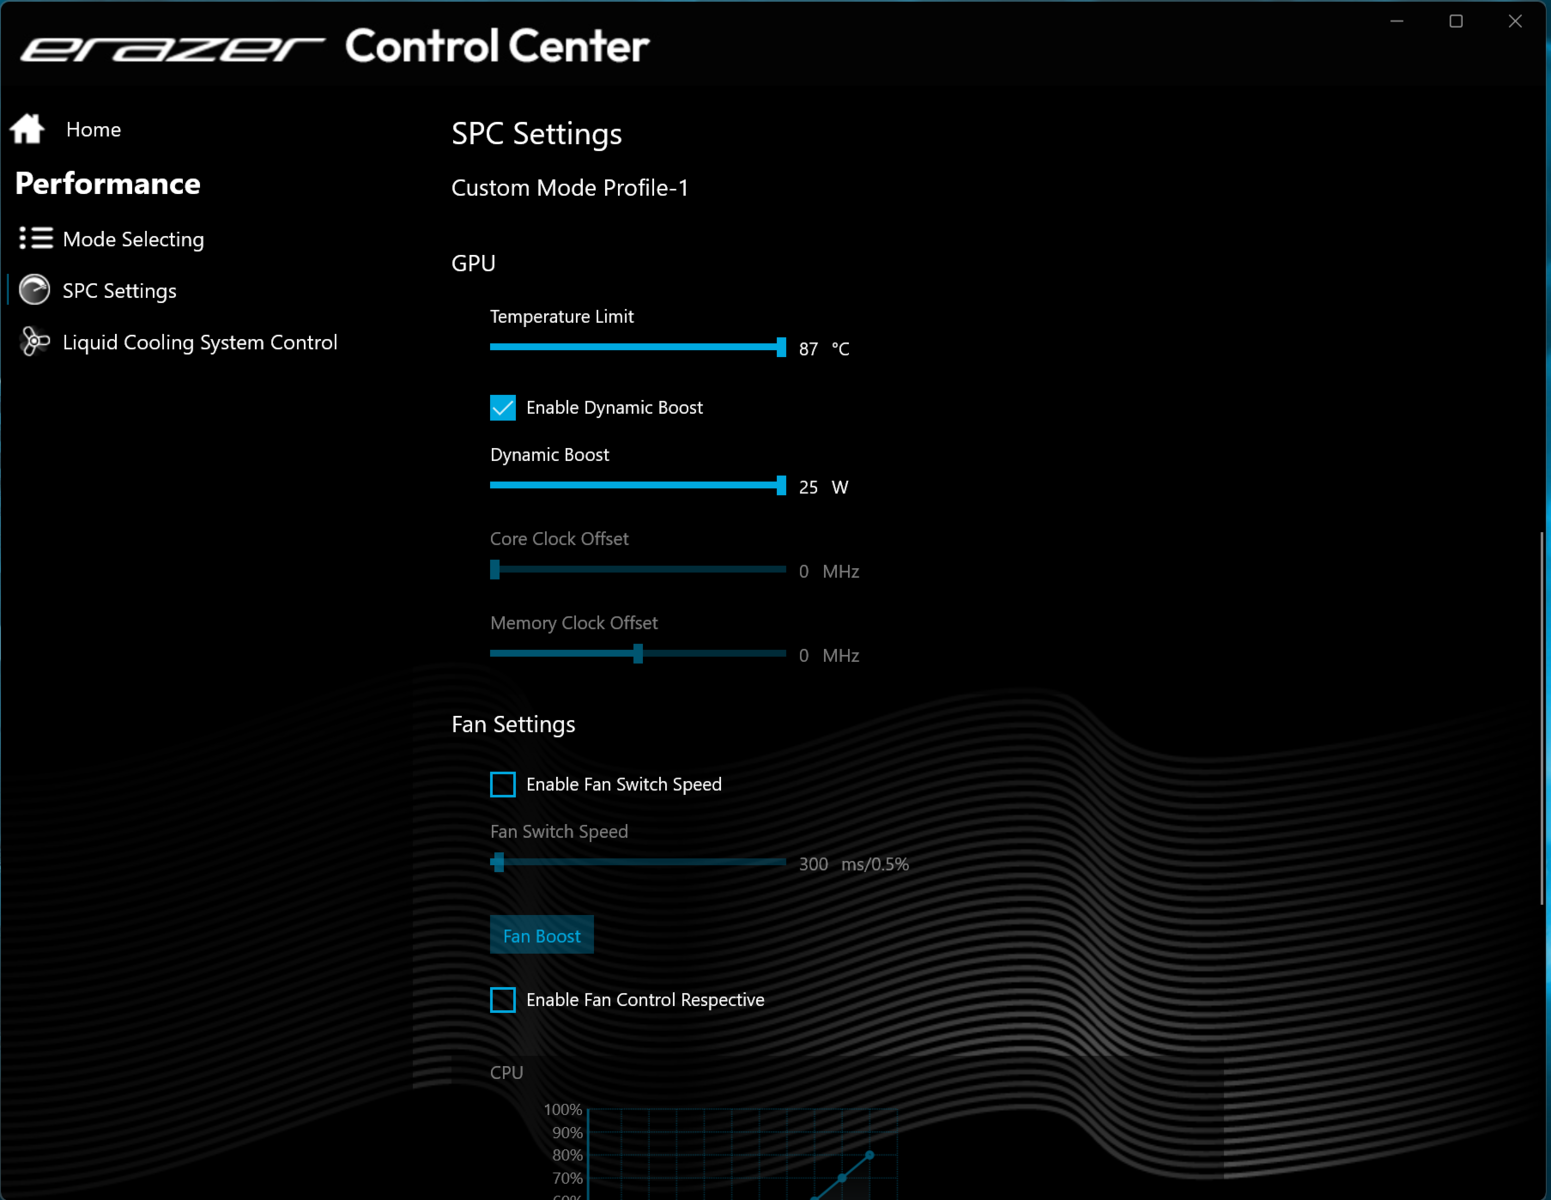
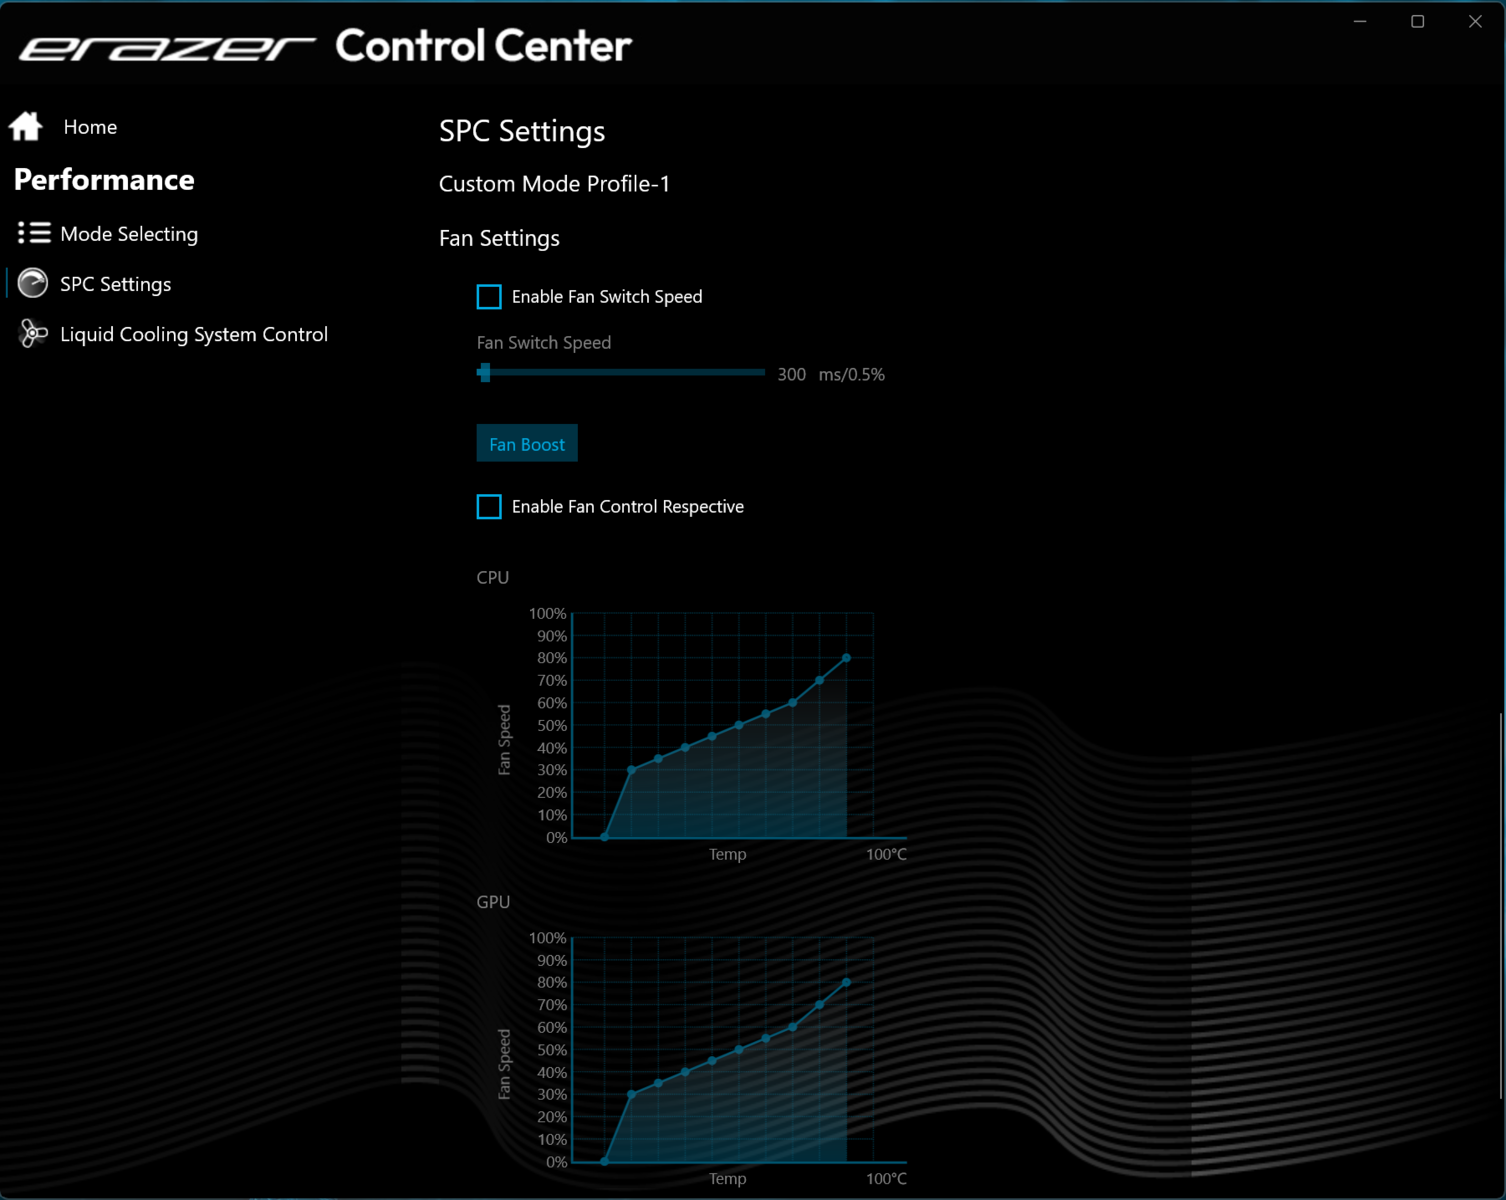
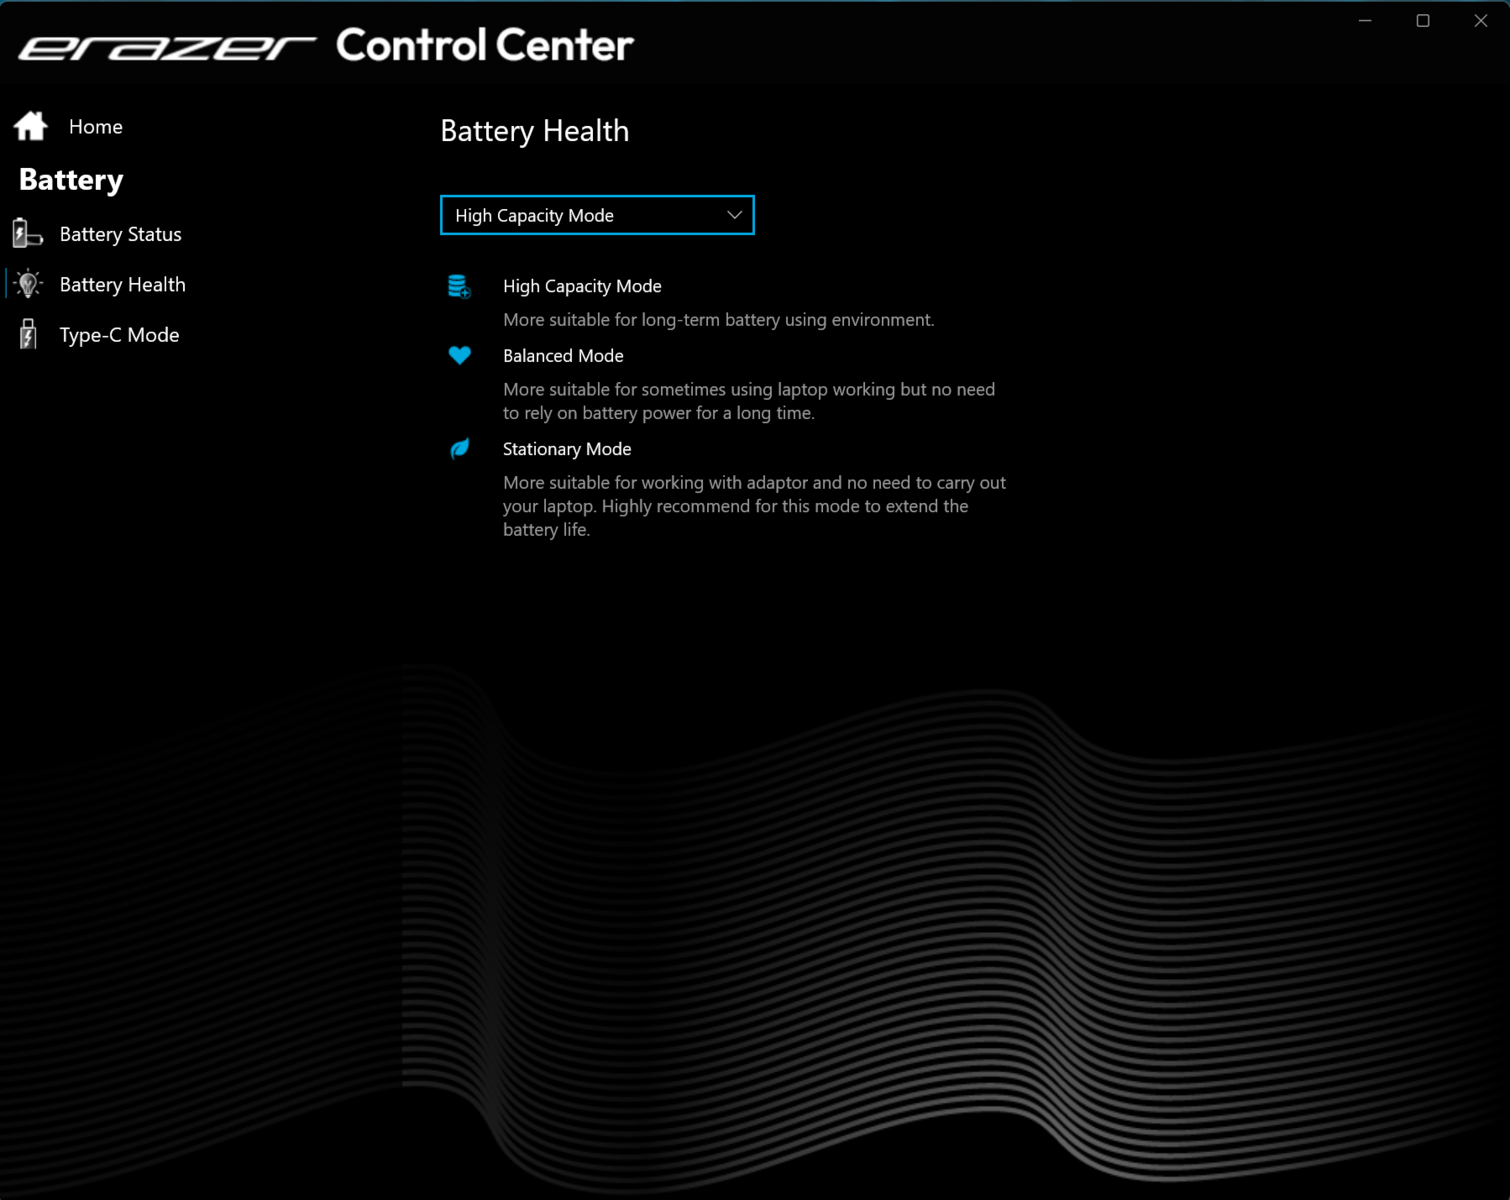
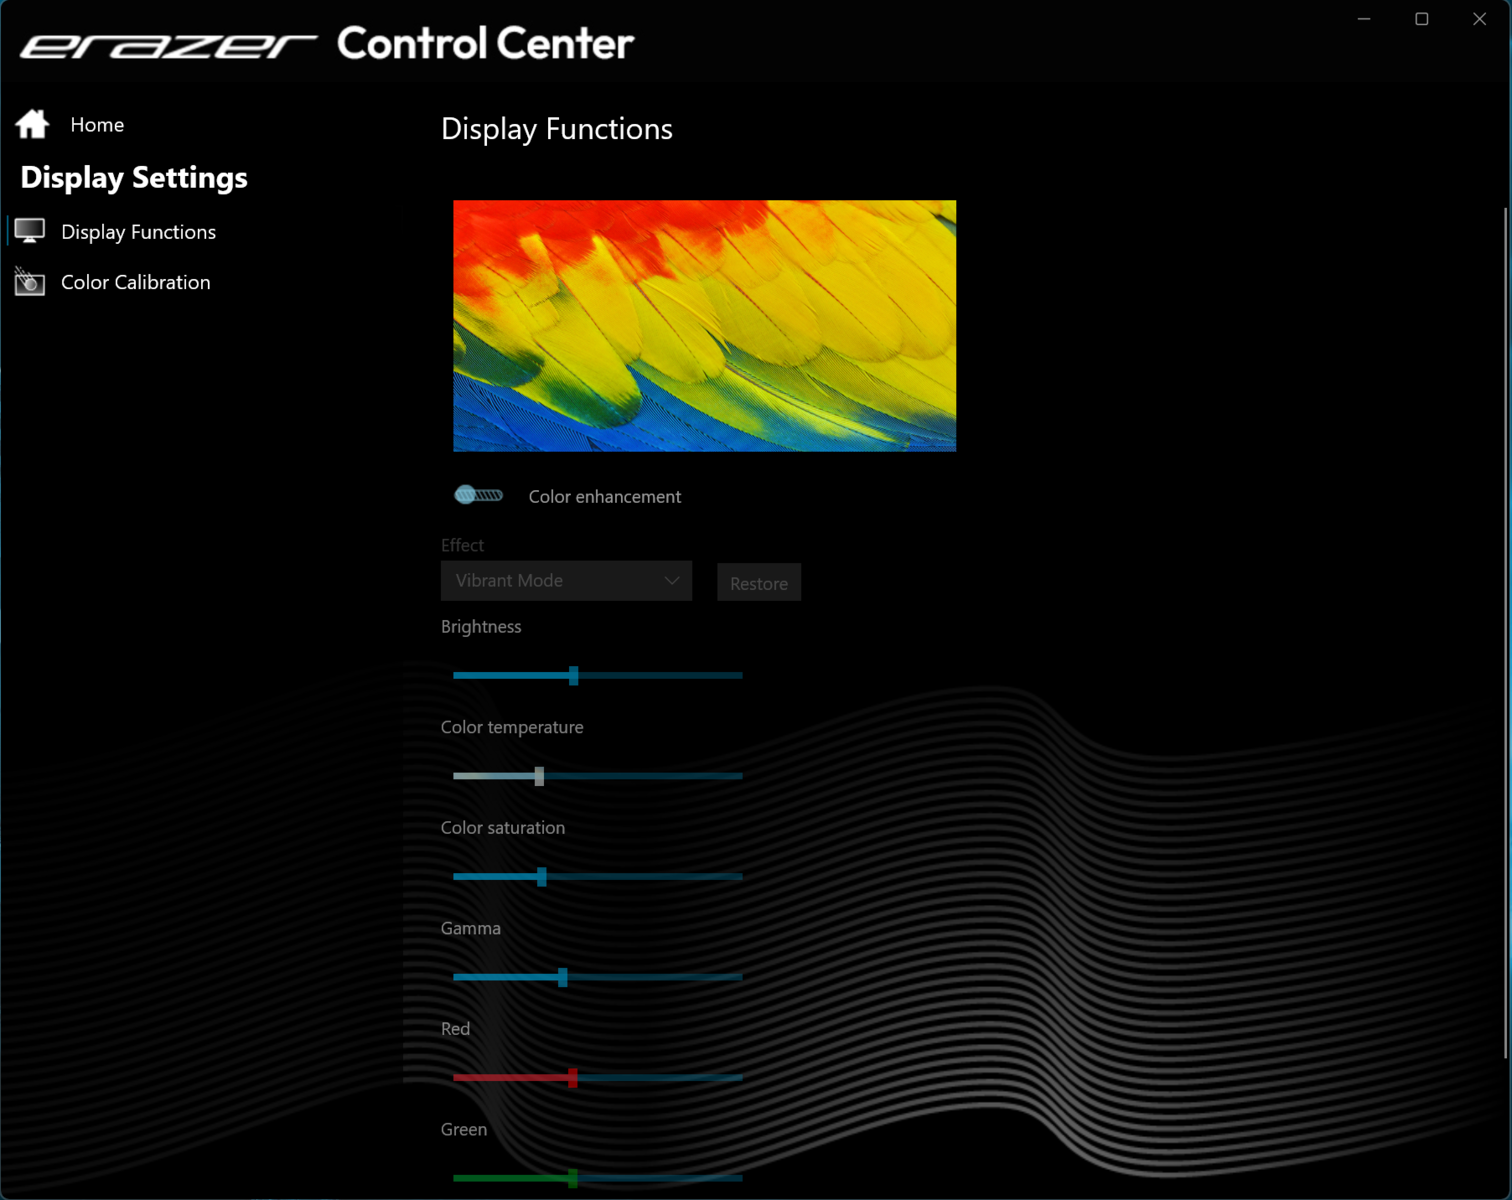
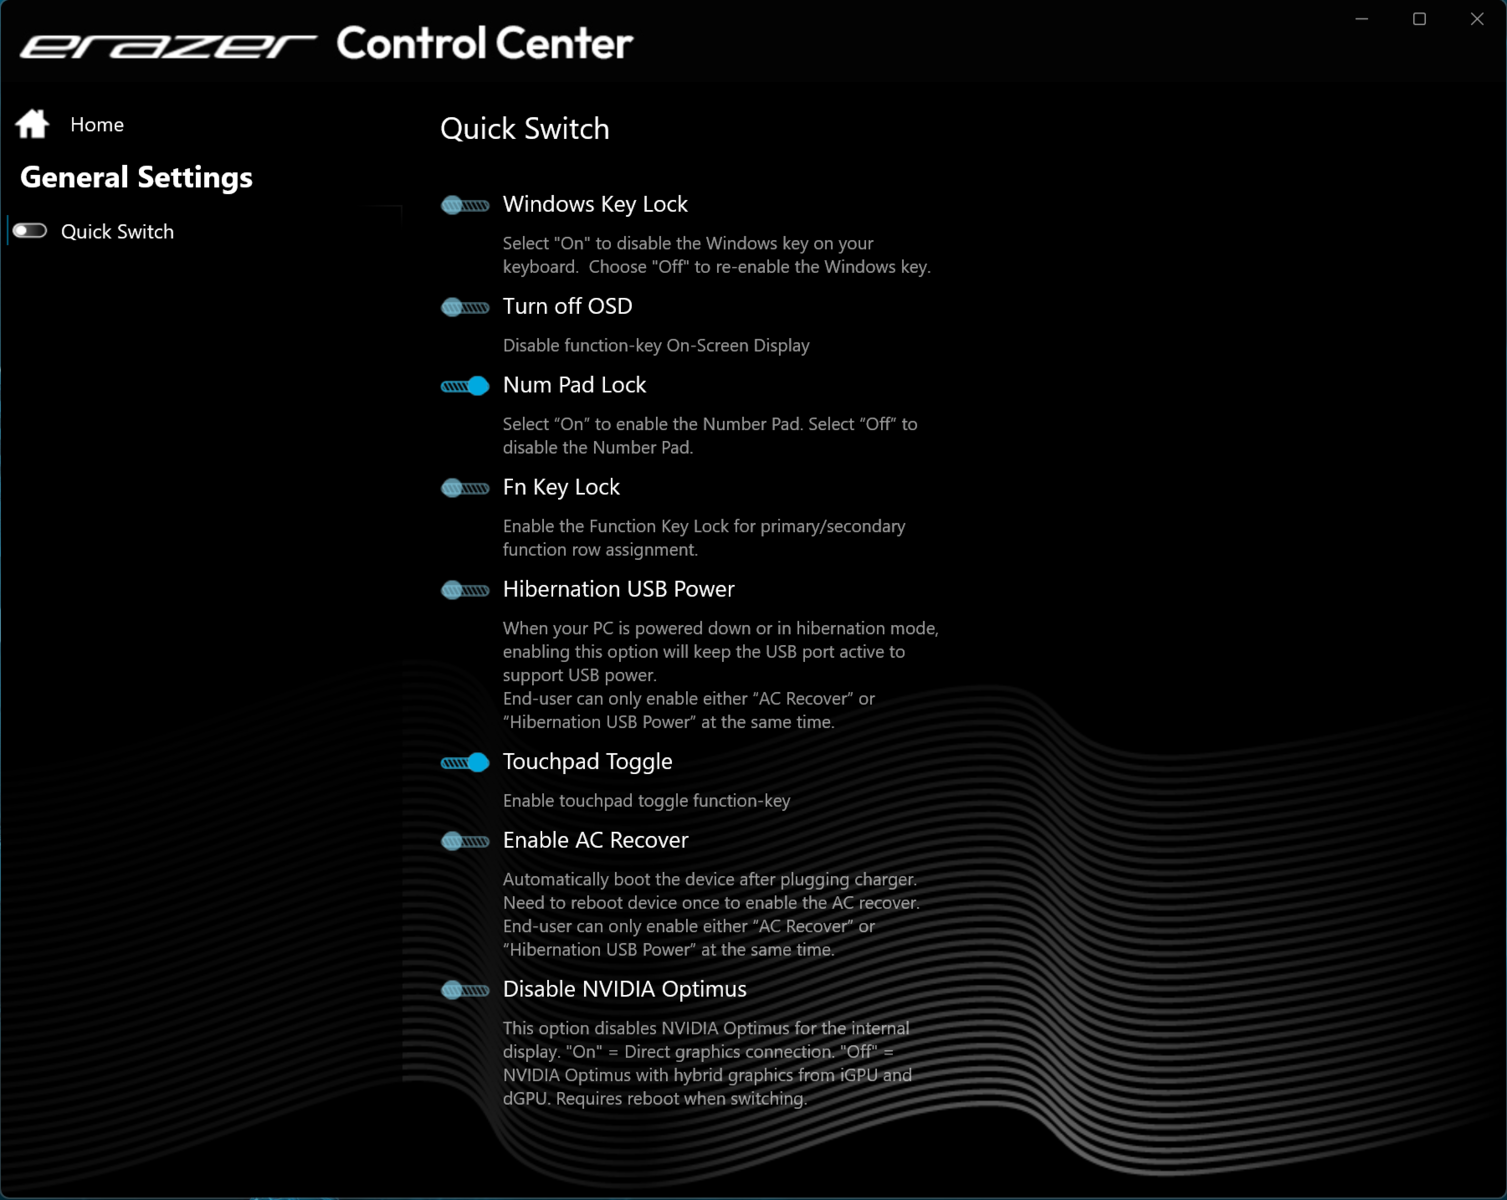
Individuella profiler kan skapas med hjälp av den förinstallerade Control Center-programvaran där effektgränserna för CPU, TGP för GPU och/eller de övre temperaturgränserna kan justeras.
| Gaming Mode | Balance Mode | Silent Mode | |
|---|---|---|---|
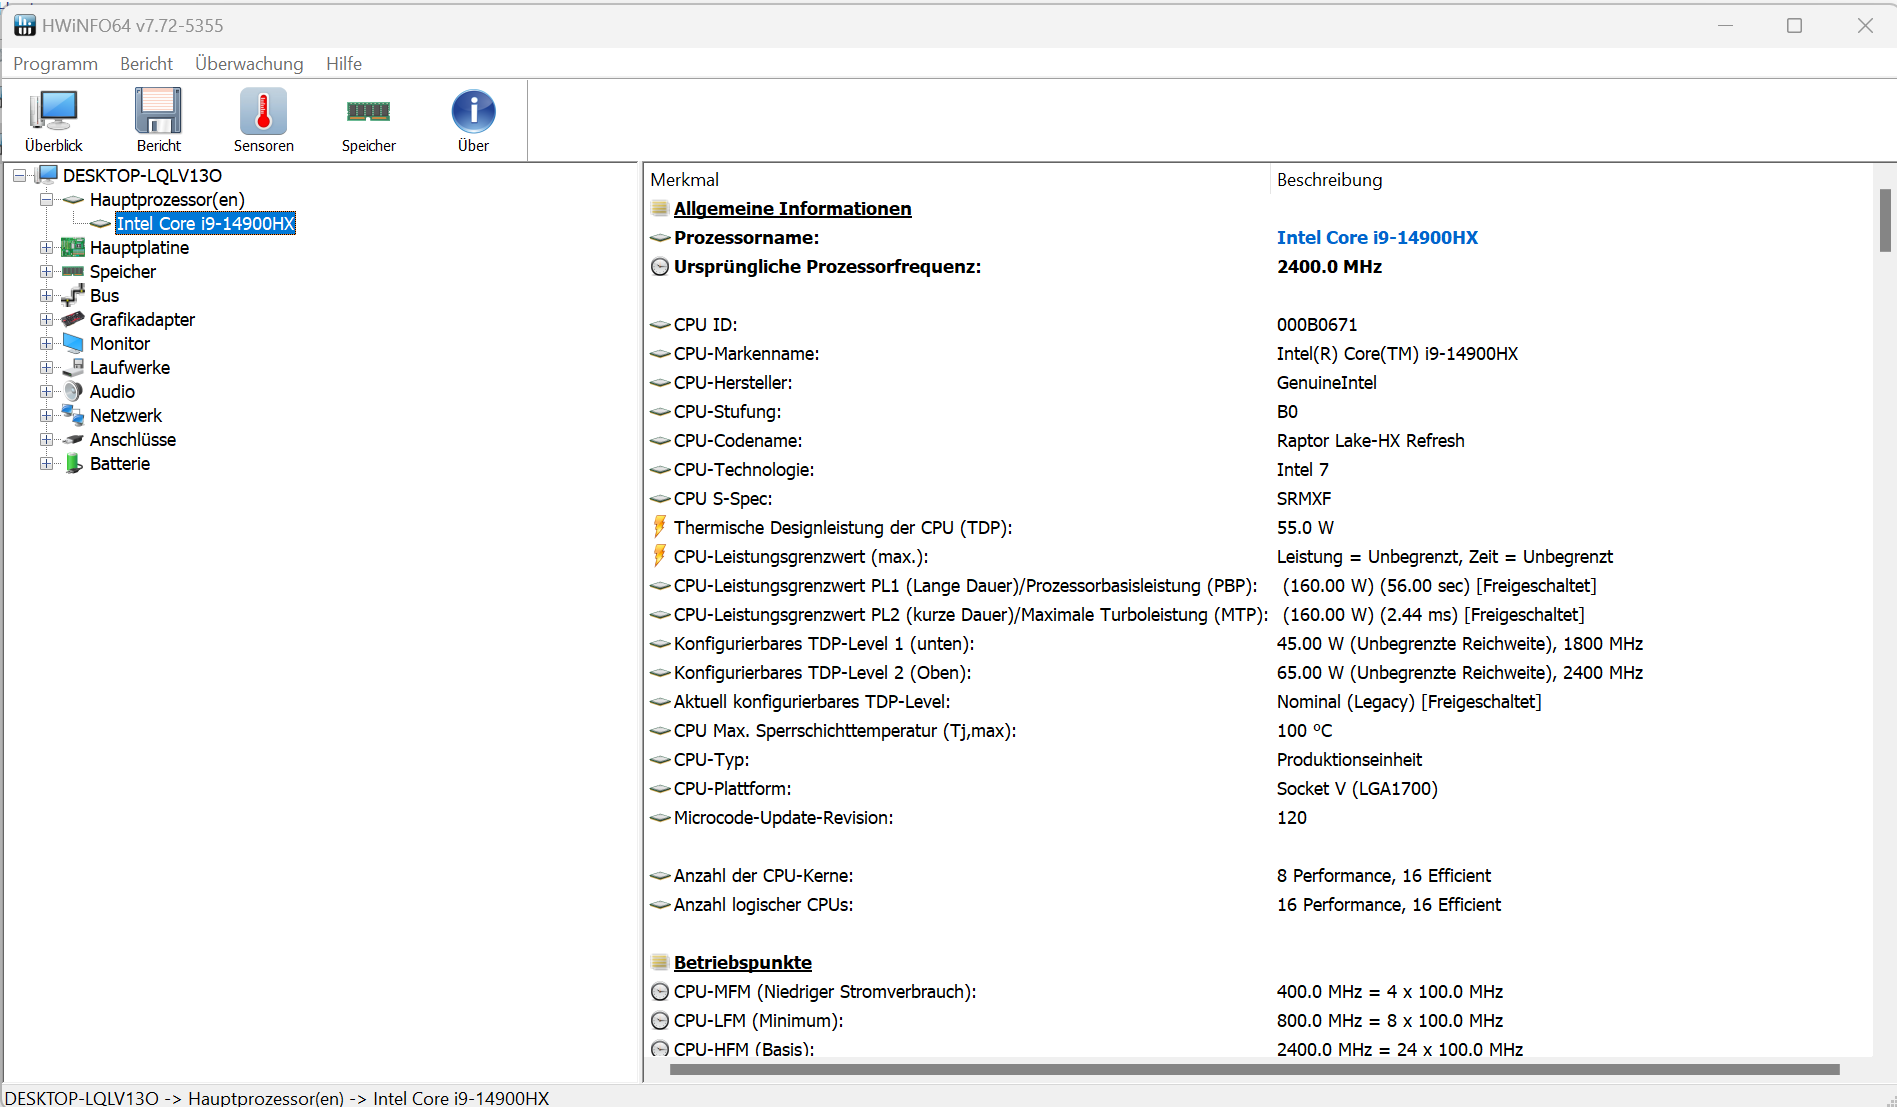
| Effektgräns 1 (HWInfo) | 160 watt | 160 watt | 160 watt |
| Effektgräns 2 (HWInfo) | 160 Watt | 160 Watt | 160 Watt |
| Buller (Witcher 3) | 52 dB(A) | 50 dB(A) | 34 dB(A) |
| Prestanda (Witcher 3) | ~214 fps | ~204 fps | 30 fps (låst) |
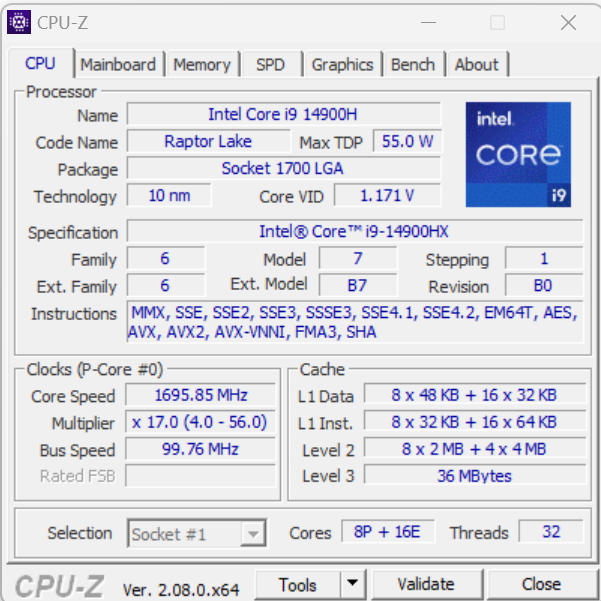
Processor
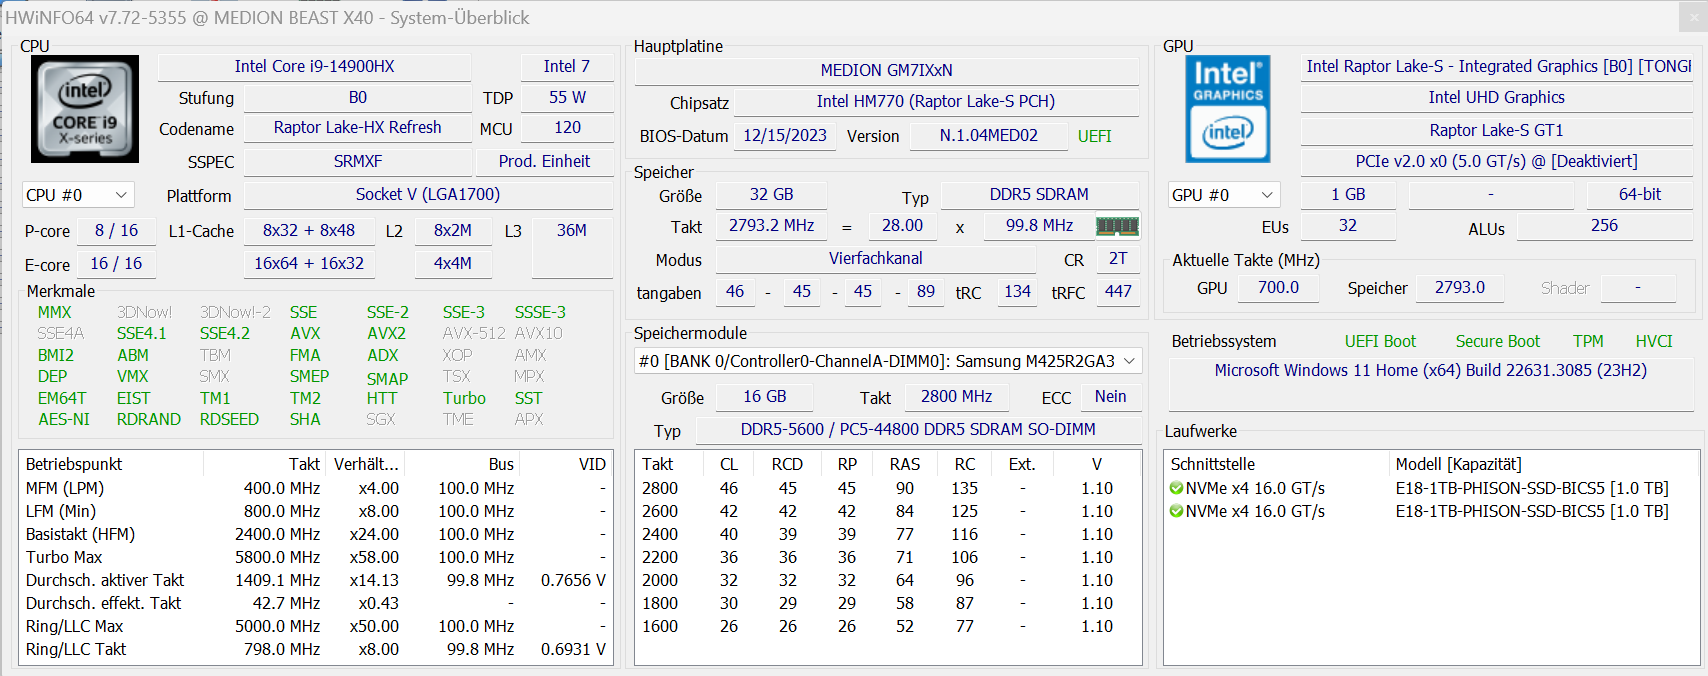
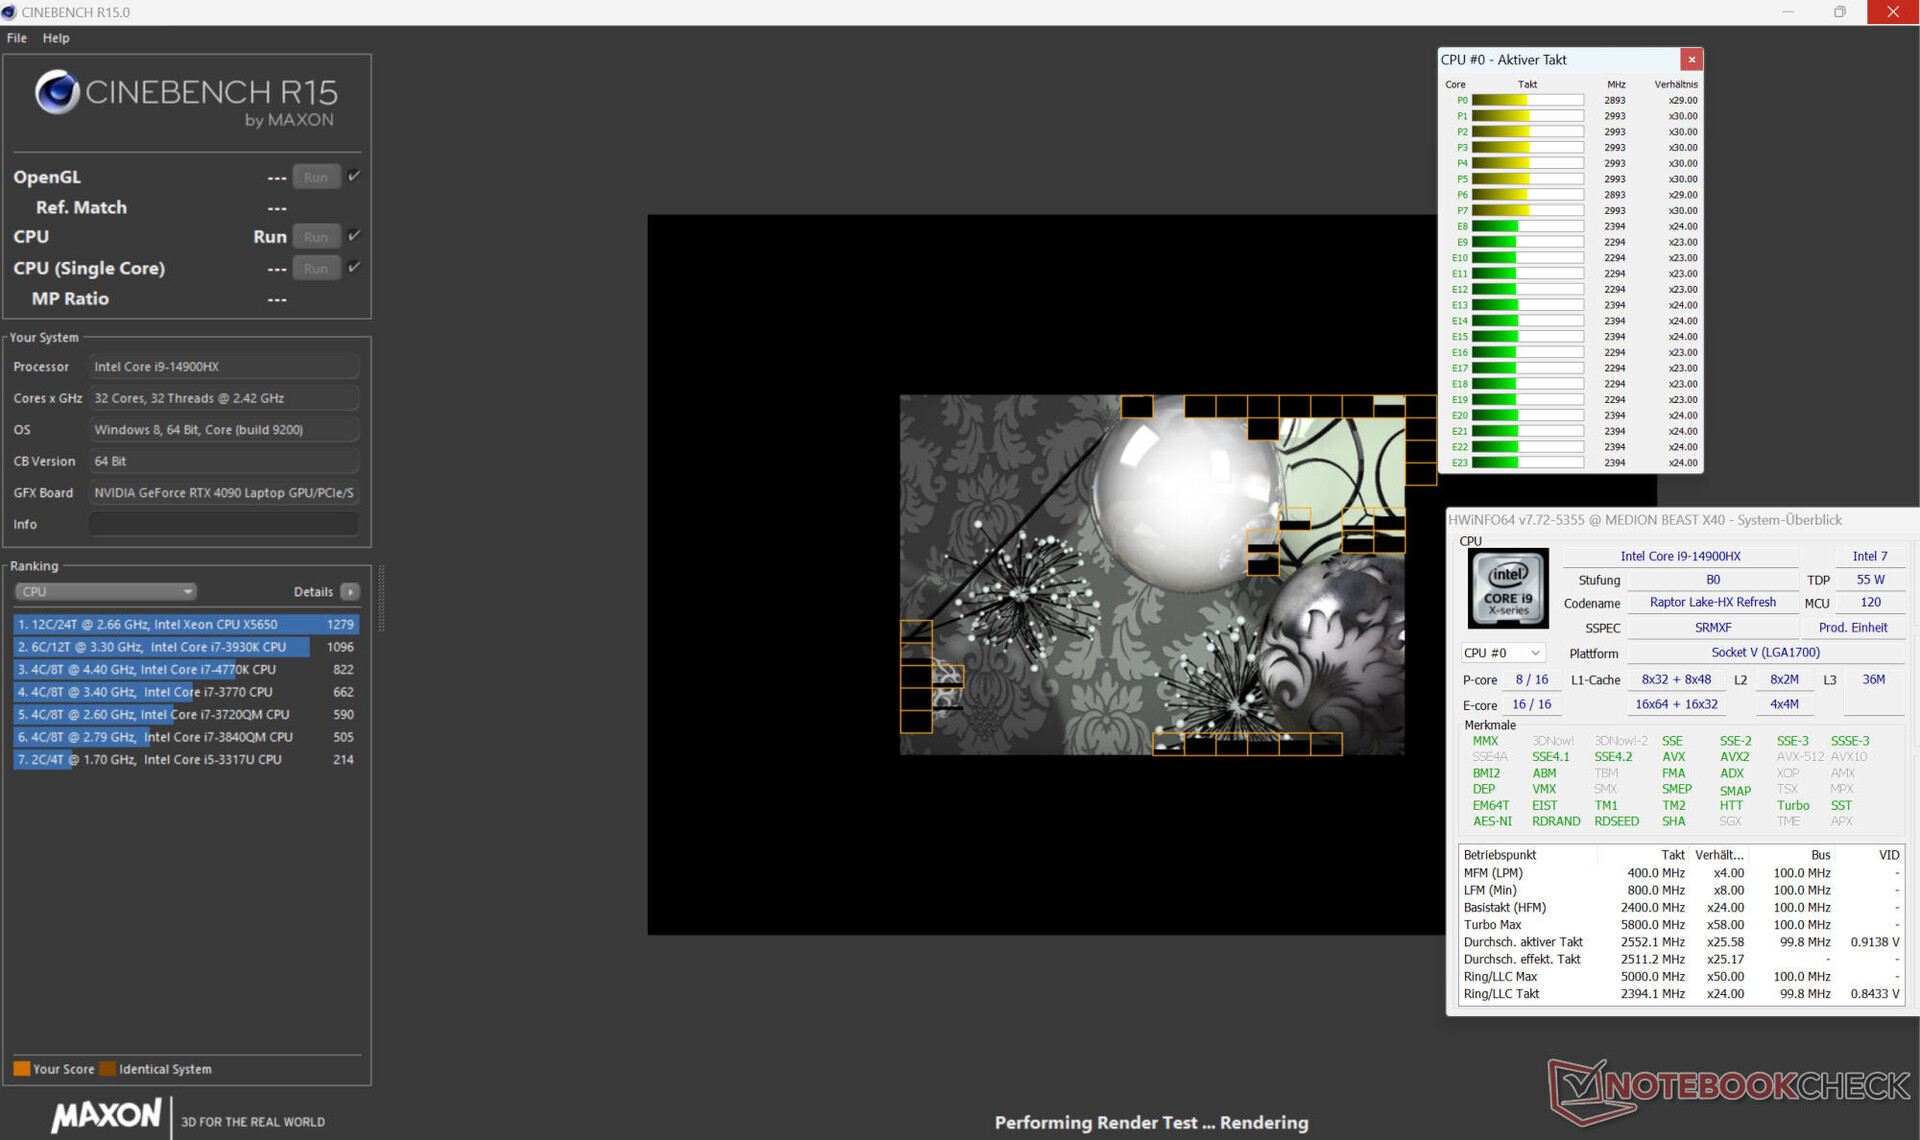
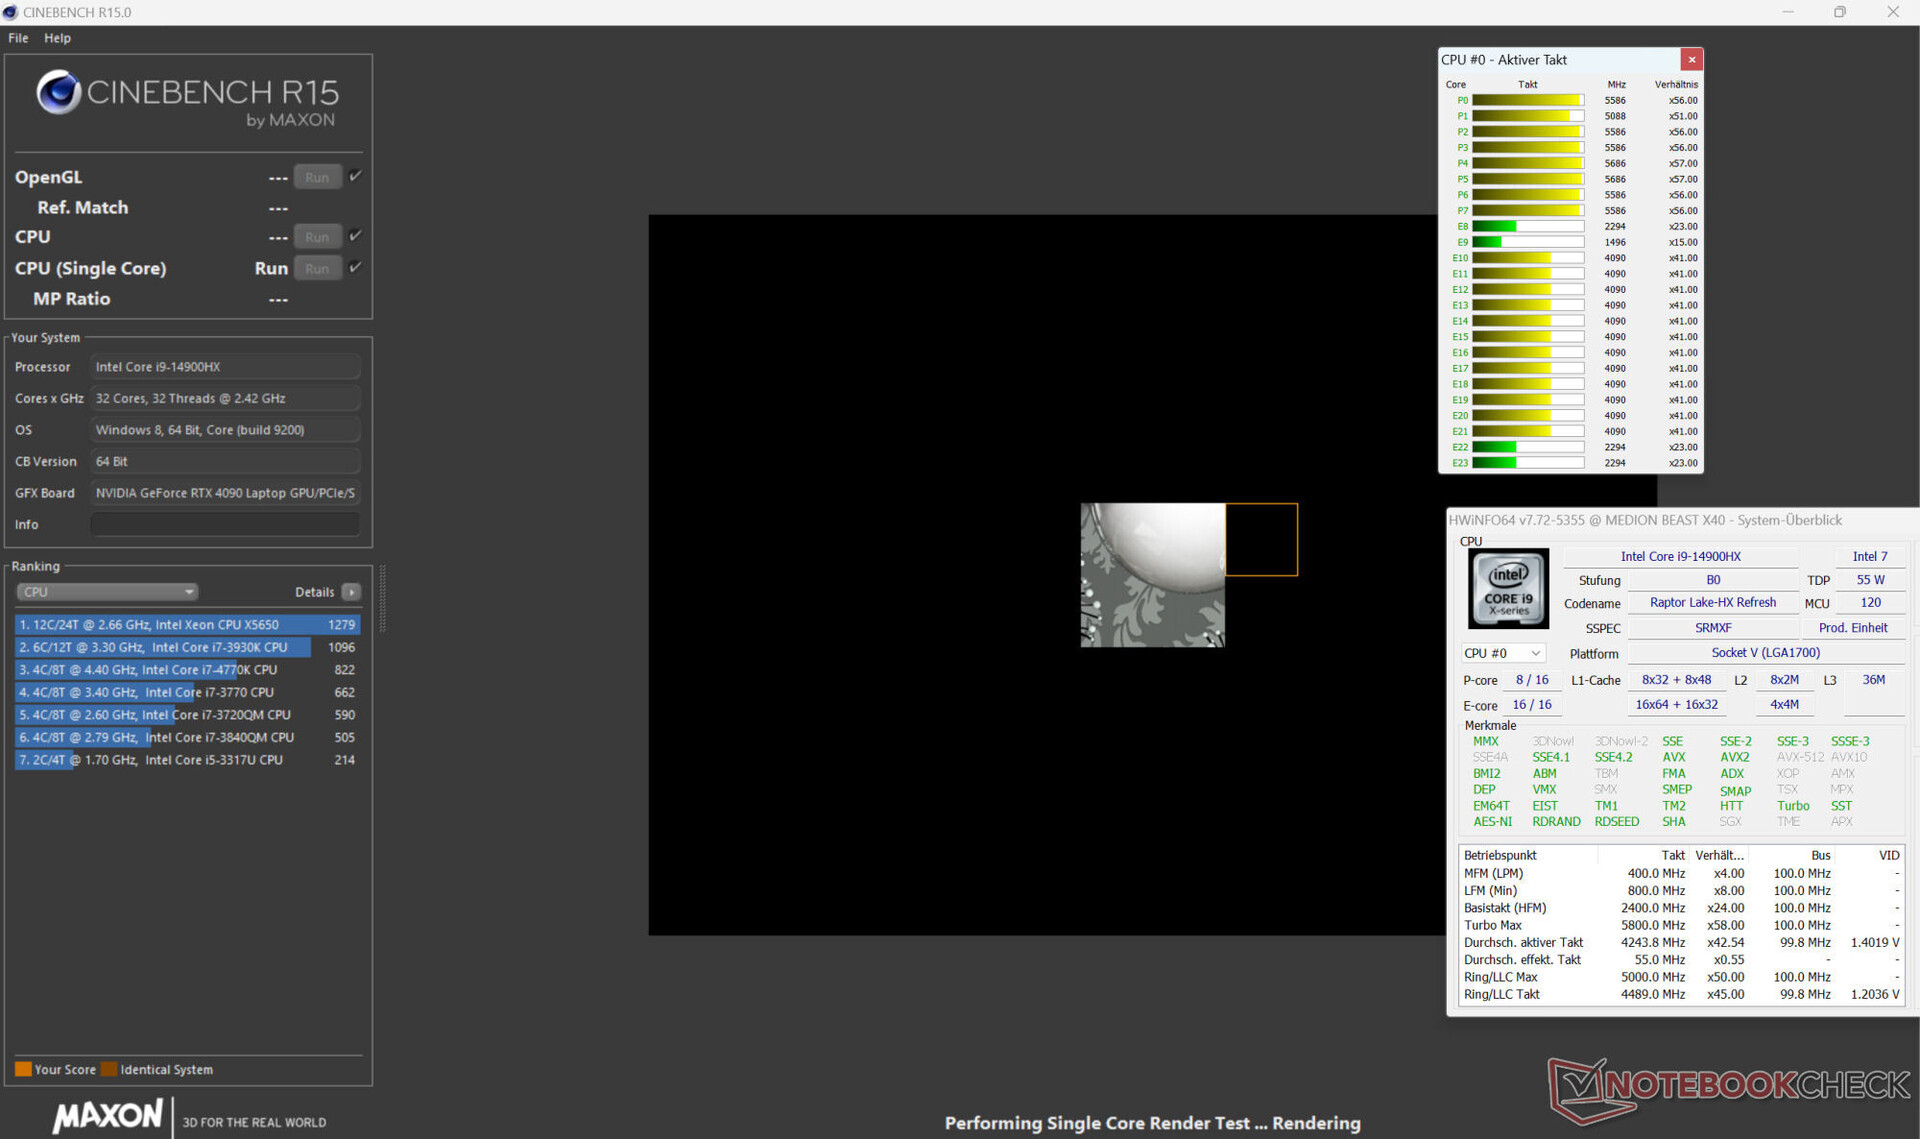
De 24 CPU-kärnorna (8P + 16E och 32 trådar) i Raptor Lake-HX Core i9-14900HX uppnår maximala klockhastigheter på 5,8 GHz (P-kärna) och 4,1 GHz (E-kärna). Tack vare något högre klockfrekvenser levererar processorn lite mer prestanda än processorn i 2023 Beast X40 föregångare med en Core i9-13900HX.
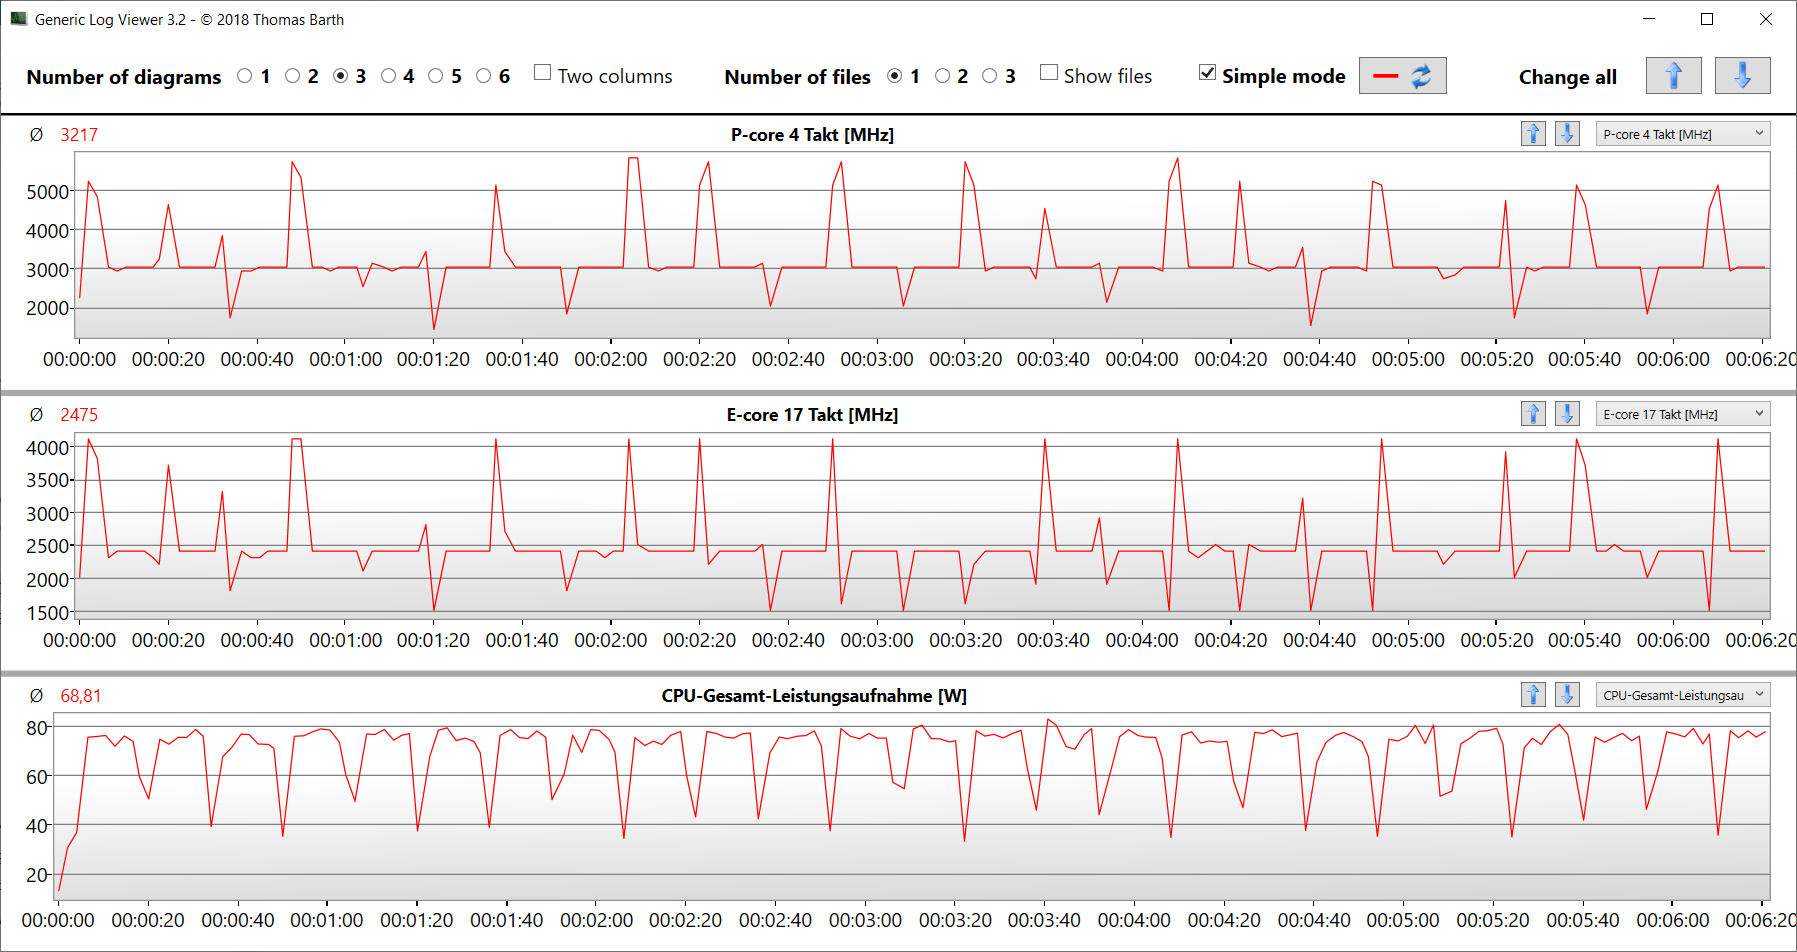
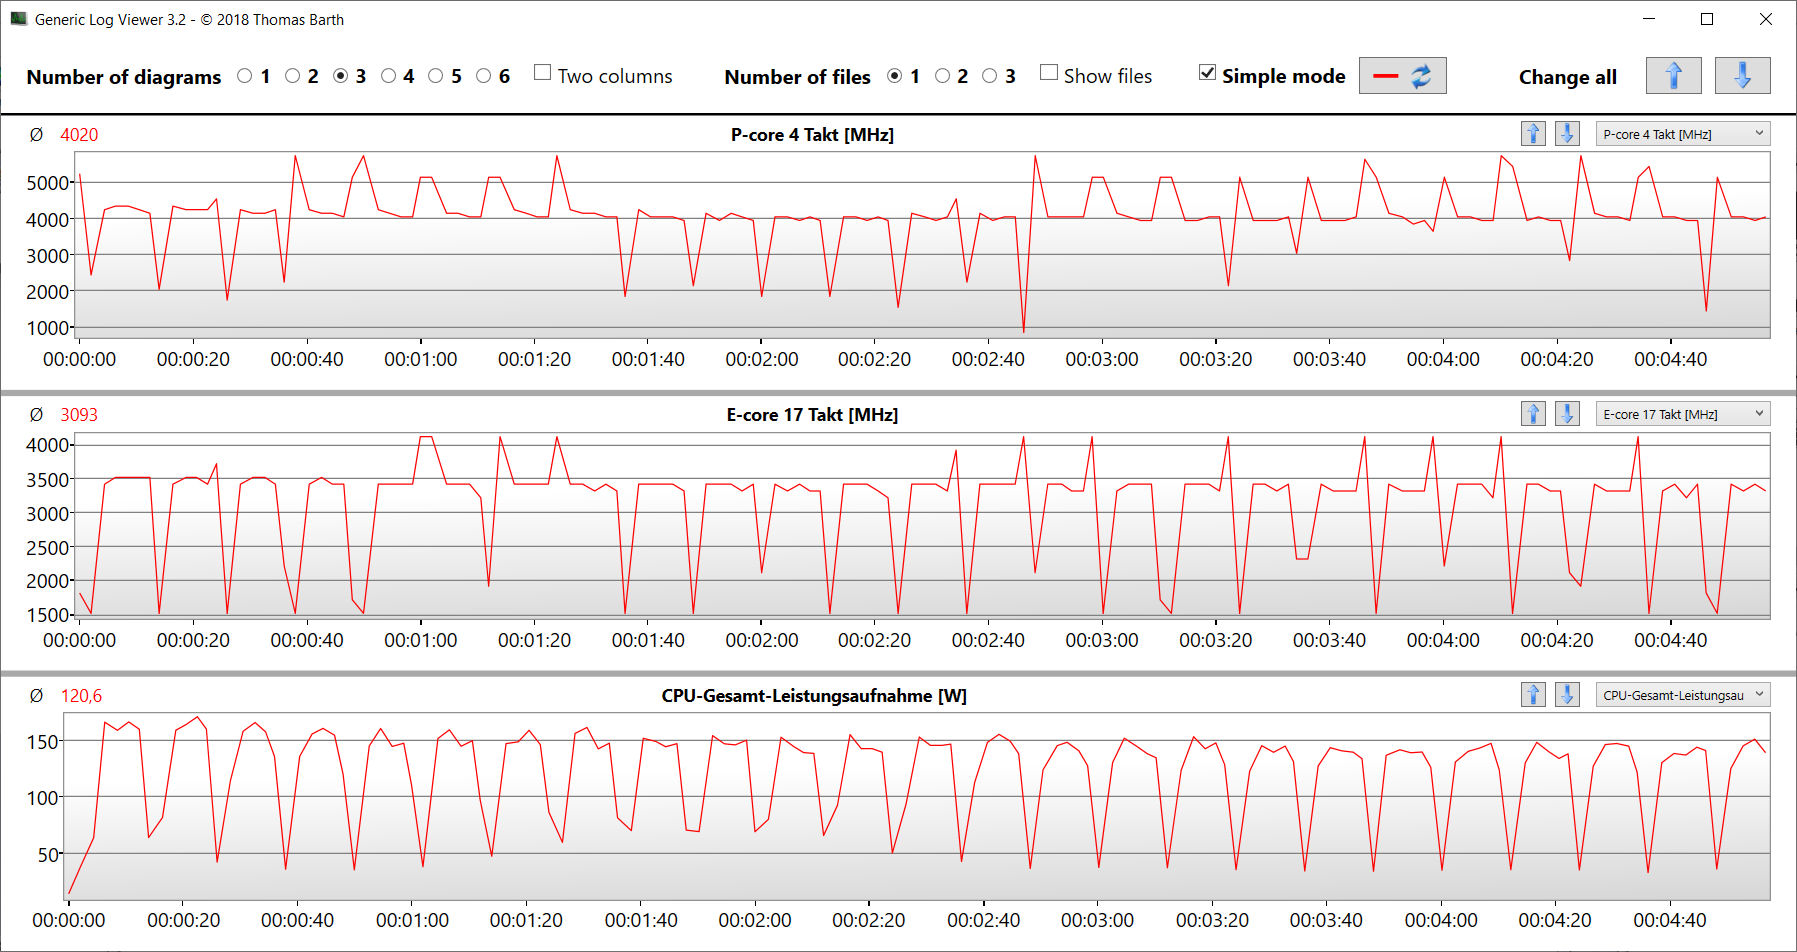
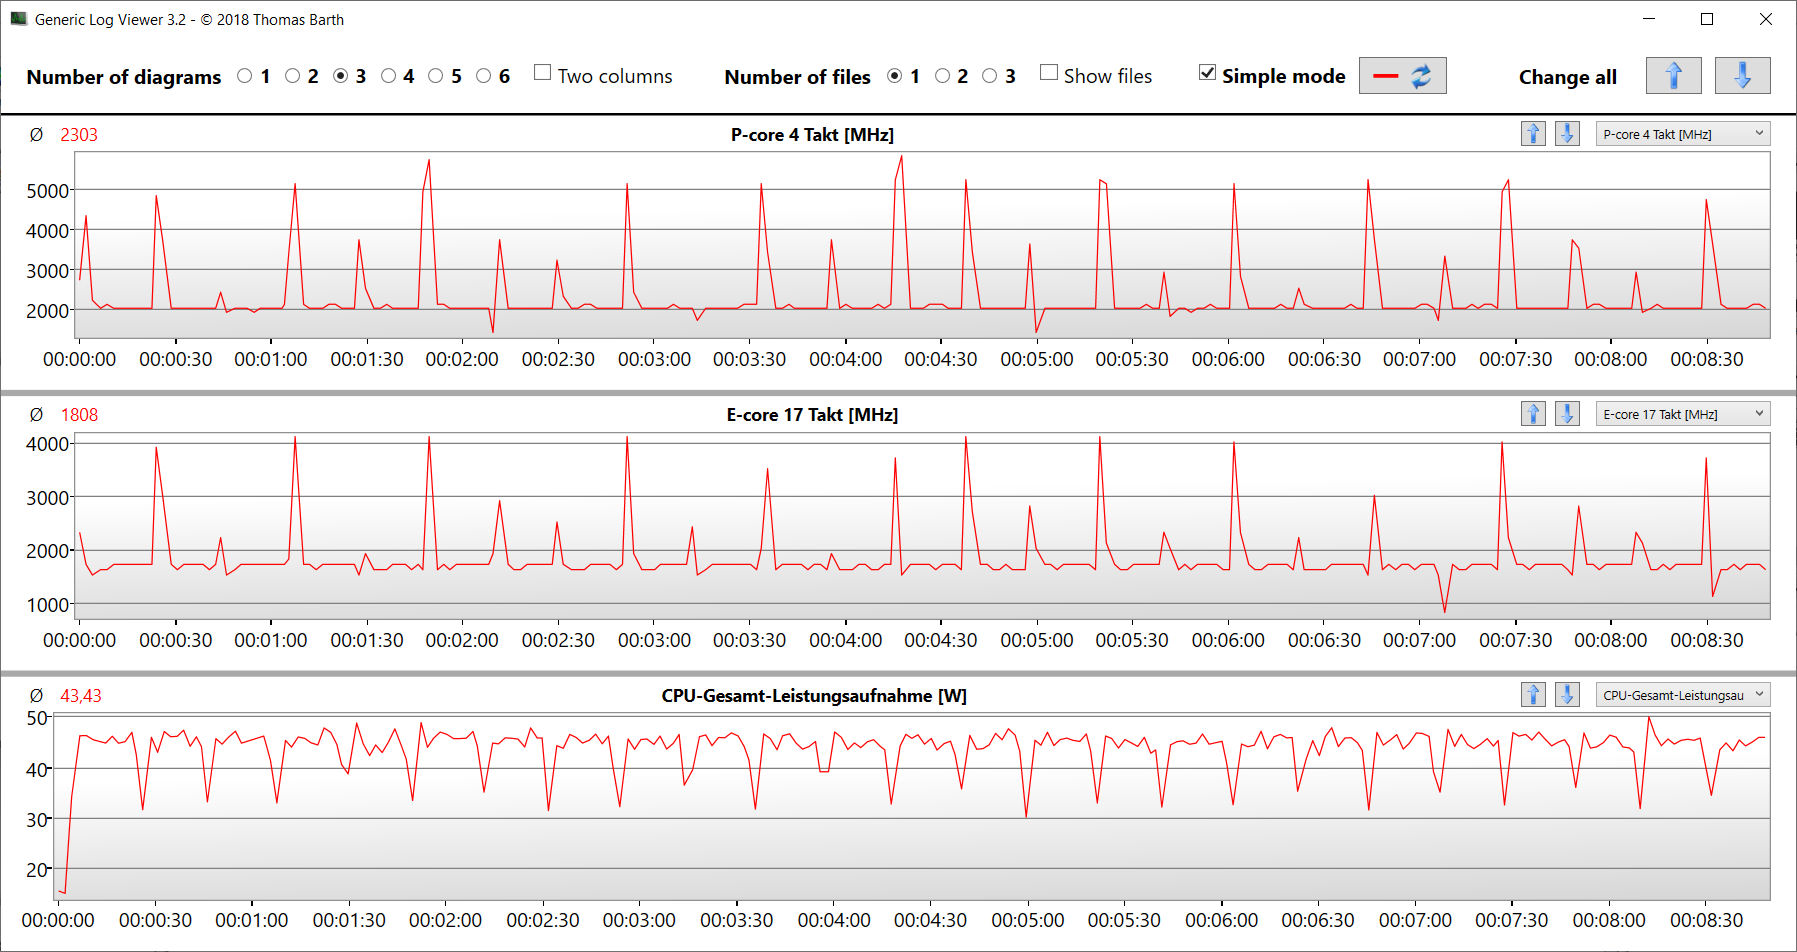
Kontinuerlig multitrådbelastning (CB15-loop) bekräftas med en konstant klockfrekvens - nivån beror på strömläget. "Balance Mode" levererar benchmarkvärden under CPU-genomsnittet, "Gaming Mode" höjer dem över det. Single-thread-prestandan är annorlunda: den ligger på en hög, nästan identisk nivå i alla tre profilerna.
Mer information om Core i9-14900HX finns i vår analysartikel på Intel Raptor Lake-HX Refresh analys - Core i9-14900HX med mer single-core prestanda .
Cinebench R15 Multi Dauertest
| CPU Performance rating - Percent | |
| Asus ROG Strix Scar 17 G733PYV-LL053X | |
| Medion Erazer Beast X40 2024 | |
| MSI Titan 18 HX A14VIG | |
| Asus ROG Strix Scar 18 G834JYR (2024) | |
| Genomsnitt Intel Core i9-14900HX | |
| Medion Erazer Beast X40 -2! | |
| Schenker Key 17 Pro (Early 23) -2! | |
| Medion Erazer Beast X40 2024 | |
| Genomsnitt av klass Gaming | |
| Cinebench R20 | |
| CPU (Multi Core) | |
| Asus ROG Strix Scar 17 G733PYV-LL053X | |
| MSI Titan 18 HX A14VIG | |
| Medion Erazer Beast X40 2024 (Gaming Mode) | |
| Medion Erazer Beast X40 | |
| Genomsnitt Intel Core i9-14900HX (6579 - 13832, n=37) | |
| Asus ROG Strix Scar 18 G834JYR (2024) | |
| Schenker Key 17 Pro (Early 23) | |
| Genomsnitt av klass Gaming (4029 - 16433, n=106, senaste 2 åren) | |
| Medion Erazer Beast X40 2024 | |
| CPU (Single Core) | |
| Medion Erazer Beast X40 2024 | |
| Asus ROG Strix Scar 18 G834JYR (2024) | |
| Medion Erazer Beast X40 2024 (Gaming Mode) | |
| Genomsnitt Intel Core i9-14900HX (657 - 859, n=37) | |
| MSI Titan 18 HX A14VIG | |
| Schenker Key 17 Pro (Early 23) | |
| Medion Erazer Beast X40 | |
| Genomsnitt av klass Gaming (442 - 913, n=106, senaste 2 åren) | |
| Asus ROG Strix Scar 17 G733PYV-LL053X | |
| Blender - v2.79 BMW27 CPU | |
| Genomsnitt av klass Gaming (79 - 330, n=104, senaste 2 åren) | |
| Medion Erazer Beast X40 2024 | |
| Genomsnitt Intel Core i9-14900HX (91 - 206, n=37) | |
| Schenker Key 17 Pro (Early 23) | |
| Asus ROG Strix Scar 18 G834JYR (2024) | |
| Medion Erazer Beast X40 2024 (Gaming Mode) | |
| Medion Erazer Beast X40 | |
| MSI Titan 18 HX A14VIG | |
| Asus ROG Strix Scar 17 G733PYV-LL053X | |
| Geekbench 6.7 | |
| Multi-Core | |
| Medion Erazer Beast X40 2024 (6.2.1, Gaming Mode) | |
| Asus ROG Strix Scar 18 G834JYR (2024) (6.2.1) | |
| Genomsnitt Intel Core i9-14900HX (13158 - 19665, n=37) | |
| Asus ROG Strix Scar 17 G733PYV-LL053X | |
| MSI Titan 18 HX A14VIG (6.2.1) | |
| Genomsnitt av klass Gaming (6625 - 22850, n=106, senaste 2 åren) | |
| Medion Erazer Beast X40 2024 (6.2.1) | |
| Single-Core | |
| Medion Erazer Beast X40 2024 (6.2.1, Gaming Mode) | |
| Medion Erazer Beast X40 2024 (6.2.1) | |
| Asus ROG Strix Scar 18 G834JYR (2024) (6.2.1) | |
| Genomsnitt Intel Core i9-14900HX (2419 - 3129, n=37) | |
| Asus ROG Strix Scar 17 G733PYV-LL053X | |
| Genomsnitt av klass Gaming (1490 - 3259, n=106, senaste 2 åren) | |
| MSI Titan 18 HX A14VIG (6.2.1) | |
| HWBOT x265 Benchmark v2.2 - 4k Preset | |
| Asus ROG Strix Scar 17 G733PYV-LL053X | |
| Medion Erazer Beast X40 2024 (Gaming Mode) | |
| MSI Titan 18 HX A14VIG | |
| Medion Erazer Beast X40 | |
| Genomsnitt Intel Core i9-14900HX (16.8 - 38.9, n=37) | |
| Asus ROG Strix Scar 18 G834JYR (2024) | |
| Genomsnitt av klass Gaming (11.5 - 44.4, n=105, senaste 2 åren) | |
| Schenker Key 17 Pro (Early 23) | |
| Medion Erazer Beast X40 2024 | |
| LibreOffice - 20 Documents To PDF | |
| Genomsnitt av klass Gaming (33.2 - 88.8, n=105, senaste 2 åren) | |
| MSI Titan 18 HX A14VIG (6.3.4.2) | |
| Asus ROG Strix Scar 18 G834JYR (2024) (6.3.4.2) | |
| Medion Erazer Beast X40 | |
| Medion Erazer Beast X40 2024 (6.3.4.2) | |
| Genomsnitt Intel Core i9-14900HX (19 - 85.1, n=37) | |
| Schenker Key 17 Pro (Early 23) | |
| Medion Erazer Beast X40 2024 (6.3.4.2, Gaming Mode) | |
| Asus ROG Strix Scar 17 G733PYV-LL053X | |
| R Benchmark 2.5 - Overall mean | |
| Genomsnitt av klass Gaming (0.3439 - 0.759, n=106, senaste 2 åren) | |
| Asus ROG Strix Scar 17 G733PYV-LL053X | |
| Medion Erazer Beast X40 | |
| Schenker Key 17 Pro (Early 23) | |
| Asus ROG Strix Scar 18 G834JYR (2024) | |
| MSI Titan 18 HX A14VIG | |
| Genomsnitt Intel Core i9-14900HX (0.3604 - 0.4859, n=37) | |
| Medion Erazer Beast X40 2024 | |
| Medion Erazer Beast X40 2024 (Gaming Mode) | |
* ... mindre är bättre
AIDA64: FP32 Ray-Trace | FPU Julia | CPU SHA3 | CPU Queen | FPU SinJulia | FPU Mandel | CPU AES | CPU ZLib | FP64 Ray-Trace | CPU PhotoWorxx
| Performance rating | |
| Asus ROG Strix Scar 17 G733PYV-LL053X | |
| Medion Erazer Beast X40 2024 | |
| MSI Titan 18 HX A14VIG | |
| Medion Erazer Beast X40 | |
| Asus ROG Strix Scar 18 G834JYR (2024) | |
| Schenker Key 17 Pro (Early 23) | |
| Genomsnitt av klass Gaming | |
| Genomsnitt Intel Core i9-14900HX | |
| Medion Erazer Beast X40 2024 | |
| AIDA64 / FP32 Ray-Trace | |
| Asus ROG Strix Scar 17 G733PYV-LL053X (v6.88.6413 Beta) | |
| Genomsnitt av klass Gaming (10227 - 85542, n=105, senaste 2 åren) | |
| MSI Titan 18 HX A14VIG (v6.92.6600) | |
| Medion Erazer Beast X40 2024 (v6.92.6600, Gaming Mode) | |
| Medion Erazer Beast X40 (v6.75.6100) | |
| Asus ROG Strix Scar 18 G834JYR (2024) (v6.92.6600) | |
| Genomsnitt Intel Core i9-14900HX (13098 - 33474, n=36) | |
| Schenker Key 17 Pro (Early 23) (v6.75.6100) | |
| Medion Erazer Beast X40 2024 (v6.92.6600) | |
| AIDA64 / FPU Julia | |
| Asus ROG Strix Scar 17 G733PYV-LL053X (v6.88.6413 Beta) | |
| MSI Titan 18 HX A14VIG (v6.92.6600) | |
| Medion Erazer Beast X40 2024 (v6.92.6600, Gaming Mode) | |
| Genomsnitt av klass Gaming (51376 - 238426, n=105, senaste 2 åren) | |
| Medion Erazer Beast X40 (v6.75.6100) | |
| Asus ROG Strix Scar 18 G834JYR (2024) (v6.92.6600) | |
| Genomsnitt Intel Core i9-14900HX (67573 - 166040, n=36) | |
| Schenker Key 17 Pro (Early 23) (v6.75.6100) | |
| Medion Erazer Beast X40 2024 (v6.92.6600) | |
| AIDA64 / CPU SHA3 | |
| Asus ROG Strix Scar 17 G733PYV-LL053X (v6.88.6413 Beta) | |
| MSI Titan 18 HX A14VIG (v6.92.6600) | |
| Medion Erazer Beast X40 2024 (v6.92.6600, Gaming Mode) | |
| Medion Erazer Beast X40 (v6.75.6100) | |
| Genomsnitt av klass Gaming (2180 - 10115, n=105, senaste 2 åren) | |
| Asus ROG Strix Scar 18 G834JYR (2024) (v6.92.6600) | |
| Genomsnitt Intel Core i9-14900HX (3589 - 7979, n=36) | |
| Schenker Key 17 Pro (Early 23) (v6.75.6100) | |
| Medion Erazer Beast X40 2024 (v6.92.6600) | |
| AIDA64 / CPU Queen | |
| Asus ROG Strix Scar 17 G733PYV-LL053X (v6.88.6413 Beta) | |
| MSI Titan 18 HX A14VIG (v6.92.6600) | |
| Medion Erazer Beast X40 2024 (v6.92.6600, Gaming Mode) | |
| Asus ROG Strix Scar 18 G834JYR (2024) (v6.92.6600) | |
| Genomsnitt Intel Core i9-14900HX (118405 - 148966, n=36) | |
| Schenker Key 17 Pro (Early 23) (v6.75.6100) | |
| Medion Erazer Beast X40 (v6.75.6100) | |
| Medion Erazer Beast X40 2024 (v6.92.6600) | |
| Genomsnitt av klass Gaming (49785 - 173351, n=90, senaste 2 åren) | |
| AIDA64 / FPU SinJulia | |
| Asus ROG Strix Scar 17 G733PYV-LL053X (v6.88.6413 Beta) | |
| MSI Titan 18 HX A14VIG (v6.92.6600) | |
| Medion Erazer Beast X40 2024 (v6.92.6600, Gaming Mode) | |
| Asus ROG Strix Scar 18 G834JYR (2024) (v6.92.6600) | |
| Medion Erazer Beast X40 (v6.75.6100) | |
| Genomsnitt Intel Core i9-14900HX (10475 - 18517, n=36) | |
| Schenker Key 17 Pro (Early 23) (v6.75.6100) | |
| Genomsnitt av klass Gaming (4424 - 33636, n=105, senaste 2 åren) | |
| Medion Erazer Beast X40 2024 (v6.92.6600) | |
| AIDA64 / FPU Mandel | |
| Asus ROG Strix Scar 17 G733PYV-LL053X (v6.88.6413 Beta) | |
| Genomsnitt av klass Gaming (25115 - 128721, n=105, senaste 2 åren) | |
| MSI Titan 18 HX A14VIG (v6.92.6600) | |
| Medion Erazer Beast X40 2024 (v6.92.6600, Gaming Mode) | |
| Medion Erazer Beast X40 (v6.75.6100) | |
| Asus ROG Strix Scar 18 G834JYR (2024) (v6.92.6600) | |
| Genomsnitt Intel Core i9-14900HX (32543 - 83662, n=36) | |
| Schenker Key 17 Pro (Early 23) (v6.75.6100) | |
| Medion Erazer Beast X40 2024 | |
| AIDA64 / CPU AES | |
| Asus ROG Strix Scar 17 G733PYV-LL053X (v6.88.6413 Beta) | |
| Schenker Key 17 Pro (Early 23) (v6.75.6100) | |
| Genomsnitt Intel Core i9-14900HX (86964 - 241777, n=36) | |
| MSI Titan 18 HX A14VIG (v6.92.6600) | |
| Medion Erazer Beast X40 2024 (v6.92.6600, Gaming Mode) | |
| Medion Erazer Beast X40 (v6.75.6100) | |
| Asus ROG Strix Scar 18 G834JYR (2024) (v6.92.6600) | |
| Genomsnitt av klass Gaming (39258 - 247074, n=105, senaste 2 åren) | |
| Medion Erazer Beast X40 2024 (v6.92.6600) | |
| AIDA64 / CPU ZLib | |
| MSI Titan 18 HX A14VIG (v6.92.6600) | |
| Medion Erazer Beast X40 2024 (v6.92.6600, Gaming Mode) | |
| Asus ROG Strix Scar 17 G733PYV-LL053X (v6.88.6413 Beta) | |
| Medion Erazer Beast X40 (v6.75.6100) | |
| Genomsnitt Intel Core i9-14900HX (1054 - 2292, n=36) | |
| Asus ROG Strix Scar 18 G834JYR (2024) | |
| Schenker Key 17 Pro (Early 23) (v6.75.6100) | |
| Genomsnitt av klass Gaming (574 - 2531, n=105, senaste 2 åren) | |
| Medion Erazer Beast X40 2024 (v6.92.6600) | |
| AIDA64 / FP64 Ray-Trace | |
| Asus ROG Strix Scar 17 G733PYV-LL053X (v6.88.6413 Beta) | |
| Genomsnitt av klass Gaming (5509 - 45446, n=105, senaste 2 åren) | |
| MSI Titan 18 HX A14VIG (v6.92.6600) | |
| Medion Erazer Beast X40 2024 (v6.92.6600, Gaming Mode) | |
| Medion Erazer Beast X40 (v6.75.6100) | |
| Asus ROG Strix Scar 18 G834JYR (2024) (v6.92.6600) | |
| Genomsnitt Intel Core i9-14900HX (6809 - 18349, n=36) | |
| Schenker Key 17 Pro (Early 23) (v6.75.6100) | |
| Medion Erazer Beast X40 2024 (v6.92.6600) | |
| AIDA64 / CPU PhotoWorxx | |
| Schenker Key 17 Pro (Early 23) (v6.75.6100) | |
| Asus ROG Strix Scar 18 G834JYR (2024) (v6.92.6600) | |
| Medion Erazer Beast X40 2024 (v6.92.6600) | |
| Medion Erazer Beast X40 2024 (v6.92.6600, Gaming Mode) | |
| Genomsnitt Intel Core i9-14900HX (23903 - 54702, n=36) | |
| Genomsnitt av klass Gaming (12271 - 89891, n=105, senaste 2 åren) | |
| Medion Erazer Beast X40 (v6.75.6100) | |
| Asus ROG Strix Scar 17 G733PYV-LL053X (v6.88.6413 Beta) | |
| MSI Titan 18 HX A14VIG (v6.92.6600) | |
Systemets prestanda
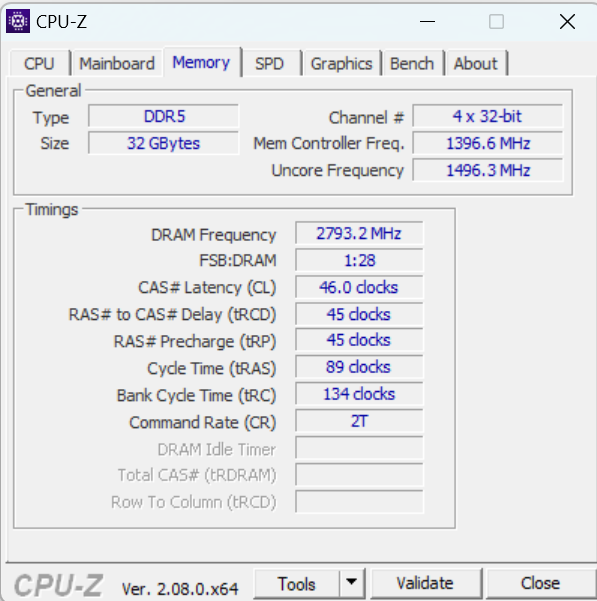
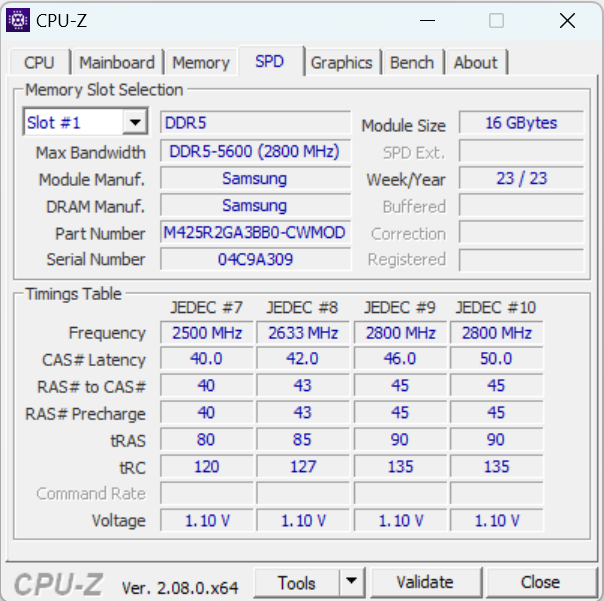
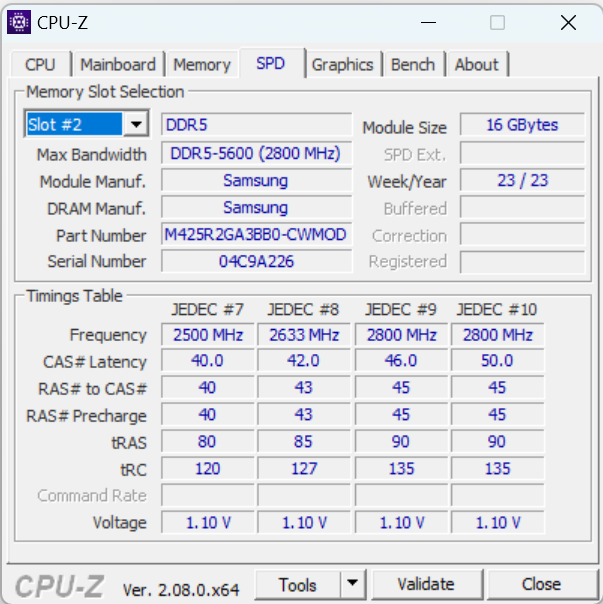
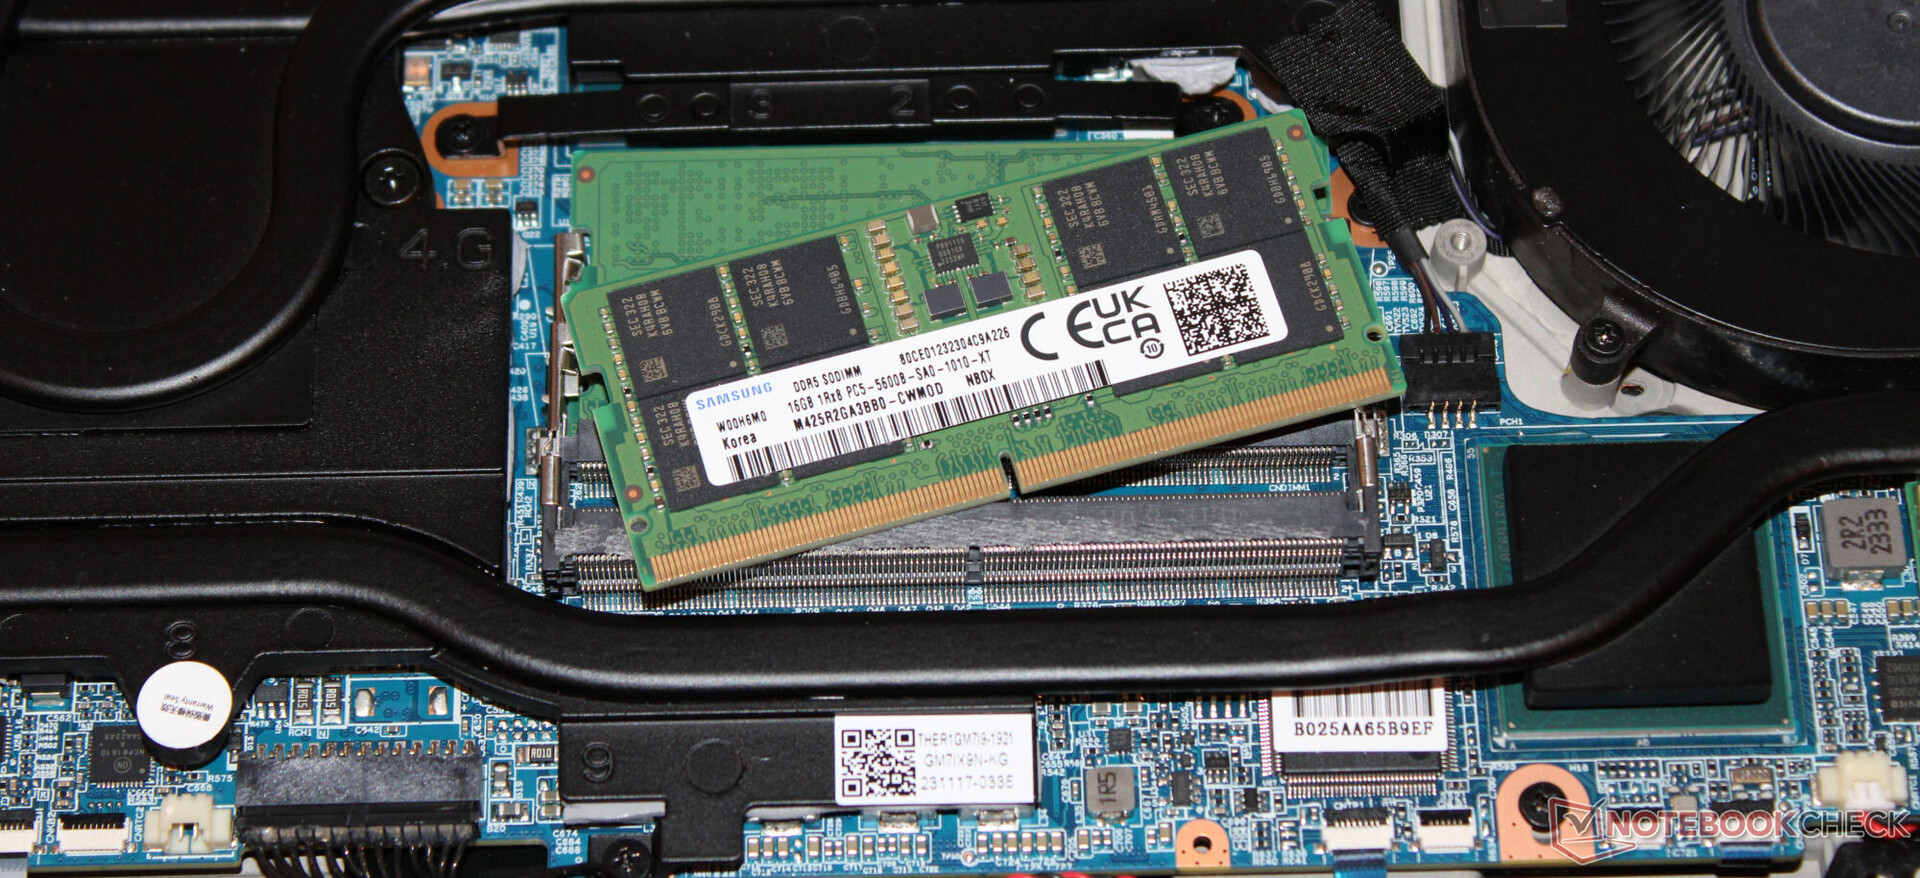
En snabb titt på specifikationerna räcker för att bekräfta att systemet erbjuder tillräckligt med kraft för att smidigt köra krävande applikationer som spel, rendering och streaming. Överföringshastigheterna för RAM-minnet ligger på en normal nivå för DDR5-5600 RAM-minne.
CrossMark: Overall | Productivity | Creativity | Responsiveness
WebXPRT 3: Overall
WebXPRT 4: Overall
Mozilla Kraken 1.1: Total
| PCMark 10 / Score | |
| Asus ROG Strix Scar 17 G733PYV-LL053X | |
| MSI Titan 18 HX A14VIG | |
| Medion Erazer Beast X40 2024 | |
| Schenker Key 17 Pro (Early 23) | |
| Asus ROG Strix Scar 18 G834JYR (2024) | |
| Genomsnitt Intel Core i9-14900HX, NVIDIA GeForce RTX 4090 Laptop GPU (8230 - 9234, n=13) | |
| Genomsnitt av klass Gaming (5828 - 12414, n=93, senaste 2 åren) | |
| Medion Erazer Beast X40 | |
| PCMark 10 / Essentials | |
| MSI Titan 18 HX A14VIG | |
| Asus ROG Strix Scar 17 G733PYV-LL053X | |
| Asus ROG Strix Scar 18 G834JYR (2024) | |
| Schenker Key 17 Pro (Early 23) | |
| Medion Erazer Beast X40 | |
| Genomsnitt Intel Core i9-14900HX, NVIDIA GeForce RTX 4090 Laptop GPU (10778 - 11628, n=13) | |
| Medion Erazer Beast X40 2024 | |
| Genomsnitt av klass Gaming (8810 - 11935, n=97, senaste 2 åren) | |
| PCMark 10 / Productivity | |
| Medion Erazer Beast X40 2024 | |
| Medion Erazer Beast X40 | |
| Schenker Key 17 Pro (Early 23) | |
| Genomsnitt av klass Gaming (6845 - 25323, n=95, senaste 2 åren) | |
| Asus ROG Strix Scar 17 G733PYV-LL053X | |
| Genomsnitt Intel Core i9-14900HX, NVIDIA GeForce RTX 4090 Laptop GPU (9458 - 11759, n=13) | |
| Asus ROG Strix Scar 18 G834JYR (2024) | |
| MSI Titan 18 HX A14VIG | |
| PCMark 10 / Digital Content Creation | |
| MSI Titan 18 HX A14VIG | |
| Asus ROG Strix Scar 17 G733PYV-LL053X | |
| Asus ROG Strix Scar 18 G834JYR (2024) | |
| Medion Erazer Beast X40 2024 | |
| Genomsnitt Intel Core i9-14900HX, NVIDIA GeForce RTX 4090 Laptop GPU (13219 - 16462, n=13) | |
| Schenker Key 17 Pro (Early 23) | |
| Genomsnitt av klass Gaming (7602 - 19954, n=95, senaste 2 åren) | |
| Medion Erazer Beast X40 | |
| CrossMark / Overall | |
| Schenker Key 17 Pro (Early 23) | |
| Asus ROG Strix Scar 18 G834JYR (2024) | |
| Medion Erazer Beast X40 2024 | |
| Medion Erazer Beast X40 | |
| Genomsnitt Intel Core i9-14900HX, NVIDIA GeForce RTX 4090 Laptop GPU (1877 - 2344, n=10) | |
| Asus ROG Strix Scar 17 G733PYV-LL053X | |
| Genomsnitt av klass Gaming (1366 - 2409, n=94, senaste 2 åren) | |
| MSI Titan 18 HX A14VIG | |
| CrossMark / Productivity | |
| Schenker Key 17 Pro (Early 23) | |
| Medion Erazer Beast X40 2024 | |
| Asus ROG Strix Scar 18 G834JYR (2024) | |
| Medion Erazer Beast X40 | |
| Genomsnitt Intel Core i9-14900HX, NVIDIA GeForce RTX 4090 Laptop GPU (1738 - 2162, n=10) | |
| Asus ROG Strix Scar 17 G733PYV-LL053X | |
| Genomsnitt av klass Gaming (1386 - 2254, n=94, senaste 2 åren) | |
| MSI Titan 18 HX A14VIG | |
| CrossMark / Creativity | |
| Asus ROG Strix Scar 18 G834JYR (2024) | |
| Schenker Key 17 Pro (Early 23) | |
| Asus ROG Strix Scar 17 G733PYV-LL053X | |
| Medion Erazer Beast X40 | |
| Genomsnitt Intel Core i9-14900HX, NVIDIA GeForce RTX 4090 Laptop GPU (2195 - 2660, n=10) | |
| Medion Erazer Beast X40 2024 | |
| Genomsnitt av klass Gaming (1343 - 2786, n=94, senaste 2 åren) | |
| MSI Titan 18 HX A14VIG | |
| CrossMark / Responsiveness | |
| Schenker Key 17 Pro (Early 23) | |
| Asus ROG Strix Scar 18 G834JYR (2024) | |
| Medion Erazer Beast X40 2024 | |
| Genomsnitt Intel Core i9-14900HX, NVIDIA GeForce RTX 4090 Laptop GPU (1478 - 2327, n=10) | |
| Medion Erazer Beast X40 | |
| Genomsnitt av klass Gaming (1226 - 2334, n=94, senaste 2 åren) | |
| Asus ROG Strix Scar 17 G733PYV-LL053X | |
| MSI Titan 18 HX A14VIG | |
| WebXPRT 3 / Overall | |
| Asus ROG Strix Scar 17 G733PYV-LL053X | |
| MSI Titan 18 HX A14VIG | |
| Medion Erazer Beast X40 2024 | |
| Genomsnitt Intel Core i9-14900HX, NVIDIA GeForce RTX 4090 Laptop GPU (279 - 339, n=10) | |
| Medion Erazer Beast X40 | |
| Asus ROG Strix Scar 18 G834JYR (2024) | |
| Genomsnitt av klass Gaming (220 - 532, n=98, senaste 2 åren) | |
| Schenker Key 17 Pro (Early 23) | |
| WebXPRT 4 / Overall | |
| Asus ROG Strix Scar 17 G733PYV-LL053X | |
| Asus ROG Strix Scar 18 G834JYR (2024) | |
| Medion Erazer Beast X40 2024 | |
| Schenker Key 17 Pro (Early 23) | |
| Genomsnitt Intel Core i9-14900HX, NVIDIA GeForce RTX 4090 Laptop GPU (246 - 309, n=8) | |
| MSI Titan 18 HX A14VIG | |
| Genomsnitt av klass Gaming (165 - 354, n=98, senaste 2 åren) | |
| Mozilla Kraken 1.1 / Total | |
| Schenker Key 17 Pro (Early 23) | |
| Medion Erazer Beast X40 | |
| Genomsnitt av klass Gaming (391 - 590, n=100, senaste 2 åren) | |
| Genomsnitt Intel Core i9-14900HX, NVIDIA GeForce RTX 4090 Laptop GPU (428 - 535, n=11) | |
| MSI Titan 18 HX A14VIG | |
| Asus ROG Strix Scar 18 G834JYR (2024) | |
| Medion Erazer Beast X40 2024 | |
| Asus ROG Strix Scar 17 G733PYV-LL053X | |
* ... mindre är bättre
| PCMark 10 Score | 8963 poäng | |
Hjälp | ||
| AIDA64 / Memory Copy | |
| Asus ROG Strix Scar 18 G834JYR (2024) | |
| Schenker Key 17 Pro (Early 23) | |
| Medion Erazer Beast X40 2024 | |
| Genomsnitt Intel Core i9-14900HX (38028 - 83392, n=36) | |
| Genomsnitt av klass Gaming (21750 - 129946, n=105, senaste 2 åren) | |
| Medion Erazer Beast X40 | |
| MSI Titan 18 HX A14VIG | |
| Asus ROG Strix Scar 17 G733PYV-LL053X | |
| AIDA64 / Memory Read | |
| Asus ROG Strix Scar 18 G834JYR (2024) | |
| Medion Erazer Beast X40 2024 | |
| Schenker Key 17 Pro (Early 23) | |
| Genomsnitt Intel Core i9-14900HX (43306 - 87568, n=36) | |
| Medion Erazer Beast X40 | |
| Genomsnitt av klass Gaming (22956 - 118858, n=105, senaste 2 åren) | |
| Asus ROG Strix Scar 17 G733PYV-LL053X | |
| MSI Titan 18 HX A14VIG | |
| AIDA64 / Memory Write | |
| Asus ROG Strix Scar 18 G834JYR (2024) | |
| Medion Erazer Beast X40 2024 | |
| Schenker Key 17 Pro (Early 23) | |
| Genomsnitt av klass Gaming (22297 - 135096, n=105, senaste 2 åren) | |
| Genomsnitt Intel Core i9-14900HX (37146 - 80589, n=36) | |
| Medion Erazer Beast X40 | |
| Asus ROG Strix Scar 17 G733PYV-LL053X | |
| MSI Titan 18 HX A14VIG | |
| AIDA64 / Memory Latency | |
| Genomsnitt av klass Gaming (75.3 - 259, n=105, senaste 2 åren) | |
| MSI Titan 18 HX A14VIG | |
| Schenker Key 17 Pro (Early 23) | |
| Medion Erazer Beast X40 | |
| Asus ROG Strix Scar 17 G733PYV-LL053X | |
| Genomsnitt Intel Core i9-14900HX (76.1 - 105, n=36) | |
| Asus ROG Strix Scar 18 G834JYR (2024) | |
| Medion Erazer Beast X40 2024 | |
* ... mindre är bättre
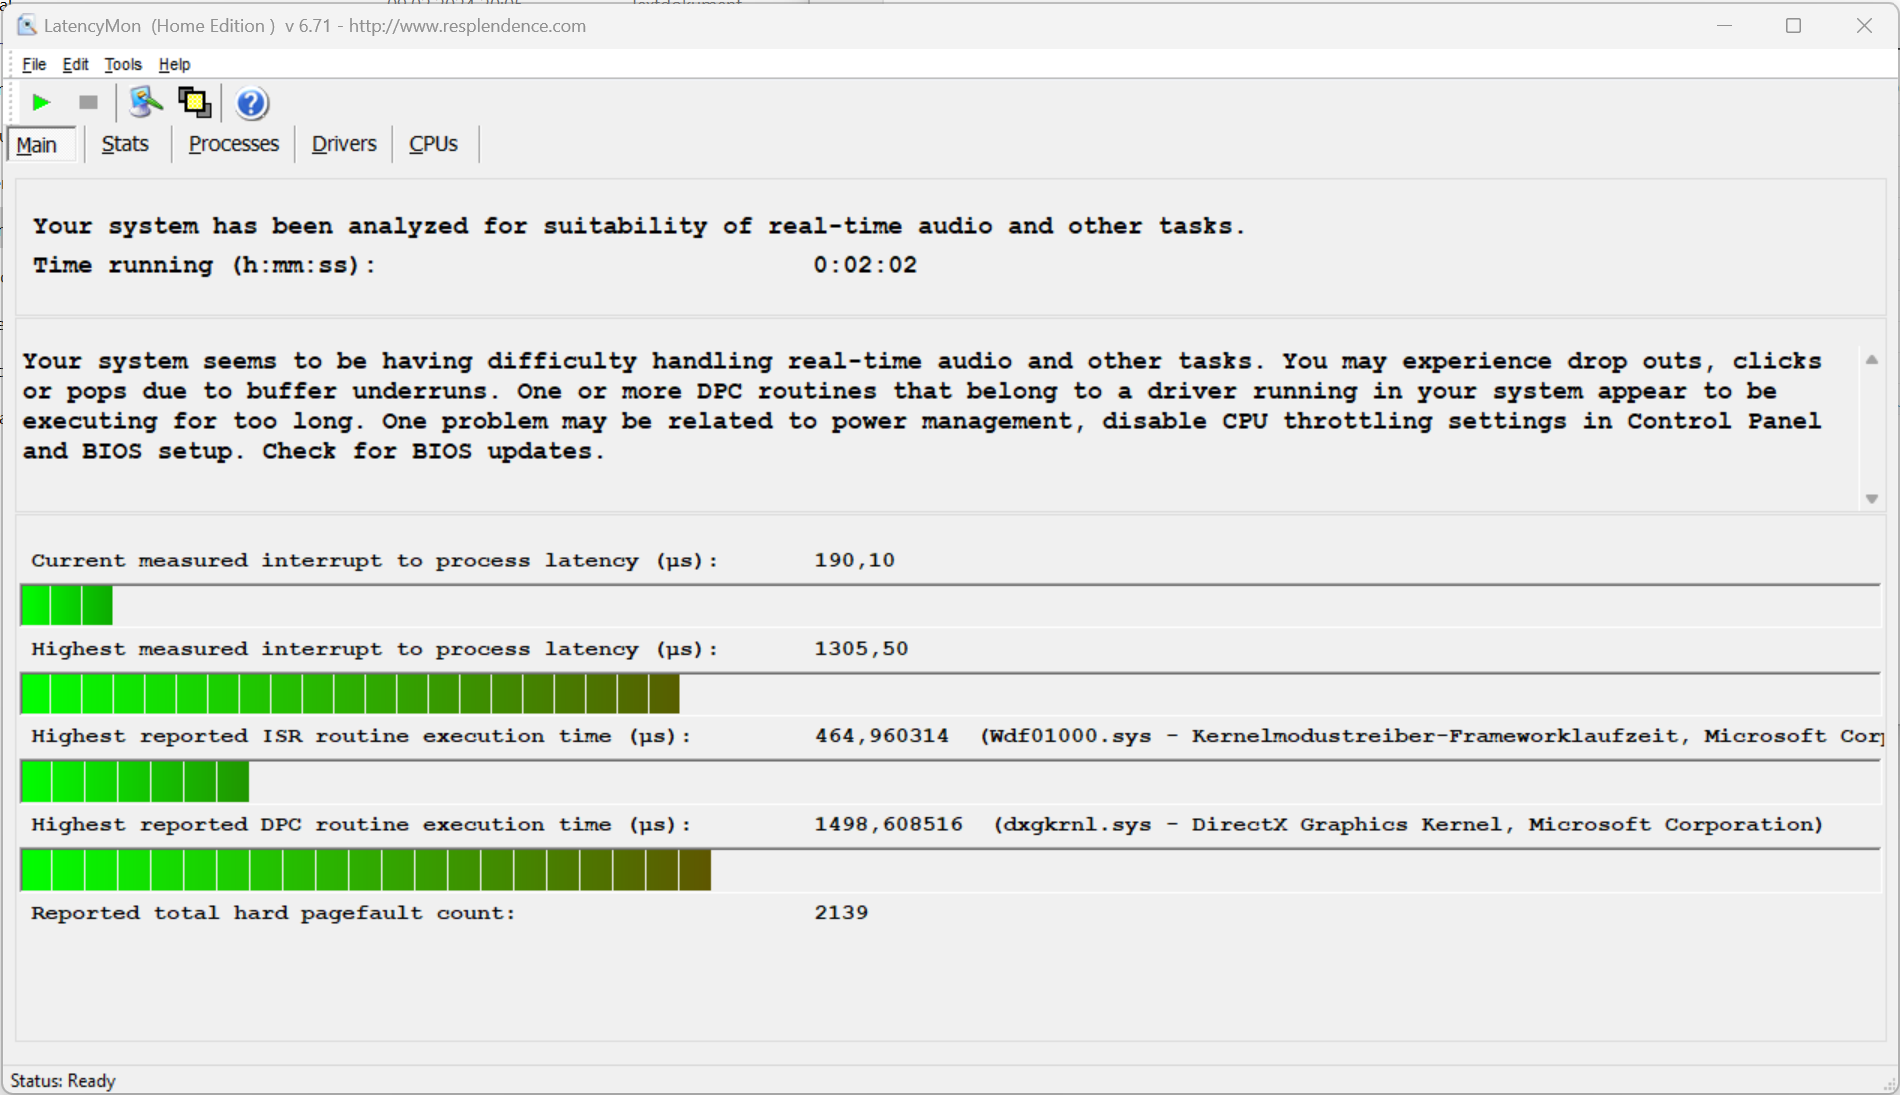
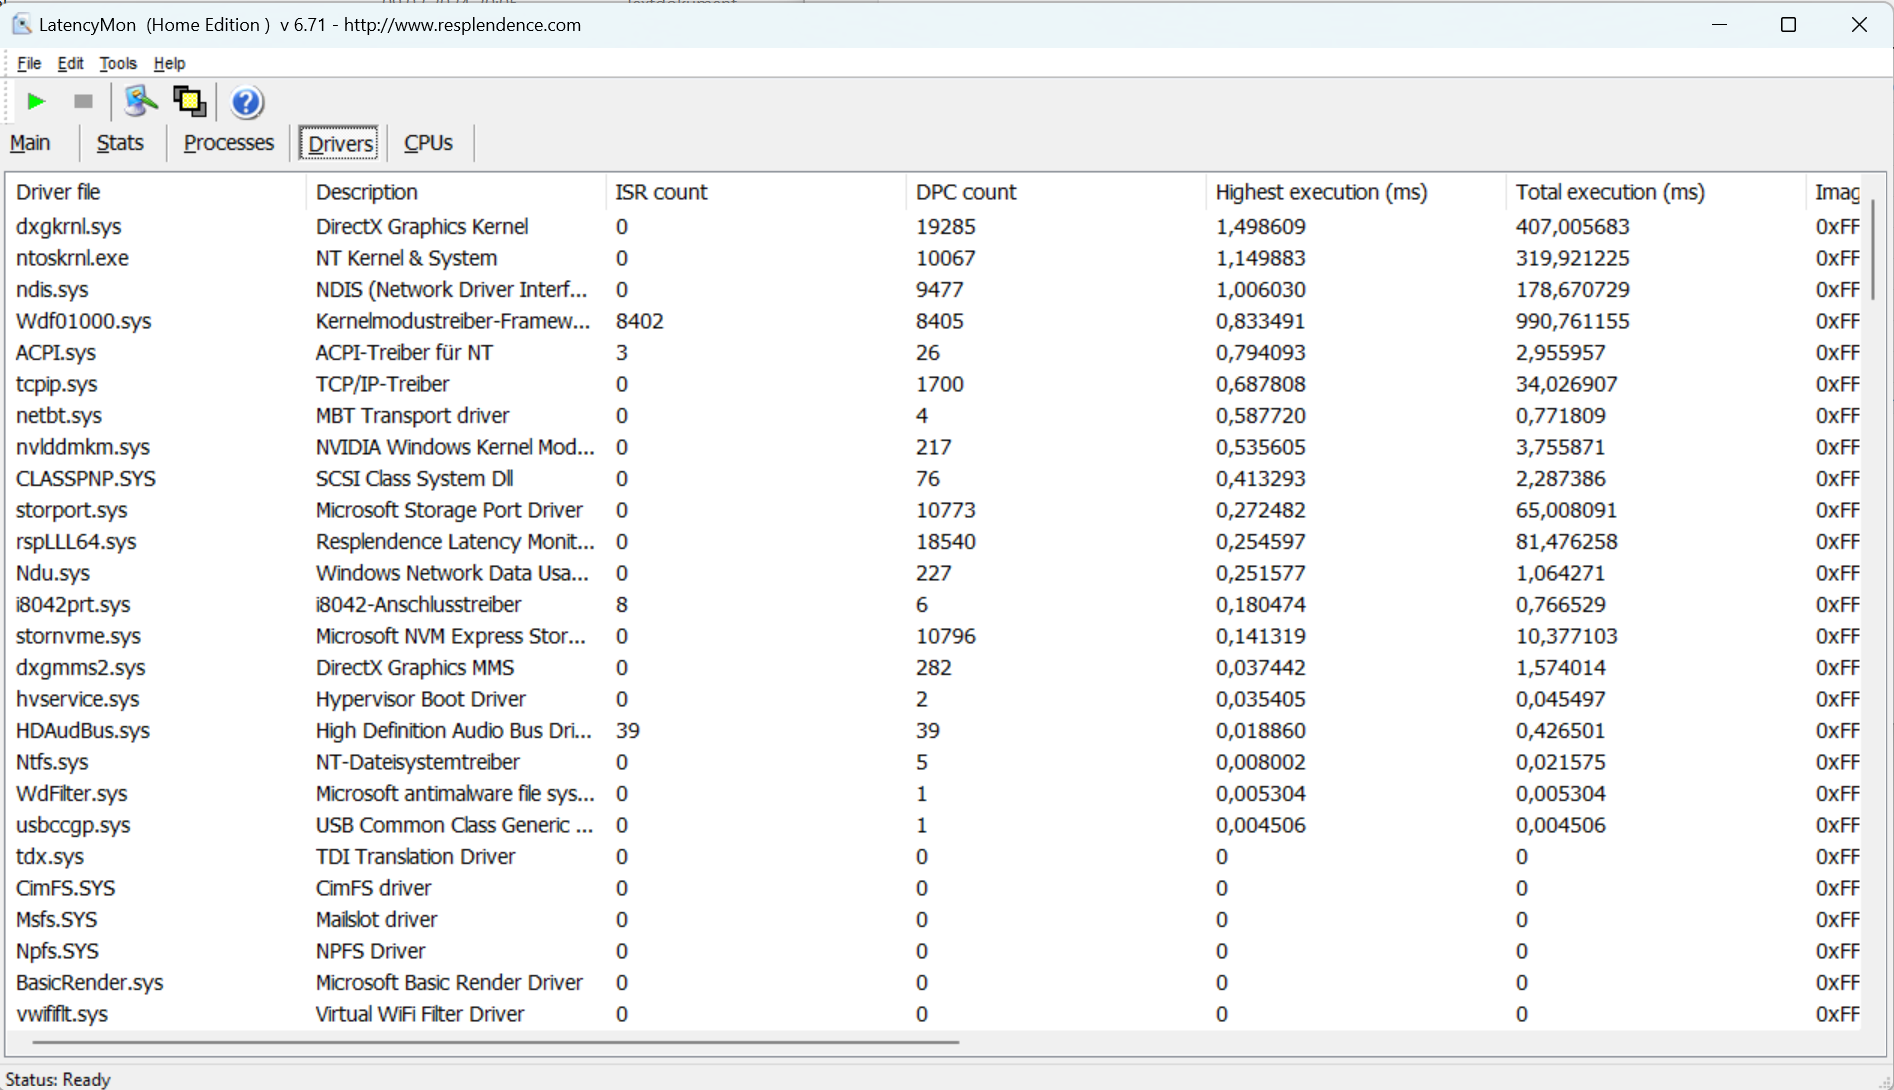
DPC-fördröjning
Latency Monitor visar avvikelser under latensmätningen (webbsurfning, uppspelning av 4k-video och hög belastning av Prime95). Systemet verkar inte vara lämpligt för video- och ljudredigering i realtid. Framtida uppdateringar av programvara och drivrutiner kan leda till potentiella förbättringar eller till och med försämringar.
| DPC Latencies / LatencyMon - interrupt to process latency (max), Web, Youtube, Prime95 | |
| Schenker Key 17 Pro (Early 23) | |
| MSI Titan 18 HX A14VIG | |
| Medion Erazer Beast X40 | |
| Medion Erazer Beast X40 2024 | |
| Asus ROG Strix Scar 18 G834JYR (2024) | |
| Asus ROG Strix Scar 17 G733PYV-LL053X | |
* ... mindre är bättre
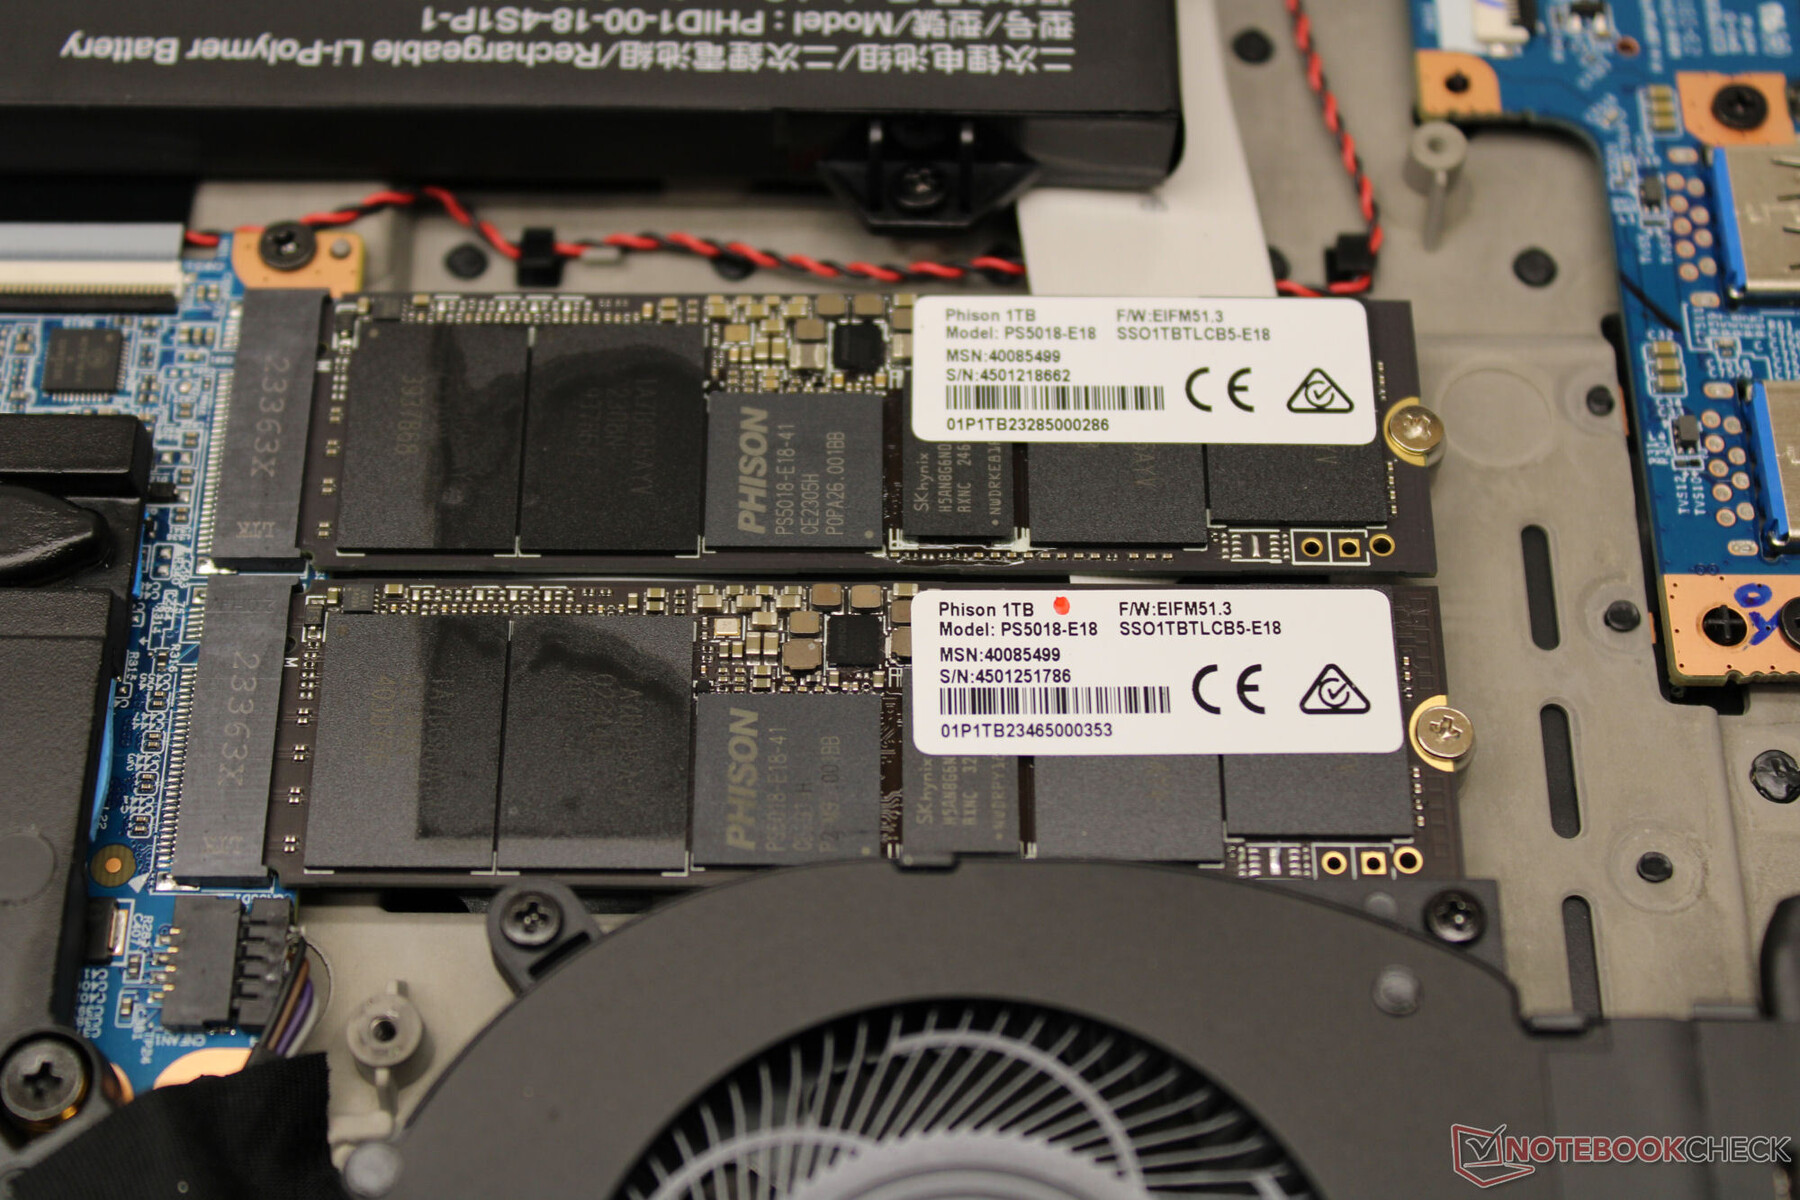
Masslagring
X40 har två PCIe Gen 4 M.2 2280 SSD-enheter på 1 TB vardera ombord, men de är inte konfigurerade i en RAID-array. En SSD fungerar som systemdisk och den andra som datalagring. Mycket bra datahastigheter uppnås. Det finns inga prestandaförluster på grund av termisk strypning.
X40 har generellt stöd för RAID-0/1, men motsvarande alternativ måste först aktiveras i BIOS och därefter måste Windows installeras om. Denna procedur rekommenderas inte för den oinvigde.

* ... mindre är bättre
Disk throttling: DiskSpd Read Loop, Queue Depth 8
Grafikkort
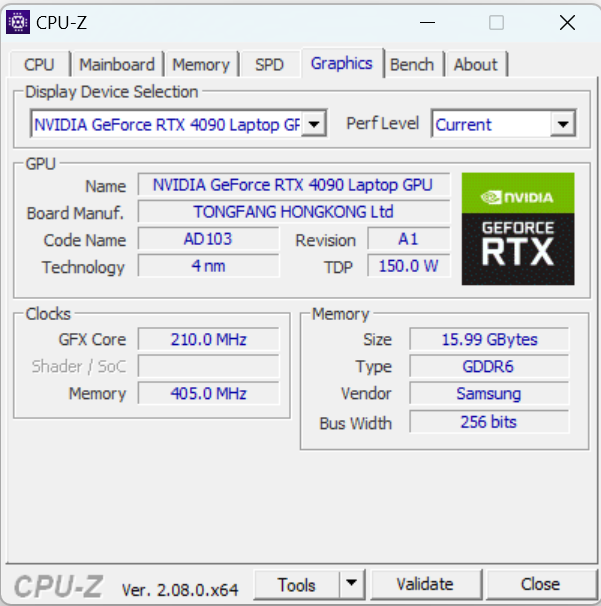
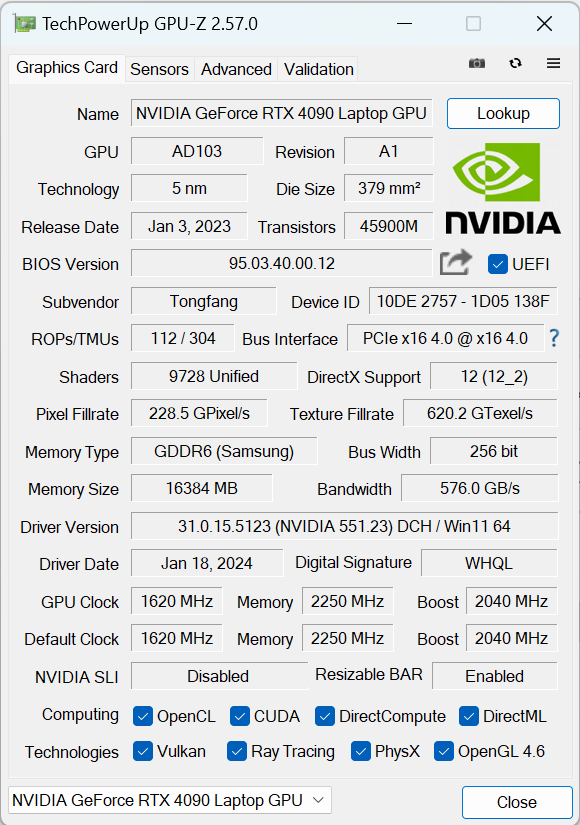
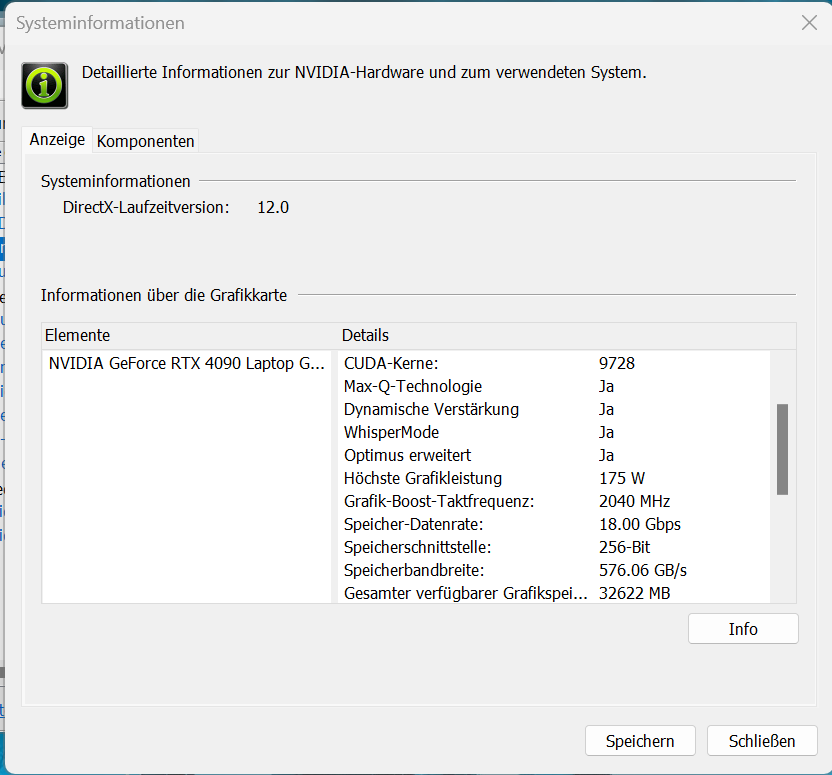
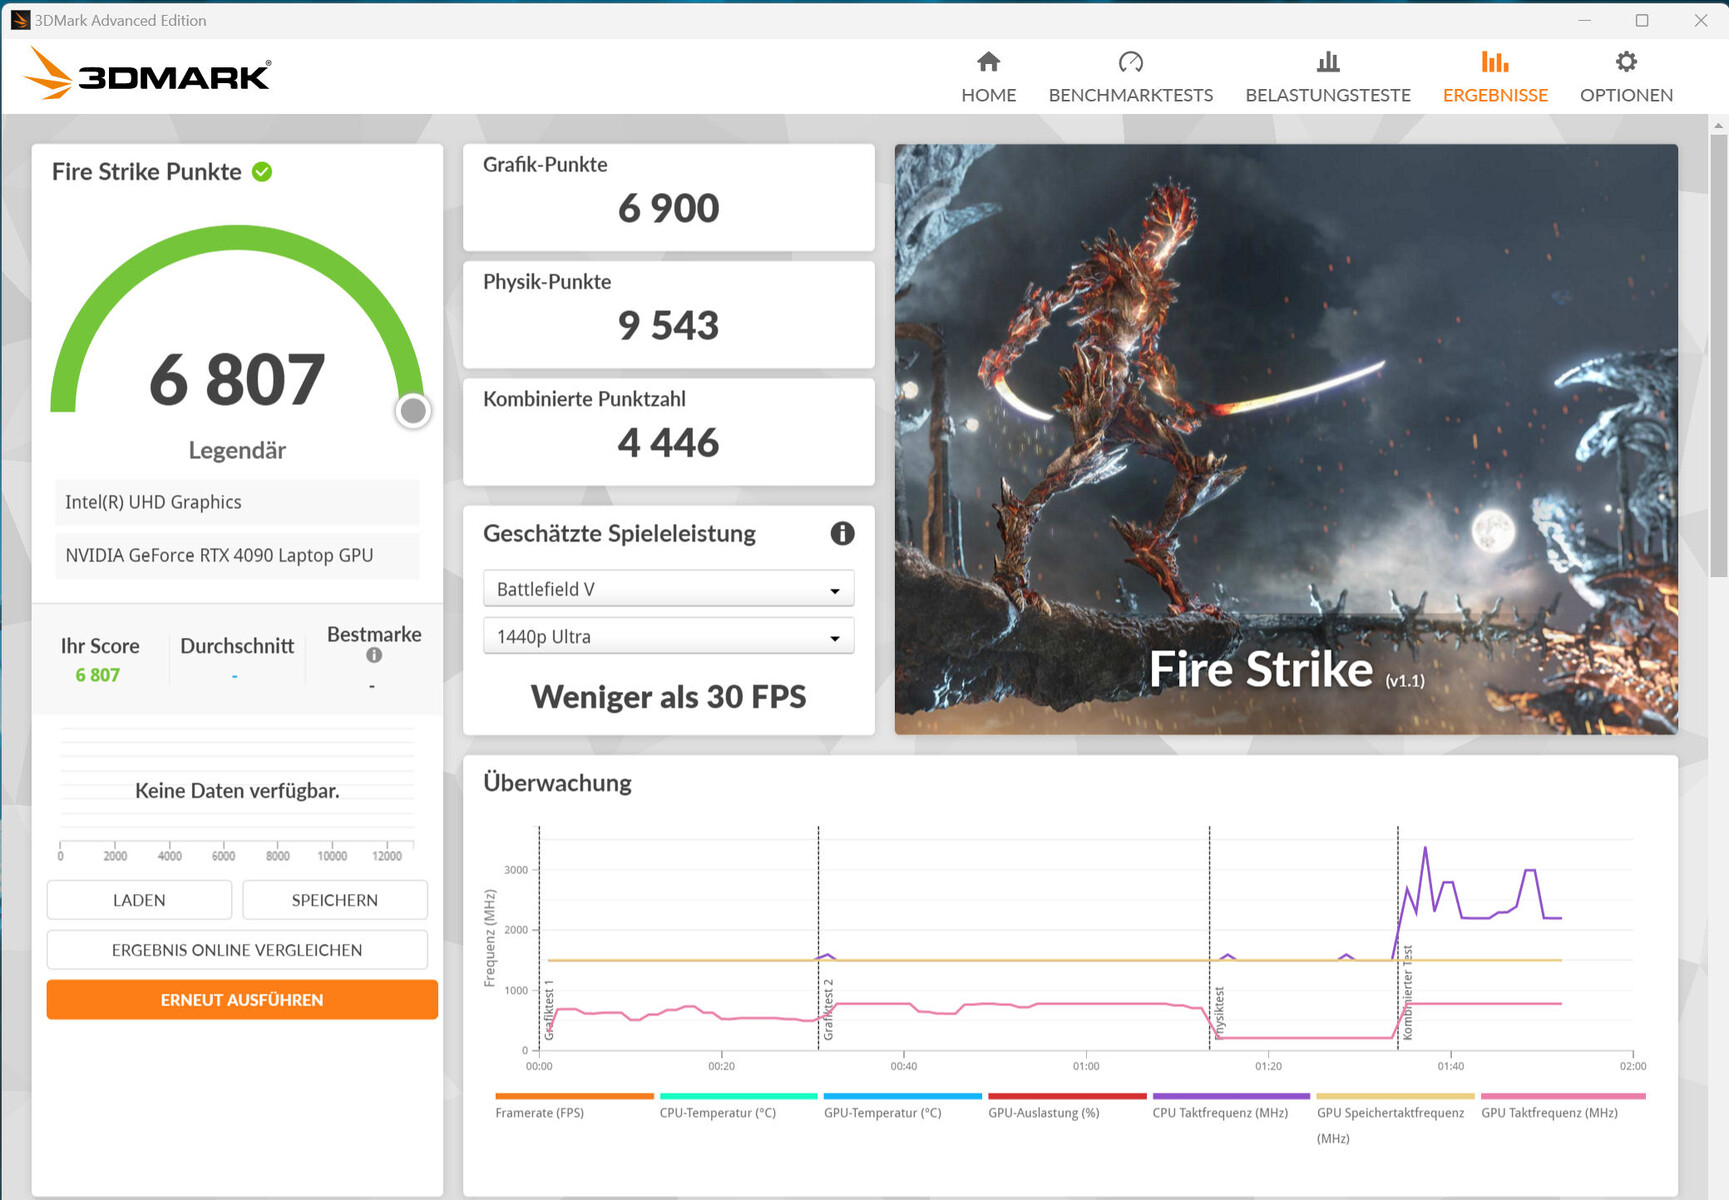
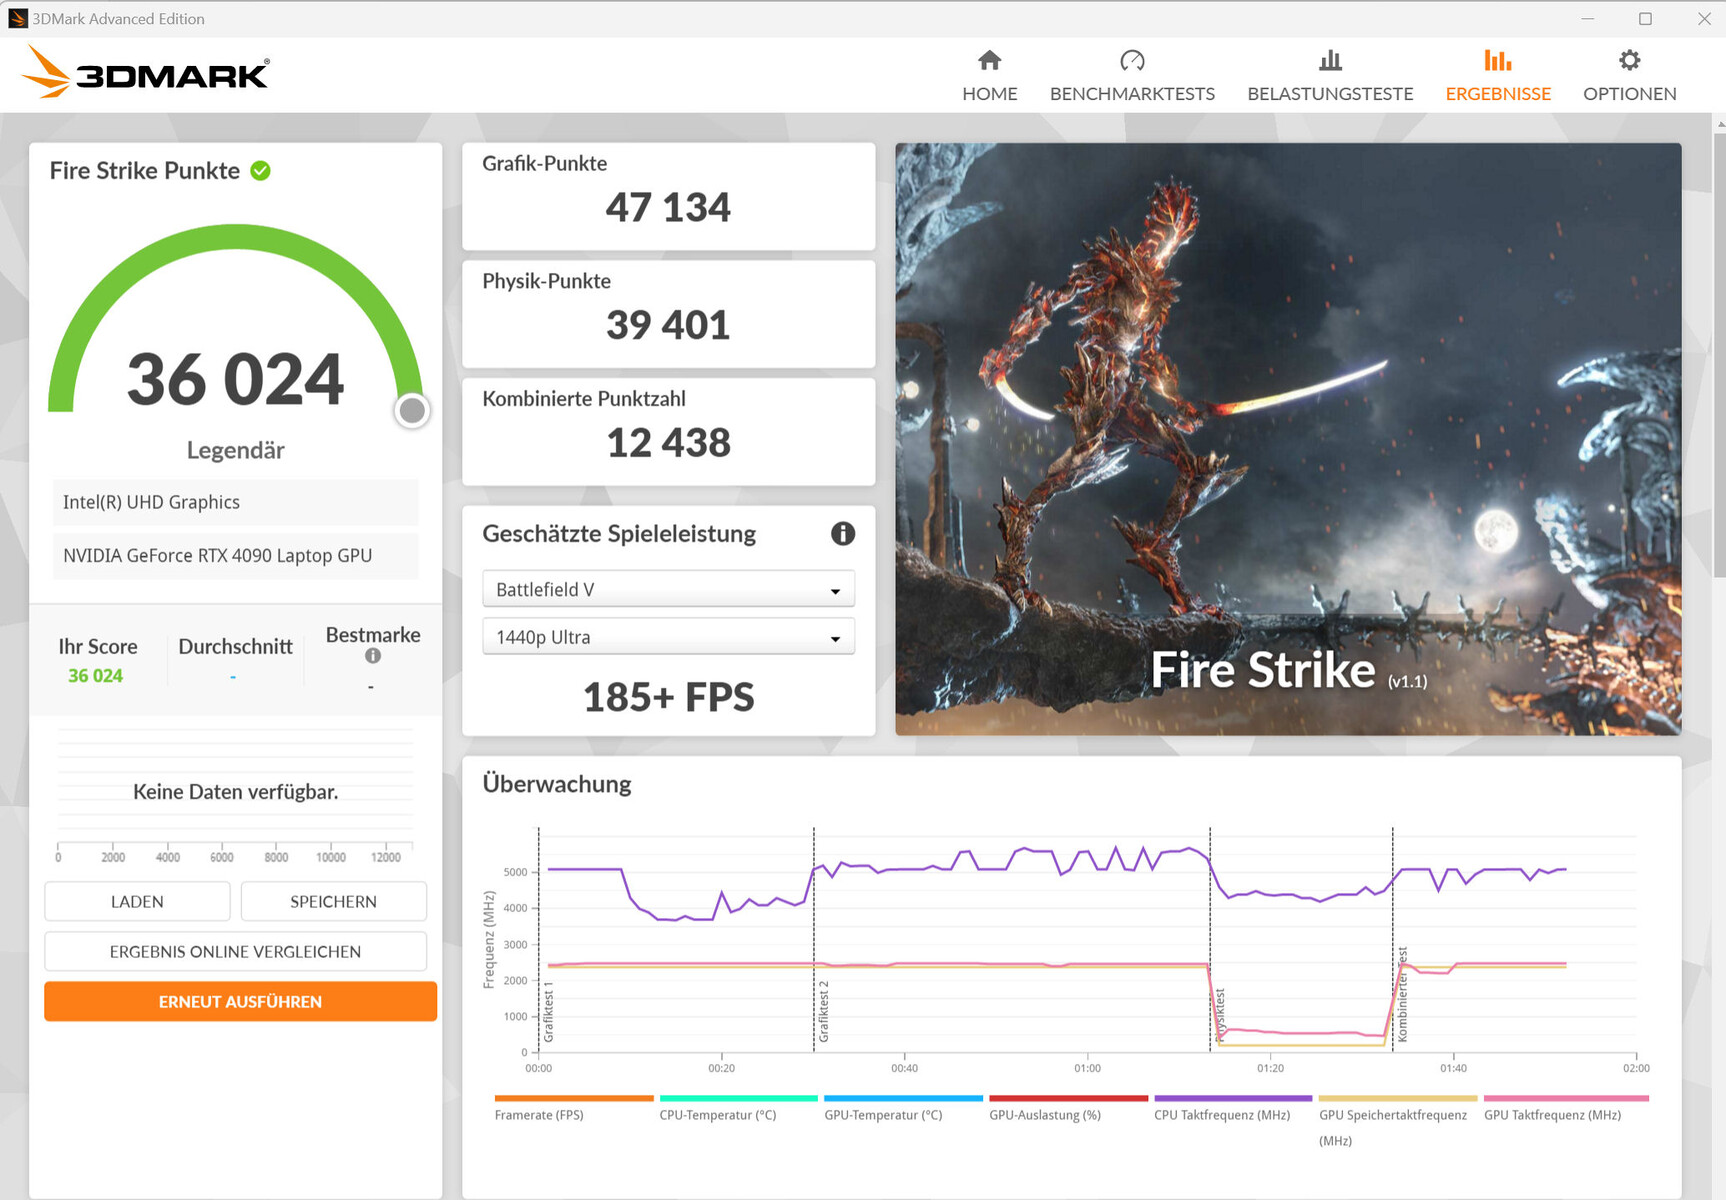
Medion Erazer Beast X40 förlitar sig på GeForce RTX 4090 - som för närvarande är Nvidias mest kraftfulla mobila GPU. Den har 9 728 shaders, en 256-bitars bred minnesbuss och snabbt 16 GB GDDR6-minne. RTX 4090 har en maximal TGP på 175 W (150 watt + 25 watt Dynamic Boost) - det finns inget sätt att överskrida den här gränsen.
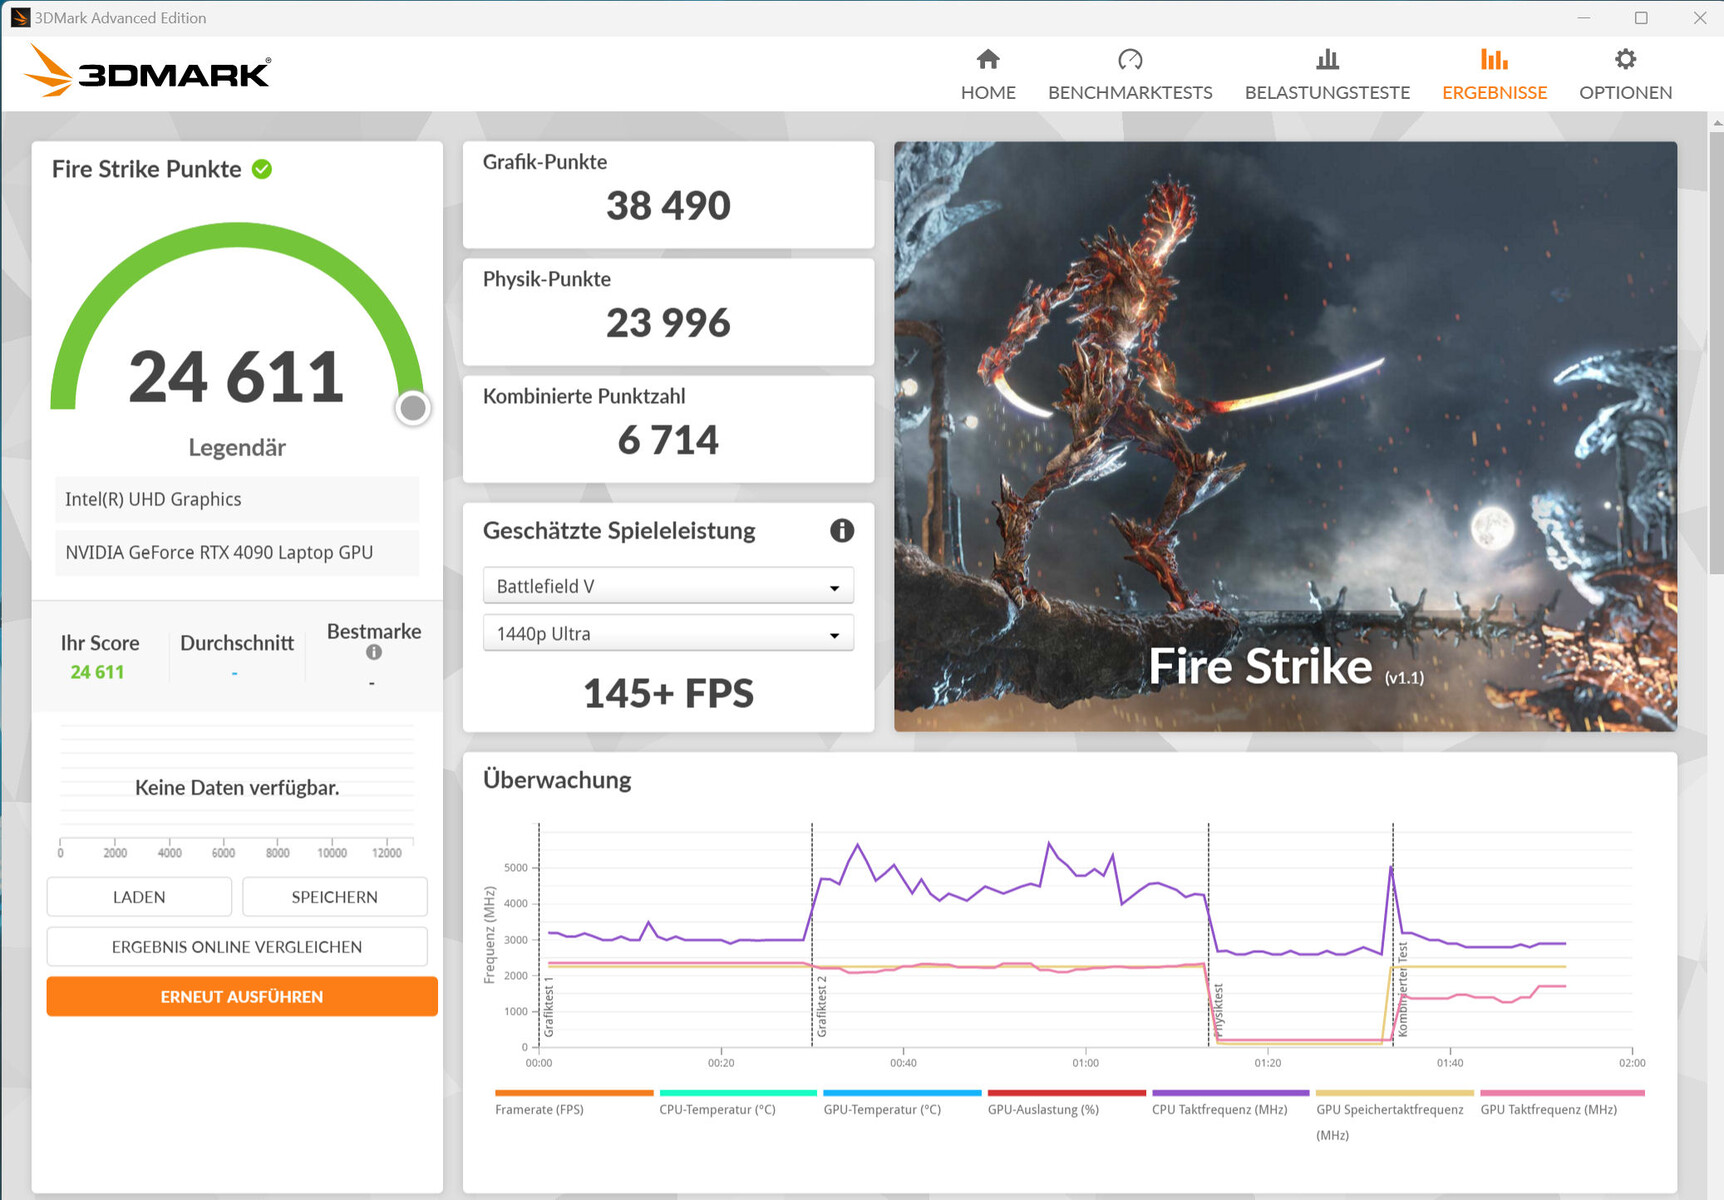
Benchmarkresultaten ligger på samma nivå (Balance Mode) eller över (Gaming Mode) det tidigare RTX 4090-genomsnittet. Situationen är dock annorlunda i spel.
Bildfrekvenser över GPU-genomsnittet uppnås i båda fallen. Advanced Optimus stöds, så att växling mellan dGPU och Optimus inte kräver en omstart.
| 3DMark Performance rating - Percent | |
| Medion Erazer Beast X40 2024 | |
| MSI Titan 18 HX A14VIG | |
| Asus ROG Strix Scar 17 G733PYV-LL053X | |
| Medion Erazer Beast X40 | |
| Schenker Key 17 Pro (Early 23) | |
| Genomsnitt NVIDIA GeForce RTX 4090 Laptop GPU | |
| Medion Erazer Beast X40 2024 | |
| Asus ROG Strix Scar 18 G834JYR (2024) | |
| Genomsnitt av klass Gaming | |
| 3DMark 11 - 1280x720 Performance GPU | |
| Medion Erazer Beast X40 2024 (Gaming Mode) | |
| Schenker Key 17 Pro (Early 23) | |
| Medion Erazer Beast X40 | |
| Genomsnitt NVIDIA GeForce RTX 4090 Laptop GPU (54073 - 73027, n=42) | |
| Medion Erazer Beast X40 2024 | |
| Asus ROG Strix Scar 17 G733PYV-LL053X | |
| MSI Titan 18 HX A14VIG | |
| Asus ROG Strix Scar 18 G834JYR (2024) | |
| Genomsnitt av klass Gaming (21841 - 80022, n=104, senaste 2 åren) | |
| 3DMark | |
| 1920x1080 Fire Strike Graphics | |
| MSI Titan 18 HX A14VIG | |
| Asus ROG Strix Scar 17 G733PYV-LL053X | |
| Medion Erazer Beast X40 2024 (Gaming Mode) | |
| Genomsnitt NVIDIA GeForce RTX 4090 Laptop GPU (40259 - 53059, n=41) | |
| Medion Erazer Beast X40 | |
| Medion Erazer Beast X40 2024 | |
| Asus ROG Strix Scar 18 G834JYR (2024) | |
| Schenker Key 17 Pro (Early 23) | |
| Genomsnitt av klass Gaming (12242 - 62849, n=115, senaste 2 åren) | |
| 2560x1440 Time Spy Graphics | |
| Medion Erazer Beast X40 2024 (Gaming Mode) | |
| MSI Titan 18 HX A14VIG | |
| Schenker Key 17 Pro (Early 23) | |
| Asus ROG Strix Scar 17 G733PYV-LL053X | |
| Medion Erazer Beast X40 | |
| Genomsnitt NVIDIA GeForce RTX 4090 Laptop GPU (16950 - 23292, n=43) | |
| Medion Erazer Beast X40 2024 | |
| Asus ROG Strix Scar 18 G834JYR (2024) | |
| Genomsnitt av klass Gaming (5012 - 26212, n=115, senaste 2 åren) | |
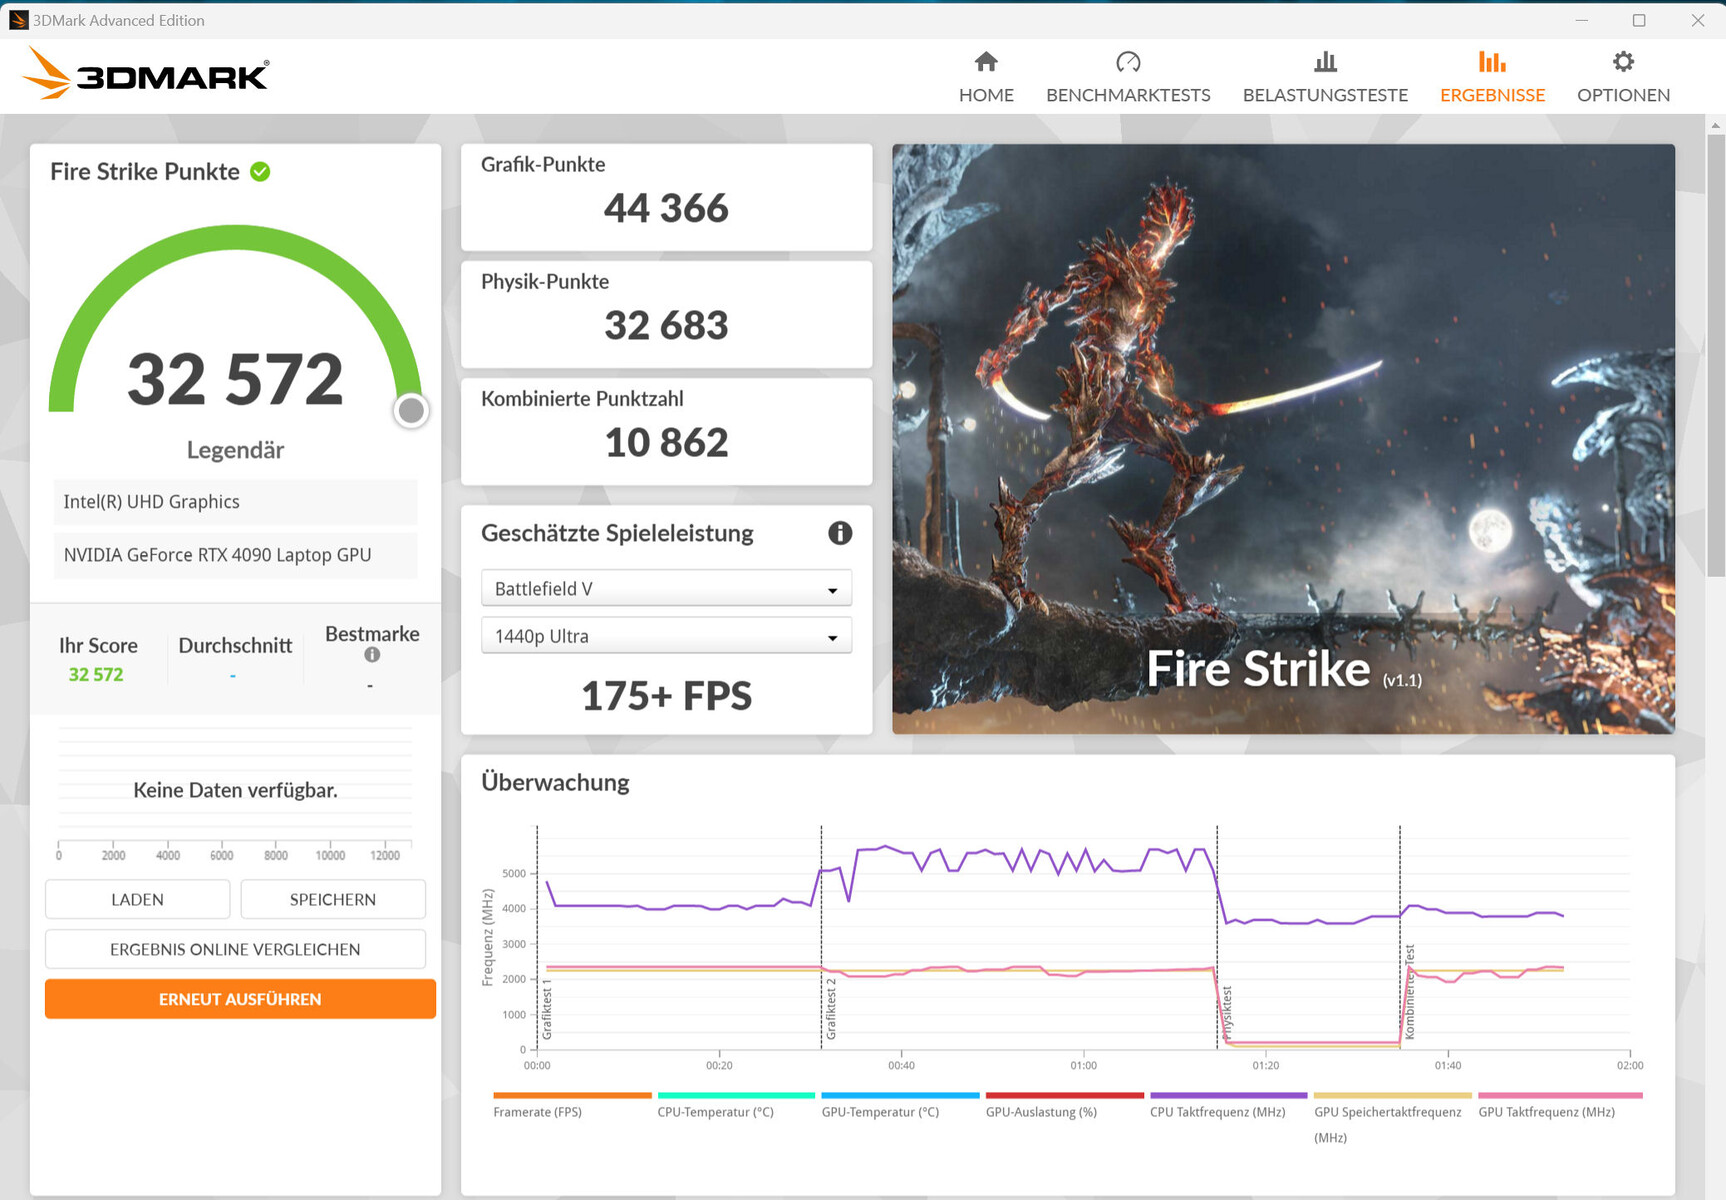
| 3DMark 11 Performance | 41974 poäng | |
| 3DMark Fire Strike Score | 32572 poäng | |
| 3DMark Time Spy Score | 19655 poäng | |
Hjälp | ||
| Geekbench 5.5 | |
| OpenCL Score | |
| Medion Erazer Beast X40 2024 (Gaming Mode) | |
| Asus ROG Strix Scar 18 G834JYR (2024) | |
| Schenker Key 17 Pro (Early 23) | |
| Asus ROG Strix Scar 17 G733PYV-LL053X | |
| Medion Erazer Beast X40 2024 | |
| Genomsnitt NVIDIA GeForce RTX 4090 Laptop GPU (6841 - 237138, n=39) | |
| MSI Titan 18 HX A14VIG | |
| Medion Erazer Beast X40 | |
| Genomsnitt av klass Gaming (80702 - 277970, n=101, senaste 2 åren) | |
| Vulkan Score 5.5 | |
| Medion Erazer Beast X40 2024 (Gaming Mode) | |
| Medion Erazer Beast X40 2024 | |
| MSI Titan 18 HX A14VIG | |
| Asus ROG Strix Scar 18 G834JYR (2024) | |
| Asus ROG Strix Scar 17 G733PYV-LL053X | |
| Genomsnitt av klass Gaming (18857 - 246759, n=76, senaste 2 åren) | |
| Genomsnitt NVIDIA GeForce RTX 4090 Laptop GPU (49663 - 163089, n=28) | |
| Geekbench 6.7 | |
| GPU Vulkan | |
| Medion Erazer Beast X40 2024 (6.2.1, Gaming Mode) | |
| Medion Erazer Beast X40 2024 (6.2.1) | |
| Asus ROG Strix Scar 18 G834JYR (2024) (6.2.1) | |
| Asus ROG Strix Scar 17 G733PYV-LL053X | |
| MSI Titan 18 HX A14VIG (6.2.1) | |
| Genomsnitt NVIDIA GeForce RTX 4090 Laptop GPU (128748 - 196201, n=16) | |
| Genomsnitt av klass Gaming (7562 - 244348, n=59, senaste 2 åren) | |
| GPU OpenCL | |
| Medion Erazer Beast X40 2024 (6.2.1) | |
| Medion Erazer Beast X40 2024 (6.2.1, Gaming Mode) | |
| Asus ROG Strix Scar 17 G733PYV-LL053X | |
| Asus ROG Strix Scar 18 G834JYR (2024) (6.2.1) | |
| Genomsnitt NVIDIA GeForce RTX 4090 Laptop GPU (159127 - 209521, n=20) | |
| MSI Titan 18 HX A14VIG (6.2.1) | |
| Genomsnitt av klass Gaming (67235 - 253130, n=103, senaste 2 åren) | |
| V-Ray Benchmark Next 4.10 | |
| GPU | |
| Medion Erazer Beast X40 2024 (v4.10.07, Gaming Mode) | |
| Asus ROG Strix Scar 17 G733PYV-LL053X (v4.10.07 ) | |
| Schenker Key 17 Pro (Early 23) (v4.10.07 ) | |
| Medion Erazer Beast X40 (v4.10.07 ) | |
| Genomsnitt NVIDIA GeForce RTX 4090 Laptop GPU (873 - 1334, n=30) | |
| Asus ROG Strix Scar 18 G834JYR (2024) (v4.10.07 ) | |
| Medion Erazer Beast X40 2024 (v4.10.07 ) | |
| Genomsnitt av klass Gaming (427 - 1627, n=99, senaste 2 åren) | |
| CPU | |
| Asus ROG Strix Scar 17 G733PYV-LL053X (v4.10.07 ) | |
| Medion Erazer Beast X40 2024 (v4.10.07, Gaming Mode) | |
| Medion Erazer Beast X40 (v4.10.07 ) | |
| Genomsnitt NVIDIA GeForce RTX 4090 Laptop GPU (18206 - 37629, n=30) | |
| Asus ROG Strix Scar 18 G834JYR (2024) (v4.10.07 ) | |
| Schenker Key 17 Pro (Early 23) (v4.10.07 ) | |
| Genomsnitt av klass Gaming (10048 - 45327, n=97, senaste 2 åren) | |
| Medion Erazer Beast X40 2024 (v4.10.07 ) | |
* ... mindre är bättre
| The Witcher 3 - 1920x1080 Ultra Graphics & Postprocessing (HBAO+) | |
| Medion Erazer Beast X40 2024 (Gaming Mode) | |
| MSI Titan 18 HX A14VIG | |
| Asus ROG Strix Scar 17 G733PYV-LL053X | |
| Schenker Key 17 Pro (Early 23) | |
| Medion Erazer Beast X40 2024 | |
| Genomsnitt NVIDIA GeForce RTX 4090 Laptop GPU (139.2 - 216, n=35) | |
| Genomsnitt av klass Gaming (104.7 - 240, n=7, senaste 2 åren) | |
| Medion Erazer Beast X40 | |
| Asus ROG Strix Scar 18 G834JYR (2024) | |
| GTA V - 1920x1080 Highest AA:4xMSAA + FX AF:16x | |
| Asus ROG Strix Scar 17 G733PYV-LL053X | |
| Medion Erazer Beast X40 2024 (Gaming Mode) | |
| Medion Erazer Beast X40 | |
| Schenker Key 17 Pro (Early 23) | |
| Medion Erazer Beast X40 2024 | |
| MSI Titan 18 HX A14VIG | |
| Genomsnitt NVIDIA GeForce RTX 4090 Laptop GPU (91.1 - 167.7, n=40) | |
| Asus ROG Strix Scar 18 G834JYR (2024) | |
| Genomsnitt av klass Gaming (48.3 - 186.9, n=94, senaste 2 åren) | |
| Final Fantasy XV Benchmark - 1920x1080 High Quality | |
| Medion Erazer Beast X40 2024 (1.3, Gaming Mode) | |
| MSI Titan 18 HX A14VIG (1.3) | |
| Schenker Key 17 Pro (Early 23) (1.3) | |
| Medion Erazer Beast X40 2024 (1.3) | |
| Asus ROG Strix Scar 17 G733PYV-LL053X (1.3) | |
| Medion Erazer Beast X40 (1.3) | |
| Genomsnitt NVIDIA GeForce RTX 4090 Laptop GPU (122.2 - 201, n=40) | |
| Asus ROG Strix Scar 18 G834JYR (2024) (1.3) | |
| Genomsnitt av klass Gaming (41 - 215, n=95, senaste 2 åren) | |
| Strange Brigade - 1920x1080 ultra AA:ultra AF:16 | |
| Asus ROG Strix Scar 17 G733PYV-LL053X (1.47.22.14 D3D12) | |
| MSI Titan 18 HX A14VIG (1.47.22.14 D3D12) | |
| Schenker Key 17 Pro (Early 23) (1.47.22.14 D3D12) | |
| Medion Erazer Beast X40 2024 (1.47.22.14 D3D12, Gaming Mode) | |
| Medion Erazer Beast X40 2024 (1.47.22.14 D3D12) | |
| Medion Erazer Beast X40 (1.47.22.14 D3D12) | |
| Genomsnitt NVIDIA GeForce RTX 4090 Laptop GPU (233 - 421, n=39) | |
| Asus ROG Strix Scar 18 G834JYR (2024) (1.47.22.14 D3D12) | |
| Genomsnitt av klass Gaming (76.3 - 458, n=87, senaste 2 åren) | |
| Dota 2 Reborn - 1920x1080 ultra (3/3) best looking | |
| Asus ROG Strix Scar 17 G733PYV-LL053X | |
| Medion Erazer Beast X40 2024 | |
| Medion Erazer Beast X40 2024 (Gaming Mode) | |
| Schenker Key 17 Pro (Early 23) | |
| Genomsnitt NVIDIA GeForce RTX 4090 Laptop GPU (115.7 - 220, n=42) | |
| MSI Titan 18 HX A14VIG | |
| Medion Erazer Beast X40 | |
| Asus ROG Strix Scar 18 G834JYR (2024) | |
| Genomsnitt av klass Gaming (84.8 - 248, n=107, senaste 2 åren) | |
| X-Plane 11.11 - 1920x1080 high (fps_test=3) | |
| Asus ROG Strix Scar 17 G733PYV-LL053X | |
| Medion Erazer Beast X40 2024 | |
| Medion Erazer Beast X40 2024 (Gaming Mode) | |
| Asus ROG Strix Scar 18 G834JYR (2024) | |
| Schenker Key 17 Pro (Early 23) | |
| Genomsnitt NVIDIA GeForce RTX 4090 Laptop GPU (77.8 - 166.2, n=46) | |
| Medion Erazer Beast X40 | |
| MSI Titan 18 HX A14VIG | |
| Genomsnitt av klass Gaming (55.5 - 143.5, n=109, senaste 2 åren) | |
| Helldivers 2 | |
| 1920x1080 Ultra Preset | |
| Medion Erazer Beast X40 2024 | |
| Genomsnitt NVIDIA GeForce RTX 4090 Laptop GPU (130.2 - 141.2, n=2) | |
| Asus ROG Zephyrus M16 | |
| Genomsnitt av klass Gaming (18.4 - 153.8, n=5, senaste 2 åren) | |
| 2560x1440 Ultra Preset | |
| Medion Erazer Beast X40 2024 | |
| Genomsnitt av klass Gaming (81.3 - 140.1, n=5, senaste 2 åren) | |
| Genomsnitt NVIDIA GeForce RTX 4090 Laptop GPU (105.5 - 122.6, n=2) | |
| Asus ROG Zephyrus M16 | |
| Enshrouded | |
| 1920x1080 Max. Quality AA:FX | |
| Medion Erazer Beast X40 2024 | |
| Genomsnitt NVIDIA GeForce RTX 4090 Laptop GPU (79 - 101.5, n=3) | |
| Asus ROG Strix Scar 18 G834JYR (2024) | |
| Asus ROG Zephyrus M16 | |
| Genomsnitt av klass Gaming (n=1senaste 2 åren) | |
| 2560x1440 Max. Quality AA:FX | |
| Medion Erazer Beast X40 2024 | |
| Asus ROG Strix Scar 18 G834JYR (2024) | |
| Genomsnitt NVIDIA GeForce RTX 4090 Laptop GPU (61.8 - 76, n=3) | |
| Asus ROG Zephyrus M16 | |
| Ready or Not | |
| 1920x1080 Epic Preset | |
| Asus ROG Zephyrus M16 | |
| Genomsnitt NVIDIA GeForce RTX 4090 Laptop GPU (155.1 - 203, n=2) | |
| Medion Erazer Beast X40 2024 | |
| 2560x1440 Epic Preset | |
| Medion Erazer Beast X40 2024 | |
| Genomsnitt NVIDIA GeForce RTX 4090 Laptop GPU (141.1 - 144.3, n=2) | |
| Asus ROG Zephyrus M16 | |
| Immortals of Aveum | |
| 1920x1080 Ultra AF:16x | |
| Medion Erazer Beast X40 2024 | |
| Genomsnitt NVIDIA GeForce RTX 4090 Laptop GPU (90.6 - 106.3, n=2) | |
| 2560x1440 Ultra AF:16x | |
| Medion Erazer Beast X40 2024 | |
| Genomsnitt NVIDIA GeForce RTX 4090 Laptop GPU (62.9 - 76.5, n=2) | |
The Witcher 3 FPS chart
| låg | med. | hög | ultra | QHD | |
|---|---|---|---|---|---|
| GTA V (2015) | 187.3 | 186.7 | 183 | 141.5 | 139.8 |
| The Witcher 3 (2015) | 555 | 518 | 394 | 204 | 157.6 |
| Dota 2 Reborn (2015) | 241 | 214 | 205 | 189.9 | |
| Final Fantasy XV Benchmark (2018) | 225 | 210 | 181.1 | 147.7 | |
| X-Plane 11.11 (2018) | 207 | 182.2 | 143.9 | ||
| Strange Brigade (2018) | 484 | 401 | 387 | 371 | 289 |
| Immortals of Aveum (2023) | 119.3 | 109.6 | 106.3 | 76.5 | |
| Cyberpunk 2077 (2023) | 133.2 | 131 | 120.9 | 118.9 | 87.5 |
| Ready or Not (2023) | 289 | 166.6 | 158 | 155.1 | 144.3 |
| Enshrouded (2024) | 150.5 | 134.5 | 116.2 | 101.5 | 76 |
| Helldivers 2 (2024) | 146.8 | 143.8 | 143.3 | 141.2 | 122.6 |
Utsläpp och energi: Beast X40 kan arbeta tyst
Utsläpp av buller
Stressning vid full belastning visar att ljudtrycksnivåer på upp till 52 dB(A) är möjliga med Beast X40. Den bärbara datorn är bara något tystare i spelläget.
"Silent Mode" säkerställer en mycket låg ljudnivå, men ger ändå mer än tillräckligt med kraft för vardagliga uppgifter som kontor och internet. Spel är också möjligt i detta läge. Bildhastigheten är dock låst till 30 fps av systemet i vårt test på Witcher 3.
Under vissa omständigheter kan ett elektroniskt surrande höras inifrån den bärbara datorn, t.ex. under testet på Witcher 3 eller när Specviewperf-riktmärket körs.
Ljudnivå
| Låg belastning |
| 28 / 29 / 32 dB(A) |
| Hög belastning |
| 48 / 52 dB(A) |
 | ||
30 dB tyst 40 dB(A) hörbar 50 dB(A) högt ljud |
||
min: | ||
| Medion Erazer Beast X40 2024 i9-14900HX, GeForce RTX 4090 Laptop GPU | Asus ROG Strix Scar 17 G733PYV-LL053X R9 7945HX3D, GeForce RTX 4090 Laptop GPU | Schenker Key 17 Pro (Early 23) i9-13900HX, GeForce RTX 4090 Laptop GPU | Asus ROG Strix Scar 18 G834JYR (2024) i9-14900HX, GeForce RTX 4090 Laptop GPU | MSI Titan 18 HX A14VIG i9-14900HX, GeForce RTX 4090 Laptop GPU | Medion Erazer Beast X40 i9-13900HX, GeForce RTX 4090 Laptop GPU | |
|---|---|---|---|---|---|---|
| Noise | 0% | -17% | 1% | 6% | -1% | |
| av / miljö * (dB) | 25 | 23 8% | 26 -4% | 24 4% | 22.8 9% | 24 4% |
| Idle Minimum * (dB) | 28 | 23 18% | 26 7% | 27 4% | 23.8 15% | 25 11% |
| Idle Average * (dB) | 29 | 27.7 4% | 33 -14% | 28 3% | 23.8 18% | 29 -0% |
| Idle Maximum * (dB) | 32 | 34.7 -8% | 46 -44% | 32 -0% | 28 12% | 35 -9% |
| Load Average * (dB) | 48 | 53.4 -11% | 56 -17% | 50 -4% | 38 21% | 51 -6% |
| Witcher 3 ultra * (dB) | 50 | 53.4 -7% | 62 -24% | 50 -0% | 57.3 -15% | 51 -2% |
| Load Maximum * (dB) | 52 | 53.4 -3% | 64 -23% | 52 -0% | 62.8 -21% | 53 -2% |
* ... mindre är bättre
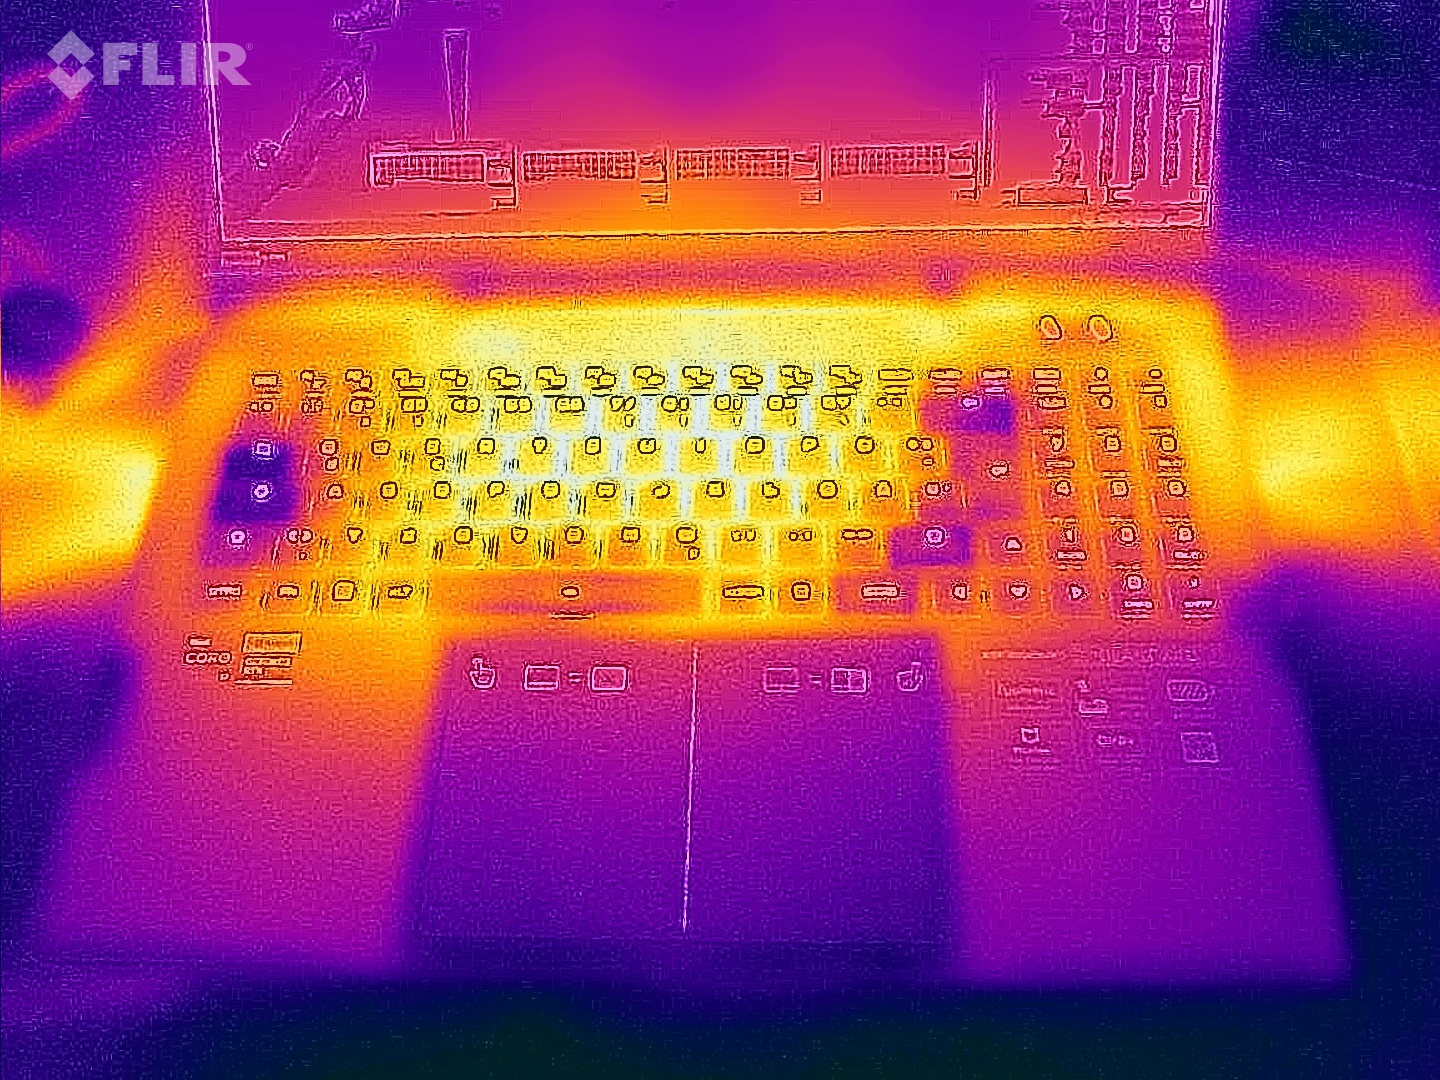
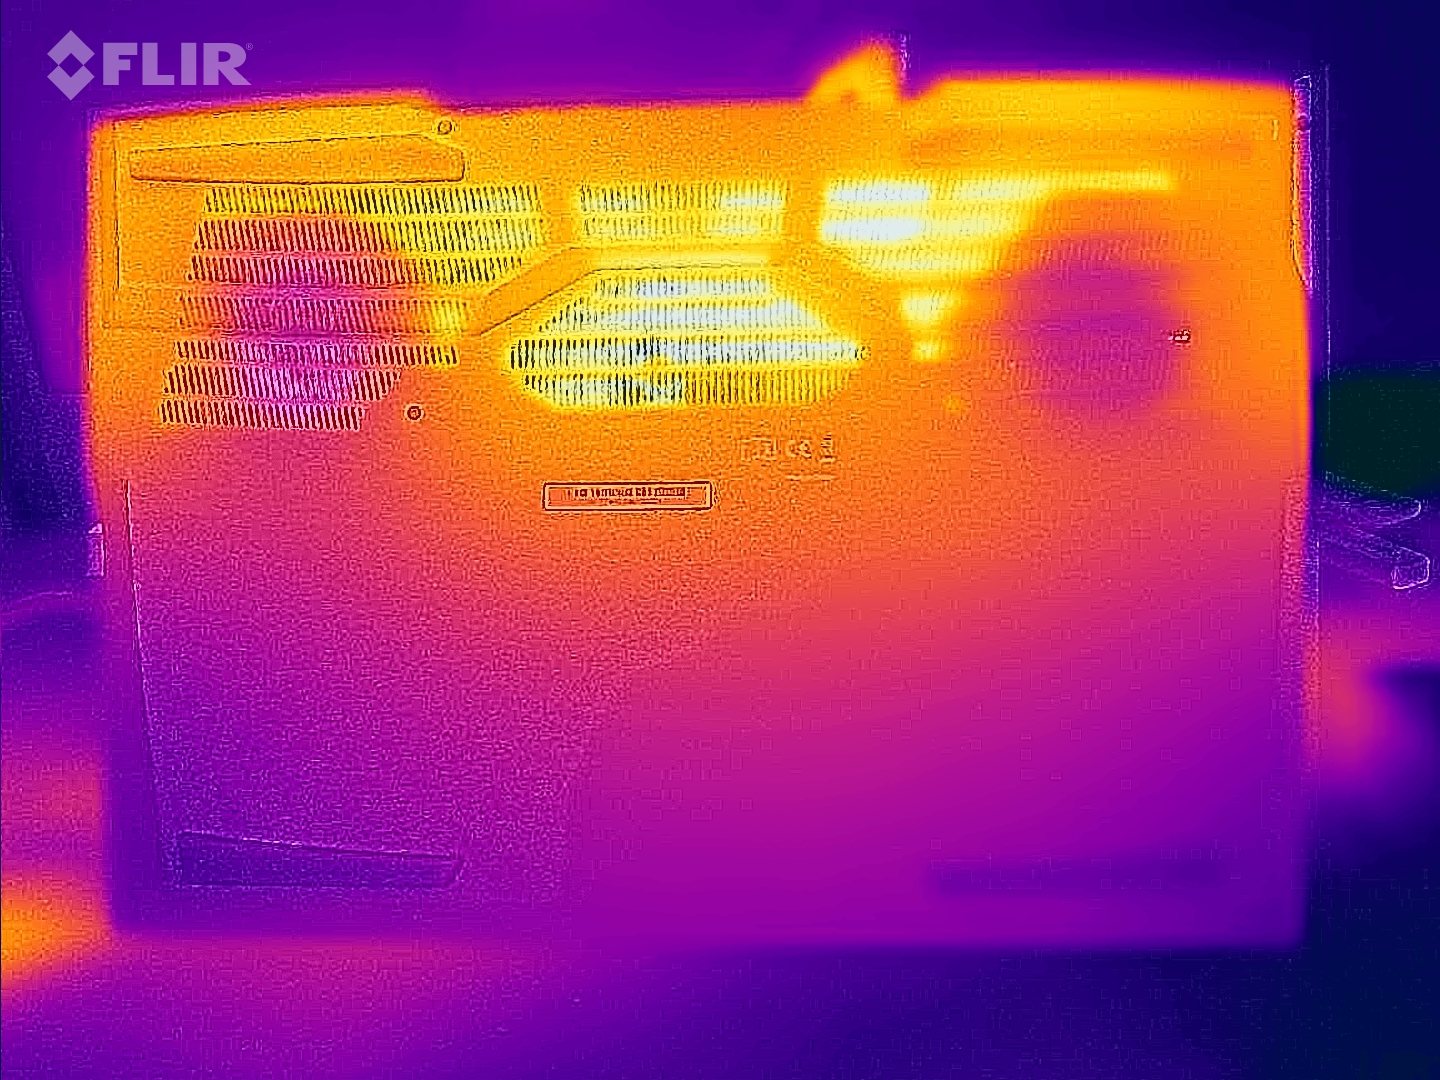
Temperatur
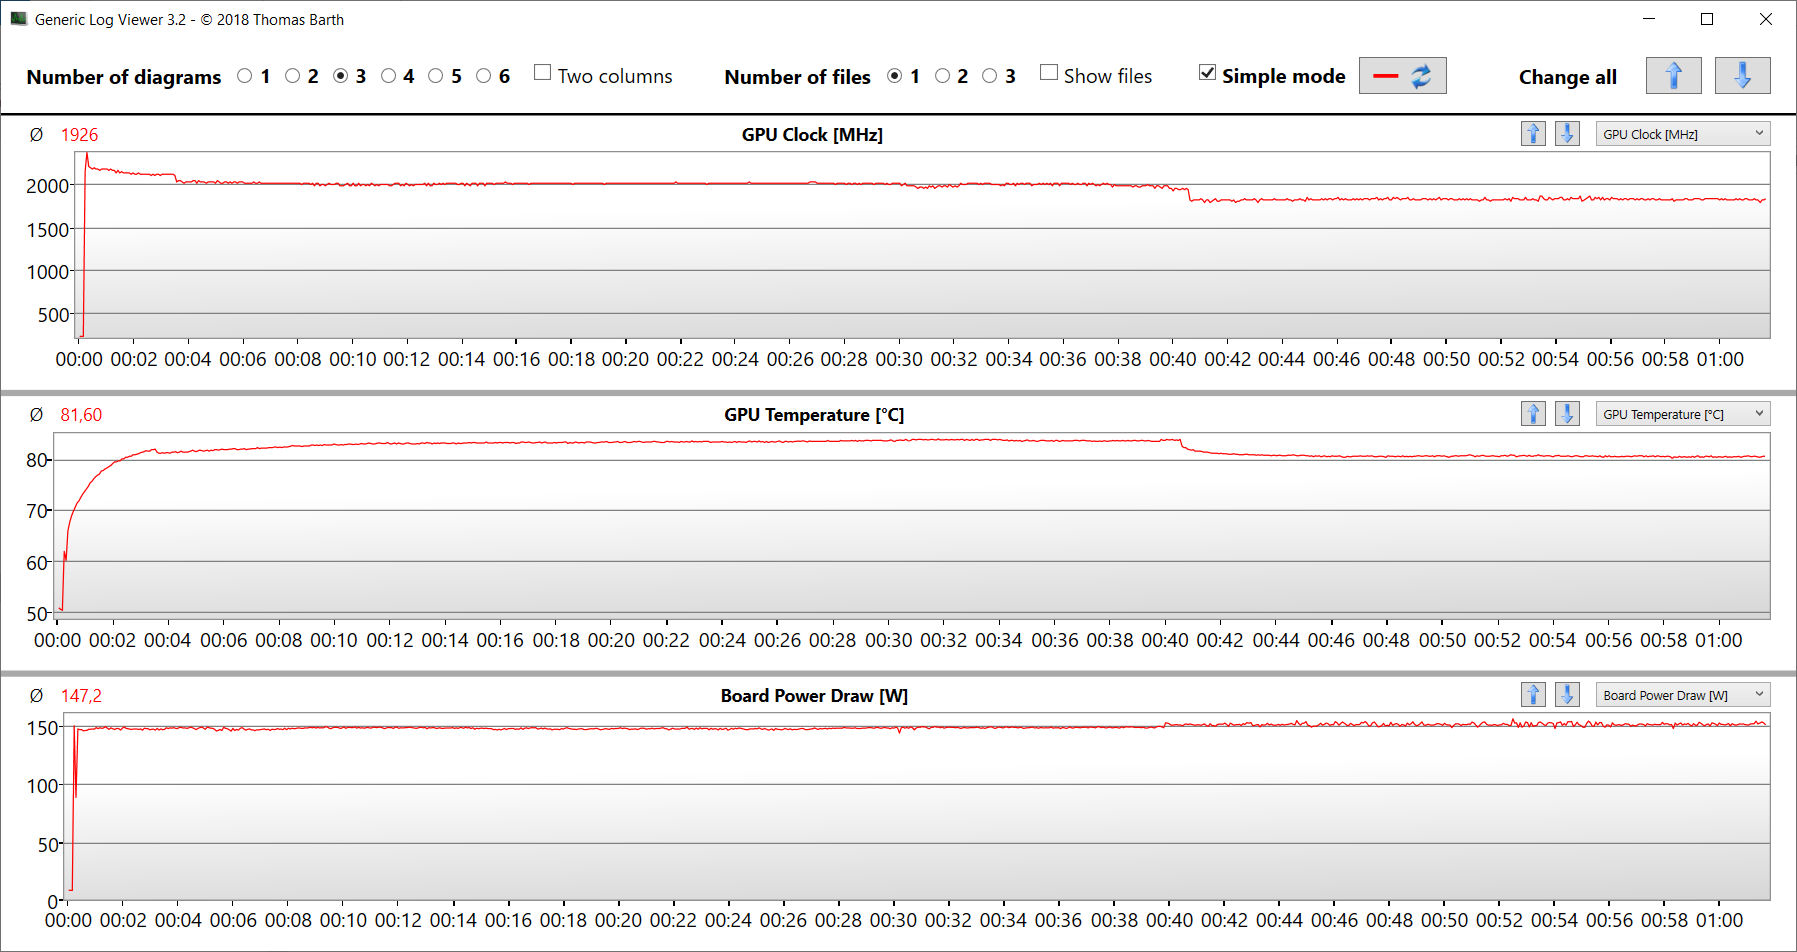
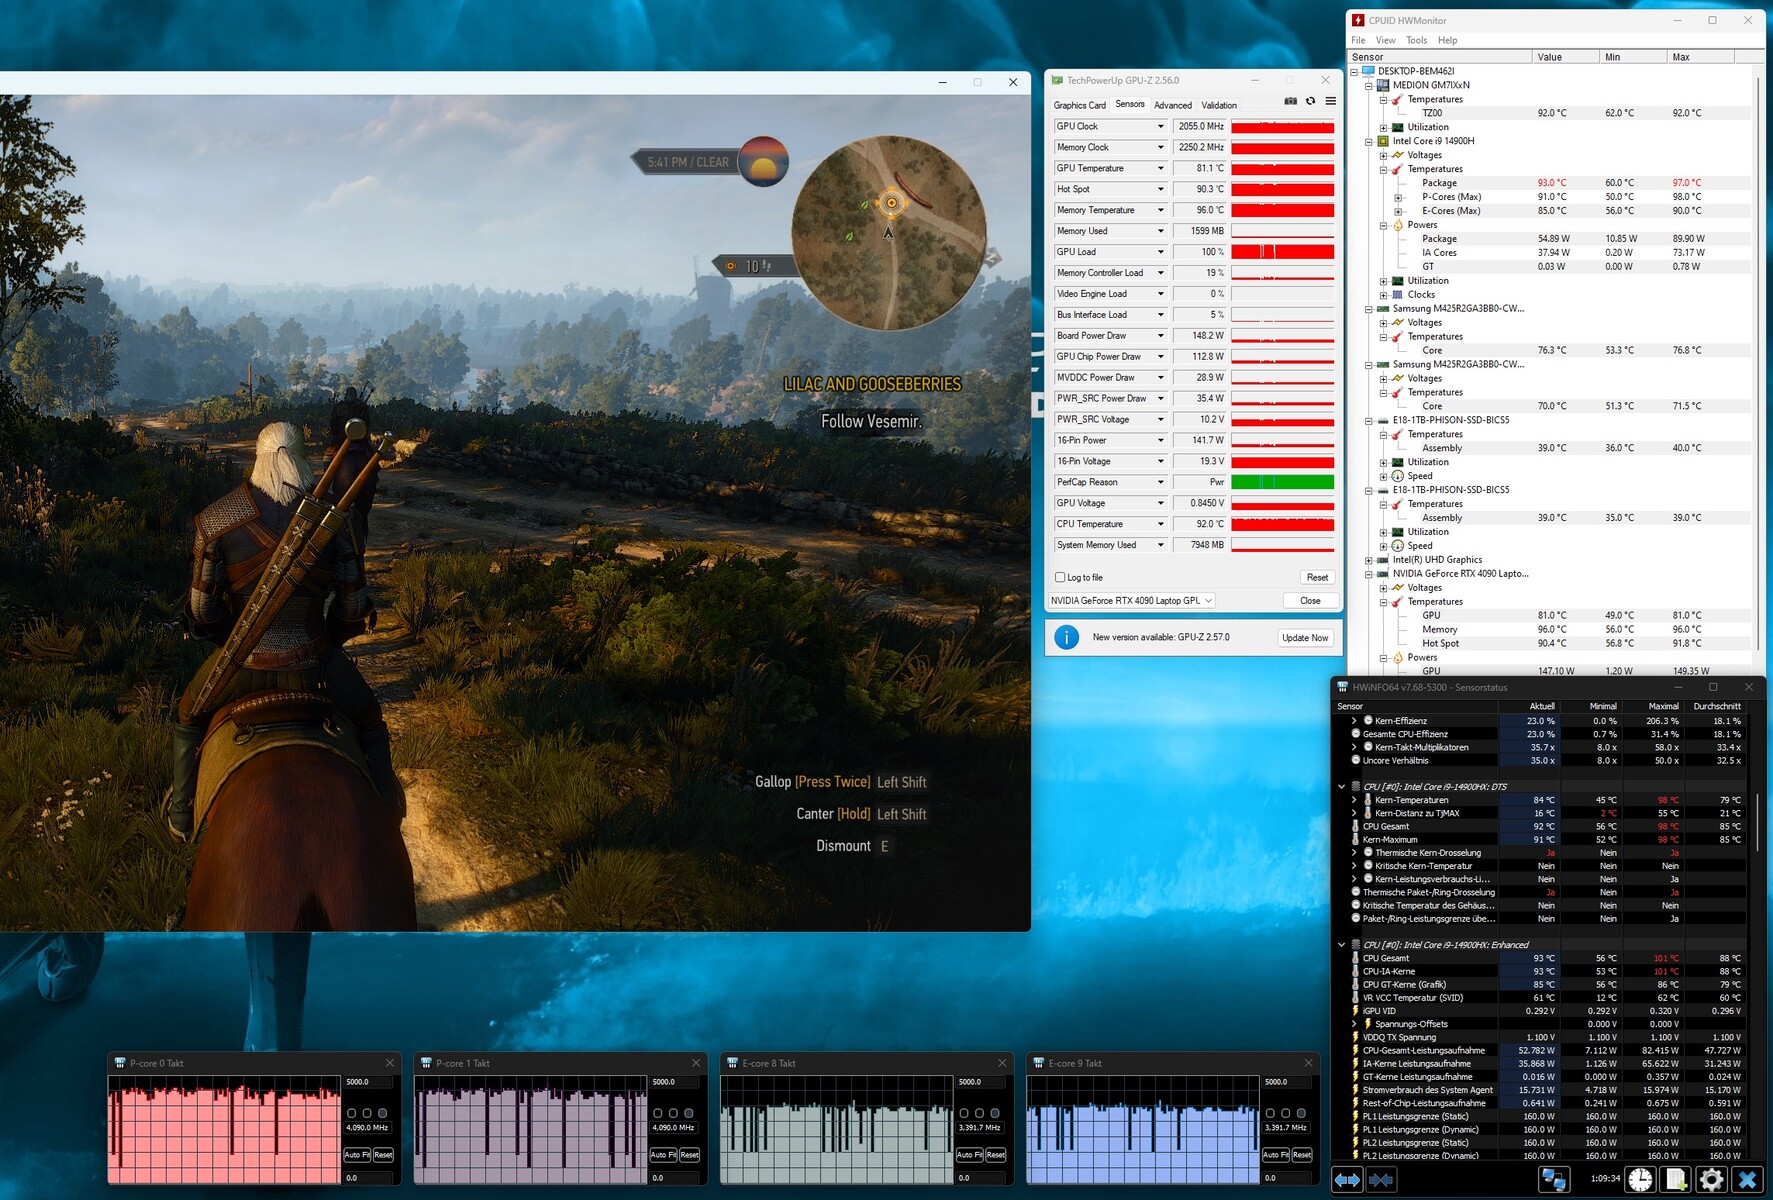
Stresstestet och Witcher 3 -testet gör att notebooken värms upp märkbart men inte överdrivet. Värden över 50 grader Celsius uppnås vid vissa tillfällen. Vid daglig användning (Office, Internet) ligger värdena inom det gröna området.
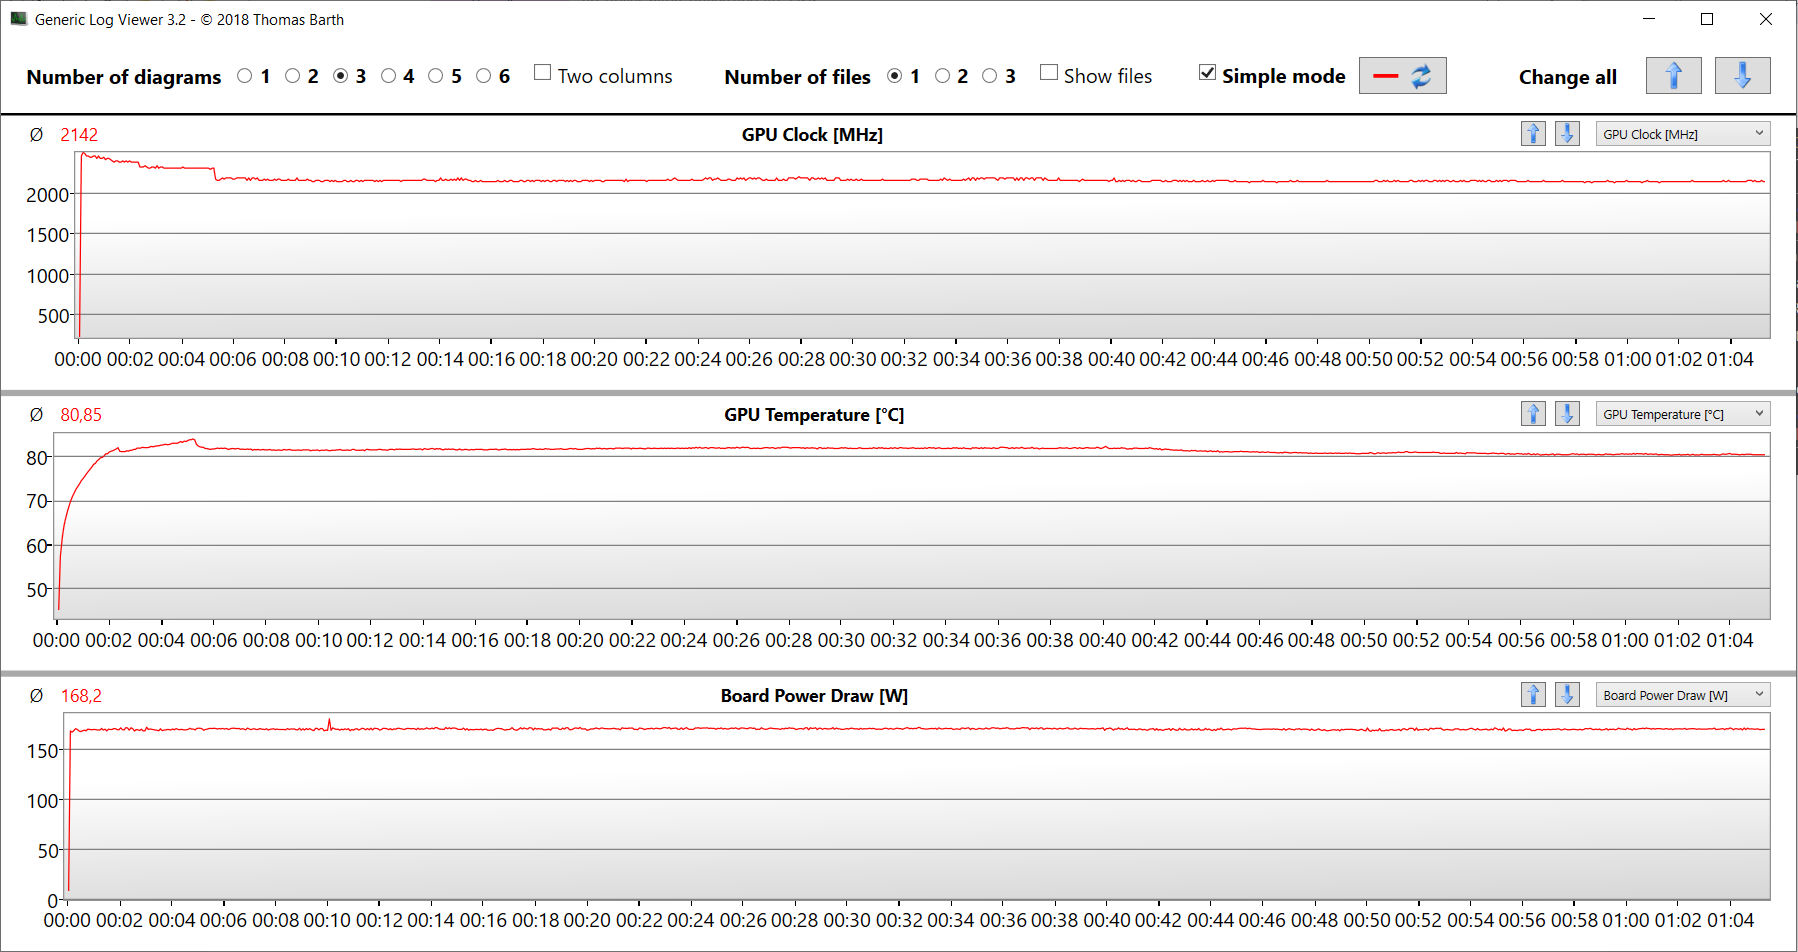
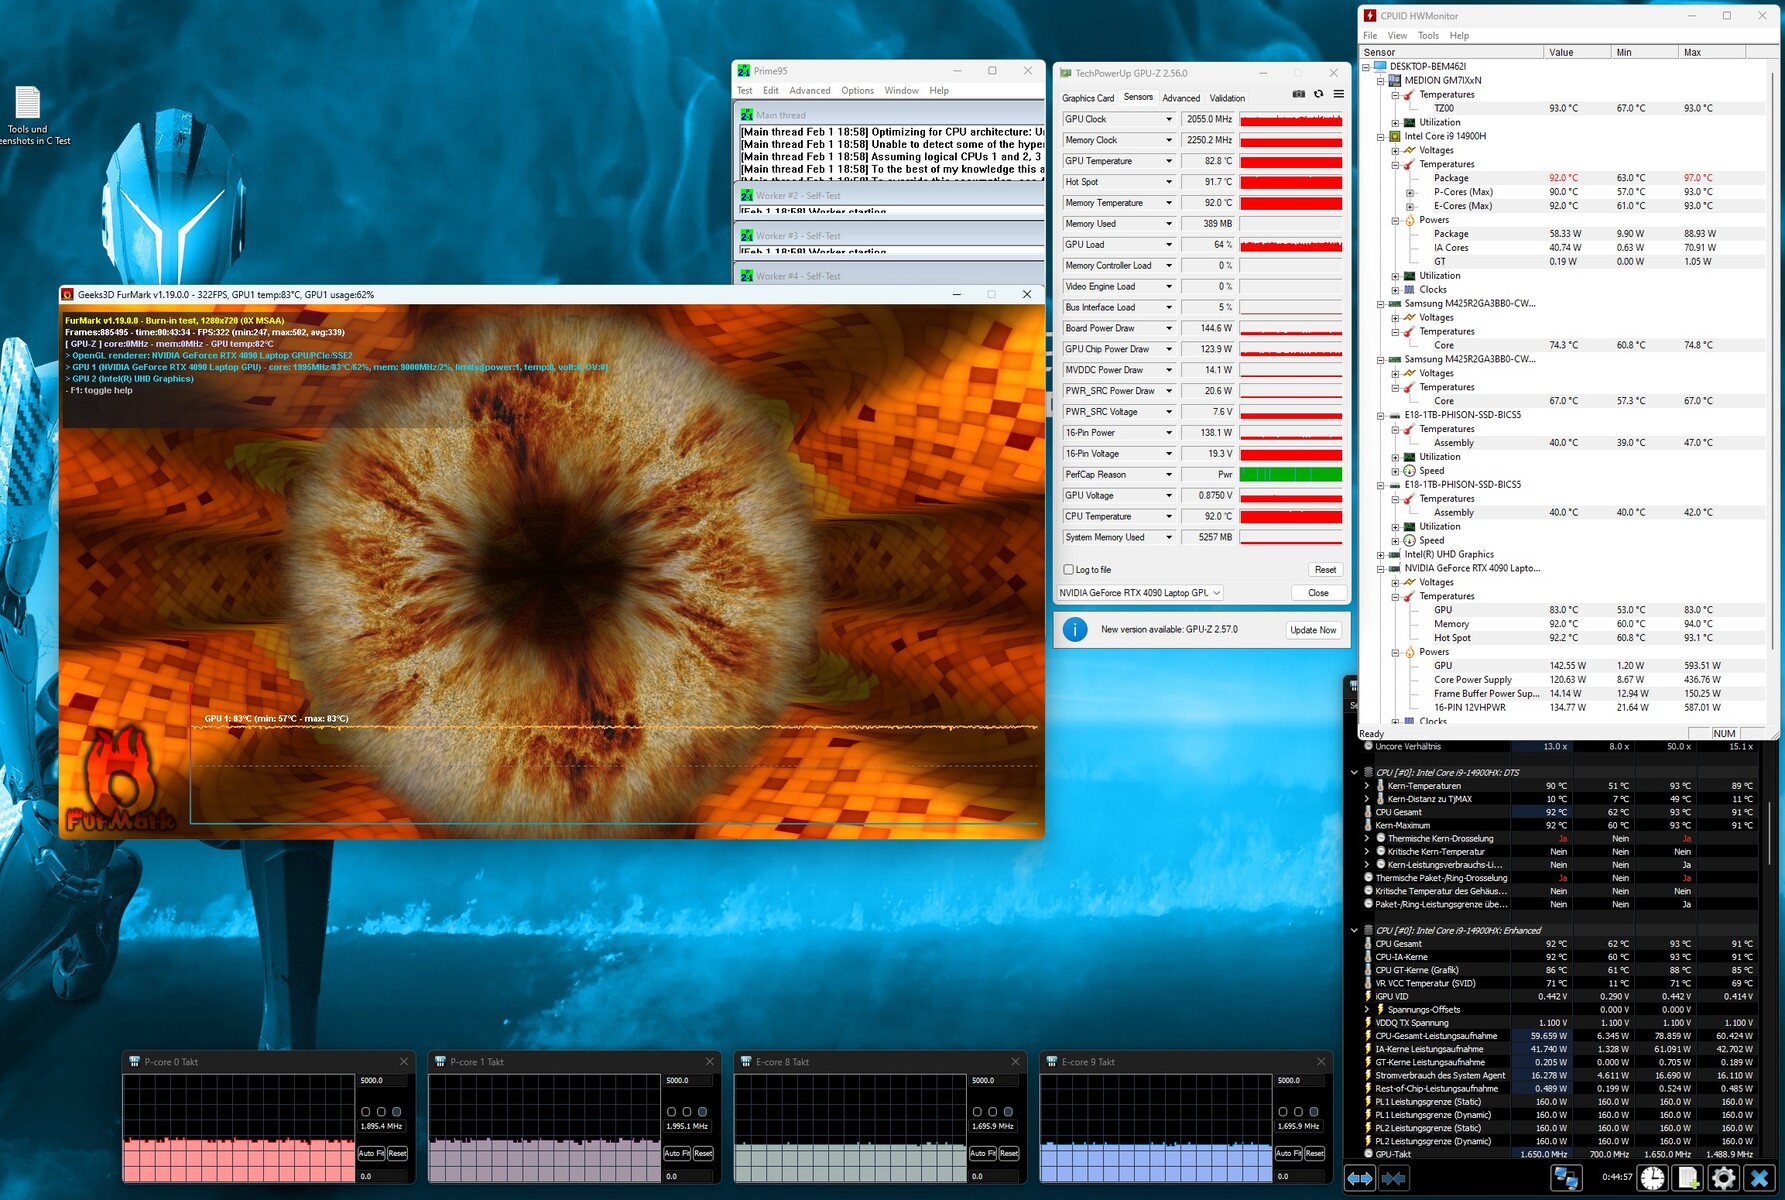
Stresstestet (Prime95 och Furmark i kontinuerlig drift) är ett extremt scenario för att testa systemets stabilitet under full belastning. CPU-klockfrekvensen sjunker till 1,9 till 2 GHz (P-kärnor) eller 1,7 GHz (E-kärnor) inom de första minuterna och förblir på denna nivå. GPU:n arbetar med hastigheter mellan 2 och 2,1 GHz.
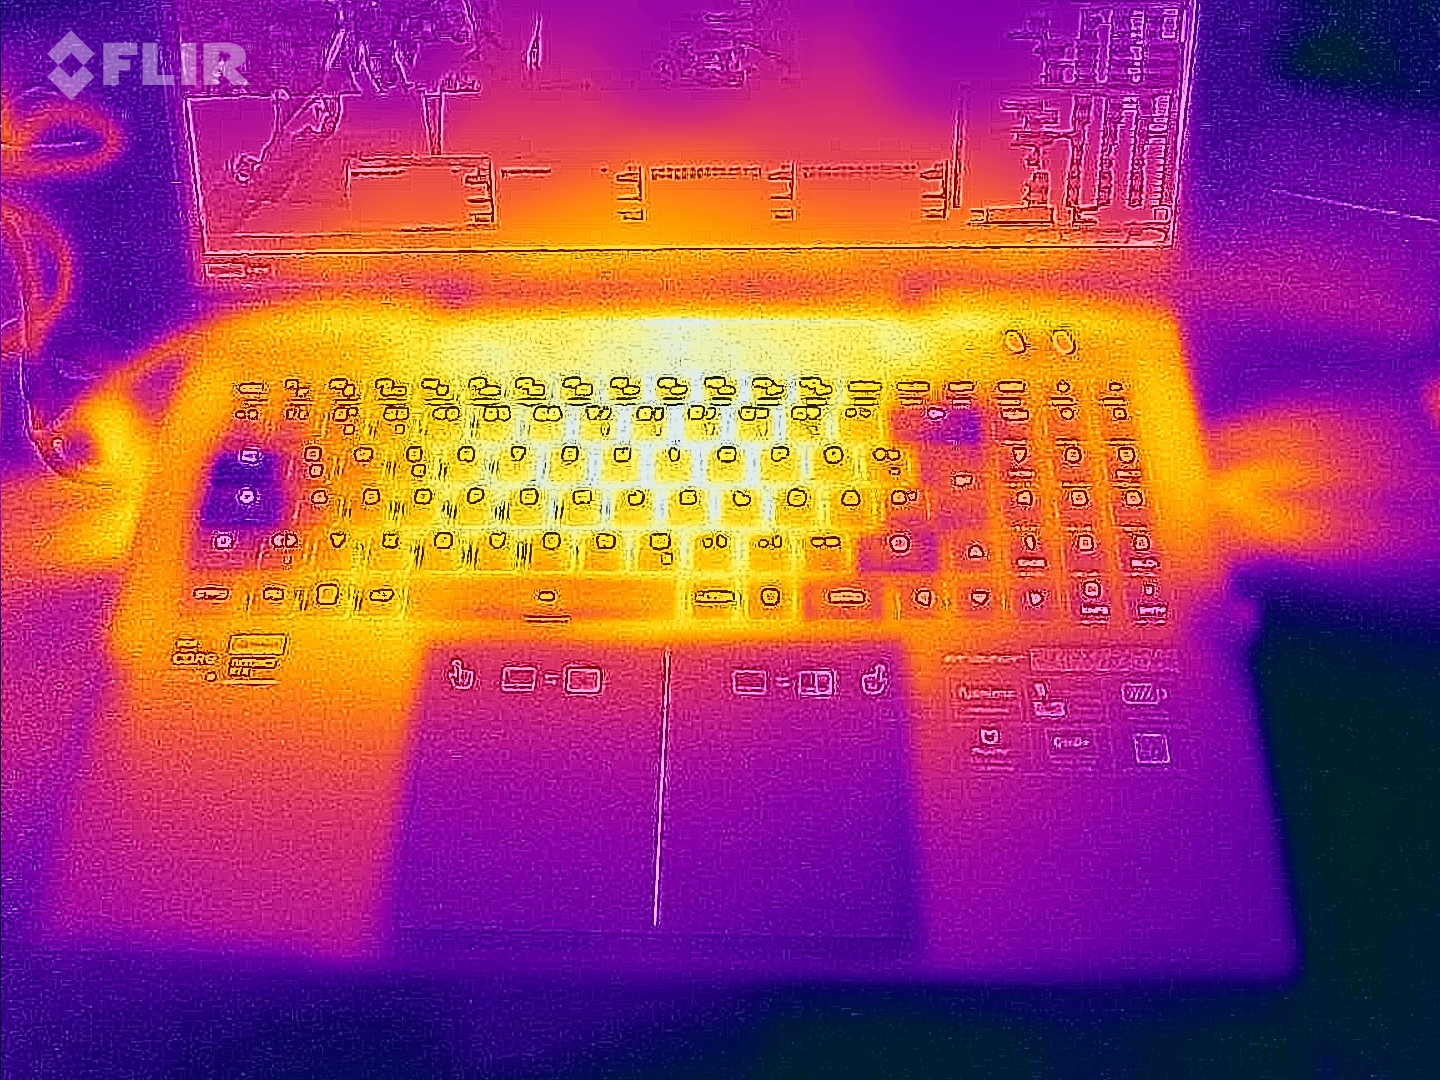
(-) Den maximala temperaturen på ovansidan är 47 °C / 117 F, jämfört med genomsnittet av 40.4 °C / 105 F , allt från 21.2 till 68.8 °C för klassen Gaming.
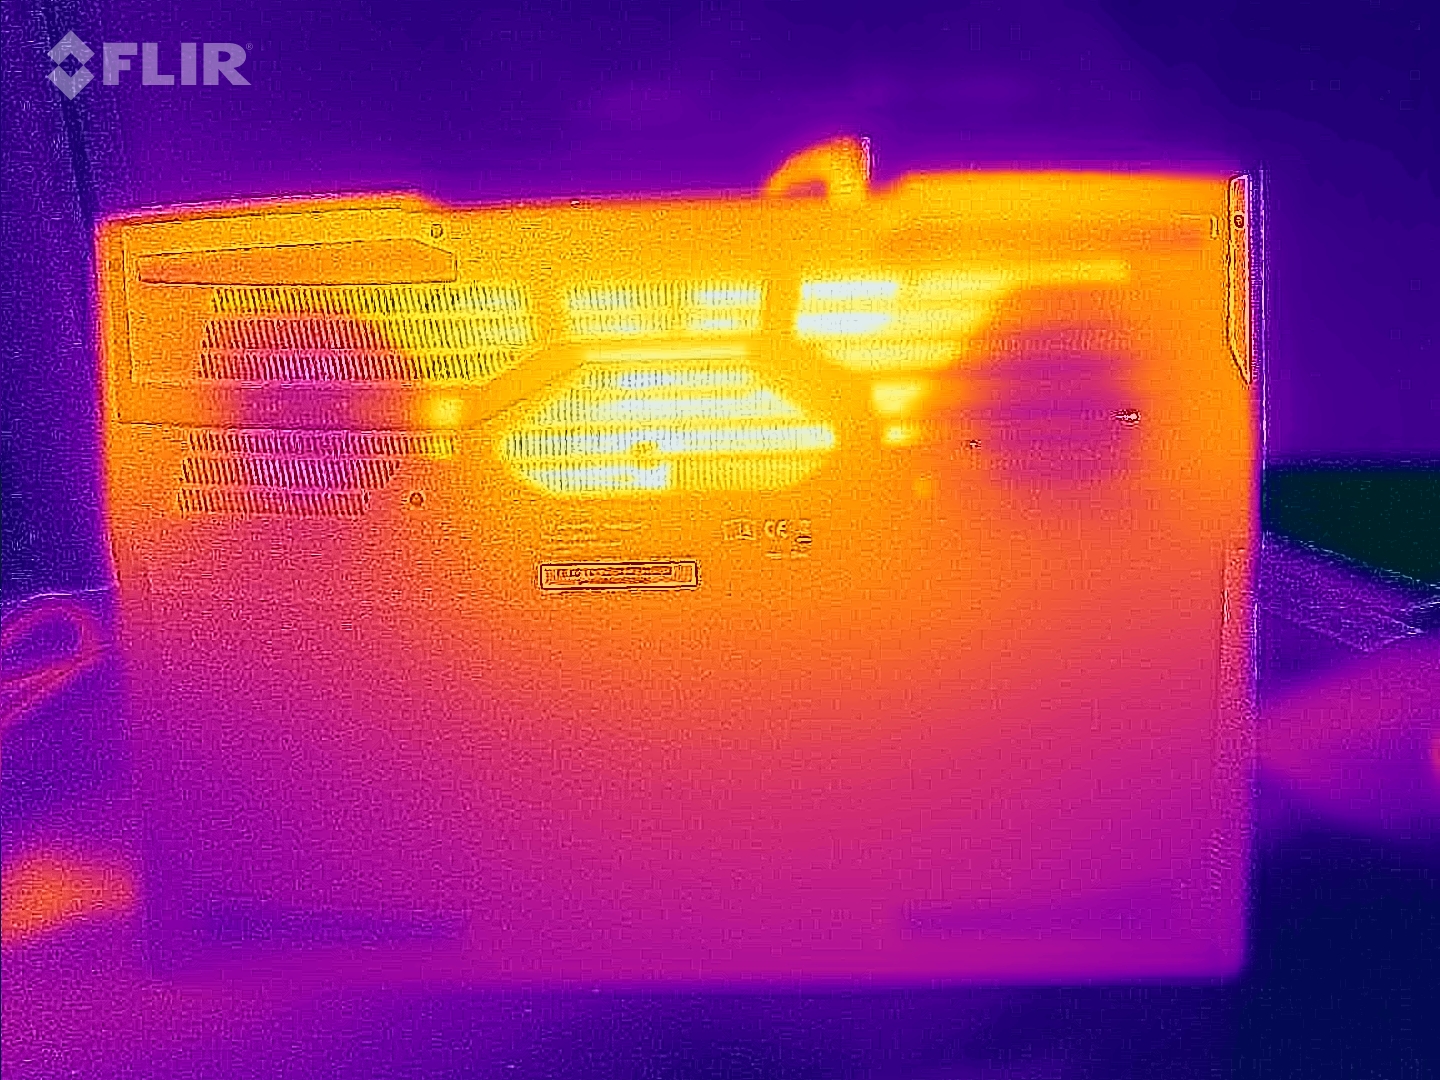
(-) Botten värms upp till maximalt 54 °C / 129 F, jämfört med genomsnittet av 43.2 °C / 110 F
(+) Vid tomgångsbruk är medeltemperaturen för ovansidan 28.1 °C / 83 F, jämfört med enhetsgenomsnittet på 33.9 °C / ### class_avg_f### F.
(-) När du spelar The Witcher 3 är medeltemperaturen för ovansidan 39.1 °C / 102 F, jämfört med enhetsgenomsnittet på 33.9 °C / ## #class_avg_f### F.
(+) Handledsstöden och pekplattan når maximal hudtemperatur (34 °C / 93.2 F) och är därför inte varma.
(-) Medeltemperaturen för handledsstödsområdet på liknande enheter var 28.8 °C / 83.8 F (-5.2 °C / -9.4 F).
| Medion Erazer Beast X40 2024 Intel Core i9-14900HX, NVIDIA GeForce RTX 4090 Laptop GPU | Asus ROG Strix Scar 17 G733PYV-LL053X AMD Ryzen 9 7945HX3D, NVIDIA GeForce RTX 4090 Laptop GPU | Schenker Key 17 Pro (Early 23) Intel Core i9-13900HX, NVIDIA GeForce RTX 4090 Laptop GPU | Asus ROG Strix Scar 18 G834JYR (2024) Intel Core i9-14900HX, NVIDIA GeForce RTX 4090 Laptop GPU | MSI Titan 18 HX A14VIG Intel Core i9-14900HX, NVIDIA GeForce RTX 4090 Laptop GPU | Medion Erazer Beast X40 Intel Core i9-13900HX, NVIDIA GeForce RTX 4090 Laptop GPU | |
|---|---|---|---|---|---|---|
| Heat | 14% | -11% | 4% | 5% | 1% | |
| Maximum Upper Side * (°C) | 47 | 40.1 15% | 57 -21% | 49 -4% | 37.8 20% | 48 -2% |
| Maximum Bottom * (°C) | 54 | 46.7 14% | 60 -11% | 47 13% | 37.6 30% | 52 4% |
| Idle Upper Side * (°C) | 30 | 26.5 12% | 32 -7% | 29 3% | 34.8 -16% | 30 -0% |
| Idle Bottom * (°C) | 32 | 27.7 13% | 34 -6% | 31 3% | 36 -13% | 31 3% |
* ... mindre är bättre
Högtalare
Stereohögtalarna ger överlag ett mycket bra ljud.
Medion Erazer Beast X40 2024 ljudanalys
(+) | högtalare kan spela relativt högt (88 dB)
Bas 100 - 315 Hz
(±) | reducerad bas - i genomsnitt 14.7% lägre än medianen
(±) | linjäriteten för basen är genomsnittlig (7.2% delta till föregående frekvens)
Mellan 400 - 2000 Hz
(+) | balanserad mellan - endast 3.7% från medianen
(+) | mids är linjära (5.8% delta till föregående frekvens)
Högsta 2 - 16 kHz
(+) | balanserade toppar - endast 2.8% från medianen
(+) | toppar är linjära (6.4% delta till föregående frekvens)
Totalt 100 - 16 000 Hz
(+) | det totala ljudet är linjärt (12.1% skillnad mot median)
Jämfört med samma klass
» 12% av alla testade enheter i den här klassen var bättre, 4% liknande, 84% sämre
» Den bästa hade ett delta på 6%, genomsnittet var 18%, sämst var 132%
Jämfört med alla testade enheter
» 10% av alla testade enheter var bättre, 2% liknande, 88% sämre
» Den bästa hade ett delta på 4%, genomsnittet var 23%, sämst var 134%
Energiförbrukning
Beast X40 bjuder inte på några överraskningar när det gäller energiförbrukning. Värdena ligger på en normal nivå för den installerade hårdvaran.
Witcher 3 -testet och stresstestet körs med något lägre energiförbrukning. Nätaggregatet på 330 W visar sig vara tillräckligt under stress.
| Av/Standby | |
| Låg belastning | |
| Hög belastning |
|
Förklaring:
min: | |
Power consumption: The Witcher 3 / Stress test
Power consumption: External monitor
Batteriets livslängd
Beast X40 uppnår en drifttid på 6:14 h i det praktiska WLAN-testet (illustration av belastningen vid åtkomst till webbplatser med hjälp av ett skript), vilket är ett anständigt värde.
Detta placerar X40 på samma nivå som sin föregångare.
För
Emot
Slutsats: Kraftpaket i hög prisklass
Medion Erazer Beast X40 kommer från den övre änden av prestandaskalan: RTX GeForce RTX 4090 och Core i9-14900HX levererar den kraft som krävs för spel, streaming, rendering och videoredigering. En kompromiss mellan prestanda och ljudnivå är möjlig. Med ett vattenkylningssystem som tillval (ca 200 €) kan man uppnå en liten prestandaökning och totalt sett lägre utsläpp.
Med Erazer Beast X40 levererar Medion en extremt kraftfull bärbar dator för spel.
På plussidan finns en högkvalitativ 17-tumsskärm (2 560 x 1 600 pixlar, 240 Hz, G-Sync, sRGB) i 16:10-format, ett taktilt mekaniskt tangentbord och en Thunderbolt 4-port. Den senare öppnar upp för expansionsalternativ (extern GPU, dockningslösning), stöder Power Delivery och kan mata ut en DisplayPort-signal. Den har också en anständig batteritid.
Skillnaderna mellan den nuvarande och förra årets förra årets X40 är inte särskilt stora. Tack vare något högre klockhastigheter levererar Core i9-14900HX något mer prestanda med samma antal kärnor och trådar än Core i9-13900HX av föregående års modell. Den senare skulle vara ett (billigare) alternativ: Medion säljer den för närvarande för knappt 3 500 euro.
Ett annat alternativ skulle vara Asus ROG Strix Scar 17 X3D. Den erbjuder en jämförbar prestandanivå och en skärm med DCI-P3-täckning. Asus bärbara dator erbjuder dock inte Thunderbolt 4. Den är också sämre när det gäller batteritid.
Pris och tillgänglighet
Medion Erazer Beast X40 (2024) är tillgänglig från Medion-butiken och Cyberport.de till ett pris under 4 000 euro.
Medion Erazer Beast X40 2024
- 02/21/2024 v7 (old)
Sascha Mölck
Genomskinlighet
Valet av enheter som ska granskas görs av vår redaktion. Testprovet gavs till författaren som ett lån av tillverkaren eller återförsäljaren för denna recension. Långivaren hade inget inflytande på denna recension och inte heller fick tillverkaren en kopia av denna recension innan publiceringen. Det fanns ingen skyldighet att publicera denna recension. Som ett oberoende medieföretag är Notebookcheck inte föremål för auktoritet från tillverkare, återförsäljare eller förlag.
This is how Notebookcheck is testingEvery year, Notebookcheck independently reviews hundreds of laptops and smartphones using standardized procedures to ensure that all results are comparable. We have continuously developed our test methods for around 20 years and set industry standards in the process. In our test labs, high-quality measuring equipment is utilized by experienced technicians and editors. These tests involve a multi-stage validation process. Our complex rating system is based on hundreds of well-founded measurements and benchmarks, which maintains objectivity.
Price comparison
