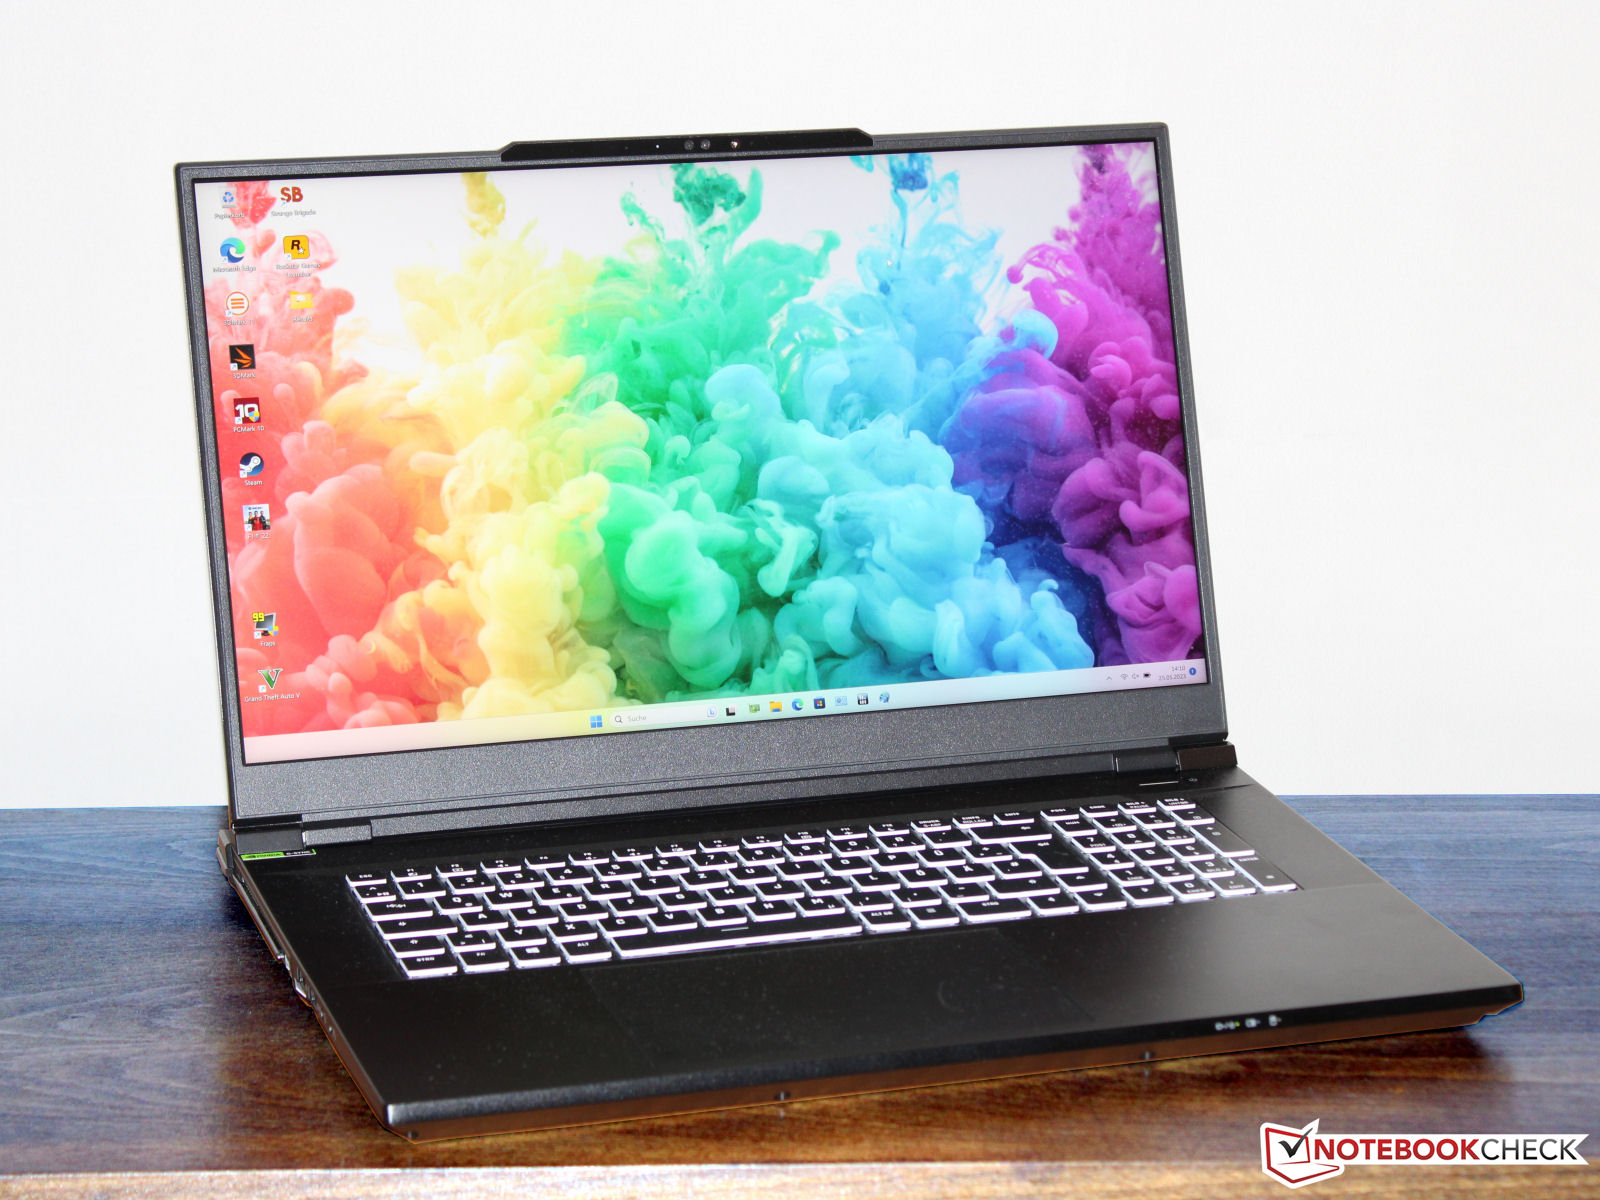
Schenker Key 17 Pro (Tidig 23) recension: 4k gaming notebook med Core i9 och RTX 4090
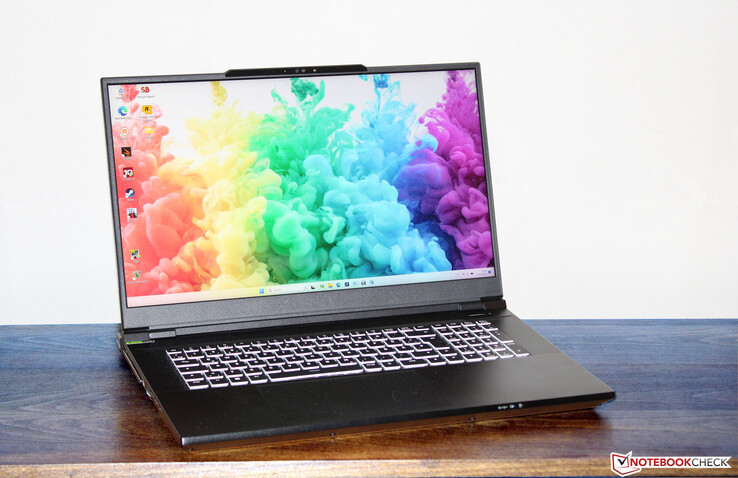
Den kraftfulla Key 17 Pro riktar sig till kreatörer och spelare. Raptor Lake och Ada Lovelace ger den nödvändiga datorkraften i den bärbara datorn, som har en Core i9-13900HX och enGeForce RTX 4090och är baserad på en Clevo barebone (X370SNW-G). Den konkurrerar mot enheter som t.ex MSI Stealth 17 Studio A13VH, den Asus ROG Strix Scar 17 G733PY, den Aorus 17X AZF och Medion Erazer Beast X40.
Potentiella konkurrenter i jämförelse
Gradering | Datum | Modell | Vikt | Höjd | Storlek | Upplösning | Pris |
|---|---|---|---|---|---|---|---|
| 85.5 % v7 (old) | 06/2023 | Schenker Key 17 Pro (Early 23) i9-13900HX, GeForce RTX 4090 Laptop GPU | 3.4 kg | 24.9 mm | 17.30" | 3840x2160 | |
| 89.2 % v7 (old) | 04/2023 | MSI Stealth 17 Studio A13VH-014 i9-13900H, GeForce RTX 4080 Laptop GPU | 3 kg | 21.3 mm | 17.30" | 3840x2160 | |
| 88.3 % v7 (old) | 04/2023 | Asus ROG Strix Scar 17 G733PY-XS96 R9 7945HX, GeForce RTX 4090 Laptop GPU | 2.9 kg | 28.3 mm | 17.30" | 2560x1440 | |
| 86 % v7 (old) | 04/2023 | Aorus 17X AZF i9-13900HX, GeForce RTX 4090 Laptop GPU | 2.9 kg | 21.8 mm | 17.30" | 2560x1440 | |
| 88.4 % v7 (old) | 03/2023 | Medion Erazer Beast X40 i9-13900HX, GeForce RTX 4090 Laptop GPU | 2.9 kg | 33 mm | 17.00" | 2560x1600 |
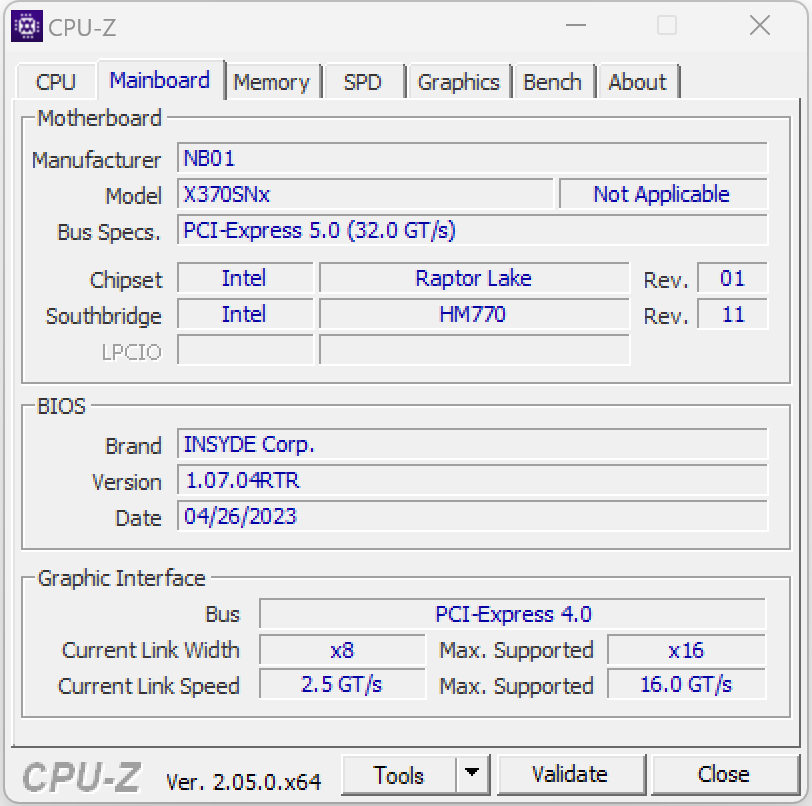
Fodral och specifikationer - Clevo barebone erbjuder Thunderbolt 4
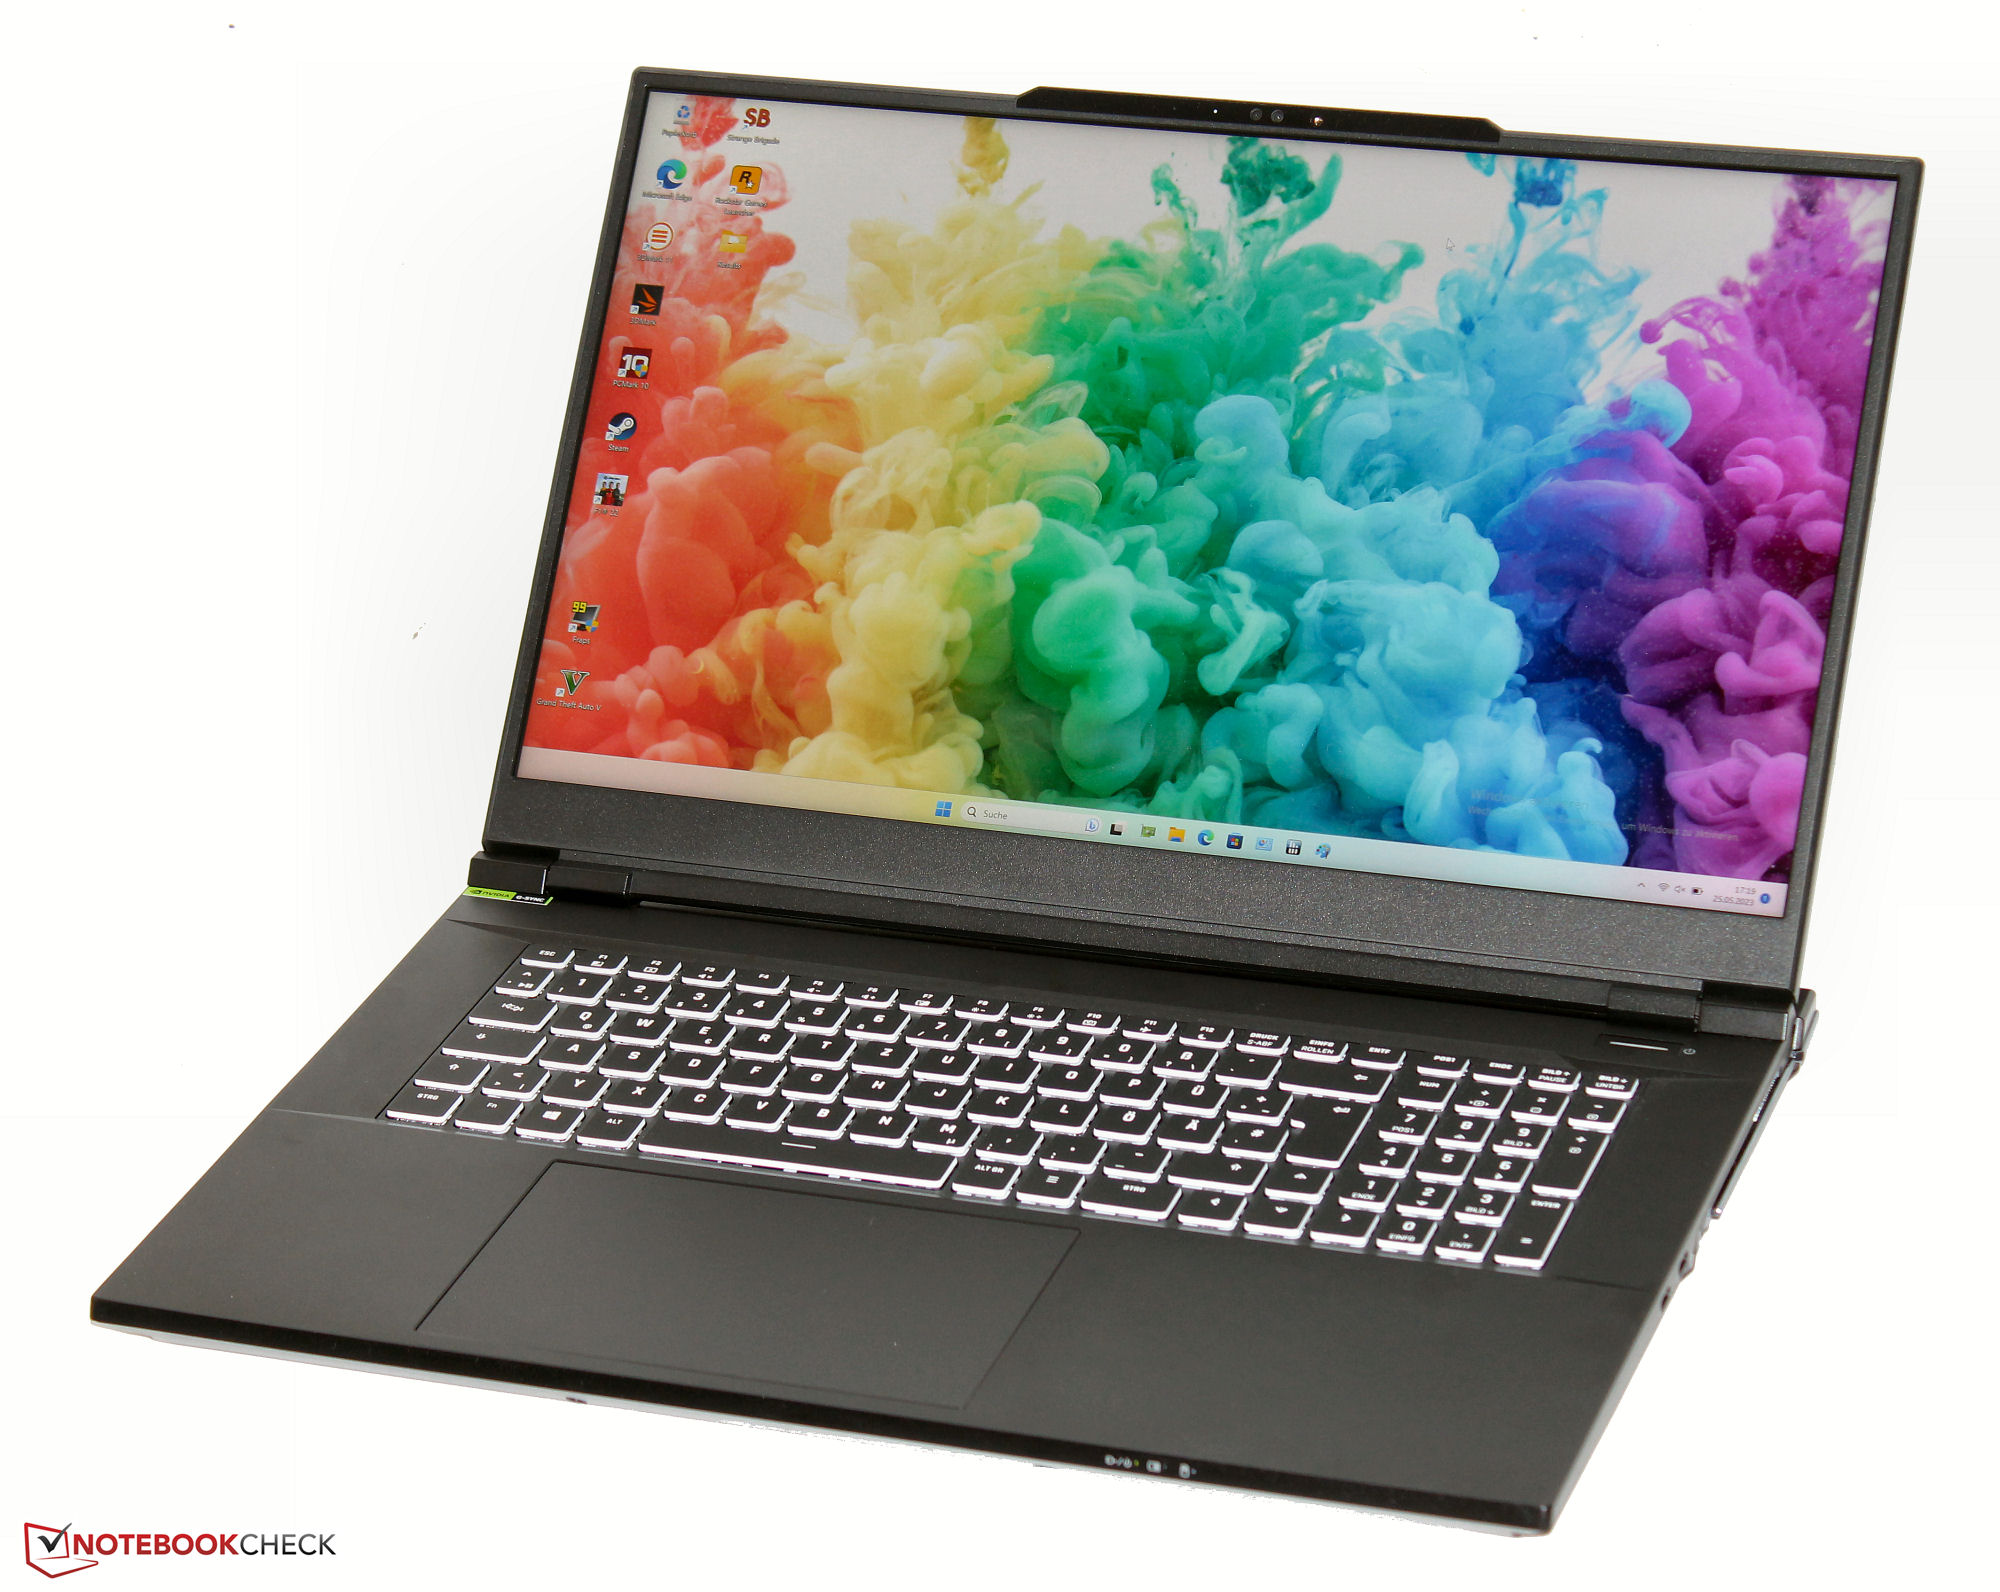
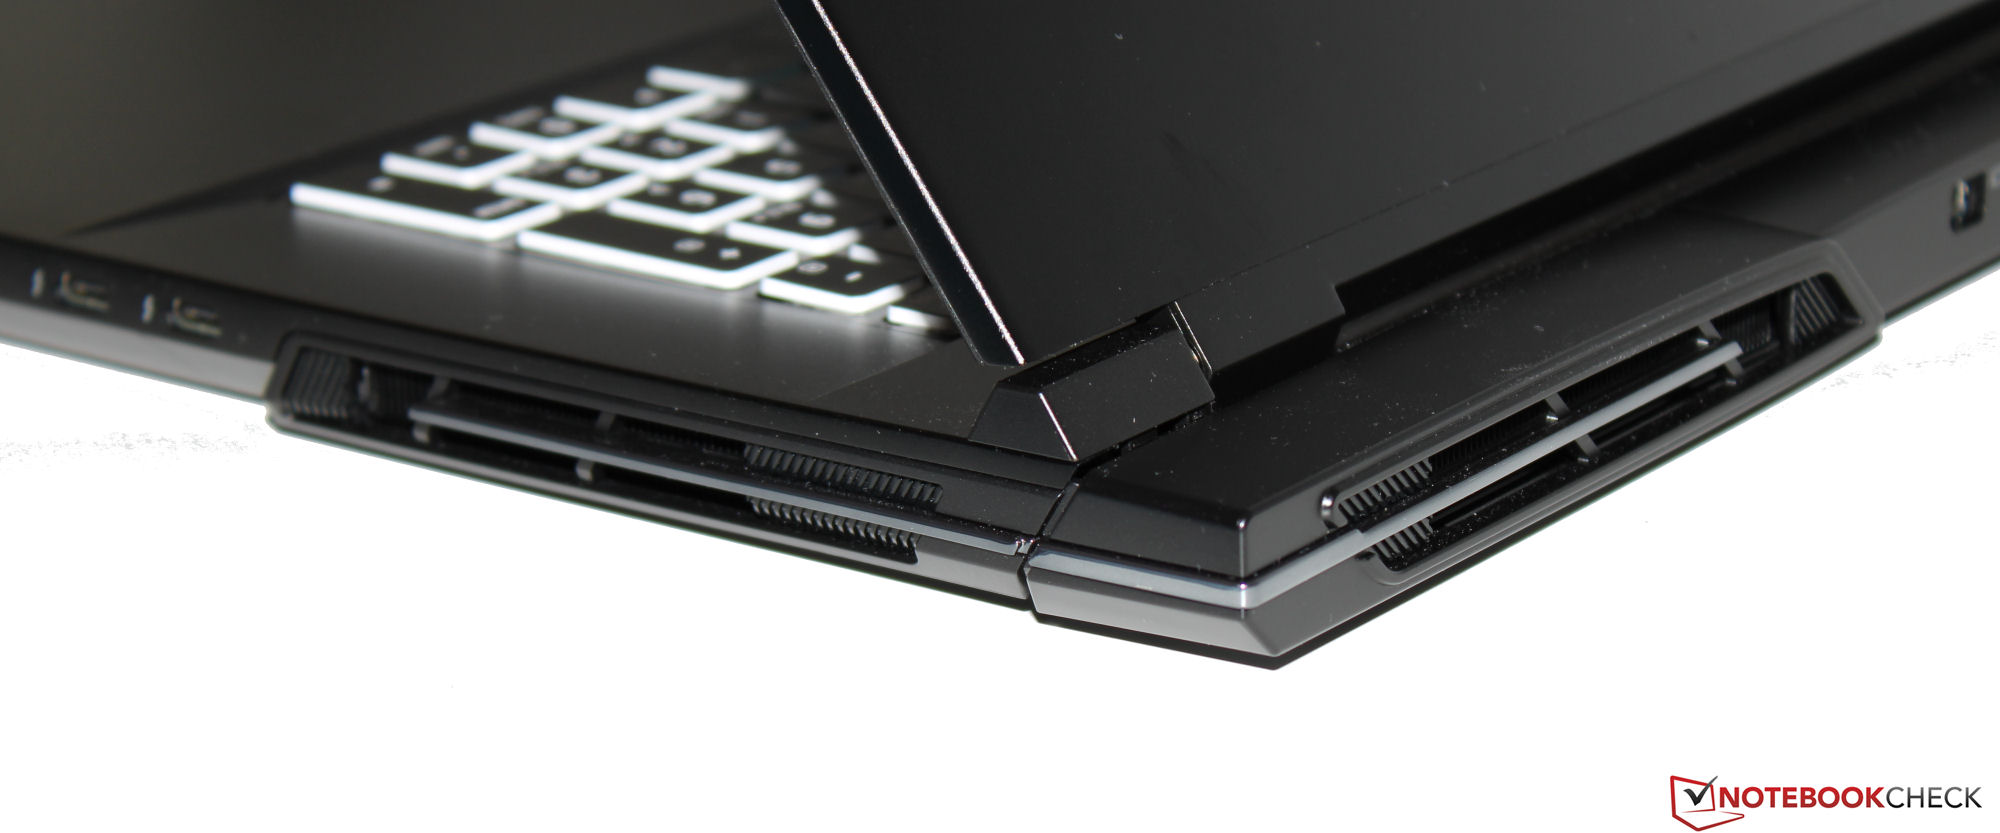
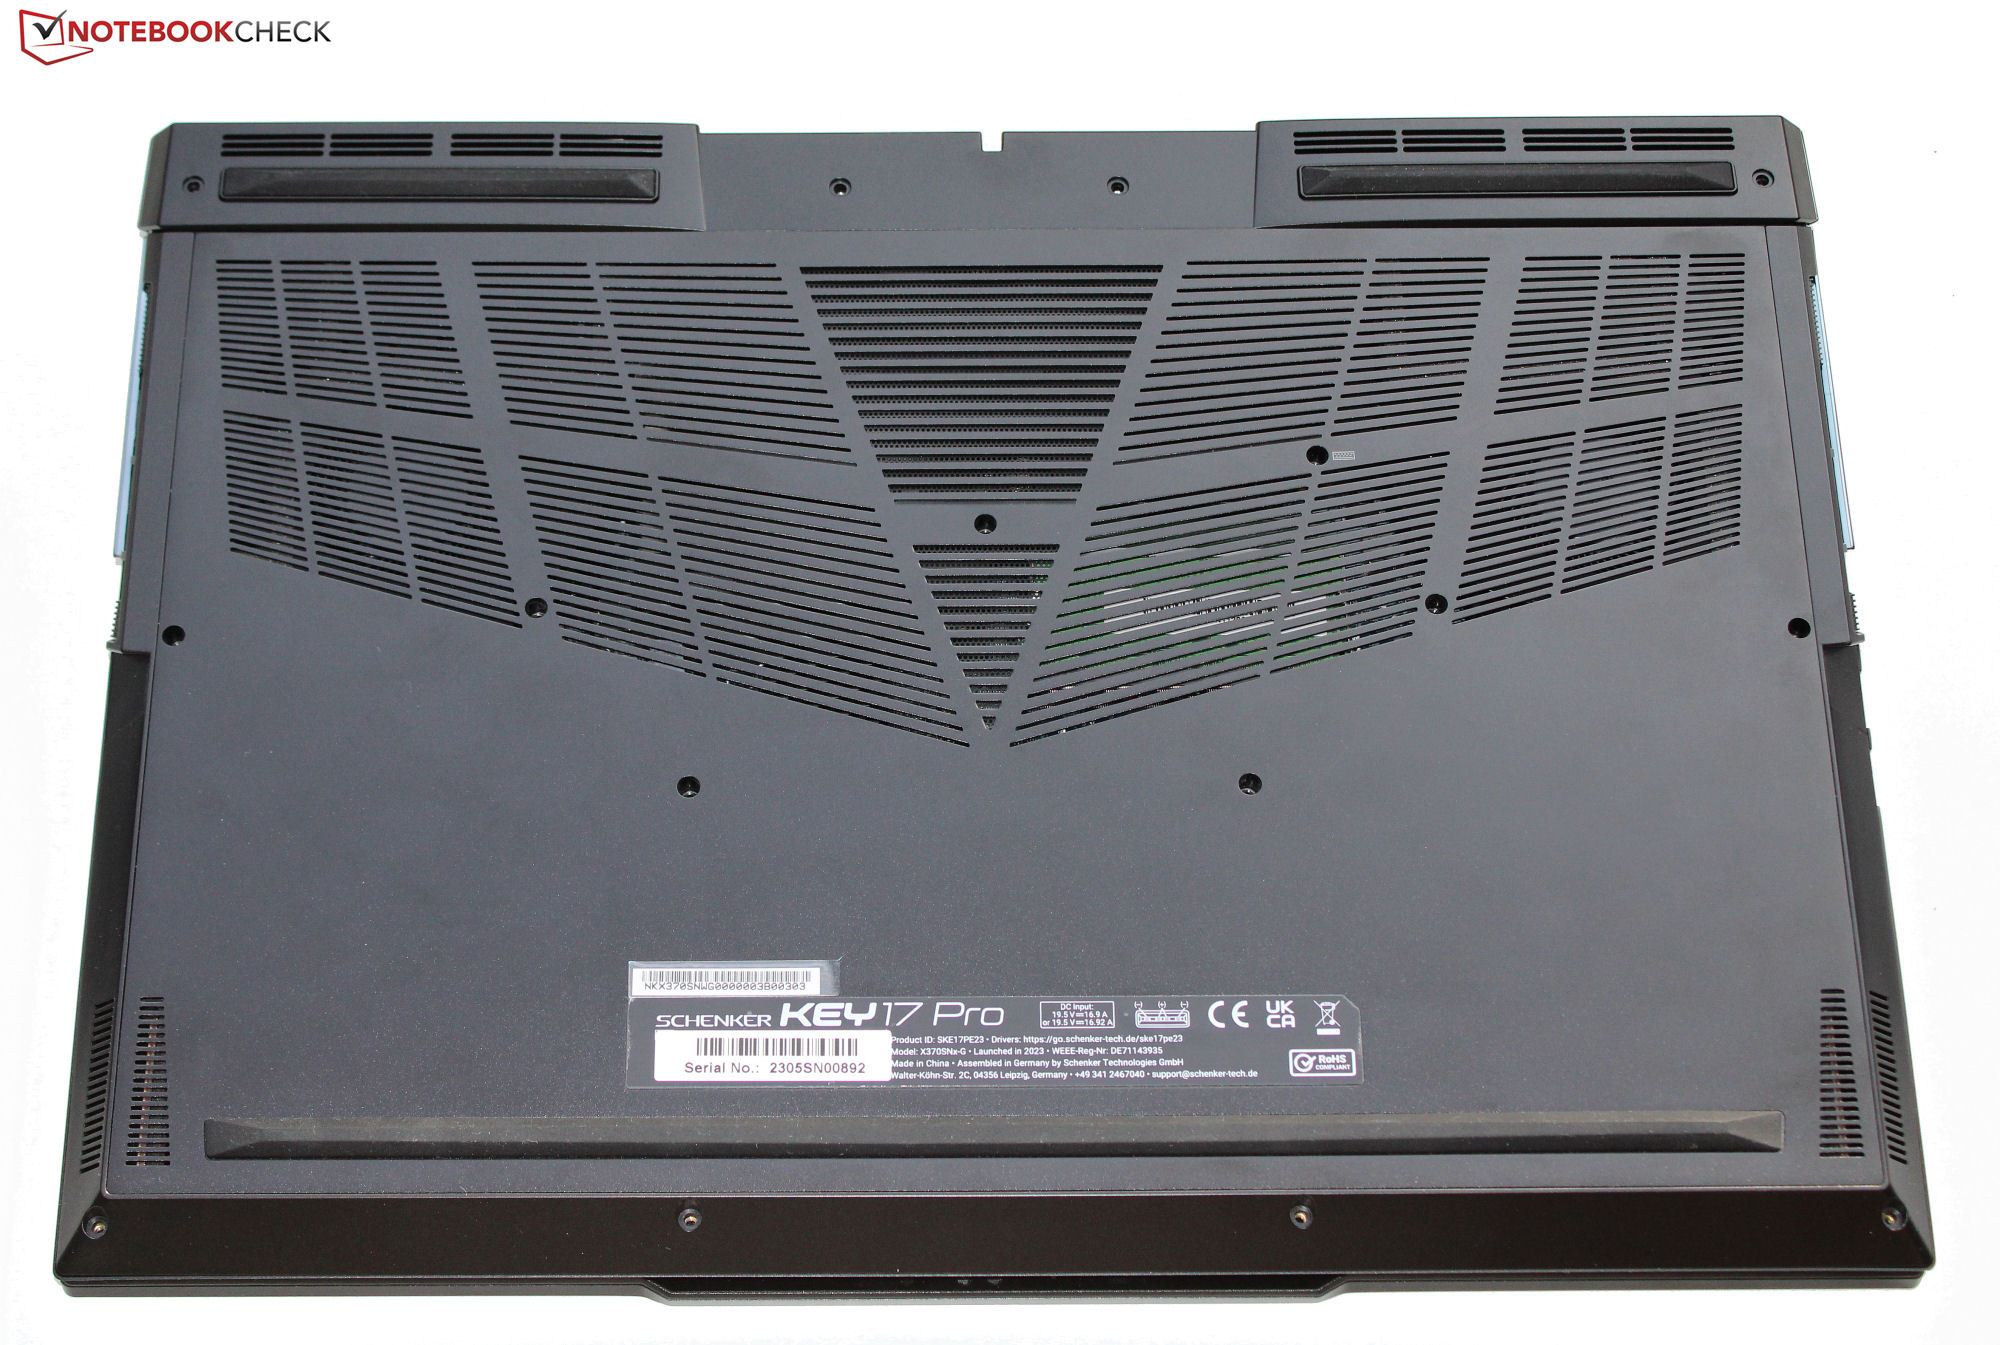
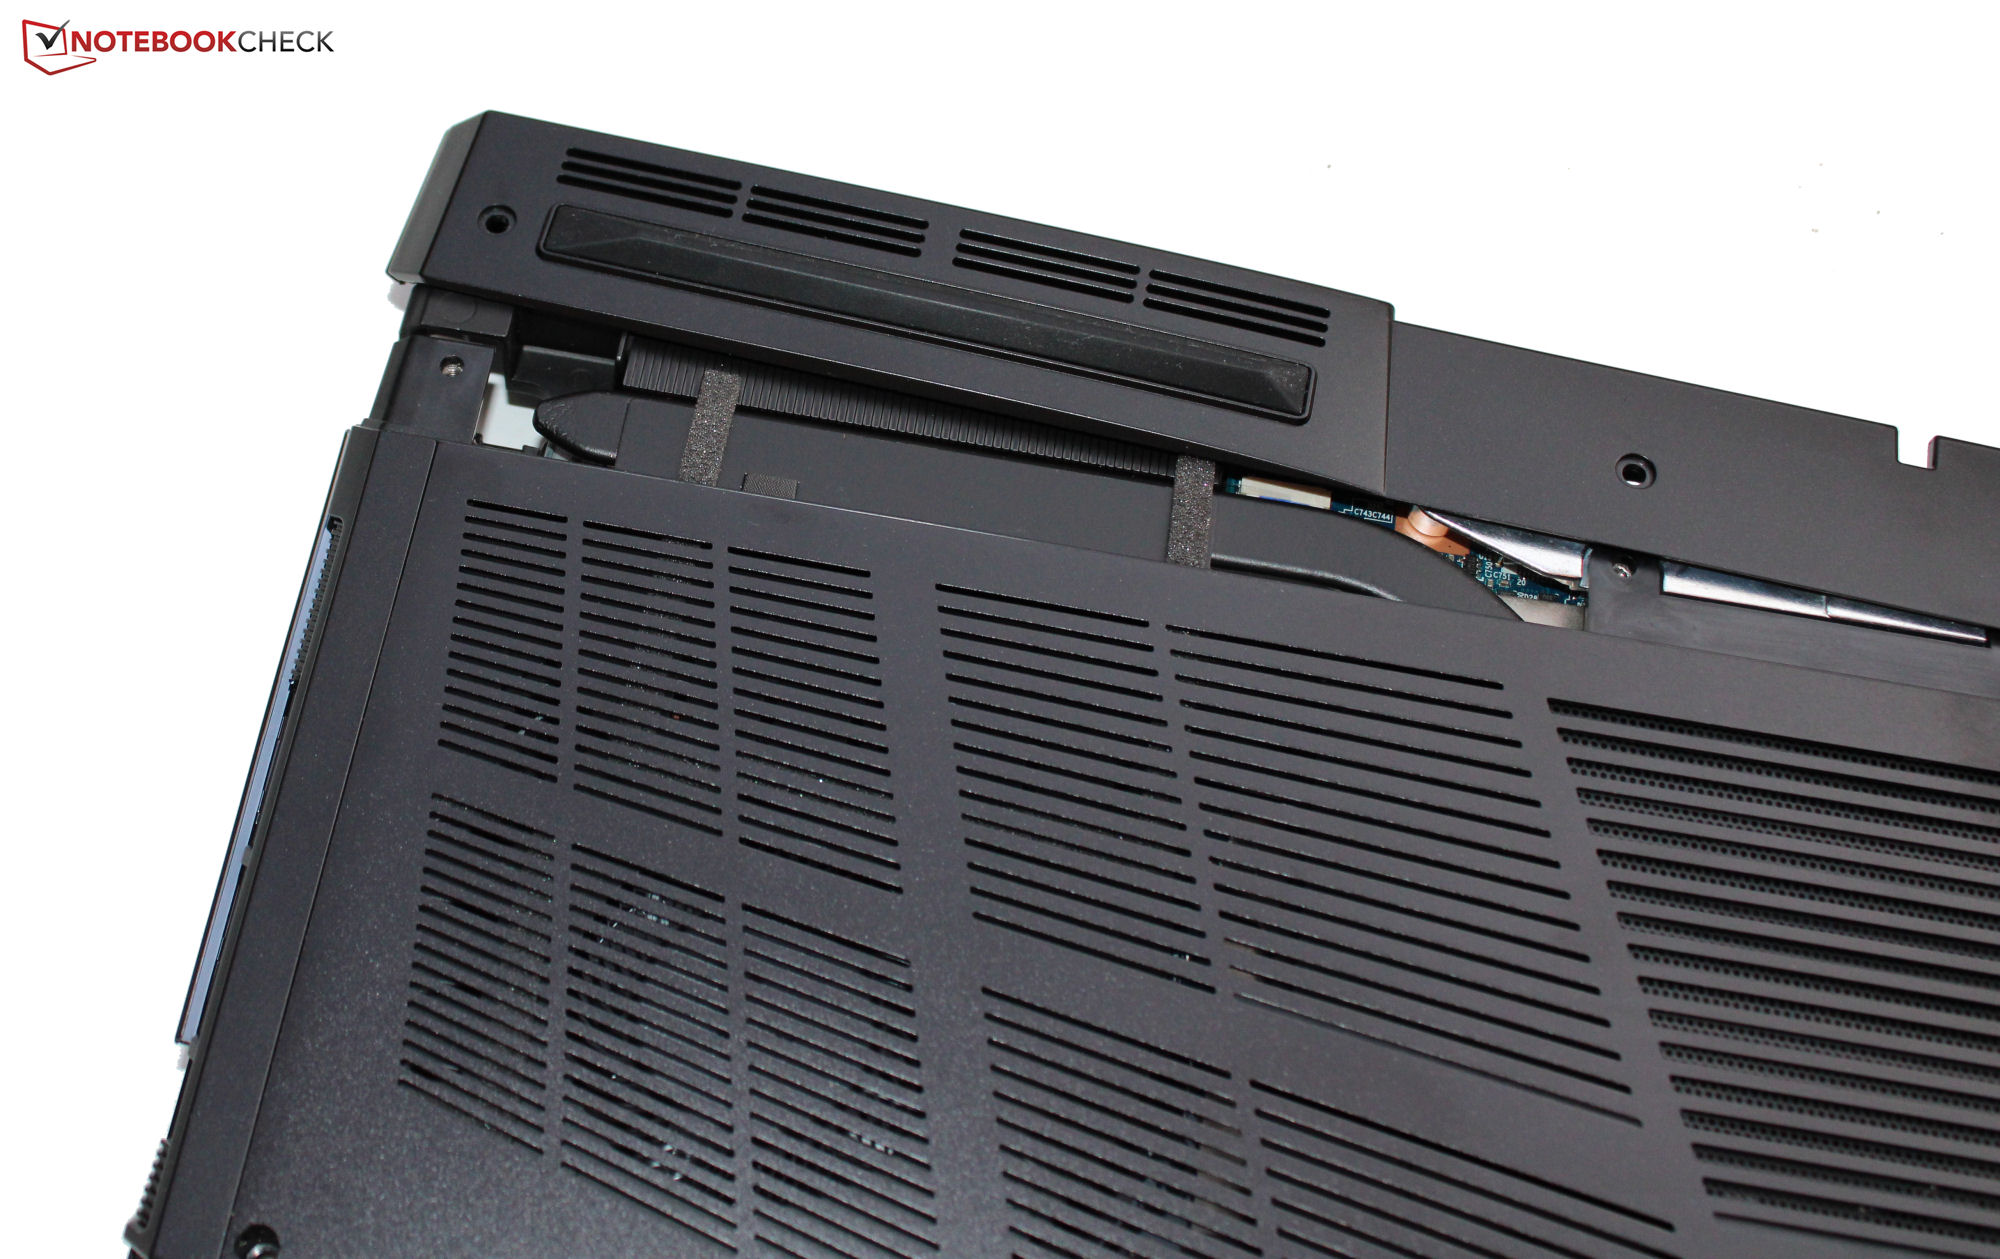
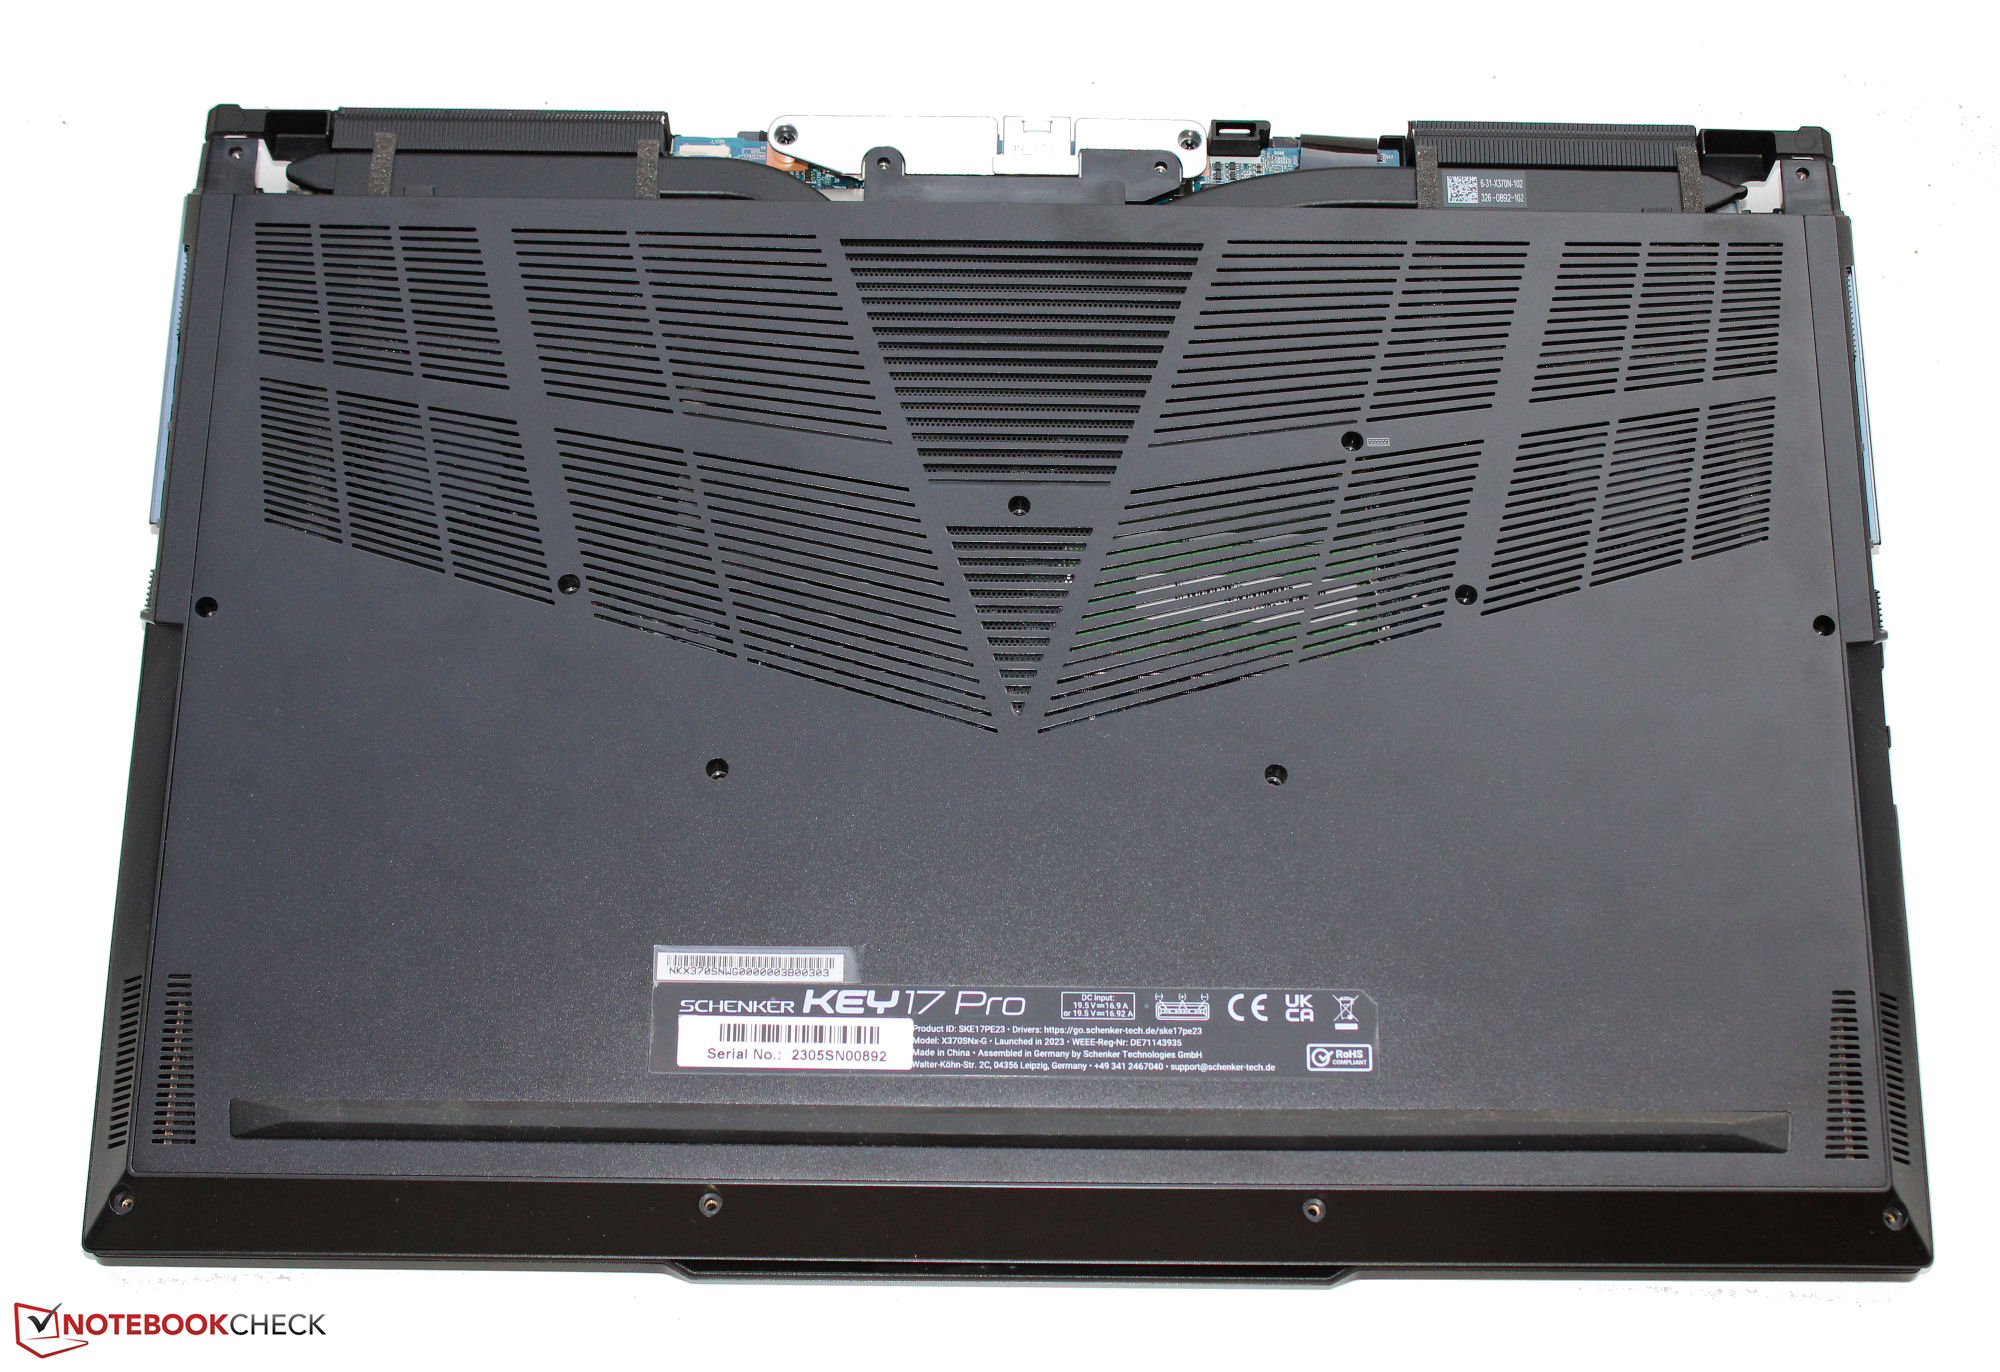
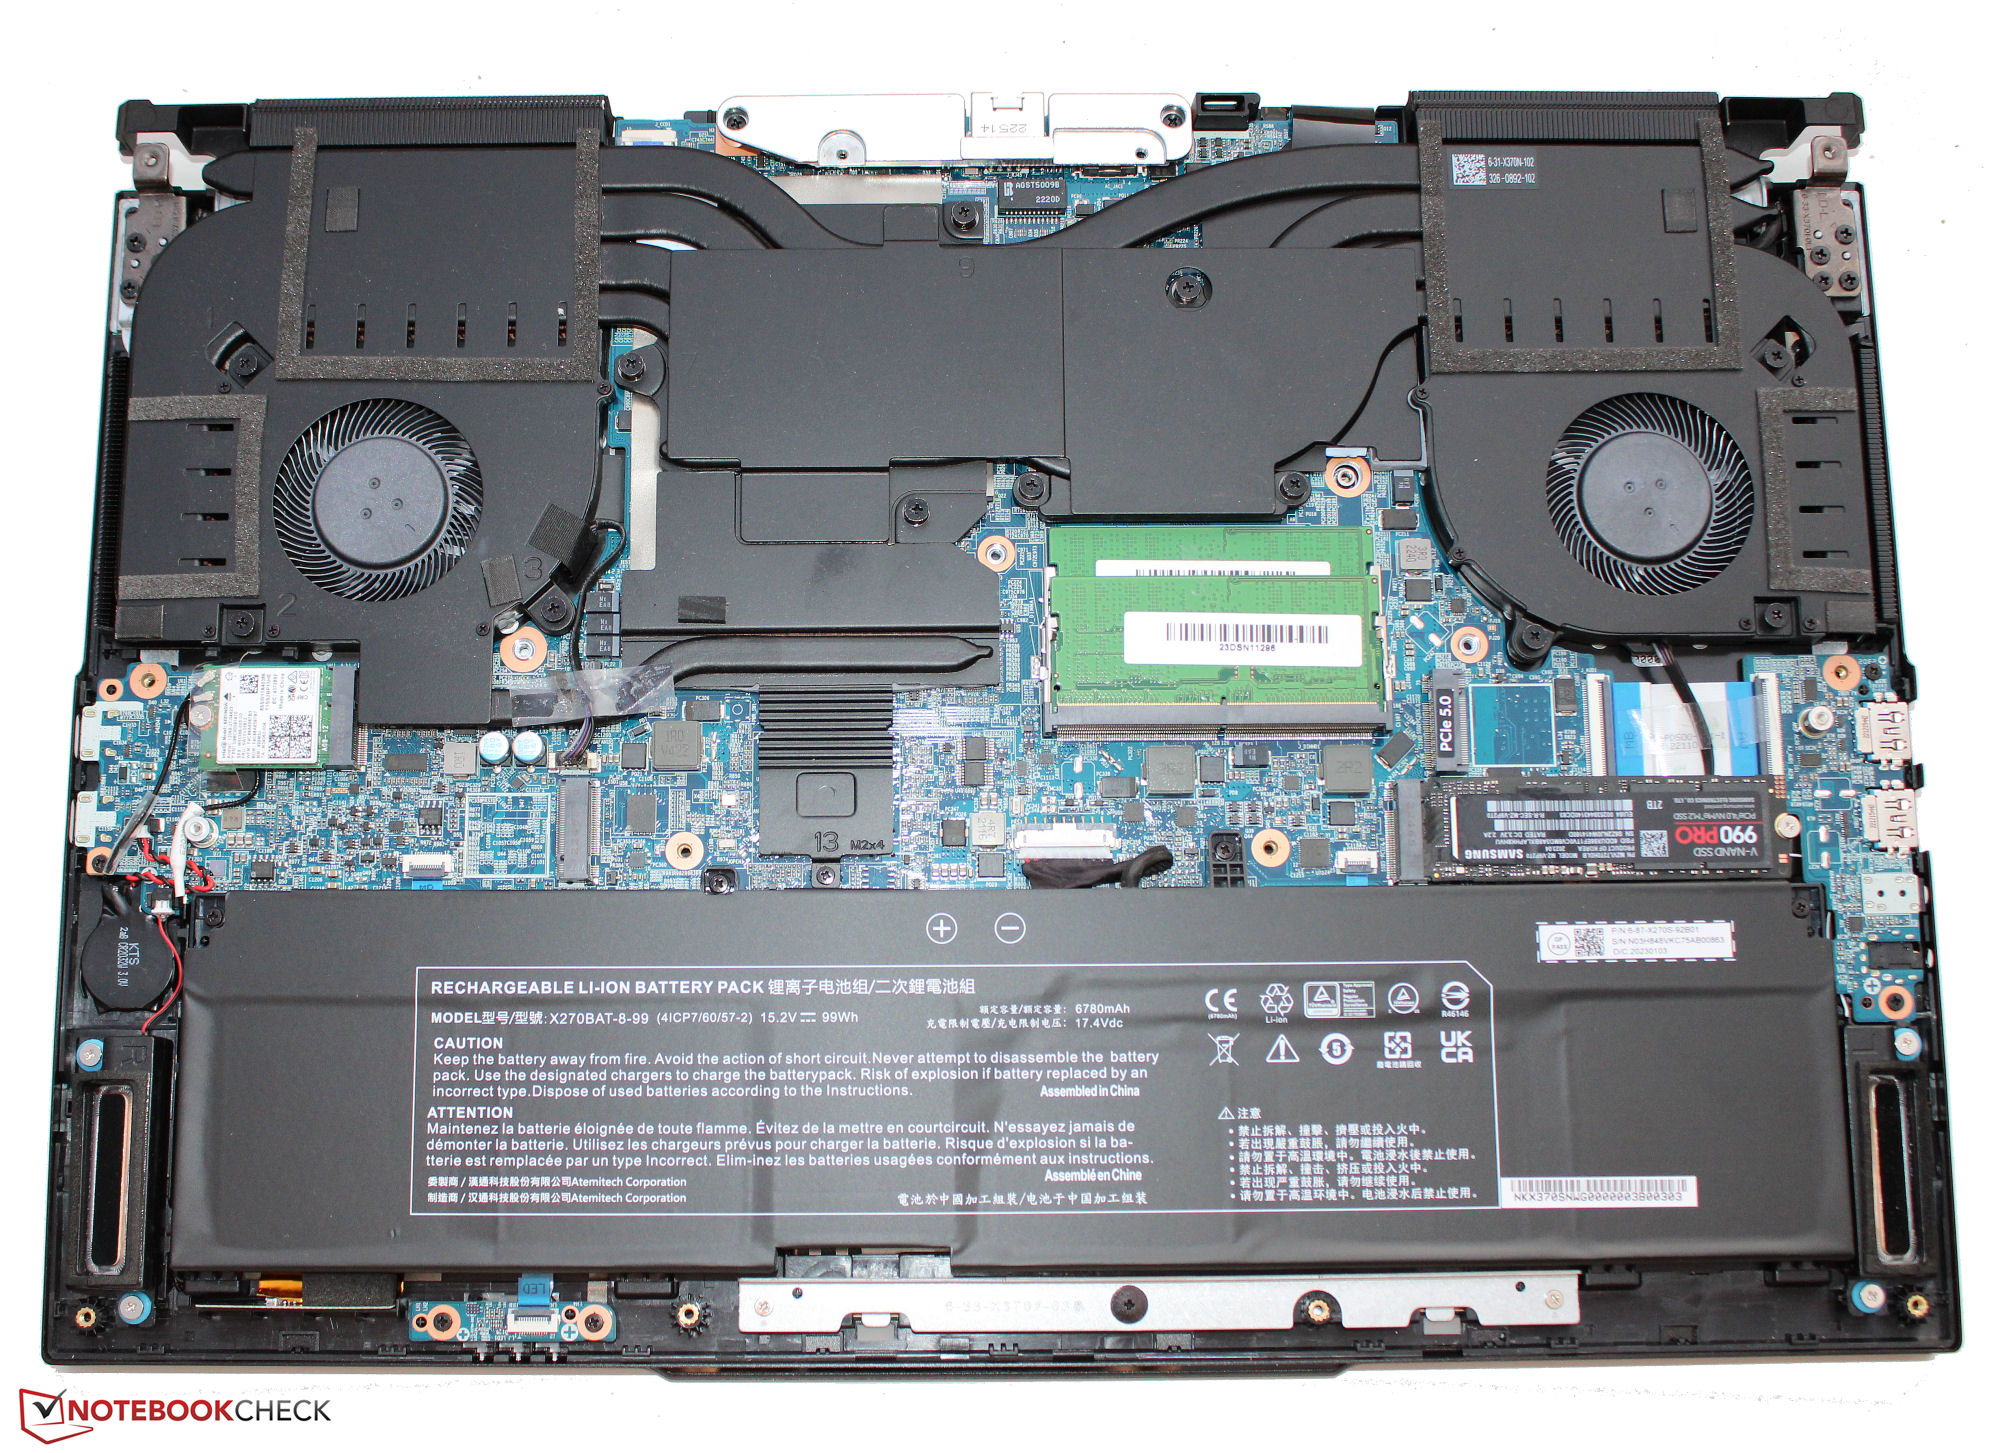
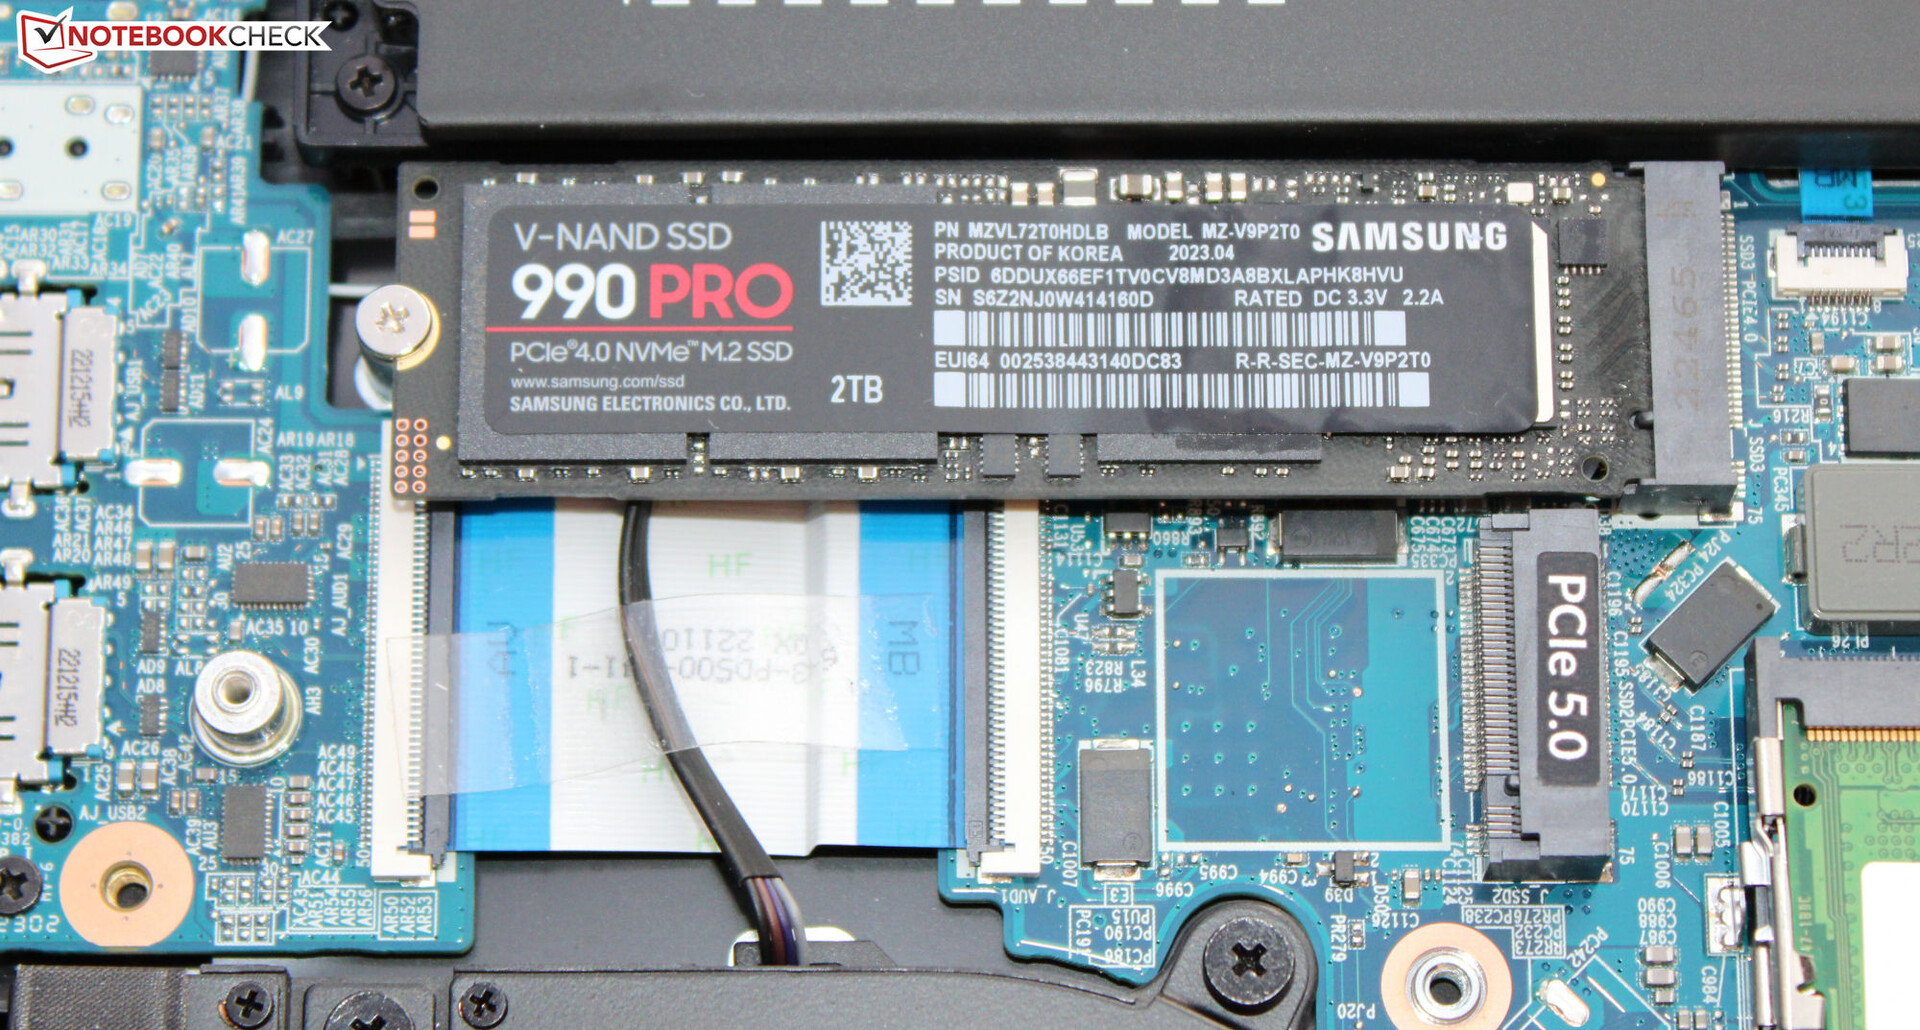
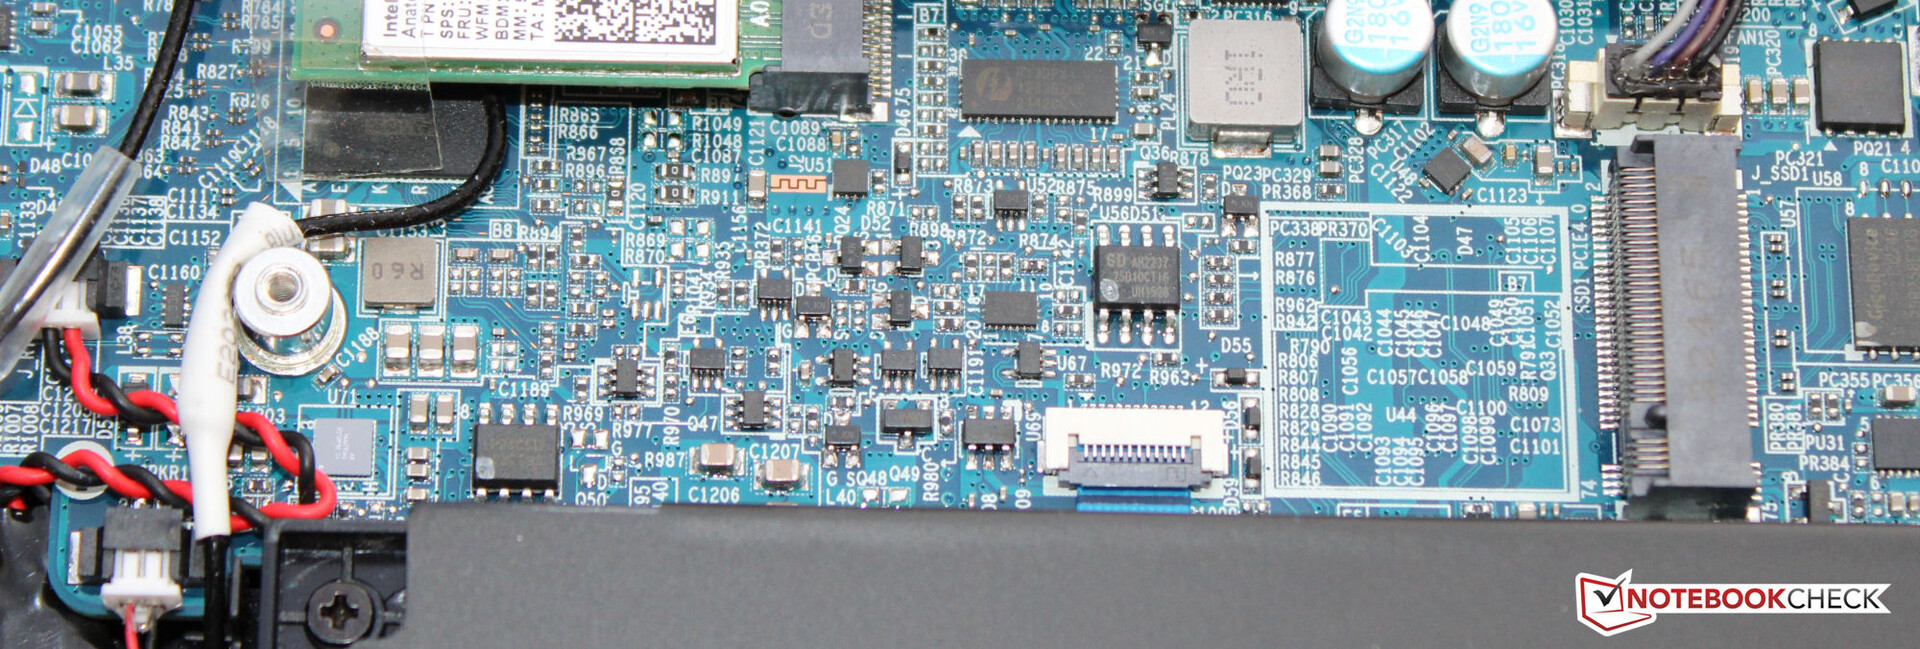
Det subtila, mattsvarta metallchassit på vår granskningsenhet uppvisar inga problem med utförandet. Basen böjer sig knappt alls, och locket har en liten men mycket acceptabel eftergivlighet. Den bärbara datorns batteri (fastskruvat, inte fastlimmat) och andra interna delar är åtkomliga när du tar bort det tvådelade bottenlocket.
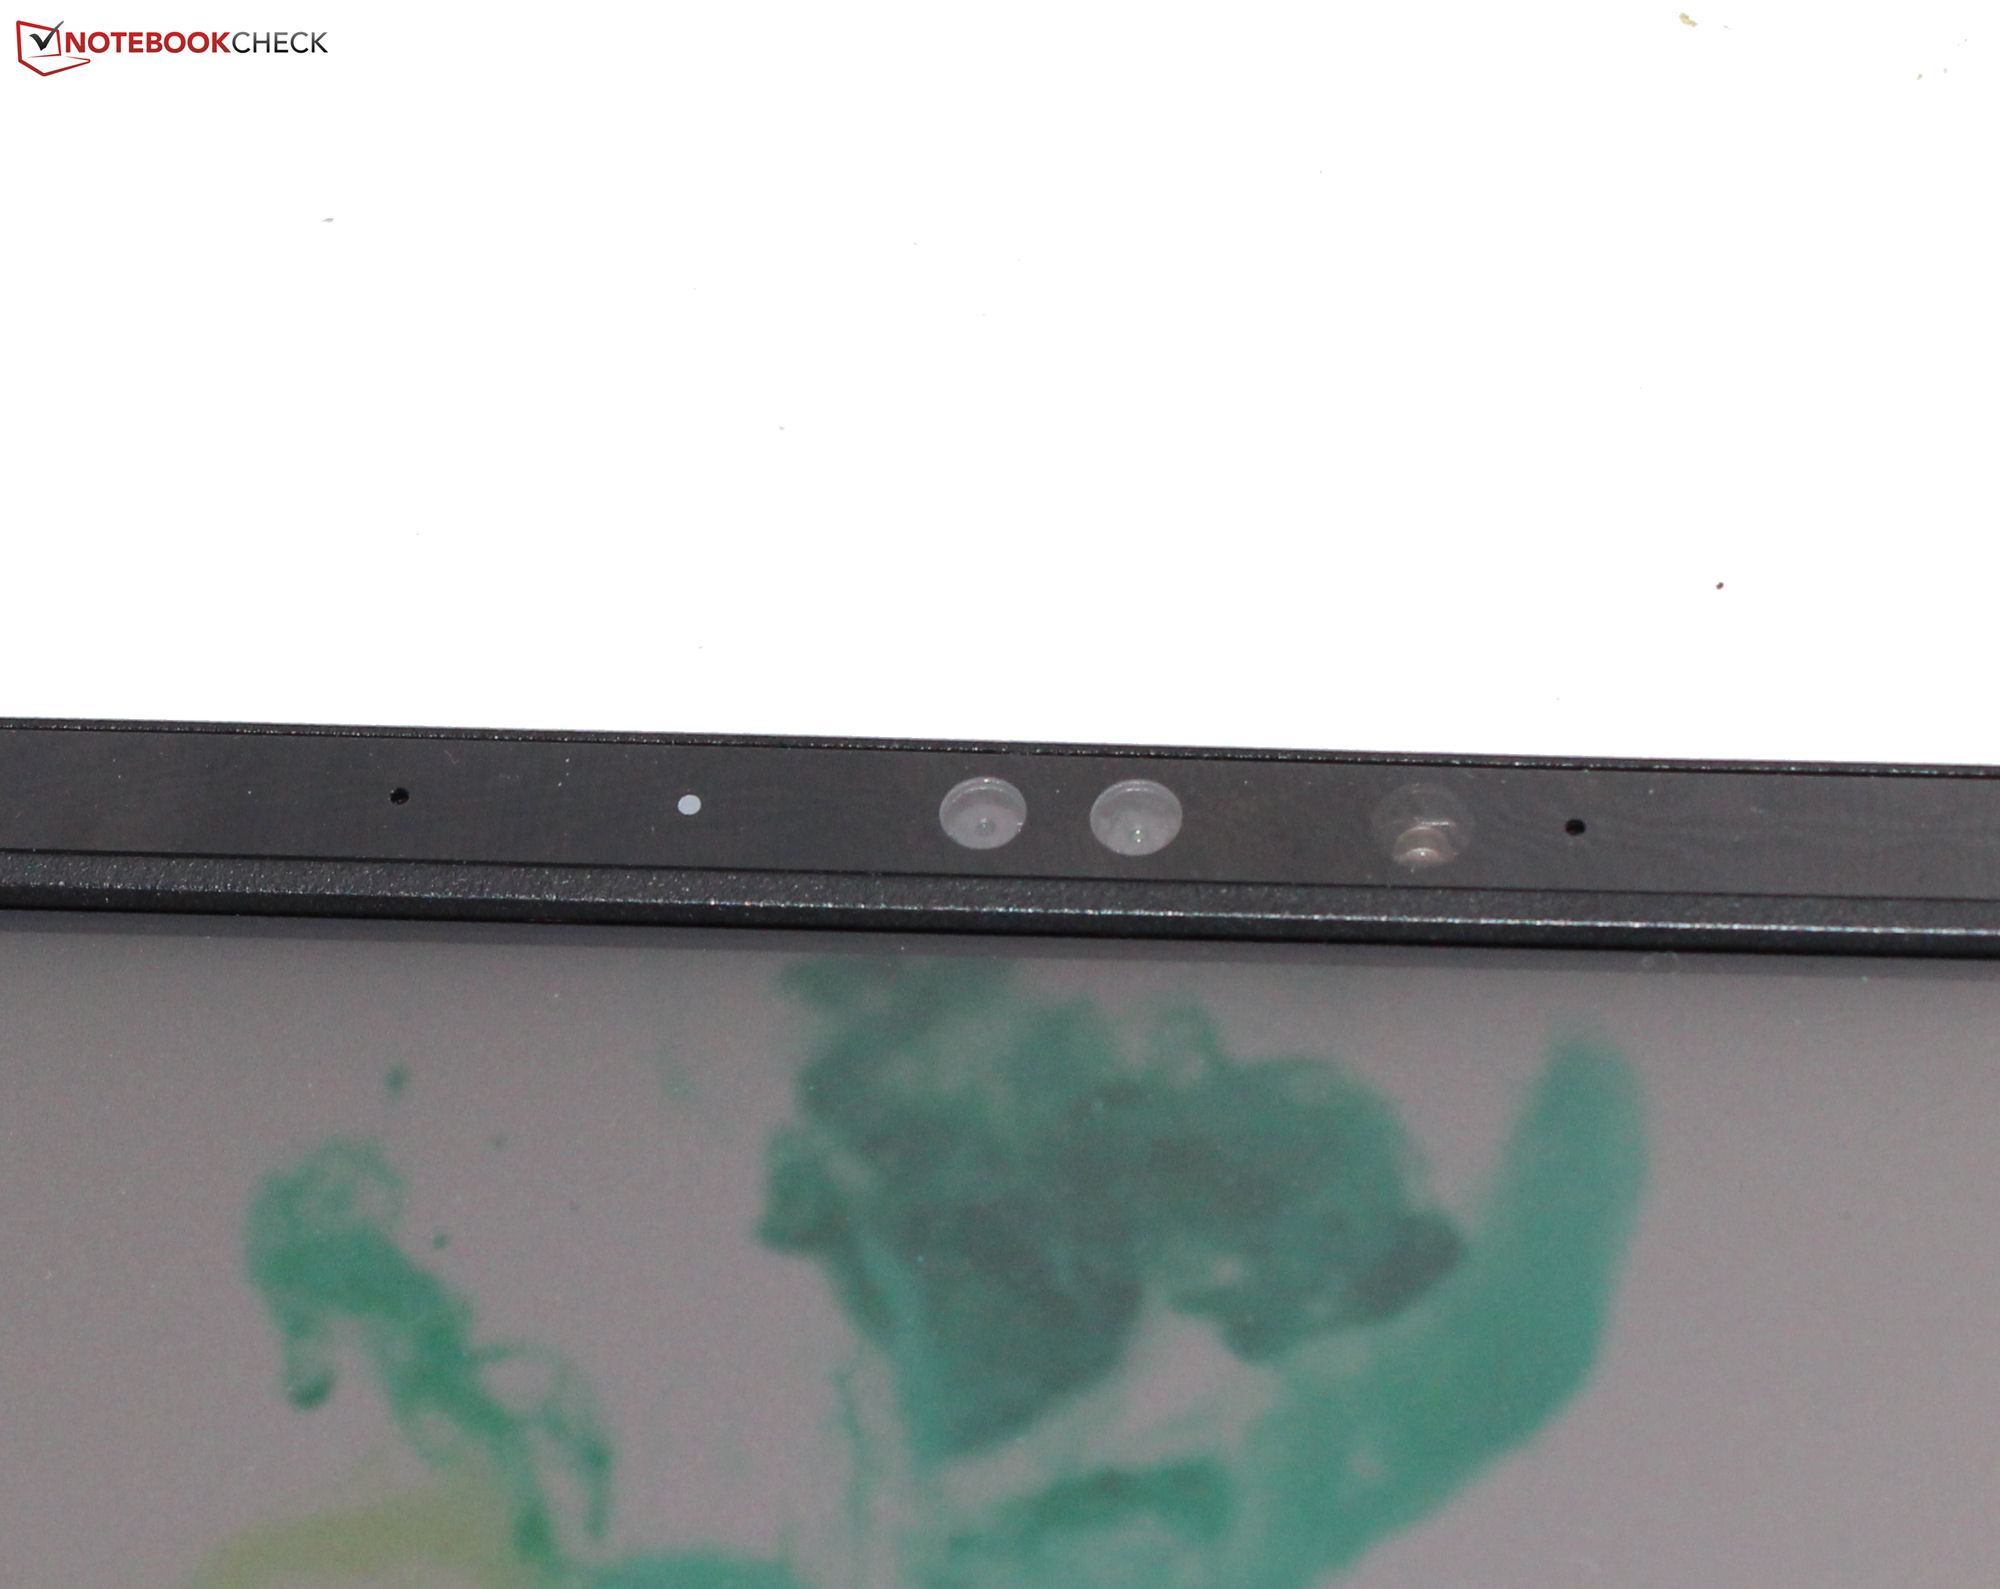
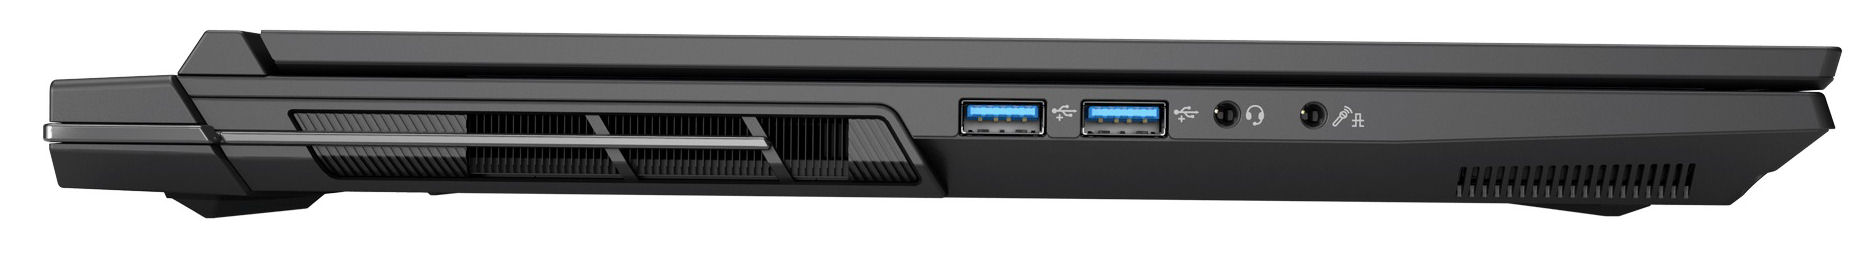
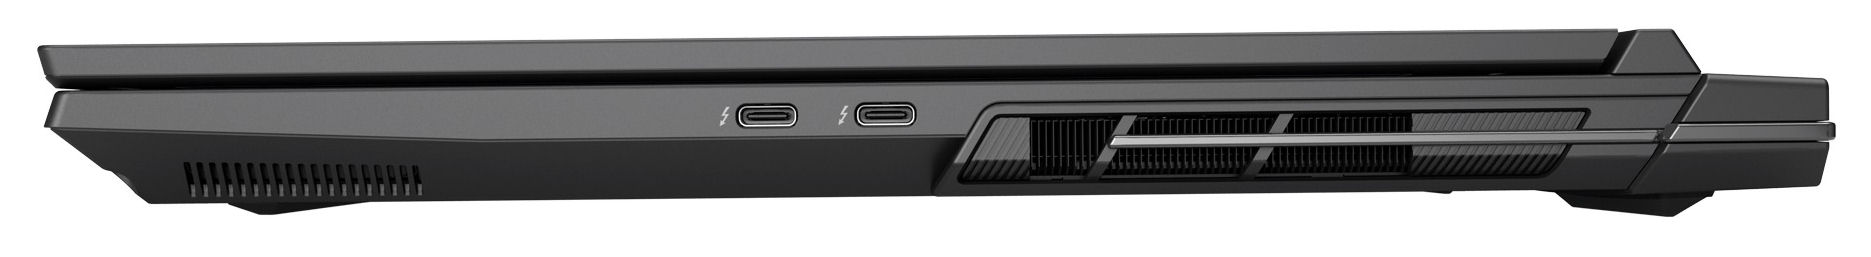
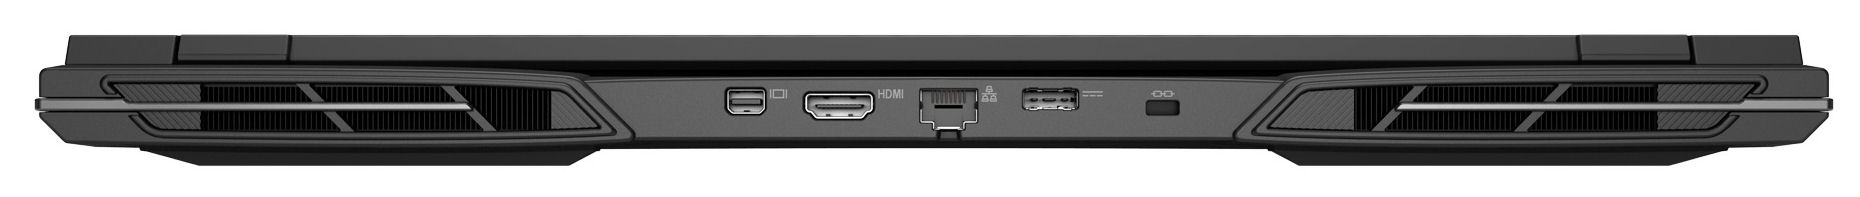
Key har två USB-A-portar (USB 3.2 Gen 2) och två USB-C-portar (Thunderbolt 4). Endast en av Thunderbolt 4-portarna har stöd för Power Delivery, men båda kan mata ut en DisplayPort-signal. Den bärbara datorn har totalt fyra videoutgångar (1x HDMI, 3x DP). Tyvärr levereras enheten inte med en kortläsare, och webbkameran (2,1 MP, maximal upplösning på 1 920 x 1 080, ingen sekretesslucka) är inget att skriva hem om.
Tack vare sitt Wi-Fi 6E-kort (Intel AX211) kan Key 17 Pro nå utmärkta Wi-Fi-datahastigheter under idealiska förhållanden (dvs. inga andra Wi-Fi-enheter i närheten, kort avstånd mellan den bärbara datorn och serverdatorn). Trådbundna anslutningar hanteras av en Killer E3100X-styrenhet (2,5 Gbit/s).

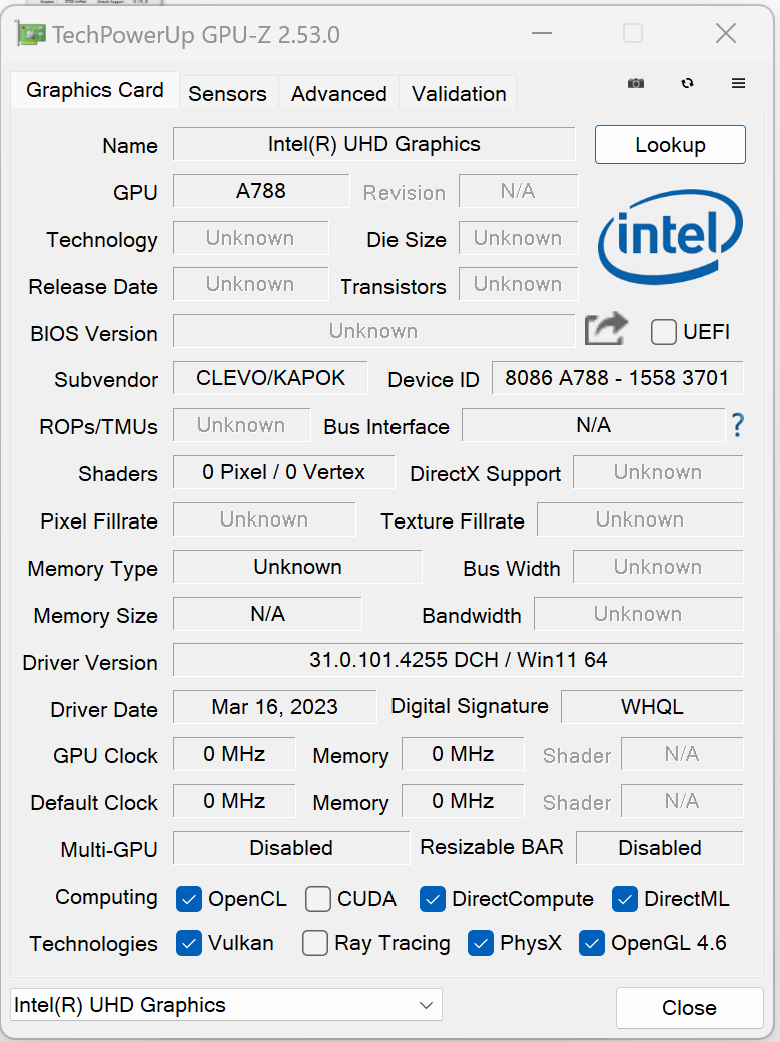
 GeForce RTX 4090 Laptop GPU, i9-13900HX, Samsung 990 Pro 2 TB MZVL72T0HDLB")
 GeForce RTX 4090 Laptop GPU, i9-13900HX, Samsung 990 Pro 2 TB MZVL72T0HDLB")
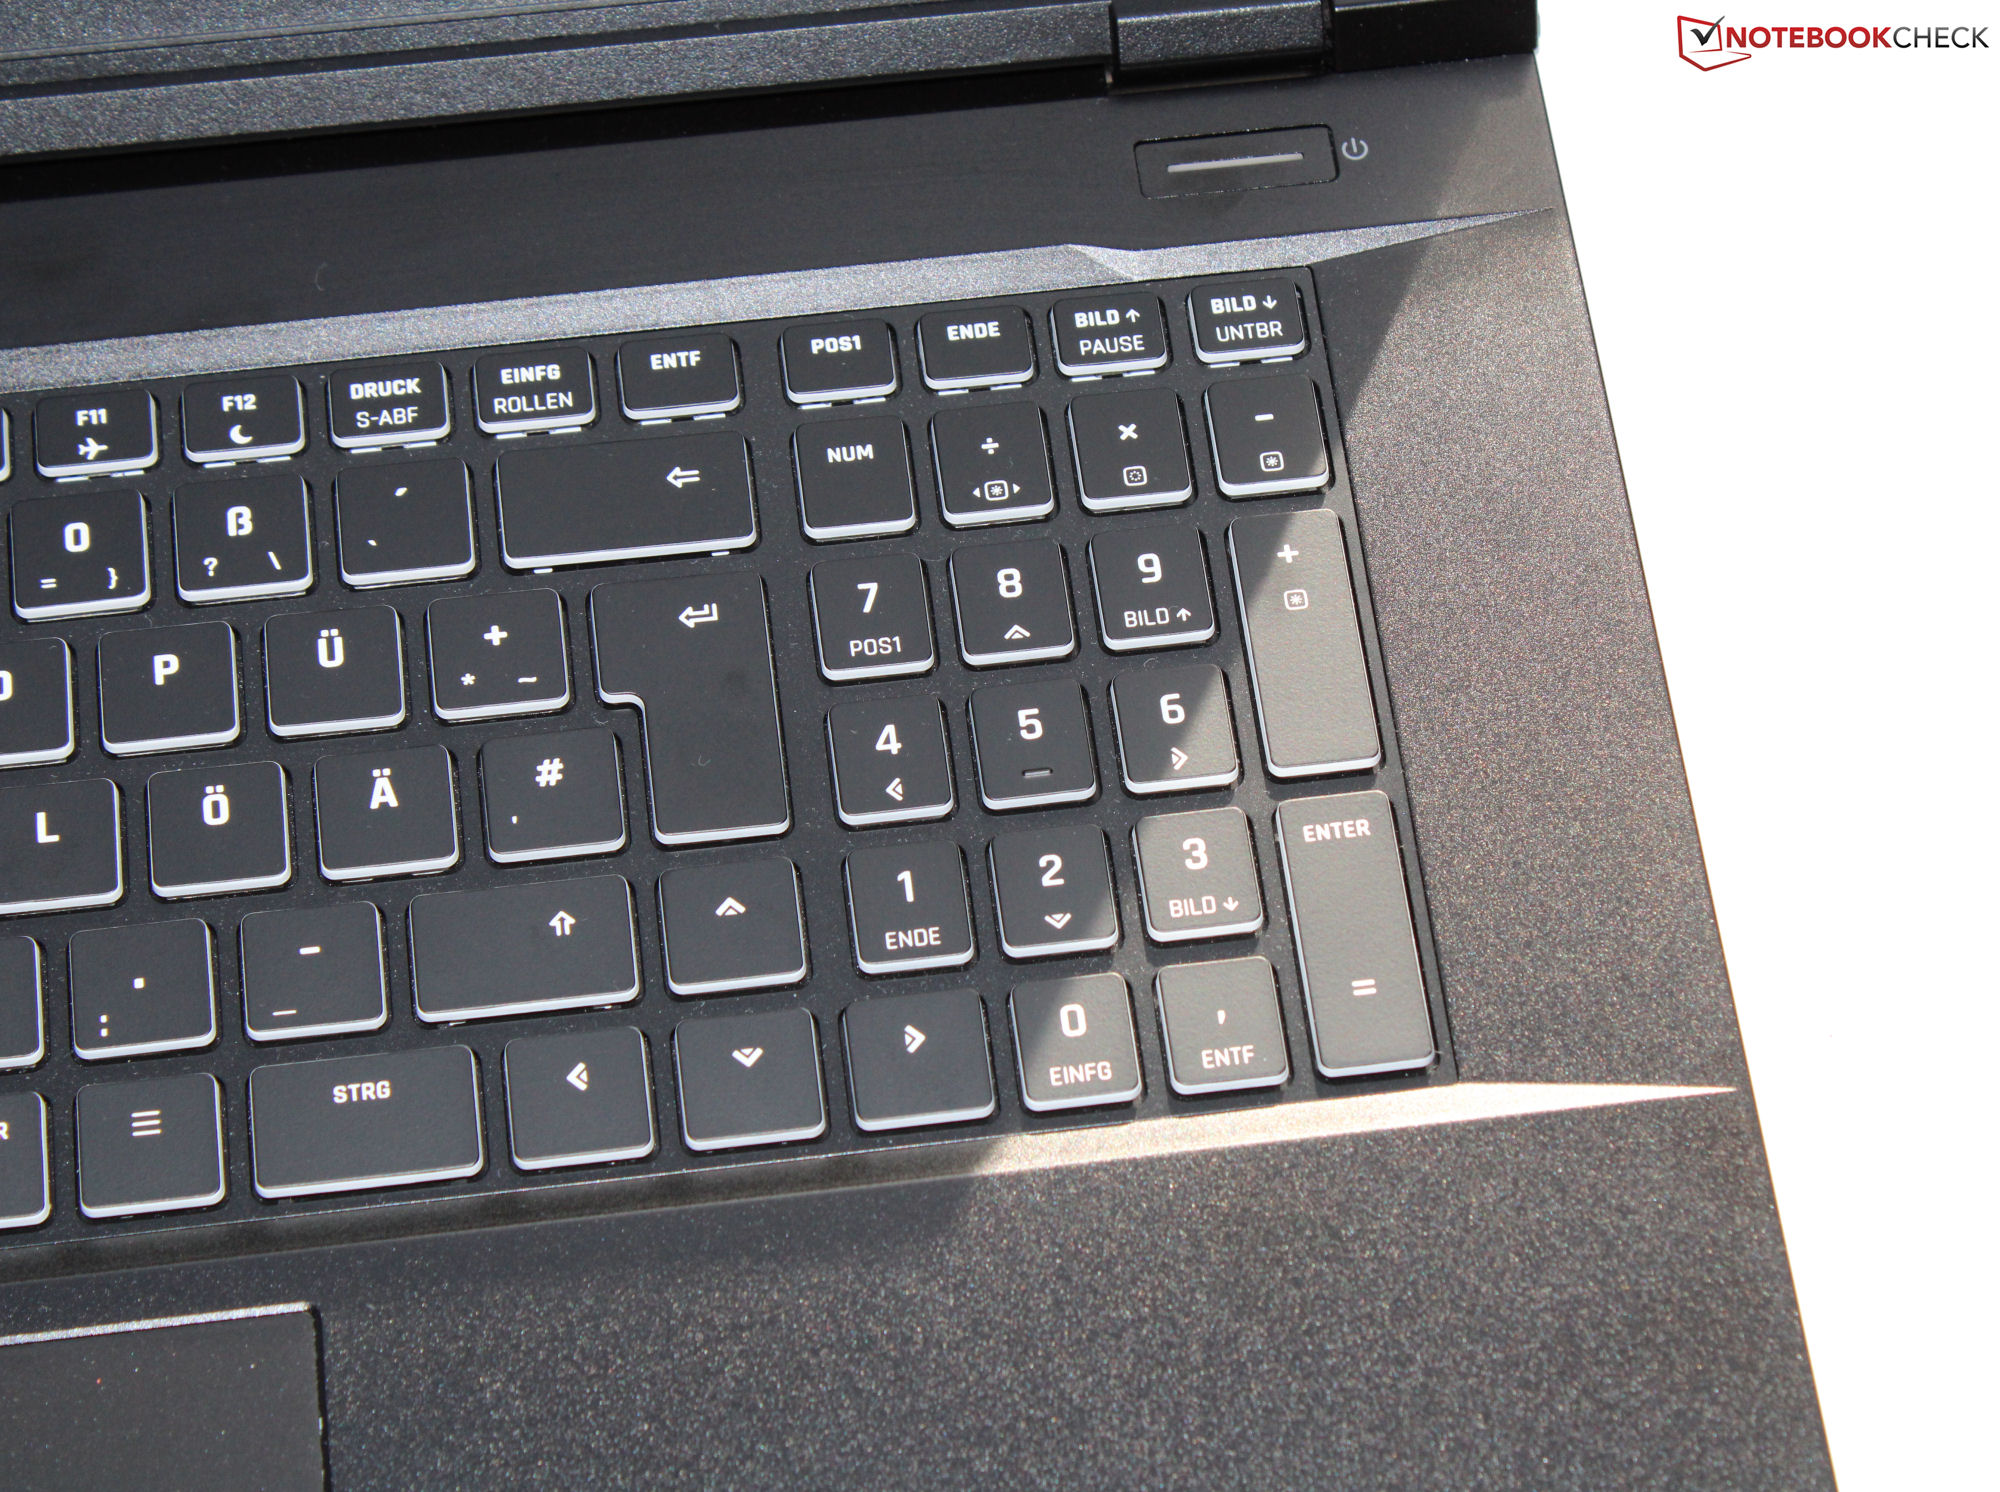
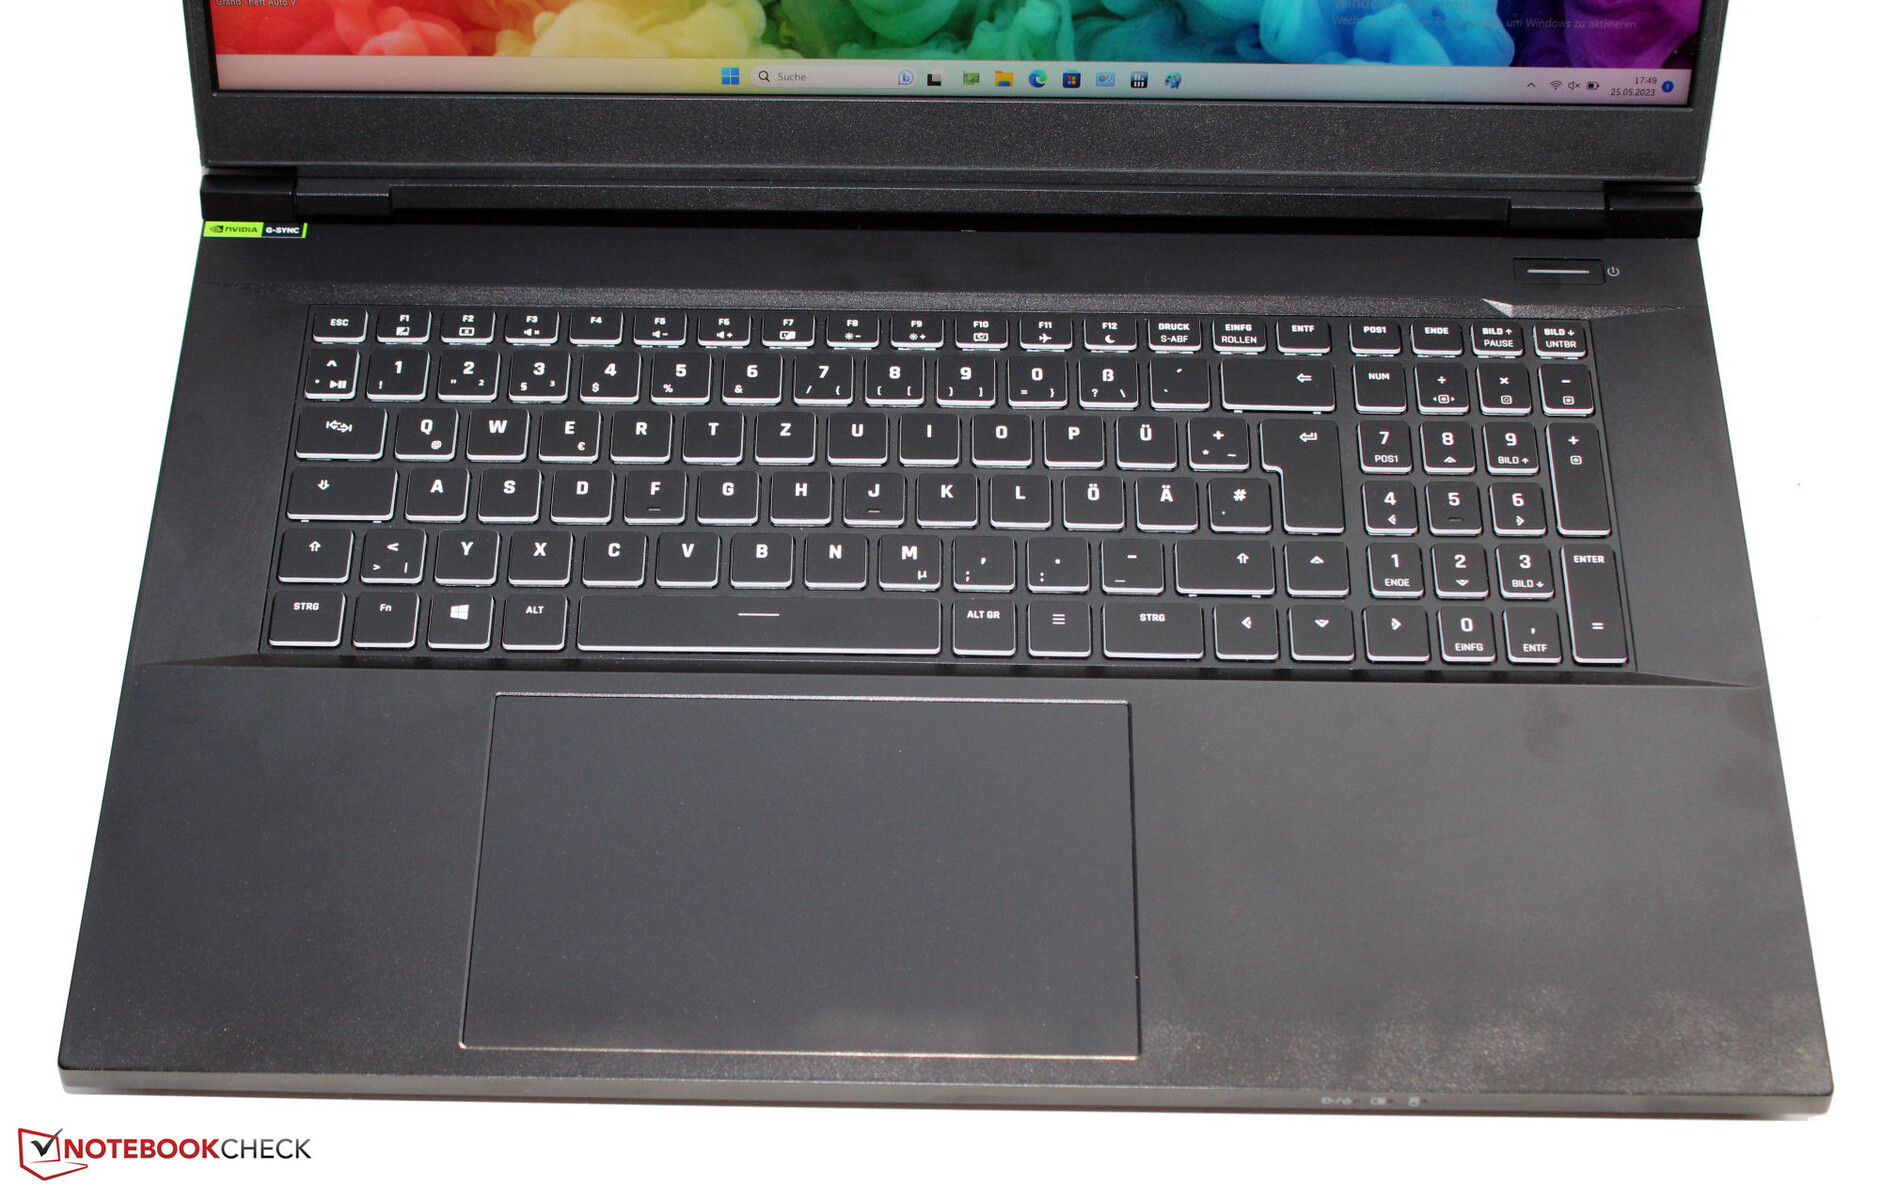
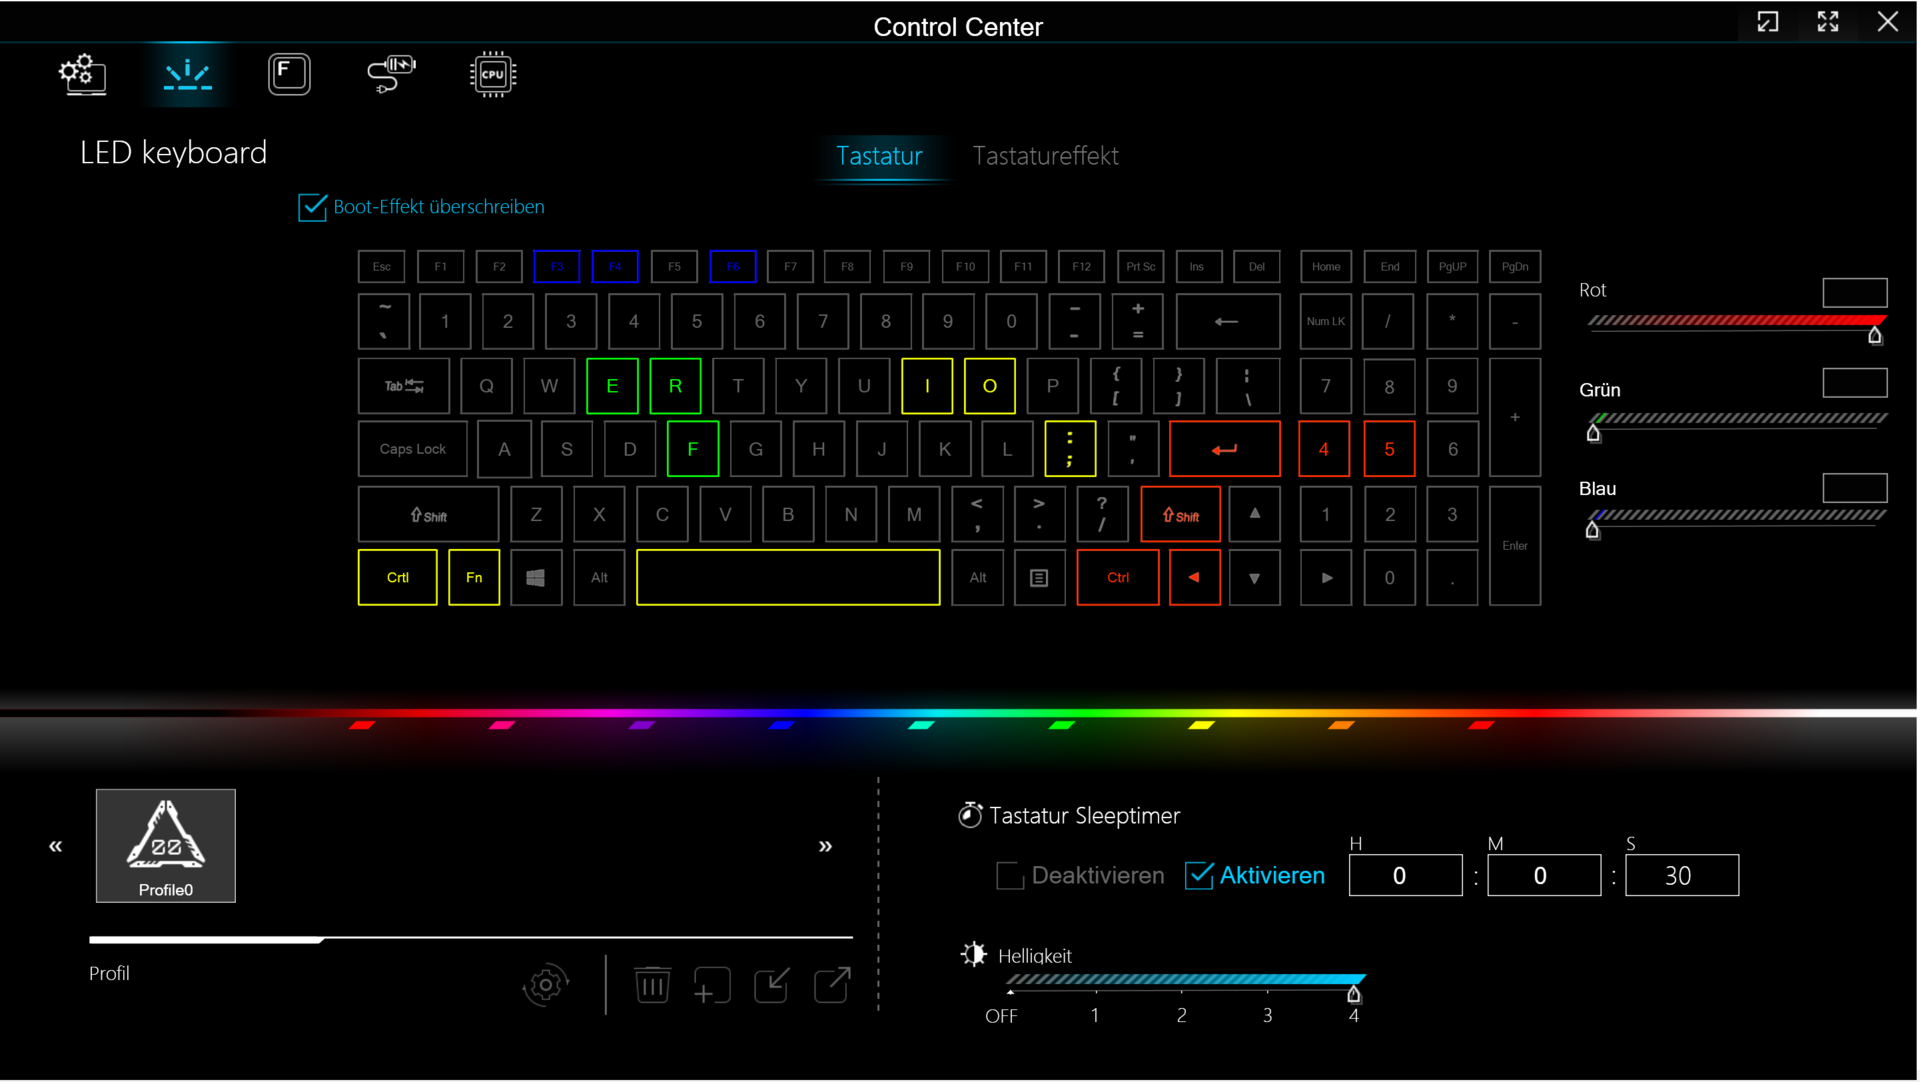
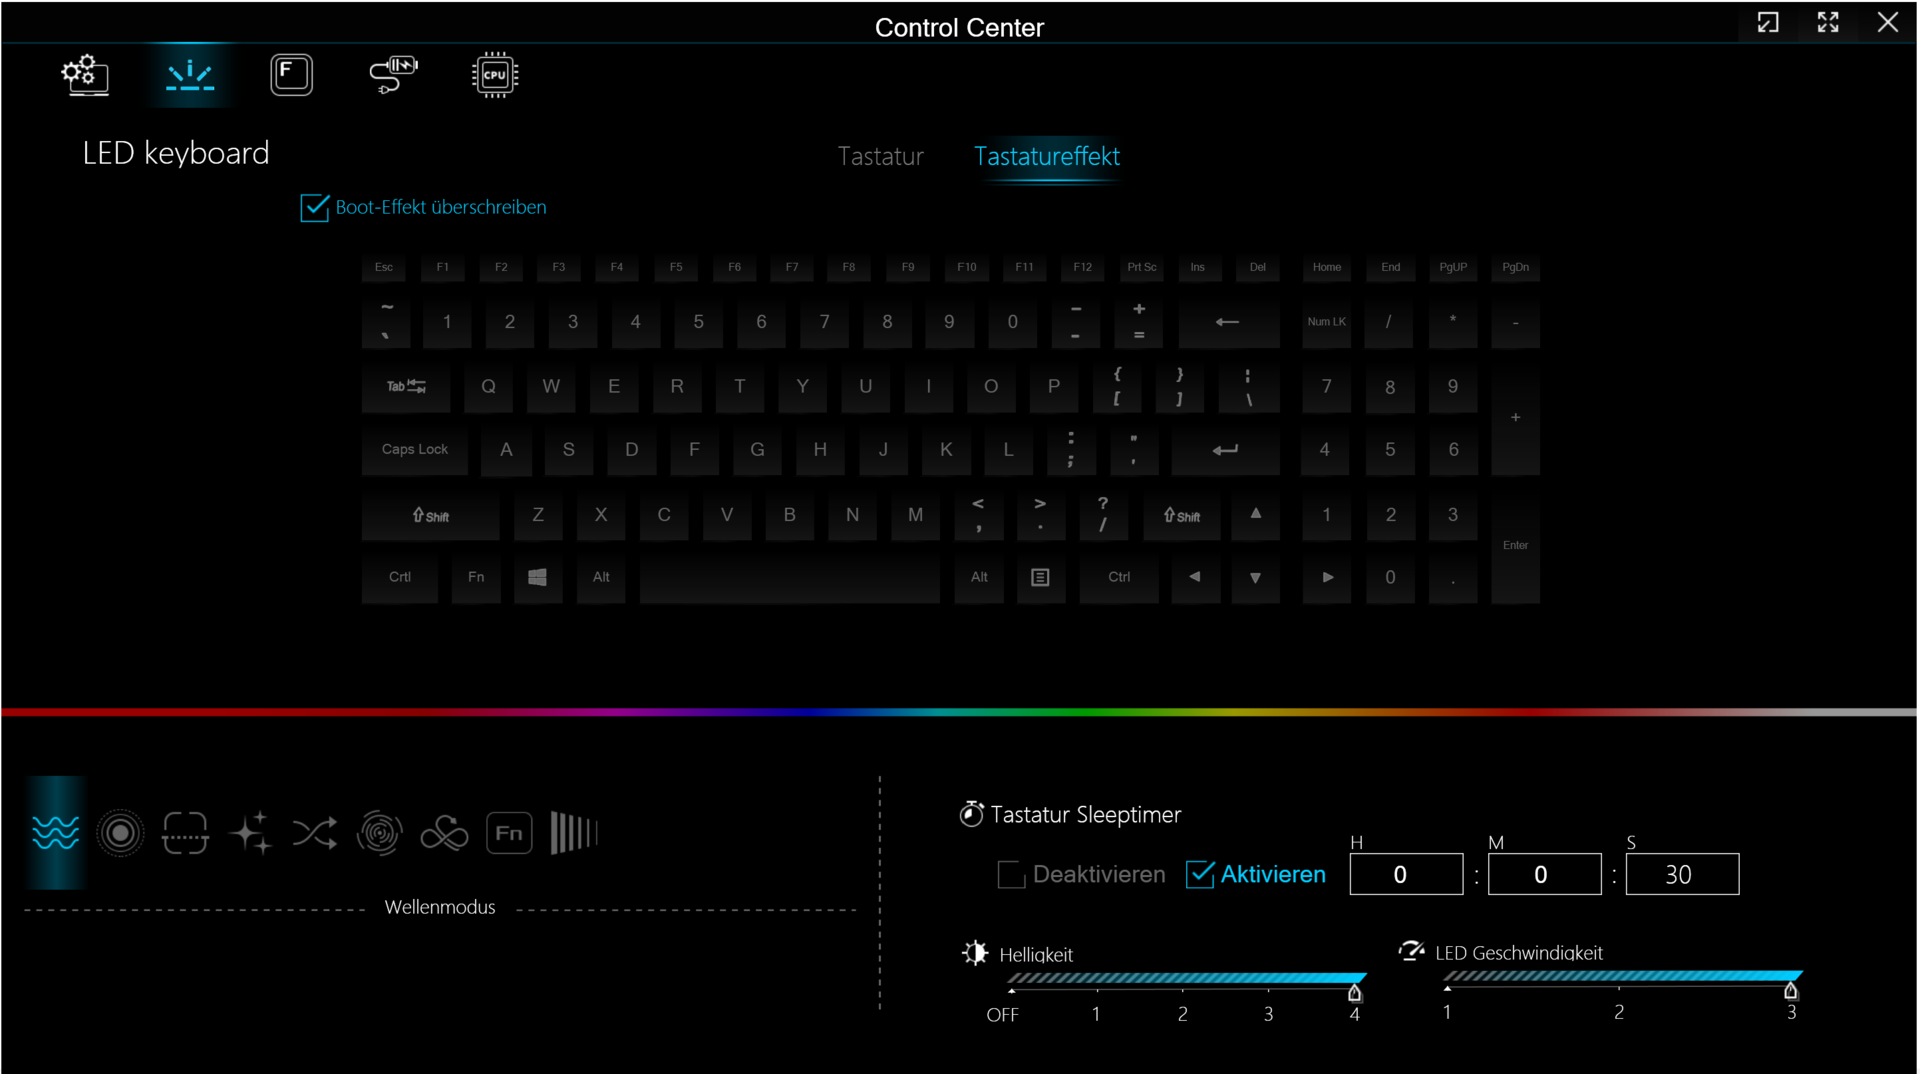
Inmatningsenheter - Schenker laptop med RGB per tangent
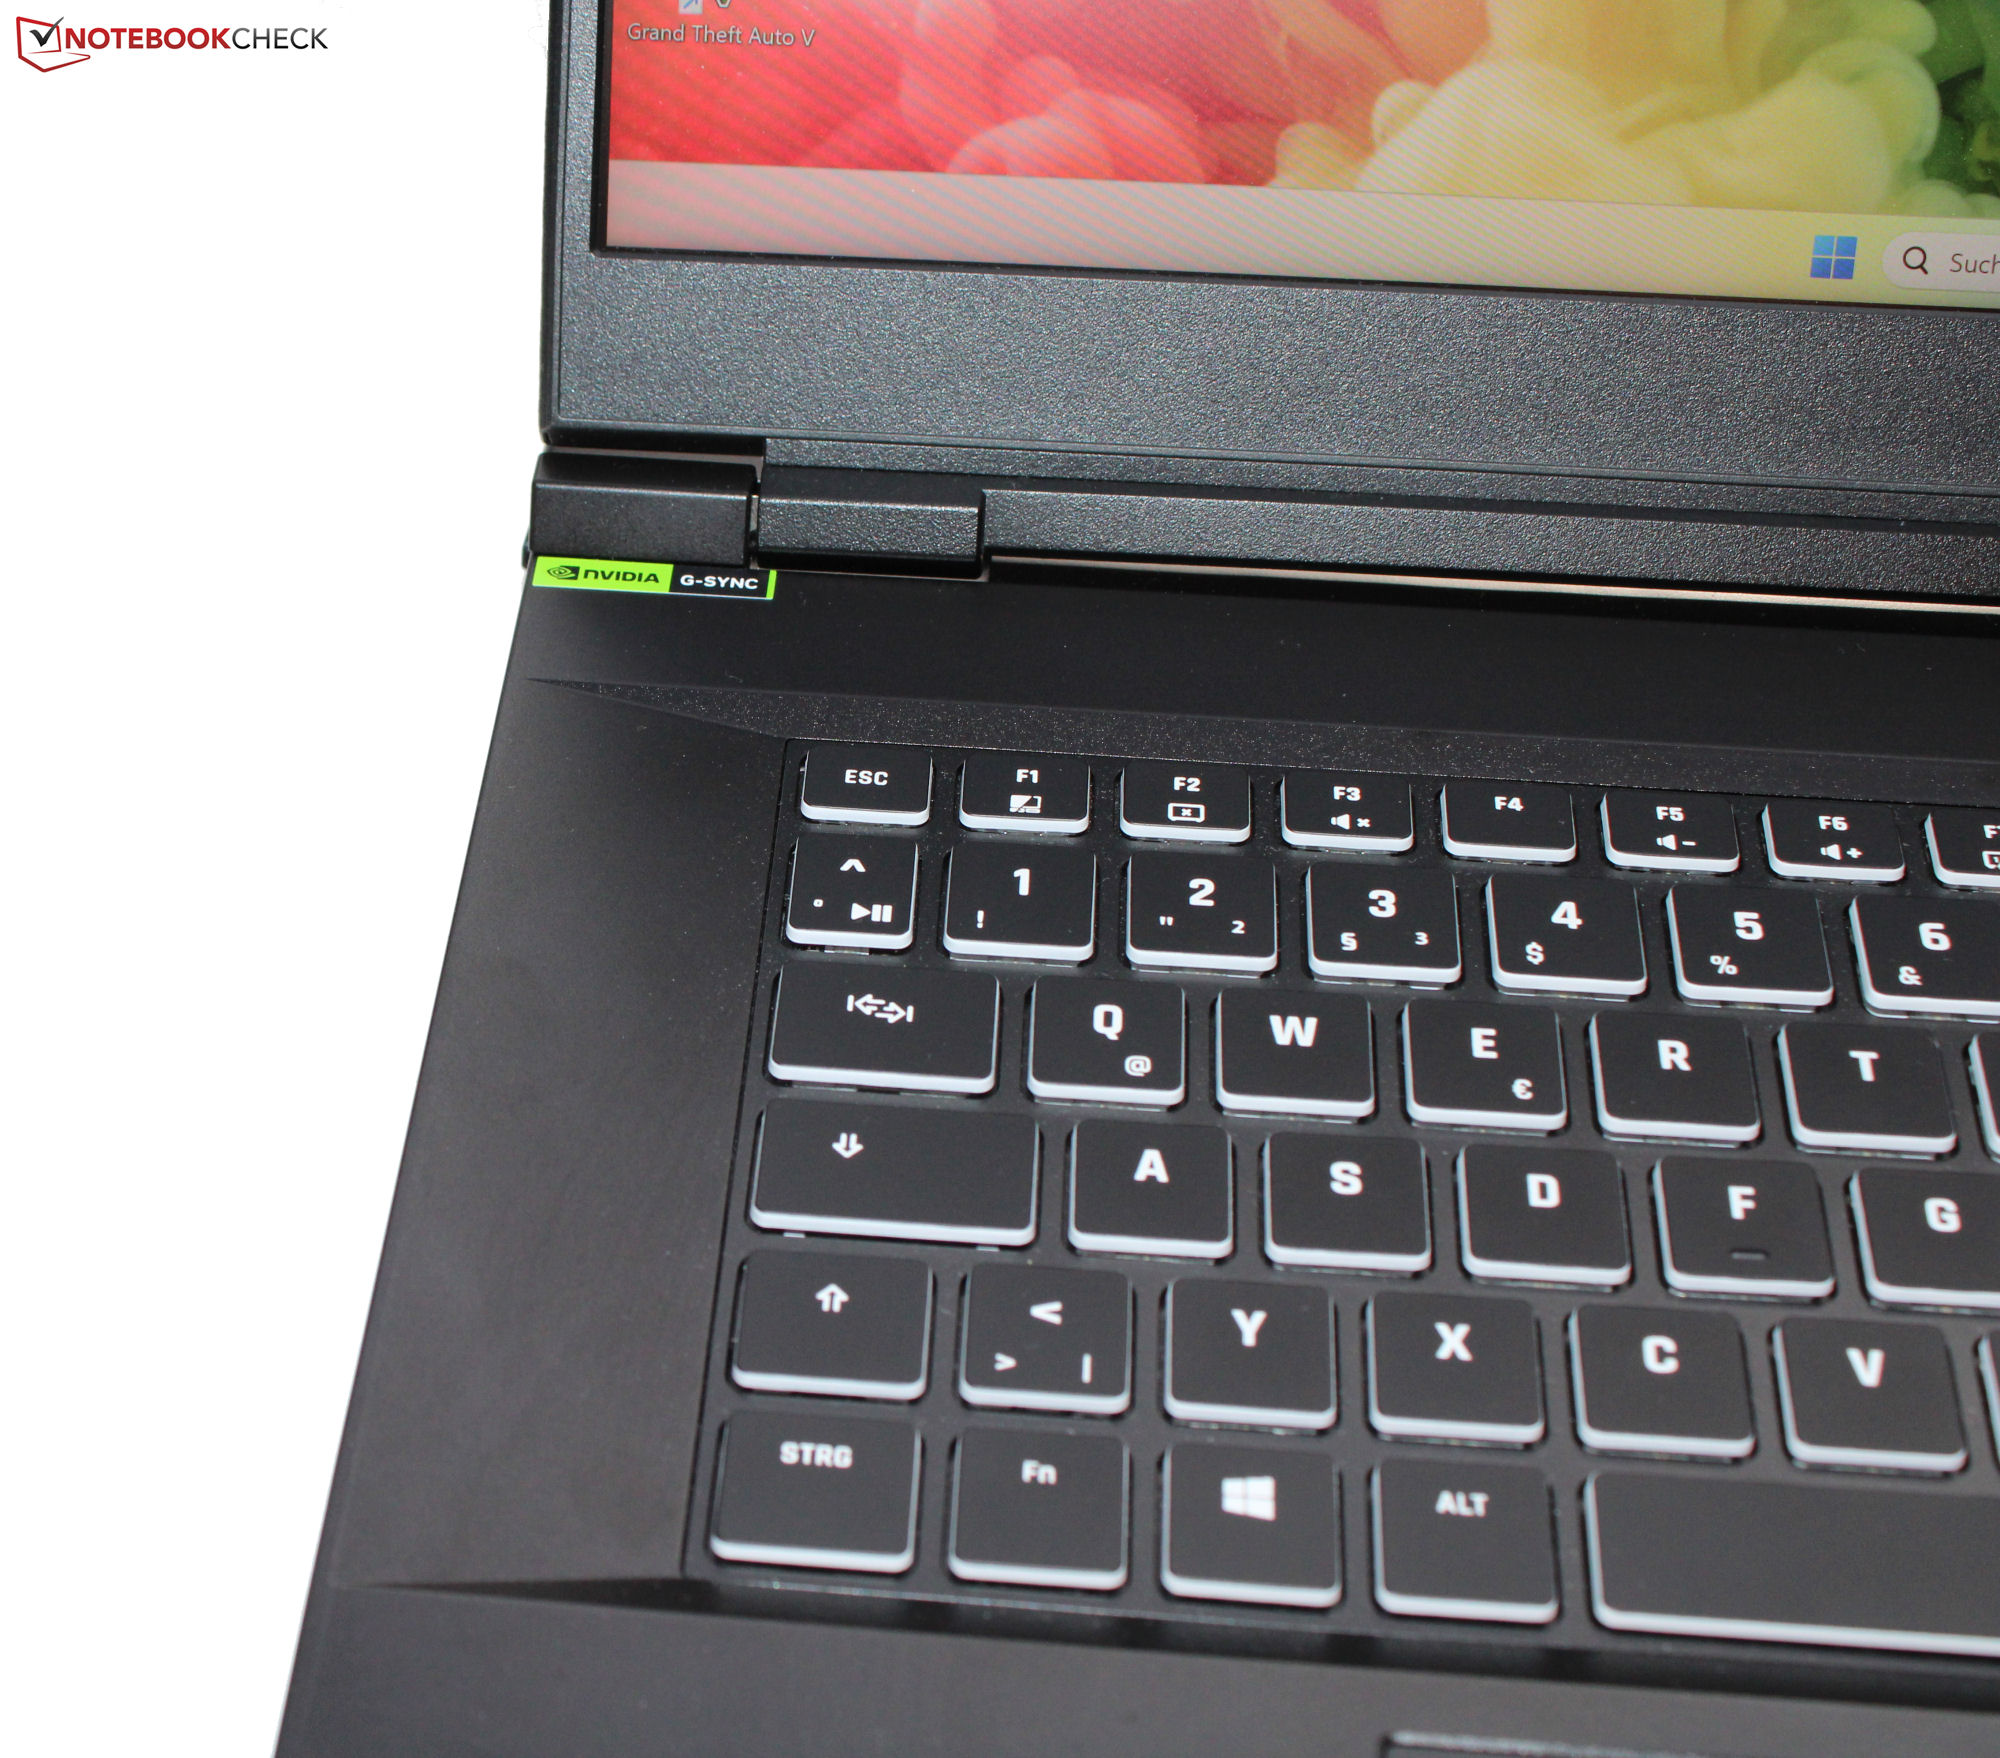
De platta, släta tangenterna på chiclet-tangentbordet (med RGB-belysning per tangent) har en måttlig slaglängd och en distinkt aktiveringspunkt. Vi tycker dock att tangentmotståndet kunde vara skarpare. Tangentbordsdäcket böjer sig lite när du skriver, men Schenker har överlag levererat ett adekvat tangentbord för daglig användning. Key 17 Pro har också en pekplatta (ca 15 x 9,1 cm, eller 5,9 x 3,6") med kort slaglängd och tydlig klickpunkt.
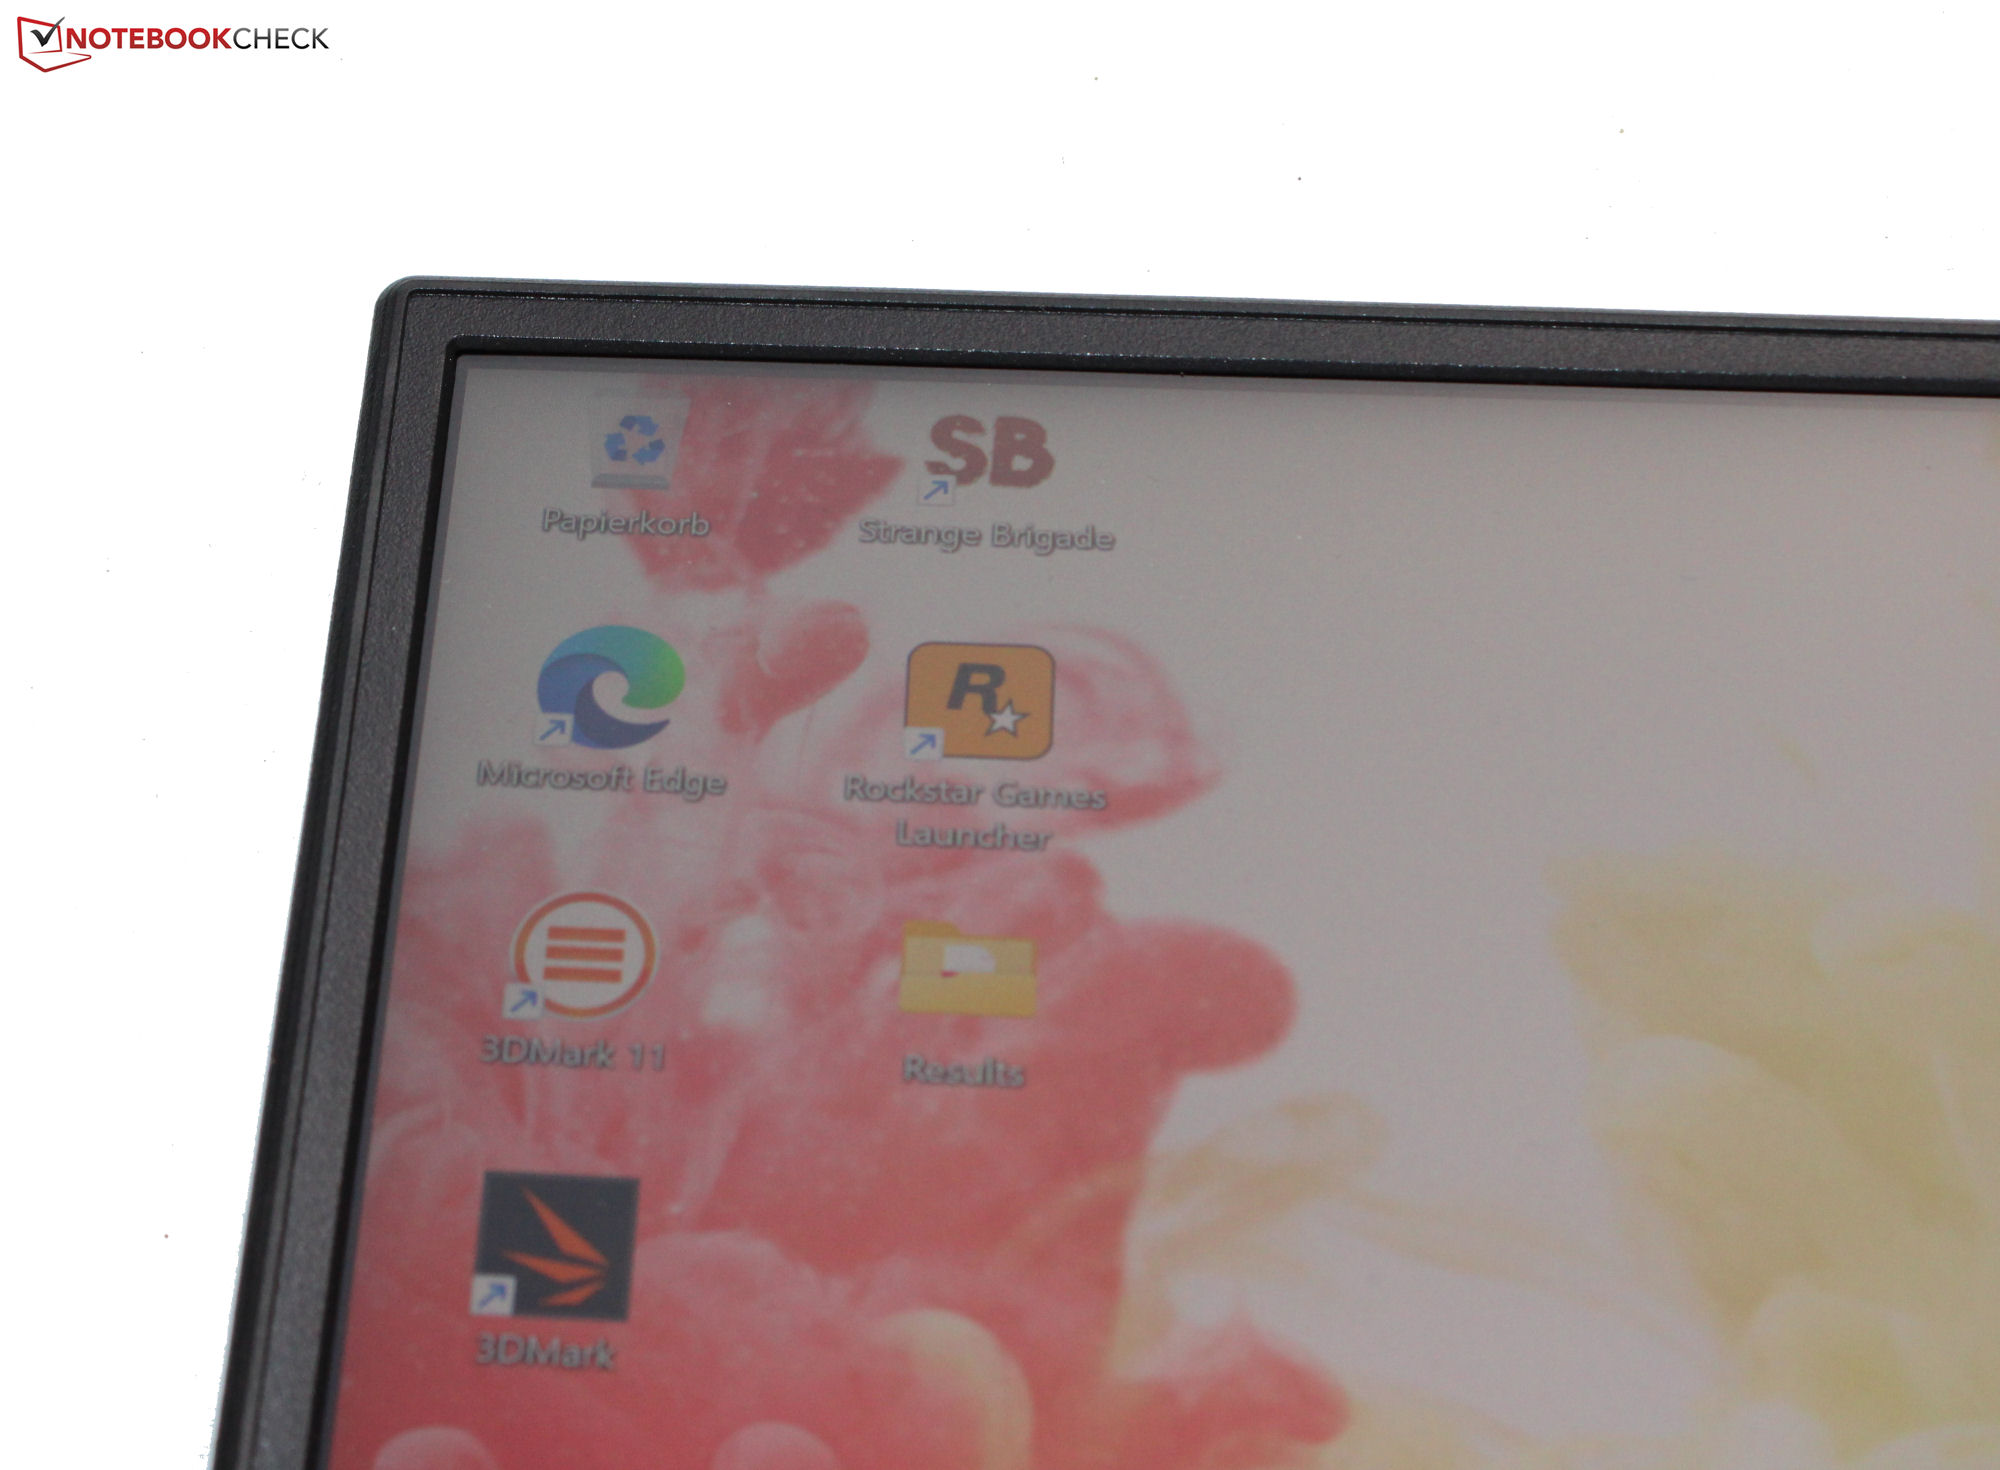
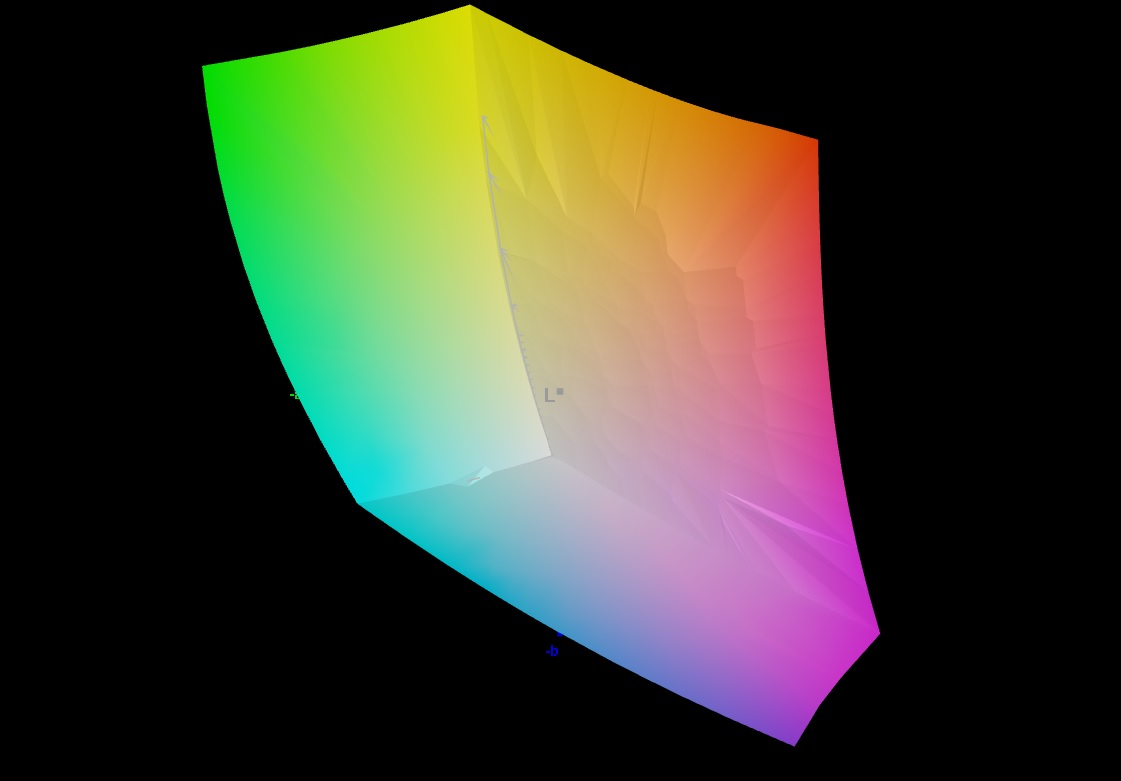
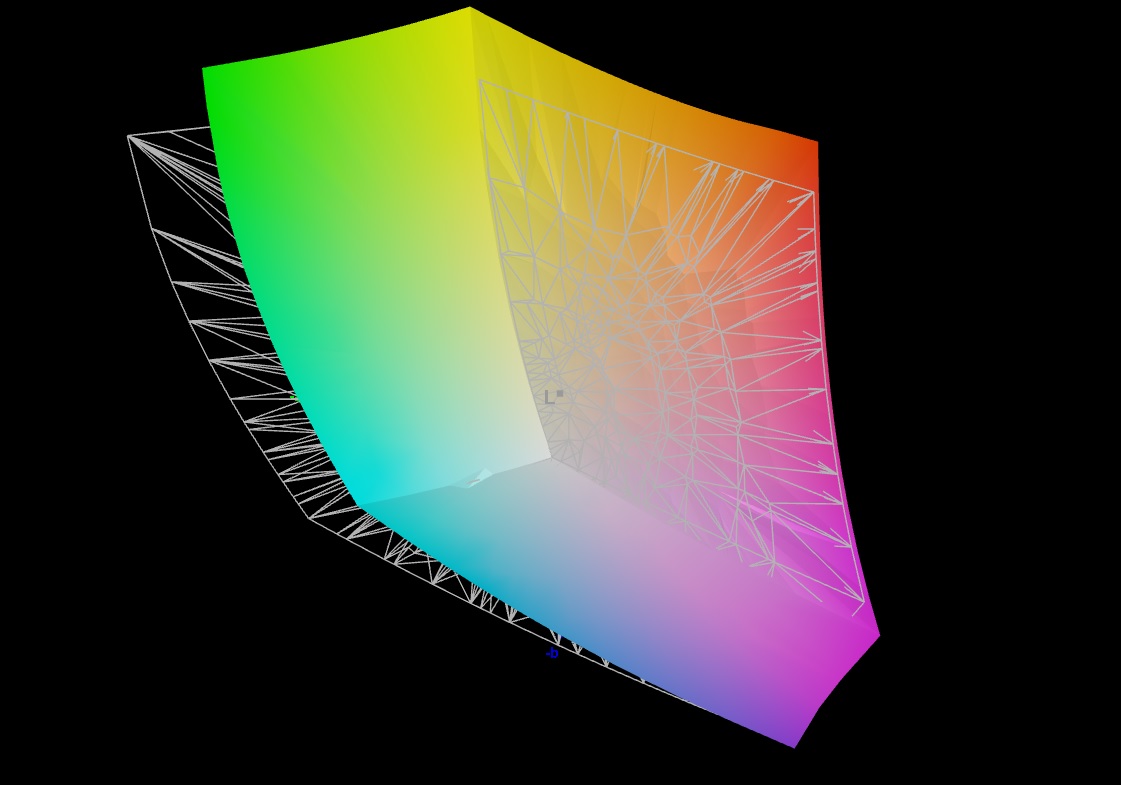
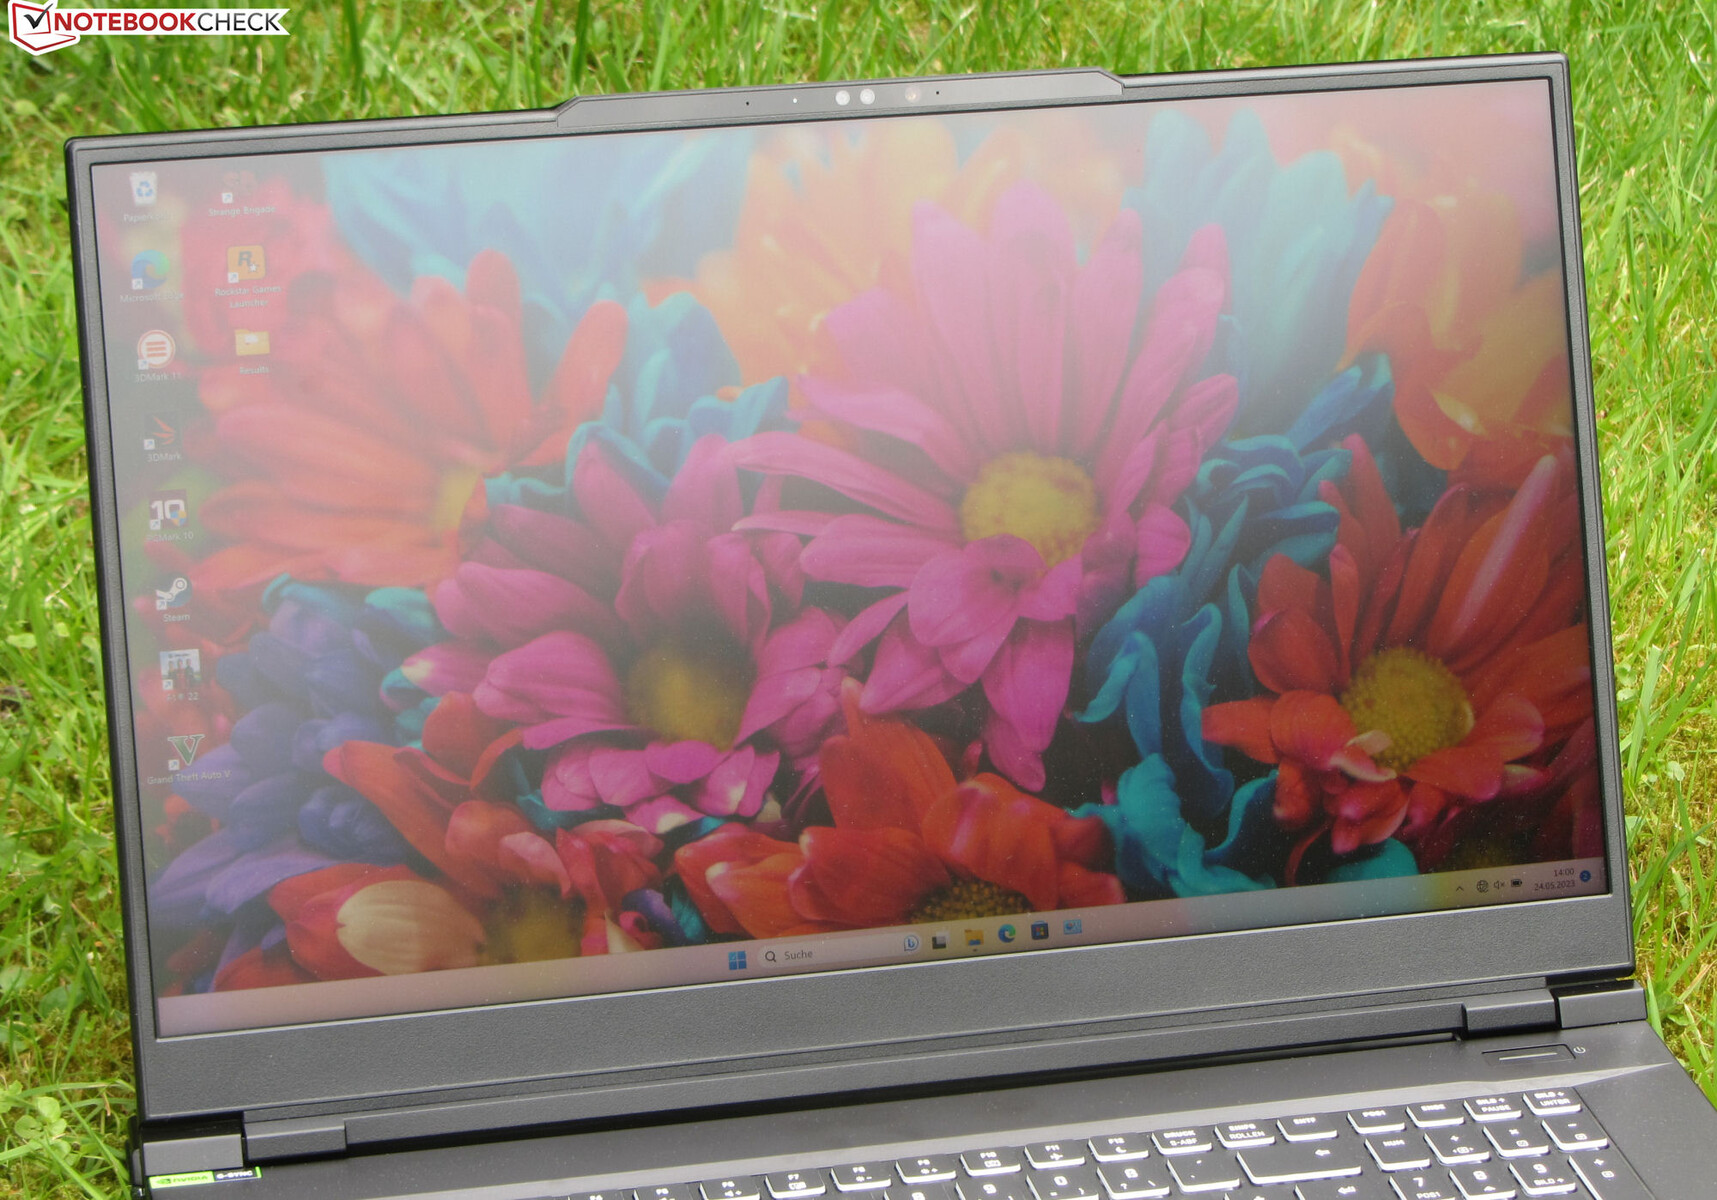
Display - UHD-panel med DCI-P3-täckning
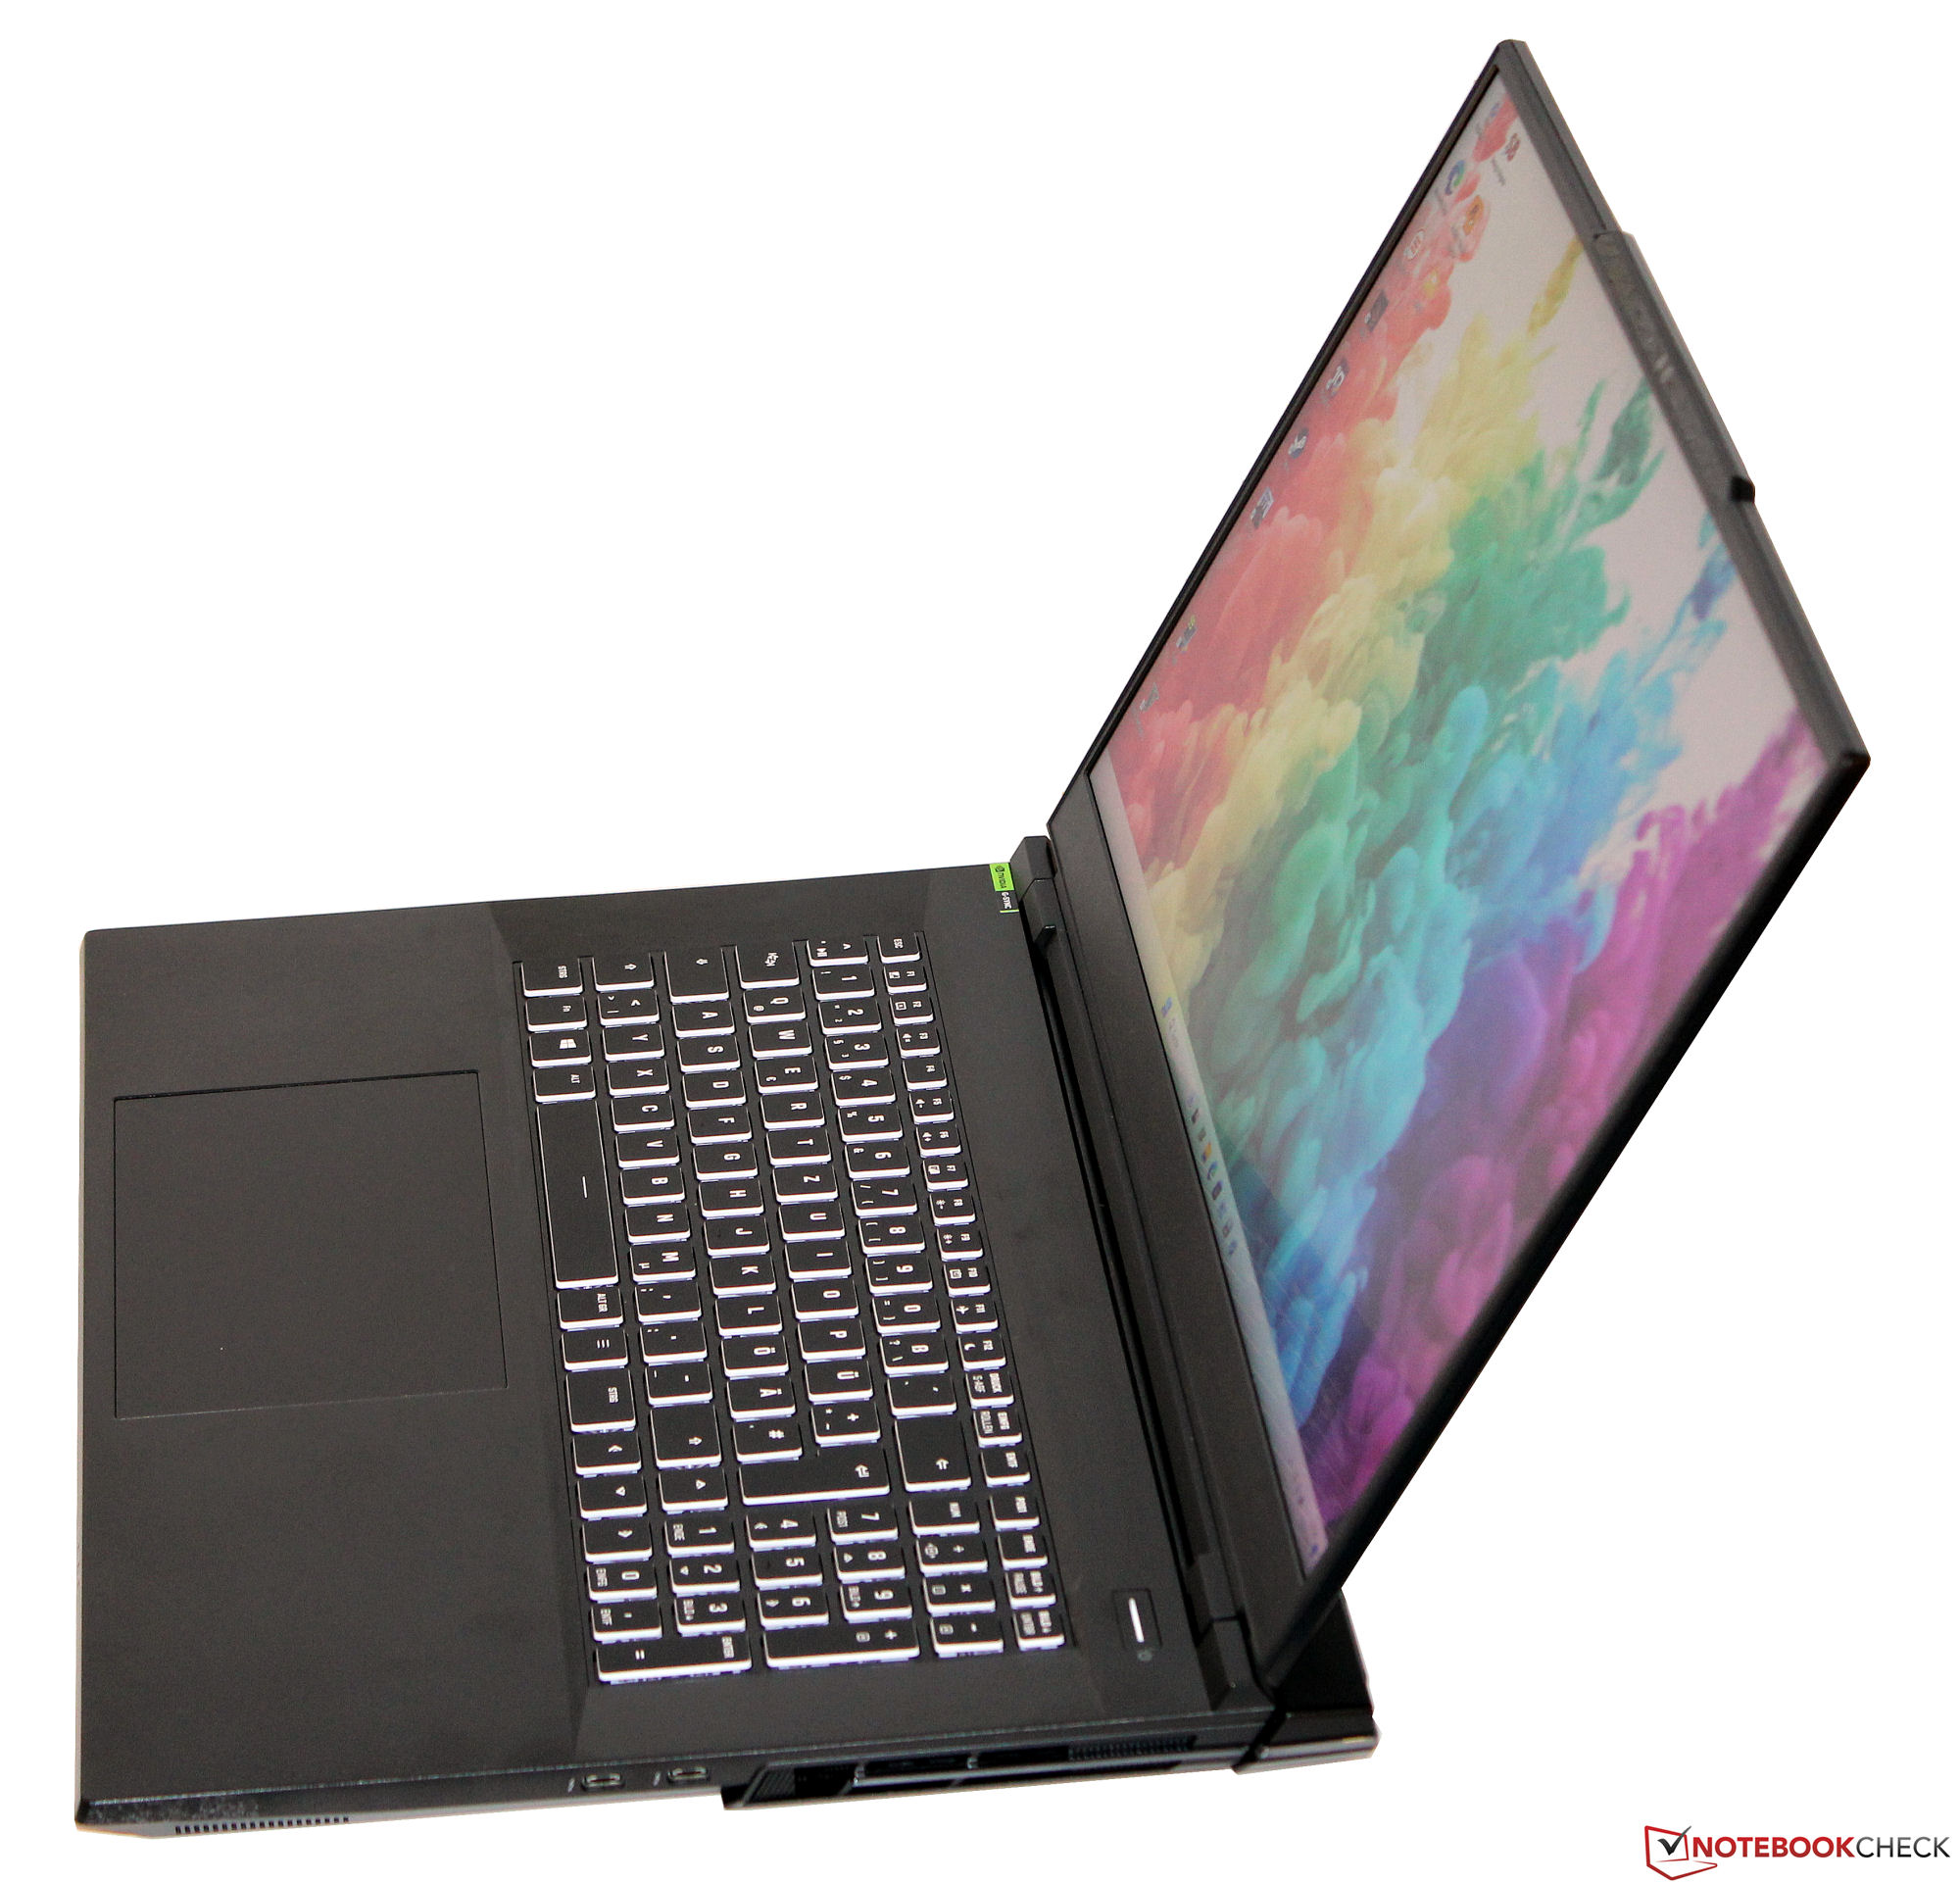
Förutom 4K IPS-skärmen (3 840 x 2 150 pixlar, 144 Hz) på granskningsenheten erbjuder Schenker även Key 17 Pro med en QHD IPS-panel (2 560 x 1 440 pixlar, 240 Hz) - båda 17,3-tumsskärmarna har stöd för G-Sync.
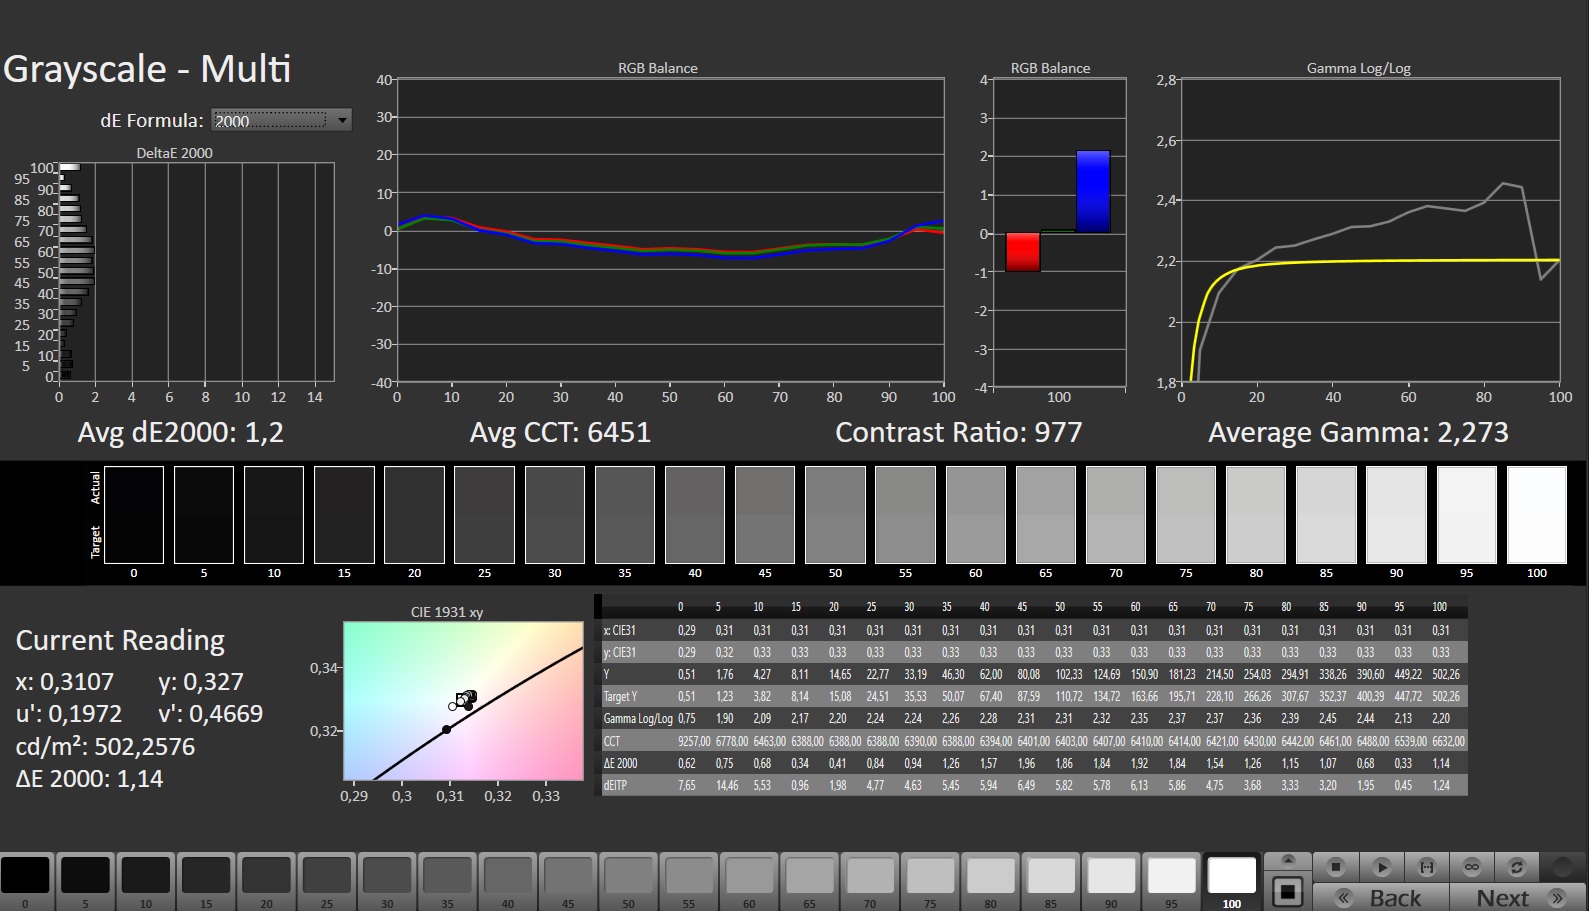
4K-panelen kännetecknas av sin höga ljusstyrka och frånvaron av PWM-flimmer och erbjuder också en hög uppdateringsfrekvens (144Hz) och snabba svarstider. När det gäller kontrastförhållandet (> 1 000:1) når den dock inte ända fram.
| |||||||||||||||||||||||||
Distribution av ljusstyrkan: 87 %
Mitt på batteriet: 487 cd/m²
Kontrast: 955:1 (Svärta: 0.51 cd/m²)
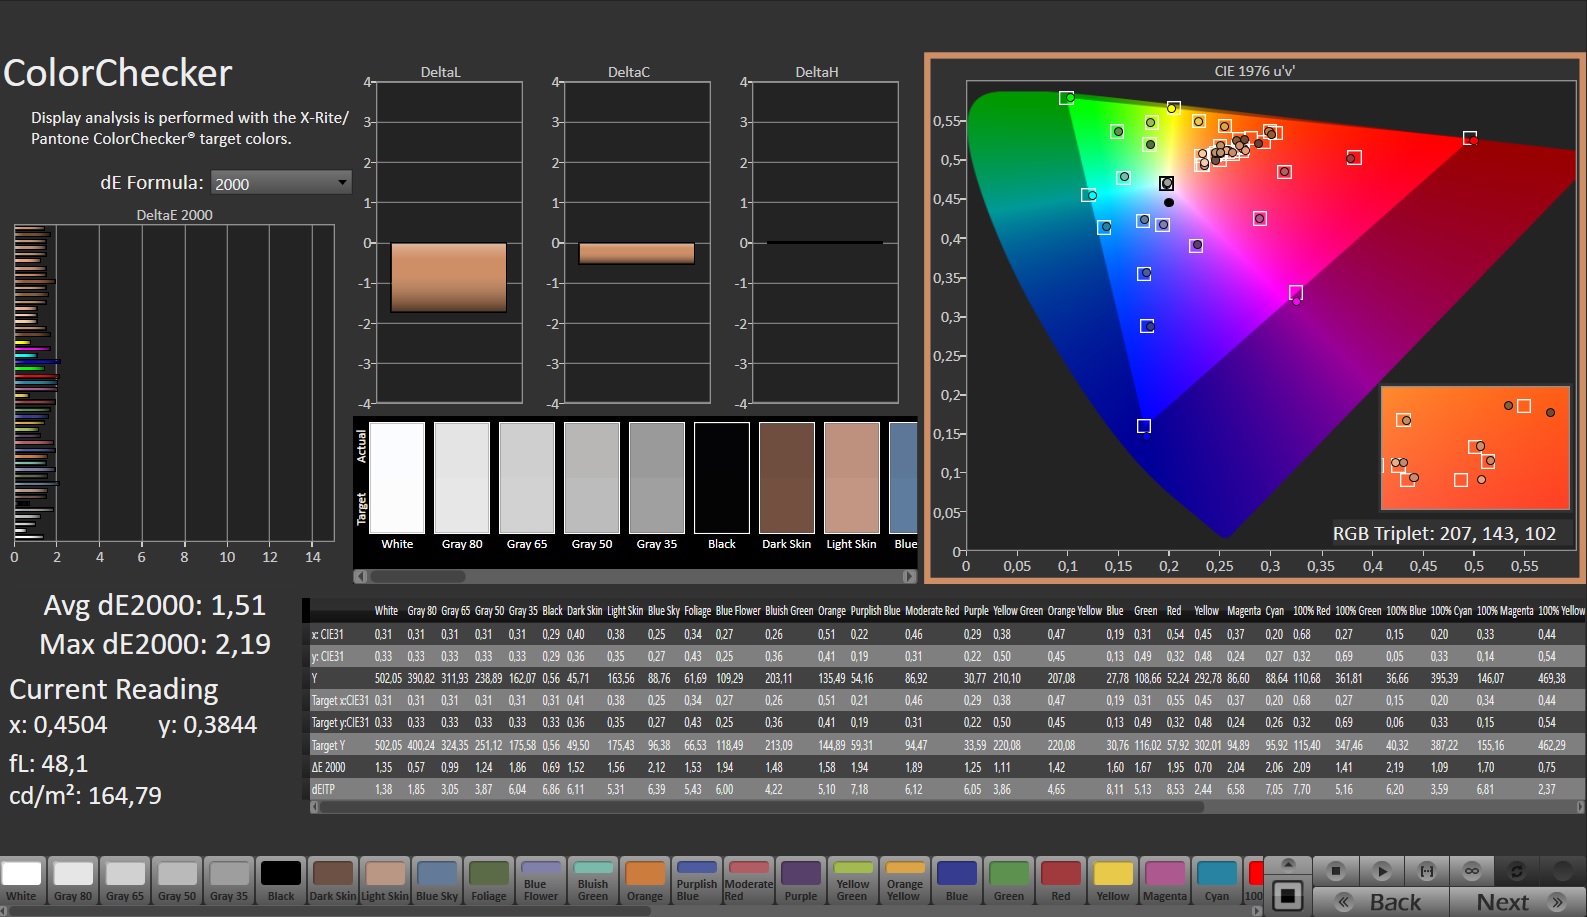
ΔE ColorChecker Calman: 1.51 | ∀{0.5-29.43 Ø4.71}
ΔE Greyscale Calman: 1.2 | ∀{0.09-98 Ø4.96}
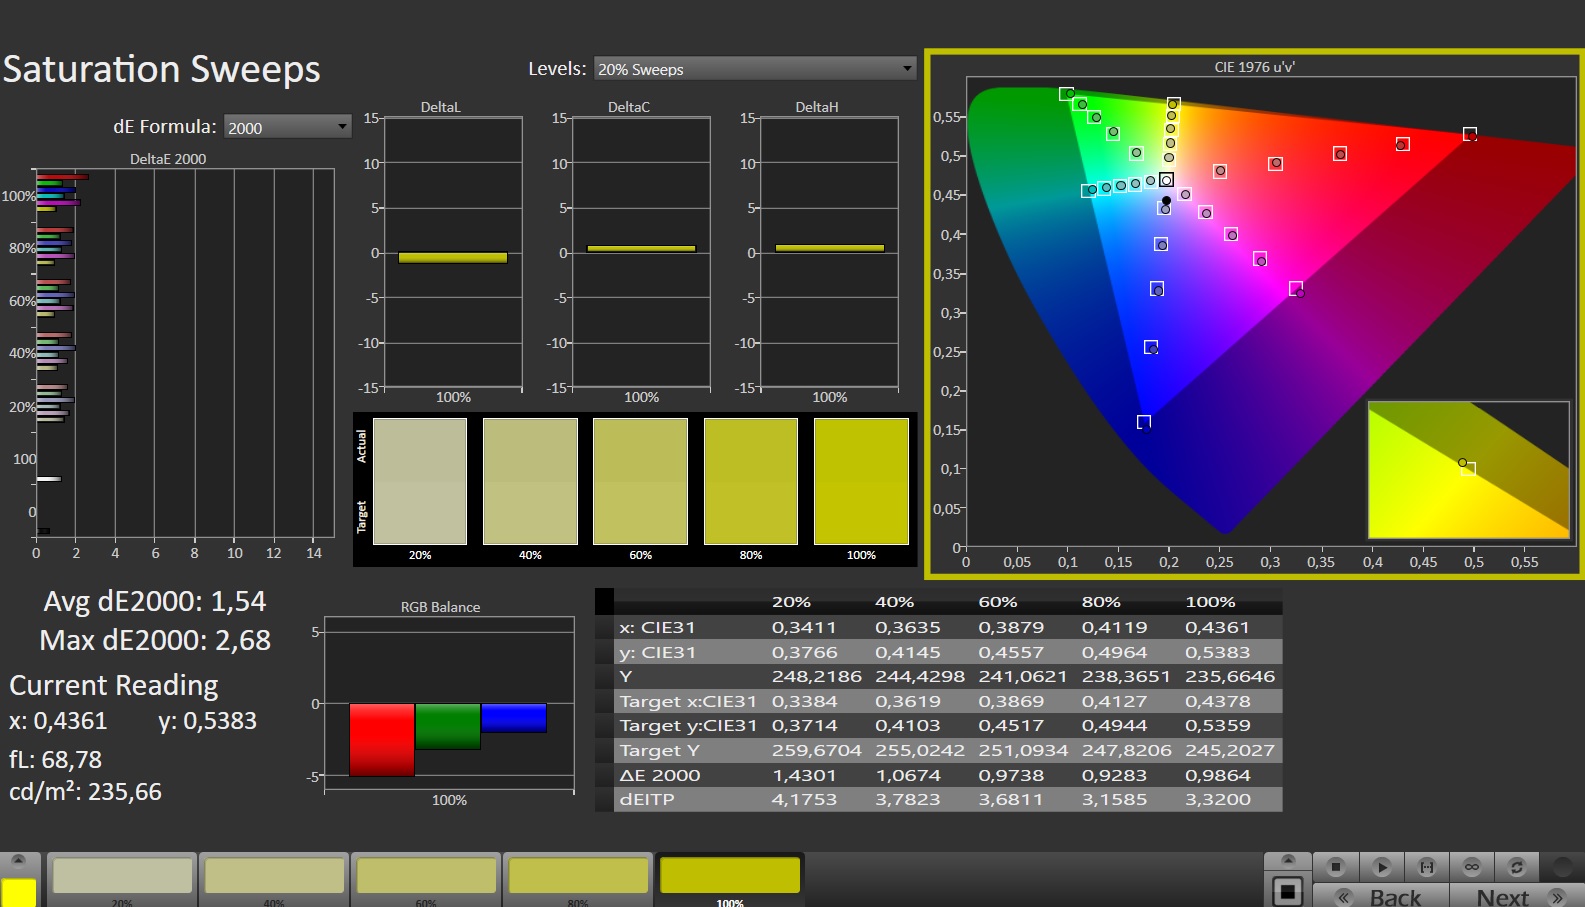
84.3% AdobeRGB 1998 (Argyll 3D)
99.9% sRGB (Argyll 3D)
96.4% Display P3 (Argyll 3D)
Gamma: 2.273
CCT: 6451 K
| Schenker Key 17 Pro (Early 23) BOE CQ NE173QUM-NY1, IPS, 3840x2160, 17.3" | MSI Stealth 17 Studio A13VH-014 AUO41A2 B173ZAN06.C, Mini LED, 3840x2160, 17.3" | Asus ROG Strix Scar 17 G733PY-XS96 NE173QHM-NZ2, IPS, 2560x1440, 17.3" | Aorus 17X AZF BOE09F9, IPS, 2560x1440, 17.3" | Medion Erazer Beast X40 BOE NE170QDM-NZ1, IPS, 2560x1600, 17" | |
|---|---|---|---|---|---|
| Display | 2% | 1% | 0% | -16% | |
| Display P3 Coverage (%) | 96.4 | 92 -5% | 98 2% | 96.7 0% | 68.6 -29% |
| sRGB Coverage (%) | 99.9 | 99.1 -1% | 100 0% | 99.9 0% | 99.8 0% |
| AdobeRGB 1998 Coverage (%) | 84.3 | 94.07 12% | 85.6 2% | 84.5 0% | 69.4 -18% |
| Response Times | -62% | 0% | -18% | 10% | |
| Response Time Grey 50% / Grey 80% * (ms) | 14.8 ? | 46.4 ? -214% | 6.2 ? 58% | 14 ? 5% | 11.3 ? 24% |
| Response Time Black / White * (ms) | 7.2 ? | 0.62 ? 91% | 11.4 ? -58% | 10.1 ? -40% | 7.5 ? -4% |
| PWM Frequency (Hz) | 2400 | ||||
| Screen | 221% | -8% | -57% | -29% | |
| Brightness middle (cd/m²) | 487 | 397.29 -18% | 322.5 -34% | 294 -40% | 384 -21% |
| Brightness (cd/m²) | 485 | 392 -19% | 317 -35% | 276 -43% | 377 -22% |
| Brightness Distribution (%) | 87 | 93 7% | 86 -1% | 90 3% | 90 3% |
| Black Level * (cd/m²) | 0.51 | 0.02 96% | 0.29 43% | 0.28 45% | 0.45 12% |
| Contrast (:1) | 955 | 19865 1980% | 1112 16% | 1050 10% | 853 -11% |
| Colorchecker dE 2000 * | 1.51 | 2.52 -67% | 1.15 24% | 2.81 -86% | 2.05 -36% |
| Colorchecker dE 2000 max. * | 2.19 | 3.91 -79% | 3.03 -38% | 5.7 -160% | 3.64 -66% |
| Greyscale dE 2000 * | 1.2 | 2.78 -132% | 1.7 -42% | 3.4 -183% | 2.3 -92% |
| Gamma | 2.273 97% | 2.63 84% | 2.27 97% | 2.301 96% | 2.017 109% |
| CCT | 6451 101% | 6412 101% | 6299 103% | 7389 88% | 6546 99% |
| Colorchecker dE 2000 calibrated * | 2.52 | 0.56 | 0.86 | 0.74 | |
| Totalt genomsnitt (program/inställningar) | 54% /
127% | -2% /
-5% | -25% /
-38% | -12% /
-20% |
* ... mindre är bättre
Redan från början hade skärmen en utmärkt färgåtergivning. Med ungefär 1,5 ligger den genomsnittliga färgskillnaden verkligen inom vad vi anser vara bra (Delta E < 3). Färgnoggrannheten är given: panelen har full sRGB-täckning och kan täcka nästan hela DCI-P3-utrymmet; den kan också återge upp till 84 % av AdobeRGB-utrymmet.

Visa svarstider
| ↔ Svarstid svart till vitt | ||
|---|---|---|
| 7.2 ms ... stiga ↗ och falla ↘ kombinerat | ↗ 2.2 ms stiga | 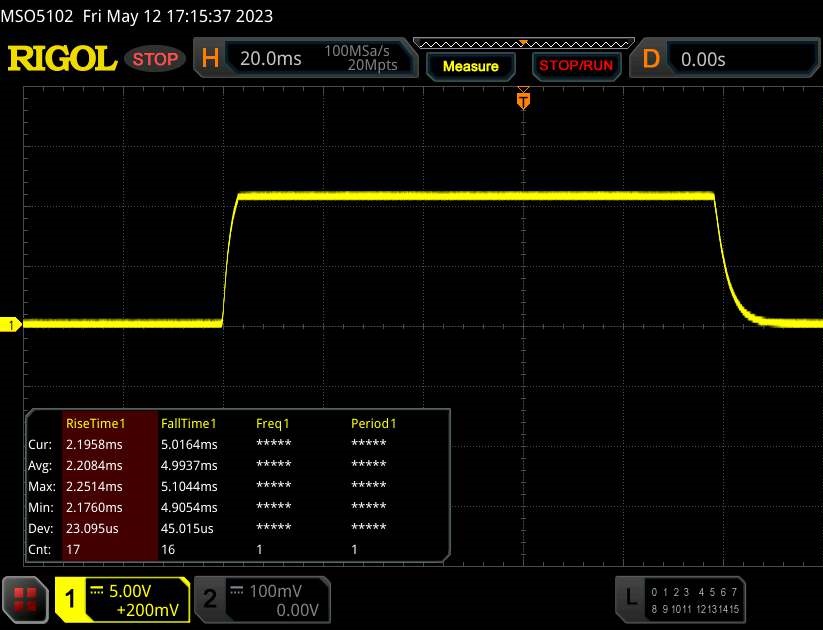 |
| ↘ 5 ms hösten | ||
| Skärmen visar väldigt snabba svarsfrekvenser i våra tester och borde vara mycket väl lämpad för fartfyllt spel. I jämförelse sträcker sig alla testade enheter från 0.1 (minst) till 240 (maximalt) ms. » 22 % av alla enheter är bättre. Det betyder att den uppmätta svarstiden är bättre än genomsnittet av alla testade enheter (19.8 ms). | ||
| ↔ Svarstid 50 % grått till 80 % grått | ||
| 14.8 ms ... stiga ↗ och falla ↘ kombinerat | ↗ 7.2 ms stiga | 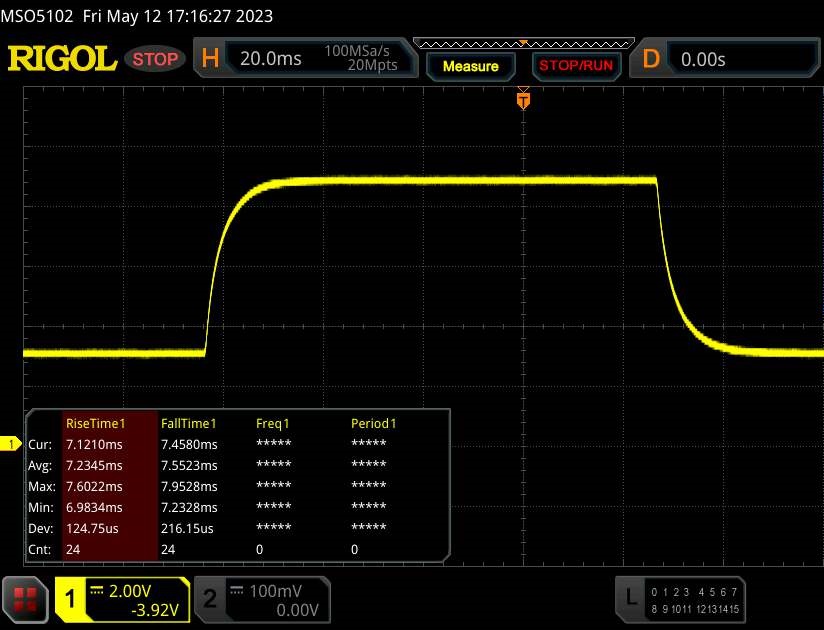 |
| ↘ 7.6 ms hösten | ||
| Skärmen visar bra svarsfrekvens i våra tester, men kan vara för långsam för konkurrenskraftiga spelare. I jämförelse sträcker sig alla testade enheter från 0.165 (minst) till 636 (maximalt) ms. » 29 % av alla enheter är bättre. Det betyder att den uppmätta svarstiden är bättre än genomsnittet av alla testade enheter (31 ms). | ||
Skärmflimmer / PWM (Puls-Width Modulation)
| Skärmflimmer / PWM upptäcktes inte |  | ||
Som jämförelse: 52 % av alla testade enheter använder inte PWM för att dämpa skärmen. Om PWM upptäcktes mättes ett medelvärde av 7754 (minst: 5 - maximum: 343500) Hz. | |||
IPS-skärmen är läsbar från alla positioner tack vare den breda betraktningsvinkeln. Du kan säkert urskilja innehållet på skärmen även utomhus, förutsatt att solen inte skiner för starkt.
Prestanda - Key 17 har avancerad hårdvara
Schenker Key 17 Pro är en avancerad 17,3-tums bärbar dator som utnyttjar kraften i Raptor Lake och Ada Lovelace. Du kan konfigurera datorn efter dina behov i Schenkers onlinebutik. Vår recension kostar cirka 4 500 euro (4 820 USD). Och priserna börjar på 3 200 euro (3 427 USD).
Testförhållanden
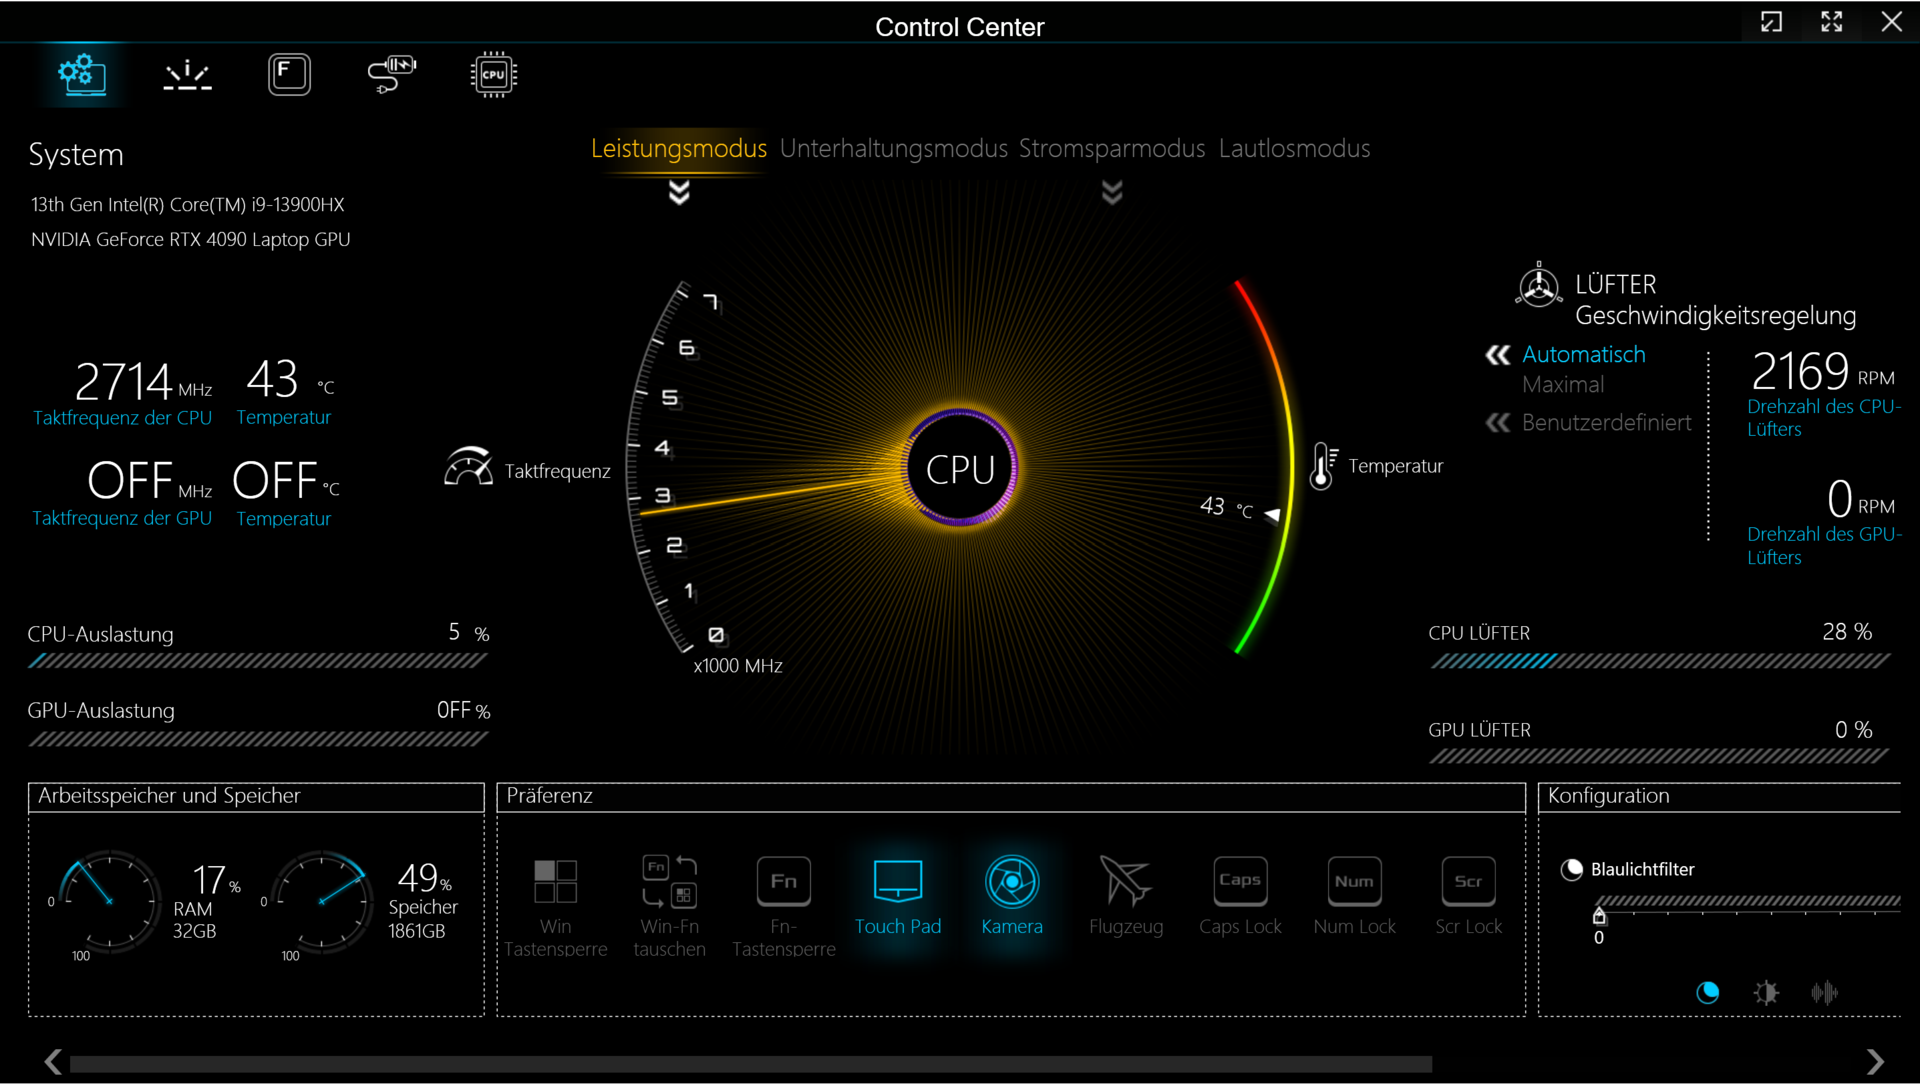
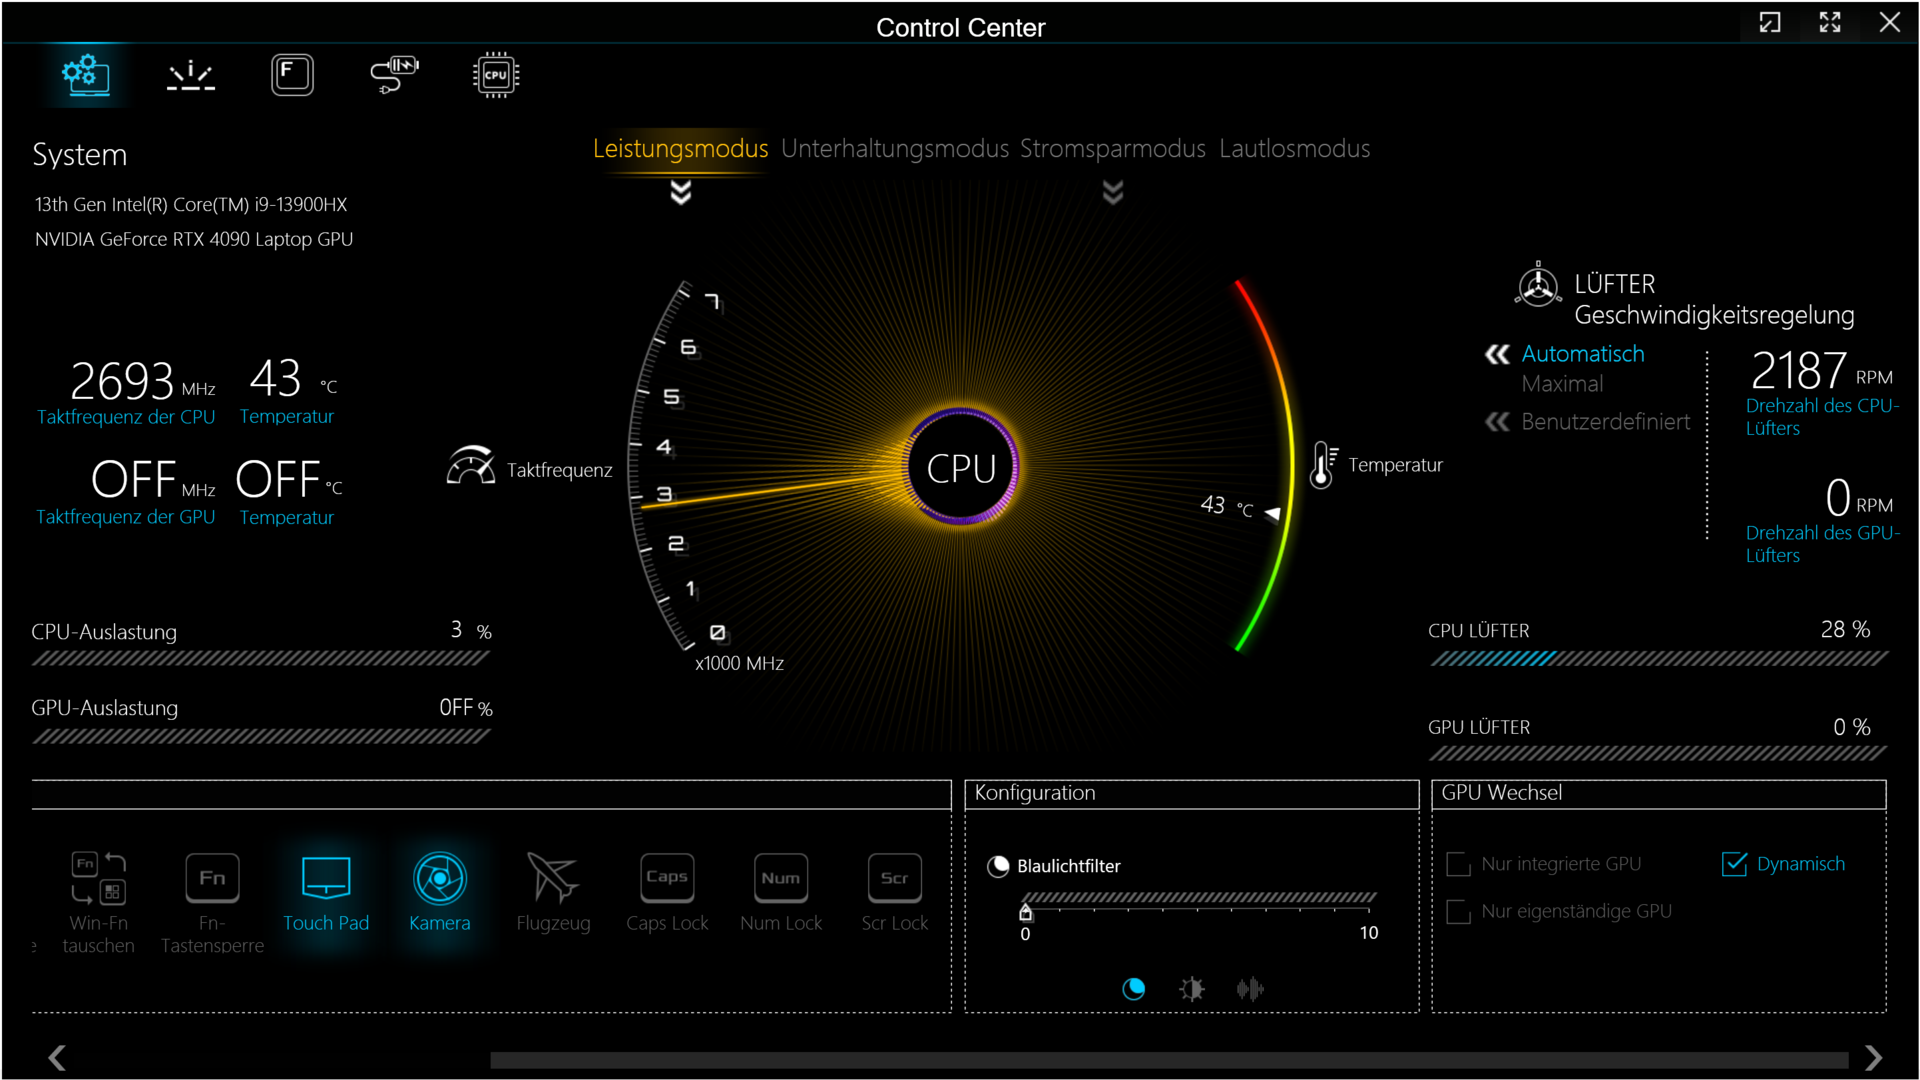
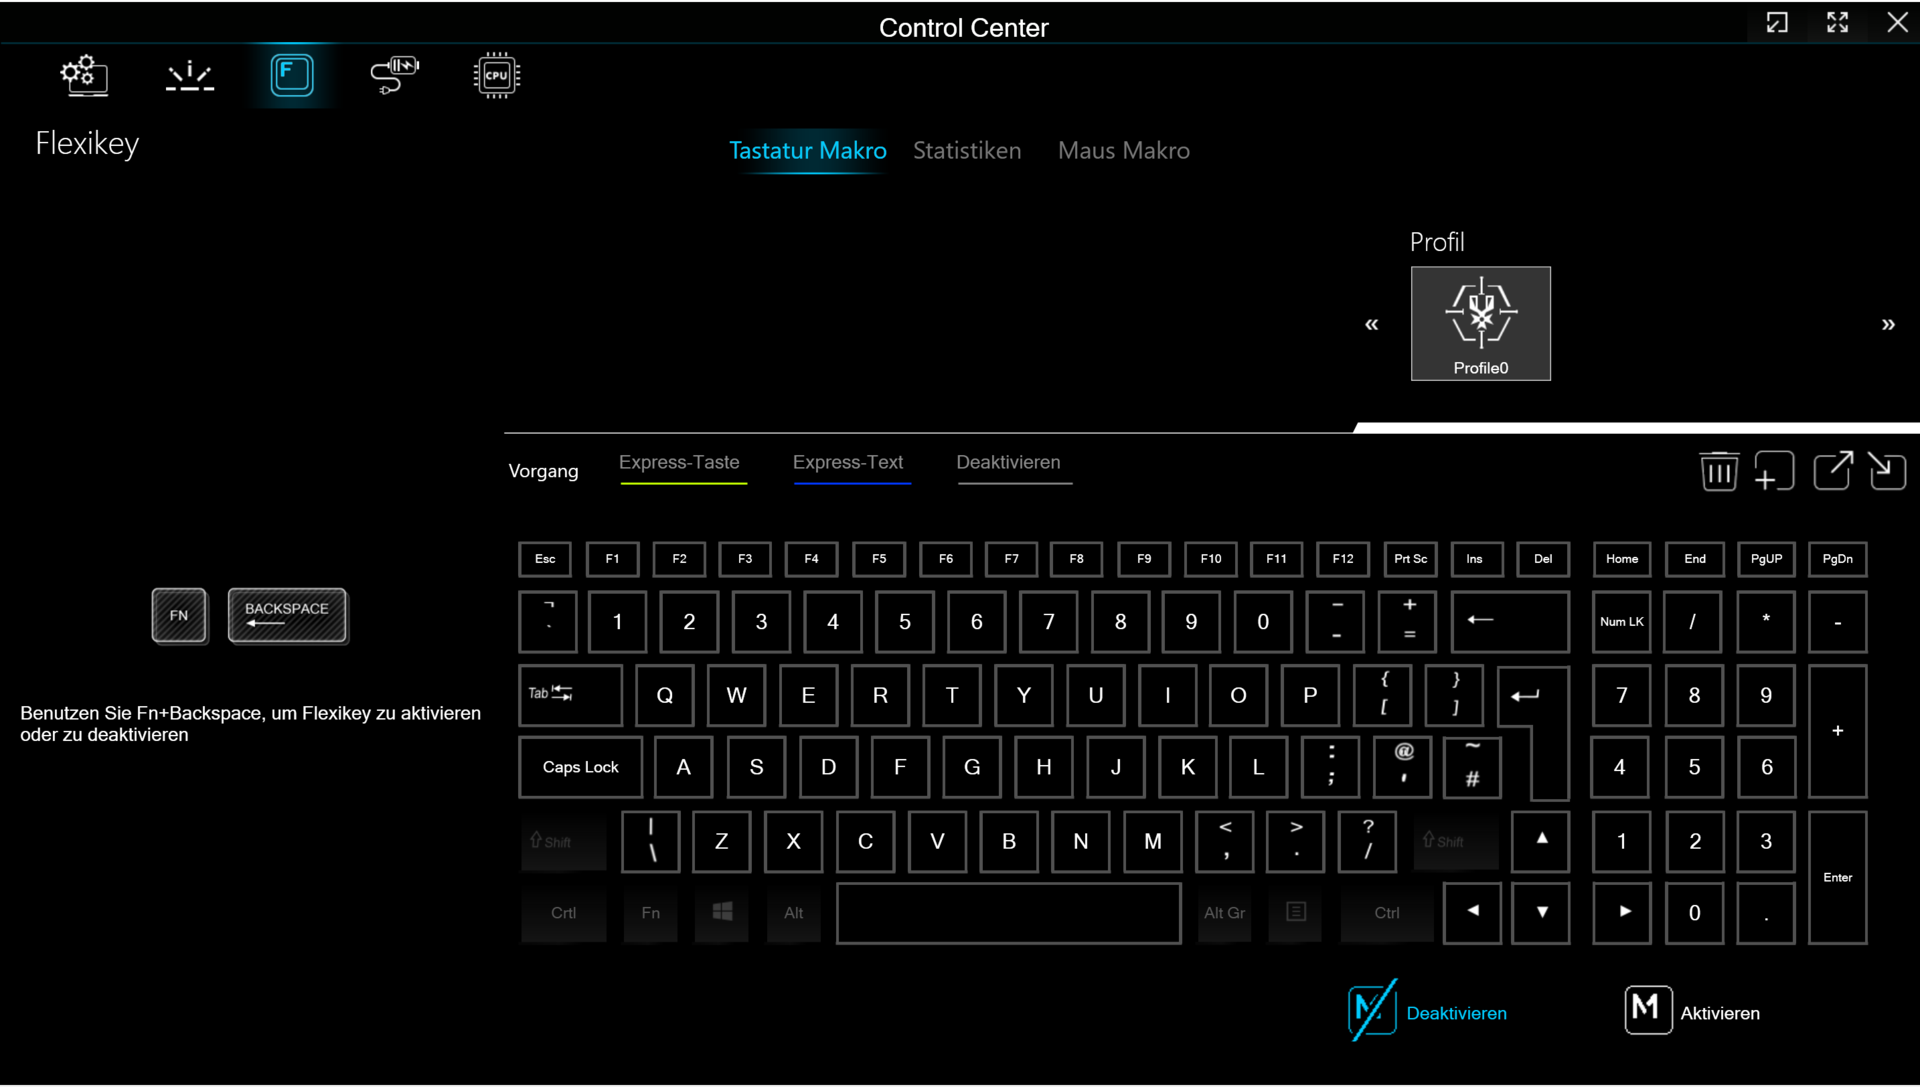
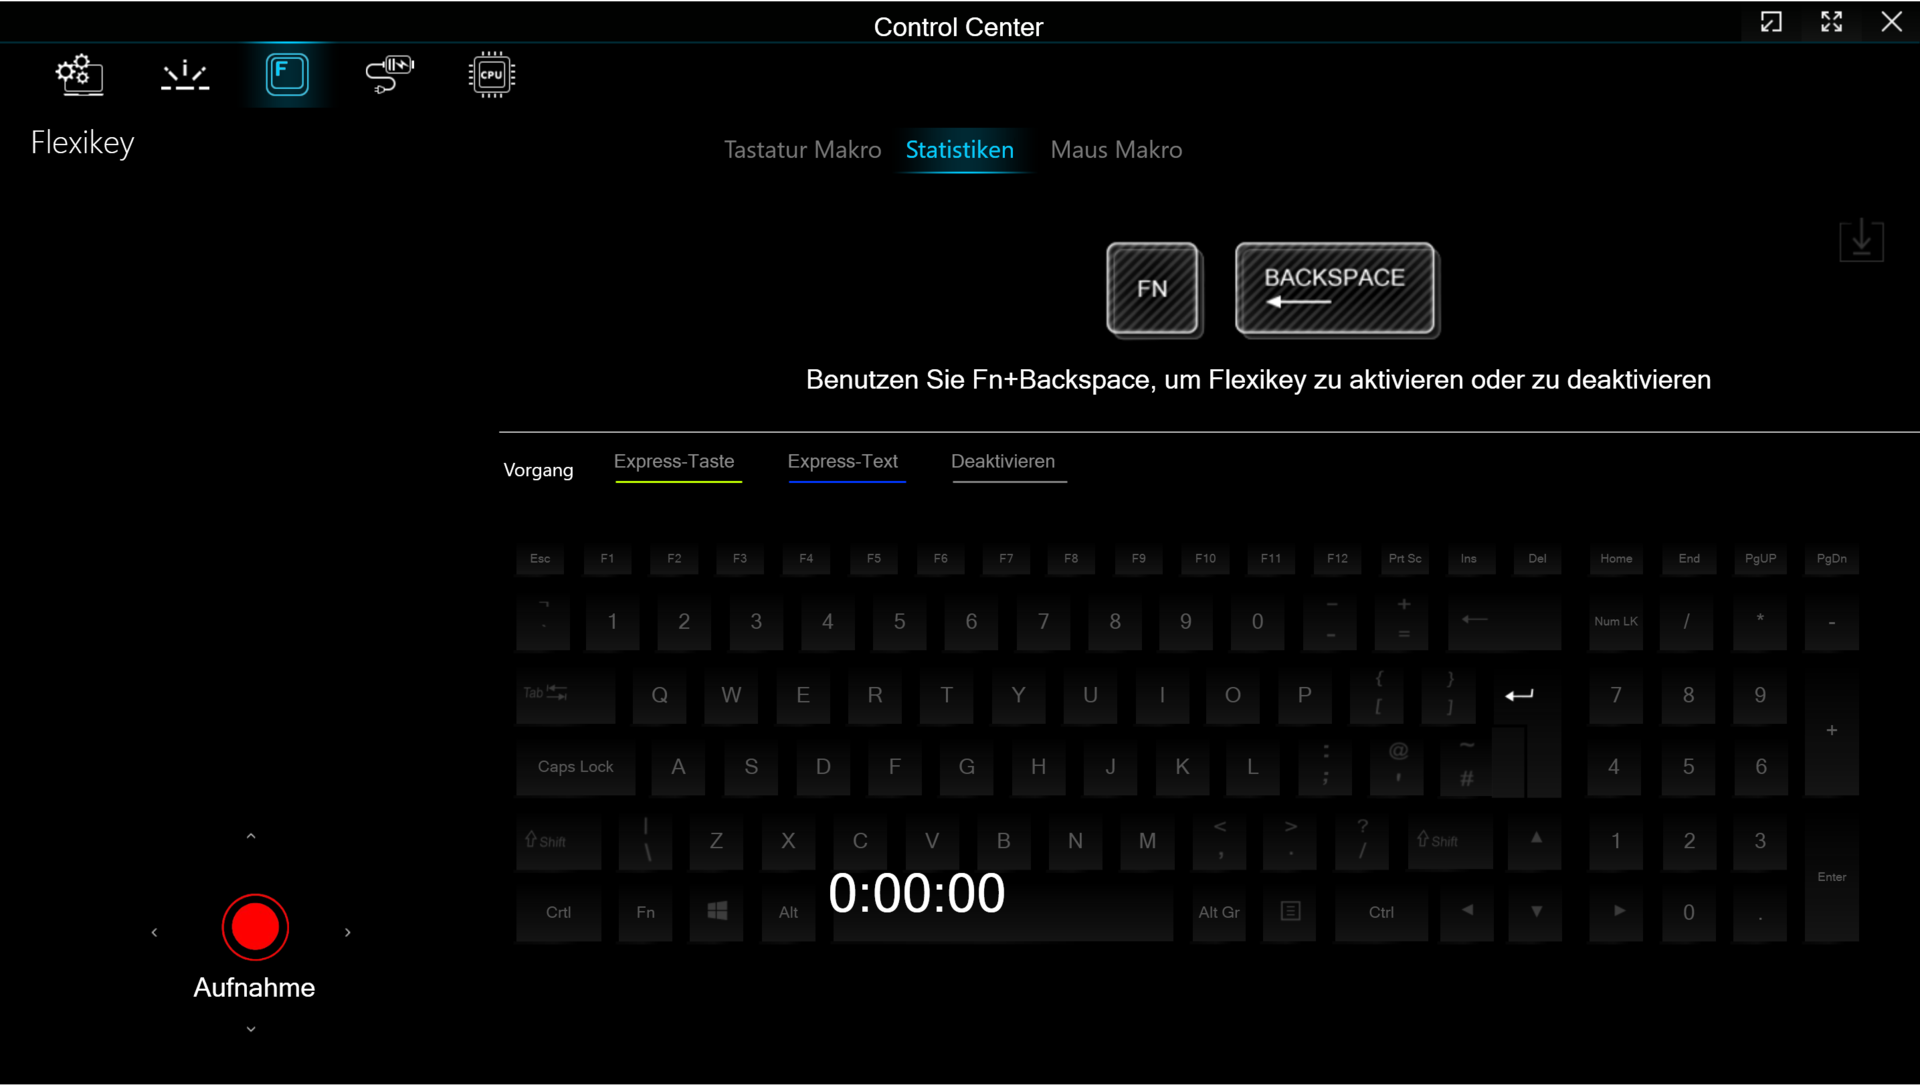
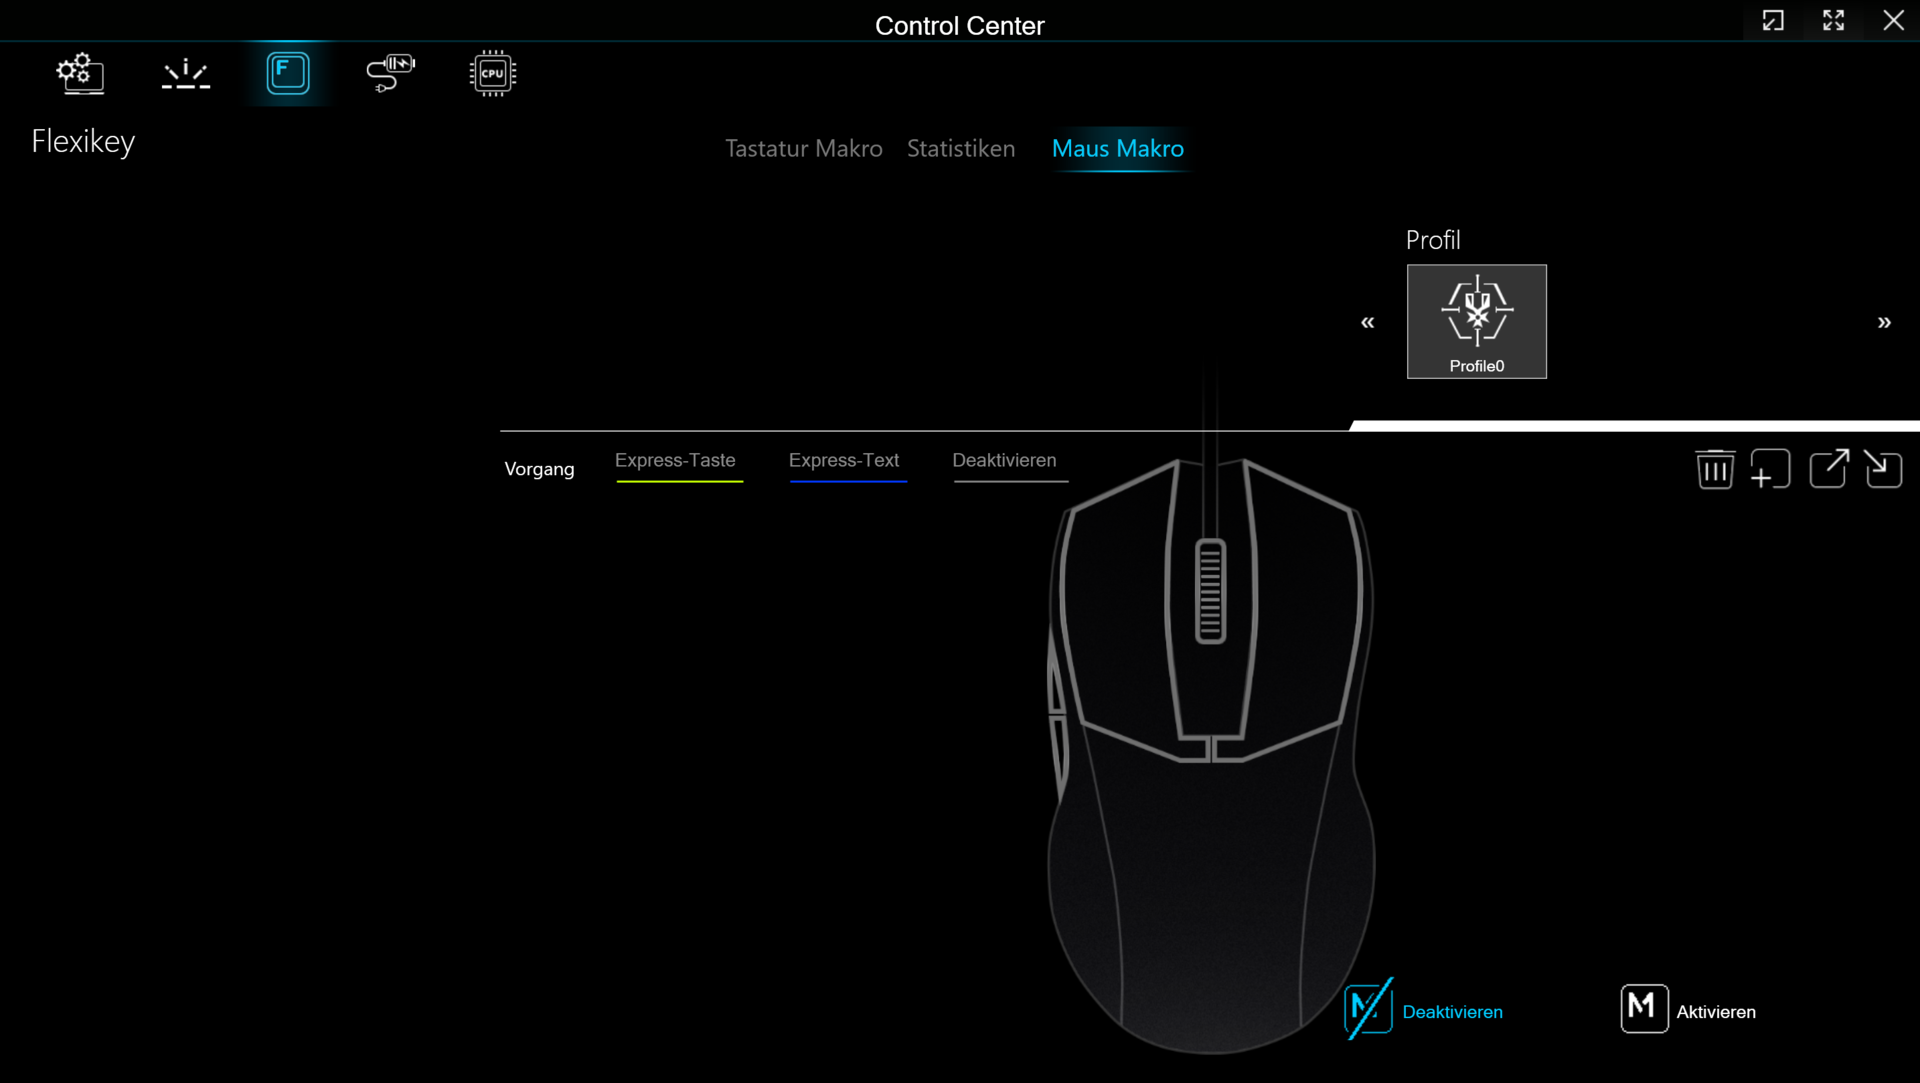
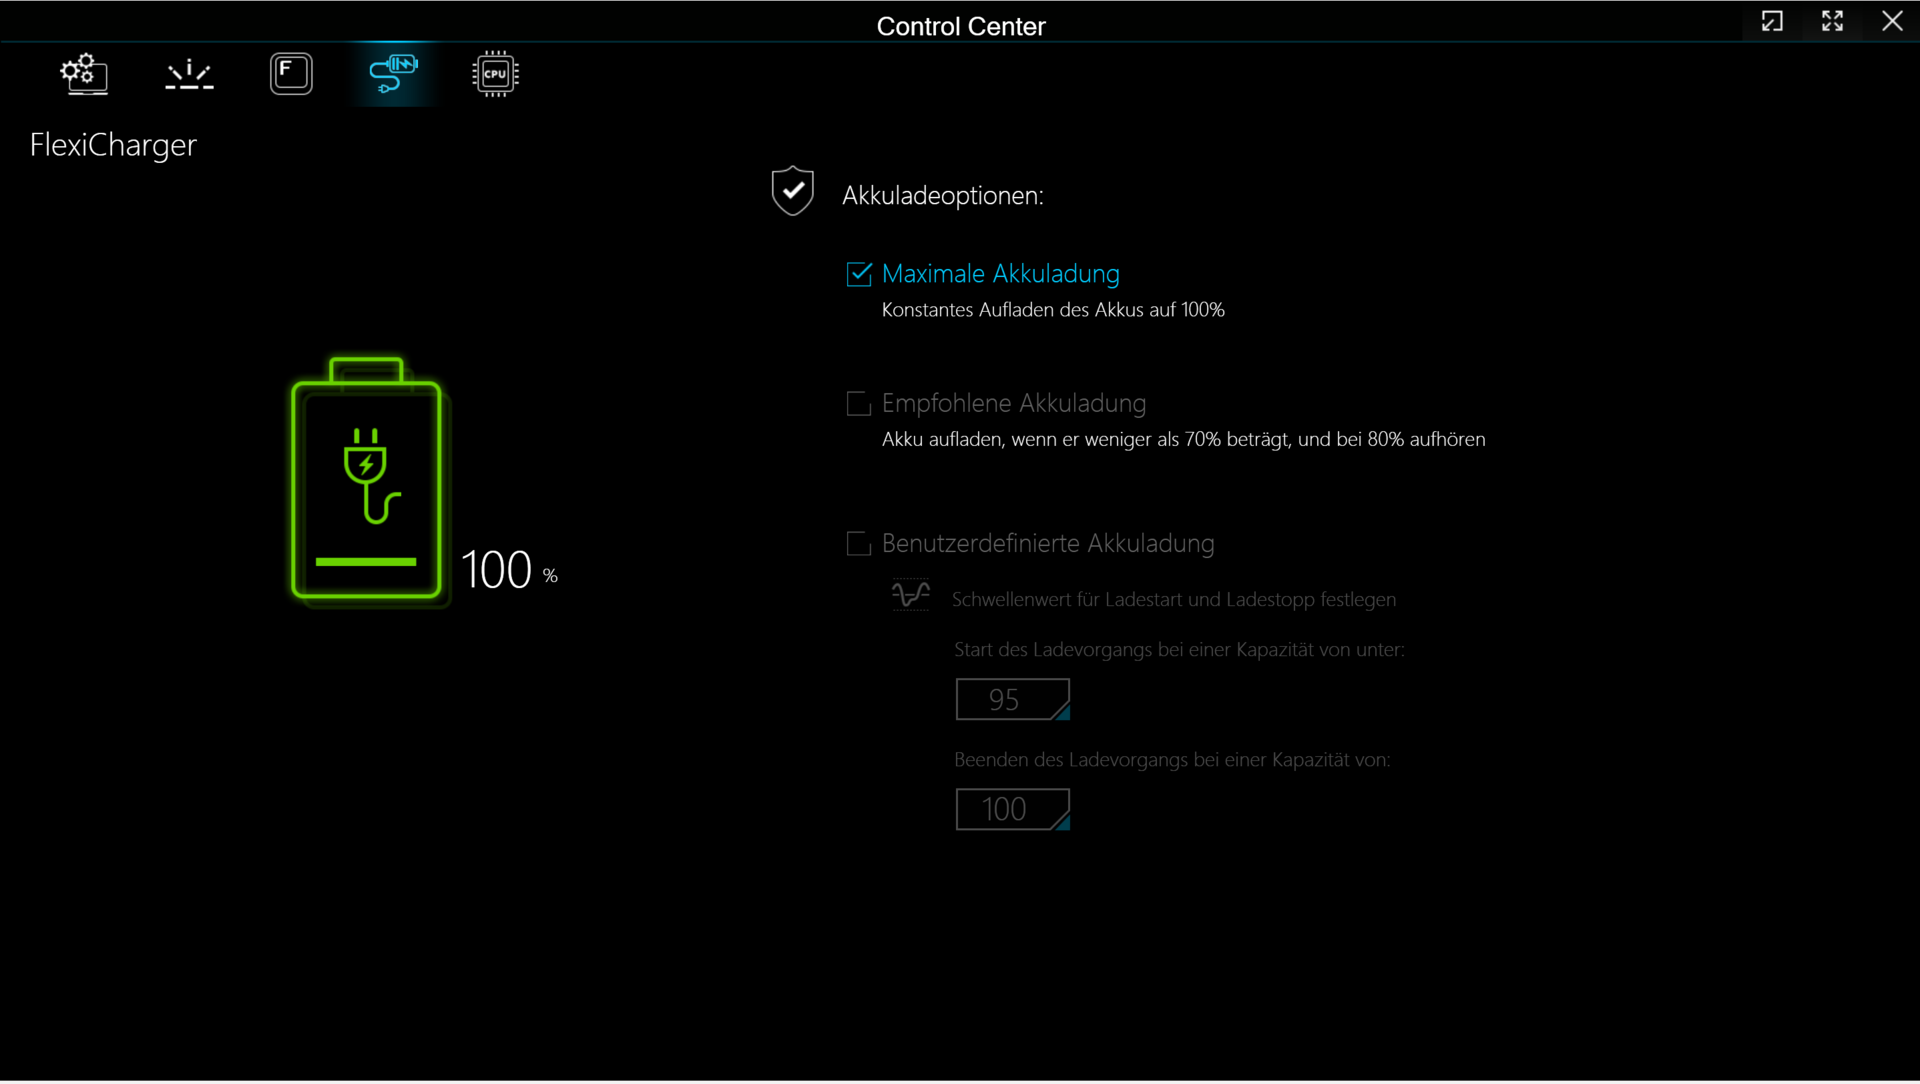
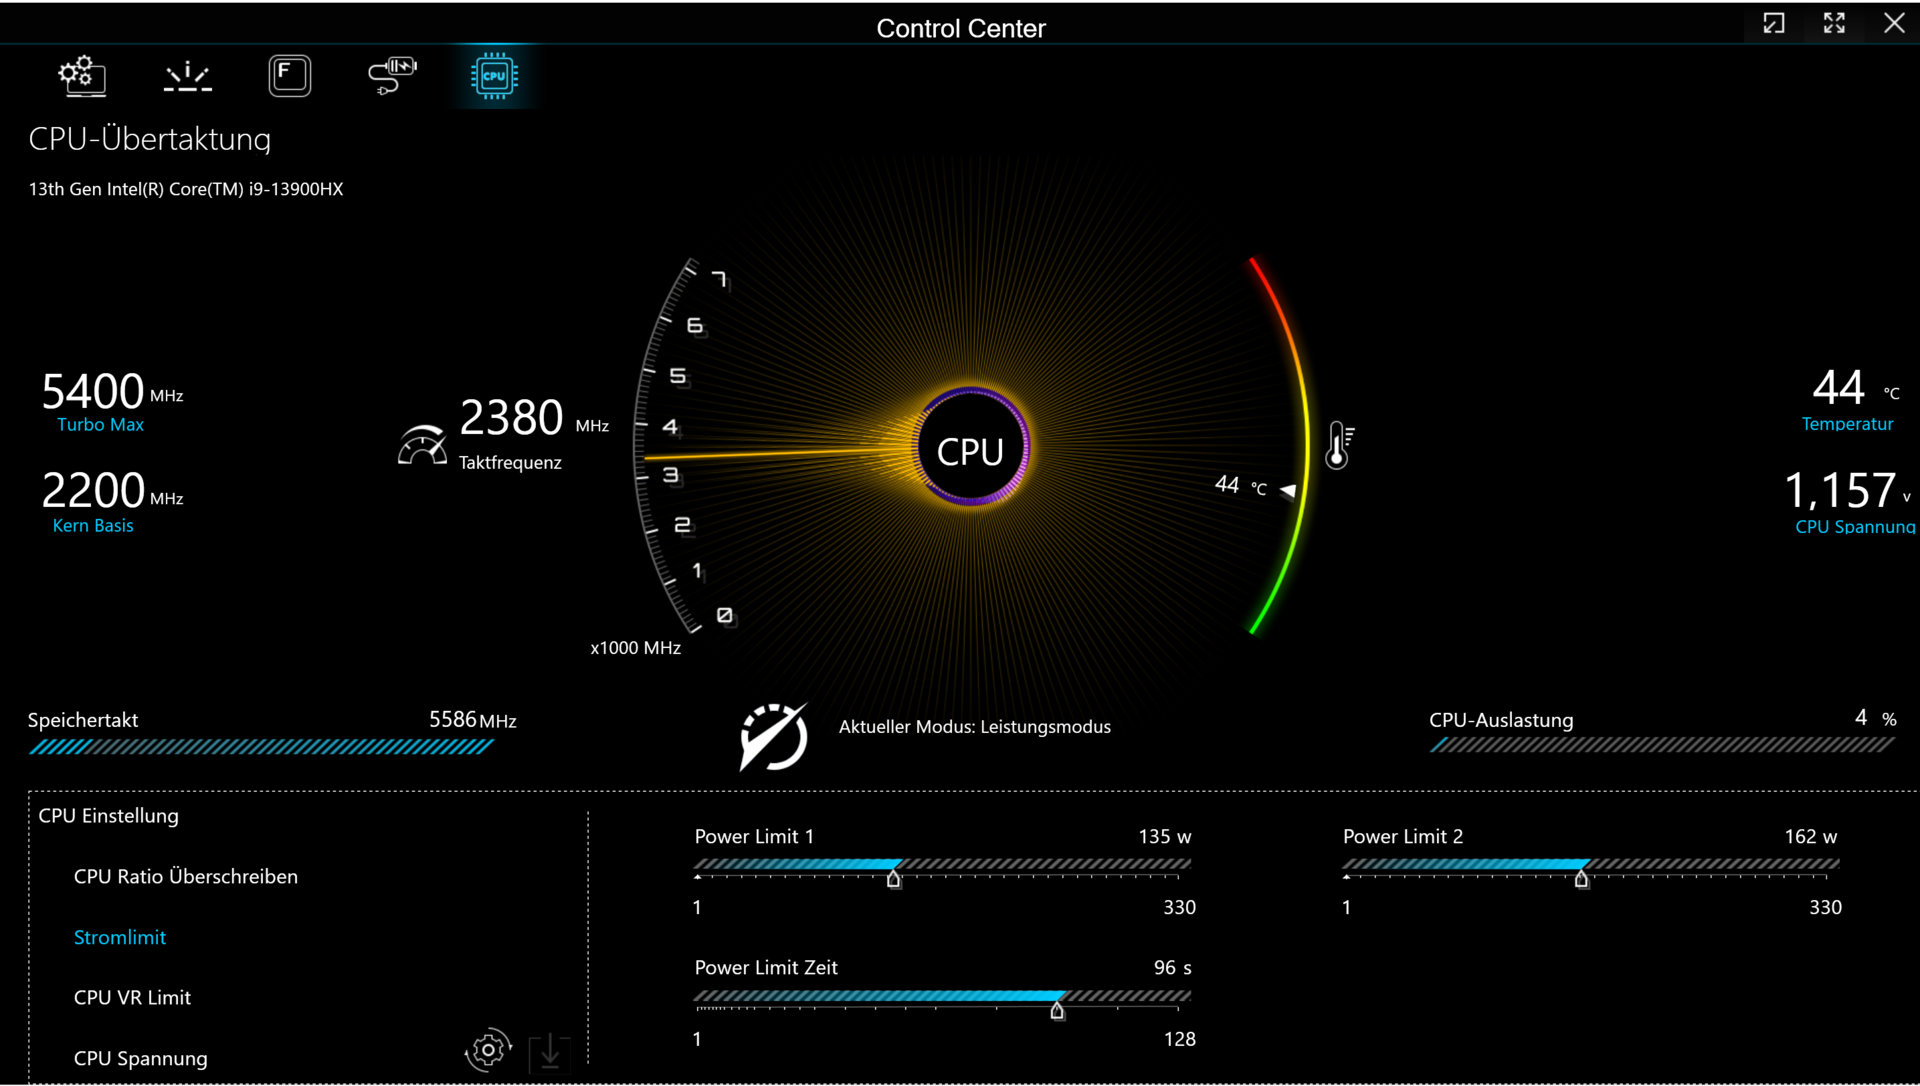
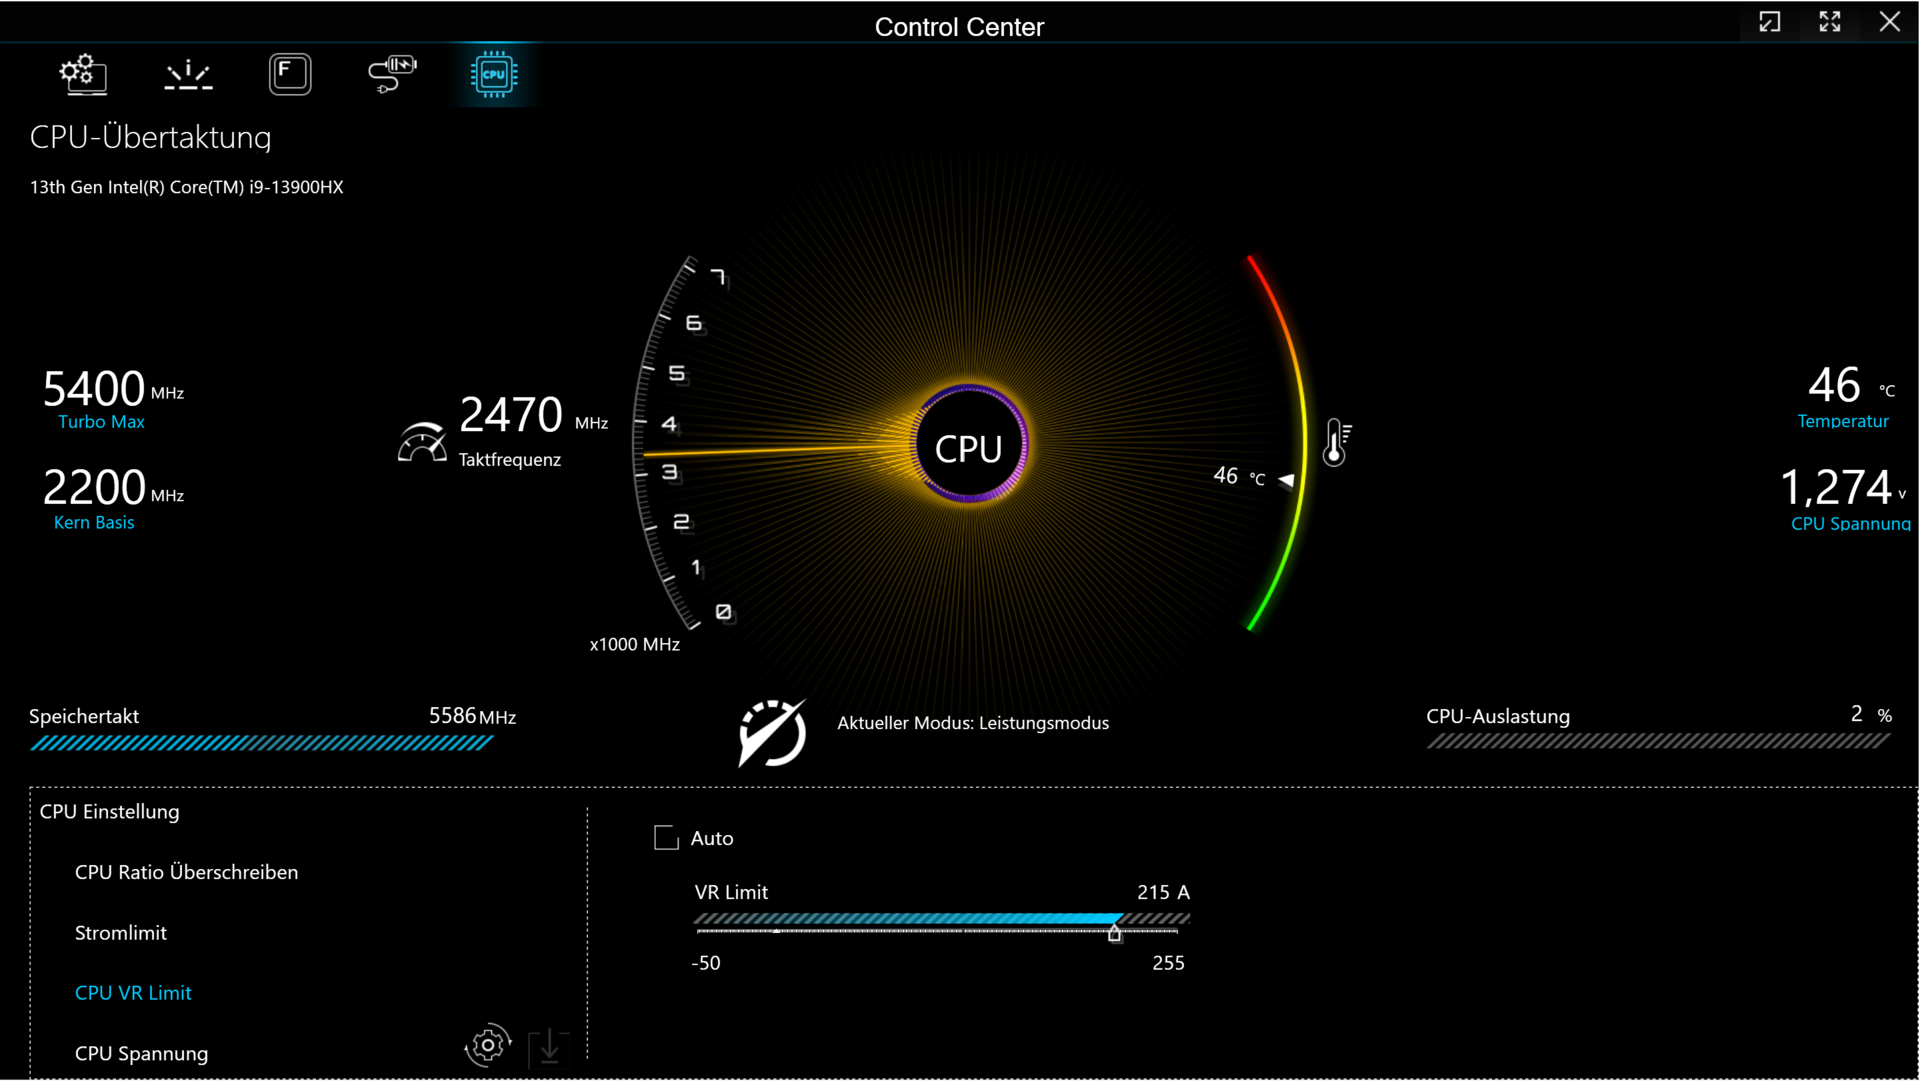
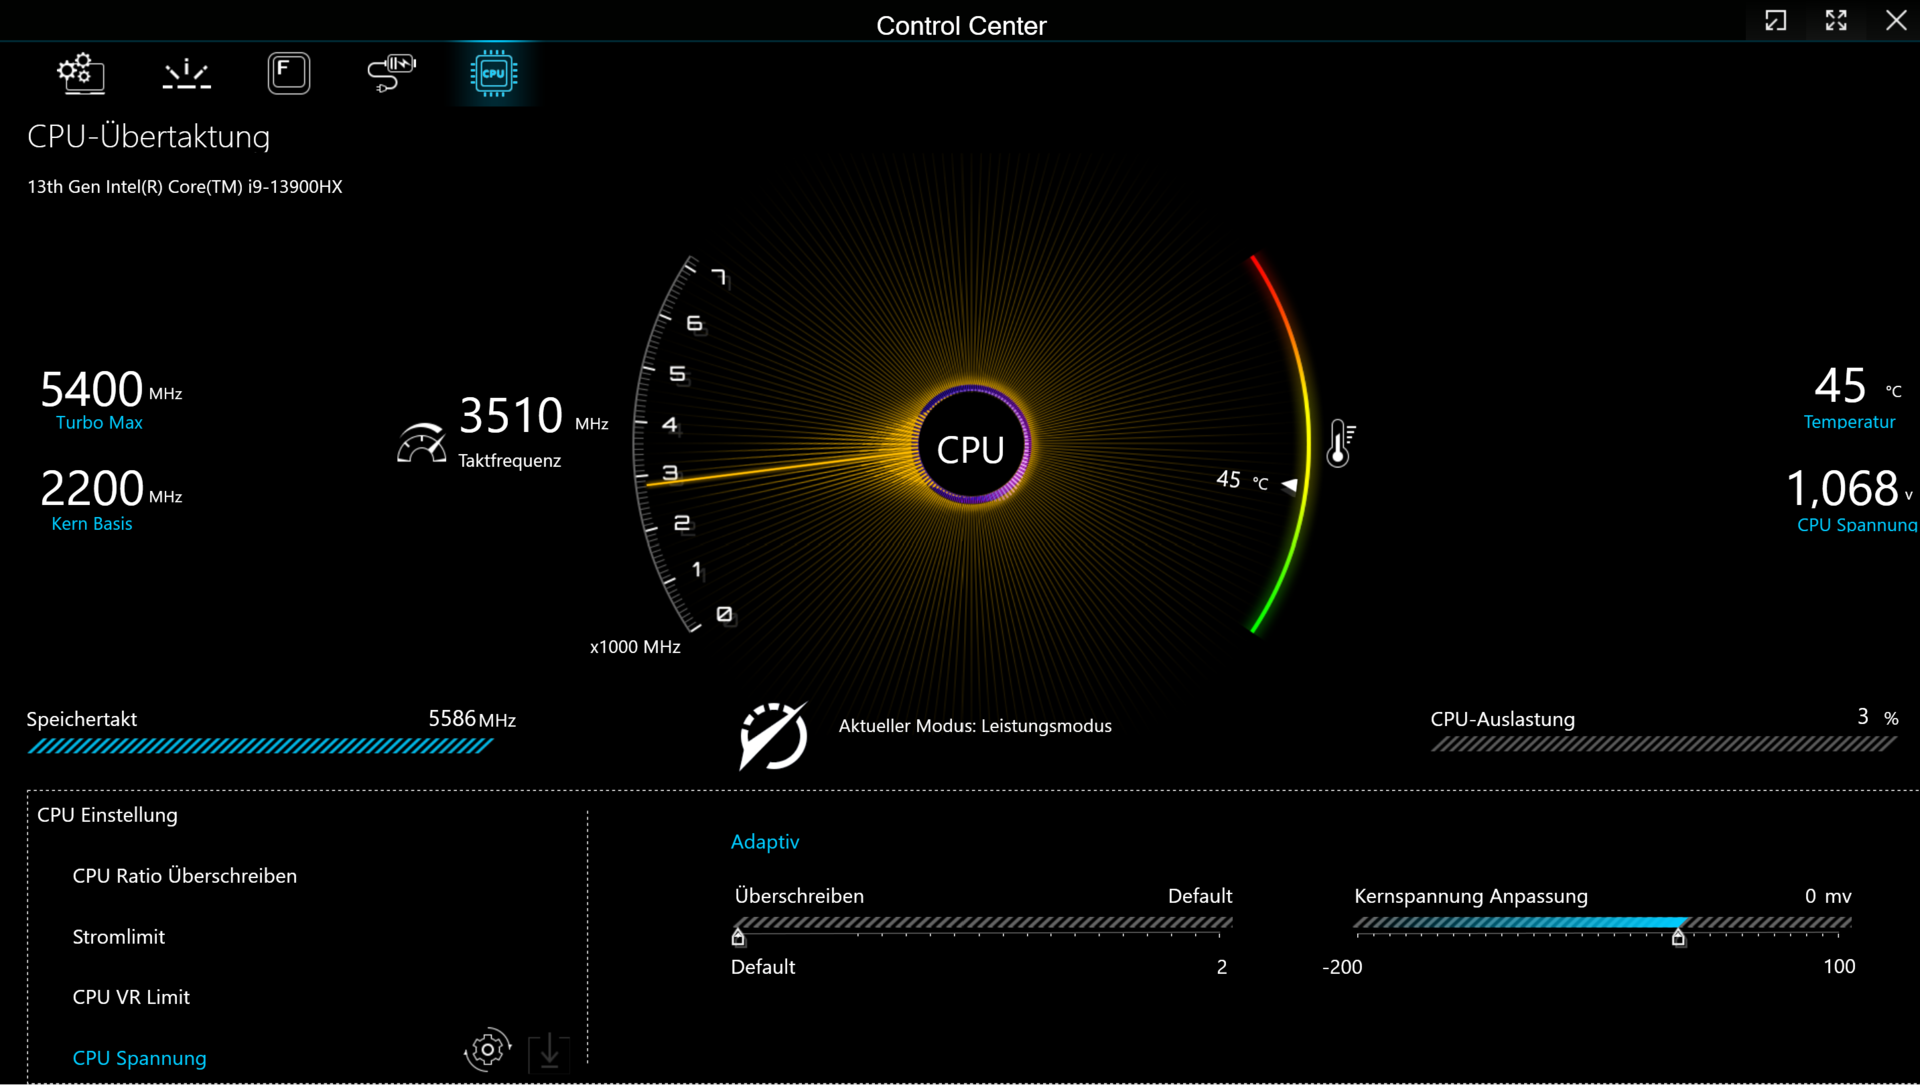
Key 17 Pro erbjuder fyra tillverkarspecificerade strömlägen (se tabell). Du kan växla mellan dem med hjälp av Control Center-programvaran som är installerad på den bärbara datorn. Vi körde våra benchmarks i "Performance mode" och vårt batteritidstest i "Power Saver mode" (med RTX 4090 inaktiverad. Optimus var aktiverat under våra tester.
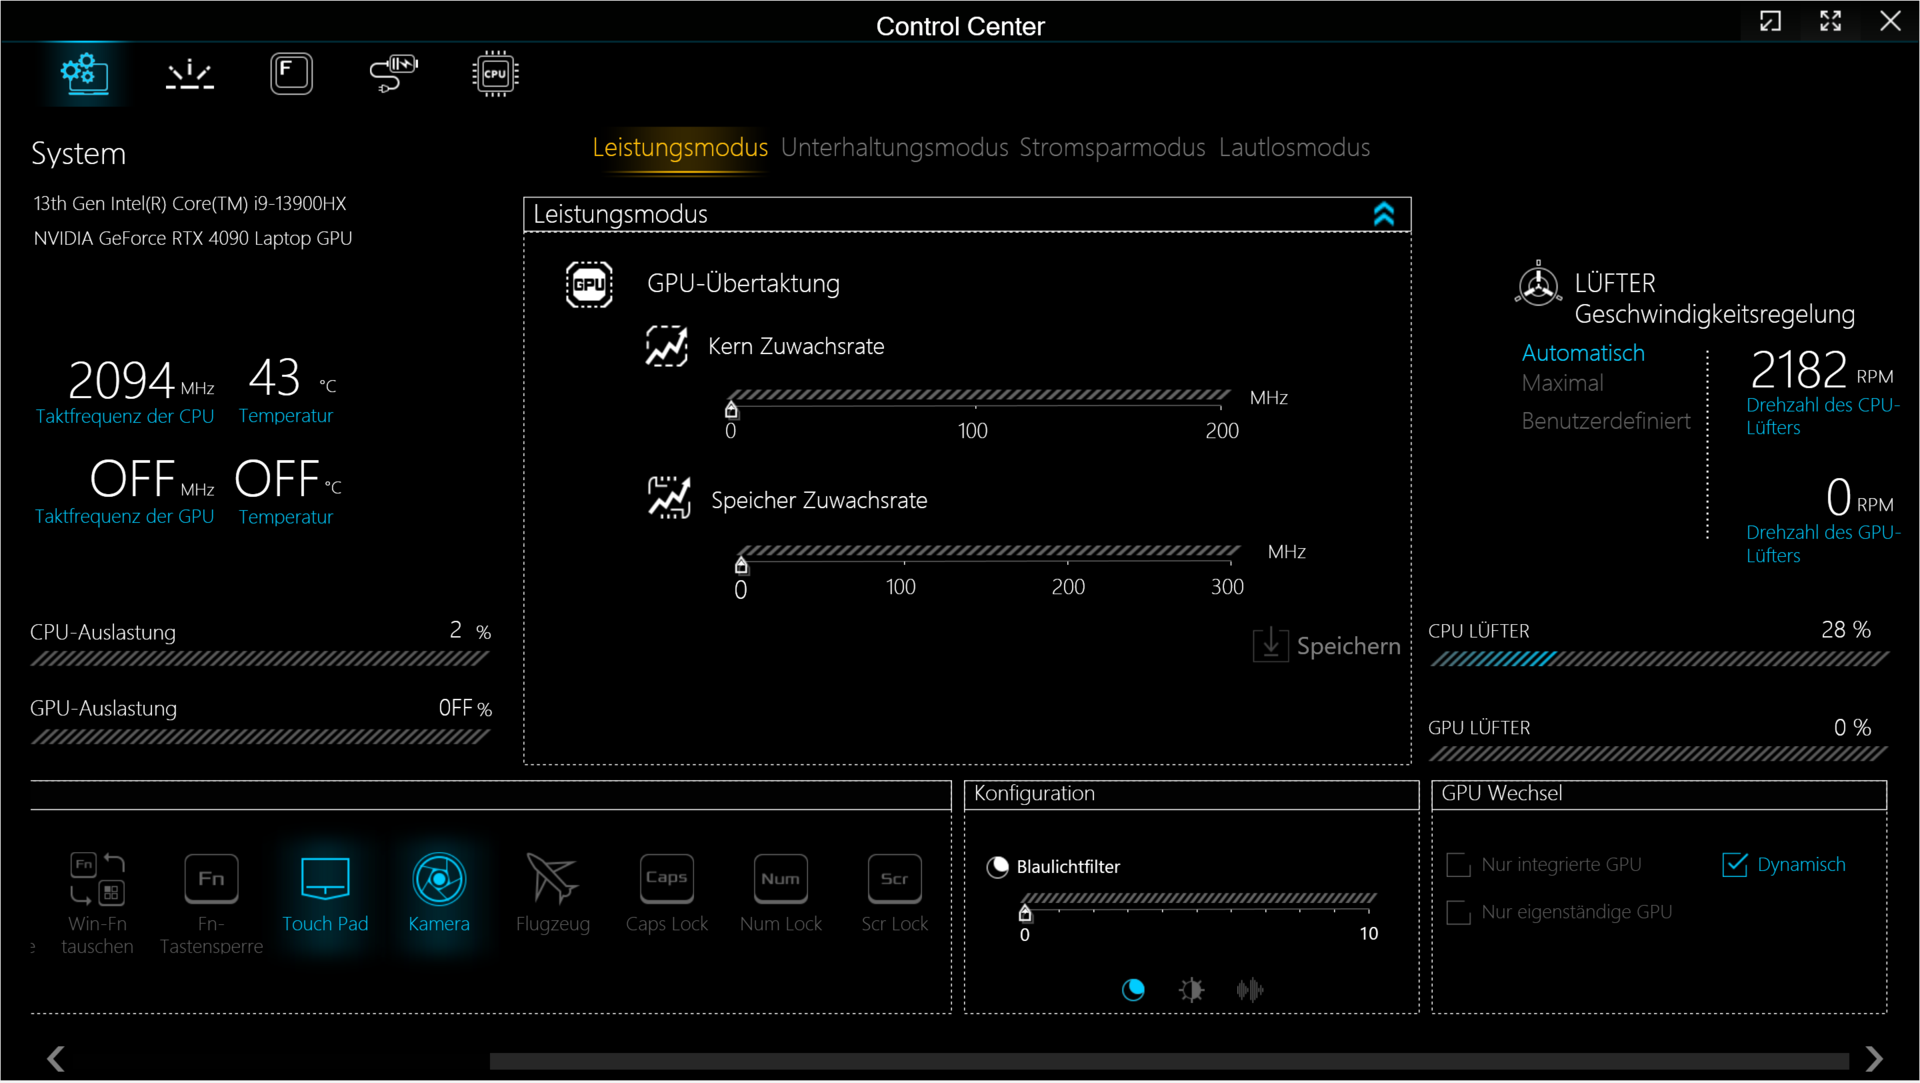
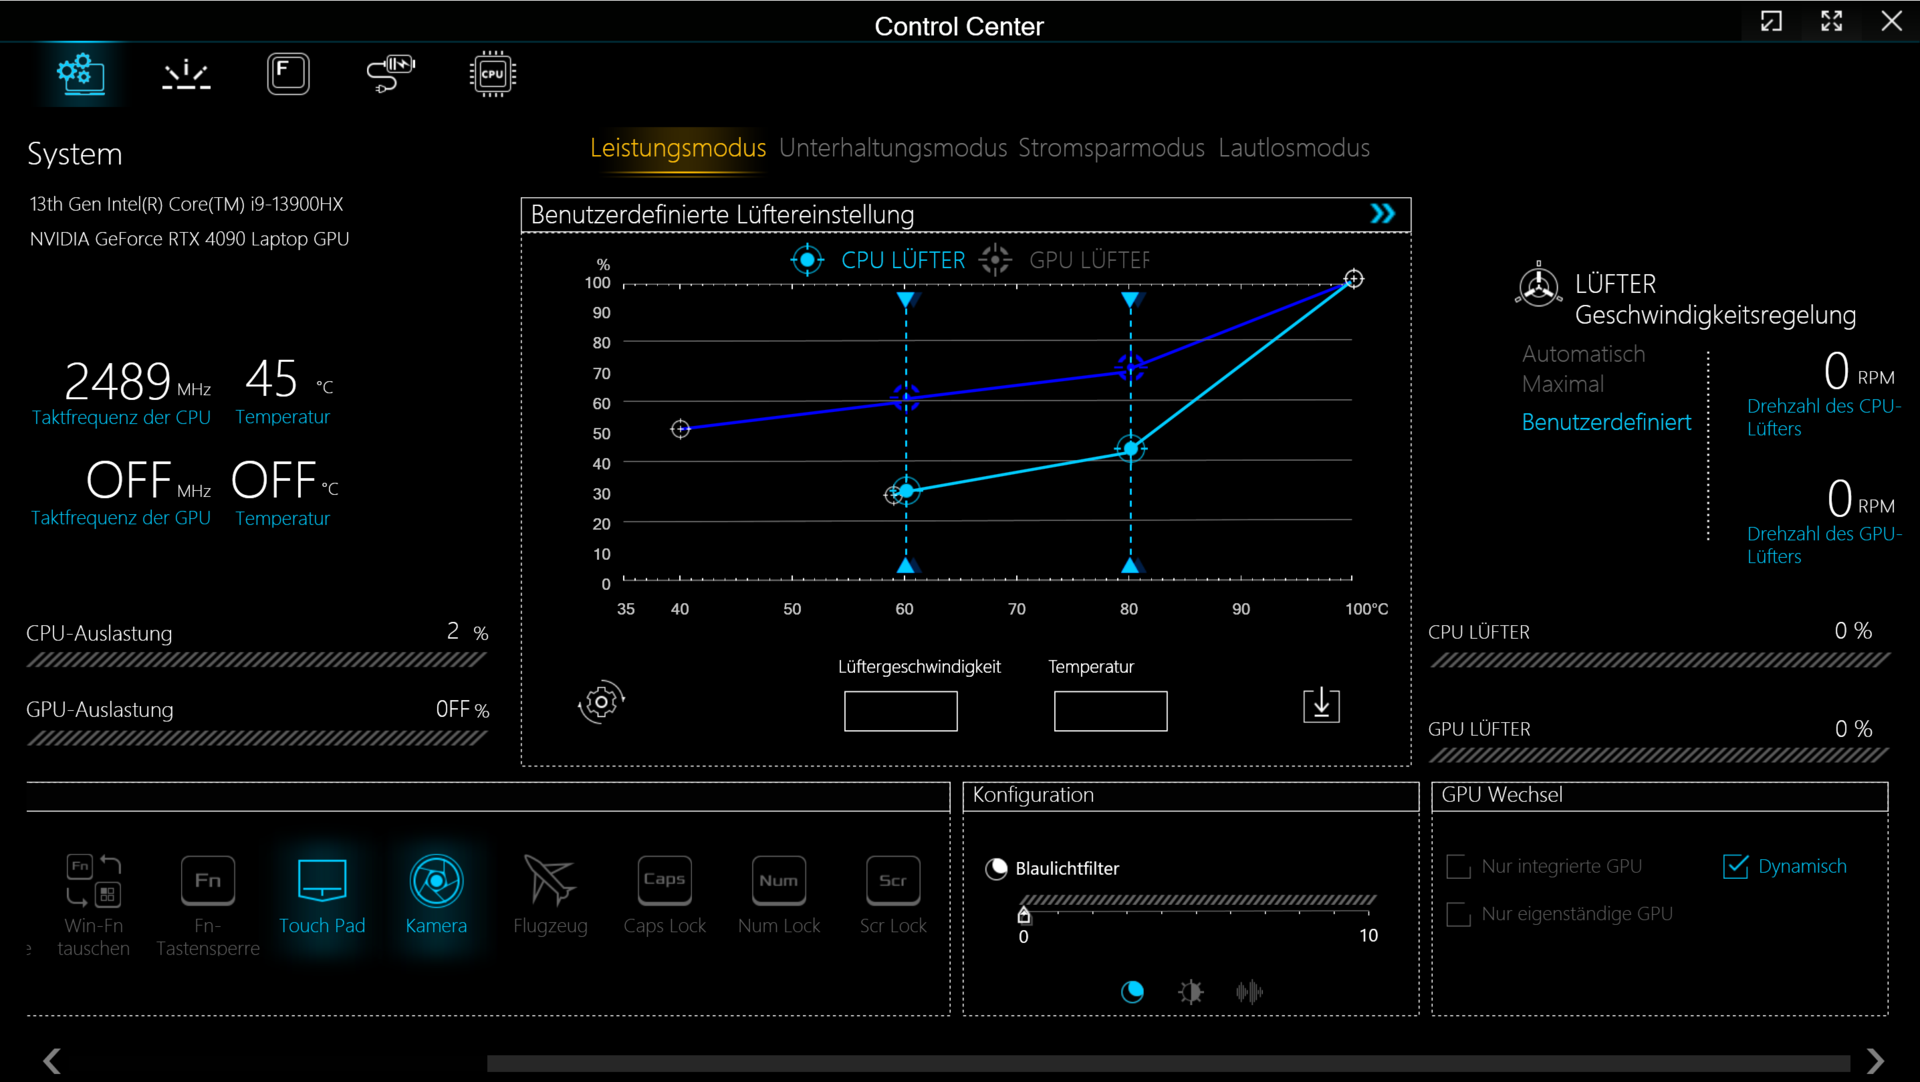
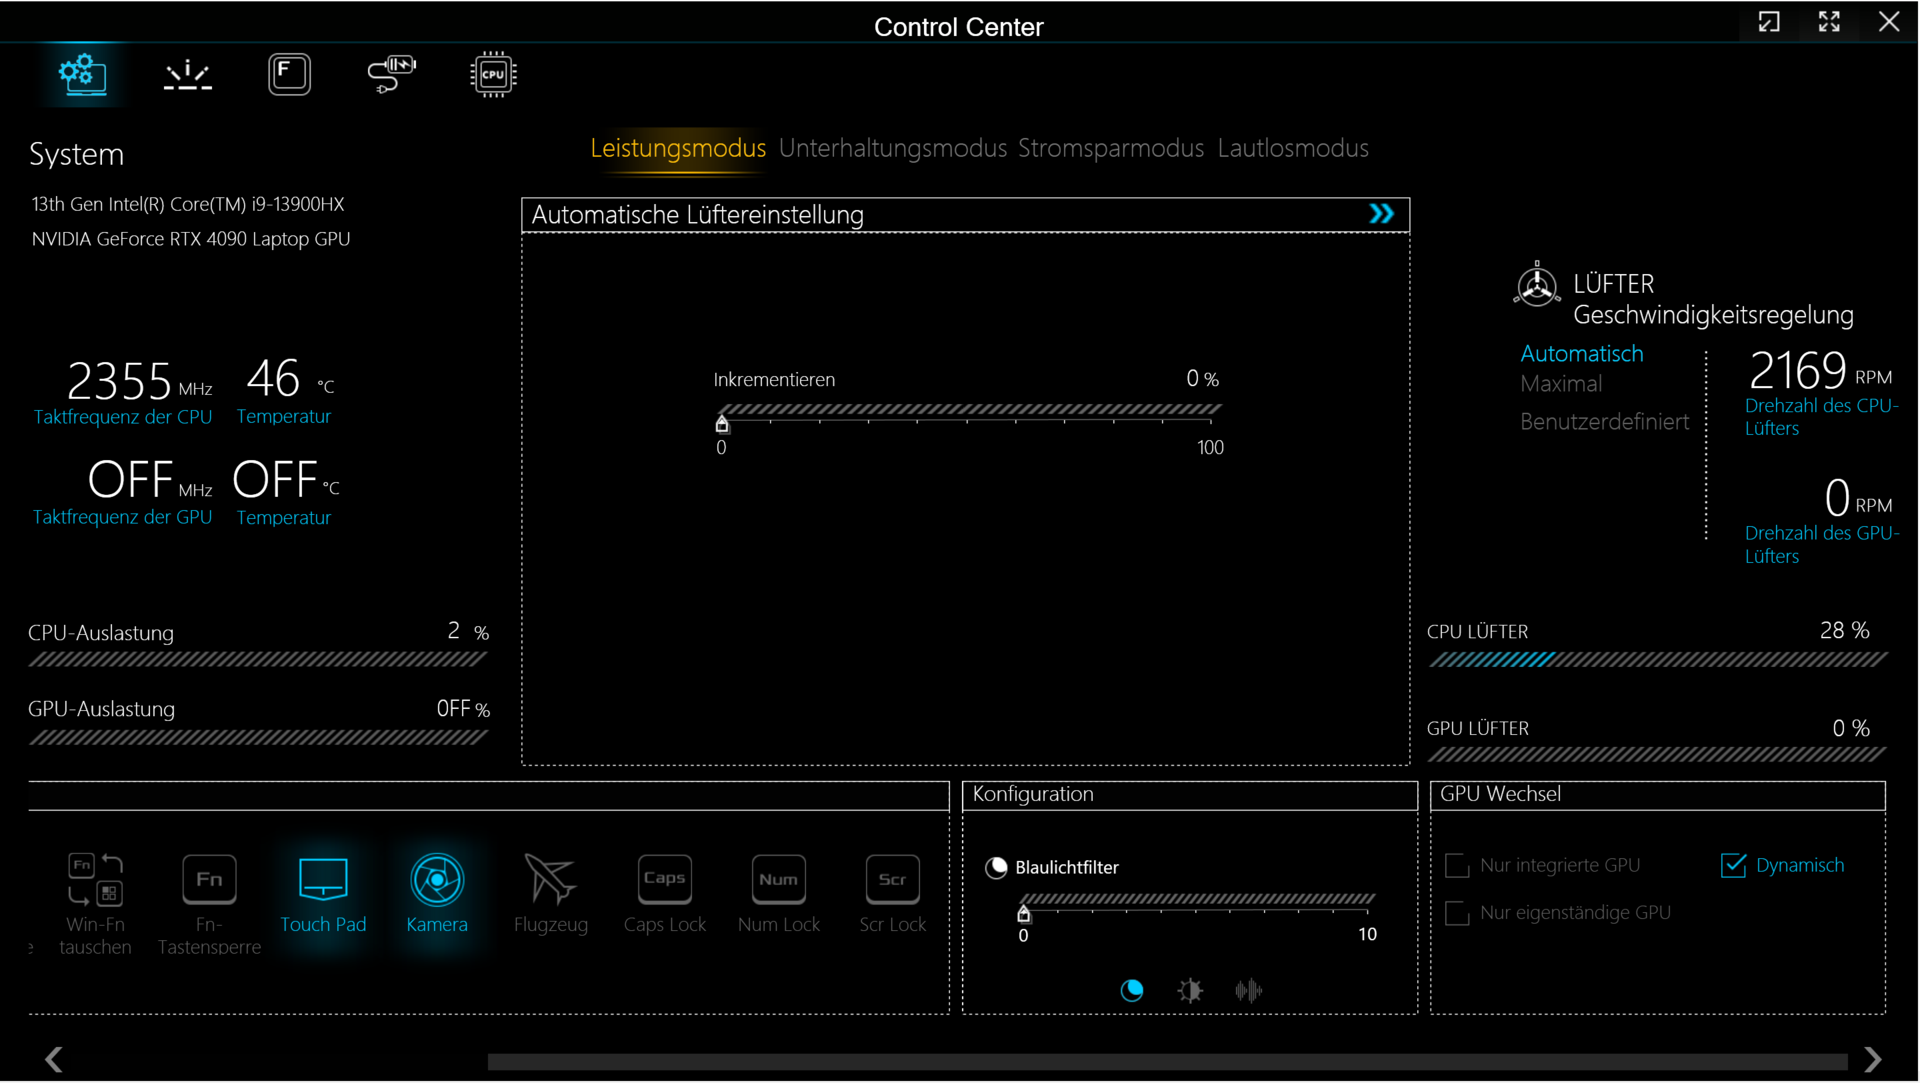
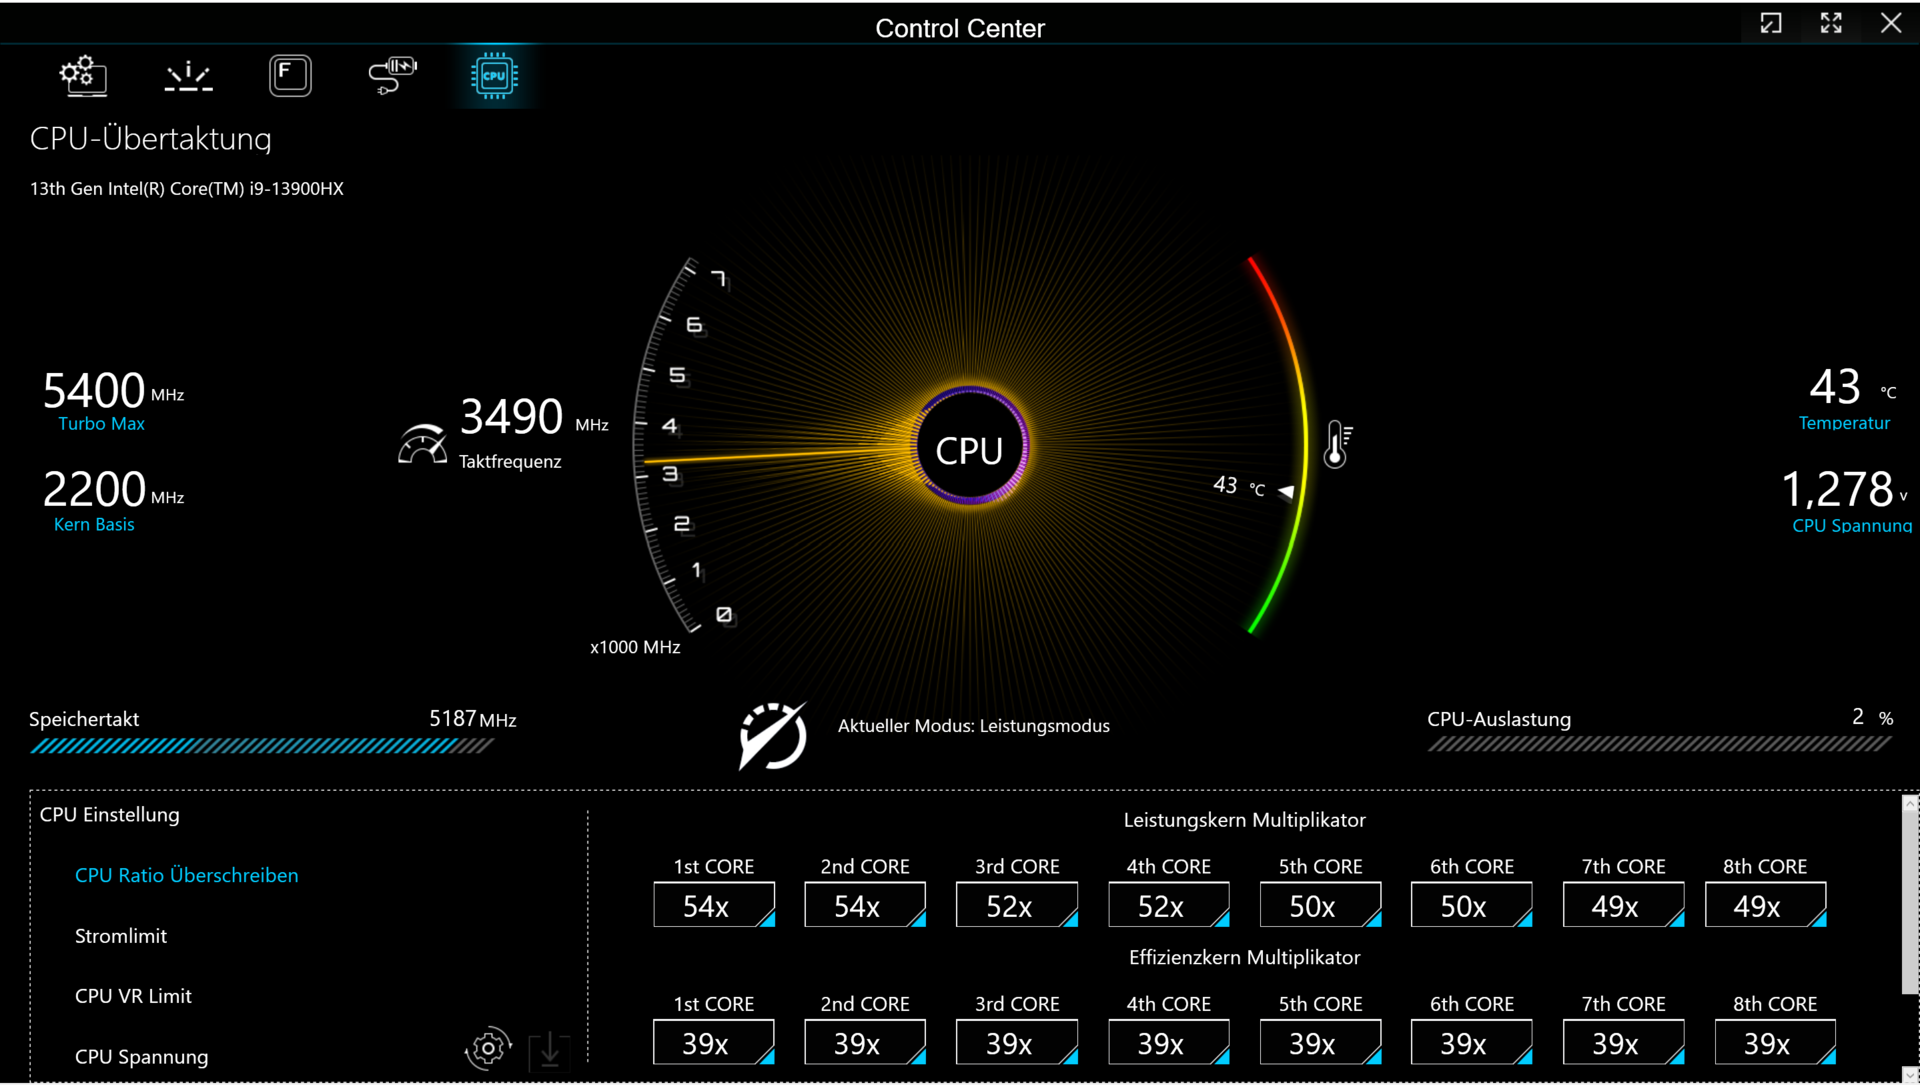
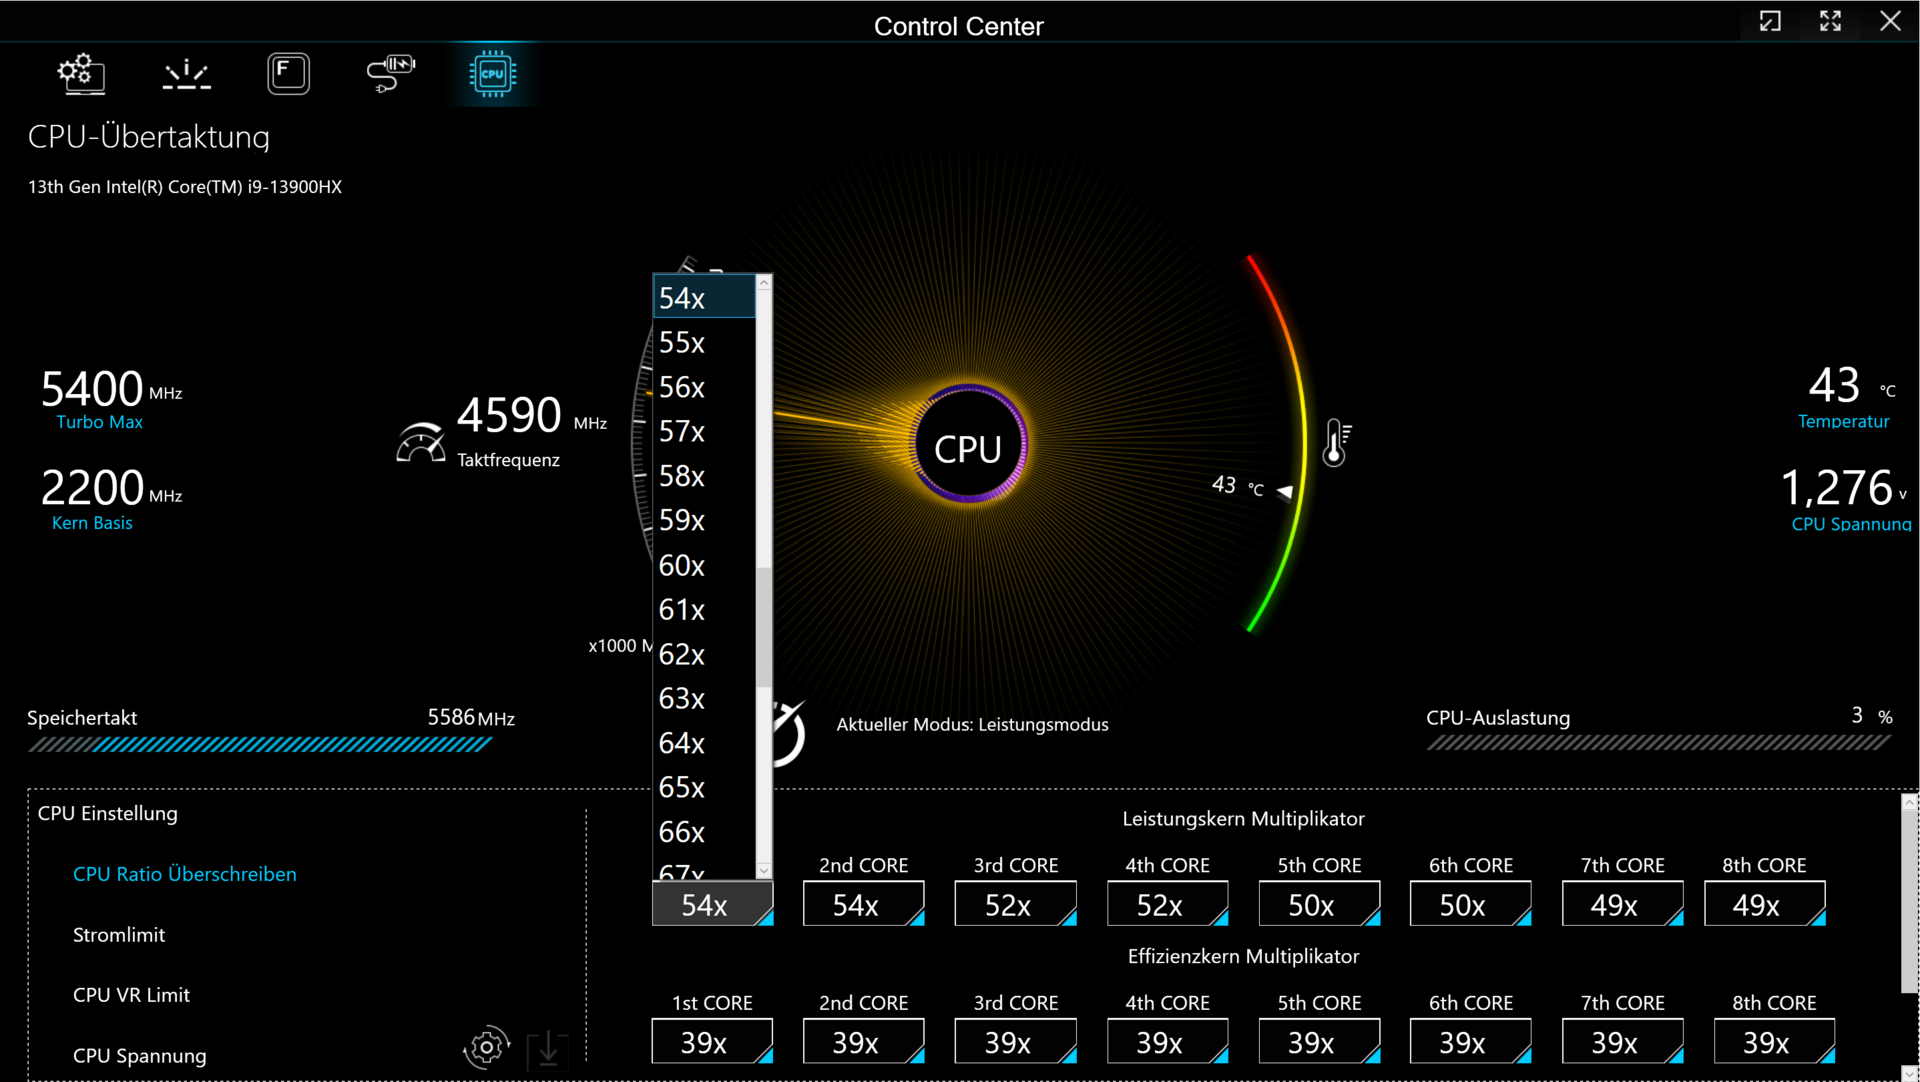
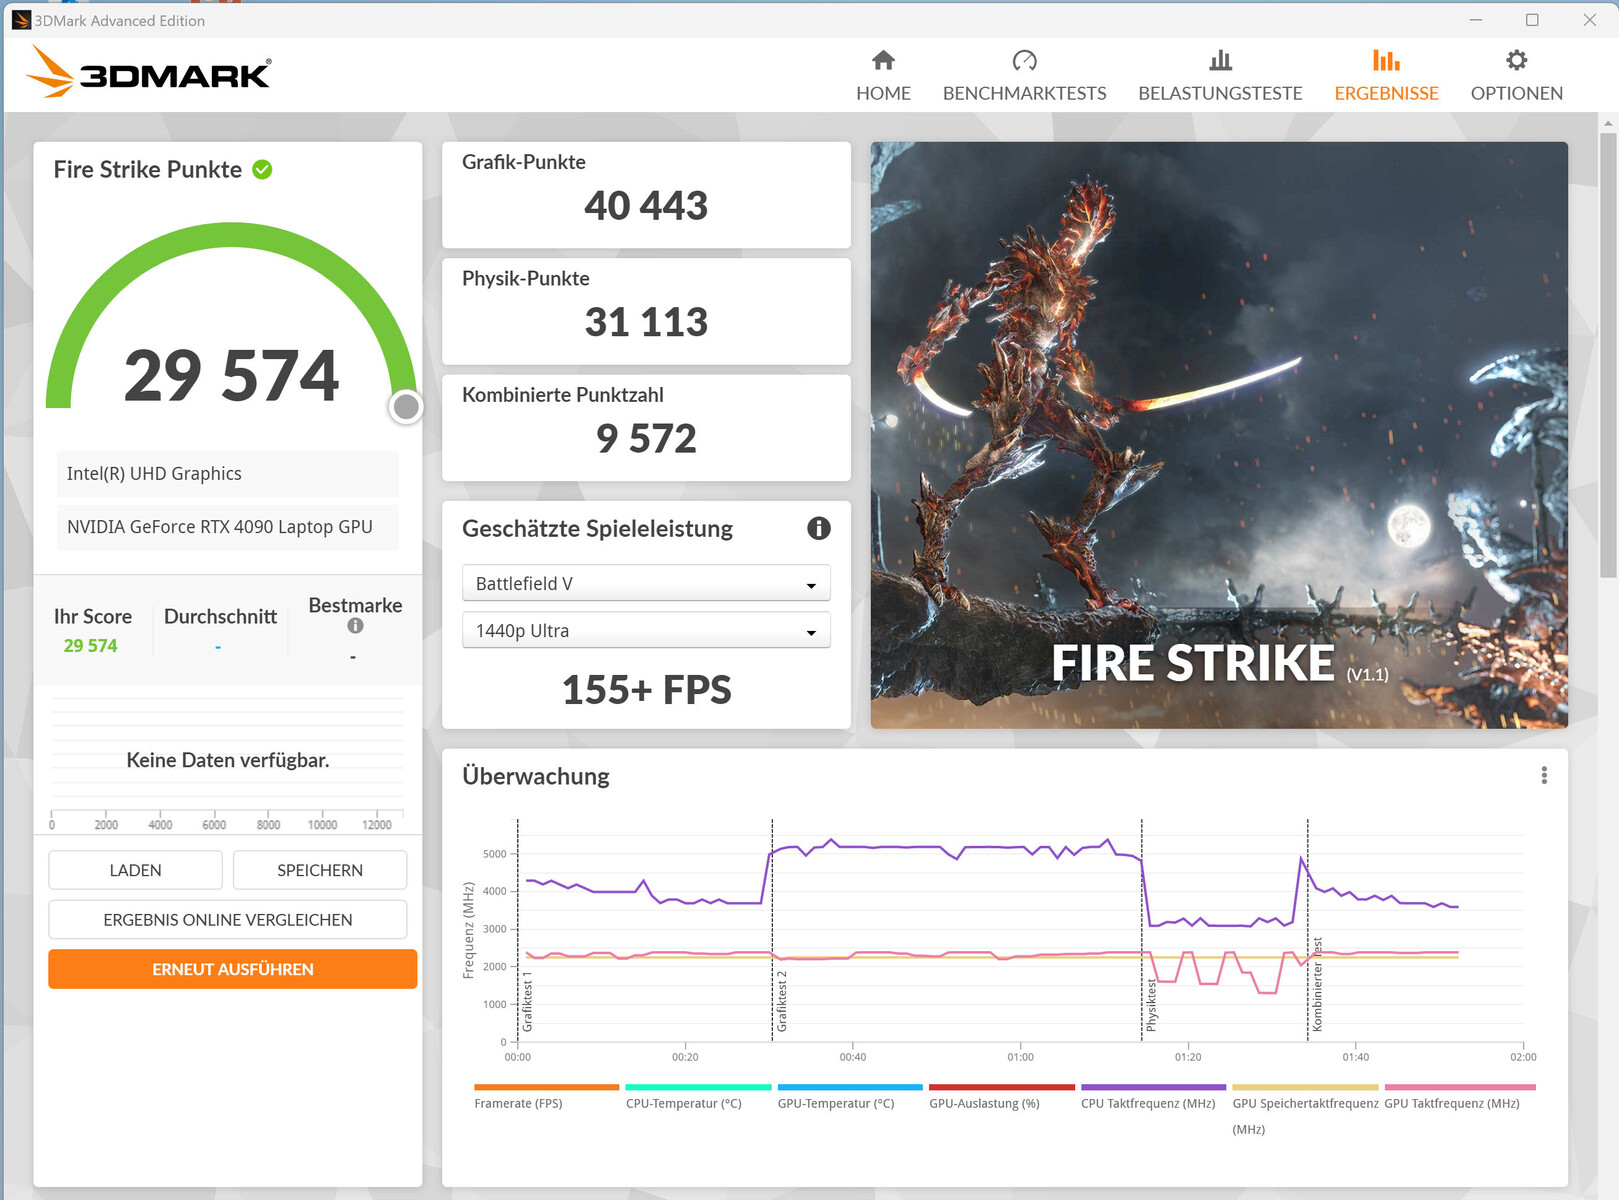
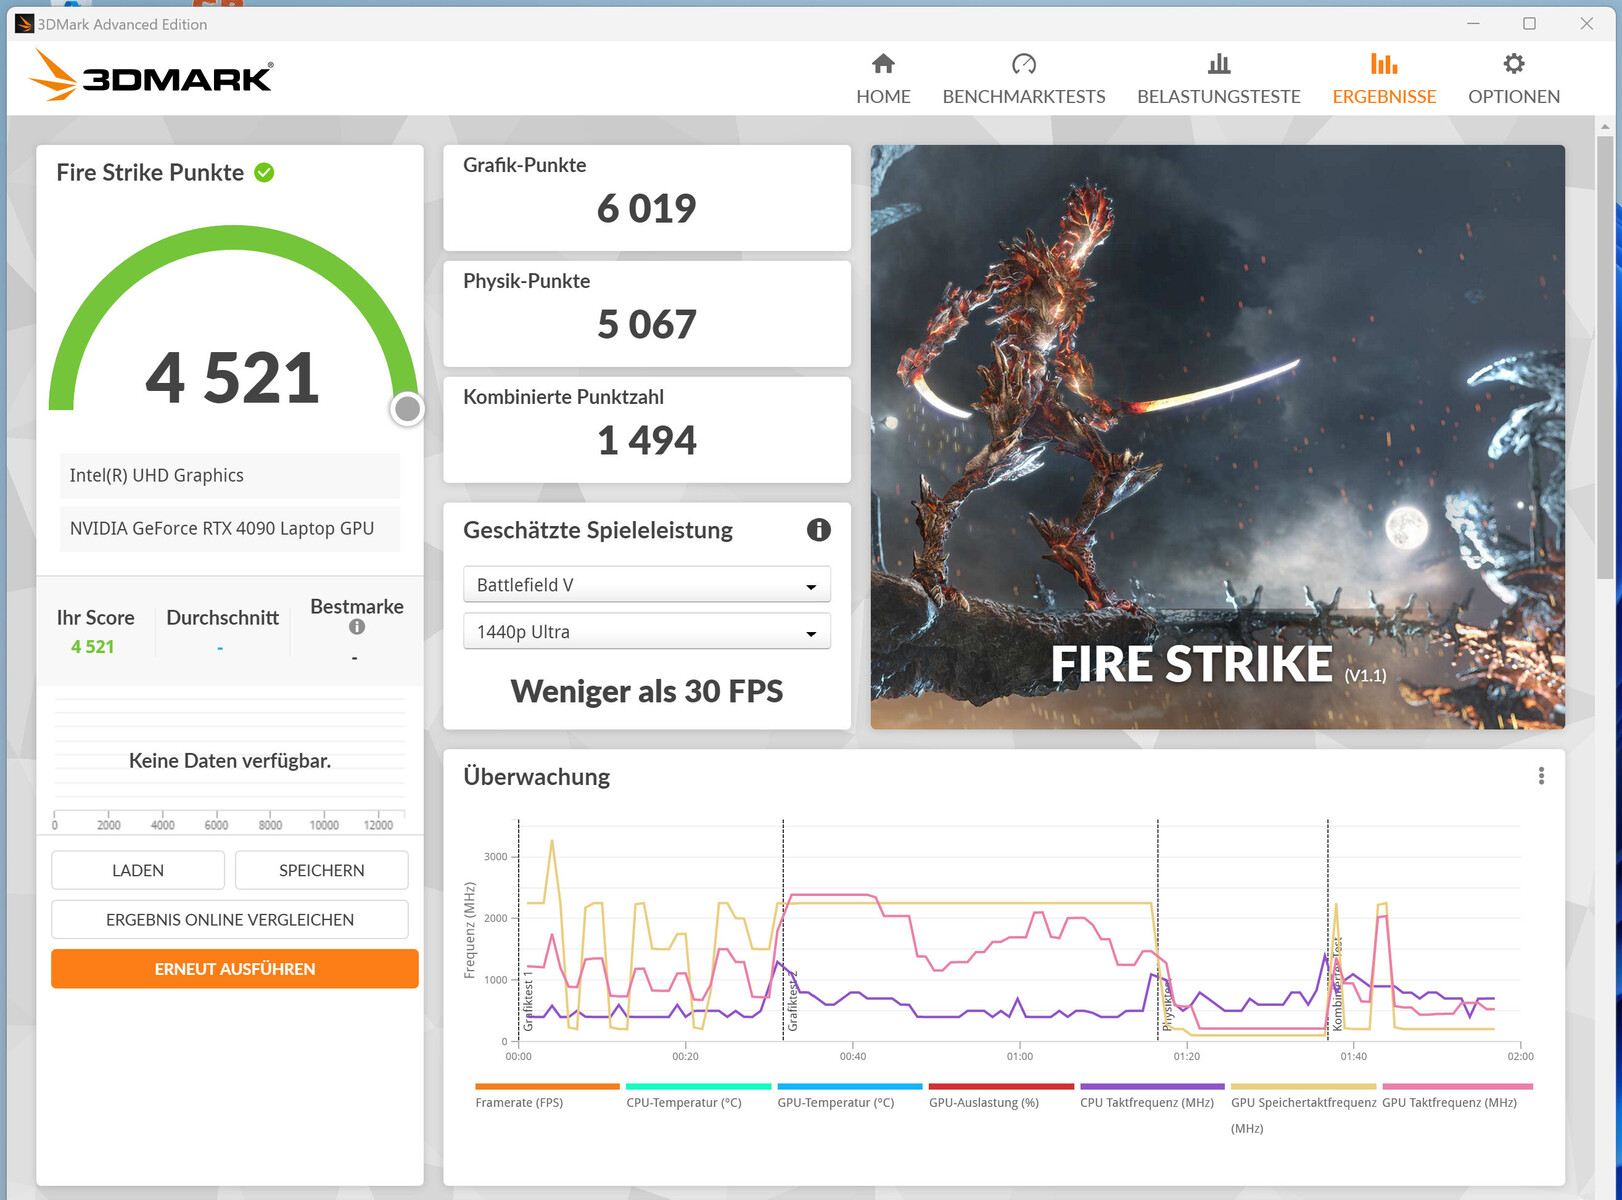
"Performance mode" låter användare överklocka GPU och VRAM i Control Center. Genom att klicka på de två nedåtriktade pilarna öppnas motsvarande meny (bild 3). Du måste aktivera CPU-överklockning i BIOS innan en ny flik dyker upp i Control Center (se bild 12 till 16). Men se upp: överklocka hårdvaran på egen risk - du är ansvarig för eventuella skador som uppstår till följd av detta.
| Performance mode | Entertainment mode | Power Saver mode | Silent mode | |
|---|---|---|---|---|
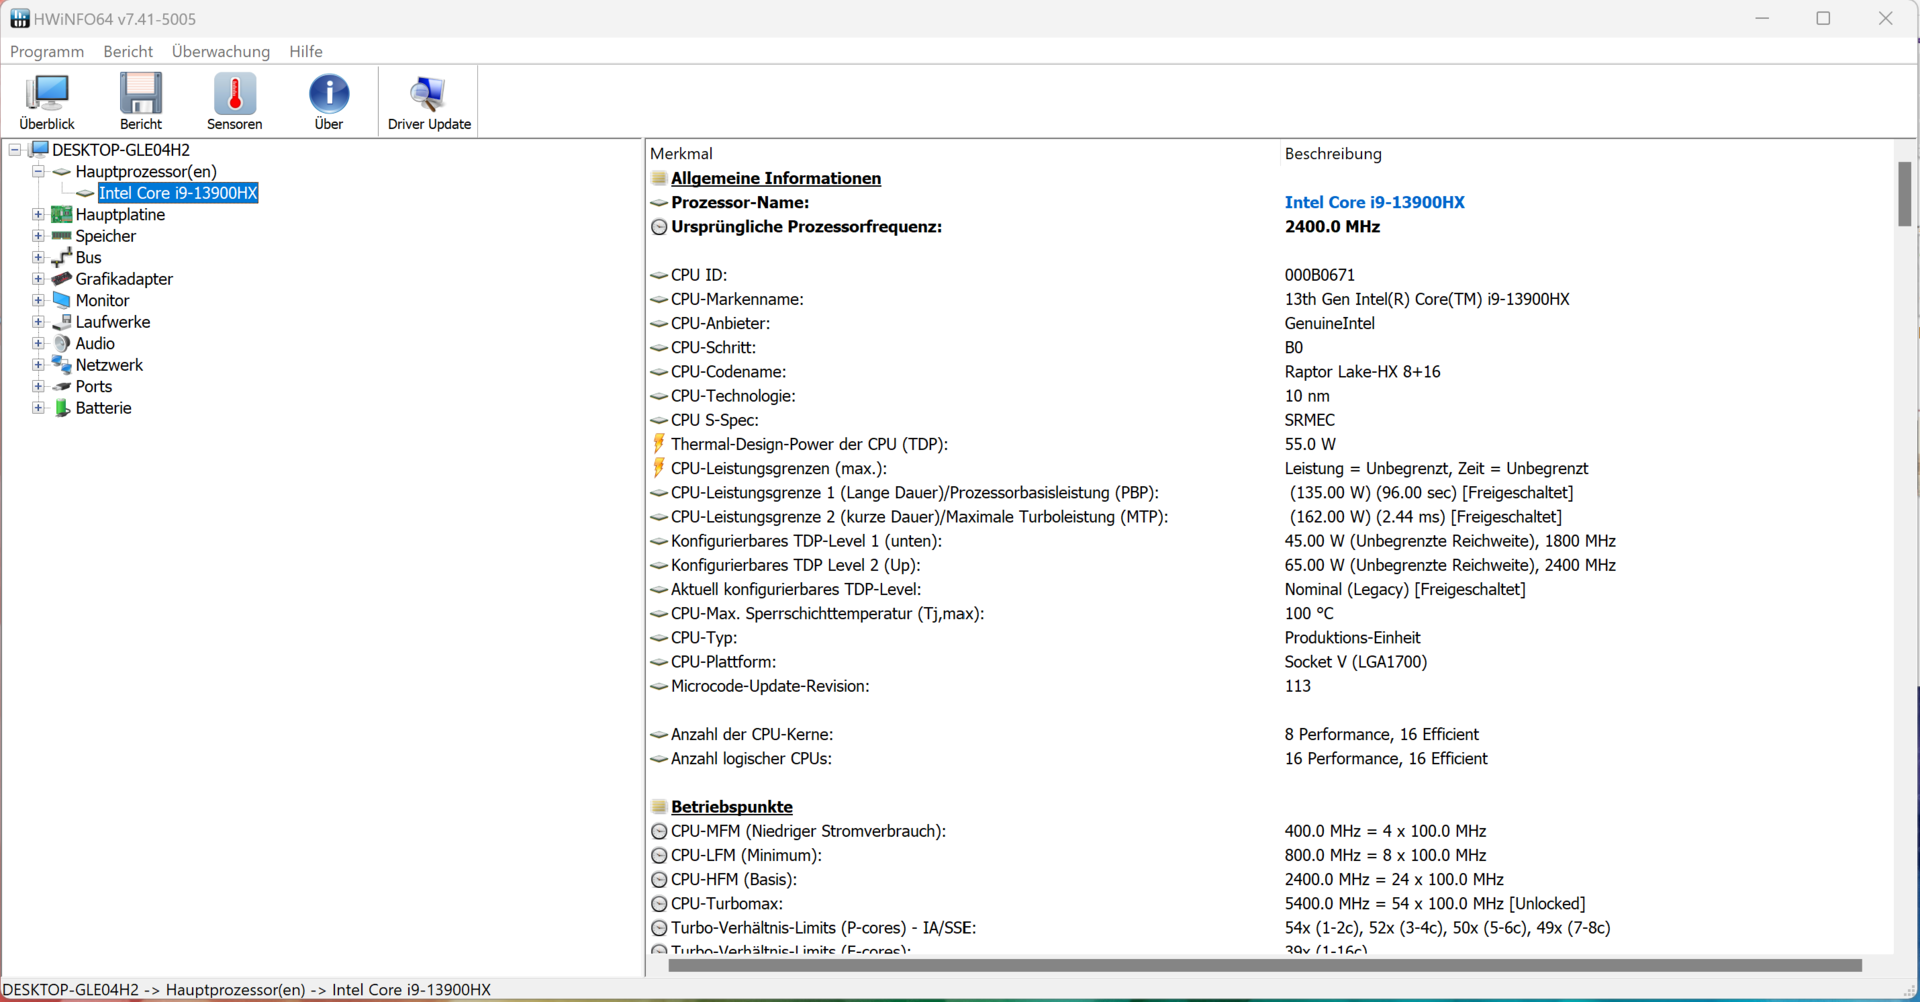
| CPU PL1 (HWInfo) | 135 Watt | 75 Watt | 15 Watt | 15 Watt |
| CPU PL2 (HWInfo) | 162 Watt | 130 Watt | 30 Watt | 30 Watt |
| Buller (Witcher 3) | 62 dB(A) | 54 dB(A) | - | 42 dB(A) |
| Prestanda (Witcher 3) | ~204 fps | ~188 fps | - | 50 bis 60 fps |
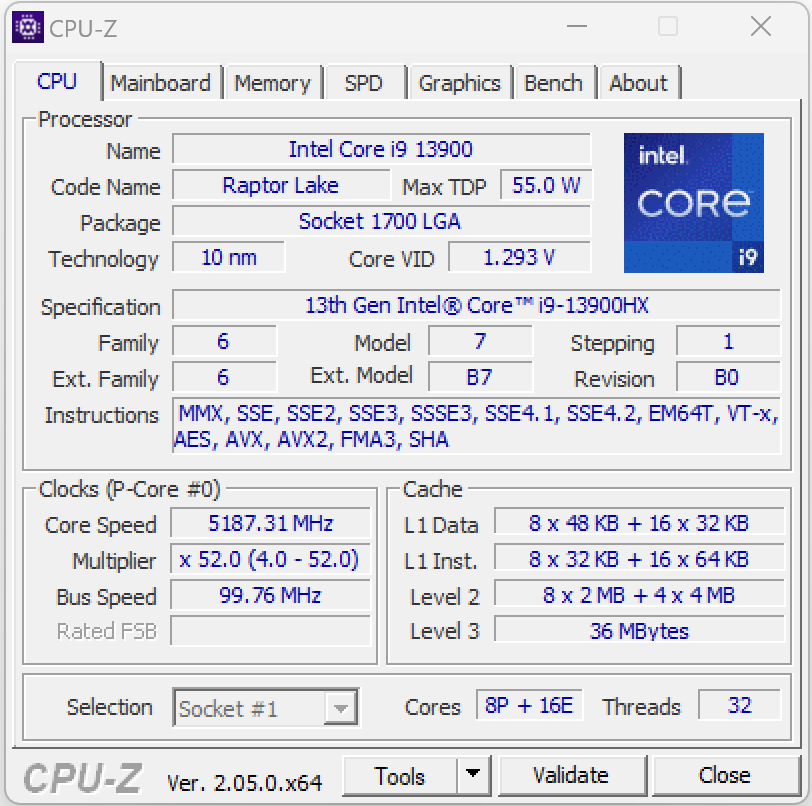
Processor
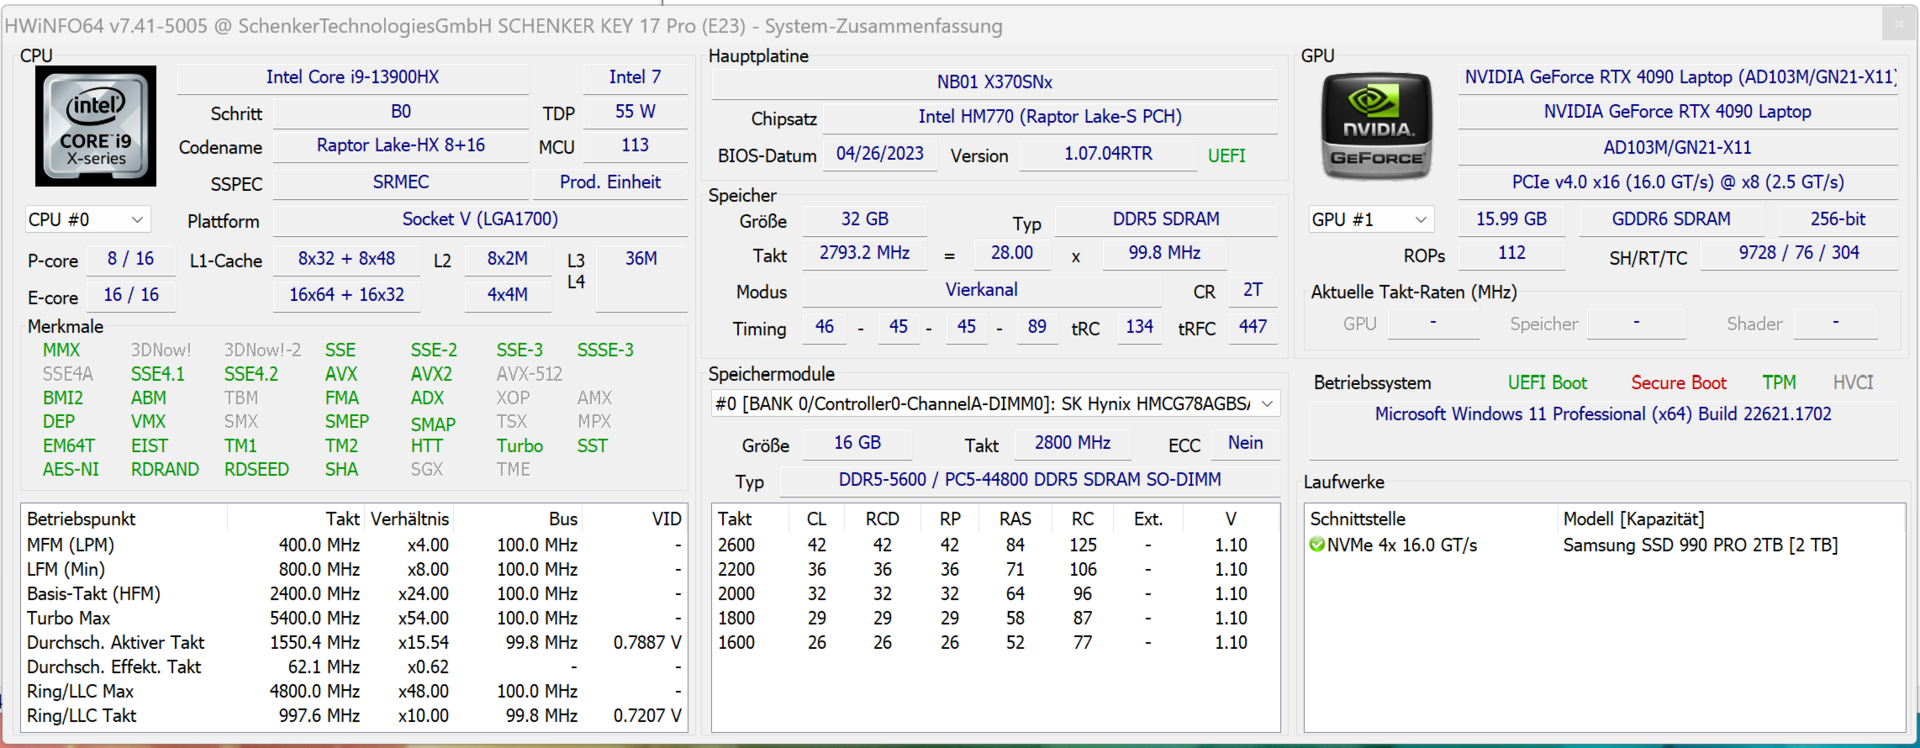
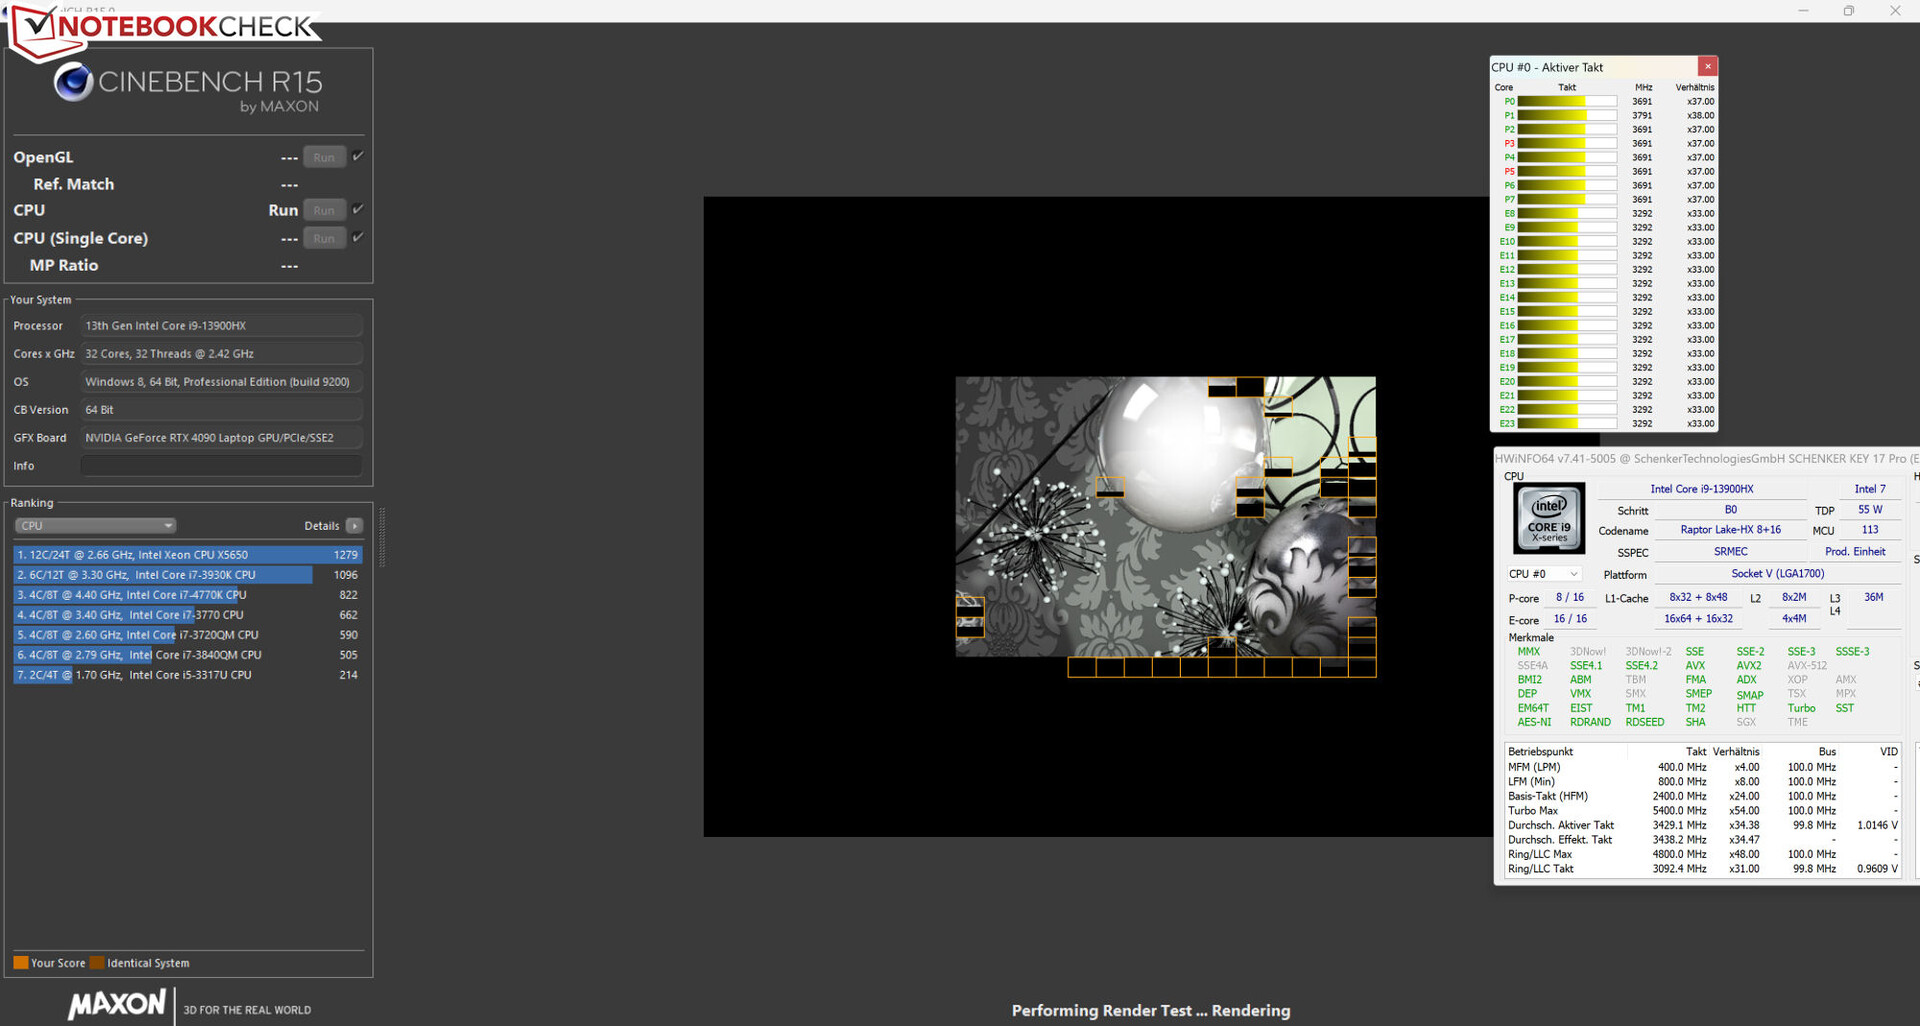
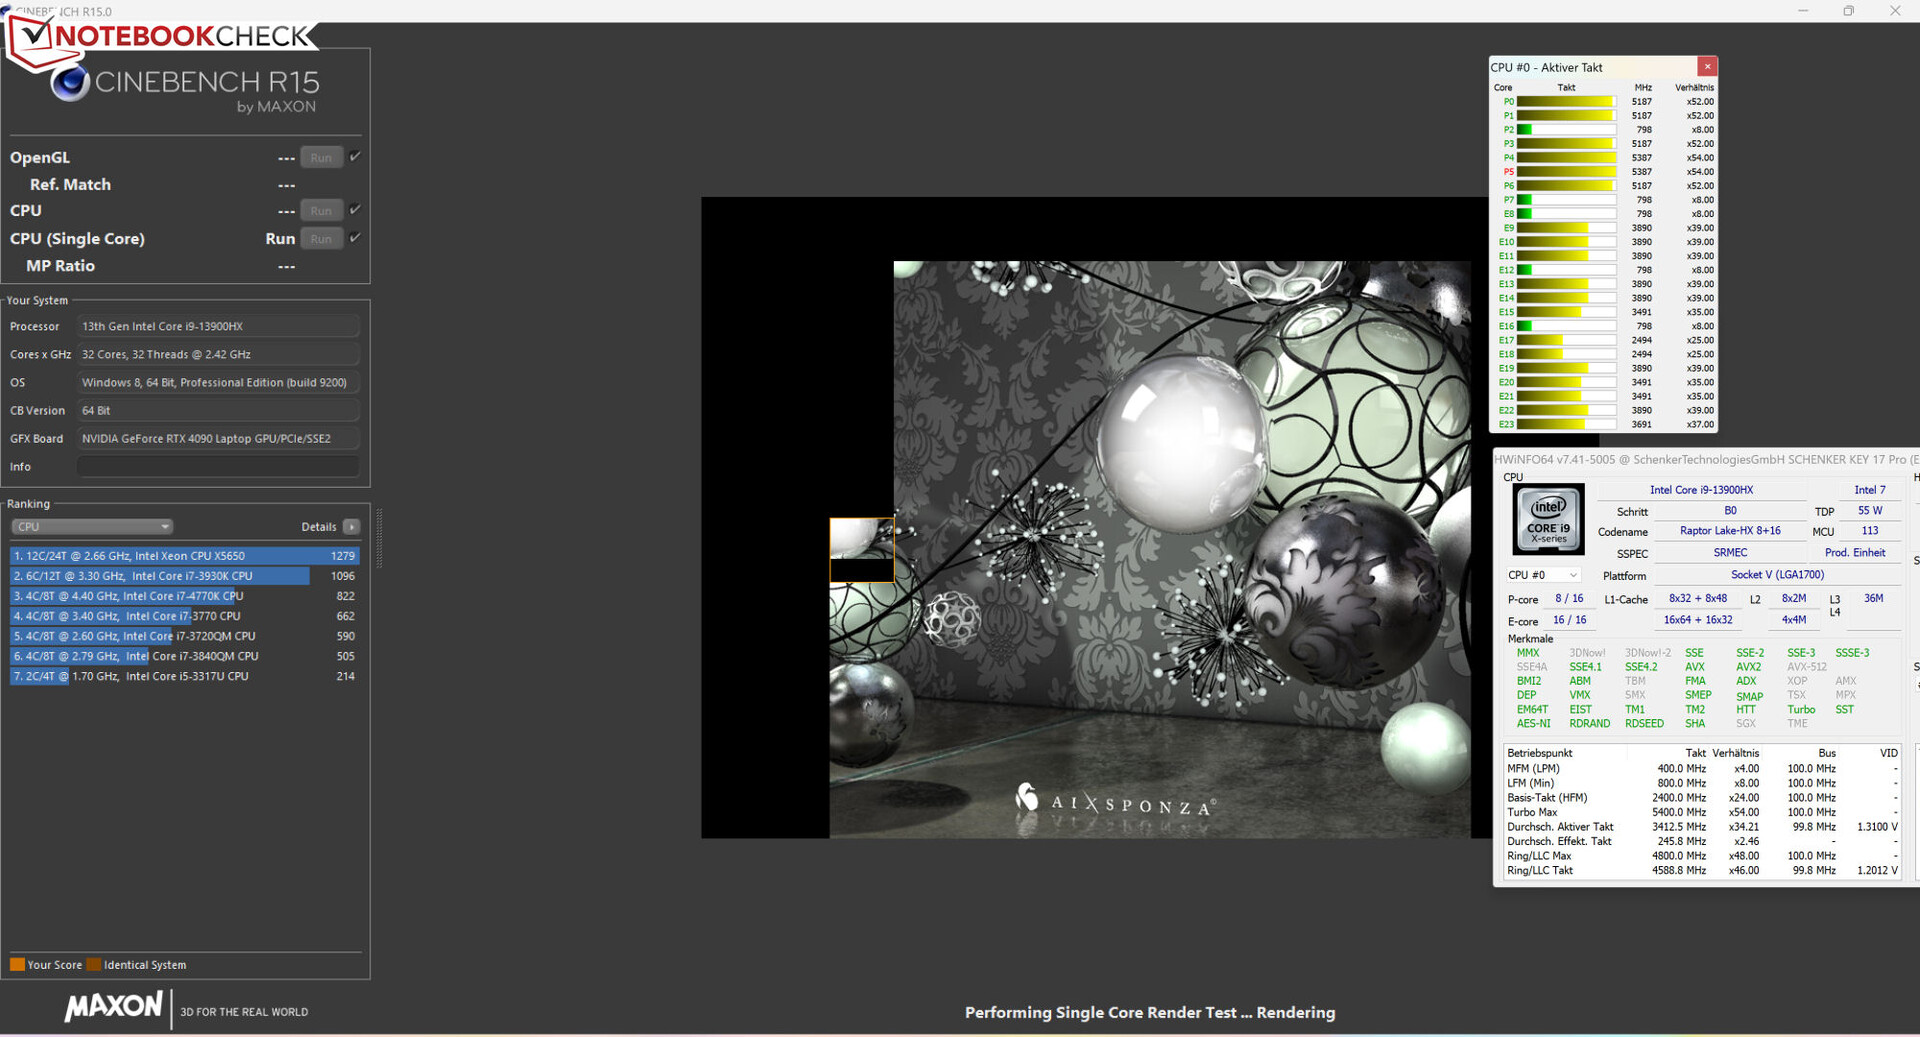
Core i9-13900HX Raptor Lake-processorn består av åtta prestandakärnor (Hyperthreading, 2,2 till 5,4 GHz) och sexton effektivitetskärnor (ingen Hyperthreading, 1,6 till 3,9 GHz), vilket ger totalt 32 logiska CPU-kärnor.
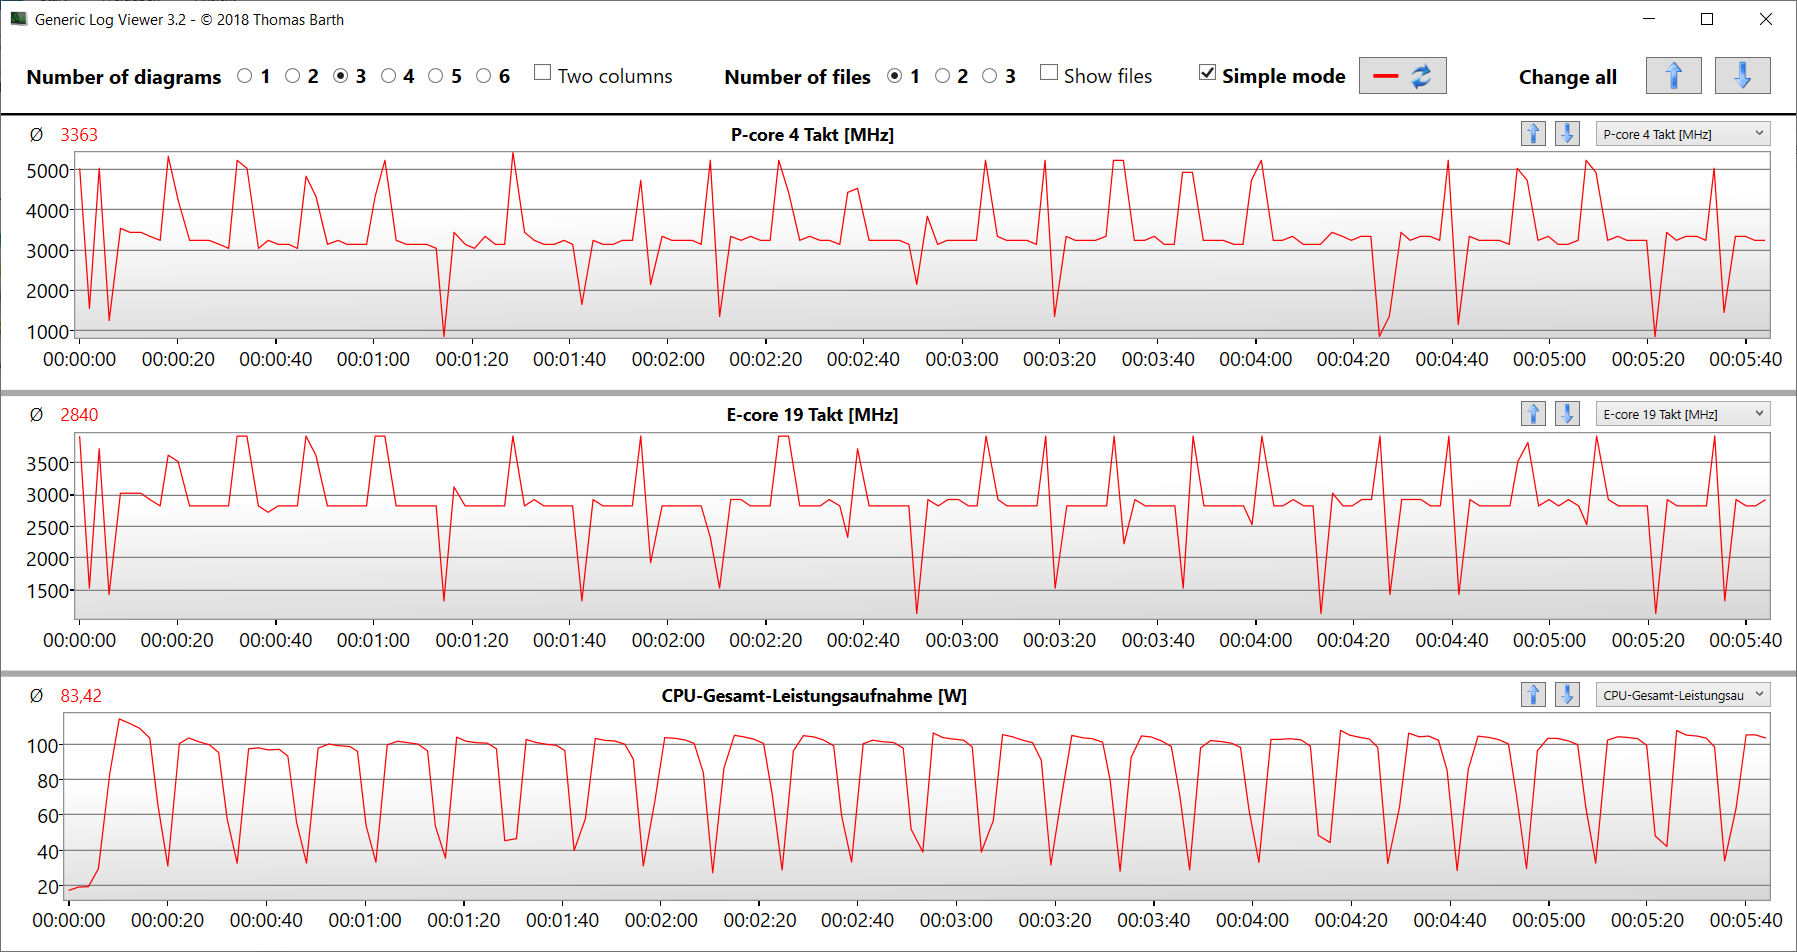
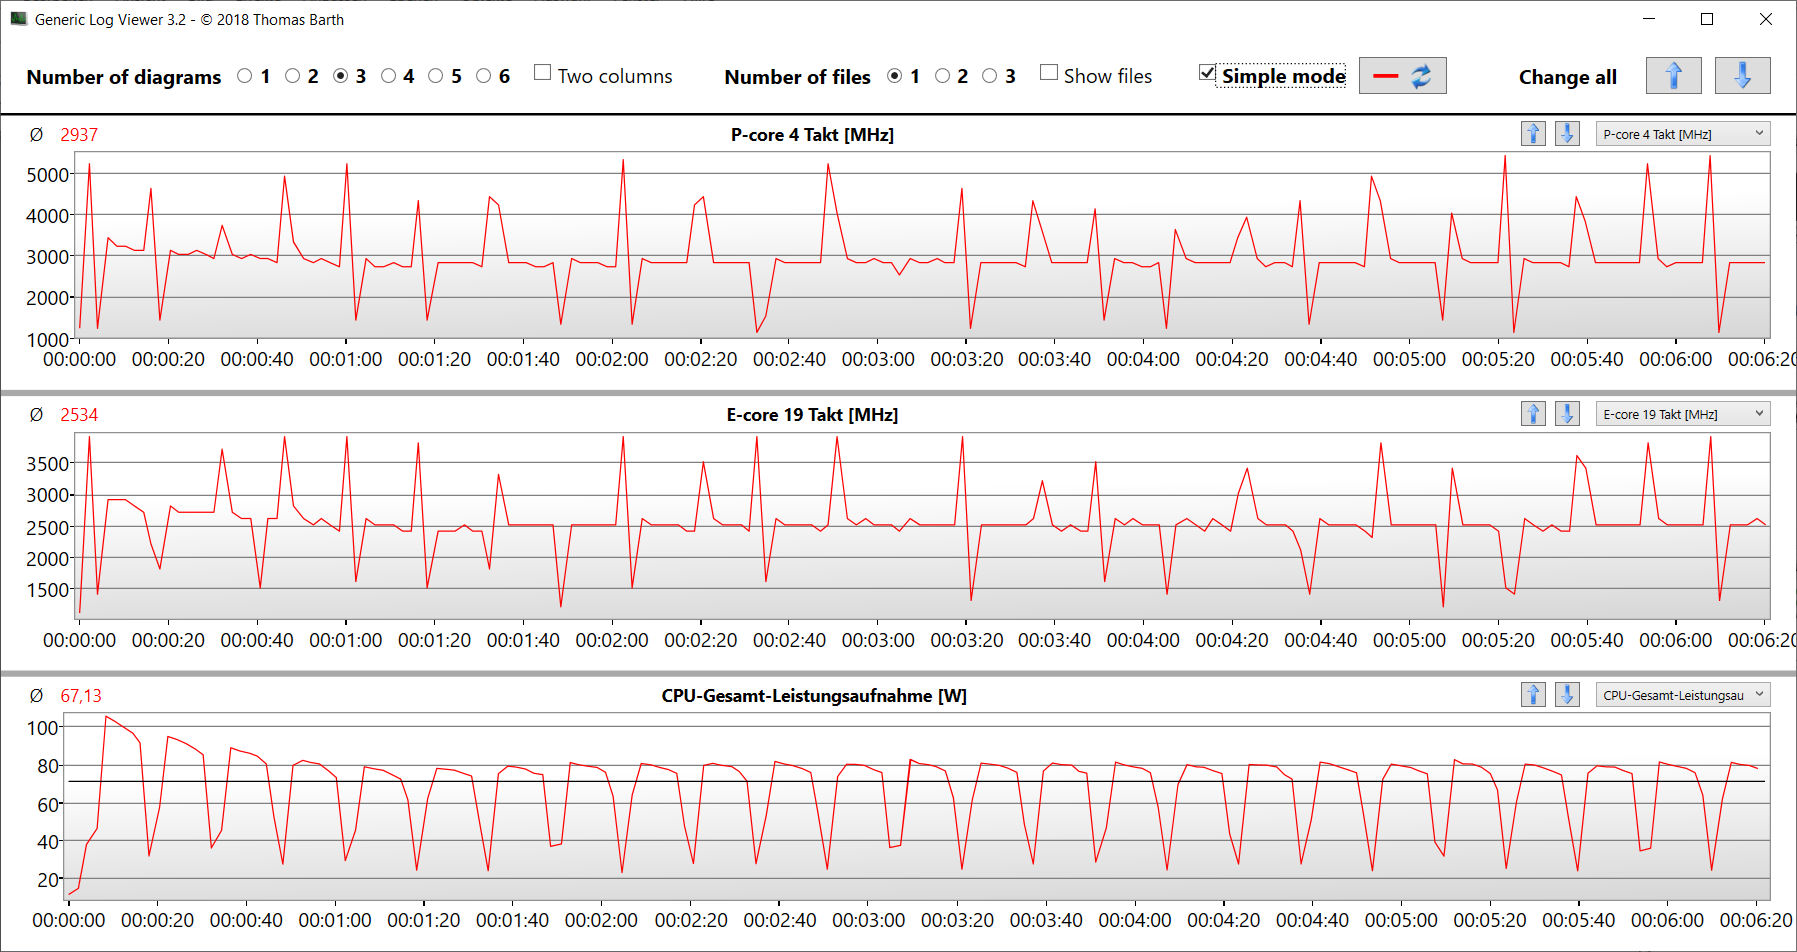
Benchmarkresultaten från Key 17 Pro är ungefär i samma storleksordning som vad vi har sett från denna CPU i genomsnitt. Under vårt Cinebench 15 loop-test, orsakade den ihållande flertrådsbelastningen att CPU:ns turboklockhastighet sjönk något under de första två körningarna innan den slutligen stabiliserades på en konstant nivå.
Cinebench R15 Multi sustained load
* ... mindre är bättre
AIDA64: FP32 Ray-Trace | FPU Julia | CPU SHA3 | CPU Queen | FPU SinJulia | FPU Mandel | CPU AES | CPU ZLib | FP64 Ray-Trace | CPU PhotoWorxx
| Performance rating | |
| Asus ROG Strix Scar 17 G733PY-XS96 | |
| Schenker Key 17 Pro (Early 23) | |
| Medion Erazer Beast X40 | |
| Genomsnitt av klass Gaming | |
| Genomsnitt Intel Core i9-13900HX | |
| Aorus 17X AZF | |
| MSI Stealth 17 Studio A13VH-014 | |
| AIDA64 / FP32 Ray-Trace | |
| Asus ROG Strix Scar 17 G733PY-XS96 | |
| Genomsnitt av klass Gaming (10227 - 85542, n=105, senaste 2 åren) | |
| Medion Erazer Beast X40 | |
| Genomsnitt Intel Core i9-13900HX (17589 - 27615, n=22) | |
| Schenker Key 17 Pro (Early 23) | |
| MSI Stealth 17 Studio A13VH-014 | |
| Aorus 17X AZF | |
| AIDA64 / FPU Julia | |
| Asus ROG Strix Scar 17 G733PY-XS96 | |
| Genomsnitt av klass Gaming (51376 - 238426, n=105, senaste 2 åren) | |
| Medion Erazer Beast X40 | |
| Genomsnitt Intel Core i9-13900HX (88686 - 137015, n=22) | |
| Schenker Key 17 Pro (Early 23) | |
| MSI Stealth 17 Studio A13VH-014 | |
| Aorus 17X AZF | |
| AIDA64 / CPU SHA3 | |
| Asus ROG Strix Scar 17 G733PY-XS96 | |
| Medion Erazer Beast X40 | |
| Genomsnitt av klass Gaming (2180 - 10115, n=105, senaste 2 åren) | |
| Genomsnitt Intel Core i9-13900HX (4362 - 7029, n=22) | |
| Schenker Key 17 Pro (Early 23) | |
| Aorus 17X AZF | |
| MSI Stealth 17 Studio A13VH-014 | |
| AIDA64 / CPU Queen | |
| Asus ROG Strix Scar 17 G733PY-XS96 | |
| Schenker Key 17 Pro (Early 23) | |
| Genomsnitt Intel Core i9-13900HX (125644 - 141385, n=22) | |
| Medion Erazer Beast X40 | |
| Aorus 17X AZF | |
| Genomsnitt av klass Gaming (49785 - 173351, n=90, senaste 2 åren) | |
| MSI Stealth 17 Studio A13VH-014 | |
| AIDA64 / FPU SinJulia | |
| Asus ROG Strix Scar 17 G733PY-XS96 | |
| Medion Erazer Beast X40 | |
| Genomsnitt Intel Core i9-13900HX (12334 - 17179, n=22) | |
| Schenker Key 17 Pro (Early 23) | |
| Genomsnitt av klass Gaming (4424 - 33636, n=105, senaste 2 åren) | |
| Aorus 17X AZF | |
| MSI Stealth 17 Studio A13VH-014 | |
| AIDA64 / FPU Mandel | |
| Asus ROG Strix Scar 17 G733PY-XS96 | |
| Genomsnitt av klass Gaming (25115 - 128721, n=105, senaste 2 åren) | |
| Medion Erazer Beast X40 | |
| Genomsnitt Intel Core i9-13900HX (43850 - 69202, n=22) | |
| Schenker Key 17 Pro (Early 23) | |
| MSI Stealth 17 Studio A13VH-014 | |
| Aorus 17X AZF | |
| AIDA64 / CPU AES | |
| Schenker Key 17 Pro (Early 23) | |
| Asus ROG Strix Scar 17 G733PY-XS96 | |
| Aorus 17X AZF | |
| Genomsnitt Intel Core i9-13900HX (89413 - 237881, n=22) | |
| Medion Erazer Beast X40 | |
| Genomsnitt av klass Gaming (39258 - 247074, n=105, senaste 2 åren) | |
| MSI Stealth 17 Studio A13VH-014 | |
| AIDA64 / CPU ZLib | |
| Asus ROG Strix Scar 17 G733PY-XS96 | |
| Medion Erazer Beast X40 | |
| Genomsnitt Intel Core i9-13900HX (1284 - 1958, n=22) | |
| Schenker Key 17 Pro (Early 23) | |
| Genomsnitt av klass Gaming (574 - 2531, n=105, senaste 2 åren) | |
| Aorus 17X AZF | |
| MSI Stealth 17 Studio A13VH-014 | |
| AIDA64 / FP64 Ray-Trace | |
| Asus ROG Strix Scar 17 G733PY-XS96 | |
| Genomsnitt av klass Gaming (5509 - 45446, n=105, senaste 2 åren) | |
| Medion Erazer Beast X40 | |
| Genomsnitt Intel Core i9-13900HX (9481 - 15279, n=22) | |
| Schenker Key 17 Pro (Early 23) | |
| MSI Stealth 17 Studio A13VH-014 | |
| Aorus 17X AZF | |
| AIDA64 / CPU PhotoWorxx | |
| Schenker Key 17 Pro (Early 23) | |
| MSI Stealth 17 Studio A13VH-014 | |
| Aorus 17X AZF | |
| Genomsnitt Intel Core i9-13900HX (42994 - 51994, n=22) | |
| Genomsnitt av klass Gaming (12271 - 89891, n=105, senaste 2 åren) | |
| Medion Erazer Beast X40 | |
| Asus ROG Strix Scar 17 G733PY-XS96 | |
Systemets prestanda
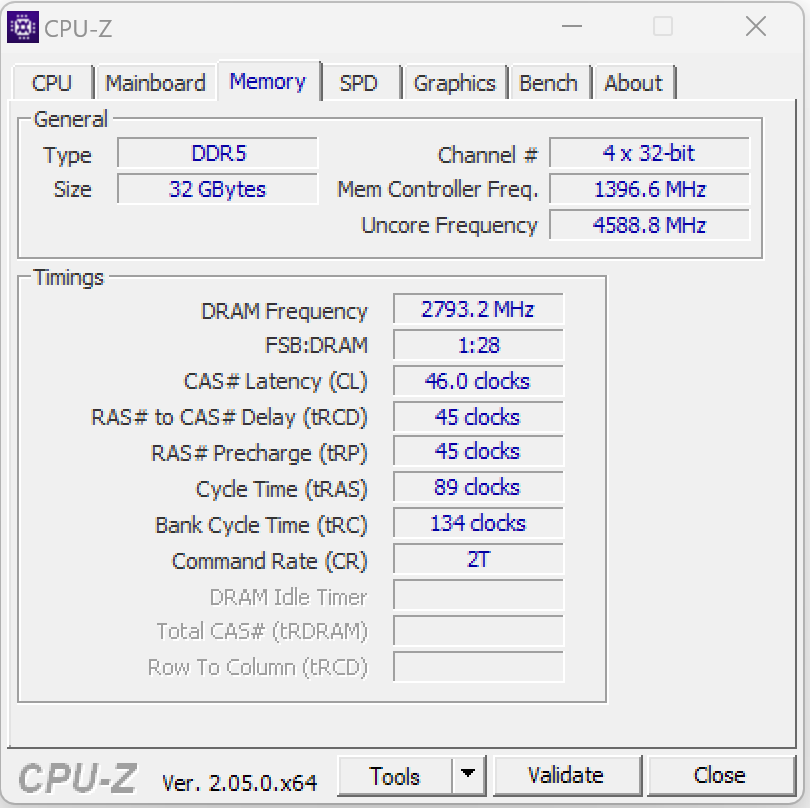
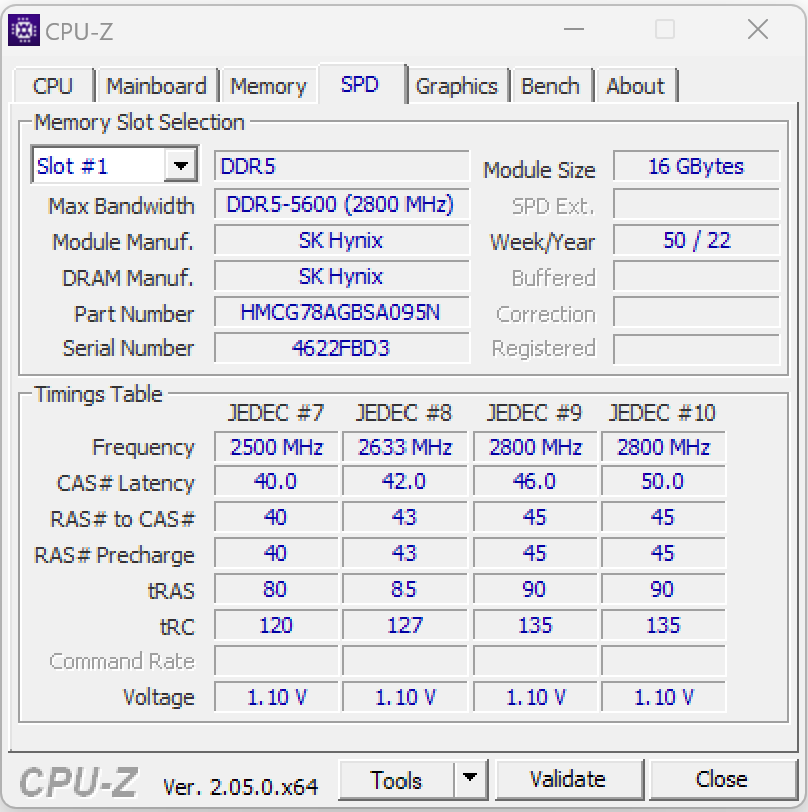
Systemet körs smidigt och har tillräckligt med beräkningskraft för att hantera rendering, videoredigering och spel. RAM-minnets överföringshastigheter är ganska standard för DDR5-5600-minne.
CrossMark: Overall | Productivity | Creativity | Responsiveness
| PCMark 10 / Score | |
| Schenker Key 17 Pro (Early 23) | |
| Asus ROG Strix Scar 17 G733PY-XS96 | |
| Genomsnitt Intel Core i9-13900HX, NVIDIA GeForce RTX 4090 Laptop GPU (7690 - 9331, n=8) | |
| Genomsnitt av klass Gaming (5828 - 12414, n=93, senaste 2 åren) | |
| Medion Erazer Beast X40 | |
| Aorus 17X AZF | |
| MSI Stealth 17 Studio A13VH-014 | |
| PCMark 10 / Essentials | |
| Schenker Key 17 Pro (Early 23) | |
| Genomsnitt Intel Core i9-13900HX, NVIDIA GeForce RTX 4090 Laptop GPU (10972 - 11983, n=8) | |
| Medion Erazer Beast X40 | |
| Aorus 17X AZF | |
| Asus ROG Strix Scar 17 G733PY-XS96 | |
| Genomsnitt av klass Gaming (8810 - 11935, n=97, senaste 2 åren) | |
| MSI Stealth 17 Studio A13VH-014 | |
| PCMark 10 / Productivity | |
| Medion Erazer Beast X40 | |
| Schenker Key 17 Pro (Early 23) | |
| Genomsnitt av klass Gaming (6845 - 25323, n=95, senaste 2 åren) | |
| Genomsnitt Intel Core i9-13900HX, NVIDIA GeForce RTX 4090 Laptop GPU (9038 - 11680, n=8) | |
| Aorus 17X AZF | |
| Asus ROG Strix Scar 17 G733PY-XS96 | |
| MSI Stealth 17 Studio A13VH-014 | |
| PCMark 10 / Digital Content Creation | |
| Asus ROG Strix Scar 17 G733PY-XS96 | |
| Schenker Key 17 Pro (Early 23) | |
| Genomsnitt av klass Gaming (7602 - 19954, n=95, senaste 2 åren) | |
| Genomsnitt Intel Core i9-13900HX, NVIDIA GeForce RTX 4090 Laptop GPU (10605 - 16395, n=8) | |
| MSI Stealth 17 Studio A13VH-014 | |
| Medion Erazer Beast X40 | |
| Aorus 17X AZF | |
| CrossMark / Overall | |
| Schenker Key 17 Pro (Early 23) | |
| Aorus 17X AZF | |
| Medion Erazer Beast X40 | |
| Genomsnitt Intel Core i9-13900HX, NVIDIA GeForce RTX 4090 Laptop GPU (1825 - 2295, n=8) | |
| Asus ROG Strix Scar 17 G733PY-XS96 | |
| Genomsnitt av klass Gaming (1366 - 2409, n=94, senaste 2 åren) | |
| MSI Stealth 17 Studio A13VH-014 | |
| CrossMark / Productivity | |
| Schenker Key 17 Pro (Early 23) | |
| Aorus 17X AZF | |
| Medion Erazer Beast X40 | |
| Genomsnitt Intel Core i9-13900HX, NVIDIA GeForce RTX 4090 Laptop GPU (1666 - 2166, n=8) | |
| Genomsnitt av klass Gaming (1386 - 2254, n=94, senaste 2 åren) | |
| Asus ROG Strix Scar 17 G733PY-XS96 | |
| MSI Stealth 17 Studio A13VH-014 | |
| CrossMark / Creativity | |
| Schenker Key 17 Pro (Early 23) | |
| Medion Erazer Beast X40 | |
| Genomsnitt Intel Core i9-13900HX, NVIDIA GeForce RTX 4090 Laptop GPU (2162 - 2514, n=8) | |
| Asus ROG Strix Scar 17 G733PY-XS96 | |
| Aorus 17X AZF | |
| Genomsnitt av klass Gaming (1343 - 2786, n=94, senaste 2 åren) | |
| MSI Stealth 17 Studio A13VH-014 | |
| CrossMark / Responsiveness | |
| Schenker Key 17 Pro (Early 23) | |
| Aorus 17X AZF | |
| Medion Erazer Beast X40 | |
| Genomsnitt Intel Core i9-13900HX, NVIDIA GeForce RTX 4090 Laptop GPU (1441 - 2275, n=8) | |
| Genomsnitt av klass Gaming (1226 - 2334, n=94, senaste 2 åren) | |
| Asus ROG Strix Scar 17 G733PY-XS96 | |
| MSI Stealth 17 Studio A13VH-014 | |
| PCMark 10 Score | 8913 poäng | |
Hjälp | ||
| AIDA64 / Memory Copy | |
| Schenker Key 17 Pro (Early 23) | |
| Aorus 17X AZF | |
| Genomsnitt Intel Core i9-13900HX (67716 - 79193, n=22) | |
| MSI Stealth 17 Studio A13VH-014 | |
| Genomsnitt av klass Gaming (21750 - 129946, n=105, senaste 2 åren) | |
| Medion Erazer Beast X40 | |
| Asus ROG Strix Scar 17 G733PY-XS96 | |
| AIDA64 / Memory Read | |
| Aorus 17X AZF | |
| Schenker Key 17 Pro (Early 23) | |
| Genomsnitt Intel Core i9-13900HX (73998 - 88462, n=22) | |
| MSI Stealth 17 Studio A13VH-014 | |
| Medion Erazer Beast X40 | |
| Genomsnitt av klass Gaming (22956 - 118858, n=105, senaste 2 åren) | |
| Asus ROG Strix Scar 17 G733PY-XS96 | |
| AIDA64 / Memory Write | |
| Schenker Key 17 Pro (Early 23) | |
| Aorus 17X AZF | |
| Genomsnitt av klass Gaming (22297 - 135096, n=105, senaste 2 åren) | |
| MSI Stealth 17 Studio A13VH-014 | |
| Genomsnitt Intel Core i9-13900HX (65472 - 77045, n=22) | |
| Medion Erazer Beast X40 | |
| Asus ROG Strix Scar 17 G733PY-XS96 | |
| AIDA64 / Memory Latency | |
| Genomsnitt av klass Gaming (75.3 - 259, n=105, senaste 2 åren) | |
| MSI Stealth 17 Studio A13VH-014 | |
| Schenker Key 17 Pro (Early 23) | |
| Medion Erazer Beast X40 | |
| Genomsnitt Intel Core i9-13900HX (75.3 - 91.1, n=22) | |
| Asus ROG Strix Scar 17 G733PY-XS96 | |
| Aorus 17X AZF | |
* ... mindre är bättre
DPC-fördröjning
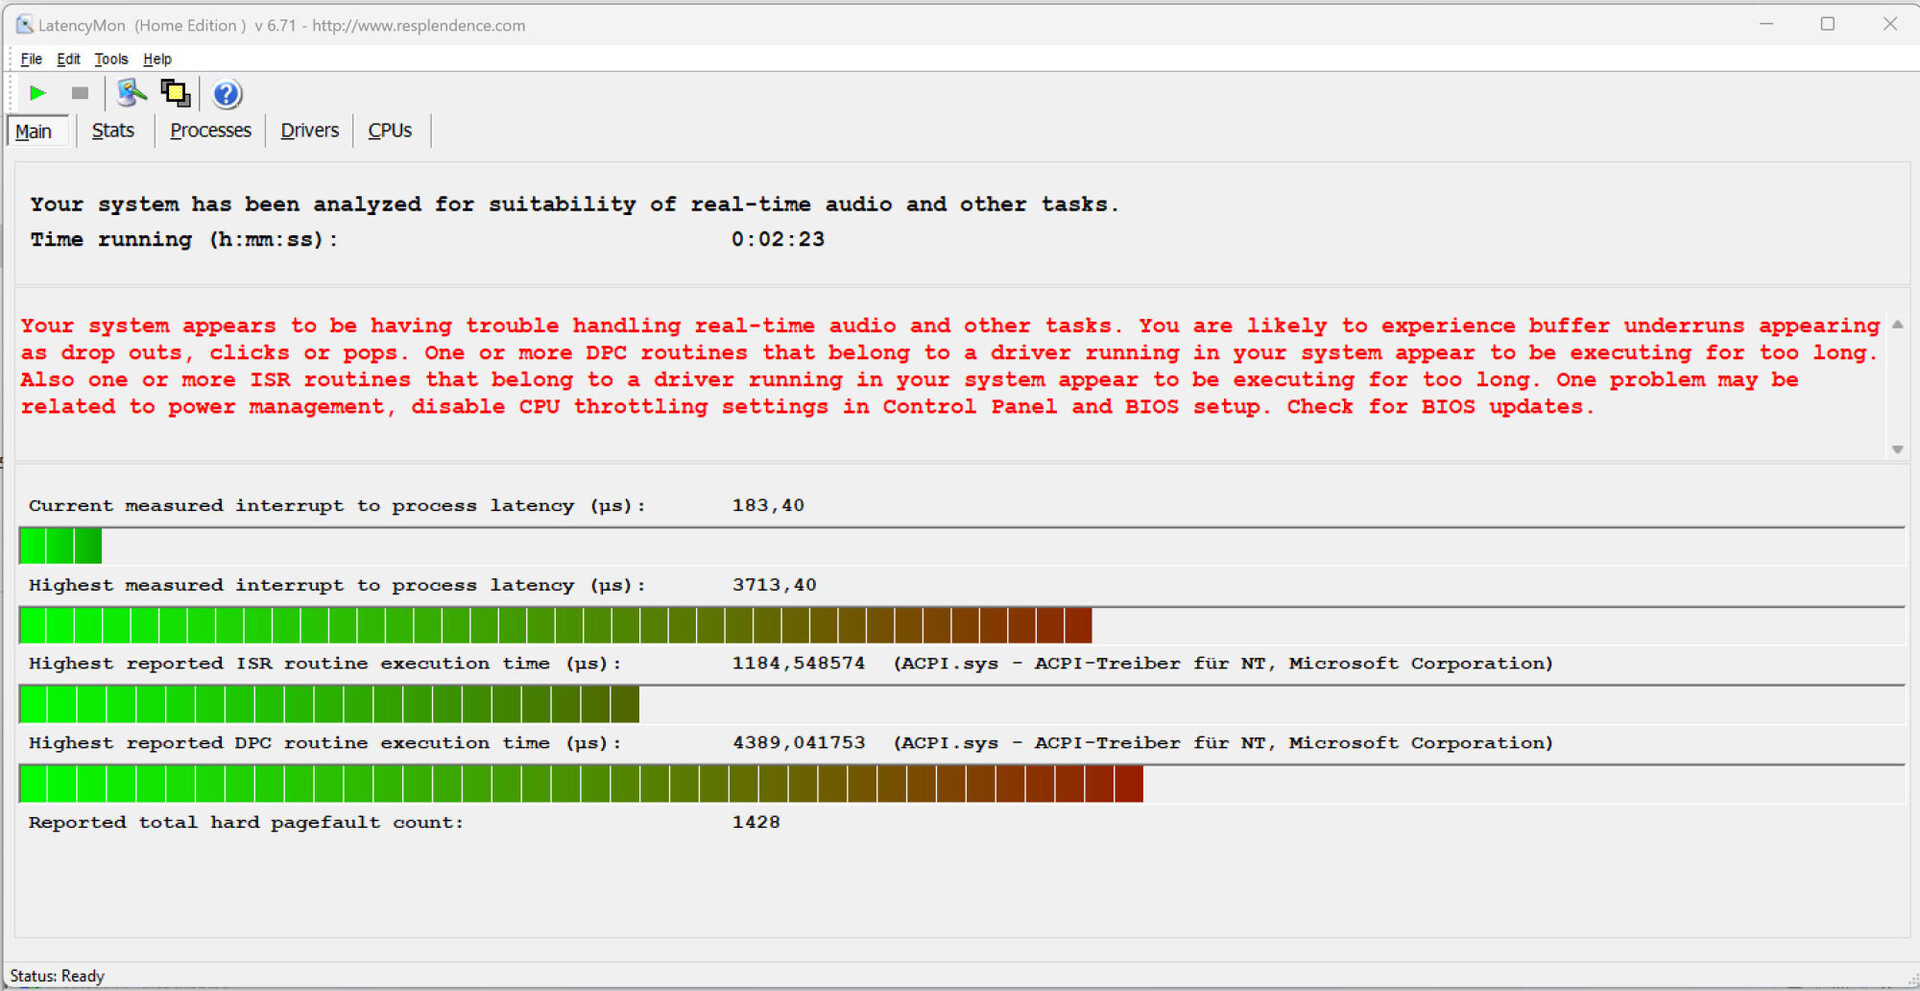
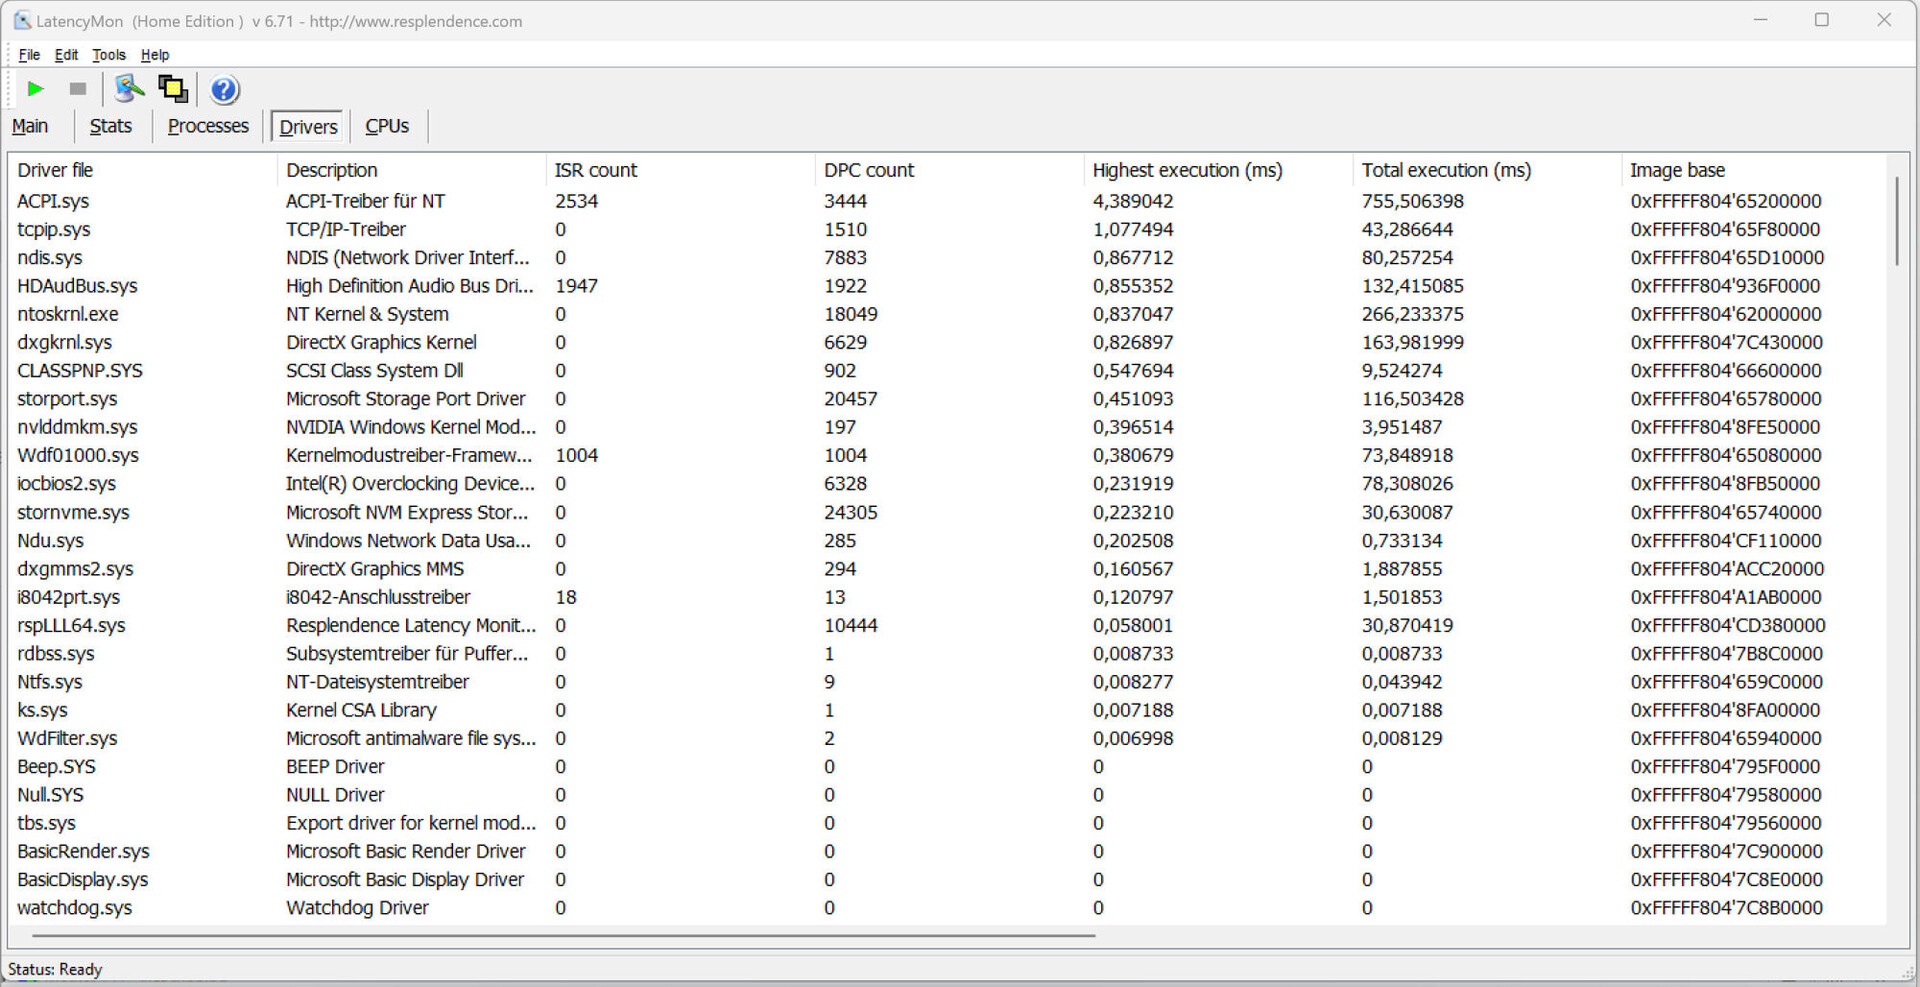
Vårt standardiserade latensmätningstest (Internetsurfning, uppspelning av 4K-video, Prime95 hög belastning) avslöjade vissa latensproblem. Systemet verkar inte vara lämpligt för hantering av video- och ljuduppgifter i realtid. Förhoppningsvis kommer dessa problem att lösas i framtida programuppdateringar.
| DPC Latencies / LatencyMon - interrupt to process latency (max), Web, Youtube, Prime95 | |
| Aorus 17X AZF | |
| Schenker Key 17 Pro (Early 23) | |
| MSI Stealth 17 Studio A13VH-014 | |
| Medion Erazer Beast X40 | |
| Asus ROG Strix Scar 17 G733PY-XS96 | |
* ... mindre är bättre
Masslagring
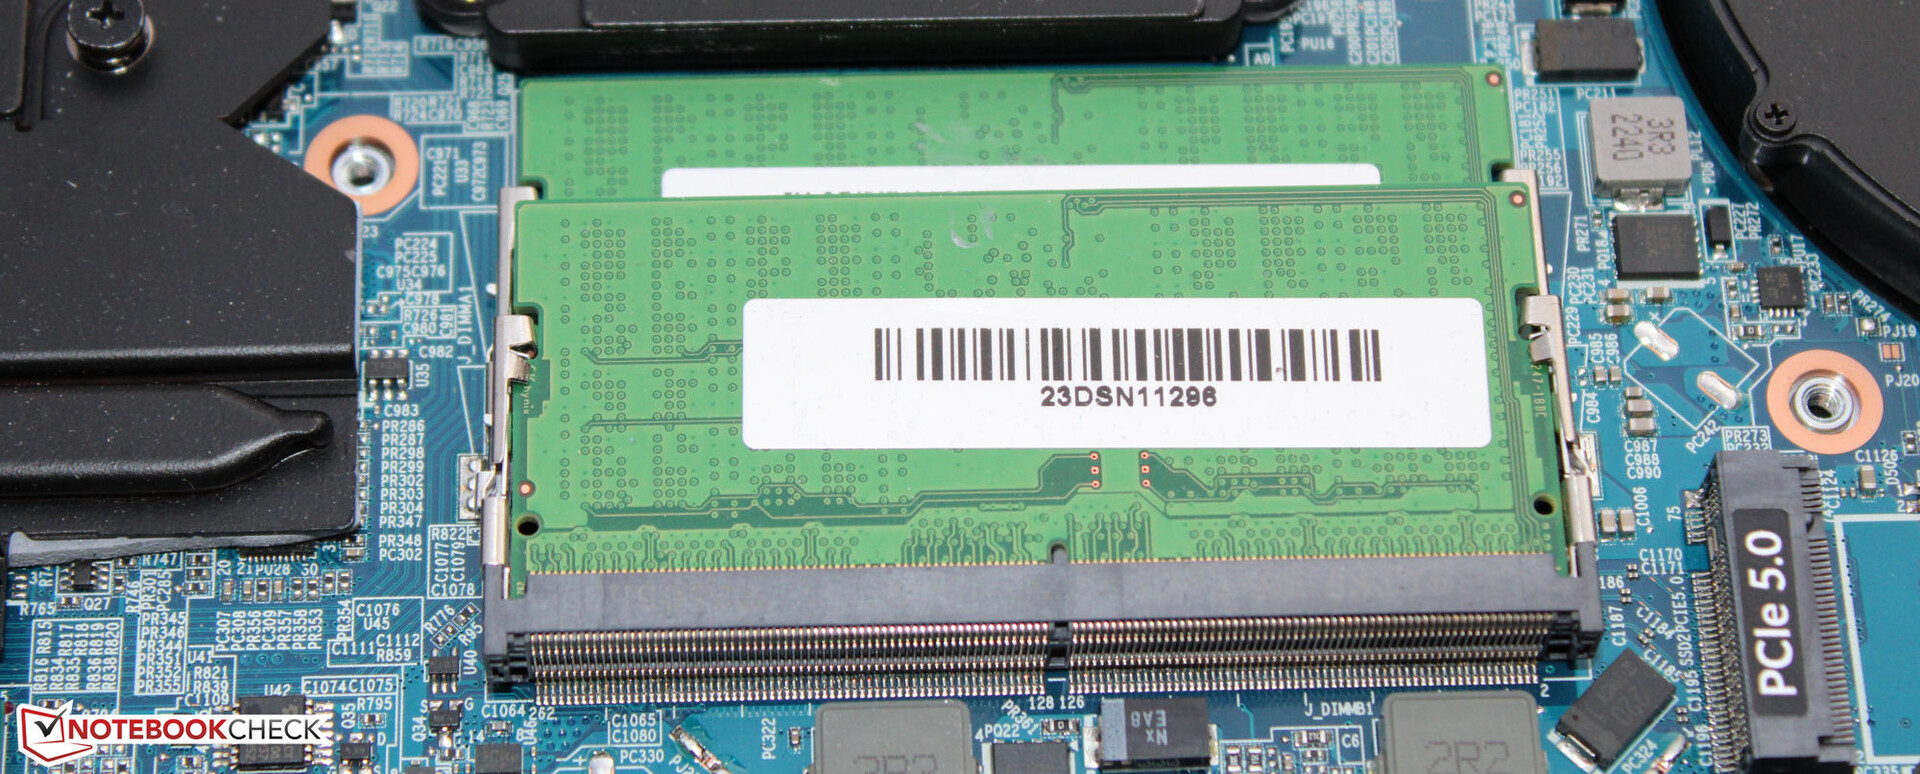
Schenker Key 17 Pro har plats för upp till tre M.2-2280 SSD-enheter (2x PCIe 4.0, 1x PCIe 5.0). Den förinstallerade PCIe 4.0 Samsung-enheten erbjuder gott om lagringsutrymme (2 TB) och levererar fantastiska överföringshastigheter. Vi märkte inte av några prestandasänkningar orsakade av termisk strypning.

* ... mindre är bättre
Sustained load Read: DiskSpd Read Loop, Queue Depth 8
Grafikkort
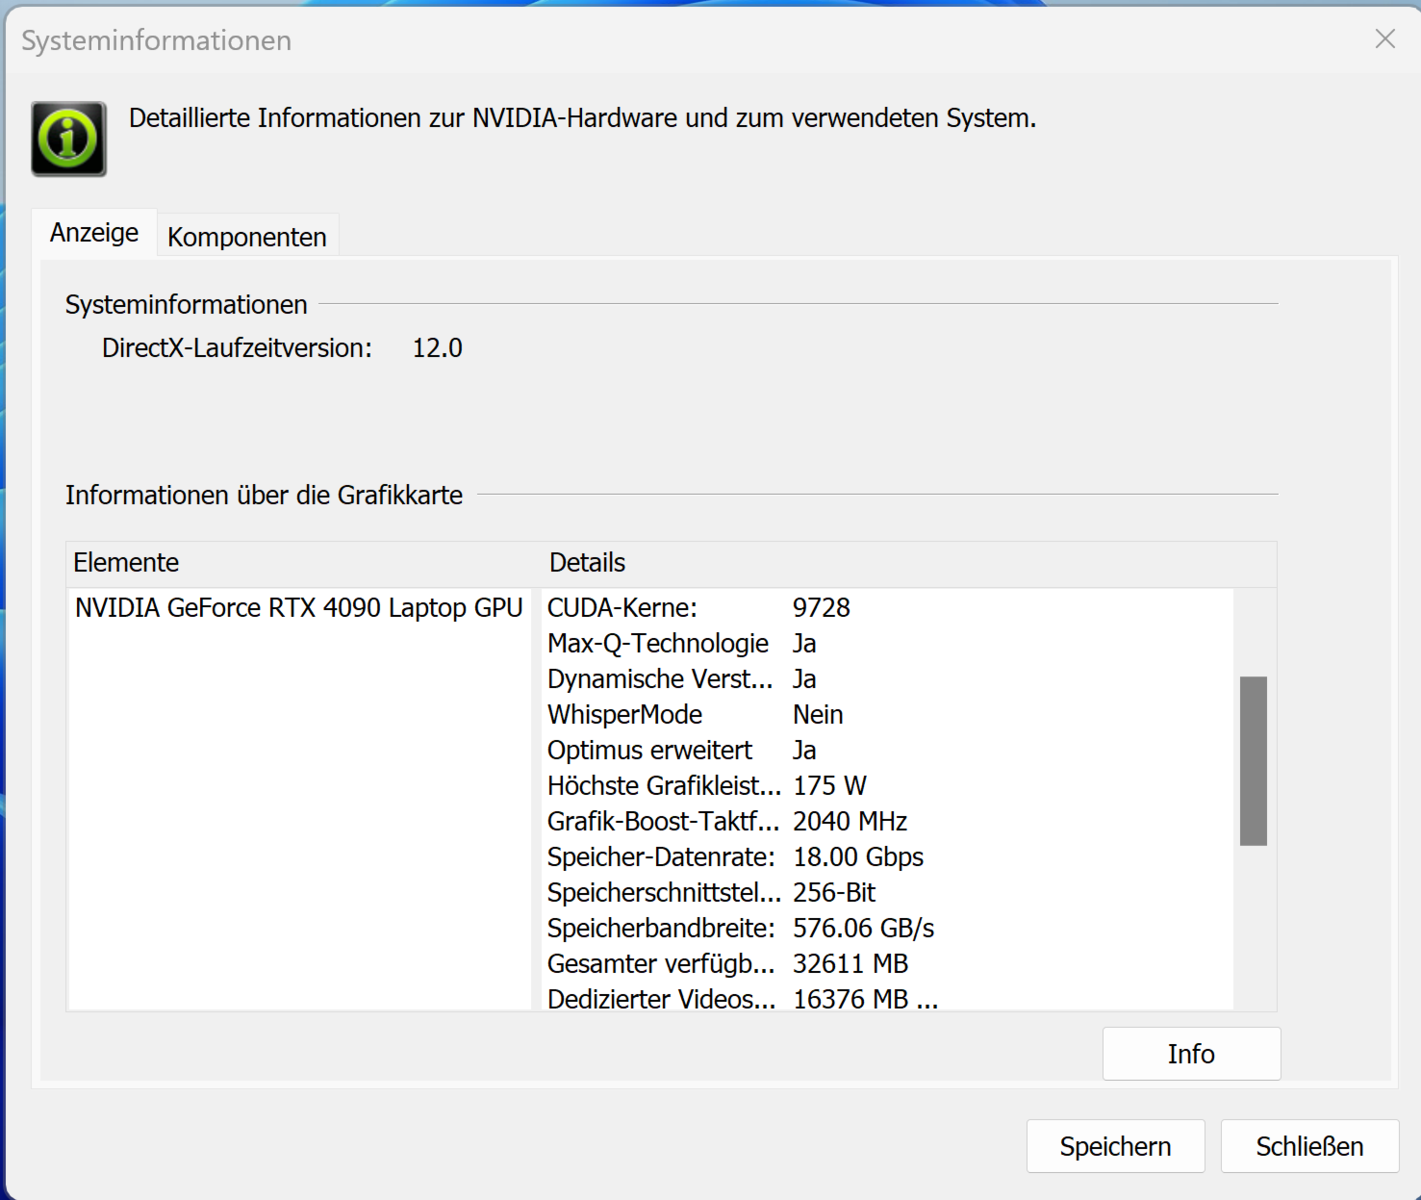
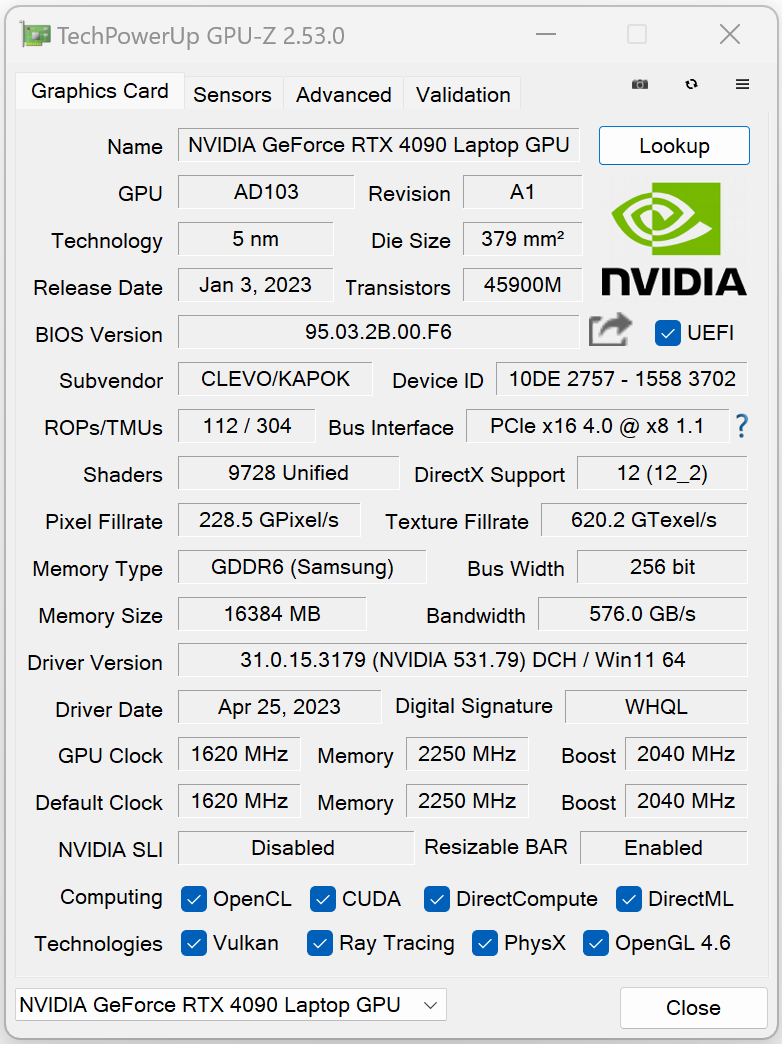
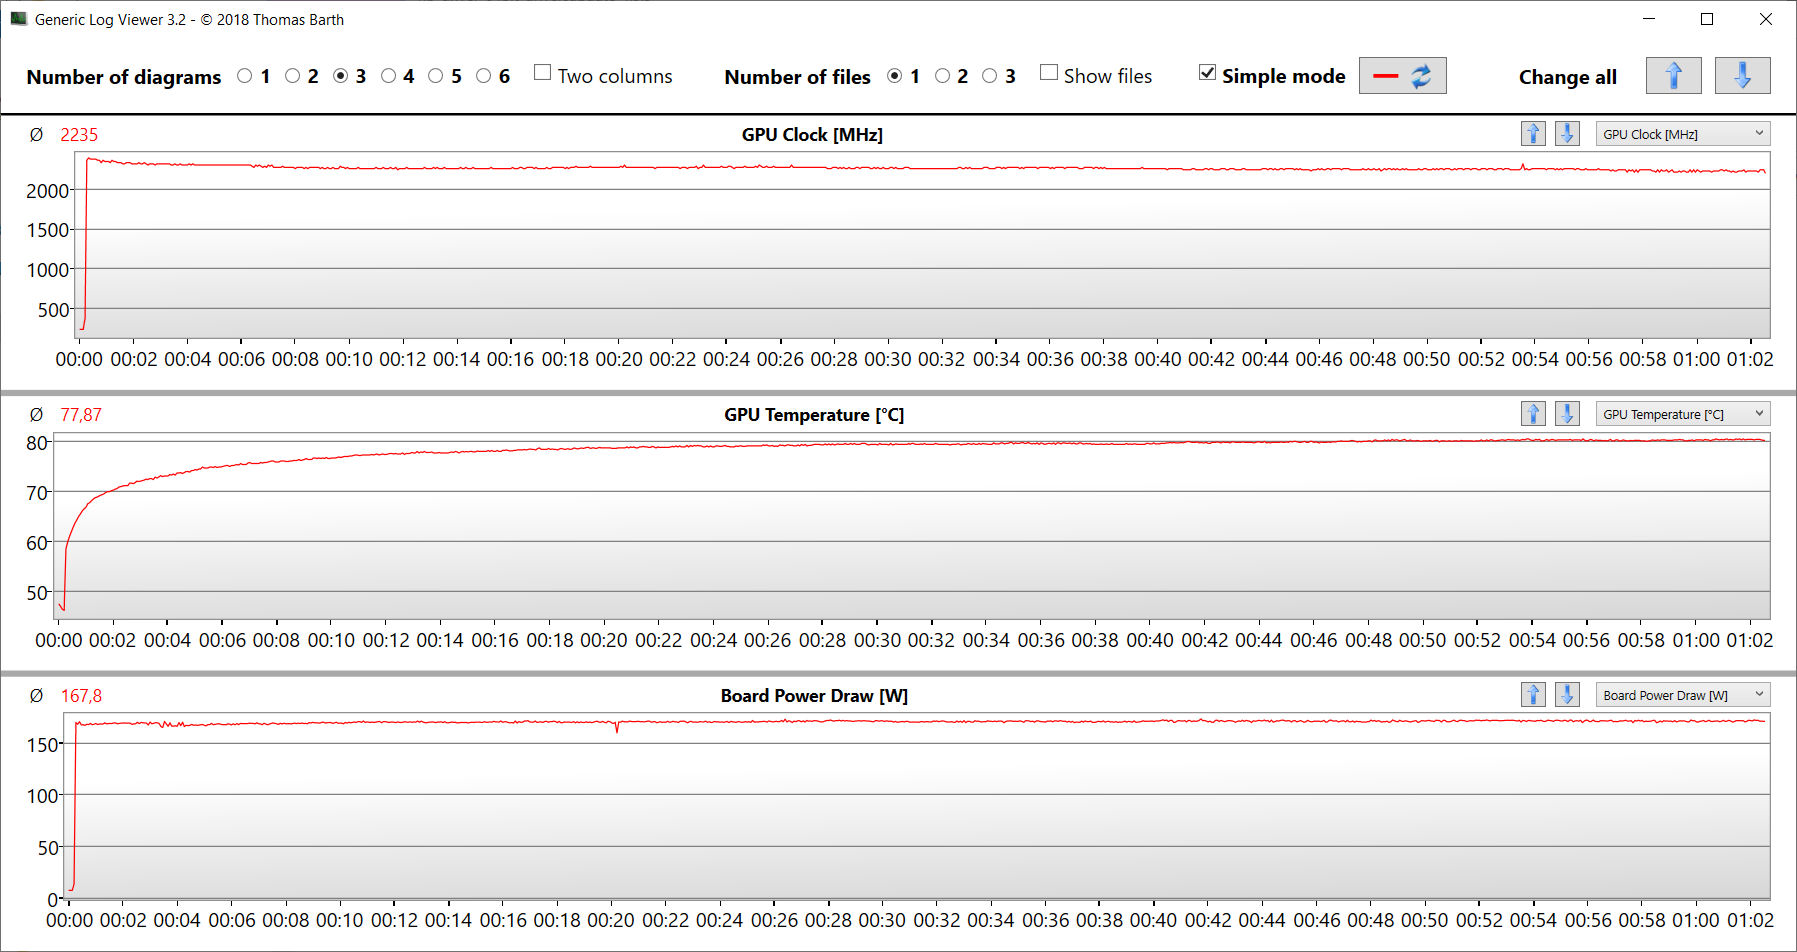
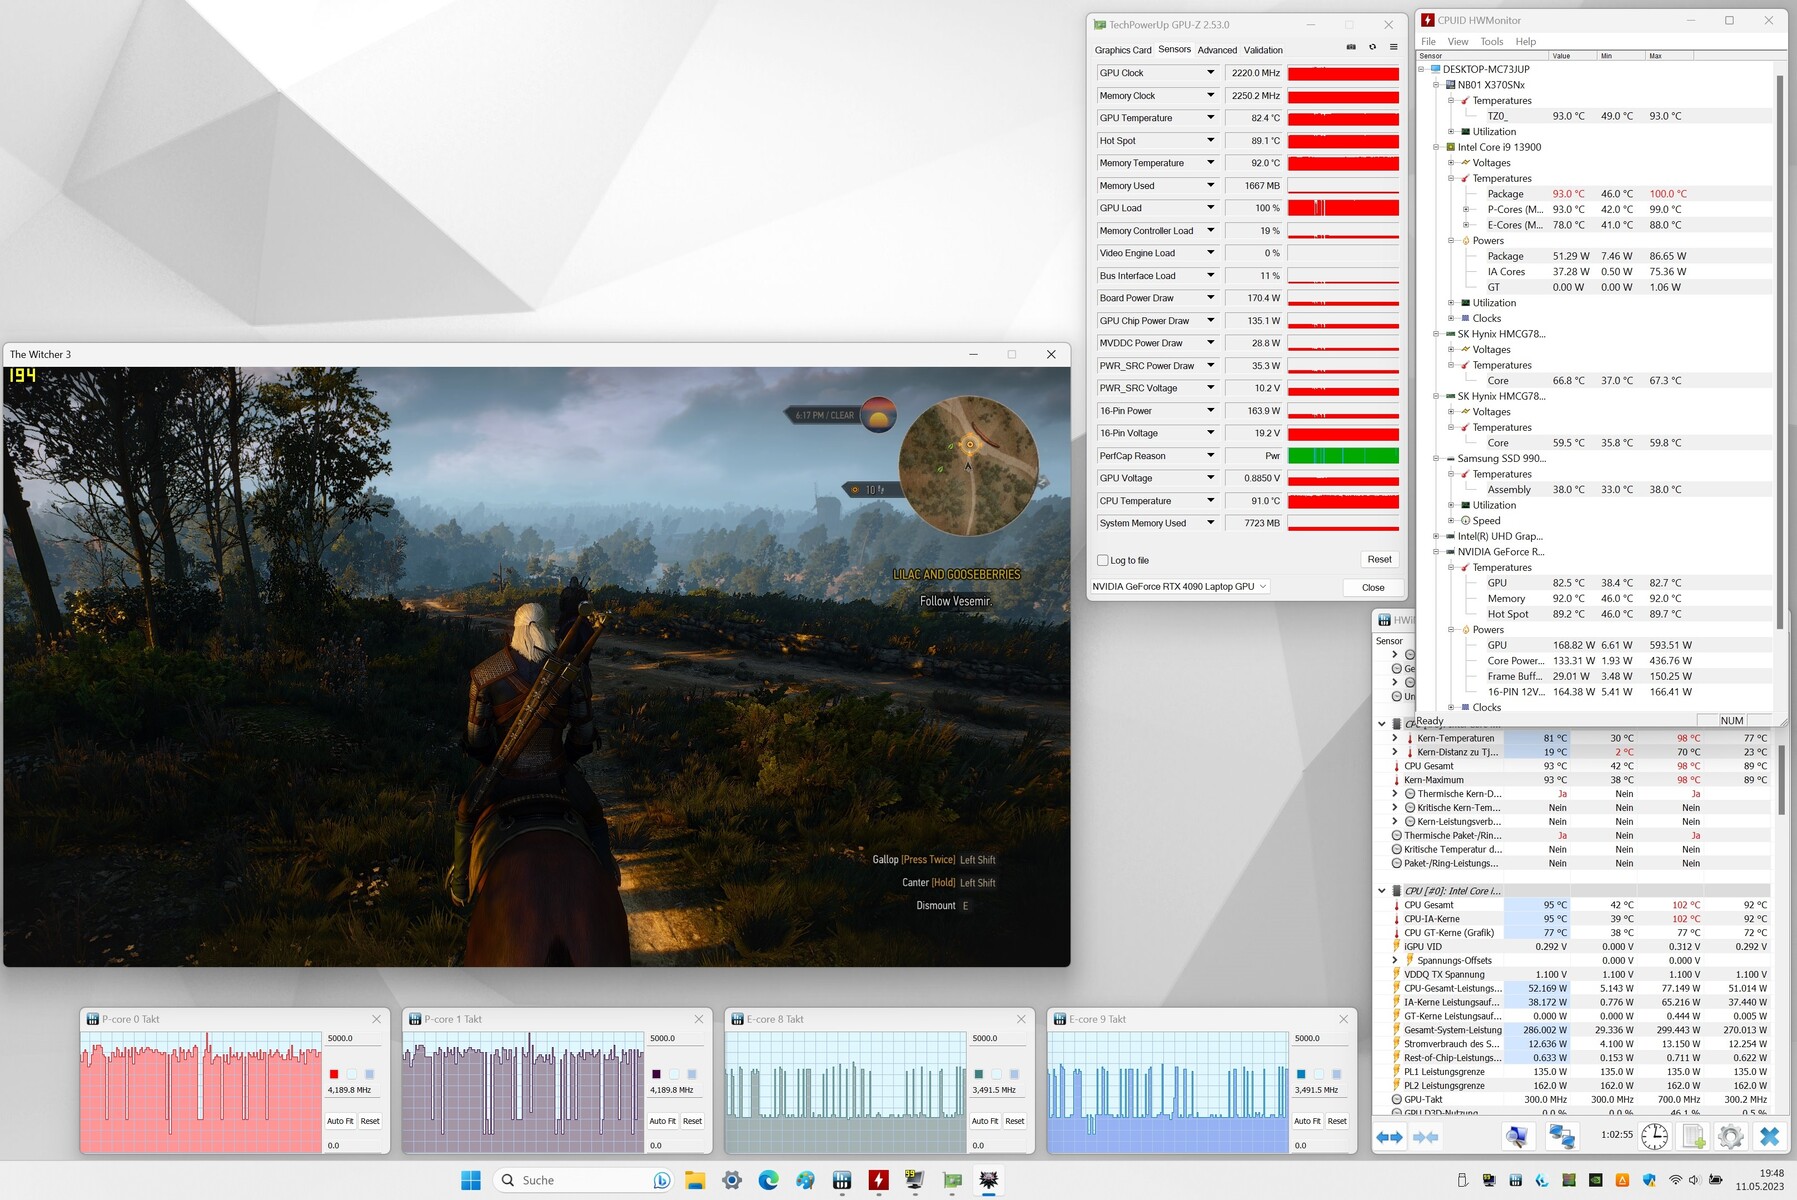
GeForce RTX 4090 Laptop är Nvidias nuvarande mobila GPU i toppklass. Den är utrustad med 9 728 shader-enheter, en 256-bitars minnesbuss och 16 GB snabb GDDR6 RAM. Grafikkortet har en maximal TGP på 175 watt (150 watt + 25 watt Dynamic Boost) - det är så högt det kan bli. TGP utnyttjades inte fullt ut under vårt test på Witcher 3
.
Även om GPU:n levererade resultat under genomsnittet i syntetiska GPU-benchmarks, var dess prestanda i faktiska spel över genomsnittet. Att växla till dGPU-läge (via Control Center) gav också en prestandaökning. Med så kraftfull hårdvara är den bärbara datorn definitivt kapabel till 4K-spel med höga till maximala inställningar.


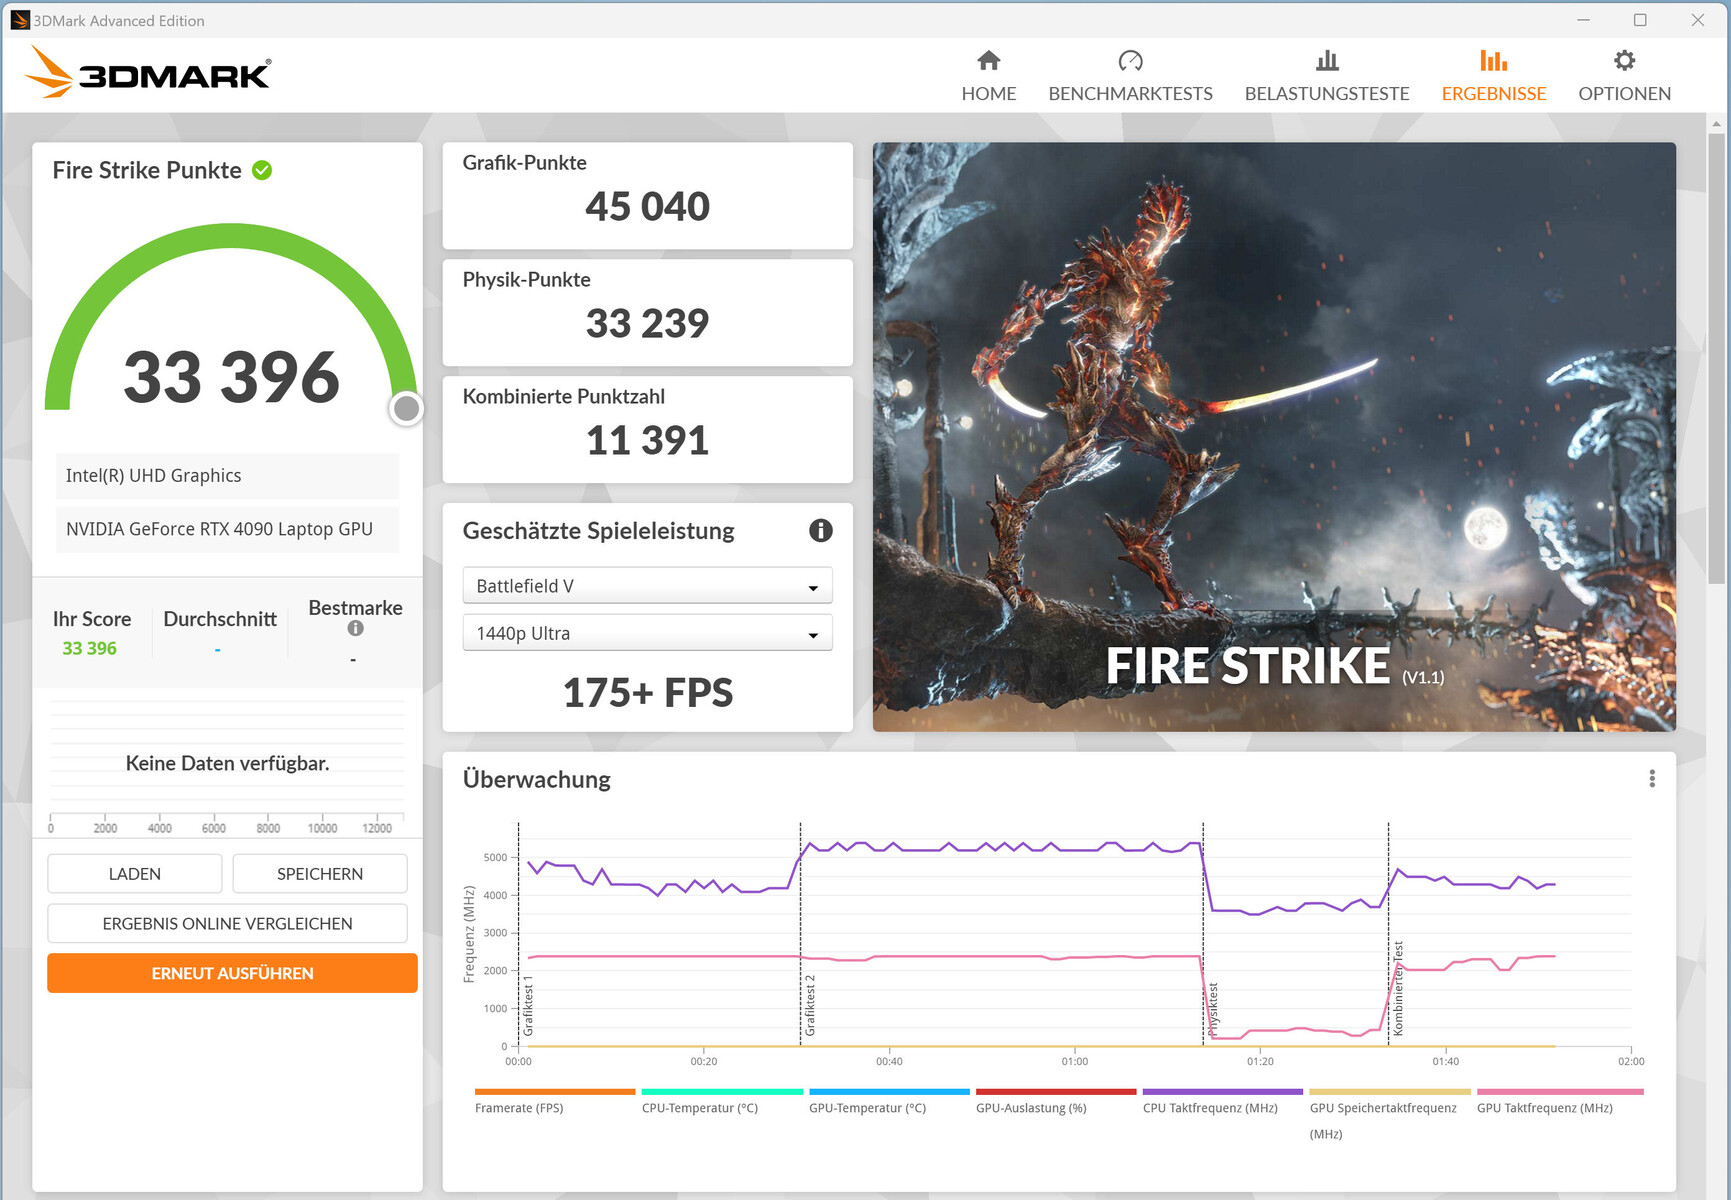
| 3DMark 11 Performance | 44742 poäng | |
| 3DMark Cloud Gate Standard Score | 54257 poäng | |
| 3DMark Fire Strike Score | 31208 poäng | |
| 3DMark Time Spy Score | 19893 poäng | |
Hjälp | ||
* ... mindre är bättre
| The Witcher 3 - 1920x1080 Ultra Graphics & Postprocessing (HBAO+) | |
| Schenker Key 17 Pro (Early 23) | |
| Asus ROG Strix Scar 17 G733PY-XS96 | |
| Aorus 17X AZF | |
| Genomsnitt NVIDIA GeForce RTX 4090 Laptop GPU (139.2 - 216, n=35) | |
| Genomsnitt av klass Gaming (104.7 - 240, n=7, senaste 2 åren) | |
| Medion Erazer Beast X40 | |
| MSI Stealth 17 Studio A13VH-014 | |
| Strange Brigade - 1920x1080 ultra AA:ultra AF:16 | |
| Aorus 17X AZF | |
| Schenker Key 17 Pro (Early 23) | |
| Medion Erazer Beast X40 | |
| Genomsnitt NVIDIA GeForce RTX 4090 Laptop GPU (233 - 421, n=39) | |
| Genomsnitt av klass Gaming (76.3 - 458, n=87, senaste 2 åren) | |
| MSI Stealth 17 Studio A13VH-014 | |
| Sons of the Forest | |
| 1920x1080 Ultra Preset AA:T | |
| Schenker Key 17 Pro (Early 23) | |
| Genomsnitt NVIDIA GeForce RTX 4090 Laptop GPU (85.7 - 93.9, n=2) | |
| Medion Erazer Beast X40 | |
| 3840x2160 Ultra Preset AA:T | |
| Schenker Key 17 Pro (Early 23) | |
| Genomsnitt NVIDIA GeForce RTX 4090 Laptop GPU (n=1) | |
| Star Wars Jedi Survivor | |
| 1920x1080 Epic Preset | |
| Schenker Key 17 Pro (Early 23) | |
| Genomsnitt NVIDIA GeForce RTX 4090 Laptop GPU (103 - 148, n=6) | |
| Asus ROG Strix Scar 17 G733PY-XS96 | |
| 3840x2160 Epic Preset | |
| Genomsnitt NVIDIA GeForce RTX 4090 Laptop GPU (39 - 59, n=6) | |
| Asus ROG Strix Scar 17 G733PY-XS96 | |
| Schenker Key 17 Pro (Early 23) | |
| Resident Evil 4 Remake | |
| 1920x1080 Max Preset | |
| Schenker Key 17 Pro (Early 23) | |
| Genomsnitt NVIDIA GeForce RTX 4090 Laptop GPU (136.3 - 143.2, n=2) | |
| Aorus 17X AZF | |
| 3840x2160 Max Preset | |
| Schenker Key 17 Pro (Early 23) | |
| Genomsnitt NVIDIA GeForce RTX 4090 Laptop GPU (63.4 - 64.9, n=2) | |
| Aorus 17X AZF | |
| Dead Island 2 | |
| 1920x1080 Ultra Preset AA:High T | |
| Genomsnitt NVIDIA GeForce RTX 4090 Laptop GPU (181.7 - 206, n=2) | |
| Schenker Key 17 Pro (Early 23) | |
| 3840x2160 Ultra Preset AA:High T | |
| Genomsnitt NVIDIA GeForce RTX 4090 Laptop GPU (94.8 - 101.2, n=2) | |
| Schenker Key 17 Pro (Early 23) | |
| The Callisto Protocol | |
| 1920x1080 Ultra Preset (without FSR Upscaling) | |
| Schenker Key 17 Pro (Early 23) | |
| Aorus 17X AZF | |
| Genomsnitt NVIDIA GeForce RTX 4090 Laptop GPU (102.6 - 150.7, n=6) | |
| 3840x2160 Ultra Preset (without FSR Upscaling) | |
| Schenker Key 17 Pro (Early 23) | |
| Genomsnitt NVIDIA GeForce RTX 4090 Laptop GPU (48.1 - 81.4, n=6) | |
| Aorus 17X AZF | |
Witcher 3 FPS chart
| låg | med. | hög | ultra | QHD | 4K | |
|---|---|---|---|---|---|---|
| GTA V (2015) | 187.7 | 186.4 | 184.8 | 142.3 | 141.5 | 167.9 |
| The Witcher 3 (2015) | 474.4 | 382.6 | 299.2 | 206 | 96.3 | |
| Dota 2 Reborn (2015) | 231 | 207 | 195.3 | 182.5 | 141.9 | |
| Final Fantasy XV Benchmark (2018) | 230 | 217 | 183.1 | 156.4 | 91.9 | |
| X-Plane 11.11 (2018) | 180.8 | 171.7 | 136.6 | 109.7 | ||
| Strange Brigade (2018) | 558 | 437 | 410 | 378 | 291 | 153.4 |
| The Callisto Protocol (2022) | 194.5 | 182.6 | 175.5 | 150.7 | 126.7 | 81.4 |
| Sons of the Forest (2023) | 103.2 | 97.5 | 93.9 | 93.9 | 89.6 | 72.5 |
| Resident Evil 4 Remake (2023) | 203 | 194.6 | 173.1 | 143.2 | 113.2 | 64.9 |
| Dead Island 2 (2023) | 226 | 212 | 190.3 | 181.7 | 178.5 | 94.8 |
| Star Wars Jedi Survivor (2023) | 131.2 | 127.6 | 122.1 | 117.4 | 84.4 | 41.8 |
Utsläpp och energihantering - Schenkers bärbara dator kan vara ganska bullrig
Utsläpp av buller
En kraftfull bärbar dator som Key 17 Pro kan producera en enorm mängd ljud under belastning: ljudnivån nådde en topp på 62 dB(A) när den bärbara datorn körde spel i "Performance mode". Även i "Underhållningsläge" lyckades enheten fortfarande nå en extremt hög ljudnivå på 54 dB(A). De andra två strömlägena hjälper Key 17 Pro att köra tyst för det mesta med betydligt reducerad prestanda.
Den bärbara datorn är i allmänhet tyst, ibland till och med ljudlös, på tomgång eller vid daglig användning (t.ex. kontorsprogram, surfning på Internet). Fläktarna snurrar dock ibland utan anledning (ett fenomen som vanligtvis inträffar med Clevo-barebones).
Ljudnivå
| Låg belastning |
| 26 / 33 / 46 dB(A) |
| Hög belastning |
| 56 / 64 dB(A) |
 | ||
30 dB tyst 40 dB(A) hörbar 50 dB(A) högt ljud |
||
min: | ||
| Schenker Key 17 Pro (Early 23) i9-13900HX, GeForce RTX 4090 Laptop GPU | MSI Stealth 17 Studio A13VH-014 i9-13900H, GeForce RTX 4080 Laptop GPU | Asus ROG Strix Scar 17 G733PY-XS96 R9 7945HX, GeForce RTX 4090 Laptop GPU | Aorus 17X AZF i9-13900HX, GeForce RTX 4090 Laptop GPU | Medion Erazer Beast X40 i9-13900HX, GeForce RTX 4090 Laptop GPU | |
|---|---|---|---|---|---|
| Noise | 25% | 22% | 10% | 13% | |
| av / miljö * (dB) | 26 | 24 8% | 22.7 13% | 25 4% | 24 8% |
| Idle Minimum * (dB) | 26 | 24 8% | 23.5 10% | 28 -8% | 25 4% |
| Idle Average * (dB) | 33 | 24 27% | 27.7 16% | 29 12% | 29 12% |
| Idle Maximum * (dB) | 46 | 24 48% | 27.7 40% | 34 26% | 35 24% |
| Load Average * (dB) | 56 | 34.49 38% | 30.5 46% | 51 9% | 51 9% |
| Witcher 3 ultra * (dB) | 62 | 48.29 22% | 51.4 17% | 57 8% | 51 18% |
| Load Maximum * (dB) | 64 | 49.66 22% | 54.1 15% | 54 16% | 53 17% |
* ... mindre är bättre
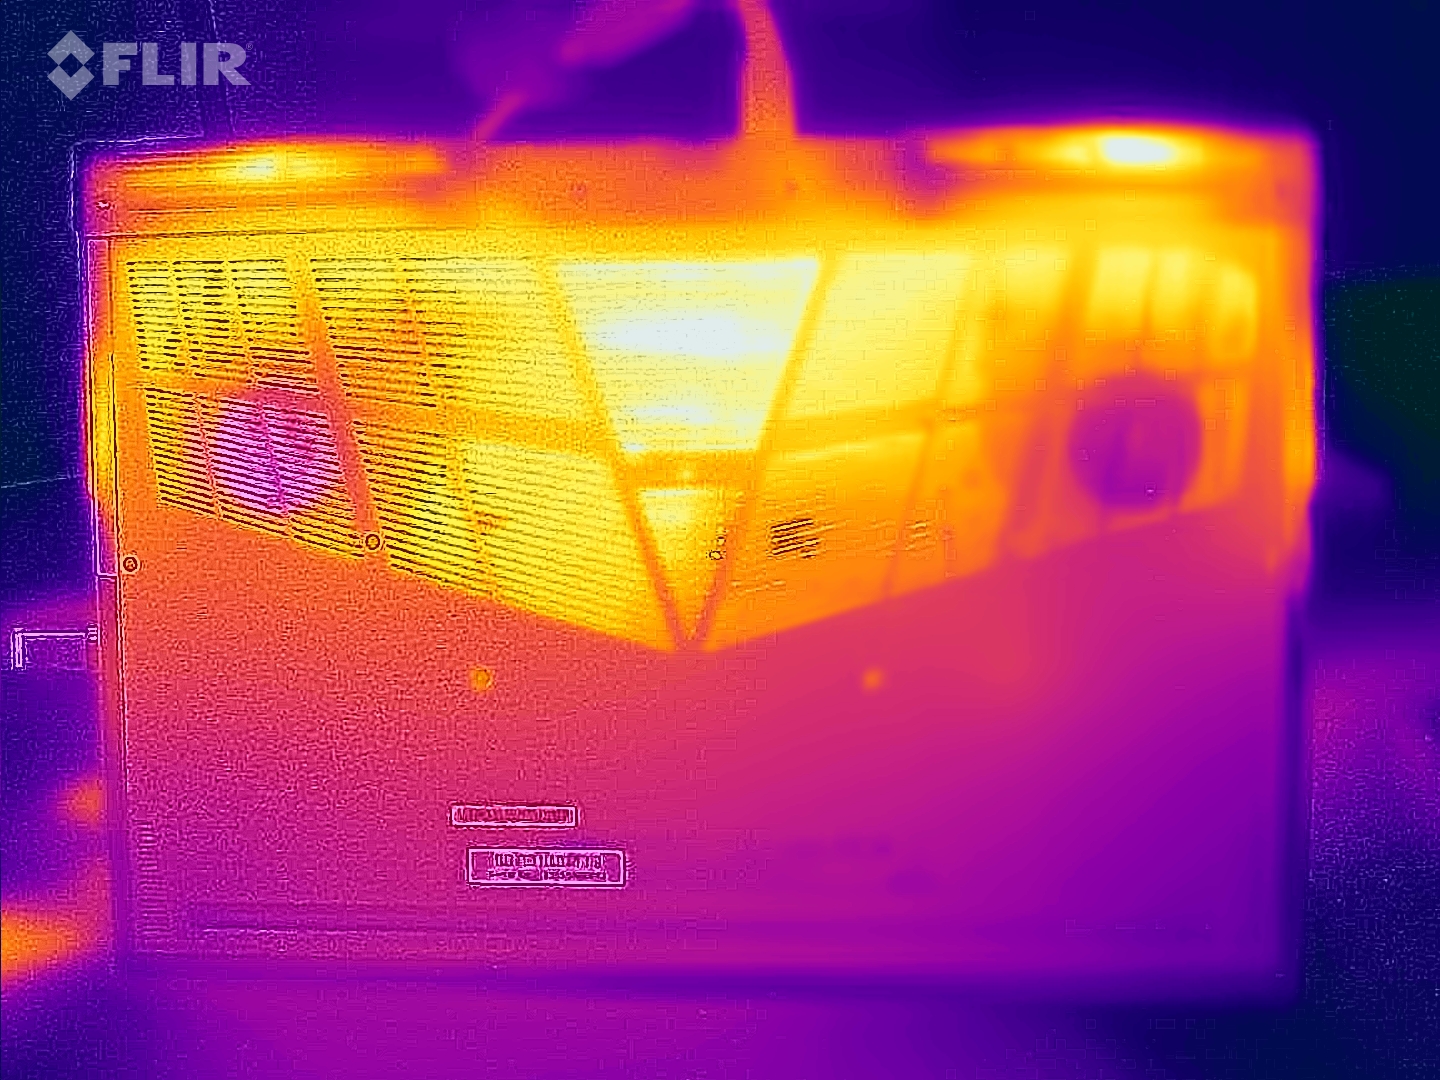
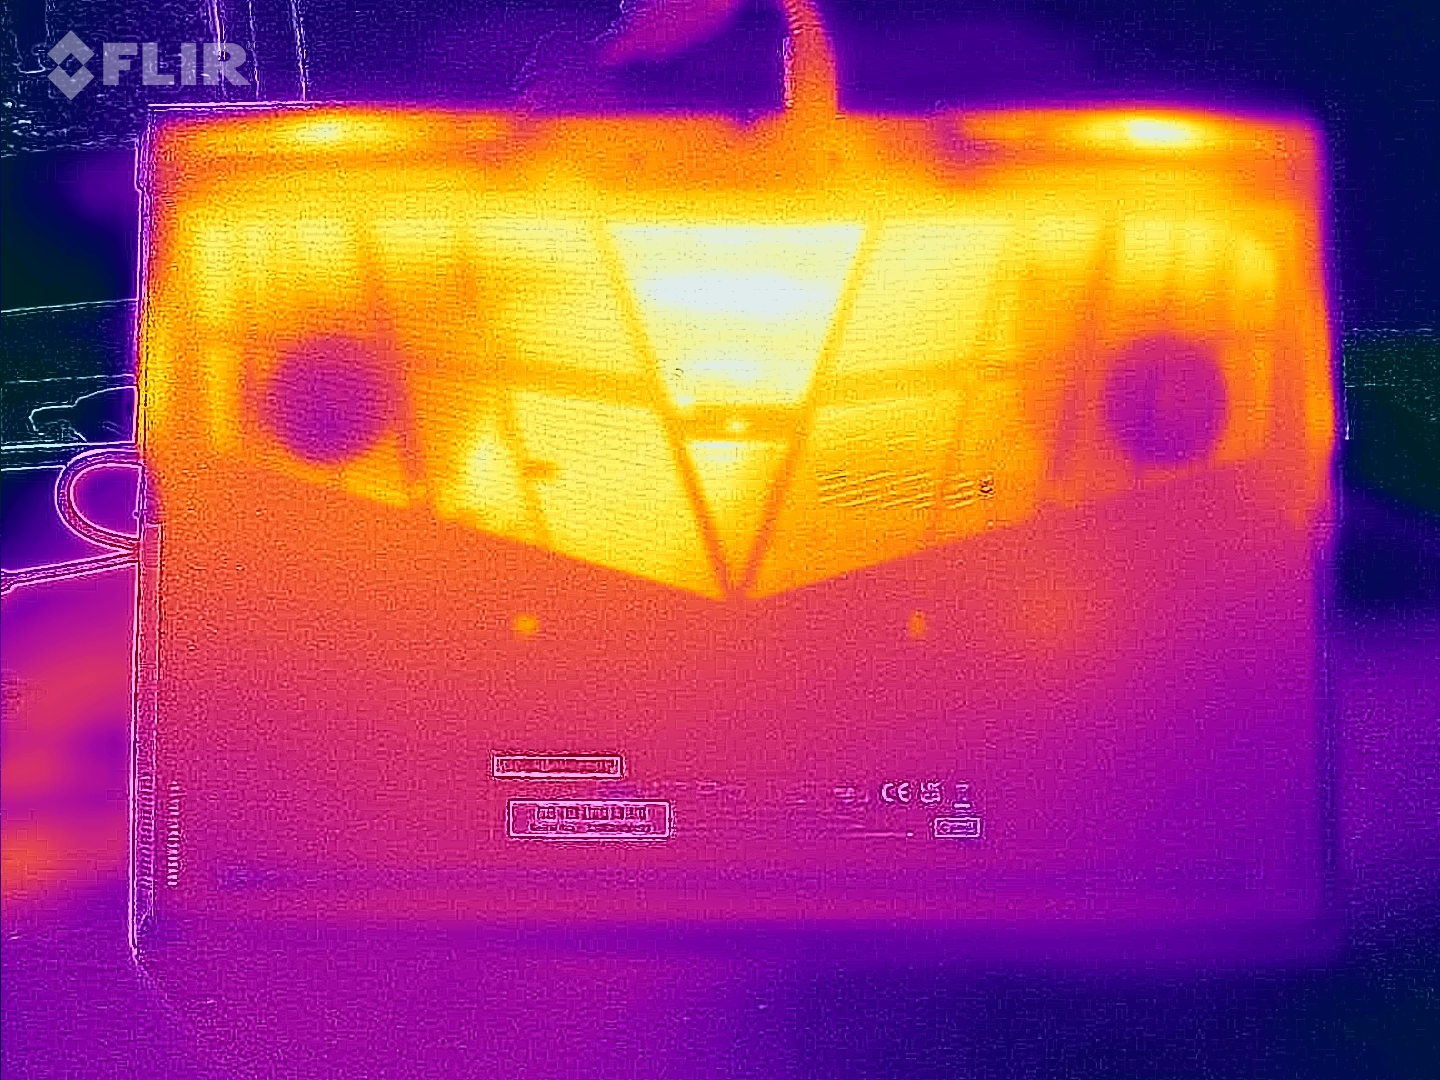
Temperatur
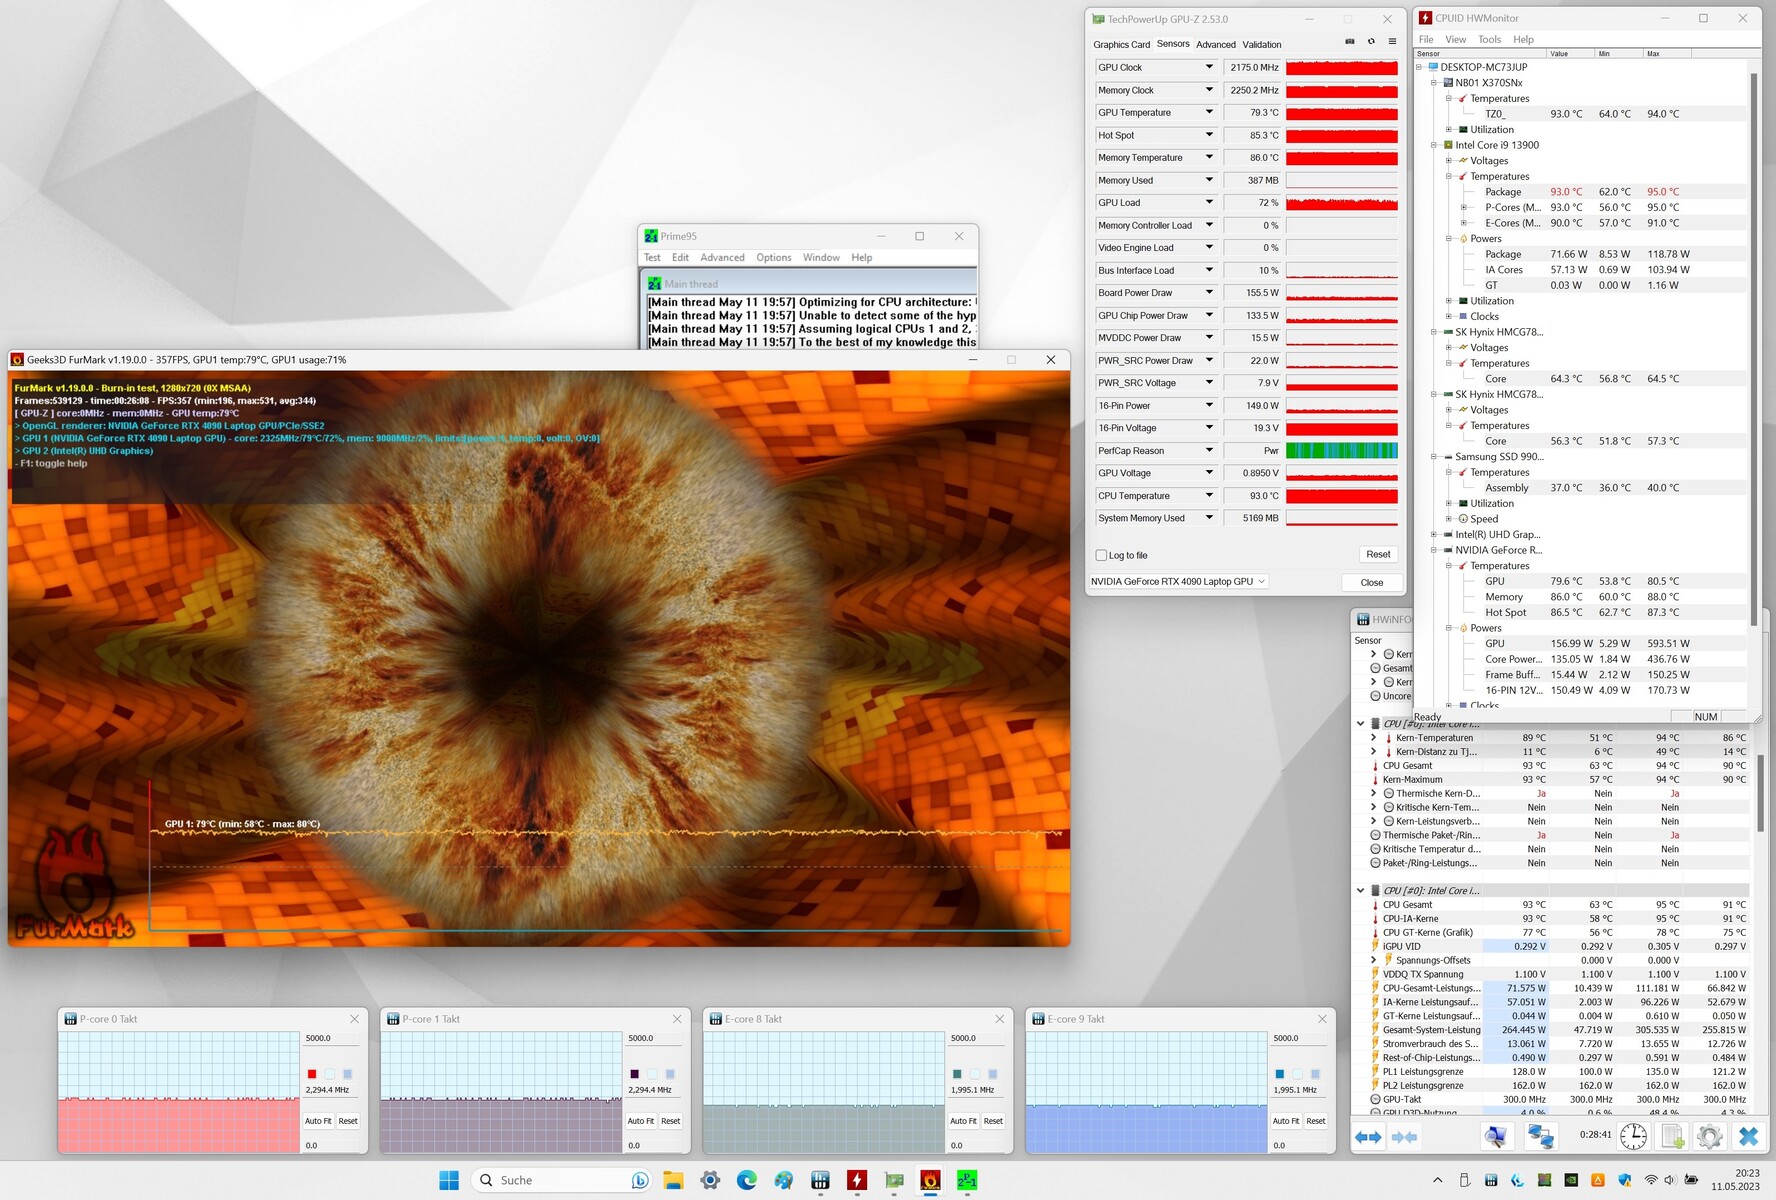
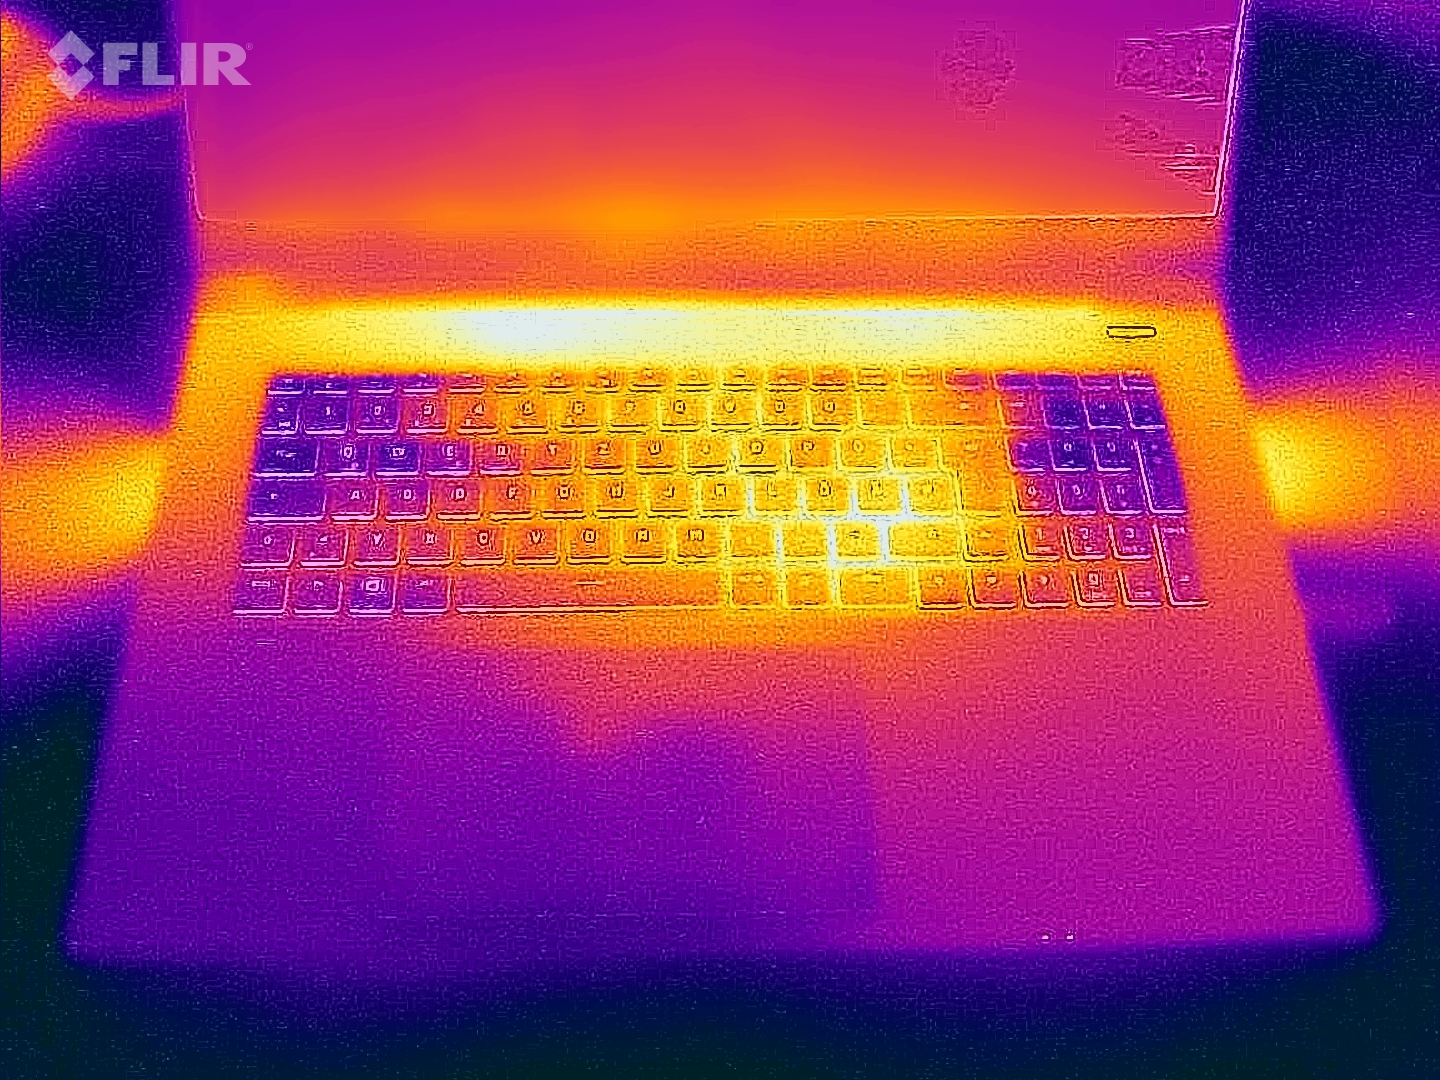
Den bärbara datorn blir märkbart varm under belastning: vi uppmätte temperaturer på mellan 55 och 60°C (131 och 140°F) på vissa ställen på chassit. Vid normal användning höll sig dock chassitemperaturen inom ett behagligt intervall
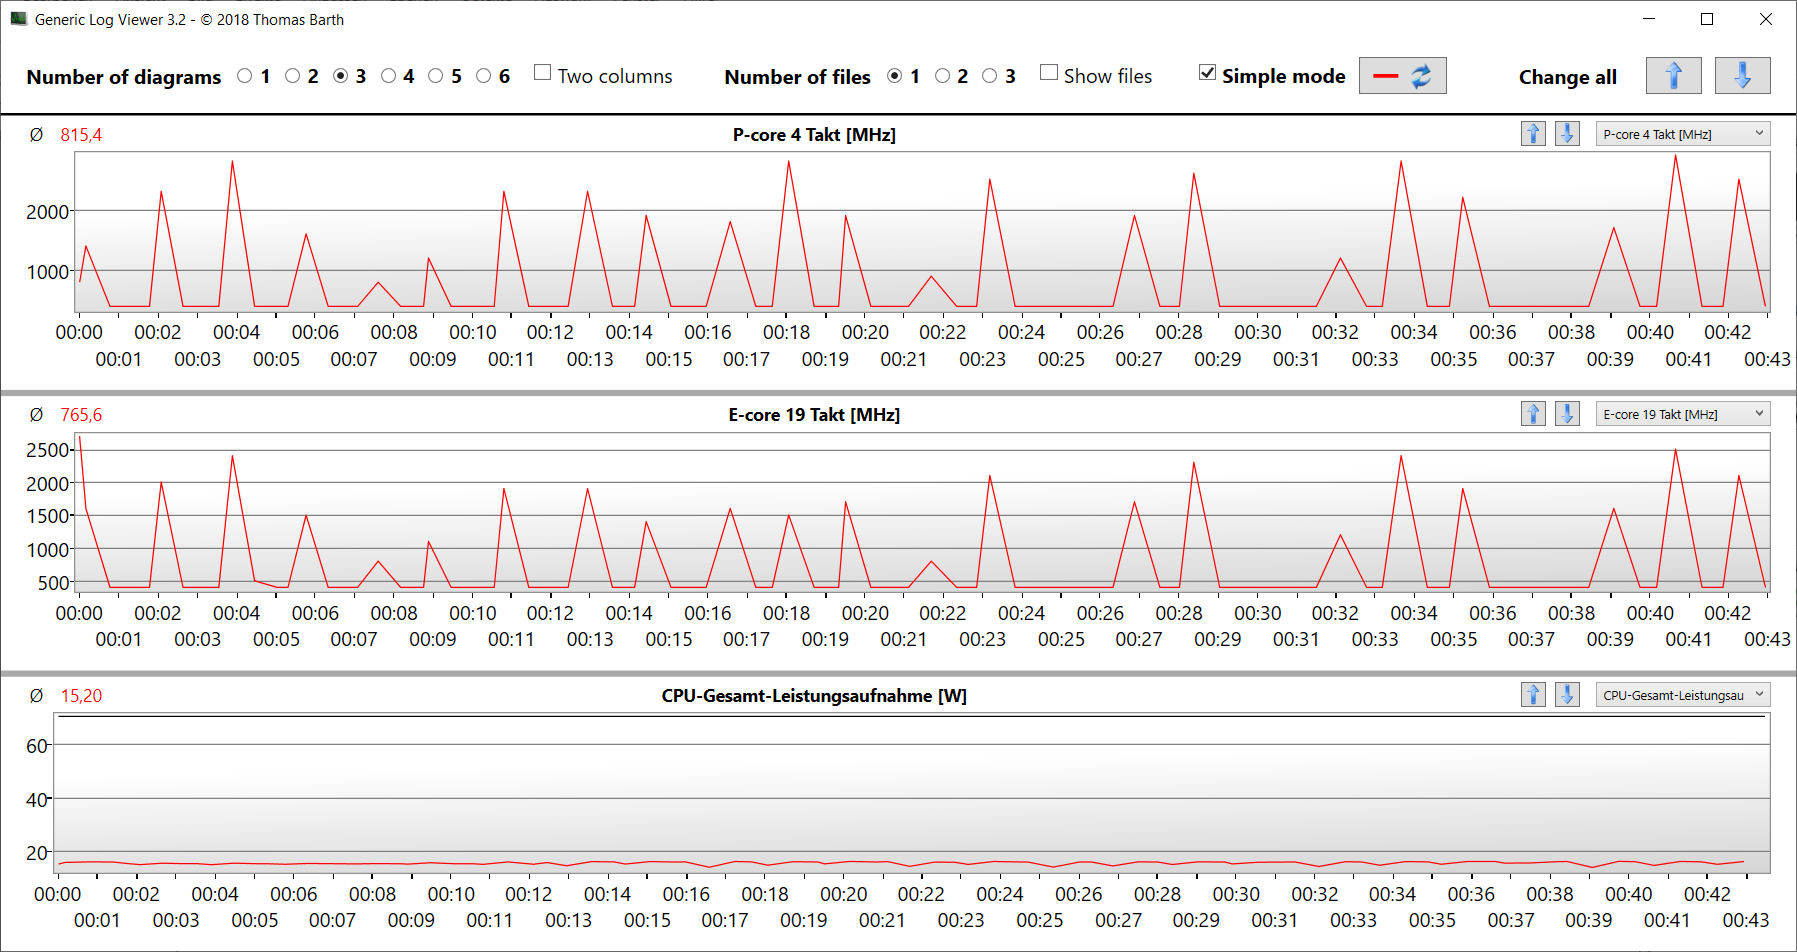
Vårt stresstest (körning av Prime95 och FurMark under en längre period) representerar ett extremt scenario som utformats för att kontrollera ett systems stabilitet under full belastning. Processorn kördes med höga klockfrekvenser (P-cores: 3,4 till 3,5 GHz, E-cores: 3,1 till 3,2 GHz) direkt från start, och GPU:n tickade på med 1,0 till 1,6 GHz. Därefter sjönk CPU-klockan relativt snabbt medan GPU-klockan klättrade över 2 GHz.
(-) Den maximala temperaturen på ovansidan är 57 °C / 135 F, jämfört med genomsnittet av 40.4 °C / 105 F , allt från 21.2 till 68.8 °C för klassen Gaming.
(-) Botten värms upp till maximalt 60 °C / 140 F, jämfört med genomsnittet av 43.2 °C / 110 F
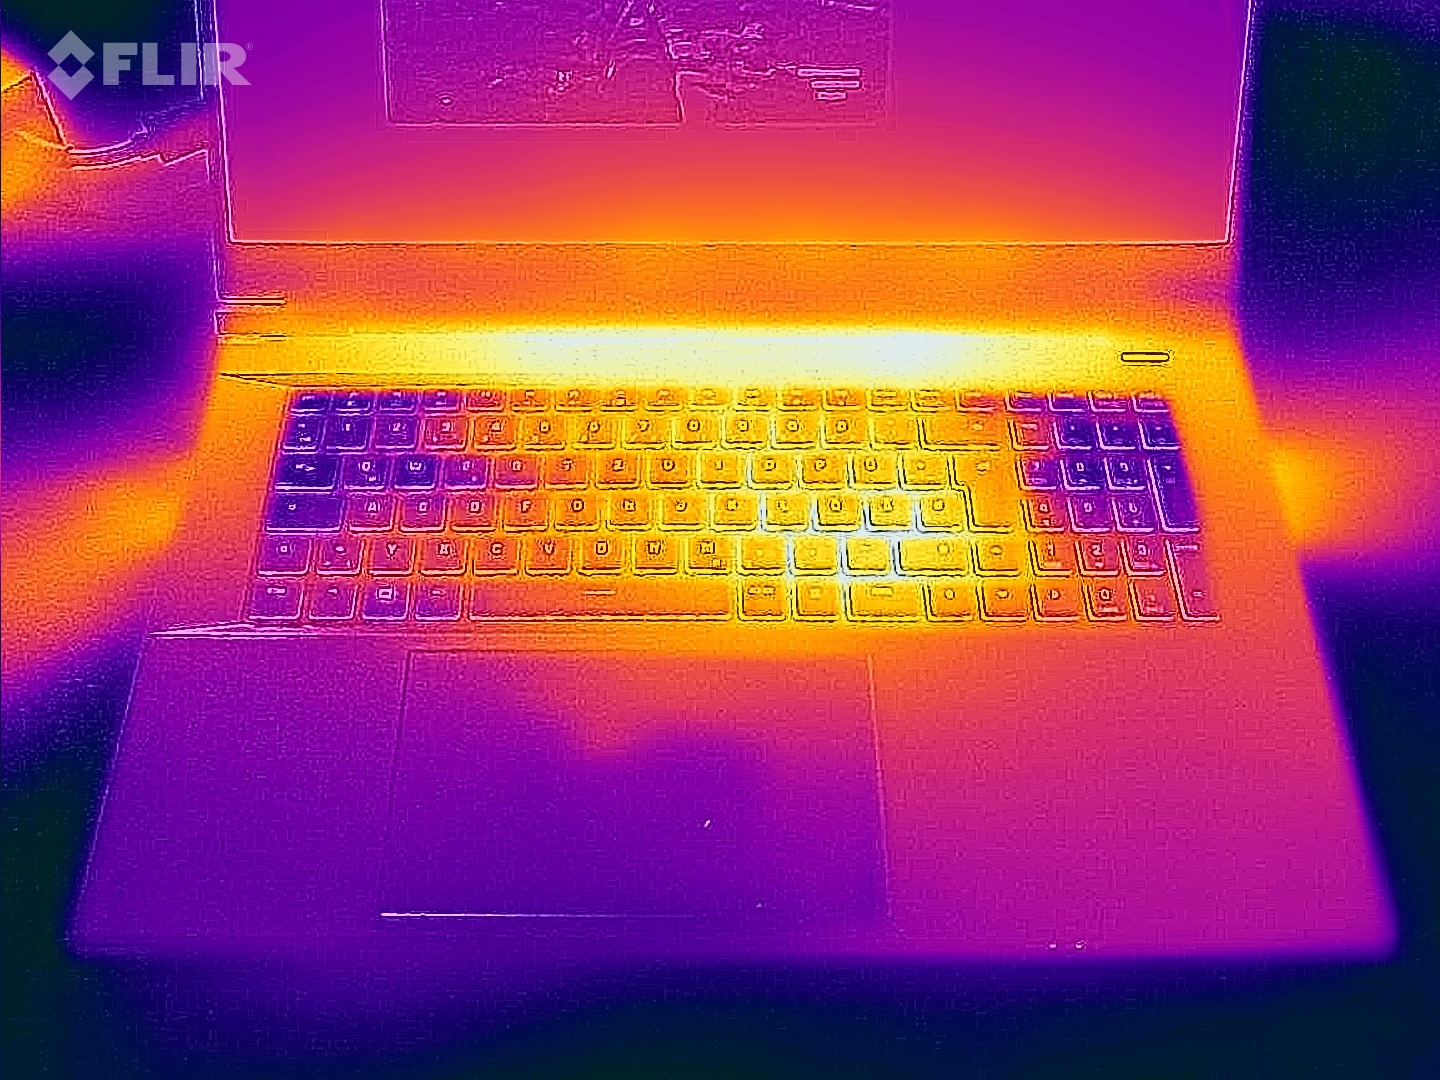
(+) Vid tomgångsbruk är medeltemperaturen för ovansidan 28.7 °C / 84 F, jämfört med enhetsgenomsnittet på 33.9 °C / ### class_avg_f### F.
(-) När du spelar The Witcher 3 är medeltemperaturen för ovansidan 47.3 °C / 117 F, jämfört med enhetsgenomsnittet på 33.9 °C / ## #class_avg_f### F.
(±) Handledsstöden och pekplattan kan bli väldigt varma vid beröring med maximalt 38 °C / 100.4 F.
(-) Medeltemperaturen för handledsstödsområdet på liknande enheter var 28.8 °C / 83.8 F (-9.2 °C / -16.6 F).
| Schenker Key 17 Pro (Early 23) Intel Core i9-13900HX, NVIDIA GeForce RTX 4090 Laptop GPU | MSI Stealth 17 Studio A13VH-014 Intel Core i9-13900H, NVIDIA GeForce RTX 4080 Laptop GPU | Asus ROG Strix Scar 17 G733PY-XS96 AMD Ryzen 9 7945HX, NVIDIA GeForce RTX 4090 Laptop GPU | Aorus 17X AZF Intel Core i9-13900HX, NVIDIA GeForce RTX 4090 Laptop GPU | Medion Erazer Beast X40 Intel Core i9-13900HX, NVIDIA GeForce RTX 4090 Laptop GPU | |
|---|---|---|---|---|---|
| Heat | 10% | 27% | 12% | 11% | |
| Maximum Upper Side * (°C) | 57 | 47 18% | 34.6 39% | 47 18% | 48 16% |
| Maximum Bottom * (°C) | 60 | 54 10% | 35.6 41% | 51 15% | 52 13% |
| Idle Upper Side * (°C) | 32 | 30 6% | 27.2 15% | 30 6% | 30 6% |
| Idle Bottom * (°C) | 34 | 32 6% | 30 12% | 31 9% | 31 9% |
* ... mindre är bättre
Högtalare
Stereohögtalarna låter överlag ganska bra.
Schenker Key 17 Pro (Early 23) ljudanalys
(±) | högtalarljudstyrkan är genomsnittlig men bra (78 dB)
Bas 100 - 315 Hz
(±) | reducerad bas - i genomsnitt 11.7% lägre än medianen
(±) | linjäriteten för basen är genomsnittlig (7.1% delta till föregående frekvens)
Mellan 400 - 2000 Hz
(+) | balanserad mellan - endast 2.1% från medianen
(+) | mids är linjära (3.5% delta till föregående frekvens)
Högsta 2 - 16 kHz
(+) | balanserade toppar - endast 1.8% från medianen
(+) | toppar är linjära (6.4% delta till föregående frekvens)
Totalt 100 - 16 000 Hz
(+) | det totala ljudet är linjärt (11.9% skillnad mot median)
Jämfört med samma klass
» 12% av alla testade enheter i den här klassen var bättre, 4% liknande, 84% sämre
» Den bästa hade ett delta på 6%, genomsnittet var 18%, sämst var 132%
Jämfört med alla testade enheter
» 9% av alla testade enheter var bättre, 2% liknande, 89% sämre
» Den bästa hade ett delta på 4%, genomsnittet var 23%, sämst var 134%
MSI Stealth 17 Studio A13VH-014 ljudanalys
(+) | högtalare kan spela relativt högt (82.44 dB)
Bas 100 - 315 Hz
(±) | reducerad bas - i genomsnitt 8% lägre än medianen
(±) | linjäriteten för basen är genomsnittlig (8.8% delta till föregående frekvens)
Mellan 400 - 2000 Hz
(±) | högre mellan - i genomsnitt 8.2% högre än median
(+) | mids är linjära (6.8% delta till föregående frekvens)
Högsta 2 - 16 kHz
(+) | balanserade toppar - endast 1% från medianen
(+) | toppar är linjära (4% delta till föregående frekvens)
Totalt 100 - 16 000 Hz
(+) | det totala ljudet är linjärt (11.6% skillnad mot median)
Jämfört med samma klass
» 10% av alla testade enheter i den här klassen var bättre, 3% liknande, 87% sämre
» Den bästa hade ett delta på 6%, genomsnittet var 18%, sämst var 132%
Jämfört med alla testade enheter
» 8% av alla testade enheter var bättre, 2% liknande, 90% sämre
» Den bästa hade ett delta på 4%, genomsnittet var 23%, sämst var 134%
Strömförbrukning
Key 17 Pro uppvisade inga problem med strömförbrukningen. Den bibehöll en jämn strömförbrukning under stresstestet och testet på Witcher 3. Den medföljande adaptern (330 watt) är tillräckligt kraftfull för enheten.
| Av/Standby | |
| Låg belastning | |
| Hög belastning |
|
Förklaring:
min: | |
Power consumption Witcher 3 / Stresstest
Power consumption with external monitor
Batteriets livslängd
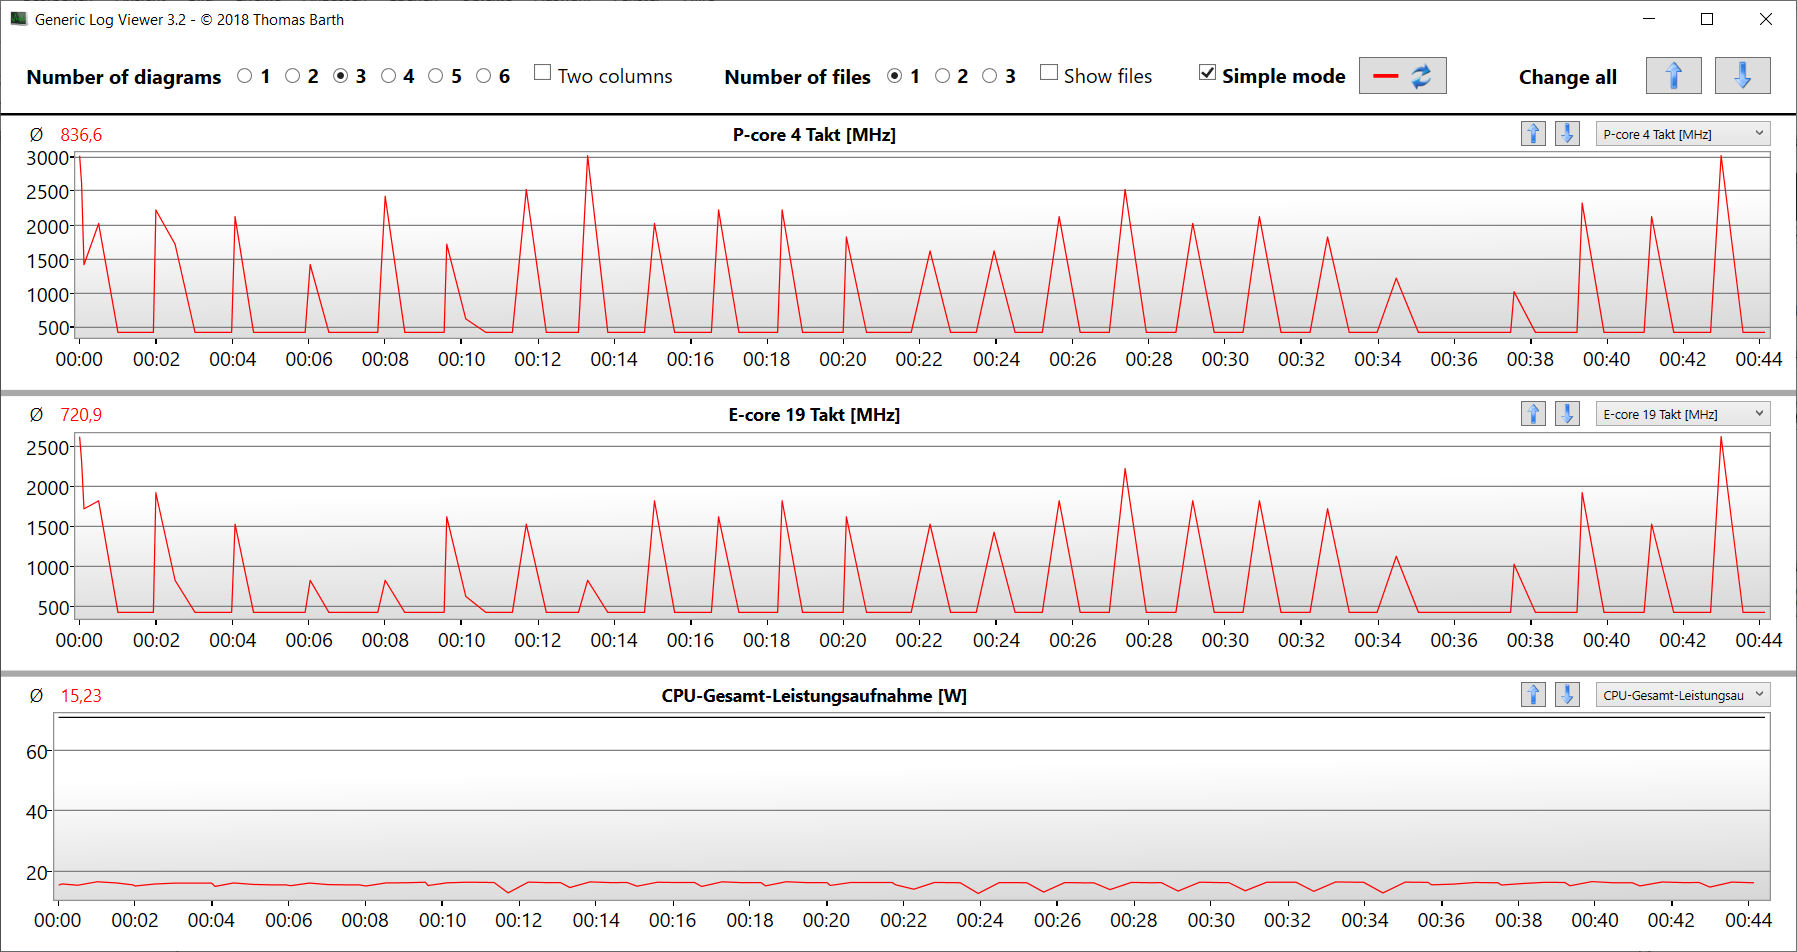
Vårt Wi-Fi-test är utformat för att simulera verklig användning och innebär åtkomst till olika webbplatser med hjälp av ett skript. Den 17,3-tums bärbara datorn klarade 6h 51m under testet - ett mycket respektabelt resultat för en så kraftfull 4K-bärbar dator.
För
Emot
Bedömning - anpassningsbart kraftpaket
Key 17 Pro är framtagen för användningsscenarier som kräver mycket datorkraft, t.ex. videoredigering, spel och rendering. Den GeForce RTX 4090 bärbar dator och Core i9-13900HX inuti ger de muskler som krävs för att hantera dessa uppgifter - båda komponenterna kan köras konstant i höga hastigheter. Den bärbara datorn genererar en normal mängd värme och buller för den här typen av enhet.
Schenker har levererat en kraftfull high-end notebook med Key 17 Pro (Early 23).
Key 17 Pro har tre SSD-platser (1x PCIe 5.0, 2x PCIe 4.0; M.2-2280), vilket innebär att du snabbt kan lägga till fler enheter om du någonsin får ont om lagringsutrymme. De två PCIe 4.0-platserna stöder RAID 0/1. Att installera ytterligare SSD-enheter är inte särskilt komplicerat. Bottenpanelen kan tas bort utan verktyg efter att du har lossat alla skruvar.
De två USB-C-portarna (Thunderbolt 4) gör att du enkelt kan integrera den bärbara datorn i en befintlig skrivbordskonfiguration och öppna upp för expansionsalternativ (t.ex. extern GPU). En av portarna har även stöd för Power Delivery. Batteritiden är mycket anständig på enheten. Den matta 17,3-tumsskärmen (4K, IPS, 144Hz, G-Sync och DCI-P3) lämnade ett mestadels positivt intryck under våra tester, även om den skulle dra nytta av att ha högre kontrast.
Ett alternativ till Key 17 Pro är MSI Stealth 17 Studio. Den levereras med en mini-LED-skärm och producerar mycket mindre ljud vid full gas. Vid tidpunkten för denna recension hade den nästan identiskt specade Aorus 17X AZF (om än med en QHD-panel snarare än en 4K-panel) för betydligt mindre än Key och är därmed ett mer plånboksvänligt alternativ.
Pris och tillgänglighet
Schenker Key 17 Pro (Early 23) enligt specifikationerna i denna recension kostar ca 4 479 € (4 820 USD). Alternativt kan du också konfigurera enheten baserat på dina behov i Schenkers onlinebutik. Priserna börjar på 3 199 € (3 445 USD).
Schenker Key 17 Pro (Early 23)
- 05/30/2023 v7 (old)
Sascha Mölck
Genomskinlighet
Valet av enheter som ska granskas görs av vår redaktion. Testprovet gavs till författaren som ett lån av tillverkaren eller återförsäljaren för denna recension. Långivaren hade inget inflytande på denna recension och inte heller fick tillverkaren en kopia av denna recension innan publiceringen. Det fanns ingen skyldighet att publicera denna recension. Som ett oberoende medieföretag är Notebookcheck inte föremål för auktoritet från tillverkare, återförsäljare eller förlag.
This is how Notebookcheck is testingEvery year, Notebookcheck independently reviews hundreds of laptops and smartphones using standardized procedures to ensure that all results are comparable. We have continuously developed our test methods for around 20 years and set industry standards in the process. In our test labs, high-quality measuring equipment is utilized by experienced technicians and editors. These tests involve a multi-stage validation process. Our complex rating system is based on hundreds of well-founded measurements and benchmarks, which maintains objectivity.
Price comparison

