Dell OptiPlex Micro Plus 7010 recension: Desktop Core i7-13700 i ett mini-PC-paket

OptiPlex Micro är en minidator avsedd för kommersiella och professionella ändamål, men dess kompakta formfaktor har sina tillämpningar för WFH-miljöer, särskilt jämfört med de fullstora OptiPlex-standardmodellerna. Just den här modellen utmärker sig genom sin stationära processor, medan de flesta andra mini-PC istället använder mobila processorer i H- eller HX-serien.
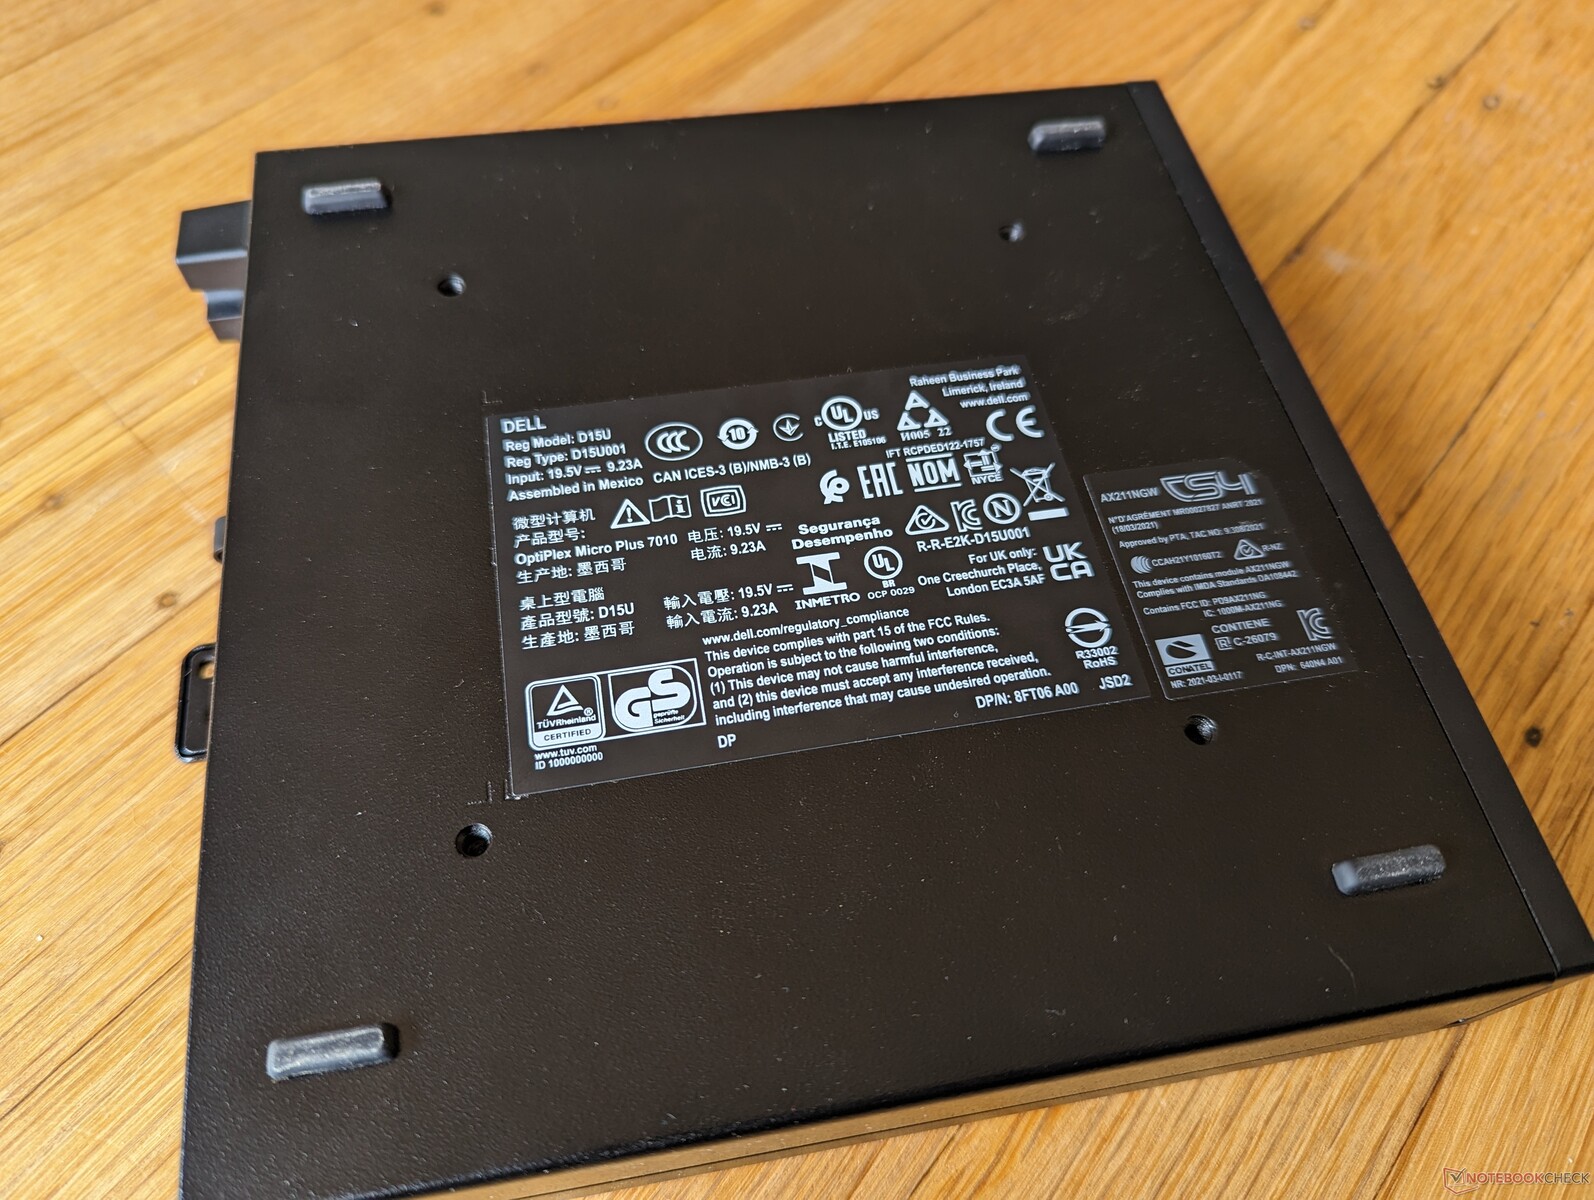
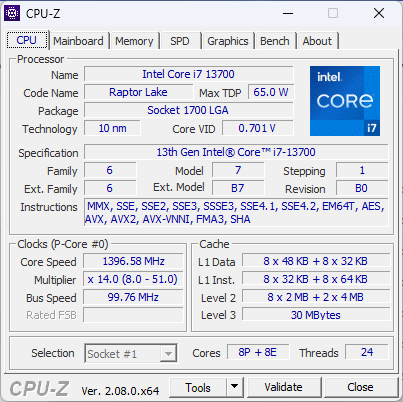
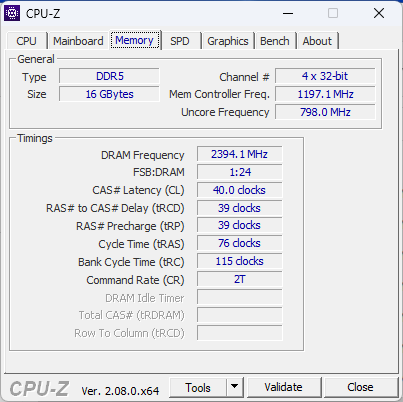
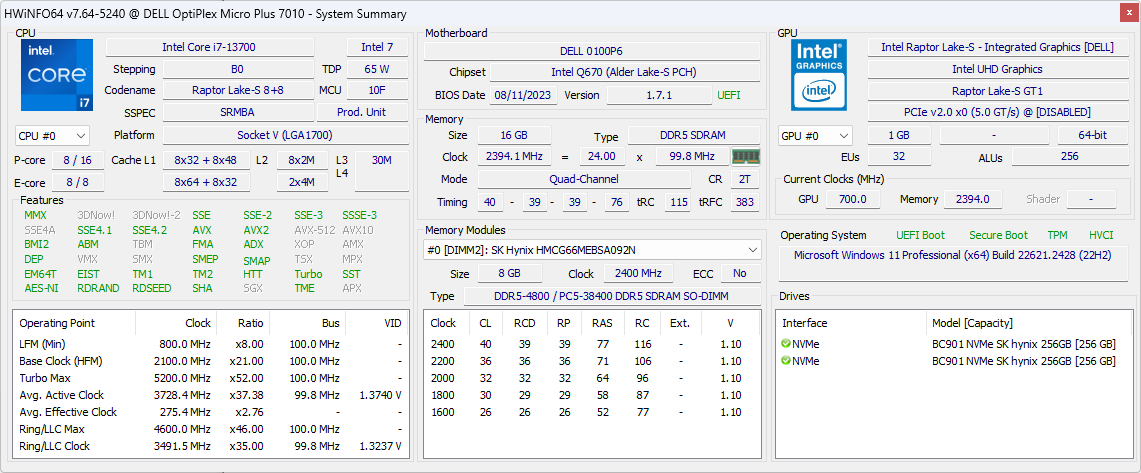
Vår specifika testenhet har konfigurerats med 13:e generationens Core i7-13700-processor, 16 GB DDR5-4800 RAM-minne och 512 GB SSD i RAID 0. Konfigurationer i lägre prisklasser börjar med Core i3-13100T för under 900 USD upp till Core i9-13900 vPro. Icke-Plus SKU:er kan levereras med en ännu långsammare Pentium Gold G7400T. Inga konfigurationer erbjuder för närvarande diskret grafik eller några AMD-alternativ.
OptiPlex Micro konkurrerar med andra halvprofessionella mini-datorer somApple Mac Mini M2, Beelink GTR7eller Intel NUC-serien.
Fler recensioner av Dell:
Potentiella konkurrenter i jämförelse
Gradering | Datum | Modell | Vikt | Höjd | Storlek | Upplösning | Pris |
|---|---|---|---|---|---|---|---|
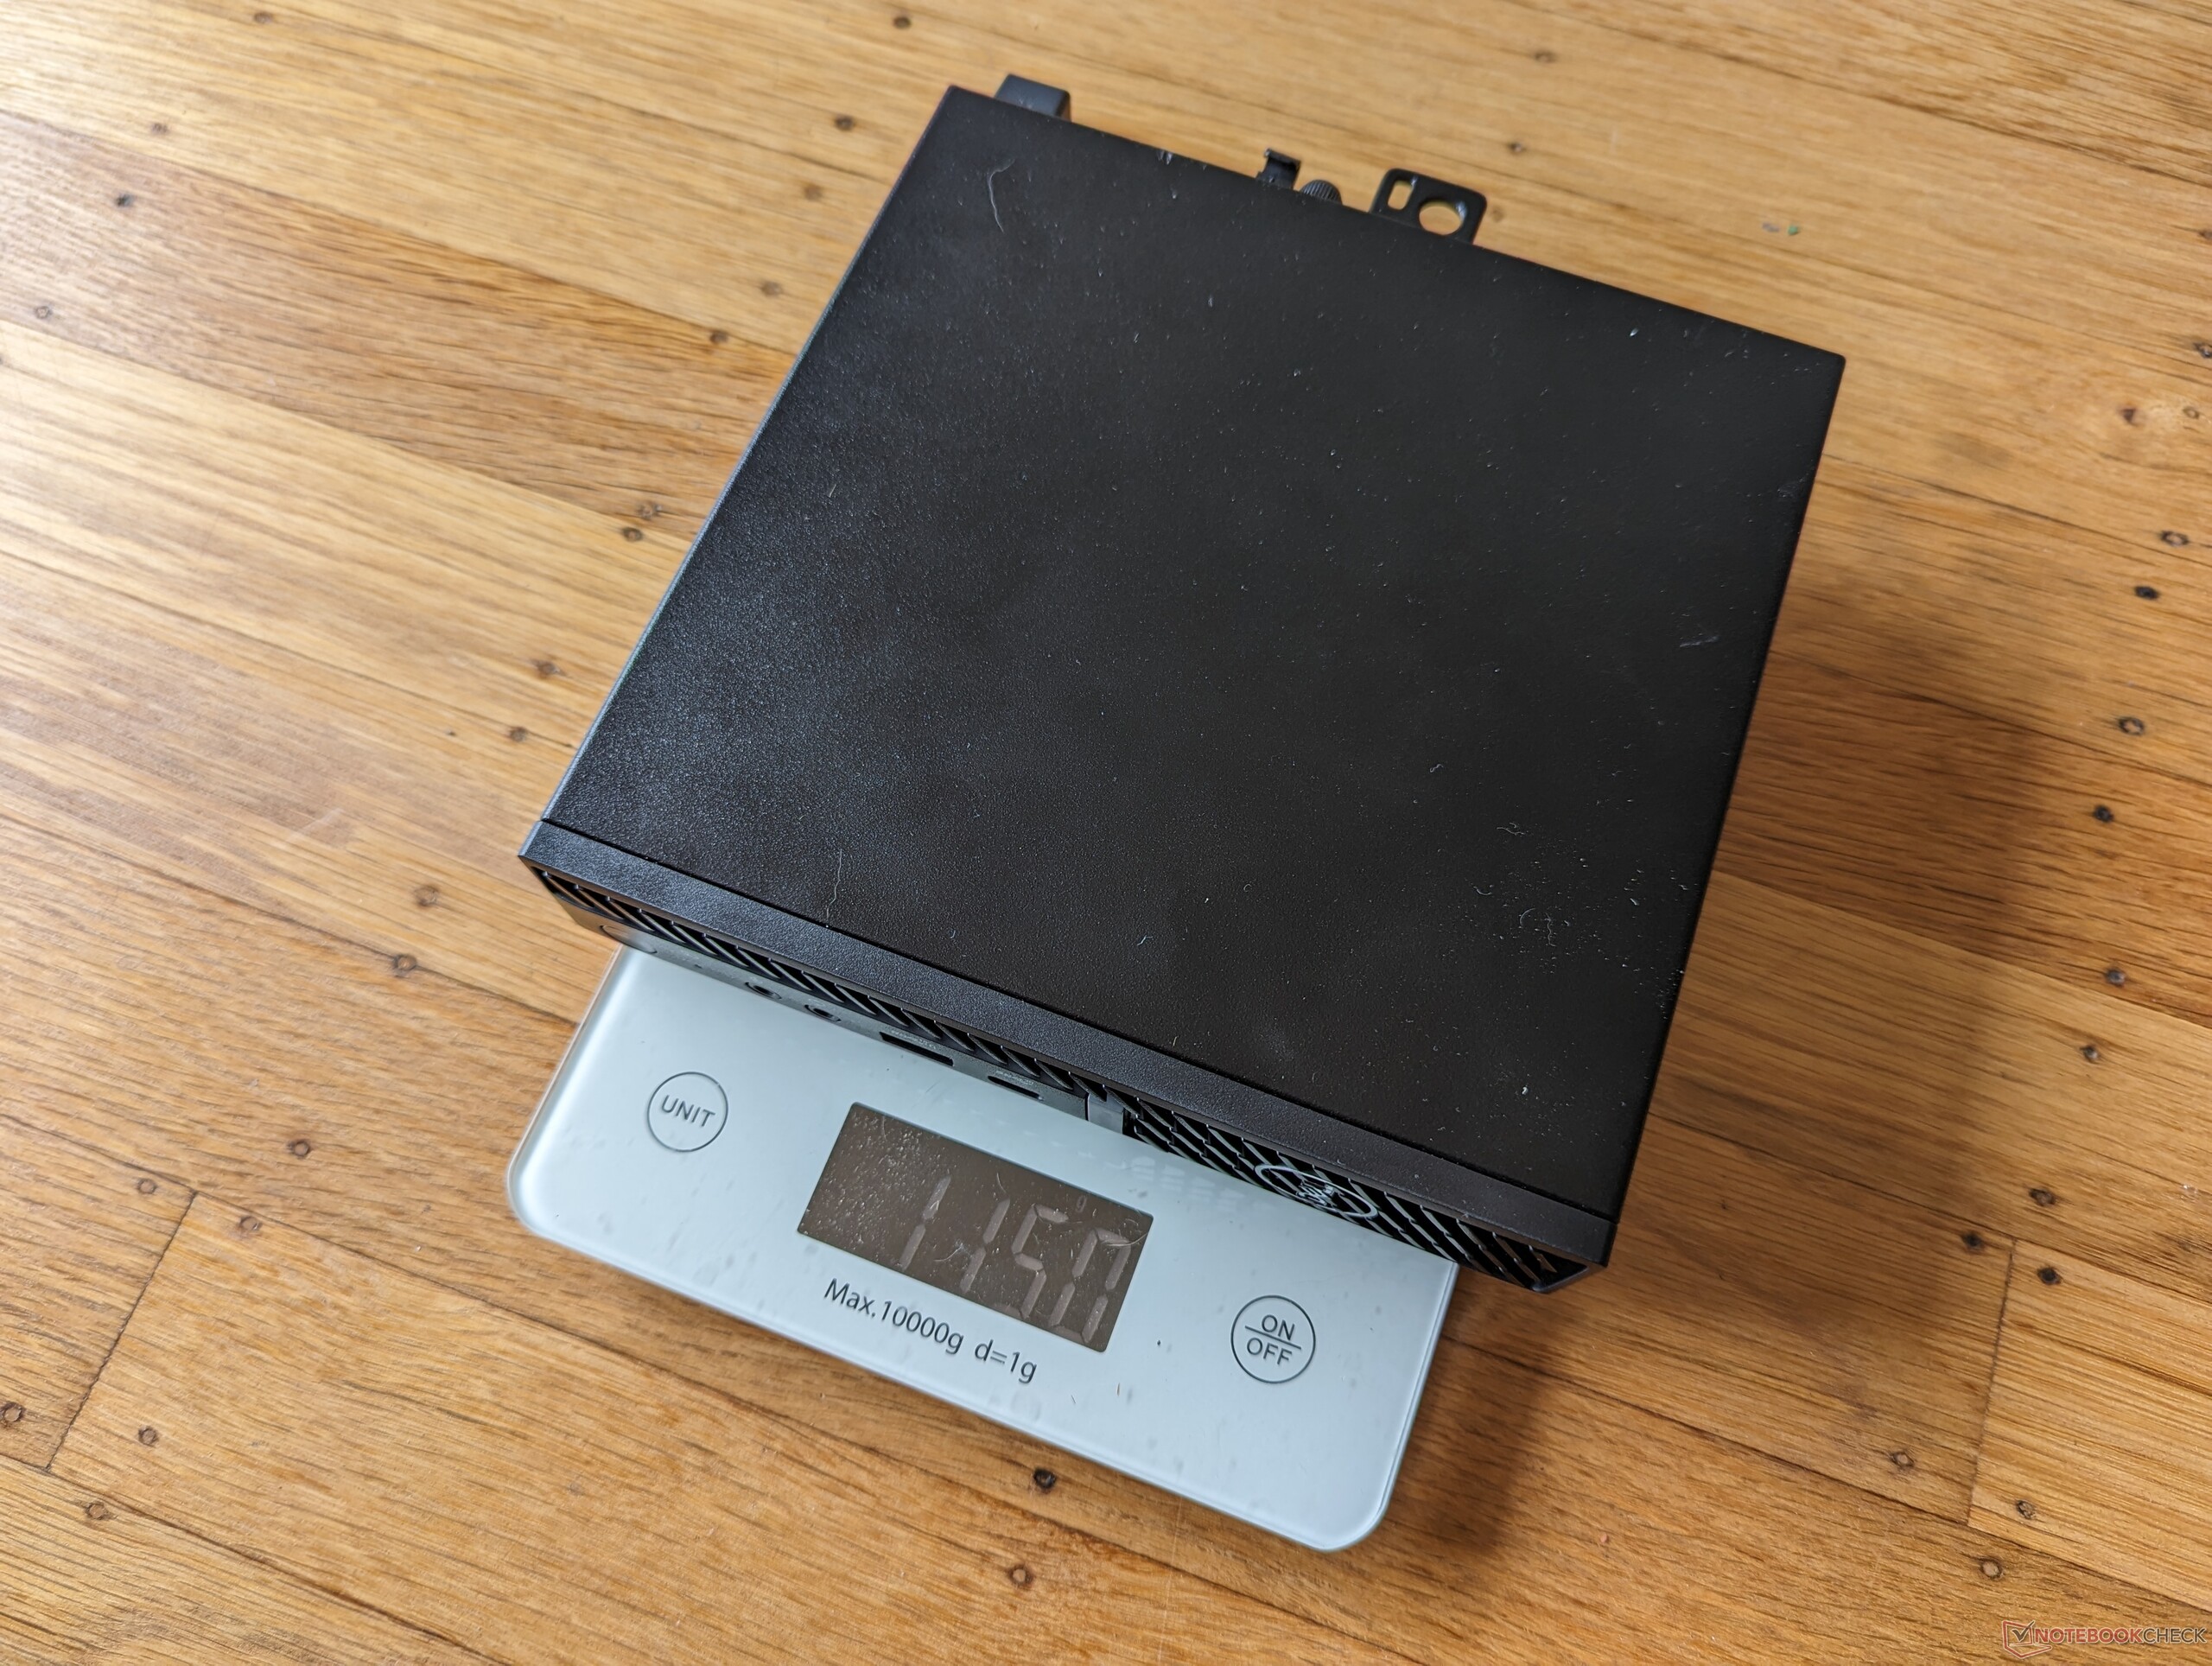
| 80.2 % v7 (old) | 10/2023 | Dell OptiPlex Micro i7-13700, UHD Graphics 770 | 1.2 kg | 36 mm | x | ||
| 87.3 % v7 (old) | 09/2023 | Apple Mac Mini M2 M2, M2 10-Core GPU | 1.2 kg | 36 mm | x | ||
| 81 % v7 (old) | 09/2023 | Lenovo IdeaCentre Mini 01IRH8 i7-13700H, Iris Xe G7 96EUs | 1.8 kg | 39 mm | x | ||
| 82.8 % v7 (old) | 10/2023 | GMK NucBox K3 Pro i7-12650H, UHD Graphics 64EUs | 396 g | 43.2 mm | x | ||
| 86.3 % v7 (old) | 07/2023 | Beelink GTR7 7840HS R7 7840HS, Radeon 780M | 890 g | 48.8 mm | x | ||
| 86.6 % v7 (old) | 09/2023 | Beelink SER7 R7 7840HS, Radeon 780M | 640 g | 49 mm | x |
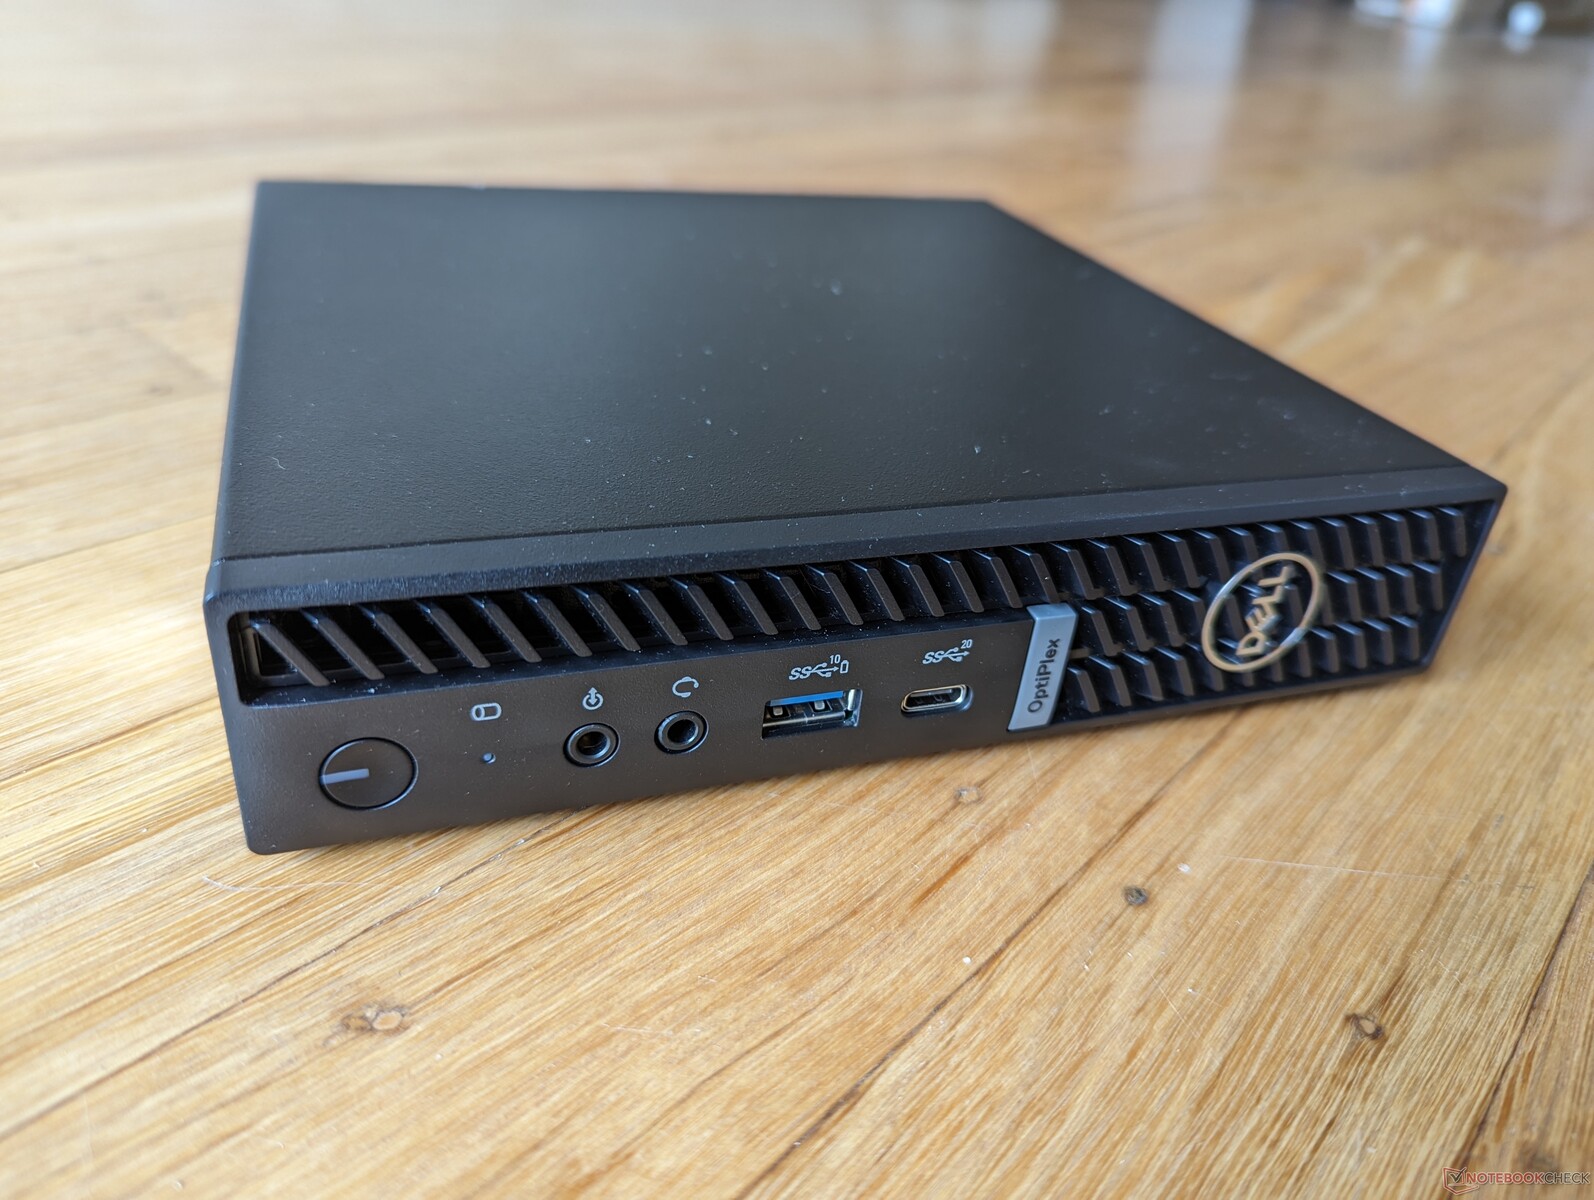
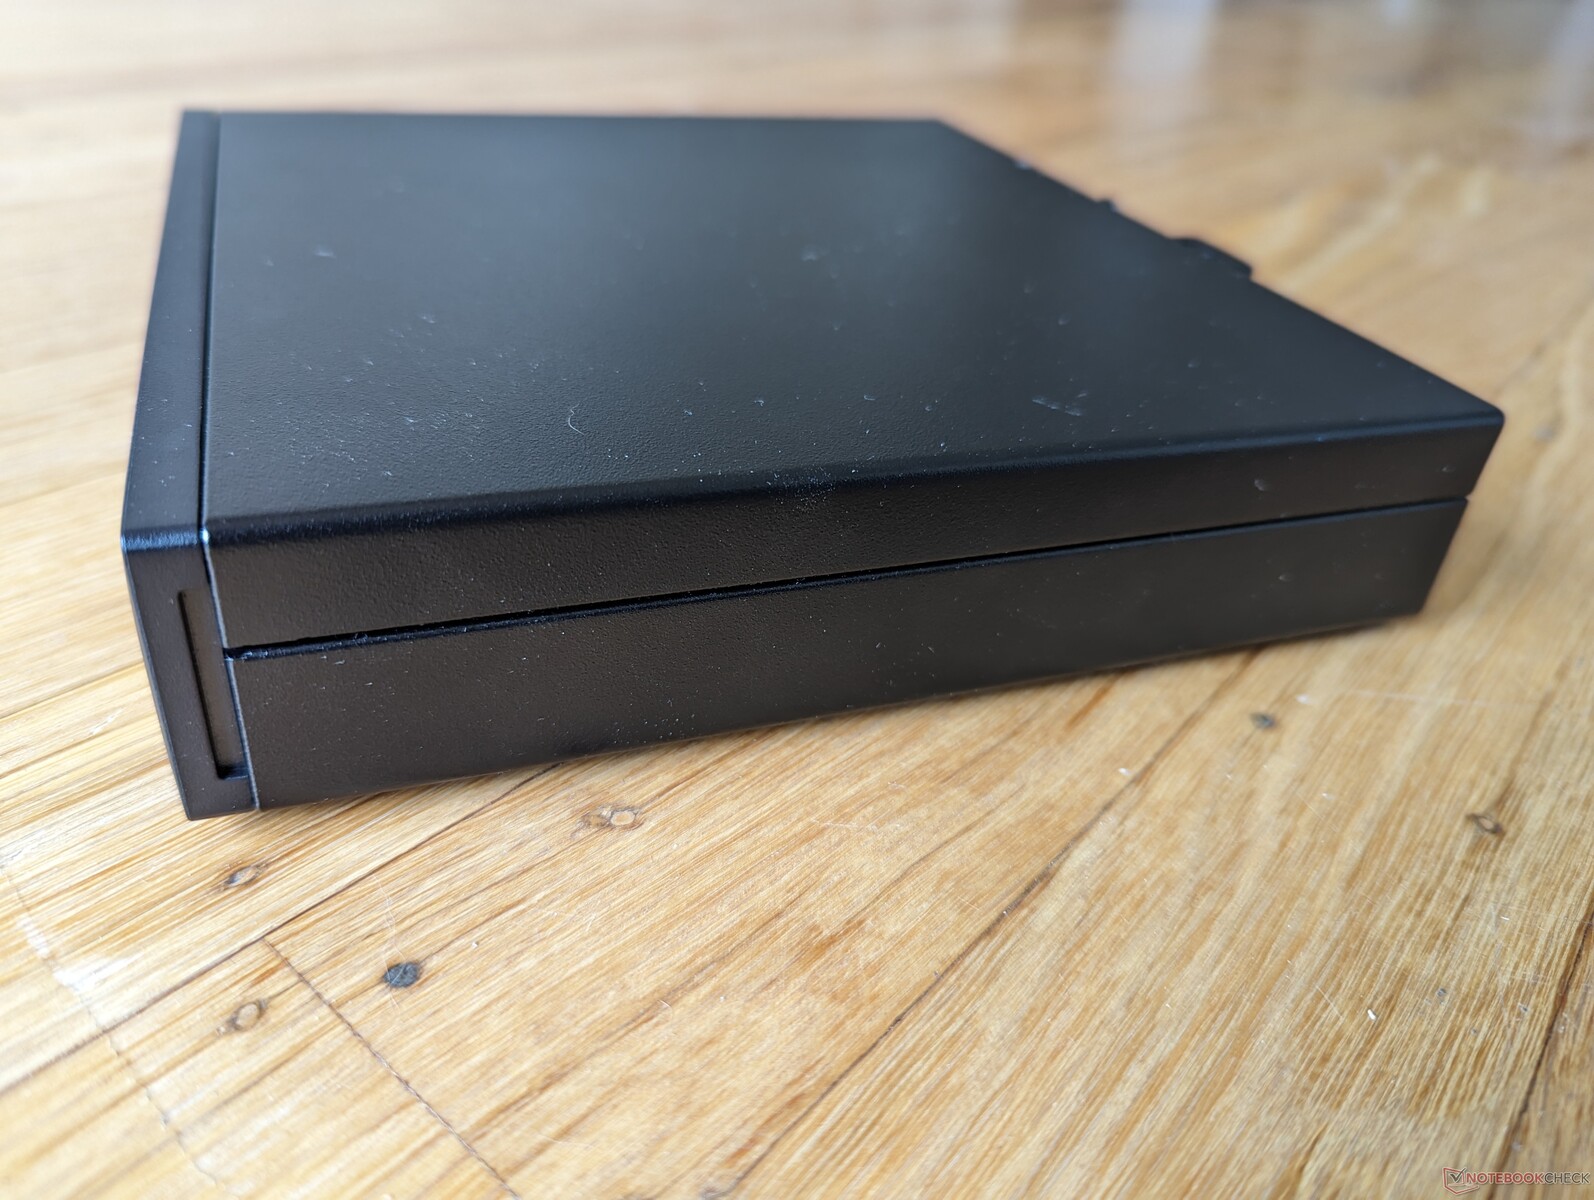
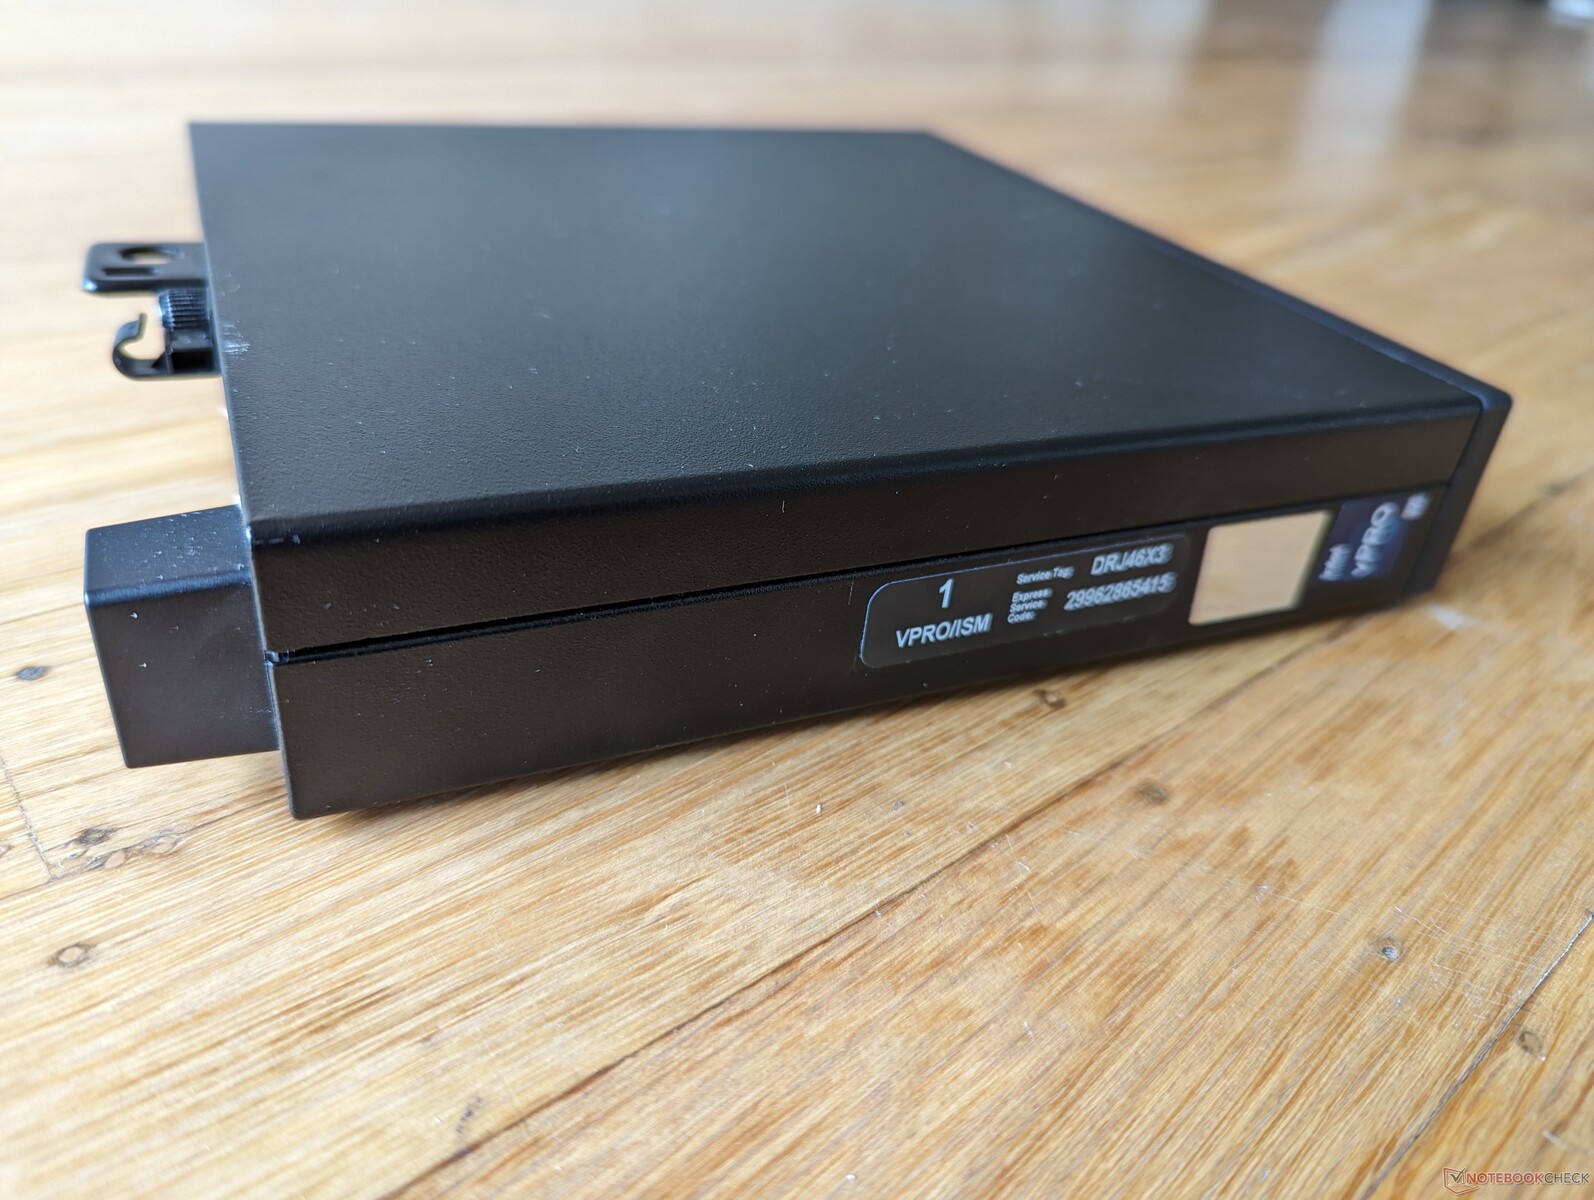
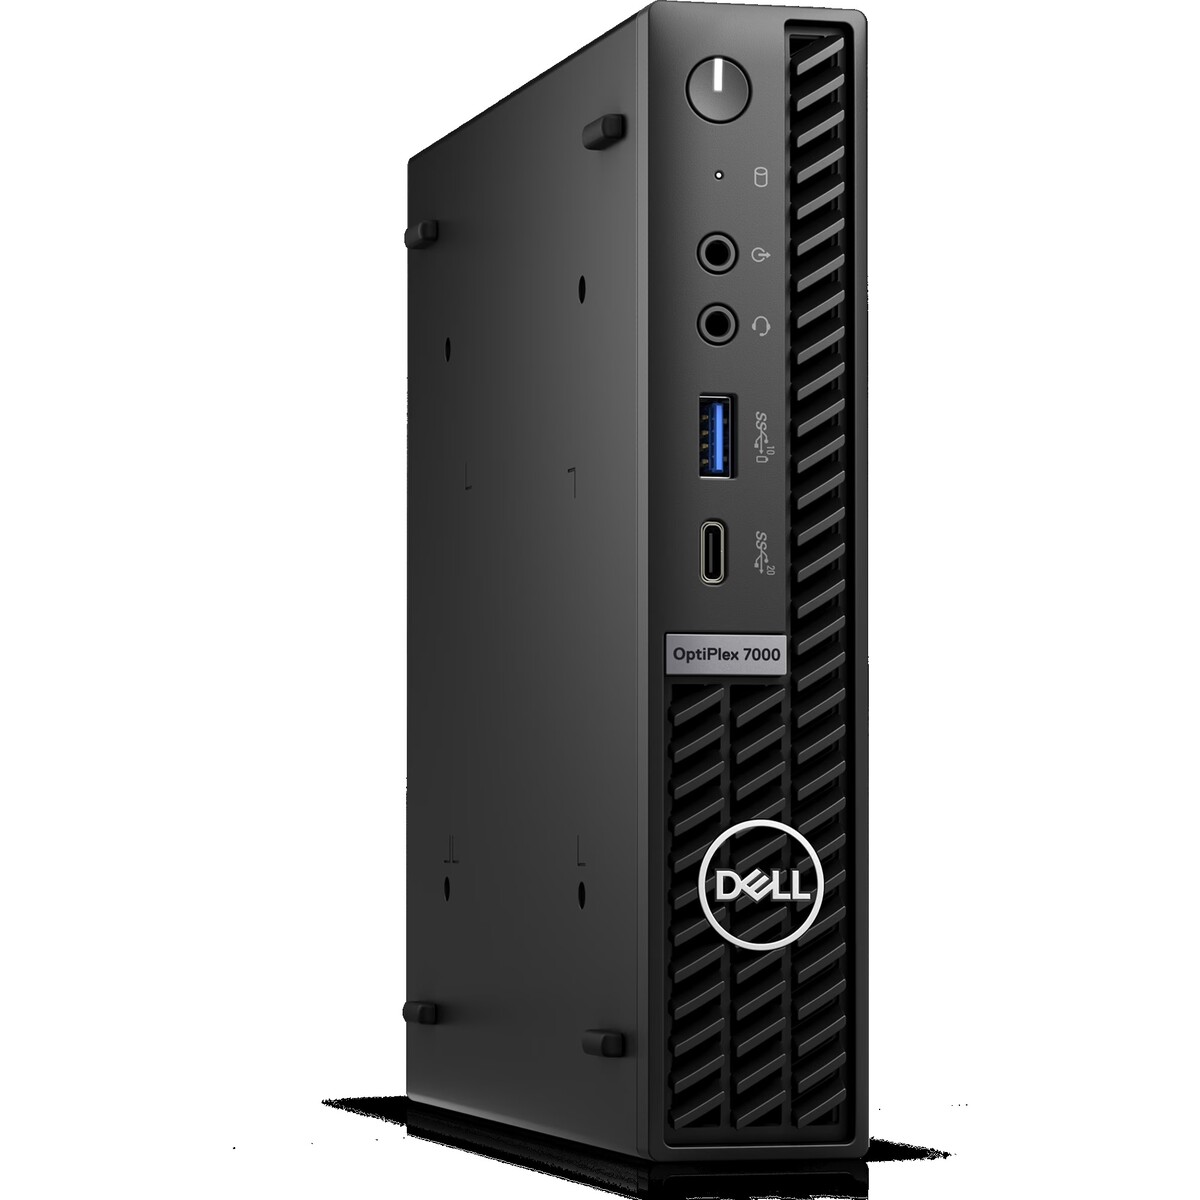
Fodral - Mini Tower Look
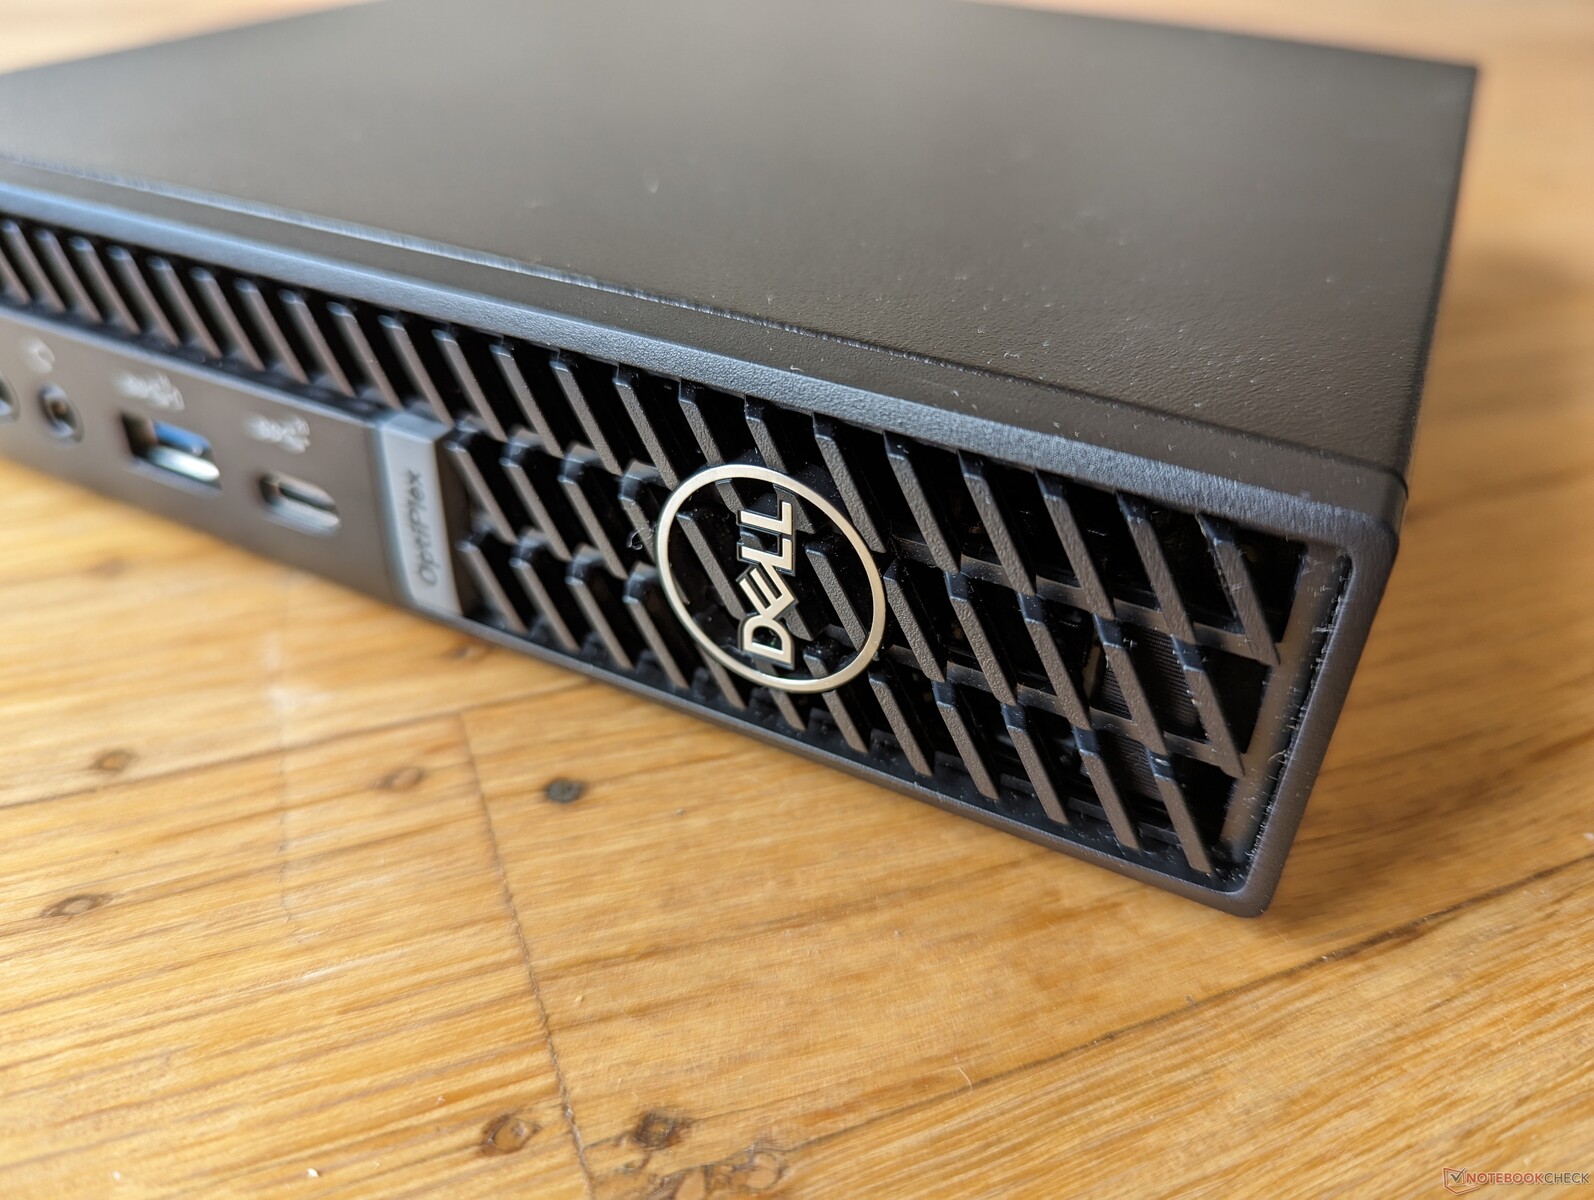
OptiPlex Micro är dubbelt så stor och väger mer än Intel NUC 13 Pro, men är fortfarande mindre än Mac Mini och i synnerhet OptiPlex SFF. Chassit helt i metall och den distinkta designen med frontgaller är annars omisskännligt OptiPlex.
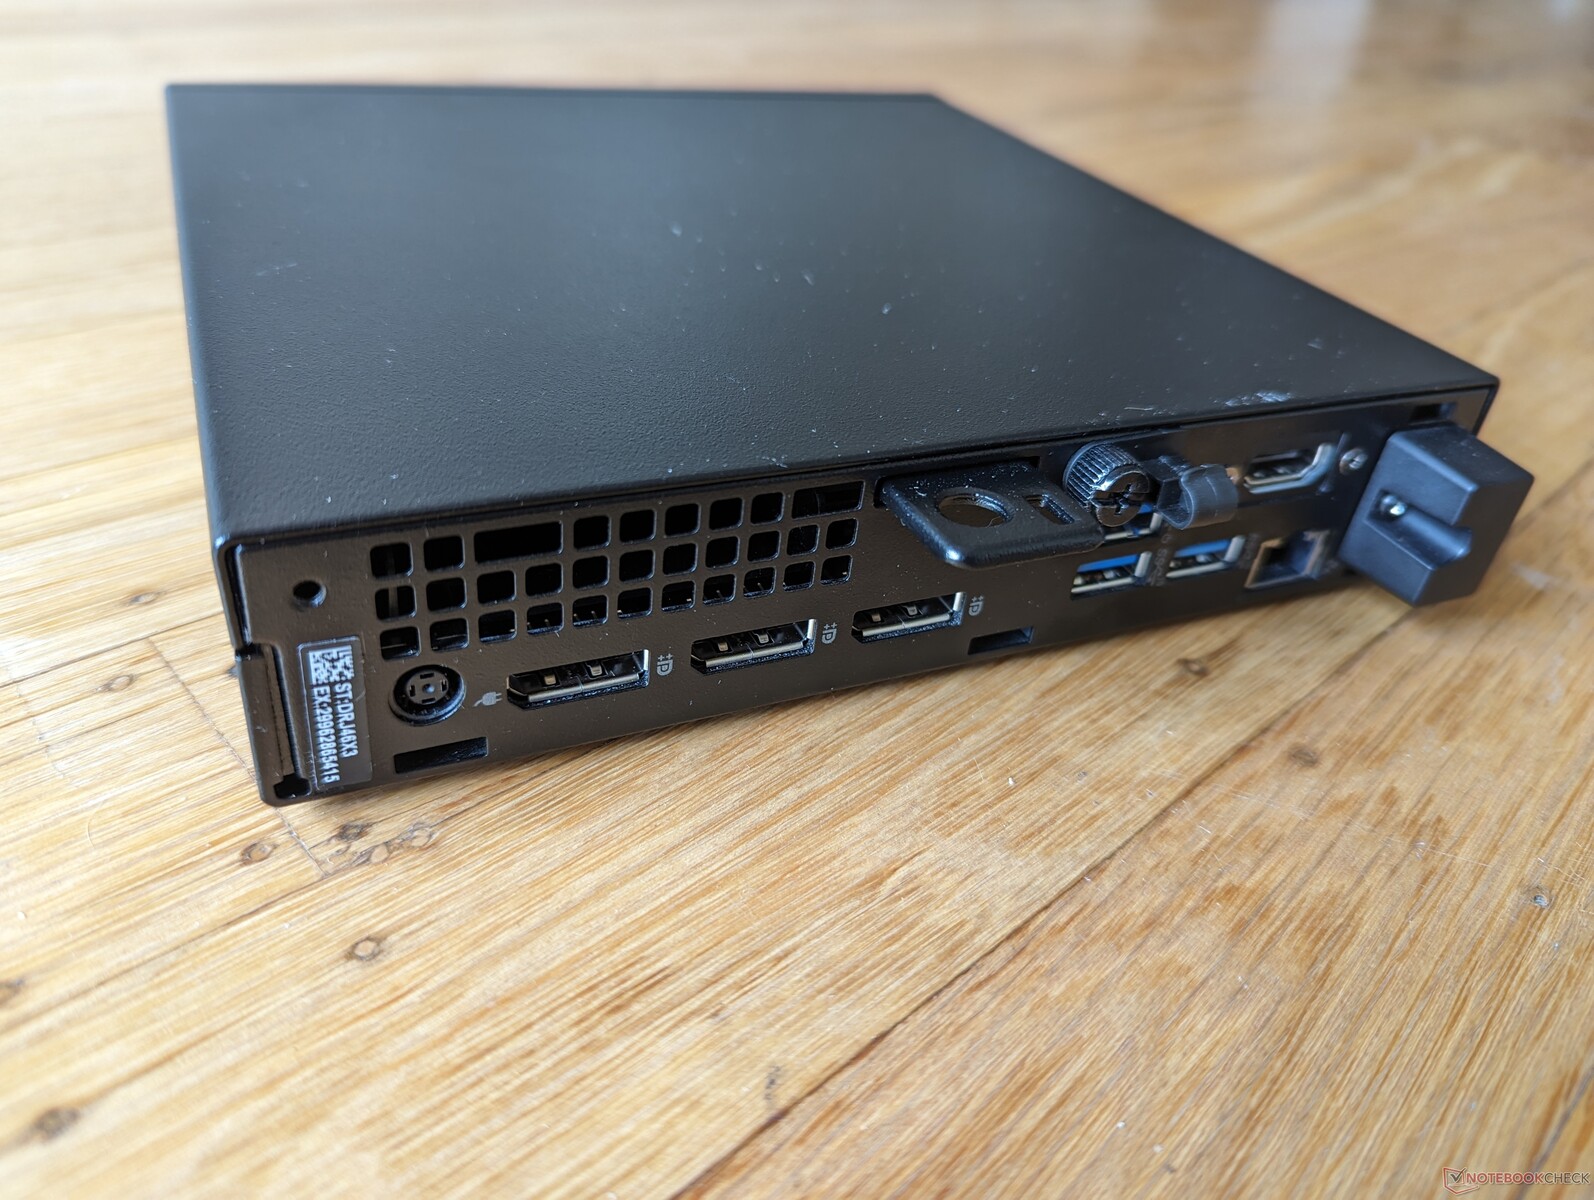
Anslutningsmöjligheter
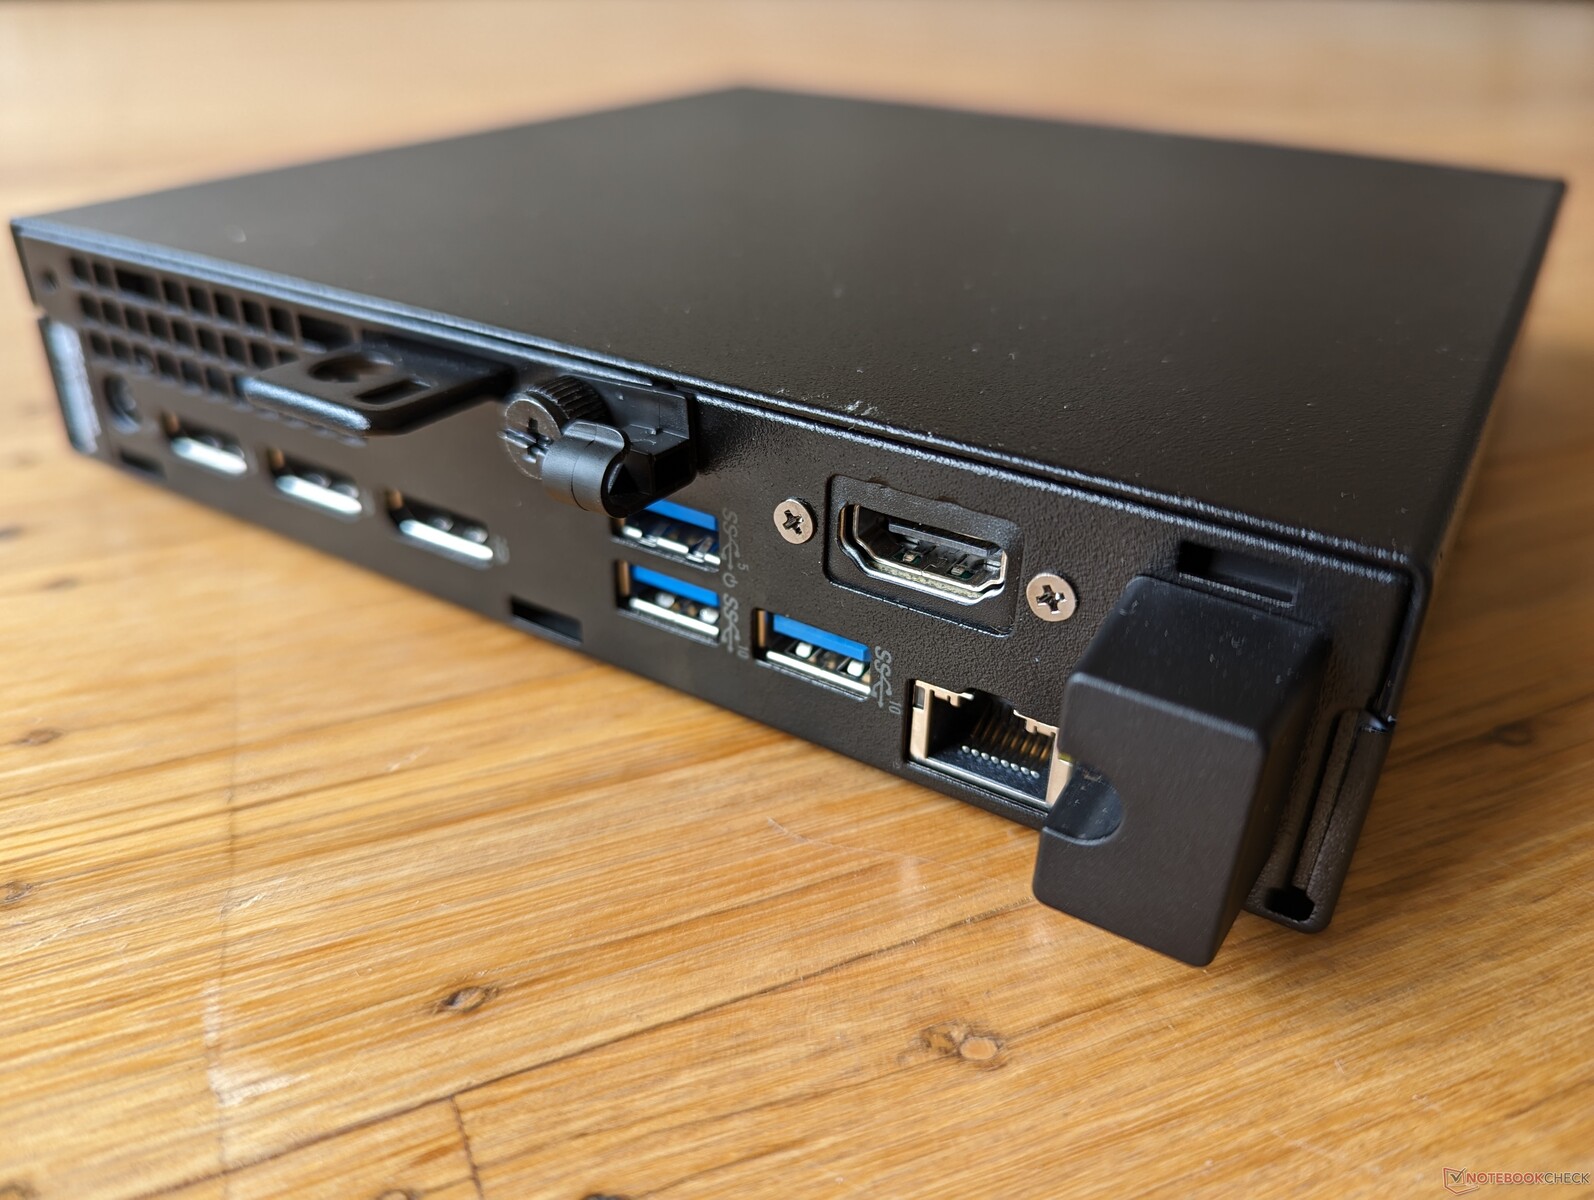
Portalternativen är varierade och de mest anmärkningsvärda är de fyra individuella videoutgångarna. Den enda USB-C-porten har dock inte stöd för USB4, Thunderbolt, Power Delivery eller ens DisplayPort, till skillnad från USB-C-portarna på de flesta Intel NUC eller Beelink mini PC.
Kommunikation
Den medföljande Intel AX211 erbjuder Wi-Fi 6E och Bluetooth 5.3-anslutning. Prestandan är pålitlig utan några större skillnader mellan 5 GHz eller 6 GHz i nätverk.
| Networking | |
| iperf3 transmit AXE11000 | |
| Apple Mac Mini M2 | |
| Beelink SER7 | |
| GMK NucBox K3 Pro | |
| Beelink GTR7 7840HS | |
| Dell OptiPlex Micro | |
| Lenovo IdeaCentre Mini 01IRH8 | |
| iperf3 receive AXE11000 | |
| Apple Mac Mini M2 | |
| GMK NucBox K3 Pro | |
| Beelink GTR7 7840HS | |
| Beelink SER7 | |
| Dell OptiPlex Micro | |
| Lenovo IdeaCentre Mini 01IRH8 | |
| iperf3 transmit AXE11000 6GHz | |
| Dell OptiPlex Micro | |
| iperf3 receive AXE11000 6GHz | |
| Dell OptiPlex Micro | |
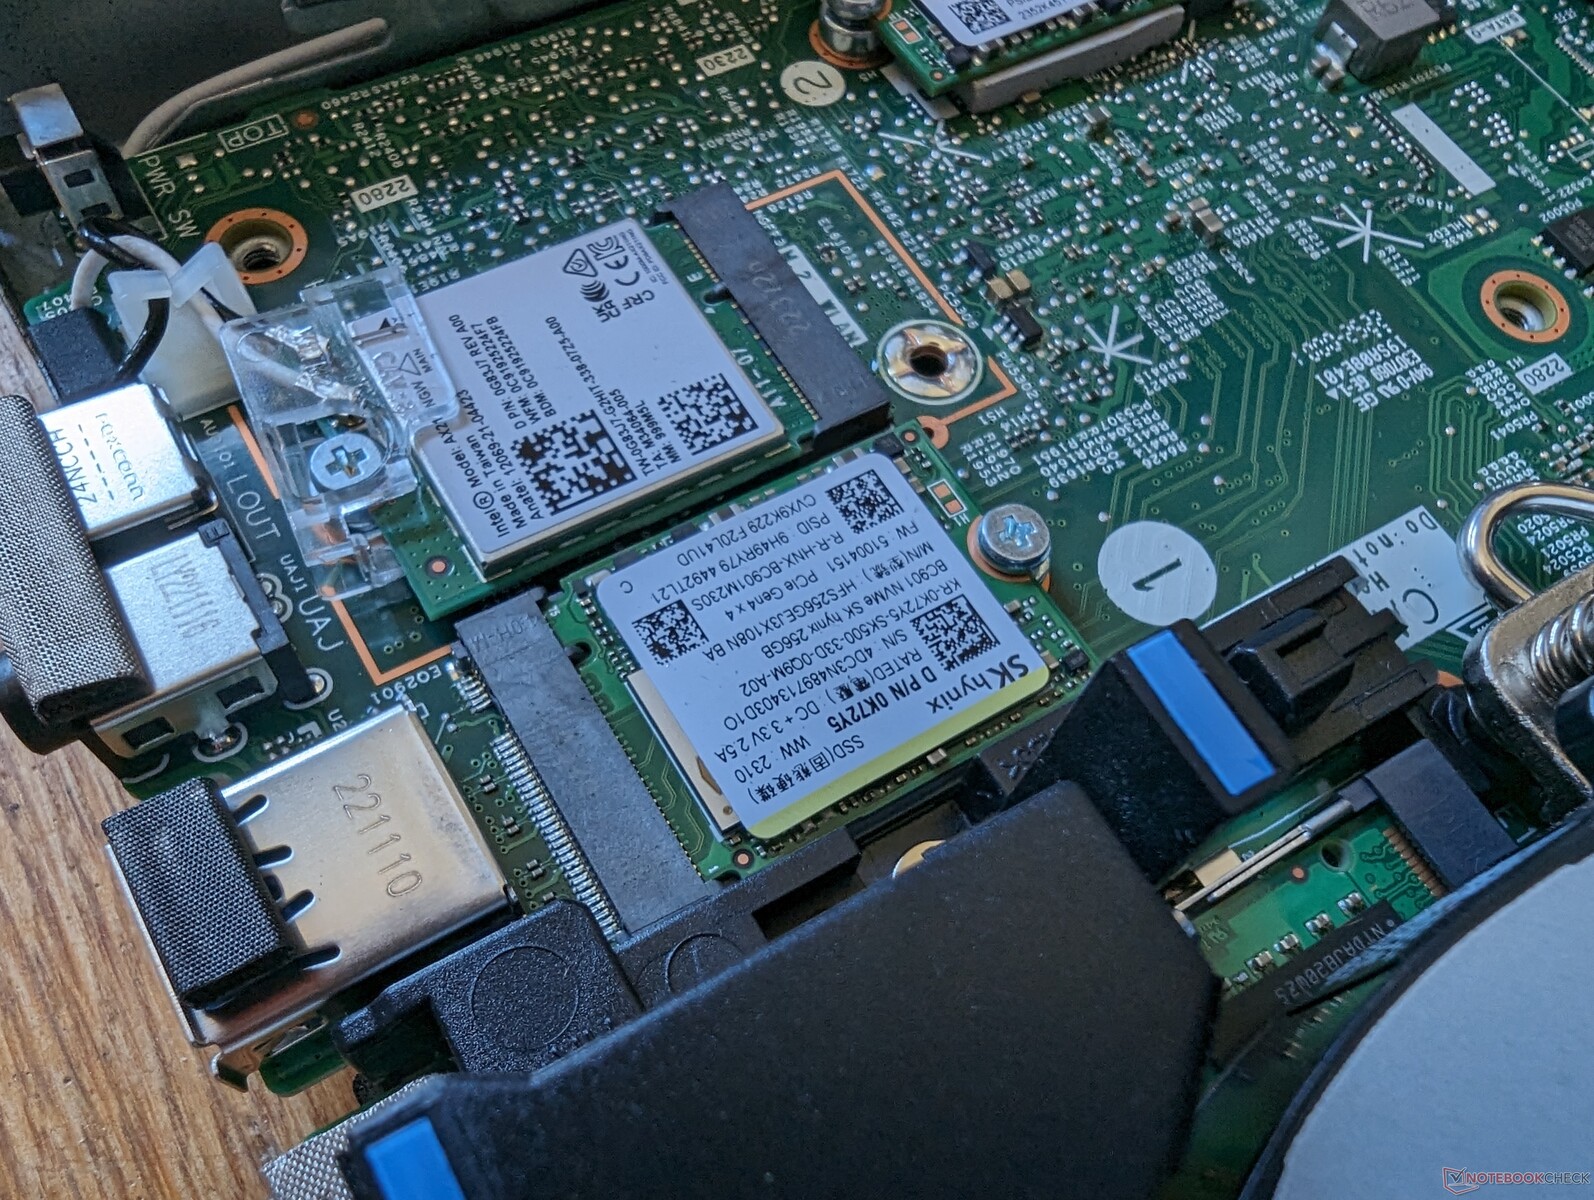
Underhåll
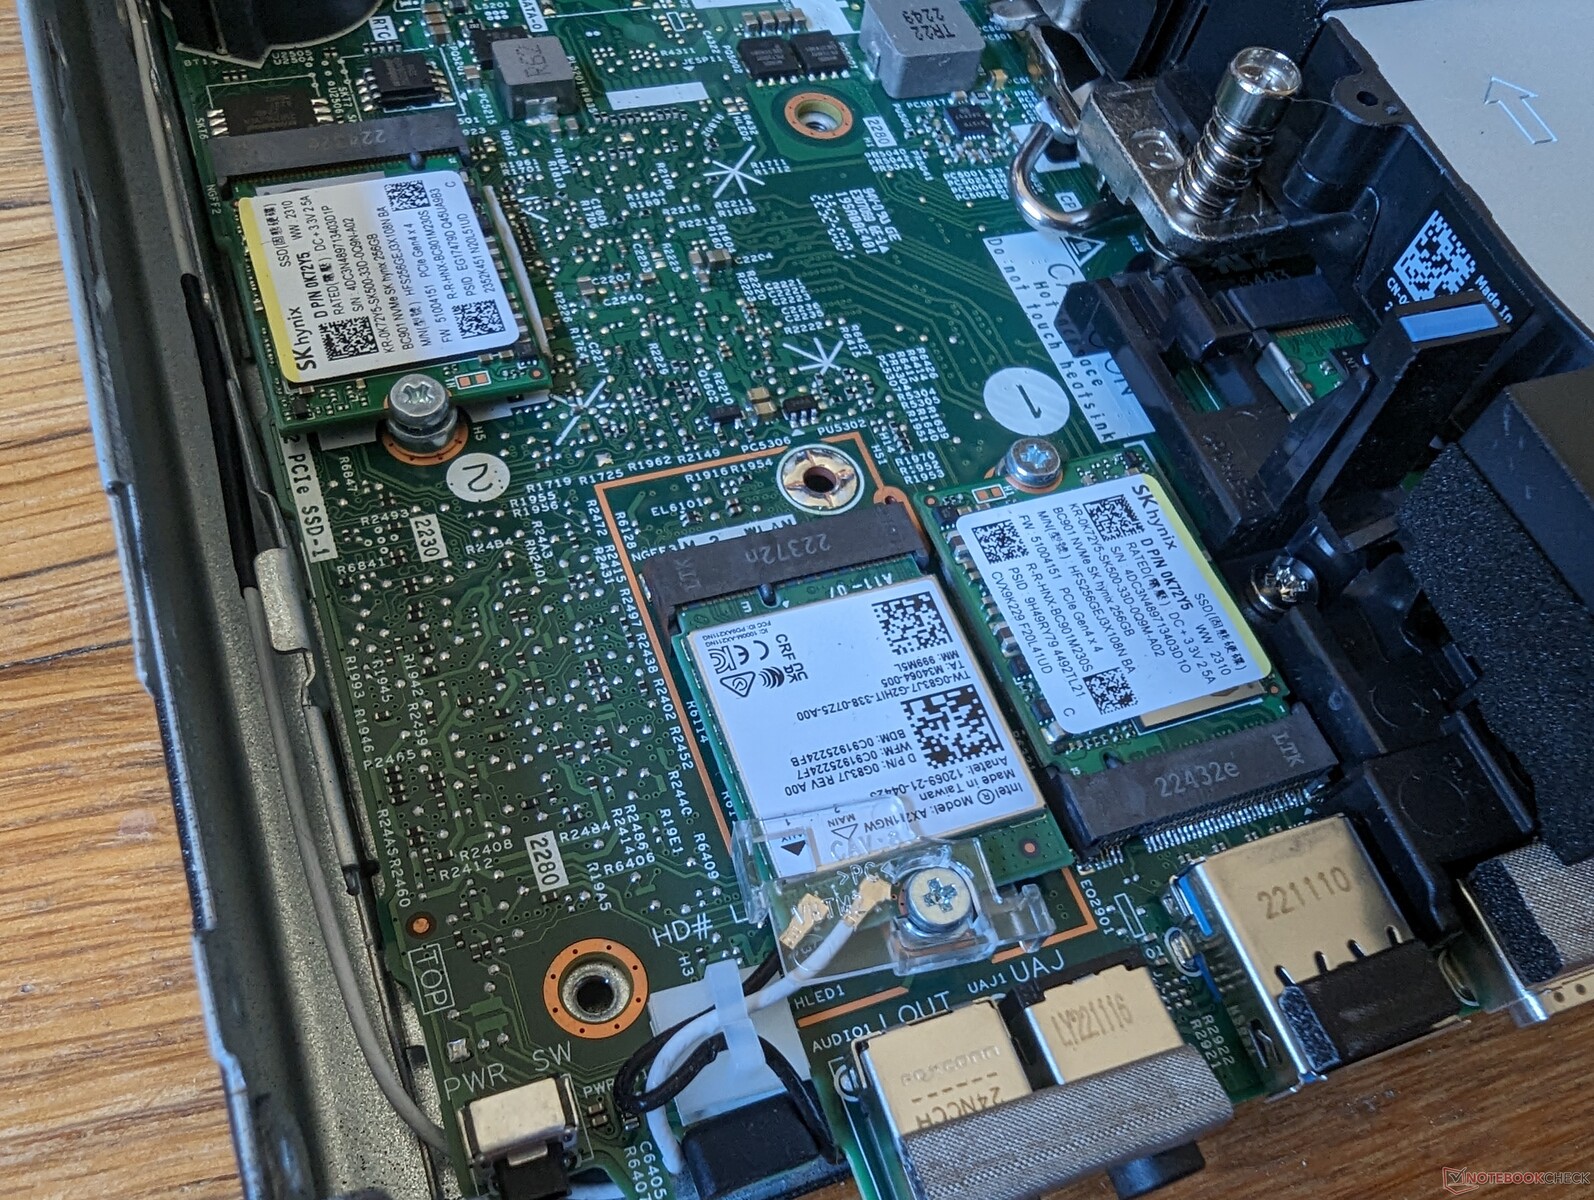
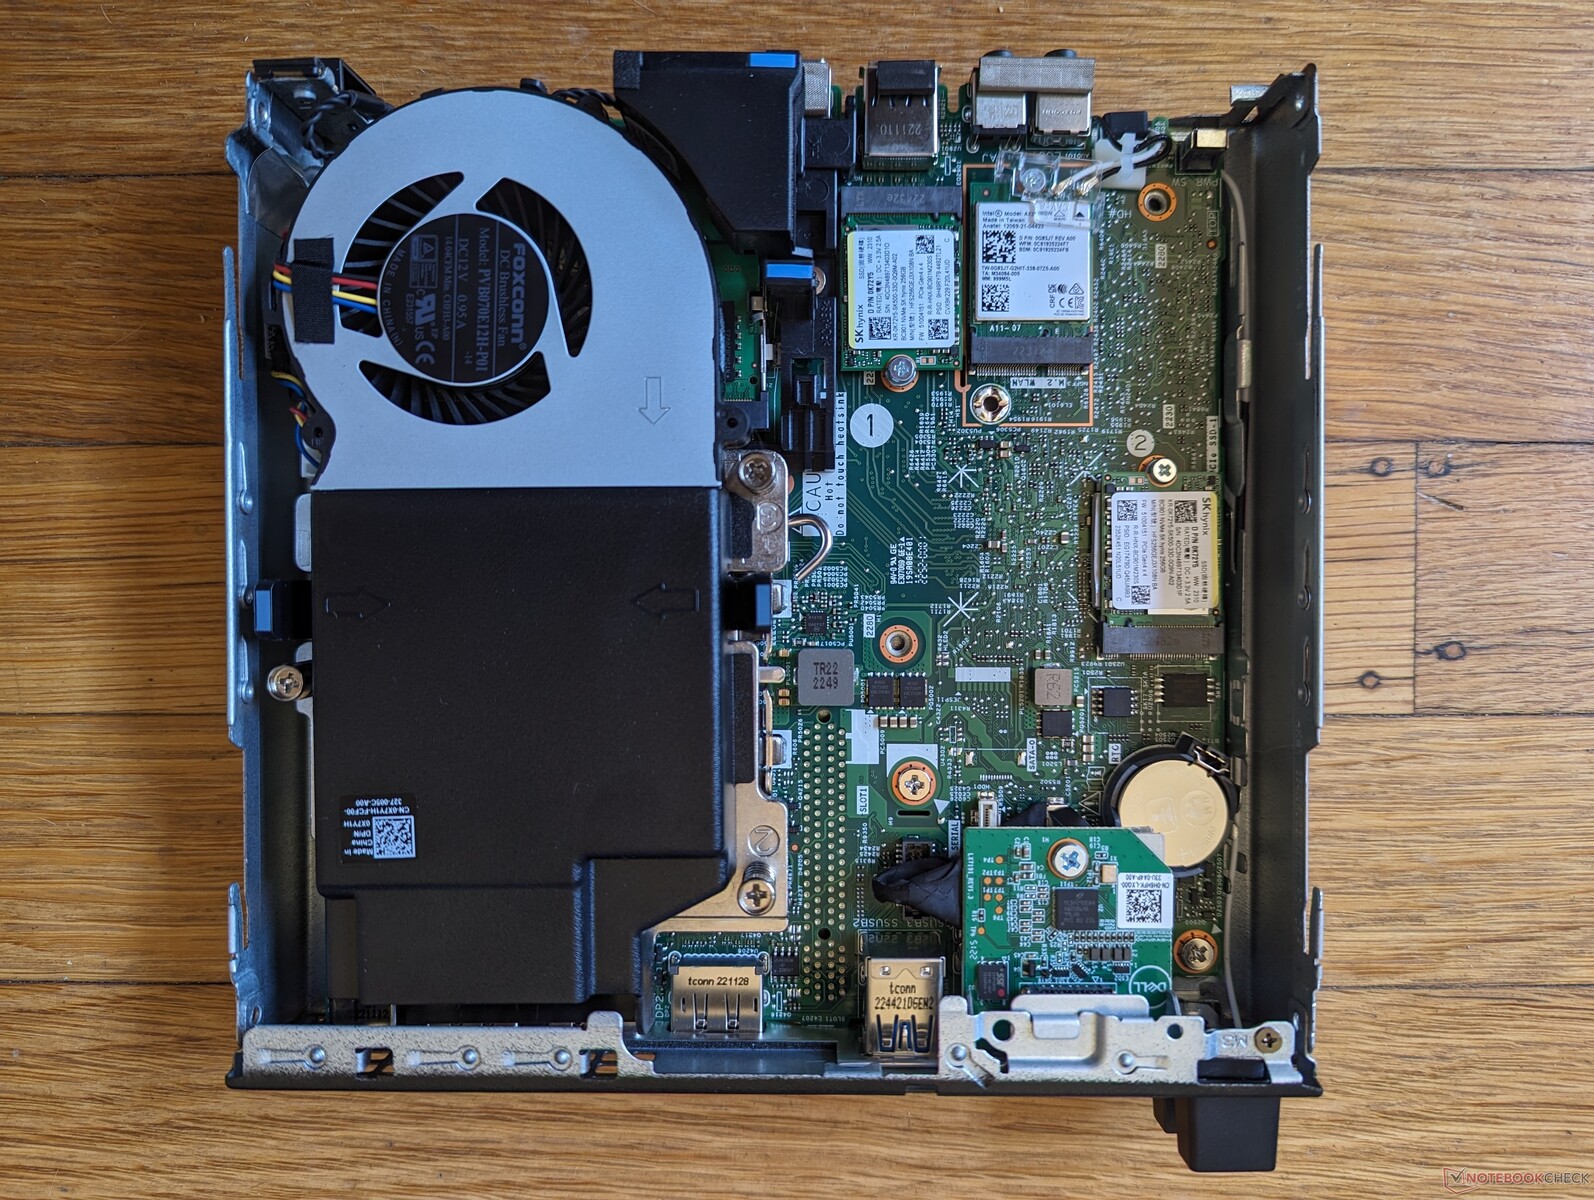
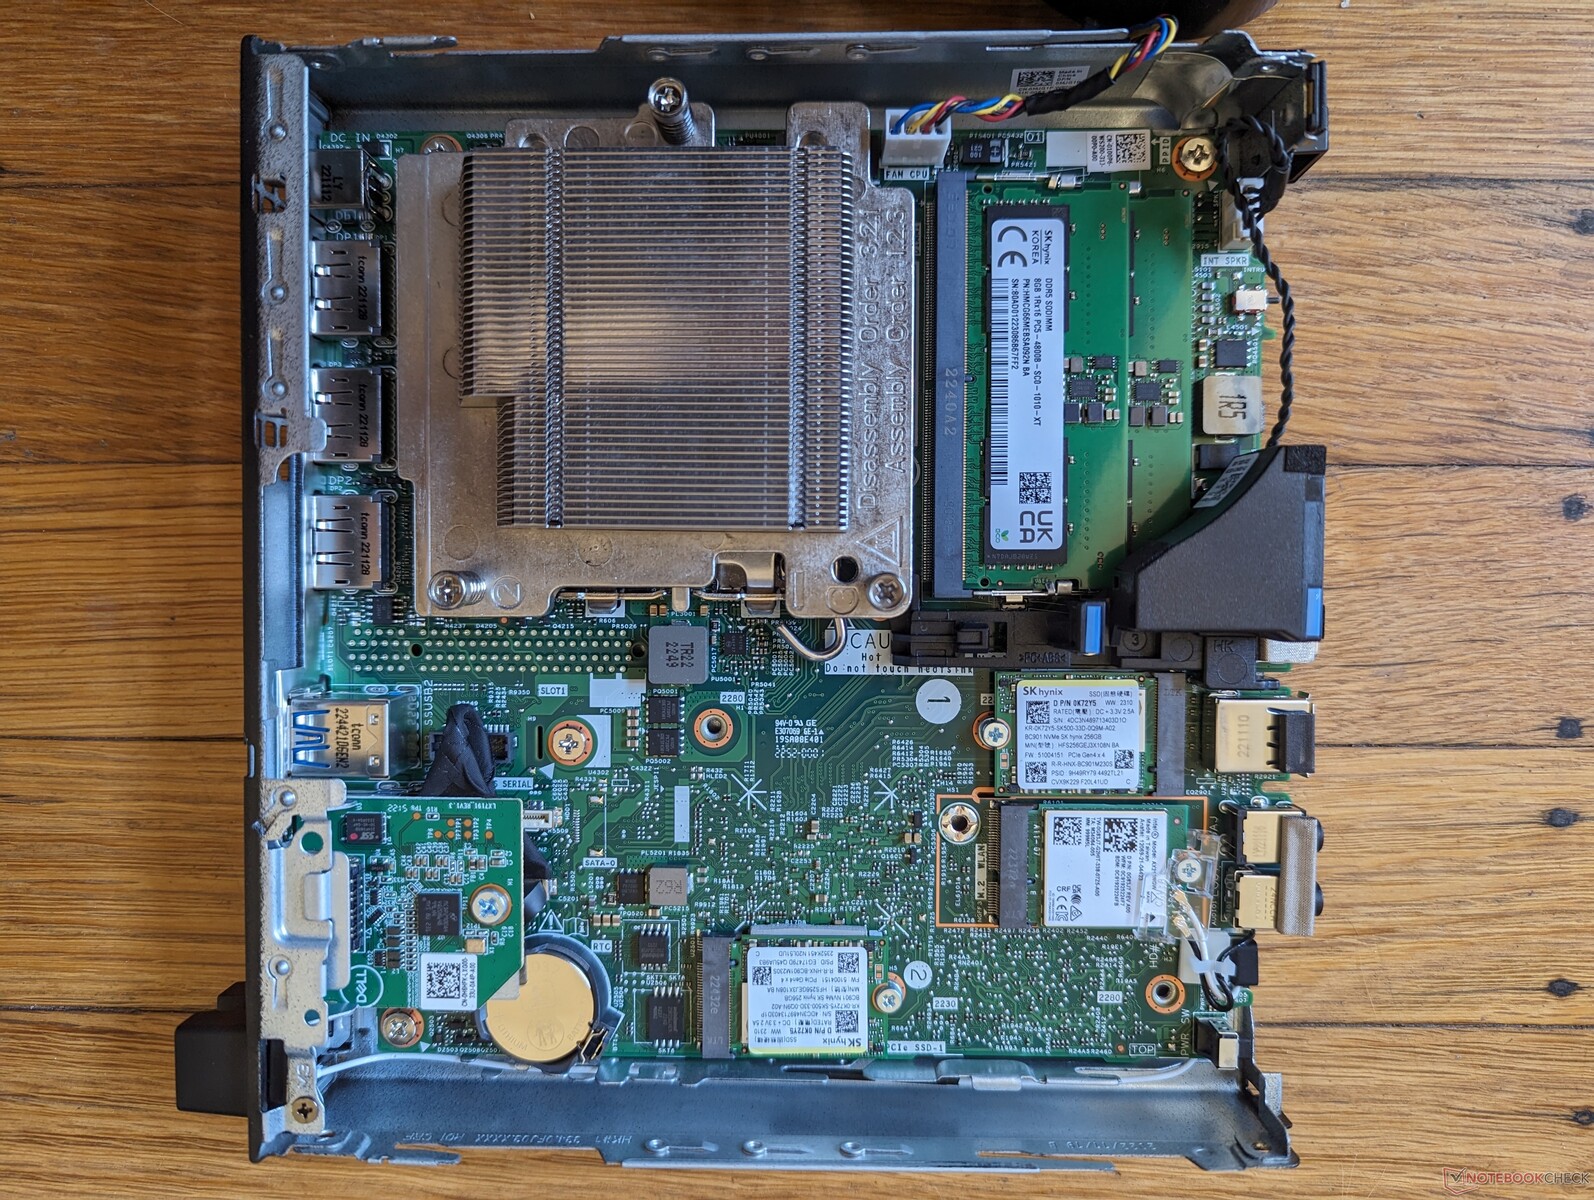
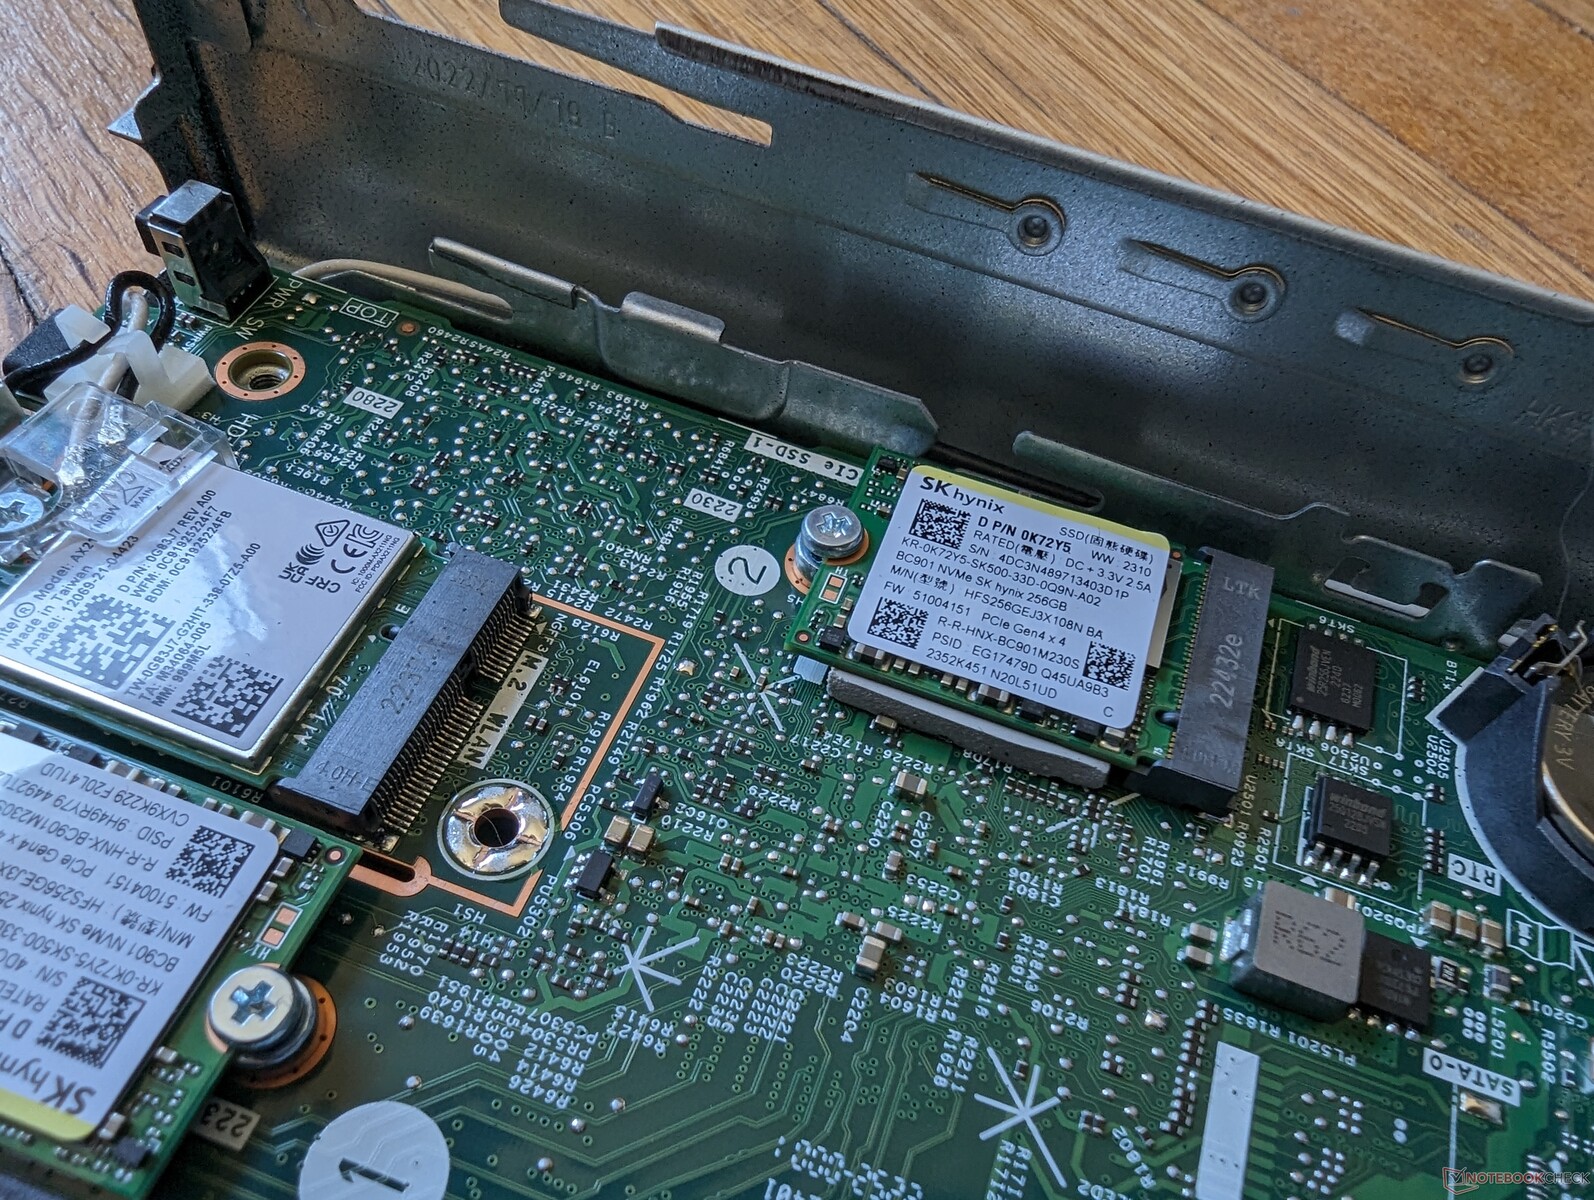
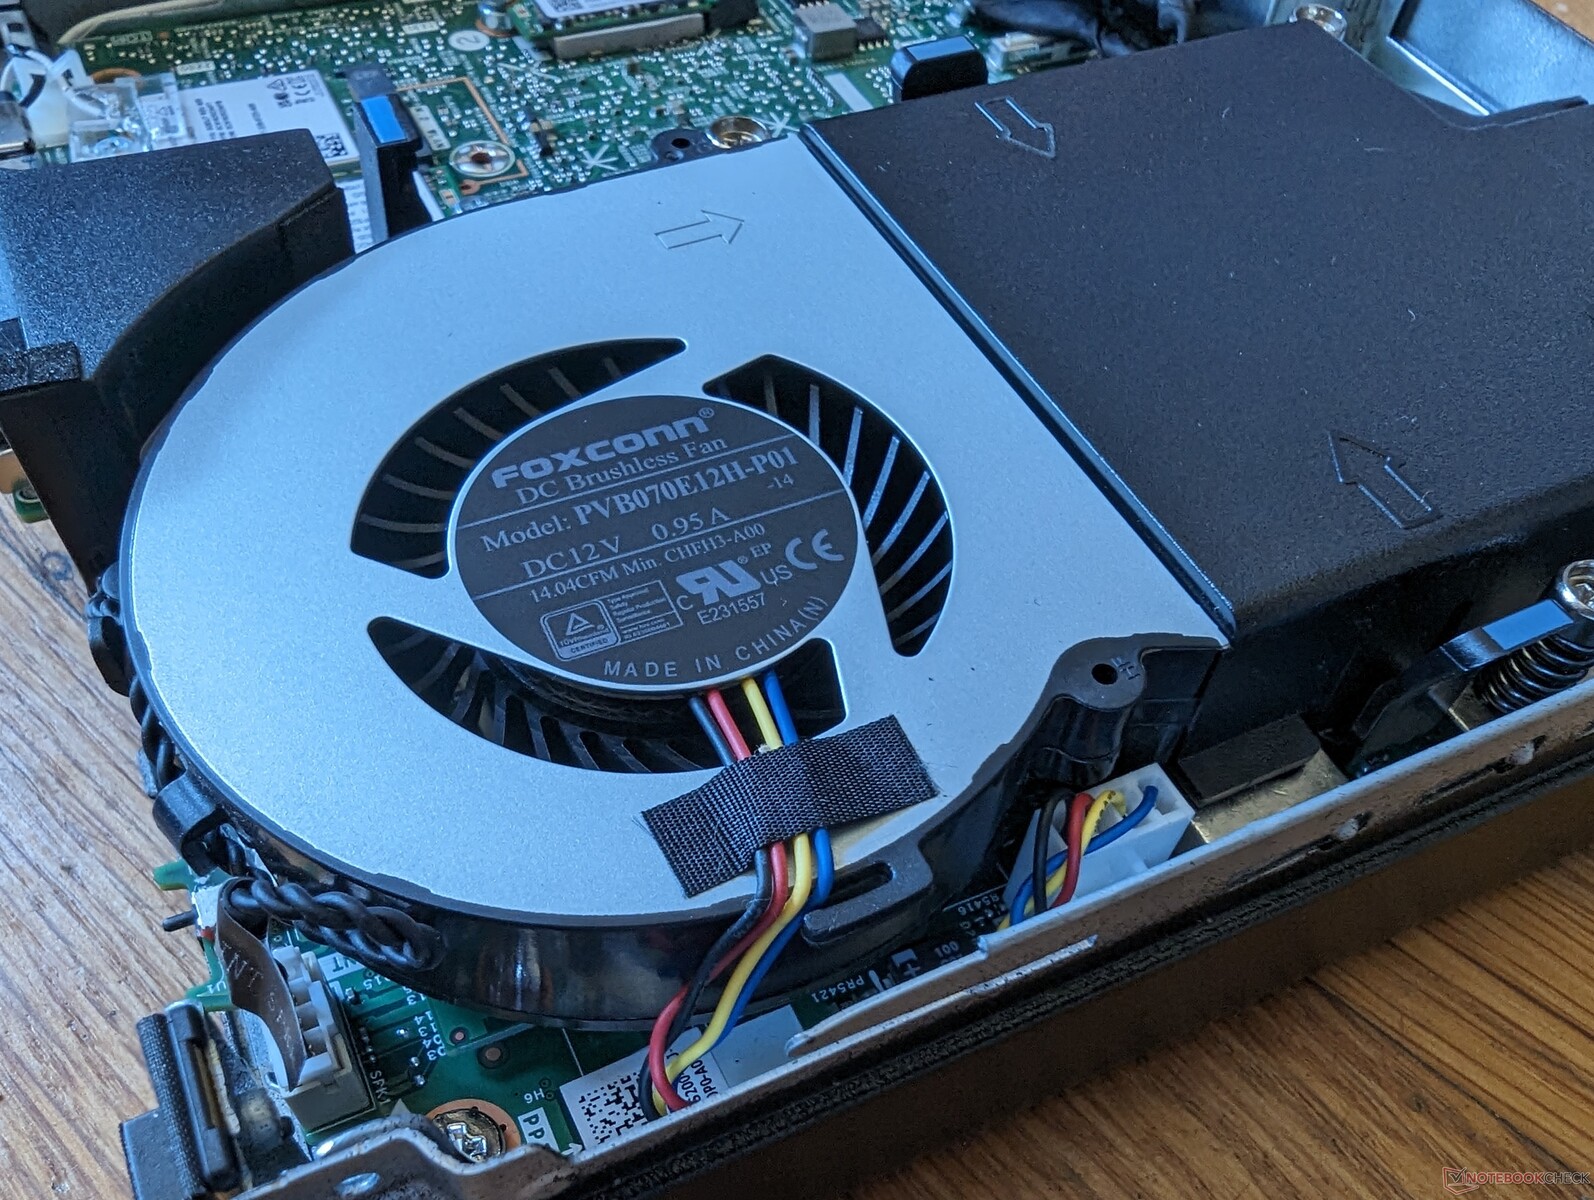
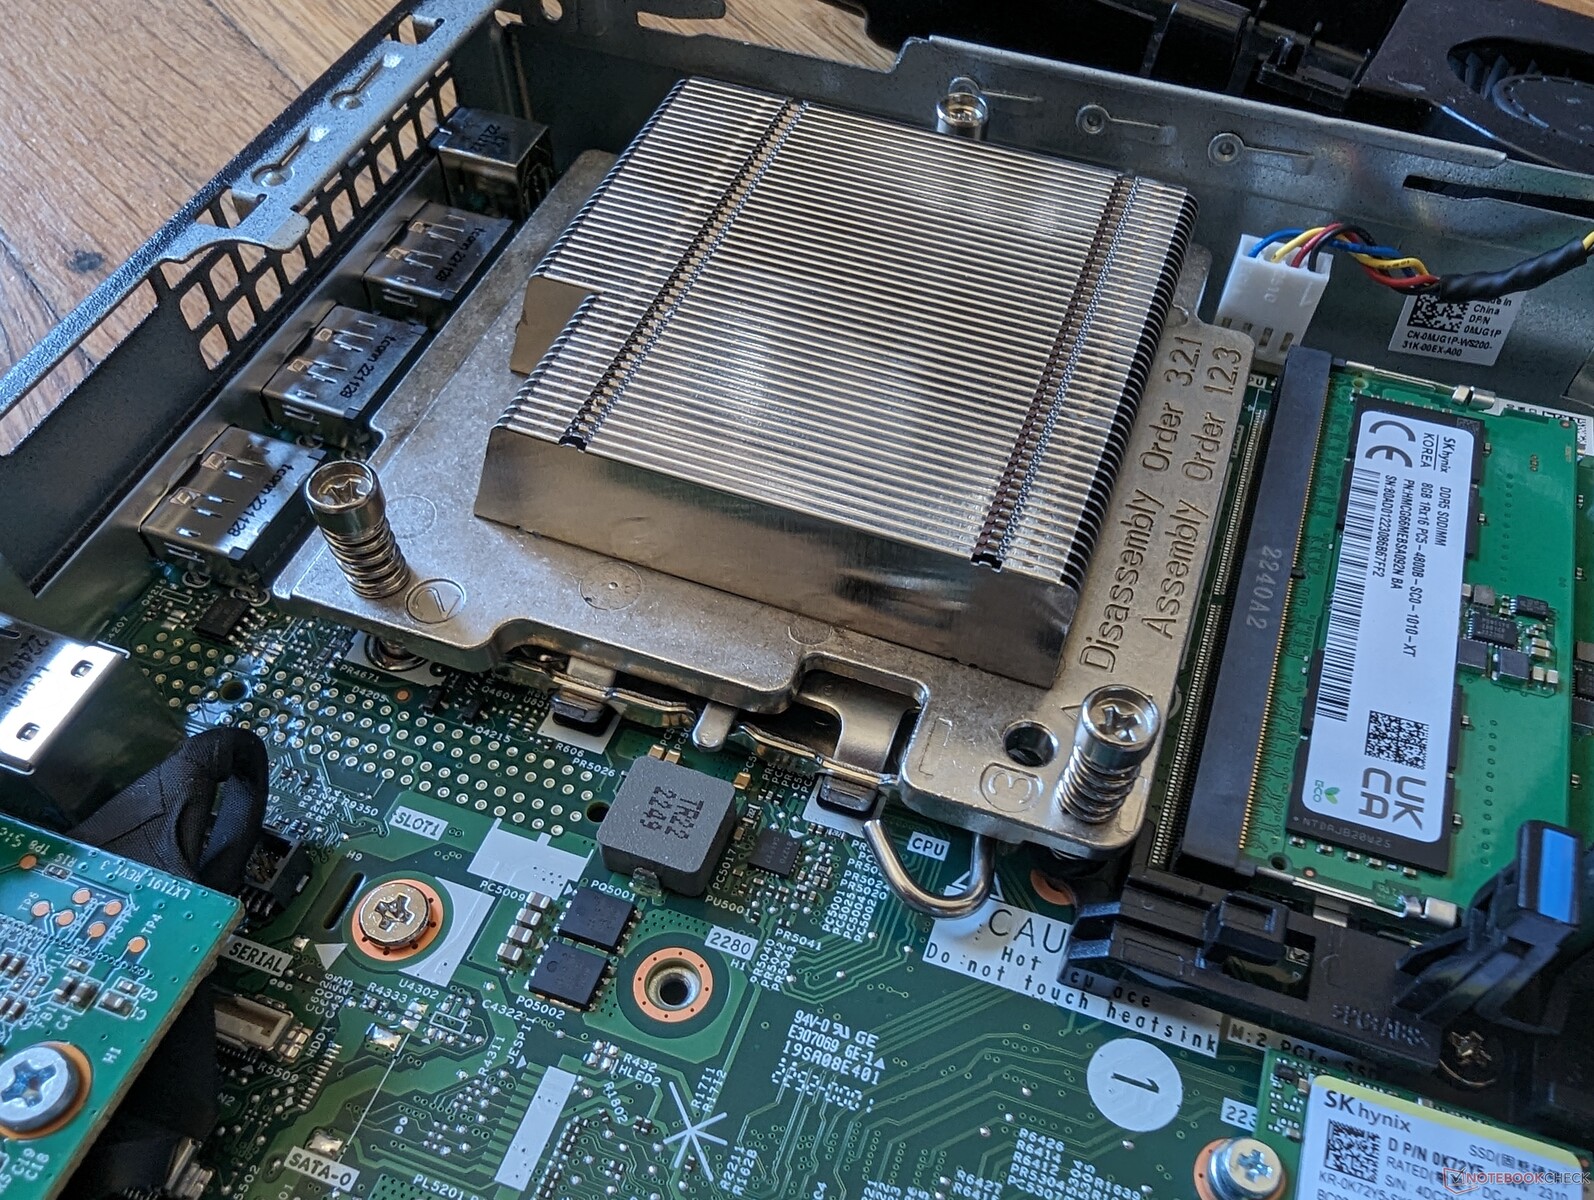
Den övre panelen glider lätt av efter att en enda tumskruv har tagits bort bakifrån för att avslöja den löstagbara WLAN-modulen och två SSD-kortplatser. Fläkten måste tas bort för att komma åt de två SODIMM-platserna, men hela processen är verktygslös för enkel service.
Observera att FCLGA1700-processorn är löstagbar och utbytbar till skillnad från de flesta andra minidatorer.
Tillbehör och garanti
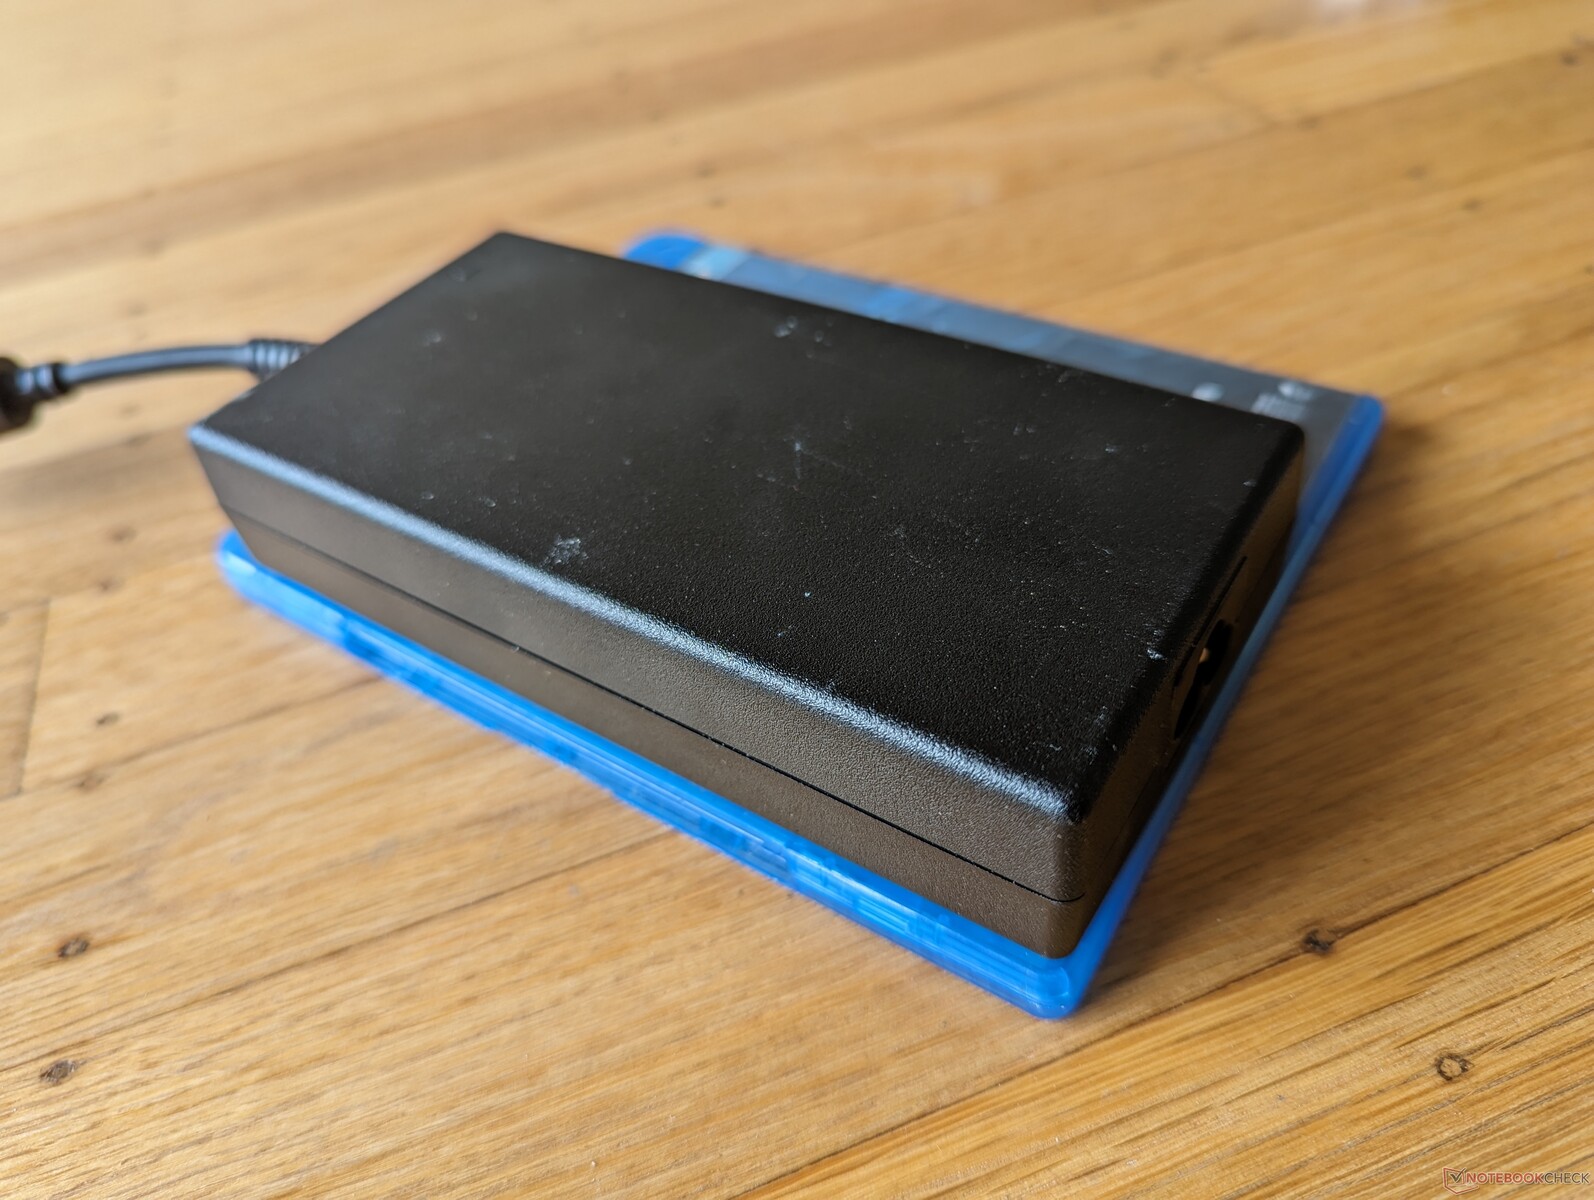
Det finns inga extra tillbehör i förpackningen förutom den externa strömbrickan och pappersarbete. Det är synd att det vertikala stativet säljs separat eftersom systemet kan tippa över ganska lätt.
En treårig begränsad tillverkargaranti gäller precis som på de flesta andra avancerade affärsdatorer från Dell.
Prestanda - processorkraft för stationära datorer
Villkor för testning
Vi ställde in Windows på prestandaläge innan vi körde riktmärkena nedan. Dell Optimizer är förinstallerad, men den erbjuder inga specialiserade energiprofiler till skillnad från de flesta bärbara Dell-datorer.
Processor
CPU-prestandan är otrolig för formfaktorn. Jämfört med H-seriens Core i7-13700H som finns på bärbara datorer som Inspiron 16 Plus 7630erbjuder vår Core i7-13700 i desktop-serien 15 till 30 procent snabbare multi-thread-prestanda, främst tack vare högre effekt och snabbare klockfrekvenser. Dess fördelar jämfört med Apple M2 är märkbara när det gäller CPU-tunga belastningar.
Tyvärr är Core i7-13700 i OptiPlex Micro mer känslig för strypning jämfört med en större stationär dator med samma processor. Vår referens Core i7-13700 som körs på ett fullstort torn, till exempel, skulle ge multi-thread benchmarkresultat som är 40 till 60 procent snabbare än vår mini PC. Därmed inte sagt att Dell-enheten är långsam, men det går inte att förneka att dess lilla kyllösning är en begränsande faktor. När vi körde CineBench R15 xT i en loop, till exempel, sjönk prestandan med cirka 20 procent efter de första looparna, vilket tyder på ett strypningsbeteende.
Cinebench R15 Multi Loop
Cinebench R23: Multi Core | Single Core
Cinebench R20: CPU (Multi Core) | CPU (Single Core)
Cinebench R15: CPU Multi 64Bit | CPU Single 64Bit
Blender: v2.79 BMW27 CPU
7-Zip 18.03: 7z b 4 | 7z b 4 -mmt1
Geekbench 5.5: Multi-Core | Single-Core
HWBOT x265 Benchmark v2.2: 4k Preset
LibreOffice : 20 Documents To PDF
R Benchmark 2.5: Overall mean
| CPU Performance rating | |
| Intel Core i7-13700 | |
| Genomsnitt Intel Core i7-13700 | |
| Dell OptiPlex Micro | |
| Alienware m16 R1 Intel | |
| Beelink GTR7 7840HS | |
| Lenovo IdeaCentre Mini 01IRH8 | |
| Intel NUC 12, NUC12SNKi72_Serpent Canyon | |
| GMK NucBox K3 Pro | |
| Acemagic AM20 | |
| Apple Mac Mini M2 -5! | |
| Geekom A5 | |
| Acemagic AD15 | |
| Minisforum Venus Series UN1245 | |
| Cinebench R23 / Multi Core | |
| Intel Core i7-13700 | |
| Genomsnitt Intel Core i7-13700 (21013 - 29725, n=2) | |
| Alienware m16 R1 Intel | |
| Dell OptiPlex Micro | |
| Beelink GTR7 7840HS | |
| Intel NUC 12, NUC12SNKi72_Serpent Canyon | |
| Lenovo IdeaCentre Mini 01IRH8 | |
| Acemagic AM20 | |
| Geekom A5 | |
| GMK NucBox K3 Pro | |
| Acemagic AD15 | |
| Minisforum Venus Series UN1245 | |
| Apple Mac Mini M2 | |
| Cinebench R23 / Single Core | |
| Intel Core i7-13700 | |
| Genomsnitt Intel Core i7-13700 (1997 - 2020, n=2) | |
| Dell OptiPlex Micro | |
| Alienware m16 R1 Intel | |
| Lenovo IdeaCentre Mini 01IRH8 | |
| Beelink GTR7 7840HS | |
| Intel NUC 12, NUC12SNKi72_Serpent Canyon | |
| GMK NucBox K3 Pro | |
| Minisforum Venus Series UN1245 | |
| Apple Mac Mini M2 | |
| Acemagic AM20 | |
| Acemagic AD15 | |
| Geekom A5 | |
| Cinebench R20 / CPU (Multi Core) | |
| Intel Core i7-13700 | |
| Genomsnitt Intel Core i7-13700 (7027 - 11361, n=2) | |
| Alienware m16 R1 Intel | |
| Dell OptiPlex Micro | |
| Beelink GTR7 7840HS | |
| Intel NUC 12, NUC12SNKi72_Serpent Canyon | |
| Lenovo IdeaCentre Mini 01IRH8 | |
| Acemagic AM20 | |
| Geekom A5 | |
| GMK NucBox K3 Pro | |
| Acemagic AD15 | |
| Minisforum Venus Series UN1245 | |
| Apple Mac Mini M2 | |
| Cinebench R20 / CPU (Single Core) | |
| Intel Core i7-13700 | |
| Genomsnitt Intel Core i7-13700 (703 - 776, n=2) | |
| Alienware m16 R1 Intel | |
| Lenovo IdeaCentre Mini 01IRH8 | |
| Beelink GTR7 7840HS | |
| Dell OptiPlex Micro | |
| Intel NUC 12, NUC12SNKi72_Serpent Canyon | |
| GMK NucBox K3 Pro | |
| Minisforum Venus Series UN1245 | |
| Acemagic AM20 | |
| Acemagic AD15 | |
| Geekom A5 | |
| Apple Mac Mini M2 | |
| Cinebench R15 / CPU Multi 64Bit | |
| Intel Core i7-13700 | |
| Genomsnitt Intel Core i7-13700 (2986 - 4398, n=2) | |
| Alienware m16 R1 Intel | |
| Dell OptiPlex Micro | |
| Beelink GTR7 7840HS | |
| Intel NUC 12, NUC12SNKi72_Serpent Canyon | |
| Lenovo IdeaCentre Mini 01IRH8 | |
| Acemagic AM20 | |
| Geekom A5 | |
| GMK NucBox K3 Pro | |
| Acemagic AD15 | |
| Minisforum Venus Series UN1245 | |
| Apple Mac Mini M2 | |
| Cinebench R15 / CPU Single 64Bit | |
| Intel Core i7-13700 | |
| Beelink GTR7 7840HS | |
| Genomsnitt Intel Core i7-13700 (279 - 291, n=2) | |
| Dell OptiPlex Micro | |
| Alienware m16 R1 Intel | |
| Lenovo IdeaCentre Mini 01IRH8 | |
| Intel NUC 12, NUC12SNKi72_Serpent Canyon | |
| GMK NucBox K3 Pro | |
| Acemagic AM20 | |
| Minisforum Venus Series UN1245 | |
| Apple Mac Mini M2 | |
| Geekom A5 | |
| Acemagic AD15 | |
| Blender / v2.79 BMW27 CPU | |
| Apple Mac Mini M2 | |
| Minisforum Venus Series UN1245 | |
| GMK NucBox K3 Pro | |
| Acemagic AD15 | |
| Geekom A5 | |
| Acemagic AM20 | |
| Beelink GTR7 7840HS | |
| Lenovo IdeaCentre Mini 01IRH8 | |
| Intel NUC 12, NUC12SNKi72_Serpent Canyon | |
| Dell OptiPlex Micro | |
| Alienware m16 R1 Intel | |
| Genomsnitt Intel Core i7-13700 (111 - 178, n=2) | |
| Intel Core i7-13700 | |
| 7-Zip 18.03 / 7z b 4 | |
| Intel Core i7-13700 | |
| Genomsnitt Intel Core i7-13700 (74475 - 108733, n=2) | |
| Alienware m16 R1 Intel | |
| Dell OptiPlex Micro | |
| Beelink GTR7 7840HS | |
| Intel NUC 12, NUC12SNKi72_Serpent Canyon | |
| Lenovo IdeaCentre Mini 01IRH8 | |
| Geekom A5 | |
| Acemagic AM20 | |
| Acemagic AD15 | |
| GMK NucBox K3 Pro | |
| Minisforum Venus Series UN1245 | |
| 7-Zip 18.03 / 7z b 4 -mmt1 | |
| Intel Core i7-13700 | |
| Beelink GTR7 7840HS | |
| Genomsnitt Intel Core i7-13700 (6466 - 6819, n=2) | |
| Dell OptiPlex Micro | |
| Alienware m16 R1 Intel | |
| Lenovo IdeaCentre Mini 01IRH8 | |
| Intel NUC 12, NUC12SNKi72_Serpent Canyon | |
| GMK NucBox K3 Pro | |
| Acemagic AD15 | |
| Acemagic AM20 | |
| Geekom A5 | |
| Minisforum Venus Series UN1245 | |
| Geekbench 5.5 / Multi-Core | |
| Intel Core i7-13700 | |
| Genomsnitt Intel Core i7-13700 (15525 - 19602, n=2) | |
| Dell OptiPlex Micro | |
| Alienware m16 R1 Intel | |
| Beelink GTR7 7840HS | |
| Lenovo IdeaCentre Mini 01IRH8 | |
| Intel NUC 12, NUC12SNKi72_Serpent Canyon | |
| GMK NucBox K3 Pro | |
| Apple Mac Mini M2 | |
| Geekom A5 | |
| Acemagic AM20 | |
| Acemagic AD15 | |
| Minisforum Venus Series UN1245 | |
| Geekbench 5.5 / Single-Core | |
| Beelink GTR7 7840HS | |
| Intel Core i7-13700 | |
| Genomsnitt Intel Core i7-13700 (1958 - 2009, n=2) | |
| Dell OptiPlex Micro | |
| Apple Mac Mini M2 | |
| Alienware m16 R1 Intel | |
| Lenovo IdeaCentre Mini 01IRH8 | |
| GMK NucBox K3 Pro | |
| Minisforum Venus Series UN1245 | |
| Acemagic AD15 | |
| Intel NUC 12, NUC12SNKi72_Serpent Canyon | |
| Acemagic AM20 | |
| Geekom A5 | |
| HWBOT x265 Benchmark v2.2 / 4k Preset | |
| Intel Core i7-13700 | |
| Genomsnitt Intel Core i7-13700 (21.4 - 33.1, n=2) | |
| Alienware m16 R1 Intel | |
| Dell OptiPlex Micro | |
| Intel NUC 12, NUC12SNKi72_Serpent Canyon | |
| Lenovo IdeaCentre Mini 01IRH8 | |
| Acemagic AM20 | |
| Geekom A5 | |
| GMK NucBox K3 Pro | |
| Acemagic AD15 | |
| Beelink GTR7 7840HS | |
| Minisforum Venus Series UN1245 | |
| LibreOffice / 20 Documents To PDF | |
| Geekom A5 | |
| Minisforum Venus Series UN1245 | |
| Acemagic AD15 | |
| Acemagic AM20 | |
| Alienware m16 R1 Intel | |
| Intel NUC 12, NUC12SNKi72_Serpent Canyon | |
| GMK NucBox K3 Pro | |
| Beelink GTR7 7840HS | |
| Lenovo IdeaCentre Mini 01IRH8 | |
| Dell OptiPlex Micro | |
| Genomsnitt Intel Core i7-13700 (34.1 - 36.4, n=2) | |
| Intel Core i7-13700 | |
| R Benchmark 2.5 / Overall mean | |
| Acemagic AD15 | |
| Acemagic AM20 | |
| Geekom A5 | |
| Minisforum Venus Series UN1245 | |
| GMK NucBox K3 Pro | |
| Intel NUC 12, NUC12SNKi72_Serpent Canyon | |
| Lenovo IdeaCentre Mini 01IRH8 | |
| Alienware m16 R1 Intel | |
| Dell OptiPlex Micro | |
| Beelink GTR7 7840HS | |
| Genomsnitt Intel Core i7-13700 (0.4075 - 0.423, n=2) | |
| Intel Core i7-13700 | |
Cinebench R23: Multi Core | Single Core
Cinebench R20: CPU (Multi Core) | CPU (Single Core)
Cinebench R15: CPU Multi 64Bit | CPU Single 64Bit
Blender: v2.79 BMW27 CPU
7-Zip 18.03: 7z b 4 | 7z b 4 -mmt1
Geekbench 5.5: Multi-Core | Single-Core
HWBOT x265 Benchmark v2.2: 4k Preset
LibreOffice : 20 Documents To PDF
R Benchmark 2.5: Overall mean
* ... mindre är bättre
AIDA64: FP32 Ray-Trace | FPU Julia | CPU SHA3 | CPU Queen | FPU SinJulia | FPU Mandel | CPU AES | CPU ZLib | FP64 Ray-Trace | CPU PhotoWorxx
| Performance rating | |
| Beelink GTR7 7840HS | |
| Beelink SER7 | |
| Genomsnitt Intel Core i7-13700 | |
| Dell OptiPlex Micro | |
| Lenovo IdeaCentre Mini 01IRH8 | |
| GMK NucBox K3 Pro | |
| AIDA64 / FP32 Ray-Trace | |
| Beelink GTR7 7840HS | |
| Beelink SER7 | |
| Genomsnitt Intel Core i7-13700 (16408 - 29348, n=2) | |
| Dell OptiPlex Micro | |
| Lenovo IdeaCentre Mini 01IRH8 | |
| GMK NucBox K3 Pro | |
| AIDA64 / FPU Julia | |
| Beelink GTR7 7840HS | |
| Genomsnitt Intel Core i7-13700 (83757 - 138865, n=2) | |
| Beelink SER7 | |
| Dell OptiPlex Micro | |
| Lenovo IdeaCentre Mini 01IRH8 | |
| GMK NucBox K3 Pro | |
| AIDA64 / CPU SHA3 | |
| Beelink GTR7 7840HS | |
| Genomsnitt Intel Core i7-13700 (3648 - 6169, n=2) | |
| Beelink SER7 | |
| Dell OptiPlex Micro | |
| Lenovo IdeaCentre Mini 01IRH8 | |
| GMK NucBox K3 Pro | |
| AIDA64 / CPU Queen | |
| Genomsnitt Intel Core i7-13700 (113697 - 128088, n=2) | |
| Beelink GTR7 7840HS | |
| Dell OptiPlex Micro | |
| Beelink SER7 | |
| Lenovo IdeaCentre Mini 01IRH8 | |
| GMK NucBox K3 Pro | |
| AIDA64 / FPU SinJulia | |
| Beelink GTR7 7840HS | |
| Beelink SER7 | |
| Genomsnitt Intel Core i7-13700 (10833 - 15314, n=2) | |
| Dell OptiPlex Micro | |
| Lenovo IdeaCentre Mini 01IRH8 | |
| GMK NucBox K3 Pro | |
| AIDA64 / FPU Mandel | |
| Beelink GTR7 7840HS | |
| Beelink SER7 | |
| Genomsnitt Intel Core i7-13700 (40920 - 72217, n=2) | |
| Dell OptiPlex Micro | |
| Lenovo IdeaCentre Mini 01IRH8 | |
| GMK NucBox K3 Pro | |
| AIDA64 / CPU AES | |
| Beelink GTR7 7840HS | |
| Beelink SER7 | |
| Genomsnitt Intel Core i7-13700 (76357 - 120512, n=2) | |
| GMK NucBox K3 Pro | |
| Dell OptiPlex Micro | |
| Lenovo IdeaCentre Mini 01IRH8 | |
| AIDA64 / CPU ZLib | |
| Genomsnitt Intel Core i7-13700 (1045 - 1703, n=2) | |
| Beelink GTR7 7840HS | |
| Dell OptiPlex Micro | |
| Lenovo IdeaCentre Mini 01IRH8 | |
| Beelink SER7 | |
| GMK NucBox K3 Pro | |
| AIDA64 / FP64 Ray-Trace | |
| Beelink GTR7 7840HS | |
| Beelink SER7 | |
| Genomsnitt Intel Core i7-13700 (8712 - 16164, n=2) | |
| Dell OptiPlex Micro | |
| Lenovo IdeaCentre Mini 01IRH8 | |
| GMK NucBox K3 Pro | |
| AIDA64 / CPU PhotoWorxx | |
| GMK NucBox K3 Pro | |
| Genomsnitt Intel Core i7-13700 (37819 - 48448, n=2) | |
| Beelink SER7 | |
| Beelink GTR7 7840HS | |
| Dell OptiPlex Micro | |
| Lenovo IdeaCentre Mini 01IRH8 | |
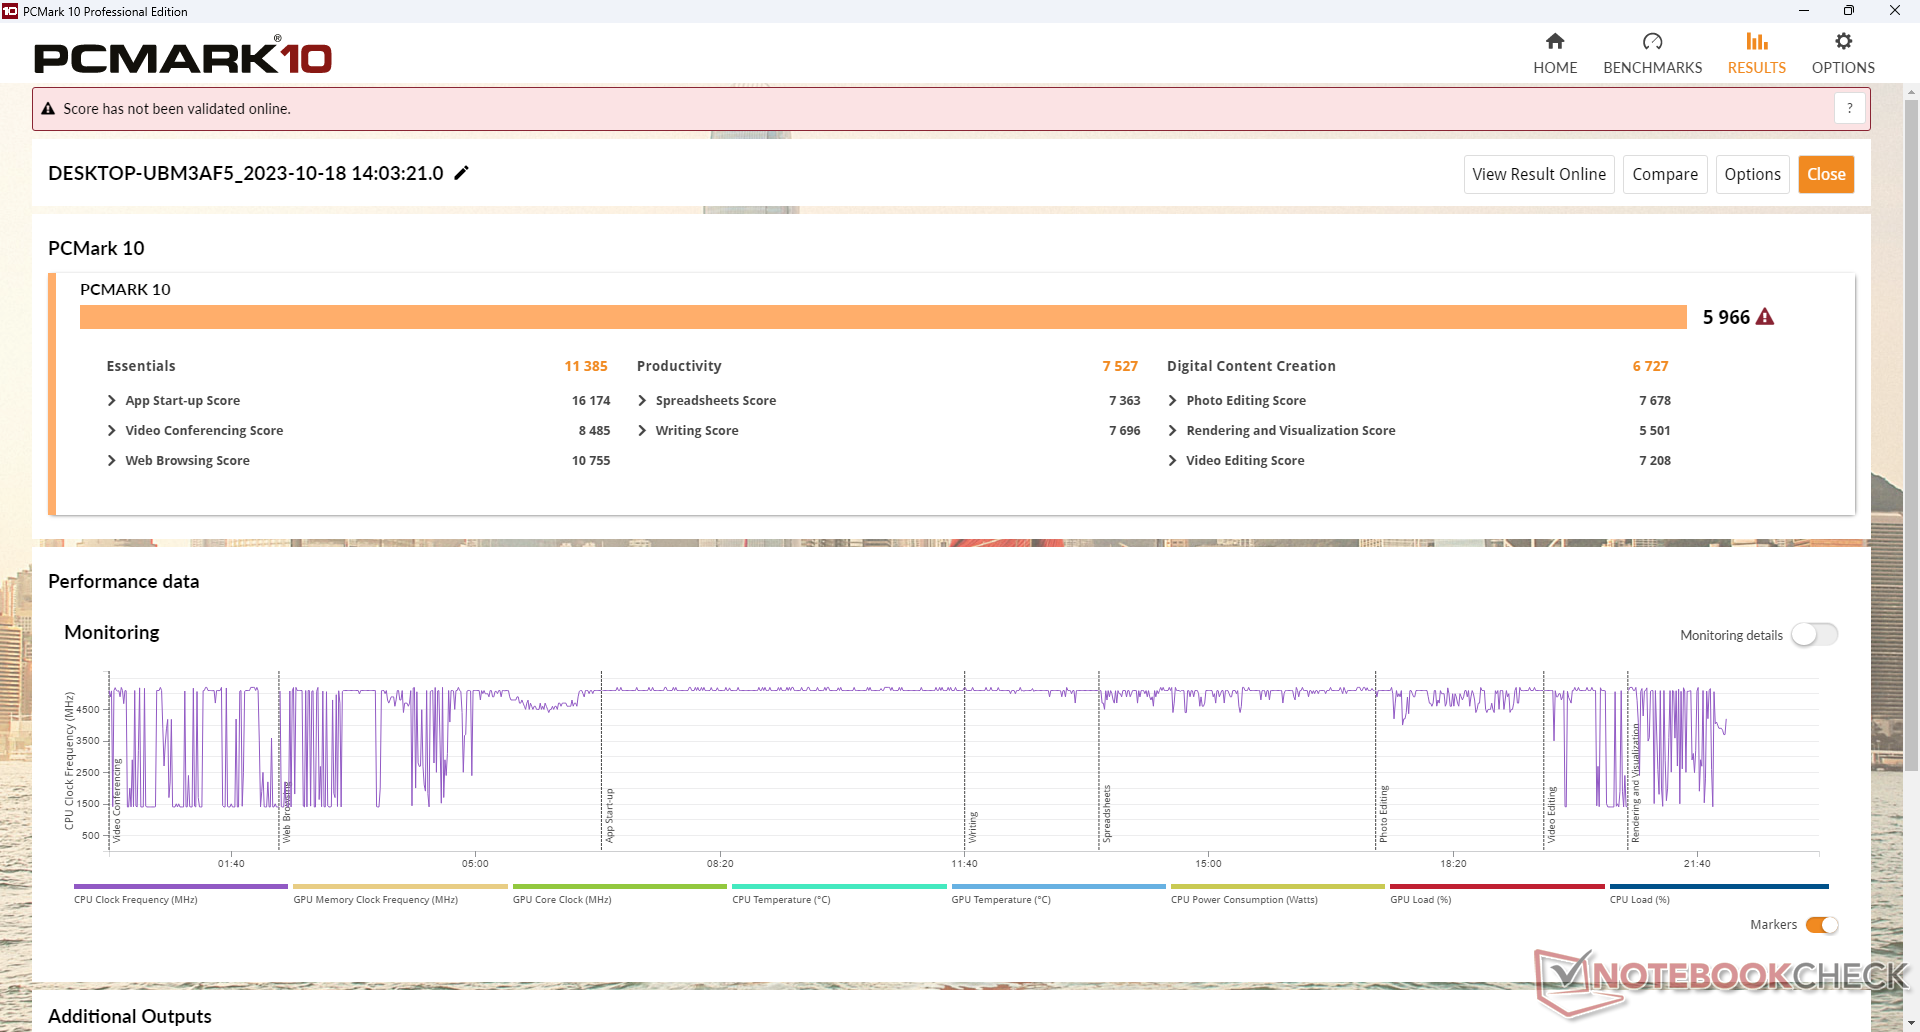
Systemets prestanda
PCMark-resultaten är jämförbara medGMK NucBox K3 Pro men fortfarande bakom AMD-baserade minidatorer som Beelink SER7. Underskottet kan till stor del hänföras till den snabbare integrerade Radeon GPU på konkurrerande Ryzen Zen 3+ eller Zen 4-plattformar.
CrossMark: Overall | Productivity | Creativity | Responsiveness
| PCMark 10 / Score | |
| Beelink GTR7 7840HS | |
| Beelink SER7 | |
| Lenovo IdeaCentre Mini 01IRH8 | |
| Dell OptiPlex Micro | |
| Genomsnitt Intel Core i7-13700, Intel UHD Graphics 770 (n=1) | |
| GMK NucBox K3 Pro | |
| PCMark 10 / Essentials | |
| Lenovo IdeaCentre Mini 01IRH8 | |
| Dell OptiPlex Micro | |
| Genomsnitt Intel Core i7-13700, Intel UHD Graphics 770 (n=1) | |
| Beelink GTR7 7840HS | |
| Beelink SER7 | |
| GMK NucBox K3 Pro | |
| PCMark 10 / Productivity | |
| Beelink GTR7 7840HS | |
| Beelink SER7 | |
| GMK NucBox K3 Pro | |
| Lenovo IdeaCentre Mini 01IRH8 | |
| Dell OptiPlex Micro | |
| Genomsnitt Intel Core i7-13700, Intel UHD Graphics 770 (n=1) | |
| PCMark 10 / Digital Content Creation | |
| Beelink GTR7 7840HS | |
| Beelink SER7 | |
| Lenovo IdeaCentre Mini 01IRH8 | |
| Dell OptiPlex Micro | |
| Genomsnitt Intel Core i7-13700, Intel UHD Graphics 770 (n=1) | |
| GMK NucBox K3 Pro | |
| CrossMark / Overall | |
| Dell OptiPlex Micro | |
| Genomsnitt Intel Core i7-13700, Intel UHD Graphics 770 (n=1) | |
| Lenovo IdeaCentre Mini 01IRH8 | |
| Beelink SER7 | |
| GMK NucBox K3 Pro | |
| Beelink GTR7 7840HS | |
| Apple Mac Mini M2 | |
| CrossMark / Productivity | |
| Dell OptiPlex Micro | |
| Genomsnitt Intel Core i7-13700, Intel UHD Graphics 770 (n=1) | |
| Lenovo IdeaCentre Mini 01IRH8 | |
| Beelink SER7 | |
| Beelink GTR7 7840HS | |
| GMK NucBox K3 Pro | |
| Apple Mac Mini M2 | |
| CrossMark / Creativity | |
| Dell OptiPlex Micro | |
| Genomsnitt Intel Core i7-13700, Intel UHD Graphics 770 (n=1) | |
| Beelink SER7 | |
| Lenovo IdeaCentre Mini 01IRH8 | |
| Apple Mac Mini M2 | |
| GMK NucBox K3 Pro | |
| Beelink GTR7 7840HS | |
| CrossMark / Responsiveness | |
| Beelink GTR7 7840HS | |
| Dell OptiPlex Micro | |
| Genomsnitt Intel Core i7-13700, Intel UHD Graphics 770 (n=1) | |
| Lenovo IdeaCentre Mini 01IRH8 | |
| GMK NucBox K3 Pro | |
| Beelink SER7 | |
| Apple Mac Mini M2 | |
| PCMark 10 Score | 5966 poäng | |
Hjälp | ||
| AIDA64 / Memory Copy | |
| GMK NucBox K3 Pro | |
| Beelink SER7 | |
| Beelink GTR7 7840HS | |
| Genomsnitt Intel Core i7-13700 (61152 - 73900, n=2) | |
| Dell OptiPlex Micro | |
| Lenovo IdeaCentre Mini 01IRH8 | |
| AIDA64 / Memory Read | |
| Genomsnitt Intel Core i7-13700 (71285 - 81167, n=2) | |
| Dell OptiPlex Micro | |
| GMK NucBox K3 Pro | |
| Beelink SER7 | |
| Beelink GTR7 7840HS | |
| Lenovo IdeaCentre Mini 01IRH8 | |
| AIDA64 / Memory Write | |
| Beelink SER7 | |
| Beelink GTR7 7840HS | |
| Genomsnitt Intel Core i7-13700 (60029 - 73720, n=2) | |
| Dell OptiPlex Micro | |
| GMK NucBox K3 Pro | |
| Lenovo IdeaCentre Mini 01IRH8 | |
| AIDA64 / Memory Latency | |
| GMK NucBox K3 Pro | |
| Dell OptiPlex Micro | |
| Beelink GTR7 7840HS | |
| Beelink SER7 | |
| Lenovo IdeaCentre Mini 01IRH8 | |
| Genomsnitt Intel Core i7-13700 (71.8 - 87, n=2) | |
* ... mindre är bättre
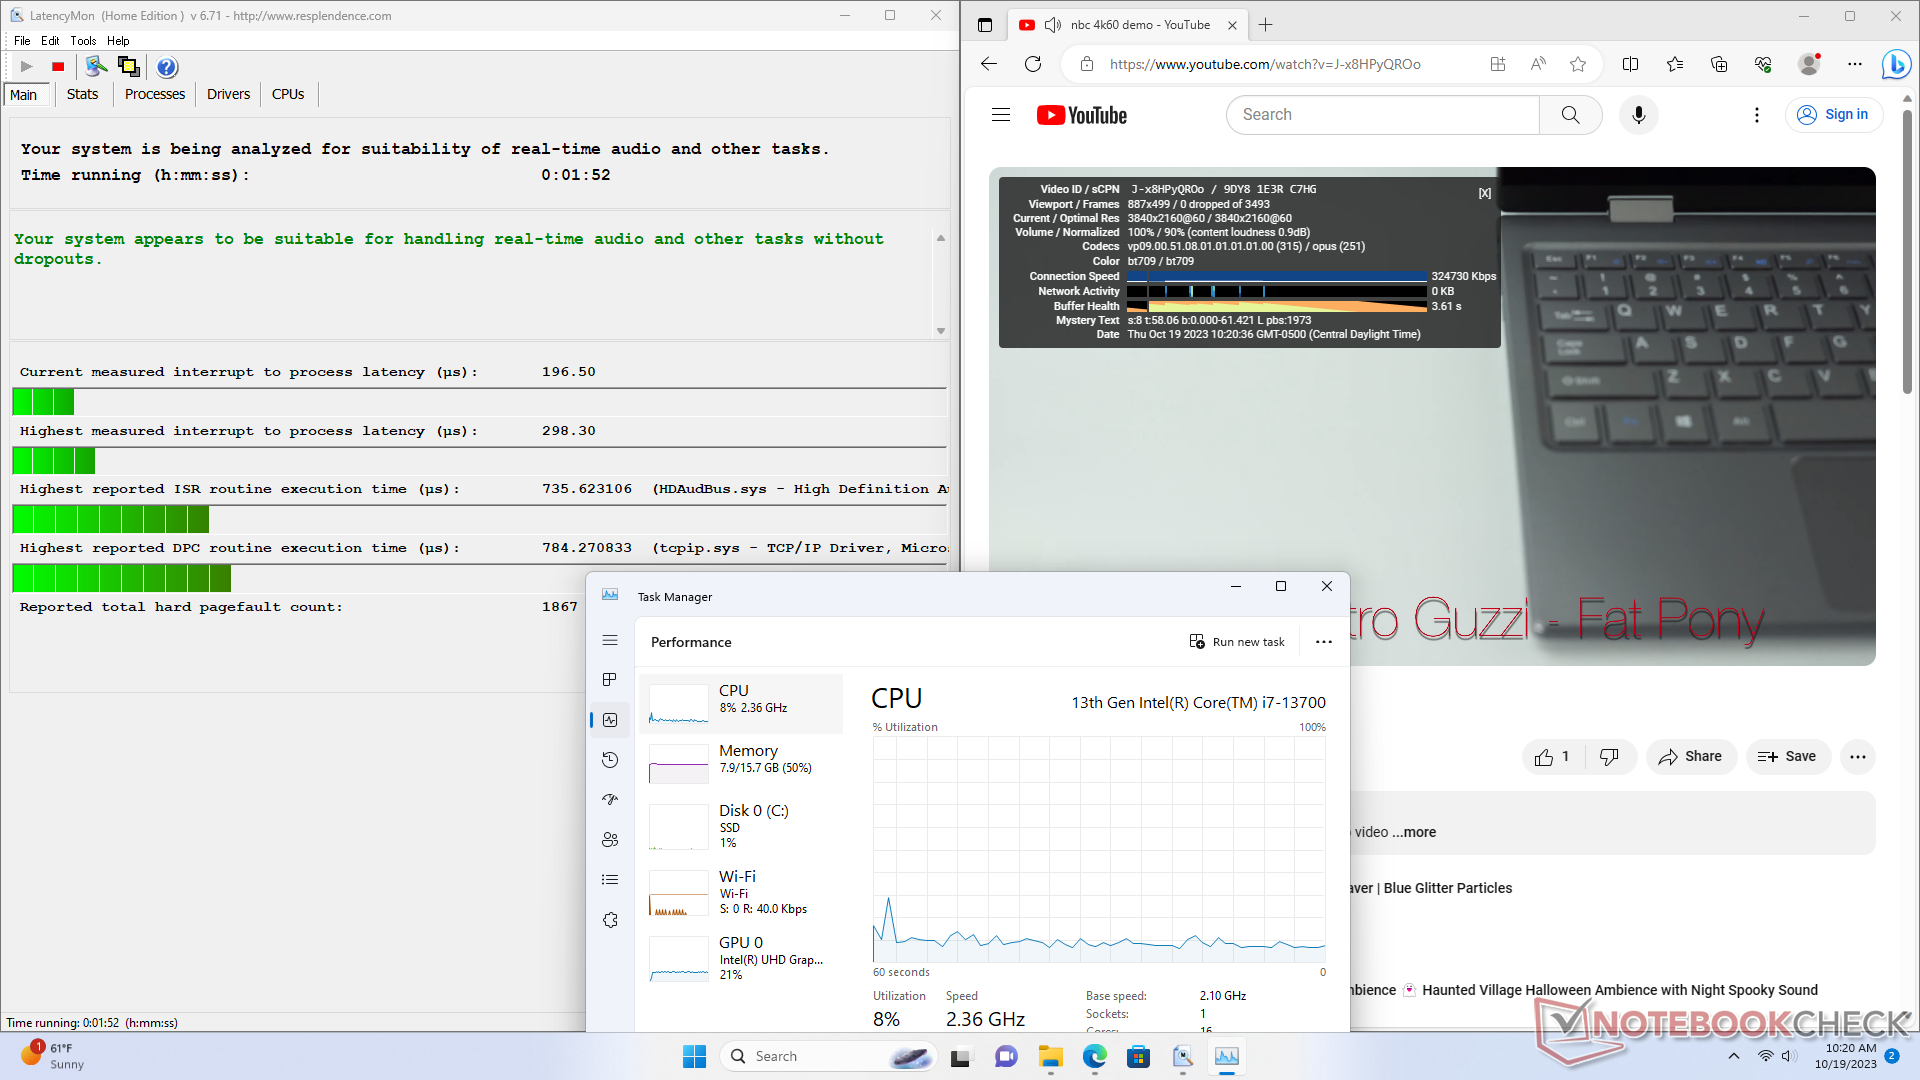
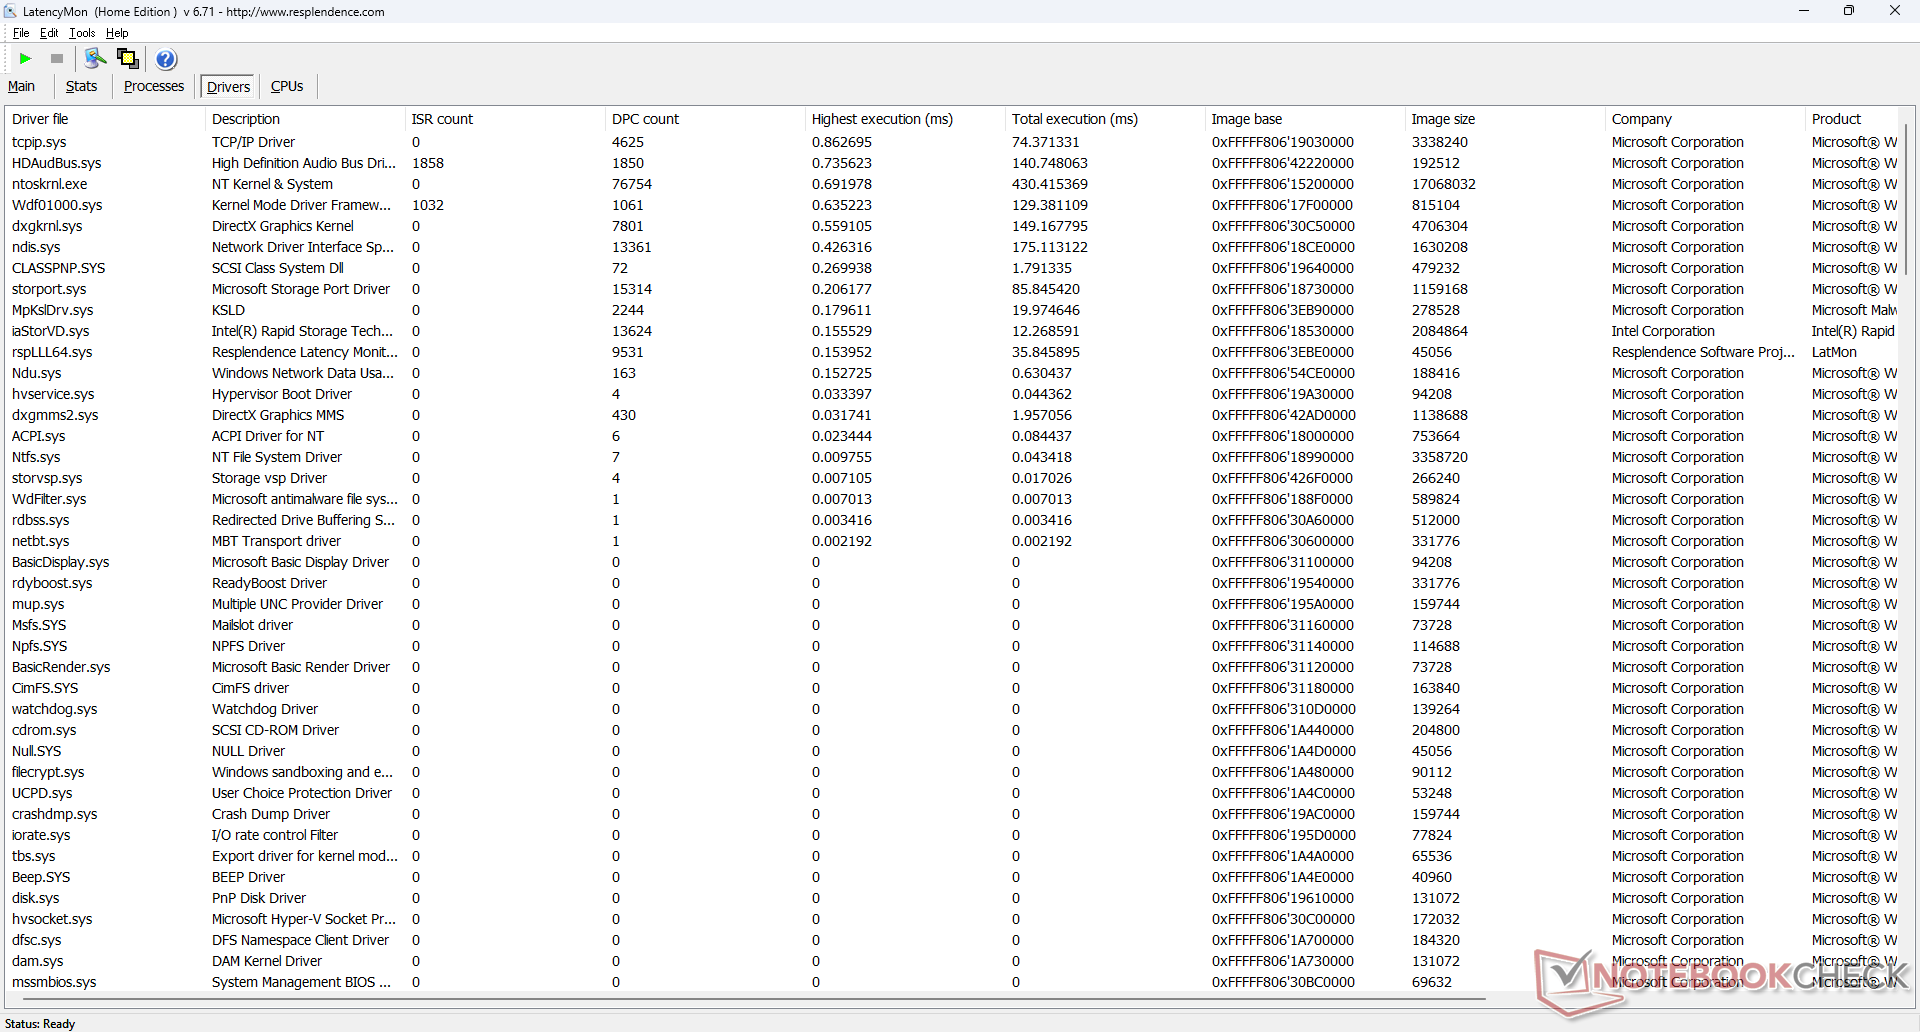
DPC-fördröjning
LatencyMon visar inga större DPC-problem när vi öppnar flera webbläsarflikar på vår hemsida och inga tappade bildrutor under 4K-uppspelning vid 60 FPS.
| DPC Latencies / LatencyMon - interrupt to process latency (max), Web, Youtube, Prime95 | |
| Lenovo IdeaCentre Mini 01IRH8 | |
| GMK NucBox K3 Pro | |
| Beelink GTR7 7840HS | |
| Beelink SER7 | |
| Dell OptiPlex Micro | |
* ... mindre är bättre
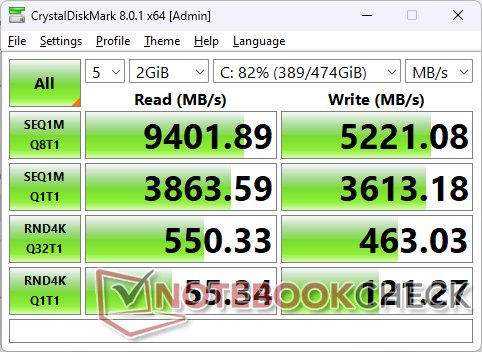
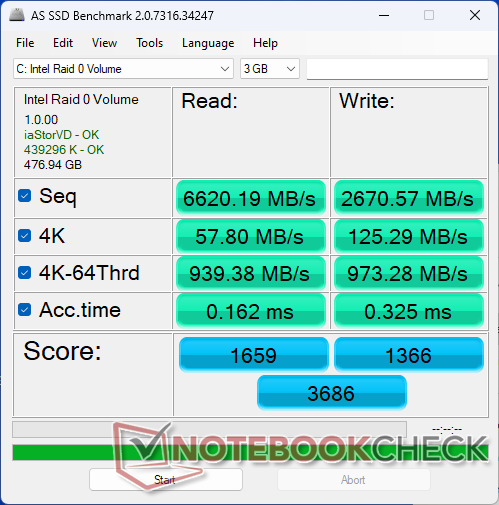
Lagringsenheter
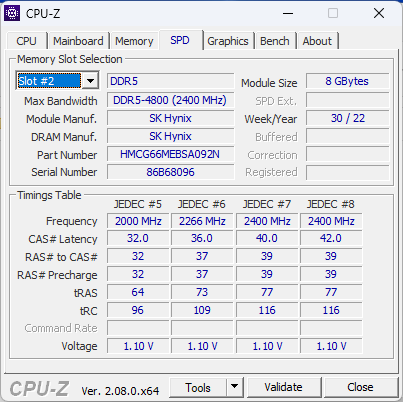
Vår enhet använder två SK hynix BC901 NVMe SSD-enheter i RAID 0-konfiguration, vilket är en ovanlig syn eftersom varje enhet bara är 30 mm lång i stället för de mer typiska 80 mm. Den kortare längden och avsaknaden av värmespridare innebär att prestandastrypning är mer sannolikt att inträffa när enheterna är stressade. Tyvärr är detta precis vad som händer, vilket visas av våra DiskSpd loop-testresultat nedan där överföringshastigheterna kunde vara så höga som 8600 MB/s endast under den första minuten eller så innan de minskade till 1500 till 2500 MB/s.
Notera att systemet fortfarande kan stödja två fullängds 2280 M.2 SSD-enheter om så önskas.

| Drive Performance rating - Percent | |
| Beelink GTR7 7840HS | |
| Dell OptiPlex Micro | |
| Lenovo IdeaCentre Mini 01IRH8 | |
| Beelink SER7 | |
| GMK NucBox K3 Pro | |
* ... mindre är bättre
Disk Throttling: DiskSpd Read Loop, Queue Depth 8
GPU-prestanda
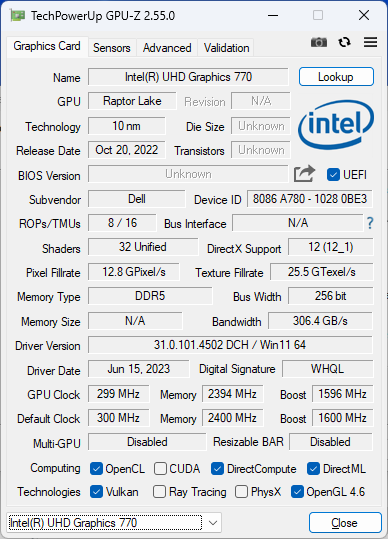
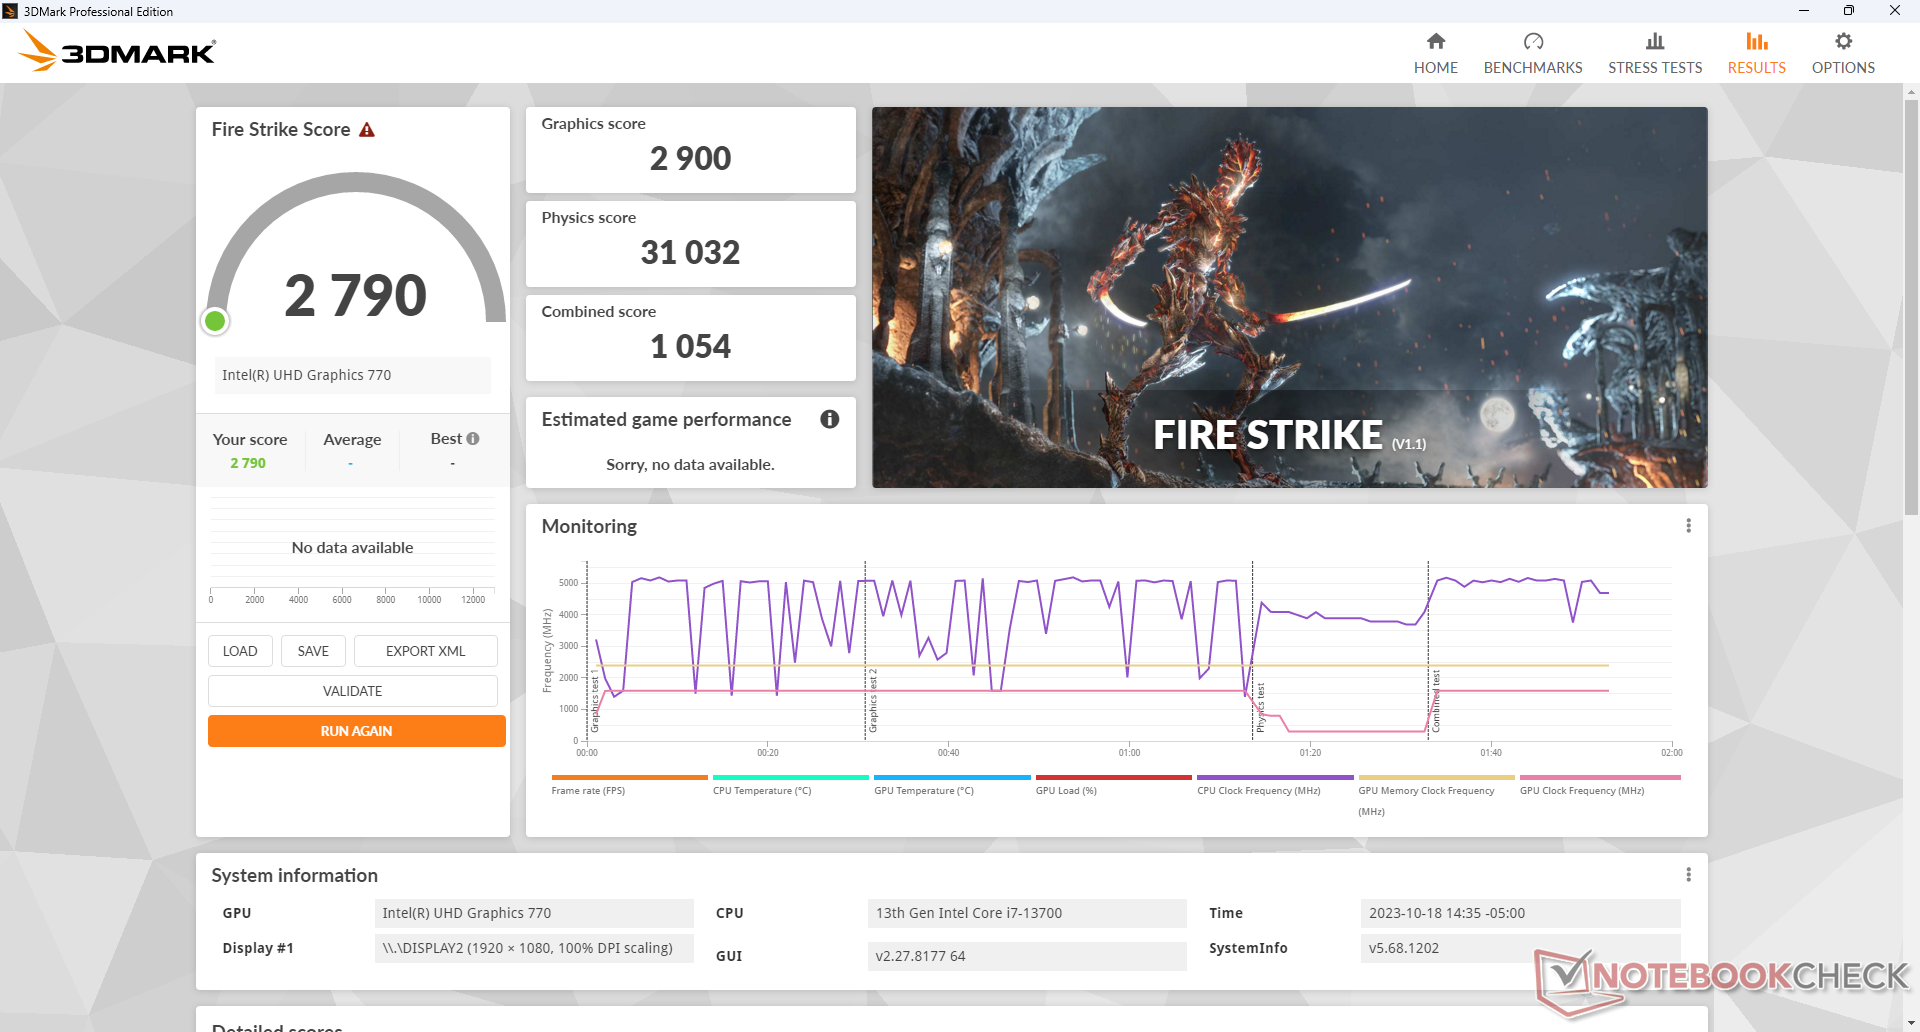
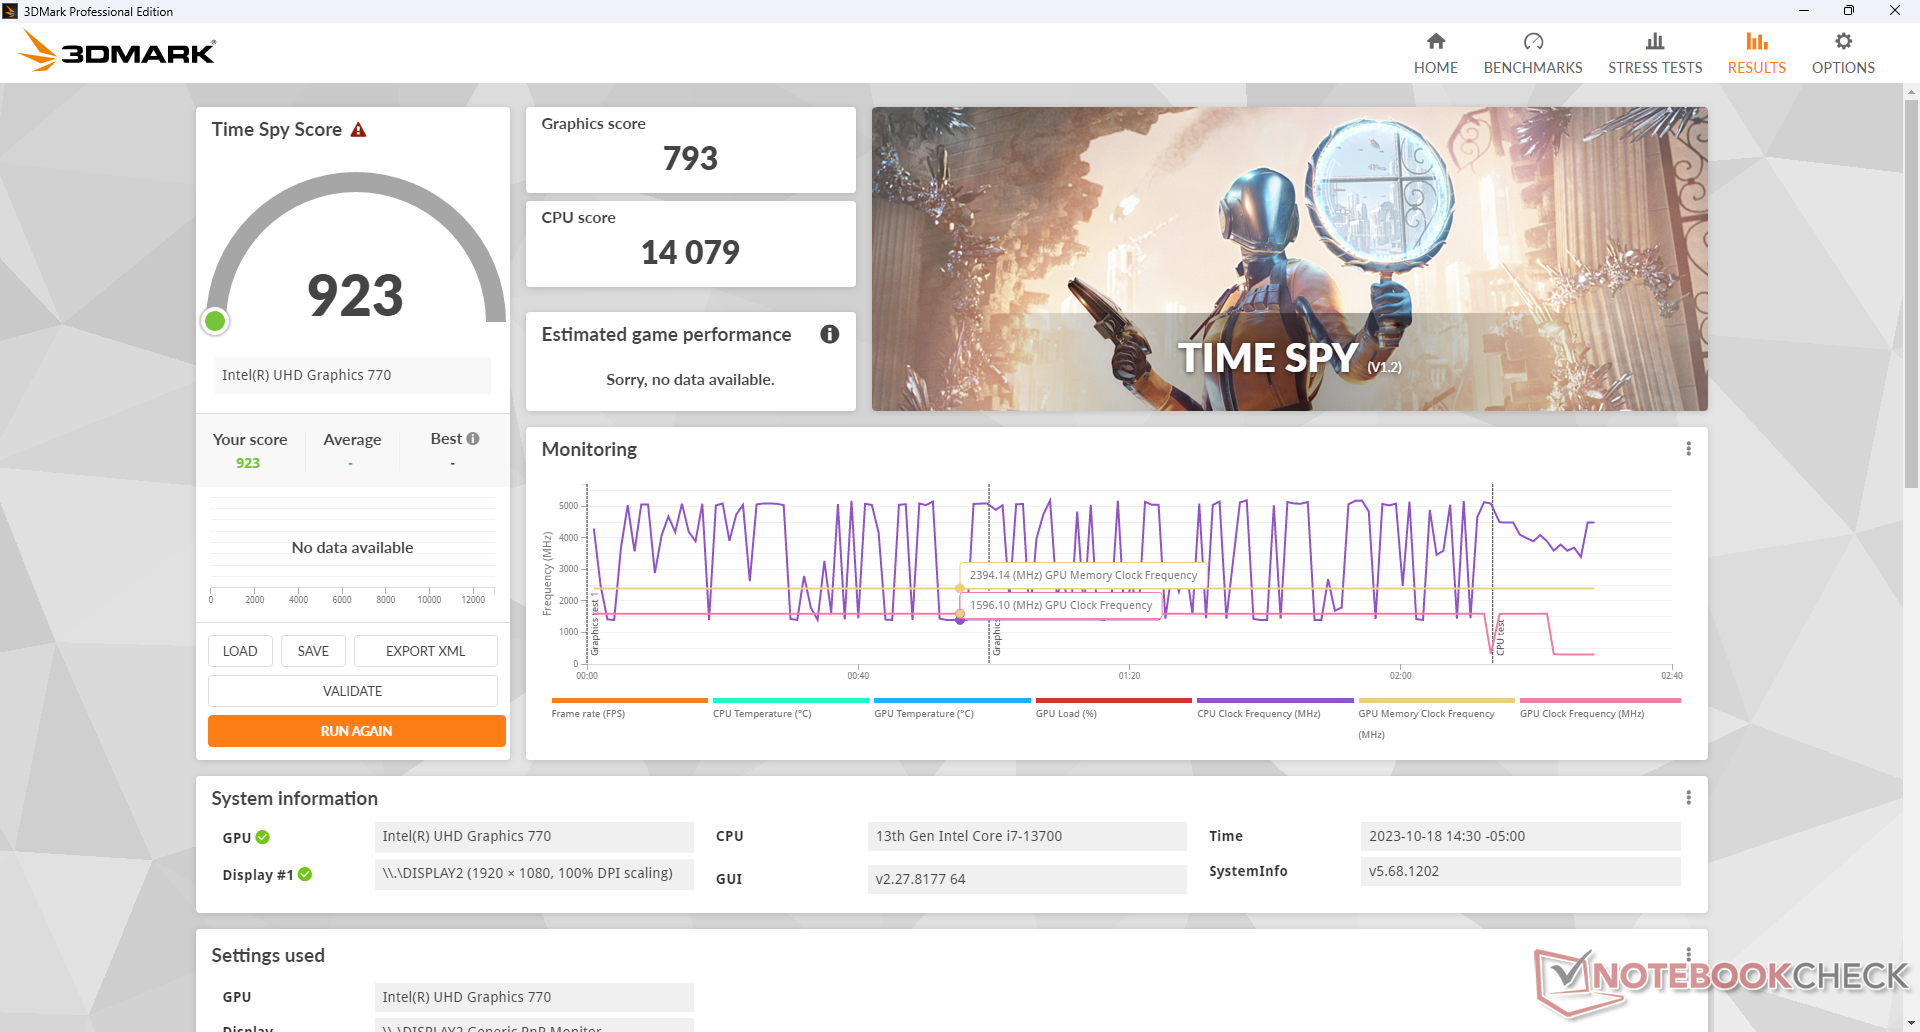
Grafikprestandan är dålig, särskilt jämfört med den mer imponerande CPU:n. DenUHD Graphics 770 har blivit föråldrad och den är bara riktigt användbar för streamingändamål eller grundläggande 4K60-videoutgång. Detta bör dock inte vara ett problem för målgruppen eftersom OptiPlex Micro inte var utformad för att vara ett grafikkraftverk.
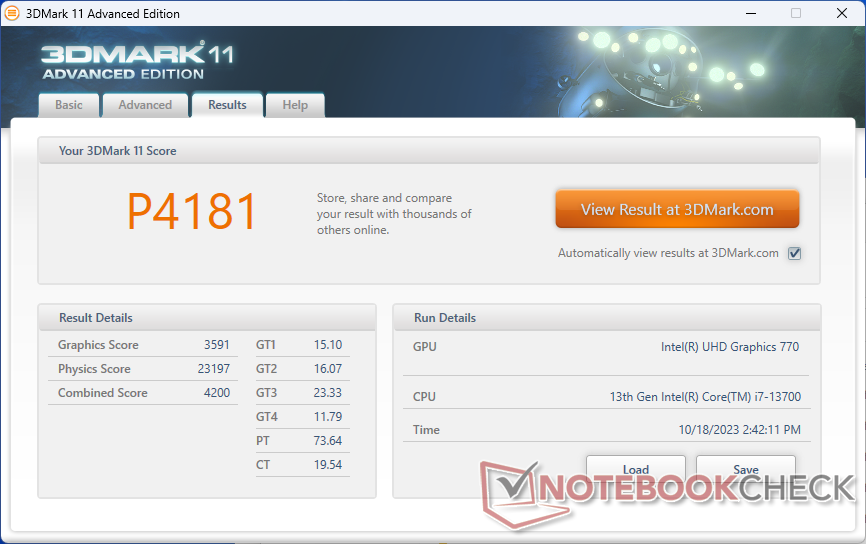
| 3DMark 11 Performance | 4181 poäng | |
| 3DMark Fire Strike Score | 2790 poäng | |
| 3DMark Time Spy Score | 923 poäng | |
Hjälp | ||
| Blender | |
| v3.3 Classroom METAL | |
| Apple Mac Mini M2 | |
| v3.3 Classroom HIP/AMD | |
| Geekom A5 | |
| Acemagic AM20 | |
| v3.3 Classroom CPU | |
| Minisforum Venus Series UN1245 | |
| GMK NucBox K3 Pro | |
| Acemagic AD15 | |
| Apple Mac Mini M2 | |
| Geekom A5 | |
| Acemagic AM20 | |
| Beelink GTR7 7840HS | |
| Lenovo IdeaCentre Mini 01IRH8 | |
| Genomsnitt Intel UHD Graphics 770 (320 - 533, n=5) | |
| Intel NUC 12, NUC12SNKi72_Serpent Canyon | |
| Dell OptiPlex Micro | |
* ... mindre är bättre
| The Witcher 3 | |
| 1024x768 Low Graphics & Postprocessing | |
| Beelink GTR7 7840HS | |
| Acemagic AM20 | |
| Lenovo IdeaCentre Mini 01IRH8 | |
| Geekom A5 | |
| GMK NucBox K3 Pro | |
| Minisforum Venus Series UN1245 | |
| Dell OptiPlex Micro | |
| Genomsnitt Intel UHD Graphics 770 (41.8 - 58, n=4) | |
| Acemagic AD15 | |
| 1366x768 Medium Graphics & Postprocessing | |
| Beelink GTR7 7840HS | |
| GMK NucBox K3 Pro | |
| Lenovo IdeaCentre Mini 01IRH8 | |
| Geekom A5 | |
| Acemagic AM20 | |
| Minisforum Venus Series UN1245 | |
| Dell OptiPlex Micro | |
| Genomsnitt Intel UHD Graphics 770 (34.2 - 37.9, n=2) | |
| Cyberpunk 2077 1.6 | |
| 1280x720 Low Preset | |
| Beelink GTR7 7840HS | |
| Lenovo IdeaCentre Mini 01IRH8 | |
| Genomsnitt Intel UHD Graphics 770 (18.6 - 22.2, n=2) | |
| Dell OptiPlex Micro | |
| 1920x1080 Low Preset | |
| Beelink GTR7 7840HS | |
| Lenovo IdeaCentre Mini 01IRH8 | |
| Genomsnitt Intel UHD Graphics 770 (10.2 - 11.8, n=2) | |
| Dell OptiPlex Micro | |
Witcher 3 FPS Chart
| låg | med. | hög | ultra | |
|---|---|---|---|---|
| The Witcher 3 (2015) | 58 | 37.9 | ||
| Dota 2 Reborn (2015) | 153.1 | 96.1 | 44.2 | 40.8 |
| Final Fantasy XV Benchmark (2018) | 28.2 | 14.6 | 10.2 | |
| X-Plane 11.11 (2018) | 51.4 | 32.7 | 29.7 | |
| Cyberpunk 2077 1.6 (2022) | 10.2 | |||
| Tiny Tina's Wonderlands (2022) | 16.4 |
Utsläpp
Buller från systemet
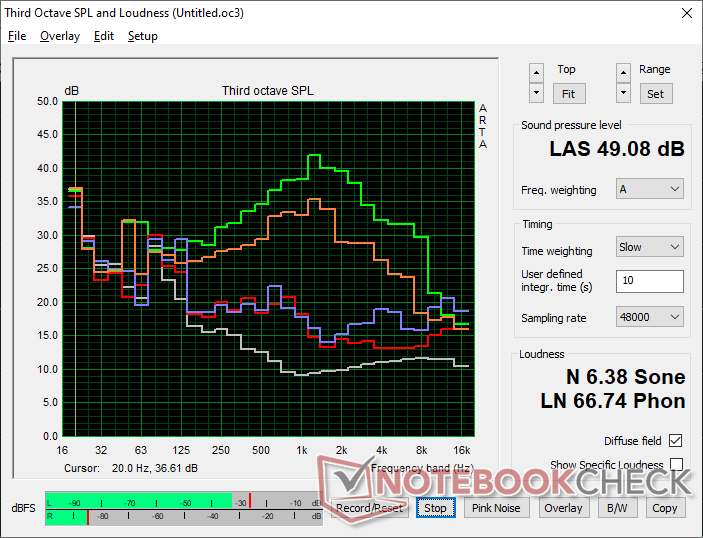
Den interna fläkten är alltid aktiv med ett minimum på 28,2 dB(A) mot en tyst bakgrund på 23,2 dB(A). Fläkten är relativt tyst och ligger på ca 30 dB(A) när man kör typiska belastningar som webbläsare eller kalkylblad, men extrema belastningar som Prime95-stress kan orsaka ett fläktljud på nästan 50 dB(A) och är därmed högre än de flesta andra mini-pc-datorer. Med andra ord blir OptiPlex Micro bara högljudd när krävande applikationer introduceras.
Ljudnivå
| Låg belastning |
| 28.2 / 28.2 / 29.1 dB(A) |
| Hög belastning |
| 30.2 / 49.1 dB(A) |
 | ||
30 dB tyst 40 dB(A) hörbar 50 dB(A) högt ljud |
||
min: | ||
| Dell OptiPlex Micro UHD Graphics 770, i7-13700 | Apple Mac Mini M2 M2 10-Core GPU, M2, Apple SSD AP0512Z | Lenovo IdeaCentre Mini 01IRH8 Iris Xe G7 96EUs, i7-13700H, Samsung PM9B1 512GB MZVL4512HBLU | GMK NucBox K3 Pro UHD Graphics 64EUs, i7-12650H, Lexar NM610 Pro NM610P001T-HNNNG | Beelink GTR7 7840HS Radeon 780M, R7 7840HS, Crucial P3 Plus CT1000P3PSSD8 | Beelink SER7 Radeon 780M, R7 7840HS, Crucial P3 Plus CT1000P3PSSD8 | |
|---|---|---|---|---|---|---|
| Noise | 15% | 2% | 4% | 1% | 5% | |
| av / miljö * (dB) | 23.2 | 24.7 -6% | 23.4 -1% | 23.1 -0% | 25.6 -10% | 24.5 -6% |
| Idle Minimum * (dB) | 28.2 | 24.7 12% | 30.4 -8% | 25 11% | 28.1 -0% | 25.1 11% |
| Idle Average * (dB) | 28.2 | 24.7 12% | 30.4 -8% | 25.5 10% | 28.1 -0% | 25.1 11% |
| Idle Maximum * (dB) | 29.1 | 24.7 15% | 30.4 -4% | 25.5 12% | 28.1 3% | 25.1 14% |
| Load Average * (dB) | 30.2 | 24.7 18% | 30.7 -2% | 39.9 -32% | 34.9 -16% | 35.9 -19% |
| Witcher 3 ultra * (dB) | 42.6 | 33.9 20% | 39.9 6% | 36.4 15% | 35.6 16% | |
| Load Maximum * (dB) | 49.1 | 29.4 40% | 41 16% | 39.9 19% | 42.4 14% | 45.4 8% |
* ... mindre är bättre
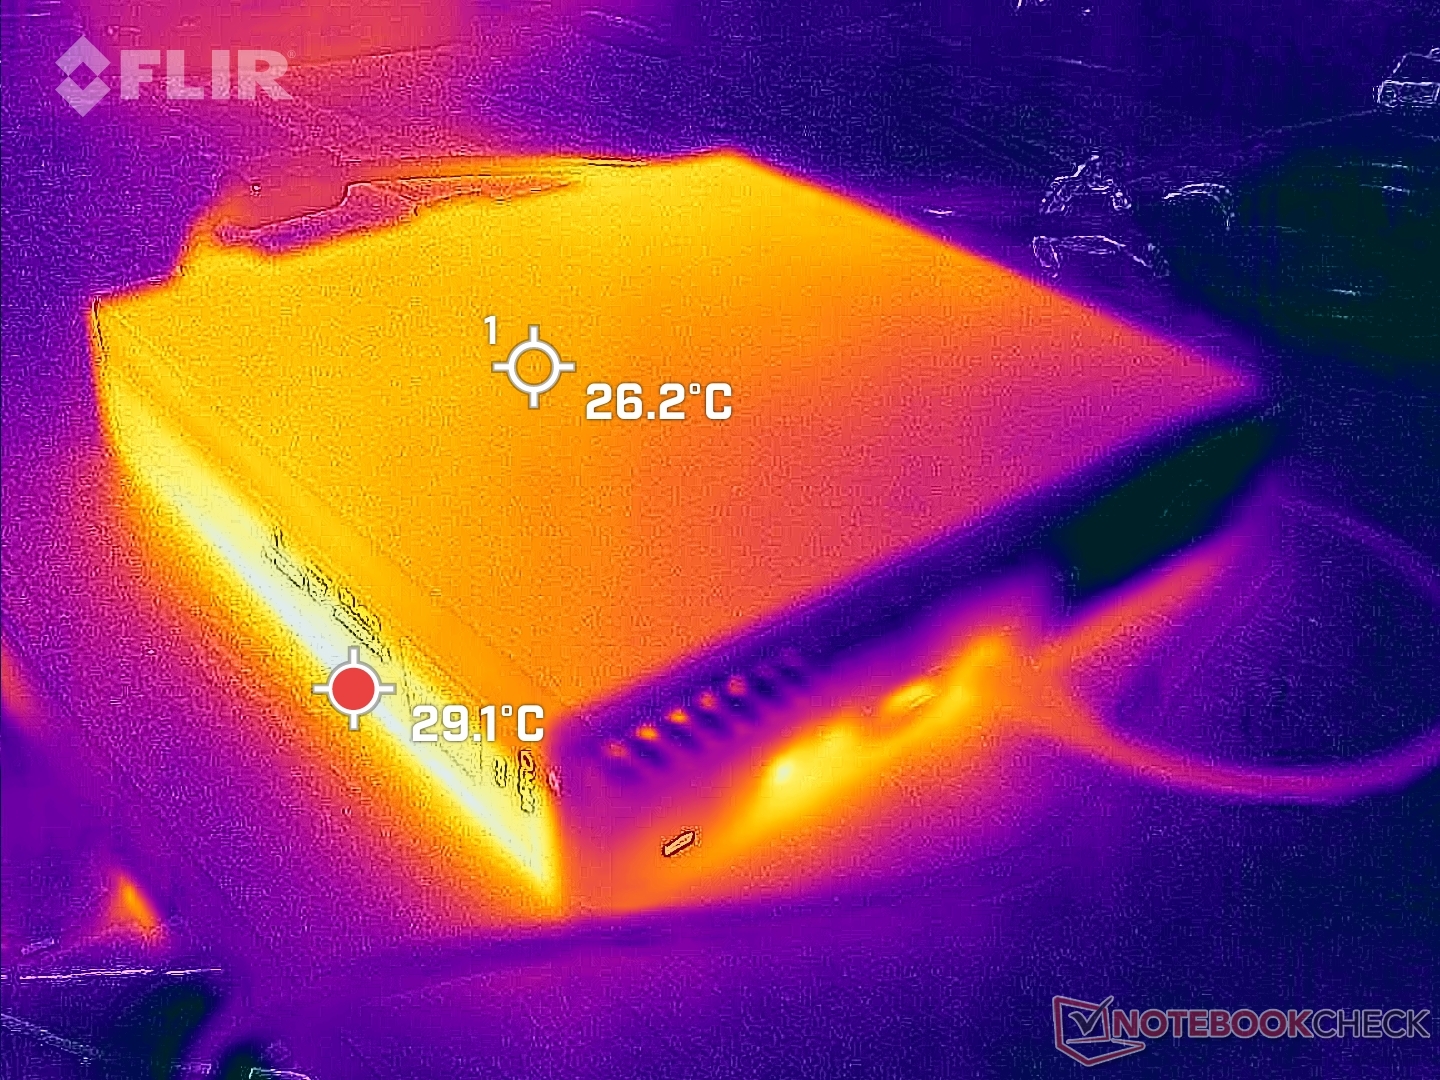
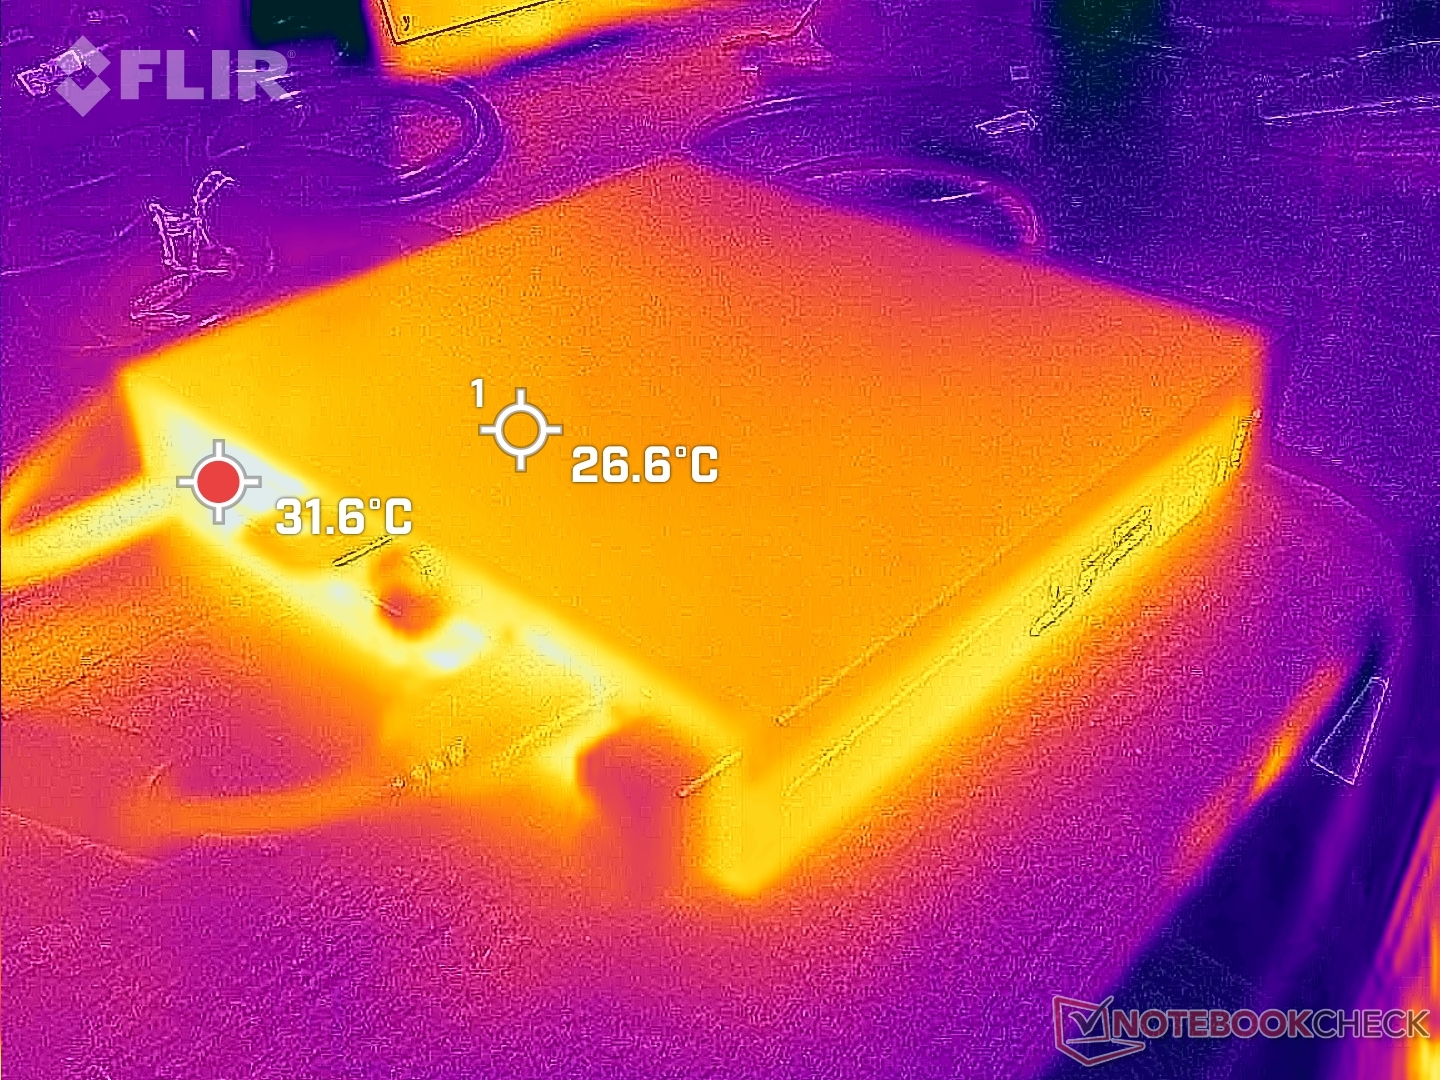
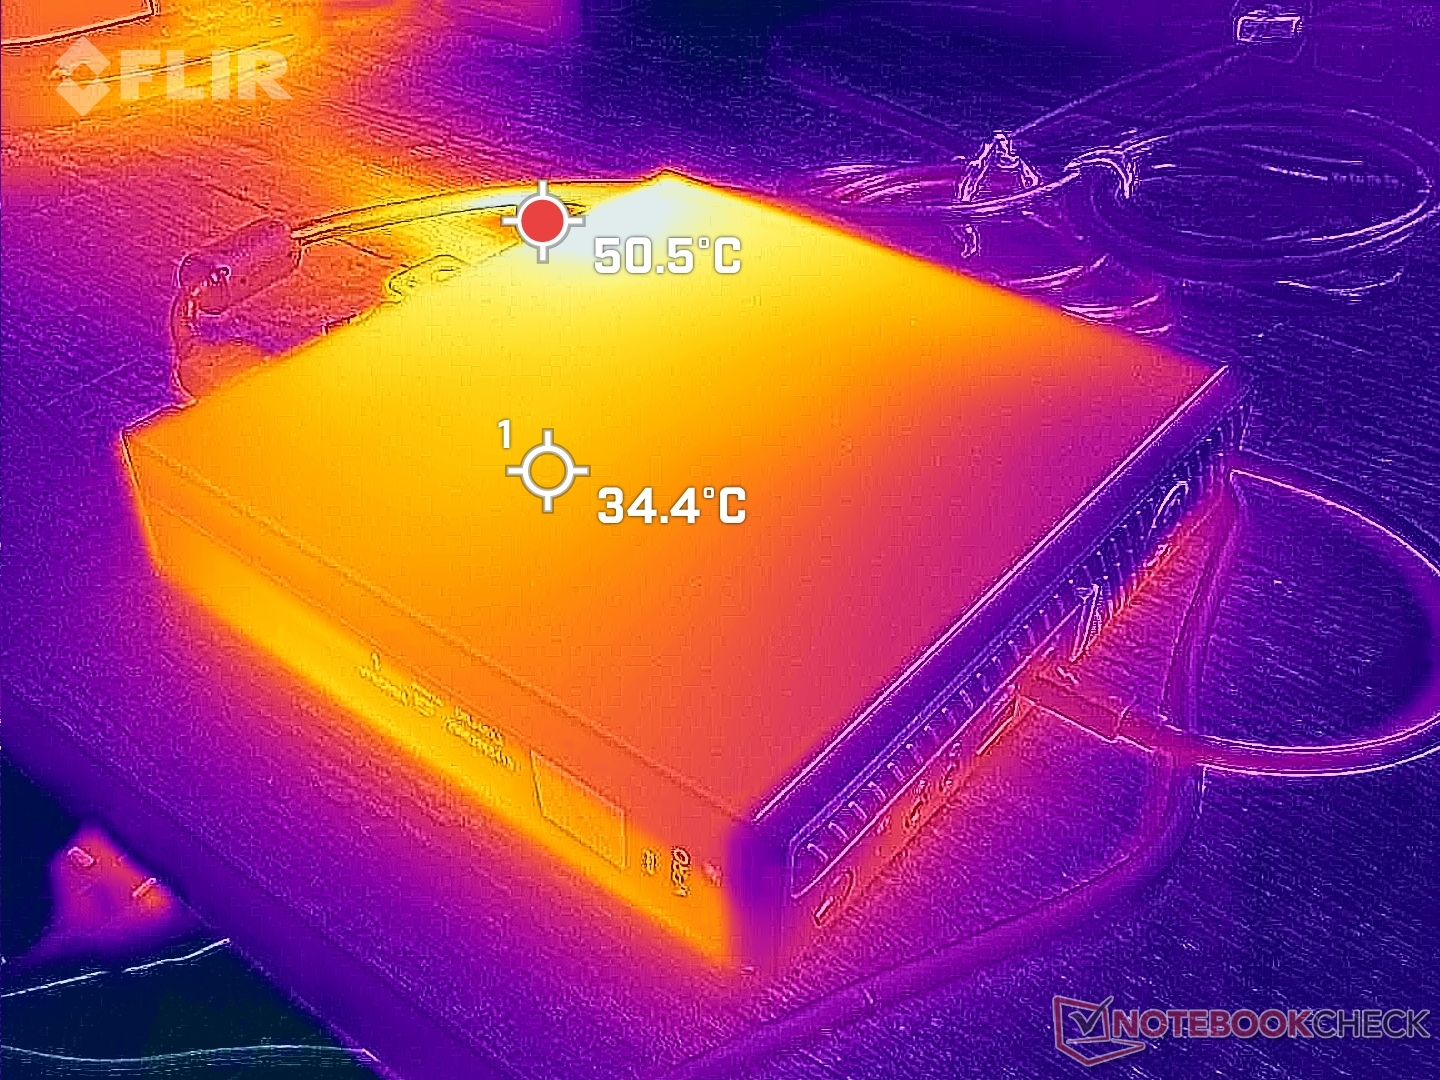
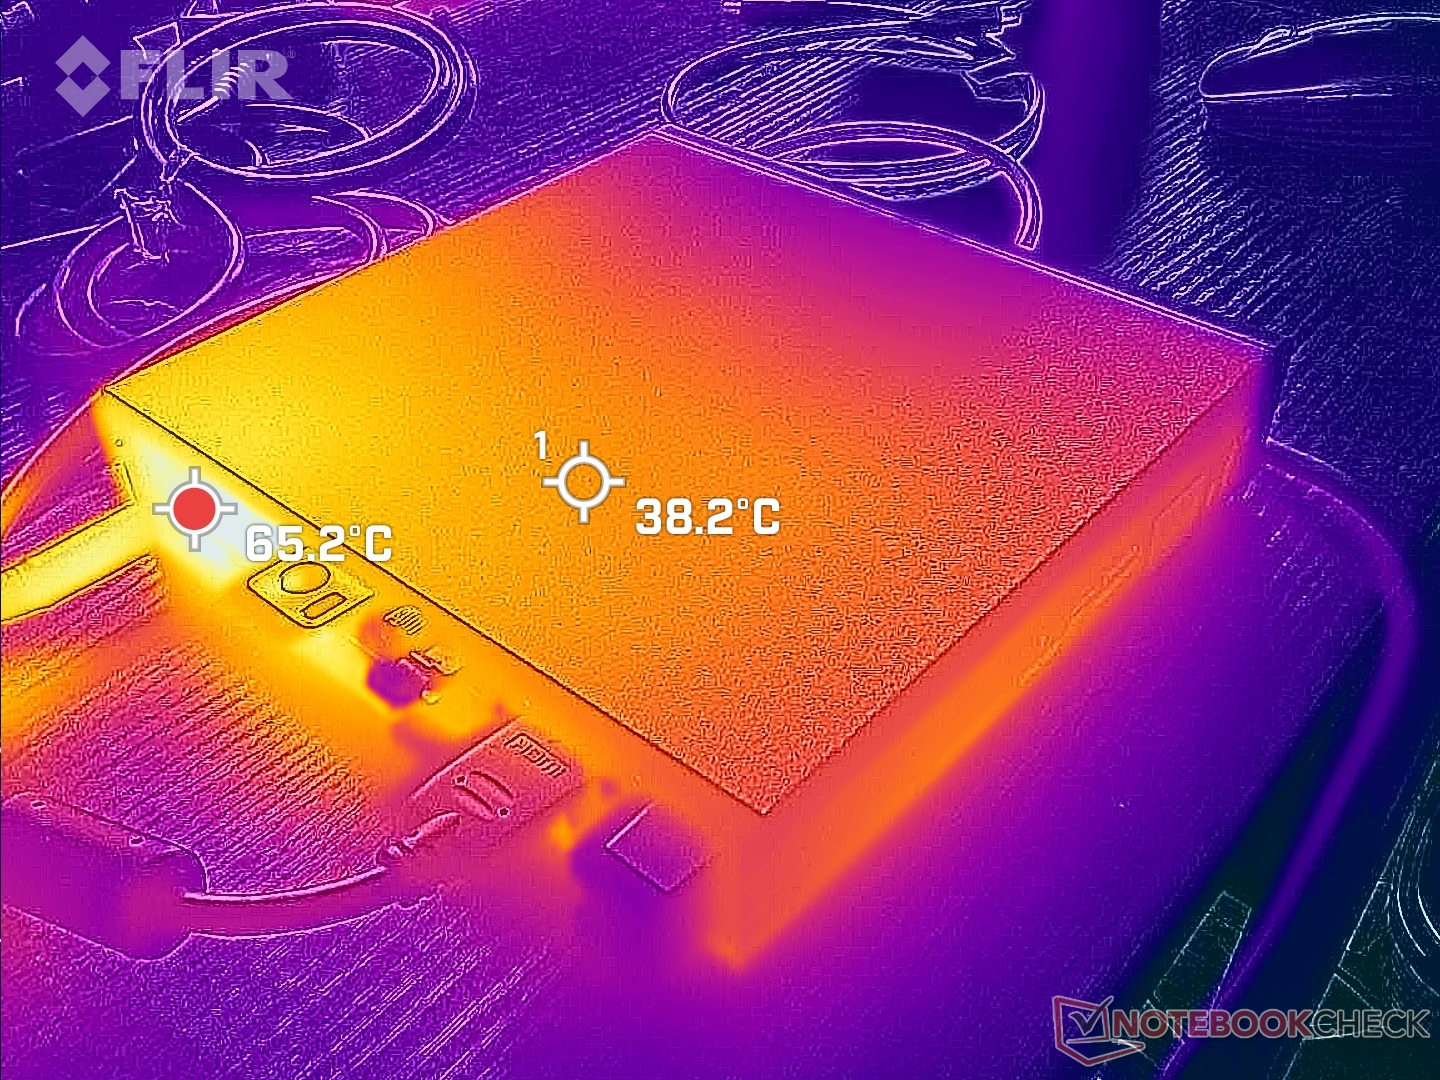
Temperatur - varm topp
Yttemperaturerna kan bli ganska varma eftersom modellen har en CPU i stationär klass i ett yttre som mestadels består av metall. Den övre ytan är mellan 30 och 35 C när du bara surfar på webben och den kan bli så hög som 51 C när du kör krävande belastningar. Du kommer definitivt att vilja vara försiktig med temperaturen om du placerar några föremål ovanpå enheten.
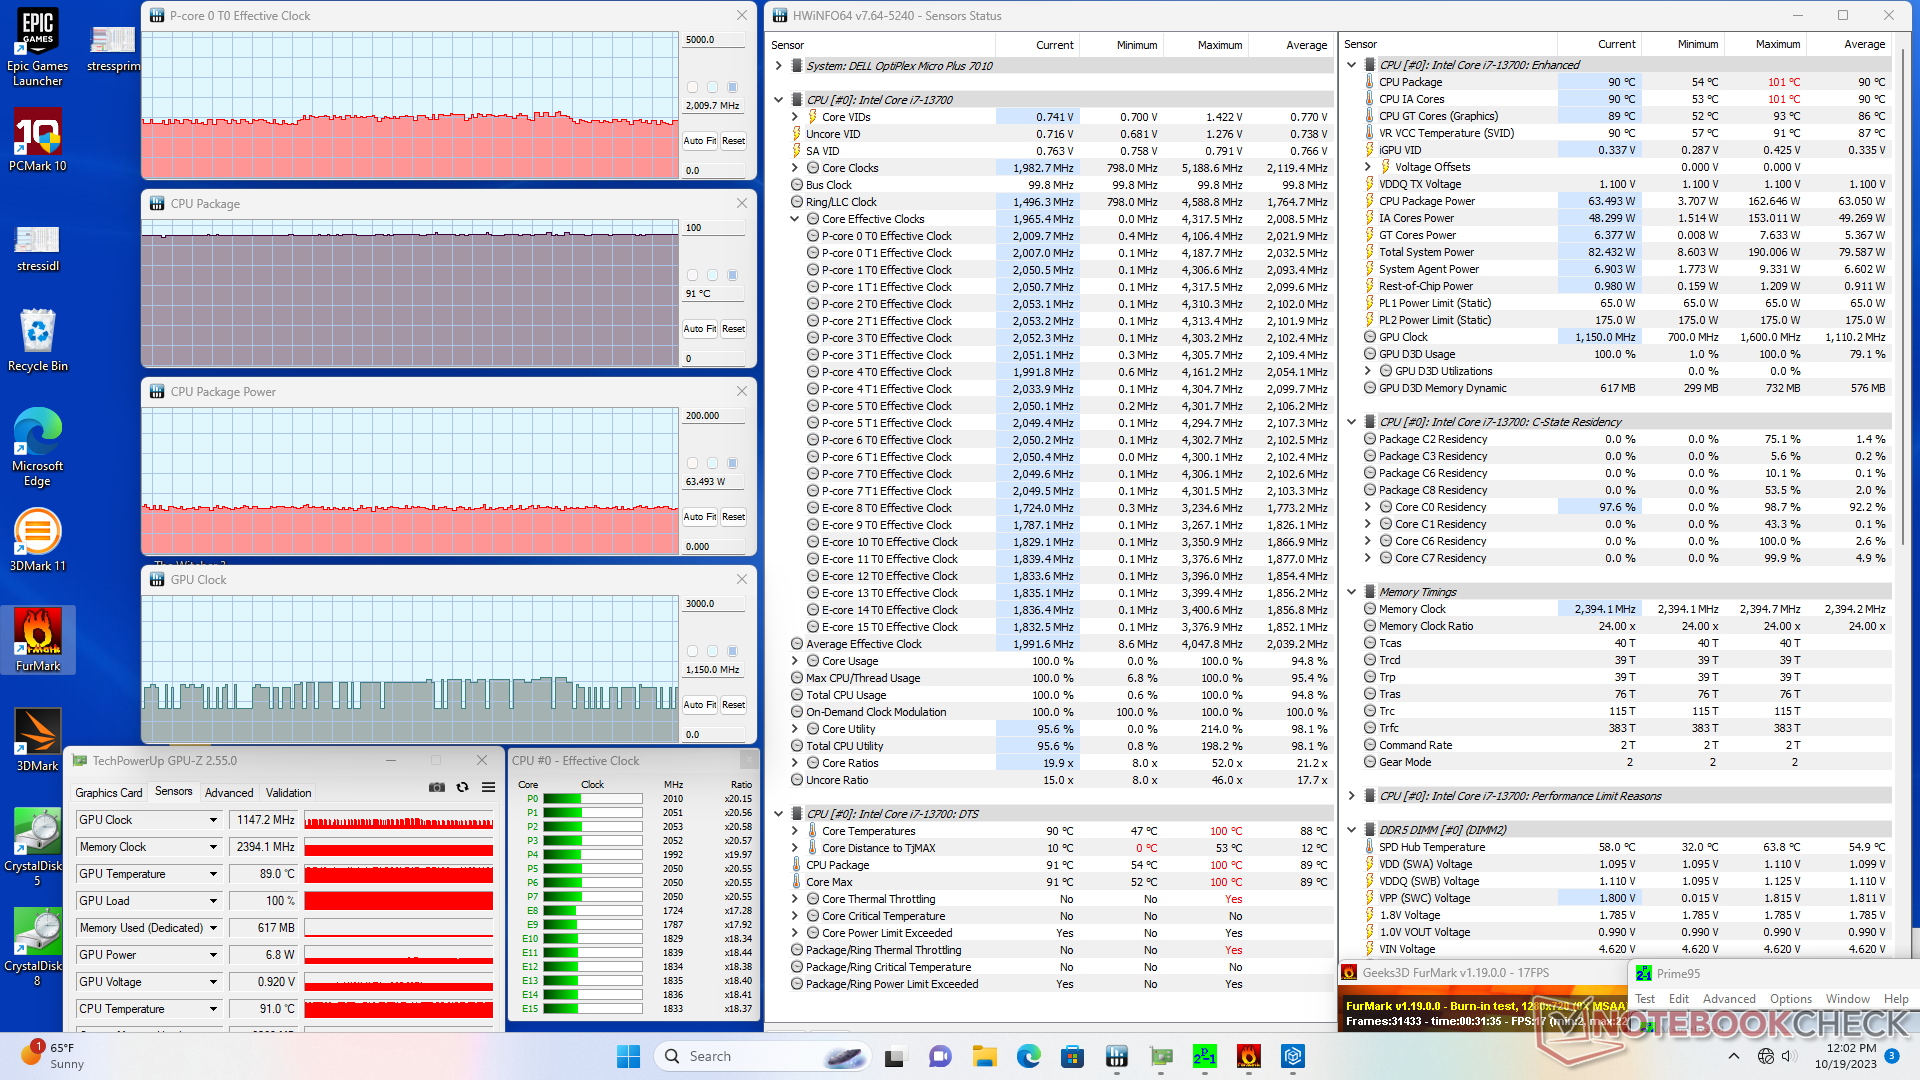
Stresstest
Kärntemperaturerna kan vara mycket höga, vilket korrelerar med de höga yttemperaturerna och strypningsbeteendet som nämnts ovan. När Prime95 kördes, till exempel, kunde processorn öka till 3,6 GHz, 155 W och nästan 100 C under bara en minut eller två som mest. Därefter stabiliserades processorn vid 2,7 GHz och 66 W för att bibehålla en något svalare kärntemperatur på 90 C. Upprepning av detta test påLenovo IdeaCentre Mini med den långsammare Core i7-13700H skulle resultera i en svalare kärntemperatur på 81 C istället.
Dessutom krävs det inte så mycket för att nå så höga kärntemperaturer. Kärntemperaturen skulle stabiliseras vid 94 C bara från att köra Witcher 3 för att representera höga belastningar jämfört med endast 68 C påBeelink GTR7.
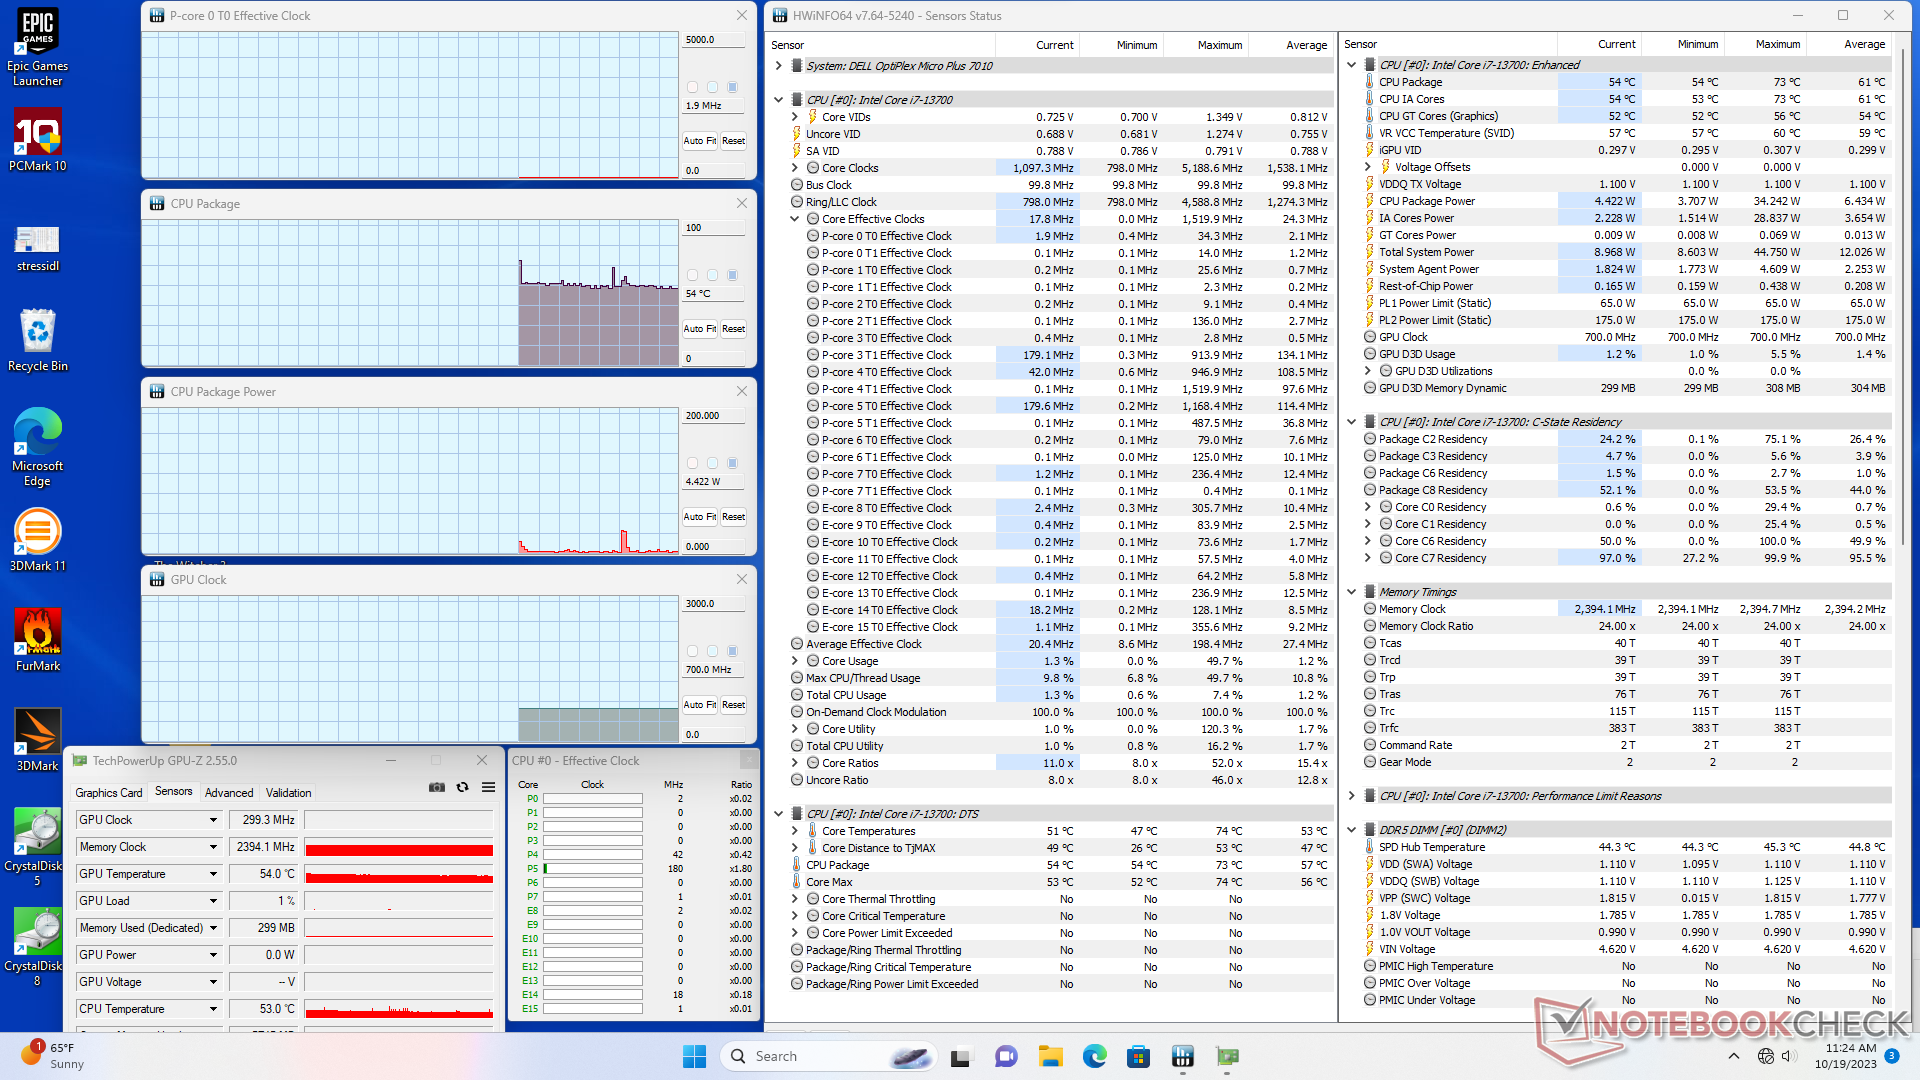
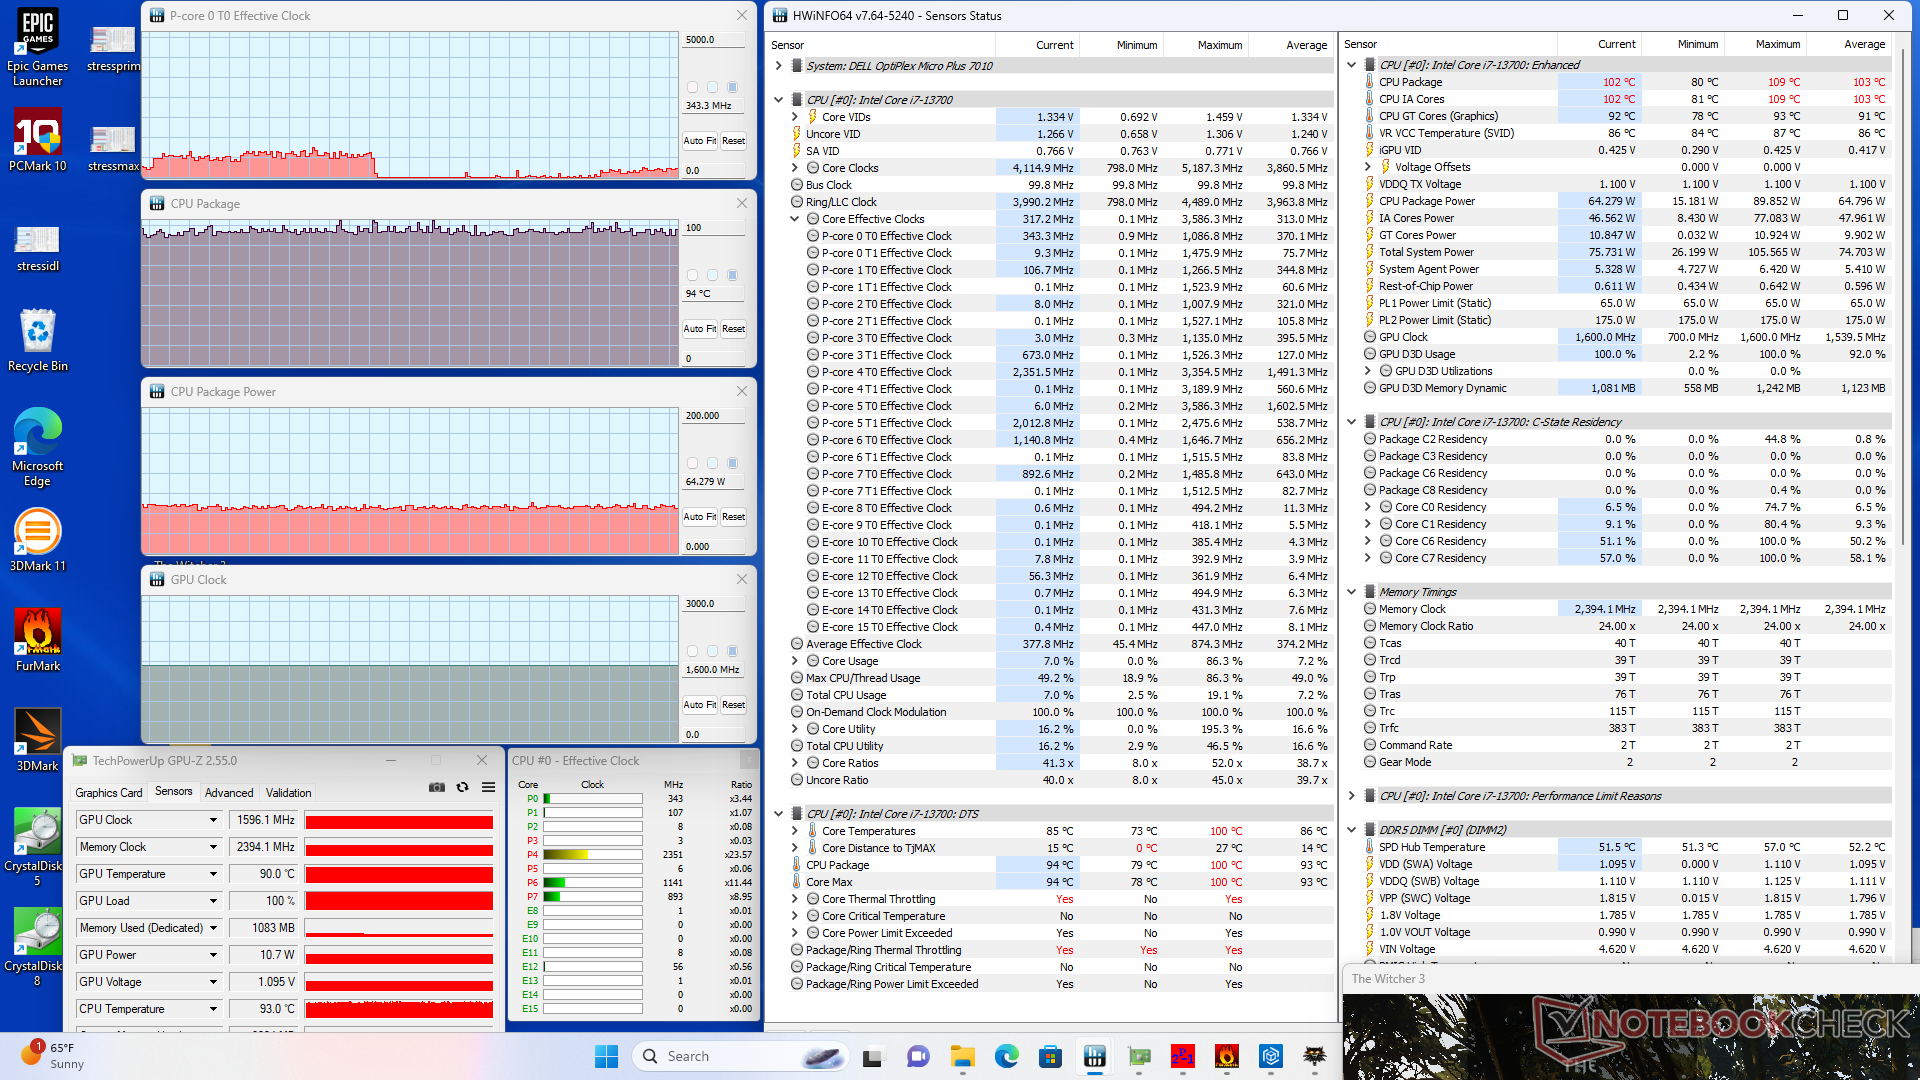
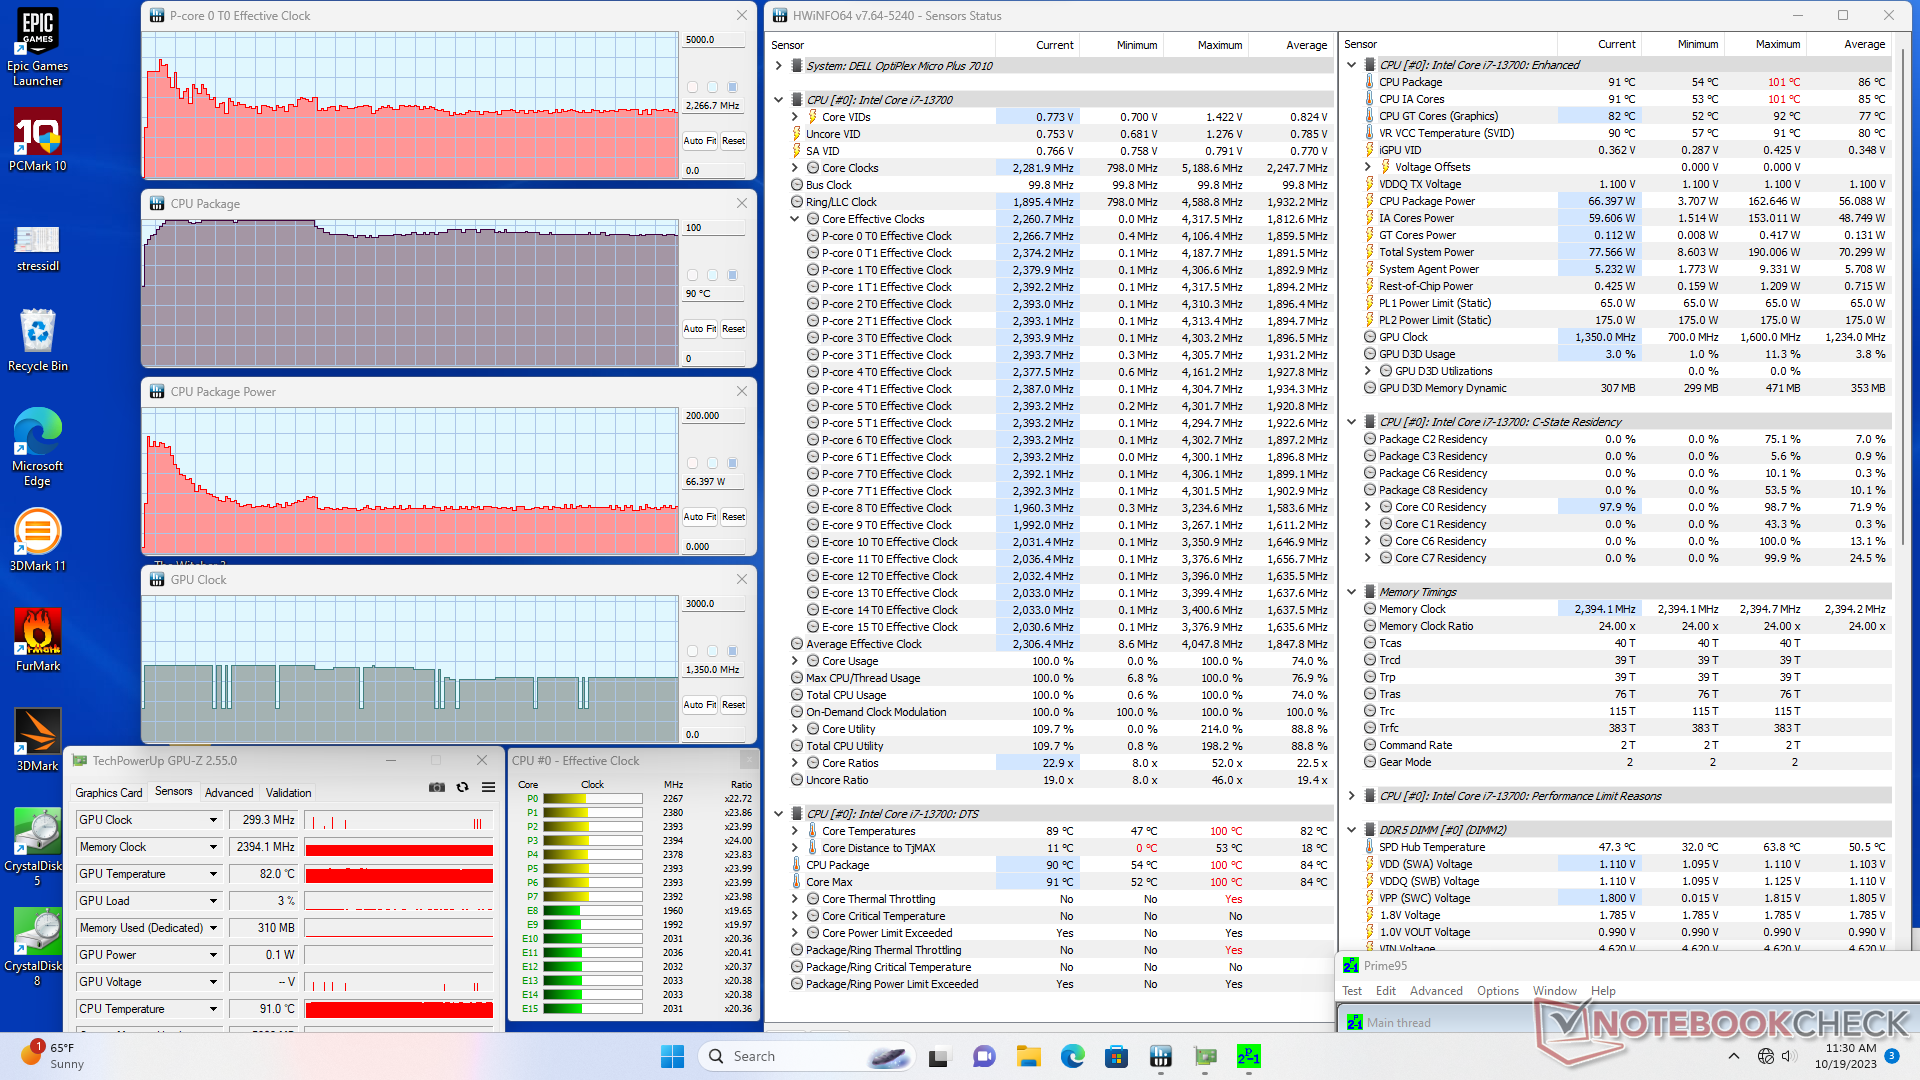
| CPU-klocka (GHz) | GPU-klocka (MHz) | Genomsnittlig CPU-temperatur (°C) | |
| System i viloläge | -- | -- | 54 |
| Prime95 Stress | 2.3 | -- | 90 |
| Prime95 + FurMark Stress | 2.0 | 700 - 1350 | 91 |
| Witcher 3 Stress | ~0,3 | 1596 | 94 |
Högtalare
Modellen integrerar monauralt ljud till skillnad från andra mini-PC där integrerade högtalare är ovanliga. Högtalaren är tillräckligt högljudd för små kontor men definitivt inte tillräckligt kraftfull för konferensrum.
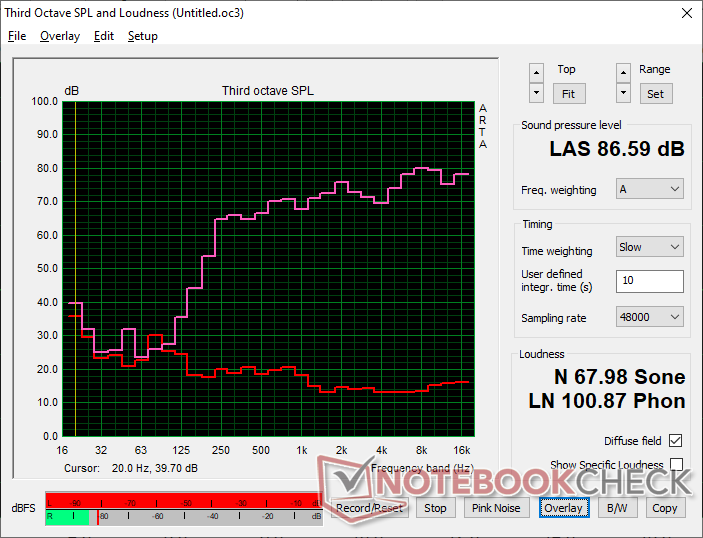
Dell OptiPlex Micro ljudanalys
(+) | högtalare kan spela relativt högt (86.6 dB)
Bas 100 - 315 Hz
(-) | nästan ingen bas - i genomsnitt 22% lägre än medianen
(±) | linjäriteten för basen är genomsnittlig (12.2% delta till föregående frekvens)
Mellan 400 - 2000 Hz
(+) | balanserad mellan - endast 2.6% från medianen
(+) | mids är linjära (4.1% delta till föregående frekvens)
Högsta 2 - 16 kHz
(+) | balanserade toppar - endast 4.7% från medianen
(+) | toppar är linjära (4.4% delta till föregående frekvens)
Totalt 100 - 16 000 Hz
(±) | linjäriteten för det totala ljudet är genomsnittlig (15.9% skillnad mot median)
Jämfört med samma klass
» 7% av alla testade enheter i den här klassen var bättre, 7% liknande, 86% sämre
» Den bästa hade ett delta på 13%, genomsnittet var 24%, sämst var 64%
Jämfört med alla testade enheter
» 25% av alla testade enheter var bättre, 5% liknande, 70% sämre
» Den bästa hade ett delta på 4%, genomsnittet var 24%, sämst var 134%
Apple MacBook Pro 16 2021 M1 Pro ljudanalys
(+) | högtalare kan spela relativt högt (84.7 dB)
Bas 100 - 315 Hz
(+) | bra bas - bara 3.8% från medianen
(+) | basen är linjär (5.2% delta till föregående frekvens)
Mellan 400 - 2000 Hz
(+) | balanserad mellan - endast 1.3% från medianen
(+) | mids är linjära (2.1% delta till föregående frekvens)
Högsta 2 - 16 kHz
(+) | balanserade toppar - endast 1.9% från medianen
(+) | toppar är linjära (2.7% delta till föregående frekvens)
Totalt 100 - 16 000 Hz
(+) | det totala ljudet är linjärt (4.6% skillnad mot median)
Jämfört med samma klass
» 0% av alla testade enheter i den här klassen var bättre, 0% liknande, 100% sämre
» Den bästa hade ett delta på 5%, genomsnittet var 17%, sämst var 45%
Jämfört med alla testade enheter
» 0% av alla testade enheter var bättre, 0% liknande, 100% sämre
» Den bästa hade ett delta på 4%, genomsnittet var 24%, sämst var 134%
Energiförvaltning
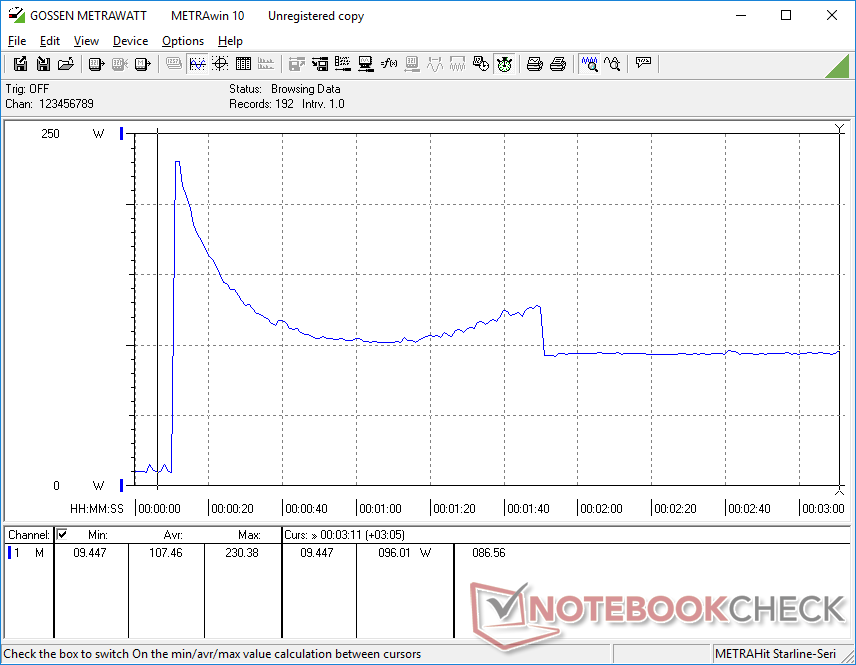
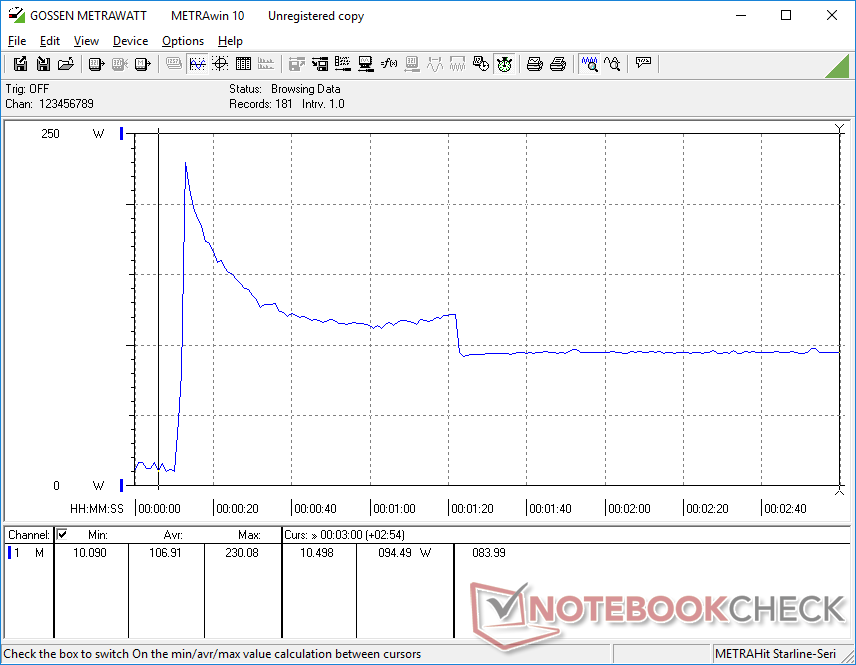
Effektförbrukning - krävande liten maskin
Strömförbrukningen kan vara ganska hög, vilket kanske inte är oväntat med tanke på den stationära processorn. Den höga Turbo Boost-potentialen hos Core i7-13700 kan leda till att systemet drar så mycket som 190 W till 230 W när applikationer startas eller CPU-intensiva uppgifter körs, vilket framgår av graferna nedan. Den låga Turbo Boost-hållbarheten hos minidatorn innebär dock att sådan extrem strömförbrukning endast är tillfällig.
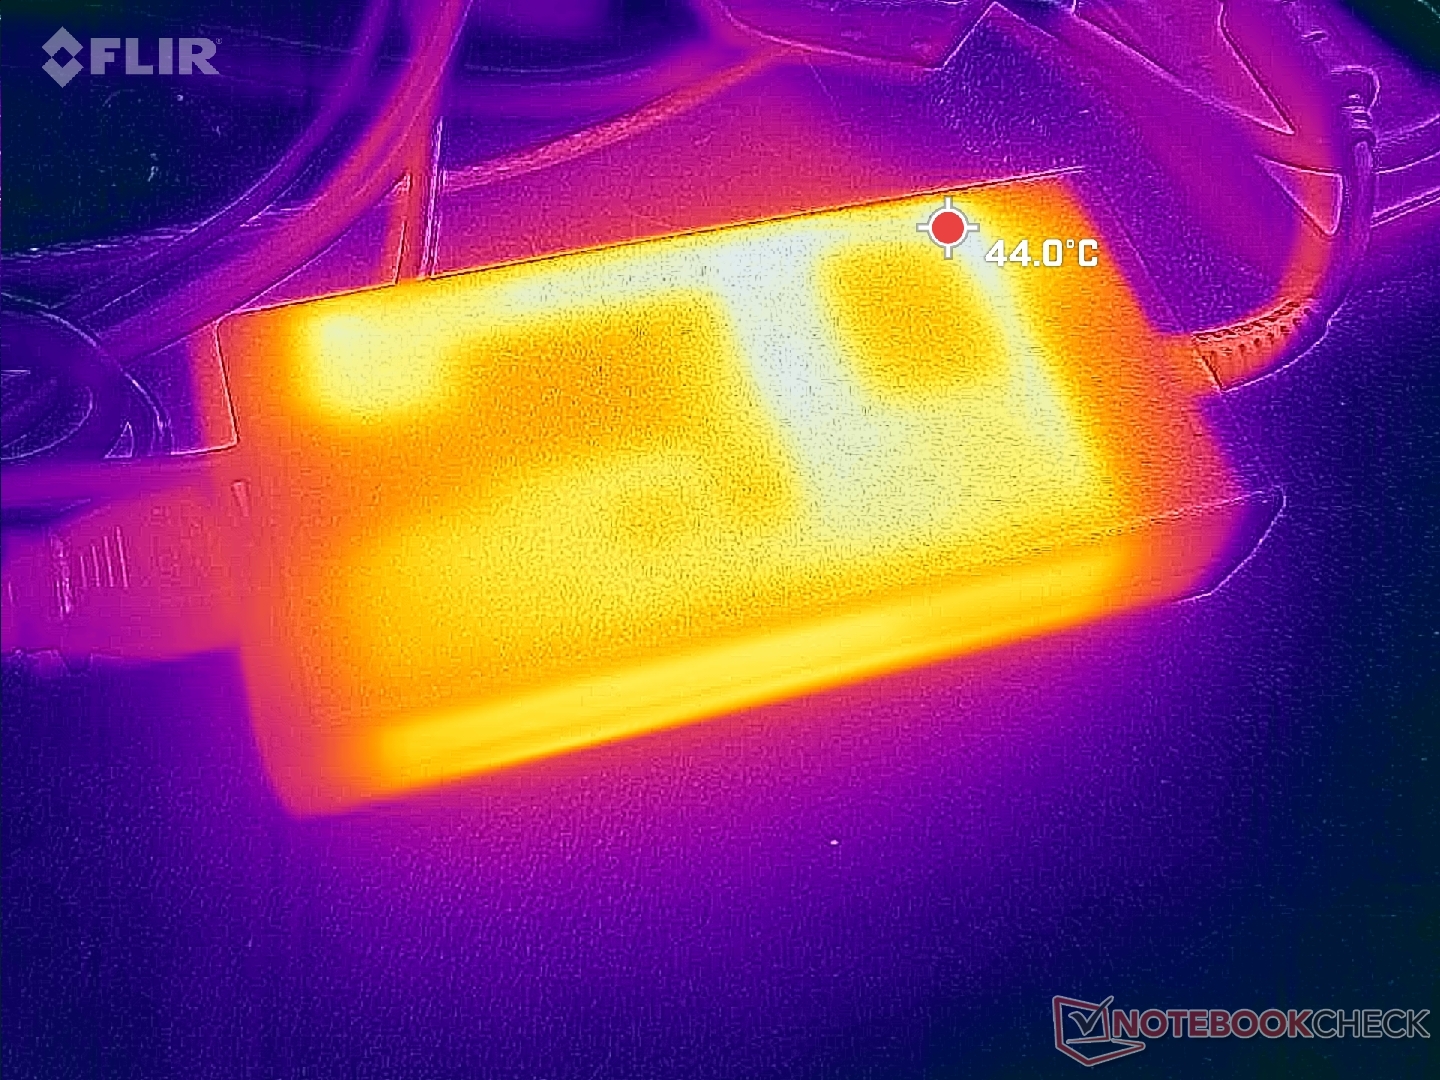
USB-C Power Delivery stöds inte och därför måste den medföljande 180 W power brick (~15,4 x 7,5 x 3,2 cm) vara ansluten hela tiden för att systemet ska kunna köras. Som jämförelse kan nämnas vissa mini-datorer som Beelink SER7 kan köras uteslutande på USB-C AC-adaptrar från tredje part medan andra som Lenovo IdeaCentre Mini inte har någon extern strömkälla alls.
| Av/Standby | |
| Låg belastning | |
| Hög belastning |
|
Förklaring:
min: | |
| Dell OptiPlex Micro i7-13700, UHD Graphics 770, , , x, | Apple Mac Mini M2 M2, M2 10-Core GPU, Apple SSD AP0512Z, , x, | Lenovo IdeaCentre Mini 01IRH8 i7-13700H, Iris Xe G7 96EUs, Samsung PM9B1 512GB MZVL4512HBLU, , x, | GMK NucBox K3 Pro i7-12650H, UHD Graphics 64EUs, Lexar NM610 Pro NM610P001T-HNNNG, , x, | Beelink GTR7 7840HS R7 7840HS, Radeon 780M, Crucial P3 Plus CT1000P3PSSD8, , x, | Beelink SER7 R7 7840HS, Radeon 780M, Crucial P3 Plus CT1000P3PSSD8, , x, | |
|---|---|---|---|---|---|---|
| Power Consumption | 62% | 4% | -18% | 5% | -8% | |
| Idle Minimum * (Watt) | 3.7 | 2.2 41% | 6.7 -81% | 7.1 -92% | 5.5 -49% | 6.7 -81% |
| Idle Average * (Watt) | 7.2 | 6.7 7% | 10.1 -40% | 5.8 19% | 7.3 -1% | |
| Idle Maximum * (Watt) | 8.7 | 2.6 70% | 7.1 18% | 18.6 -114% | 7.7 11% | 11.6 -33% |
| Load Average * (Watt) | 69.5 | 28.7 59% | 68.5 1% | 45.3 35% | 70.6 -2% | 64.1 8% |
| Witcher 3 ultra * (Watt) | 77.1 | 58.3 24% | 55.2 28% | 79.8 -4% | 75.8 2% | |
| Load Maximum * (Watt) | 230.6 | 51.5 78% | 104.3 55% | 52.9 77% | 111.8 52% | 94.8 59% |
* ... mindre är bättre
Power Consumption Witcher 3 / Stresstest
Power Consumption external Monitor
För
Emot
Omdöme - Stor CPU för en mikroformfaktor
OptiPlex Micro har bland annat en löstagbar CPU, verktygslös service, hög processorprestanda per volym och fyra individuella videoutgångar. Användare som multitaskar mellan två eller flera bildskärmar för grafer, kalkylblad och ordbehandling kommer att finna OptiPlex Micro vara ett pålitligt "set and forget"-alternativ.
Att köra en fullfjädrad Core i7-processor avsedd för stationära datorer i ett mini-PC-format har sina nackdelar. Särskilt Turbo Boost-potentialen är lägre, vilket innebär att genomsnittsprestandan är betydligt långsammare än i ett större OptiPlex-system utrustat med samma processor. För det andra är kärntemperaturen mycket hög, över 90 C, vilket visserligen är tekniskt säkert men inte idealiskt, särskilt inte när de flesta andra mini-PC körs svalare. Och slutligen är den föråldrade integrerade GPU:n otillräcklig för de flesta moderna 3D-renderingar och detta blir ännu värre av avsaknaden av USB4- eller Thunderbolt eGPU-stöd. Vi rekommenderar minidatorer med Iris Xe- eller Radeon 680M/780M-grafik om din arbetsbelastning innebär lite grafikredigering.
Mini PC-användare som värdesätter rå CPU-prestanda kommer att tycka att OptiPlex Micro är värdefull. Annars är alternativ som Intel NUC 13 Pro eller Beelink GTR7 bättre balanserade när det gäller CPU- och GPU-prestanda.
SSD-strypningen är också olycklig att se. Dedikerade SSD-värmespridare skulle sannolikt ha löst problemet, men detta skulle ha ökat vikten och priset.
Pris och tillgänglighet
Dell levererar för närvarande OptiPlex Micro Plus 7010 från $929 USD, men endast konfigurationer med de långsammare Core T-seriens processorer är tillgängliga i skrivande stund.
Dell OptiPlex Micro
- 10/24/2023 v7 (old)
Allen Ngo
Genomskinlighet
Valet av enheter som ska granskas görs av vår redaktion. Testprovet gavs till författaren som ett lån av tillverkaren eller återförsäljaren för denna recension. Långivaren hade inget inflytande på denna recension och inte heller fick tillverkaren en kopia av denna recension innan publiceringen. Det fanns ingen skyldighet att publicera denna recension. Som ett oberoende medieföretag är Notebookcheck inte föremål för auktoritet från tillverkare, återförsäljare eller förlag.
This is how Notebookcheck is testingEvery year, Notebookcheck independently reviews hundreds of laptops and smartphones using standardized procedures to ensure that all results are comparable. We have continuously developed our test methods for around 20 years and set industry standards in the process. In our test labs, high-quality measuring equipment is utilized by experienced technicians and editors. These tests involve a multi-stage validation process. Our complex rating system is based on hundreds of well-founded measurements and benchmarks, which maintains objectivity.
Price comparison

