Beelink SEi12 mini-dator recension: Överträffar Intel NUC 11

Beelink levererar ett stort antal minidatorer som är utformade för budget- och mellanklassmarknaden. Även om det ännu inte finns några modeller med dedikerade GPU:er, levereras många av dem med Windows 11, RAM och lagringsutrymme redan förinstallerade för att räcka till mediecenter, streamingboxar eller typiska vardagliga surf- eller kontorsuppgifter
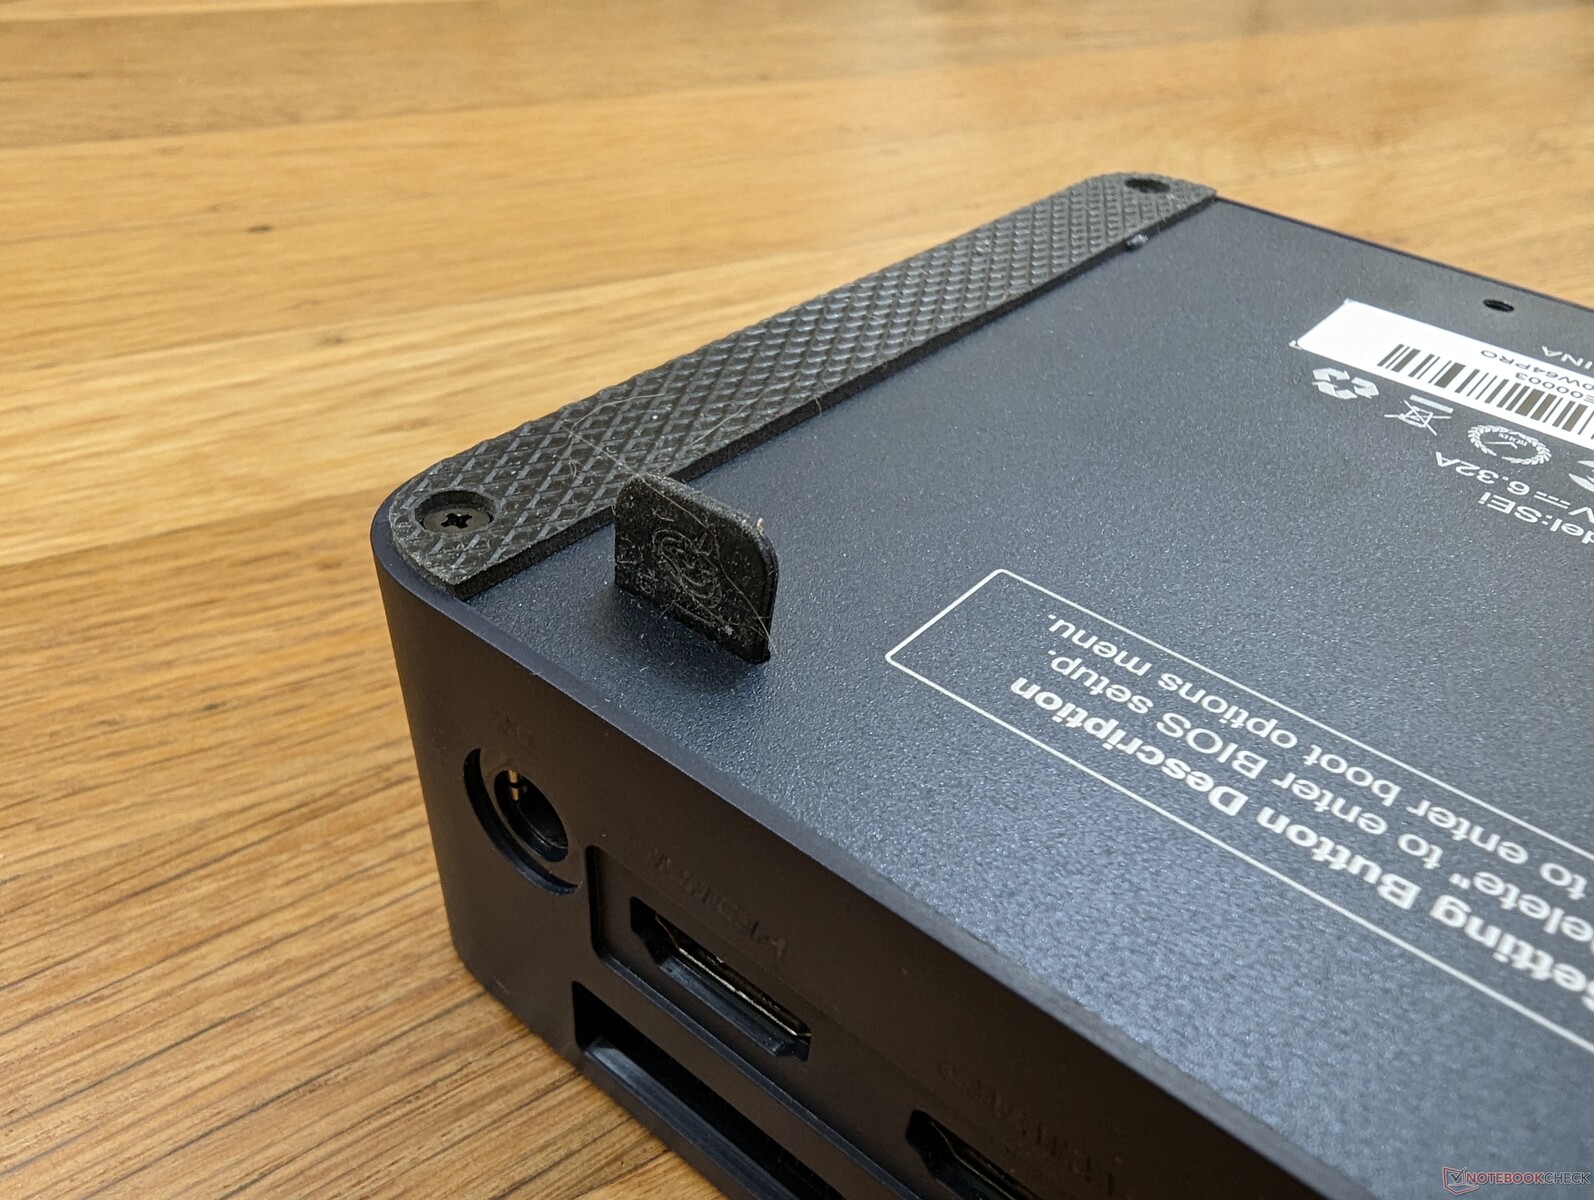
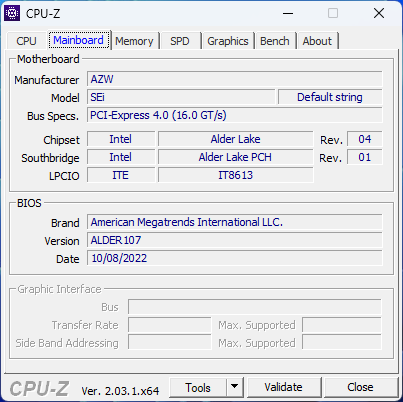
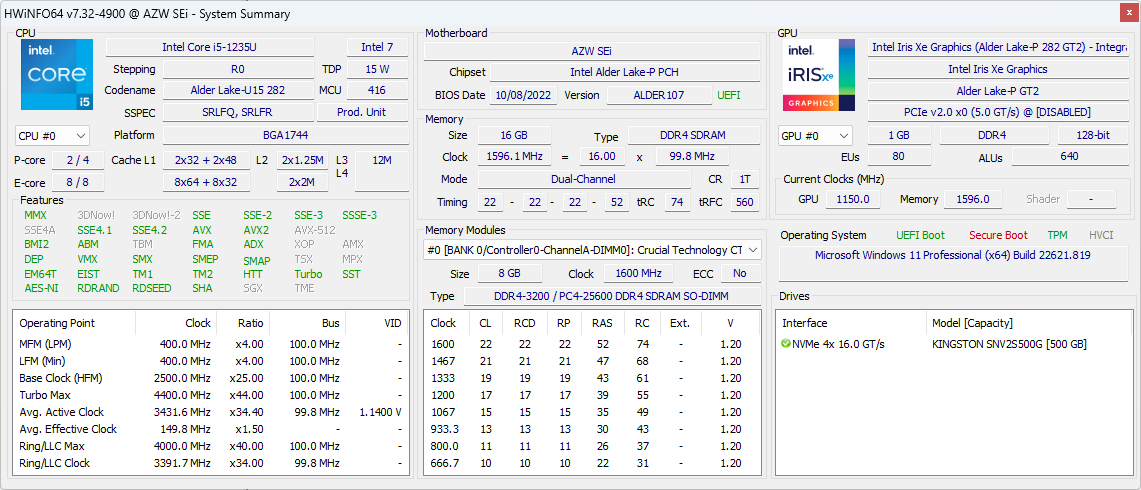
Den senaste minidatorn från Beelink är SEi12 som levereras med 12:e generationens Core i5-1235U medan de flesta andra billiga alternativ vanligtvis kommer med äldre eller långsammare CPU:er för att hålla kostnaderna låga. Vår recensionsenhet kan hittas online för endast 460 dollar
Konkurrenterna till SEi12 inkluderar de flesta andra minidatorer som drivs av CPU:er i U-serien, som t.ex Intel NUC-modeller, den BMAX B5 Proeller Ace Magician AMR5
Fler recensioner av Beelink:
Potentiella konkurrenter i jämförelse
Gradering | Datum | Modell | Vikt | Höjd | Storlek | Upplösning | Pris |
|---|---|---|---|---|---|---|---|
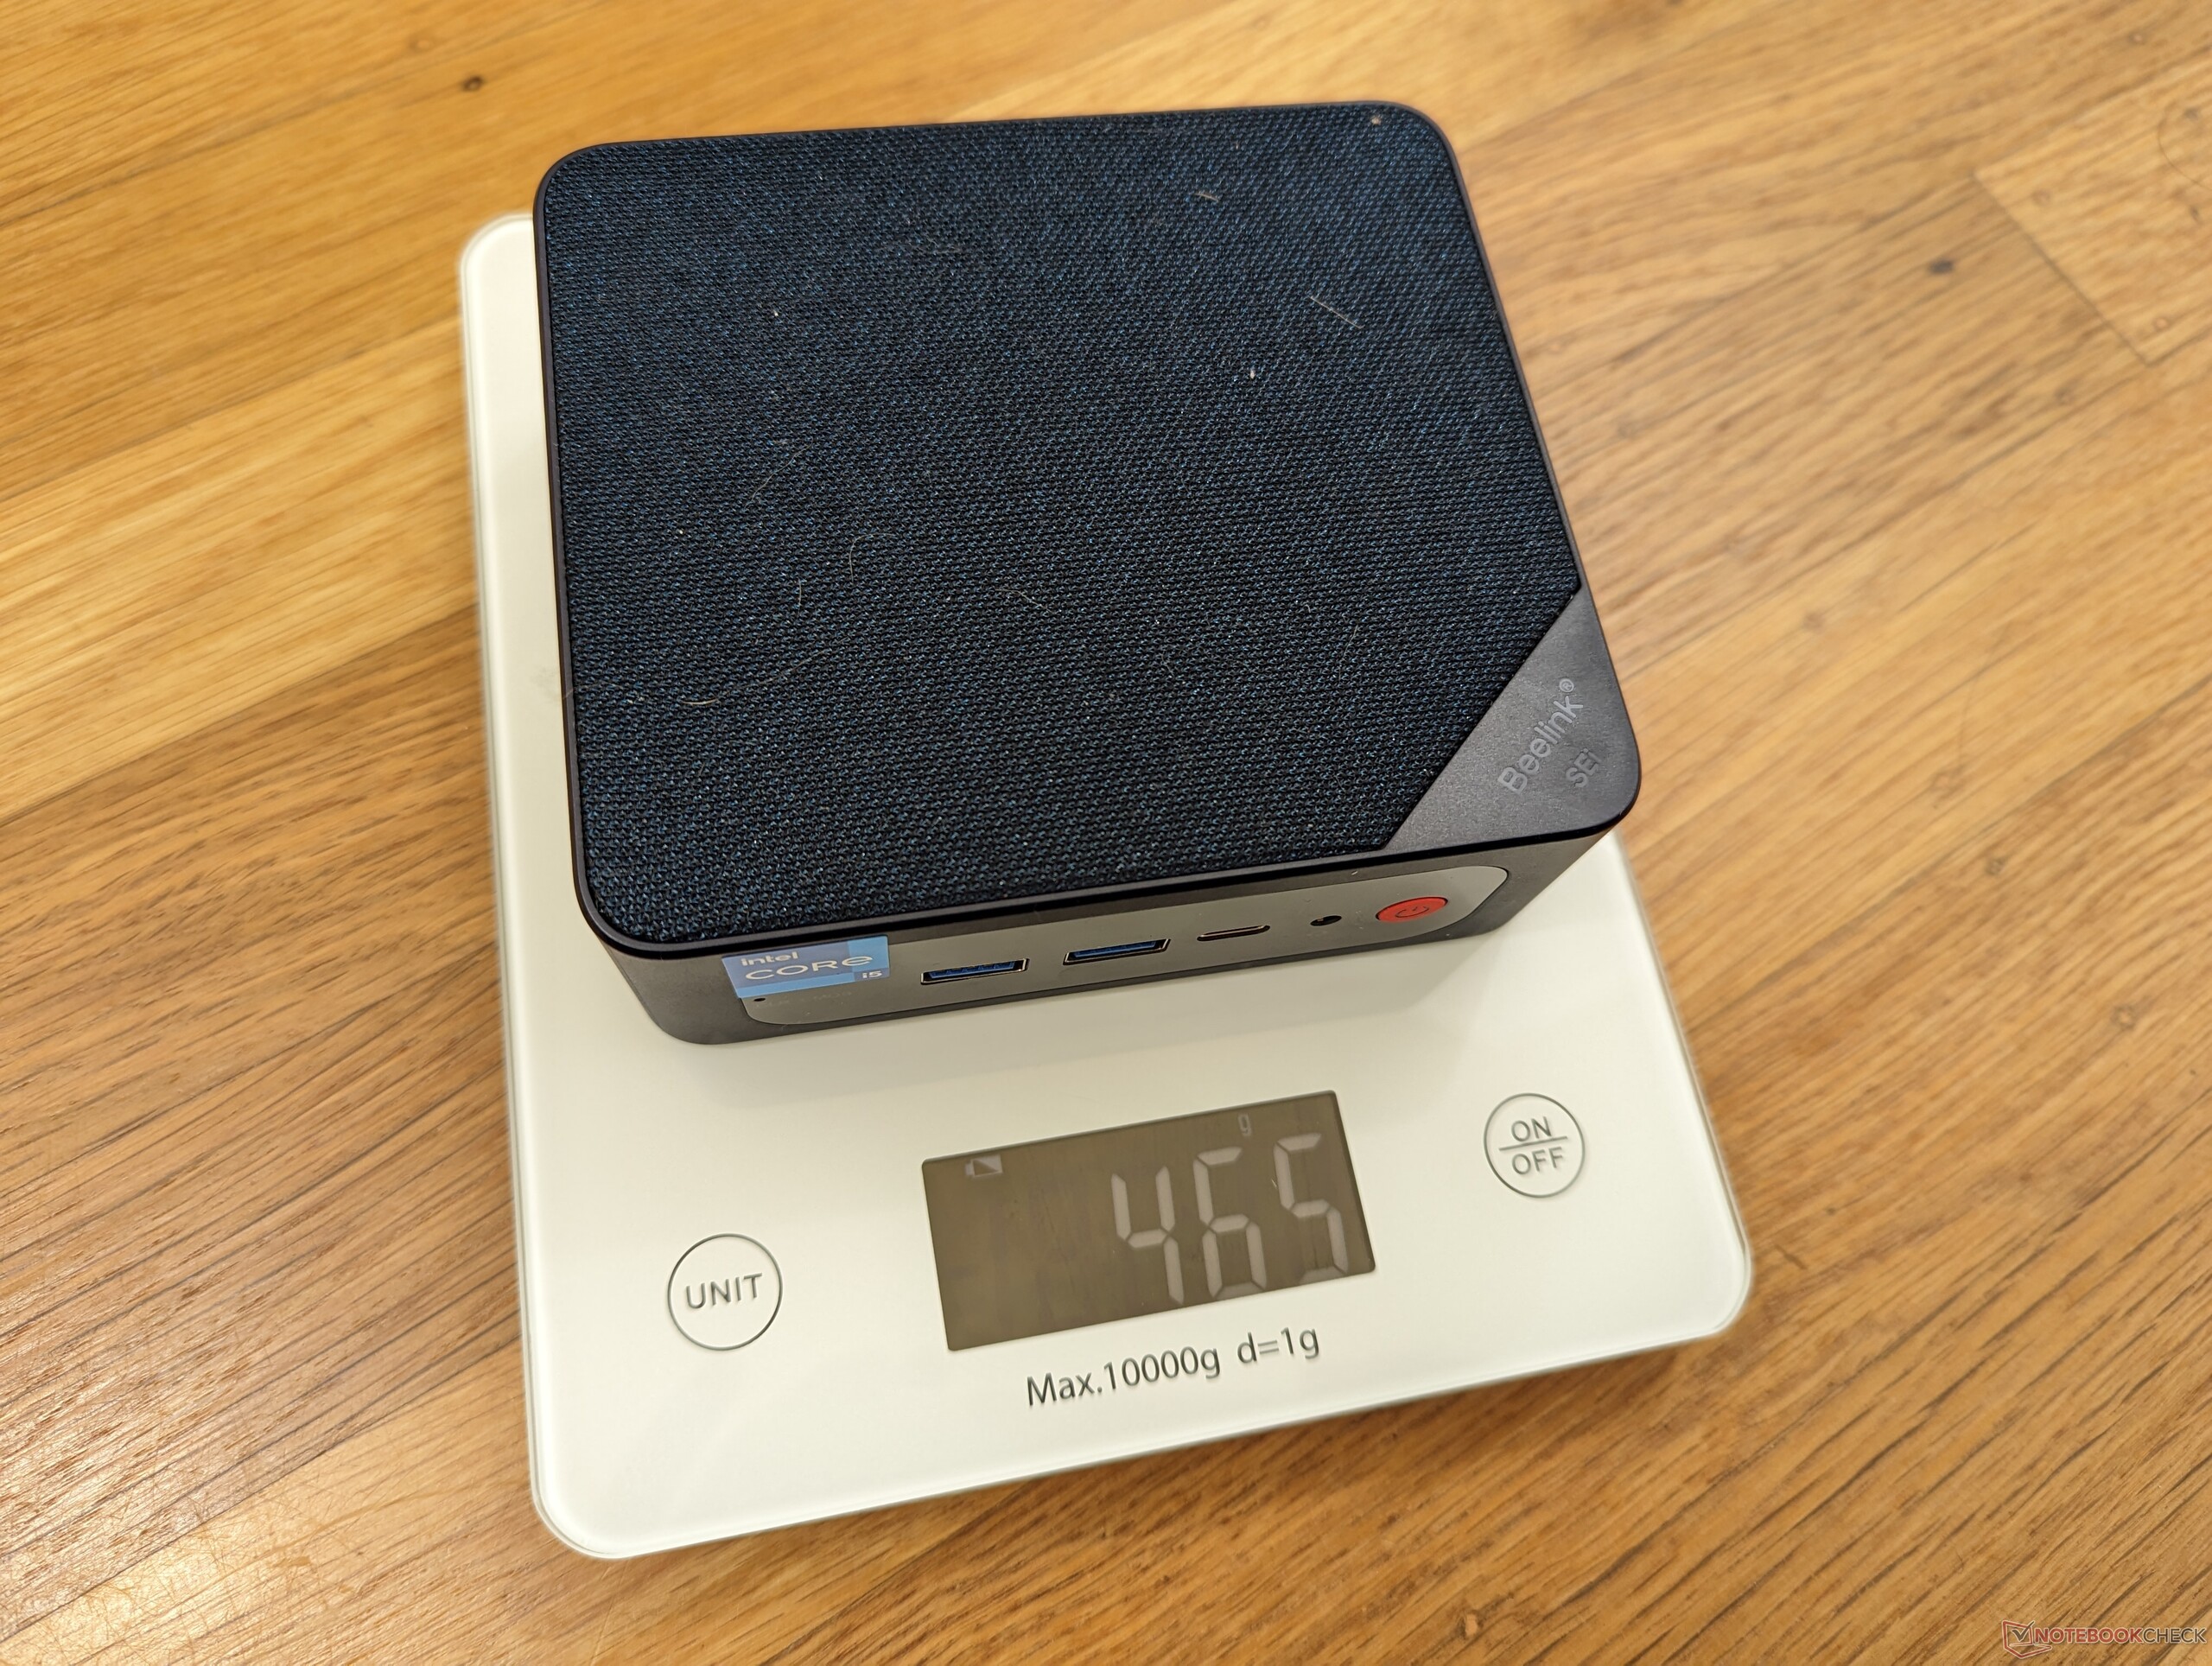
v (old) | 12/2022 | Beelink SEi12 Core i5-1235U i5-1235U, Iris Xe G7 80EUs | 465 g | 42 mm | x | ||
v (old) | 04/2022 | Beelink SEi8 i3-8109U, Iris Plus Graphics 655 | 346 g | 41 mm | x | ||
v (old) | 04/2022 | Beelink SER4 R7 4800U, Vega 8 | 494 g | 40 mm | x | ||
v (old) | Intel NUC11PAQi7 i7-1165G7, Iris Xe G7 96EUs | 647 g | 56 mm | x | |||
v (old) | 11/2022 | BMAX B5 Pro G7H8 i5-8260U, UHD Graphics 620 | 369 g | 43.2 mm | x | ||
v (old) | 03/2018 | Intel Hades Canyon NUC8i7HVK i7-8809G, Vega M GH | 1.3 kg | 39 mm | x |
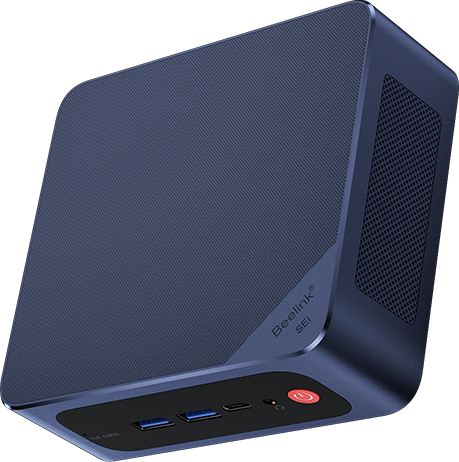
Fall
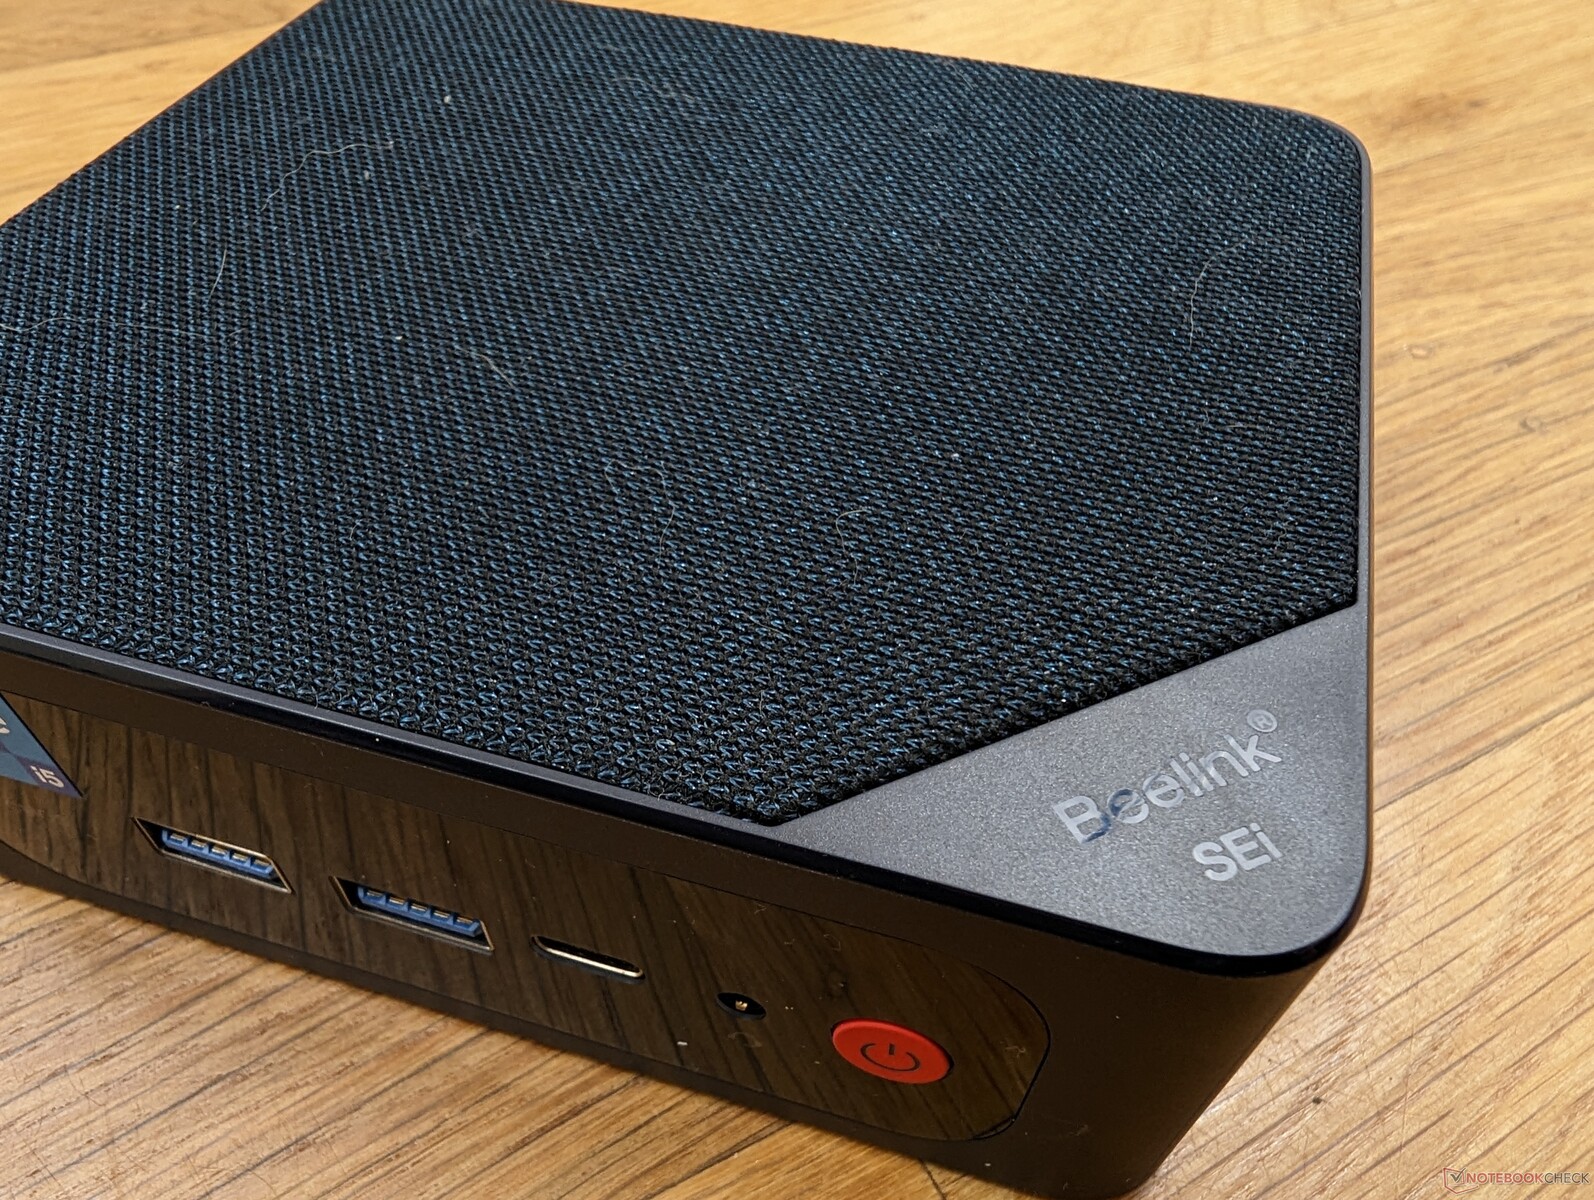
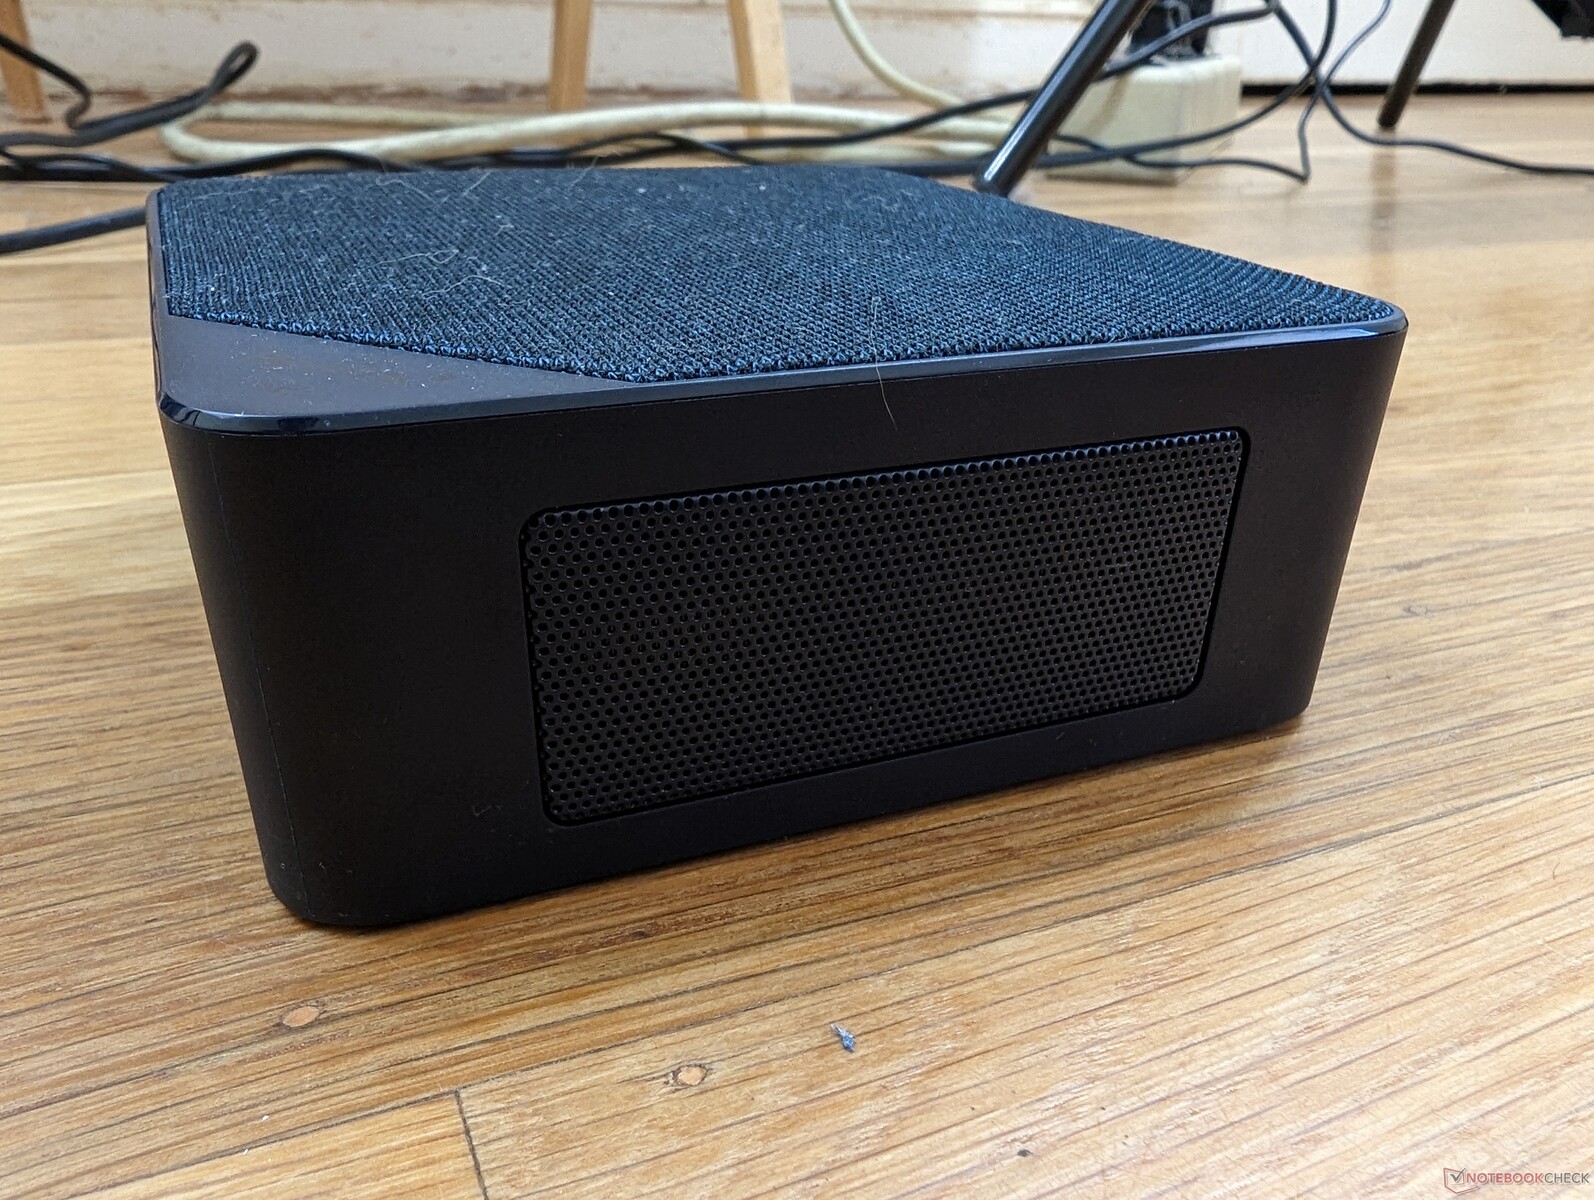
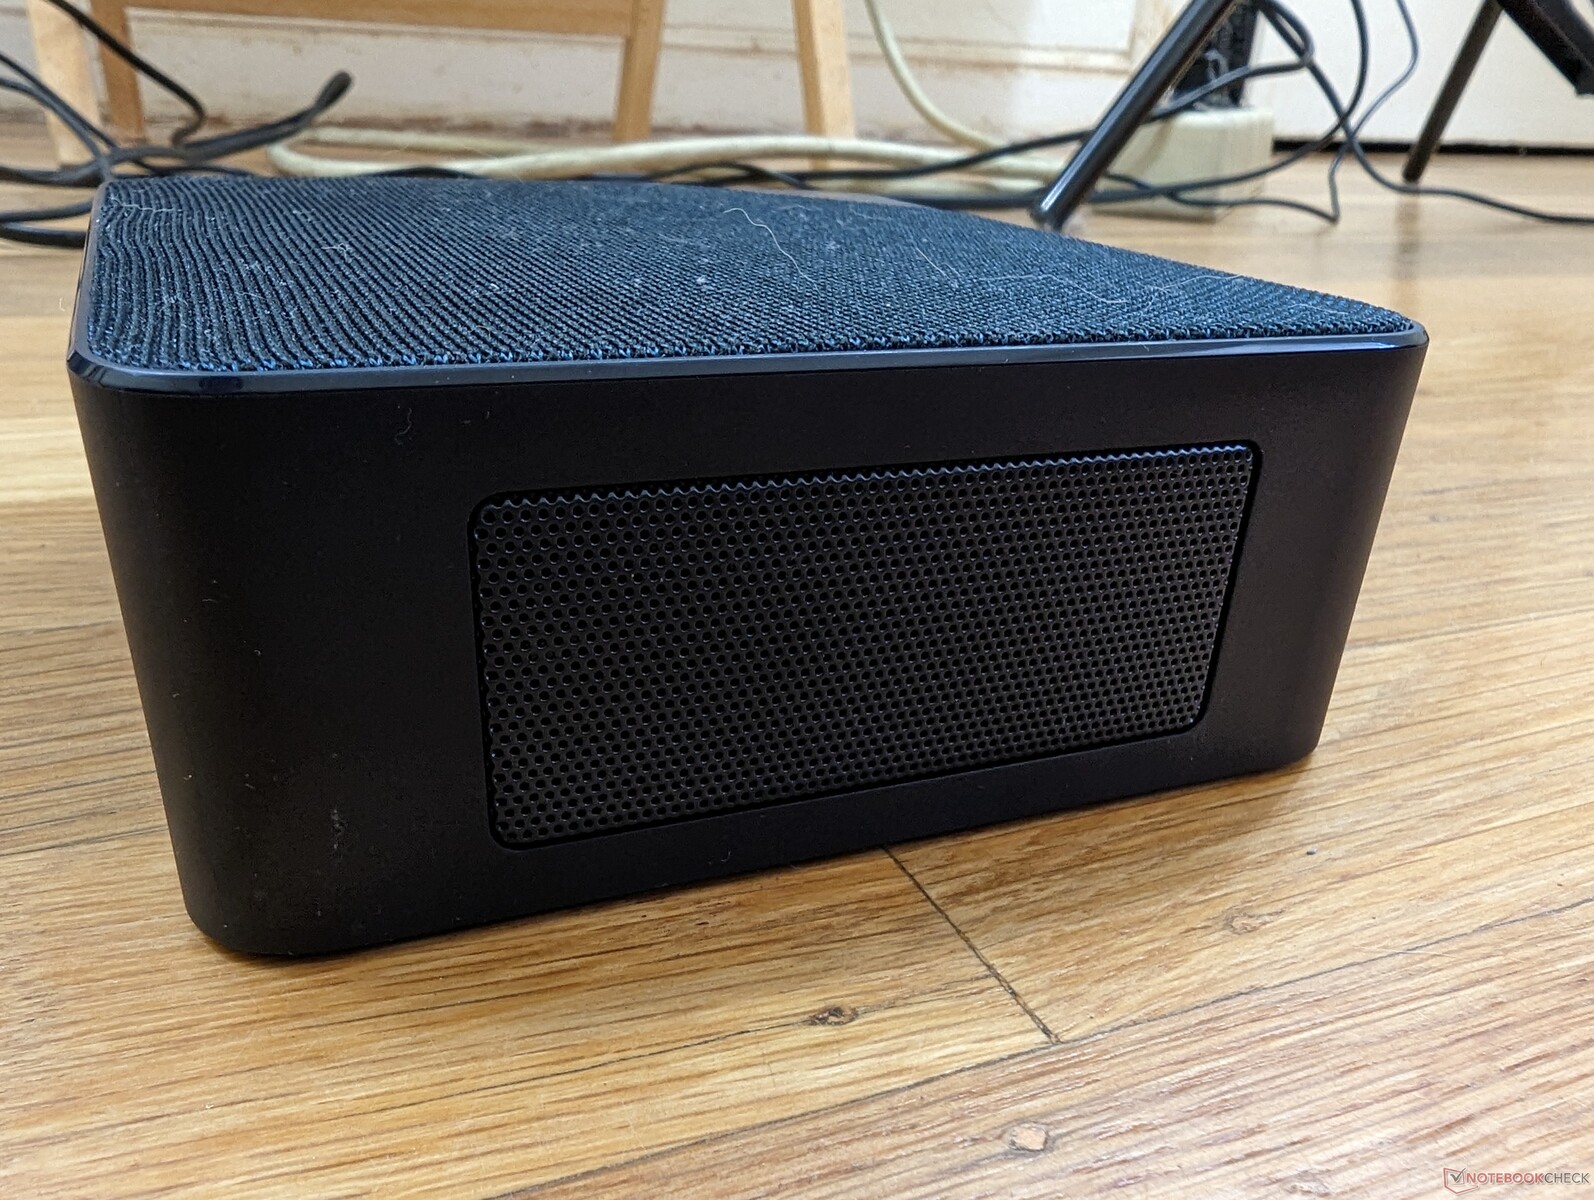
Chassit är bara något tjockare och tyngre än det äldre chassit SEi 11men har i övrigt liknande metallmaterial och fysiska egenskaper. Den mest anmärkningsvärda visuella aspekten av SEi12 är dess nya fleece- eller tygmaterial på ovansidan medan äldre Beelink-konstruktioner helt enkelt var slät plast eller ett perforerat plastnät. Tyget är mjukt vid beröring och ger en lyxig känsla, men det kan vara svårt att rengöra det eftersom hår och damm lättare fastnar på det.
Anslutning - Ingen Thunderbolt
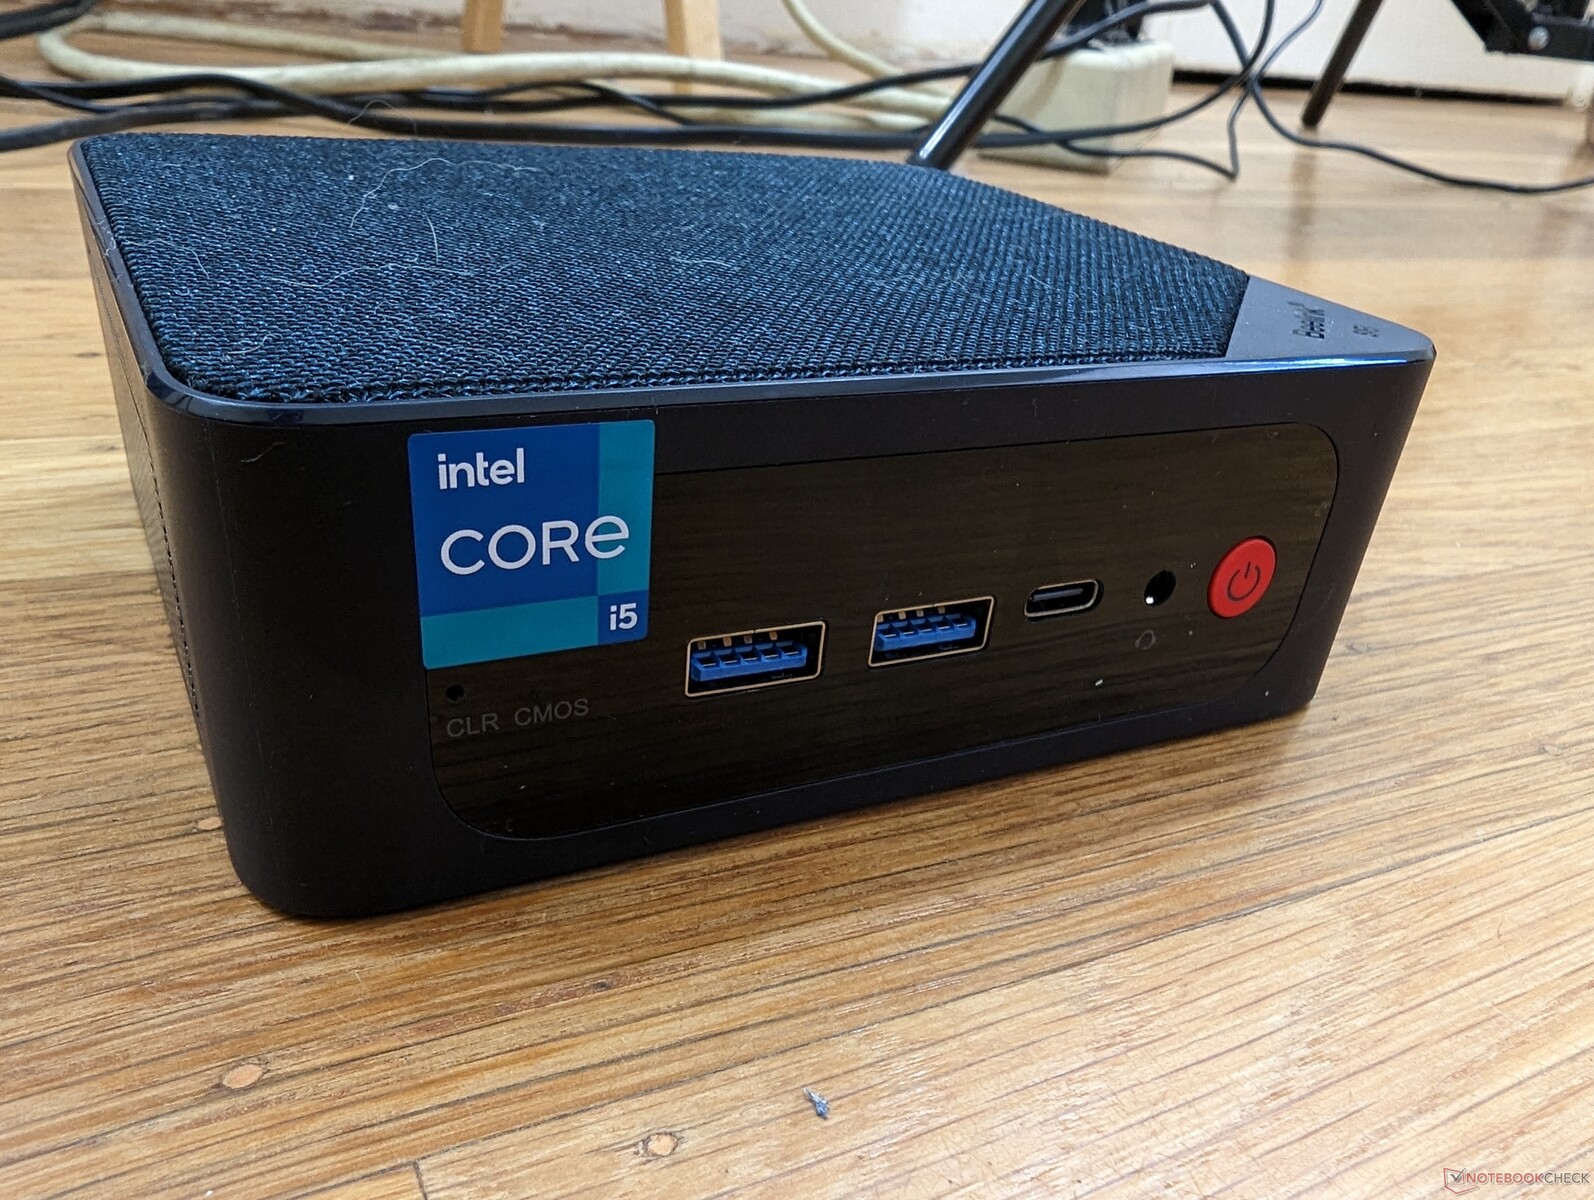
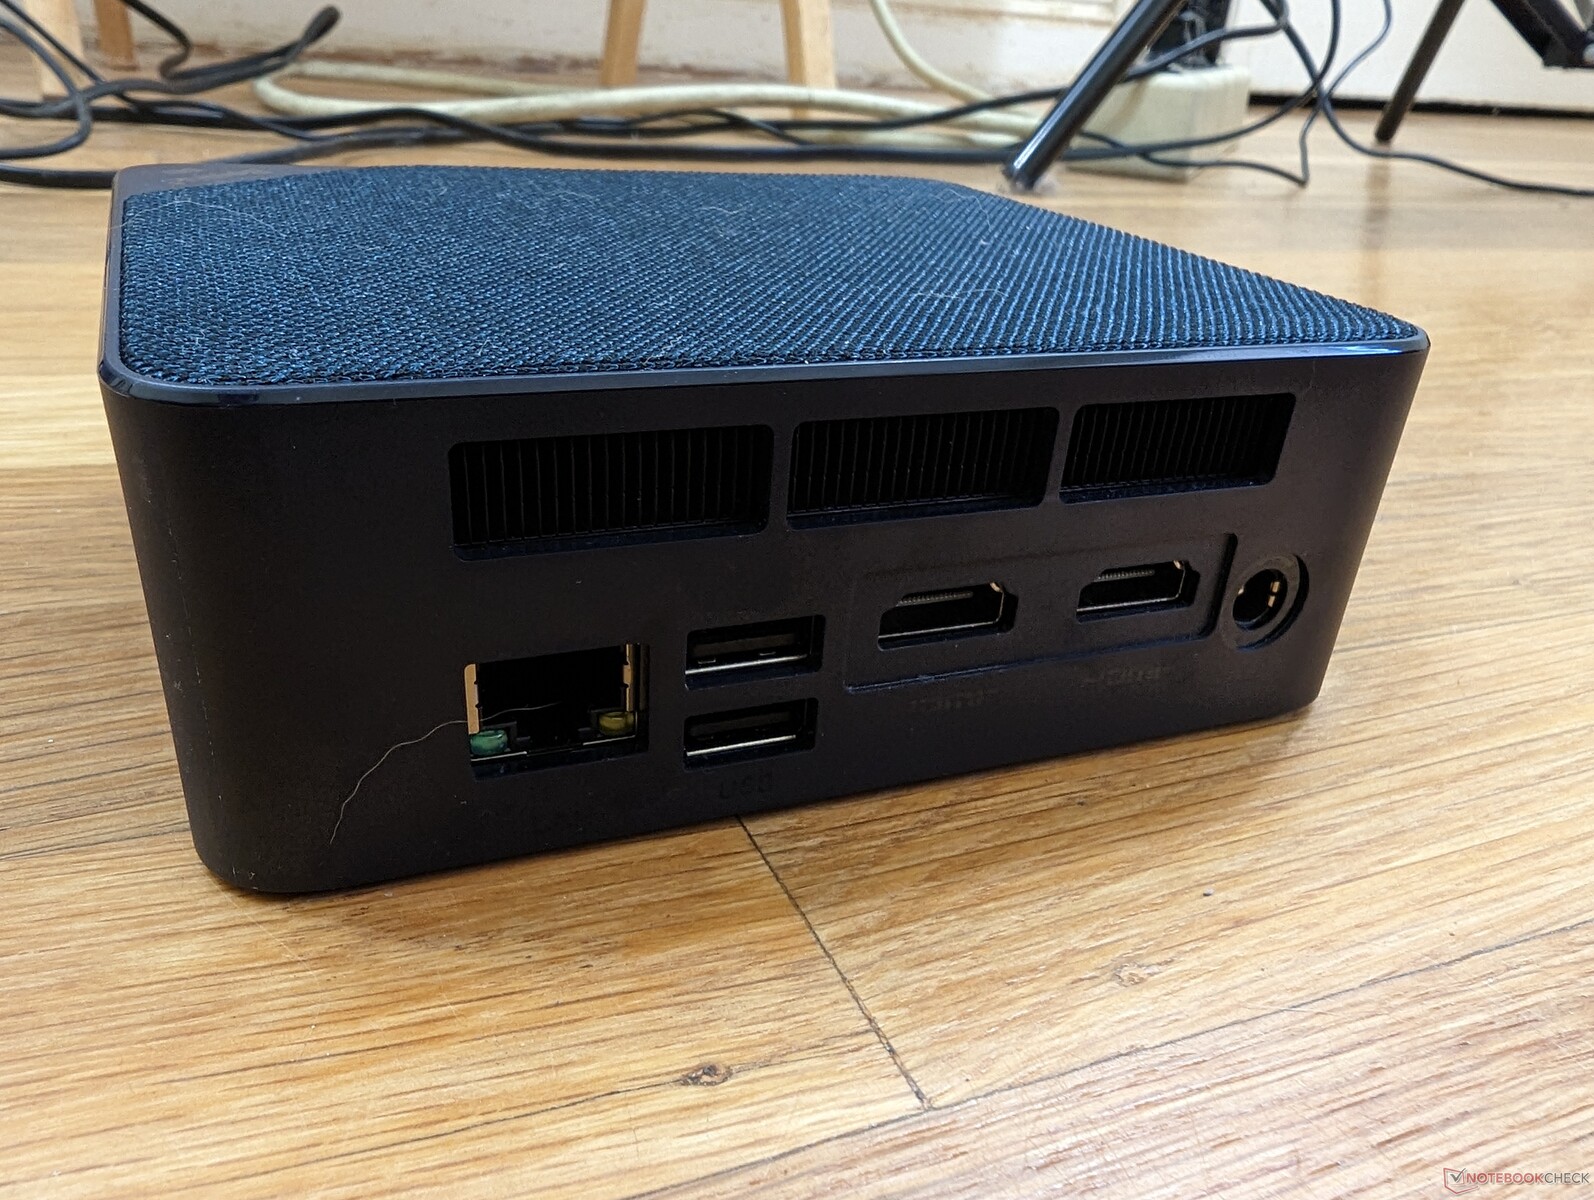
Portalternativen är utmärkta med fem USB-portar och två HDMI-portar att välja mellan. Vi kan dock inte skicka ut någon video från USB-C-porten, vilket innebär att DisplayPort-over-USB kanske inte stöds. Systemet kan inte heller strömförsörjas via USB-C.
Kommunikation
En Intel AX201 är standard för Wi-Fi 6 och Bluetooth 5.2. Det finns inga Wi-Fi 6E-alternativ för att hålla kostnaderna nere, men användarna kan installera en egen Wi-Fi 6E-modul om de vill. Överföringshastigheterna är ändå både snabba och stabila.
| Networking | |
| iperf3 transmit AX12 | |
| Beelink SER4 | |
| Intel NUC11PAQi7 | |
| Intel Hades Canyon NUC8i7HVK | |
| Beelink SEi8 | |
| iperf3 receive AX12 | |
| Beelink SER4 | |
| Intel NUC11PAQi7 | |
| Intel Hades Canyon NUC8i7HVK | |
| Beelink SEi8 | |
| iperf3 receive AXE11000 | |
| Beelink SEi12 Core i5-1235U | |
| BMAX B5 Pro G7H8 | |
| iperf3 transmit AXE11000 | |
| Beelink SEi12 Core i5-1235U | |
| BMAX B5 Pro G7H8 | |
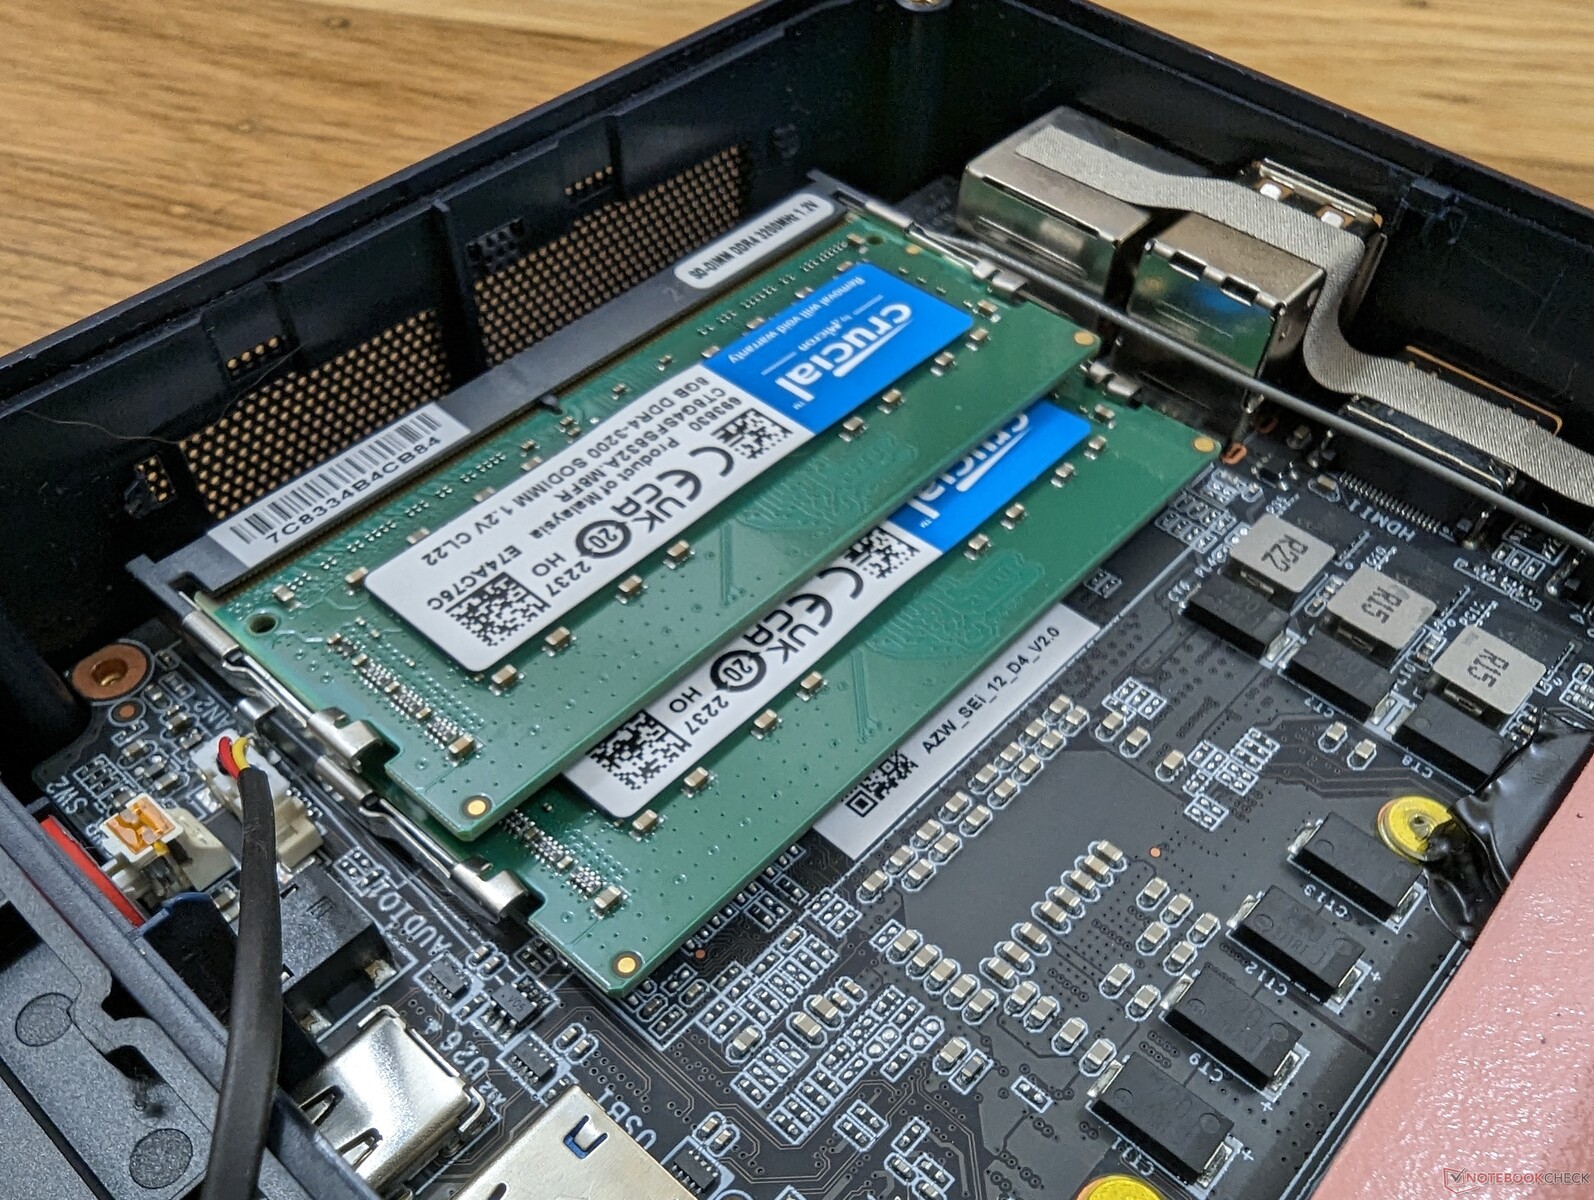
Underhåll
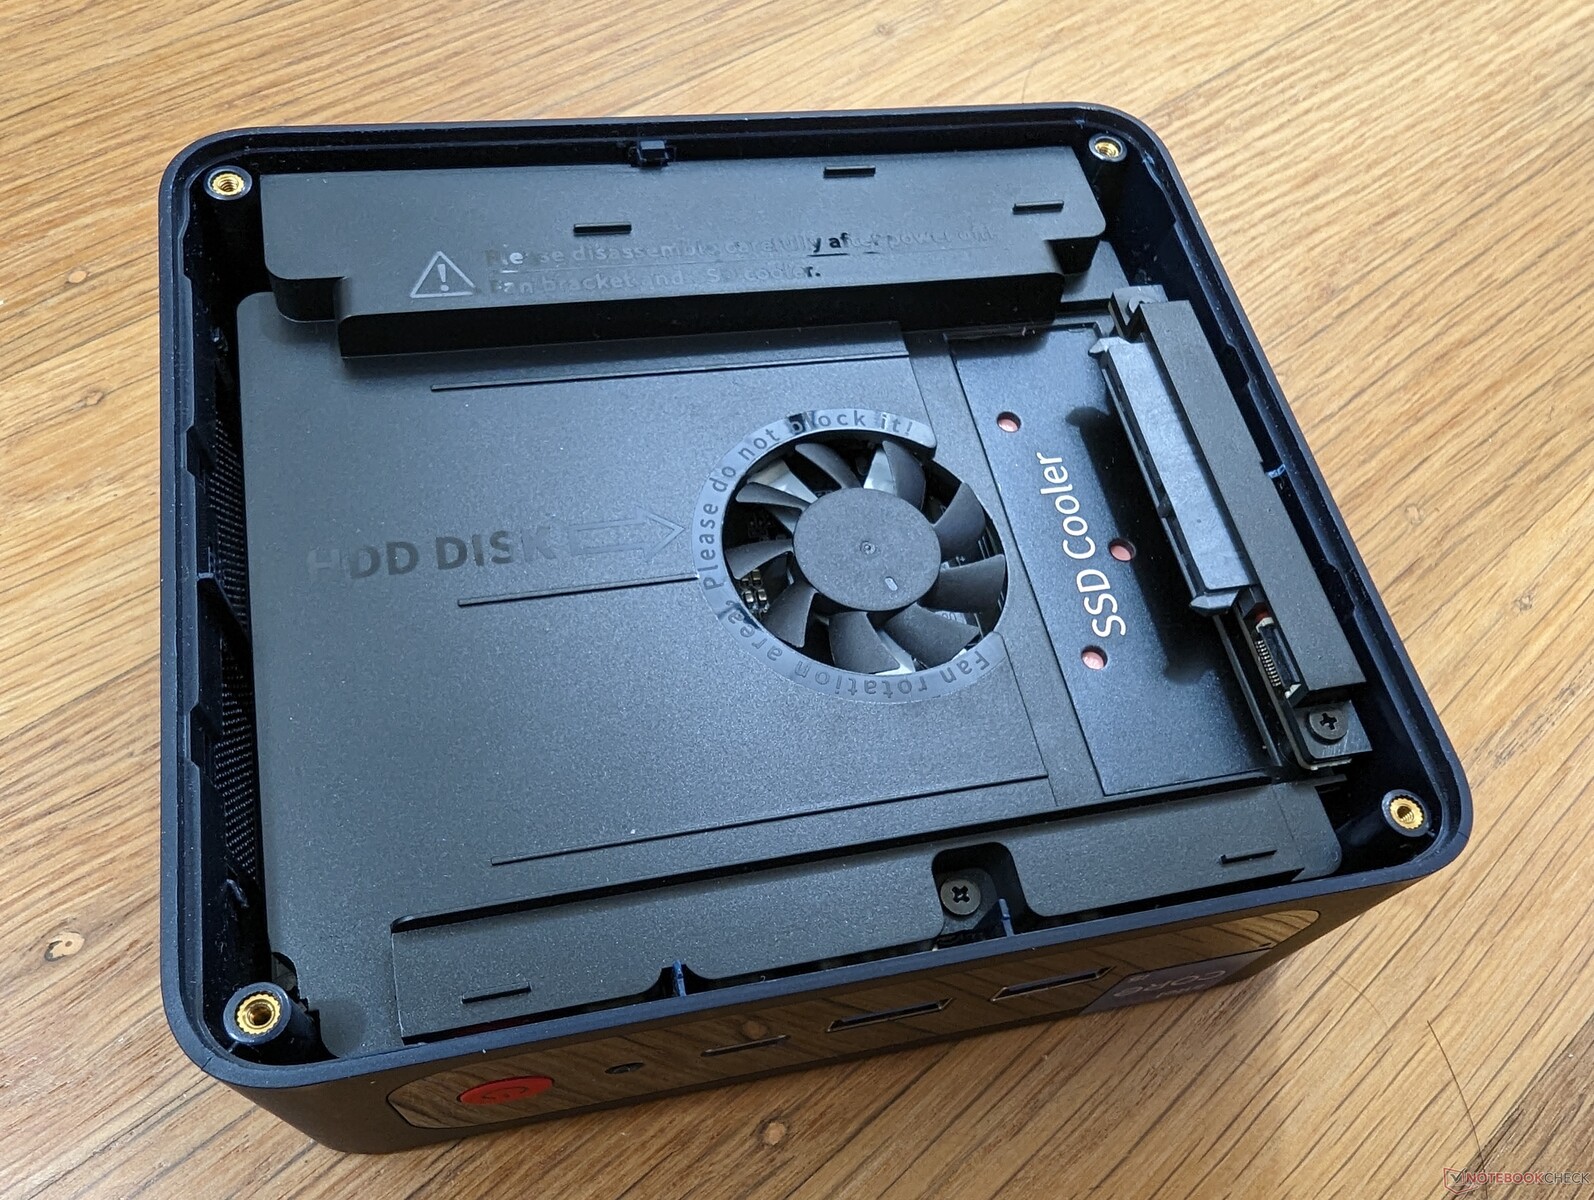
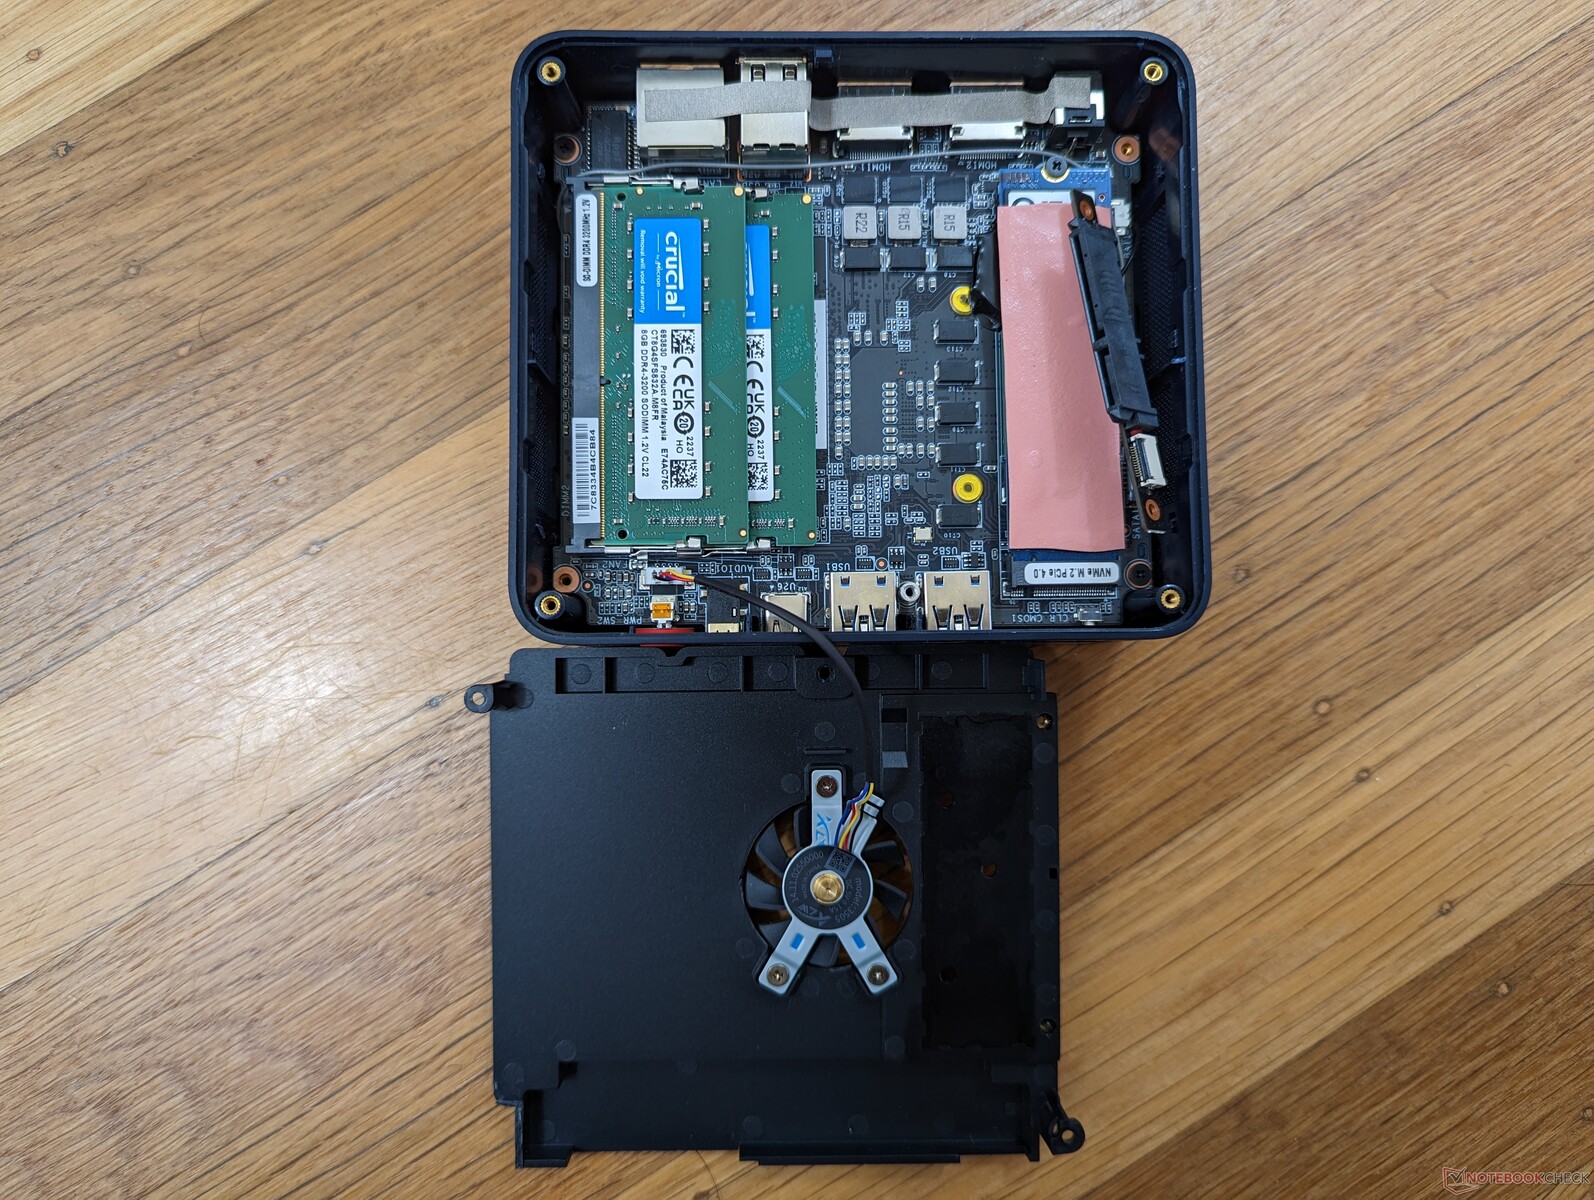
Service kräver lite mer arbete än de flesta andra minidatorer. När du tar bort bottenplattan kommer du åt en av fläktarna som sedan måste tas bort för att avslöja RAM-minnet, M.2 SSD-modulerna och M.2 WLAN-modulerna, vilket framgår av bilderna nedan. Tack och lov är allt som behövs en vanlig Philips-skruvmejsel för eventuella uppgraderingar.
Tillbehör och garanti
I förpackningen ingår två HDMI-kablar, VESA-fäste med skruvar, bruksanvisning och nätadapter. En ettårig begränsad tillverkargaranti gäller jämfört med tre år om du köper en Intel NUC.
Prestanda
Provningsförhållanden
Vi ställde in vår enhet i prestandaläget innan vi körde alla prestandabänkningar nedan. Tillverkaren har inga förinstallerade program eller programvara av typen "kontrollcenter" med sina minidatorer.
Processor
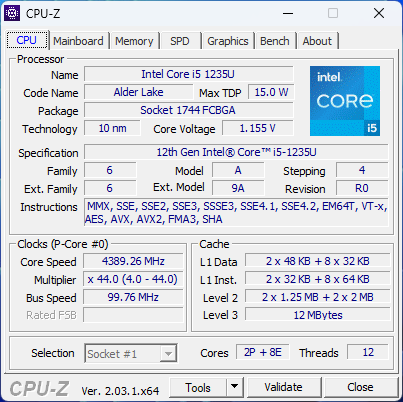
CPU-prestanda är utmärkt med resultat som är betydligt snabbare änGateway Ultra Slim 14.1 eller VAIO FE 14.1, båda med samma 12:e generationens Core i5-1235U PROCESSOR. Turbo Boosts hållbarhet kunde dock säkert vara bättre, eftersom CineBench R15 xT-resultaten skulle sjunka med cirka 14 procent över tiden, vilket visas i diagrammet nedan. Hög Turbo Boost-potential förväntas ändå inte med tanke på att det här är en CPU i Core U-serien
Den totala prestandan för flera trådar är ungefär 15 procent snabbare än den 11:e generationen Core i7-1165G7 i den dyrare NUC11.
Cinebench R15 Multi Loop
Cinebench R23: Multi Core | Single Core
Cinebench R15: CPU Multi 64Bit | CPU Single 64Bit
Blender: v2.79 BMW27 CPU
7-Zip 18.03: 7z b 4 | 7z b 4 -mmt1
Geekbench 5.5: Multi-Core | Single-Core
HWBOT x265 Benchmark v2.2: 4k Preset
LibreOffice : 20 Documents To PDF
R Benchmark 2.5: Overall mean
| Cinebench R20 / CPU (Multi Core) | |
| Beelink SER4 | |
| Intel NUC Pro Chassis_i7_1265U | |
| HP Spectre x360 13.5 14t-ef000 | |
| Beelink SEi12 Core i5-1235U | |
| Genomsnitt Intel Core i5-1235U (1783 - 3537, n=8) | |
| Intel NUC11PAQi7 | |
| Intel NUC Pro Chassis_i7_1185G7 | |
| Intel Hades Canyon NUC8i7HVK | |
| BMAX B5 Pro G7H8 | |
| Beelink SEi8 | |
| Cinebench R20 / CPU (Single Core) | |
| HP Spectre x360 13.5 14t-ef000 | |
| Intel NUC Pro Chassis_i7_1265U | |
| Beelink SEi12 Core i5-1235U | |
| Genomsnitt Intel Core i5-1235U (566 - 651, n=8) | |
| Intel NUC11PAQi7 | |
| Intel NUC Pro Chassis_i7_1185G7 | |
| Beelink SER4 | |
| Intel Hades Canyon NUC8i7HVK | |
| BMAX B5 Pro G7H8 | |
| Beelink SEi8 | |
| Cinebench R23 / Multi Core | |
| Beelink SER4 | |
| Intel NUC Pro Chassis_i7_1265U | |
| HP Spectre x360 13.5 14t-ef000 | |
| Beelink SEi12 Core i5-1235U | |
| Intel NUC11PAQi7 | |
| Genomsnitt Intel Core i5-1235U (2485 - 9208, n=8) | |
| Intel NUC Pro Chassis_i7_1185G7 | |
| BMAX B5 Pro G7H8 | |
| Beelink SEi8 | |
| Cinebench R23 / Single Core | |
| HP Spectre x360 13.5 14t-ef000 | |
| Intel NUC Pro Chassis_i7_1265U | |
| Beelink SEi12 Core i5-1235U | |
| Genomsnitt Intel Core i5-1235U (1444 - 1698, n=8) | |
| Intel NUC Pro Chassis_i7_1185G7 | |
| Beelink SER4 | |
| Beelink SEi8 | |
| BMAX B5 Pro G7H8 | |
| Cinebench R15 / CPU Multi 64Bit | |
| Beelink SER4 | |
| Beelink SEi12 Core i5-1235U | |
| HP Spectre x360 13.5 14t-ef000 | |
| Intel NUC Pro Chassis_i7_1265U | |
| Genomsnitt Intel Core i5-1235U (785 - 1587, n=8) | |
| Intel NUC11PAQi7 | |
| Intel Hades Canyon NUC8i7HVK | |
| Intel NUC Pro Chassis_i7_1185G7 | |
| BMAX B5 Pro G7H8 | |
| Beelink SEi8 | |
| Cinebench R15 / CPU Single 64Bit | |
| HP Spectre x360 13.5 14t-ef000 | |
| Intel NUC Pro Chassis_i7_1265U | |
| Beelink SEi12 Core i5-1235U | |
| Intel NUC11PAQi7 | |
| Intel NUC Pro Chassis_i7_1185G7 | |
| Genomsnitt Intel Core i5-1235U (151.5 - 242, n=8) | |
| Beelink SER4 | |
| Intel Hades Canyon NUC8i7HVK | |
| BMAX B5 Pro G7H8 | |
| Beelink SEi8 | |
| Blender / v2.79 BMW27 CPU | |
| Beelink SEi8 | |
| BMAX B5 Pro G7H8 | |
| Intel NUC Pro Chassis_i7_1185G7 | |
| Intel Hades Canyon NUC8i7HVK | |
| Genomsnitt Intel Core i5-1235U (366 - 662, n=8) | |
| Intel NUC11PAQi7 | |
| Beelink SEi12 Core i5-1235U | |
| HP Spectre x360 13.5 14t-ef000 | |
| Intel NUC Pro Chassis_i7_1265U | |
| Beelink SER4 | |
| 7-Zip 18.03 / 7z b 4 | |
| Beelink SER4 | |
| HP Spectre x360 13.5 14t-ef000 | |
| Intel NUC Pro Chassis_i7_1265U | |
| Beelink SEi12 Core i5-1235U | |
| Genomsnitt Intel Core i5-1235U (20166 - 38643, n=8) | |
| Intel NUC11PAQi7 | |
| Intel NUC Pro Chassis_i7_1185G7 | |
| Intel Hades Canyon NUC8i7HVK | |
| BMAX B5 Pro G7H8 | |
| Beelink SEi8 | |
| 7-Zip 18.03 / 7z b 4 -mmt1 | |
| HP Spectre x360 13.5 14t-ef000 | |
| Intel NUC11PAQi7 | |
| Intel NUC Pro Chassis_i7_1265U | |
| Intel NUC Pro Chassis_i7_1185G7 | |
| Beelink SEi12 Core i5-1235U | |
| Genomsnitt Intel Core i5-1235U (4371 - 5233, n=8) | |
| Beelink SER4 | |
| Intel Hades Canyon NUC8i7HVK | |
| BMAX B5 Pro G7H8 | |
| Beelink SEi8 | |
| Geekbench 5.5 / Multi-Core | |
| Intel NUC Pro Chassis_i7_1265U | |
| HP Spectre x360 13.5 14t-ef000 | |
| Beelink SEi12 Core i5-1235U | |
| Genomsnitt Intel Core i5-1235U (5528 - 8571, n=10) | |
| Beelink SER4 | |
| Intel NUC Pro Chassis_i7_1185G7 | |
| Intel NUC11PAQi7 | |
| Beelink SEi8 | |
| BMAX B5 Pro G7H8 | |
| Geekbench 5.5 / Single-Core | |
| Intel NUC Pro Chassis_i7_1265U | |
| HP Spectre x360 13.5 14t-ef000 | |
| Beelink SEi12 Core i5-1235U | |
| Intel NUC11PAQi7 | |
| Genomsnitt Intel Core i5-1235U (1426 - 1643, n=10) | |
| Intel NUC Pro Chassis_i7_1185G7 | |
| Beelink SER4 | |
| Beelink SEi8 | |
| BMAX B5 Pro G7H8 | |
| HWBOT x265 Benchmark v2.2 / 4k Preset | |
| Beelink SER4 | |
| HP Spectre x360 13.5 14t-ef000 | |
| Intel NUC Pro Chassis_i7_1265U | |
| Beelink SEi12 Core i5-1235U | |
| Intel NUC11PAQi7 | |
| Genomsnitt Intel Core i5-1235U (4.99 - 9.43, n=8) | |
| Intel Hades Canyon NUC8i7HVK | |
| Intel NUC Pro Chassis_i7_1185G7 | |
| Beelink SEi8 | |
| BMAX B5 Pro G7H8 | |
| LibreOffice / 20 Documents To PDF | |
| BMAX B5 Pro G7H8 | |
| Beelink SEi8 | |
| Beelink SER4 | |
| Genomsnitt Intel Core i5-1235U (42.4 - 65.5, n=8) | |
| Intel NUC Pro Chassis_i7_1265U | |
| Beelink SEi12 Core i5-1235U | |
| Intel NUC Pro Chassis_i7_1185G7 | |
| HP Spectre x360 13.5 14t-ef000 | |
| Intel NUC11PAQi7 | |
| R Benchmark 2.5 / Overall mean | |
| BMAX B5 Pro G7H8 | |
| Beelink SEi8 | |
| Intel NUC Pro Chassis_i7_1185G7 | |
| Beelink SER4 | |
| Intel NUC11PAQi7 | |
| Genomsnitt Intel Core i5-1235U (0.4986 - 0.603, n=8) | |
| Beelink SEi12 Core i5-1235U | |
| Intel NUC Pro Chassis_i7_1265U | |
| HP Spectre x360 13.5 14t-ef000 | |
* ... mindre är bättre
AIDA64: FP32 Ray-Trace | FPU Julia | CPU SHA3 | CPU Queen | FPU SinJulia | FPU Mandel | CPU AES | CPU ZLib | FP64 Ray-Trace | CPU PhotoWorxx
| Performance rating | |
| Beelink SER4 | |
| HP Spectre x360 13.5 14t-ef000 | |
| Intel NUC Pro Chassis_i7_1265U | |
| Beelink SEi12 Core i5-1235U | |
| Intel NUC Pro Chassis_i7_1185G7 | |
| Genomsnitt Intel Core i5-1235U | |
| BMAX B5 Pro G7H8 | |
| Beelink SEi8 | |
| AIDA64 / FP32 Ray-Trace | |
| Beelink SER4 | |
| HP Spectre x360 13.5 14t-ef000 | |
| Intel NUC Pro Chassis_i7_1185G7 | |
| Intel NUC Pro Chassis_i7_1265U | |
| Beelink SEi12 Core i5-1235U | |
| Genomsnitt Intel Core i5-1235U (3078 - 7457, n=8) | |
| BMAX B5 Pro G7H8 | |
| Beelink SEi8 | |
| AIDA64 / FPU Julia | |
| Beelink SER4 | |
| HP Spectre x360 13.5 14t-ef000 | |
| Intel NUC Pro Chassis_i7_1265U | |
| Beelink SEi12 Core i5-1235U | |
| Intel NUC Pro Chassis_i7_1185G7 | |
| Genomsnitt Intel Core i5-1235U (15838 - 37760, n=8) | |
| BMAX B5 Pro G7H8 | |
| Beelink SEi8 | |
| AIDA64 / CPU SHA3 | |
| HP Spectre x360 13.5 14t-ef000 | |
| Intel NUC Pro Chassis_i7_1185G7 | |
| Intel NUC Pro Chassis_i7_1265U | |
| Beelink SEi12 Core i5-1235U | |
| Beelink SER4 | |
| Genomsnitt Intel Core i5-1235U (978 - 2072, n=8) | |
| BMAX B5 Pro G7H8 | |
| Beelink SEi8 | |
| AIDA64 / CPU Queen | |
| Beelink SER4 | |
| Intel NUC Pro Chassis_i7_1265U | |
| HP Spectre x360 13.5 14t-ef000 | |
| Beelink SEi12 Core i5-1235U | |
| Genomsnitt Intel Core i5-1235U (45680 - 62404, n=8) | |
| Intel NUC Pro Chassis_i7_1185G7 | |
| BMAX B5 Pro G7H8 | |
| Beelink SEi8 | |
| AIDA64 / FPU SinJulia | |
| Beelink SER4 | |
| Intel NUC Pro Chassis_i7_1265U | |
| Beelink SEi12 Core i5-1235U | |
| Intel NUC Pro Chassis_i7_1185G7 | |
| HP Spectre x360 13.5 14t-ef000 | |
| BMAX B5 Pro G7H8 | |
| Genomsnitt Intel Core i5-1235U (3099 - 4644, n=8) | |
| Beelink SEi8 | |
| AIDA64 / FPU Mandel | |
| Beelink SER4 | |
| HP Spectre x360 13.5 14t-ef000 | |
| Intel NUC Pro Chassis_i7_1265U | |
| Intel NUC Pro Chassis_i7_1185G7 | |
| Beelink SEi12 Core i5-1235U | |
| Genomsnitt Intel Core i5-1235U (8046 - 18819, n=8) | |
| BMAX B5 Pro G7H8 | |
| Beelink SEi8 | |
| AIDA64 / CPU AES | |
| Intel NUC Pro Chassis_i7_1185G7 | |
| HP Spectre x360 13.5 14t-ef000 | |
| Beelink SEi12 Core i5-1235U | |
| Beelink SER4 | |
| Intel NUC Pro Chassis_i7_1265U | |
| Genomsnitt Intel Core i5-1235U (23386 - 67140, n=8) | |
| BMAX B5 Pro G7H8 | |
| Beelink SEi8 | |
| AIDA64 / CPU ZLib | |
| Beelink SEi12 Core i5-1235U | |
| Beelink SER4 | |
| Intel NUC Pro Chassis_i7_1265U | |
| HP Spectre x360 13.5 14t-ef000 | |
| Genomsnitt Intel Core i5-1235U (329 - 633, n=8) | |
| Intel NUC Pro Chassis_i7_1185G7 | |
| BMAX B5 Pro G7H8 | |
| Beelink SEi8 | |
| AIDA64 / FP64 Ray-Trace | |
| Beelink SER4 | |
| HP Spectre x360 13.5 14t-ef000 | |
| Intel NUC Pro Chassis_i7_1265U | |
| Intel NUC Pro Chassis_i7_1185G7 | |
| Beelink SEi12 Core i5-1235U | |
| Genomsnitt Intel Core i5-1235U (1670 - 3928, n=8) | |
| BMAX B5 Pro G7H8 | |
| Beelink SEi8 | |
| AIDA64 / CPU PhotoWorxx | |
| Intel NUC Pro Chassis_i7_1265U | |
| HP Spectre x360 13.5 14t-ef000 | |
| Intel NUC Pro Chassis_i7_1185G7 | |
| Genomsnitt Intel Core i5-1235U (15933 - 41909, n=8) | |
| Beelink SEi12 Core i5-1235U | |
| Beelink SER4 | |
| BMAX B5 Pro G7H8 | |
| Beelink SEi8 | |
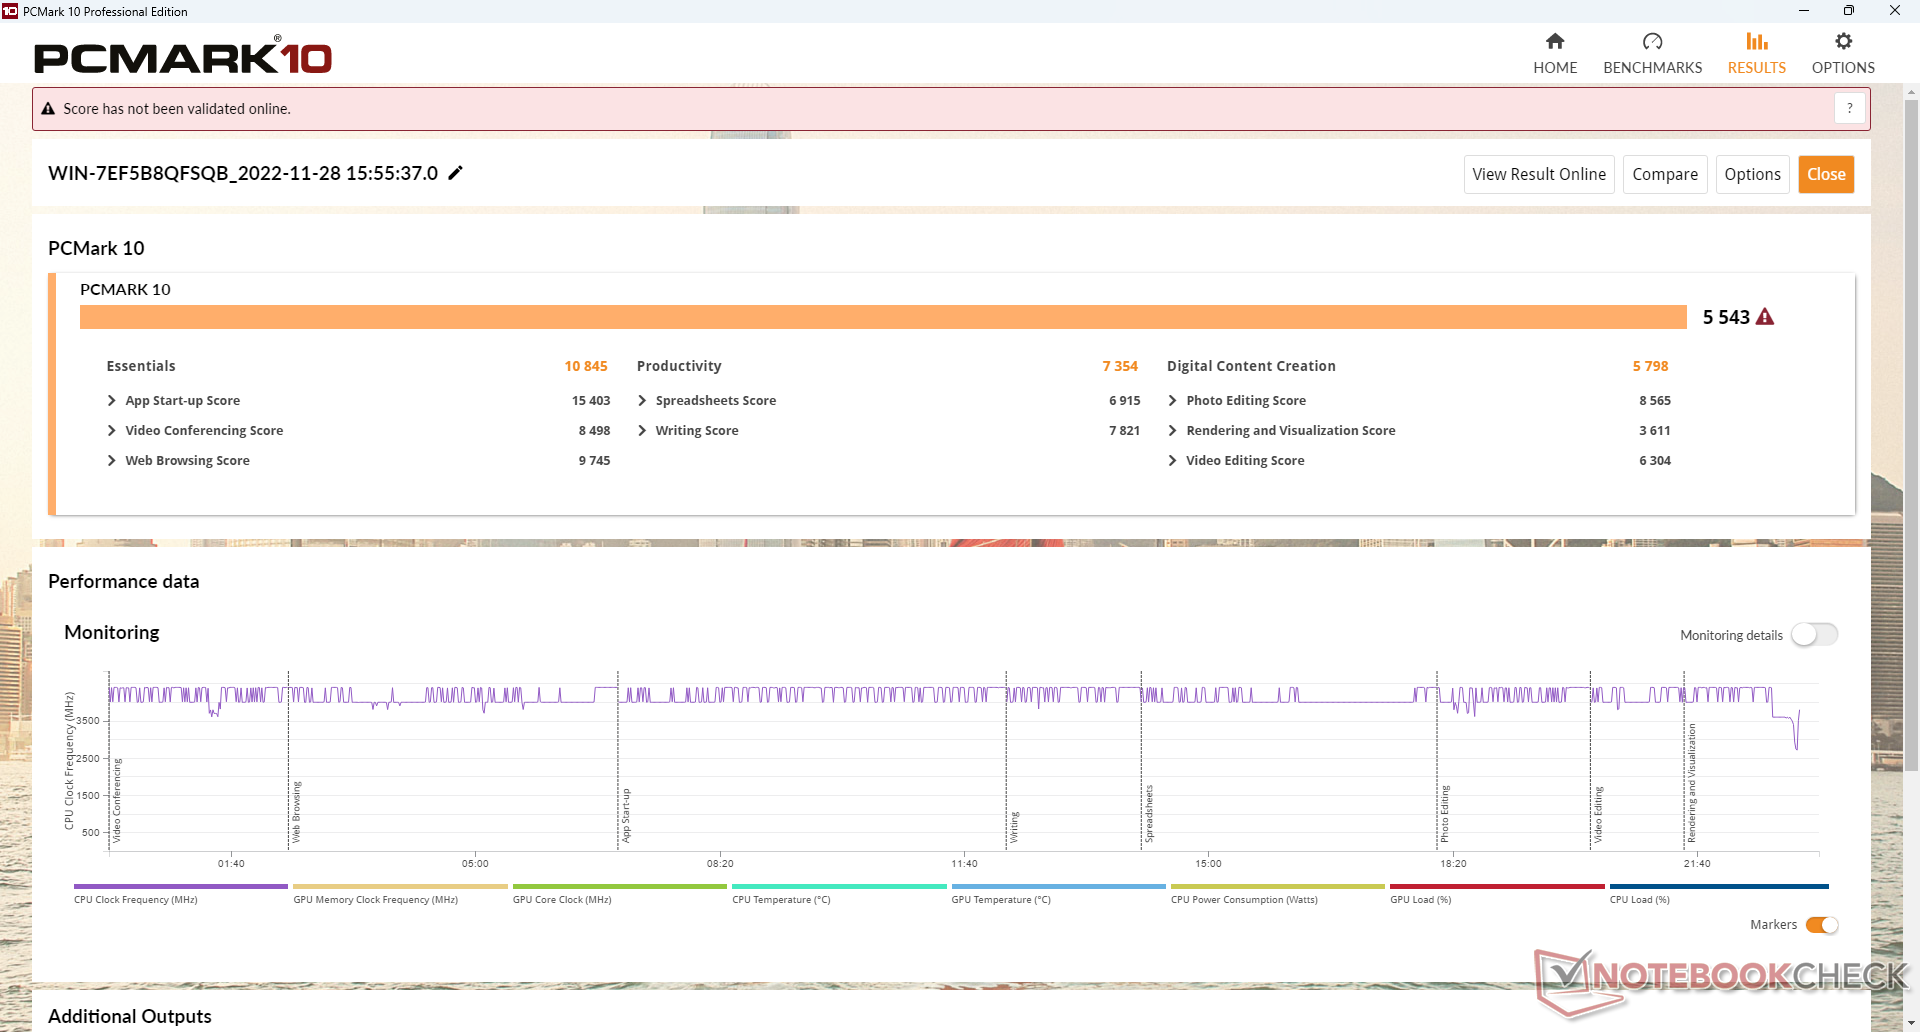
Systemets prestanda
PCMark-resultaten är betydligt högre än de äldreBeelink SEi8 som använder en 8:e generationens i3-8109U och en långsammare Intel 660p SSD.
CrossMark: Overall | Productivity | Creativity | Responsiveness
| PCMark 10 / Score | |
| Beelink SEi12 Core i5-1235U | |
| Intel Hades Canyon NUC8i7HVK | |
| Beelink SER4 | |
| Intel NUC11PAQi7 | |
| Genomsnitt Intel Core i5-1235U, Intel Iris Xe Graphics G7 80EUs (4528 - 5543, n=8) | |
| BMAX B5 Pro G7H8 | |
| Beelink SEi8 | |
| PCMark 10 / Essentials | |
| Beelink SEi12 Core i5-1235U | |
| Intel NUC11PAQi7 | |
| Genomsnitt Intel Core i5-1235U, Intel Iris Xe Graphics G7 80EUs (9143 - 11273, n=8) | |
| Beelink SER4 | |
| Intel Hades Canyon NUC8i7HVK | |
| BMAX B5 Pro G7H8 | |
| Beelink SEi8 | |
| PCMark 10 / Productivity | |
| Beelink SER4 | |
| Intel Hades Canyon NUC8i7HVK | |
| Beelink SEi12 Core i5-1235U | |
| Intel NUC11PAQi7 | |
| Genomsnitt Intel Core i5-1235U, Intel Iris Xe Graphics G7 80EUs (6440 - 7354, n=8) | |
| BMAX B5 Pro G7H8 | |
| Beelink SEi8 | |
| PCMark 10 / Digital Content Creation | |
| Beelink SEi12 Core i5-1235U | |
| Intel Hades Canyon NUC8i7HVK | |
| Beelink SER4 | |
| Genomsnitt Intel Core i5-1235U, Intel Iris Xe Graphics G7 80EUs (4220 - 5839, n=8) | |
| Intel NUC11PAQi7 | |
| BMAX B5 Pro G7H8 | |
| Beelink SEi8 | |
| CrossMark / Overall | |
| Beelink SEi12 Core i5-1235U | |
| Genomsnitt Intel Core i5-1235U, Intel Iris Xe Graphics G7 80EUs (983 - 1644, n=8) | |
| BMAX B5 Pro G7H8 | |
| CrossMark / Productivity | |
| Beelink SEi12 Core i5-1235U | |
| Genomsnitt Intel Core i5-1235U, Intel Iris Xe Graphics G7 80EUs (1026 - 1676, n=8) | |
| BMAX B5 Pro G7H8 | |
| CrossMark / Creativity | |
| Beelink SEi12 Core i5-1235U | |
| Genomsnitt Intel Core i5-1235U, Intel Iris Xe Graphics G7 80EUs (1032 - 1618, n=8) | |
| BMAX B5 Pro G7H8 | |
| CrossMark / Responsiveness | |
| Beelink SEi12 Core i5-1235U | |
| Genomsnitt Intel Core i5-1235U, Intel Iris Xe Graphics G7 80EUs (746 - 1867, n=8) | |
| BMAX B5 Pro G7H8 | |
| PCMark 10 Score | 5543 poäng | |
Hjälp | ||
| AIDA64 / Memory Copy | |
| Genomsnitt Intel Core i5-1235U (24653 - 61921, n=8) | |
| Beelink SEi12 Core i5-1235U | |
| Beelink SER4 | |
| Beelink SEi8 | |
| BMAX B5 Pro G7H8 | |
| AIDA64 / Memory Read | |
| Genomsnitt Intel Core i5-1235U (24441 - 66108, n=8) | |
| Beelink SEi12 Core i5-1235U | |
| Beelink SER4 | |
| BMAX B5 Pro G7H8 | |
| Beelink SEi8 | |
| AIDA64 / Memory Write | |
| Genomsnitt Intel Core i5-1235U (25156 - 75808, n=8) | |
| Beelink SEi12 Core i5-1235U | |
| Beelink SER4 | |
| BMAX B5 Pro G7H8 | |
| Beelink SEi8 | |
| AIDA64 / Memory Latency | |
| Beelink SER4 | |
| BMAX B5 Pro G7H8 | |
| Beelink SEi12 Core i5-1235U | |
| Genomsnitt Intel Core i5-1235U (76.3 - 119, n=8) | |
| Beelink SEi8 | |
* ... mindre är bättre
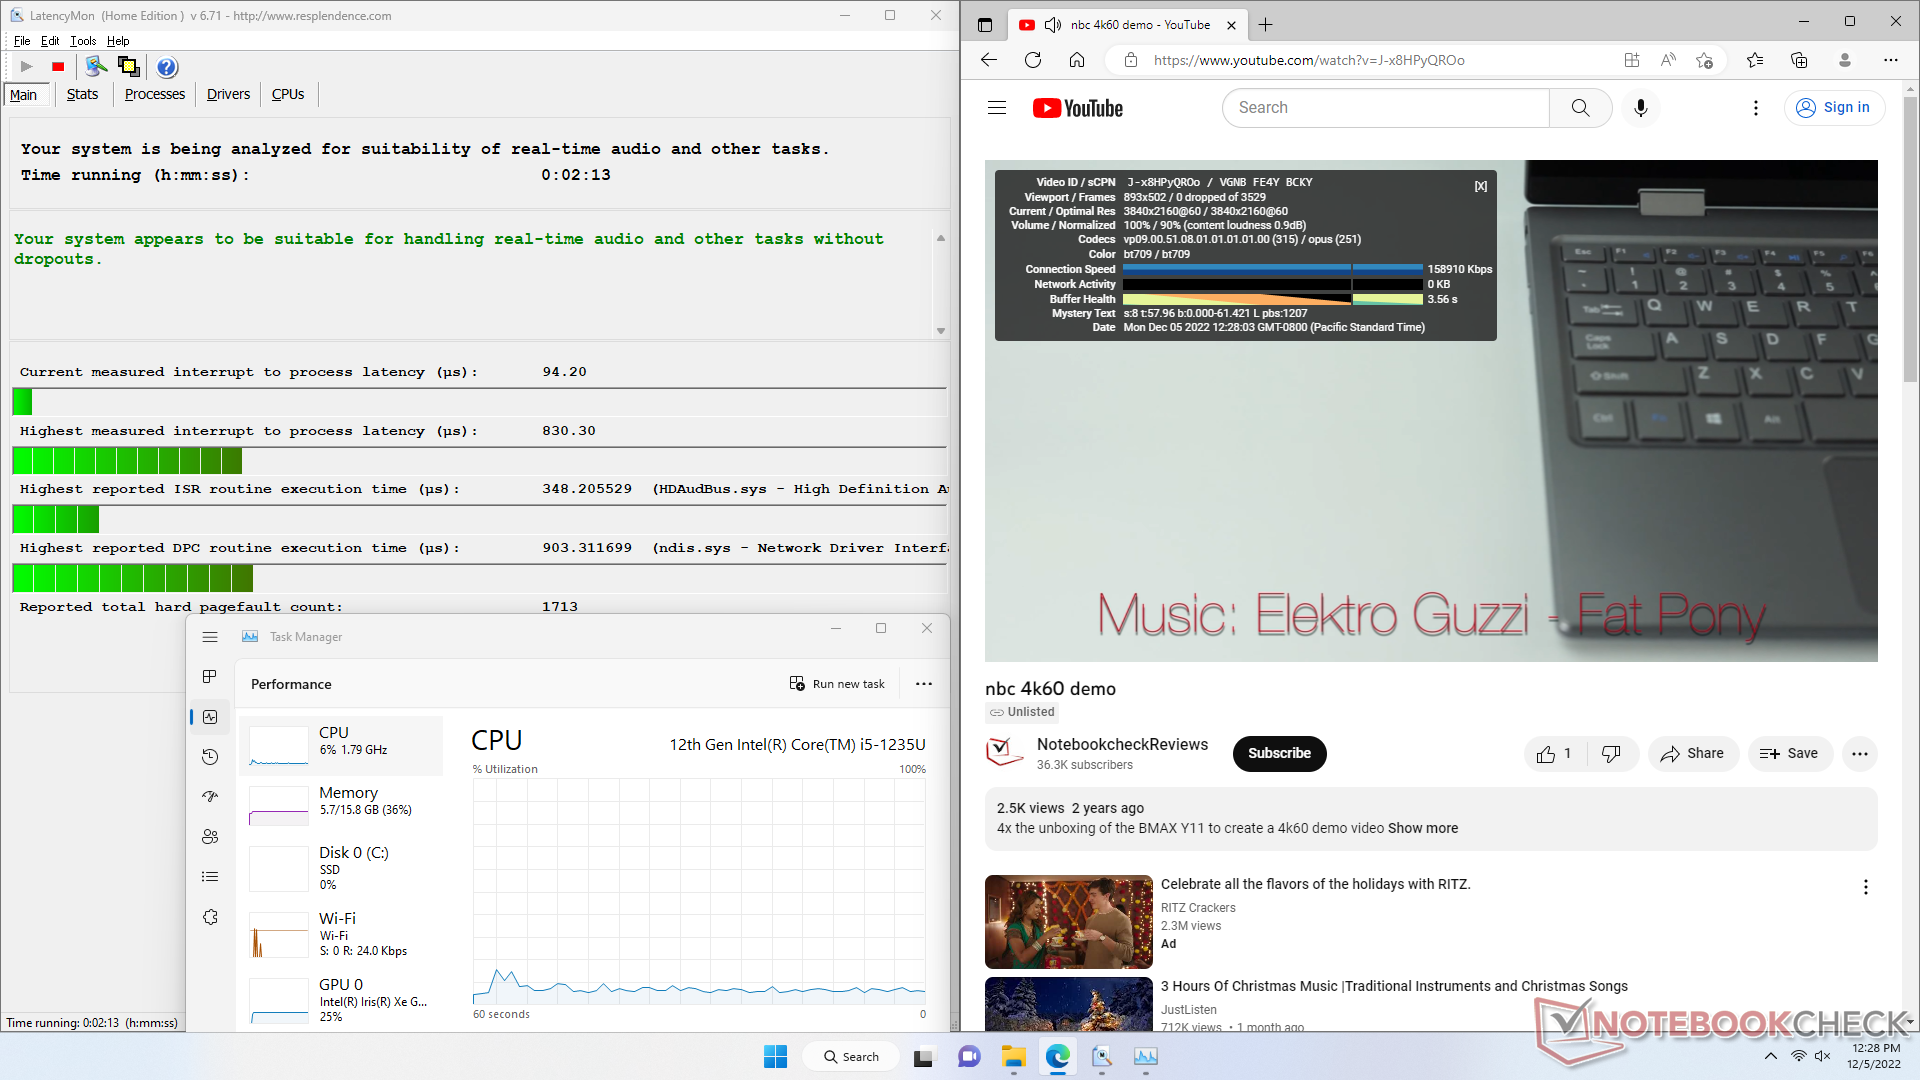
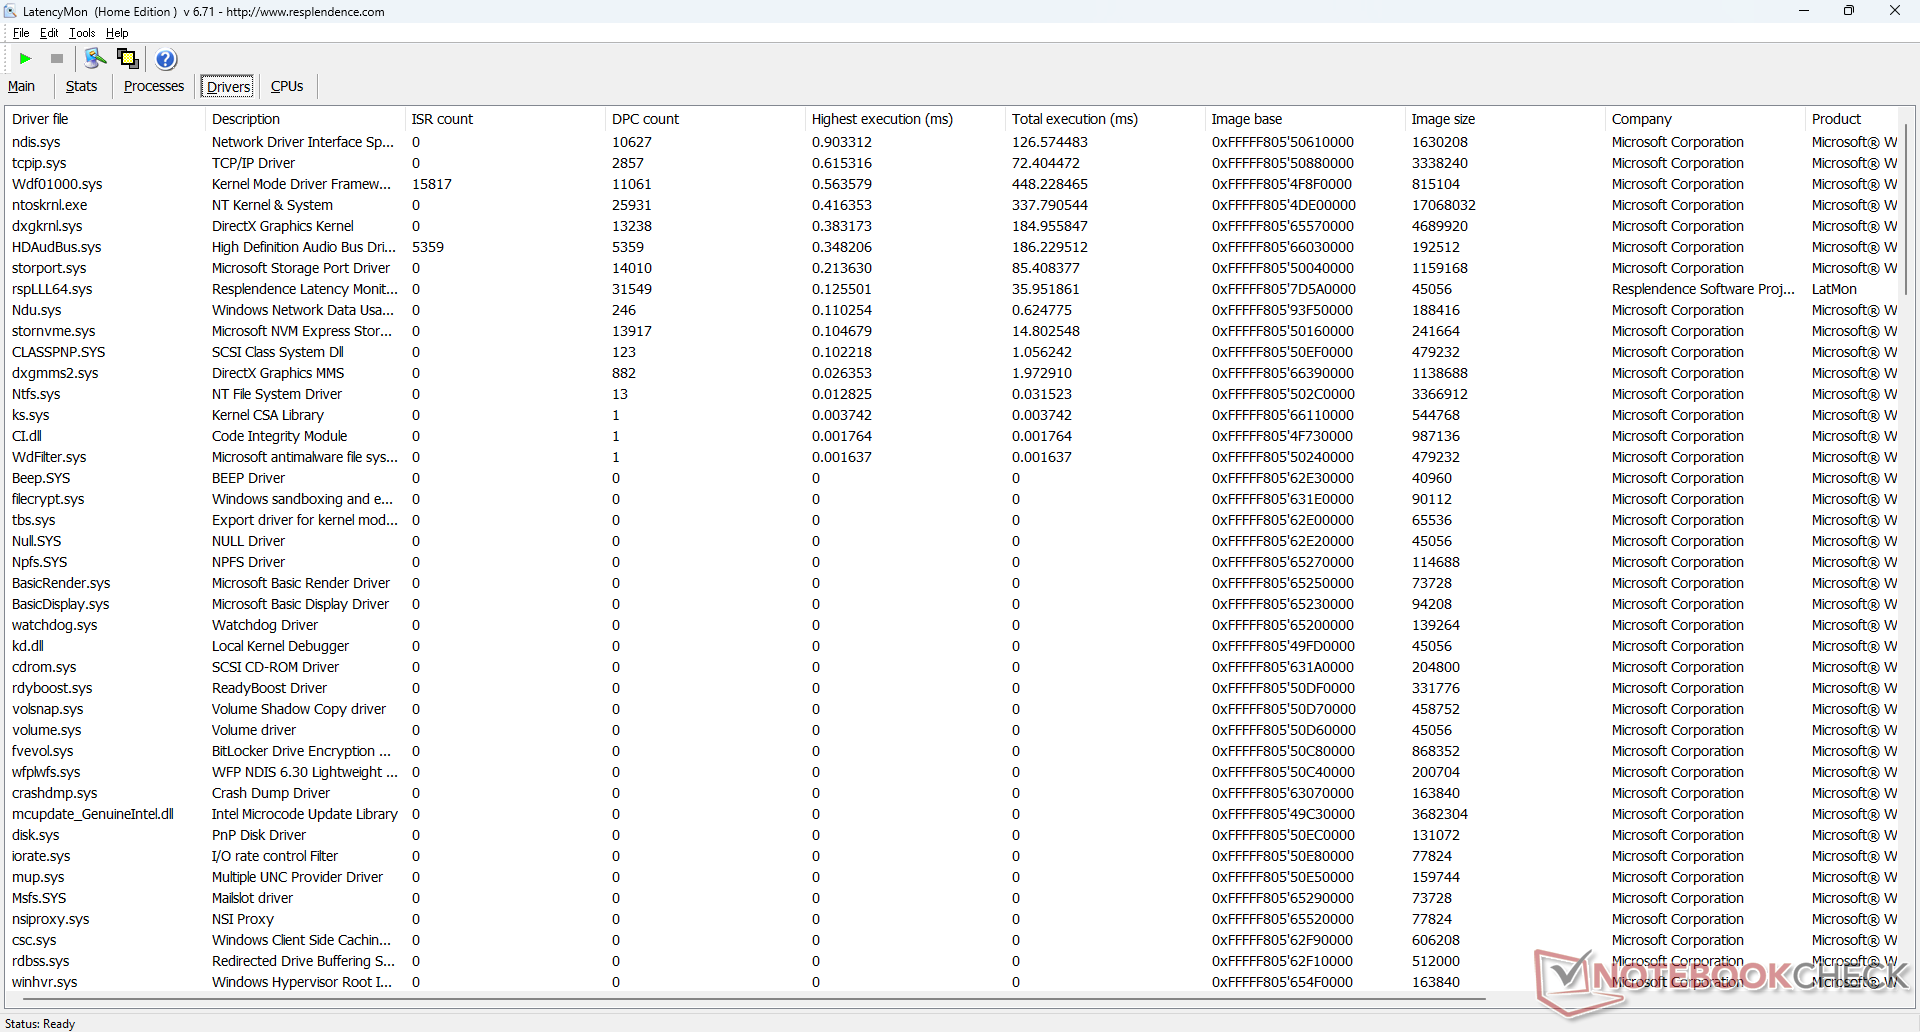
DPC-latenstid
LatencyMon visar inga DPC-problem när du öppnar flera webbläsarflikar på vår hemsida. uppspelning av 4K-video vid 60 FPS går också smidigt utan att några ramar tappas bort.
| DPC Latencies / LatencyMon - interrupt to process latency (max), Web, Youtube, Prime95 | |
| Beelink SEi12 Core i5-1235U | |
| Intel NUC11PAQi7 | |
| BMAX B5 Pro G7H8 | |
| Beelink SER4 | |
| Beelink SEi11 Pro | |
* ... mindre är bättre
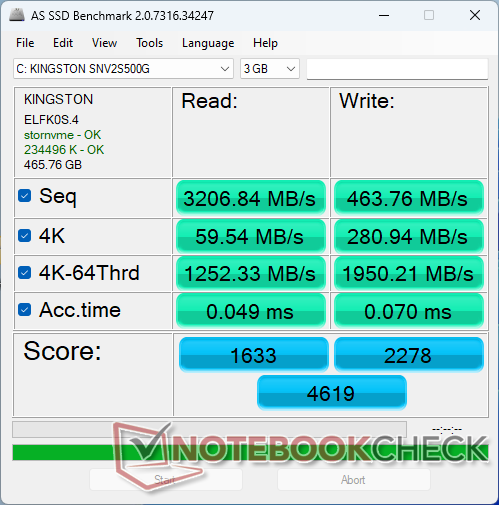
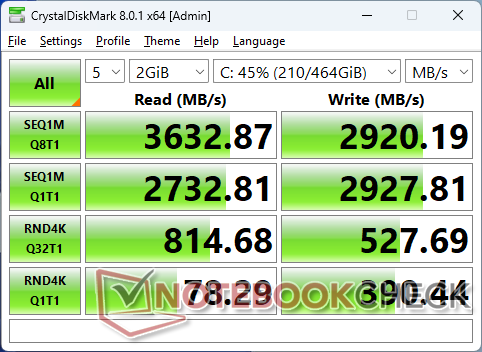
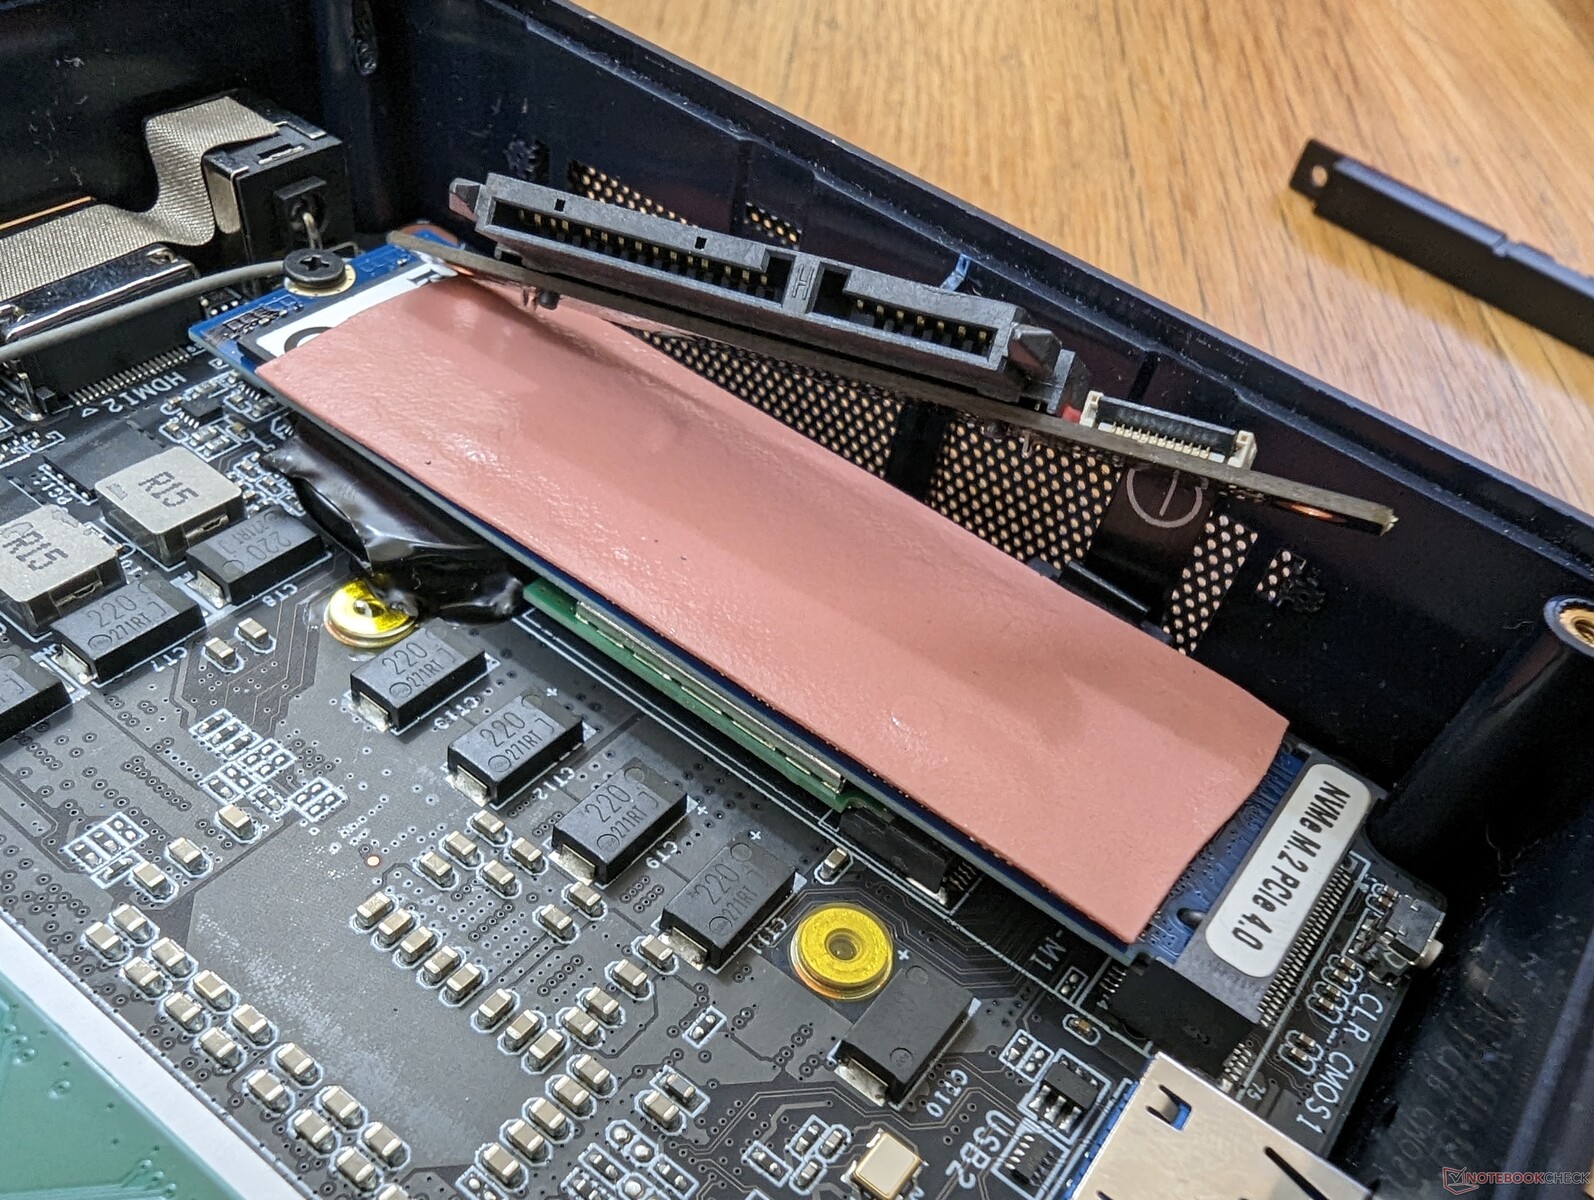
Lagringsenheter
Systemet har stöd för PCIe4 x4 NVMe SSD-diskar och har även en kylfläns för att hålla temperaturen i schack. Trots detta levereras enheten med en långsammare Kingston NV1 PCIe3 x4 NVMe SSD i stället som en kostnadsbesparande åtgärd. När vi kör DiskSpd i en slinga kan vi observera att överföringshastigheterna sjunker från höga 3600 MB/s till låga 1700 MB/s, vilket kan tyda på en underpresterande kylfläns.

| Drive Performance rating - Percent | |
| Intel NUC11PAQi7 | |
| Beelink SEi12 Core i5-1235U | |
| Intel Hades Canyon NUC8i7HVK -8! | |
| BMAX B5 Pro G7H8 | |
| Beelink SEi11 Pro | |
| Beelink SER4 | |
| DiskSpd | |
| seq read | |
| Intel NUC11PAQi7 | |
| Beelink SEi12 Core i5-1235U | |
| BMAX B5 Pro G7H8 | |
| Beelink SEi11 Pro | |
| Beelink SER4 | |
| seq write | |
| Intel NUC11PAQi7 | |
| Beelink SEi12 Core i5-1235U | |
| Beelink SEi11 Pro | |
| BMAX B5 Pro G7H8 | |
| Beelink SER4 | |
| seq q8 t1 read | |
| Intel NUC11PAQi7 | |
| Beelink SEi12 Core i5-1235U | |
| BMAX B5 Pro G7H8 | |
| Beelink SEi11 Pro | |
| Beelink SER4 | |
| seq q8 t1 write | |
| Intel NUC11PAQi7 | |
| Beelink SEi12 Core i5-1235U | |
| BMAX B5 Pro G7H8 | |
| Beelink SEi11 Pro | |
| Beelink SER4 | |
| 4k q1 t1 read | |
| Beelink SEi12 Core i5-1235U | |
| Beelink SER4 | |
| Intel NUC11PAQi7 | |
| Beelink SEi11 Pro | |
| BMAX B5 Pro G7H8 | |
| 4k q1 t1 write | |
| Beelink SEi12 Core i5-1235U | |
| Beelink SER4 | |
| Beelink SEi11 Pro | |
| BMAX B5 Pro G7H8 | |
| Intel NUC11PAQi7 | |
| 4k q32 t16 read | |
| Intel NUC11PAQi7 | |
| Beelink SEi12 Core i5-1235U | |
| BMAX B5 Pro G7H8 | |
| Beelink SEi11 Pro | |
| Beelink SER4 | |
| 4k q32 t16 write | |
| Intel NUC11PAQi7 | |
| Beelink SEi12 Core i5-1235U | |
| BMAX B5 Pro G7H8 | |
| Beelink SER4 | |
| Beelink SEi11 Pro | |
* ... mindre är bättre
Disk Throttling: DiskSpd Read Loop, Queue Depth 8
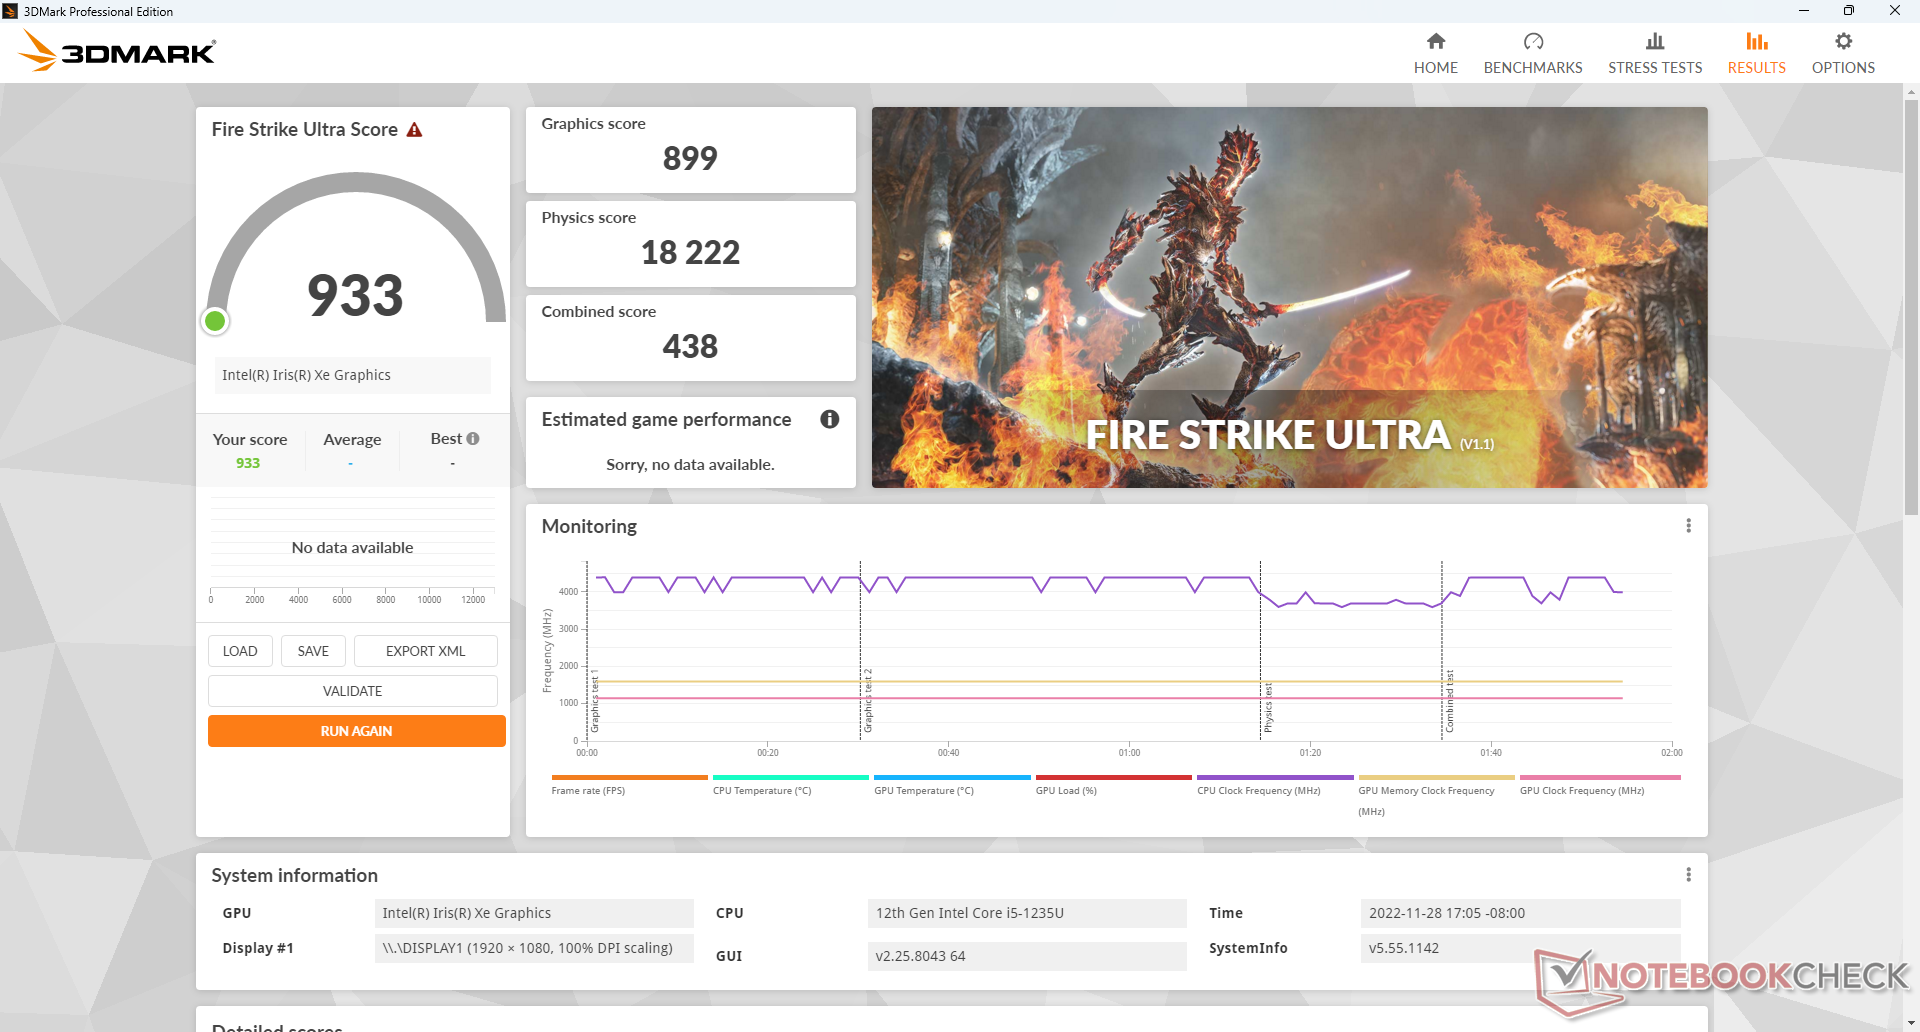
GPU-prestanda
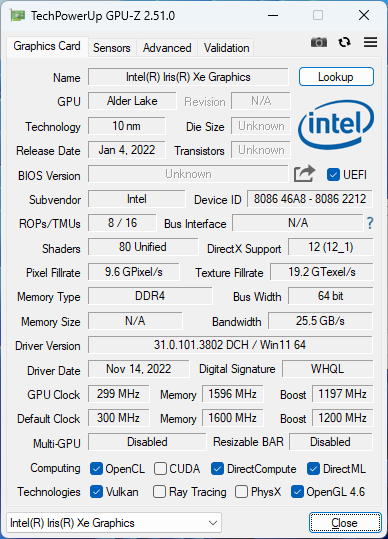
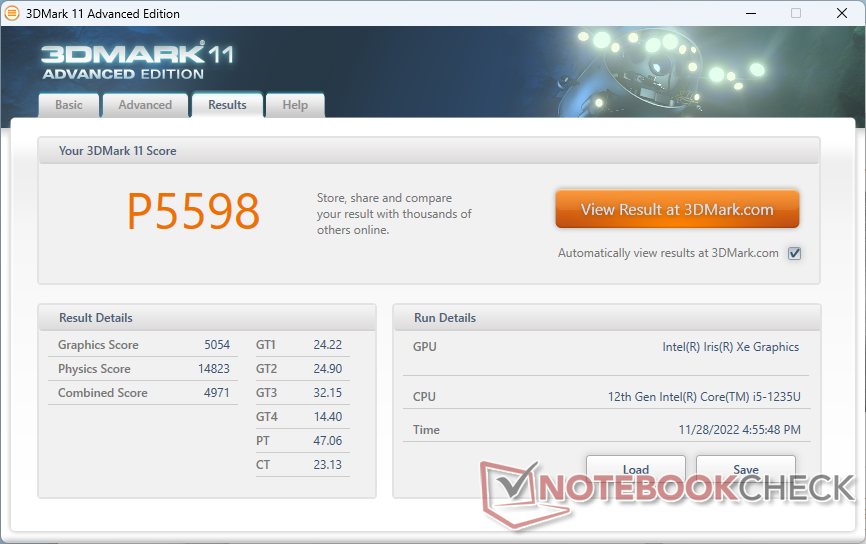
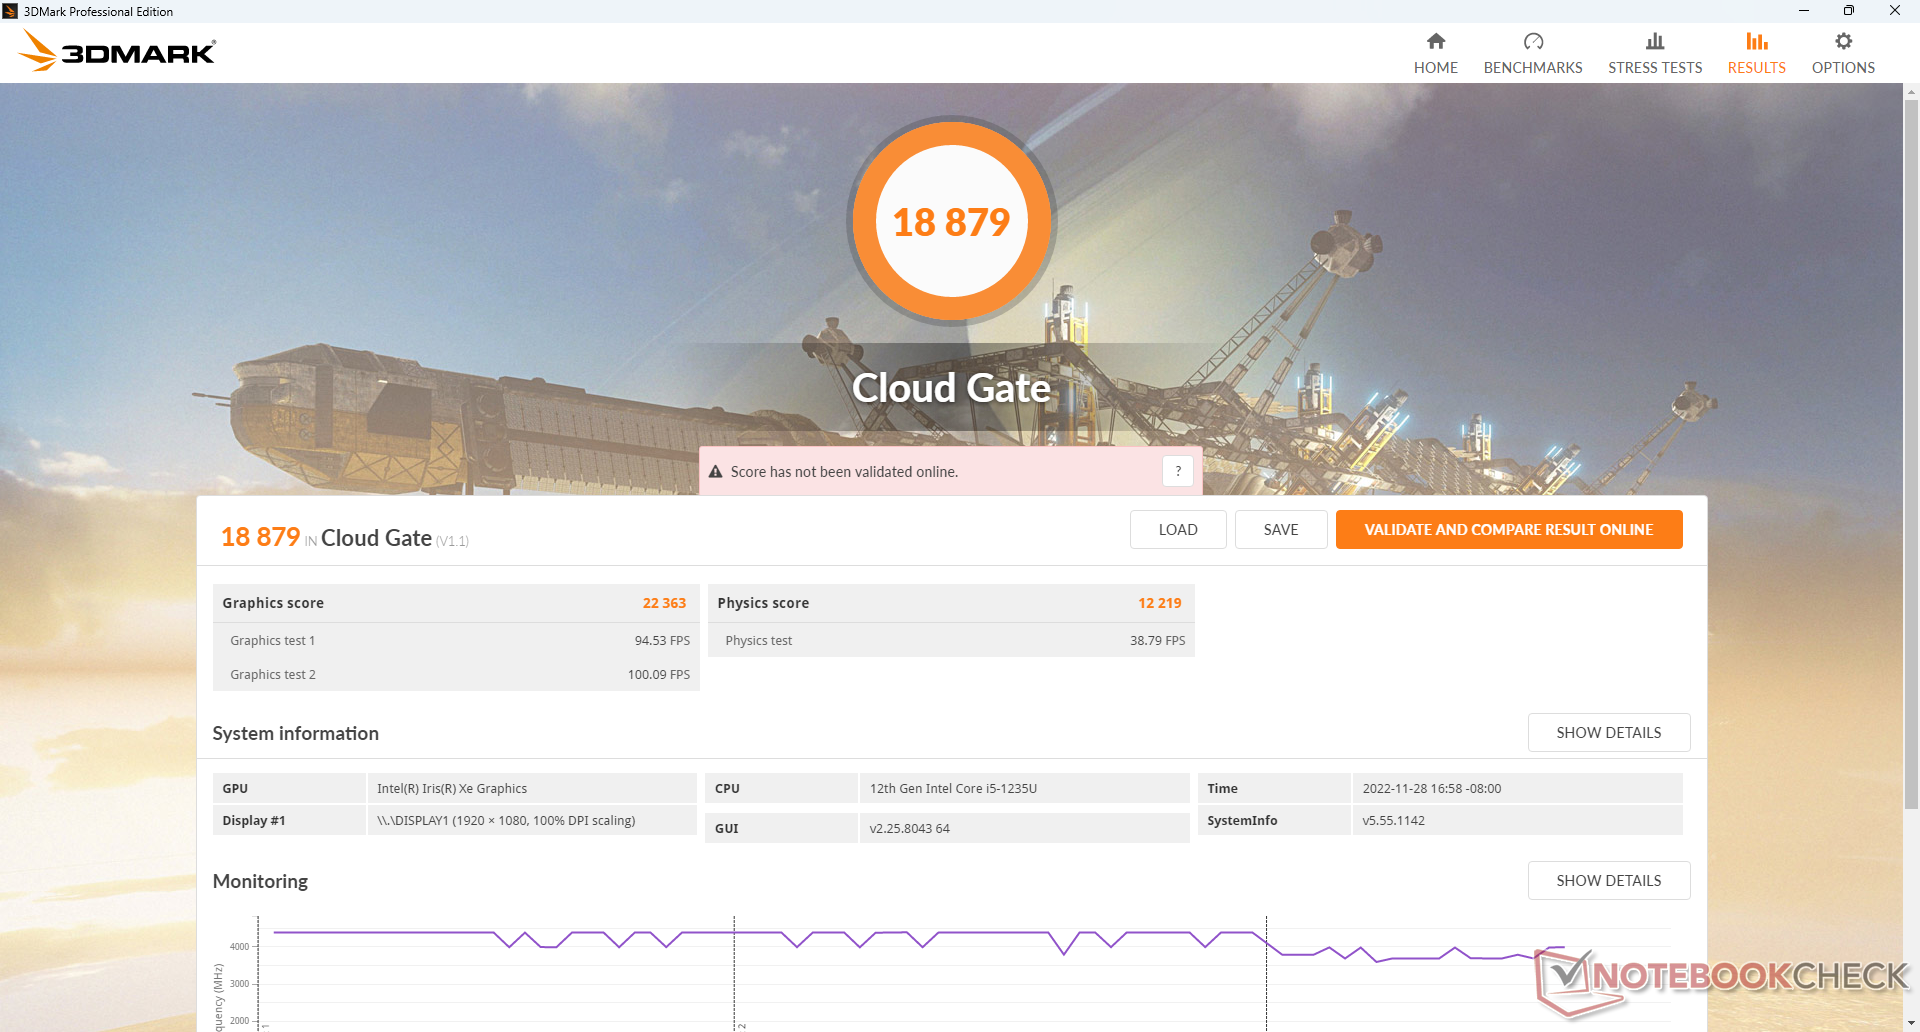
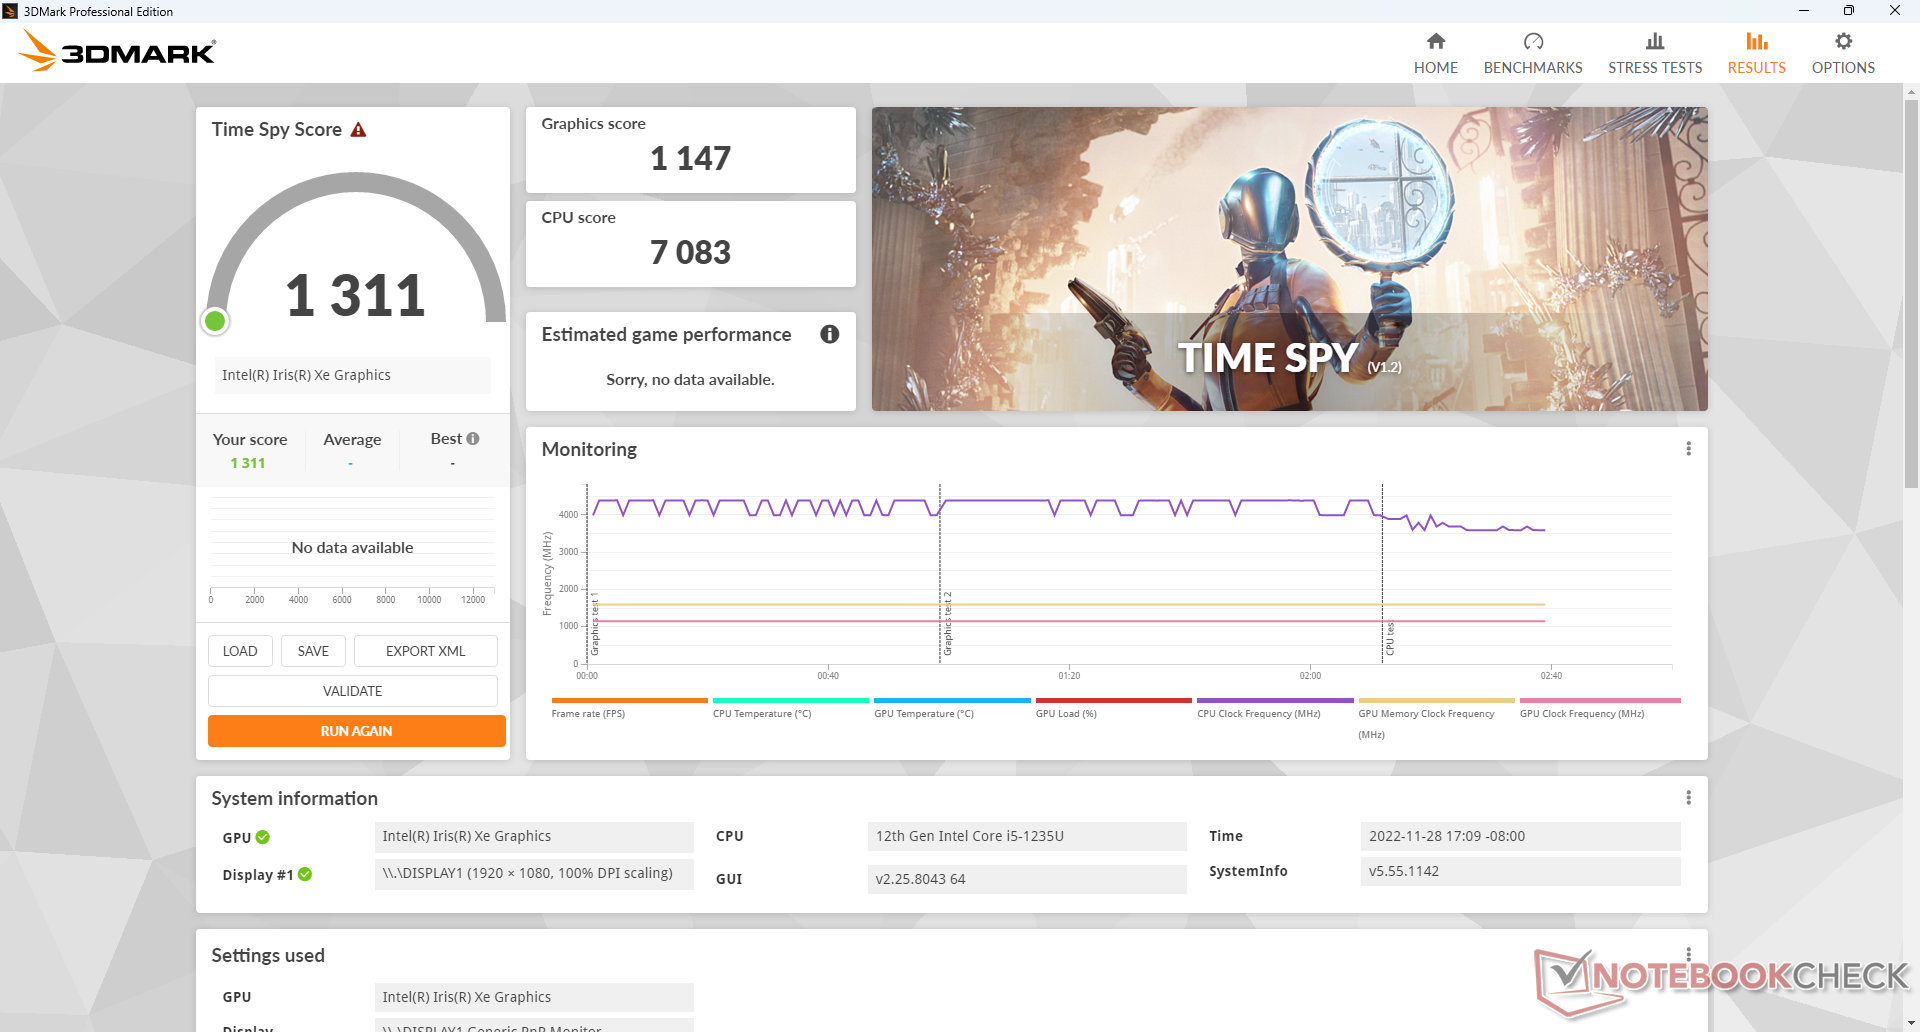
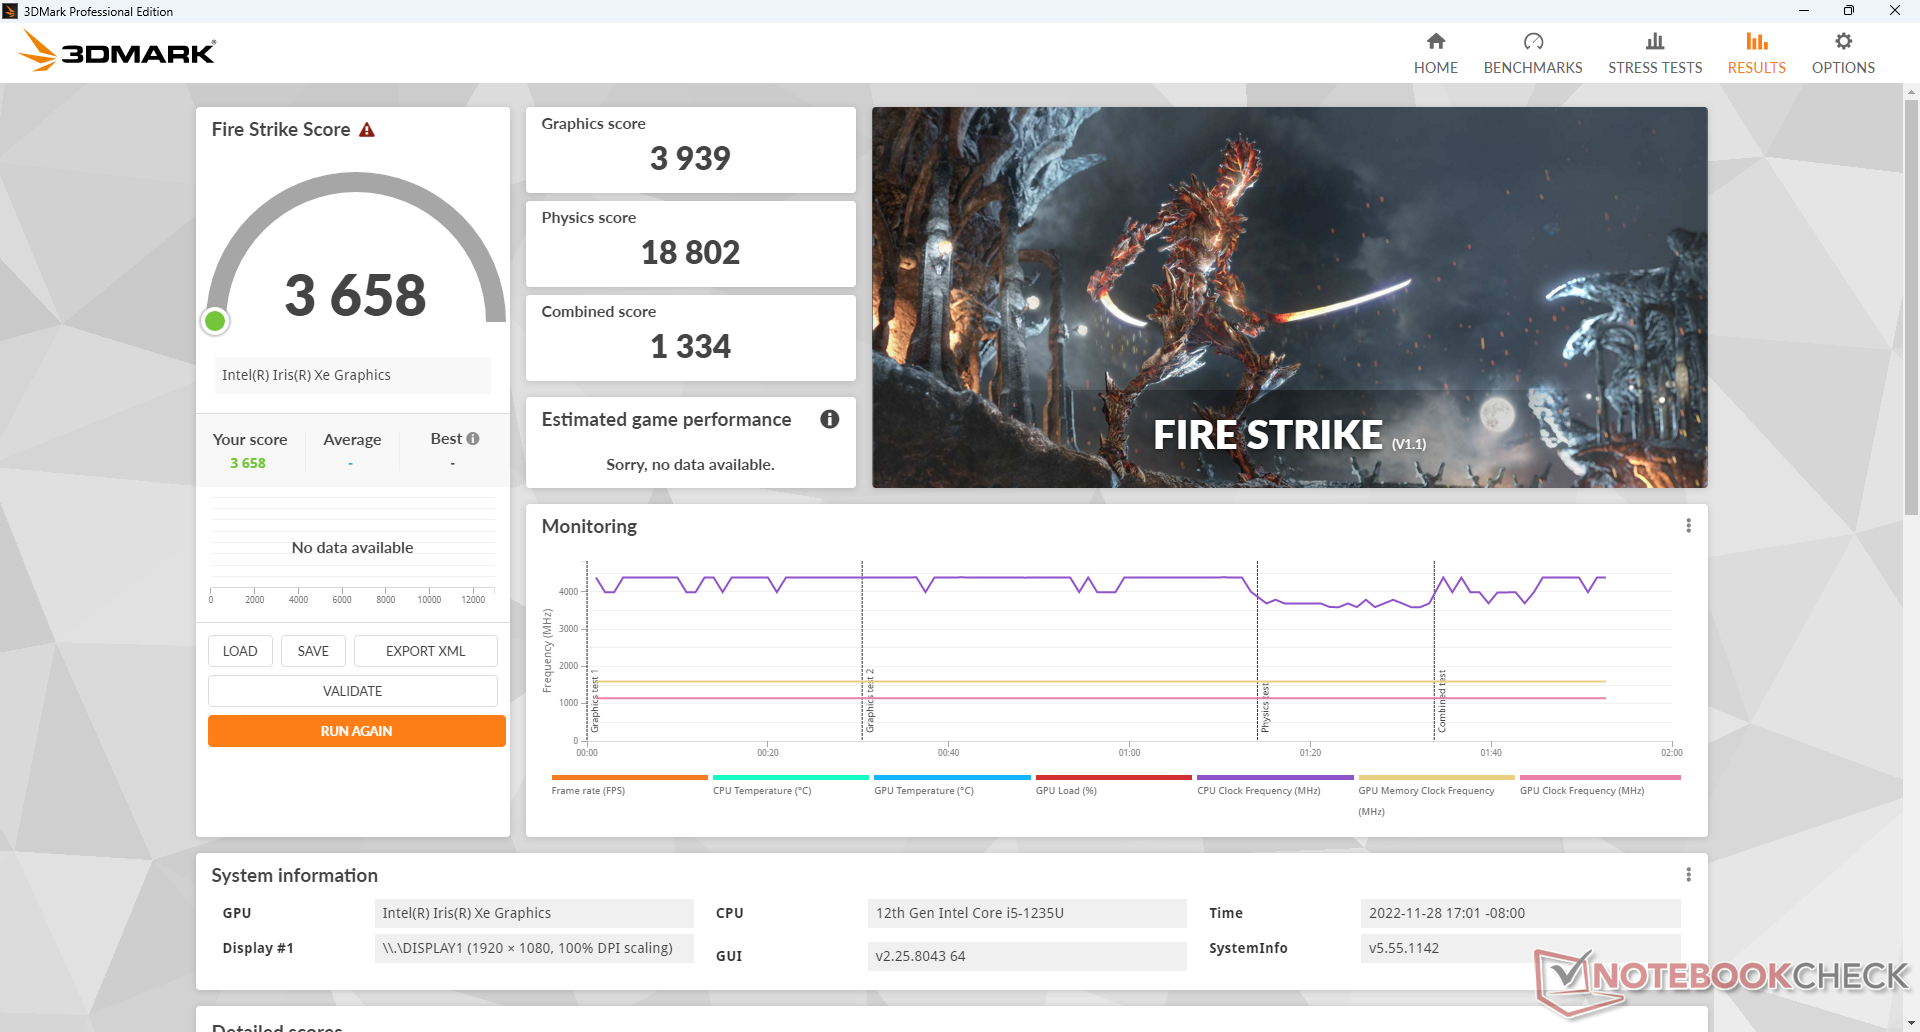
Grafikprestanda är där vi förväntar oss att den ska vara i förhållande till andra datorer med samma integrerade Iris Xe G7 80 EUs GPU. Observera att andra datorer med Iris Xe G7 96 EUs kan vara snabbare med upp till 25-40 procent om de konfigureras med dubbelkanals RAM-minne i stället för enkelkanals RAM-minne.
| 3DMark | |
| 1920x1080 Fire Strike Graphics | |
| Intel Hades Canyon NUC8i7HVK | |
| Intel NUC 12 Pro Kit NUC12WSKi7 | |
| Beelink SEi12 Core i5-1235U | |
| Beelink SER4 | |
| Genomsnitt Intel Iris Xe Graphics G7 80EUs (1560 - 5398, n=114) | |
| Intel NUC11PAQi7 | |
| Beelink SEi8 | |
| BMAX B5 Pro G7H8 | |
| 2560x1440 Time Spy Graphics | |
| Intel Hades Canyon NUC8i7HVK | |
| Intel NUC 12 Pro Kit NUC12WSKi7 | |
| Beelink SER4 | |
| Genomsnitt Intel Iris Xe Graphics G7 80EUs (561 - 1576, n=111) | |
| Intel NUC11PAQi7 | |
| Beelink SEi12 Core i5-1235U | |
| Beelink SEi8 | |
| BMAX B5 Pro G7H8 | |
| 2560x1440 Time Spy Score | |
| Intel Hades Canyon NUC8i7HVK | |
| Intel NUC 12 Pro Kit NUC12WSKi7 | |
| Beelink SER4 | |
| Genomsnitt Intel Iris Xe Graphics G7 80EUs (630 - 1791, n=111) | |
| Intel NUC11PAQi7 | |
| Beelink SEi12 Core i5-1235U | |
| Beelink SEi8 | |
| BMAX B5 Pro G7H8 | |
| 3DMark 11 - 1280x720 Performance GPU | |
| Intel Hades Canyon NUC8i7HVK | |
| Intel NUC 12 Pro Kit NUC12WSKi7 | |
| Beelink SER4 | |
| Intel NUC11PAQi7 | |
| Genomsnitt Intel Iris Xe Graphics G7 80EUs (2246 - 6579, n=112) | |
| Beelink SEi12 Core i5-1235U | |
| Beelink SEi8 | |
| BMAX B5 Pro G7H8 | |
| 3DMark 11 Performance | 5598 poäng | |
| 3DMark Cloud Gate Standard Score | 18879 poäng | |
| 3DMark Fire Strike Score | 3658 poäng | |
| 3DMark Time Spy Score | 1311 poäng | |
Hjälp | ||
* ... mindre är bättre
| Performance rating - Percent | |
| Intel Hades Canyon NUC8i7HVK | |
| Beelink SEi11 Pro -1! | |
| Beelink SER4 | |
| Beelink SEi12 Core i5-1235U | |
| Intel NUC11PAQi7 | |
| BMAX B5 Pro G7H8 -5! | |
| The Witcher 3 - 1920x1080 Ultra Graphics & Postprocessing (HBAO+) | |
| Intel Hades Canyon NUC8i7HVK | |
| Beelink SER4 | |
| Beelink SEi11 Pro | |
| Beelink SEi12 Core i5-1235U | |
| Intel NUC11PAQi7 | |
| GTA V - 1920x1080 Highest AA:4xMSAA + FX AF:16x | |
| Intel Hades Canyon NUC8i7HVK | |
| Beelink SER4 | |
| Beelink SEi12 Core i5-1235U | |
| Intel NUC11PAQi7 | |
| Final Fantasy XV Benchmark - 1920x1080 High Quality | |
| Intel Hades Canyon NUC8i7HVK | |
| Beelink SEi11 Pro | |
| Beelink SER4 | |
| Beelink SEi12 Core i5-1235U | |
| Intel NUC11PAQi7 | |
| Strange Brigade - 1920x1080 ultra AA:ultra AF:16 | |
| Intel Hades Canyon NUC8i7HVK | |
| Beelink SER4 | |
| Beelink SEi11 Pro | |
| Beelink SEi12 Core i5-1235U | |
| Intel NUC11PAQi7 | |
| Dota 2 Reborn - 1920x1080 ultra (3/3) best looking | |
| Intel Hades Canyon NUC8i7HVK | |
| Beelink SER4 | |
| Beelink SEi11 Pro | |
| Beelink SEi12 Core i5-1235U | |
| Intel NUC11PAQi7 | |
| BMAX B5 Pro G7H8 | |
| X-Plane 11.11 - 1920x1080 high (fps_test=3) | |
| Intel Hades Canyon NUC8i7HVK | |
| Beelink SEi11 Pro | |
| Beelink SER4 | |
| Beelink SEi12 Core i5-1235U | |
| Intel NUC11PAQi7 | |
Witcher 3 FPS Chart
| låg | med. | hög | ultra | |
|---|---|---|---|---|
| GTA V (2015) | 117.5 | 98.7 | 17.2 | 7.41 |
| The Witcher 3 (2015) | 77.7 | 48.7 | 26 | 12.2 |
| Dota 2 Reborn (2015) | 93.8 | 88.7 | 45.5 | 42.2 |
| Final Fantasy XV Benchmark (2018) | 35.7 | 19.3 | 13.5 | |
| X-Plane 11.11 (2018) | 48.4 | 32.8 | 29.5 | |
| Strange Brigade (2018) | 65.9 | 26.5 | 21.4 | 17.5 |
| Cyberpunk 2077 1.6 (2022) | 13.4 | 11.4 | 9 | 7.4 |
Utsläpp
Systembrus
Precis som andra minidatorer från Beelink är fläktljudet alltid närvarande på SEi12 med nästan 28 dB(A) mot en tyst bakgrund på 23 dB(A). Lyckligtvis blir systemet aldrig störande högljutt även när högre belastning introduceras. Att köra Witcher 3 eller 3DMark 06 skulle resultera i jämförbara fläktljudnivåer som för Intel NUC 11PAQ när de utsätts för liknande förhållanden. Fläktljudet kan ibland nå upp till 39 dB(A), om än bara under korta perioder innan det sjunker tillbaka till låga 30 dB(A). Mer kraftfulla minidatorer som Beelink SER-serien är ännu högre.
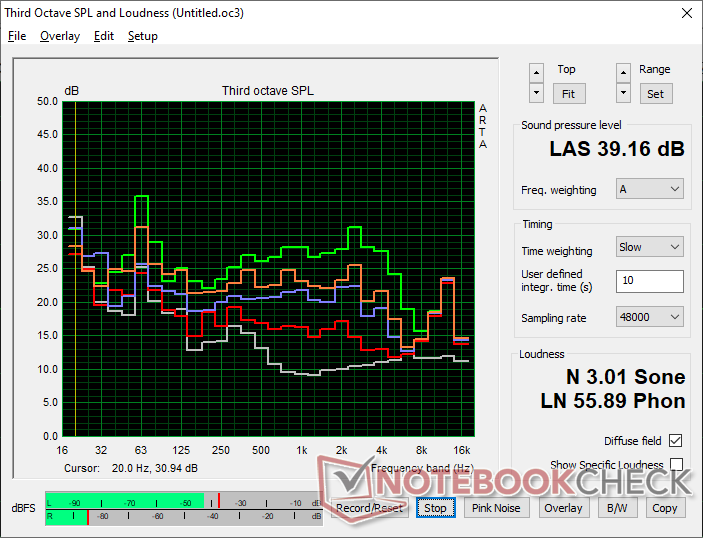
Ljudnivå
| Låg belastning |
| 27.8 / 27.8 / 27.8 dB(A) |
| Hög belastning |
| 32 / 39.2 dB(A) |
 | ||
30 dB tyst 40 dB(A) hörbar 50 dB(A) högt ljud |
||
min: | ||
| Beelink SEi12 Core i5-1235U Iris Xe G7 80EUs, i5-1235U, Kingston NV1 SNVS/500GCN | Beelink SEi8 Iris Plus Graphics 655, i3-8109U, Intel SSD 660p SSDPEKNW512G8 | Beelink SER4 Vega 8, R7 4800U, Intel SSD 660p SSDPEKNW512G8 | Intel NUC11PAQi7 Iris Xe G7 96EUs, i7-1165G7, Samsung SSD 980 Pro 500GB MZ-V8P500BW | BMAX B5 Pro G7H8 UHD Graphics 620, i5-8260U | Intel Hades Canyon NUC8i7HVK Vega M GH, i7-8809G, Intel Optane 120 GB SSDPEK1W120GA | |
|---|---|---|---|---|---|---|
| Noise | -4% | -14% | -4% | 10% | -14% | |
| av / miljö * (dB) | 23.3 | 24.5 -5% | 23.4 -0% | 25.6 -10% | 23 1% | 28.7 -23% |
| Idle Minimum * (dB) | 27.8 | 26.5 5% | 33.2 -19% | 25.6 8% | 25.1 10% | 29 -4% |
| Idle Average * (dB) | 27.8 | 26.5 5% | 33.2 -19% | 25.6 8% | 25.1 10% | 29 -4% |
| Idle Maximum * (dB) | 27.8 | 31.1 -12% | 33.2 -19% | 25.6 8% | 25.1 10% | 29 -4% |
| Load Average * (dB) | 32 | 37.7 -18% | 38.6 -21% | 33.6 -5% | 28.6 11% | 36 -13% |
| Witcher 3 ultra * (dB) | 34.1 | 39.2 -15% | 33.6 1% | 30.1 12% | 42 -23% | |
| Load Maximum * (dB) | 39.2 | 37.5 4% | 40.8 -4% | 54.5 -39% | 34 13% | 49.4 -26% |
* ... mindre är bättre
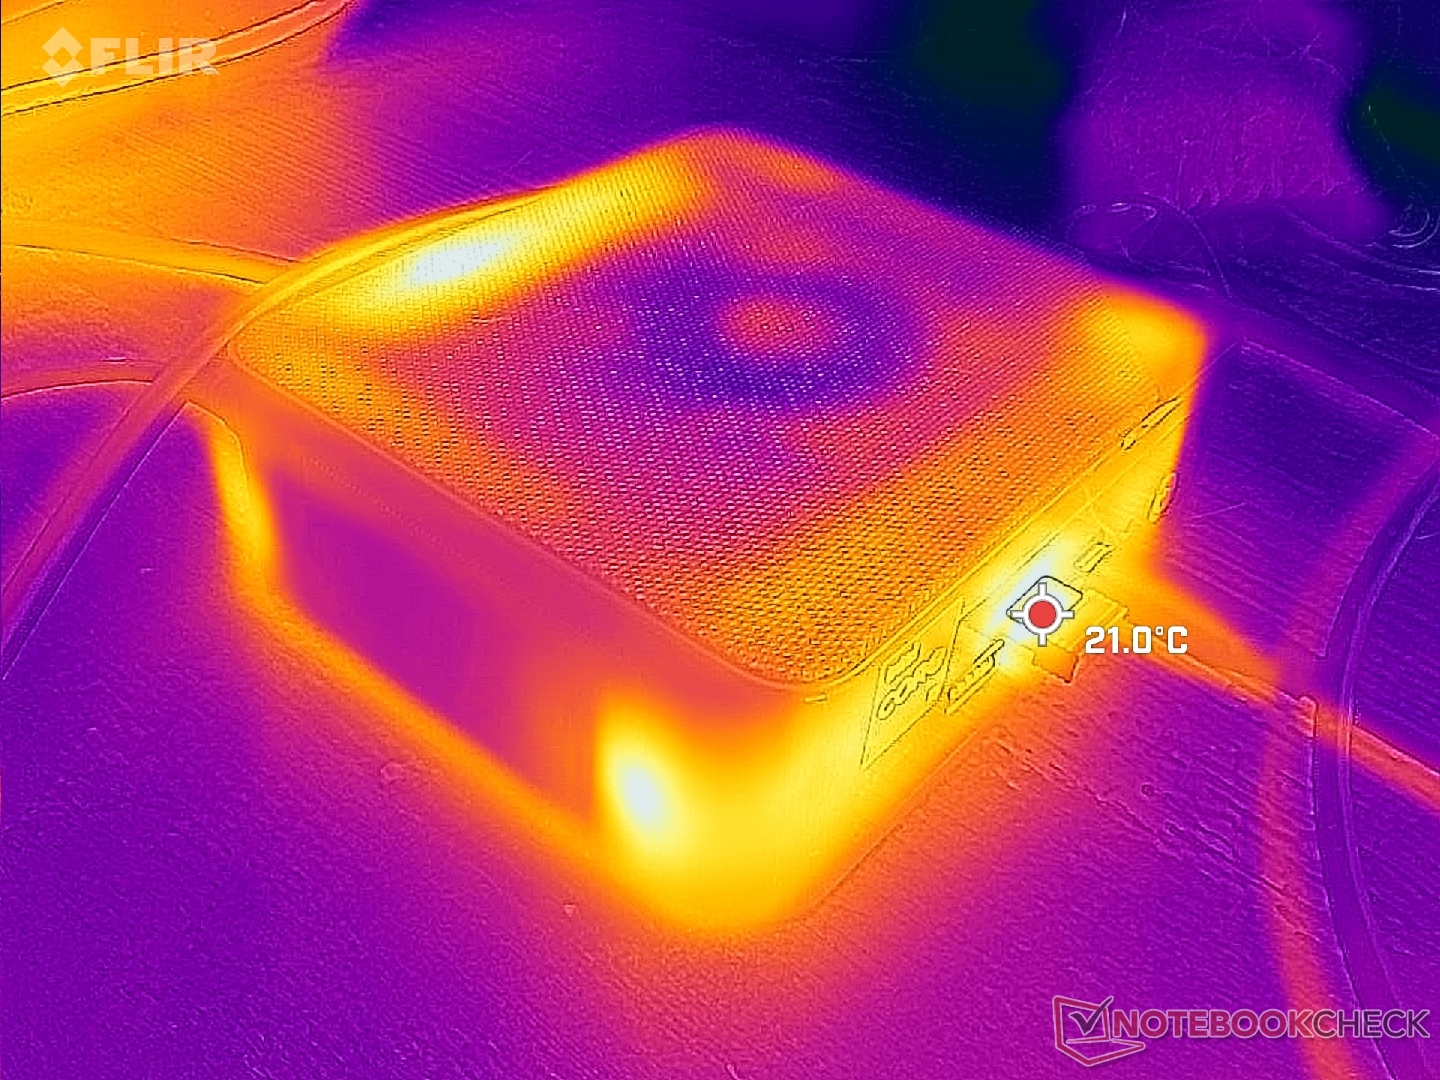
Temperatur
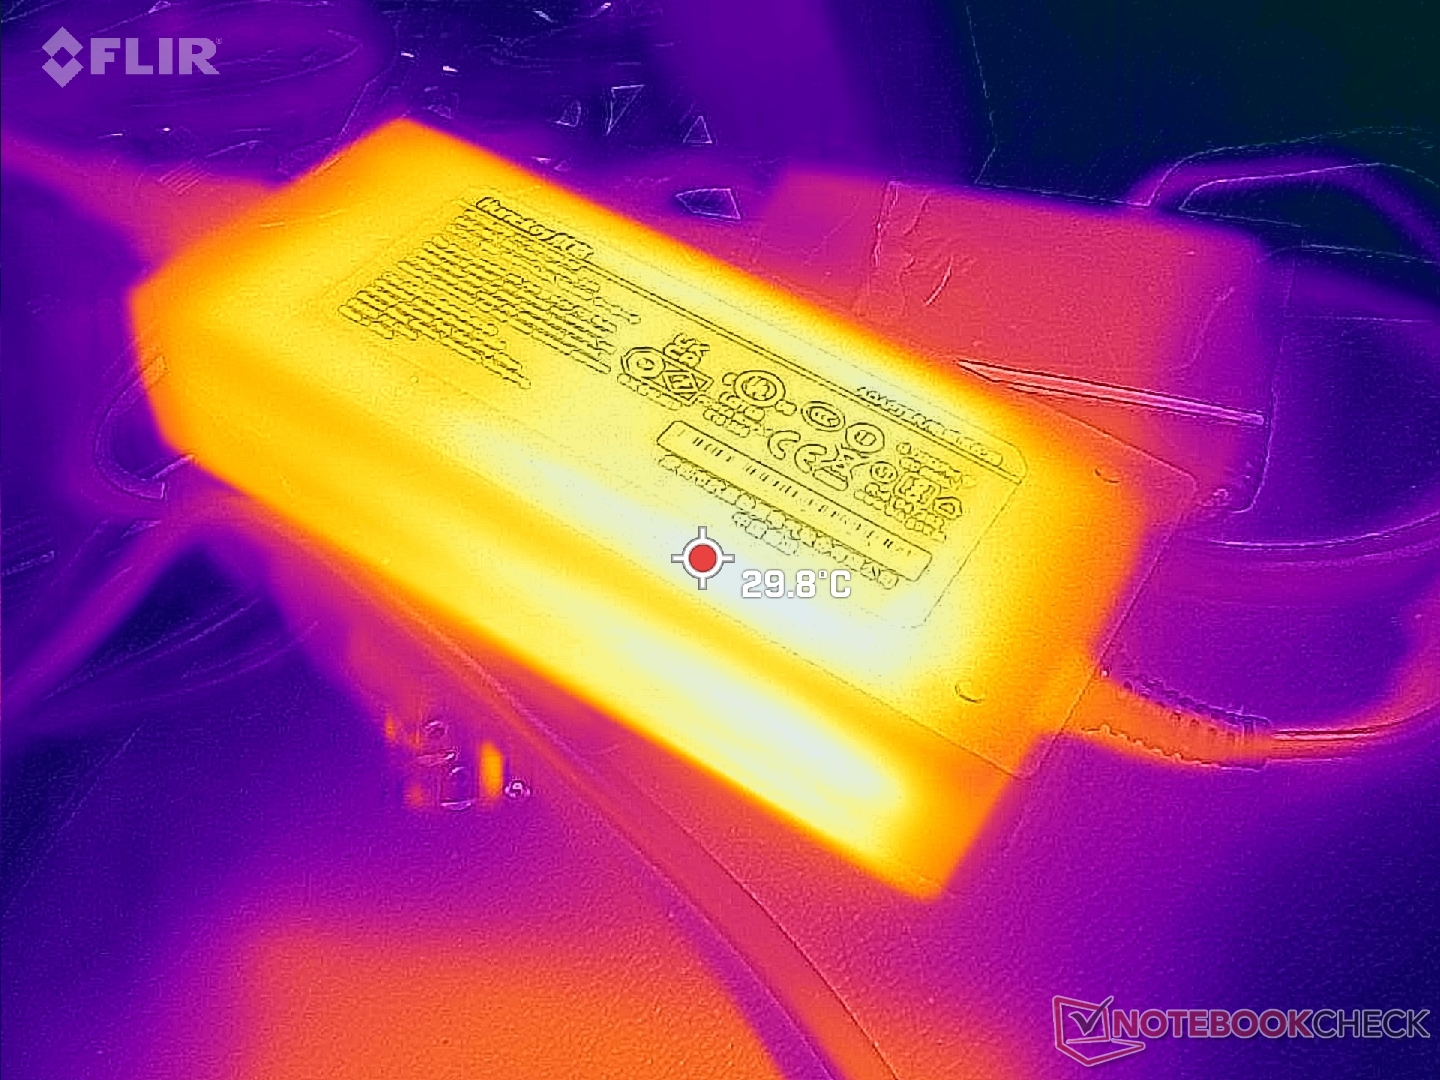
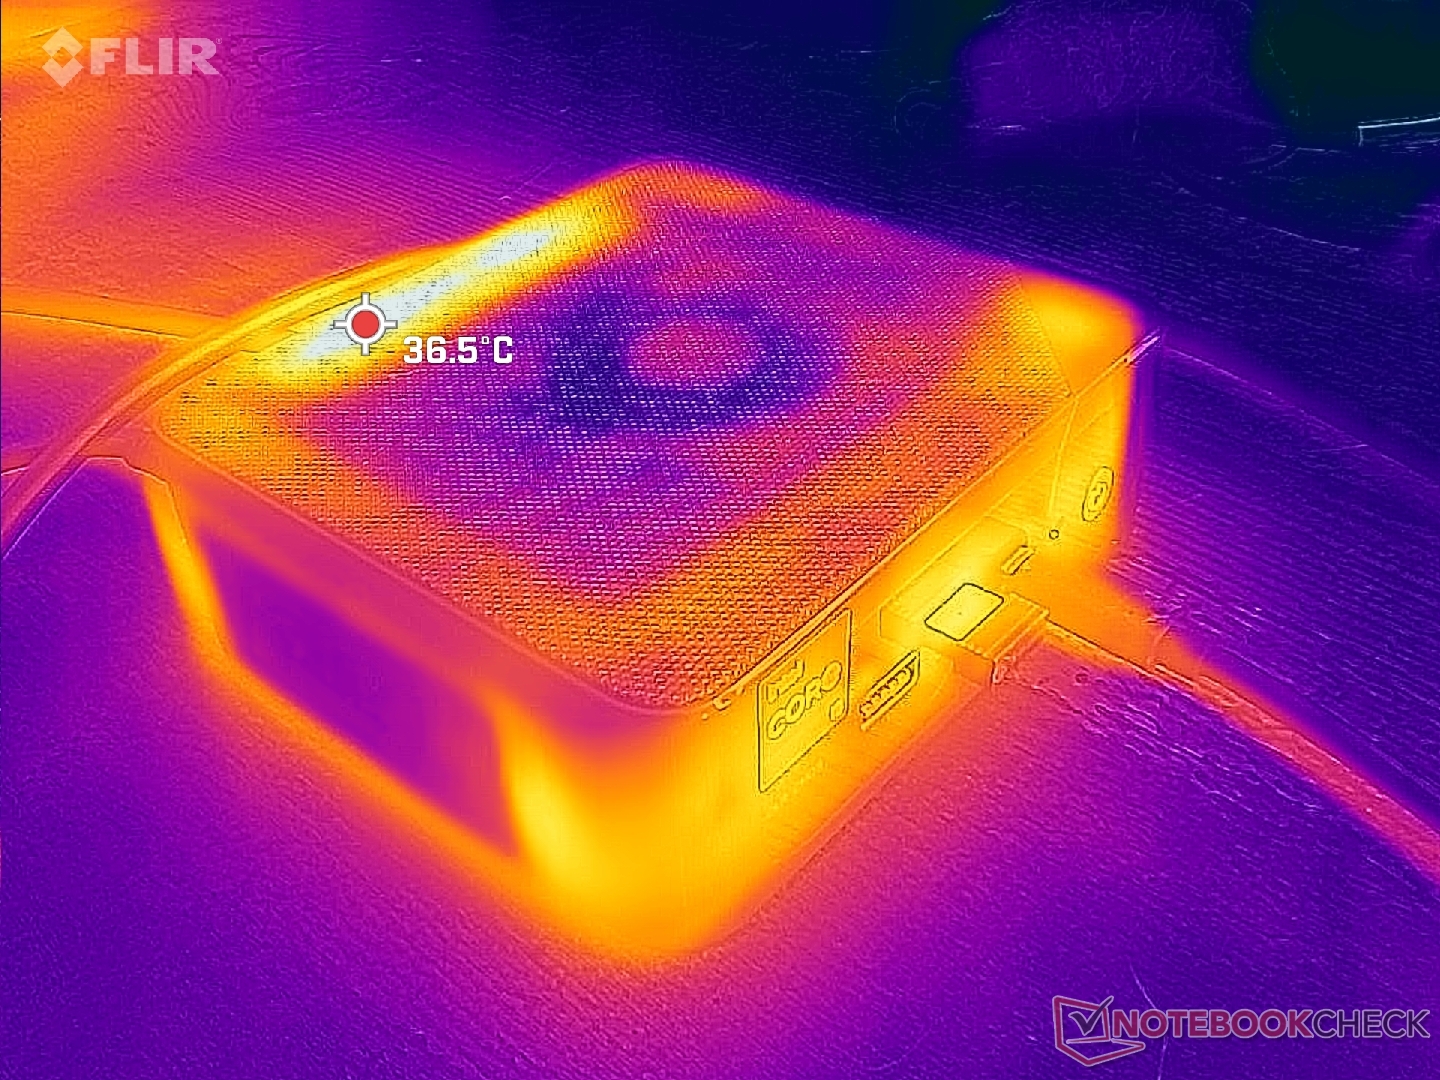
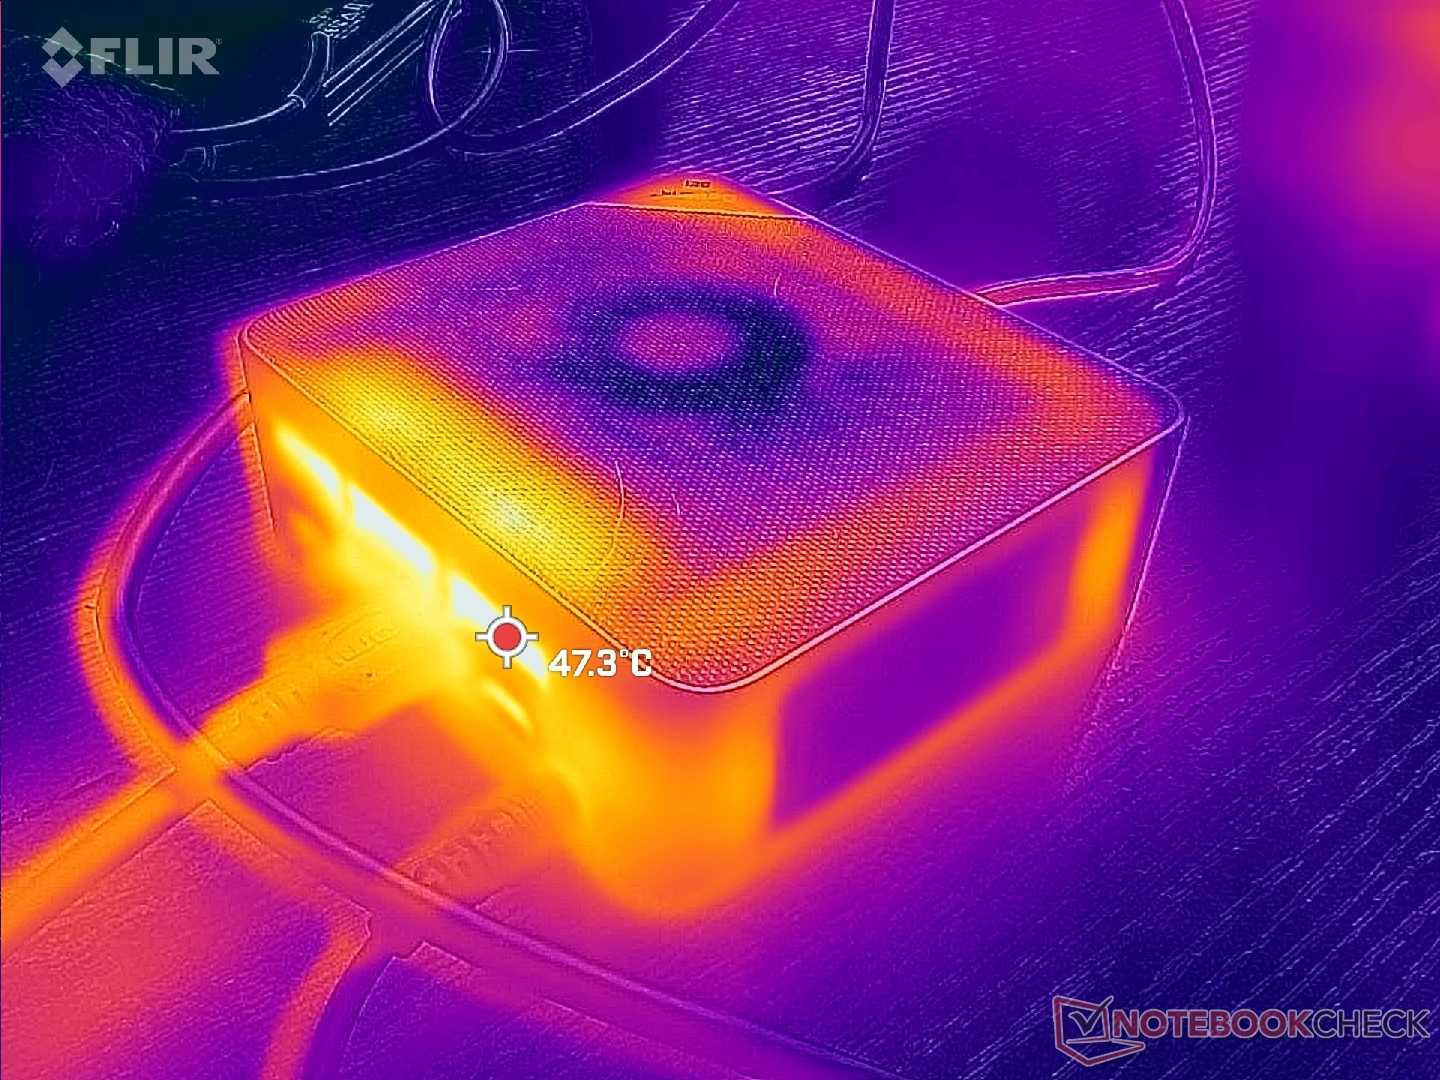
Kall luft kommer in från sidorna och den övre maskan medan varm luft kommer ut bakifrån, vilket framgår av temperaturkartorna nedan. Den heta punkten på baksidan kan bli så varm som 47 C vid krävande tillämpningar. Det rekommenderas inte att placera några föremål ovanpå enheten, eftersom luftflödet annars kommer att minska.
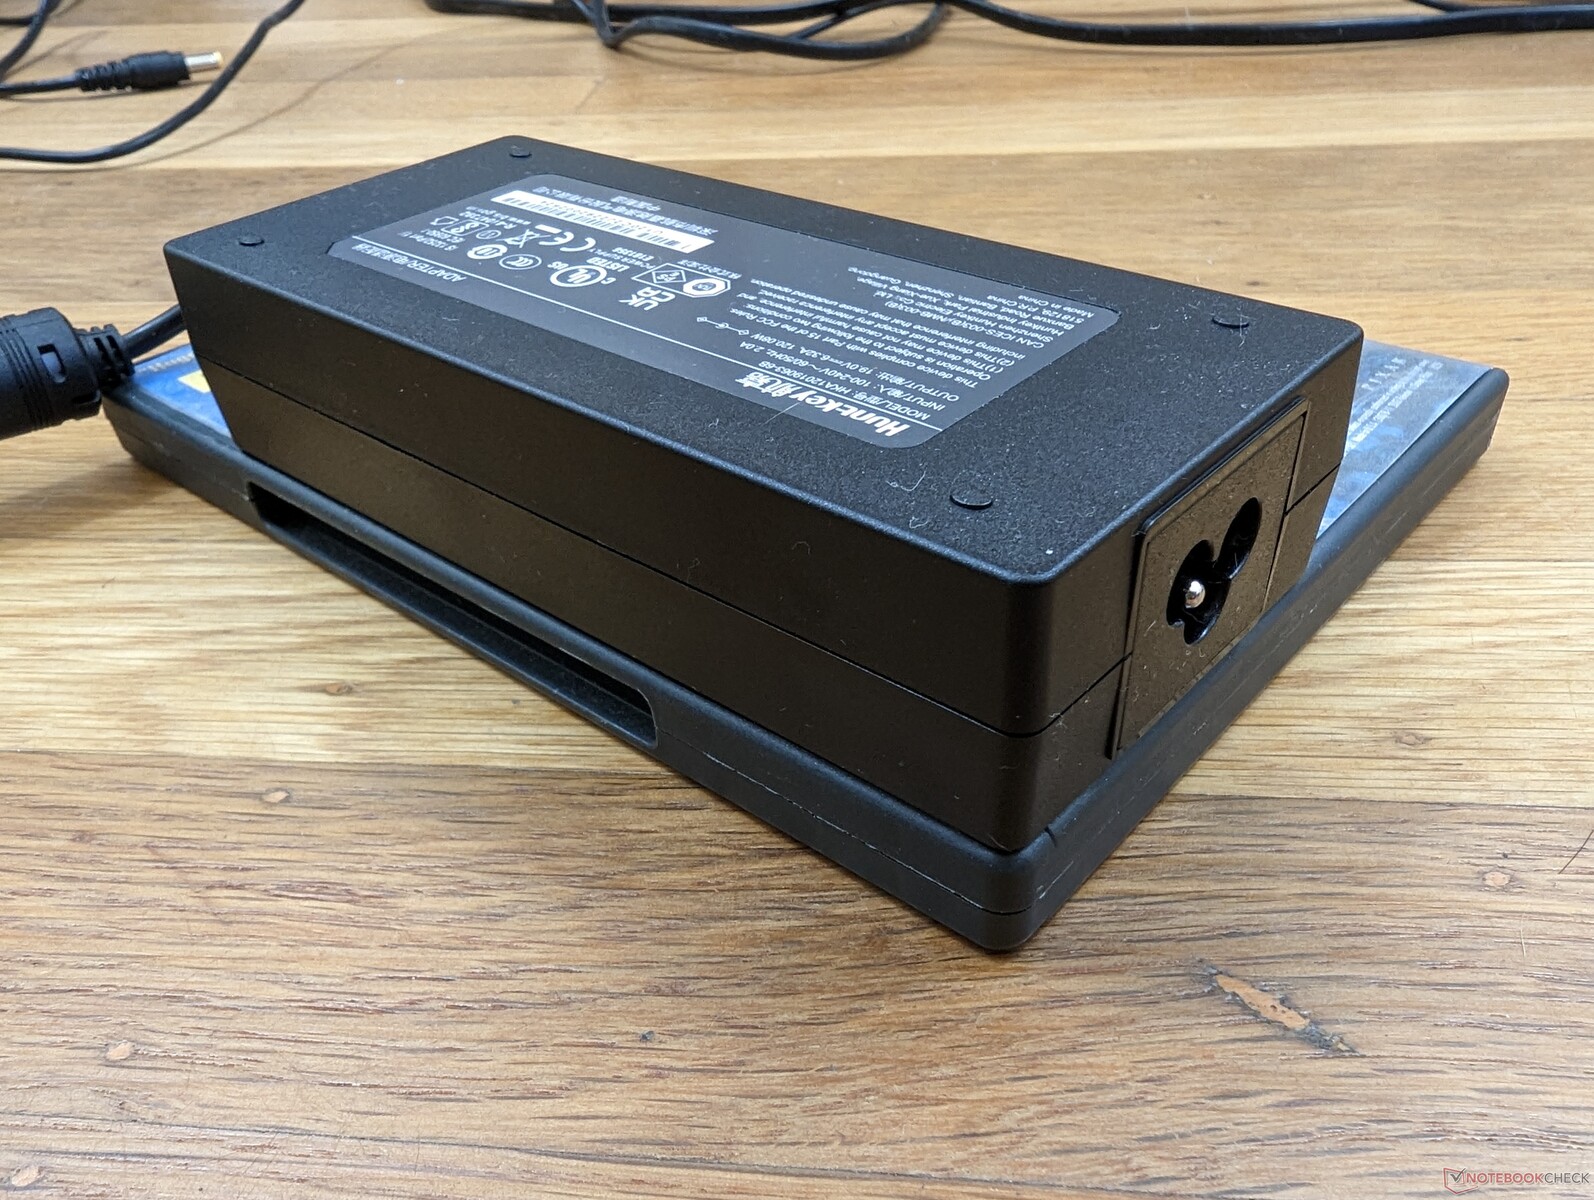
Växelströmsadaptern kan nå 30 C när krävande belastningar körs under långa perioder.

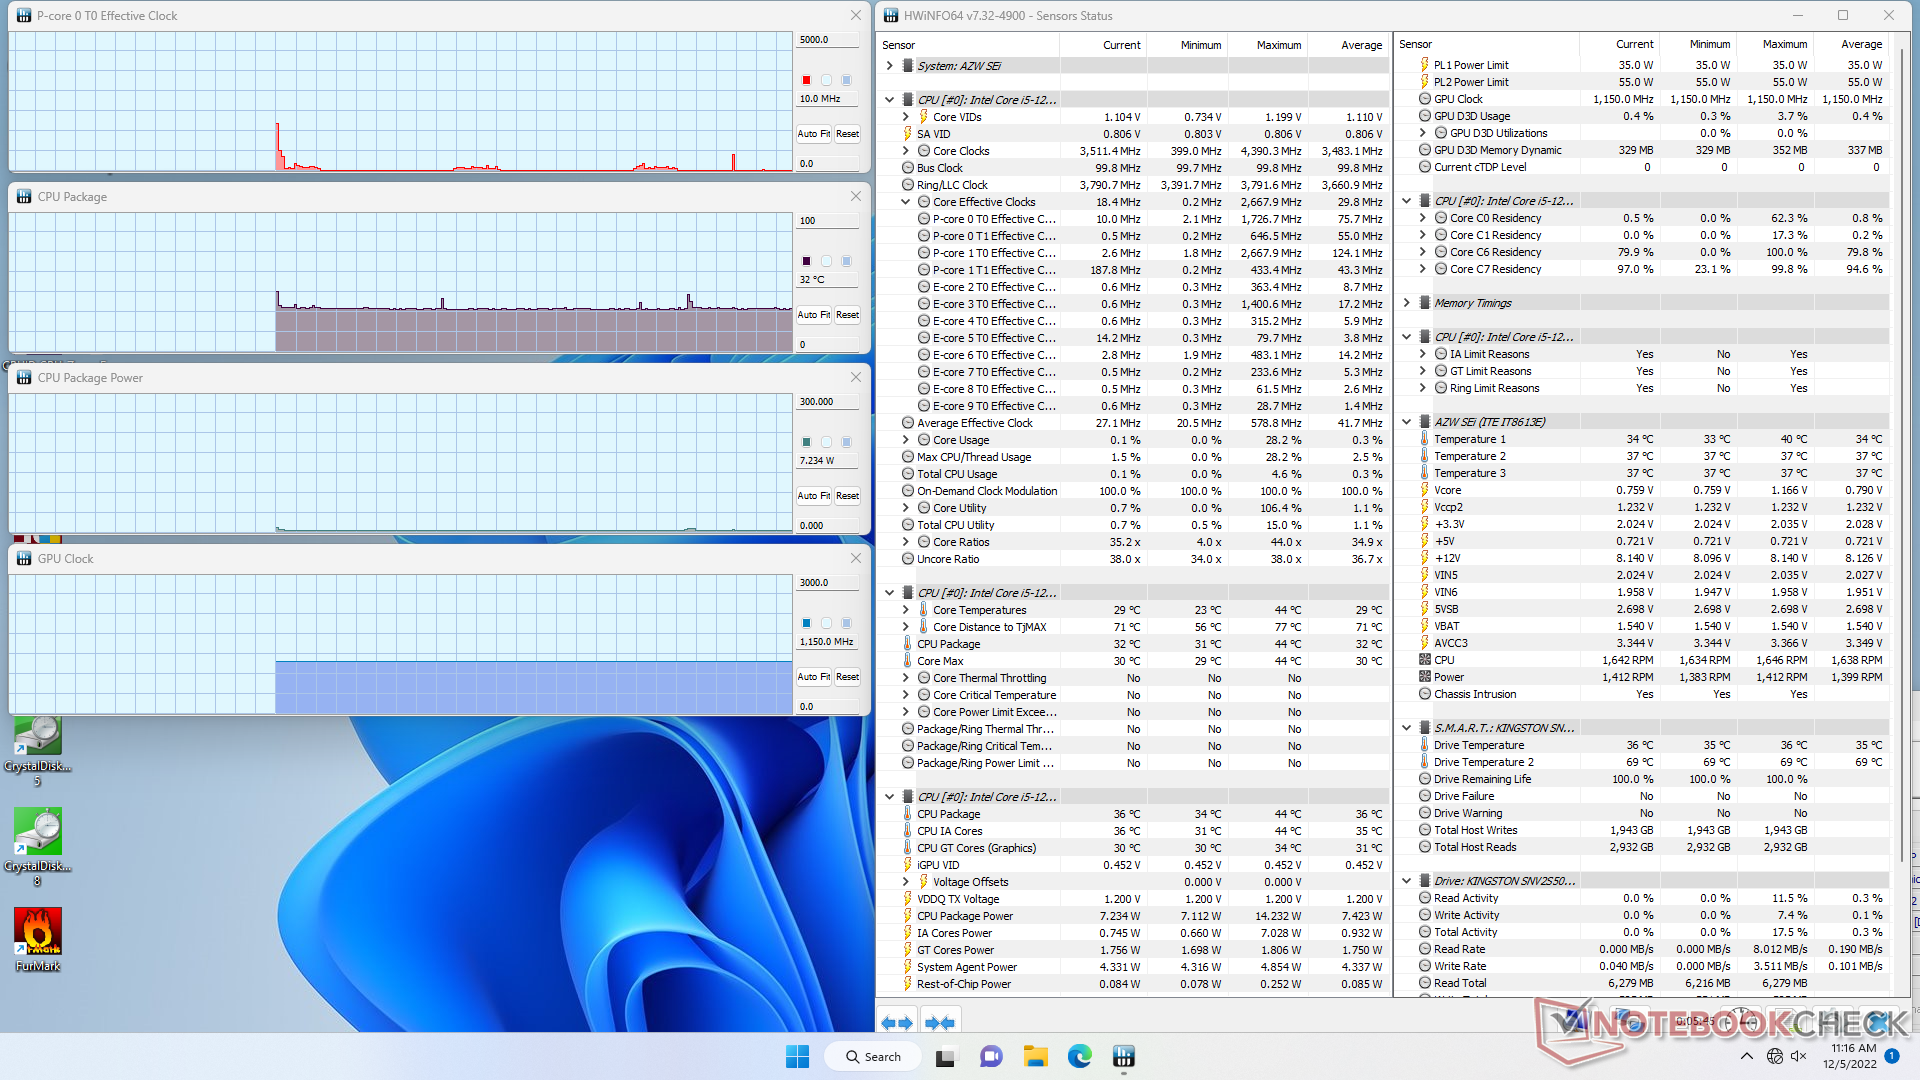
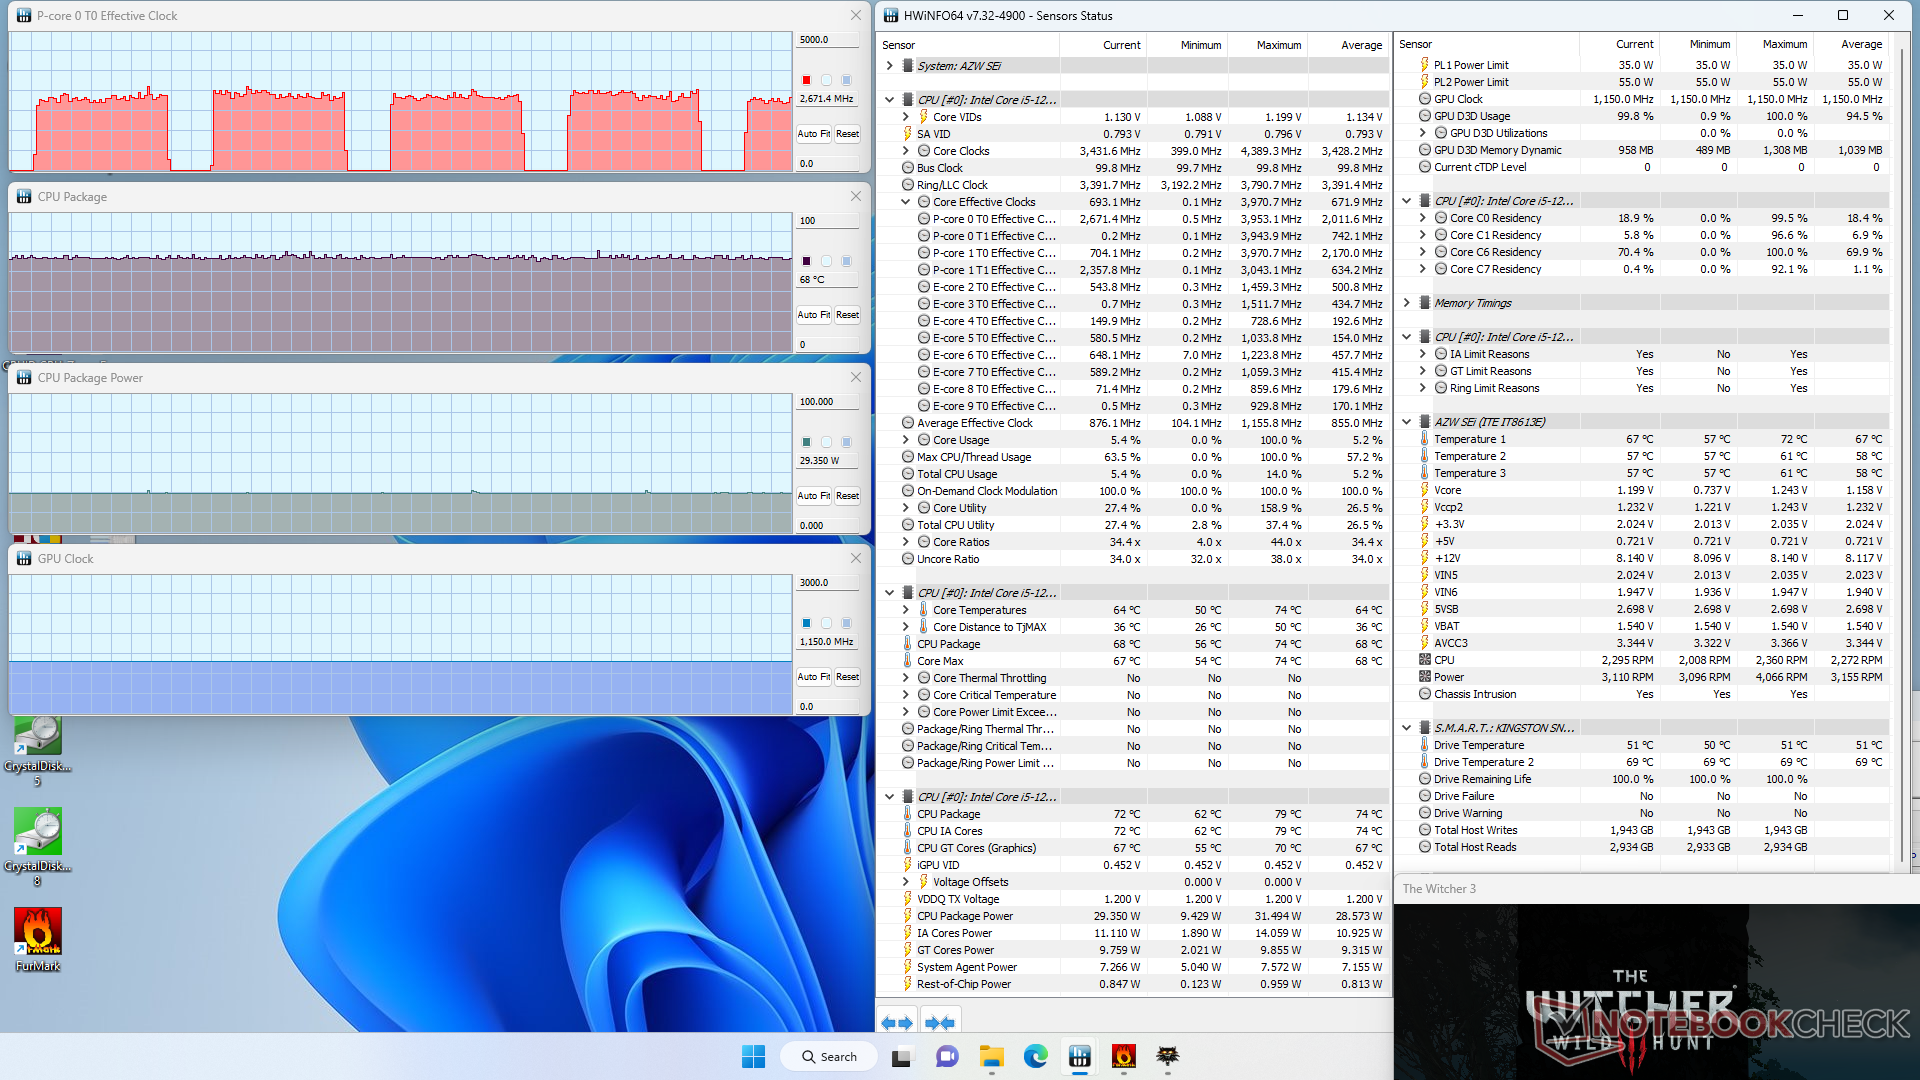
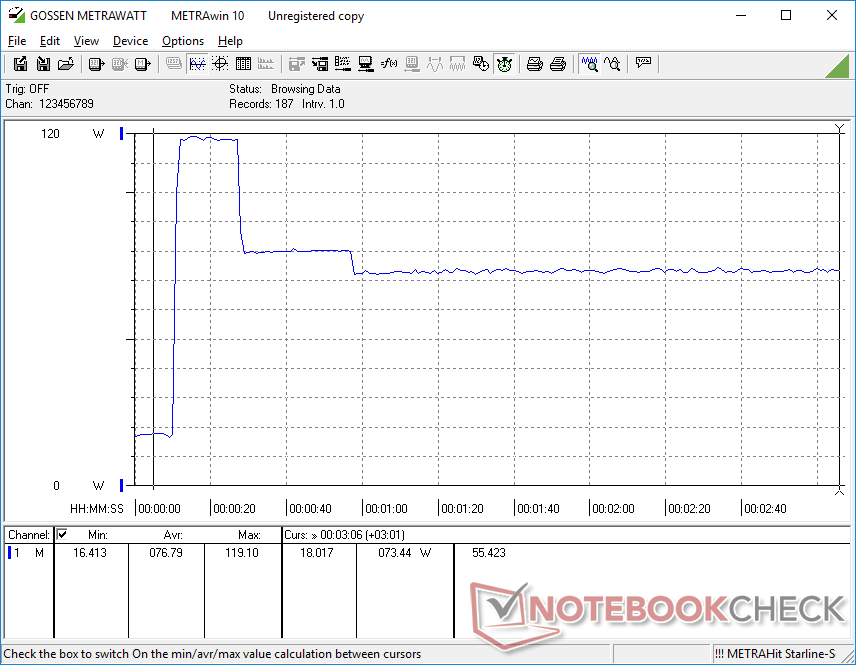
Stresstest
När processorn belastas med Prime95 ökar den till 3,6 GHz med en processoreffekt på 47 W. När kärntemperaturen når 76 C bara några sekunder senare sjunker dock klockfrekvensen och effektuttaget till 2,1 GHz respektive 27 W för att bibehålla en svalare kärntemperatur på 67 C.
GPU-klockfrekvens och temperatur vid körning Witcher 3 skulle stabiliseras på 1150 MHz respektive 68 C, jämfört med 1300 MHz och 57 C på den dyrare Intel NUC11PAQi7.
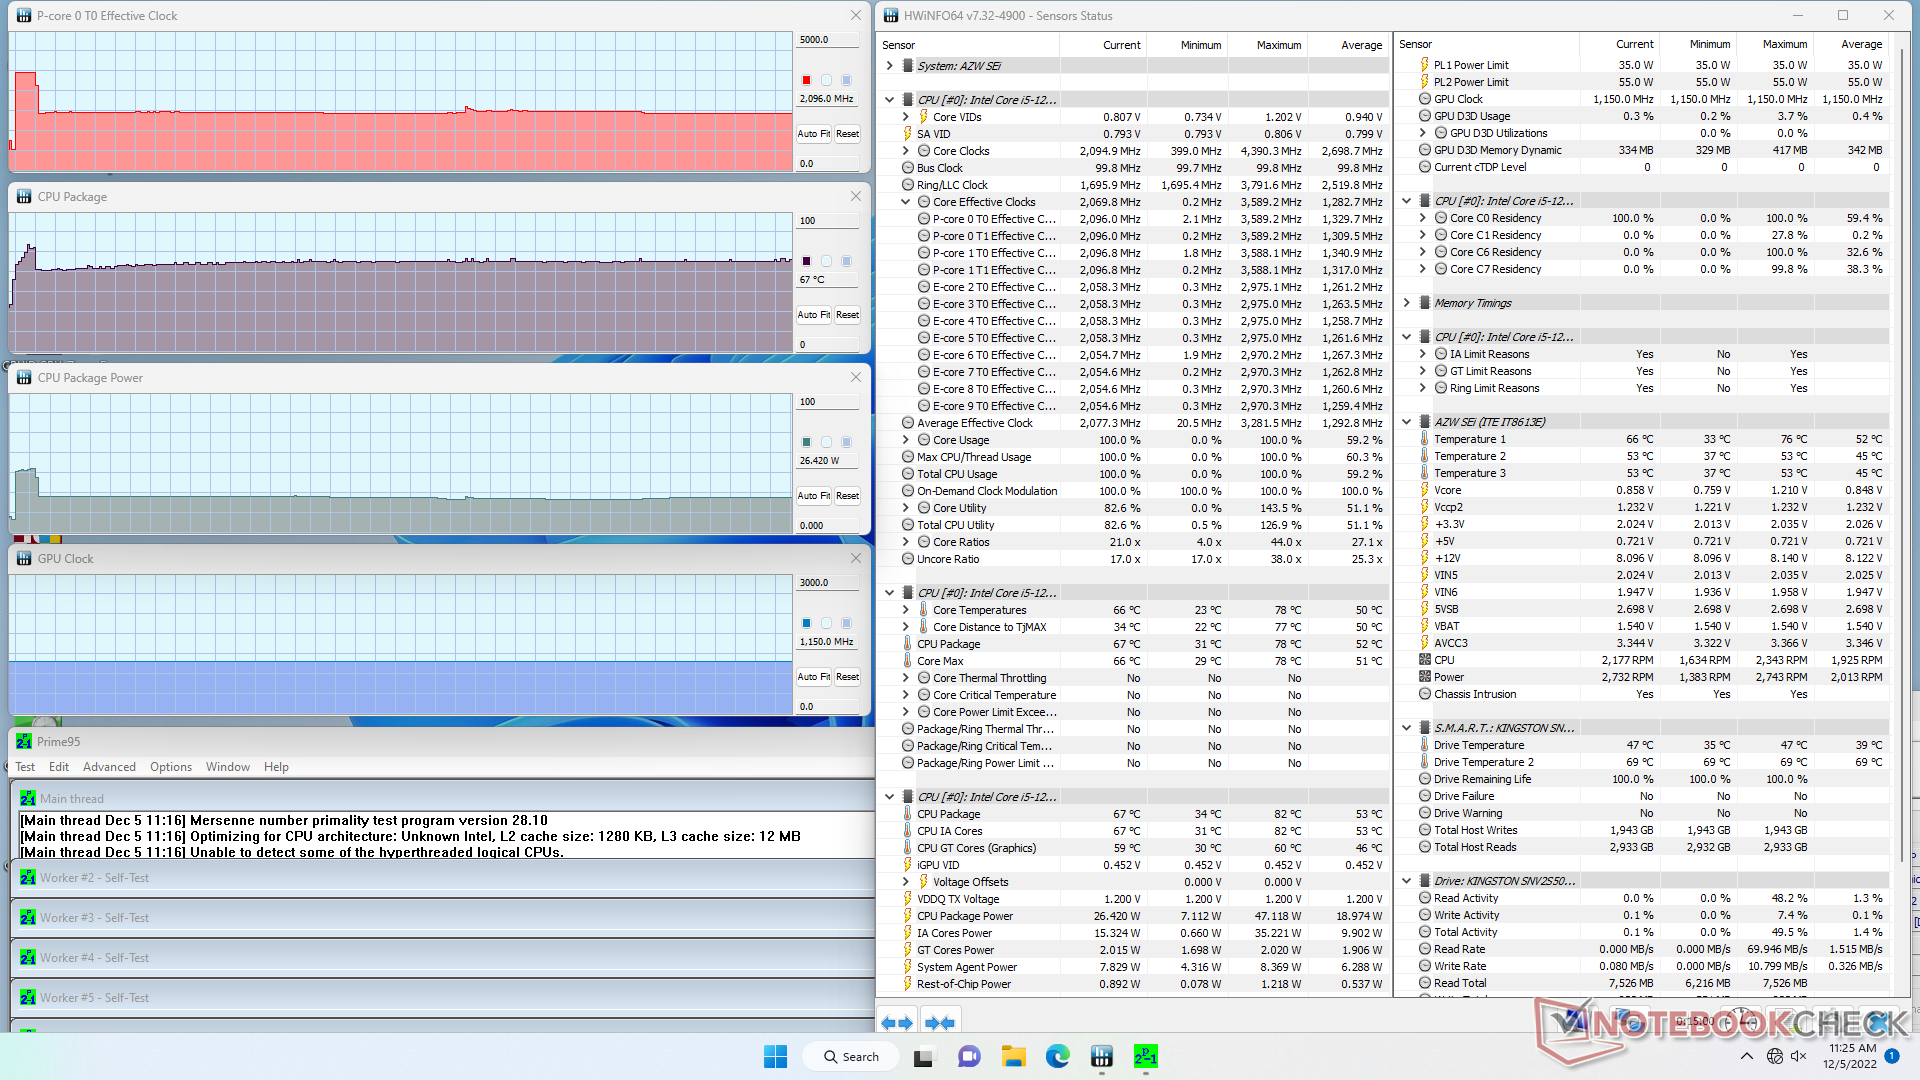
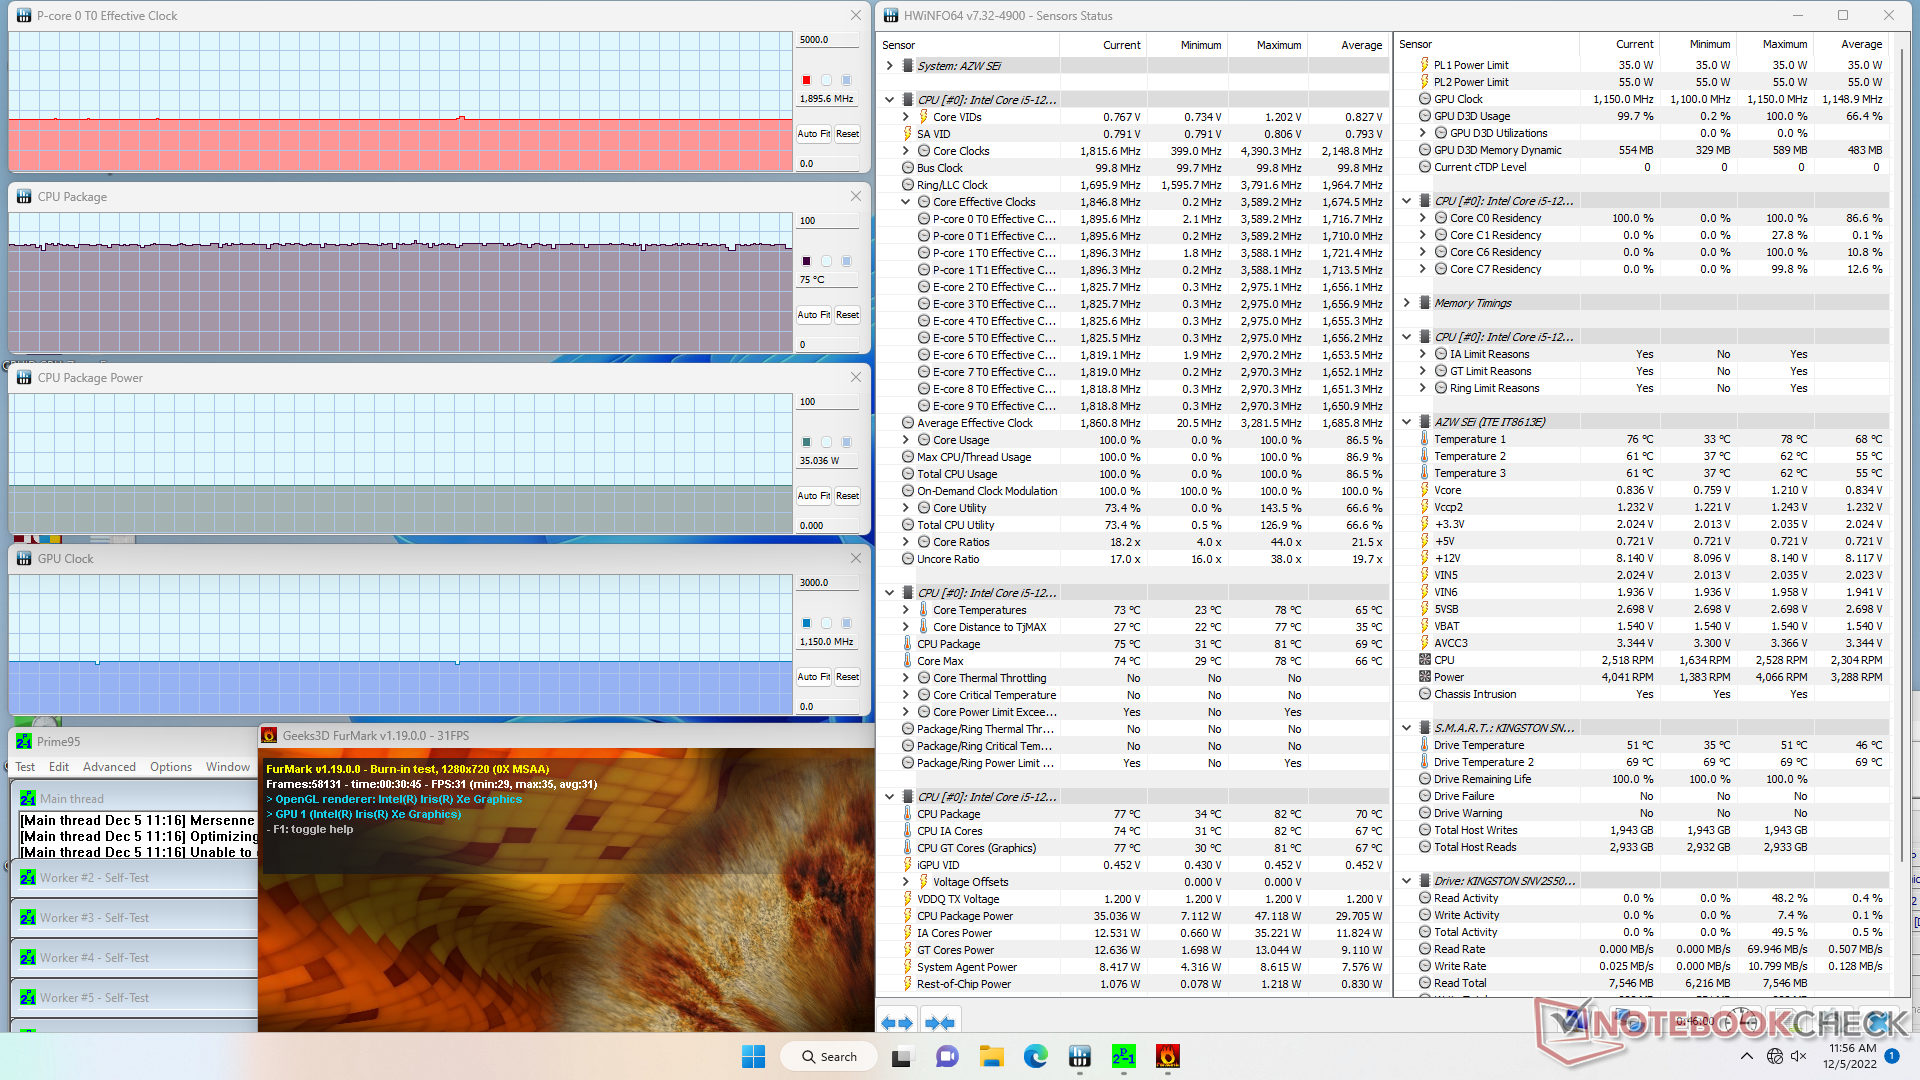
| CPU-klocka (GHz) | GPU-klocka (MHz) | Genomsnittlig CPU-temperatur (°C) | |
| Systemets tomgång | -- | -- | 32 |
| Prime95 Stress | 2.1 | 1150 | 67 |
| Prime95 + FurMark Stress | 1,9 | 1150 | 75 |
| Witcher 3 Stress | ~2,6 | 1150 | 68 |
Energiförvaltning
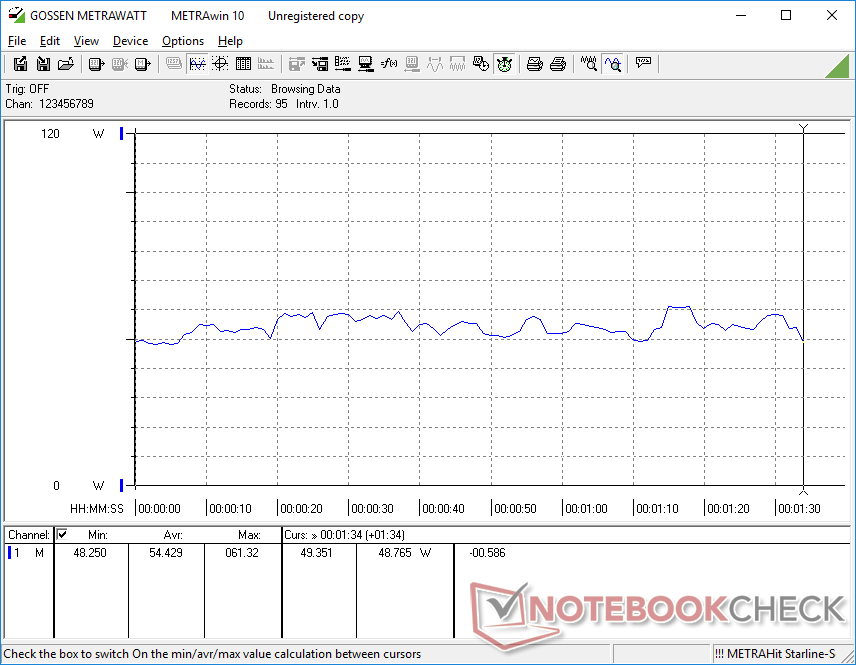
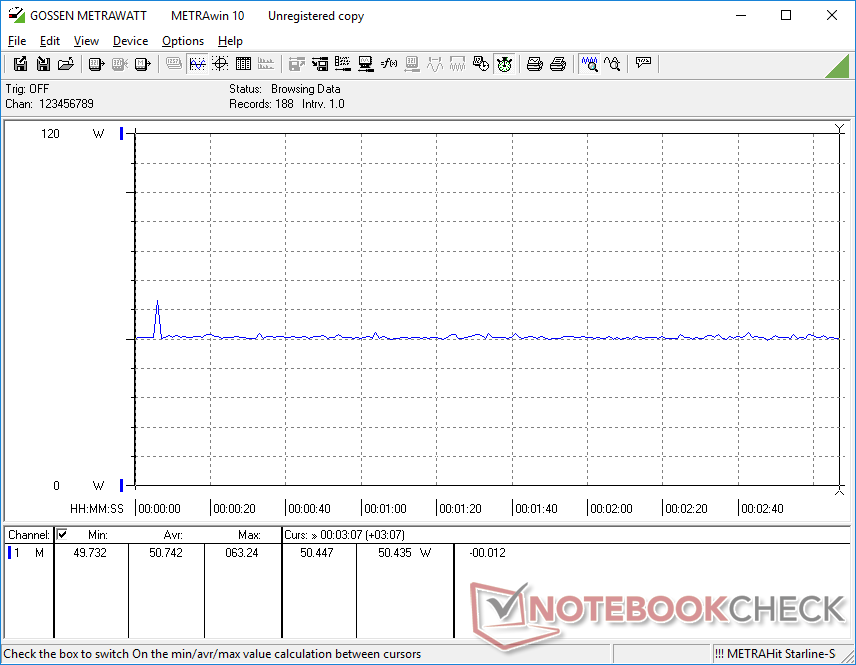
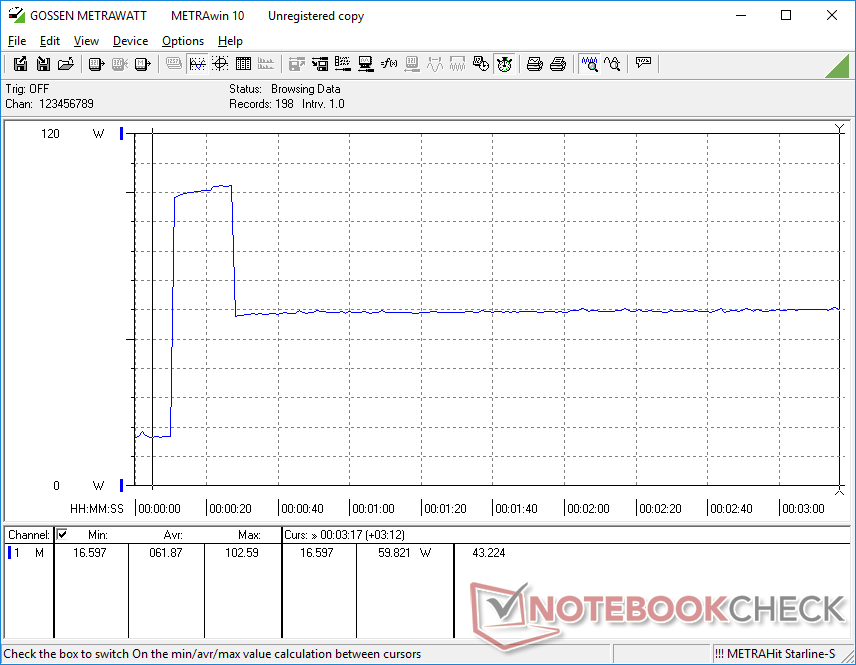
Effektförbrukning
Strömförbrukningen är relativt hög, vilket kan förklara varför nätadaptern är större än väntat. Tomgång på skrivbordet förbrukar cirka 17 W jämfört med mindre än hälften så mycket för andra minidatorer som drivs av U-serien, t.ex SER4 eller Intel NUC11. När man kör krävande belastningar som spel skulle förbrukningen i genomsnitt ligga runt 50 W jämfört med strax under 40 W på NUC11.
| Av/Standby | |
| Låg belastning | |
| Hög belastning |
|
Förklaring:
min: | |
| Beelink SEi12 Core i5-1235U i5-1235U, Iris Xe G7 80EUs, Kingston NV1 SNVS/500GCN, , x, | Beelink SEi8 i3-8109U, Iris Plus Graphics 655, Intel SSD 660p SSDPEKNW512G8, , x, | Beelink SER4 R7 4800U, Vega 8, Intel SSD 660p SSDPEKNW512G8, , x, | Intel NUC11PAQi7 i7-1165G7, Iris Xe G7 96EUs, Samsung SSD 980 Pro 500GB MZ-V8P500BW, , x, | BMAX B5 Pro G7H8 i5-8260U, UHD Graphics 620, , , x, | Intel Hades Canyon NUC8i7HVK i7-8809G, Vega M GH, Intel Optane 120 GB SSDPEK1W120GA, , x, | |
|---|---|---|---|---|---|---|
| Power Consumption | 49% | 59% | 49% | 49% | -38% | |
| Idle Minimum * (Watt) | 15.8 | 7.5 53% | 4.1 74% | 5.6 65% | 6 62% | 15.5 2% |
| Idle Average * (Watt) | 16.8 | 7.6 55% | 4.1 76% | 5.6 67% | 6.2 63% | 16.2 4% |
| Idle Maximum * (Watt) | 17 | 9.2 46% | 4.6 73% | 6 65% | 6.3 63% | 16.5 3% |
| Load Average * (Watt) | 54.4 | 41.1 24% | 35.6 35% | 31.4 42% | 42.8 21% | 83.4 -53% |
| Witcher 3 ultra * (Watt) | 50.7 | 35.6 30% | 39 23% | 35 31% | 121.7 -140% | |
| Load Maximum * (Watt) | 119.1 | 41.4 65% | 39.9 66% | 80.5 32% | 55.8 53% | 173.5 -46% |
* ... mindre är bättre
Power Consumption Witcher 3 / Stresstest
Power Consumption external Monitor
För
Emot
Bedömning - Lågt pris utan att skära ner på prestandan
SEi12 erbjuder jämförbara och ofta bättre prestanda än en Intel NUC11 med Core U-drift och kostar mycket mindre. NUC11PAH med Core i5-1135G7-processor, 16 GB RAM och 256 GB SSD kostar för närvarande 550 dollar, medan vår SEi 12 med dubbelt så mycket lagringsutrymme kostar bara 400 dollar. Modellen förlitar sig inte på förfärligt långsamma Celeron- eller Atom-lösningar för att nå attraktiva prisnivåer och detta förblir ett viktigt försäljningsargument för många minidatorer från Beelink.
Avsaknaden av Thunderbolt-stöd är en besvikelse, men detta kommer troligen bara att påverka entusiaster som vill daisy chaina högupplösta bildskärmar eller ansluta eGPU:er. För vad det är värt börjar Intel slå tillbaka med den senaste NUC12-serien som nu erbjuder ännu snabbare Core P CPU:er. Om du är nöjd med prestandan hos en modern Ultrabook kommer Core i5-1235U i SEi12 fortfarande att vara mer än tillräckligt och säkerligen mycket snabbare än de flesta minidatorer i samma prisklass.
Pris och tillgänglighet
Beelink SEi12 säljs för närvarande för $400 USD på Amazon från sitt ursprungliga pris på 480 dollar. Alternativt kan användare köpa direkt från tillverkaren för 460 dollar.
Price comparison

