Intel Core i5-8260U debut: BMAX B5 Pro G7H8 mini PC granskning
I likhet med Chuwi har BMax specialiserat sig på billiga bärbara datorer, skärmar och minidatorer som i allmänhet är hundratals dollar billigare än de mest grundläggande enheterna från större och mer kända tillverkare. Deras hemlighet är användningen av CPU:er av äldre generation som kan sänka kostnaden för enheterna avsevärt
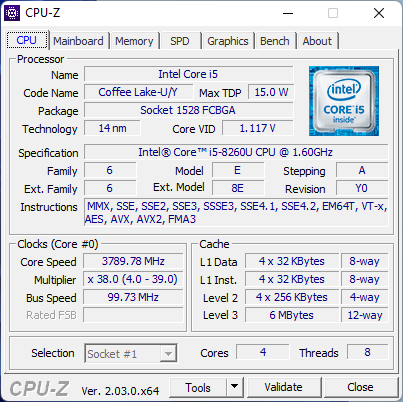
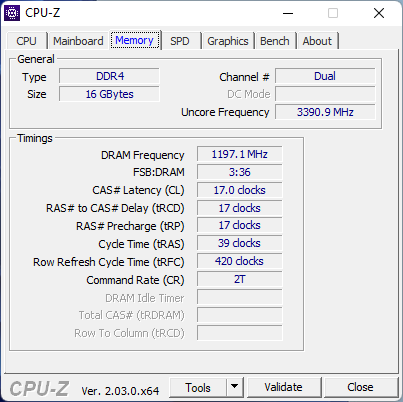
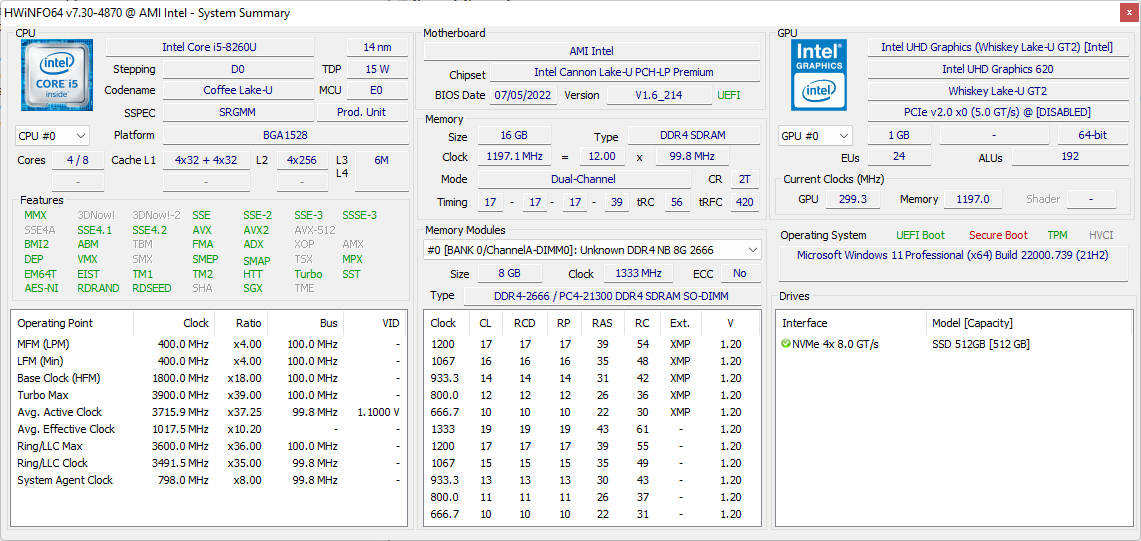
BMax B5 Pro är den senaste minidatorn från tillverkaren som riktar sig till HTPC-användare med en snävare budget. Den är anmärkningsvärd för att den har en äldre 8:e generationens Intel Core U-series CPU medan de senaste minidatorerna använder 12:e generationens alternativ. Vår specifika konfiguration kommer med den ovanliga Coffee Lake Core i5-8260U CPU:n med 16 GB RAM, 512 GB NVMe SSD och Windows 11 förinstallerat för endast 280 USD i skrivande stund. B5 Pro konkurrerar direkt med andra billiga minidatorer som Beelink SEi8 eller GMK NucBox 2.
Fler recensioner av BMax:
Potentiella konkurrenter i jämförelse
Gradering | Datum | Modell | Vikt | Höjd | Storlek | Upplösning | Pris |
|---|---|---|---|---|---|---|---|
v (old) | 11/2022 | BMAX B5 Pro G7H8 i5-8260U, UHD Graphics 620 | 369 g | 43.2 mm | x | ||
v (old) | 09/2022 | Beelink SEi11 Pro i5-11320H, Iris Xe G7 96EUs | 440 g | 40 mm | x | ||
v (old) | 09/2022 | Beelink U59 N5105 Celeron N5105, UHD Graphics (Jasper Lake 24 EU) | 320 g | 42 mm | x | ||
v (old) | 04/2022 | Beelink SEi8 i3-8109U, Iris Plus Graphics 655 | 346 g | 41 mm | x | ||
v (old) | 10/2022 | Beelink SER Pro Ryzen 5 5600H R5 5600H, Vega 7 | 498 g | 42 mm | x | ||
v (old) | Intel NUC11TNKi5 i5-1135G7, Iris Xe G7 80EUs | 504 g | 37 mm | x |
Case - Inget ovanligt
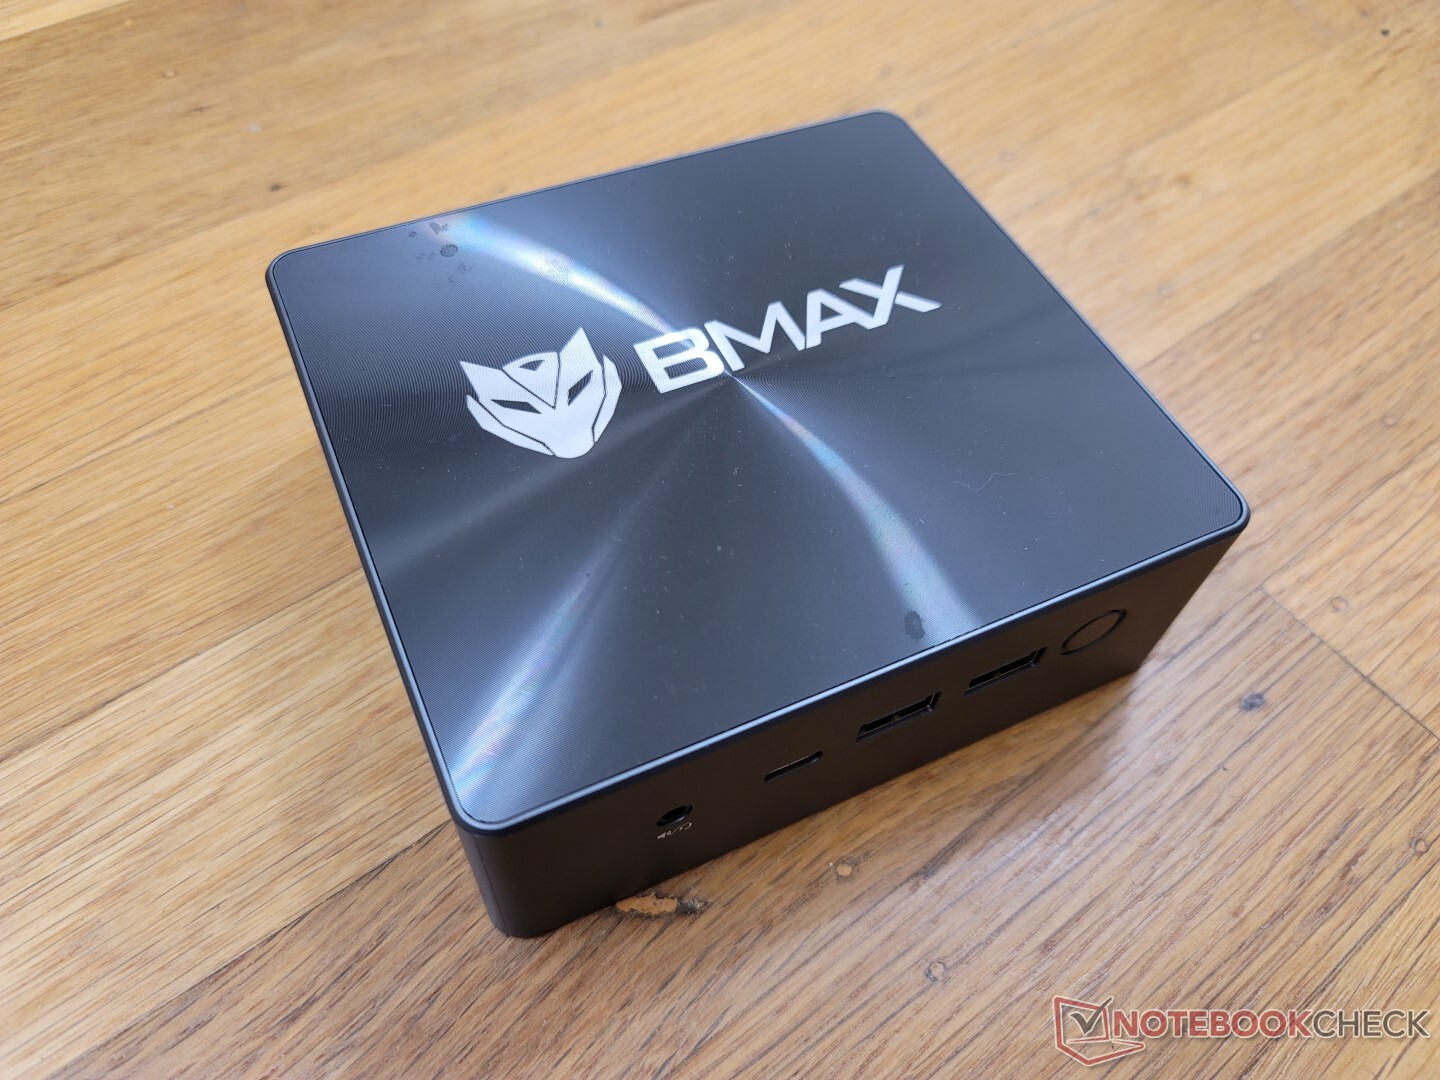
Fodralet är något tjockare än Intel NUC11TNKi5 för att vara nästan identisk med Beelink SEi8. Styvheten är stark runt kanterna och botten eftersom dessa områden är av metall medan toppen är av billigare plast och mer mottaglig för skevhet. Det är fortfarande en stark konstruktion utan uppenbara fel även om den inte är lika tung som en Intel NUC.
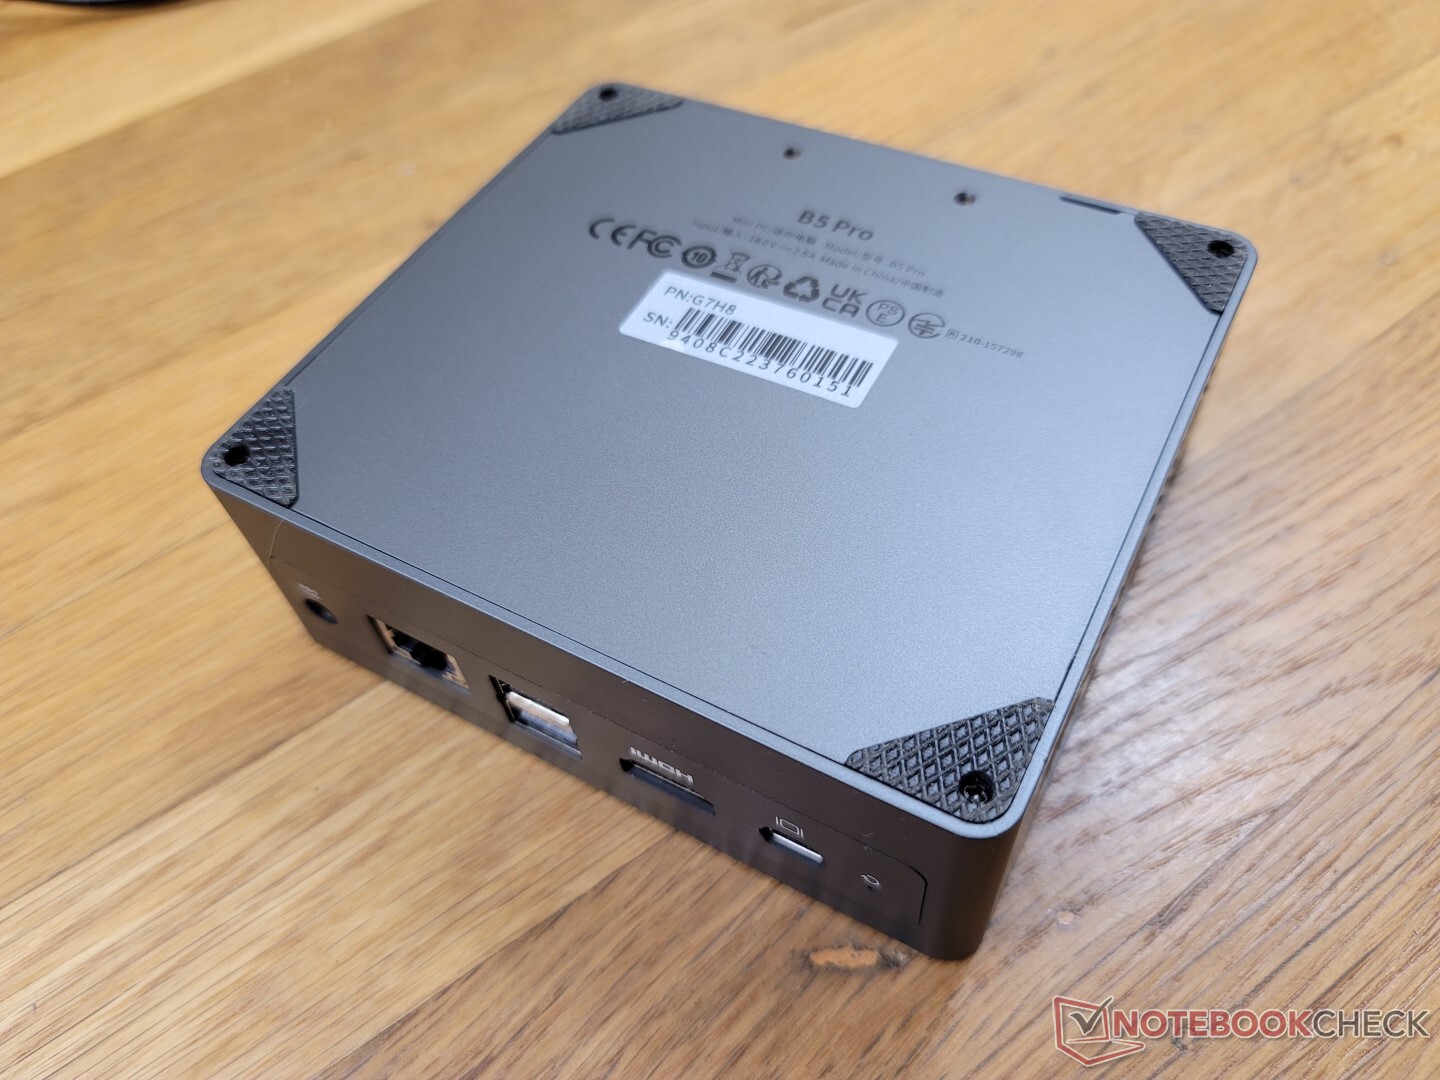
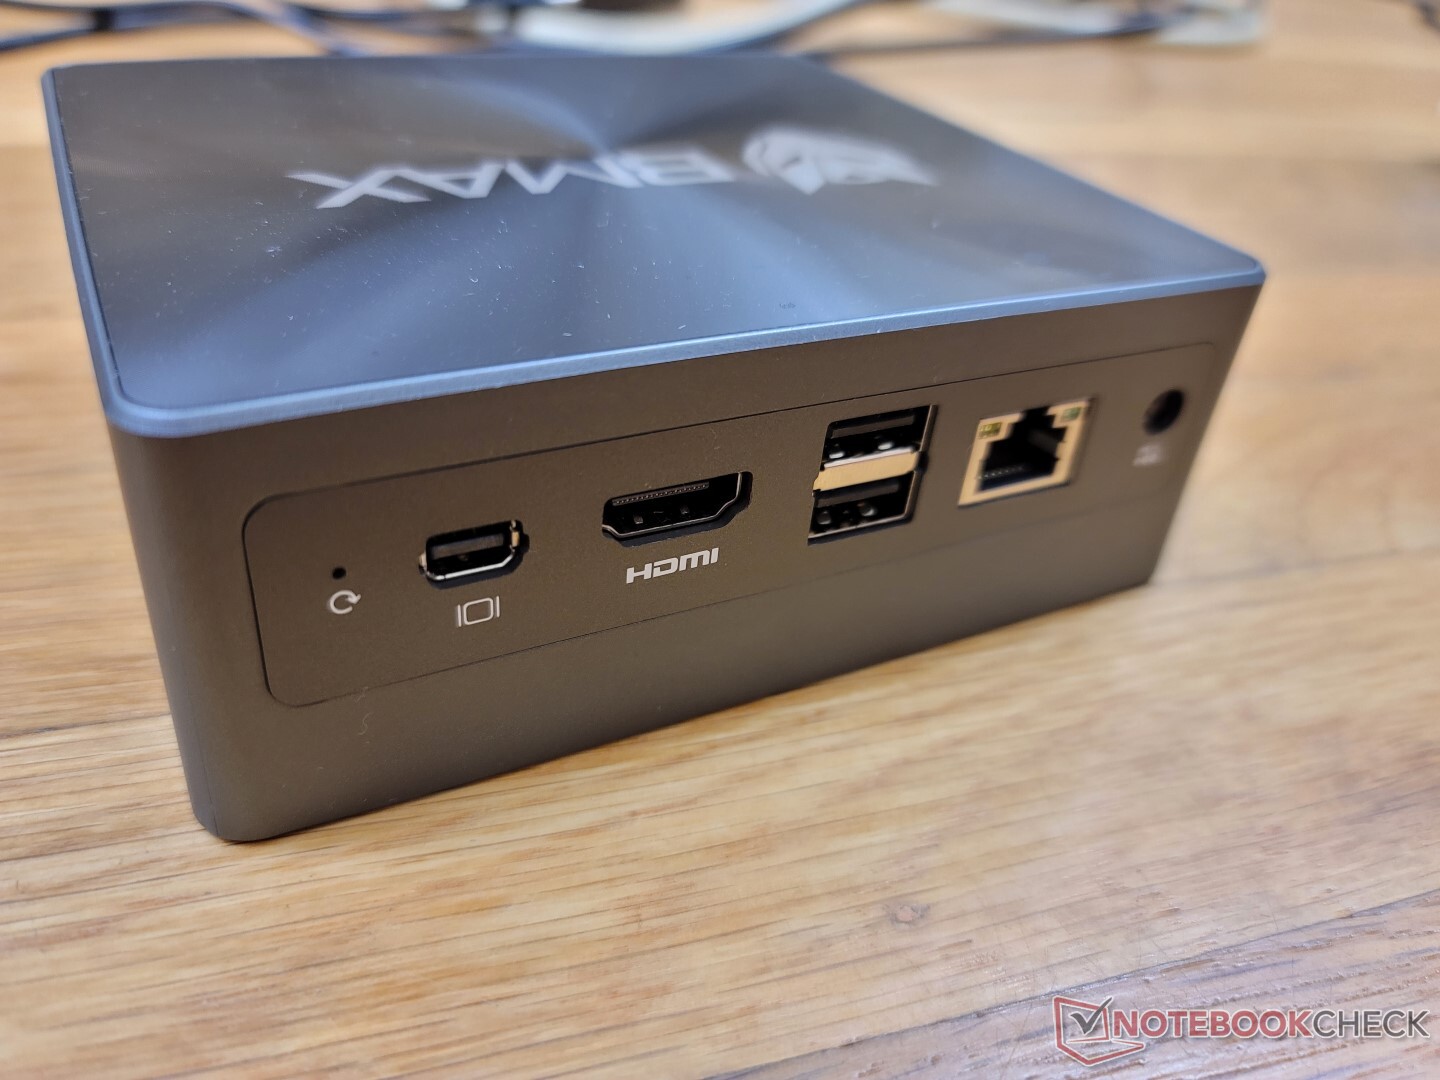
Anslutning - Inget stöd för Thunderbolt
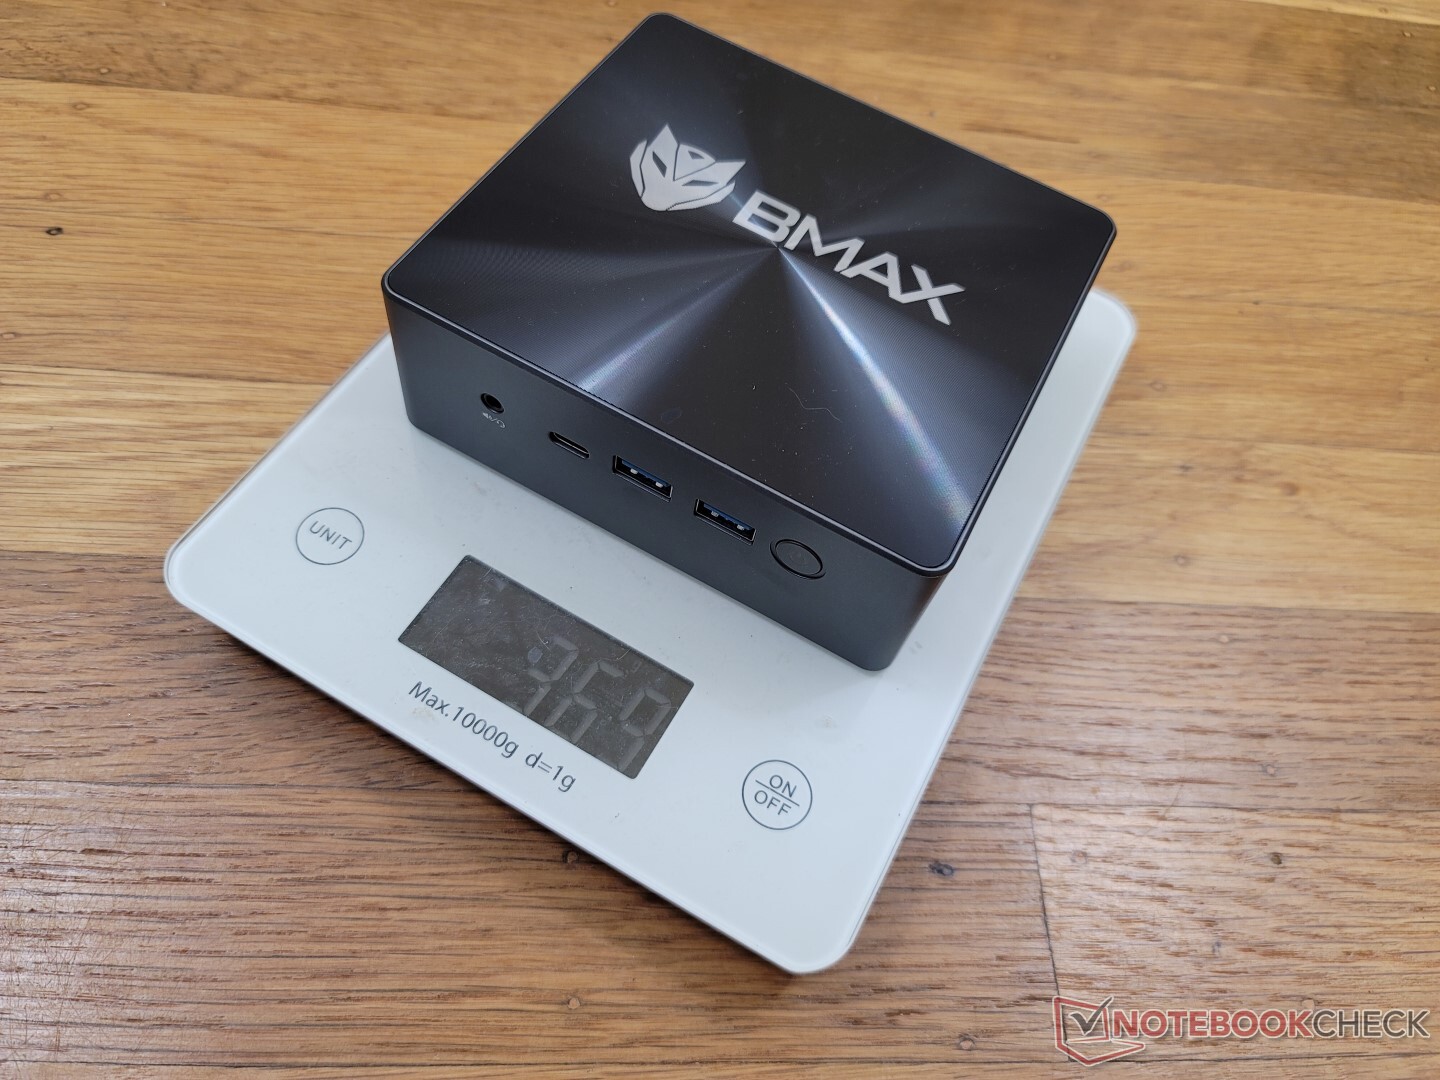
Den mest anmärkningsvärda porten på B5 Pro är mini DisplayPort, eftersom de flesta andra minidatorer i den här prisklassen inte har någon mini DisplayPort alls. 4K-skärmar vid 60 Hz stöds inte via HDMI.
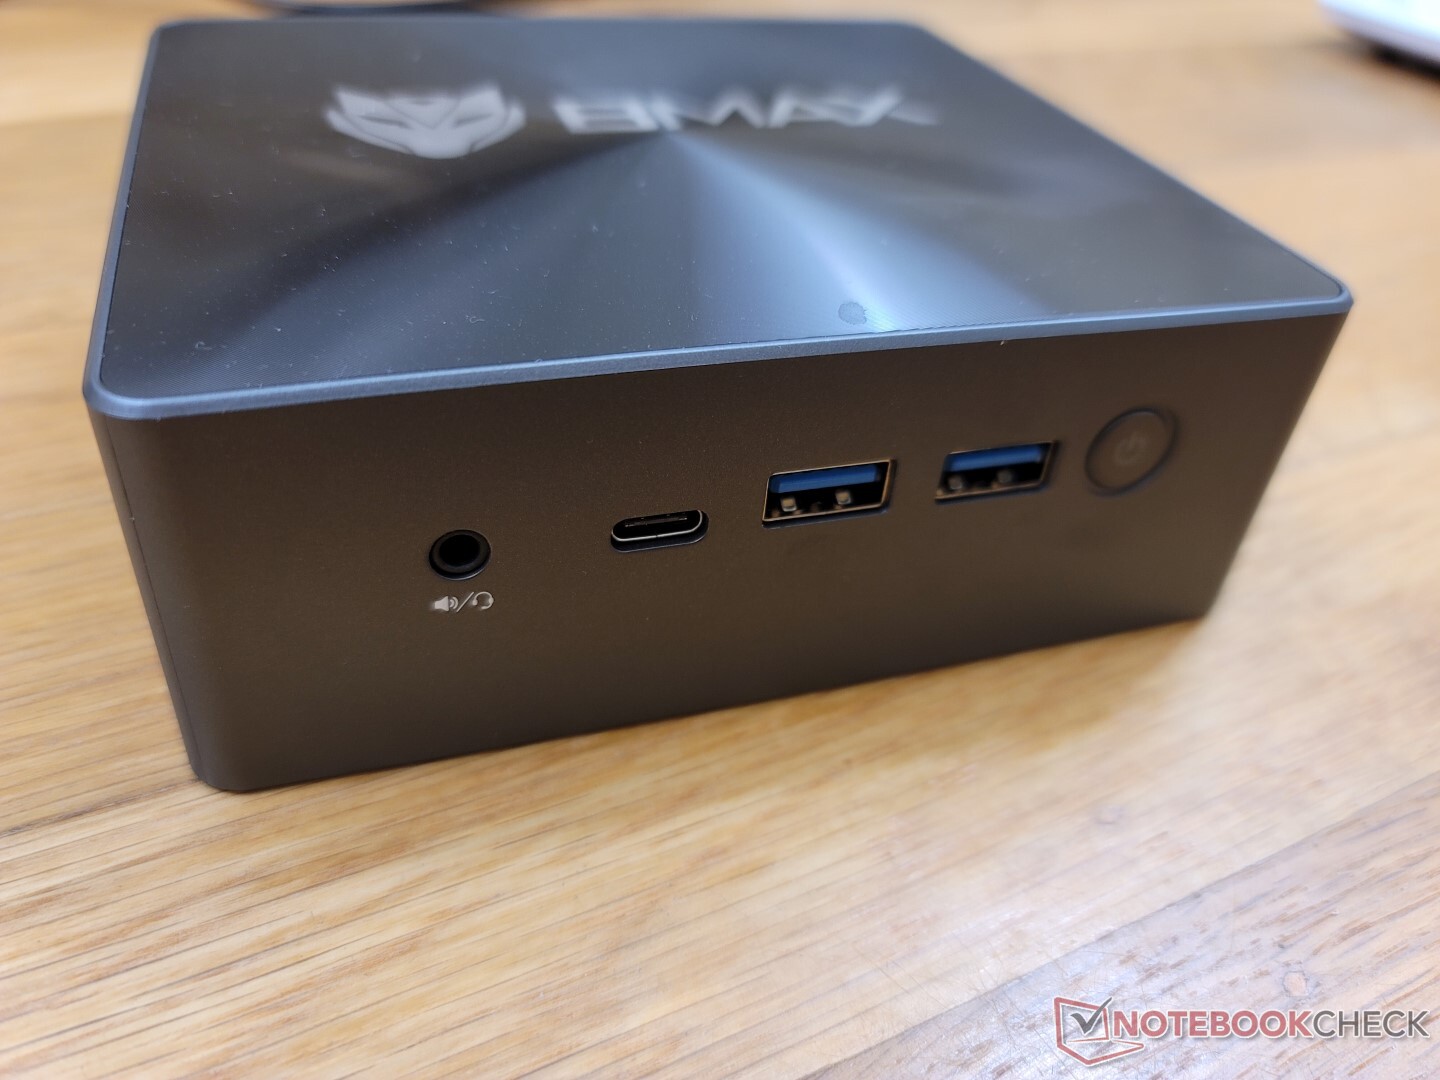
USB-C-porten på framsidan stöder externa bildskärmar, men den stöder inte Power-in eller Thunderbolt.
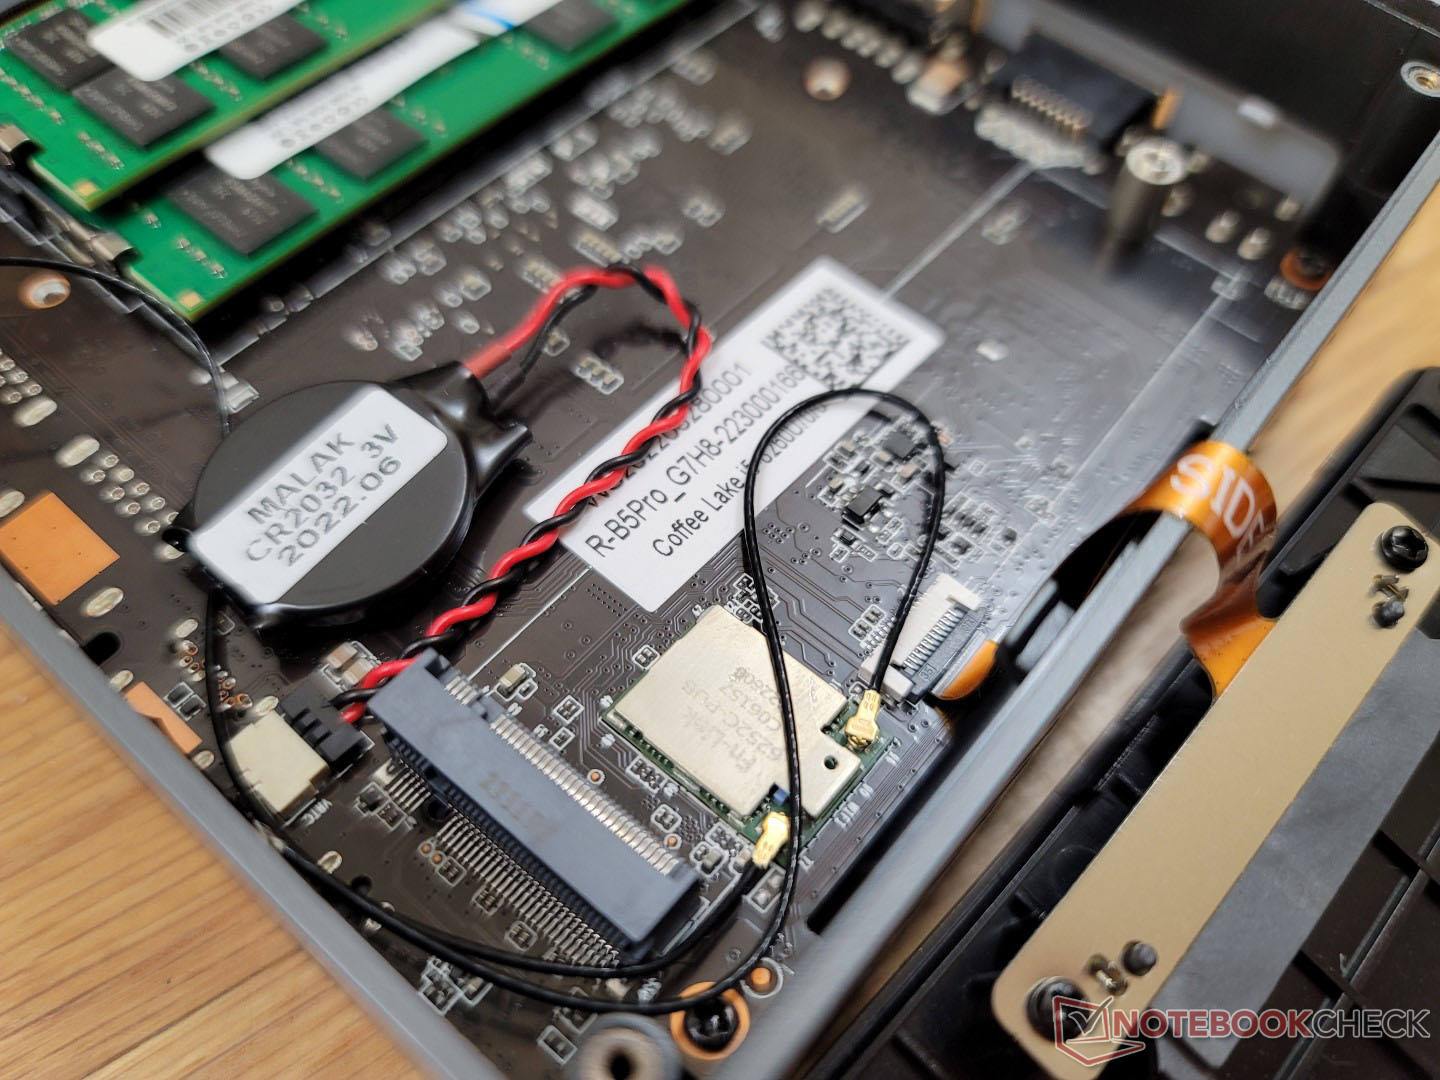
Kommunikation
RealTek RTL8852BE är standard för Wi-Fi 6 och Bluetooth 5.2. Det finns inget stöd för Wi-Fi 6E, vilket sannolikt är för att spara på kostnaderna. Överföringshastigheterna är annars stabila och utan problem även om det de inte är i närheten av lika snabba som den vanligare Intel AX200/201-serien.
| Networking | |
| iperf3 transmit AX12 | |
| Intel NUC11TNKi5 | |
| Beelink SEi8 | |
| iperf3 receive AX12 | |
| Intel NUC11TNKi5 | |
| Beelink SEi8 | |
| iperf3 receive AXE11000 6GHz | |
| Beelink SER Pro Ryzen 5 5600H | |
| Beelink SEi11 Pro | |
| iperf3 receive AXE11000 | |
| BMAX B5 Pro G7H8 | |
| Beelink U59 N5105 | |
| iperf3 transmit AXE11000 6GHz | |
| Beelink SER Pro Ryzen 5 5600H | |
| Beelink SEi11 Pro | |
| iperf3 transmit AXE11000 | |
| BMAX B5 Pro G7H8 | |
| Beelink U59 N5105 | |
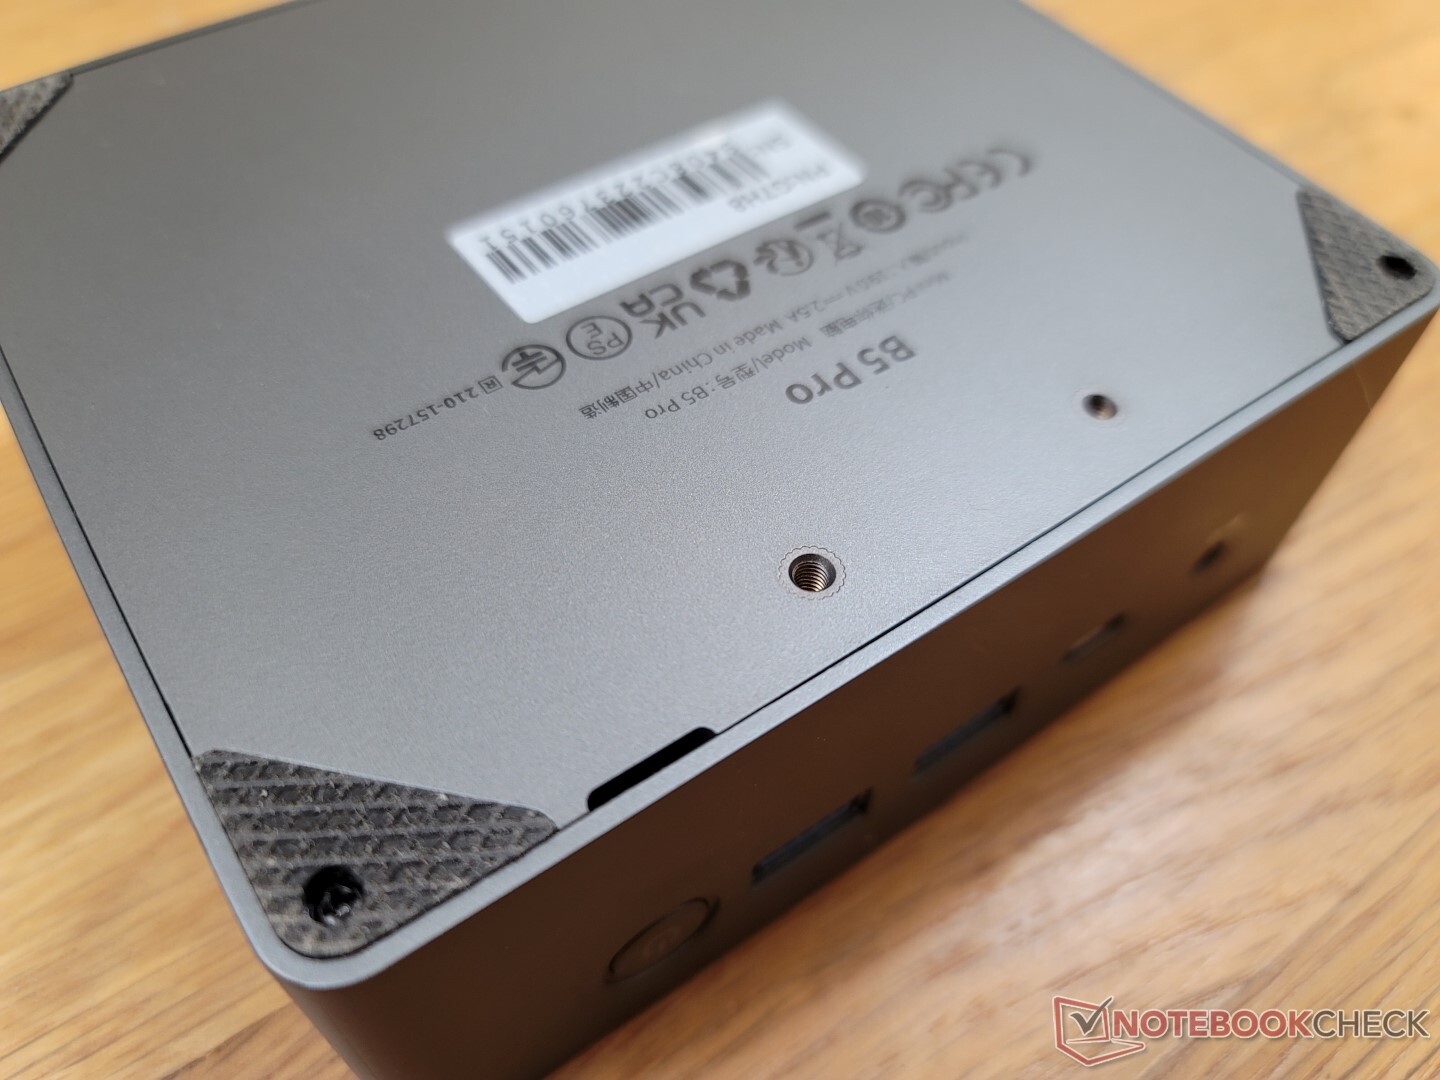
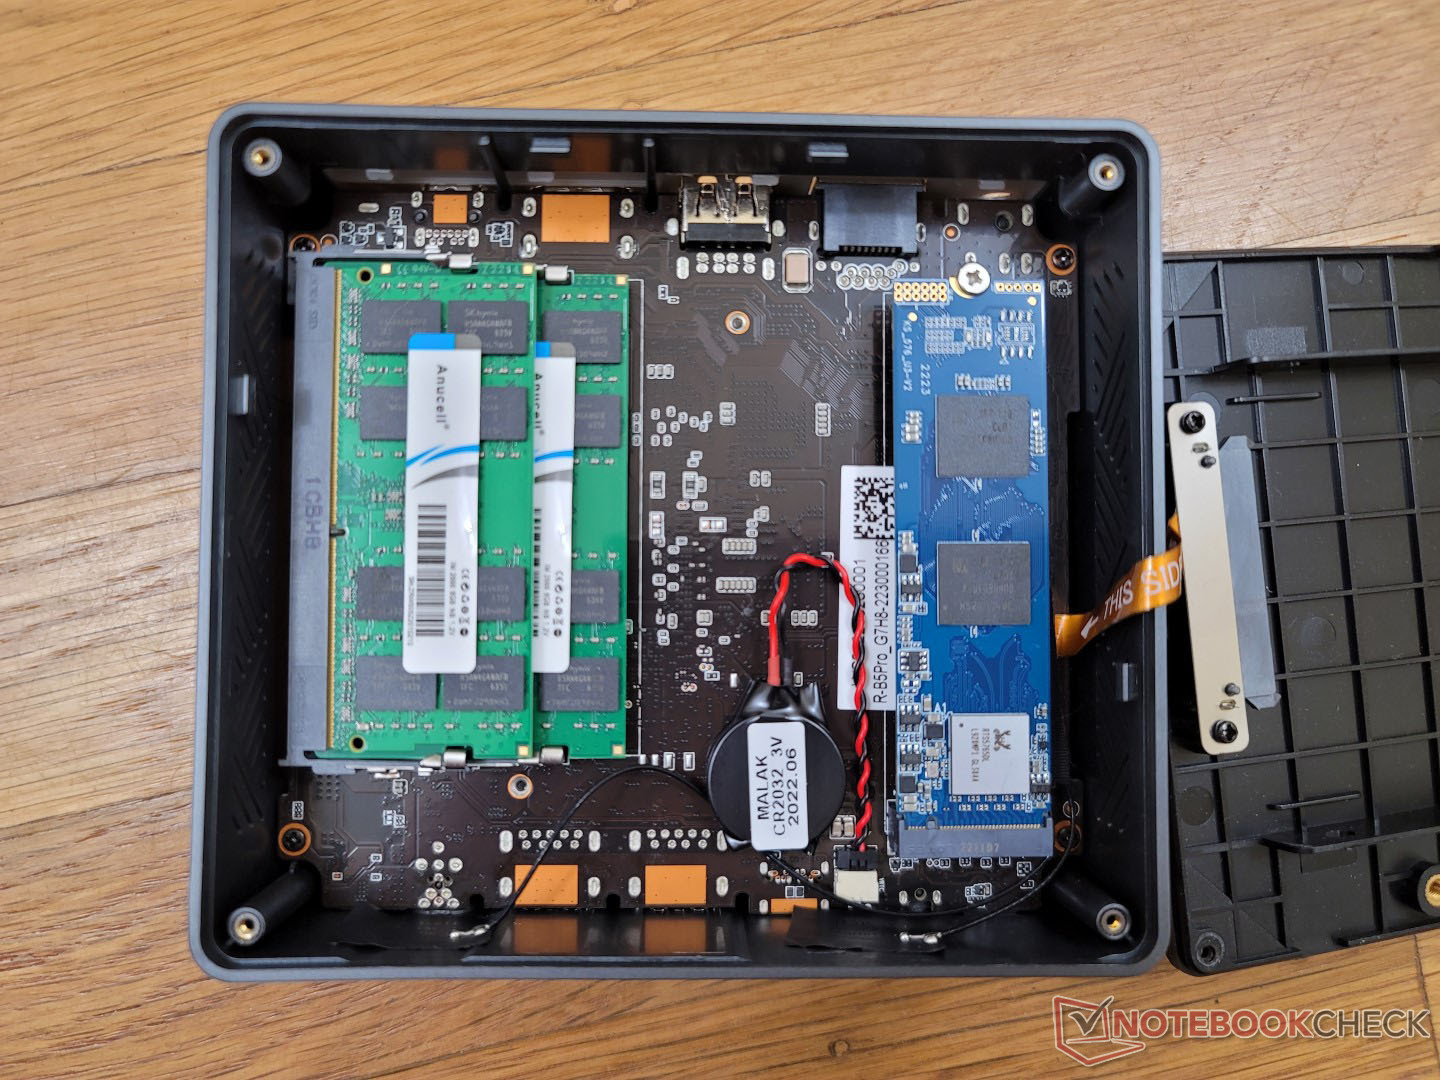
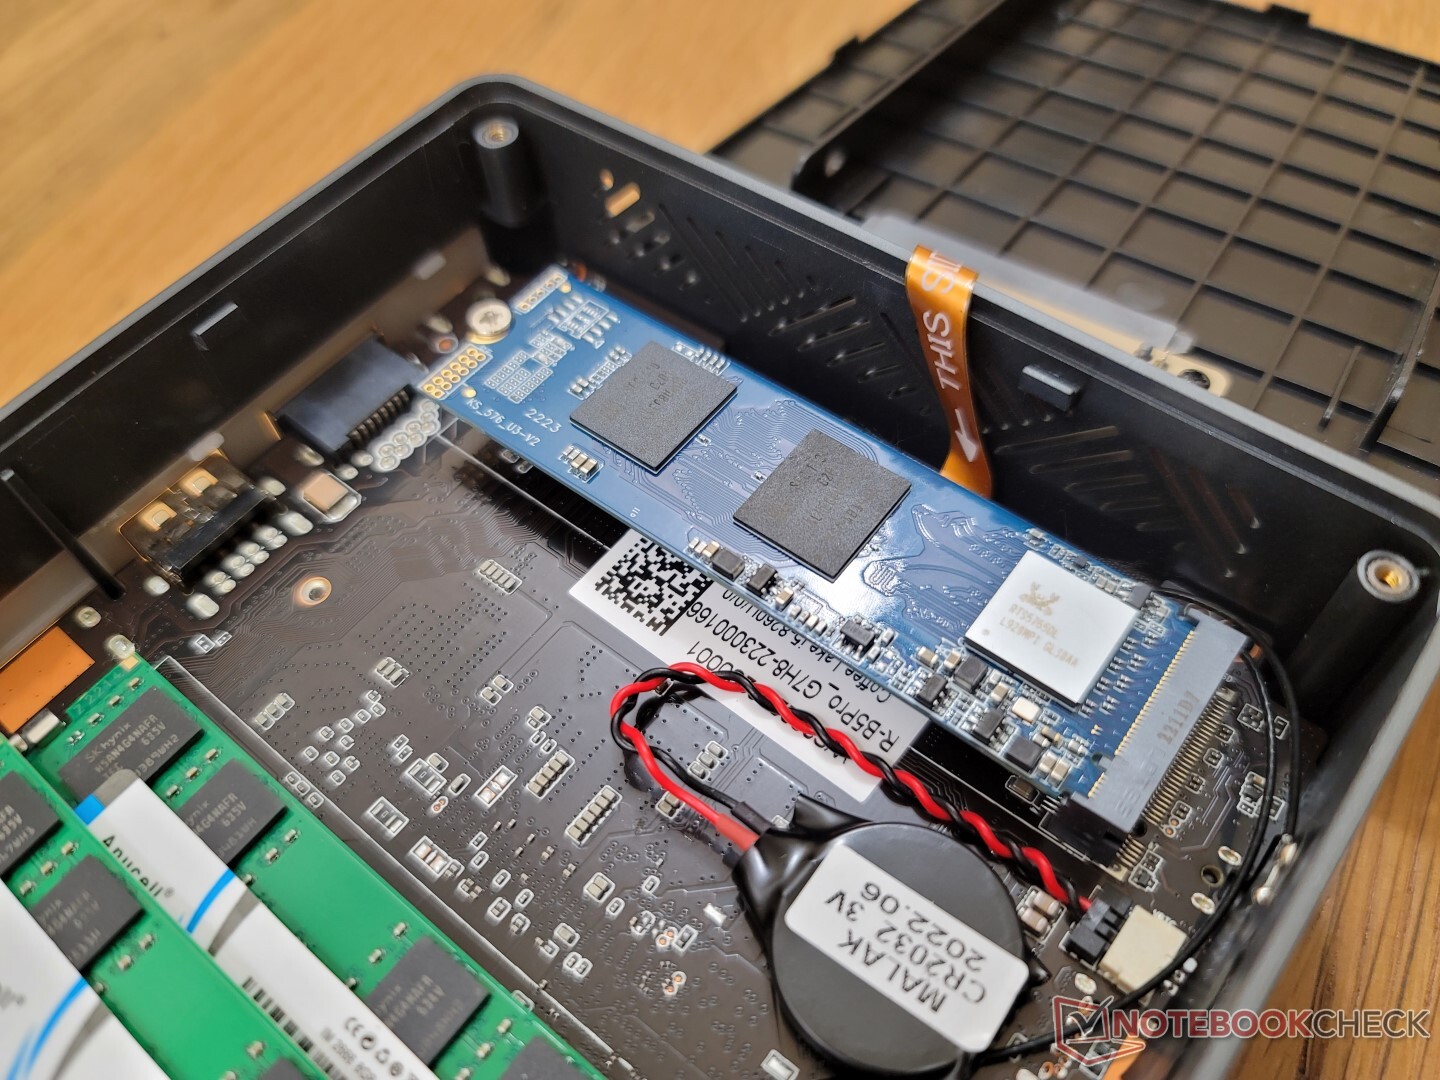
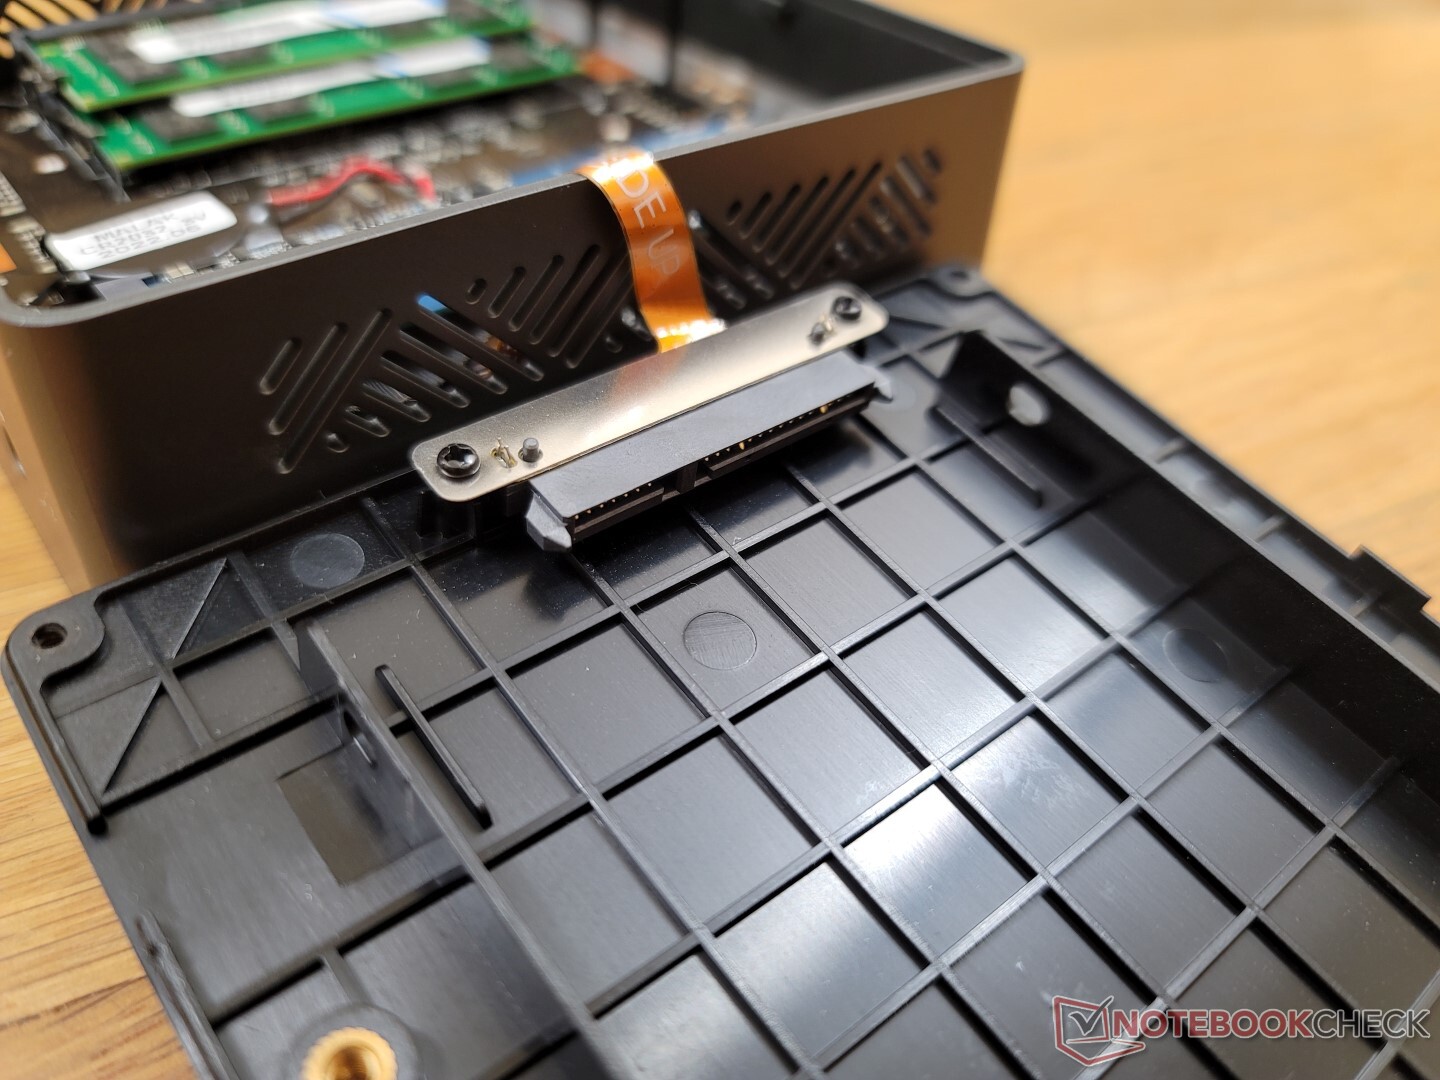
Underhåll
Bottenpanelen är fäst med fyra Philips-skruvar för enkel service. Till skillnad från Beelink SEi8 har bottenpanelen på BMax en liten slits längs en kant för att underlätta grepp och borttagning
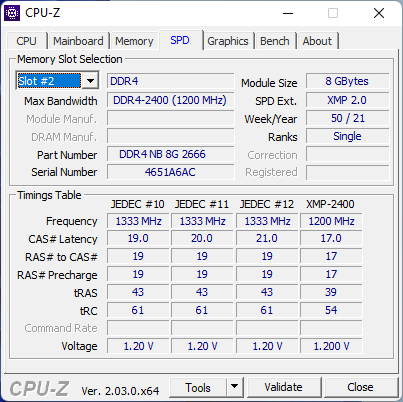
Användare kan installera upp till två DDR4 SODIMM-moduler och upp till två lagringsenheter när de väl är inne.
Tillbehör och garanti
I förpackningen ingår en HDMI-kabel och ett avtagbart VESA-monteringsfäste med skruvar tillsammans med nätadaptern. Den begränsade standardgarantin på ett år gäller om den köps i USA.
Prestanda - 8:e generationen jämfört med 12:e generationen
Provningsförhållanden
Vi ställde in vår enhet i prestandaläget via Windows innan vi körde de nedanstående benchmarks för att få högsta möjliga poäng. Det finns inga förinstallerade program från tillverkaren för en ren Windows-användarupplevelse.
Processor
Den råa CPU-prestandan är i allmänhet jämförbar med den 10:e generationen Core i7-1065G7 ellerCore i5-8259U. Även om den är mycket långsammare än den 11:e generationen Core i5-1135G7 med upp till 50 procent, är den fortfarande tillräckligt snabb för vanliga multimedieändamål som webbsökning, videoströmning och måttlig multitasking.
Den 12:e generationen Core i5-1235U, som ligger flera generationer före vår Core i5-8260U, erbjuder ungefär 60 procent och 80 procent snabbare prestanda för enkeltråd och flertråd.
Hållbar prestanda är hyfsad. När CineBench R15 xT körs i en slinga sjunker prestandan med cirka 11 procent med tiden.
Cinebench R15 Multi Loop
Cinebench R23: Multi Core | Single Core
Cinebench R15: CPU Multi 64Bit | CPU Single 64Bit
Blender: v2.79 BMW27 CPU
7-Zip 18.03: 7z b 4 | 7z b 4 -mmt1
Geekbench 5.5: Multi-Core | Single-Core
HWBOT x265 Benchmark v2.2: 4k Preset
LibreOffice : 20 Documents To PDF
R Benchmark 2.5: Overall mean
| Cinebench R20 / CPU (Multi Core) | |
| Beelink SER Pro Ryzen 5 5600H | |
| Beelink SEi11 Pro | |
| Asus Vivobook 15 K513EQ | |
| Intel NUC11TNKi5 | |
| BMAX B5 Pro G7H8 | |
| Geekom Mini IT8-GM08i5T | |
| Infinix INBook X2 | |
| Fujitsu Lifebook U939 i5 | |
| Beelink U59 N5105 | |
| Beelink SEi8 | |
| Cinebench R20 / CPU (Single Core) | |
| Asus Vivobook 15 K513EQ | |
| Beelink SEi11 Pro | |
| Beelink SER Pro Ryzen 5 5600H | |
| Intel NUC11TNKi5 | |
| Infinix INBook X2 | |
| BMAX B5 Pro G7H8 | |
| Fujitsu Lifebook U939 i5 | |
| Geekom Mini IT8-GM08i5T | |
| Beelink SEi8 | |
| Beelink U59 N5105 | |
| Cinebench R23 / Multi Core | |
| Beelink SER Pro Ryzen 5 5600H | |
| Beelink SEi11 Pro | |
| Asus Vivobook 15 K513EQ | |
| Intel NUC11TNKi5 | |
| Geekom Mini IT8-GM08i5T | |
| Infinix INBook X2 | |
| BMAX B5 Pro G7H8 | |
| Beelink U59 N5105 | |
| Beelink SEi8 | |
| Cinebench R23 / Single Core | |
| Asus Vivobook 15 K513EQ | |
| Beelink SEi11 Pro | |
| Intel NUC11TNKi5 | |
| Beelink SER Pro Ryzen 5 5600H | |
| Infinix INBook X2 | |
| Beelink SEi8 | |
| BMAX B5 Pro G7H8 | |
| Beelink U59 N5105 | |
| Cinebench R15 / CPU Multi 64Bit | |
| Beelink SER Pro Ryzen 5 5600H | |
| Asus Vivobook 15 K513EQ | |
| Beelink SEi11 Pro | |
| Intel NUC11TNKi5 | |
| BMAX B5 Pro G7H8 | |
| Geekom Mini IT8-GM08i5T | |
| Infinix INBook X2 | |
| Fujitsu Lifebook U939 i5 | |
| Beelink U59 N5105 | |
| Beelink SEi8 | |
| Cinebench R15 / CPU Single 64Bit | |
| Asus Vivobook 15 K513EQ | |
| Beelink SER Pro Ryzen 5 5600H | |
| Beelink SEi11 Pro | |
| Intel NUC11TNKi5 | |
| Fujitsu Lifebook U939 i5 | |
| BMAX B5 Pro G7H8 | |
| Infinix INBook X2 | |
| Geekom Mini IT8-GM08i5T | |
| Beelink SEi8 | |
| Beelink U59 N5105 | |
| Blender / v2.79 BMW27 CPU | |
| Beelink U59 N5105 | |
| Beelink SEi8 | |
| Fujitsu Lifebook U939 i5 | |
| Infinix INBook X2 | |
| BMAX B5 Pro G7H8 | |
| Geekom Mini IT8-GM08i5T | |
| Intel NUC11TNKi5 | |
| Asus Vivobook 15 K513EQ | |
| Beelink SEi11 Pro | |
| Beelink SER Pro Ryzen 5 5600H | |
| 7-Zip 18.03 / 7z b 4 | |
| Beelink SER Pro Ryzen 5 5600H | |
| Geekom Mini IT8-GM08i5T | |
| Asus Vivobook 15 K513EQ | |
| Beelink SEi11 Pro | |
| Intel NUC11TNKi5 | |
| BMAX B5 Pro G7H8 | |
| Infinix INBook X2 | |
| Fujitsu Lifebook U939 i5 | |
| Beelink U59 N5105 | |
| Beelink SEi8 | |
| 7-Zip 18.03 / 7z b 4 -mmt1 | |
| Beelink SER Pro Ryzen 5 5600H | |
| Asus Vivobook 15 K513EQ | |
| Beelink SEi11 Pro | |
| Intel NUC11TNKi5 | |
| BMAX B5 Pro G7H8 | |
| Fujitsu Lifebook U939 i5 | |
| Geekom Mini IT8-GM08i5T | |
| Beelink SEi8 | |
| Infinix INBook X2 | |
| Beelink U59 N5105 | |
| Geekbench 5.5 / Multi-Core | |
| Beelink SER Pro Ryzen 5 5600H | |
| Beelink SEi11 Pro | |
| Intel NUC11TNKi5 | |
| Geekom Mini IT8-GM08i5T | |
| Fujitsu Lifebook U939 i5 | |
| Infinix INBook X2 | |
| Beelink U59 N5105 | |
| Beelink SEi8 | |
| BMAX B5 Pro G7H8 | |
| Geekbench 5.5 / Single-Core | |
| Beelink SEi11 Pro | |
| Beelink SER Pro Ryzen 5 5600H | |
| Intel NUC11TNKi5 | |
| Infinix INBook X2 | |
| Fujitsu Lifebook U939 i5 | |
| Geekom Mini IT8-GM08i5T | |
| Beelink SEi8 | |
| Beelink U59 N5105 | |
| BMAX B5 Pro G7H8 | |
| HWBOT x265 Benchmark v2.2 / 4k Preset | |
| Beelink SER Pro Ryzen 5 5600H | |
| Beelink SEi11 Pro | |
| Asus Vivobook 15 K513EQ | |
| Intel NUC11TNKi5 | |
| Geekom Mini IT8-GM08i5T | |
| Infinix INBook X2 | |
| Fujitsu Lifebook U939 i5 | |
| Beelink SEi8 | |
| Beelink U59 N5105 | |
| BMAX B5 Pro G7H8 | |
| LibreOffice / 20 Documents To PDF | |
| BMAX B5 Pro G7H8 | |
| Beelink U59 N5105 | |
| Beelink SEi8 | |
| Geekom Mini IT8-GM08i5T | |
| Infinix INBook X2 | |
| Fujitsu Lifebook U939 i5 | |
| Beelink SER Pro Ryzen 5 5600H | |
| Intel NUC11TNKi5 | |
| Beelink SEi11 Pro | |
| Asus Vivobook 15 K513EQ | |
| R Benchmark 2.5 / Overall mean | |
| BMAX B5 Pro G7H8 | |
| Beelink U59 N5105 | |
| Beelink SEi8 | |
| Geekom Mini IT8-GM08i5T | |
| Infinix INBook X2 | |
| Fujitsu Lifebook U939 i5 | |
| Intel NUC11TNKi5 | |
| Beelink SEi11 Pro | |
| Asus Vivobook 15 K513EQ | |
| Beelink SER Pro Ryzen 5 5600H | |
* ... mindre är bättre
AIDA64: FP32 Ray-Trace | FPU Julia | CPU SHA3 | CPU Queen | FPU SinJulia | FPU Mandel | CPU AES | CPU ZLib | FP64 Ray-Trace | CPU PhotoWorxx
| Performance rating | |
| Beelink SER Pro Ryzen 5 5600H | |
| Beelink SEi11 Pro | |
| Intel NUC11TNKi5 | |
| BMAX B5 Pro G7H8 | |
| Beelink SEi8 | |
| Beelink U59 N5105 | |
| AIDA64 / FP32 Ray-Trace | |
| Beelink SER Pro Ryzen 5 5600H | |
| Beelink SEi11 Pro | |
| Intel NUC11TNKi5 | |
| BMAX B5 Pro G7H8 | |
| Beelink SEi8 | |
| Beelink U59 N5105 | |
| AIDA64 / FPU Julia | |
| Beelink SER Pro Ryzen 5 5600H | |
| Beelink SEi11 Pro | |
| Intel NUC11TNKi5 | |
| BMAX B5 Pro G7H8 | |
| Beelink SEi8 | |
| Beelink U59 N5105 | |
| AIDA64 / CPU SHA3 | |
| Beelink SER Pro Ryzen 5 5600H | |
| Beelink SEi11 Pro | |
| Intel NUC11TNKi5 | |
| BMAX B5 Pro G7H8 | |
| Beelink SEi8 | |
| Beelink U59 N5105 | |
| AIDA64 / CPU Queen | |
| Beelink SER Pro Ryzen 5 5600H | |
| Beelink SEi11 Pro | |
| Intel NUC11TNKi5 | |
| BMAX B5 Pro G7H8 | |
| Beelink SEi8 | |
| Beelink U59 N5105 | |
| AIDA64 / FPU SinJulia | |
| Beelink SER Pro Ryzen 5 5600H | |
| Beelink SEi11 Pro | |
| Intel NUC11TNKi5 | |
| BMAX B5 Pro G7H8 | |
| Beelink SEi8 | |
| Beelink U59 N5105 | |
| AIDA64 / FPU Mandel | |
| Beelink SER Pro Ryzen 5 5600H | |
| Beelink SEi11 Pro | |
| Intel NUC11TNKi5 | |
| BMAX B5 Pro G7H8 | |
| Beelink SEi8 | |
| Beelink U59 N5105 | |
| AIDA64 / CPU AES | |
| Beelink SER Pro Ryzen 5 5600H | |
| Beelink SEi11 Pro | |
| Intel NUC11TNKi5 | |
| Beelink U59 N5105 | |
| BMAX B5 Pro G7H8 | |
| Beelink SEi8 | |
| AIDA64 / CPU ZLib | |
| Beelink SER Pro Ryzen 5 5600H | |
| Intel NUC11TNKi5 | |
| Beelink SEi11 Pro | |
| BMAX B5 Pro G7H8 | |
| Beelink U59 N5105 | |
| Beelink SEi8 | |
| AIDA64 / FP64 Ray-Trace | |
| Beelink SER Pro Ryzen 5 5600H | |
| Beelink SEi11 Pro | |
| Intel NUC11TNKi5 | |
| BMAX B5 Pro G7H8 | |
| Beelink SEi8 | |
| Beelink U59 N5105 | |
| AIDA64 / CPU PhotoWorxx | |
| Beelink SEi11 Pro | |
| Beelink SER Pro Ryzen 5 5600H | |
| BMAX B5 Pro G7H8 | |
| Intel NUC11TNKi5 | |
| Beelink SEi8 | |
| Beelink U59 N5105 | |
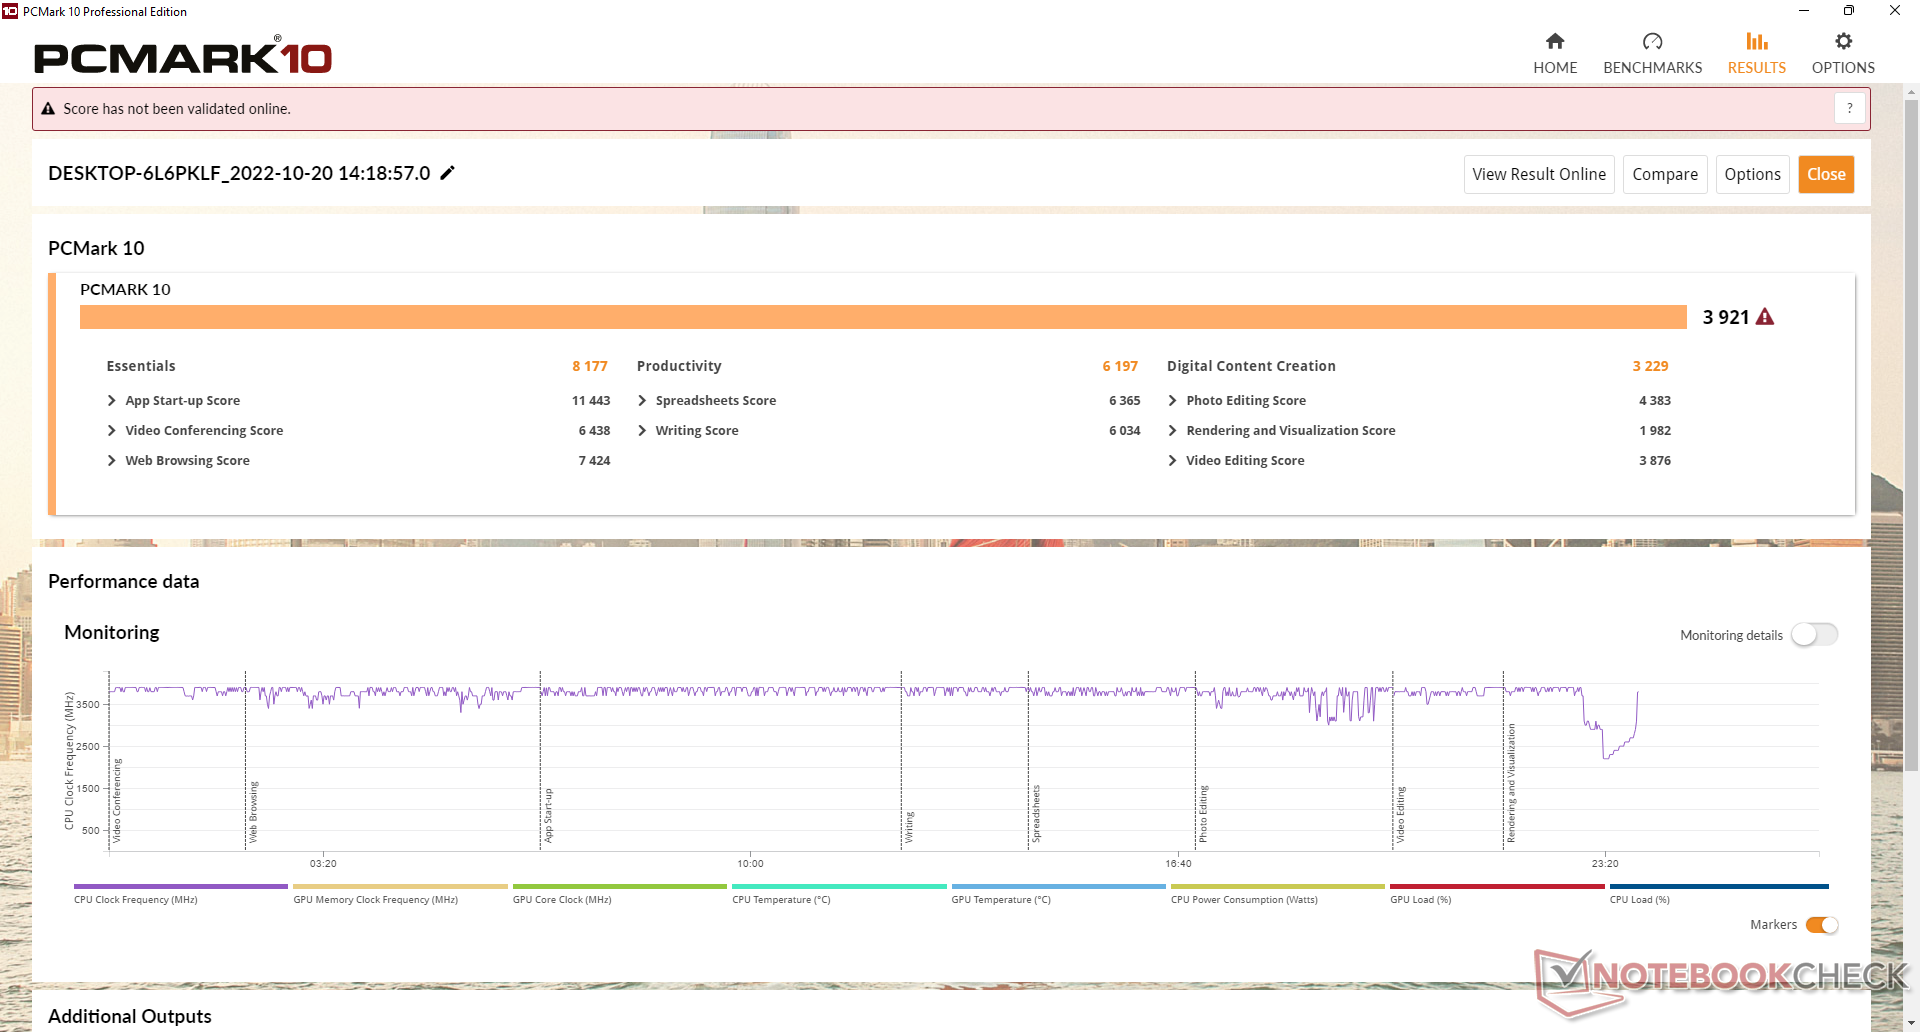
Systemets prestanda
PCMark 10-resultaten är jämförbara med Beelink SEi8 som också använder en äldre 8:e generationens Core CPU. Minidatorer med nyare 11:e generationens CPU:er som Intel NUC11TNKi5 kan erbjuda betydligt högre resultat för skapande av digitalt innehåll på grund av deras snabbare integrerade GPU:er.
CrossMark: Overall | Productivity | Creativity | Responsiveness
| PCMark 10 / Score | |
| Beelink SER Pro Ryzen 5 5600H | |
| Beelink SEi11 Pro | |
| Intel NUC11TNKi5 | |
| BMAX B5 Pro G7H8 | |
| Beelink SEi8 | |
| Beelink U59 N5105 | |
| PCMark 10 / Essentials | |
| Beelink SER Pro Ryzen 5 5600H | |
| Beelink SEi11 Pro | |
| Intel NUC11TNKi5 | |
| BMAX B5 Pro G7H8 | |
| Beelink SEi8 | |
| Beelink U59 N5105 | |
| PCMark 10 / Productivity | |
| Beelink SER Pro Ryzen 5 5600H | |
| Beelink SEi11 Pro | |
| BMAX B5 Pro G7H8 | |
| Intel NUC11TNKi5 | |
| Beelink SEi8 | |
| Beelink U59 N5105 | |
| PCMark 10 / Digital Content Creation | |
| Beelink SER Pro Ryzen 5 5600H | |
| Beelink SEi11 Pro | |
| Intel NUC11TNKi5 | |
| BMAX B5 Pro G7H8 | |
| Beelink SEi8 | |
| Beelink U59 N5105 | |
| CrossMark / Overall | |
| Beelink SEi11 Pro | |
| Beelink SER Pro Ryzen 5 5600H | |
| BMAX B5 Pro G7H8 | |
| Beelink U59 N5105 | |
| CrossMark / Productivity | |
| Beelink SEi11 Pro | |
| Beelink SER Pro Ryzen 5 5600H | |
| BMAX B5 Pro G7H8 | |
| Beelink U59 N5105 | |
| CrossMark / Creativity | |
| Beelink SER Pro Ryzen 5 5600H | |
| Beelink SEi11 Pro | |
| BMAX B5 Pro G7H8 | |
| Beelink U59 N5105 | |
| CrossMark / Responsiveness | |
| Beelink SEi11 Pro | |
| Beelink SER Pro Ryzen 5 5600H | |
| BMAX B5 Pro G7H8 | |
| Beelink U59 N5105 | |
| PCMark 10 Score | 3921 poäng | |
Hjälp | ||
| AIDA64 / Memory Copy | |
| Beelink SER Pro Ryzen 5 5600H | |
| Beelink SEi11 Pro | |
| Beelink SEi8 | |
| BMAX B5 Pro G7H8 | |
| Beelink U59 N5105 | |
| Intel NUC11TNKi5 | |
| AIDA64 / Memory Read | |
| Beelink SER Pro Ryzen 5 5600H | |
| Beelink SEi11 Pro | |
| BMAX B5 Pro G7H8 | |
| Beelink SEi8 | |
| Intel NUC11TNKi5 | |
| Beelink U59 N5105 | |
| AIDA64 / Memory Write | |
| Beelink SEi11 Pro | |
| Beelink SER Pro Ryzen 5 5600H | |
| BMAX B5 Pro G7H8 | |
| Beelink U59 N5105 | |
| Intel NUC11TNKi5 | |
| Beelink SEi8 | |
| AIDA64 / Memory Latency | |
| BMAX B5 Pro G7H8 | |
| Intel NUC11TNKi5 | |
| Beelink SEi11 Pro | |
| Beelink SER Pro Ryzen 5 5600H | |
| Beelink U59 N5105 | |
| Beelink SEi8 | |
* ... mindre är bättre
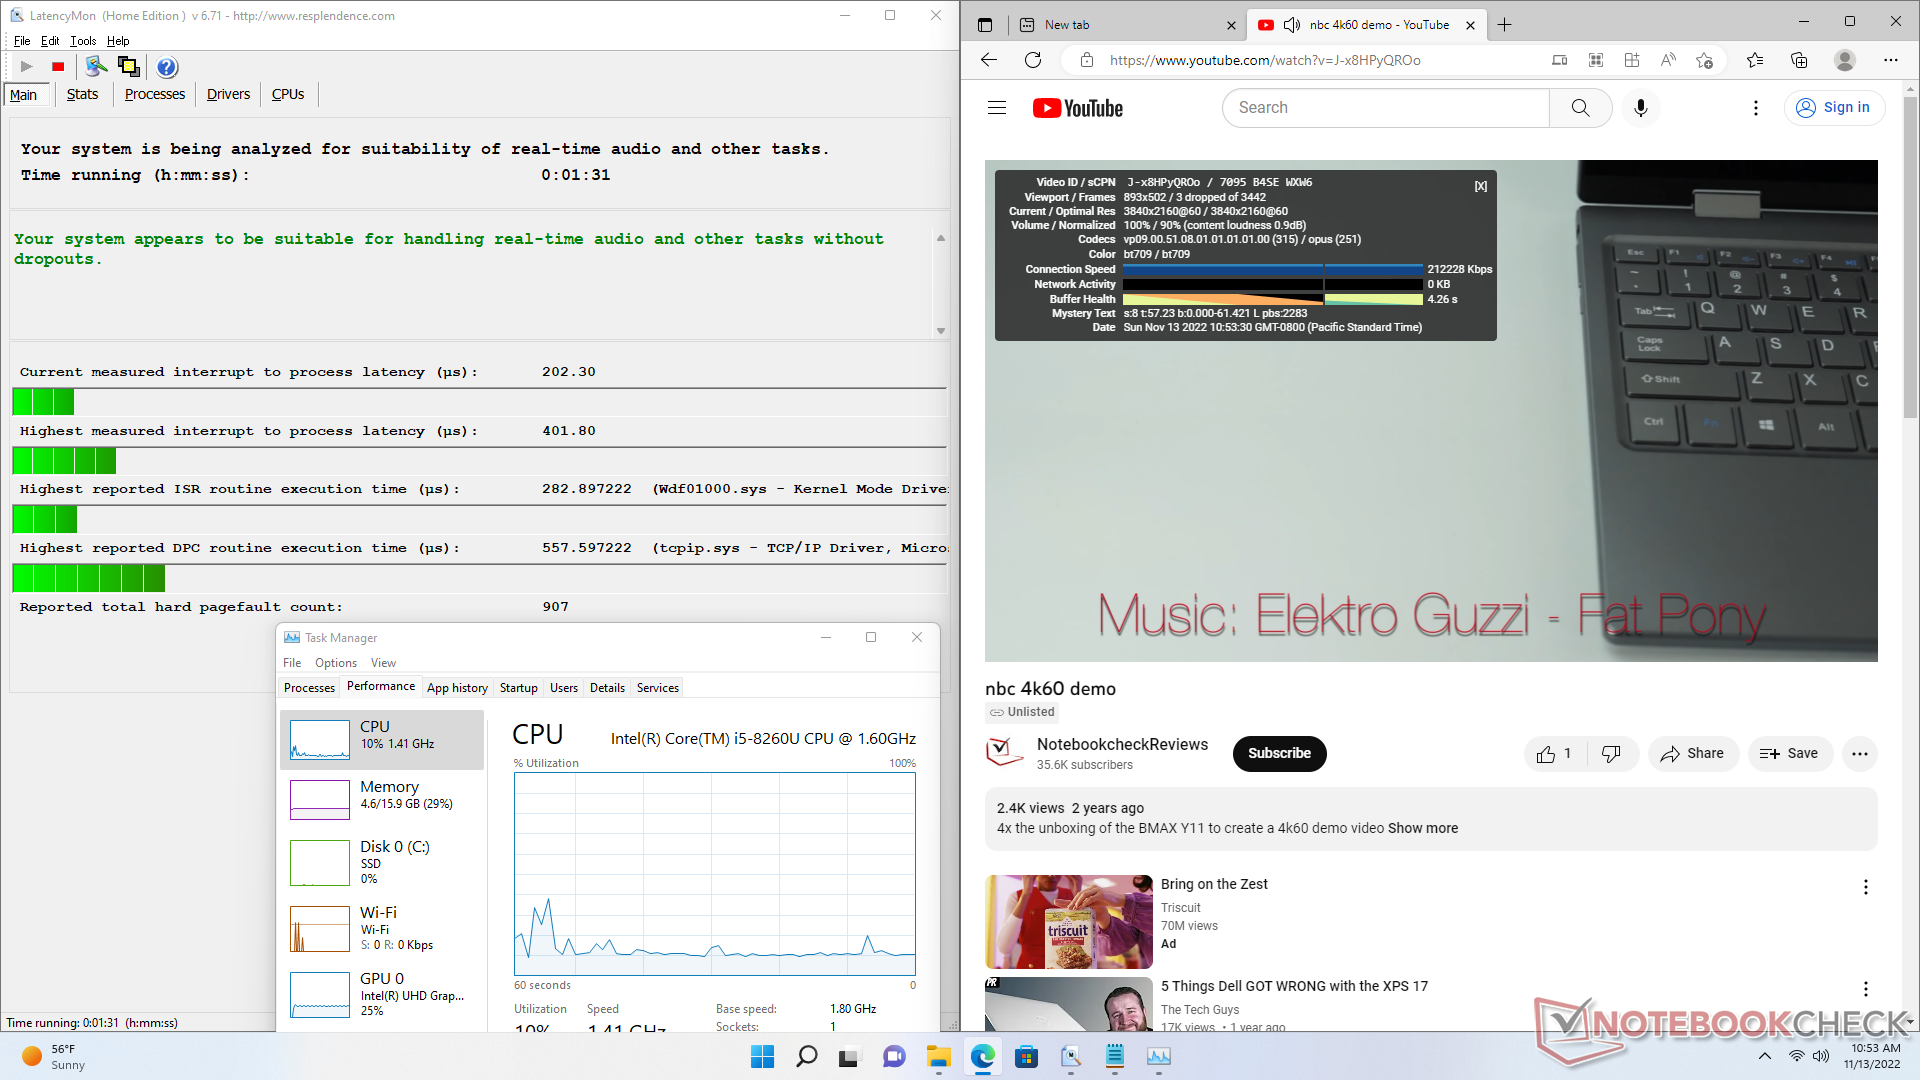
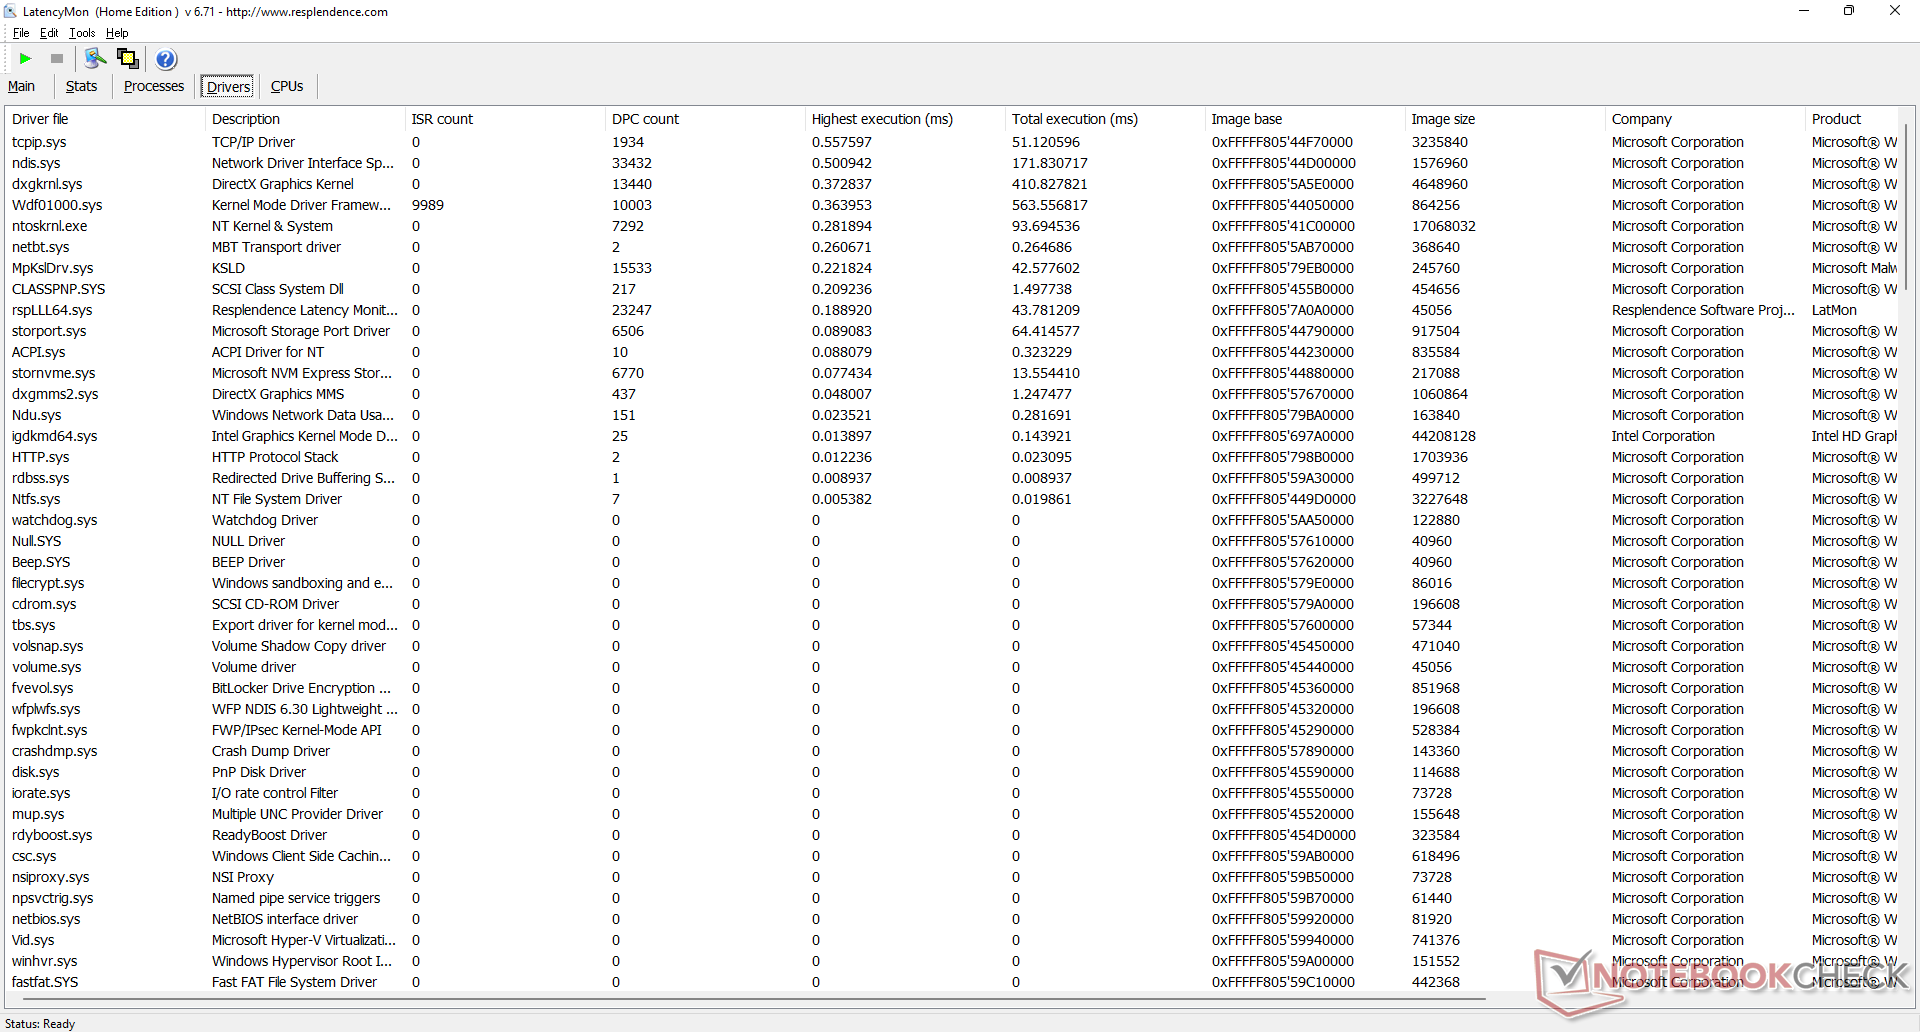
DPC-latenstid
LatencyMon visar inga större DPC-problem när du surfar på webben. uppspelning av 4K-video vid 60 FPS är också utmärkt, med bara 3 tappade bilder under vår minutlånga uppspelning.
| DPC Latencies / LatencyMon - interrupt to process latency (max), Web, Youtube, Prime95 | |
| Beelink SEi8 | |
| Beelink U59 N5105 | |
| Beelink SER Pro Ryzen 5 5600H | |
| Intel NUC11TNKi5 | |
| BMAX B5 Pro G7H8 | |
| Beelink SEi11 Pro | |
* ... mindre är bättre
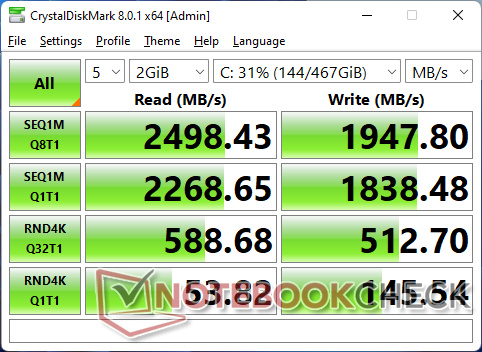
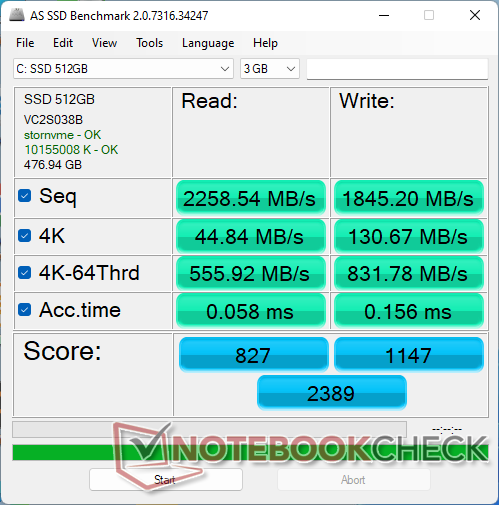
Lagringsenheter - upp till två enheter
B5 Pro använder en generisk M.2 PCIe3 x4 SSD med en RealTek RTS5763DL-kontroller för att spara på kostnaderna. Prestandan är dock inte optimal, eftersom läshastigheterna sjunker från den initialt höga nivån på ~2400 MB/s till endast ~1700 MB/s när enheten belastas.

| Drive Performance rating - Percent | |
| Beelink SER Pro Ryzen 5 5600H -11! | |
| BMAX B5 Pro G7H8 | |
| Beelink SEi11 Pro | |
| Beelink SEi8 | |
| Beelink U59 N5105 | |
| Intel NUC11TNKi5 | |
| DiskSpd | |
| seq read | |
| BMAX B5 Pro G7H8 | |
| Beelink SER Pro Ryzen 5 5600H | |
| Beelink SEi11 Pro | |
| Beelink SEi8 | |
| Intel NUC11TNKi5 | |
| Beelink U59 N5105 | |
| seq write | |
| Beelink SER Pro Ryzen 5 5600H | |
| Beelink SEi11 Pro | |
| BMAX B5 Pro G7H8 | |
| Beelink SEi8 | |
| Intel NUC11TNKi5 | |
| Beelink U59 N5105 | |
| seq q8 t1 read | |
| Beelink SER Pro Ryzen 5 5600H | |
| BMAX B5 Pro G7H8 | |
| Beelink SEi11 Pro | |
| Beelink SEi8 | |
| Intel NUC11TNKi5 | |
| Beelink U59 N5105 | |
| seq q8 t1 write | |
| BMAX B5 Pro G7H8 | |
| Beelink SER Pro Ryzen 5 5600H | |
| Beelink SEi11 Pro | |
| Beelink SEi8 | |
| Intel NUC11TNKi5 | |
| Beelink U59 N5105 | |
| 4k q1 t1 read | |
| Beelink SEi8 | |
| Beelink SEi11 Pro | |
| BMAX B5 Pro G7H8 | |
| Beelink SER Pro Ryzen 5 5600H | |
| Beelink U59 N5105 | |
| Intel NUC11TNKi5 | |
| 4k q1 t1 write | |
| Beelink SEi11 Pro | |
| Beelink SER Pro Ryzen 5 5600H | |
| Beelink SEi8 | |
| BMAX B5 Pro G7H8 | |
| Beelink U59 N5105 | |
| Intel NUC11TNKi5 | |
| 4k q32 t16 read | |
| BMAX B5 Pro G7H8 | |
| Beelink SER Pro Ryzen 5 5600H | |
| Beelink SEi11 Pro | |
| Beelink SEi8 | |
| Intel NUC11TNKi5 | |
| Beelink U59 N5105 | |
| 4k q32 t16 write | |
| BMAX B5 Pro G7H8 | |
| Beelink SER Pro Ryzen 5 5600H | |
| Beelink SEi11 Pro | |
| Beelink SEi8 | |
| Intel NUC11TNKi5 | |
| Beelink U59 N5105 | |
| AS SSD | |
| Score Total | |
| Beelink SEi11 Pro | |
| BMAX B5 Pro G7H8 | |
| Beelink SEi8 | |
| Intel NUC11TNKi5 | |
| Beelink U59 N5105 | |
| Score Read | |
| Beelink SEi11 Pro | |
| BMAX B5 Pro G7H8 | |
| Beelink SEi8 | |
| Intel NUC11TNKi5 | |
| Beelink U59 N5105 | |
| Score Write | |
| Beelink SEi11 Pro | |
| BMAX B5 Pro G7H8 | |
| Beelink SEi8 | |
| Intel NUC11TNKi5 | |
| Beelink U59 N5105 | |
| Seq Read | |
| BMAX B5 Pro G7H8 | |
| Beelink SEi11 Pro | |
| Beelink SEi8 | |
| Intel NUC11TNKi5 | |
| Beelink U59 N5105 | |
| Seq Write | |
| BMAX B5 Pro G7H8 | |
| Beelink SEi11 Pro | |
| Beelink SEi8 | |
| Intel NUC11TNKi5 | |
| Beelink U59 N5105 | |
| 4K Read | |
| Beelink SEi8 | |
| BMAX B5 Pro G7H8 | |
| Beelink SEi11 Pro | |
| Intel NUC11TNKi5 | |
| Beelink U59 N5105 | |
| 4K Write | |
| Beelink SEi11 Pro | |
| BMAX B5 Pro G7H8 | |
| Beelink SEi8 | |
| Beelink U59 N5105 | |
| Intel NUC11TNKi5 | |
| 4K-64 Read | |
| Beelink SEi11 Pro | |
| BMAX B5 Pro G7H8 | |
| Beelink SEi8 | |
| Intel NUC11TNKi5 | |
| Beelink U59 N5105 | |
| 4K-64 Write | |
| Beelink SEi11 Pro | |
| BMAX B5 Pro G7H8 | |
| Beelink SEi8 | |
| Intel NUC11TNKi5 | |
| Beelink U59 N5105 | |
| Access Time Read | |
| Intel NUC11TNKi5 | |
| Beelink SEi8 | |
| Beelink U59 N5105 | |
| BMAX B5 Pro G7H8 | |
| Beelink SEi11 Pro | |
| Access Time Write | |
| Beelink SEi11 Pro | |
| Intel NUC11TNKi5 | |
| Beelink U59 N5105 | |
| BMAX B5 Pro G7H8 | |
| Beelink SEi8 | |
* ... mindre är bättre
Disk Throttling: DiskSpd Read Loop, Queue Depth 8
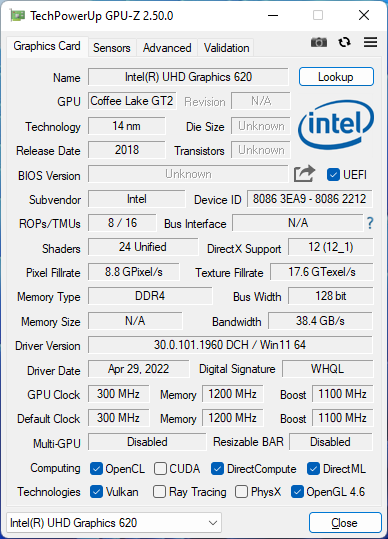
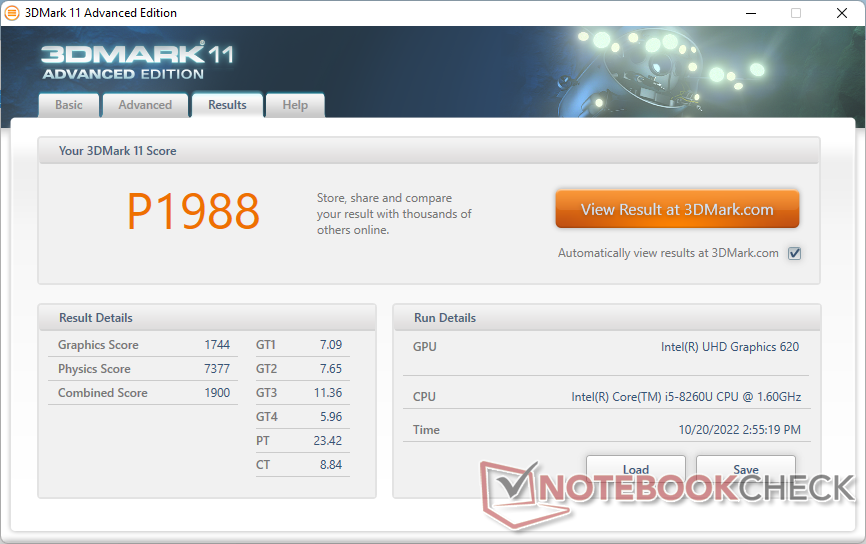
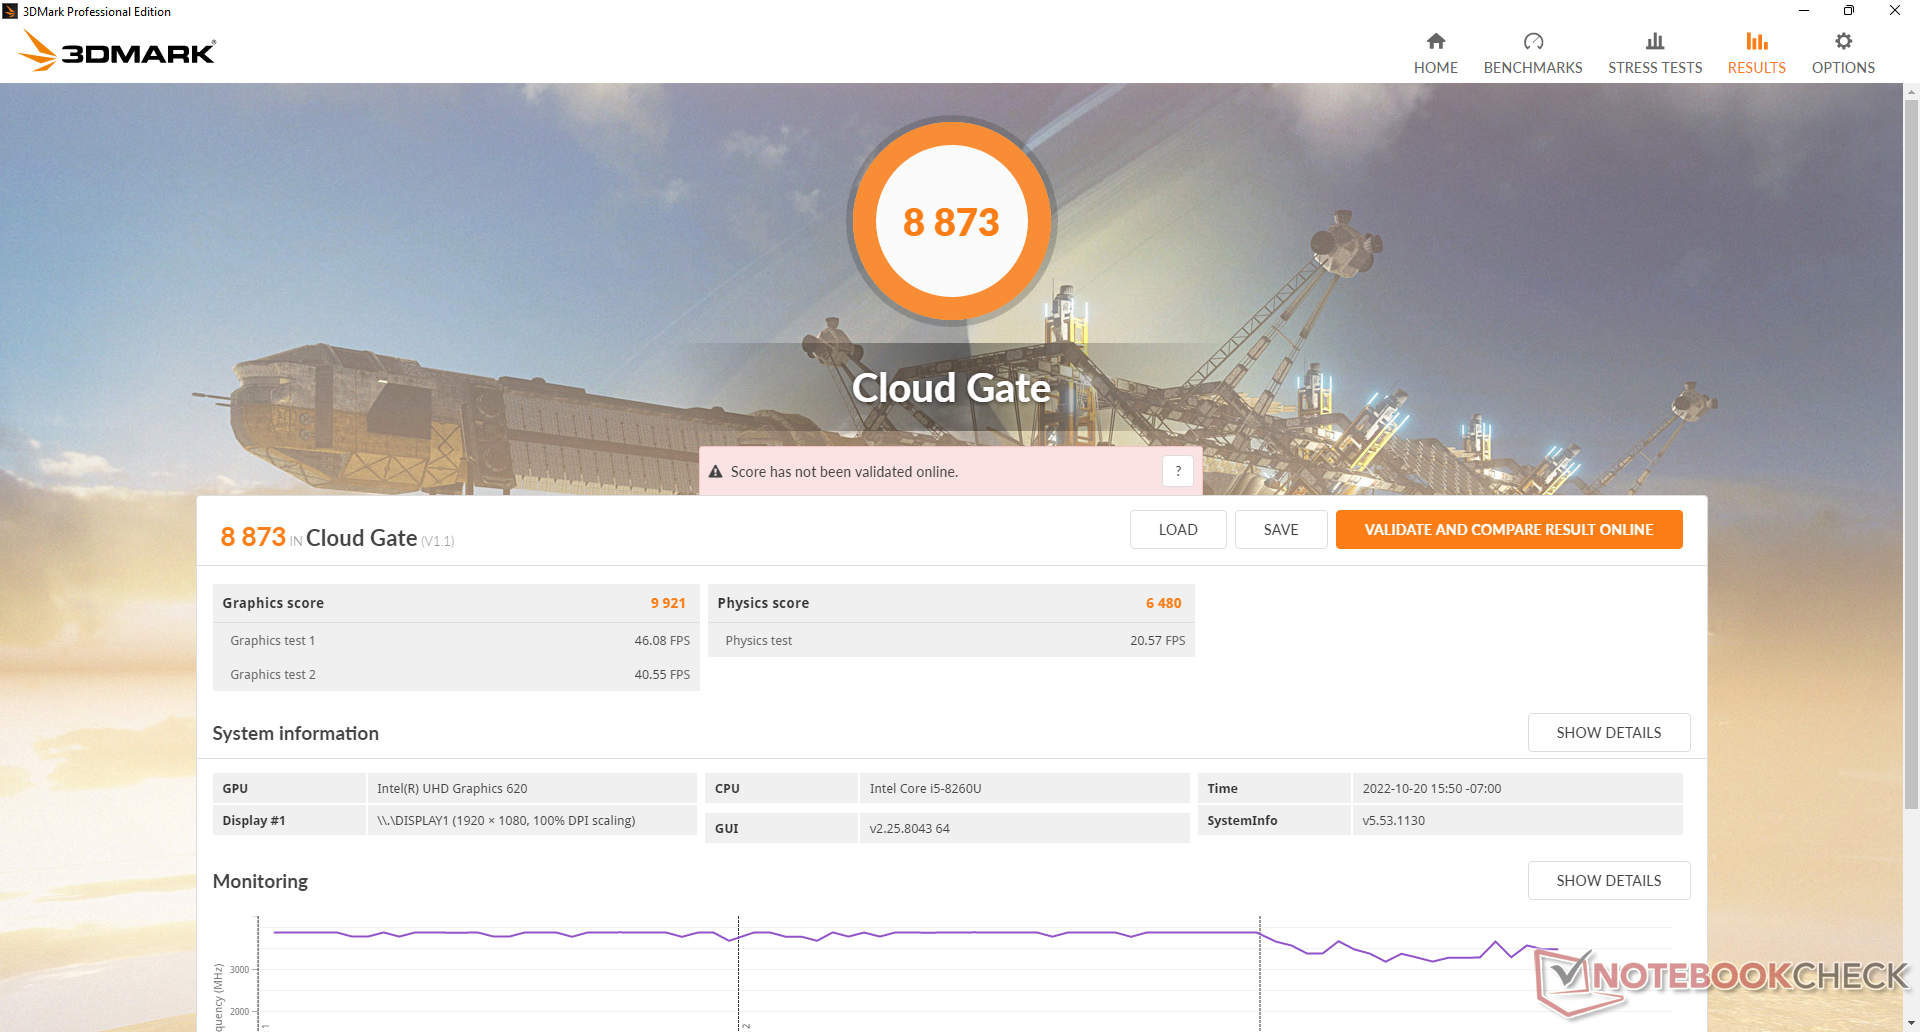
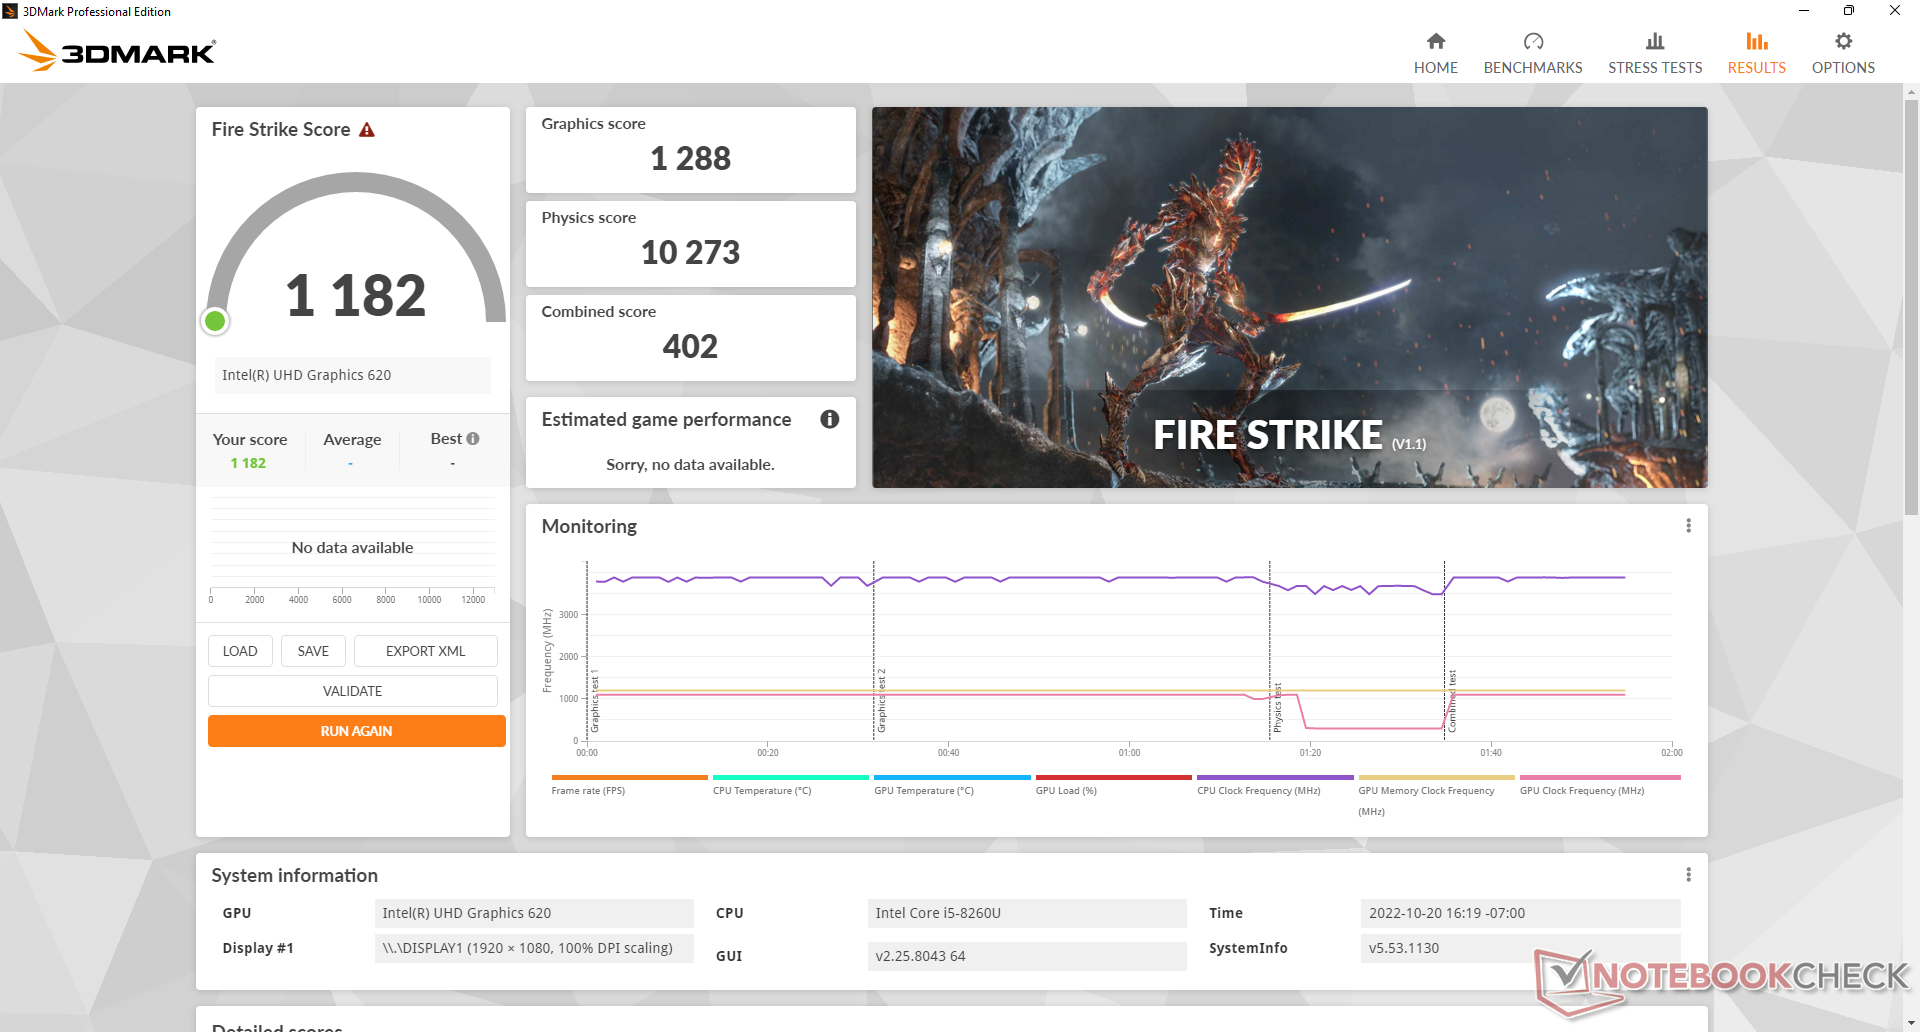
GPU-prestanda
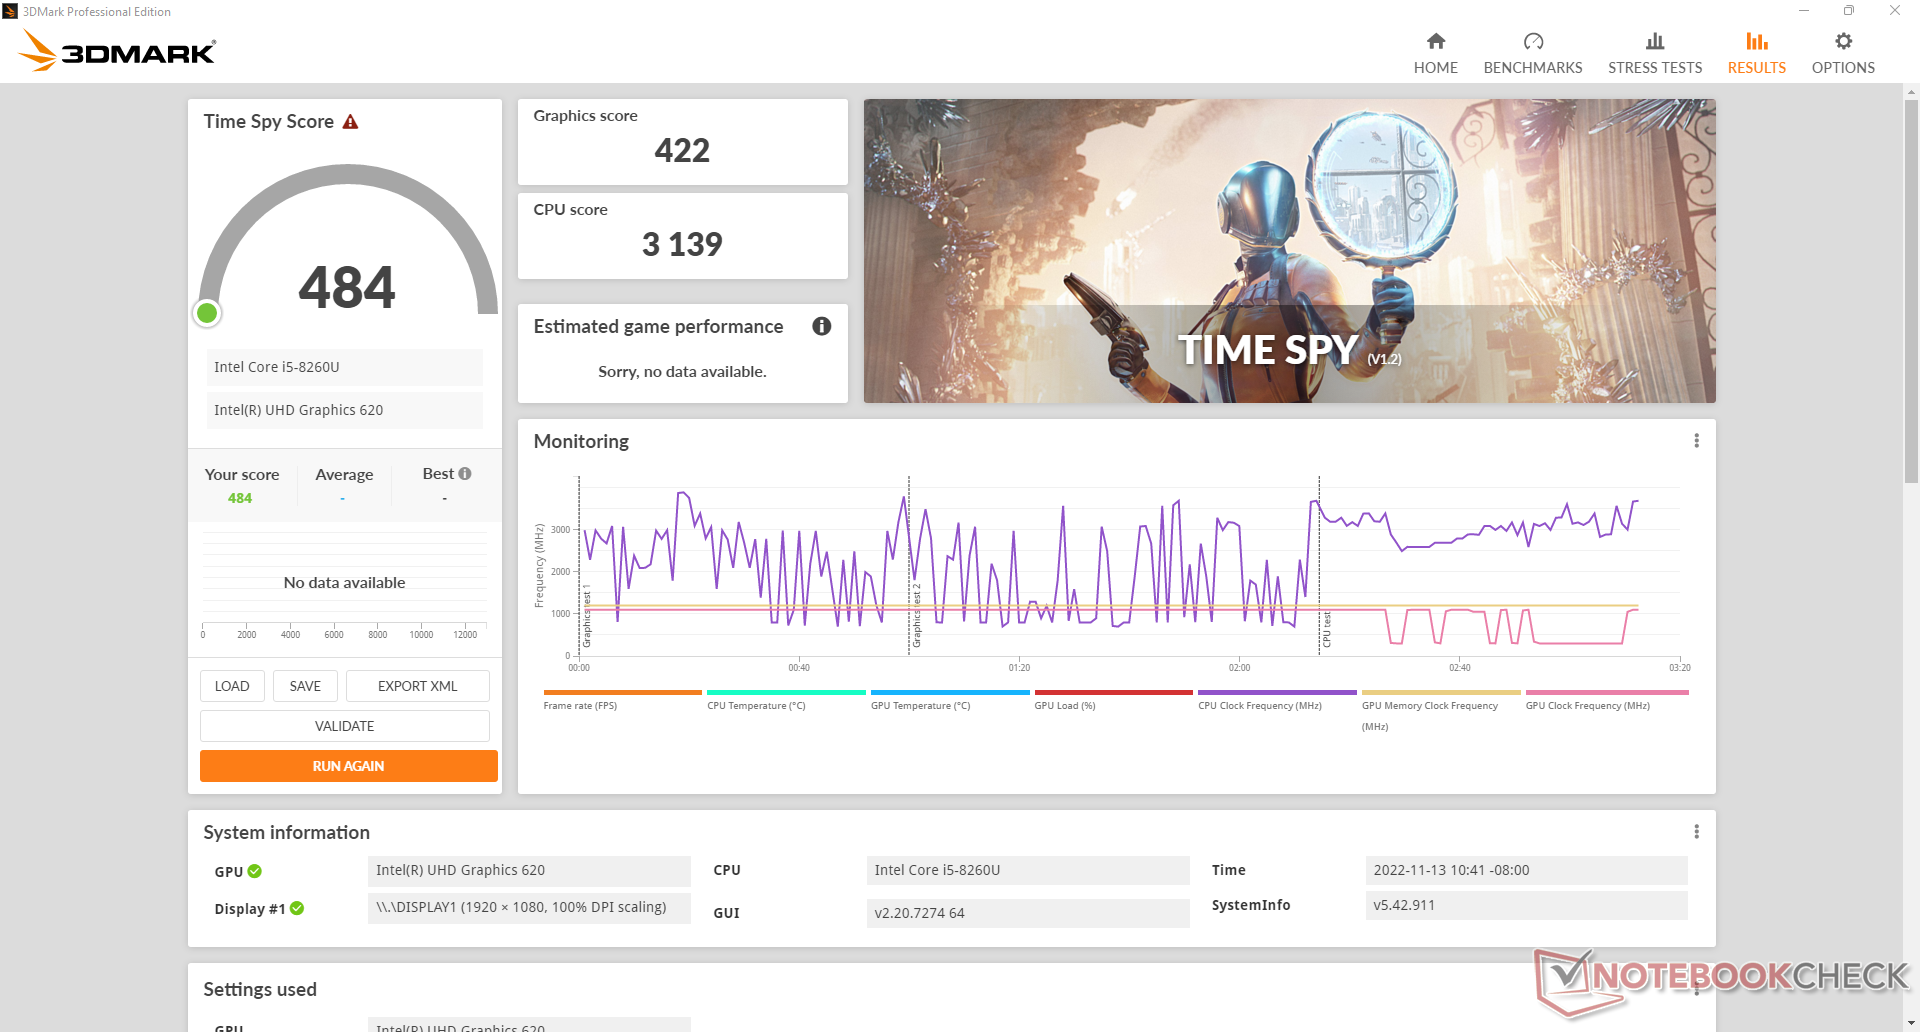
Grafikprestandan är dålig med dagens mått mätt. Iris Xe 80 EU i många moderna CPU:er i Core i5 U-serien ger till exempel 2x till 2,5x snabbare prestanda än vår åldrande UHD Graphics 620. De flesta spel är ospelbara och vissa startar inte ens överhuvudtaget, däribland X-Plane.
| 3DMark | |
| 1920x1080 Fire Strike Graphics | |
| Beelink SEi11 Pro | |
| Asus Vivobook 15 K513EQ | |
| Beelink SER Pro Ryzen 5 5600H | |
| Intel NUC11TNKi5 | |
| Infinix INBook X2 | |
| Geekom Mini IT8-GM08i5T | |
| Beelink SEi8 | |
| BMAX B5 Pro G7H8 | |
| Beelink U59 N5105 | |
| 2560x1440 Time Spy Graphics | |
| Beelink SEi11 Pro | |
| Asus Vivobook 15 K513EQ | |
| Beelink SER Pro Ryzen 5 5600H | |
| Intel NUC11TNKi5 | |
| Infinix INBook X2 | |
| Geekom Mini IT8-GM08i5T | |
| Beelink SEi8 | |
| BMAX B5 Pro G7H8 | |
| Beelink U59 N5105 | |
| 2560x1440 Time Spy Score | |
| Beelink SEi11 Pro | |
| Asus Vivobook 15 K513EQ | |
| Beelink SER Pro Ryzen 5 5600H | |
| Intel NUC11TNKi5 | |
| Infinix INBook X2 | |
| Geekom Mini IT8-GM08i5T | |
| Beelink SEi8 | |
| BMAX B5 Pro G7H8 | |
| Beelink U59 N5105 | |
| 3DMark 11 - 1280x720 Performance GPU | |
| Beelink SEi11 Pro | |
| Asus Vivobook 15 K513EQ | |
| Beelink SER Pro Ryzen 5 5600H | |
| Intel NUC11TNKi5 | |
| Infinix INBook X2 | |
| Geekom Mini IT8-GM08i5T | |
| Beelink SEi8 | |
| BMAX B5 Pro G7H8 | |
| Fujitsu Lifebook U939 i5 | |
| Beelink U59 N5105 | |
| 3DMark 11 Performance | 1988 poäng | |
| 3DMark Cloud Gate Standard Score | 8873 poäng | |
| 3DMark Fire Strike Score | 1182 poäng | |
| 3DMark Time Spy Score | 484 poäng | |
Hjälp | ||
| Blender - v3.3 Classroom CPU (sortera efter värde) | |
| BMAX B5 Pro G7H8 | |
| Beelink SEi11 Pro | |
| Beelink U59 N5105 | |
| Beelink SER Pro Ryzen 5 5600H | |
* ... mindre är bättre
| Performance rating - Percent | |
| Asus Vivobook 15 K513EQ | |
| Beelink SER Pro Ryzen 5 5600H | |
| Beelink SEi11 Pro -1! | |
| Intel NUC11TNKi5 -3! | |
| Infinix INBook X2 -2! | |
| Beelink SEi8 -3! | |
| Fujitsu Lifebook U939 i5 -4! | |
| Beelink U59 N5105 -3! | |
| BMAX B5 Pro G7H8 -5! | |
| The Witcher 3 - 1920x1080 Ultra Graphics & Postprocessing (HBAO+) | |
| Asus Vivobook 15 K513EQ | |
| Beelink SER Pro Ryzen 5 5600H | |
| Beelink SEi11 Pro | |
| Infinix INBook X2 | |
| Beelink U59 N5105 | |
| GTA V - 1920x1080 Highest AA:4xMSAA + FX AF:16x | |
| Asus Vivobook 15 K513EQ | |
| Beelink SER Pro Ryzen 5 5600H | |
| Final Fantasy XV Benchmark - 1920x1080 High Quality | |
| Beelink SEi11 Pro | |
| Asus Vivobook 15 K513EQ | |
| Beelink SER Pro Ryzen 5 5600H | |
| Intel NUC11TNKi5 | |
| Infinix INBook X2 | |
| Beelink SEi8 | |
| Strange Brigade - 1920x1080 ultra AA:ultra AF:16 | |
| Beelink SER Pro Ryzen 5 5600H | |
| Beelink SEi11 Pro | |
| Asus Vivobook 15 K513EQ | |
| Dota 2 Reborn - 1920x1080 ultra (3/3) best looking | |
| Asus Vivobook 15 K513EQ | |
| Beelink SER Pro Ryzen 5 5600H | |
| Beelink SEi11 Pro | |
| Intel NUC11TNKi5 | |
| Infinix INBook X2 | |
| Beelink SEi8 | |
| Fujitsu Lifebook U939 i5 | |
| Beelink U59 N5105 | |
| BMAX B5 Pro G7H8 | |
| X-Plane 11.11 - 1920x1080 high (fps_test=3) | |
| Asus Vivobook 15 K513EQ | |
| Beelink SEi11 Pro | |
| Beelink SER Pro Ryzen 5 5600H | |
| Intel NUC11TNKi5 | |
| Infinix INBook X2 | |
| Fujitsu Lifebook U939 i5 | |
| Beelink SEi8 | |
| Beelink U59 N5105 | |
| The Witcher 3 | |
| 1024x768 Low Graphics & Postprocessing | |
| Beelink SEi11 Pro | |
| Asus Vivobook 15 K513EQ | |
| Beelink SER Pro Ryzen 5 5600H | |
| Intel NUC11TNKi5 | |
| Infinix INBook X2 | |
| BMAX B5 Pro G7H8 | |
| Beelink U59 N5105 | |
| Fujitsu Lifebook U939 i5 | |
| 1366x768 Medium Graphics & Postprocessing | |
| Beelink SEi11 Pro | |
| Beelink SER Pro Ryzen 5 5600H | |
| Asus Vivobook 15 K513EQ | |
| Infinix INBook X2 | |
| Beelink U59 N5105 | |
| BMAX B5 Pro G7H8 | |
| 1920x1080 High Graphics & Postprocessing (Nvidia HairWorks Off) | |
| Asus Vivobook 15 K513EQ | |
| Beelink SEi11 Pro | |
| Beelink SER Pro Ryzen 5 5600H | |
| Infinix INBook X2 | |
| Beelink U59 N5105 | |
| BMAX B5 Pro G7H8 | |
| Final Fantasy XV Benchmark - 1280x720 Lite Quality | |
| Asus Vivobook 15 K513EQ | |
| Beelink SER Pro Ryzen 5 5600H | |
| Beelink SEi11 Pro | |
| Intel NUC11TNKi5 | |
| Infinix INBook X2 | |
| Geekom Mini IT8-GM08i5T | |
| Beelink SEi8 | |
| Beelink U59 N5105 | |
| BMAX B5 Pro G7H8 | |
| Dota 2 Reborn | |
| 1280x720 min (0/3) fastest | |
| Beelink SER Pro Ryzen 5 5600H | |
| Asus Vivobook 15 K513EQ | |
| Beelink SEi11 Pro | |
| Beelink SEi8 | |
| Infinix INBook X2 | |
| Intel NUC11TNKi5 | |
| Beelink U59 N5105 | |
| Fujitsu Lifebook U939 i5 | |
| BMAX B5 Pro G7H8 | |
| 1366x768 med (1/3) | |
| Asus Vivobook 15 K513EQ | |
| Beelink SER Pro Ryzen 5 5600H | |
| Beelink SEi11 Pro | |
| Infinix INBook X2 | |
| Intel NUC11TNKi5 | |
| Fujitsu Lifebook U939 i5 | |
| Beelink SEi8 | |
| Beelink U59 N5105 | |
| BMAX B5 Pro G7H8 | |
| 1920x1080 high (2/3) | |
| Asus Vivobook 15 K513EQ | |
| Beelink SER Pro Ryzen 5 5600H | |
| Beelink SEi11 Pro | |
| Intel NUC11TNKi5 | |
| Infinix INBook X2 | |
| Beelink SEi8 | |
| Fujitsu Lifebook U939 i5 | |
| Beelink U59 N5105 | |
| BMAX B5 Pro G7H8 | |
| 1920x1080 ultra (3/3) best looking | |
| Asus Vivobook 15 K513EQ | |
| Beelink SER Pro Ryzen 5 5600H | |
| Beelink SEi11 Pro | |
| Intel NUC11TNKi5 | |
| Infinix INBook X2 | |
| Beelink SEi8 | |
| Fujitsu Lifebook U939 i5 | |
| Beelink U59 N5105 | |
| BMAX B5 Pro G7H8 | |
Witcher 3 FPS Chart
| låg | med. | hög | ultra | |
|---|---|---|---|---|
| The Witcher 3 (2015) | 23.8 | 13.5 | 7.3 | |
| Dota 2 Reborn (2015) | 42.4 | 8.6 | 5.6 | 5.6 |
| Final Fantasy XV Benchmark (2018) | 5.61 |
Utsläpp
Systemljud - inte alls högt
Den interna fläkten är nästan alltid aktiv med cirka 25 dB(A) mot en tyst bakgrund på 23 dB(A) även när inga program körs. Lyckligtvis är detta låga intervall tillräckligt tyst för att inte märkas i de flesta scenarier. Om man kör högre belastningar som spel uppstår ett fläktljud på 30-34 dB(A), vilket fortfarande är mycket tyst, särskilt i HTPC-miljöer.
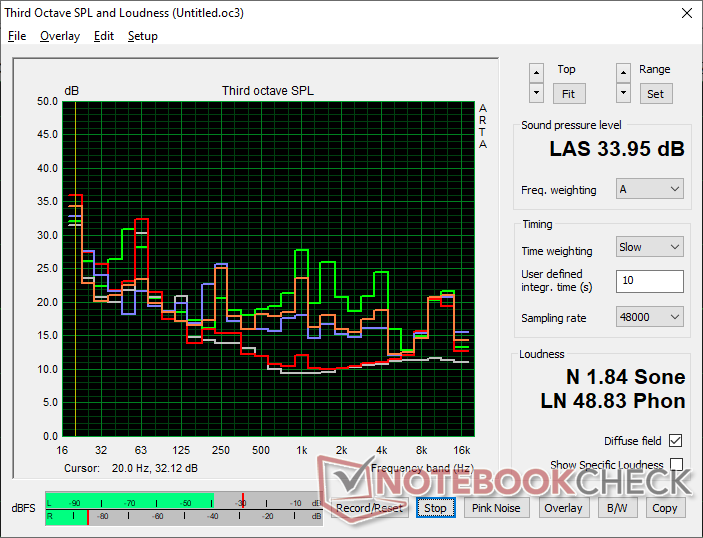
Ljudnivå
| Låg belastning |
| 25.1 / 25.1 / 25.1 dB(A) |
| Hög belastning |
| 28.6 / 34 dB(A) |
 | ||
30 dB tyst 40 dB(A) hörbar 50 dB(A) högt ljud |
||
min: | ||
| BMAX B5 Pro G7H8 UHD Graphics 620, i5-8260U | Beelink SEi11 Pro Iris Xe G7 96EUs, i5-11320H, Kingston NV1 SNVS/500GCN | Beelink U59 N5105 UHD Graphics (Jasper Lake 24 EU), Celeron N5105, Silicon Motion AZW 512G NV428 | Beelink SEi8 Iris Plus Graphics 655, i3-8109U, Intel SSD 660p SSDPEKNW512G8 | Beelink SER Pro Ryzen 5 5600H Vega 7, R5 5600H, Kingston NV1 SNVS/500GCN | Intel NUC11TNKi5 Iris Xe G7 80EUs, i5-1135G7, Transcend M.2 SSD 430S TS512GMTS430S | |
|---|---|---|---|---|---|---|
| Noise | -5% | 14% | -14% | -7% | -32% | |
| av / miljö * (dB) | 23 | 22.8 1% | 21.5 7% | 24.5 -7% | 22.8 1% | 24.8 -8% |
| Idle Minimum * (dB) | 25.1 | 24.7 2% | 22.1 12% | 26.5 -6% | 26.1 -4% | 35.6 -42% |
| Idle Average * (dB) | 25.1 | 24.7 2% | 22.1 12% | 26.5 -6% | 26.1 -4% | 35.6 -42% |
| Idle Maximum * (dB) | 25.1 | 25.3 -1% | 22.1 12% | 31.1 -24% | 28.7 -14% | 35.6 -42% |
| Load Average * (dB) | 28.6 | 33.2 -16% | 23.9 16% | 37.7 -32% | 32.3 -13% | 36.2 -27% |
| Witcher 3 ultra * (dB) | 30.1 | 34.5 -15% | 24.4 19% | 32.8 -9% | 38 -26% | |
| Load Maximum * (dB) | 34 | 37.8 -11% | 26.8 21% | 37.5 -10% | 36.4 -7% | 47.6 -40% |
* ... mindre är bättre
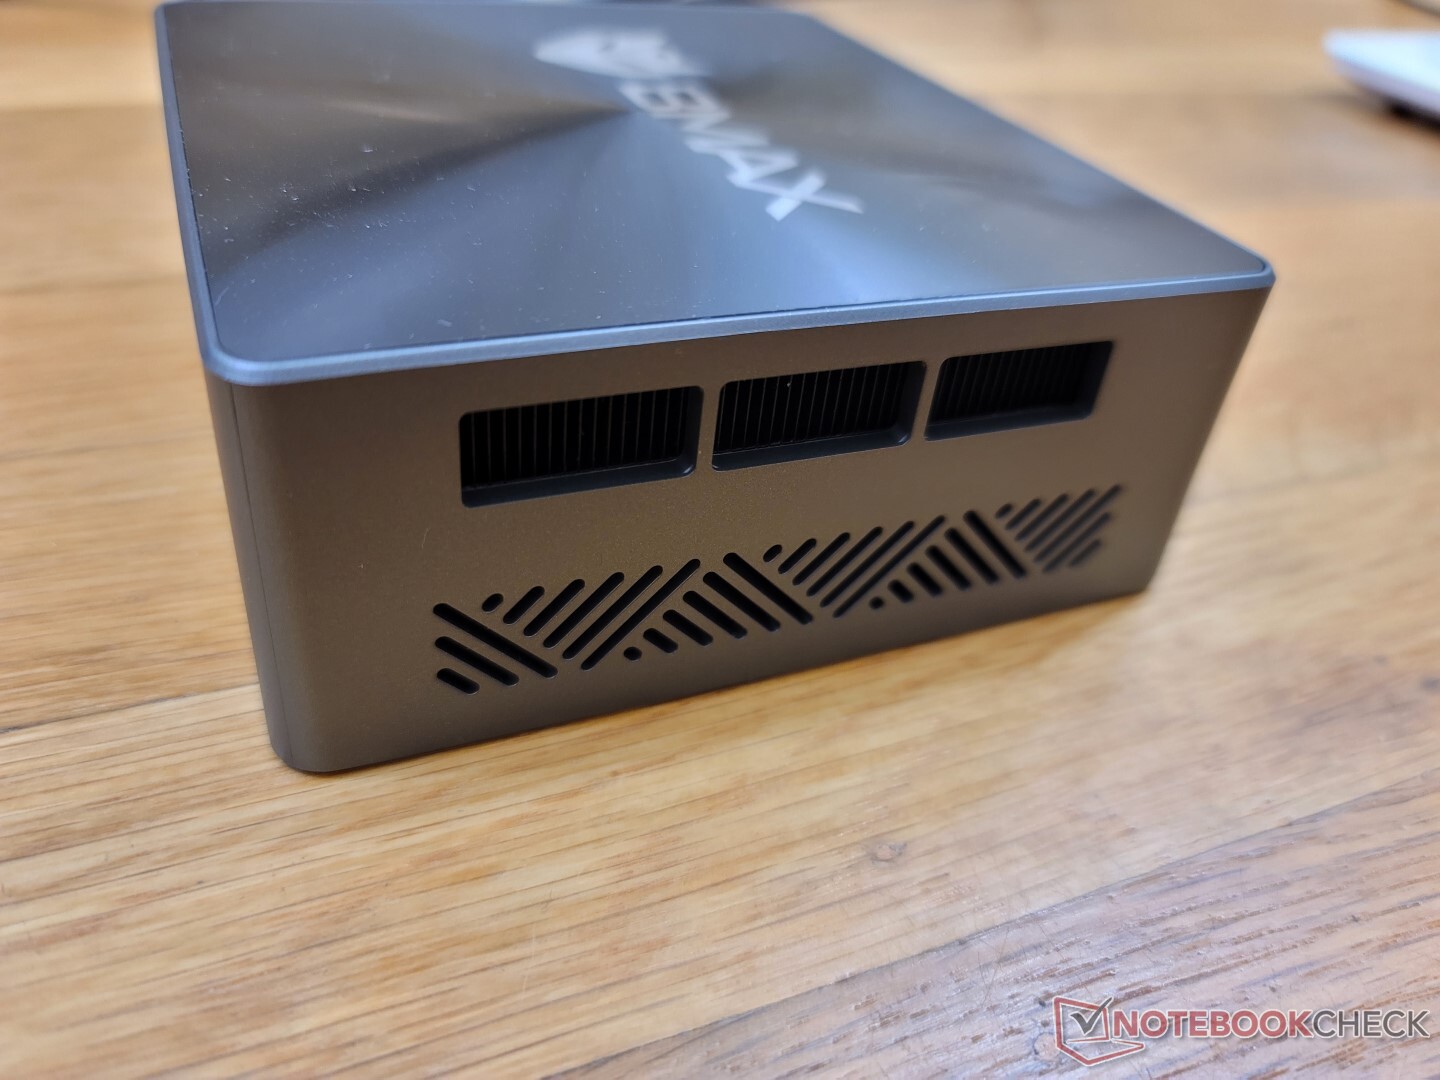
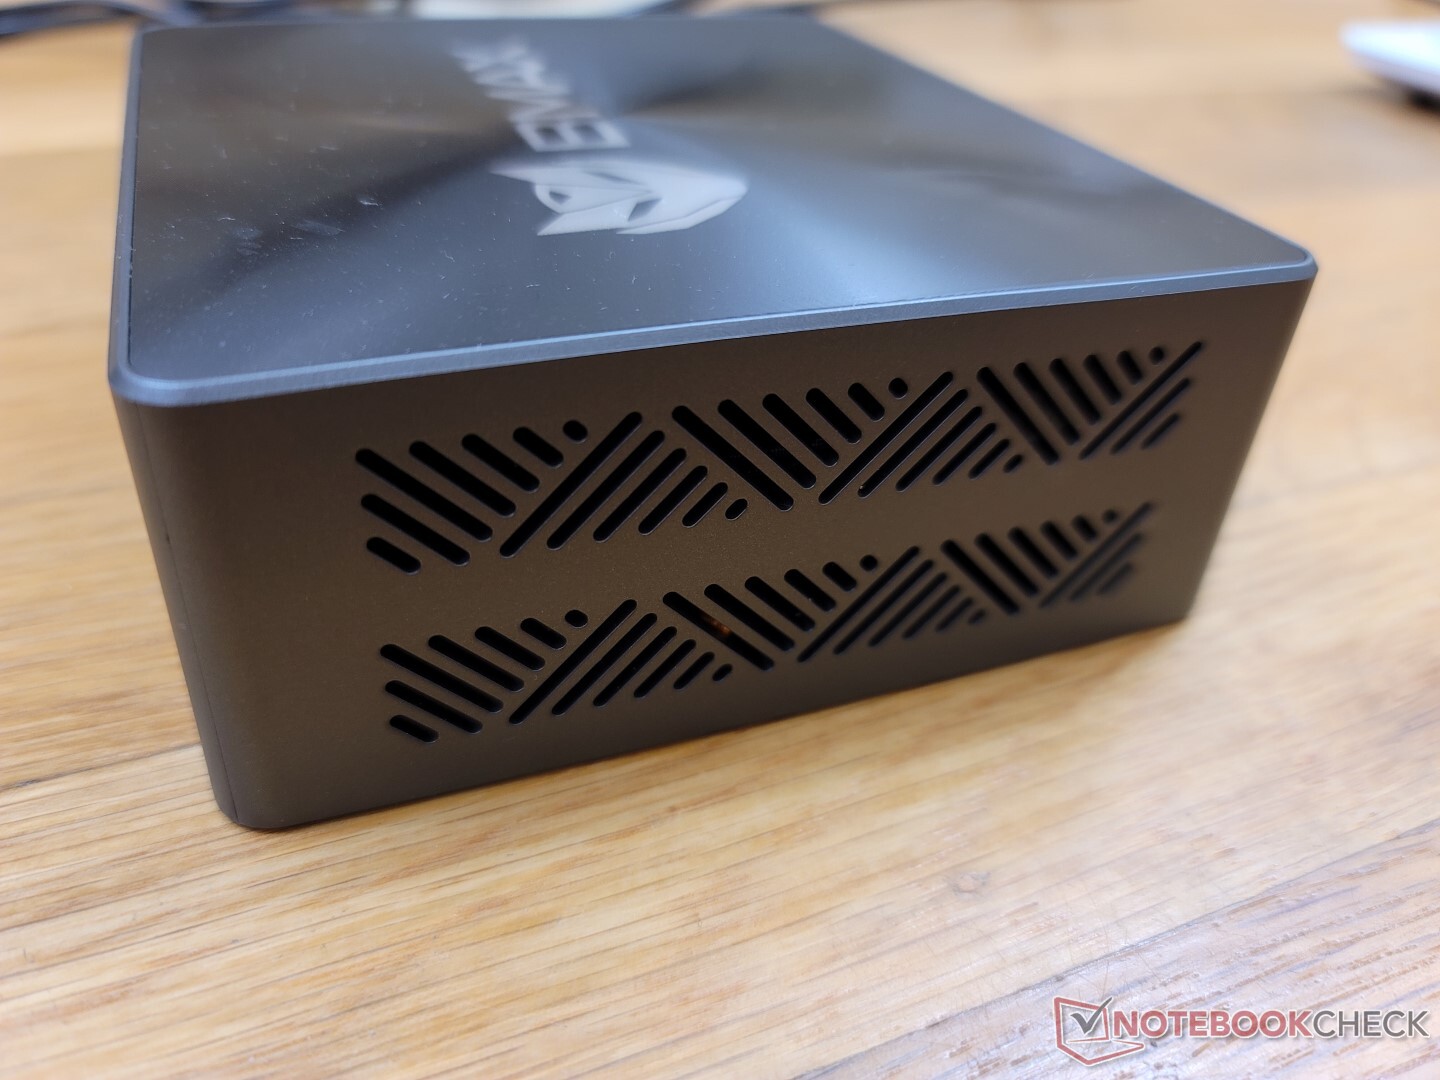
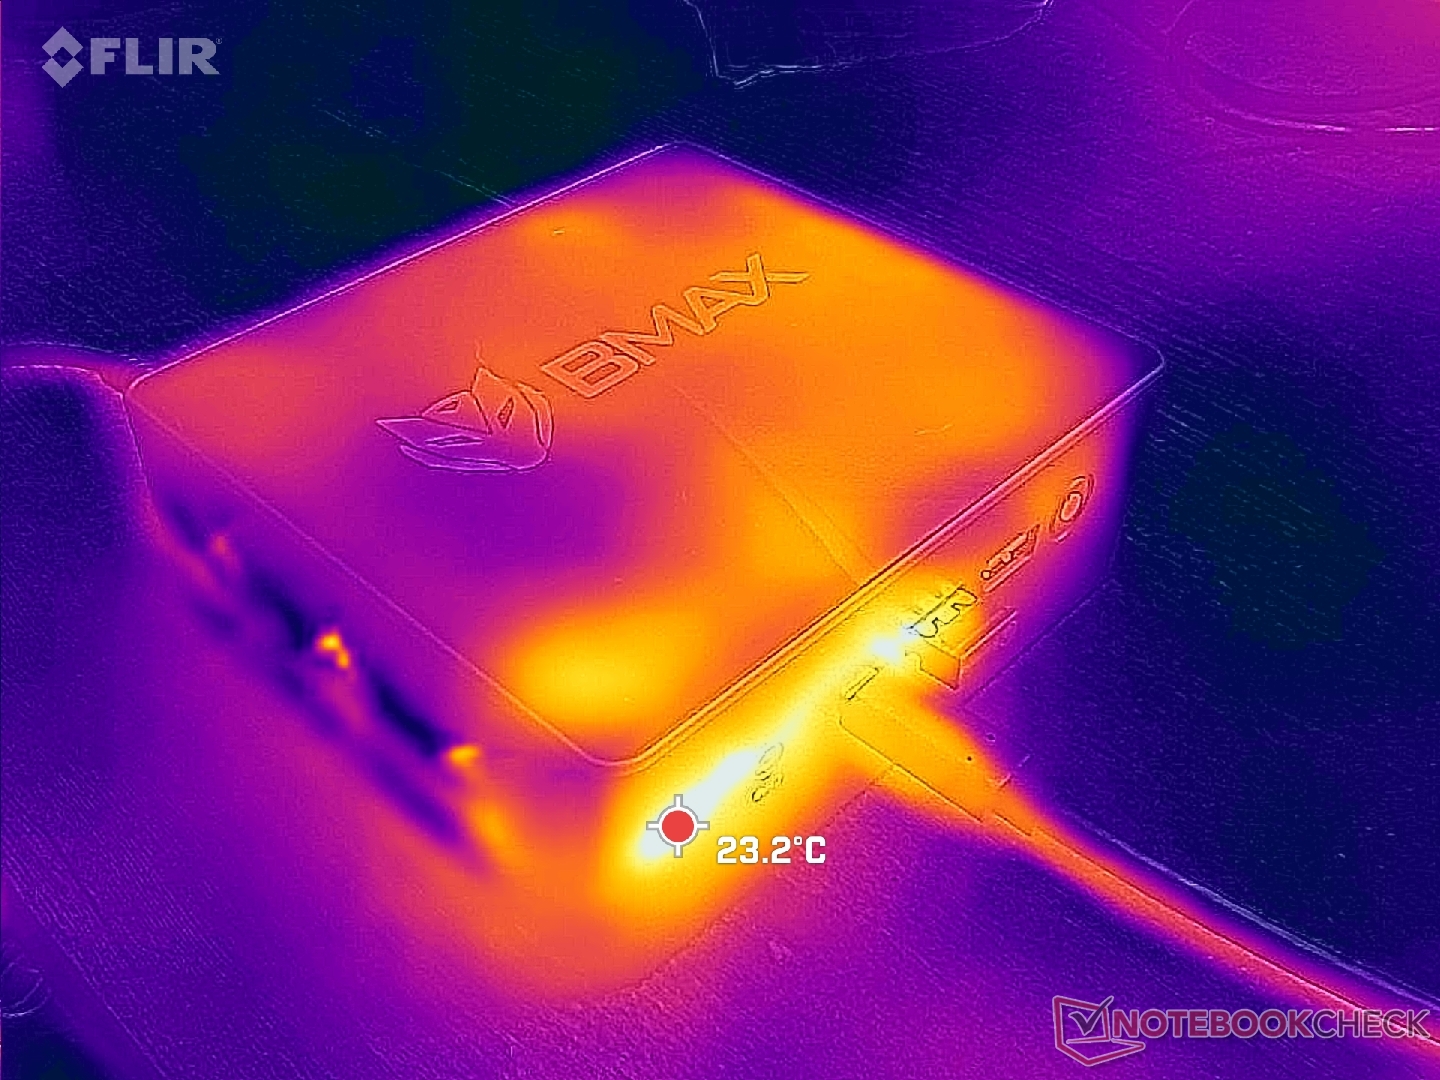
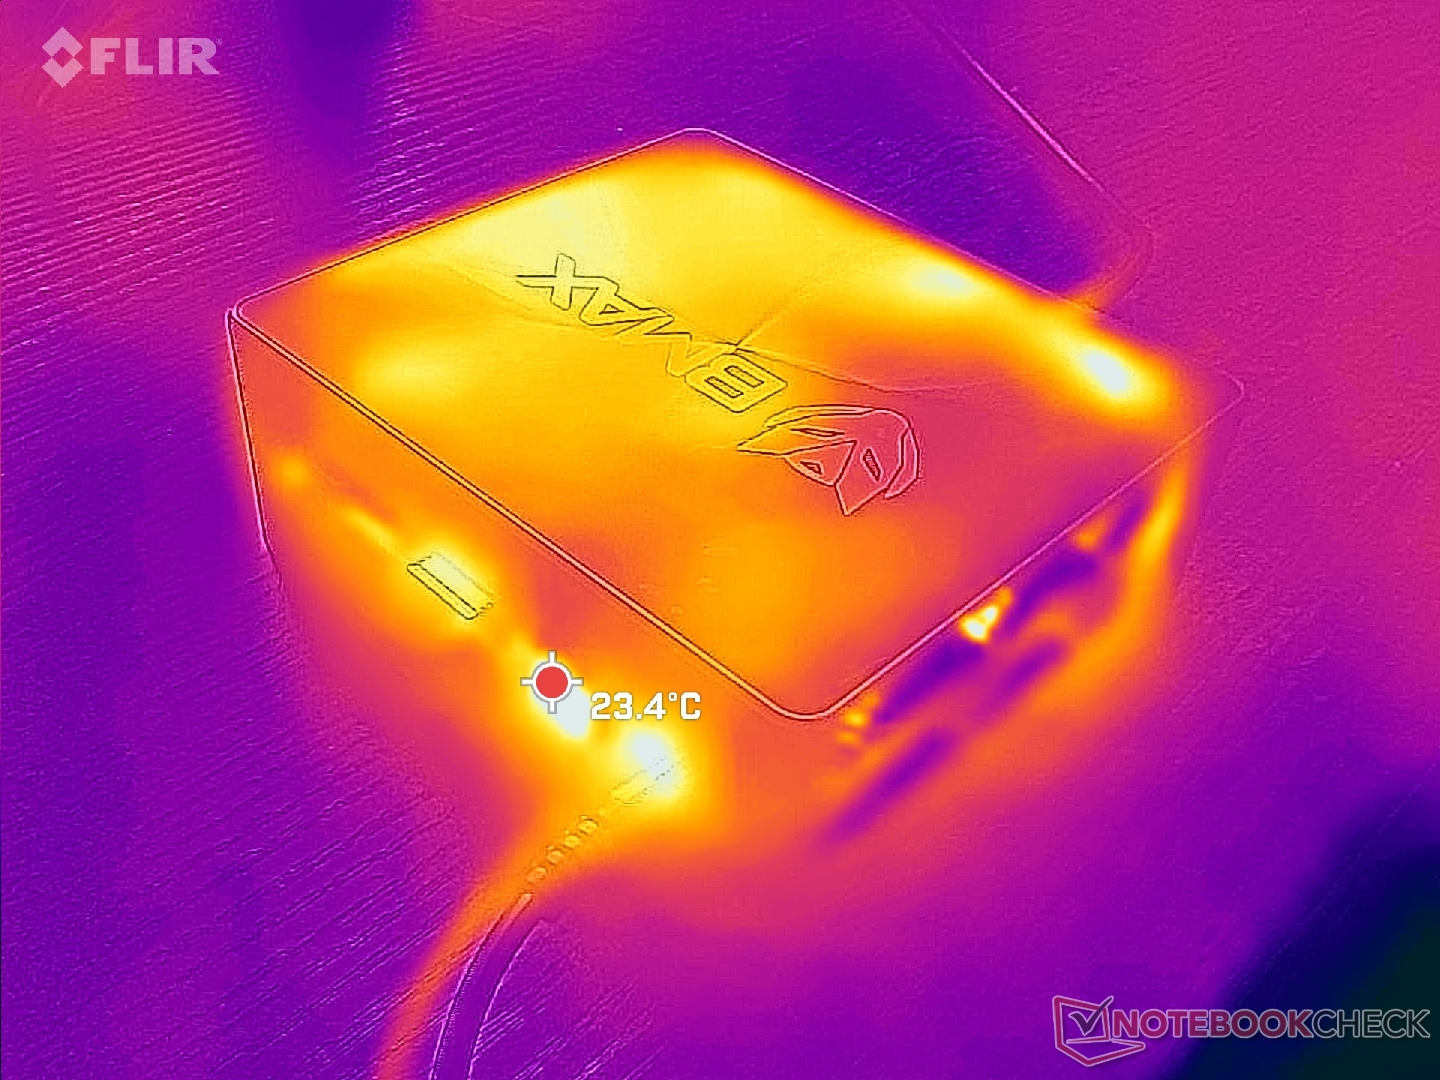
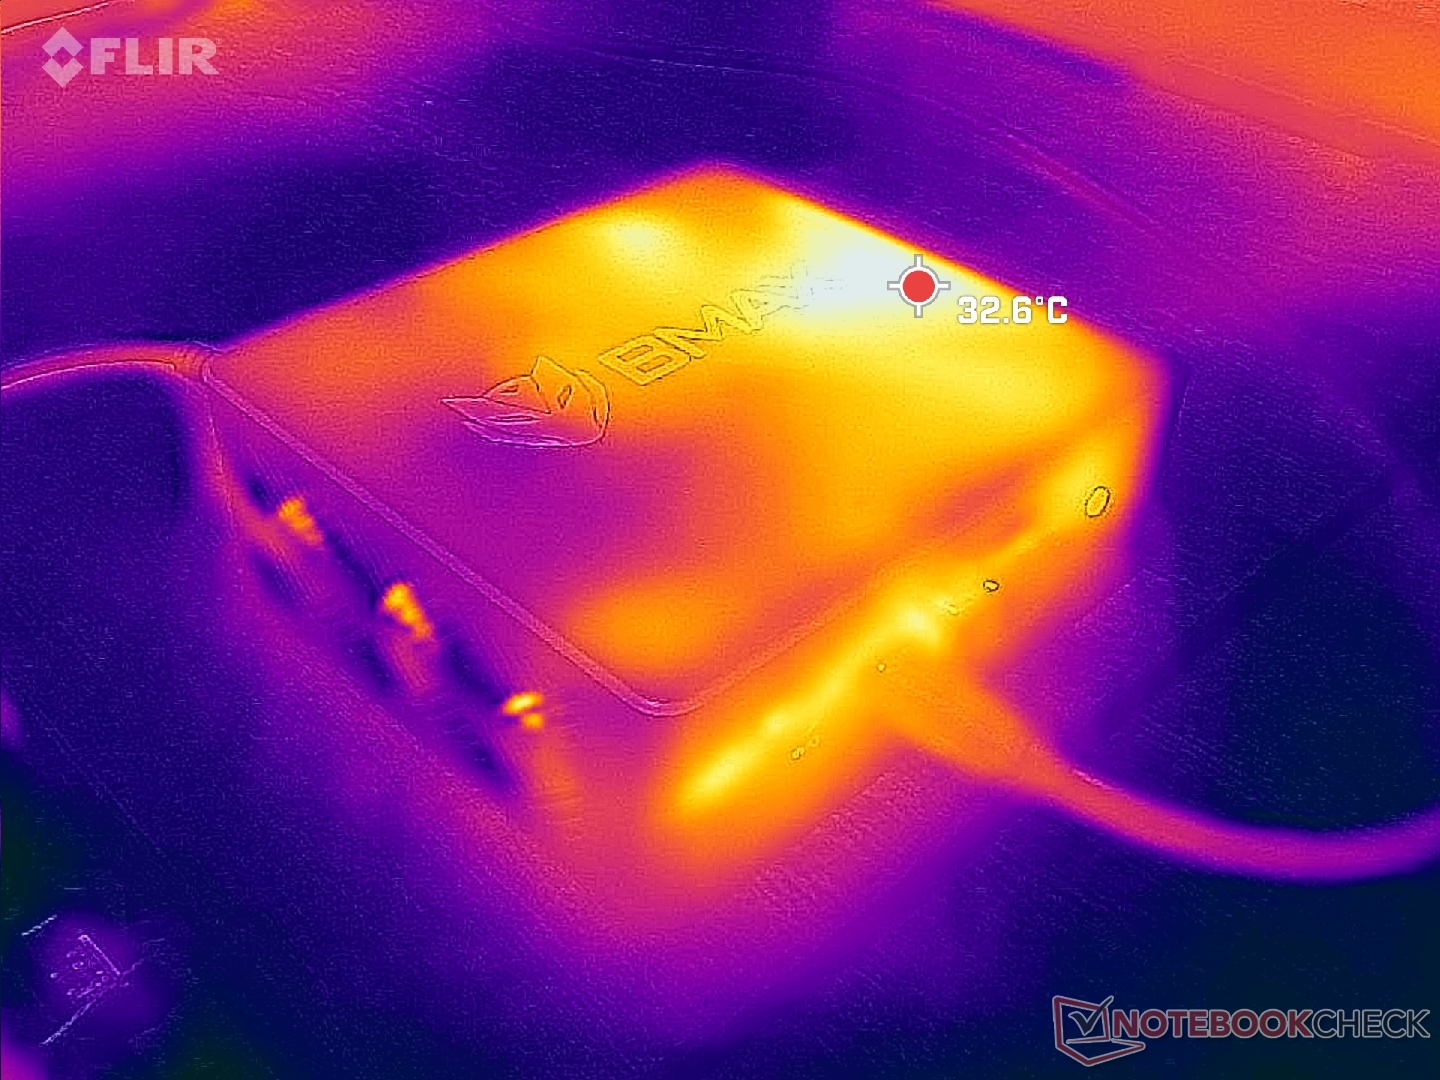
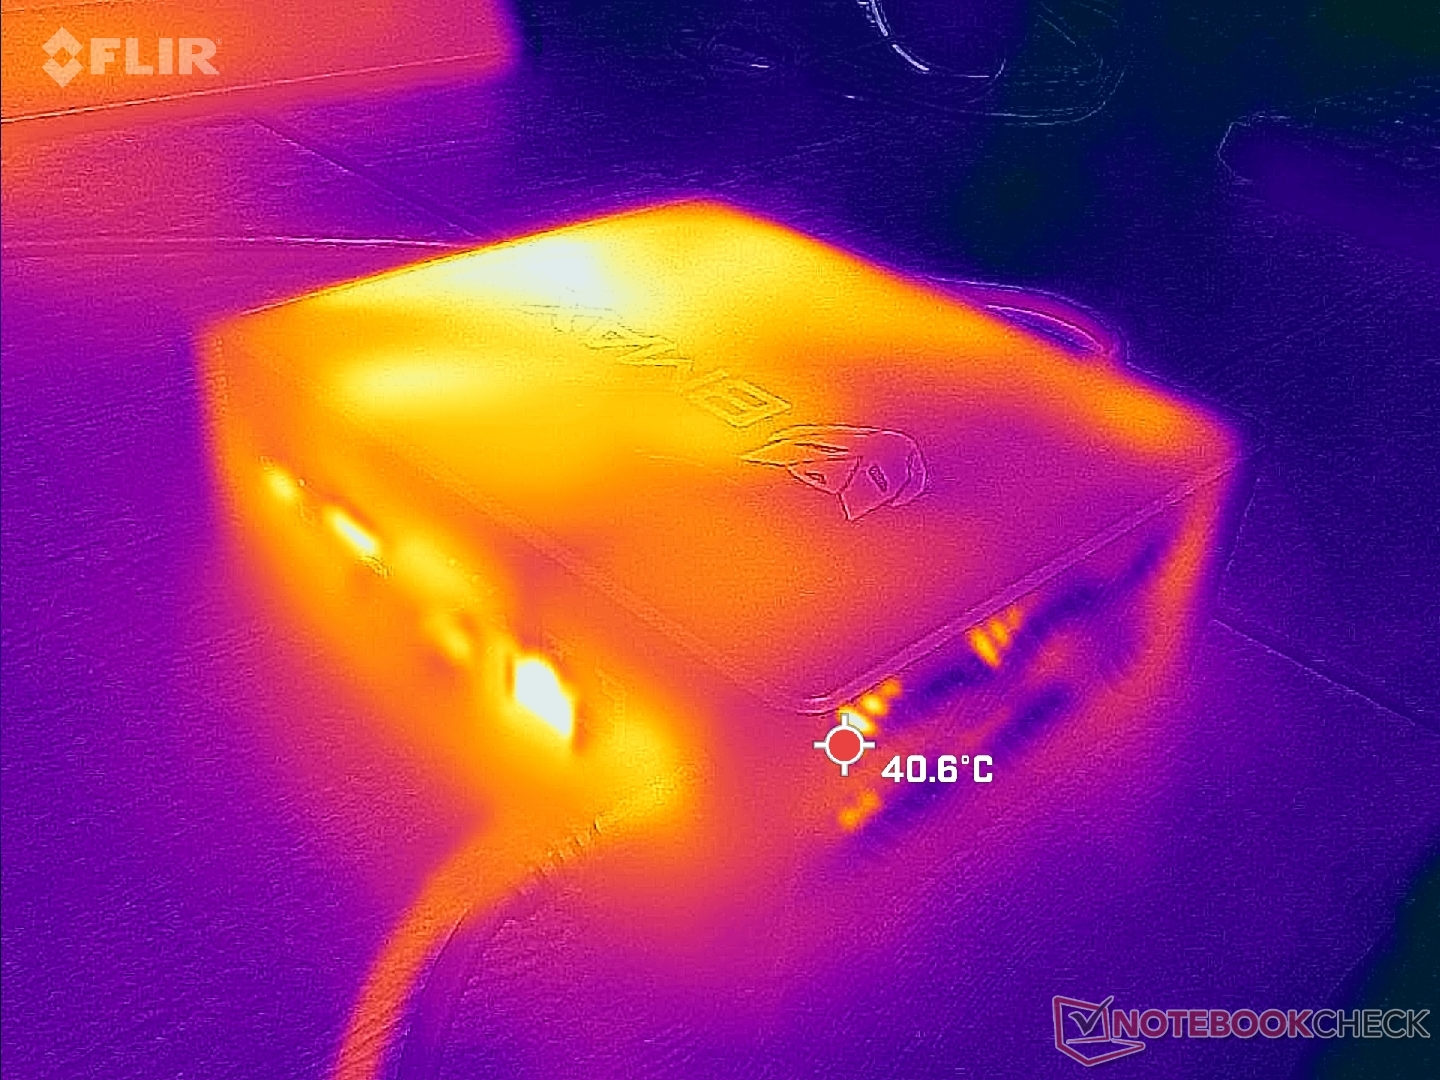
Temperatur
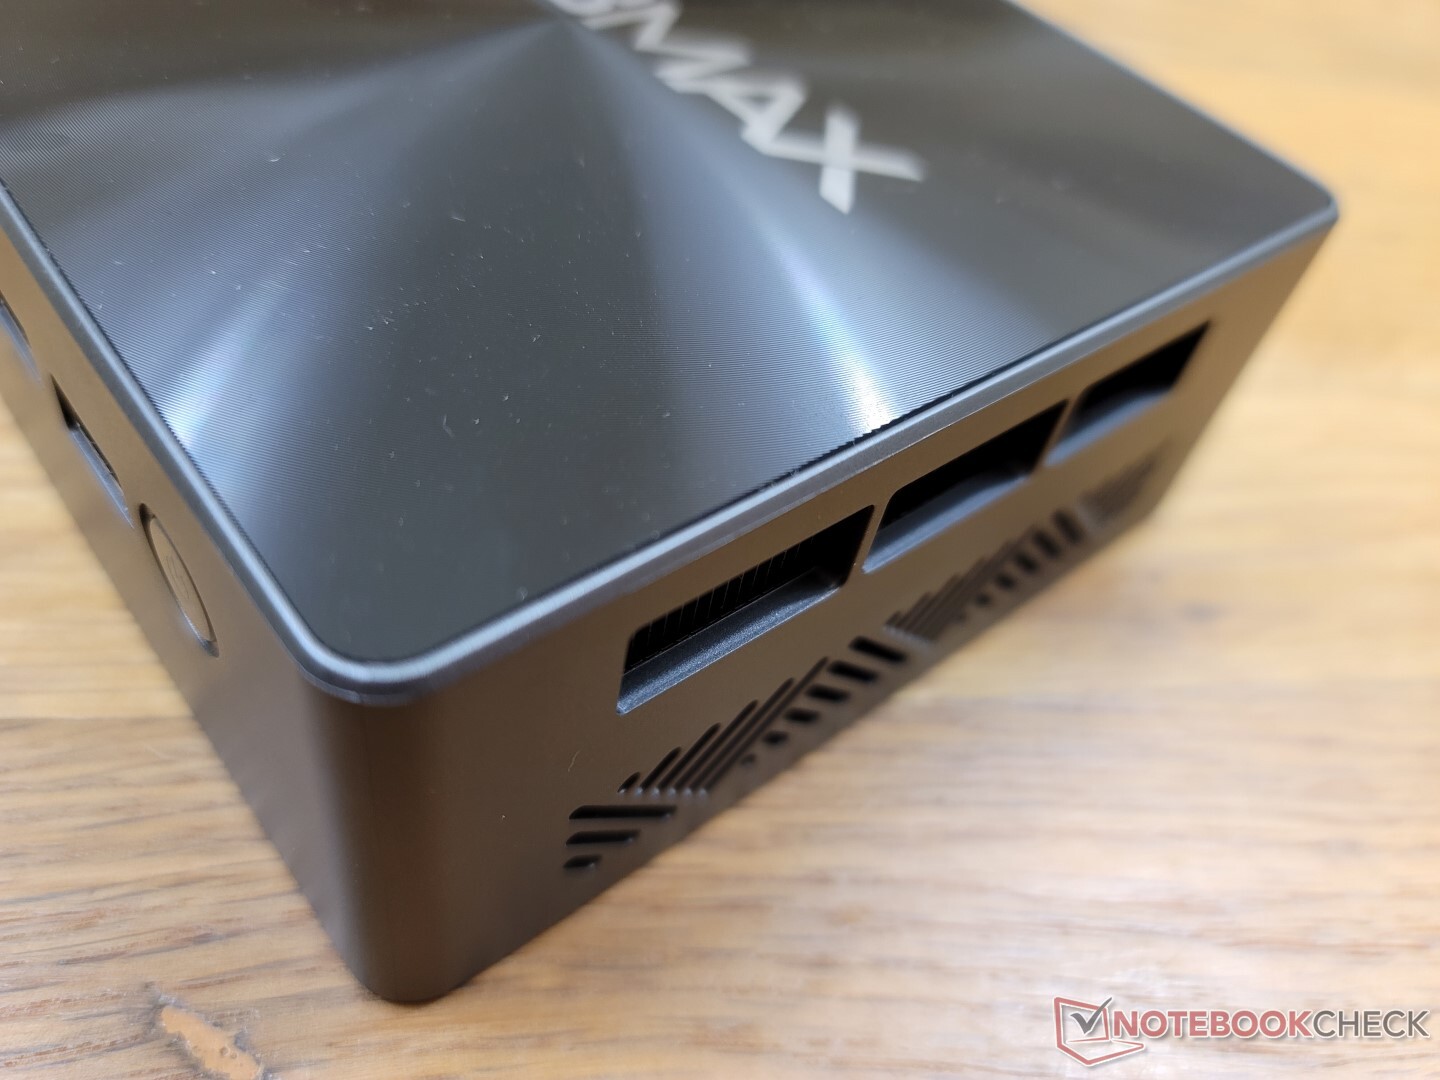
Yttemperaturen är aldrig obehagligt varm. Den heta punkten på toppen når till exempel bara upp till cirka 33 C när den utsätts för hög belastning vid bearbetningen. Värmen släpper ut från chassits högra sida till skillnad från Intel NUC där värmen släpps ut från baksidan
Föremål kan säkert placeras på toppen av enheten eftersom det inte finns några ventilationsgaller där.
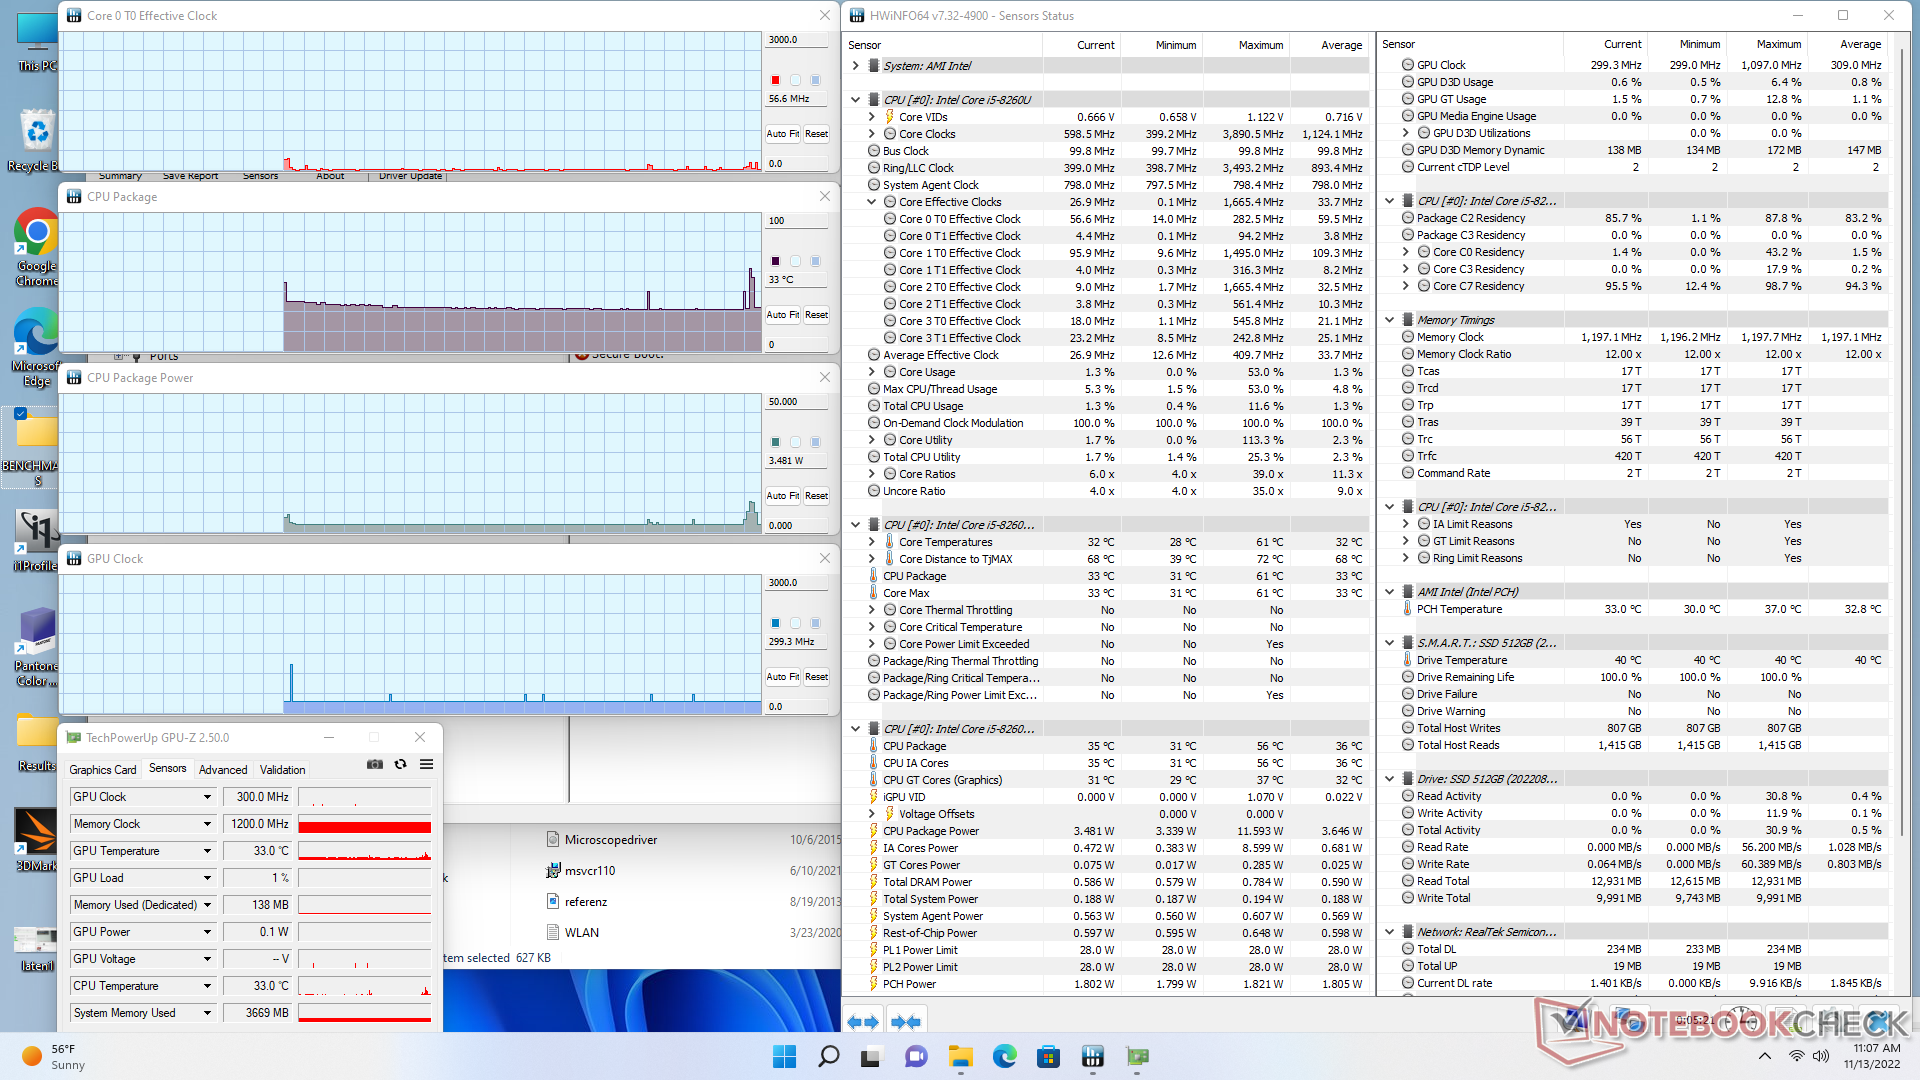
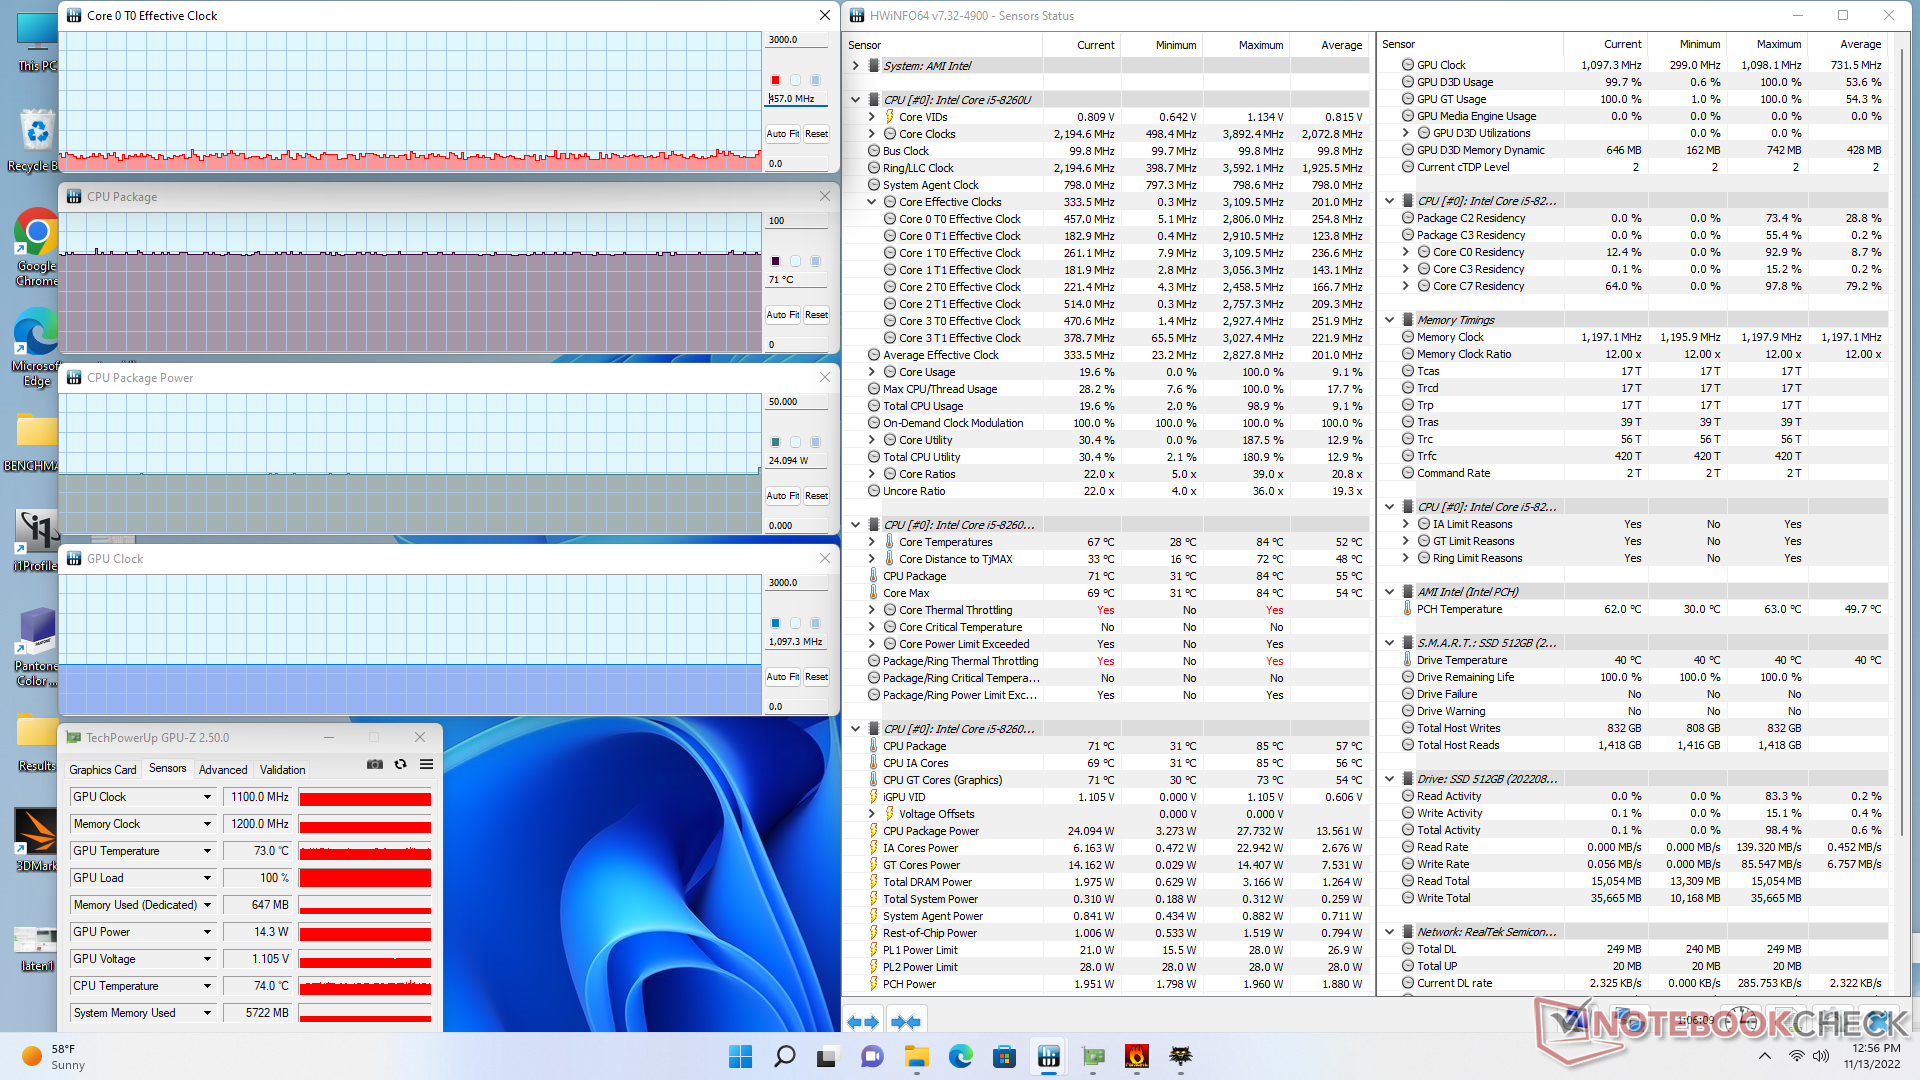
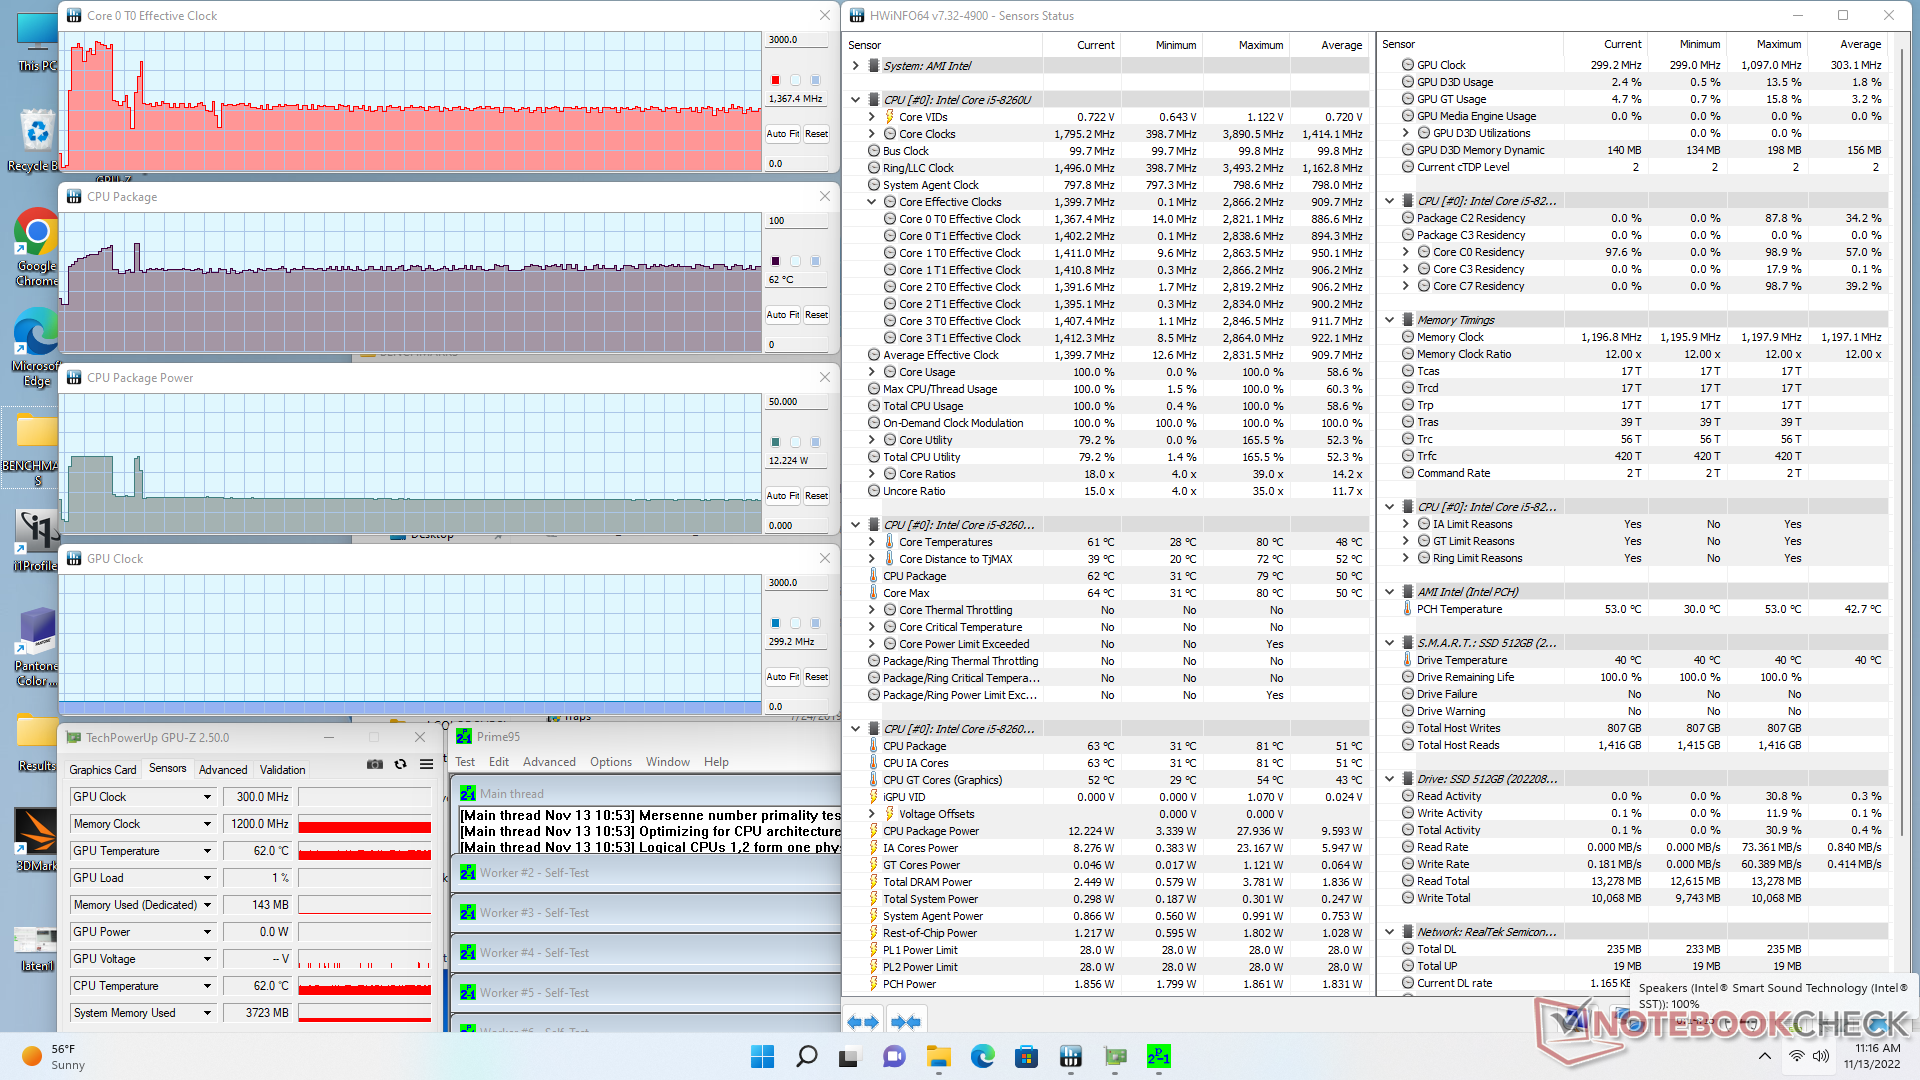
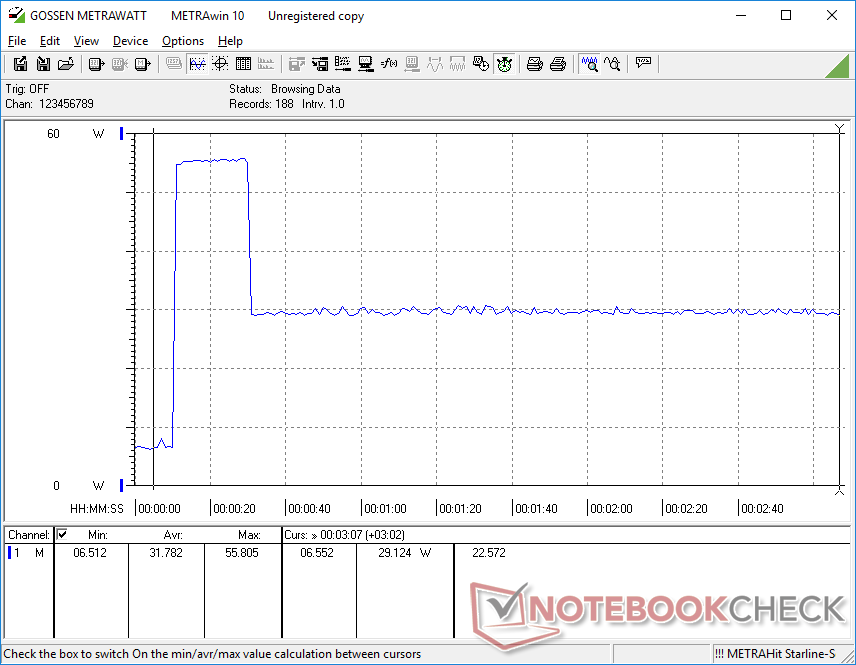
Stresstest
När CPU:n stressas under Prime95 ökar den till 2,8 GHz och 28 W i cirka 20 sekunder eller tills kärntemperaturen når 76 C. Klockfrekvensen och kortets strömförbrukning stabiliseras sedan på 1,5 GHz respektive 12 W för att upprätthålla en svalare kärntemperatur på 60 C. Genom att upprepa samma test på Beelink SEi8 skulle resultera i snabbare kärnklockor och varmare temperaturer på 2,8 GHz respektive 80 C. Turbo Boost-potentialen hos B5 Pro är därför begränsad, vilket följer vad vi observerade under vårt CineBench-stresstest ovan.
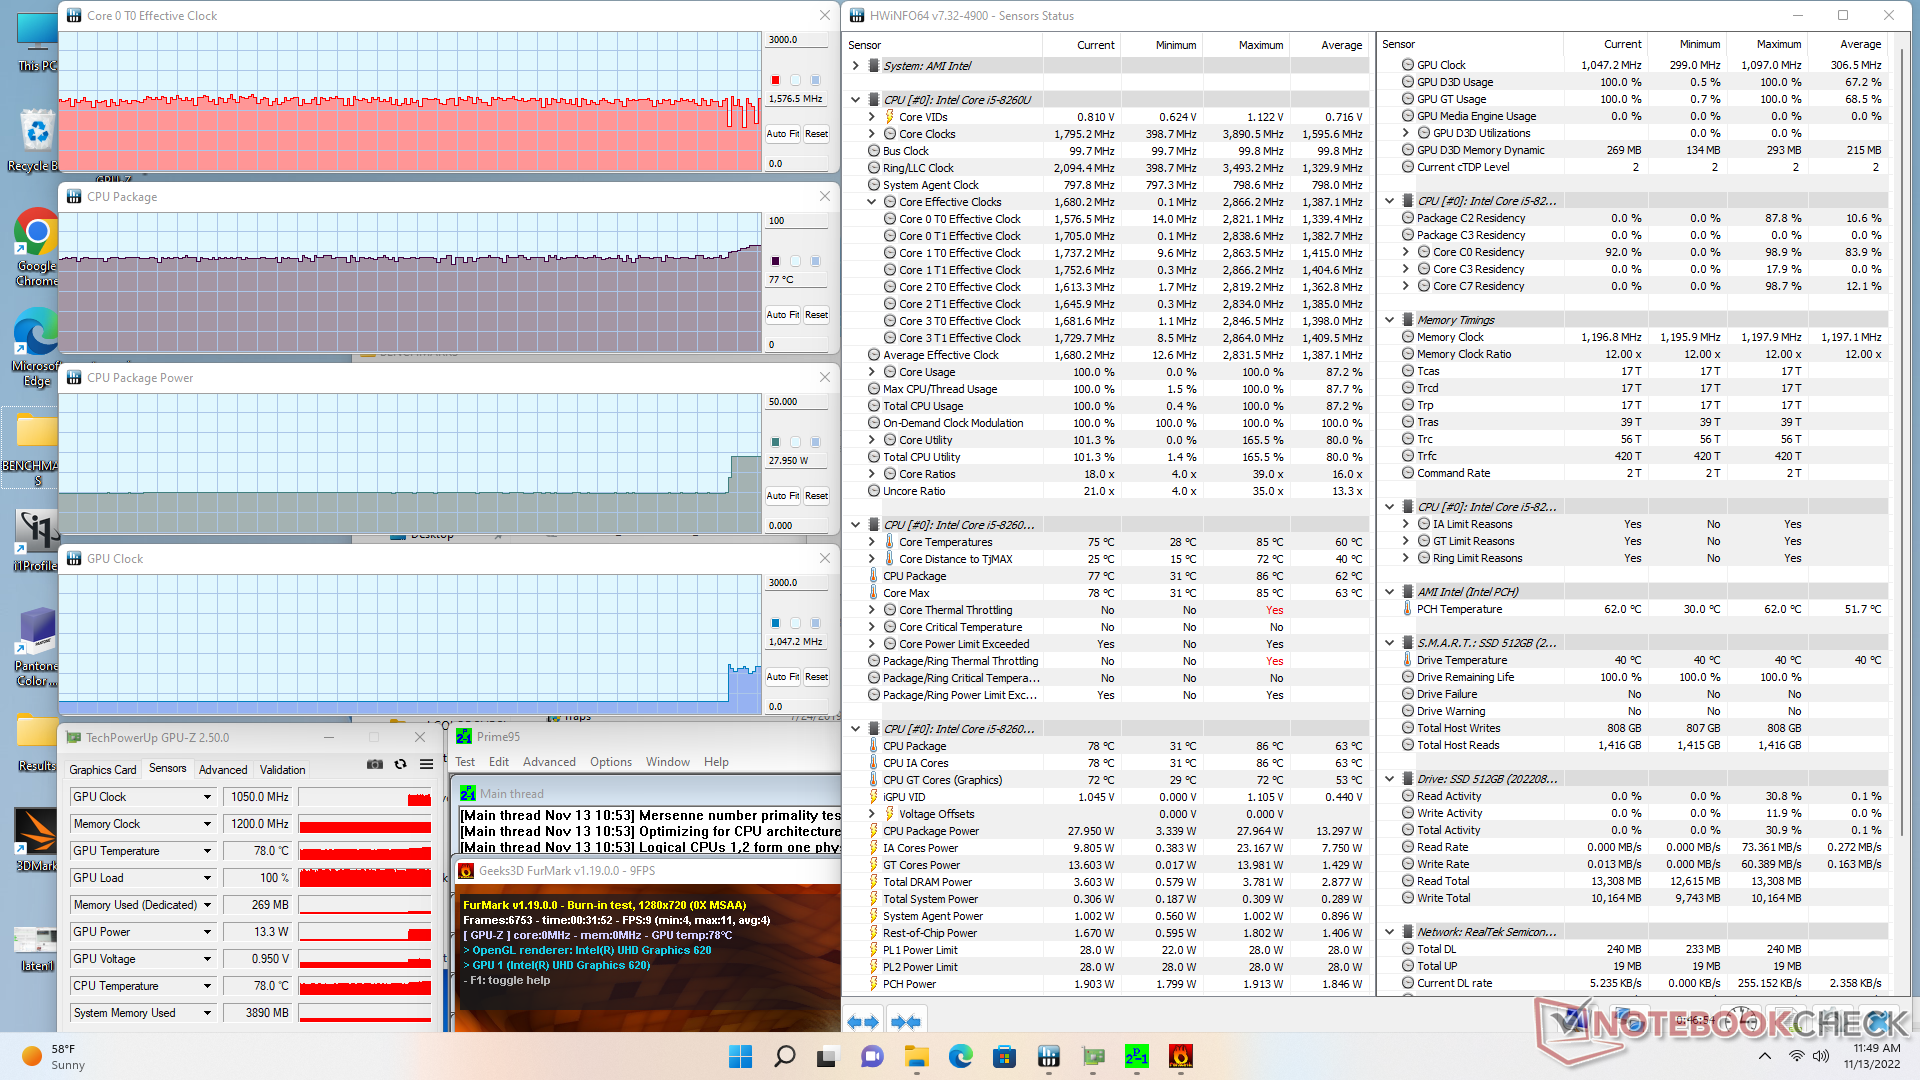
| CPU-klocka (GHz) | GPU-klocka (MHz) | Genomsnittlig CPU-temperatur (°C) | |
| Systemets tomgång | -- | -- | 33 |
| Prime95 Stress | 1.3 | -- | 62 |
| Prime95 + FurMark Stress | 1,6 | 300 | 67 |
| Witcher 3 Stress | ~400 | 1100 | 71 |
Energiförvaltning
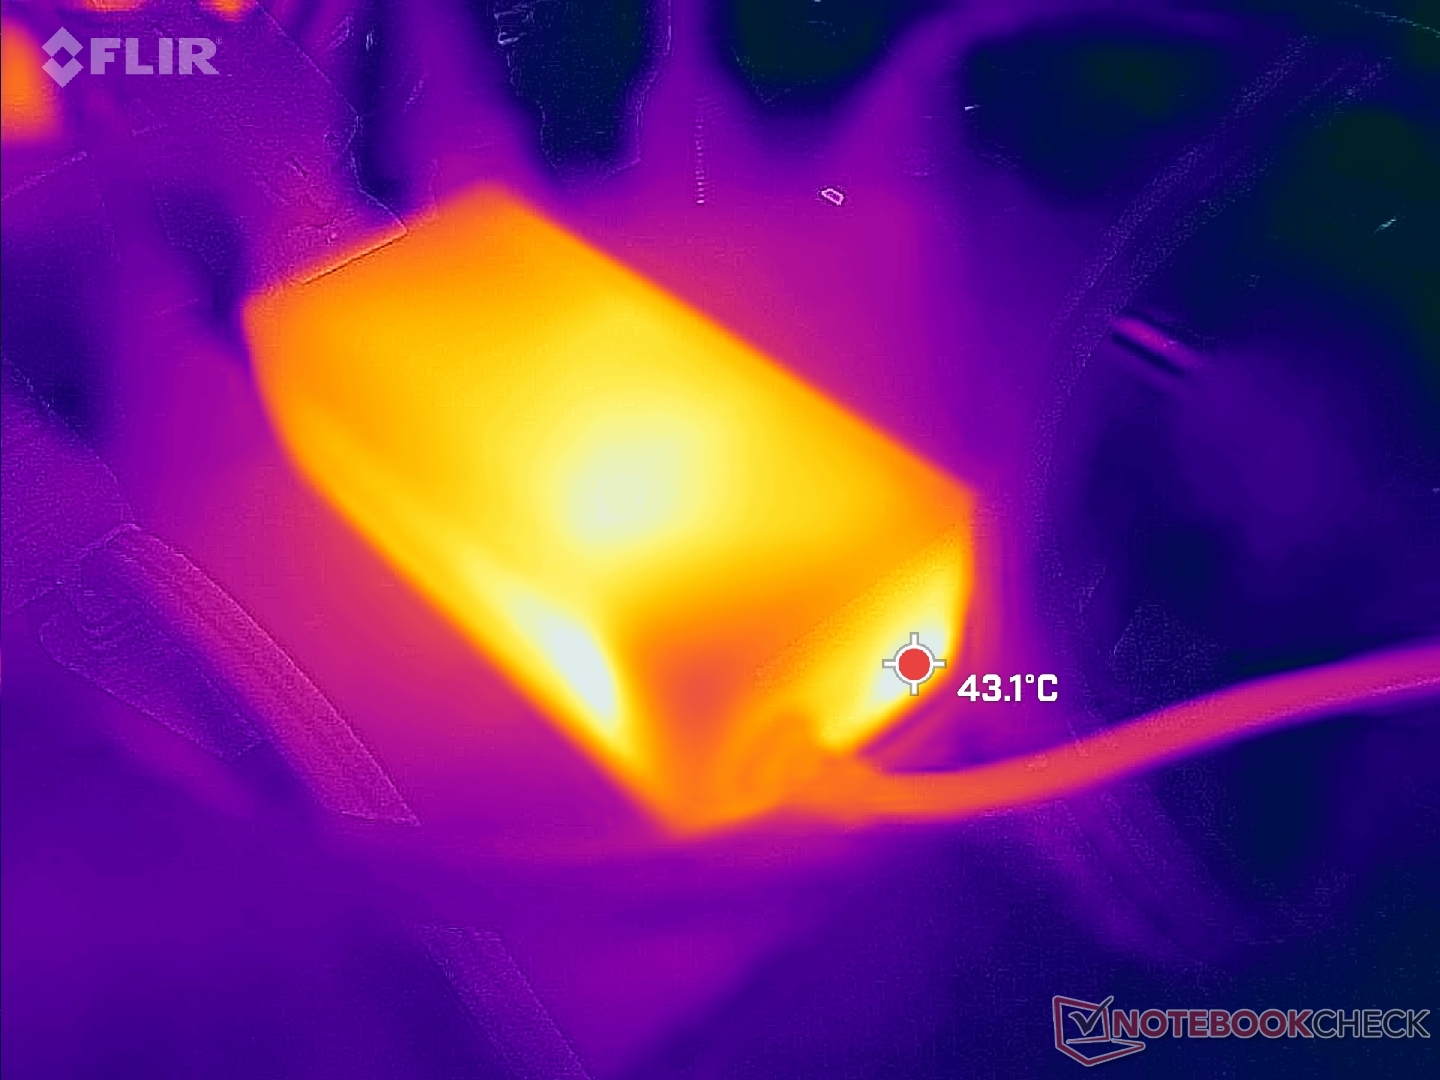
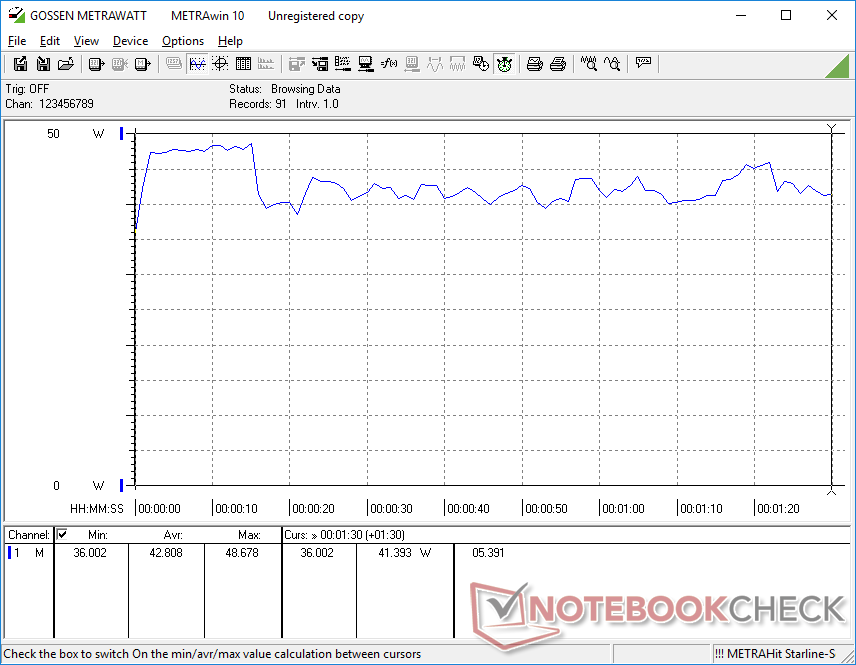
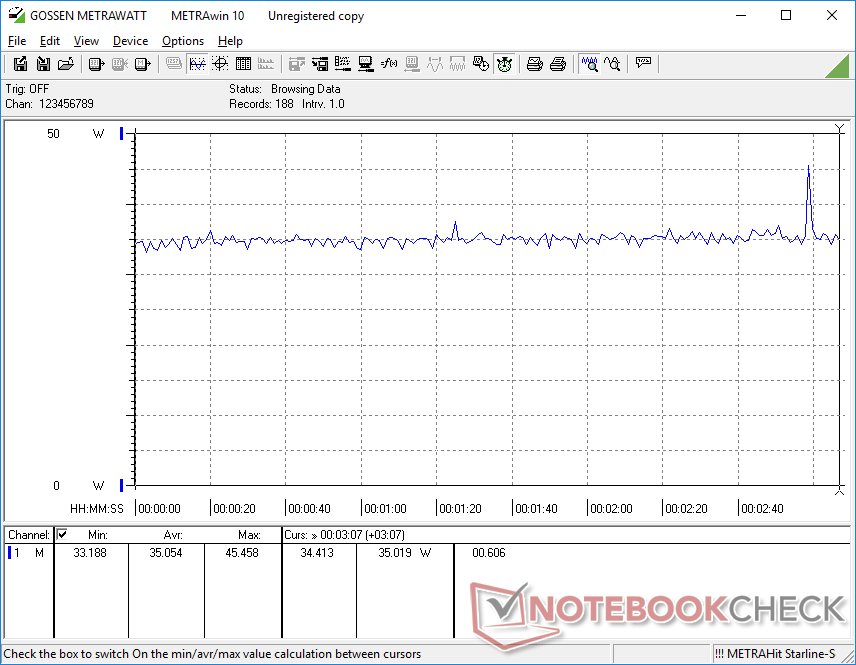
Strömförbrukning - Mycket liten
Den totala förbrukningen är lägre än på många minidatorer med nyare processorer som Intel NUC11TNKi5 och dess 11:e generationens Core i5-1135G7. Prestanda per watt gynnar dock den senare betydligt. Även om användarna kan spara några watt med BMax kan minidatorer med nyare generationens CPU:er som den tidigare nämnda NUC erbjuda över 2x så hög grafikprestanda eller 50 procent högre CPU-prestanda
Vi kan registrera ett maximalt uttag på 55,9 W från den lilla (~9,8 x 4,3 x 3,7 cm) 48 W AC-adaptern när CPU:n är 100 procent utnyttjad. Den här hastigheten är endast tillfällig, vilket framgår av våra grafer nedan.
| Av/Standby | |
| Låg belastning | |
| Hög belastning |
|
Förklaring:
min: | |
| BMAX B5 Pro G7H8 i5-8260U, UHD Graphics 620, , , x, | Beelink SEi11 Pro i5-11320H, Iris Xe G7 96EUs, Kingston NV1 SNVS/500GCN, , x, | Beelink U59 N5105 Celeron N5105, UHD Graphics (Jasper Lake 24 EU), Silicon Motion AZW 512G NV428, , x, | Beelink SEi8 i3-8109U, Iris Plus Graphics 655, Intel SSD 660p SSDPEKNW512G8, , x, | Beelink SER Pro Ryzen 5 5600H R5 5600H, Vega 7, Kingston NV1 SNVS/500GCN, , x, | Intel NUC11TNKi5 i5-1135G7, Iris Xe G7 80EUs, Transcend M.2 SSD 430S TS512GMTS430S, , x, | |
|---|---|---|---|---|---|---|
| Power Consumption | -47% | 2% | -13% | -15% | -58% | |
| Idle Minimum * (Watt) | 6 | 9.8 -63% | 6.7 -12% | 7.5 -25% | 5.4 10% | 11.5 -92% |
| Idle Average * (Watt) | 6.2 | 10.3 -66% | 8.1 -31% | 7.6 -23% | 8.2 -32% | 12.4 -100% |
| Idle Maximum * (Watt) | 6.3 | 10.5 -67% | 11.6 -84% | 9.2 -46% | 8.3 -32% | 12.9 -105% |
| Load Average * (Watt) | 42.8 | 54.2 -27% | 23.9 44% | 41.1 4% | 49.3 -15% | 40.7 5% |
| Witcher 3 ultra * (Watt) | 35 | 53.1 -52% | 19.1 45% | 46.1 -32% | 43.9 -25% | |
| Load Maximum * (Watt) | 55.8 | 59 -6% | 28.8 48% | 41.4 26% | 50.2 10% | 73.5 -32% |
* ... mindre är bättre
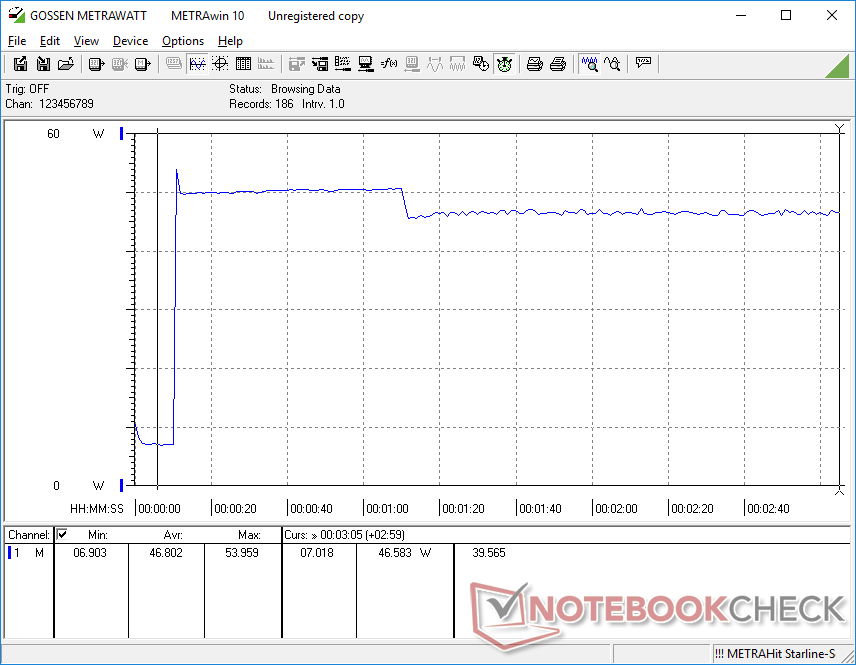
Power Consumption Witcher 3 / Stresstest
Power Consumption external Monitor
För
Emot
Bedömning - Billigt alternativ för grundläggande HTPC-ändamål
Om du vill få ut så mycket som möjligt för pengarna bör BMax B5 Pro stå högst upp på din lista. Den erbjuder en rymlig 512 GB NVMe SSD, utrymme för en andra SSD, 16 GB flyttbart RAM-minne, licensierat Windows 11 Pro redan installerat, tyst fläktljud och en processor som är jämförbar med den 10:e generationen av Core i7-1065G7 allt för under 300 USD. Core i5-8260U går om vartannat över alla nuvarande Core i3-, Celeron-, Atom- eller Ryzen 3-alternativ som är alltför vanliga i denna prisklass.
BMax B5 Pro är ett komplett paket för nästan hälften av priset för en Intel NUC utan att behöva nöja sig med lågklassiga Celeron- eller Atom-processorer.
Den största nackdelen med modellen är dess svaga grafikprestanda, vilket egentligen inte borde vara ett problem eftersom ingen borde köpa B5 Pro för speländamål. Grafikprestandan är fortfarande tillräcklig för bekväm 4K60-streaming.
Vi skulle vilja se fler USB-C-portar, stöd för USB-C Power Delivery och en HDMI 2.0-port eller bättre på framtida revideringar.
Pris och tillgänglighet
Amazon skickar för närvarande vår exakta BMax B5 Pro-konfiguration för $380 USD eller $280 USD efter att ha tillämpat kupongkoden vid publiceringstillfället.
Price comparison

