 Deutsch
 English
 Español
 Français
 Italiano
 Nederlands
 Polski
 Português
 Русский
 Türkçe
 Svenska
 Chinese
 Magyar
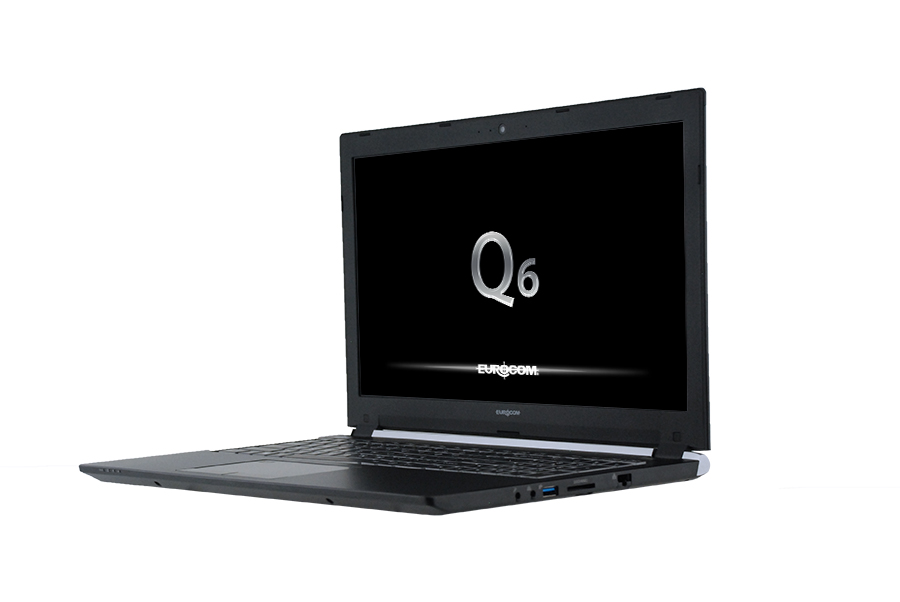
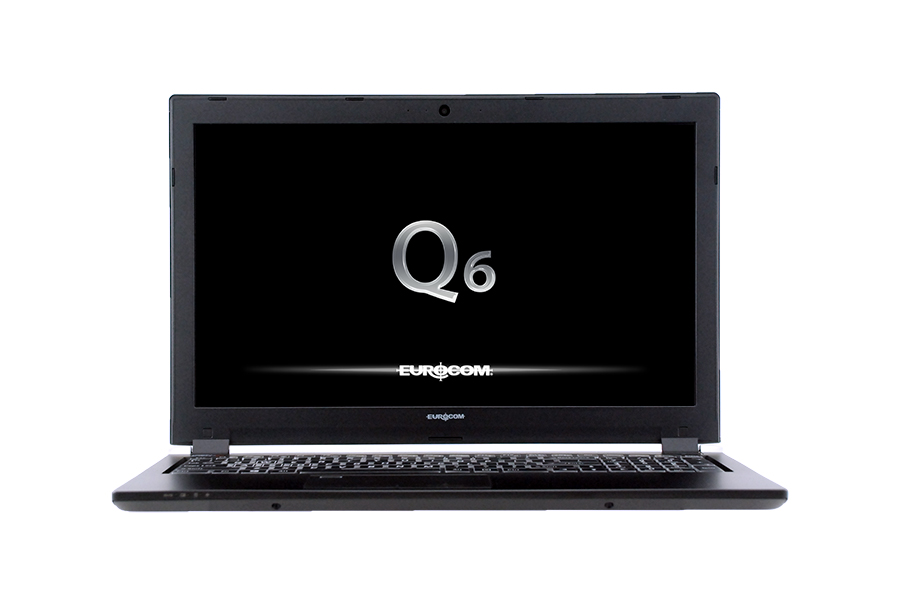
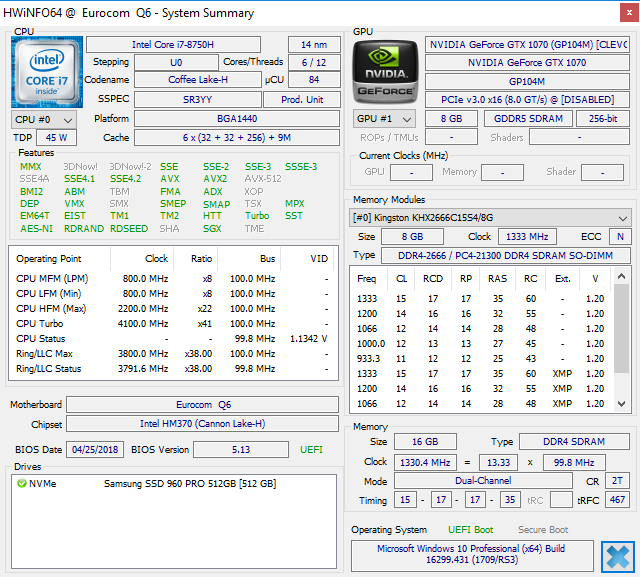
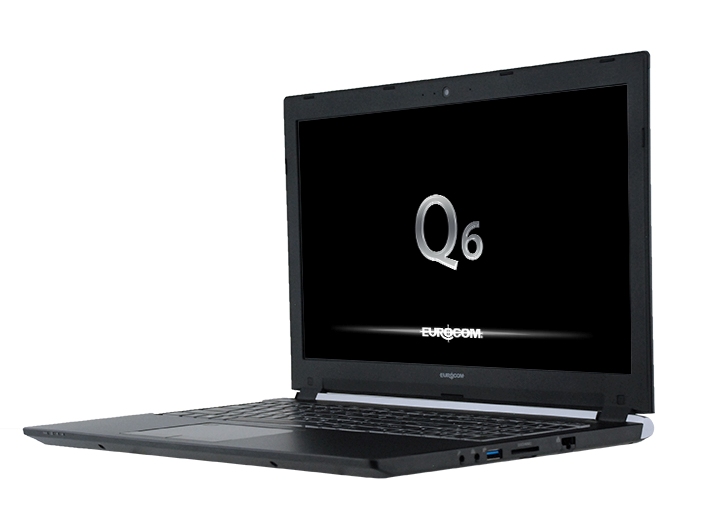
Test: Eurocom Q6 (i7-8750H, GTX 1070 Max-Q, FHD) Laptop (Sammanfattning)
| SD Card Reader | |
| average JPG Copy Test (av. of 3 runs) | |
| Aorus X5 v8 (Toshiba Exceria Pro SDXC 64 GB UHS-II) | |
| Gigabyte Aero 15X v8 (Toshiba Exceria Pro SDXC 64 GB UHS-II) | |
| Eurocom Q6 (Toshiba Exceria Pro SDXC 64 GB UHS-II) | |
| maximum AS SSD Seq Read Test (1GB) | |
| Gigabyte Aero 15X v8 (Toshiba Exceria Pro SDXC 64 GB UHS-II) | |
| Aorus X5 v8 (Toshiba Exceria Pro SDXC 64 GB UHS-II) | |
| Eurocom Q6 (Toshiba Exceria Pro SDXC 64 GB UHS-II) | |
| Networking | |
| iperf3 transmit AX12 | |
| MSI GS65 8RF-019DE Stealth Thin | |
| Eurocom Q6 | |
| Aorus X5 v8 | |
| iperf3 receive AX12 | |
| Aorus X5 v8 | |
| MSI GS65 8RF-019DE Stealth Thin | |
| Eurocom Q6 | |
| |||||||||||||||||||||||||
Distribution av ljusstyrkan: 88 %
Mitt på batteriet: 326.6 cd/m²
Kontrast: 778:1 (Svärta: 0.42 cd/m²)
ΔE Color 2.54 | 0.5-29.43 Ø5, calibrated: 1.63
ΔE Greyscale 1.9 | 0.57-98 Ø5.3
94.5% sRGB (Argyll 1.6.3 3D)
60.9% AdobeRGB 1998 (Argyll 1.6.3 3D)
66.2% AdobeRGB 1998 (Argyll 2.2.0 3D)
94.4% sRGB (Argyll 2.2.0 3D)
65.1% Display P3 (Argyll 2.2.0 3D)
Gamma: 2.14
| Eurocom Q6 LG Philips LGD05C0, IPS, 15.60, 1920x1080 | Eurocom Q5 ID: LGD04D4, Name: LG Philips LP156UD1-SPB1, IPS, 15.60, 3840x2160 | Aorus X5 v8 AU Optronics B156HAN07.0 (AUO70ED), IPS, 15.60, 1920x1080 | Apple MacBook Pro 15 2017 (2.9 GHz, 560) 15.40, 2880x1800 | MSI GS65 8RF-019DE Stealth Thin AU Optronics B156HAN08.0 (AUO80ED), IPS, 15.60, 1920x1080 | Gigabyte Aero 15X v8 LGD05C0, IPS, 15.60, 1920x1080 | |
|---|---|---|---|---|---|---|
| Display | -3% | 2% | 1% | -2% | ||
| Display P3 Coverage | 65.1 | 63 -3% | 67.1 3% | 66.2 2% | 63.6 -2% | |
| sRGB Coverage | 94.4 | 92.7 -2% | 93.4 -1% | 92.1 -2% | 93.8 -1% | |
| AdobeRGB 1998 Coverage | 66.2 | 64.4 -3% | 68.1 3% | 67.2 2% | 64.9 -2% | |
| Response Times | -145% | -20% | -174% | -20% | -10% | |
| Response Time Grey 50% / Grey 80% * | 15.2 ? | 32.4 ? -113% | 18.8 ? -24% | 42.4 ? -179% | 17.6 ? -16% | 16.8 ? -11% |
| Response Time Black / White * | 10.4 ? | 28.8 ? -177% | 12 ? -15% | 28 ? -169% | 12.8 ? -23% | 11.2 ? -8% |
| PWM Frequency | ||||||
| Screen | -44% | 13% | 33% | 6% | 19% | |
| Brightness middle | 326.6 | 287.5 -12% | 271 -17% | 534 64% | 254 -22% | 313 -4% |
| Brightness | 312 | 279 -11% | 259 -17% | 502 61% | 262 -16% | 300 -4% |
| Brightness Distribution | 88 | 87 -1% | 87 -1% | 86 -2% | 89 1% | 78 -11% |
| Black Level * | 0.42 | 0.65 -55% | 0.27 36% | 0.31 26% | 0.22 48% | 0.33 21% |
| Contrast | 778 | 442 -43% | 1004 29% | 1723 121% | 1155 48% | 948 22% |
| Colorchecker dE 2000 * | 2.54 | 4.5 -77% | 1.81 29% | 1.8 29% | 2.37 7% | 1.29 49% |
| Colorchecker dE 2000 max. * | 4.7 | 8.9 -89% | 3.33 29% | 3.8 19% | 4.71 -0% | 2.04 57% |
| Colorchecker dE 2000 calibrated * | 1.63 | 1.84 -13% | ||||
| Greyscale dE 2000 * | 1.9 | 4.6 -142% | 1.09 43% | 2.4 -26% | 1.58 17% | 0.69 64% |
| Gamma | 2.14 103% | 2.39 92% | 2.45 90% | 2.27 97% | 2.48 89% | 2.43 91% |
| CCT | 6562 99% | 7393 88% | 6435 101% | 6563 99% | 6785 96% | 6550 99% |
| Color Space (Percent of AdobeRGB 1998) | 60.9 | 59 -3% | 61 0% | 77.92 28% | 60 -1% | 60 -1% |
| Color Space (Percent of sRGB) | 94.5 | 92.3 -2% | 93 -2% | 99.94 6% | 92 -3% | 94 -1% |
| Total Average (Program / Settings) | -64% /
-49% | -2% /
6% | -71% /
-2% | -4% /
2% | 2% /
11% |
* ... smaller is better
Display Response Times
| ↔ Response Time Black to White | ||
|---|---|---|
| 10.4 ms ... rise ↗ and fall ↘ combined | ↗ 6 ms rise | 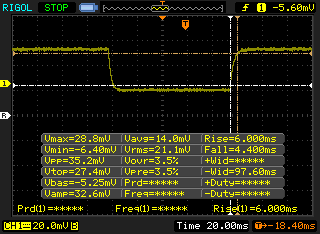 |
| ↘ 4.4 ms fall | ||
| The screen shows good response rates in our tests, but may be too slow for competitive gamers. In comparison, all tested devices range from 0.1 (minimum) to 240 (maximum) ms. » 23 % of all devices are better. This means that the measured response time is better than the average of all tested devices (21.5 ms). | ||
| ↔ Response Time 50% Grey to 80% Grey | ||
| 15.2 ms ... rise ↗ and fall ↘ combined | ↗ 8.4 ms rise | 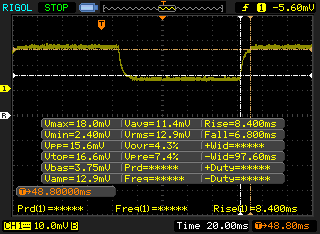 |
| ↘ 6.8 ms fall | ||
| The screen shows good response rates in our tests, but may be too slow for competitive gamers. In comparison, all tested devices range from 0.2 (minimum) to 636 (maximum) ms. » 24 % of all devices are better. This means that the measured response time is better than the average of all tested devices (33.7 ms). | ||
Screen Flickering / PWM (Pulse-Width Modulation)
| Screen flickering / PWM not detected | 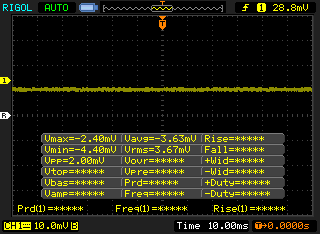 | ||
In comparison: 53 % of all tested devices do not use PWM to dim the display. If PWM was detected, an average of 17853 (minimum: 5 - maximum: 3846000) Hz was measured. | |||
| Cinebench R15 | |
| CPU Single 64Bit | |
| Eurocom Sky X4C | |
| MSI GS65 8RF-019DE Stealth Thin | |
| Average Intel Core i7-8750H (163 - 177, n=86) | |
| Asus FX504GD | |
| Eurocom Q6 | |
| Eurocom Tornado F5 Killer Edition | |
| HP Omen X 17-ap0xx | |
| Eurocom Q5 | |
| Razer Blade (2016) FHD | |
| Asus ROG Strix GL702ZC-GC204T | |
| Dell Inspiron 15 7000 7577 | |
| CPU Multi 64Bit | |
| Eurocom Sky X4C | |
| Asus ROG Strix GL702ZC-GC204T | |
| Average Intel Core i7-8750H (863 - 1251, n=93) | |
| Eurocom Q6 | |
| MSI GS65 8RF-019DE Stealth Thin | |
| HP Omen X 17-ap0xx | |
| Eurocom Q5 | |
| Razer Blade (2016) FHD | |
| Eurocom Tornado F5 Killer Edition | |
| Asus FX504GD | |
| Dell Inspiron 15 7000 7577 | |
| Cinebench R11.5 | |
| CPU Single 64Bit | |
| Eurocom Sky X4C | |
| MSI GS65 8RF-019DE Stealth Thin | |
| Eurocom Tornado F5 Killer Edition | |
| Average Intel Core i7-8750H (1.89 - 2, n=40) | |
| Eurocom Q6 | |
| HP Omen X 17-ap0xx | |
| Eurocom Q5 | |
| Asus FX504GD | |
| Razer Blade (2016) FHD | |
| Asus ROG Strix GL702ZC-GC204T | |
| Dell Inspiron 15 7000 7577 | |
| CPU Multi 64Bit | |
| Eurocom Sky X4C | |
| Asus ROG Strix GL702ZC-GC204T | |
| Average Intel Core i7-8750H (9.54 - 13.5, n=41) | |
| MSI GS65 8RF-019DE Stealth Thin | |
| Eurocom Q6 | |
| HP Omen X 17-ap0xx | |
| Eurocom Q5 | |
| Eurocom Tornado F5 Killer Edition | |
| Razer Blade (2016) FHD | |
| Asus FX504GD | |
| Dell Inspiron 15 7000 7577 | |
| Cinebench R10 | |
| Rendering Multiple CPUs 32Bit | |
| Eurocom Sky X4C | |
| Average Intel Core i7-8750H (29664 - 35307, n=25) | |
| Asus ROG Strix GL702ZC-GC204T | |
| Eurocom Tornado F5 Killer Edition | |
| HP Omen X 17-ap0xx | |
| Eurocom Q5 | |
| Razer Blade (2016) FHD | |
| Asus FX504GD | |
| Dell Inspiron 15 7000 7577 | |
| Rendering Single 32Bit | |
| Eurocom Sky X4C | |
| Eurocom Tornado F5 Killer Edition | |
| Asus FX504GD | |
| Average Intel Core i7-8750H (6236 - 6645, n=25) | |
| HP Omen X 17-ap0xx | |
| Eurocom Q5 | |
| Razer Blade (2016) FHD | |
| Dell Inspiron 15 7000 7577 | |
| Asus ROG Strix GL702ZC-GC204T | |
| wPrime 2.10 - 1024m | |
| Asus ROG Strix GL702ZC-GC204T | |
| Dell Inspiron 15 7000 7577 | |
| Eurocom Tornado F5 Killer Edition | |
| Asus FX504GD | |
| Eurocom Q5 | |
| HP Omen X 17-ap0xx | |
| Average Intel Core i7-8750H (125.5 - 180.5, n=6) | |
| Eurocom Sky X4C | |
* ... smaller is better
| PCMark 10 - Score | |
| Eurocom Sky X4C | |
| Aorus X5 v8 | |
| Eurocom Q6 | |
| Eurocom Q5 | |
| MSI GS65 8RF-019DE Stealth Thin | |
| PCMark 8 | |
| Home Score Accelerated v2 | |
| Aorus X5 v8 | |
| Eurocom Sky X4C | |
| MSI GS65 8RF-019DE Stealth Thin | |
| Eurocom Q6 | |
| Eurocom Q5 | |
| Work Score Accelerated v2 | |
| Aorus X5 v8 | |
| Eurocom Q6 | |
| MSI GS65 8RF-019DE Stealth Thin | |
| Eurocom Sky X4C | |
| Eurocom Q5 | |
| PCMark 8 Home Score Accelerated v2 | 4644 poäng | |
| PCMark 8 Work Score Accelerated v2 | 5751 poäng | |
| PCMark 10 Score | 5362 poäng | |
Hjälp | ||
| Eurocom Q6 Samsung SSD 960 Pro 512 GB m.2 | Gigabyte Aero 15X v8 Toshiba NVMe THNSN5512GPU7 | Eurocom Q5 Samsung SSD 960 Pro 512 GB m.2 | Eurocom Sky X4C Samsung SSD 960 Pro 1TB m.2 NVMe | MSI GS65 8RF-019DE Stealth Thin Samsung SSD PM981 MZVLB512HAJQ | |
|---|---|---|---|---|---|
| AS SSD | -39% | 13% | 24% | 2% | |
| Copy Game MB/s | 633 | 682 8% | 1055 67% | ||
| Copy Program MB/s | 363.4 | 301.5 -17% | 467.2 29% | ||
| Copy ISO MB/s | 1768 | 1967 11% | 1908 8% | ||
| Score Total | 3894 | 2536 -35% | 4001 3% | 4615 19% | 4122 6% |
| Score Write | 1693 | 939 -45% | 1705 1% | 1703 1% | 2051 21% |
| Score Read | 1477 | 1092 -26% | 1529 4% | 1945 32% | 1346 -9% |
| Access Time Write * | 0.039 | 0.046 -18% | 0.028 28% | 0.03 23% | 0.035 10% |
| Access Time Read * | 0.049 | 0.119 -143% | 0.036 27% | 0.032 35% | 0.073 -49% |
| 4K-64 Write | 1403 | 742 -47% | 1366 -3% | 1375 -2% | 1760 25% |
| 4K-64 Read | 1195 | 847 -29% | 1231 3% | 1646 38% | 1170 -2% |
| 4K Write | 96.2 | 80.4 -16% | 136.2 42% | 129.6 35% | 107.2 11% |
| 4K Read | 29.62 | 23.36 -21% | 49.3 66% | 44.83 51% | 48.94 65% |
| Seq Write | 1943 | 1163 -40% | 2029 4% | 1989 2% | 1834 -6% |
| Seq Read | 2523 | 2213 -12% | 2493 -1% | 2541 1% | 1266 -50% |
* ... smaller is better

| 3DMark | |
| 1920x1080 Fire Strike Graphics | |
| MSI Gaming X GeForce GTX 1080 Desktop PC | |
| MSI GT75 8RG-090 Titan | |
| Alienware 15 R3 Max-Q | |
| Asus Zephyrus M GM501 | |
| Average NVIDIA GeForce GTX 1070 Max-Q (14146 - 16165, n=16) | |
| Eurocom Q6 | |
| Eurocom Q5 | |
| Asus ROG Strix GL702ZC-GC204T | |
| Asus FX503VM-EH73 | |
| Asus Strix GL502VY-DS71 | |
| Asus GL552VW-DH74 | |
| 3840x2160 Fire Strike Ultra Graphics | |
| Alienware 15 R3 Max-Q | |
| Average NVIDIA GeForce GTX 1070 Max-Q (3210 - 3662, n=8) | |
| Eurocom Q6 | |
| Eurocom Q5 | |
| Asus Strix GL502VY-DS71 | |
| Asus GL552VW-DH74 | |
| 3DMark 11 | |
| 1280x720 Performance GPU | |
| MSI Gaming X GeForce GTX 1080 Desktop PC | |
| MSI GT75 8RG-090 Titan | |
| Alienware 15 R3 Max-Q | |
| Asus Zephyrus M GM501 | |
| Average NVIDIA GeForce GTX 1070 Max-Q (17680 - 20829, n=18) | |
| Eurocom Q5 | |
| Eurocom Q6 | |
| Asus ROG Strix GL702ZC-GC204T | |
| Asus FX503VM-EH73 | |
| Asus Strix GL502VY-DS71 | |
| Asus GL552VW-DH74 | |
| 1280x720 Performance Combined | |
| MSI GT75 8RG-090 Titan | |
| Asus Zephyrus M GM501 | |
| MSI Gaming X GeForce GTX 1080 Desktop PC | |
| Eurocom Q6 | |
| Average NVIDIA GeForce GTX 1070 Max-Q (7458 - 12069, n=18) | |
| Alienware 15 R3 Max-Q | |
| Eurocom Q5 | |
| Asus Strix GL502VY-DS71 | |
| Asus ROG Strix GL702ZC-GC204T | |
| Asus FX503VM-EH73 | |
| Asus GL552VW-DH74 | |
| 3DMark 11 Performance | 15801 poäng | |
| 3DMark Cloud Gate Standard Score | 34682 poäng | |
| 3DMark Fire Strike Score | 12903 poäng | |
| 3DMark Fire Strike Extreme Score | 6588 poäng | |
Hjälp | ||
| låg | med. | hög | ultra | |
| BioShock Infinite (2013) | 327.9 | 246.7 | 230.8 | 132.1 |
| The Witcher 3 (2015) | 236.2 | 165.2 | 97 | 48.9 |
| Rise of the Tomb Raider (2016) | 202.7 | 166.2 | 97.8 | 82.4 |
| The Witcher 3 - 1920x1080 Ultra Graphics & Postprocessing (HBAO+) | |
| MSI GT75 8RG-090 Titan | |
| Alienware 15 R3 Max-Q | |
| Aorus X5 v8 | |
| Average NVIDIA GeForce GTX 1070 Max-Q (46 - 55.3, n=19) | |
| Eurocom Q6 | |
| Eurocom Q5 | |
| Asus FX503VM-EH73 | |
| Dell Inspiron 15 7000 7577 4K | |
| BioShock Infinite - 1920x1080 Ultra Preset, DX11 (DDOF) | |
| Alienware 15 R3 Max-Q | |
| Eurocom Q6 | |
| Eurocom Q5 | |
| Average NVIDIA GeForce GTX 1070 Max-Q (109.6 - 139.4, n=10) | |
| Dell Inspiron 15 7000 7577 4K | |
| Rise of the Tomb Raider - 1920x1080 Very High Preset AA:FX AF:16x | |
| Eurocom Q6 | |
| Average NVIDIA GeForce GTX 1070 Max-Q (77.1 - 85.9, n=7) | |
| Eurocom Q5 | |
| Asus FX503VM-EH73 | |
| Dell Inspiron 15 7000 7577 4K | |
Ljudnivå
| Låg belastning |
| 30.4 / 30.5 / 33.3 dB(A) |
| Hög belastning |
| 42.3 / 50.8 dB(A) |
 | ||
30 dB tyst 40 dB(A) hörbar 50 dB(A) högt ljud |
||
min: | ||
| Eurocom Q6 GeForce GTX 1070 Max-Q, i7-8750H, Samsung SSD 960 Pro 512 GB m.2 | Eurocom Q5 GeForce GTX 1070 Max-Q, i7-7700HQ, Samsung SSD 960 Pro 512 GB m.2 | Aorus X5 v8 GeForce GTX 1070 Mobile, i7-8850H, Toshiba NVMe THNSN5512GPU7 | Gigabyte Aero 15X v8 GeForce GTX 1070 Max-Q, i7-8750H, Toshiba NVMe THNSN5512GPU7 | MSI GS65 8RF-019DE Stealth Thin GeForce GTX 1070 Max-Q, i7-8750H, Samsung SSD PM981 MZVLB512HAJQ | Asus Zephyrus M GM501 GeForce GTX 1070 Mobile, i7-8750H, Samsung SM961 MZVKW512HMJP m.2 PCI-e | |
|---|---|---|---|---|---|---|
| Noise | -3% | -11% | -7% | 1% | -5% | |
| off / environment * | 28.3 | 29 -2% | 30 -6% | 29 -2% | 30 -6% | 29 -2% |
| Idle Minimum * | 30.4 | 31.5 -4% | 33 -9% | 30 1% | 30 1% | 30 1% |
| Idle Average * | 30.5 | 33.8 -11% | 35 -15% | 31 -2% | 31 -2% | 31 -2% |
| Idle Maximum * | 33.3 | 33.8 -2% | 40 -20% | 35 -5% | 34 -2% | 33 1% |
| Load Average * | 42.3 | 41.7 1% | 45 -6% | 49 -16% | 43 -2% | 49 -16% |
| Witcher 3 ultra * | 43.3 | 41.7 4% | 50 -15% | 51 -18% | 42 3% | 50 -15% |
| Load Maximum * | 50.8 | 54.2 -7% | 55 -8% | 54 -6% | 44 13% | 52 -2% |
* ... smaller is better
(-) The maximum temperature on the upper side is 49 °C / 120 F, compared to the average of 40.4 °C / 105 F, ranging from 21.2 to 68.8 °C for the class Gaming.
(-) The bottom heats up to a maximum of 53 °C / 127 F, compared to the average of 43.2 °C / 110 F
(+) In idle usage, the average temperature for the upper side is 28.5 °C / 83 F, compared to the device average of 33.8 °C / 93 F.
(-) Playing The Witcher 3, the average temperature for the upper side is 41.6 °C / 107 F, compared to the device average of 33.8 °C / 93 F.
(±) The palmrests and touchpad can get very hot to the touch with a maximum of 37.6 °C / 99.7 F.
(-) The average temperature of the palmrest area of similar devices was 28.9 °C / 84 F (-8.7 °C / -15.7 F).
| Av/Standby | |
| Låg belastning | |
| Hög belastning |
|
| Eurocom Q6 i7-8750H, GeForce GTX 1070 Max-Q, Samsung SSD 960 Pro 512 GB m.2, IPS, 1920x1080, 15.60 | Eurocom Q5 i7-7700HQ, GeForce GTX 1070 Max-Q, Samsung SSD 960 Pro 512 GB m.2, IPS, 3840x2160, 15.60 | Aorus X5 v8 i7-8850H, GeForce GTX 1070 Mobile, Toshiba NVMe THNSN5512GPU7, IPS, 1920x1080, 15.60 | MSI GS65 8RF-019DE Stealth Thin i7-8750H, GeForce GTX 1070 Max-Q, Samsung SSD PM981 MZVLB512HAJQ, IPS, 1920x1080, 15.60 | HP Omen 15t-ce000 i7-7700HQ, GeForce GTX 1060 Max-Q, Samsung PM961 NVMe MZVLW128HEGR, IPS, 3840x2160, 15.60 | Asus Zephyrus M GM501 i7-8750H, GeForce GTX 1070 Mobile, Samsung SM961 MZVKW512HMJP m.2 PCI-e, IPS, 1920x1080, 15.60 | |
|---|---|---|---|---|---|---|
| Power Consumption | 15% | -60% | 11% | -2% | -24% | |
| Idle Minimum * | 11.6 | 9 22% | 25 -116% | 7 40% | 15.4 -33% | 16 -38% |
| Idle Average * | 16.3 | 13.5 17% | 31 -90% | 11 33% | 22.4 -37% | 19 -17% |
| Idle Maximum * | 21.5 | 13.7 36% | 33 -53% | 20 7% | 22.4 -4% | 26 -21% |
| Load Average * | 100.7 | 87.8 13% | 102 -1% | 98 3% | 78.1 22% | 103 -2% |
| Witcher 3 ultra * | 140.1 | 129 8% | 194 -38% | 132 6% | 97.5 30% | 164 -17% |
| Load Maximum * | 150.3 | 158.6 -6% | 239 -59% | 182 -21% | 133.52 11% | 223 -48% |
* ... smaller is better
| Eurocom Q6 i7-8750H, GeForce GTX 1070 Max-Q, 55 Wh | Eurocom Q5 i7-7700HQ, GeForce GTX 1070 Max-Q, 55 Wh | Aorus X5 v8 i7-8850H, GeForce GTX 1070 Mobile, 92.24 Wh | MSI GS65 8RF-019DE Stealth Thin i7-8750H, GeForce GTX 1070 Max-Q, 82 Wh | Gigabyte Aero 15X v8 i7-8750H, GeForce GTX 1070 Max-Q, 94.24 Wh | HP Omen 15t-ce000 i7-7700HQ, GeForce GTX 1060 Max-Q, 70 Wh | |
|---|---|---|---|---|---|---|
| Battery Runtime | 12% | 9% | 48% | 133% | 2% | |
| Reader / Idle | 306 | 466 52% | 294 -4% | 507 66% | 762 149% | 298 -3% |
| WiFi v1.3 | 219 | 258 18% | 362 65% | 513 134% | 208 -5% | |
| Load | 72 | 47 -35% | 87 21% | 81 13% | 156 117% | 83 15% |
För
Emot
Läs den fullständiga versionen av den här recensionen på engelska här.
Våra allmänna kommentarer för Q5 gäller även Q6. Den som är intresserad av Q6 borde utnyttja systemet fullt ut genom att använda dess lätttillgängliga 2.5 tums SATA III-plats och 4G LTE-anslutbarhet då dessa är sällsynta bland supertunna spellaptops.
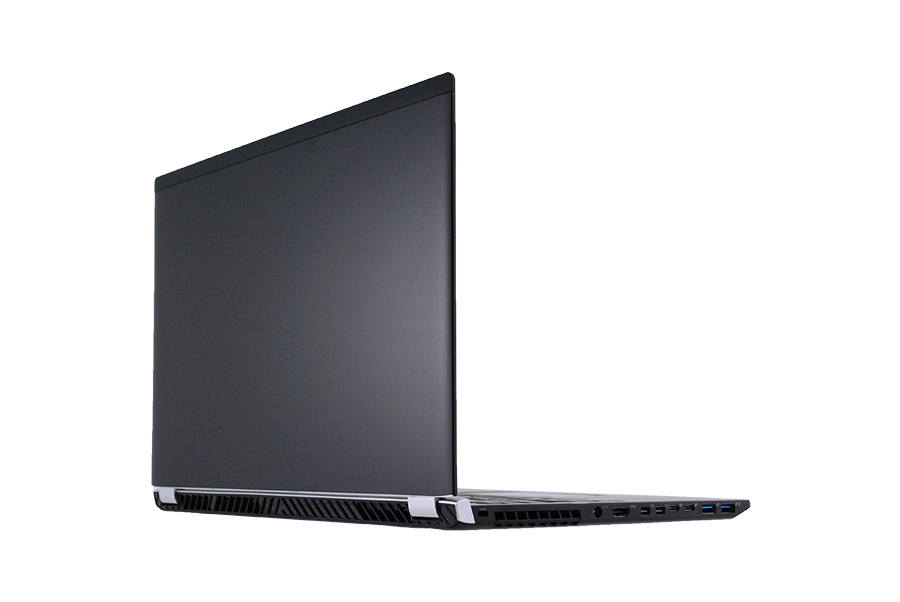
Den största utmaningen för Q6 är att den inte erbjuder särskilt mycket mer än vad Q5 gör i fråga om funktioner eller spelprestanda. Detta är inte nödvändigtvis dåligt då Q5 redan till att börja med är ett respektabelt spelsystem, men Q6 släppts i samma kvartal som tunga konkurrenter såsom MSI GS65 och Gigabyte Aero 15X. Båda dessa modeller har tunn infattning, samma alternativ för CPU och GPU och liknande 144 Hz-paneler samtidigt som dom är betydligt lättare och mer portabla för samma utgångspris på ~17.000 kronor. Till och med nykomlingar med "tjock infattning" såsom Asus Zephyrus M GM501 eller Aorus X5 v8 har Thunderbolt 3, knappspecifik RGB-belysning eller både och. I korthet, Eurocoms Q-serie börjar kännas gammal och den riskerar att hamna efter ännu mer om nästa års modell återigen är en mindre uppdatering. Q6 behöver gå ner i pris om den ska kunna konkurrera med dom senaste modellerna från MSI, Asus, Aorus och Razer.
Den presterar väl, om än lite för varmt. För priset så saknar dock Q6 modern lyx som alternativen erbjuder såsom Thunderbolt 3, knappspecifik RGB-belysning och tunn infattning. Serien står för tillfället still medans konkurrenterna kör om med fräschare design och fler funktioner.
Eurocom Q6
-
06/22/2018 v6(old)
Allen Ngo
Pricecompare
