Test: HP EliteBook 845 G7 : AMD-laptop som är bättre med Ryzen 5 än med Intel (Sammanfattning)
Gradering | Datum | Modell | Vikt | Höjd | Storlek | Upplösning | Pris |
|---|---|---|---|---|---|---|---|
| 87.8 % v7 (old) | 11/2020 | HP EliteBook 845 G7-23Y60EA R5 PRO 4650U, Vega 6 | 1.5 kg | 17.9 mm | 14.00" | 1920x1080 | |
| 90.5 % v7 (old) | 08/2020 | Lenovo ThinkPad T14s-20UJS00K00 R7 PRO 4750U, Vega 7 | 1.3 kg | 16.1 mm | 14.00" | 1920x1080 | |
| 88.7 % v7 (old) | 09/2019 | Lenovo ThinkPad T495-20NKS01Y00 R5 PRO 3500U, Vega 8 | 1.5 kg | 18.9 mm | 14.00" | 1920x1080 | |
| 88.9 % v7 (old) | 07/2020 | Dell Latitude 7410 i7-10610U, UHD Graphics 620 | 1.4 kg | 19.3 mm | 14.00" | 3840x2160 | |
| 88 % v7 (old) | 07/2020 | Lenovo ThinkPad T14-20S1S06B00 i5-10210U, UHD Graphics 620 | 1.5 kg | 17.9 mm | 14.00" | 1920x1080 | |
| 87 % v7 (old) | Acer TravelMate P6 P614-51T-G2-72ZU i7-10510U, UHD Graphics 620 | 1.2 kg | 16.6 mm | 14.00" | 1920x1080 | ||
| 85.4 % v7 (old) | Dynabook Portégé X40-G-10K i5-10210U, UHD Graphics 620 | 1.3 kg | 16.9 mm | 14.00" | 1920x1080 |
| Networking | |
| iperf3 transmit AX12 | |
| Acer TravelMate P6 P614-51T-G2-72ZU | |
| Dynabook Portégé X40-G-10K | |
| Lenovo ThinkPad T14s-20UJS00K00 | |
| HP EliteBook 845 G7-23Y60EA | |
| Genomsnitt Intel Wi-Fi 6 AX200 (447 - 1645, n=127) | |
| Dell Latitude 7410 | |
| Lenovo ThinkPad T14-20S1S06B00 | |
| Lenovo ThinkPad T495-20NKS01Y00 | |
| iperf3 receive AX12 | |
| Lenovo ThinkPad T14-20S1S06B00 | |
| Acer TravelMate P6 P614-51T-G2-72ZU | |
| Dynabook Portégé X40-G-10K | |
| Lenovo ThinkPad T14s-20UJS00K00 | |
| HP EliteBook 845 G7-23Y60EA | |
| Dell Latitude 7410 | |
| Genomsnitt Intel Wi-Fi 6 AX200 (523 - 1684, n=128) | |
| Lenovo ThinkPad T495-20NKS01Y00 | |


| |||||||||||||||||||||||||
Distribution av ljusstyrkan: 82 %
Mitt på batteriet: 224 cd/m²
Kontrast: 1261:1 (Svärta: 0.18 cd/m²)
ΔE ColorChecker Calman: 4.1 | ∀{0.5-29.43 Ø4.73}
calibrated: 4.04
ΔE Greyscale Calman: 1.99 | ∀{0.09-98 Ø4.97}
55% sRGB (Argyll 1.6.3 3D)
35% AdobeRGB 1998 (Argyll 1.6.3 3D)
37.98% AdobeRGB 1998 (Argyll 3D)
55.3% sRGB (Argyll 3D)
36.76% Display P3 (Argyll 3D)
Gamma: 2.48
CCT: 6607 K
| HP EliteBook 845 G7-23Y60EA LG Philips LGD064E, IPS, 1920x1080, 14" | Lenovo ThinkPad T14s-20UJS00K00 N140HCG-GQ2, IPS , 1920x1080, 14" | Dell Latitude 7410 AU Optronics B140ZAN, IPS, 3840x2160, 14" | Lenovo ThinkPad T14-20S1S06B00 B140HAN05.7, LTPS IPS LED, 1920x1080, 14" | Acer TravelMate P6 P614-51T-G2-72ZU AU Optronics B140HAK02.5, IPS, 1920x1080, 14" | Dynabook Portégé X40-G-10K Toshiba TOS508F, IPS, 1920x1080, 14" | |
|---|---|---|---|---|---|---|
| Display | 80% | 89% | 77% | 79% | 78% | |
| Display P3 Coverage (%) | 36.76 | 66.8 82% | 71.8 95% | 66 80% | 69.2 88% | 66.1 80% |
| sRGB Coverage (%) | 55.3 | 97.9 77% | 99.3 80% | 96.8 75% | 93.7 69% | 96.1 74% |
| AdobeRGB 1998 Coverage (%) | 37.98 | 69 82% | 72.4 91% | 67.1 77% | 68.6 81% | 68 79% |
| Response Times | 23% | -2% | -37% | -7% | -9% | |
| Response Time Grey 50% / Grey 80% * (ms) | 37 ? | 32.4 ? 12% | 39.2 ? -6% | 58.4 ? -58% | 37 ? -0% | 39 ? -5% |
| Response Time Black / White * (ms) | 23 ? | 15.2 ? 34% | 22.4 ? 3% | 26.4 ? -15% | 26 ? -13% | 26 ? -13% |
| PWM Frequency (Hz) | 26040 ? | 24000 ? | ||||
| Screen | 40% | 2% | 33% | 12% | 8% | |
| Brightness middle (cd/m²) | 227 | 404 78% | 388.6 71% | 397 75% | 323 42% | 408 80% |
| Brightness (cd/m²) | 220 | 371 69% | 365 66% | 394 79% | 308 40% | 372 69% |
| Brightness Distribution (%) | 82 | 88 7% | 82 0% | 90 10% | 90 10% | 85 4% |
| Black Level * (cd/m²) | 0.18 | 0.34 -89% | 0.35 -94% | 0.2 -11% | 0.35 -94% | 0.44 -144% |
| Contrast (:1) | 1261 | 1188 -6% | 1110 -12% | 1985 57% | 923 -27% | 927 -26% |
| Colorchecker dE 2000 * | 4.1 | 1.4 66% | 4.04 1% | 3.6 12% | 3.07 25% | 2.73 33% |
| Colorchecker dE 2000 max. * | 7.06 | 3.2 55% | 9.2 -30% | 5.9 16% | 5.8 18% | 5.61 21% |
| Colorchecker dE 2000 calibrated * | 4.04 | 0.8 80% | 1.25 69% | 1.2 70% | 3.07 24% | |
| Greyscale dE 2000 * | 1.99 | 1.6 20% | 6.4 -222% | 3.9 -96% | 2.99 -50% | 4.13 -108% |
| Gamma | 2.48 89% | 2.13 103% | 2.3 96% | 2.48 89% | 2.32 95% | 2.46 89% |
| CCT | 6607 98% | 6480 100% | 6957 93% | 7090 92% | 6097 107% | 5862 111% |
| Color Space (Percent of AdobeRGB 1998) (%) | 35 | 63 80% | 66.4 90% | 61.4 75% | 61 74% | 62 77% |
| Color Space (Percent of sRGB) (%) | 55 | 97.9 78% | 99.4 81% | 96.6 76% | 93 69% | 96 75% |
| Totalt genomsnitt (program/inställningar) | 48% /
45% | 30% /
18% | 24% /
33% | 28% /
22% | 26% /
20% |
* ... mindre är bättre
Visa svarstider
| ↔ Svarstid svart till vitt | ||
|---|---|---|
| 23 ms ... stiga ↗ och falla ↘ kombinerat | ↗ 13 ms stiga | 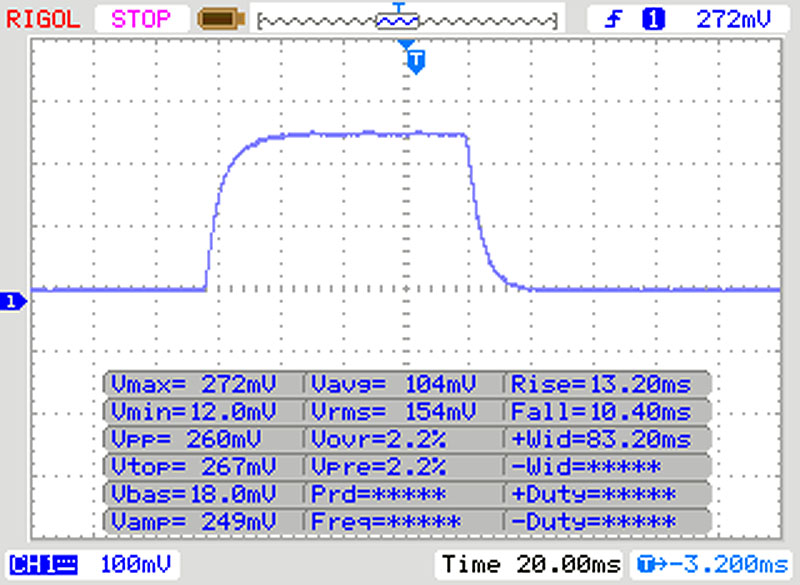 |
| ↘ 10 ms hösten | ||
| Skärmen visar bra svarsfrekvens i våra tester, men kan vara för långsam för konkurrenskraftiga spelare. I jämförelse sträcker sig alla testade enheter från 0.1 (minst) till 240 (maximalt) ms. » 52 % av alla enheter är bättre. Detta innebär att den uppmätta svarstiden är sämre än genomsnittet av alla testade enheter (19.9 ms). | ||
| ↔ Svarstid 50 % grått till 80 % grått | ||
| 37 ms ... stiga ↗ och falla ↘ kombinerat | ↗ 20 ms stiga | 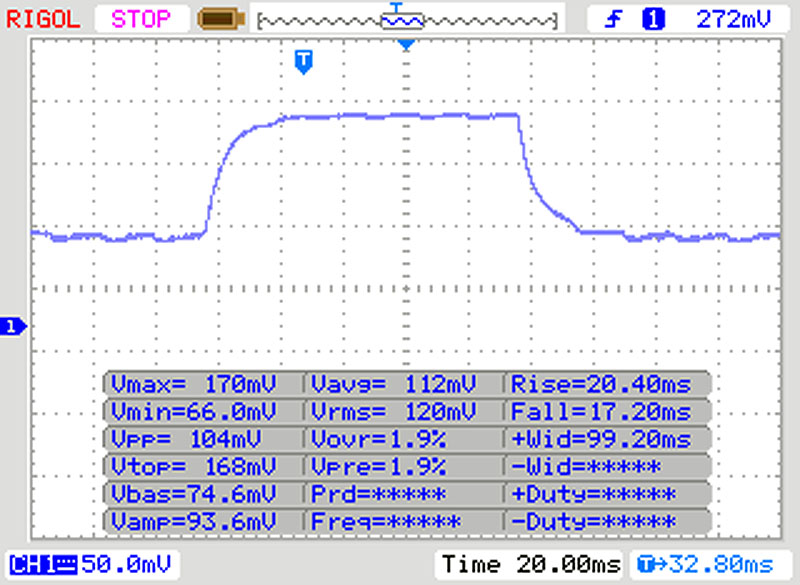 |
| ↘ 17 ms hösten | ||
| Skärmen visar långsamma svarsfrekvenser i våra tester och kommer att vara otillfredsställande för spelare. I jämförelse sträcker sig alla testade enheter från 0.165 (minst) till 636 (maximalt) ms. » 53 % av alla enheter är bättre. Detta innebär att den uppmätta svarstiden är sämre än genomsnittet av alla testade enheter (31.1 ms). | ||
Skärmflimmer / PWM (Puls-Width Modulation)
| Skärmflimmer / PWM upptäcktes inte |  | ||
Som jämförelse: 52 % av alla testade enheter använder inte PWM för att dämpa skärmen. Om PWM upptäcktes mättes ett medelvärde av 7791 (minst: 5 - maximum: 343500) Hz. | |||
Cinebench R15: CPU Single 64Bit | CPU Multi 64Bit
Blender: v2.79 BMW27 CPU
7-Zip 18.03: 7z b 4 -mmt1 | 7z b 4
Geekbench 5.5: Single-Core | Multi-Core
HWBOT x265 Benchmark v2.2: 4k Preset
LibreOffice : 20 Documents To PDF
R Benchmark 2.5: Overall mean
| Cinebench R20 / CPU (Single Core) | |
| Genomsnitt av klass Subnotebook (128 - 832, n=57, senaste 2 åren) | |
| Lenovo ThinkPad T14s-20UJS00K00 | |
| HP EliteBook 845 G7-23Y60EA | |
| Genomsnitt AMD Ryzen 5 PRO 4650U (453 - 454, n=4) | |
| Acer TravelMate P6 P614-51T-G2-72ZU | |
| Lenovo ThinkPad T14-20S1S06B00 | |
| Dynabook Portégé X40-G-10K | |
| Lenovo ThinkPad T495-20NKS01Y00 | |
| Dell Latitude 7410 | |
| Cinebench R20 / CPU (Multi Core) | |
| Genomsnitt av klass Subnotebook (579 - 8541, n=57, senaste 2 åren) | |
| Lenovo ThinkPad T14s-20UJS00K00 | |
| HP EliteBook 845 G7-23Y60EA | |
| Genomsnitt AMD Ryzen 5 PRO 4650U (2561 - 2692, n=4) | |
| Lenovo ThinkPad T14-20S1S06B00 | |
| Acer TravelMate P6 P614-51T-G2-72ZU | |
| Lenovo ThinkPad T495-20NKS01Y00 | |
| Dell Latitude 7410 | |
| Dynabook Portégé X40-G-10K | |
| Cinebench R15 / CPU Single 64Bit | |
| Genomsnitt av klass Subnotebook (72.4 - 322, n=57, senaste 2 åren) | |
| Acer TravelMate P6 P614-51T-G2-72ZU | |
| Lenovo ThinkPad T14s-20UJS00K00 | |
| Dell Latitude 7410 | |
| Genomsnitt AMD Ryzen 5 PRO 4650U (175 - 177, n=4) | |
| HP EliteBook 845 G7-23Y60EA | |
| Dynabook Portégé X40-G-10K | |
| Lenovo ThinkPad T14-20S1S06B00 | |
| Lenovo ThinkPad T495-20NKS01Y00 | |
| Cinebench R15 / CPU Multi 64Bit | |
| Genomsnitt av klass Subnotebook (327 - 3345, n=57, senaste 2 åren) | |
| Lenovo ThinkPad T14s-20UJS00K00 | |
| HP EliteBook 845 G7-23Y60EA | |
| Genomsnitt AMD Ryzen 5 PRO 4650U (1123 - 1168, n=4) | |
| Acer TravelMate P6 P614-51T-G2-72ZU | |
| Lenovo ThinkPad T14-20S1S06B00 | |
| Lenovo ThinkPad T495-20NKS01Y00 | |
| Dynabook Portégé X40-G-10K | |
| Dell Latitude 7410 | |
| Blender / v2.79 BMW27 CPU | |
| Dynabook Portégé X40-G-10K | |
| Lenovo ThinkPad T14-20S1S06B00 | |
| Acer TravelMate P6 P614-51T-G2-72ZU | |
| Dell Latitude 7410 | |
| Lenovo ThinkPad T495-20NKS01Y00 | |
| Genomsnitt AMD Ryzen 5 PRO 4650U (415 - 448, n=4) | |
| HP EliteBook 845 G7-23Y60EA | |
| Genomsnitt av klass Subnotebook (159 - 2271, n=58, senaste 2 åren) | |
| Lenovo ThinkPad T14s-20UJS00K00 | |
| 7-Zip 18.03 / 7z b 4 -mmt1 | |
| Genomsnitt av klass Subnotebook (2643 - 6699, n=59, senaste 2 åren) | |
| Acer TravelMate P6 P614-51T-G2-72ZU | |
| Dell Latitude 7410 | |
| Lenovo ThinkPad T14s-20UJS00K00 | |
| Dynabook Portégé X40-G-10K | |
| Lenovo ThinkPad T14-20S1S06B00 | |
| Genomsnitt AMD Ryzen 5 PRO 4650U (4202 - 4359, n=4) | |
| HP EliteBook 845 G7-23Y60EA | |
| Lenovo ThinkPad T495-20NKS01Y00 | |
| 7-Zip 18.03 / 7z b 4 | |
| Genomsnitt av klass Subnotebook (11668 - 77867, n=57, senaste 2 åren) | |
| Lenovo ThinkPad T14s-20UJS00K00 | |
| HP EliteBook 845 G7-23Y60EA | |
| Genomsnitt AMD Ryzen 5 PRO 4650U (30895 - 32454, n=4) | |
| Acer TravelMate P6 P614-51T-G2-72ZU | |
| Lenovo ThinkPad T14-20S1S06B00 | |
| Dell Latitude 7410 | |
| Lenovo ThinkPad T495-20NKS01Y00 | |
| Dynabook Portégé X40-G-10K | |
| Geekbench 5.5 / Single-Core | |
| Genomsnitt av klass Subnotebook (726 - 2224, n=48, senaste 2 åren) | |
| Dell Latitude 7410 | |
| Acer TravelMate P6 P614-51T-G2-72ZU | |
| Lenovo ThinkPad T14s-20UJS00K00 | |
| Dynabook Portégé X40-G-10K | |
| Genomsnitt AMD Ryzen 5 PRO 4650U (1065 - 1102, n=4) | |
| HP EliteBook 845 G7-23Y60EA | |
| Lenovo ThinkPad T14-20S1S06B00 | |
| Geekbench 5.5 / Multi-Core | |
| Genomsnitt av klass Subnotebook (2557 - 17218, n=48, senaste 2 åren) | |
| Lenovo ThinkPad T14s-20UJS00K00 | |
| HP EliteBook 845 G7-23Y60EA | |
| Genomsnitt AMD Ryzen 5 PRO 4650U (4581 - 4705, n=4) | |
| Acer TravelMate P6 P614-51T-G2-72ZU | |
| Dell Latitude 7410 | |
| Dynabook Portégé X40-G-10K | |
| Lenovo ThinkPad T14-20S1S06B00 | |
| HWBOT x265 Benchmark v2.2 / 4k Preset | |
| Genomsnitt av klass Subnotebook (0.97 - 25.1, n=57, senaste 2 åren) | |
| Lenovo ThinkPad T14s-20UJS00K00 | |
| HP EliteBook 845 G7-23Y60EA | |
| Genomsnitt AMD Ryzen 5 PRO 4650U (7.82 - 8.14, n=4) | |
| Acer TravelMate P6 P614-51T-G2-72ZU | |
| Dell Latitude 7410 | |
| Lenovo ThinkPad T14-20S1S06B00 | |
| Dynabook Portégé X40-G-10K | |
| Lenovo ThinkPad T495-20NKS01Y00 | |
| LibreOffice / 20 Documents To PDF | |
| HP EliteBook 845 G7-23Y60EA | |
| Genomsnitt AMD Ryzen 5 PRO 4650U (61.5 - 88.8, n=4) | |
| Dynabook Portégé X40-G-10K | |
| Lenovo ThinkPad T14s-20UJS00K00 | |
| Lenovo ThinkPad T14-20S1S06B00 | |
| Genomsnitt av klass Subnotebook (39.9 - 220, n=56, senaste 2 åren) | |
| Dell Latitude 7410 | |
| Acer TravelMate P6 P614-51T-G2-72ZU | |
| R Benchmark 2.5 / Overall mean | |
| Dynabook Portégé X40-G-10K | |
| Lenovo ThinkPad T14-20S1S06B00 | |
| Dell Latitude 7410 | |
| Genomsnitt AMD Ryzen 5 PRO 4650U (0.643 - 0.663, n=4) | |
| HP EliteBook 845 G7-23Y60EA | |
| Acer TravelMate P6 P614-51T-G2-72ZU | |
| Lenovo ThinkPad T14s-20UJS00K00 | |
| Genomsnitt av klass Subnotebook (0.4024 - 1.456, n=58, senaste 2 åren) | |
* ... mindre är bättre
| PCMark 10 Score | 4320 poäng | |
Hjälp | ||
| DPC Latencies / LatencyMon - interrupt to process latency (max), Web, Youtube, Prime95 | |
| Dynabook Portégé X40-G-10K | |
| Acer TravelMate P6 P614-51T-G2-72ZU | |
| Lenovo ThinkPad T14s-20UJS00K00 | |
| Lenovo ThinkPad T14-20S1S06B00 | |
| HP EliteBook 845 G7-23Y60EA | |
| Dell Latitude 7410 | |
* ... mindre är bättre
| HP EliteBook 845 G7-23Y60EA Samsung PM991 MZVLQ256HAJD | Lenovo ThinkPad T14s-20UJS00K00 WDC PC SN730 SDBPNTY-1T00 | Lenovo ThinkPad T495-20NKS01Y00 Samsung SSD PM981 MZVLB512HAJQ | Dell Latitude 7410 Toshiba XG6 KXG60ZNV512G | Lenovo ThinkPad T14-20S1S06B00 Lite-On CA5-8D512 | Acer TravelMate P6 P614-51T-G2-72ZU Samsung PM991 MZVLQ512HALU | Genomsnitt Samsung PM991 MZVLQ256HAJD | |
|---|---|---|---|---|---|---|---|
| CrystalDiskMark 5.2 / 6 | 72% | 84% | 70% | 59% | 44% | 18% | |
| Write 4K (MB/s) | 80.6 | 108 34% | 137.7 71% | 133.4 66% | 114.1 42% | 151.8 88% | 143 ? 77% |
| Read 4K (MB/s) | 31.2 | 39.82 28% | 44.11 41% | 51.3 64% | 53.6 72% | 55 76% | 43.2 ? 38% |
| Write Seq (MB/s) | 883 | 2028 130% | 2714 207% | 1897 115% | 1743 97% | 1292 46% | 855 ? -3% |
| Read Seq (MB/s) | 1352 | 1826 35% | 2665 97% | 2202 63% | 2092 55% | 1668 23% | 1328 ? -2% |
| Write 4K Q32T1 (MB/s) | 361 | 570 58% | 251.2 -30% | 384.9 7% | 394.8 9% | 440.7 22% | 419 ? 16% |
| Read 4K Q32T1 (MB/s) | 272 | 401.5 48% | 336.6 24% | 318.7 17% | 372.6 37% | 477.4 76% | 330 ? 21% |
| Write Seq Q32T1 (MB/s) | 979 | 3091 216% | 2994 206% | 2866 193% | 2176 122% | 1169 19% | 972 ? -1% |
| Read Seq Q32T1 (MB/s) | 2286 | 2872 26% | 3547 55% | 3122 37% | 3204 40% | 2245 -2% | 2174 ? -5% |
| AS SSD | 223% | 101% | 196% | 382% | 185% | 73% | |
| Seq Read (MB/s) | 1649 | 2291 39% | 2661 61% | 1837 11% | 2125 29% | 2057 25% | 1892 ? 15% |
| Seq Write (MB/s) | 615 | 1343 118% | 2330 279% | 1438 134% | 1087 77% | 1244 102% | 805 ? 31% |
| 4K Read (MB/s) | 42.8 | 42.56 -1% | 48.28 13% | 48.1 12% | 49.34 15% | 48.07 12% | 47.2 ? 10% |
| 4K Write (MB/s) | 110.5 | 132.2 20% | 94.7 -14% | 132.1 20% | 119 8% | 125.8 14% | 135.4 ? 23% |
| 4K-64 Read (MB/s) | 450 | 850 89% | 1475 228% | 660 47% | 859 91% | 875 94% | 520 ? 16% |
| 4K-64 Write (MB/s) | 780 | 2262 190% | 1494 92% | 1163 49% | 1125 44% | 785 1% | 736 ? -6% |
| Access Time Read * (ms) | 0.154 | 0.05 68% | 0.046 70% | 0.059 62% | 0.058 62% | 0.1368 ? 11% | |
| Access Time Write * (ms) | 0.035 | 0.028 20% | 0.041 -17% | 0.096 -174% | 0.032 9% | 0.031 11% | 0.0396 ? -13% |
| Score Read (Points) | 658 | 1121 70% | 1790 172% | 891 35% | 1121 70% | 1129 72% | 756 ? 15% |
| Score Write (Points) | 953 | 2529 165% | 1822 91% | 1439 51% | 1353 42% | 1035 9% | 952 ? 0% |
| Score Total (Points) | 1910 | 4185 119% | 4514 136% | 2780 46% | 3007 57% | 2712 42% | 2055 ? 8% |
| Copy ISO MB/s (MB/s) | 236 | 2546 979% | 2089 785% | 1265 436% | 1600 578% | 712 ? 202% | |
| Copy Program MB/s (MB/s) | 60.6 | 428.6 607% | 548 804% | 1353 2133% | 517 753% | 300 ? 395% | |
| Copy Game MB/s (MB/s) | 126.6 | 943 645% | 1226 868% | 3007 2275% | 1009 697% | 525 ? 315% | |
| Totalt genomsnitt (program/inställningar) | 148% /
168% | 93% /
94% | 133% /
151% | 221% /
265% | 115% /
131% | 46% /
53% |
* ... mindre är bättre

Kontinuerlig inläsning: DiskSpd Read Loop, Queue Depth 8
| 3DMark 11 - 1280x720 Performance GPU | |
| Genomsnitt av klass Subnotebook (995 - 18489, n=55, senaste 2 åren) | |
| Lenovo ThinkPad T14s-20UJS00K00 | |
| Genomsnitt AMD Radeon RX Vega 6 (Ryzen 4000/5000) (3401 - 4713, n=23) | |
| Lenovo ThinkPad T495-20NKS01Y00 | |
| HP EliteBook 845 G7-23Y60EA | |
| Acer TravelMate P6 P614-51T-G2-72ZU | |
| Dell Latitude 7410 | |
| Lenovo ThinkPad T14-20S1S06B00 | |
| Dynabook Portégé X40-G-10K | |
| 3DMark | |
| 1920x1080 Fire Strike Graphics | |
| Genomsnitt av klass Subnotebook (832 - 16347, n=56, senaste 2 åren) | |
| Lenovo ThinkPad T14s-20UJS00K00 | |
| Genomsnitt AMD Radeon RX Vega 6 (Ryzen 4000/5000) (2122 - 3239, n=23) | |
| Lenovo ThinkPad T495-20NKS01Y00 | |
| HP EliteBook 845 G7-23Y60EA | |
| Acer TravelMate P6 P614-51T-G2-72ZU | |
| Dell Latitude 7410 | |
| Dynabook Portégé X40-G-10K | |
| Lenovo ThinkPad T14-20S1S06B00 | |
| 2560x1440 Time Spy Graphics | |
| Genomsnitt av klass Subnotebook (804 - 6288, n=55, senaste 2 åren) | |
| Genomsnitt AMD Radeon RX Vega 6 (Ryzen 4000/5000) (650 - 996, n=22) | |
| Lenovo ThinkPad T495-20NKS01Y00 | |
| HP EliteBook 845 G7-23Y60EA | |
| Dell Latitude 7410 | |
| Lenovo ThinkPad T14-20S1S06B00 | |
| 3DMark 06 Score Unknown Setting | 14216 poäng | |
| 3DMark 11 Performance | 3640 poäng | |
| 3DMark Fire Strike Score | 1924 poäng | |
| 3DMark Time Spy Score | 744 poäng | |
Hjälp | ||
| Dota 2 Reborn - 1366x768 med (1/3) | |
| Genomsnitt av klass Subnotebook (25 - 149.1, n=61, senaste 2 åren) | |
| Lenovo ThinkPad T14s-20UJS00K00 | |
| Lenovo ThinkPad E14 Gen2-20T7S00W00 | |
| Lenovo IdeaPad 5 14ARE05 | |
| Genomsnitt AMD Radeon RX Vega 6 (Ryzen 4000/5000) (62.6 - 119.5, n=21) | |
| Lenovo ThinkPad T495-20NKS01Y00 | |
| HP EliteBook 845 G7-23Y60EA | |
| Dell Latitude 7410 | |
| Acer TravelMate P6 P614-51T-G2-72ZU | |
| Lenovo ThinkPad T14-20S1S06B00 | |
| Dynabook Portégé X40-G-10K | |
| X-Plane 11.11 - 1280x720 low (fps_test=1) | |
| Genomsnitt av klass Subnotebook (29.9 - 82.5, n=59, senaste 2 åren) | |
| Lenovo ThinkPad T14s-20UJS00K00 | |
| Lenovo ThinkPad E14 Gen2-20T7S00W00 | |
| Lenovo IdeaPad 5 14ARE05 | |
| Genomsnitt AMD Radeon RX Vega 6 (Ryzen 4000/5000) (33.1 - 45.6, n=20) | |
| HP EliteBook 845 G7-23Y60EA | |
| Lenovo ThinkPad T495-20NKS01Y00 | |
| Acer TravelMate P6 P614-51T-G2-72ZU | |
| Lenovo ThinkPad T14-20S1S06B00 | |
| Dell Latitude 7410 | |
| Dynabook Portégé X40-G-10K | |
| Battlefield V - 1280x720 Low Preset | |
| Lenovo IdeaPad 5 14ARE05 | |
| Genomsnitt AMD Radeon RX Vega 6 (Ryzen 4000/5000) (28.5 - 53.5, n=3) | |
| HP EliteBook 845 G7-23Y60EA | |
| låg | med. | hög | ultra | QHD | 4K | |
|---|---|---|---|---|---|---|
| The Witcher 3 (2015) | 32.8 | 23.3 | 10.9 | |||
| Dota 2 Reborn (2015) | 81.6 | 62.6 | 32 | 30.4 | 8.5 | |
| Final Fantasy XV Benchmark (2018) | 20.9 | 10.6 | 6.63 | 4.87 | 1.99 | |
| X-Plane 11.11 (2018) | 33.1 | 25.2 | 22.6 | 22.5 | ||
| Far Cry 5 (2018) | 26 | 12 | 11 | |||
| Strange Brigade (2018) | 41 | 17 | 15 | |||
| Battlefield V (2018) | 28.5 | 16.4 |
Ljudnivå
| Låg belastning |
| 25.4 / 25.4 / 25.4 dB(A) |
| Hög belastning |
| 29.6 / 29.5 dB(A) |
 | ||
30 dB tyst 40 dB(A) hörbar 50 dB(A) högt ljud |
||
min: | ||
(+) Den maximala temperaturen på ovansidan är 39 °C / 102 F, jämfört med genomsnittet av 35.9 °C / 97 F , allt från 21.4 till 59 °C för klassen Subnotebook.
(+) Botten värms upp till maximalt 37.8 °C / 100 F, jämfört med genomsnittet av 39.2 °C / 103 F
(+) Vid tomgångsbruk är medeltemperaturen för ovansidan 24 °C / 75 F, jämfört med enhetsgenomsnittet på 30.8 °C / ### class_avg_f### F.
(+) Handledsstöden och pekplattan är kallare än hudtemperaturen med maximalt 27.8 °C / 82 F och är därför svala att ta på.
(±) Medeltemperaturen för handledsstödsområdet på liknande enheter var 28.2 °C / 82.8 F (+0.4 °C / 0.8 F).
HP EliteBook 845 G7-23Y60EA ljudanalys
(-) | inte särskilt höga högtalare (67.8 dB)
Bas 100 - 315 Hz
(-) | nästan ingen bas - i genomsnitt 19.7% lägre än medianen
(±) | linjäriteten för basen är genomsnittlig (11.7% delta till föregående frekvens)
Mellan 400 - 2000 Hz
(+) | balanserad mellan - endast 1.3% från medianen
(+) | mids är linjära (4.8% delta till föregående frekvens)
Högsta 2 - 16 kHz
(+) | balanserade toppar - endast 3% från medianen
(+) | toppar är linjära (4.5% delta till föregående frekvens)
Totalt 100 - 16 000 Hz
(±) | linjäriteten för det totala ljudet är genomsnittlig (16.2% skillnad mot median)
Jämfört med samma klass
» 40% av alla testade enheter i den här klassen var bättre, 4% liknande, 56% sämre
» Den bästa hade ett delta på 5%, genomsnittet var 18%, sämst var 53%
Jämfört med alla testade enheter
» 26% av alla testade enheter var bättre, 6% liknande, 68% sämre
» Den bästa hade ett delta på 4%, genomsnittet var 24%, sämst var 134%
Lenovo ThinkPad T14s-20UJS00K00 ljudanalys
(±) | högtalarljudstyrkan är genomsnittlig men bra (75.4 dB)
Bas 100 - 315 Hz
(-) | nästan ingen bas - i genomsnitt 15.1% lägre än medianen
(±) | linjäriteten för basen är genomsnittlig (11.9% delta till föregående frekvens)
Mellan 400 - 2000 Hz
(±) | högre mellan - i genomsnitt 10.3% högre än median
(±) | linjäriteten för mids är genomsnittlig (13.3% delta till föregående frekvens)
Högsta 2 - 16 kHz
(+) | balanserade toppar - endast 3.3% från medianen
(±) | linjäriteten för toppar är genomsnittlig (7.5% delta till föregående frekvens)
Totalt 100 - 16 000 Hz
(±) | linjäriteten för det totala ljudet är genomsnittlig (29.7% skillnad mot median)
Jämfört med samma klass
» 91% av alla testade enheter i den här klassen var bättre, 3% liknande, 7% sämre
» Den bästa hade ett delta på 7%, genomsnittet var 21%, sämst var 53%
Jämfört med alla testade enheter
» 88% av alla testade enheter var bättre, 3% liknande, 10% sämre
» Den bästa hade ett delta på 4%, genomsnittet var 24%, sämst var 134%
Acer TravelMate P6 P614-51T-G2-72ZU ljudanalys
(-) | inte särskilt höga högtalare (68.3 dB)
Bas 100 - 315 Hz
(-) | nästan ingen bas - i genomsnitt 20.1% lägre än medianen
(±) | linjäriteten för basen är genomsnittlig (12.7% delta till föregående frekvens)
Mellan 400 - 2000 Hz
(+) | balanserad mellan - endast 2.6% från medianen
(±) | linjäriteten för mids är genomsnittlig (7.3% delta till föregående frekvens)
Högsta 2 - 16 kHz
(±) | högre toppar - i genomsnitt 5.4% högre än medianen
(+) | toppar är linjära (2.7% delta till föregående frekvens)
Totalt 100 - 16 000 Hz
(±) | linjäriteten för det totala ljudet är genomsnittlig (19.3% skillnad mot median)
Jämfört med samma klass
» 38% av alla testade enheter i den här klassen var bättre, 7% liknande, 54% sämre
» Den bästa hade ett delta på 7%, genomsnittet var 21%, sämst var 53%
Jämfört med alla testade enheter
» 47% av alla testade enheter var bättre, 8% liknande, 46% sämre
» Den bästa hade ett delta på 4%, genomsnittet var 24%, sämst var 134%
| Av/Standby | |
| Låg belastning | |
| Hög belastning |
|
Förklaring:
min: | |
| HP EliteBook 845 G7-23Y60EA R5 PRO 4650U, Vega 6, Samsung PM991 MZVLQ256HAJD, IPS, 1920x1080, 14" | Lenovo ThinkPad T14s-20UJS00K00 R7 PRO 4750U, Vega 7, WDC PC SN730 SDBPNTY-1T00, IPS , 1920x1080, 14" | Dell Latitude 7410 i7-10610U, UHD Graphics 620, Toshiba XG6 KXG60ZNV512G, IPS, 3840x2160, 14" | Lenovo ThinkPad T14-20S1S06B00 i5-10210U, UHD Graphics 620, Lite-On CA5-8D512, LTPS IPS LED, 1920x1080, 14" | Acer TravelMate P6 P614-51T-G2-72ZU i7-10510U, UHD Graphics 620, Samsung PM991 MZVLQ512HALU, IPS, 1920x1080, 14" | Genomsnitt AMD Radeon RX Vega 6 (Ryzen 4000/5000) | Genomsnitt av klass Subnotebook | |
|---|---|---|---|---|---|---|---|
| Power Consumption | -44% | -31% | -38% | -13% | -23% | -33% | |
| Idle Minimum * (Watt) | 3.1 | 5.7 -84% | 3.7 -19% | 3.2 -3% | 3.6 -16% | 3.98 ? -28% | 3.82 ? -23% |
| Idle Average * (Watt) | 5.6 | 8.9 -59% | 6.2 -11% | 6.1 -9% | 5.8 -4% | 6.53 ? -17% | 6.61 ? -18% |
| Idle Maximum * (Watt) | 8.6 | 11 -28% | 7 19% | 10.4 -21% | 9.5 -10% | 8.65 ? -1% | 7.99 ? 7% |
| Load Average * (Watt) | 28.4 | 38.2 -35% | 43.2 -52% | 45.6 -61% | 42 -48% | 35 ? -23% | 41.9 ? -48% |
| Load Maximum * (Watt) | 35.4 | 40.2 -14% | 68.6 -94% | 68.6 -94% | 31 12% | 51.5 ? -45% | 64.1 ? -81% |
* ... mindre är bättre
| HP EliteBook 845 G7-23Y60EA R5 PRO 4650U, Vega 6, 56 Wh | Lenovo ThinkPad T14s-20UJS00K00 R7 PRO 4750U, Vega 7, 57 Wh | Lenovo ThinkPad T495-20NKS01Y00 R5 PRO 3500U, Vega 8, 50 Wh | Dell Latitude 7410 i7-10610U, UHD Graphics 620, 68 Wh | Lenovo ThinkPad T14-20S1S06B00 i5-10210U, UHD Graphics 620, 50 Wh | Acer TravelMate P6 P614-51T-G2-72ZU i7-10510U, UHD Graphics 620, 60 Wh | Dynabook Portégé X40-G-10K i5-10210U, UHD Graphics 620, 48 Wh | Genomsnitt av klass Subnotebook | |
|---|---|---|---|---|---|---|---|---|
| Batteridrifttid | 5% | -9% | 36% | -15% | 21% | -36% | 35% | |
| Reader / Idle (h) | 16.2 | 31.3 93% | 25.8 59% | 28.6 ? 77% | ||||
| H.264 (h) | 9.5 | 13.2 39% | 11.8 24% | 10.4 9% | 12.9 36% | 15.6 ? 64% | ||
| WiFi v1.3 (h) | 12.2 | 10.2 -16% | 9.1 -25% | 11 -10% | 11 -10% | 11.3 -7% | 7.8 -36% | 14 ? 15% |
| Load (h) | 2.3 | 2.1 -9% | 1.7 -26% | 2.9 26% | 1.3 -43% | 2.2 -4% | 1.946 ? -15% |
För
Emot
Omdöme - AMD är rätt val

Läs den fullständiga versionen av den här recensionen på engelska här.
HP släpper en AMD-version av 14-tummaren EliteBook och tävlar därmed direkt med Lenovos ThinkPad T14s (AMD och Intel), Dells Latitude 7410 (Intel) och till och med Acers TravelMate P6 P614 (Intel).
Det är ett race där EliteBook hamnar precis bakom modellerna från Lenovo och Dell.
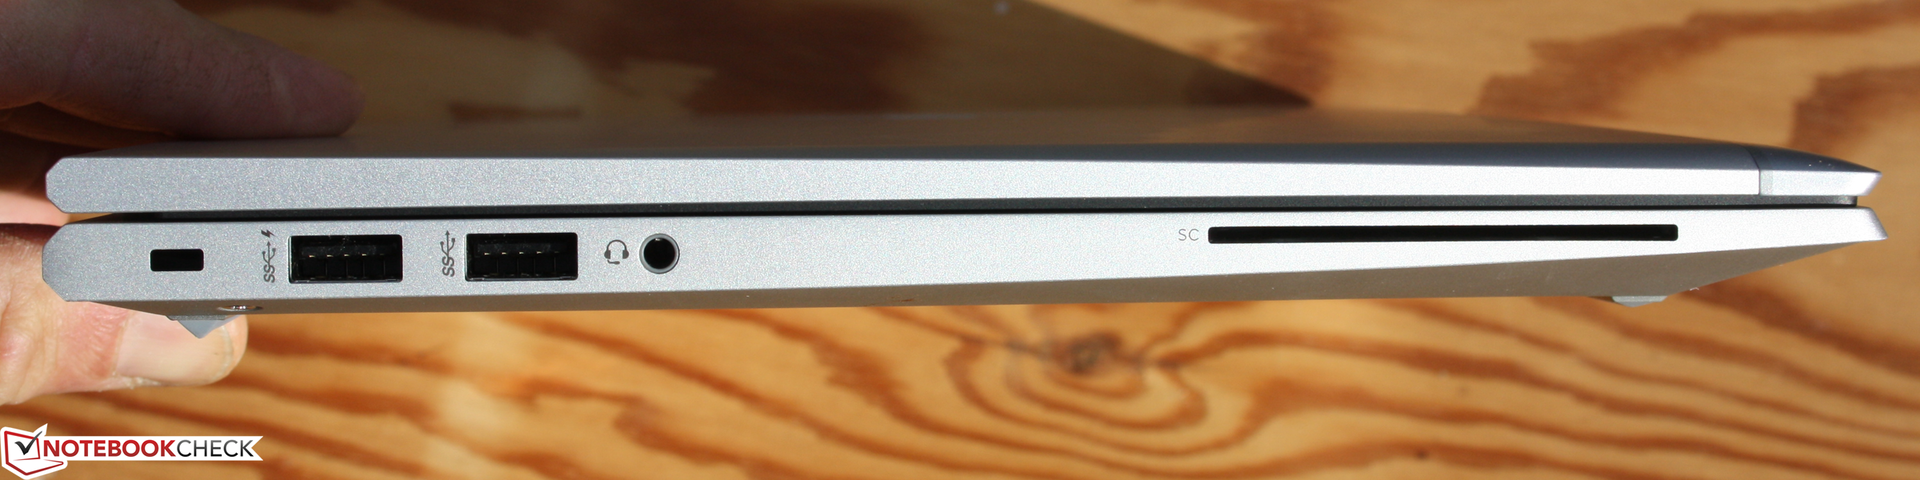
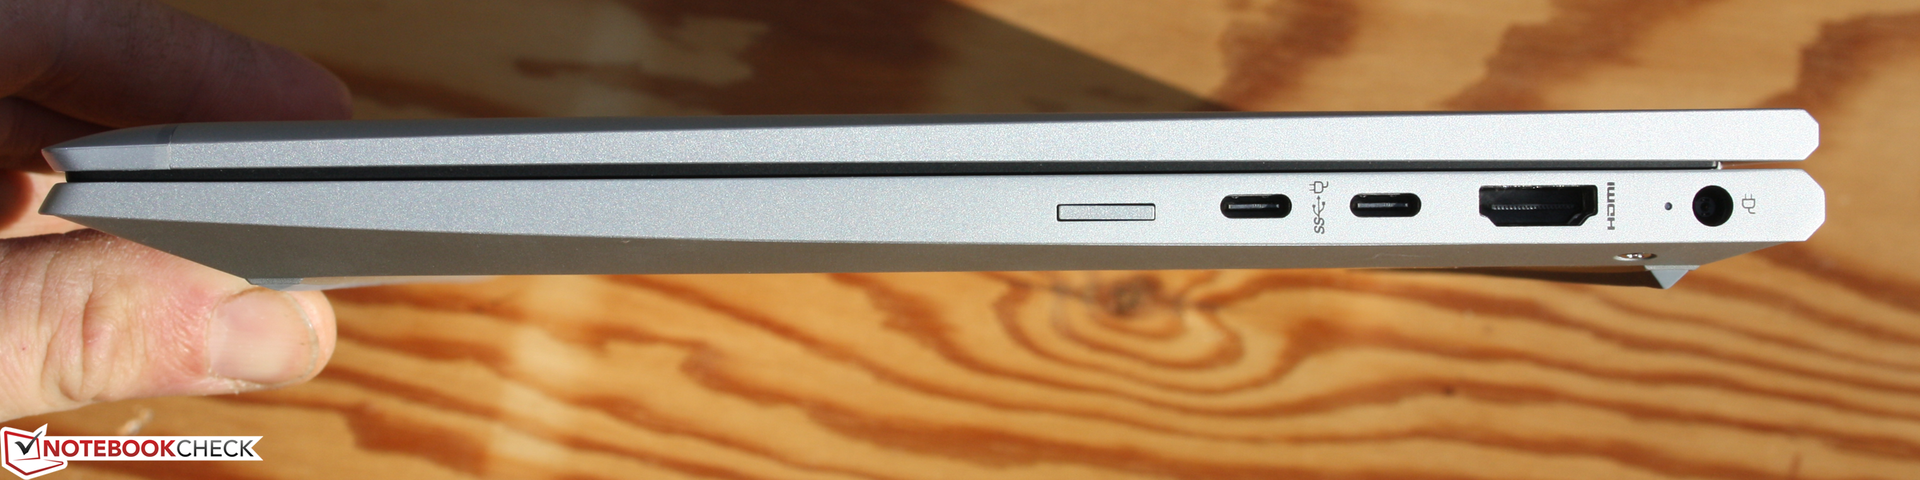
Det var tillräckligt för omdömet "riktigt bra" (88%), men i slutändan gör problem som en mörk och färgsvag skärm, en jämförelsevis långsam SSD-enhet samt faktum att den saknar Thunderbolt 3 och kortläsare en viss skillnad.
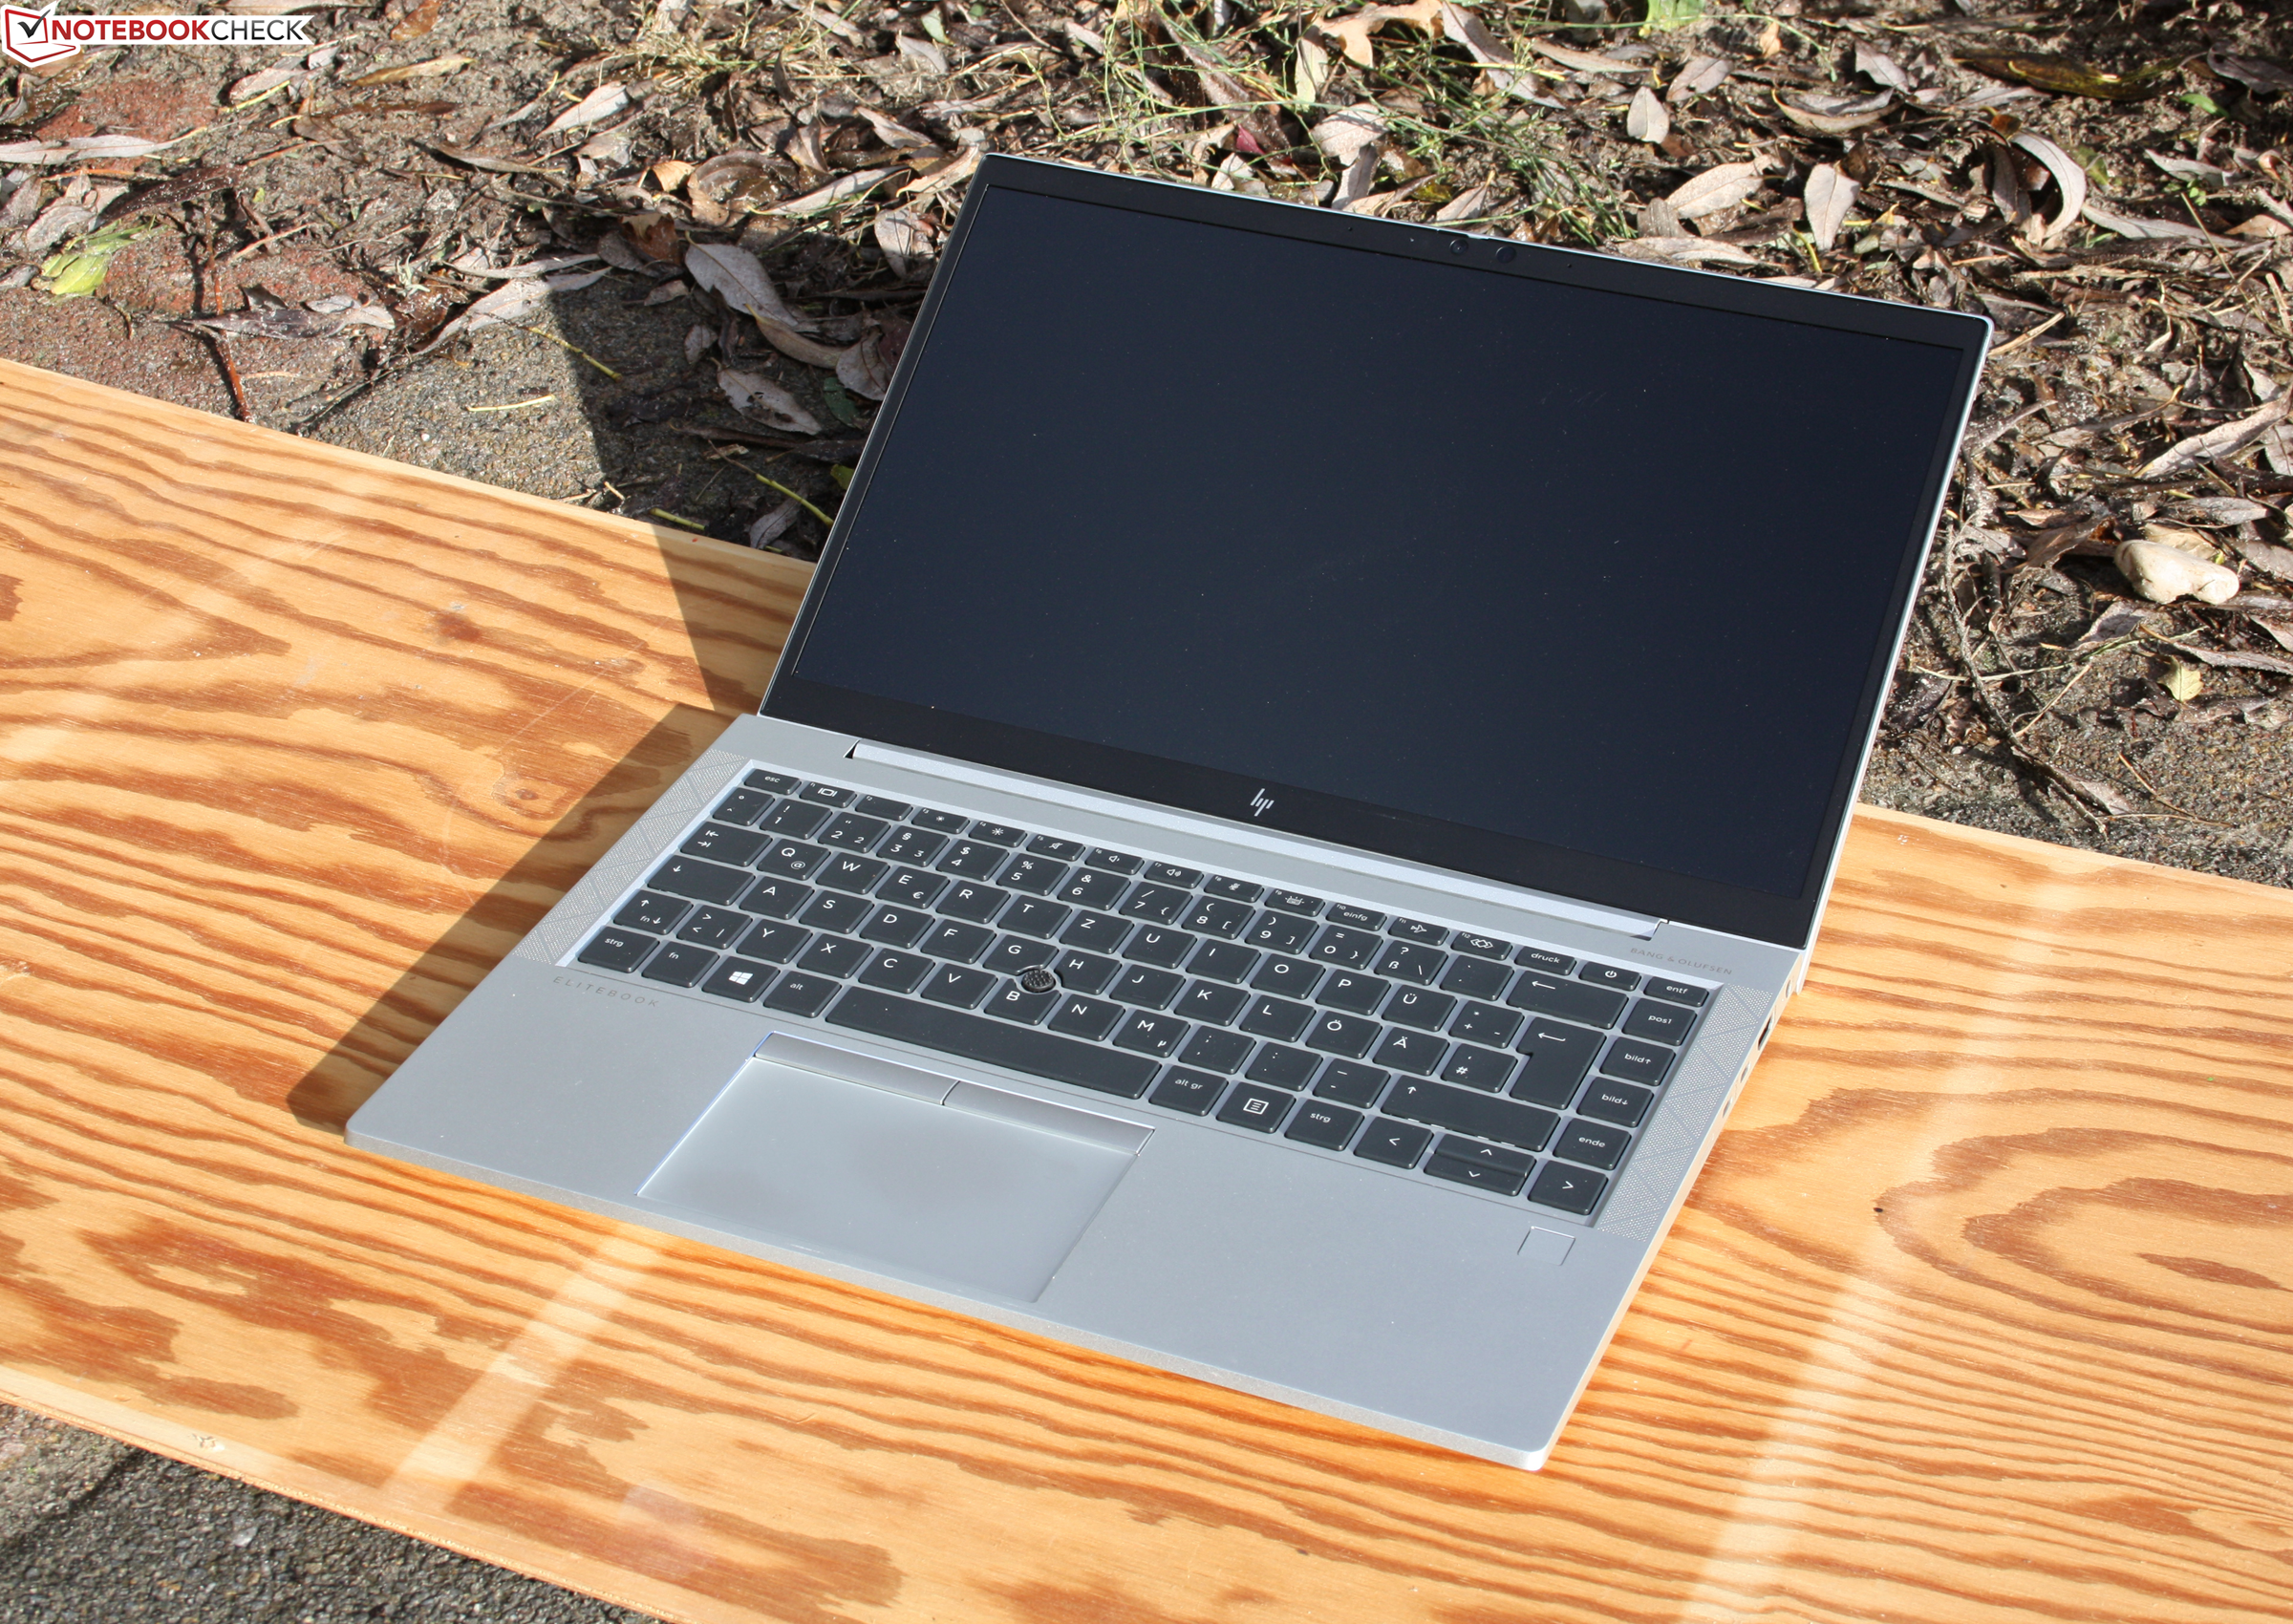
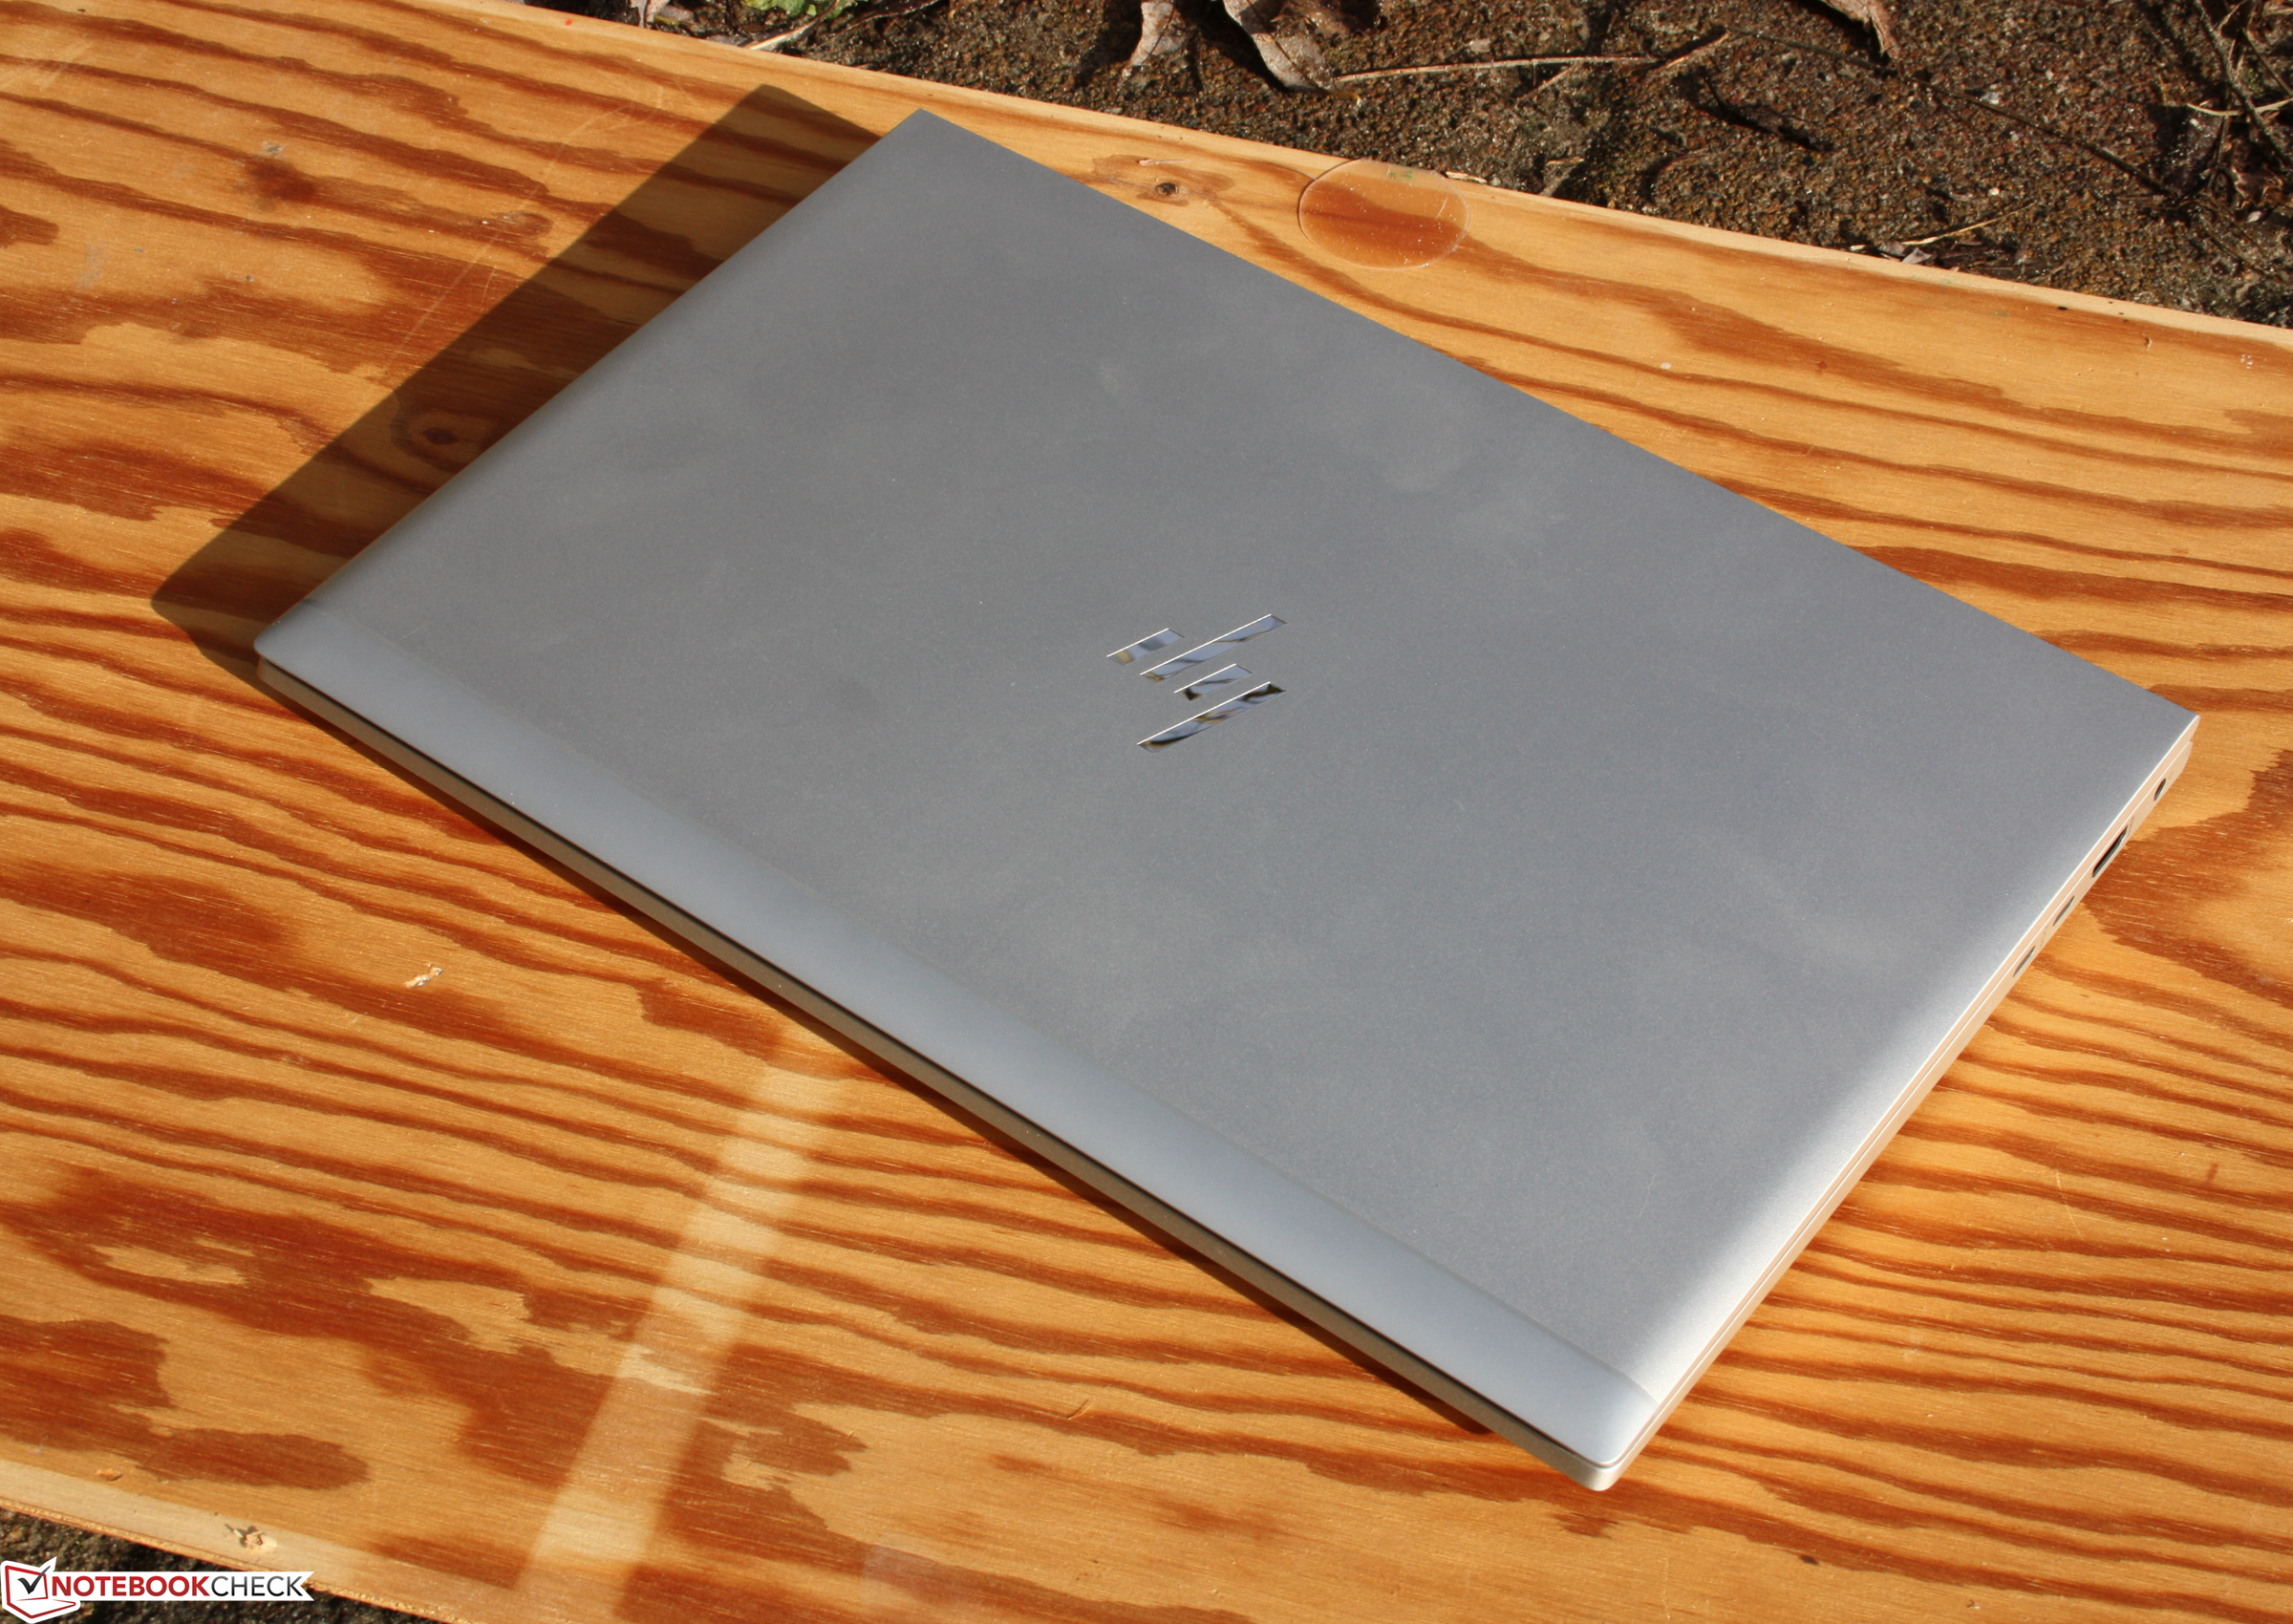
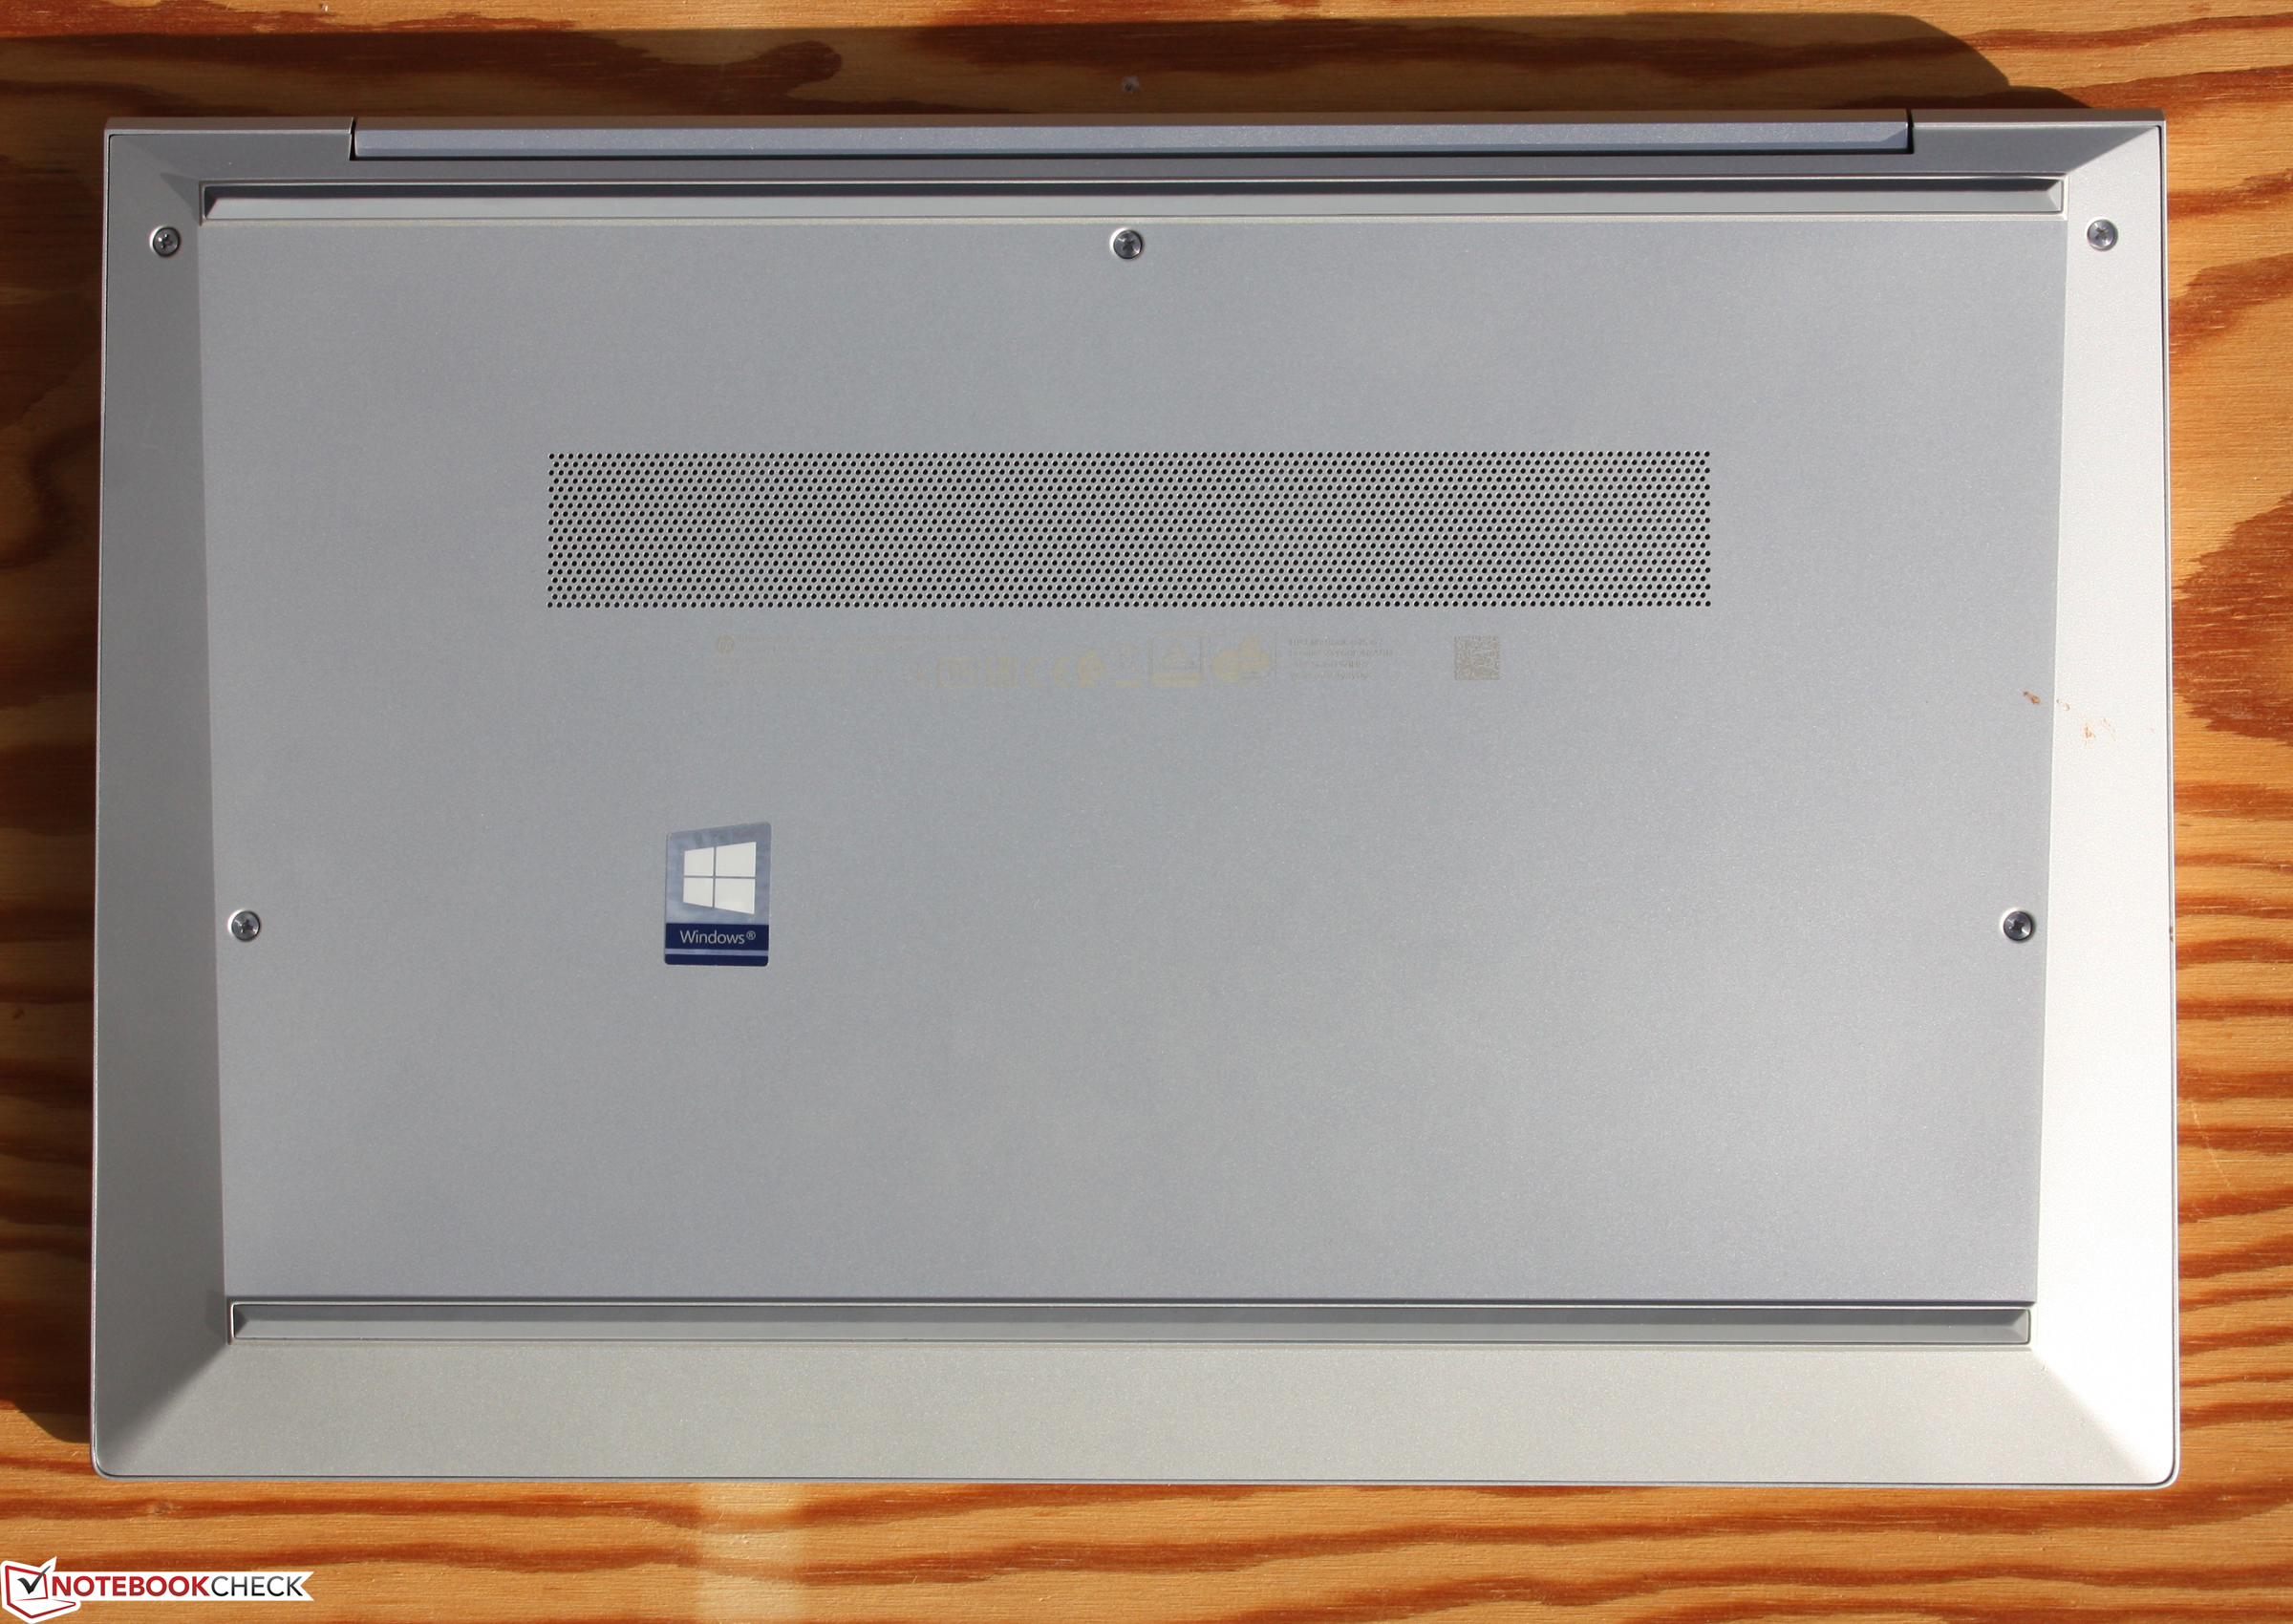
Generellt sett är EliteBook 845 G7 en utmärkt kontorslaptop för intensivt mobilt bruk. Chassits hantverk och moderna kantiga utseende imponerar. Den har dessutom utmärkt implementerade servicemöjligheter; allt du behöver är en kryss-skruvmejsel. Insidan är redo för WWAN eftersom datorn har en SIM-kortsplats och antenner.
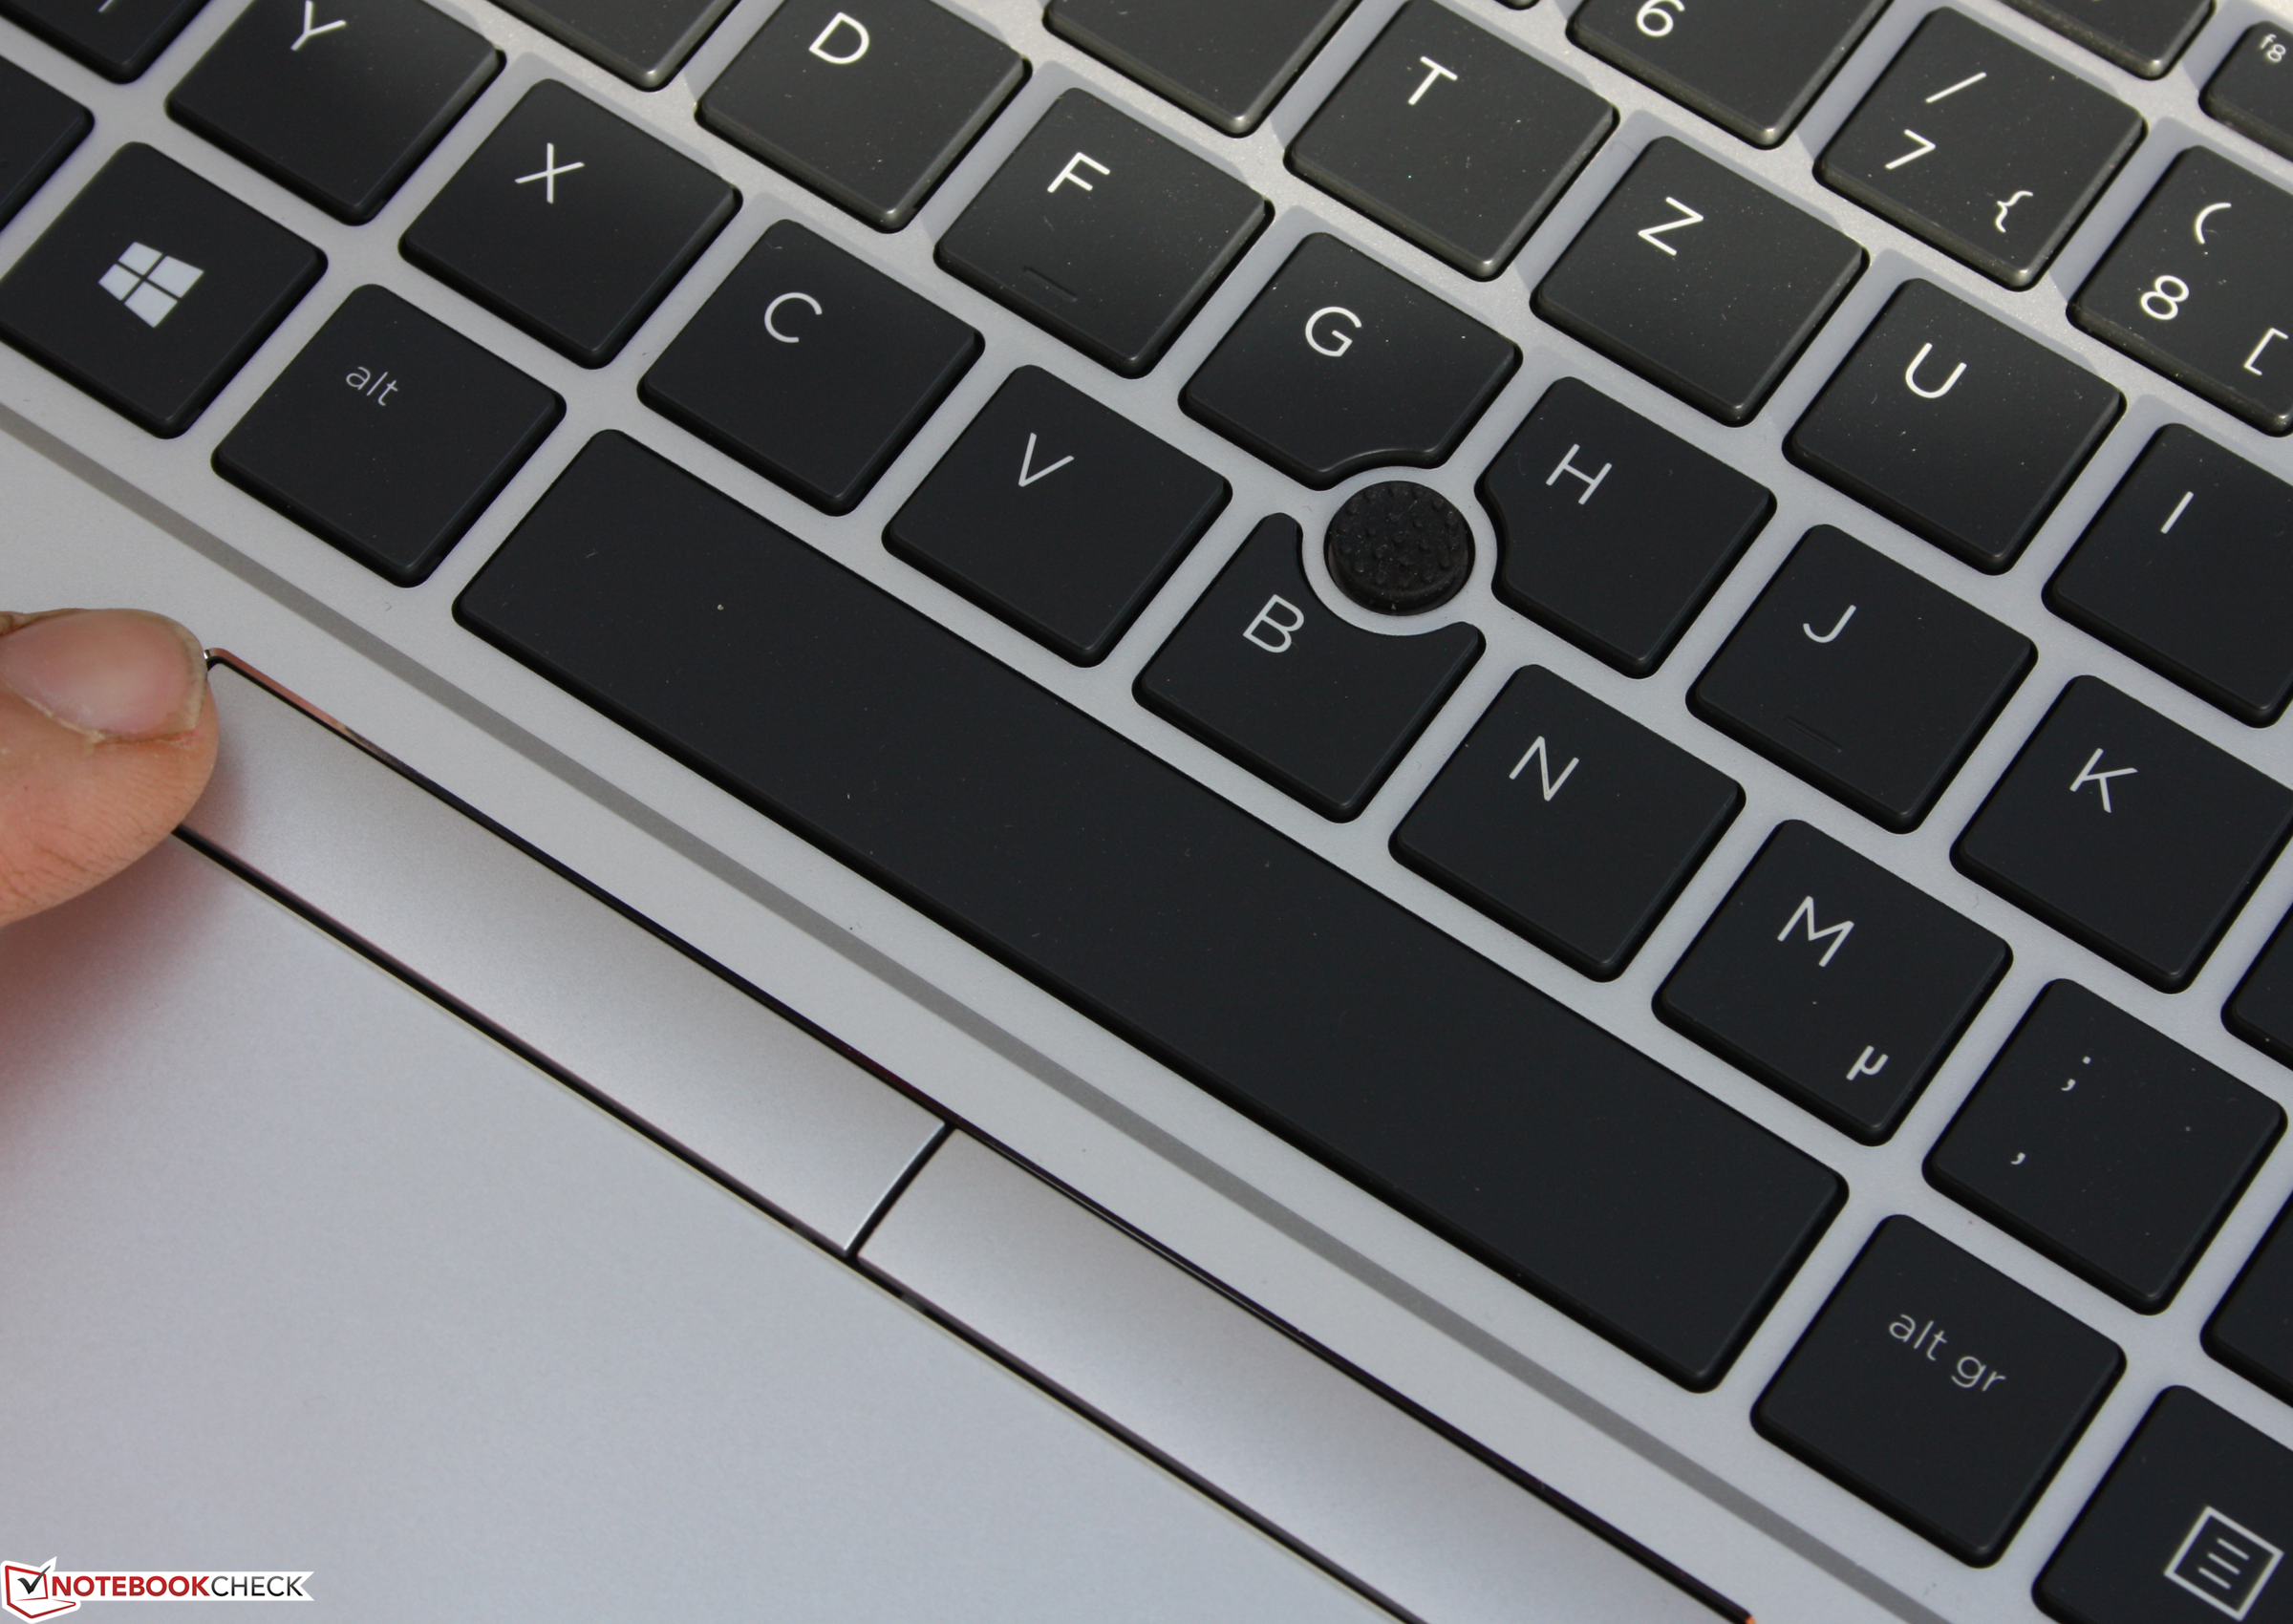
Batteriet håller en hel arbetsdag utan problem; vi mätte upp 9.5 till 12 timmar i våra praktiska tester. Vi tyckte också att inmatningsenheterna var bekväma med gedigen återkoppling och låg ljudnivå när man skriver och klickar.
Den rejäla datorkraften slår för tillfället alla Intel-konkurrenter; det behövs inte ens en fjärde generationens Ryzen 7. Ryzen 5 får dubbelt så många poäng som toppmodellen Intel Core i7-10610U (Cinebench R15/R20, flerkärnig). Den drar utan tvekan mindre energi än Intels motsvarighet och fläkten viskar behagligt i bakgrunden. Om du vill ha hög prestanda och låga värme- och ljudnivåer är EliteBook 845 G7 rätt val.
Rejäl datorkraft slår för tillfället alla Intel-baserade konkurrenter; det behövs inte ens en fjärde generationens Ryzen 7 för att göra det.
Tyvärr har AMD-modellen inte stöd för Thunderbolt. På Intel-versionen av 840 G7 har de två USB Typ C-portarna Thunderbolt-stöd. Detta är synd för det går därmed inte att få full hastighet från Thunderbolt-dockningsstationer, för att inte tala om externa grafikkort. Men utbudet av Typ C-dockor är som tur är inte direkt begränsat. Det går att ansluta externa skärmar genom en sådan docka eller direkt genom USB-C porten (DisplayPort Alt-läge).
EliteBook eller ThinkPad som 14-tummare? I slutändan är Lenovos ThinkPad T14s ett bättre val med sin utmärkta 1080p-skärm (matt, ljusstark, täcker nästan hela sRGB) och sin microSD-kortläsare. Men du får i så fall stå ut med högre ljudnivå och batteritid som tenderar att vara kortare - åtminstone på den Ryzen 7-version av T14s som vi testade. ThinkPad T14s med Ryzen 5 PRO 4650U har samma pris som HP EliteBook 845 G7 23Y60EA, modellen vi recenserat. Pris/prestanda-förhållandet talar för Lenovo.
HP EliteBook 845 G7-23Y60EA
- 11/03/2020 v7 (old)
Sebastian Jentsch
Price comparison
