Test: Aorus X9 (i7-7820HK, GTX 1070 SLI, QHD) Laptop (Sammanfattning)
| SD Card Reader | |
| average JPG Copy Test (av. of 3 runs) | |
| Aorus X9 (Toshiba Exceria Pro SDXC 64 GB UHS-II) | |
| MSI GT75VR 7RF-012 Titan Pro (Toshiba Exceria Pro SDXC 64 GB UHS-II) | |
| Acer Predator 17 G9-793-70PJ (Toshiba Exceria Pro SDXC 64 GB UHS-II) | |
| Asus G752VS-BA338T (Toshiba Exceria Pro SDXC 64 GB UHS-II) | |
| maximum AS SSD Seq Read Test (1GB) | |
| Aorus X9 (Toshiba Exceria Pro SDXC 64 GB UHS-II) | |
| Acer Predator 17 G9-793-70PJ (Toshiba Exceria Pro SDXC 64 GB UHS-II) | |
| Asus G752VS-BA338T (Toshiba Exceria Pro SDXC 64 GB UHS-II) | |
| MSI GT75VR 7RF-012 Titan Pro (Toshiba Exceria Pro SDXC 64 GB UHS-II) | |
| Networking | |
| iperf3 transmit AX12 | |
| Acer Predator 17 G9-793-70PJ | |
| Alienware 17 R4 | |
| MSI GT75VR 7RF-012 Titan Pro | |
| Aorus X9 | |
| Asus G752VS-BA338T | |
| iperf3 receive AX12 | |
| MSI GT75VR 7RF-012 Titan Pro | |
| Acer Predator 17 G9-793-70PJ | |
| Asus G752VS-BA338T | |
| Alienware 17 R4 | |
| Aorus X9 | |
| |||||||||||||||||||||||||
Distribution av ljusstyrkan: 88 %
Mitt på batteriet: 346 cd/m²
Kontrast: 641:1 (Svärta: 0.54 cd/m²)
ΔE ColorChecker Calman: 5.98 | ∀{0.5-29.43 Ø4.71}
ΔE Greyscale Calman: 5.47 | ∀{0.09-98 Ø4.96}
84% sRGB (Argyll 1.6.3 3D)
55% AdobeRGB 1998 (Argyll 1.6.3 3D)
61.1% AdobeRGB 1998 (Argyll 3D)
84% sRGB (Argyll 3D)
60.6% Display P3 (Argyll 3D)
Gamma: 2.21
CCT: 7721 K
| Aorus X9 AUO B173QTN01.3 (AUO1396), 2560x1440, 17.3" | Alienware 17 R4 2560x1440, 17.3" | MSI GT75VR 7RF-012 Titan Pro CMN N173HHE-G32 (CMN1747), 1920x1080, 17.3" | Asus G752VS-BA338T AU Optronics B173HAN01.1 (AUO119D), 1920x1080, 17.3" | Acer Predator 17 G9-793-70PJ AU Optronics B173ZAN01.0 (AUO109B), 3840x2160, 17.3" | |
|---|---|---|---|---|---|
| Display | -0% | 37% | 4% | 41% | |
| Display P3 Coverage (%) | 60.6 | 61.2 1% | 90.3 49% | 61.6 2% | 86.4 43% |
| sRGB Coverage (%) | 84 | 82.9 -1% | 99.6 19% | 90.3 8% | 99.9 19% |
| AdobeRGB 1998 Coverage (%) | 61.1 | 60.5 -1% | 86.8 42% | 62.8 3% | 99.1 62% |
| Response Times | -67% | 22% | -181% | -210% | |
| Response Time Grey 50% / Grey 80% * (ms) | 21.6 ? | 30 ? -39% | 11.6 ? 46% | 36 ? -67% | 50 ? -131% |
| Response Time Black / White * (ms) | 6.6 ? | 12.8 ? -94% | 6.8 ? -3% | 26 ? -294% | 25.6 ? -288% |
| PWM Frequency (Hz) | 25000 ? | ||||
| Screen | 3% | 36% | 5% | 29% | |
| Brightness middle (cd/m²) | 346 | 402.3 16% | 274 -21% | 307 -11% | 343 -1% |
| Brightness (cd/m²) | 326 | 372 14% | 262 -20% | 300 -8% | 328 1% |
| Brightness Distribution (%) | 88 | 86 -2% | 87 -1% | 88 0% | 84 -5% |
| Black Level * (cd/m²) | 0.54 | 0.62 -15% | 0.26 52% | 0.32 41% | 0.29 46% |
| Contrast (:1) | 641 | 649 1% | 1054 64% | 959 50% | 1183 85% |
| Colorchecker dE 2000 * | 5.98 | 5.6 6% | 1.36 77% | 5.53 8% | 4.01 33% |
| Colorchecker dE 2000 max. * | 9.77 | 9.8 -0% | 4.1 58% | 11.54 -18% | 6.03 38% |
| Greyscale dE 2000 * | 5.47 | 4.7 14% | 0.64 88% | 7 -28% | 4.7 14% |
| Gamma | 2.21 100% | 2.14 103% | 2.19 100% | 2.48 89% | 2.4 92% |
| CCT | 7721 84% | 7519 86% | 6551 99% | 8103 80% | 6451 101% |
| Color Space (Percent of AdobeRGB 1998) (%) | 55 | 53.7 -2% | 77 40% | 58 5% | 88 60% |
| Color Space (Percent of sRGB) (%) | 84 | 82.2 -2% | 100 19% | 90 7% | 100 19% |
| Totalt genomsnitt (program/inställningar) | -21% /
-7% | 32% /
34% | -57% /
-20% | -47% /
-0% |
* ... mindre är bättre
Visa svarstider
| ↔ Svarstid svart till vitt | ||
|---|---|---|
| 6.6 ms ... stiga ↗ och falla ↘ kombinerat | ↗ 4.6 ms stiga | 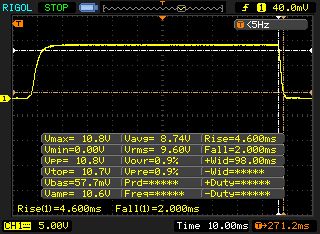 |
| ↘ 2 ms hösten | ||
| Skärmen visar väldigt snabba svarsfrekvenser i våra tester och borde vara mycket väl lämpad för fartfyllt spel. I jämförelse sträcker sig alla testade enheter från 0.1 (minst) till 240 (maximalt) ms. » 21 % av alla enheter är bättre. Det betyder att den uppmätta svarstiden är bättre än genomsnittet av alla testade enheter (19.8 ms). | ||
| ↔ Svarstid 50 % grått till 80 % grått | ||
| 21.6 ms ... stiga ↗ och falla ↘ kombinerat | ↗ 11.6 ms stiga | 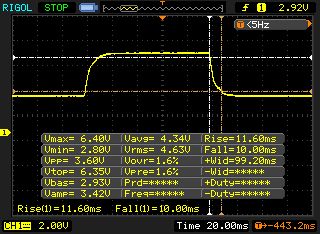 |
| ↘ 10 ms hösten | ||
| Skärmen visar bra svarsfrekvens i våra tester, men kan vara för långsam för konkurrenskraftiga spelare. I jämförelse sträcker sig alla testade enheter från 0.165 (minst) till 636 (maximalt) ms. » 34 % av alla enheter är bättre. Det betyder att den uppmätta svarstiden är bättre än genomsnittet av alla testade enheter (30.9 ms). | ||
Skärmflimmer / PWM (Puls-Width Modulation)
| Skärmflimmer / PWM upptäcktes inte | 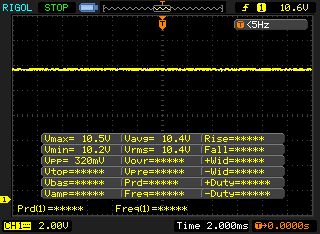 | ||
Som jämförelse: 52 % av alla testade enheter använder inte PWM för att dämpa skärmen. Om PWM upptäcktes mättes ett medelvärde av 7744 (minst: 5 - maximum: 343500) Hz. | |||
| PCMark 8 | |
| Home Score Accelerated v2 | |
| MSI GT75VR 7RF-012 Titan Pro | |
| Asus G752VS-BA338T | |
| Alienware 17 R4 | |
| Aorus X9 | |
| Acer Predator 17 G9-793-70PJ | |
| Work Score Accelerated v2 | |
| MSI GT75VR 7RF-012 Titan Pro | |
| Asus G752VS-BA338T | |
| Aorus X9 | |
| Alienware 17 R4 | |
| Acer Predator 17 G9-793-70PJ | |
| PCMark 10 - Score | |
| Aorus X9 | |
| MSI GT75VR 7RF-012 Titan Pro | |
| PCMark 8 Home Score Accelerated v2 | 5020 poäng | |
| PCMark 8 Work Score Accelerated v2 | 5240 poäng | |
| PCMark 10 Score | 5611 poäng | |
Hjälp | ||
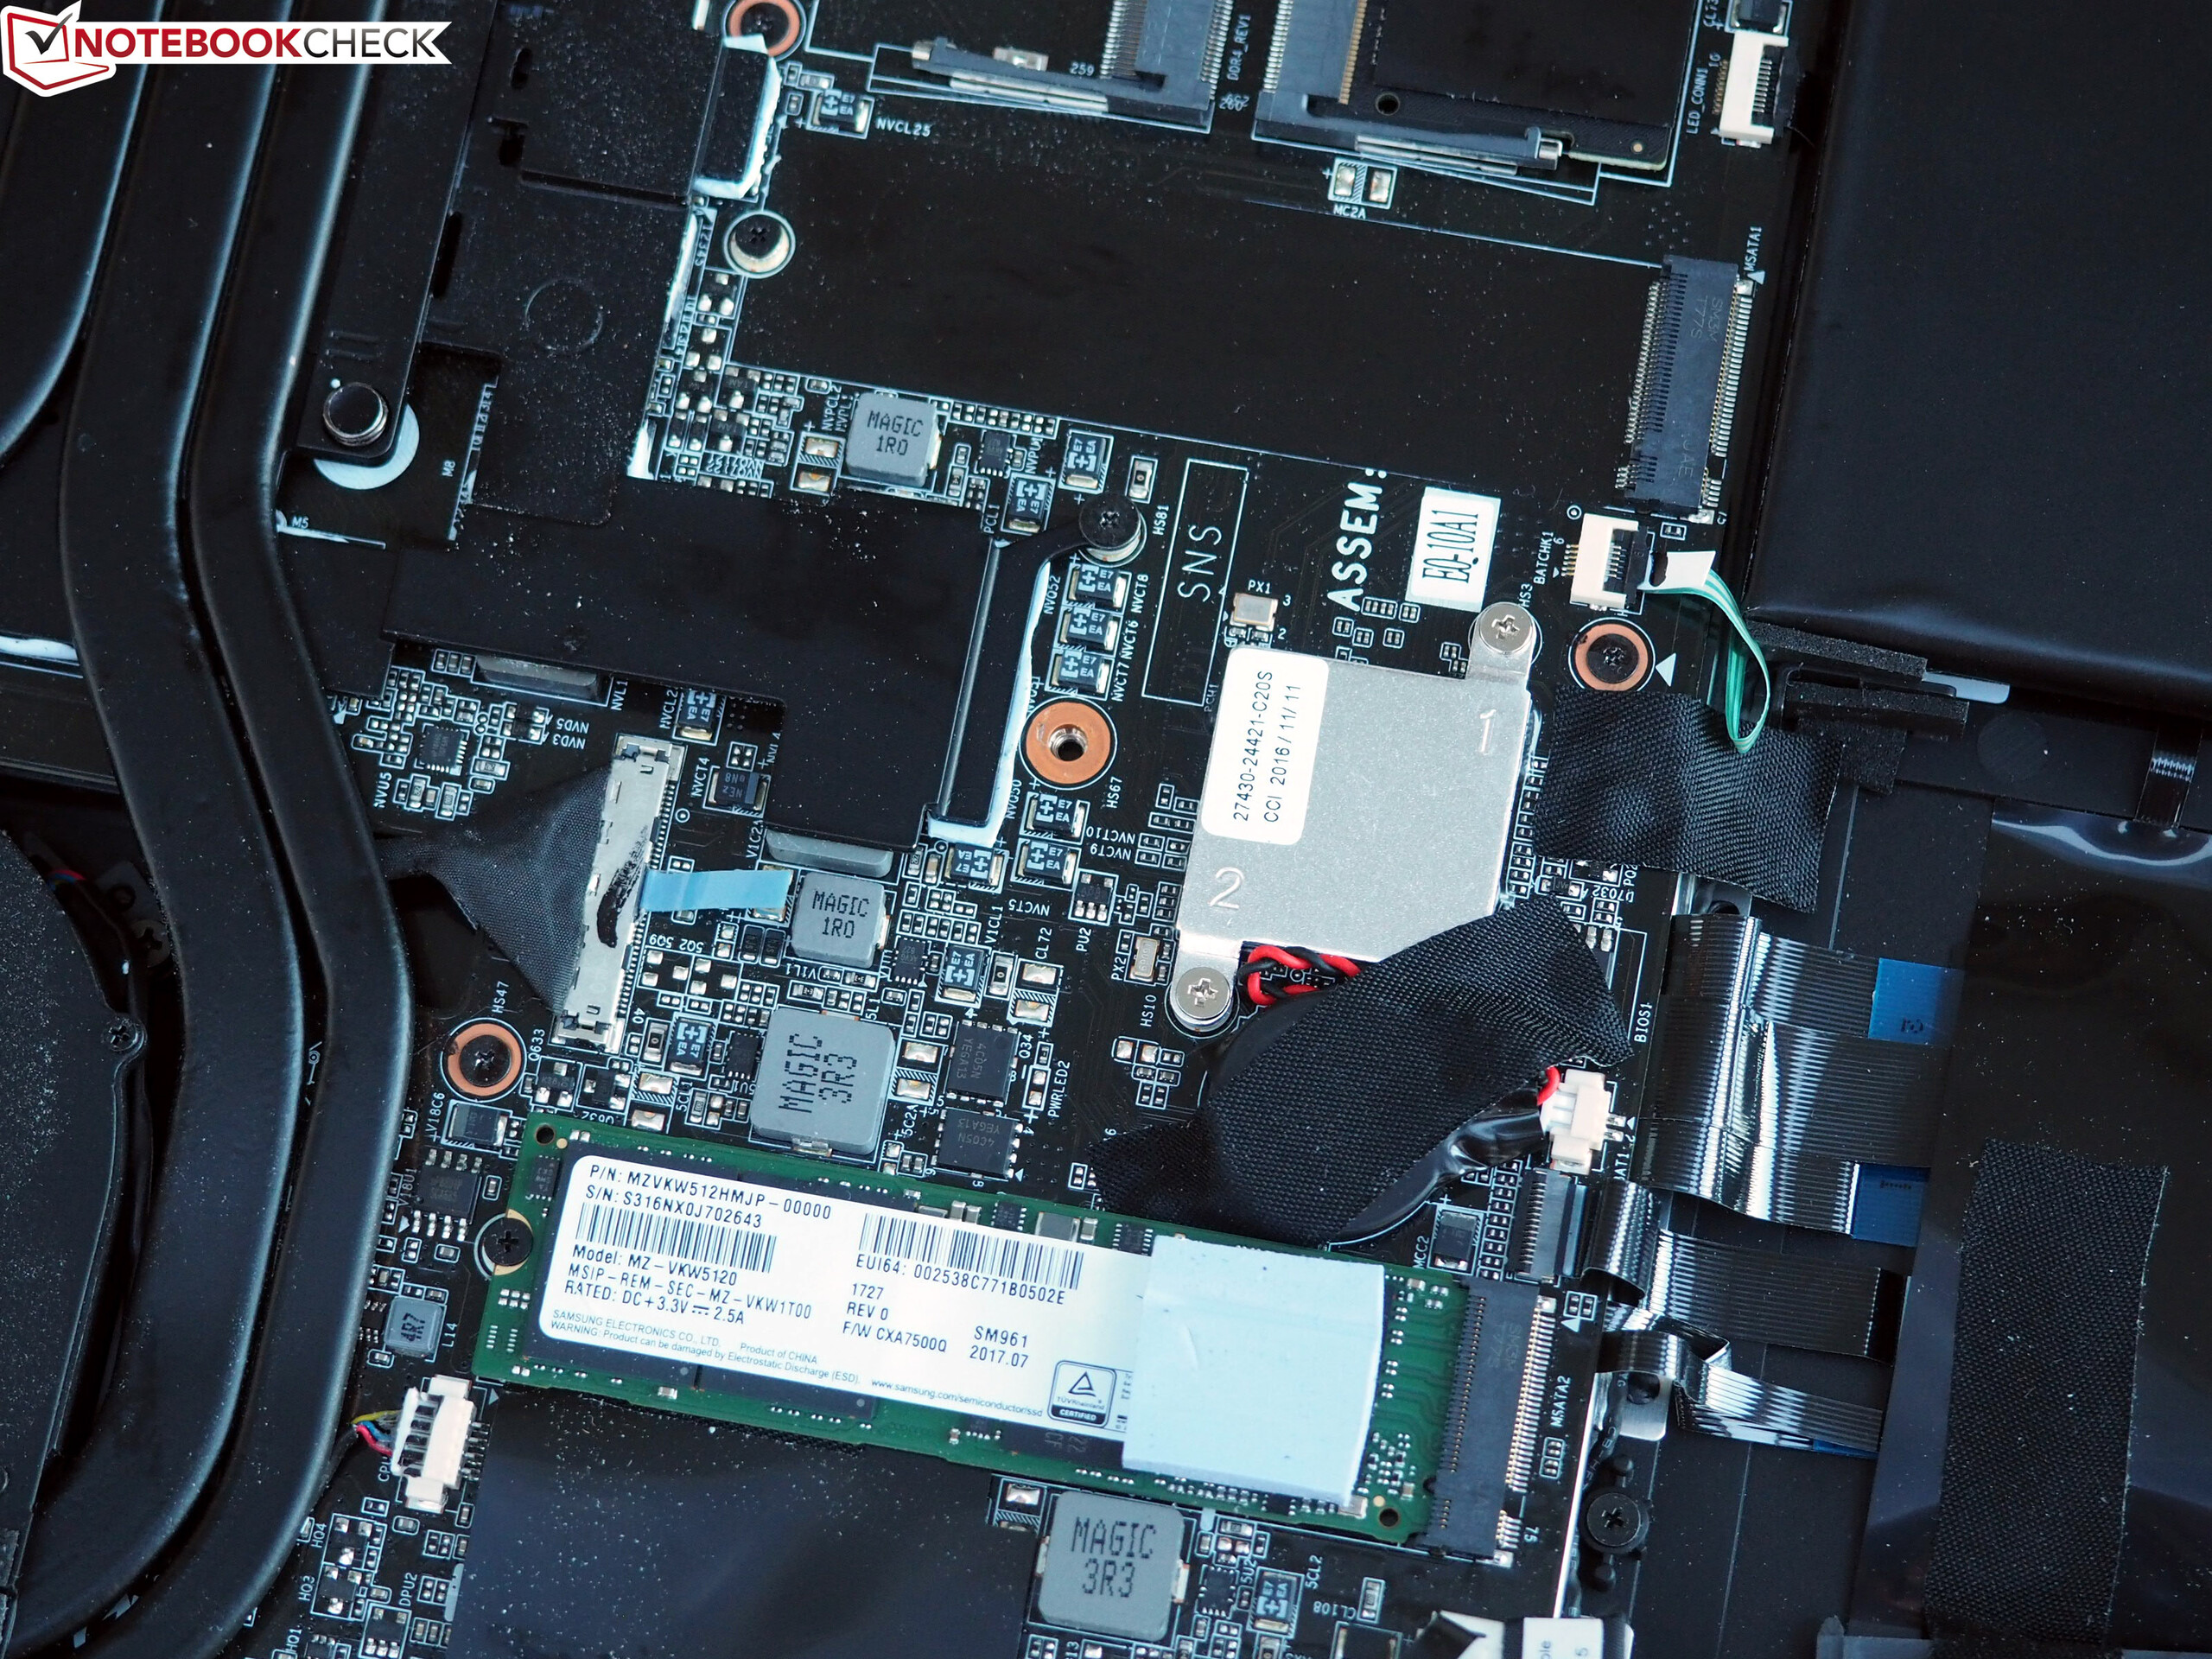
| Aorus X9 Samsung SM961 MZVKW512HMJP m.2 PCI-e | Alienware 17 R4 SK Hynix PC300 NVMe 512 GB | MSI GT75VR 7RF-012 Titan Pro 2x Samsung SM961 MZVPW256HEGL NVMe (RAID 0) | Asus G752VS-BA338T Samsung SM961 MZVKW512HMJP m.2 PCI-e | Acer Predator 17 G9-793-70PJ Toshiba NVMe THNSN5512GPU7 | |
|---|---|---|---|---|---|
| AS SSD | -72% | 1% | -11% | -26% | |
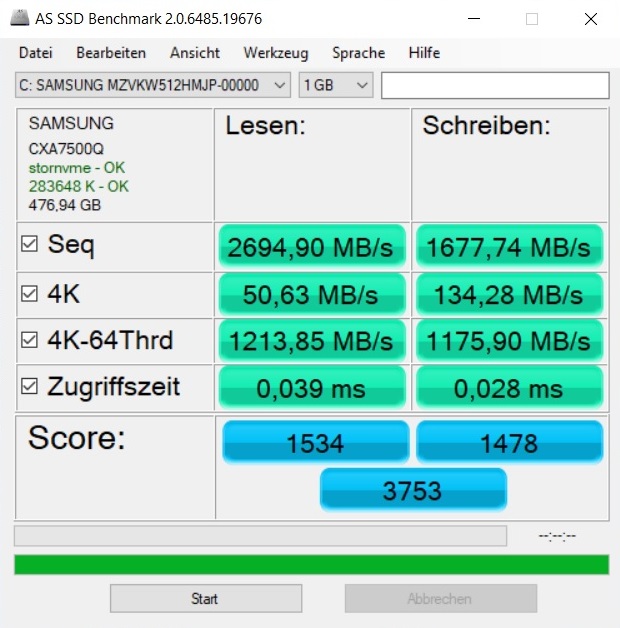
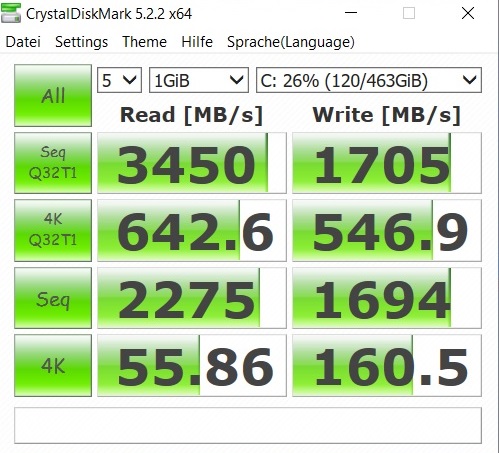
| Seq Read (MB/s) | 2695 | 1752 -35% | 3137 16% | 2824 5% | 2237 -17% |
| Seq Write (MB/s) | 1678 | 735 -56% | 2352 40% | 1554 -7% | 1230 -27% |
| 4K Read (MB/s) | 50.6 | 35.61 -30% | 50.1 -1% | 49.71 -2% | 37.51 -26% |
| 4K Write (MB/s) | 134.3 | 113.4 -16% | 128.8 -4% | 138.9 3% | 120.8 -10% |
| 4K-64 Read (MB/s) | 1214 | 620 -49% | 1048 -14% | 744 -39% | 851 -30% |
| 4K-64 Write (MB/s) | 1176 | 671 -43% | 925 -21% | 1185 1% | 646 -45% |
| Access Time Read * (ms) | 0.039 | 0.042 -8% | 0.041 -5% | 0.058 -49% | 0.052 -33% |
| Access Time Write * (ms) | 0.028 | 0.123 -339% | 0.029 -4% | 0.027 4% | 0.033 -18% |
* ... mindre är bättre

| 3DMark | |
| 2560x1440 Time Spy Graphics | |
| Aorus X9 | |
| MSI GT75VR 7RF-012 Titan Pro | |
| Asus G752VS-BA338T | |
| Acer Predator 17 G9-793-70PJ | |
| 1920x1080 Fire Strike Graphics | |
| Aorus X9 | |
| Alienware 17 R4 | |
| MSI GT75VR 7RF-012 Titan Pro | |
| Asus G752VS-BA338T | |
| Acer Predator 17 G9-793-70PJ | |
| 3DMark 11 - 1280x720 Performance GPU | |
| Aorus X9 | |
| MSI GT75VR 7RF-012 Titan Pro | |
| Alienware 17 R4 | |
| Asus G752VS-BA338T | |
| Acer Predator 17 G9-793-70PJ | |
| 3DMark 11 Performance | 23326 poäng | |
| 3DMark Ice Storm Standard Score | 166876 poäng | |
| 3DMark Cloud Gate Standard Score | 32510 poäng | |
| 3DMark Fire Strike Score | 20379 poäng | |
| 3DMark Time Spy Score | 8931 poäng | |
Hjälp | ||
| The Witcher 3 - 3840x2160 High Graphics & Postprocessing (Nvidia HairWorks Off) | |
| Aorus X9 | |
| Guru Mars K | |
| Schenker XMG U727 2017 | |
| Battlefield 1 - 3840x2160 High Preset AA:T | |
| Aorus X9 | |
| Schenker XMG U727 2017 | |
| Asus G752VS | |
| Titanfall 2 - 3840x2160 High / Enabled AA:TS AF:8x | |
| Aorus X9 | |
| Schenker XMG U727 2017 | |
| Asus G752VS | |
| Call of Duty Infinite Warfare - 3840x2160 High / On AA:FX | |
| Schenker XMG U727 2017 | |
| Aorus X9 | |
| Asus G752VS | |
| Dishonored 2 - 3840x2160 High Preset AA:TX | |
| Aorus X9 | |
| Schenker XMG U727 2017 | |
| Asus G752VS | |
| Watch Dogs 2 - 3840x2160 High Preset | |
| Aorus X9 | |
| Schenker XMG U727 2017 | |
| Asus G752VS | |
| Resident Evil 7 - 3840x2160 High / On AA:FXAA+T | |
| Schenker XMG U727 2017 | |
| Asus G752VS | |
| Aorus X9 | |
| For Honor - 3840x2160 High Preset AA:T AF:8x | |
| Aorus X9 | |
| Schenker XMG U727 2017 | |
| Asus G752VS | |
| Ghost Recon Wildlands - 3840x2160 Very High Preset AA:T AF:8x | |
| Aorus X9 | |
| Guru Mars K | |
| Asus G752VS | |
| Prey - 3840x2160 High Preset AA:2TX SM AF:8x | |
| Aorus X9 | |
| Guru Mars K | |
| Asus G752VS | |
| Rocket League - 3840x2160 High Quality AA:High FX | |
| Aorus X9 | |
| Guru Mars K | |
| Asus G752VS | |
| F1 2017 - 3840x2160 Ultra High Preset AA:T AF:16x | |
| Guru Mars K | |
| Asus G752VS | |
| Aorus X9 | |
| Ark Survival Evolved - 3840x2160 Epic Preset (100 % Resolution Scale) | |
| Aorus X9 | |
| Guru Mars K | |
| Asus G752VS | |
| FIFA 18 - 3840x2160 Ultra Preset | |
| Guru Mars K | |
| Aorus X9 | |
| Asus G752VS | |
| låg | med. | hög | ultra | 4K | |
|---|---|---|---|---|---|
| The Witcher 3 (2015) | 167 | 99.9 | 69.3 | ||
| Battlefield 1 (2016) | 143 | 129 | 74.1 | ||
| Titanfall 2 (2016) | 143 | 141 | 68.4 | ||
| Call of Duty Infinite Warfare (2016) | 122 | 111 | 58.6 | ||
| Dishonored 2 (2016) | 92.4 | 78.6 | 60 | ||
| Watch Dogs 2 (2016) | 111 | 90.9 | 59 | ||
| Resident Evil 7 (2017) | 146 | 123 | 42 | ||
| For Honor (2017) | 177 | 163 | 83.9 | ||
| Ghost Recon Wildlands (2017) | 112 | 68.8 | 53.1 | ||
| Prey (2017) | 140 | 137 | 79.1 | ||
| Rocket League (2017) | 219 | 141 | |||
| Dirt 4 (2017) | 115 | 70.4 | |||
| Playerunknown's Battlegrounds (PUBG) (2017) | 102 | 93.3 | 37.1 | ||
| F1 2017 (2017) | 132 | 89 | 42 | ||
| Ark Survival Evolved (2017) | 88.6 | 53 | 25.8 | ||
| FIFA 18 (2017) | 330 | 310 | 187 |
Ljudnivå
| Låg belastning |
| 35 / 37 / 43 dB(A) |
| Hög belastning |
| 49 / 60 dB(A) |
 | ||
30 dB tyst 40 dB(A) hörbar 50 dB(A) högt ljud |
||
min: | ||
| Aorus X9 GeForce GTX 1070 SLI (Laptop), i7-7820HK | Alienware 17 R4 GeForce GTX 1080 Mobile, i7-7820HK | MSI GT75VR 7RF-012 Titan Pro GeForce GTX 1080 Mobile, i7-7820HK | Asus G752VS-BA338T GeForce GTX 1070 Mobile, i7-7700HQ | Acer Predator 17 G9-793-70PJ GeForce GTX 1070 Mobile, i7-7700HQ | |
|---|---|---|---|---|---|
| Noise | 7% | 5% | 14% | 11% | |
| av / miljö * (dB) | 30 | 28.2 6% | 30 -0% | 30 -0% | 31 -3% |
| Idle Minimum * (dB) | 35 | 35.6 -2% | 33 6% | 30 14% | 32 9% |
| Idle Average * (dB) | 37 | 35.6 4% | 34 8% | 32 14% | 35 5% |
| Idle Maximum * (dB) | 43 | 35.7 17% | 38 12% | 36 16% | 38 12% |
| Load Average * (dB) | 49 | 50.2 -2% | 44 10% | 43 12% | 42 14% |
| Witcher 3 ultra * (dB) | 56 | 50.2 10% | 56 -0% | 43 23% | 44 21% |
| Load Maximum * (dB) | 60 | 50.2 16% | 62 -3% | 49 18% | 50 17% |
* ... mindre är bättre
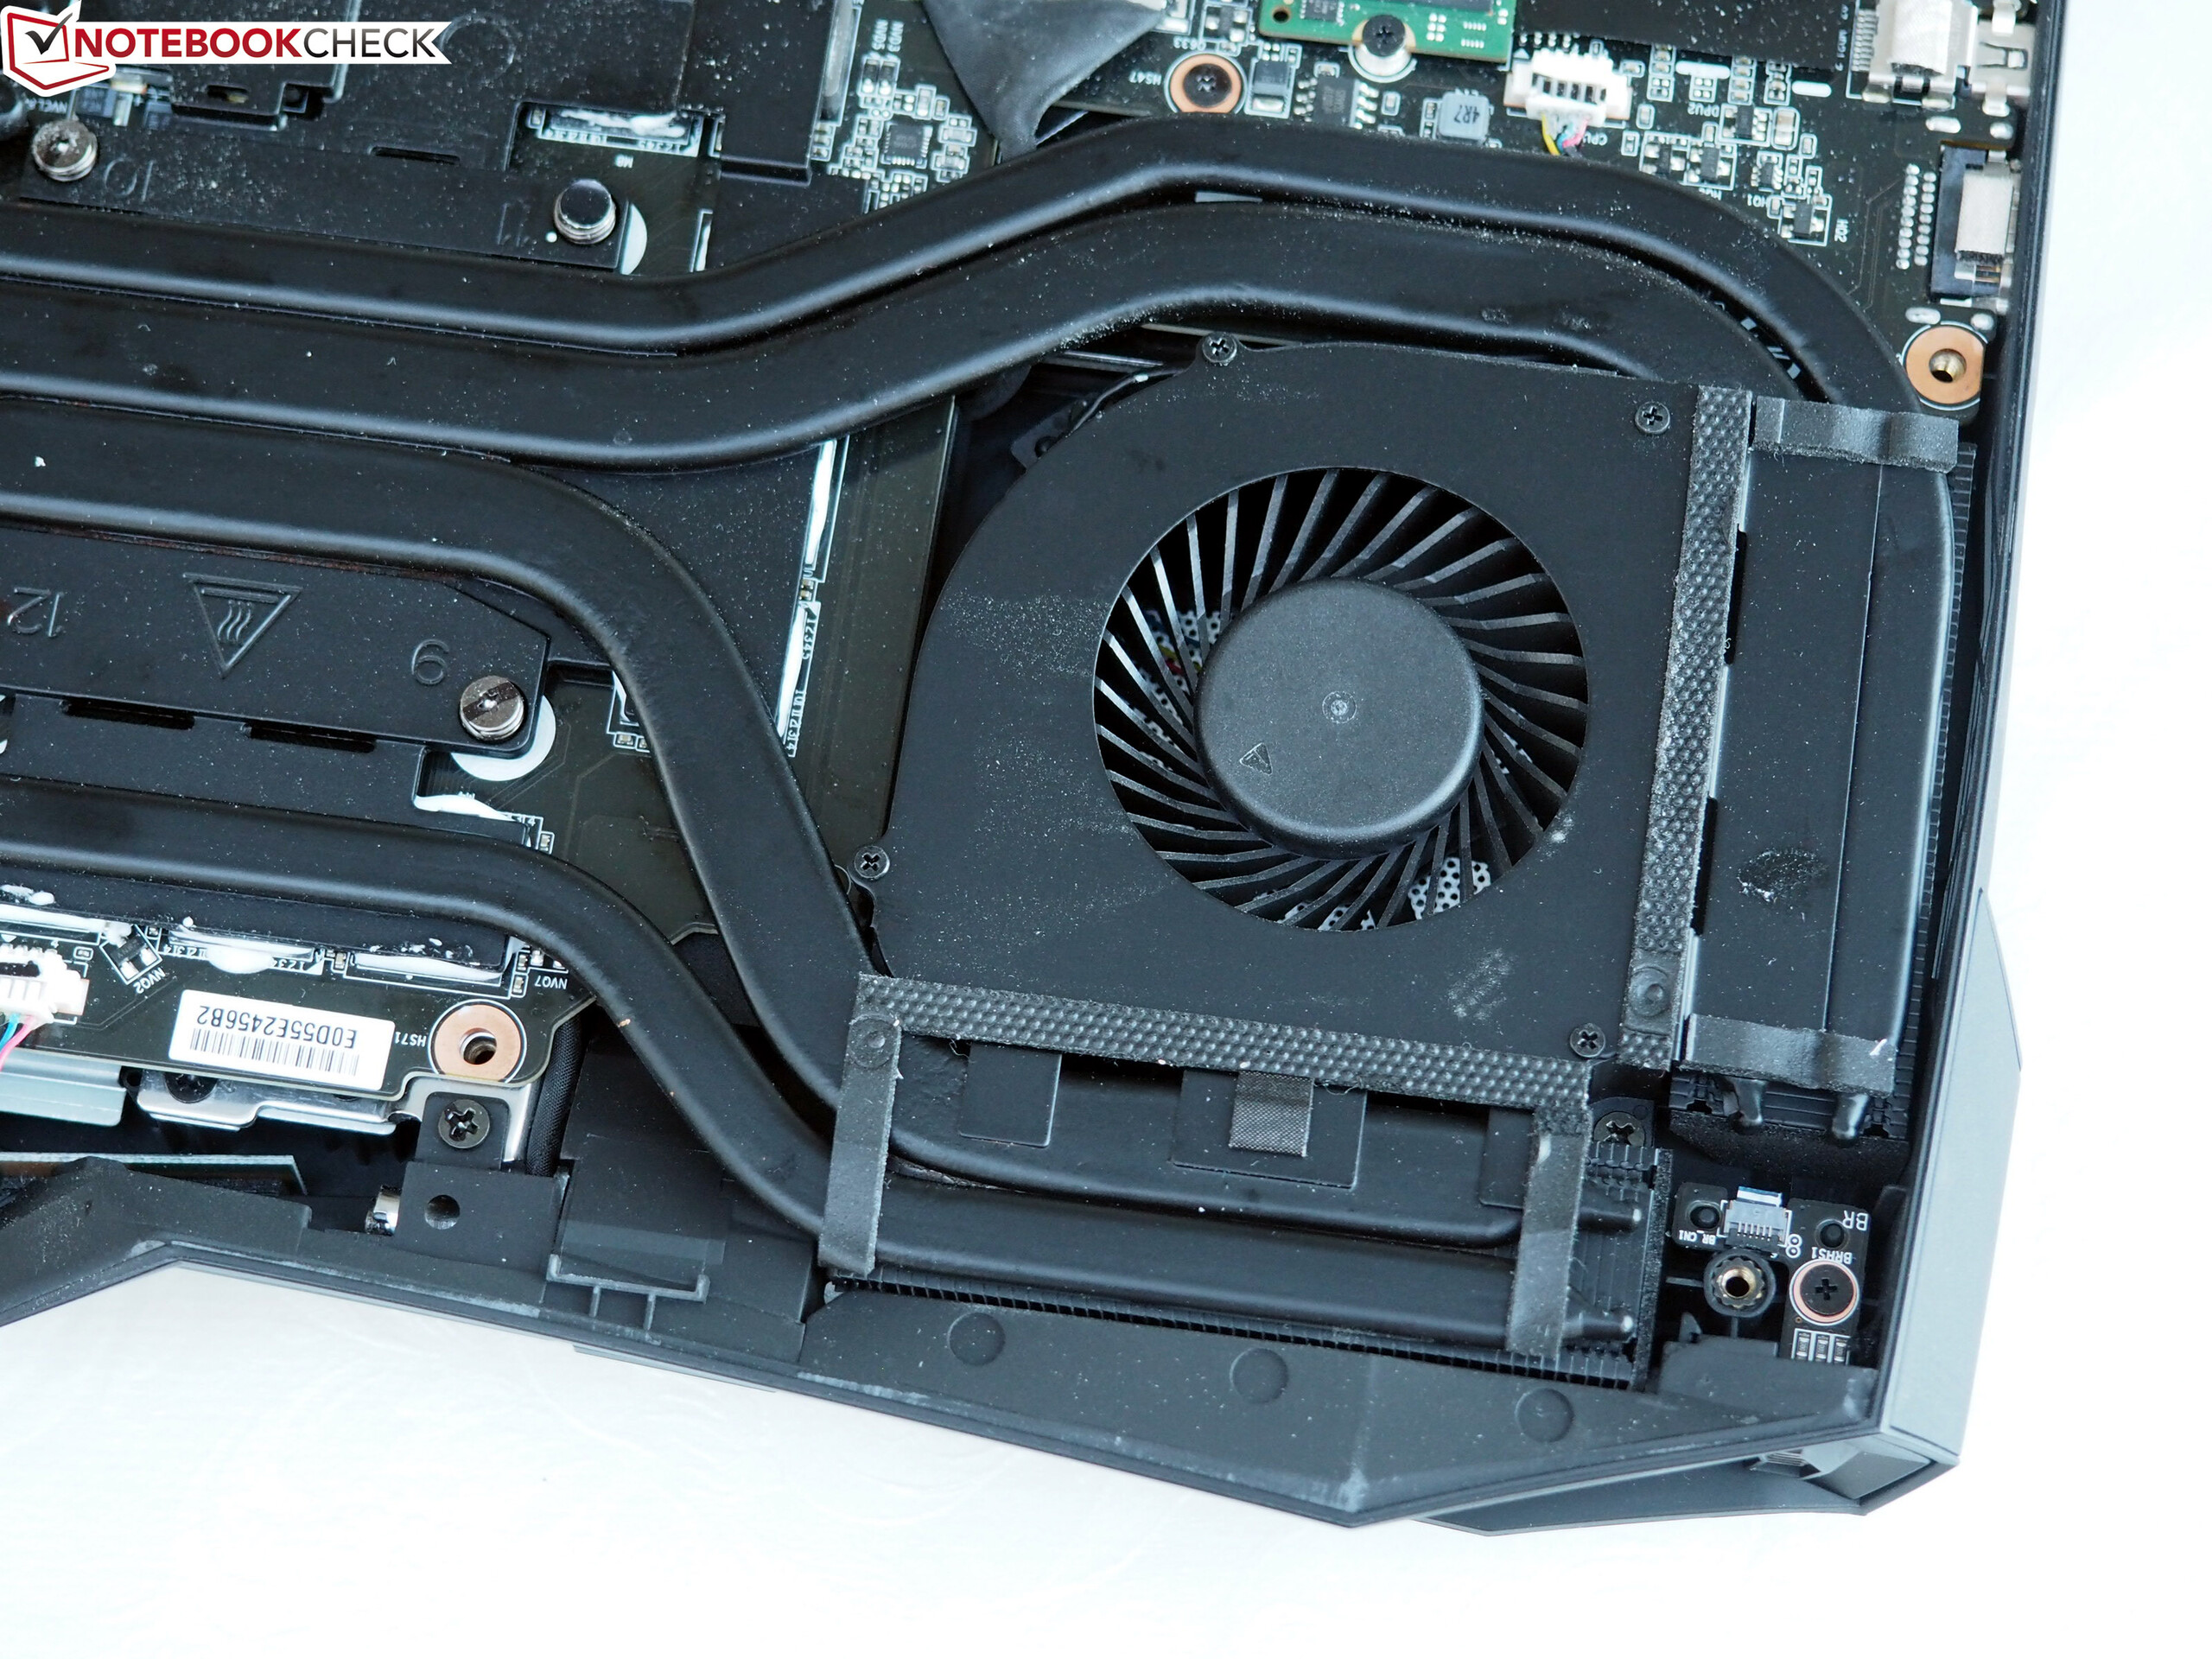
(-) Den maximala temperaturen på ovansidan är 47 °C / 117 F, jämfört med genomsnittet av 40.4 °C / 105 F , allt från 21.2 till 68.8 °C för klassen Gaming.
(-) Botten värms upp till maximalt 62 °C / 144 F, jämfört med genomsnittet av 43.2 °C / 110 F
(+) Vid tomgångsbruk är medeltemperaturen för ovansidan 27.3 °C / 81 F, jämfört med enhetsgenomsnittet på 33.9 °C / ### class_avg_f### F.
(-) När du spelar The Witcher 3 är medeltemperaturen för ovansidan 42.1 °C / 108 F, jämfört med enhetsgenomsnittet på 33.9 °C / ## #class_avg_f### F.
(-) Handledsstöden och pekplattan kan bli väldigt varma vid beröring med maximalt 44 °C / 111.2 F.
(-) Medeltemperaturen för handledsstödsområdet på liknande enheter var 28.8 °C / 83.8 F (-15.2 °C / -27.4 F).
| Aorus X9 GeForce GTX 1070 SLI (Laptop), i7-7820HK | Alienware 17 R4 GeForce GTX 1080 Mobile, i7-7820HK | MSI GT75VR 7RF-012 Titan Pro GeForce GTX 1080 Mobile, i7-7820HK | Asus G752VS-BA338T GeForce GTX 1070 Mobile, i7-7700HQ | Acer Predator 17 G9-793-70PJ GeForce GTX 1070 Mobile, i7-7700HQ | |
|---|---|---|---|---|---|
| Heat | 2% | -5% | 16% | 17% | |
| Maximum Upper Side * (°C) | 47 | 49.6 -6% | 46 2% | 41 13% | 39.1 17% |
| Maximum Bottom * (°C) | 62 | 56 10% | 57 8% | 39.3 37% | 42.1 32% |
| Idle Upper Side * (°C) | 30 | 29.6 1% | 34 -13% | 28.8 4% | 27.9 7% |
| Idle Bottom * (°C) | 30 | 29.2 3% | 35 -17% | 27.3 9% | 26.1 13% |
* ... mindre är bättre
Aorus X9 ljudanalys
(±) | högtalarljudstyrkan är genomsnittlig men bra (81 dB)
Bas 100 - 315 Hz
(±) | reducerad bas - i genomsnitt 13% lägre än medianen
(±) | linjäriteten för basen är genomsnittlig (9.9% delta till föregående frekvens)
Mellan 400 - 2000 Hz
(+) | balanserad mellan - endast 2.6% från medianen
(+) | mids är linjära (4.5% delta till föregående frekvens)
Högsta 2 - 16 kHz
(+) | balanserade toppar - endast 4.3% från medianen
(+) | toppar är linjära (6.5% delta till föregående frekvens)
Totalt 100 - 16 000 Hz
(+) | det totala ljudet är linjärt (14.2% skillnad mot median)
Jämfört med samma klass
» 25% av alla testade enheter i den här klassen var bättre, 7% liknande, 68% sämre
» Den bästa hade ett delta på 6%, genomsnittet var 18%, sämst var 132%
Jämfört med alla testade enheter
» 17% av alla testade enheter var bättre, 4% liknande, 79% sämre
» Den bästa hade ett delta på 4%, genomsnittet var 23%, sämst var 134%
Alienware 17 R4 ljudanalys
(±) | högtalarljudstyrkan är genomsnittlig men bra (75 dB)
Bas 100 - 315 Hz
(-) | nästan ingen bas - i genomsnitt 15.3% lägre än medianen
(±) | linjäriteten för basen är genomsnittlig (9.6% delta till föregående frekvens)
Mellan 400 - 2000 Hz
(±) | högre mellan - i genomsnitt 5.5% högre än median
(±) | linjäriteten för mids är genomsnittlig (8.9% delta till föregående frekvens)
Högsta 2 - 16 kHz
(±) | högre toppar - i genomsnitt 5.1% högre än medianen
(±) | linjäriteten för toppar är genomsnittlig (9.7% delta till föregående frekvens)
Totalt 100 - 16 000 Hz
(±) | linjäriteten för det totala ljudet är genomsnittlig (22.4% skillnad mot median)
Jämfört med samma klass
» 80% av alla testade enheter i den här klassen var bättre, 6% liknande, 14% sämre
» Den bästa hade ett delta på 6%, genomsnittet var 18%, sämst var 132%
Jämfört med alla testade enheter
» 66% av alla testade enheter var bättre, 6% liknande, 29% sämre
» Den bästa hade ett delta på 4%, genomsnittet var 23%, sämst var 134%
| Av/Standby | |
| Låg belastning | |
| Hög belastning |
|
Förklaring:
min: | |
| Aorus X9 GeForce GTX 1070 SLI (Laptop), i7-7820HK | Alienware 17 R4 GeForce GTX 1080 Mobile, i7-7820HK | MSI GT75VR 7RF-012 Titan Pro GeForce GTX 1080 Mobile, i7-7820HK | Asus G752VS-BA338T GeForce GTX 1070 Mobile, i7-7700HQ | Acer Predator 17 G9-793-70PJ GeForce GTX 1070 Mobile, i7-7700HQ | |
|---|---|---|---|---|---|
| Power Consumption | 7% | -2% | 33% | 23% | |
| Idle Minimum * (Watt) | 29 | 37.5 -29% | 34 -17% | 21 28% | 23 21% |
| Idle Average * (Watt) | 35 | 37.6 -7% | 41 -17% | 27 23% | 33 6% |
| Idle Maximum * (Watt) | 42 | 37.6 10% | 50 -19% | 32 24% | 40 5% |
| Load Average * (Watt) | 140 | 122.4 13% | 106 24% | 86 39% | 94 33% |
| Witcher 3 ultra * (Watt) | 295 | 180.3 39% | 257 13% | 165 44% | 177 40% |
| Load Maximum * (Watt) | 334 | 277.4 17% | 320 4% | 206 38% | 228 32% |
* ... mindre är bättre
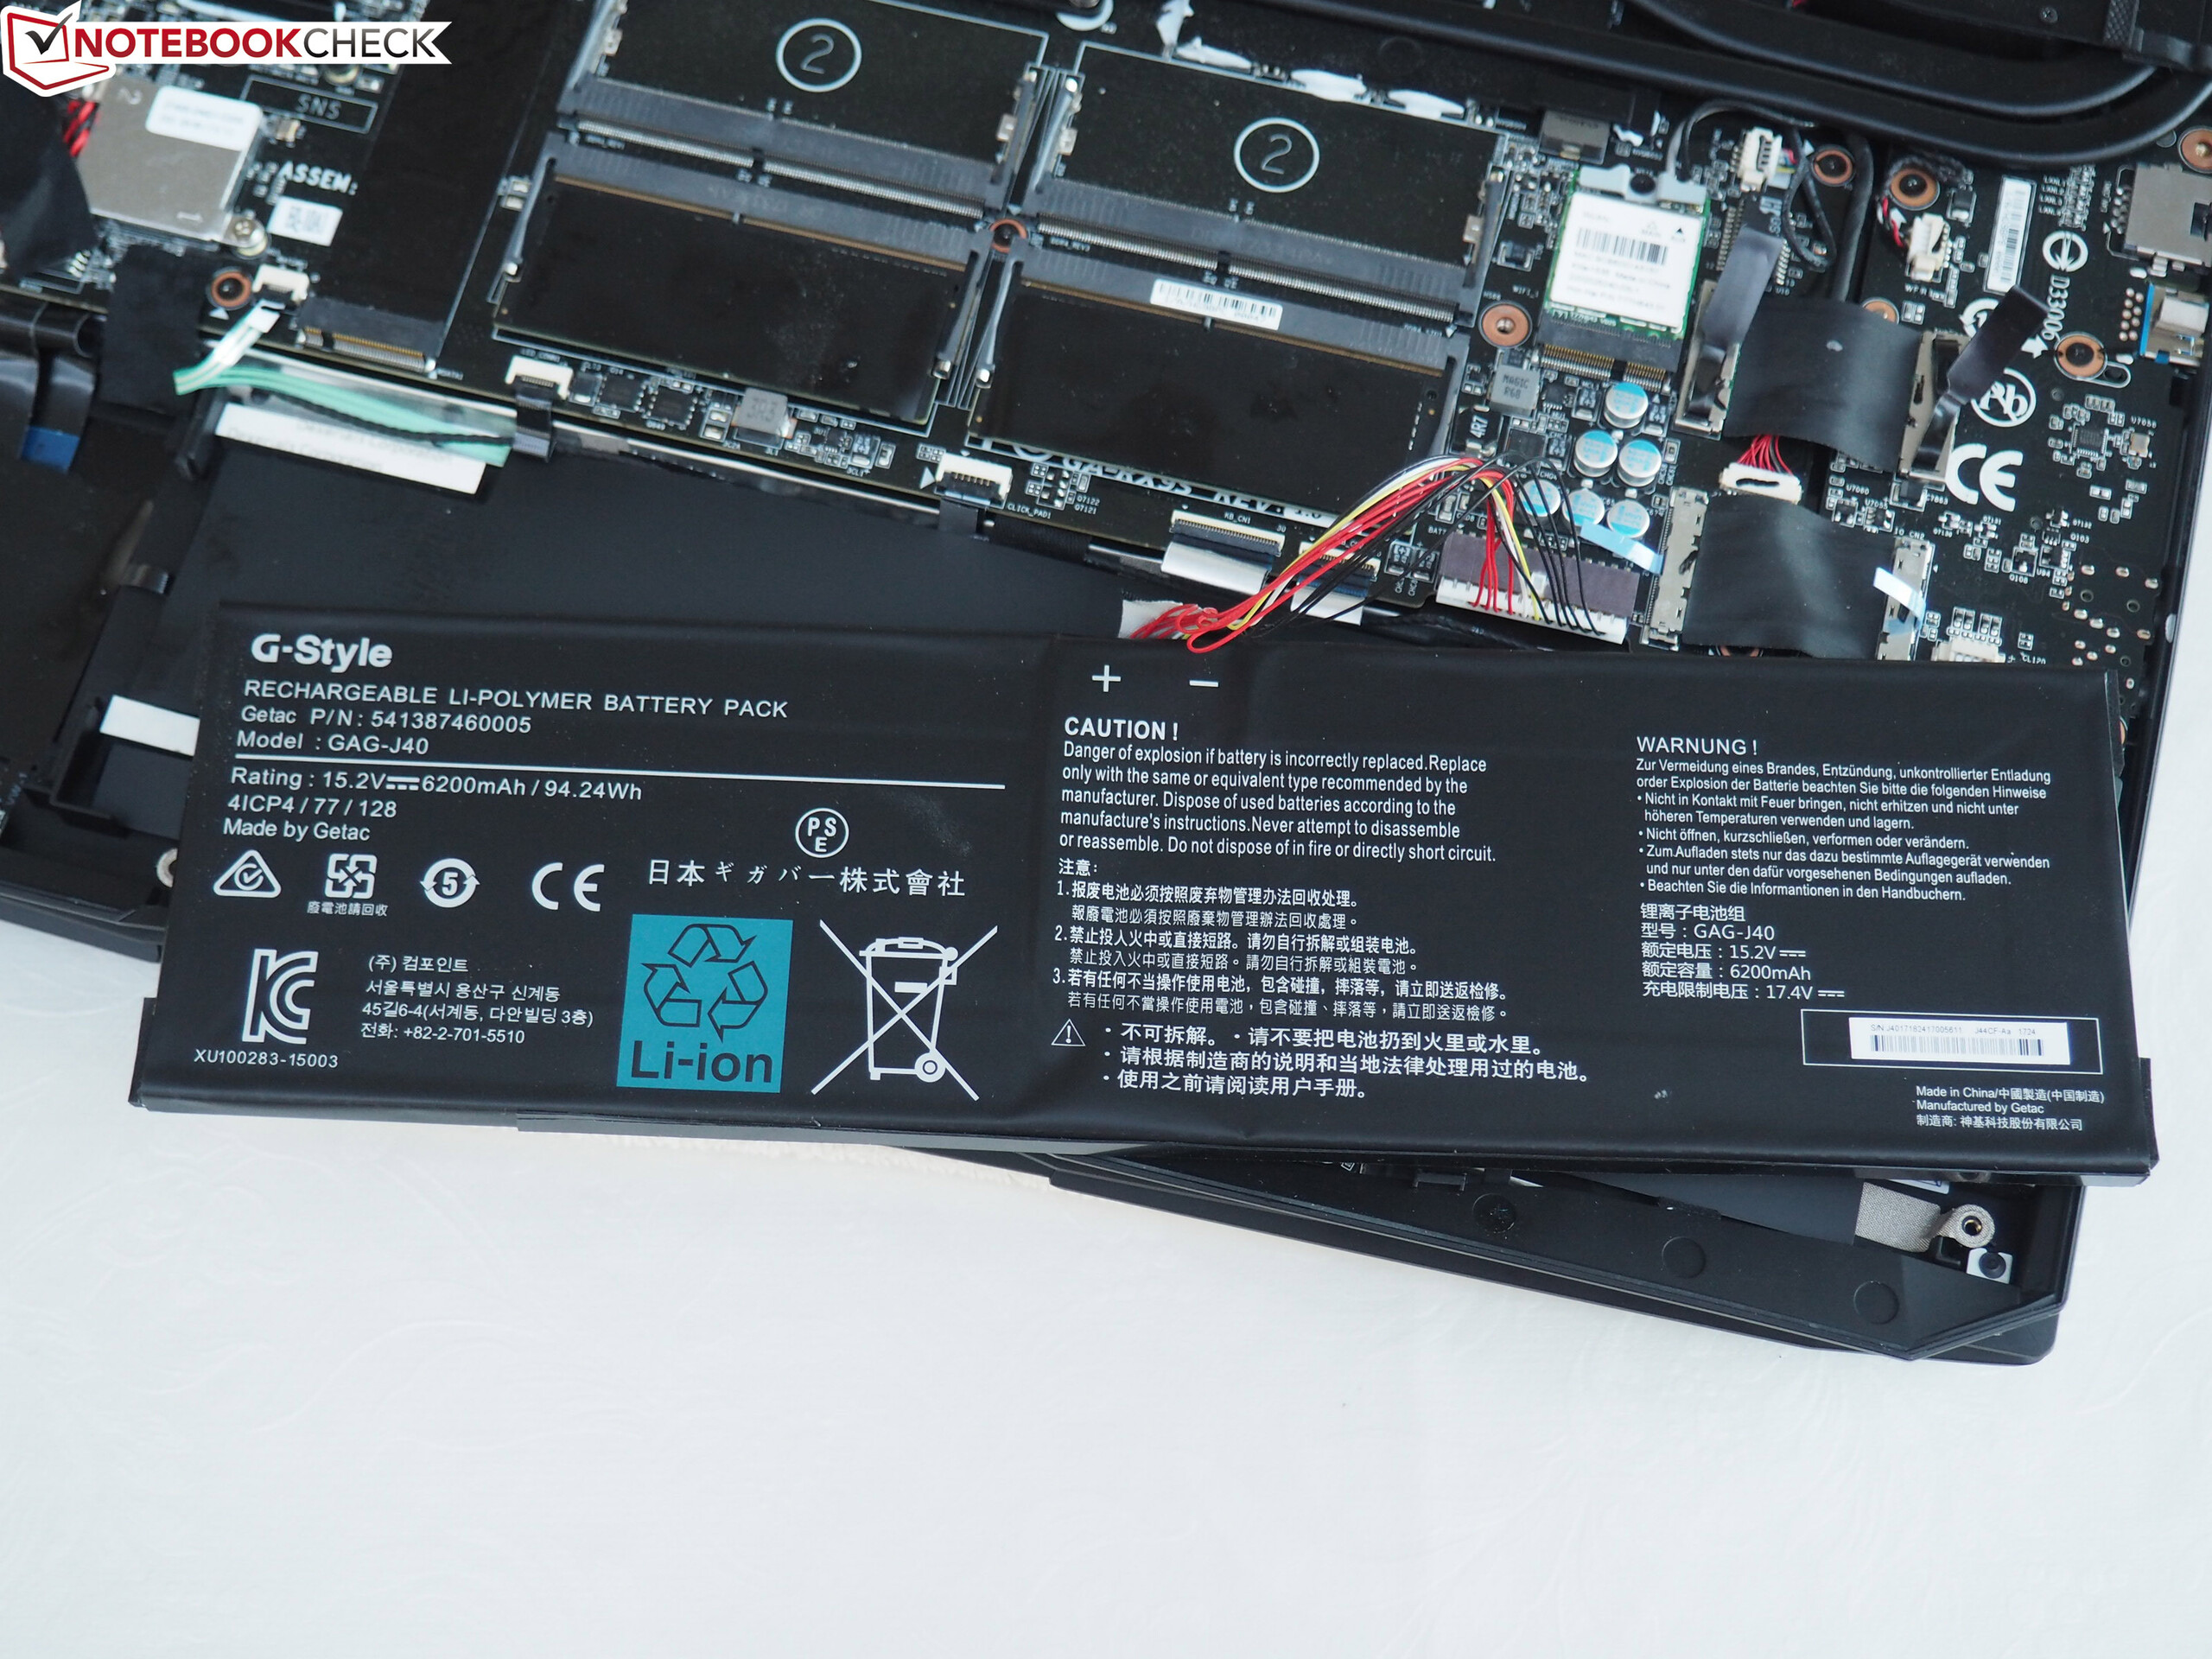
| Aorus X9 i7-7820HK, GeForce GTX 1070 SLI (Laptop), 94.24 Wh | Alienware 17 R4 i7-7820HK, GeForce GTX 1080 Mobile, 99 Wh | MSI GT75VR 7RF-012 Titan Pro i7-7820HK, GeForce GTX 1080 Mobile, 75 Wh | Asus G752VS-BA338T i7-7700HQ, GeForce GTX 1070 Mobile, 90 Wh | Acer Predator 17 G9-793-70PJ i7-7700HQ, GeForce GTX 1070 Mobile, 88 Wh | |
|---|---|---|---|---|---|
| Batteridrifttid | 32% | 3% | 100% | 58% | |
| Reader / Idle (h) | 2.9 | 4.6 59% | 3 3% | 7.4 155% | 5.4 86% |
| H.264 (h) | 2.3 | 2.5 9% | 4.3 87% | ||
| WiFi v1.3 (h) | 2.2 | 3 36% | 2.4 9% | 4.9 123% | 3.6 64% |
| Load (h) | 1.2 | 1.2 0% | 1.1 -8% | 1.6 33% | 1.5 25% |
För
Emot
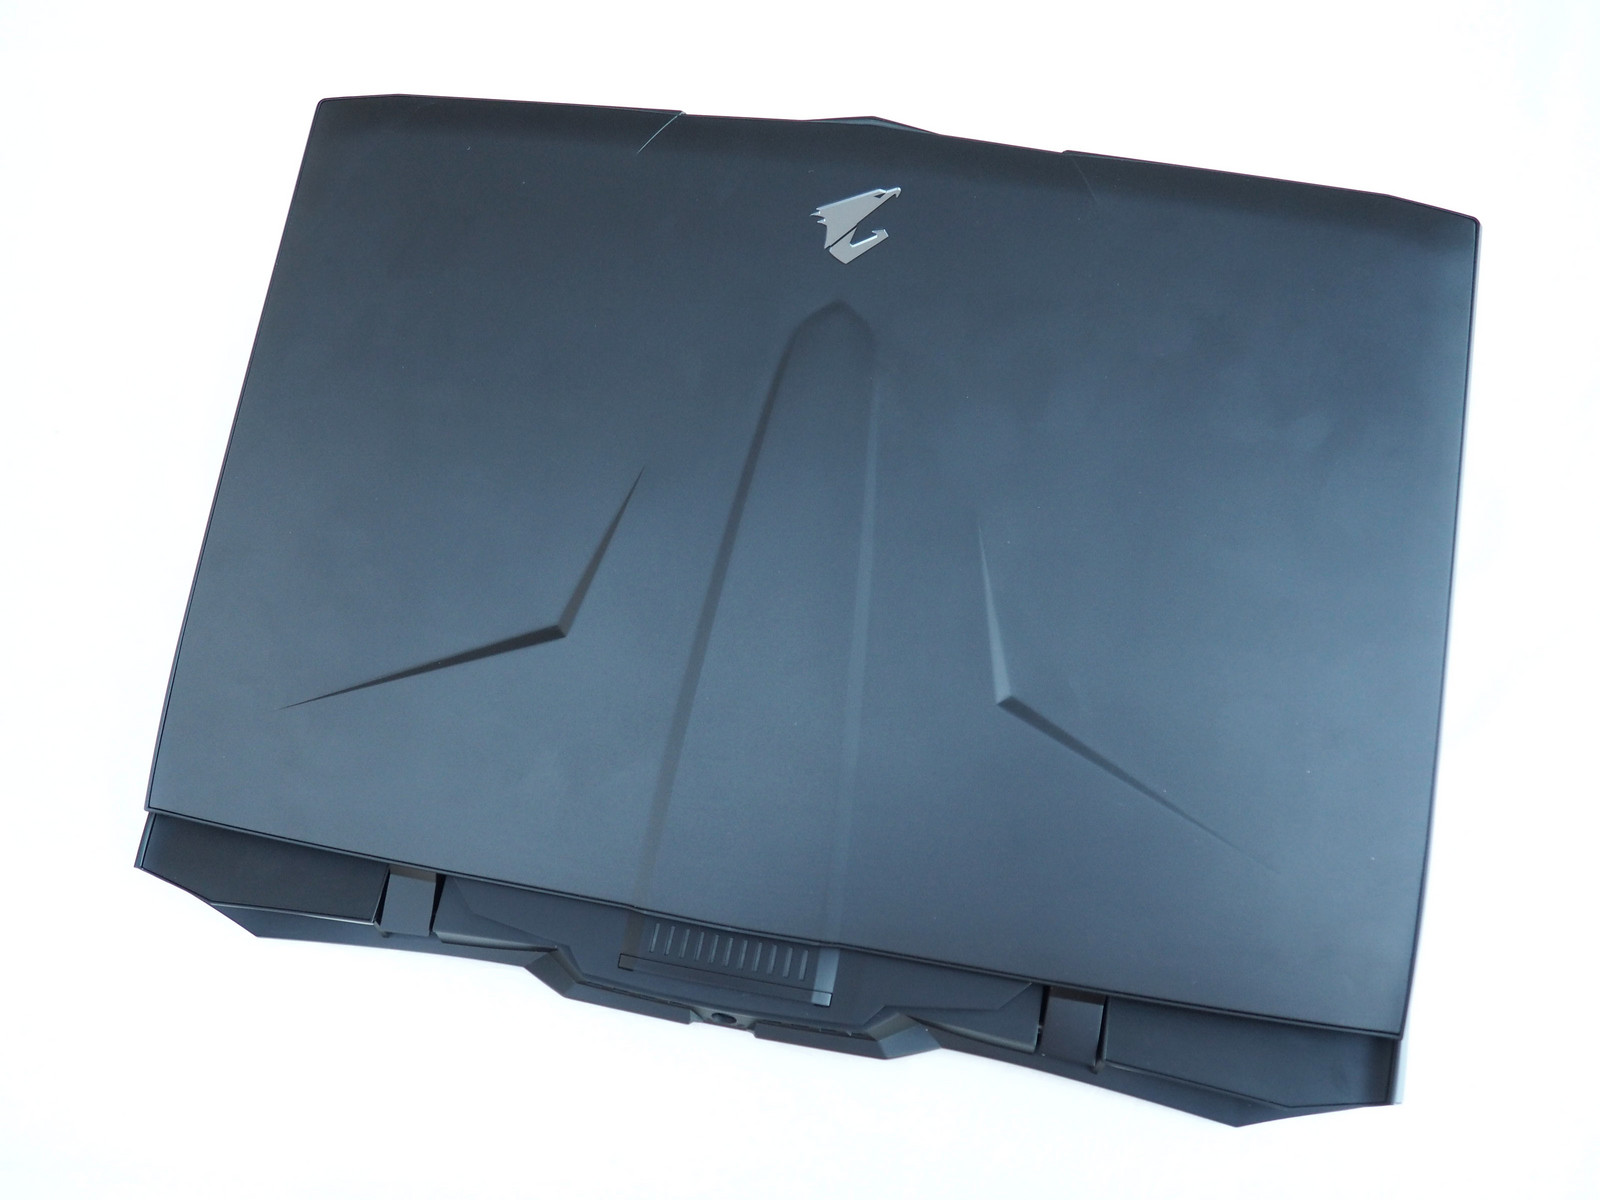
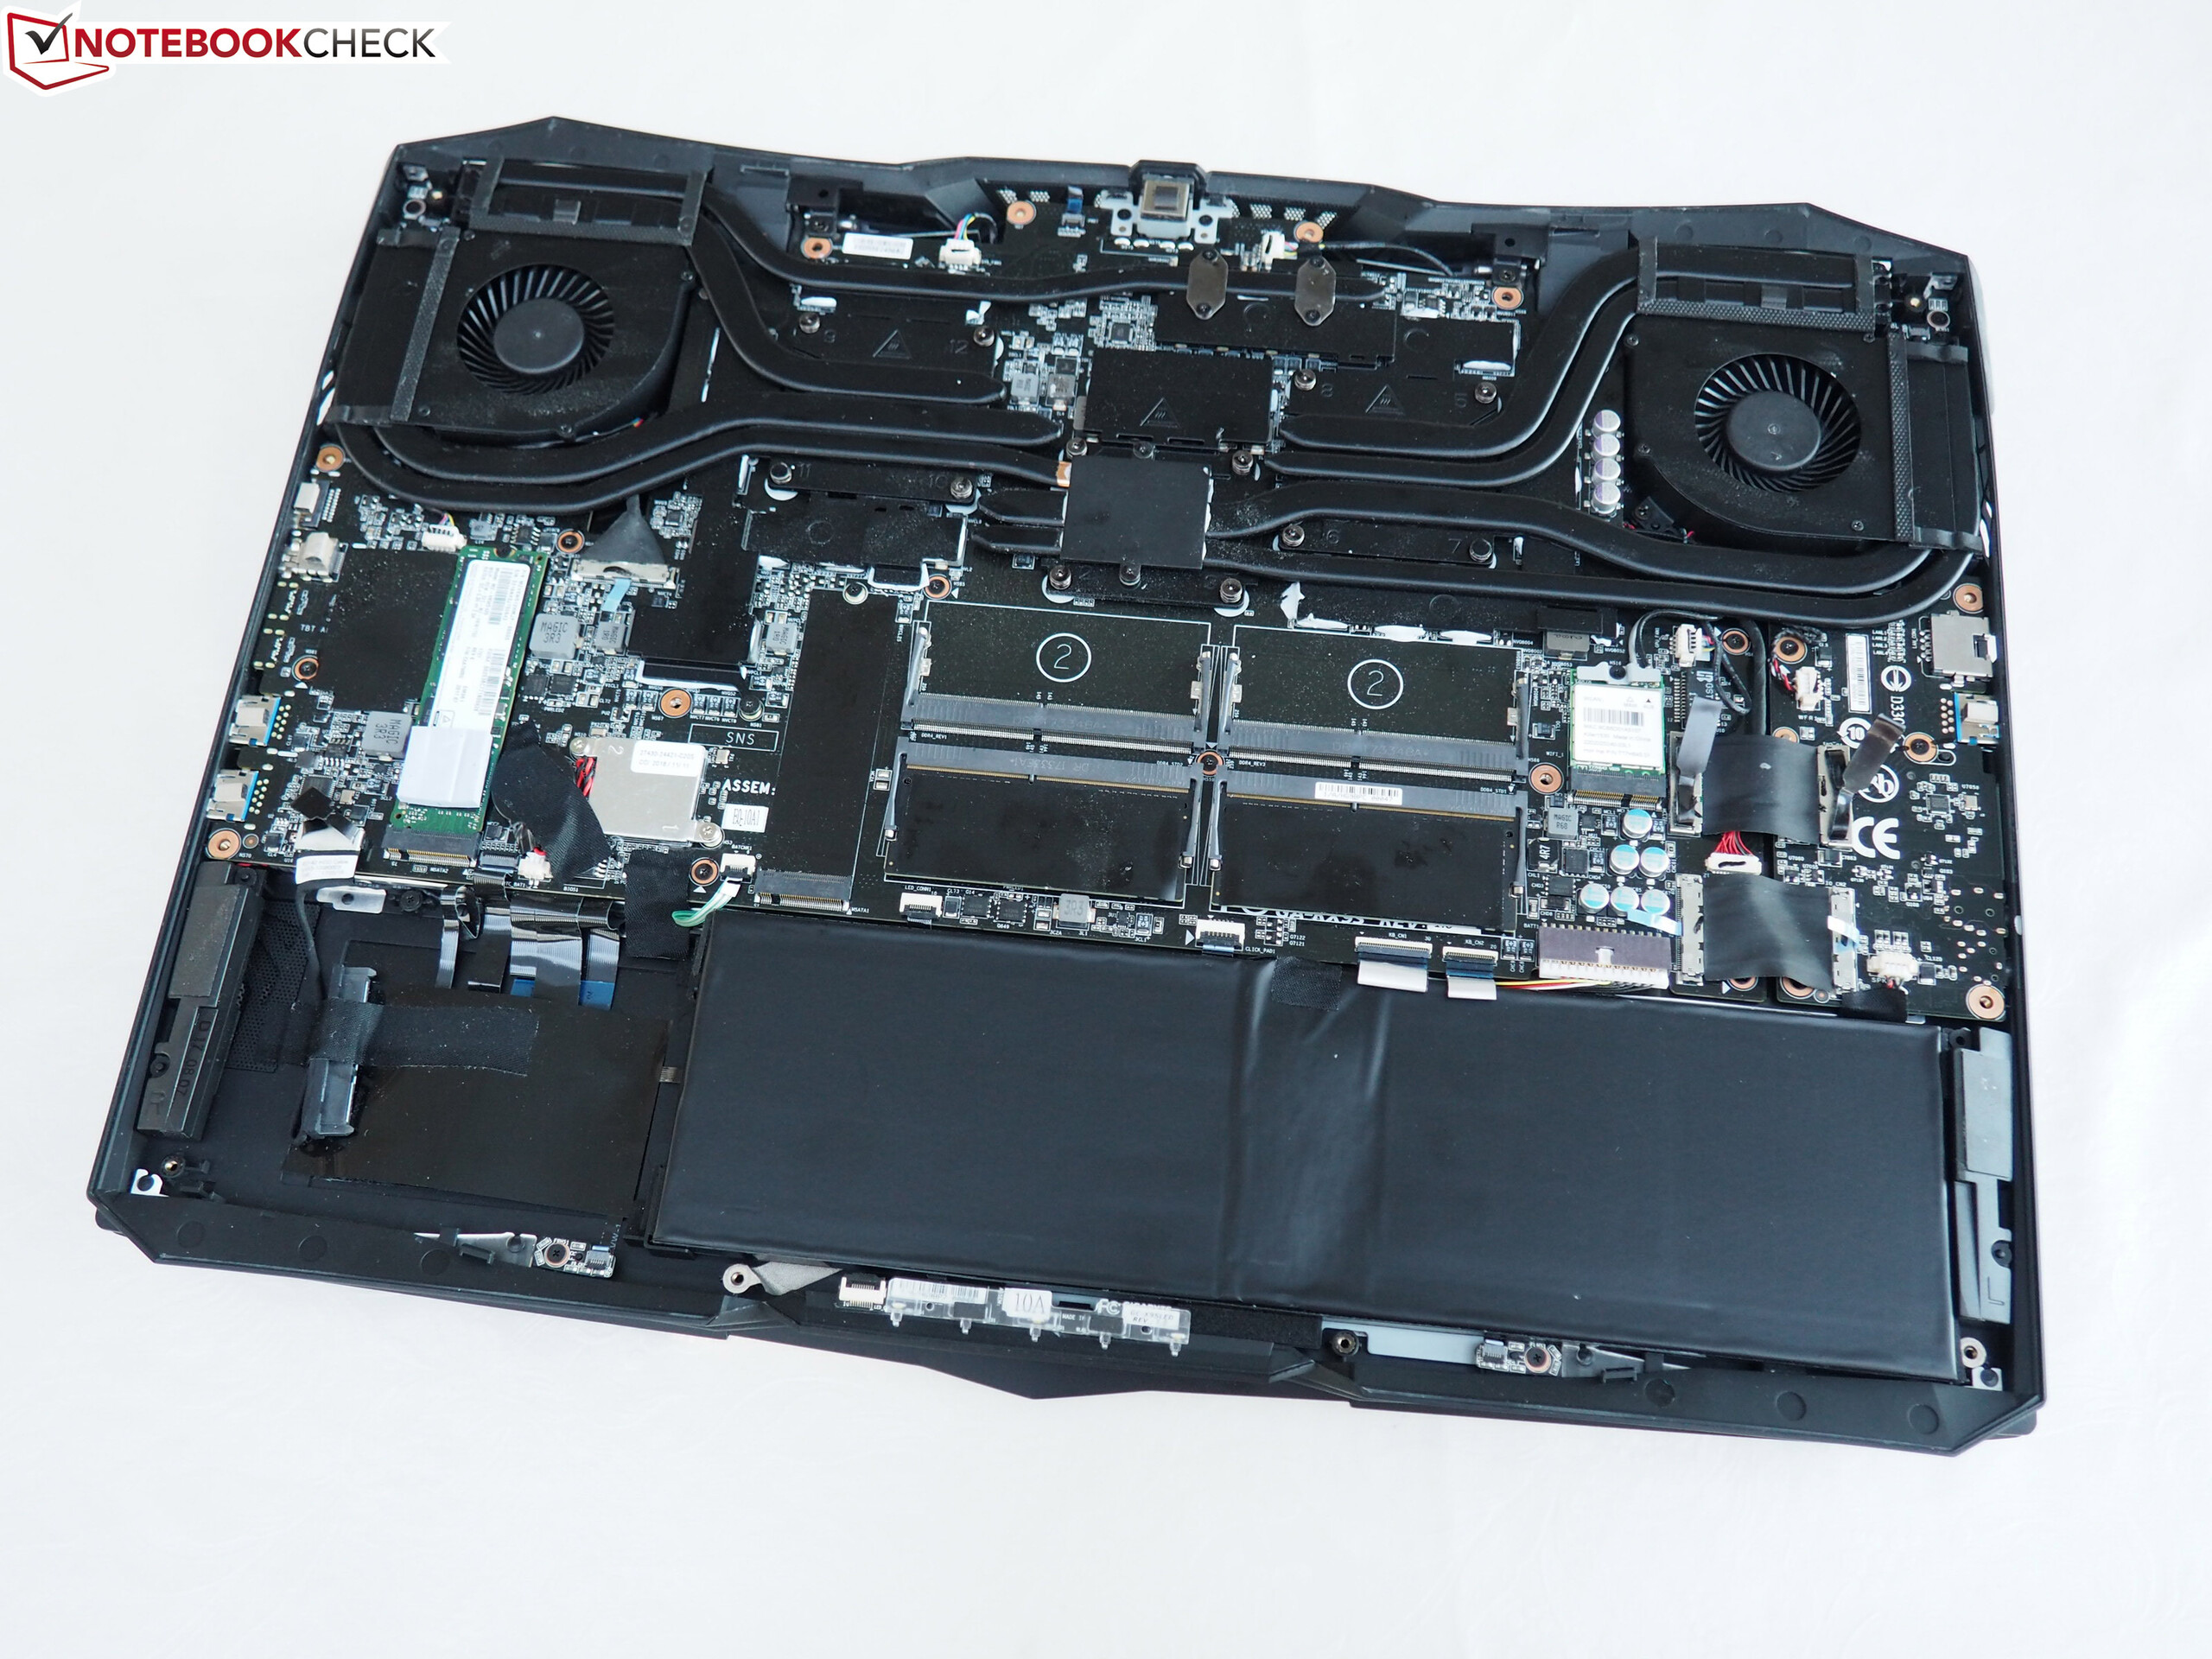
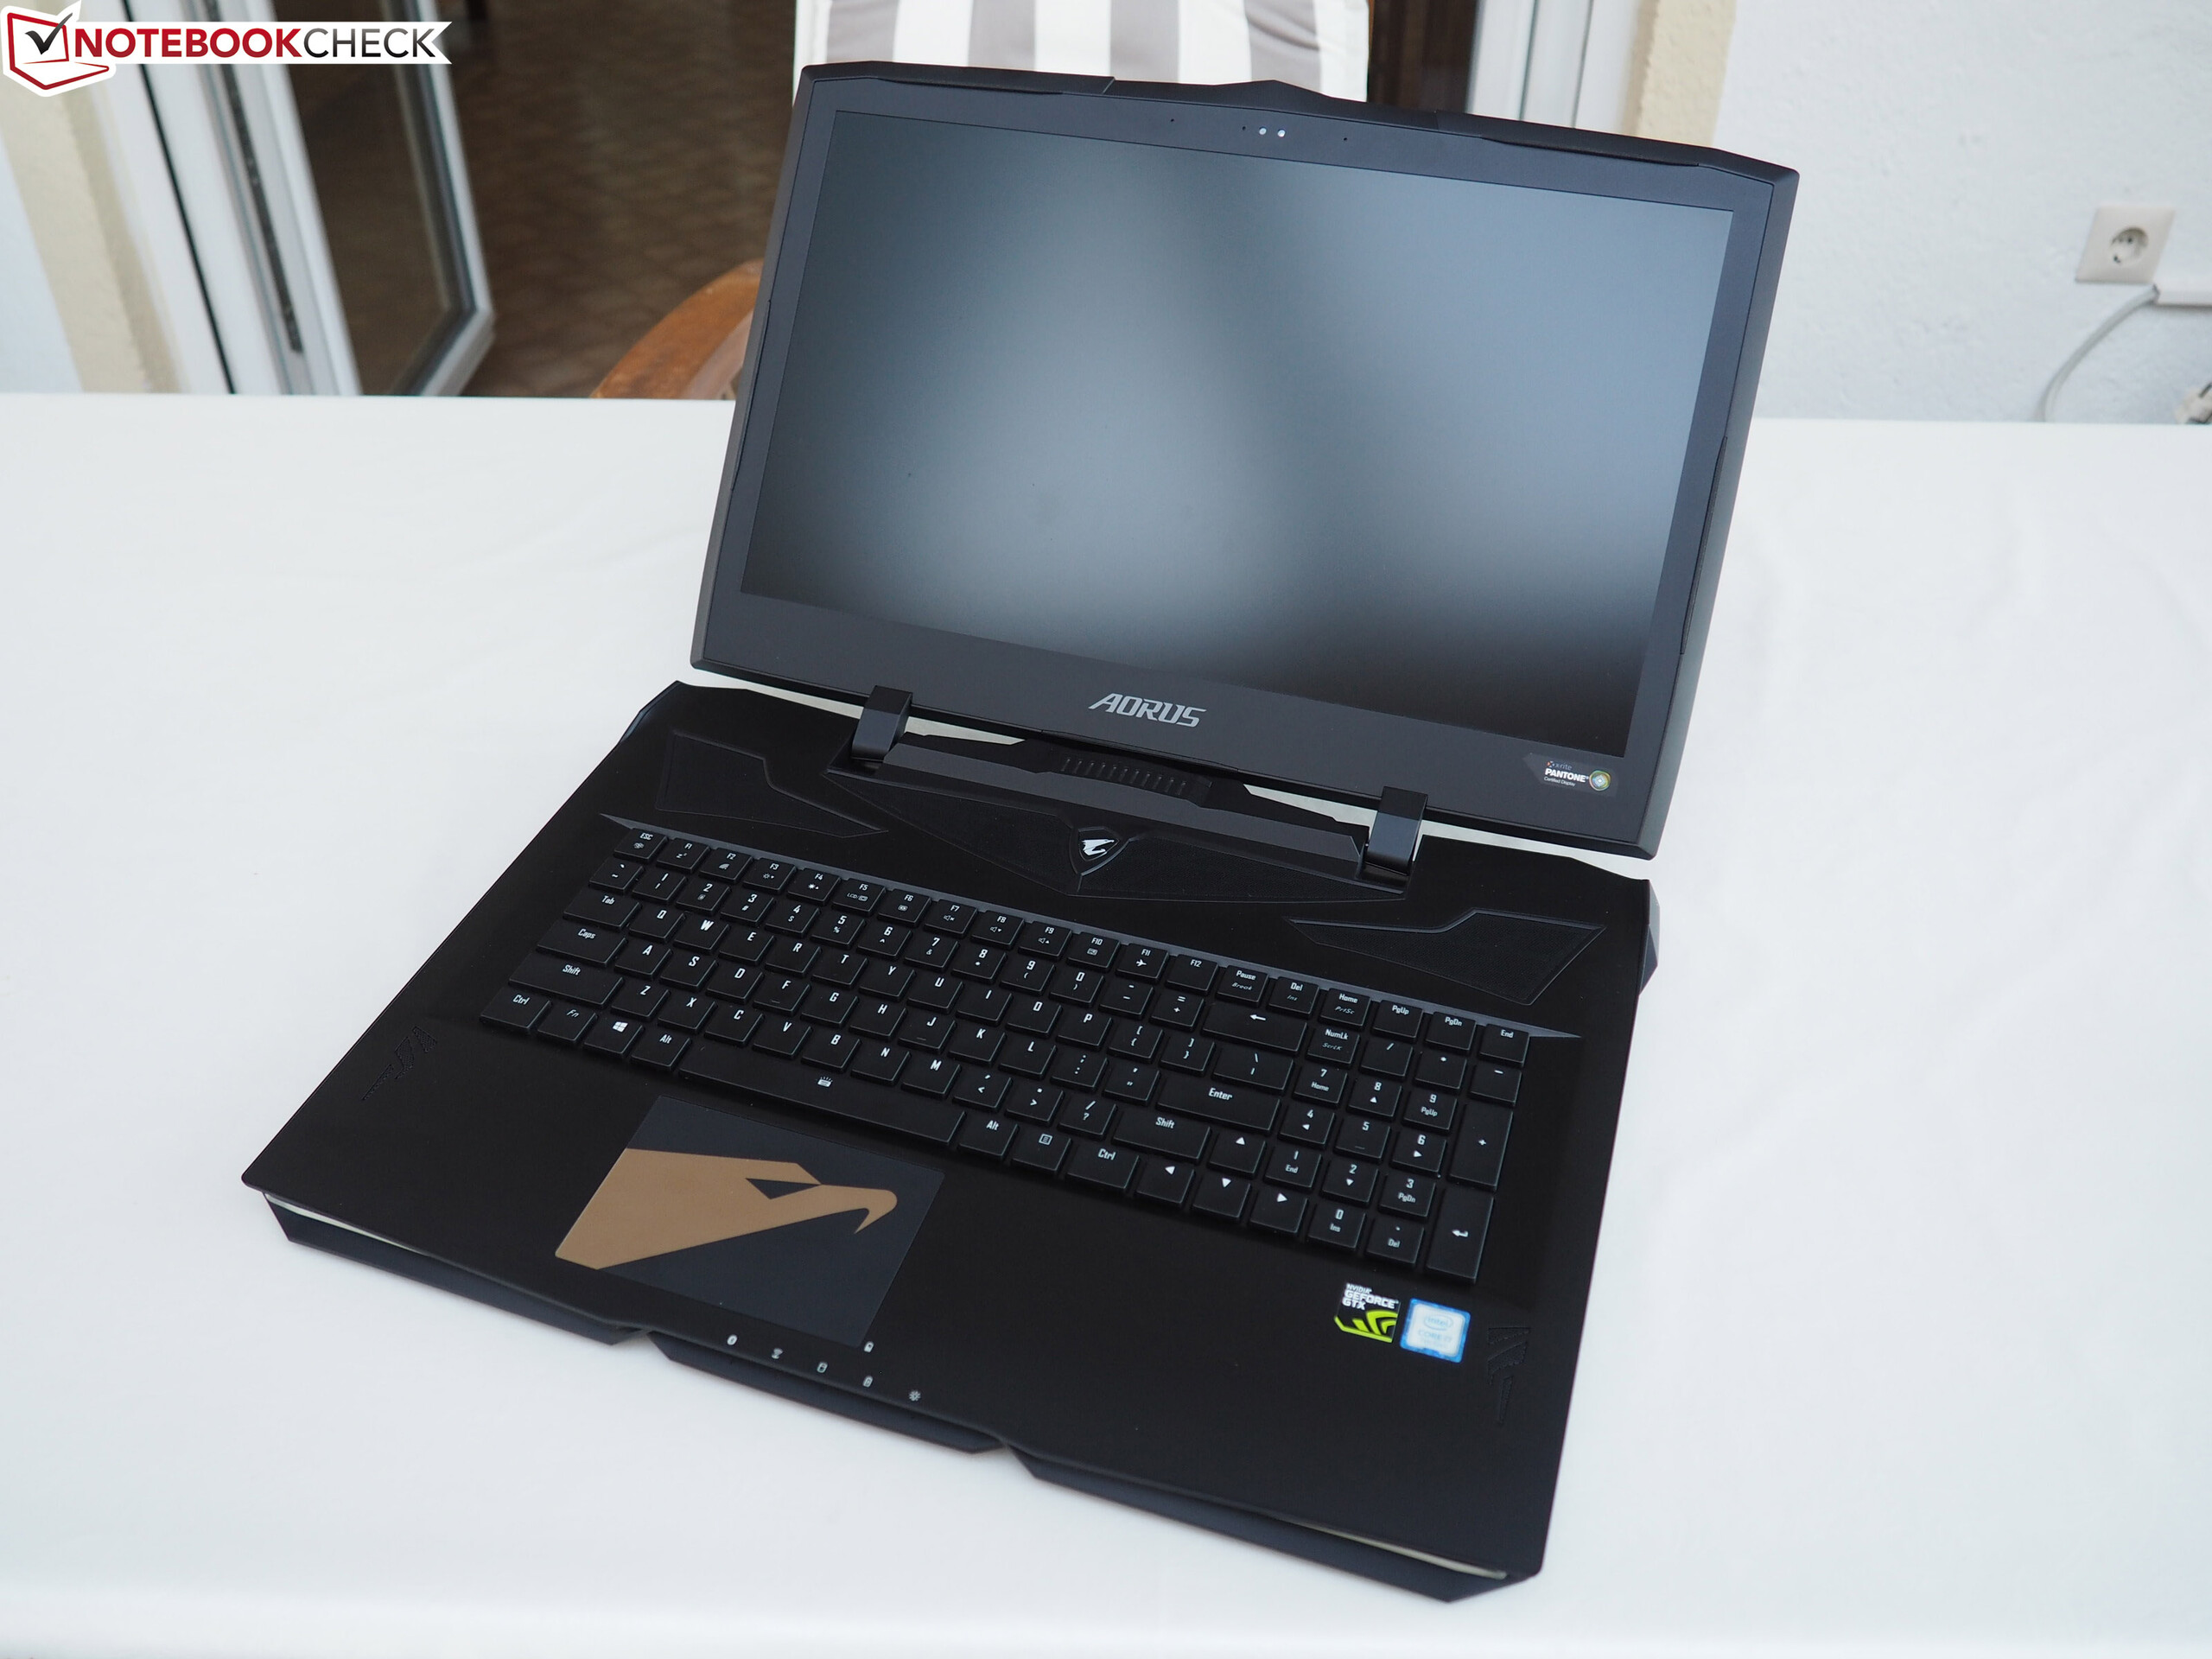
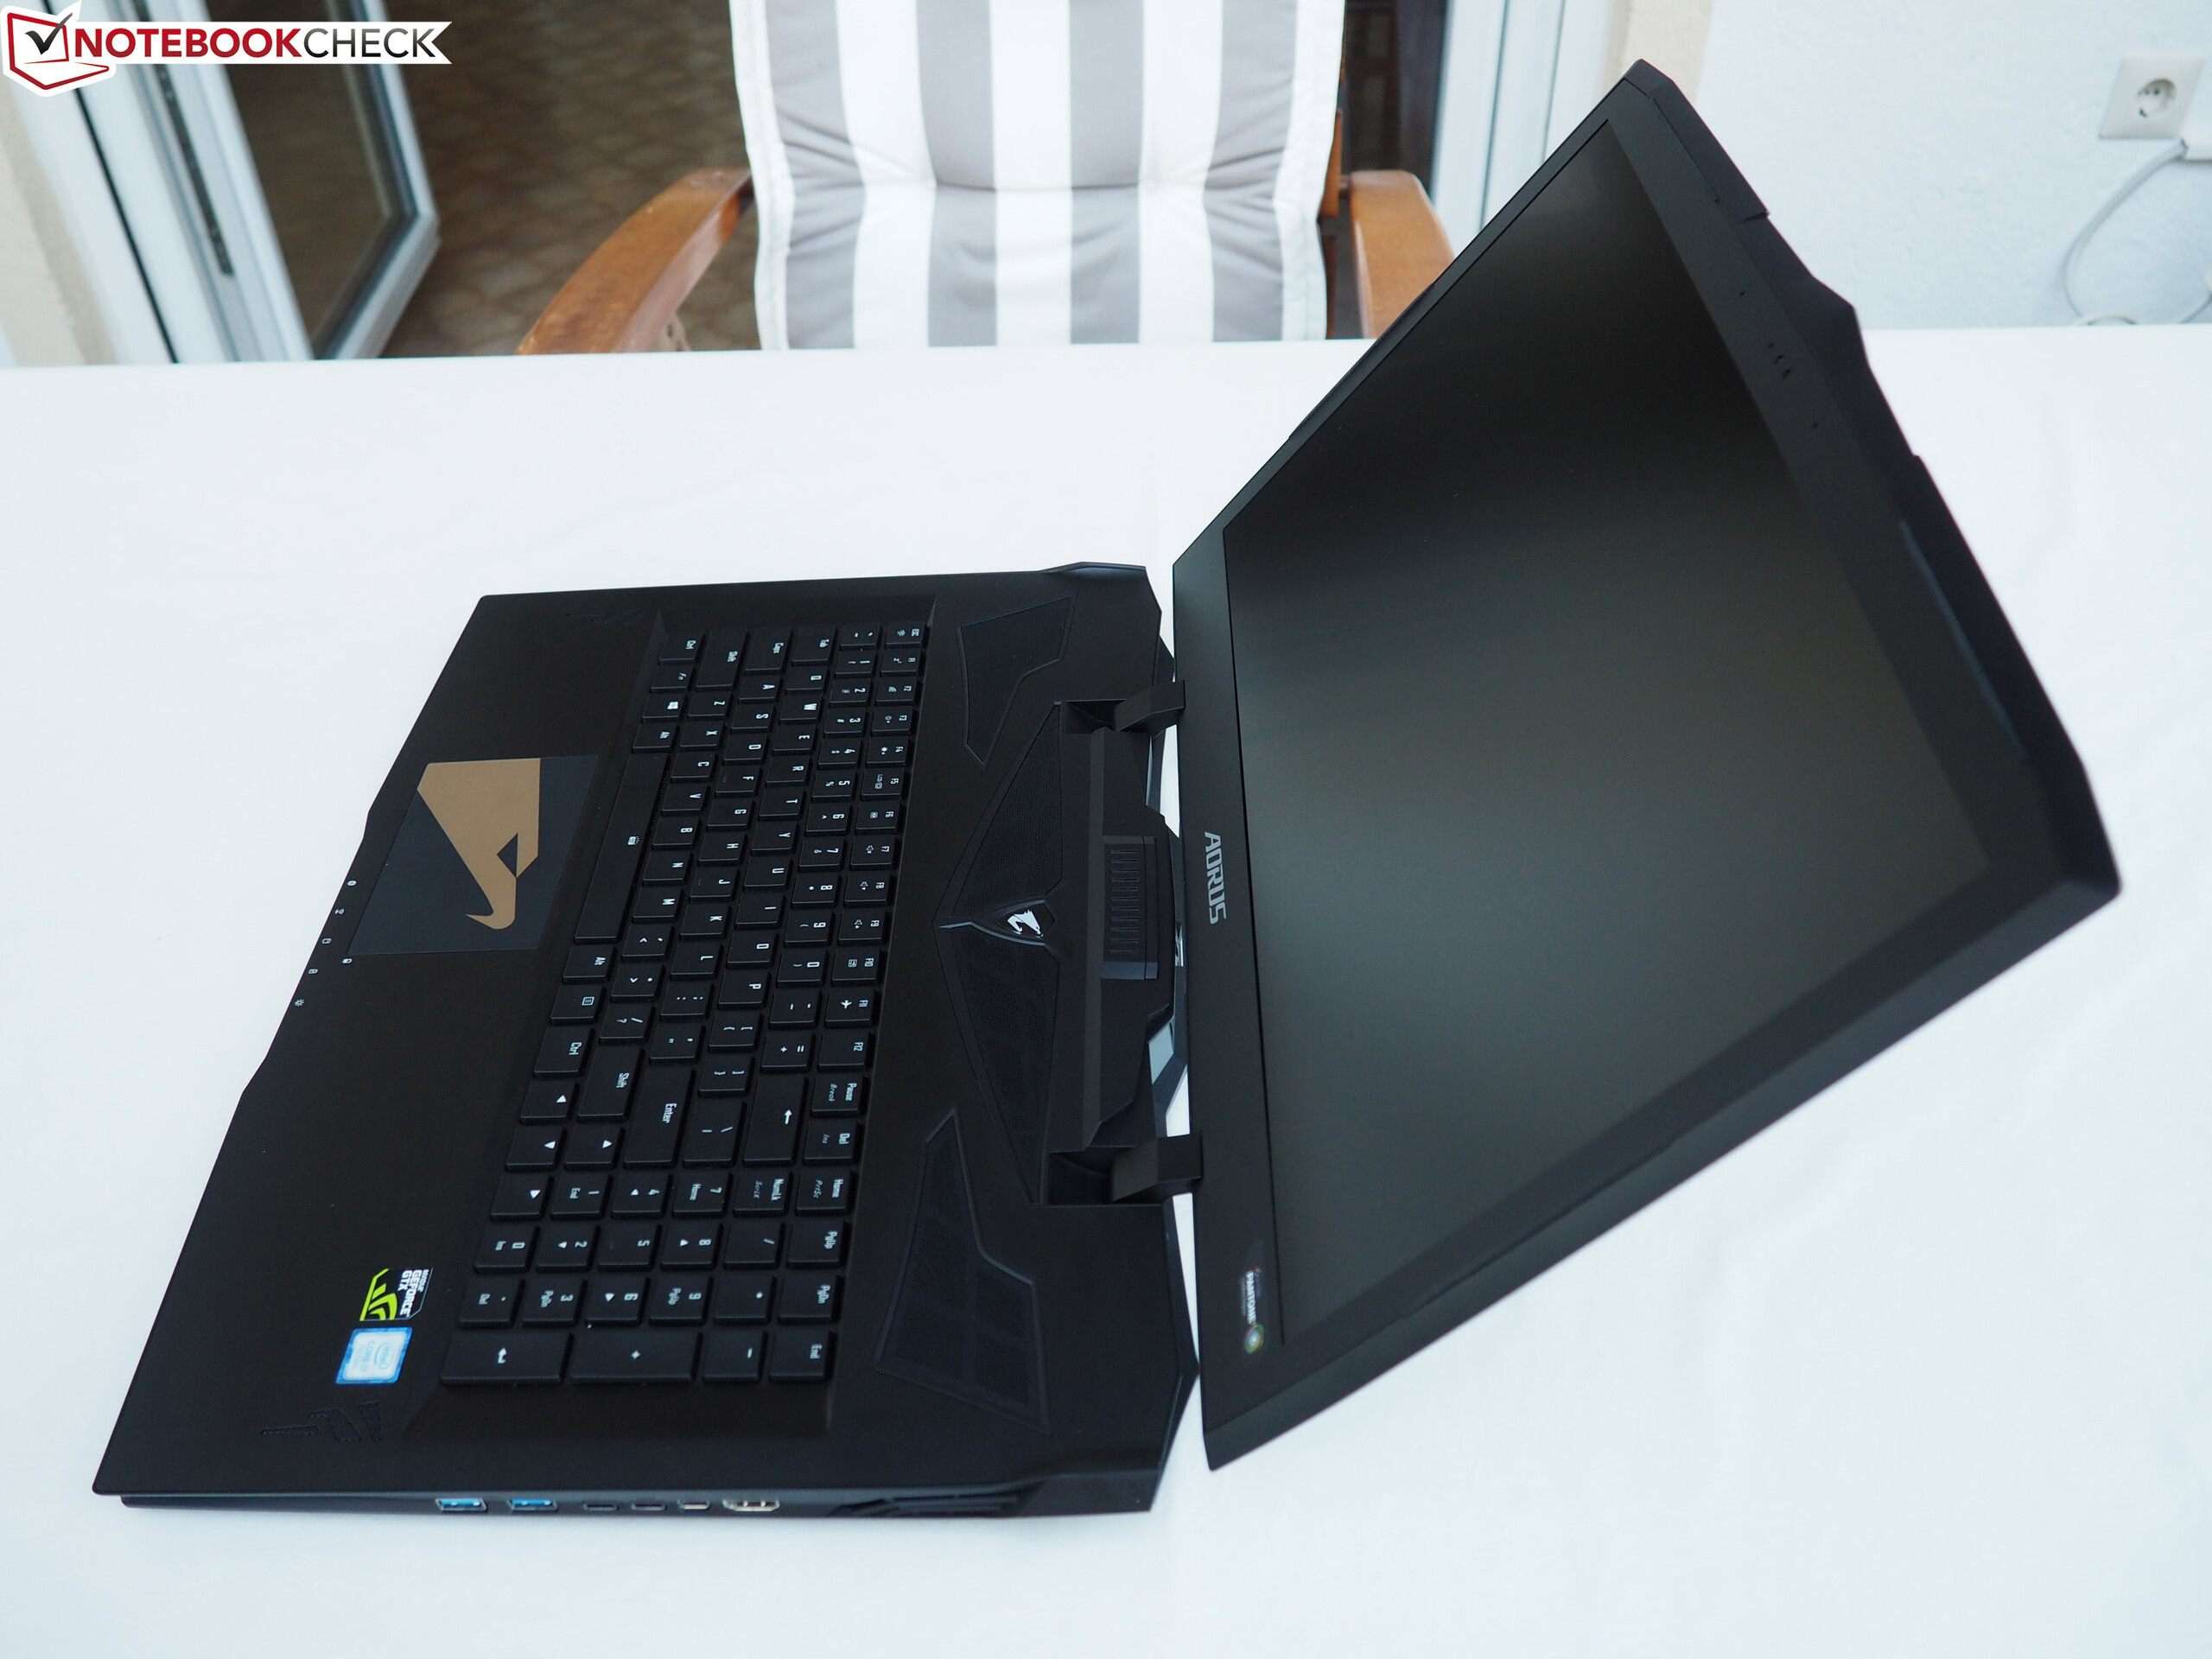
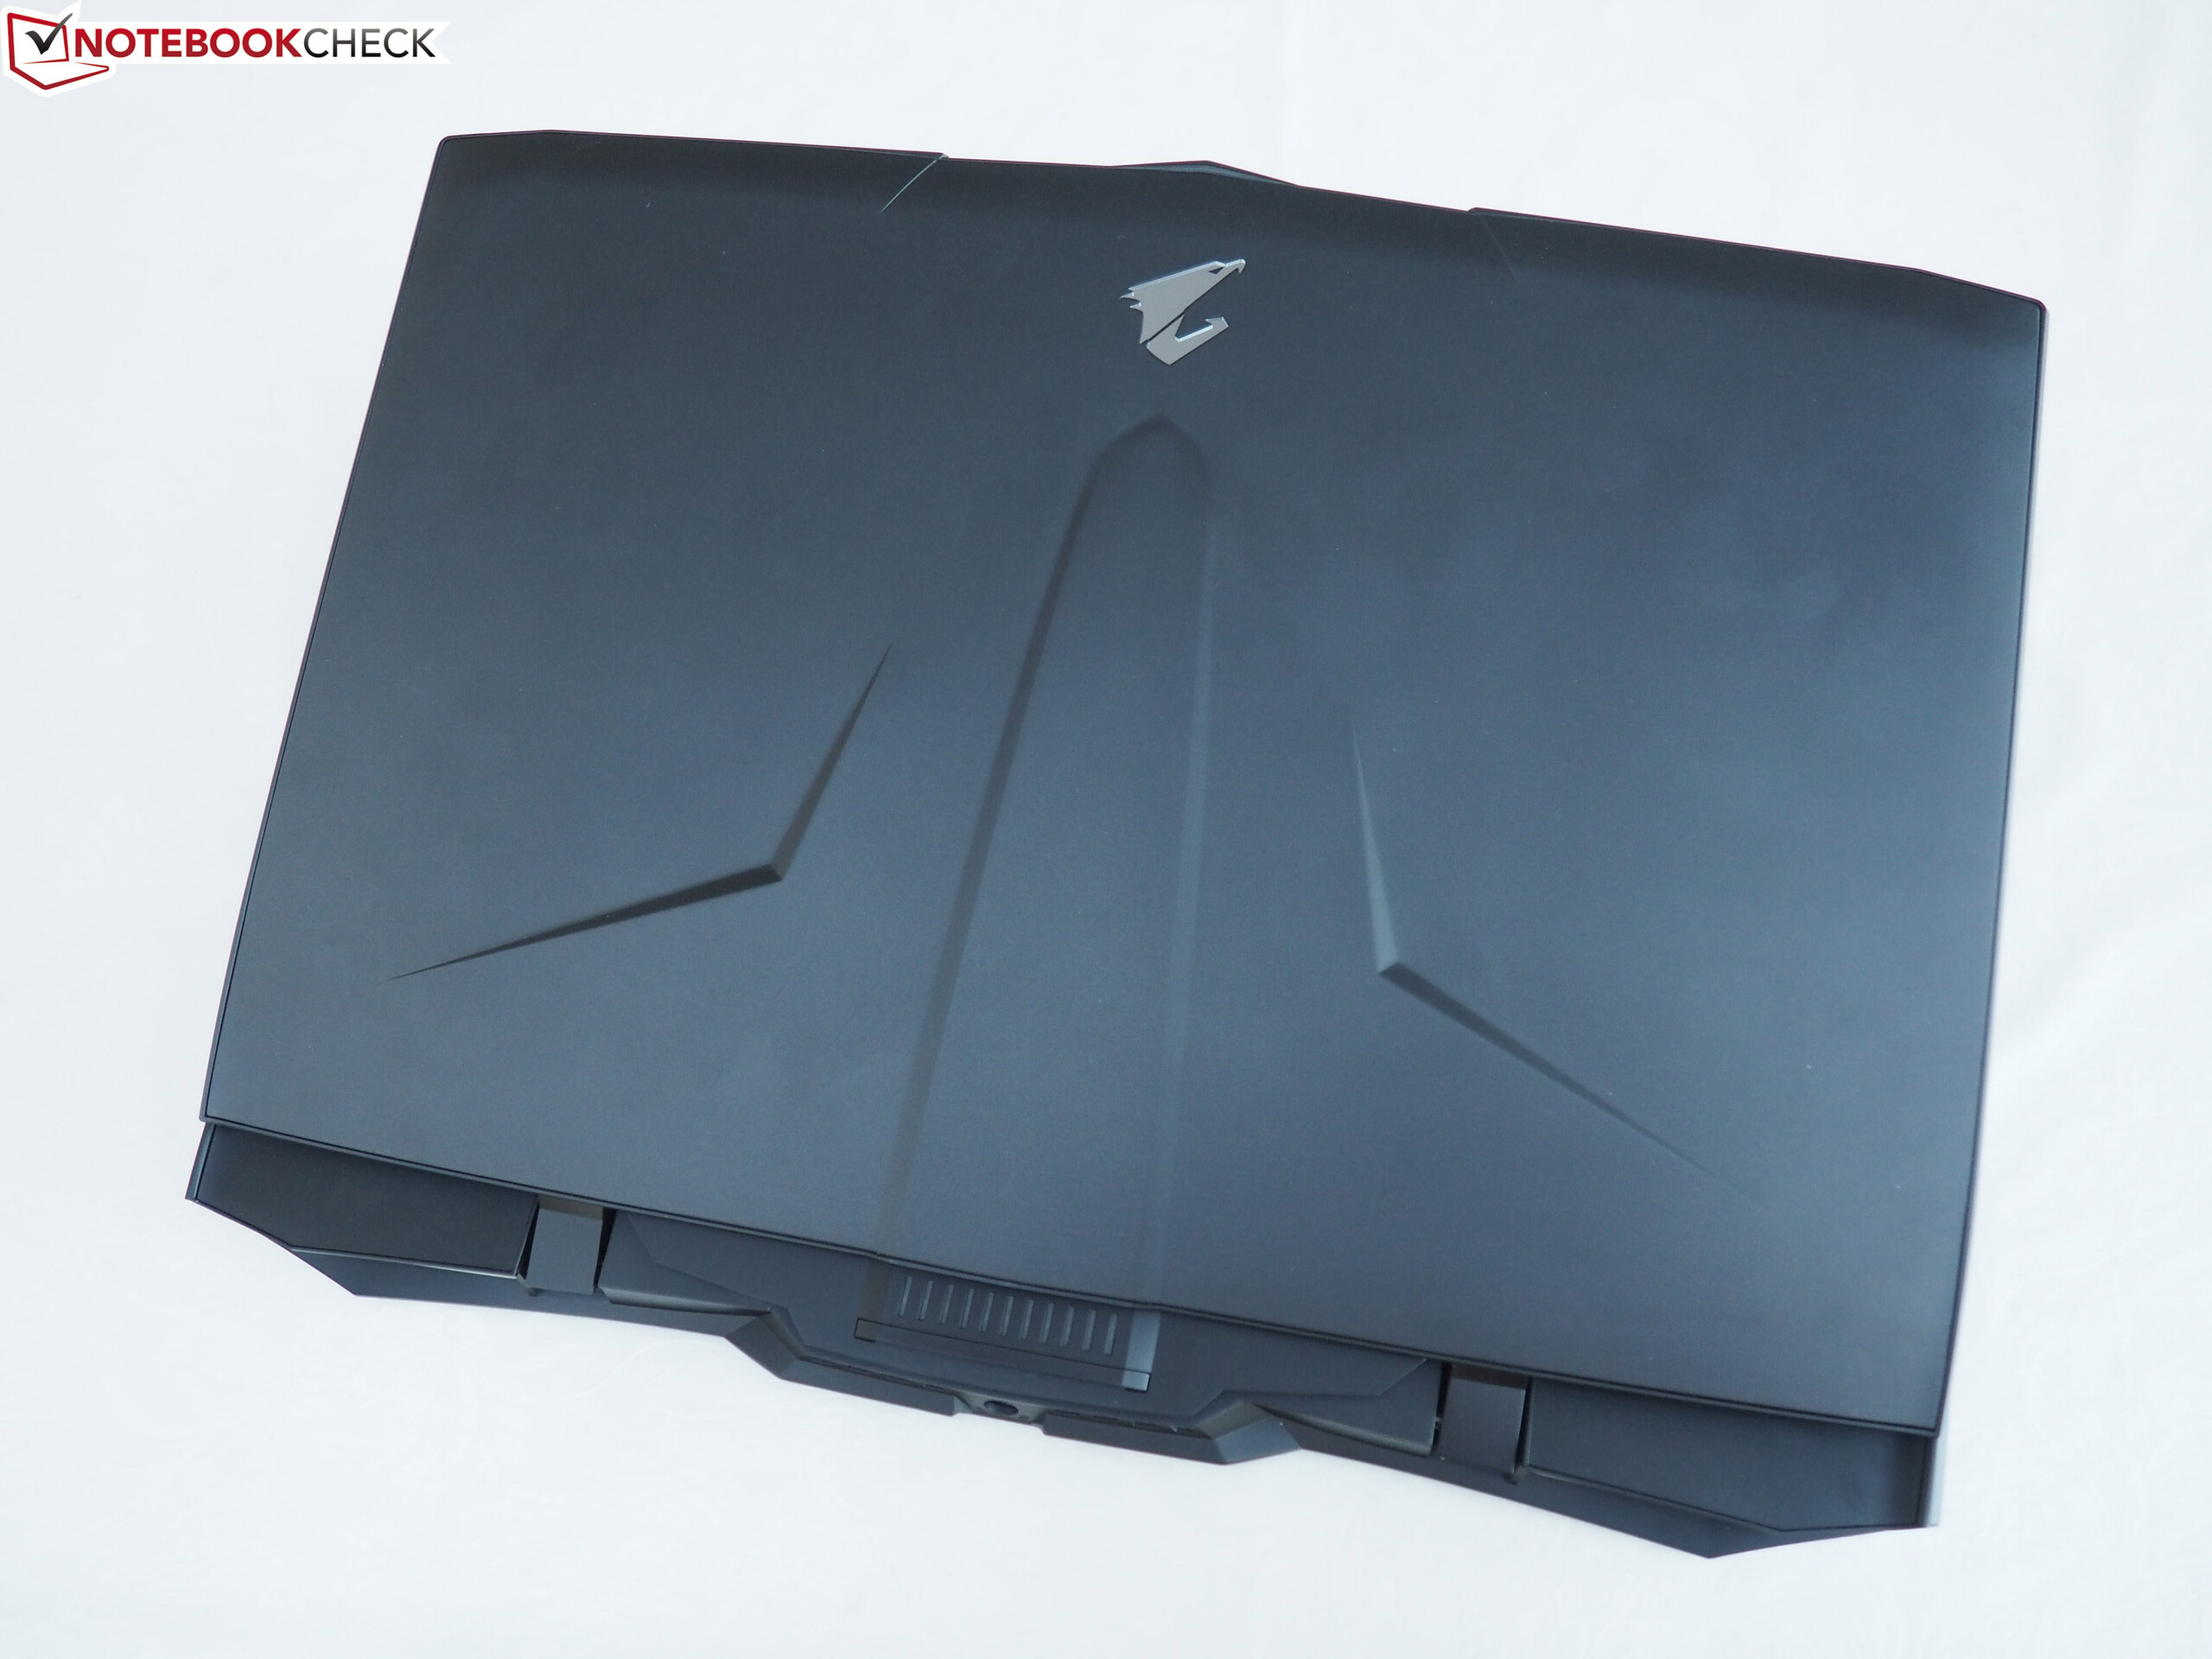
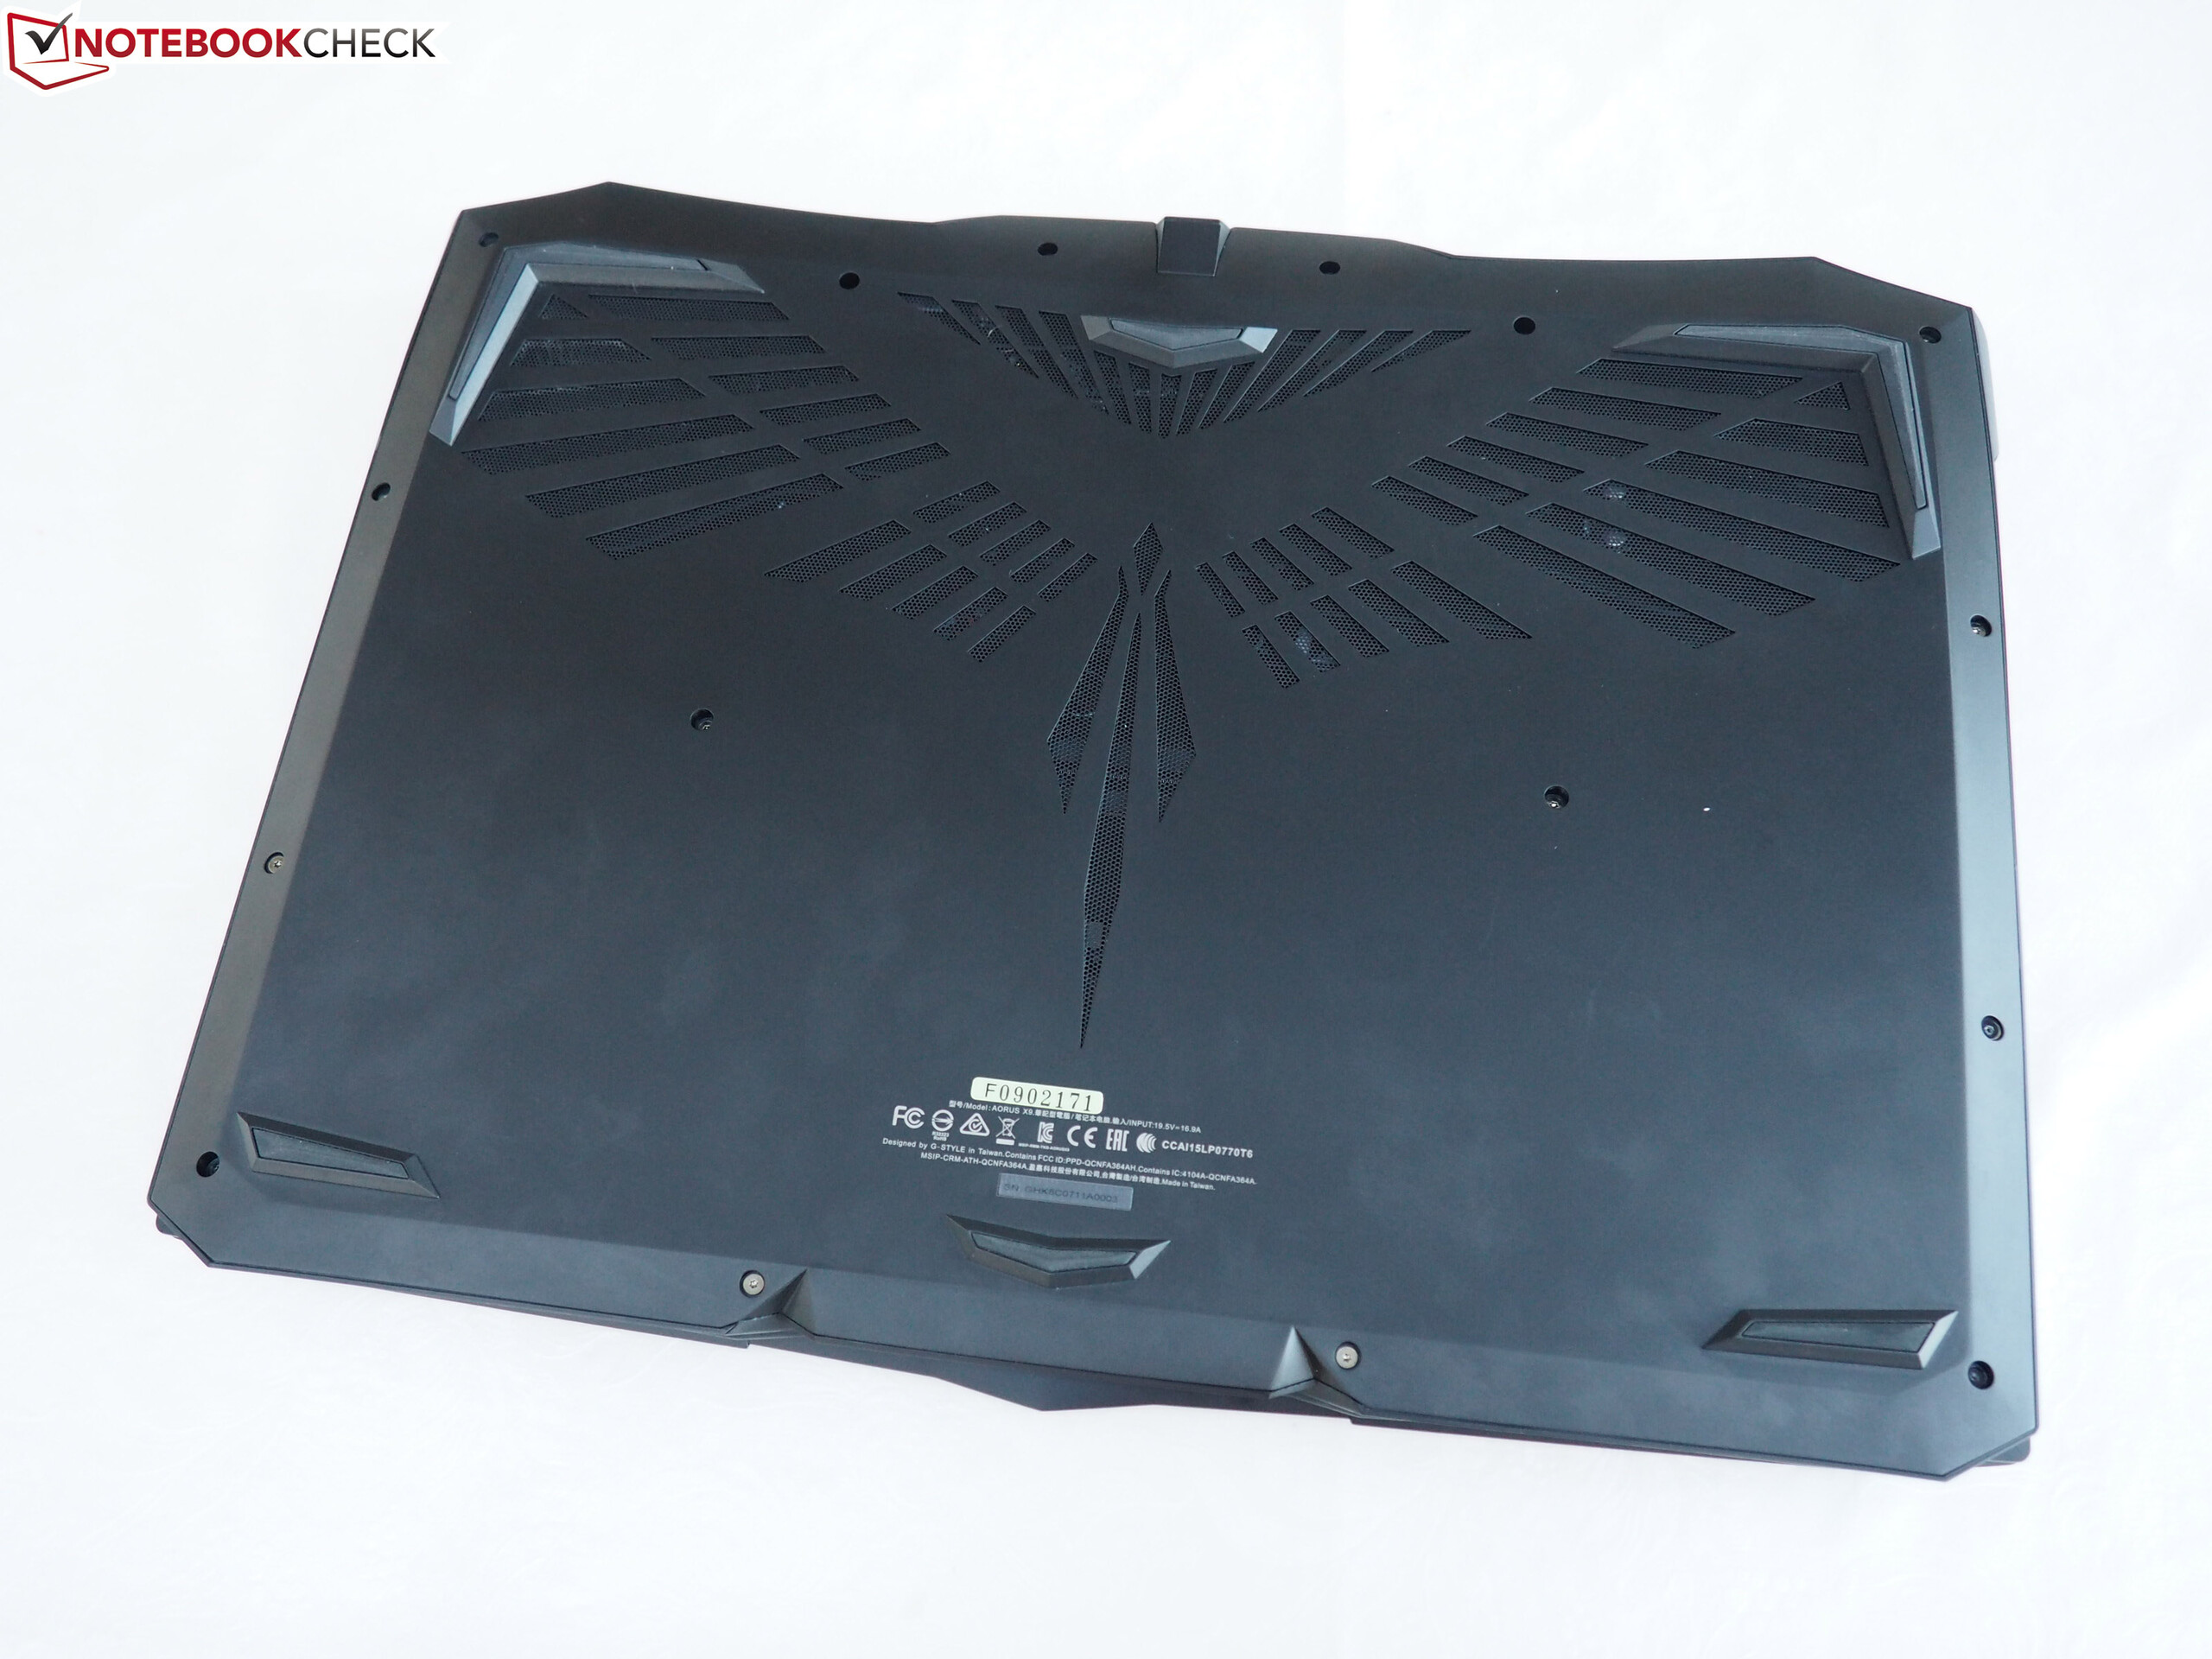
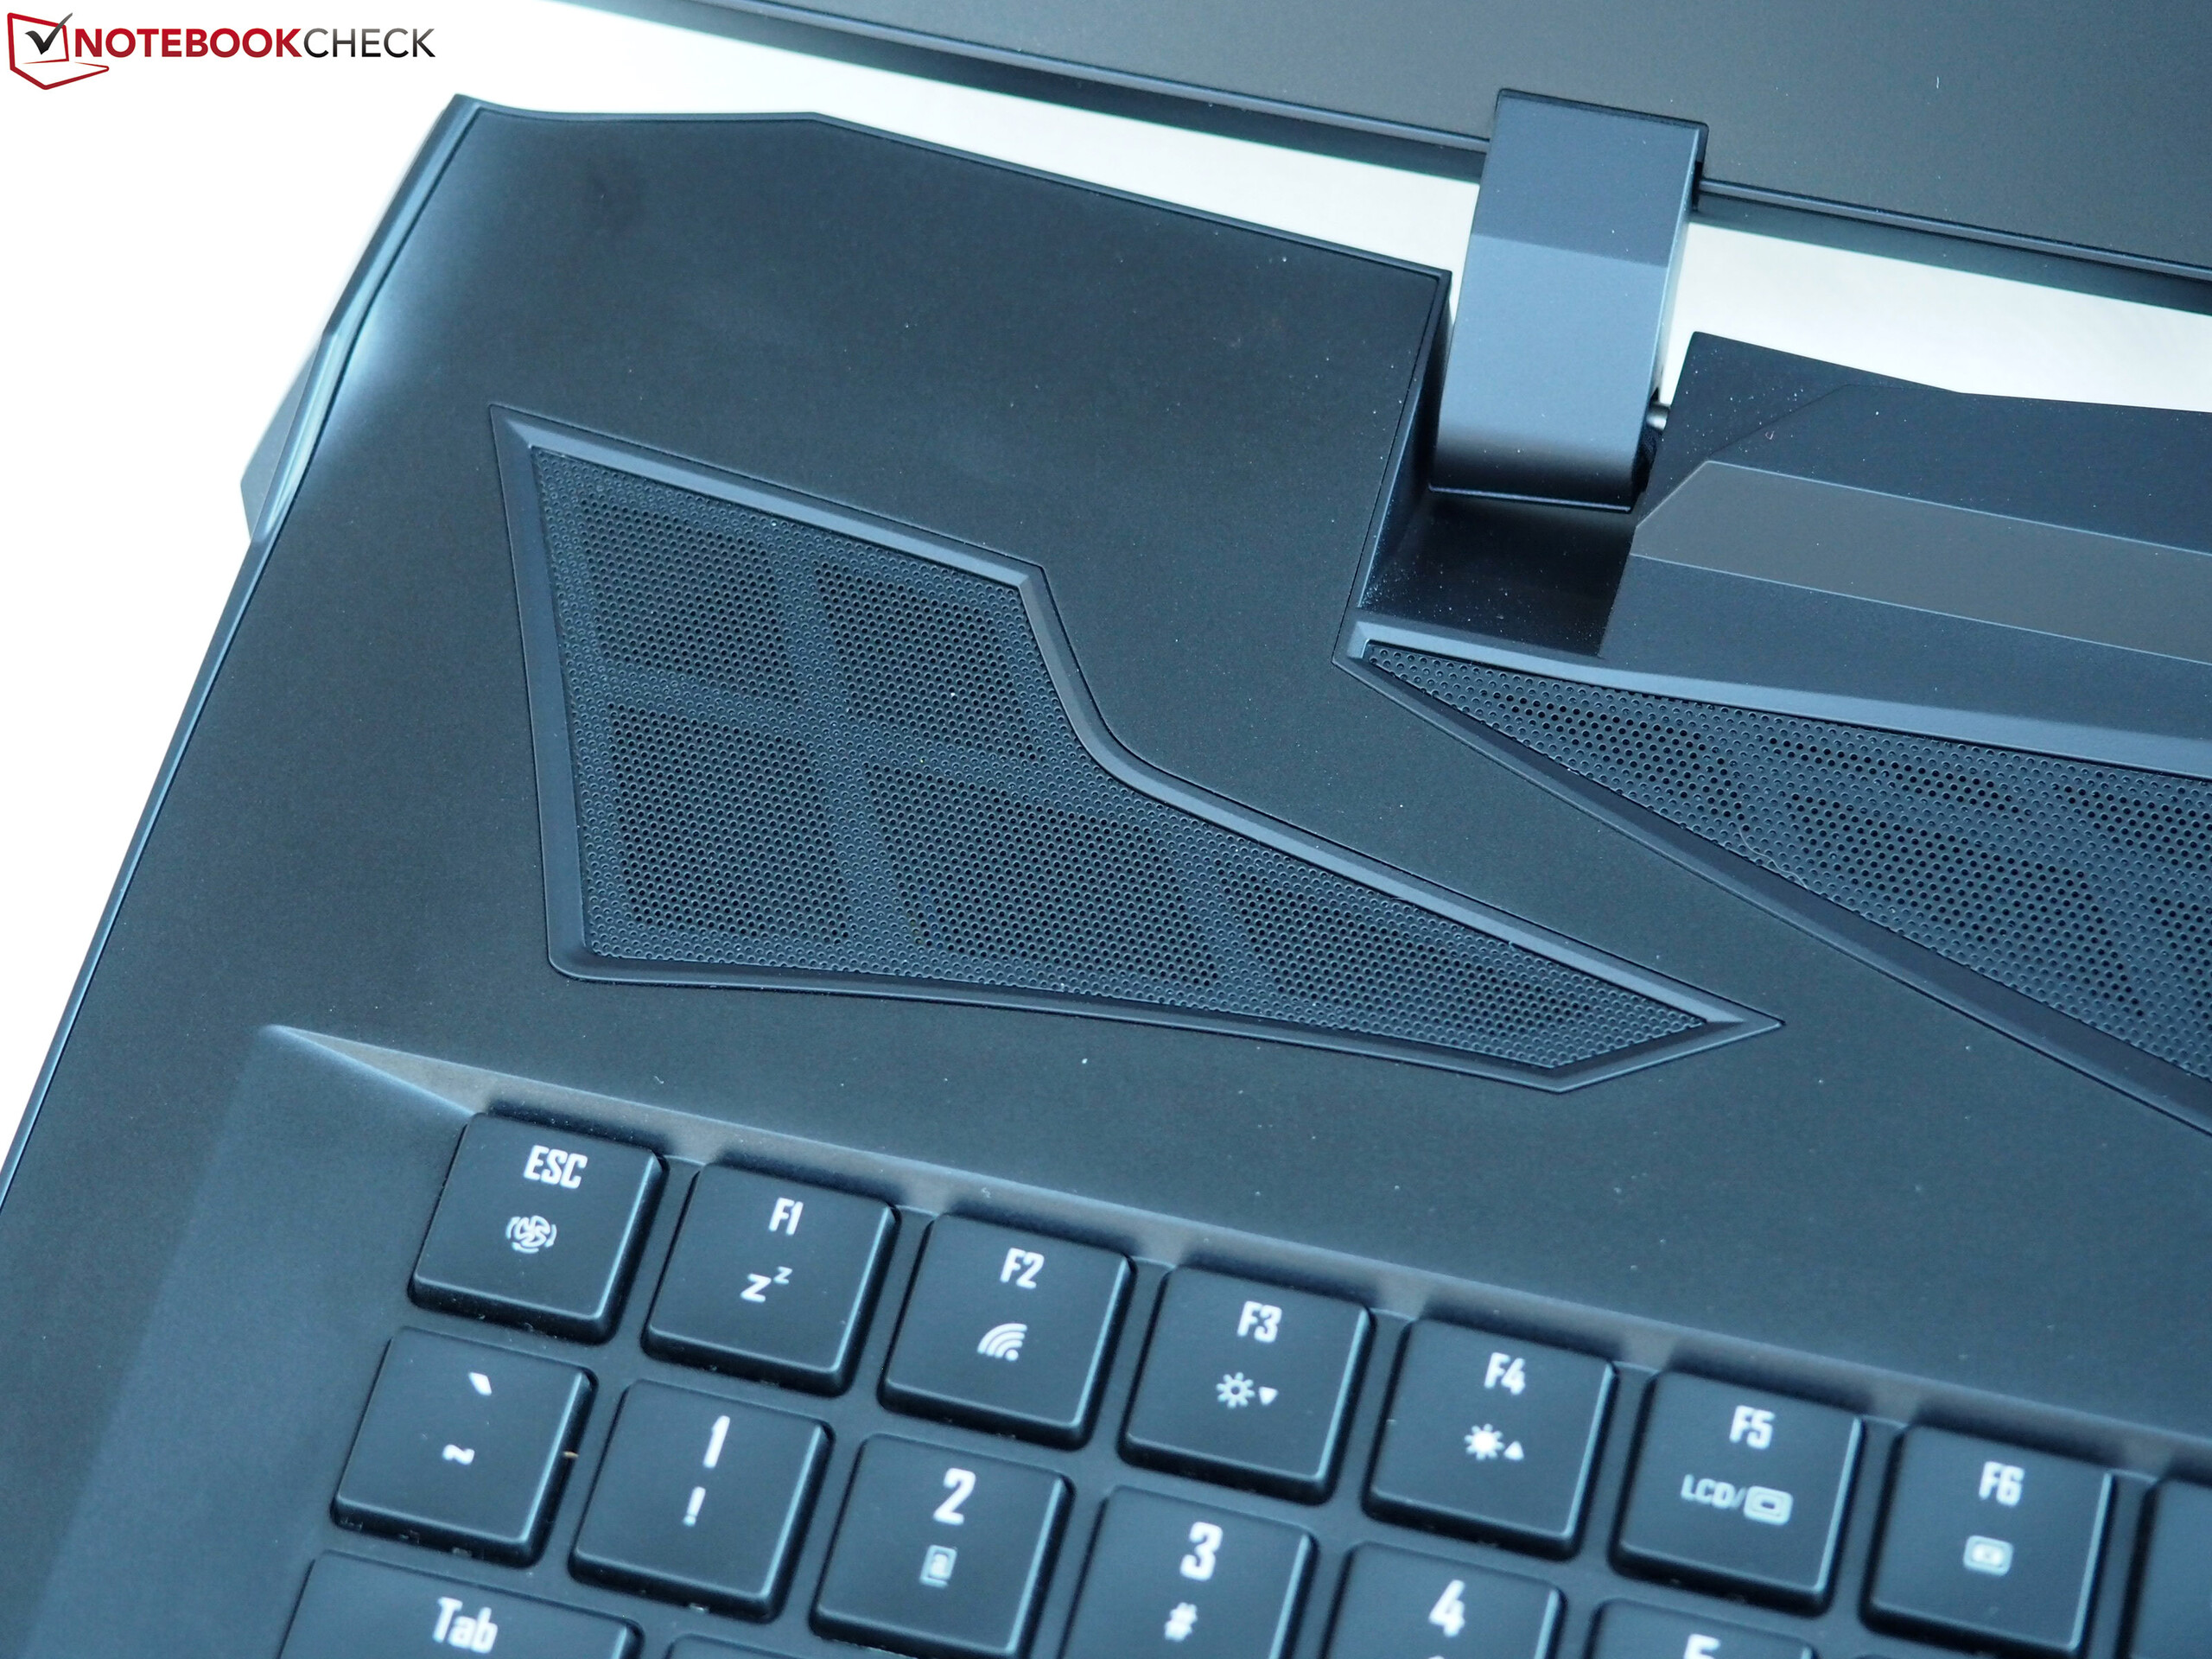
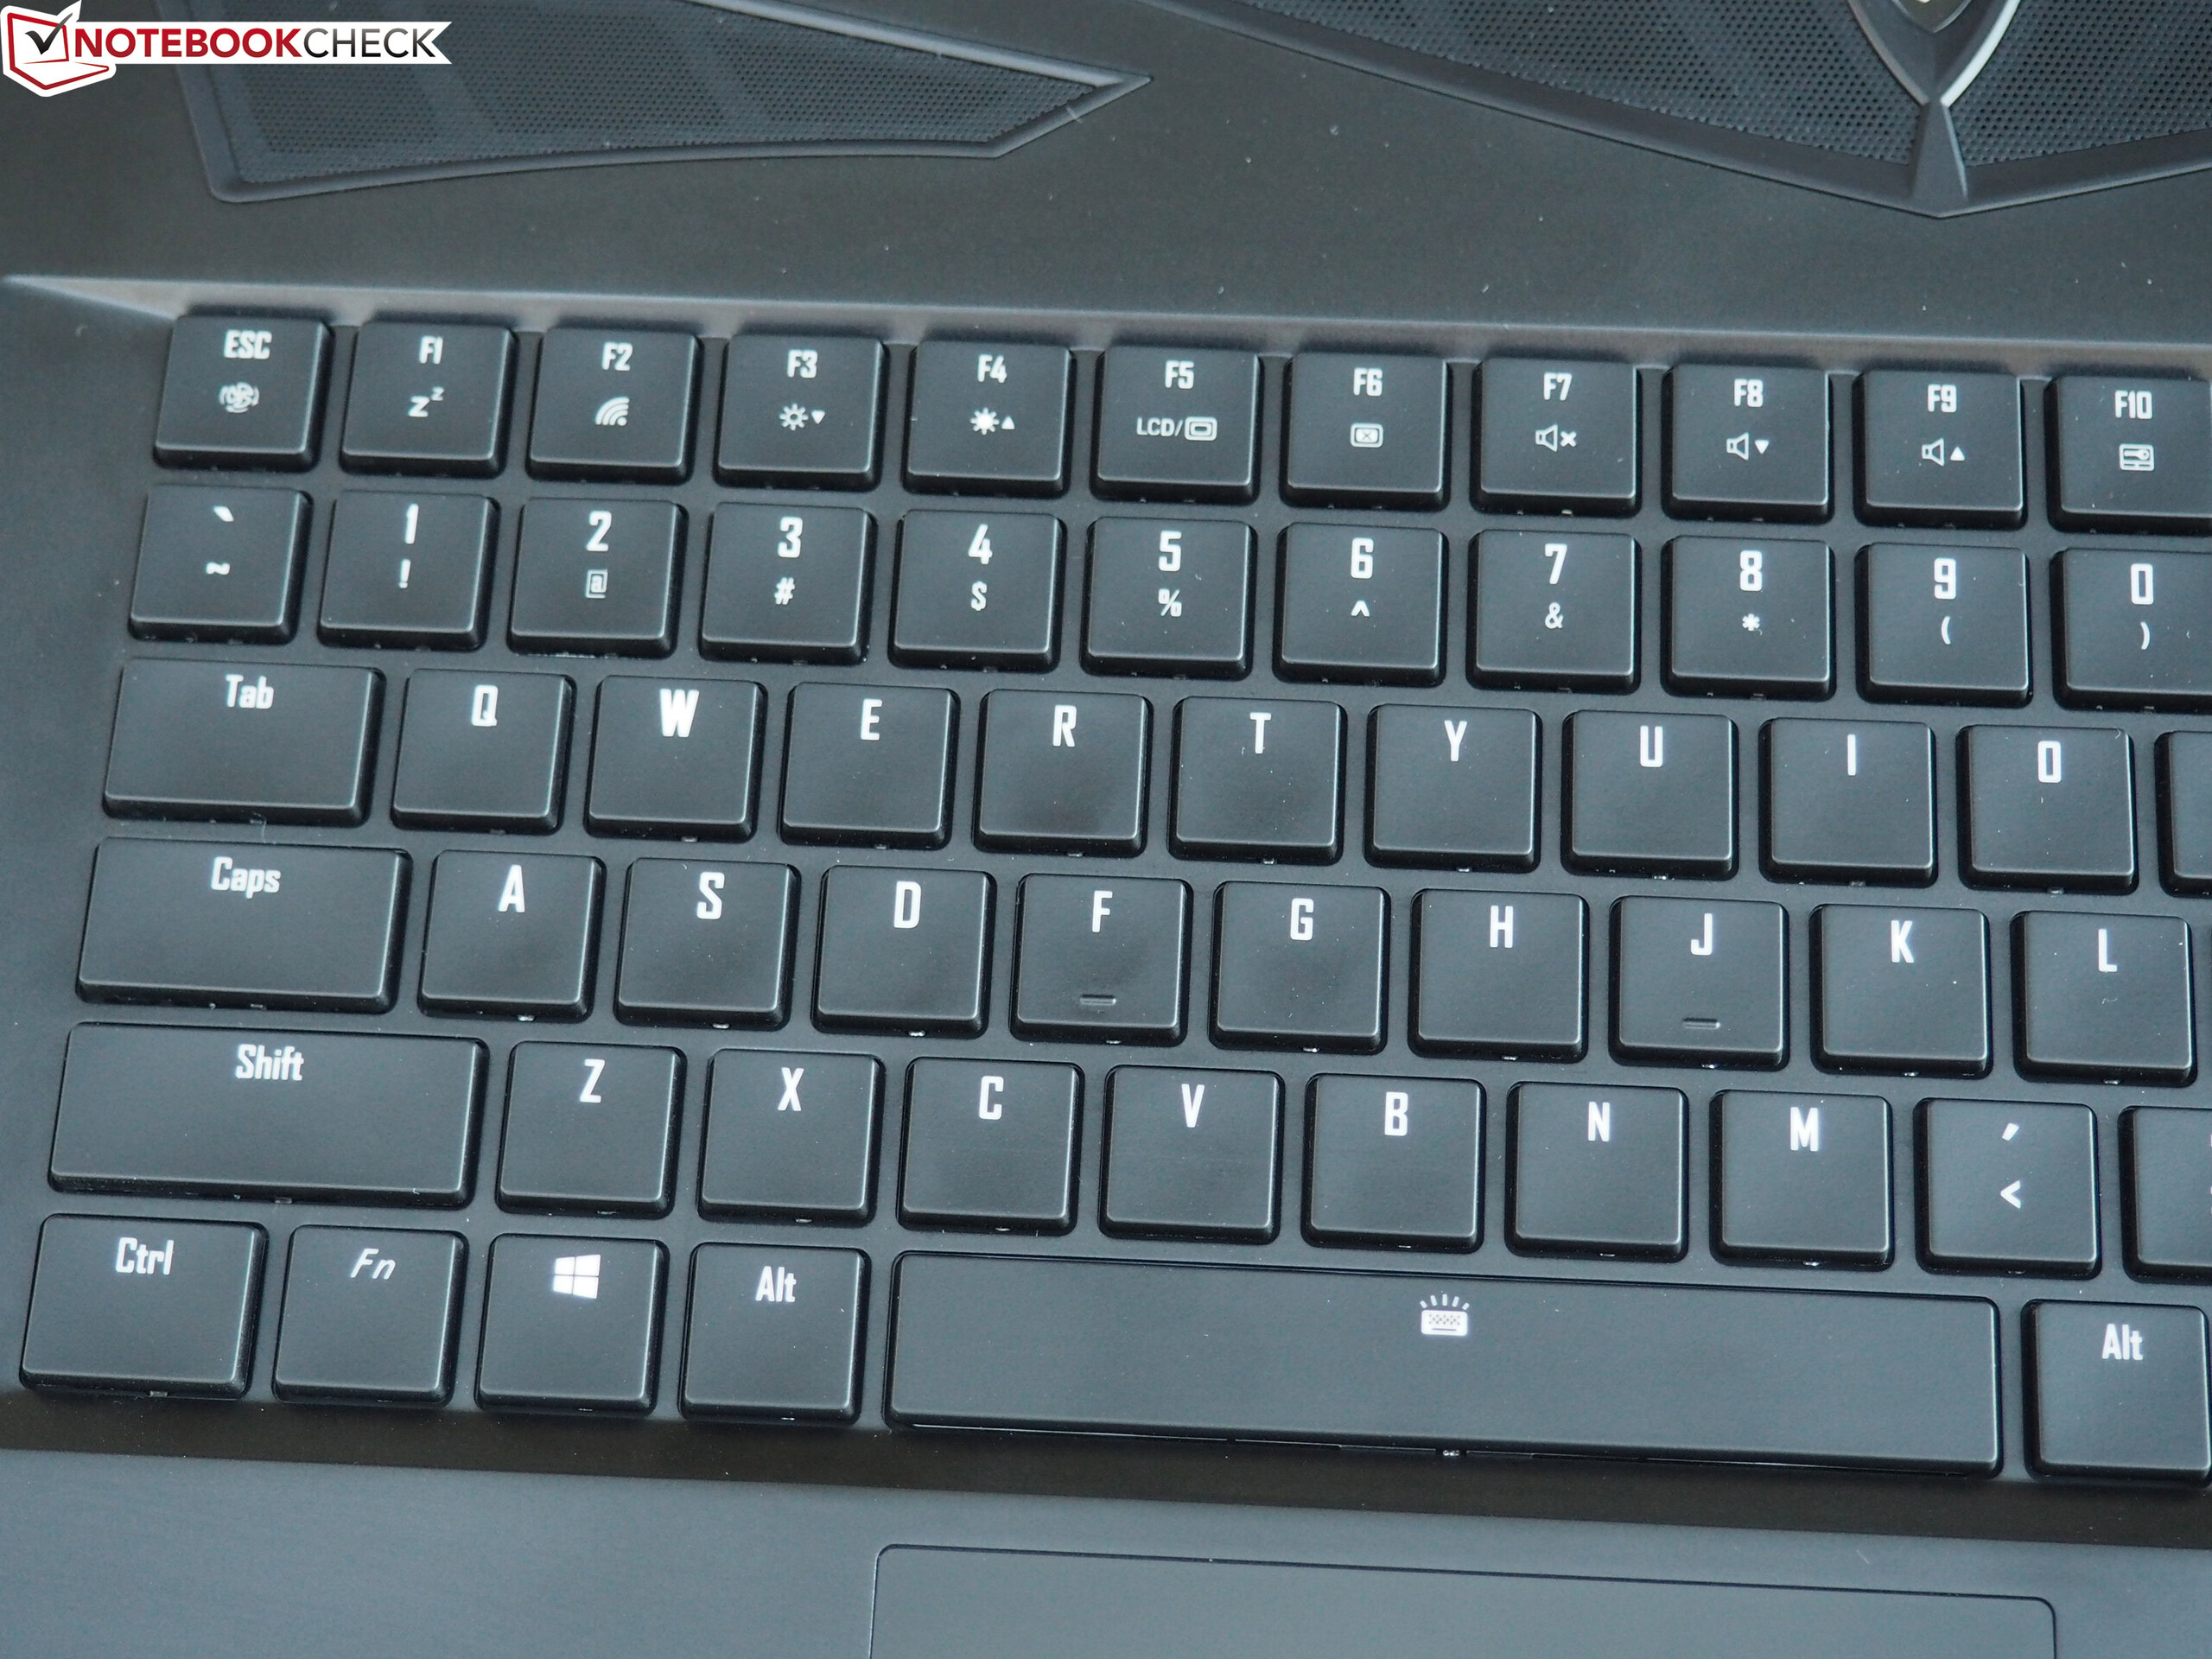
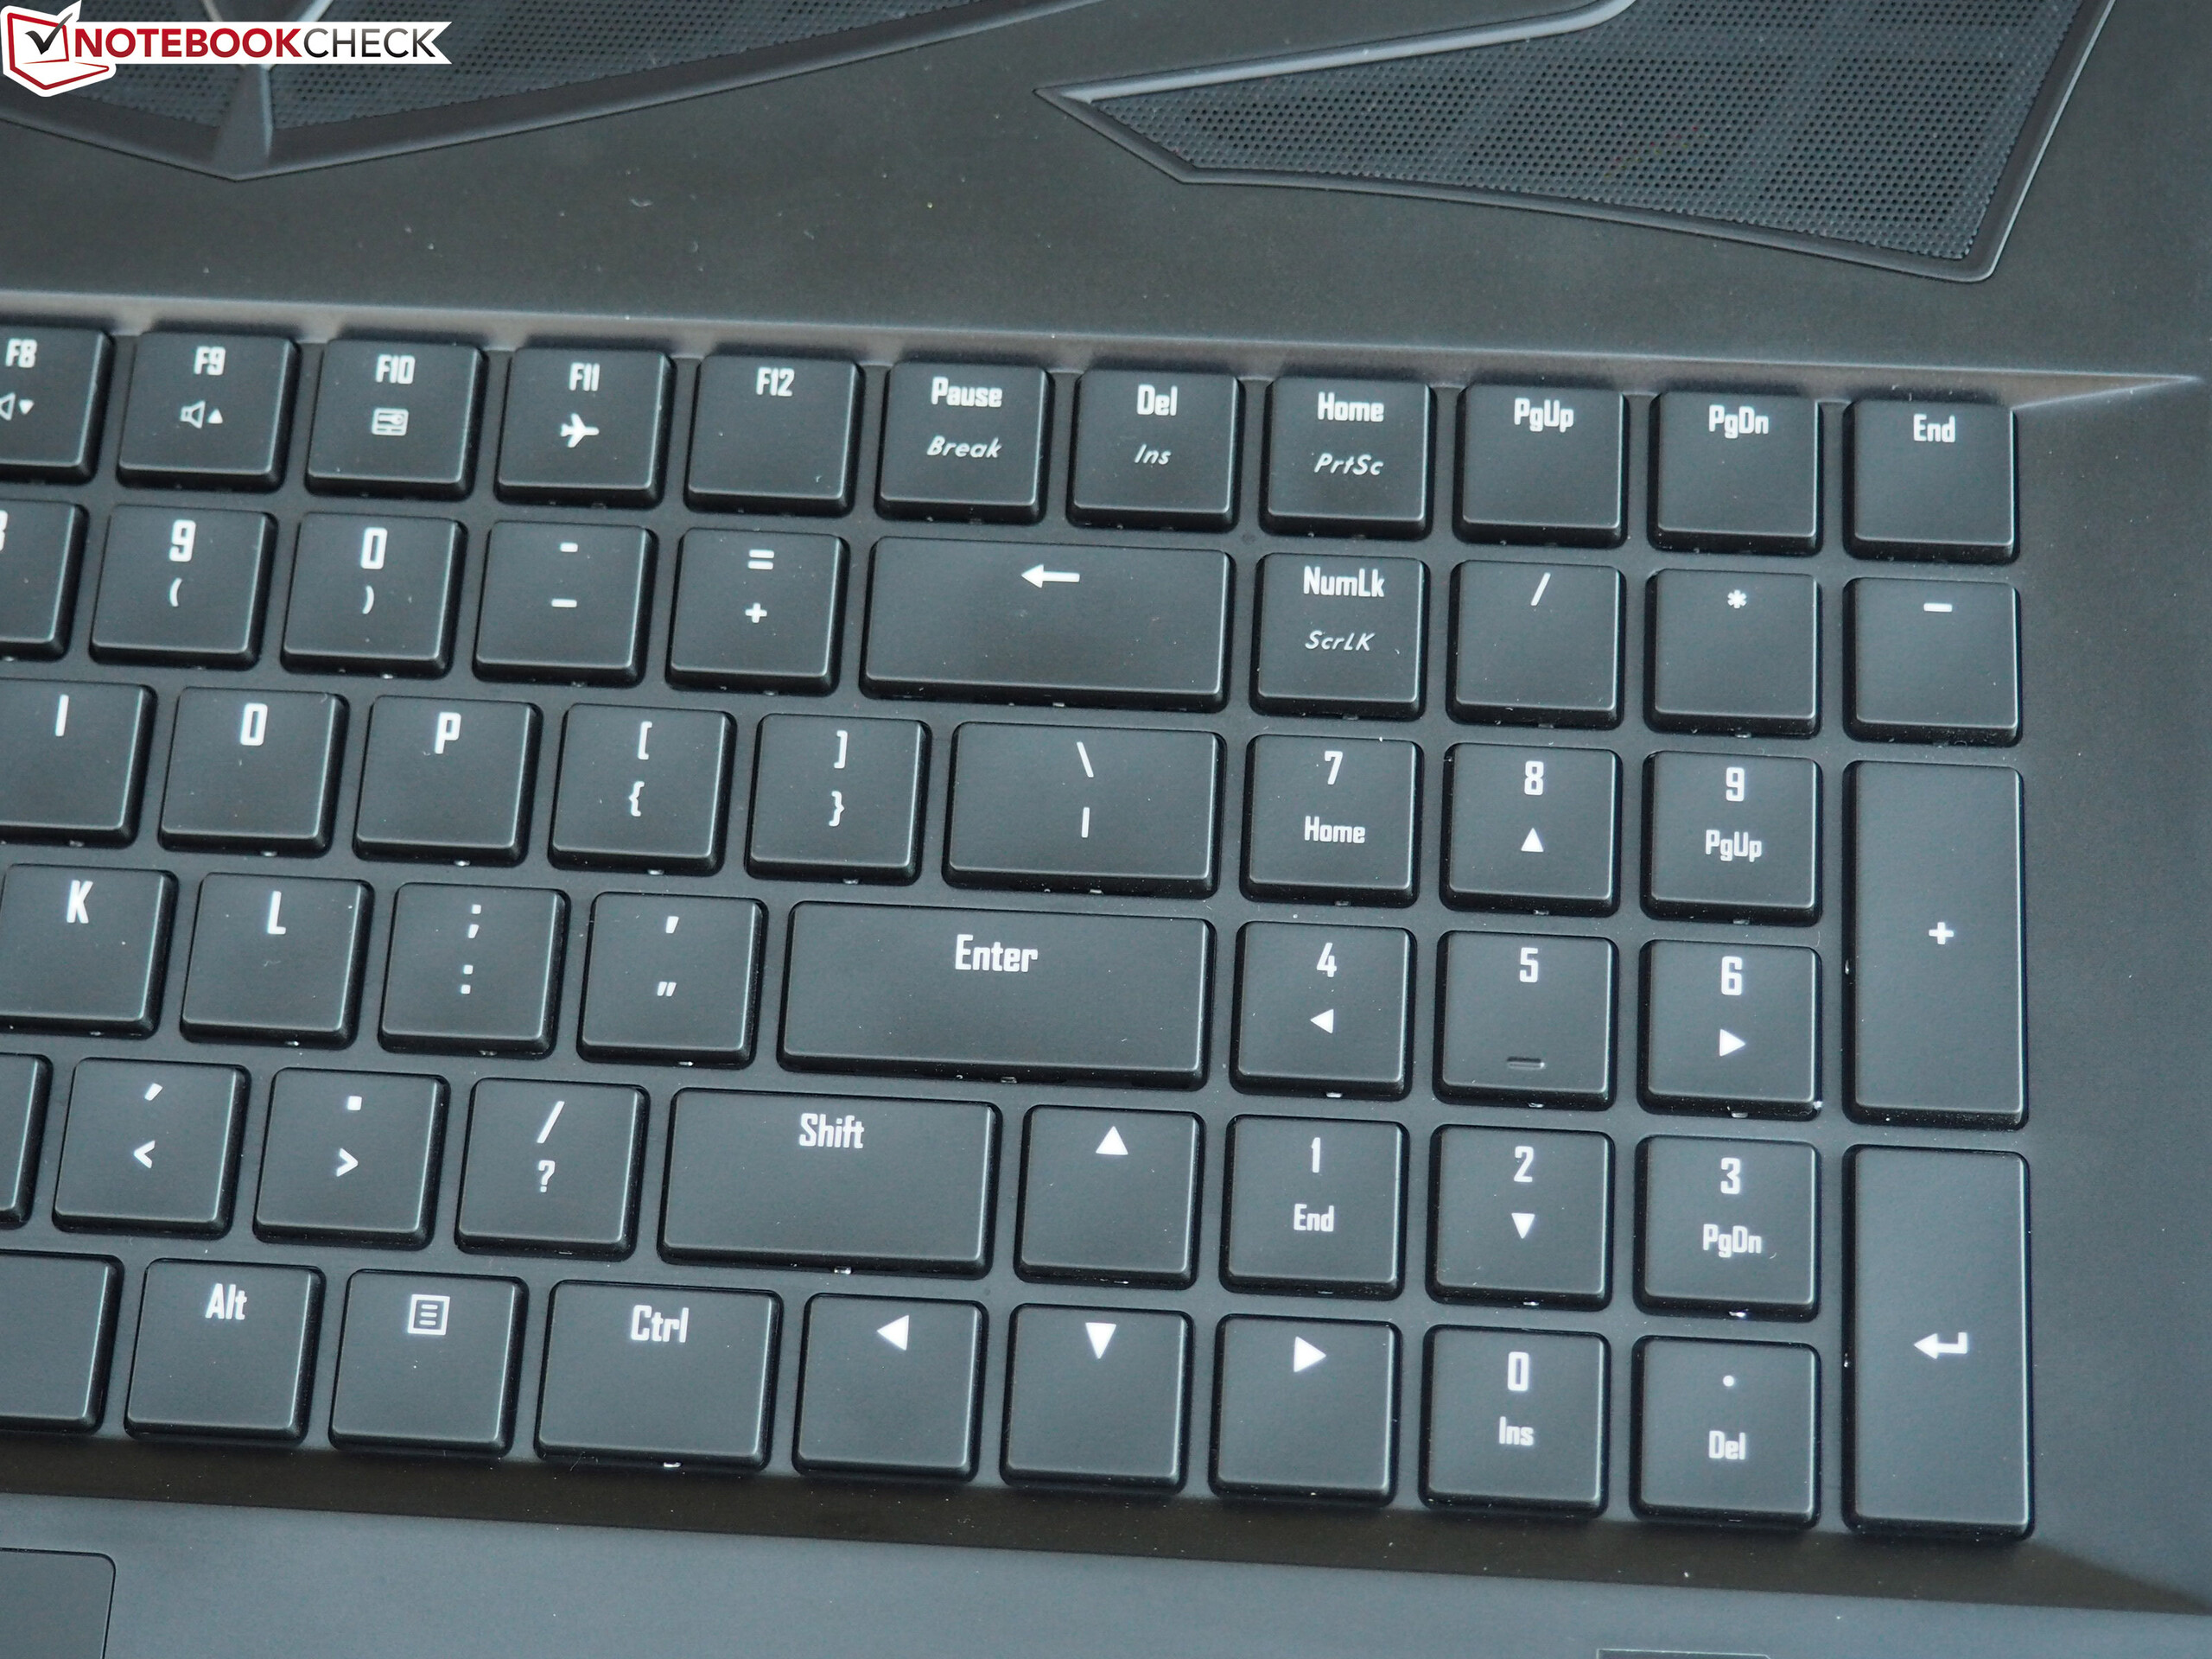
Trots att X9 är utrustad med två grafikenheter visar Gigabyte upp en väldigt tunn och, med tanke på dess prestanda, hyfsat lätt spellaptop som kan imponera med sitt högkvalitativa metall-hölje, lekfulla design (oavsett om du gillar den eller inte) och ett mekaniskt tangentbord.
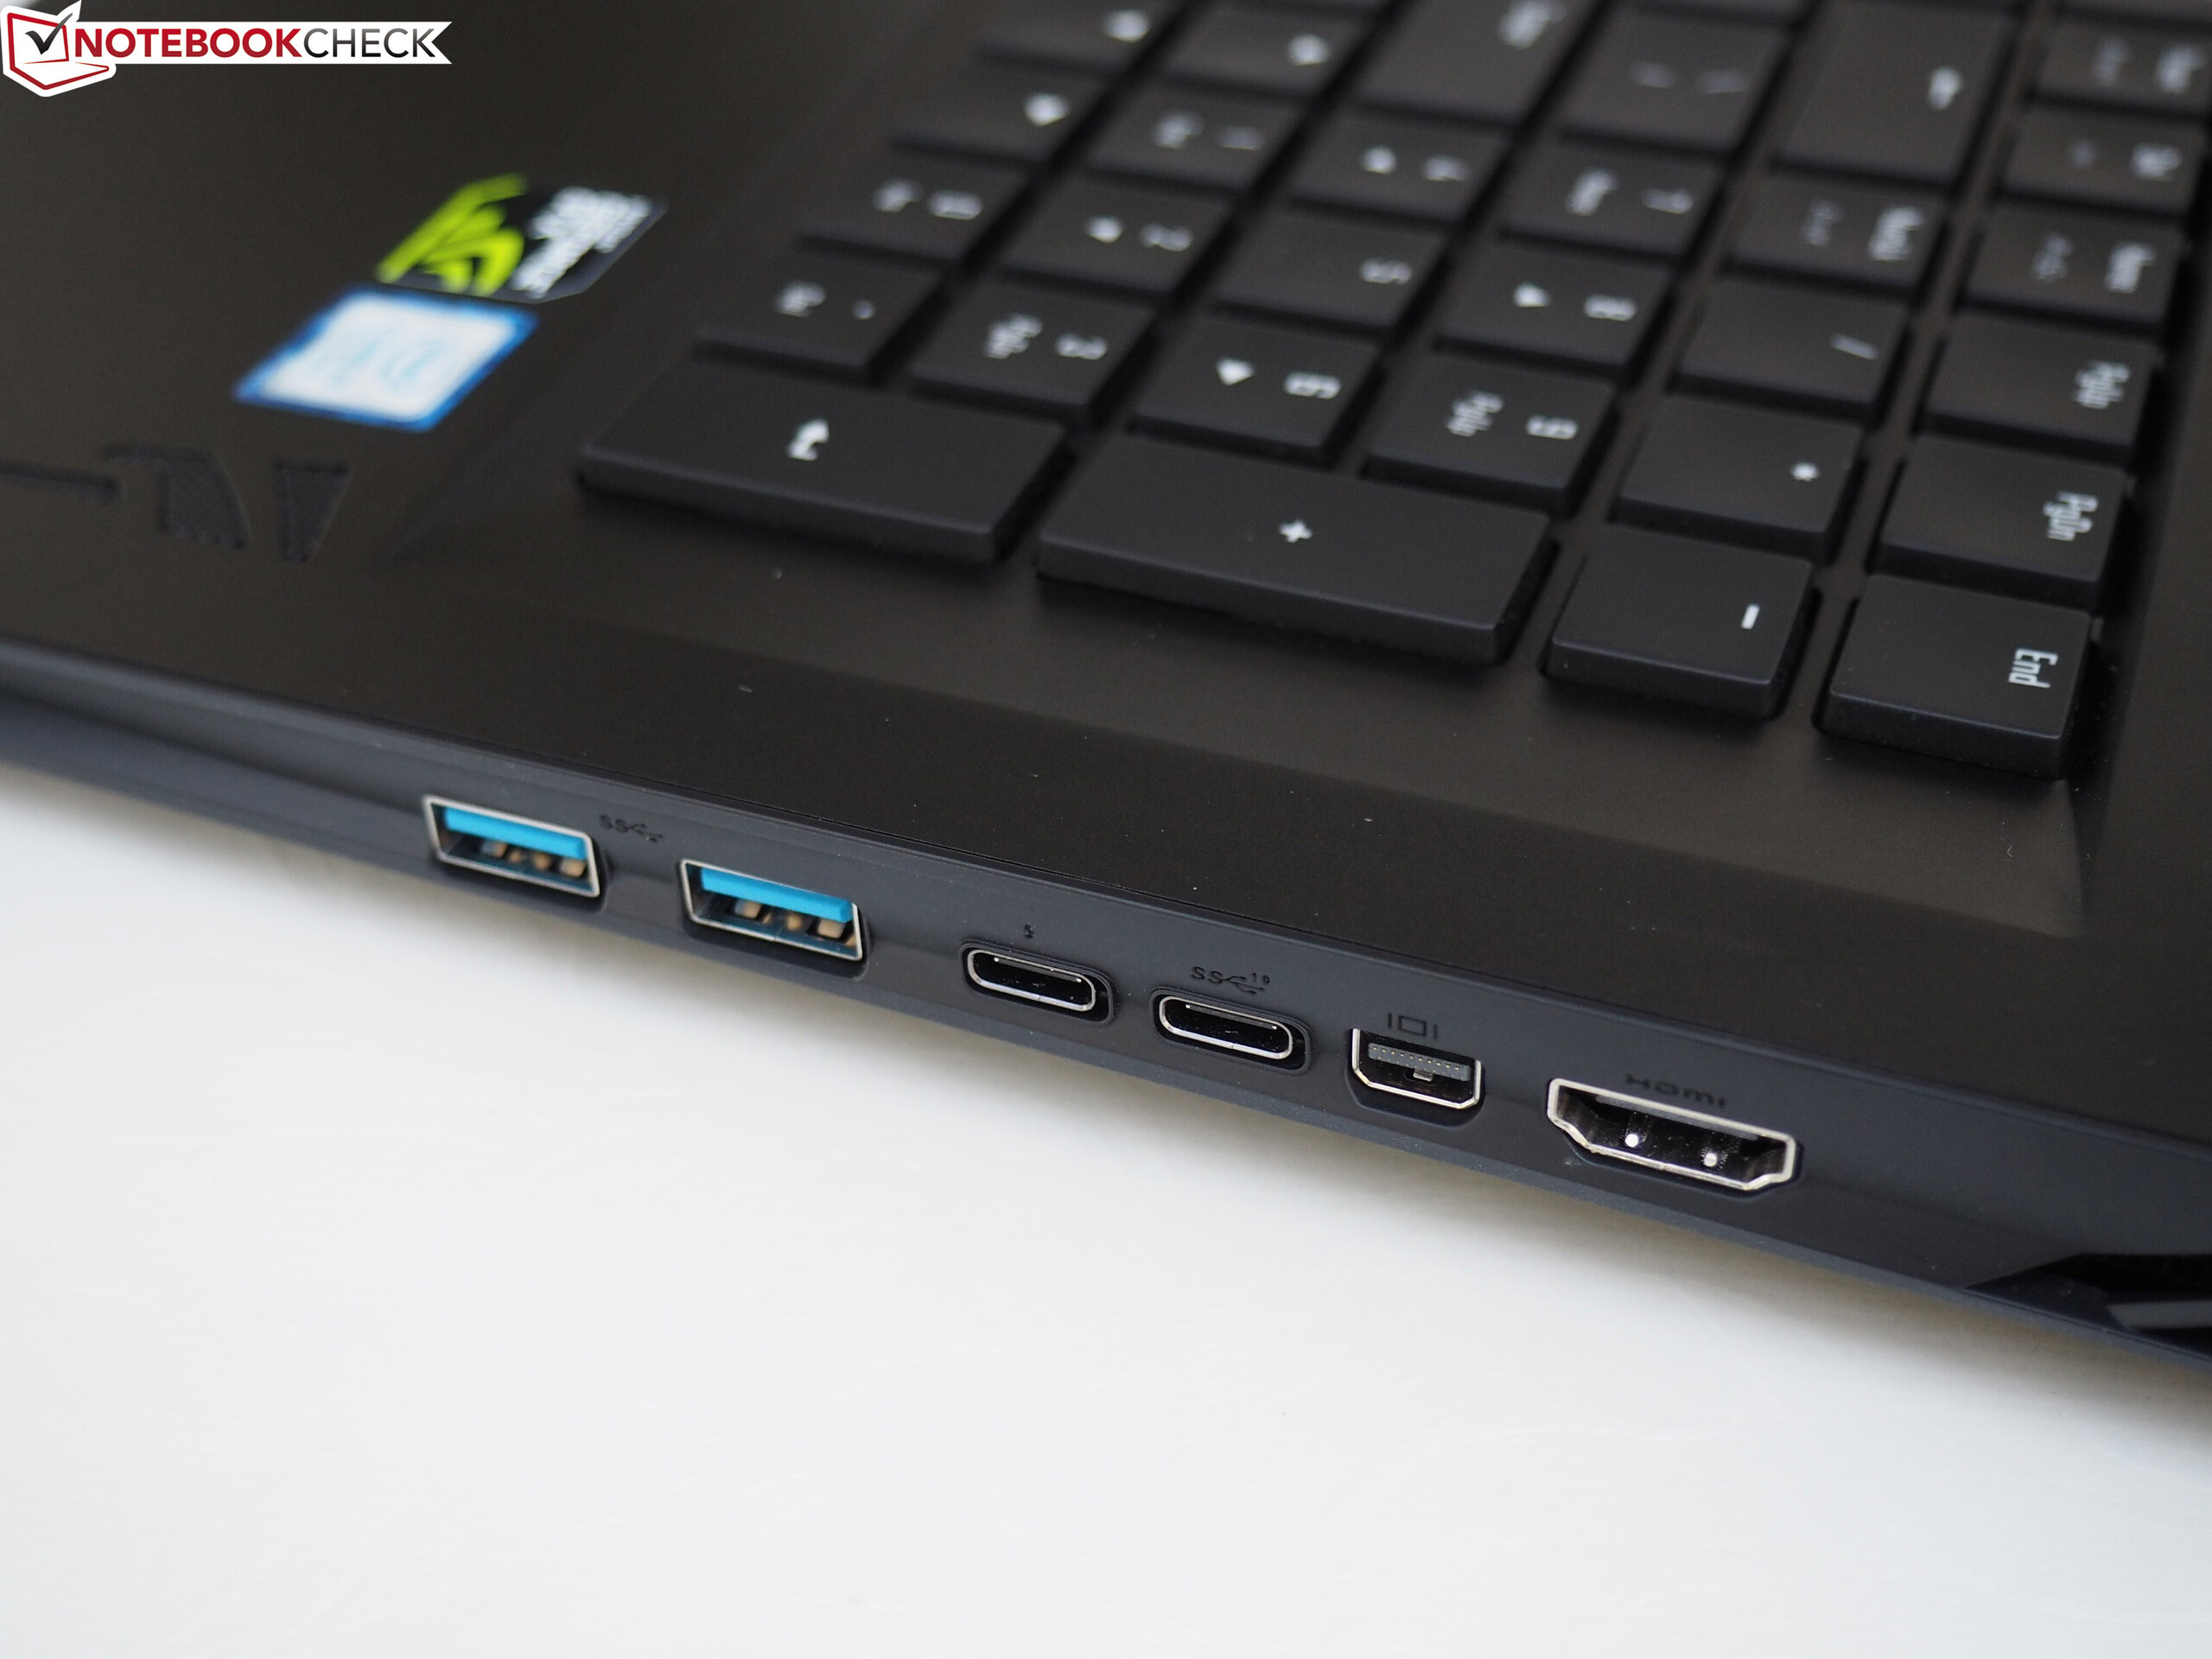
Det sistnämnda är en särskilt god nyhet och får 17 tums-enheten att stå ut bland många andra exklusiva laptops. Den har också bra anslutbarhet som kan hålla jämna steg med konkurrensen. X9 är till exempel utrustad med en modern Thunderbolt 3-port.
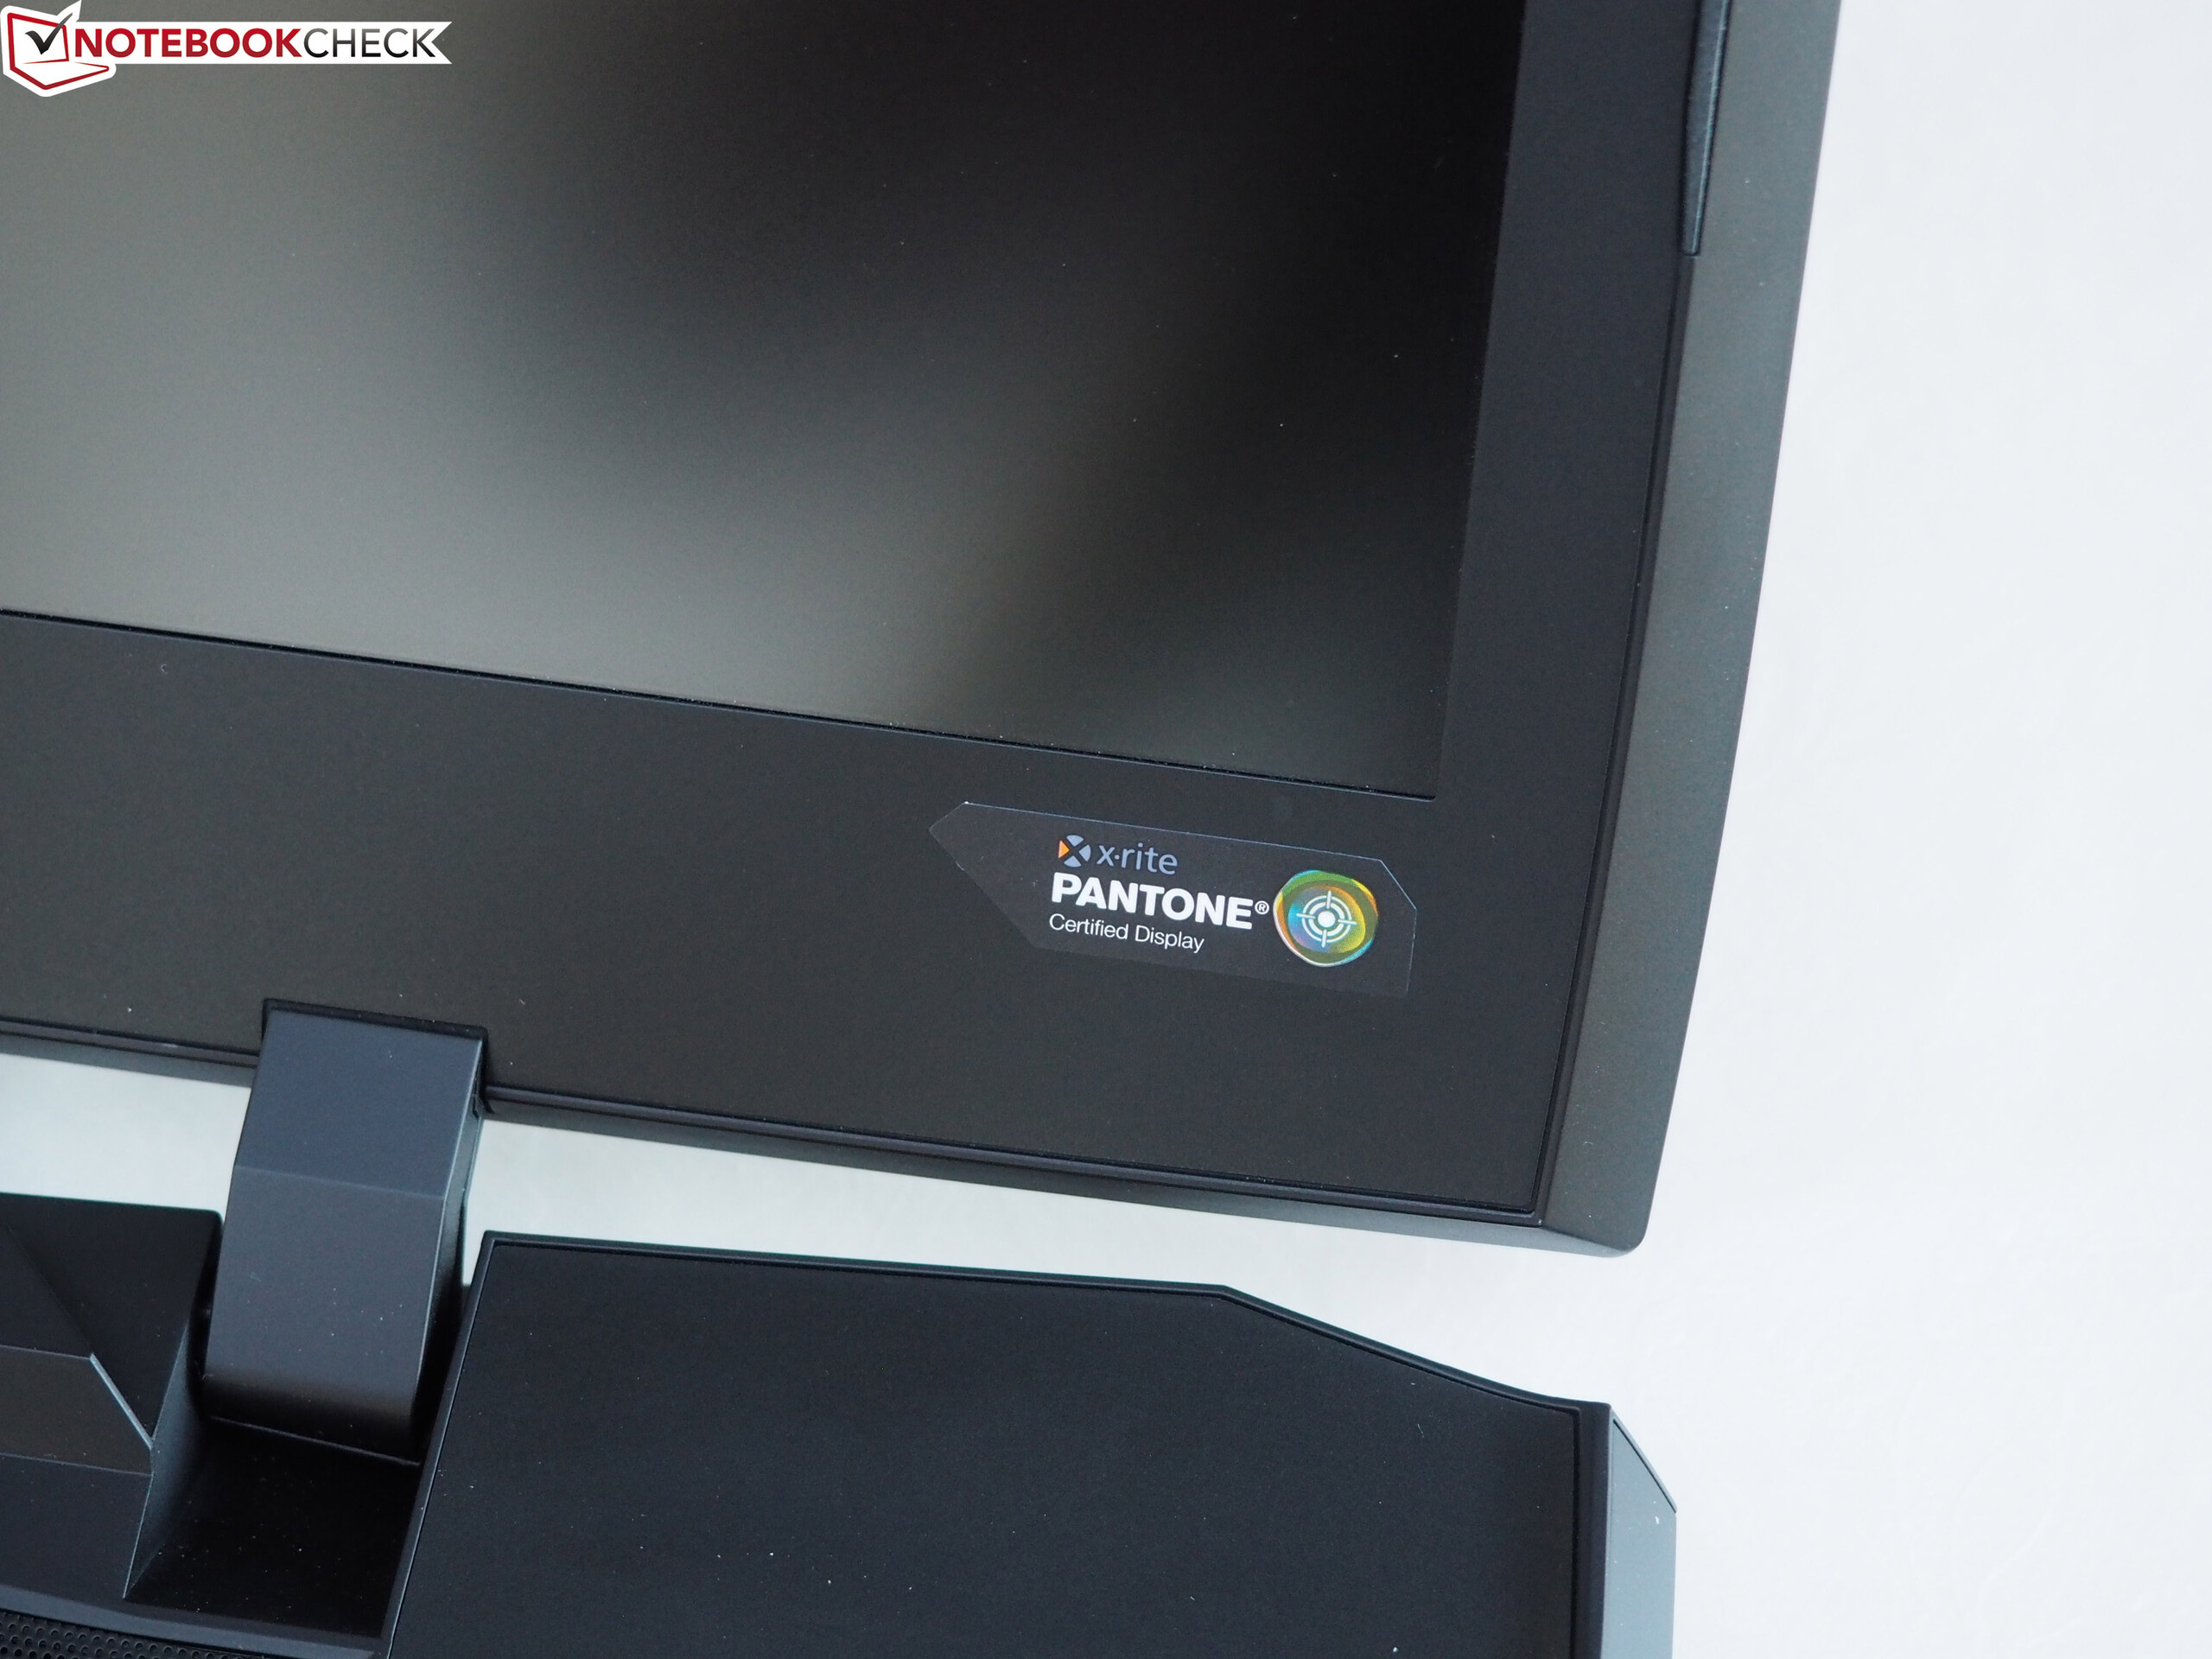
Vi var mindre nöjda med QHD-skärmen, som stödjer 120 Hz, har låg responstid och är certifierad för X-Rite Pantone, men som även har dålig kontrastratio, svärta och instabila bektraktningsvinklar. Vi blev också besvikna på batteritiden och systemets ljudnivå. 17 tums-enheten blir helt enkelt för högljudd vid 3D-applikationer för vår smak. Det bra ljudsystemet kan inte helt kompensera för dessa brister.
Att välja att använda SLI-teknologi har skapat ytterligare fördelar och svårigheter. Å ena sidan så kan Aorus X9 erbjuda överträffande prestanda i program kompatibla med dual-GPU, som till och med får modeller med GTX 1080 att skämmas. Å andra sidan så har den extra GPU:n - överraskande - en negativ inverkan på kylningen (temperatur och ljudnivå), energiåtgång och mobilitet - detta utöver faktum att alla aktuella spel inte ens stödjer SLI, vilket för dessa fall gör en extra GTX 1070 överflödig.
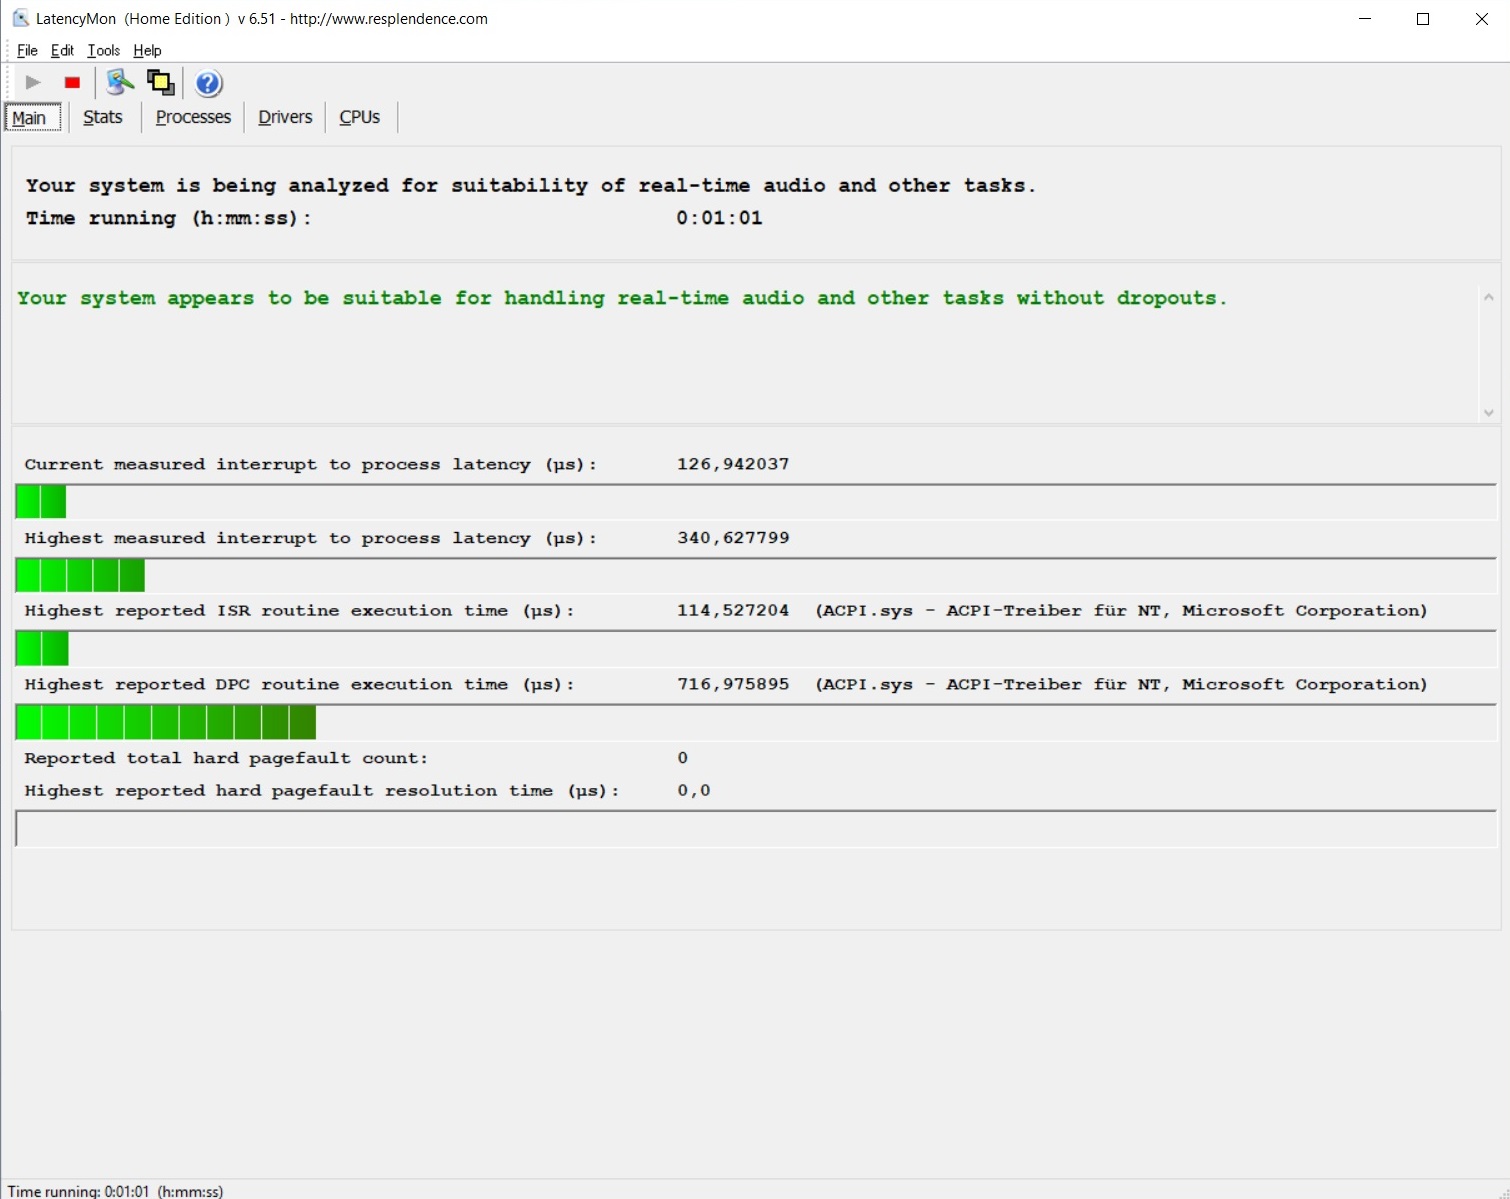
Med det höga beroendet på drivrutiner och en tendens till mikro-avbrott så är system med dual-GPU gjorda för riktiga entusiaster snarare än en genomsnittlig spelare. Om du helt enkelt vill slå på enheten och spela, utan att konstant behöva bry dig om drivrutinsuppdateringar och fortfarande förvänta dig bra prestanda för upplösningar över 1920x1080 så borde du hålla dig till en dator med en enkel GPU. (Med GeForce GTX 1070 eller GTX 1080). Generellt så är Aorus X9 inte riktigt tillräckligt bra för att komma med i vår rankinglista Topp 10 Speldatorer.
Aorus X9
- 04/14/2018 v6 (old)
Florian Glaser
Price comparison