Test: Alienware 15 R3 (sammanfattning)
| Networking | |
| iperf3 transmit AX12 | |
| Alienware 15 R3 | |
| Schenker XMG P507 PRO | |
| iperf3 receive AX12 | |
| Alienware 15 R3 | |
| Schenker XMG P507 PRO | |
| |||||||||||||||||||||||||
Distribution av ljusstyrkan: 93 %
Mitt på batteriet: 386 cd/m²
Kontrast: 990:1 (Svärta: 0.39 cd/m²)
ΔE ColorChecker Calman: 10.2 | ∀{0.5-29.43 Ø4.71}
ΔE Greyscale Calman: 11.28 | ∀{0.09-98 Ø4.96}
90% sRGB (Argyll 1.6.3 3D)
59% AdobeRGB 1998 (Argyll 1.6.3 3D)
66.2% AdobeRGB 1998 (Argyll 3D)
90.5% sRGB (Argyll 3D)
66% Display P3 (Argyll 3D)
Gamma: 2.23
CCT: 11383 K
| Alienware 15 R3 HPJGK_B156HTN (AUO51ED), 1920x1080 | Alienware 15 R2 (Skylake) Samsung 4NDDJ_156HL (SDC4C48), 1920x1080 | Asus Strix GL502VS-FY032T LG Philips LP156WF6-SPB6 (LGD046F), 1920x1080 | MSI GT62VR-6RE16H21 LG Philips LP156WF6 (LGD046F), 1920x1080 | Schenker XMG P507 PRO AUO B156HTN05.2 (AUO52ED), 1920x1080 | |
|---|---|---|---|---|---|
| Display | -36% | -6% | -5% | -1% | |
| Display P3 Coverage (%) | 66 | 40.3 -39% | 64.5 -2% | 64.6 -2% | 66.4 1% |
| sRGB Coverage (%) | 90.5 | 60.2 -33% | 83.1 -8% | 84.6 -7% | 88.9 -2% |
| AdobeRGB 1998 Coverage (%) | 66.2 | 41.67 -37% | 60.8 -8% | 61.8 -7% | 65.1 -2% |
| Response Times | -114% | -72% | -60% | 2% | |
| Response Time Grey 50% / Grey 80% * (ms) | 25 ? | 48.8 ? -95% | 38 ? -52% | 34 ? -36% | 24 ? 4% |
| Response Time Black / White * (ms) | 12 ? | 28 ? -133% | 23 ? -92% | 22 ? -83% | 12 ? -0% |
| PWM Frequency (Hz) | 200 ? | ||||
| Screen | -7% | 11% | 15% | -6% | |
| Brightness middle (cd/m²) | 386 | 180 -53% | 315 -18% | 273 -29% | 357 -8% |
| Brightness (cd/m²) | 382 | 179 -53% | 290 -24% | 278 -27% | 365 -4% |
| Brightness Distribution (%) | 93 | 83 -11% | 85 -9% | 88 -5% | 85 -9% |
| Black Level * (cd/m²) | 0.39 | 0.19 51% | 0.32 18% | 0.27 31% | 0.5 -28% |
| Contrast (:1) | 990 | 947 -4% | 984 -1% | 1011 2% | 714 -28% |
| Colorchecker dE 2000 * | 10.2 | 6.74 34% | 4.88 52% | 3.67 64% | 9.93 3% |
| Colorchecker dE 2000 max. * | 15.81 | 8.88 44% | 8.33 47% | 14.87 6% | |
| Greyscale dE 2000 * | 11.28 | 6.44 43% | 4.17 63% | 2.73 76% | 10.32 9% |
| Gamma | 2.23 99% | 2.29 96% | 2.53 87% | 2.49 88% | 2.11 104% |
| CCT | 11383 57% | 6465 101% | 6683 97% | 7029 92% | 10096 64% |
| Color Space (Percent of AdobeRGB 1998) (%) | 59 | 38 -36% | 55 -7% | 55 -7% | 58 -2% |
| Color Space (Percent of sRGB) (%) | 90 | 60 -33% | 83 -8% | 84 -7% | 89 -1% |
| Totalt genomsnitt (program/inställningar) | -52% /
-29% | -22% /
-3% | -17% /
1% | -2% /
-4% |
* ... mindre är bättre
Visa svarstider
| ↔ Svarstid svart till vitt | ||
|---|---|---|
| 12 ms ... stiga ↗ och falla ↘ kombinerat | ↗ 4 ms stiga | 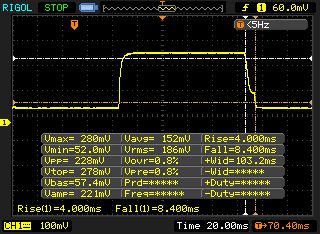 |
| ↘ 8 ms hösten | ||
| Skärmen visar bra svarsfrekvens i våra tester, men kan vara för långsam för konkurrenskraftiga spelare. I jämförelse sträcker sig alla testade enheter från 0.1 (minst) till 240 (maximalt) ms. » 32 % av alla enheter är bättre. Det betyder att den uppmätta svarstiden är bättre än genomsnittet av alla testade enheter (19.8 ms). | ||
| ↔ Svarstid 50 % grått till 80 % grått | ||
| 25 ms ... stiga ↗ och falla ↘ kombinerat | ↗ 12 ms stiga | 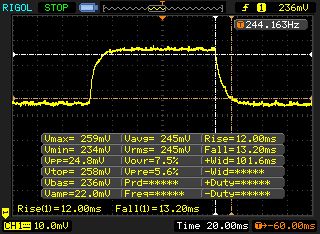 |
| ↘ 13 ms hösten | ||
| Skärmen visar relativt långsamma svarsfrekvenser i våra tester och kan vara för långsam för spelare. I jämförelse sträcker sig alla testade enheter från 0.165 (minst) till 636 (maximalt) ms. » 35 % av alla enheter är bättre. Det betyder att den uppmätta svarstiden är bättre än genomsnittet av alla testade enheter (31 ms). | ||
Skärmflimmer / PWM (Puls-Width Modulation)
| Skärmflimmer / PWM upptäcktes inte | 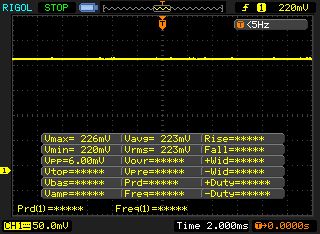 | ||
Som jämförelse: 52 % av alla testade enheter använder inte PWM för att dämpa skärmen. Om PWM upptäcktes mättes ett medelvärde av 7754 (minst: 5 - maximum: 343500) Hz. | |||
| Cinebench R15 | |
| CPU Single 64Bit | |
| Schenker XMG P507 PRO | |
| Alienware 15 R3 | |
| Asus Strix GL502VS-FY032T | |
| Alienware 15 R2 (Skylake) | |
| MSI GT62VR-6RE16H21 | |
| CPU Multi 64Bit | |
| Schenker XMG P507 PRO | |
| Alienware 15 R3 | |
| Alienware 15 R2 (Skylake) | |
| Asus Strix GL502VS-FY032T | |
| MSI GT62VR-6RE16H21 | |
| Cinebench R11.5 | |
| CPU Single 64Bit | |
| Schenker XMG P507 PRO | |
| Alienware 15 R3 | |
| Alienware 15 R2 (Skylake) | |
| MSI GT62VR-6RE16H21 | |
| Asus Strix GL502VS-FY032T | |
| CPU Multi 64Bit | |
| Schenker XMG P507 PRO | |
| Alienware 15 R3 | |
| Alienware 15 R2 (Skylake) | |
| MSI GT62VR-6RE16H21 | |
| Asus Strix GL502VS-FY032T | |
| PCMark 8 | |
| Home Score Accelerated v2 | |
| Alienware 15 R3 | |
| Asus Strix GL502VS-FY032T | |
| MSI GT62VR-6RE16H21 | |
| Schenker XMG P507 PRO | |
| Alienware 15 R2 (Skylake) | |
| Work Score Accelerated v2 | |
| Alienware 15 R3 | |
| Schenker XMG P507 PRO | |
| Alienware 15 R2 (Skylake) | |
| Asus Strix GL502VS-FY032T | |
| MSI GT62VR-6RE16H21 | |
| PCMark 7 - Score | |
| Alienware 15 R3 | |
| Schenker XMG P507 PRO | |
| MSI GT62VR-6RE16H21 | |
| Alienware 15 R2 (Skylake) | |
| PCMark 7 Score | 6886 poäng | |
| PCMark 8 Home Score Accelerated v2 | 4966 poäng | |
| PCMark 8 Creative Score Accelerated v2 | 7678 poäng | |
| PCMark 8 Work Score Accelerated v2 | 5299 poäng | |
Hjälp | ||
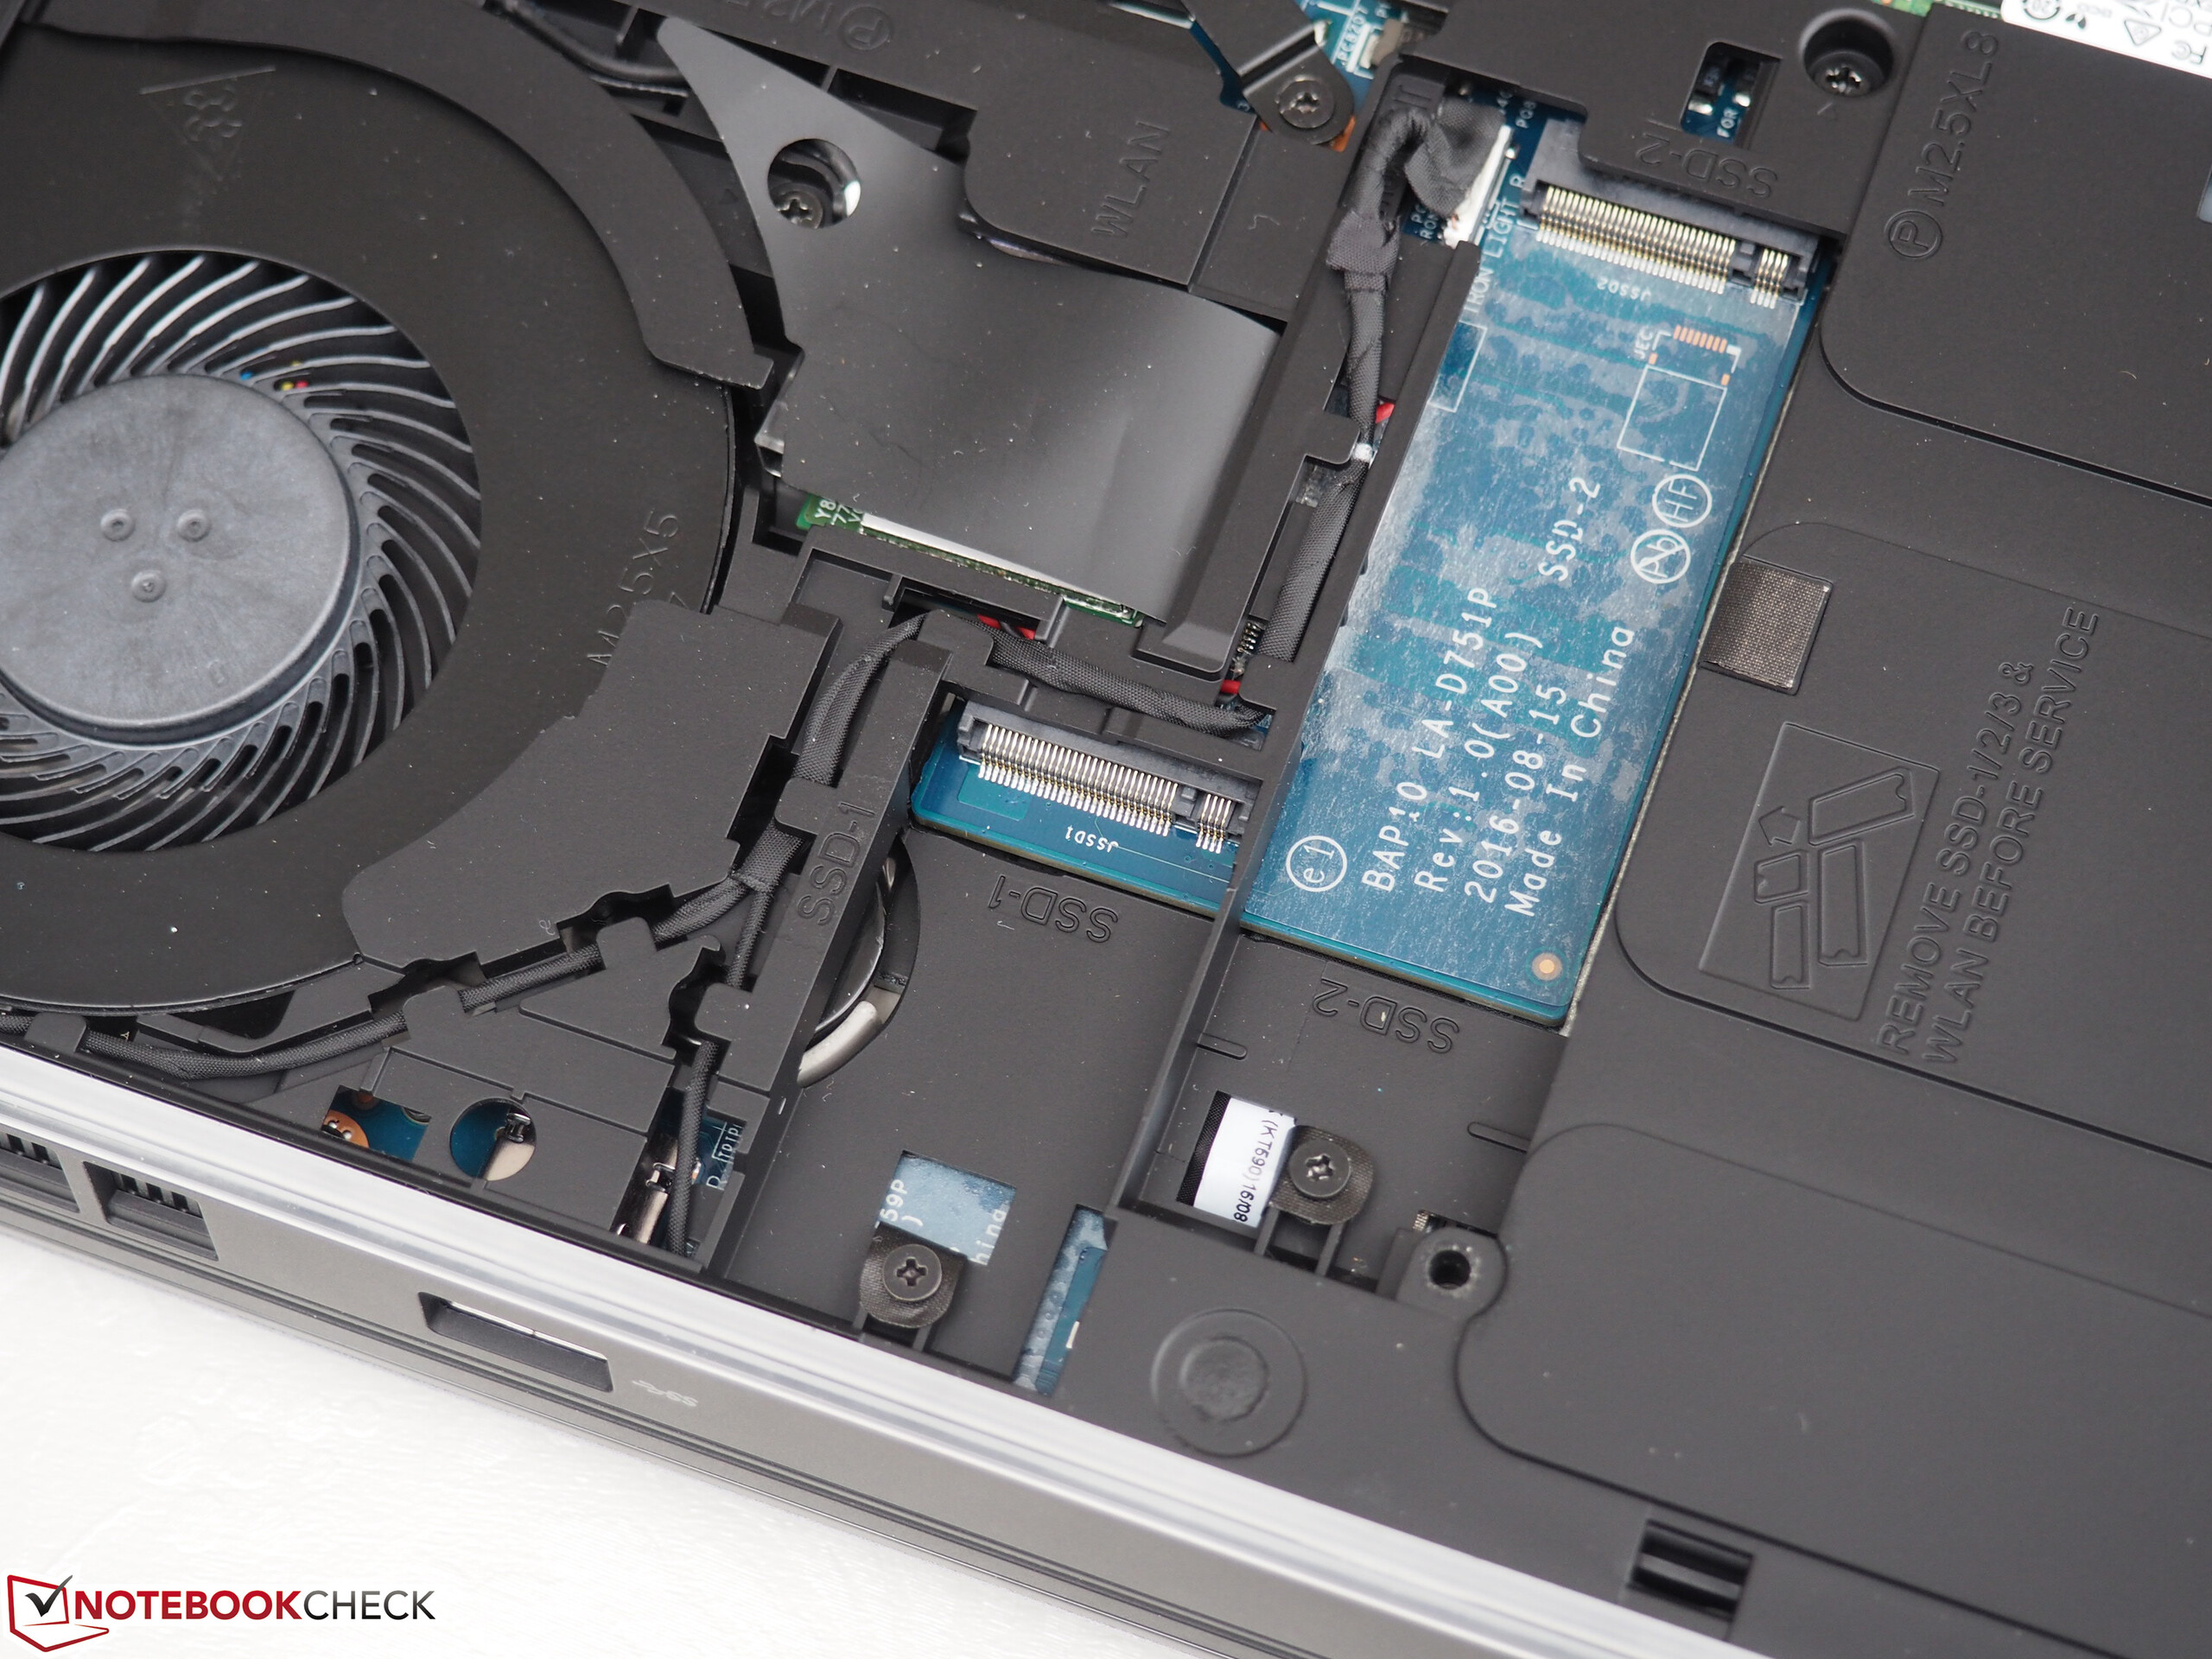
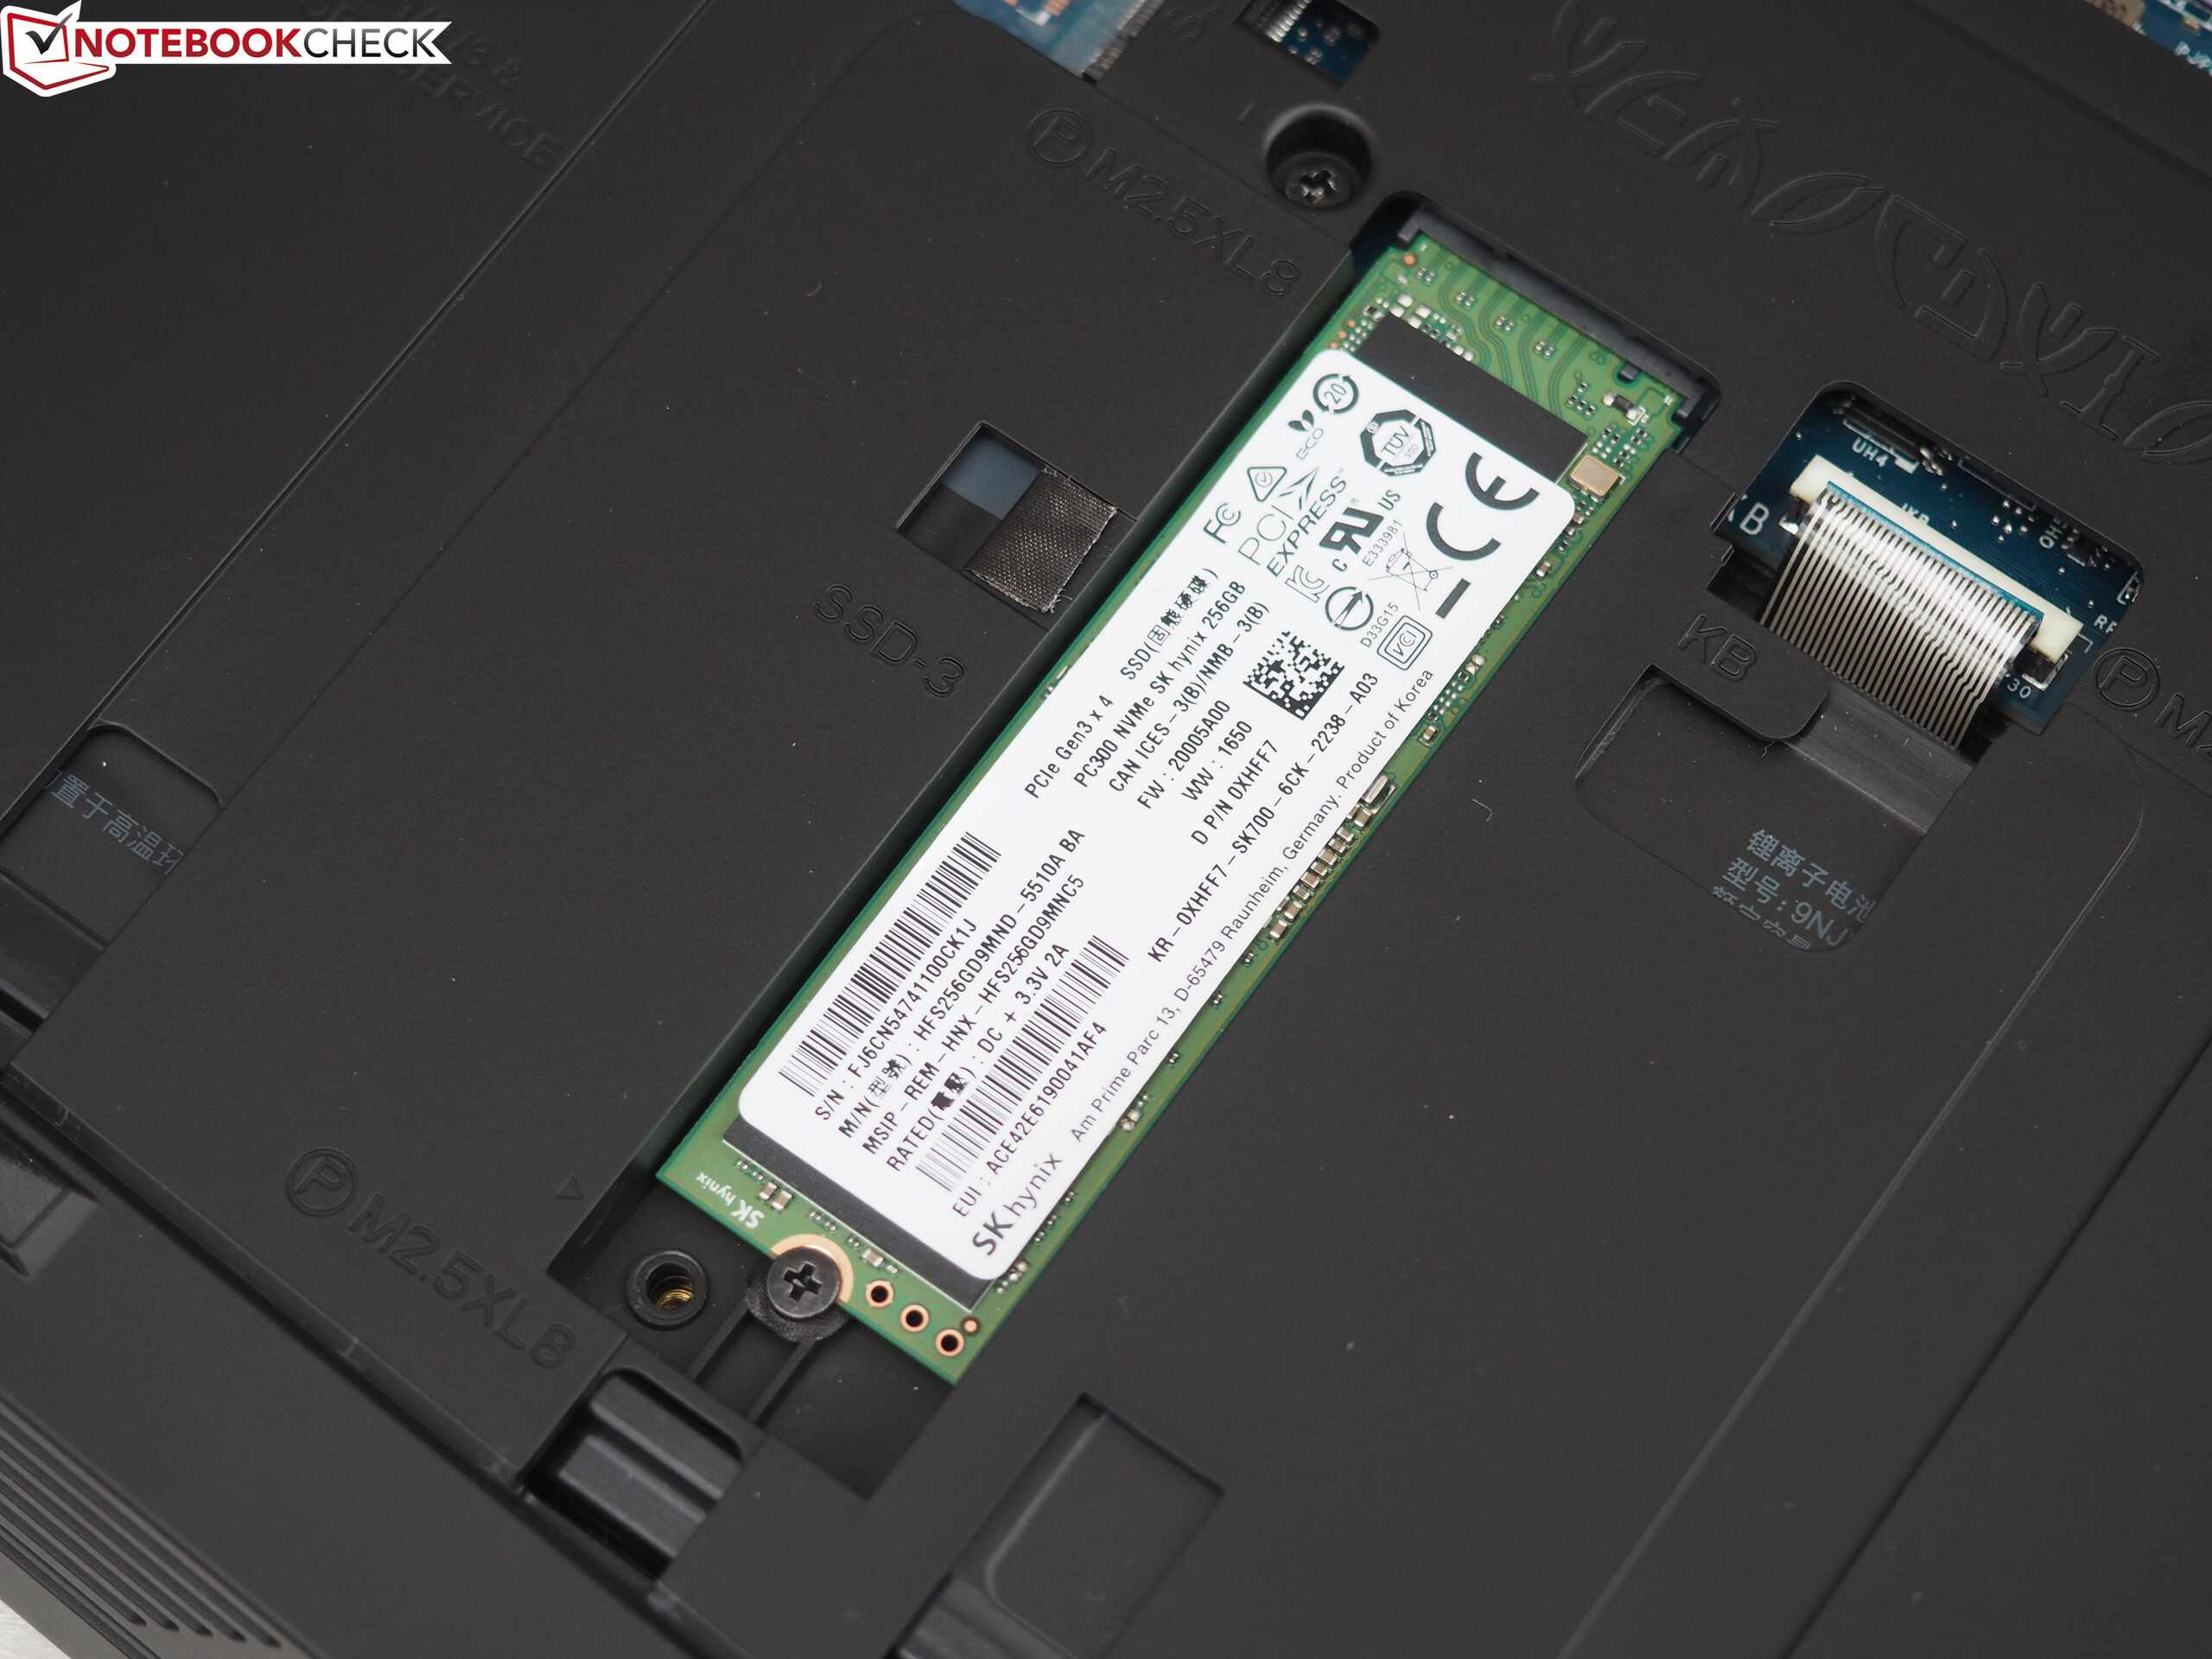
| Alienware 15 R3 | Alienware 15 R2 (Skylake) Samsung PM951 NVMe MZ-VLV256D | Asus Strix GL502VS-FY032T SanDisk SD8SNAT256G1002 | MSI GT62VR-6RE16H21 Toshiba HG6 THNSNJ256G8NY | Schenker XMG P507 PRO Samsung SSD 960 Evo 500GB m.2 NVMe | |
|---|---|---|---|---|---|
| CrystalDiskMark 3.0 | -7% | -44% | -23% | 104% | |
| Read Seq (MB/s) | 1123 | 1213 8% | 485.4 -57% | 523 -53% | 1718 53% |
| Write Seq (MB/s) | 429.2 | 306 -29% | 312.4 -27% | 485.5 13% | 1635 281% |
| Read 512 (MB/s) | 833 | 652 -22% | 294.8 -65% | 444.7 -47% | 873 5% |
| Write 512 (MB/s) | 428.1 | 304.8 -29% | 287.8 -33% | 471.2 10% | 1216 184% |
| Read 4k (MB/s) | 37.8 | 42.62 13% | 21.44 -43% | 21.86 -42% | 59.1 56% |
| Write 4k (MB/s) | 122.9 | 143.7 17% | 75.7 -38% | 98.8 -20% | 177.5 44% |

| 3DMark - 1920x1080 Fire Strike Graphics | |
| Alienware 15 R3 | |
| MSI GT62VR-6RE16H21 | |
| Schenker XMG P507 PRO | |
| Asus Strix GL502VS-FY032T | |
| Alienware 15 R2 (Skylake) | |
| 3DMark 11 - 1280x720 Performance GPU | |
| Alienware 15 R3 | |
| MSI GT62VR-6RE16H21 | |
| Asus Strix GL502VS-FY032T | |
| Schenker XMG P507 PRO | |
| Alienware 15 R2 (Skylake) | |
| Unigine Heaven 4.0 - Extreme Preset DX11 | |
| Alienware 15 R3 | |
| Schenker XMG P507 PRO | |
| MSI GT62VR-6RE16H21 | |
| Alienware 15 R2 (Skylake) | |
| 3DMark 11 Performance | 16435 poäng | |
| 3DMark Ice Storm Standard Score | 135715 poäng | |
| 3DMark Cloud Gate Standard Score | 26672 poäng | |
| 3DMark Fire Strike Score | 13728 poäng | |
Hjälp | ||
| Titanfall 2 | |
| 1920x1080 Very High (Insane Texture Quality) / Enabled AA:TS AF:16x | |
| Alienware 15 R3 | |
| Schenker XMG P507 PRO | |
| 1920x1080 High / Enabled AA:TS AF:8x | |
| Alienware 15 R3 | |
| Schenker XMG P507 PRO | |
| Call of Duty Infinite Warfare | |
| 1920x1080 Ultra / On AA:T2X SM | |
| Alienware 15 R3 | |
| Schenker XMG P507 PRO | |
| 1920x1080 High / On AA:FX | |
| Alienware 15 R3 | |
| Schenker XMG P507 PRO | |
| Dishonored 2 | |
| 1920x1080 Ultra Preset AA:TX | |
| Alienware 15 R3 | |
| Schenker XMG P507 PRO | |
| 1920x1080 High Preset AA:TX | |
| Schenker XMG P507 PRO | |
| Alienware 15 R3 | |
| Watch Dogs 2 | |
| 1920x1080 Ultra Preset | |
| Alienware 15 R3 | |
| Schenker XMG P507 PRO | |
| 1920x1080 High Preset | |
| Alienware 15 R3 | |
| Schenker XMG P507 PRO | |
| Resident Evil 7 | |
| 1920x1080 Very High / On AA:FXAA+T | |
| Alienware 15 R3 | |
| 1920x1080 High / On AA:FXAA+T | |
| Alienware 15 R3 | |
| Battlefield 1 | |
| 1920x1080 Ultra Preset AA:T | |
| Alienware 15 R3 | |
| 1920x1080 High Preset AA:T | |
| Alienware 15 R3 | |
| låg | med. | hög | ultra | |
|---|---|---|---|---|
| Battlefield 1 (2016) | 121 | 109 | ||
| Titanfall 2 (2016) | 132 | 121 | ||
| Call of Duty Infinite Warfare (2016) | 121 | 114 | ||
| Dishonored 2 (2016) | 85 | 73.3 | ||
| Watch Dogs 2 (2016) | 83.2 | 62.9 | ||
| Resident Evil 7 (2017) | 156 | 130 |
Ljudnivå
| Låg belastning |
| 31 / 32 / 42 dB(A) |
| Hårddisk |
| 32 dB(A) |
| Hög belastning |
| 49 / 50 dB(A) |
 | ||
30 dB tyst 40 dB(A) hörbar 50 dB(A) högt ljud |
||
min: | ||
| Alienware 15 R3 GeForce GTX 1070 Mobile, i7-7700HQ | Alienware 15 R2 (Skylake) GeForce GTX 980M, 6700HQ | Asus Strix GL502VS-FY032T GeForce GTX 1070 Mobile, 6700HQ | MSI GT62VR-6RE16H21 GeForce GTX 1070 Mobile, 6700HQ | Schenker XMG P507 PRO GeForce GTX 1070 Mobile, i7-7700HQ | |
|---|---|---|---|---|---|
| Noise | 4% | 5% | 7% | -3% | |
| av / miljö * (dB) | 30 | 30 -0% | 30 -0% | 31 -3% | |
| Idle Minimum * (dB) | 31 | 33.6 -8% | 32 -3% | 32 -3% | 33 -6% |
| Idle Average * (dB) | 32 | 33.8 -6% | 33 -3% | 33 -3% | 34 -6% |
| Idle Maximum * (dB) | 42 | 34 19% | 34 19% | 34 19% | 44 -5% |
| Load Average * (dB) | 49 | 39.3 20% | 39 20% | 40 18% | 46 6% |
| Load Maximum * (dB) | 50 | 51.4 -3% | 51 -2% | 46 8% | 52 -4% |
* ... mindre är bättre
(-) Den maximala temperaturen på ovansidan är 46 °C / 115 F, jämfört med genomsnittet av 40.4 °C / 105 F , allt från 21.2 till 68.8 °C för klassen Gaming.
(-) Botten värms upp till maximalt 51.8 °C / 125 F, jämfört med genomsnittet av 43.2 °C / 110 F
(+) Vid tomgångsbruk är medeltemperaturen för ovansidan 31.7 °C / 89 F, jämfört med enhetsgenomsnittet på 33.9 °C / ### class_avg_f### F.
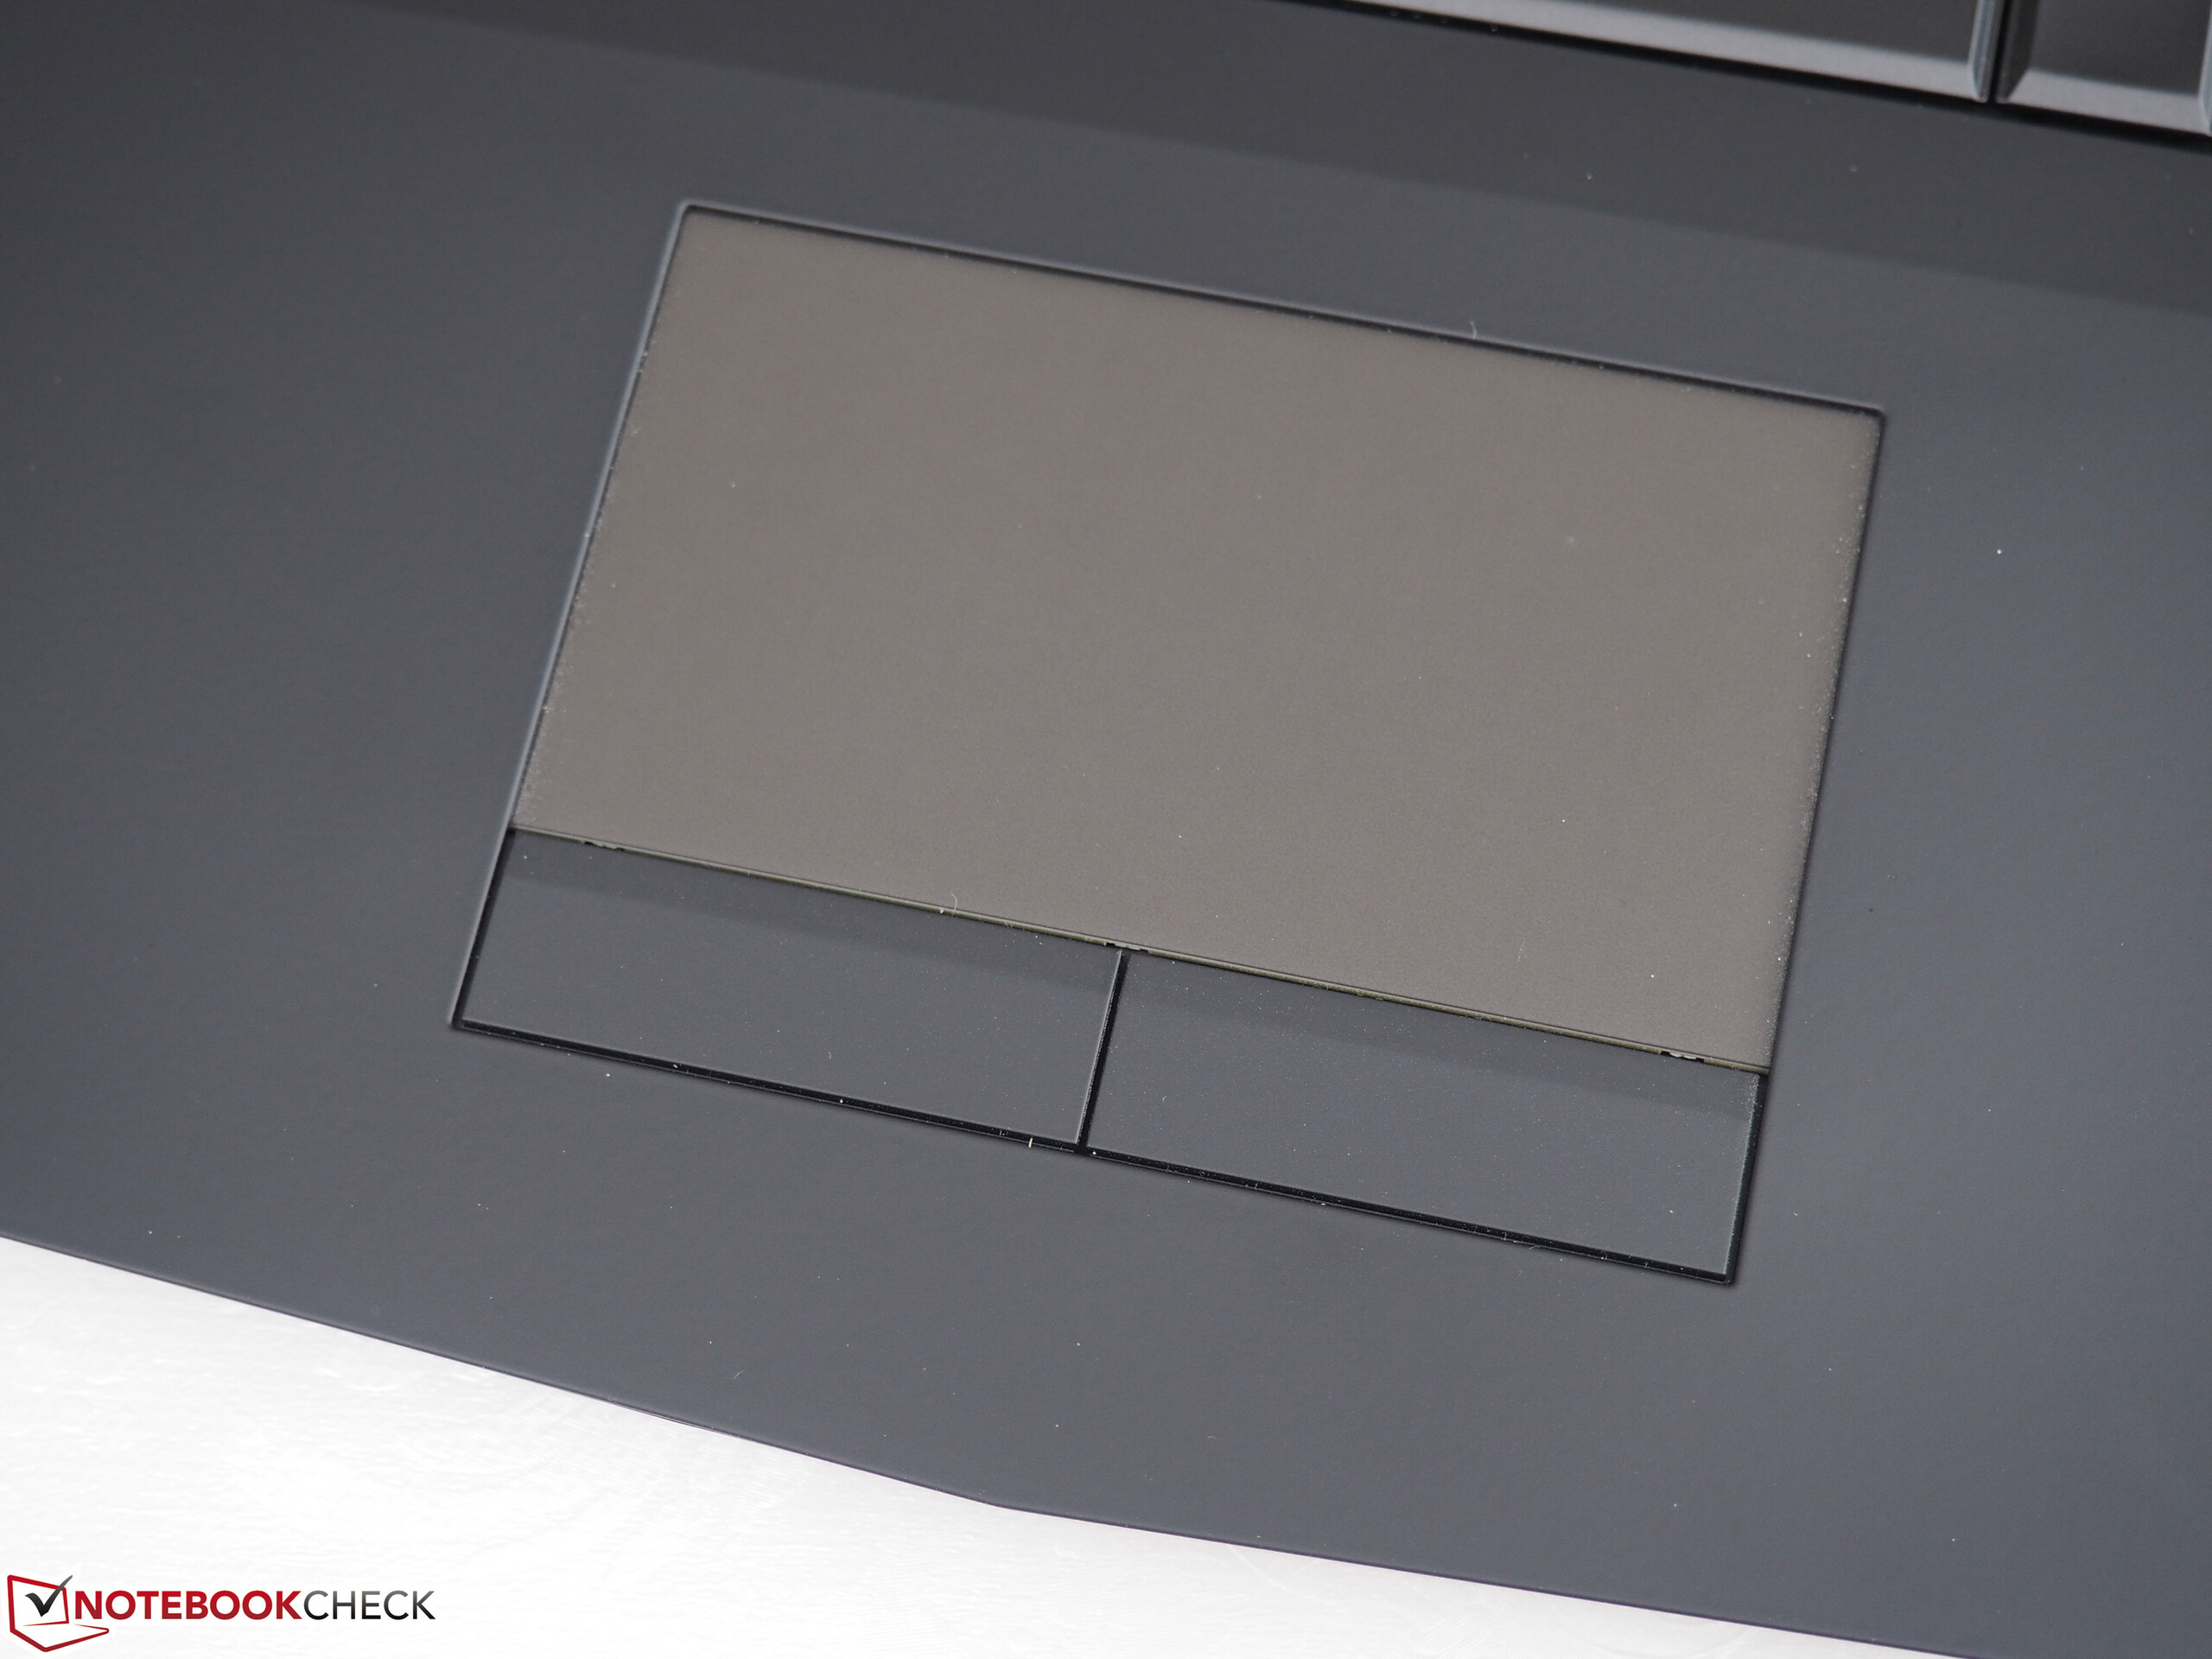
(+) Handledsstöden och pekplattan är kallare än hudtemperaturen med maximalt 26.6 °C / 79.9 F och är därför svala att ta på.
(+) Medeltemperaturen för handledsstödsområdet på liknande enheter var 28.8 °C / 83.8 F (+2.2 °C / 3.9 F).
| Alienware 15 R3 GeForce GTX 1070 Mobile, i7-7700HQ | Alienware 15 R2 (Skylake) GeForce GTX 980M, 6700HQ | Asus Strix GL502VS-FY032T GeForce GTX 1070 Mobile, 6700HQ | MSI GT62VR-6RE16H21 GeForce GTX 1070 Mobile, 6700HQ | Schenker XMG P507 PRO GeForce GTX 1070 Mobile, i7-7700HQ | |
|---|---|---|---|---|---|
| Heat | 3% | 9% | 12% | -1% | |
| Maximum Upper Side * (°C) | 46 | 48 -4% | 48 -4% | 44 4% | 49.2 -7% |
| Maximum Bottom * (°C) | 51.8 | 57.3 -11% | 46.8 10% | 53.1 -3% | 62 -20% |
| Idle Upper Side * (°C) | 36.5 | 31.9 13% | 33.7 8% | 28.8 21% | 32.4 11% |
| Idle Bottom * (°C) | 38.2 | 33.4 13% | 30.5 20% | 28.2 26% | 33 14% |
* ... mindre är bättre
Alienware 15 R3 ljudanalys
(+) | högtalare kan spela relativt högt (82 dB)
Bas 100 - 315 Hz
(-) | nästan ingen bas - i genomsnitt 19.1% lägre än medianen
(±) | linjäriteten för basen är genomsnittlig (10.4% delta till föregående frekvens)
Mellan 400 - 2000 Hz
(±) | högre mellan - i genomsnitt 6.7% högre än median
(±) | linjäriteten för mids är genomsnittlig (7.5% delta till föregående frekvens)
Högsta 2 - 16 kHz
(+) | balanserade toppar - endast 3.6% från medianen
(+) | toppar är linjära (5.2% delta till föregående frekvens)
Totalt 100 - 16 000 Hz
(±) | linjäriteten för det totala ljudet är genomsnittlig (21.6% skillnad mot median)
Jämfört med samma klass
» 77% av alla testade enheter i den här klassen var bättre, 5% liknande, 18% sämre
» Den bästa hade ett delta på 6%, genomsnittet var 18%, sämst var 132%
Jämfört med alla testade enheter
» 61% av alla testade enheter var bättre, 7% liknande, 32% sämre
» Den bästa hade ett delta på 4%, genomsnittet var 23%, sämst var 134%
Asus Strix GL502VS-FY032T ljudanalys
(±) | högtalarljudstyrkan är genomsnittlig men bra (77 dB)
Bas 100 - 315 Hz
(-) | nästan ingen bas - i genomsnitt 16.2% lägre än medianen
(±) | linjäriteten för basen är genomsnittlig (11.9% delta till föregående frekvens)
Mellan 400 - 2000 Hz
(+) | balanserad mellan - endast 0.7% från medianen
(+) | mids är linjära (3.1% delta till föregående frekvens)
Högsta 2 - 16 kHz
(+) | balanserade toppar - endast 3.5% från medianen
(±) | linjäriteten för toppar är genomsnittlig (7.4% delta till föregående frekvens)
Totalt 100 - 16 000 Hz
(±) | linjäriteten för det totala ljudet är genomsnittlig (16.8% skillnad mot median)
Jämfört med samma klass
» 44% av alla testade enheter i den här klassen var bättre, 11% liknande, 45% sämre
» Den bästa hade ett delta på 6%, genomsnittet var 18%, sämst var 132%
Jämfört med alla testade enheter
» 30% av alla testade enheter var bättre, 8% liknande, 63% sämre
» Den bästa hade ett delta på 4%, genomsnittet var 23%, sämst var 134%
| Av/Standby | |
| Låg belastning | |
| Hög belastning |
|
Förklaring:
min: | |
| Alienware 15 R3 GeForce GTX 1070 Mobile, i7-7700HQ | Alienware 15 R2 (Skylake) GeForce GTX 980M, 6700HQ | Asus Strix GL502VS-FY032T GeForce GTX 1070 Mobile, 6700HQ | MSI GT62VR-6RE16H21 GeForce GTX 1070 Mobile, 6700HQ | Schenker XMG P507 PRO GeForce GTX 1070 Mobile, i7-7700HQ | |
|---|---|---|---|---|---|
| Power Consumption | 16% | -1% | -10% | 12% | |
| Idle Minimum * (Watt) | 19 | 11.4 40% | 20 -5% | 20 -5% | 14 26% |
| Idle Average * (Watt) | 23 | 16.5 28% | 24 -4% | 26 -13% | 18 22% |
| Idle Maximum * (Watt) | 29 | 22 24% | 29 -0% | 32 -10% | 24 17% |
| Load Average * (Watt) | 85 | 94.2 -11% | 86 -1% | 100 -18% | 87 -2% |
| Load Maximum * (Watt) | 192 | 192.2 -0% | 183 5% | 202 -5% | 201 -5% |
* ... mindre är bättre
| Alienware 15 R3 GeForce GTX 1070 Mobile, i7-7700HQ, 99 Wh | Alienware 15 R2 (Skylake) GeForce GTX 980M, 6700HQ, 96 Wh | Asus Strix GL502VS-FY032T GeForce GTX 1070 Mobile, 6700HQ, 62 Wh | MSI GT62VR-6RE16H21 GeForce GTX 1070 Mobile, 6700HQ, 75.24 Wh | Schenker XMG P507 PRO GeForce GTX 1070 Mobile, i7-7700HQ, 60 Wh | |
|---|---|---|---|---|---|
| Batteridrifttid | 63% | -34% | -12% | -22% | |
| Reader / Idle (h) | 6.4 | 12.8 100% | 4.1 -36% | 5 -22% | |
| H.264 (h) | 4.4 | 7.6 73% | 3.6 -18% | ||
| WiFi v1.3 (h) | 4.4 | 7.4 68% | 3.3 -25% | 4.1 -7% | 3.3 -25% |
| Load (h) | 1.7 | 1.9 12% | 1 -41% | 1.6 -6% |
För
Emot
Läs det längre originaltestet på engelska här.
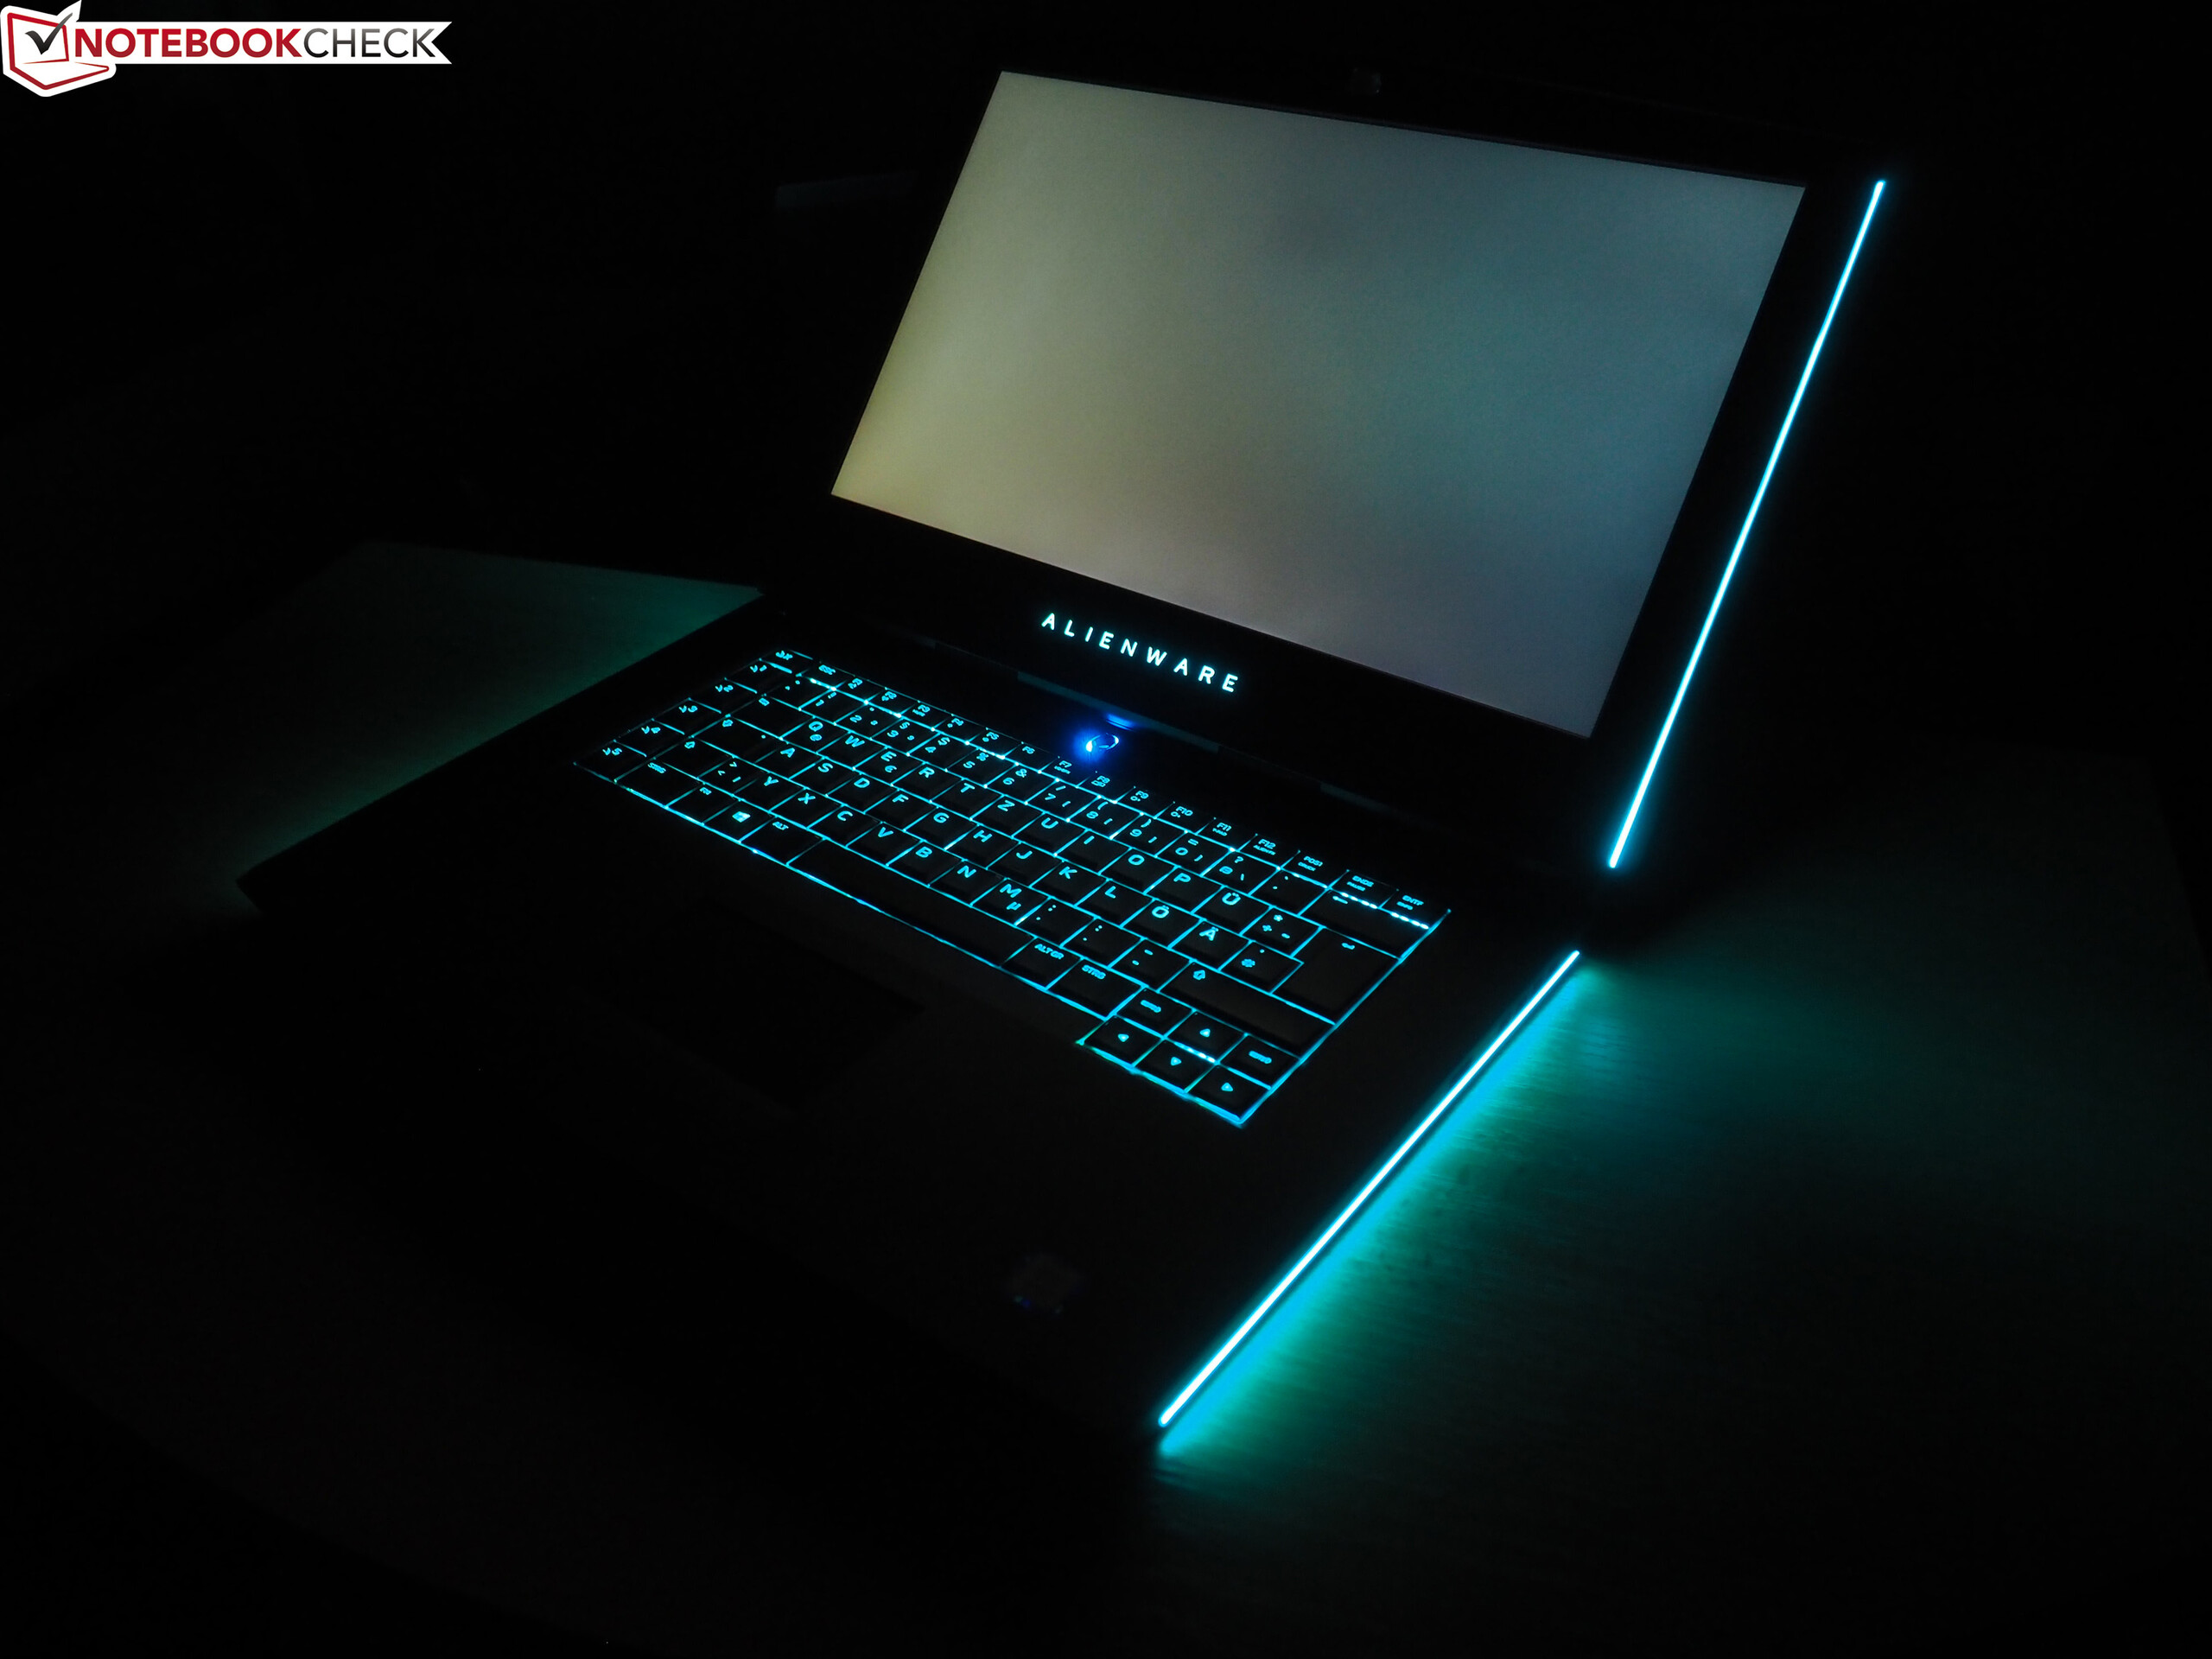
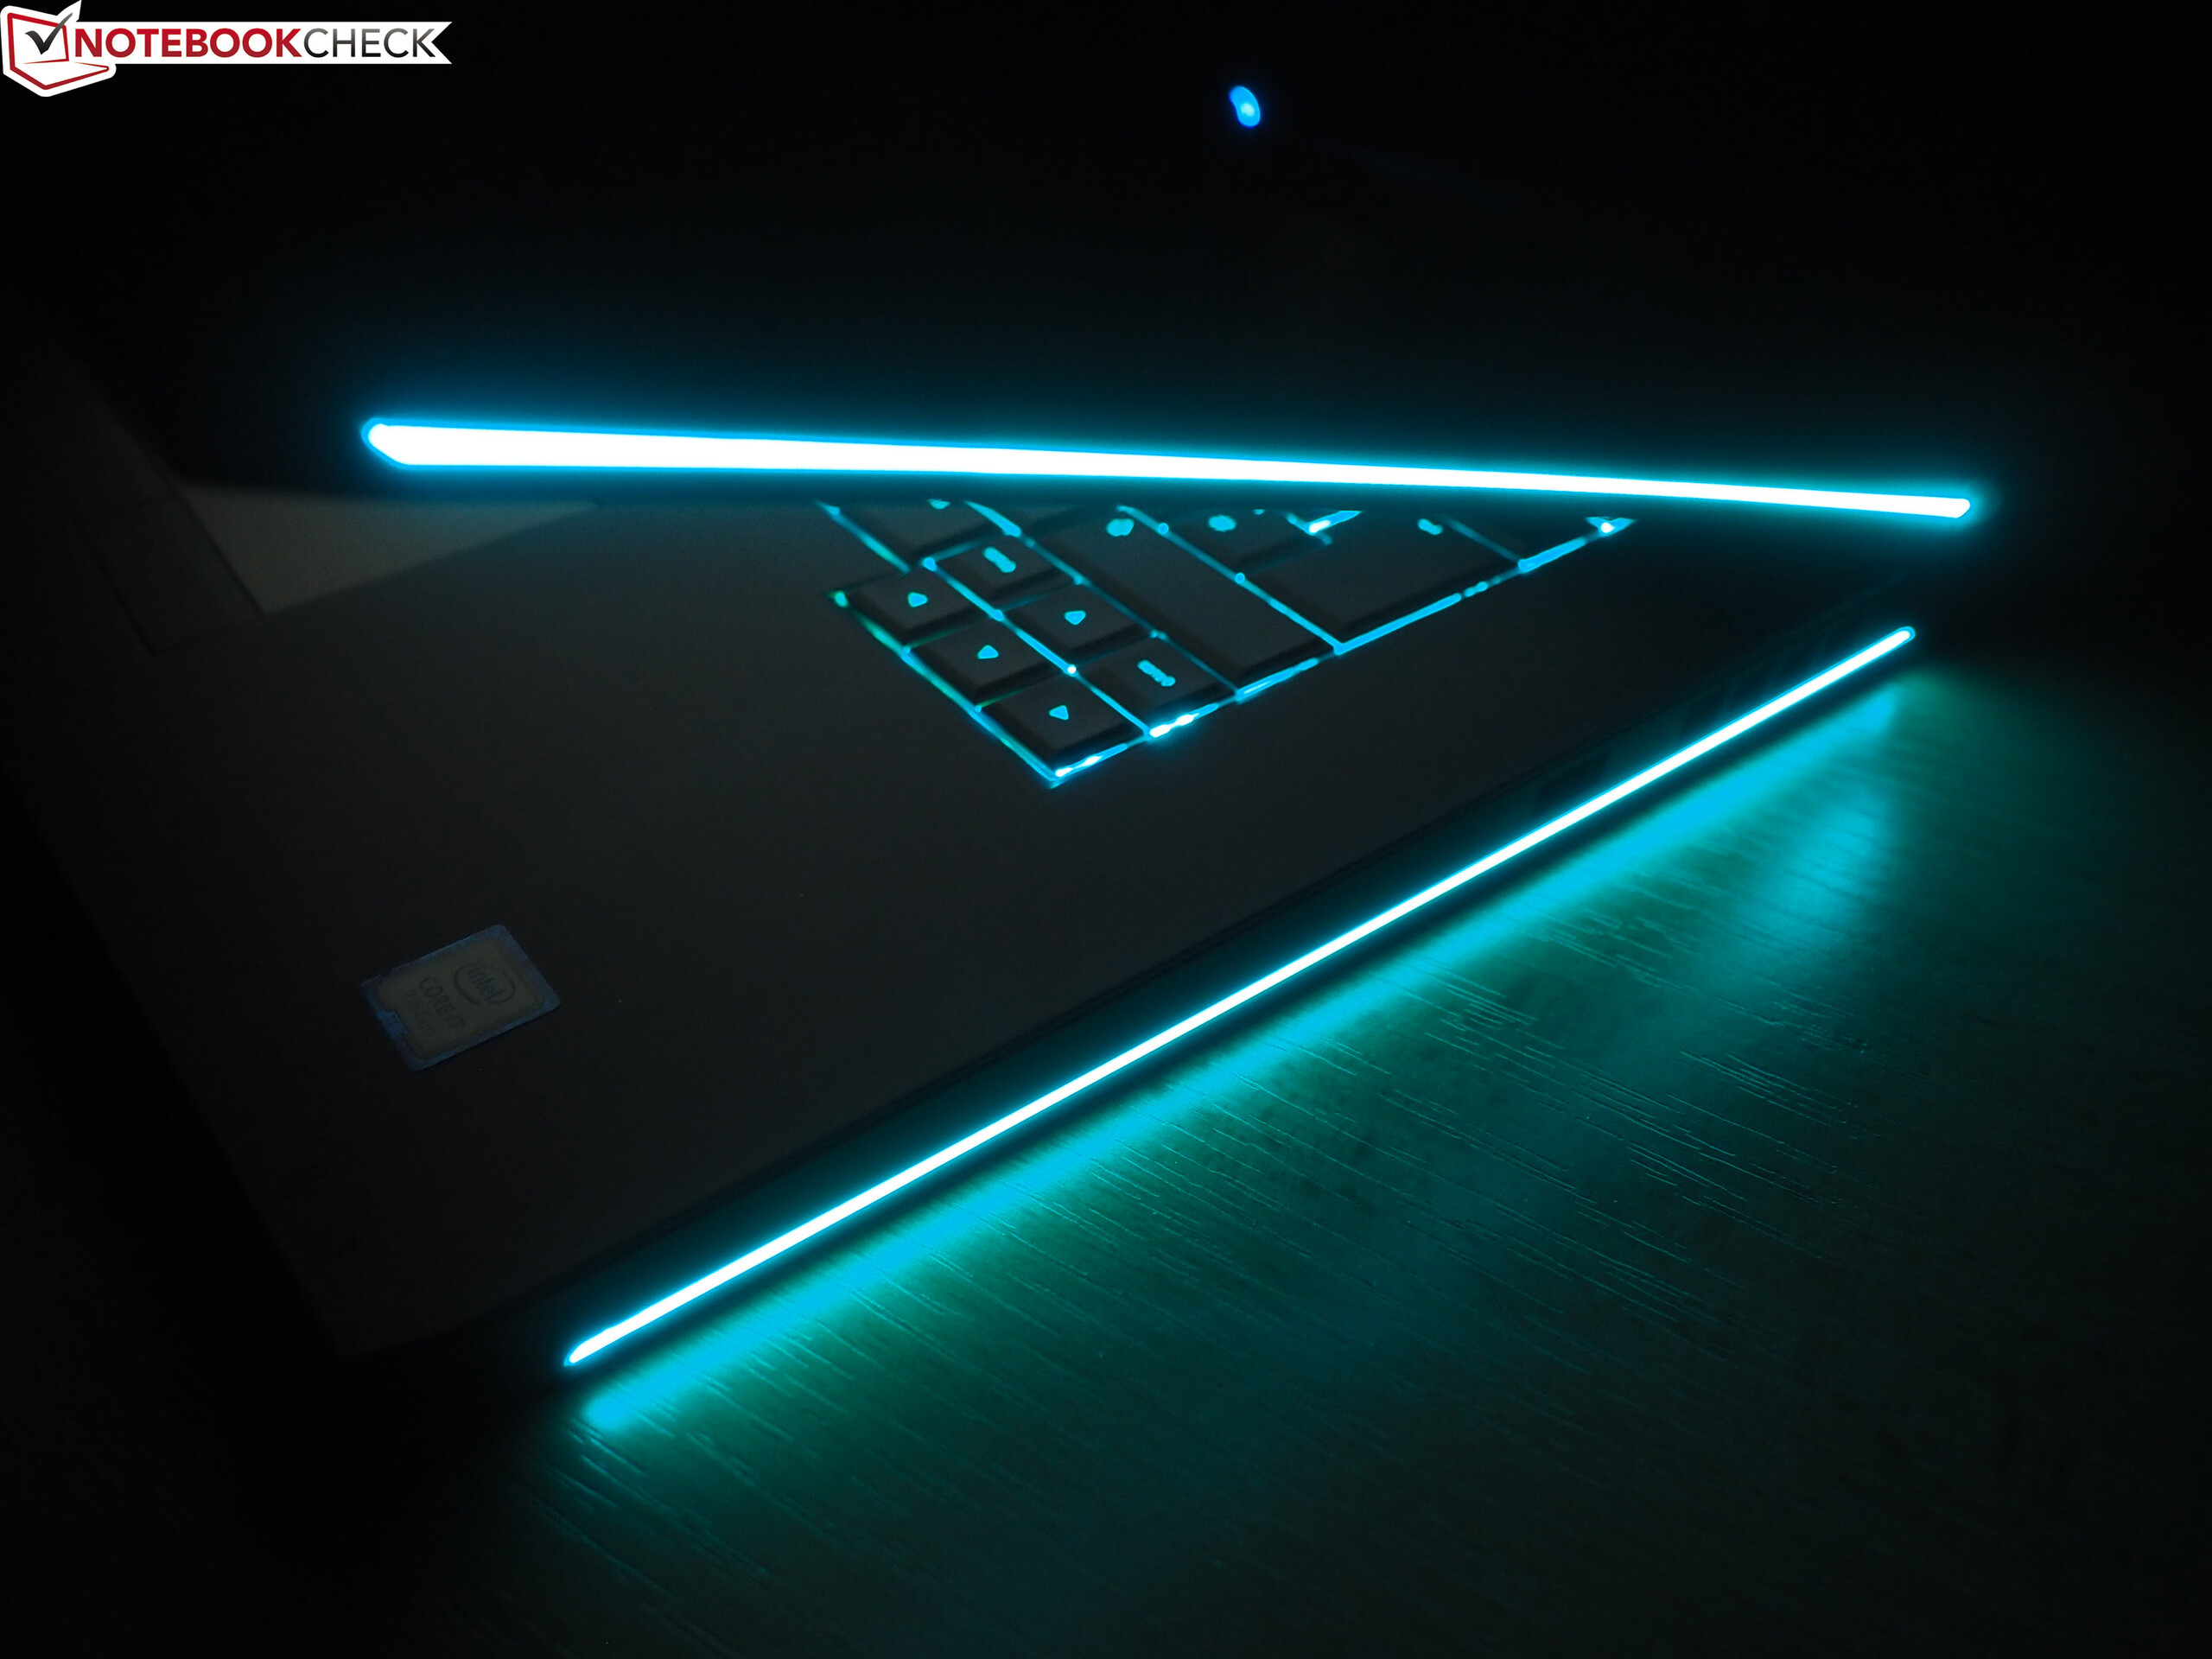
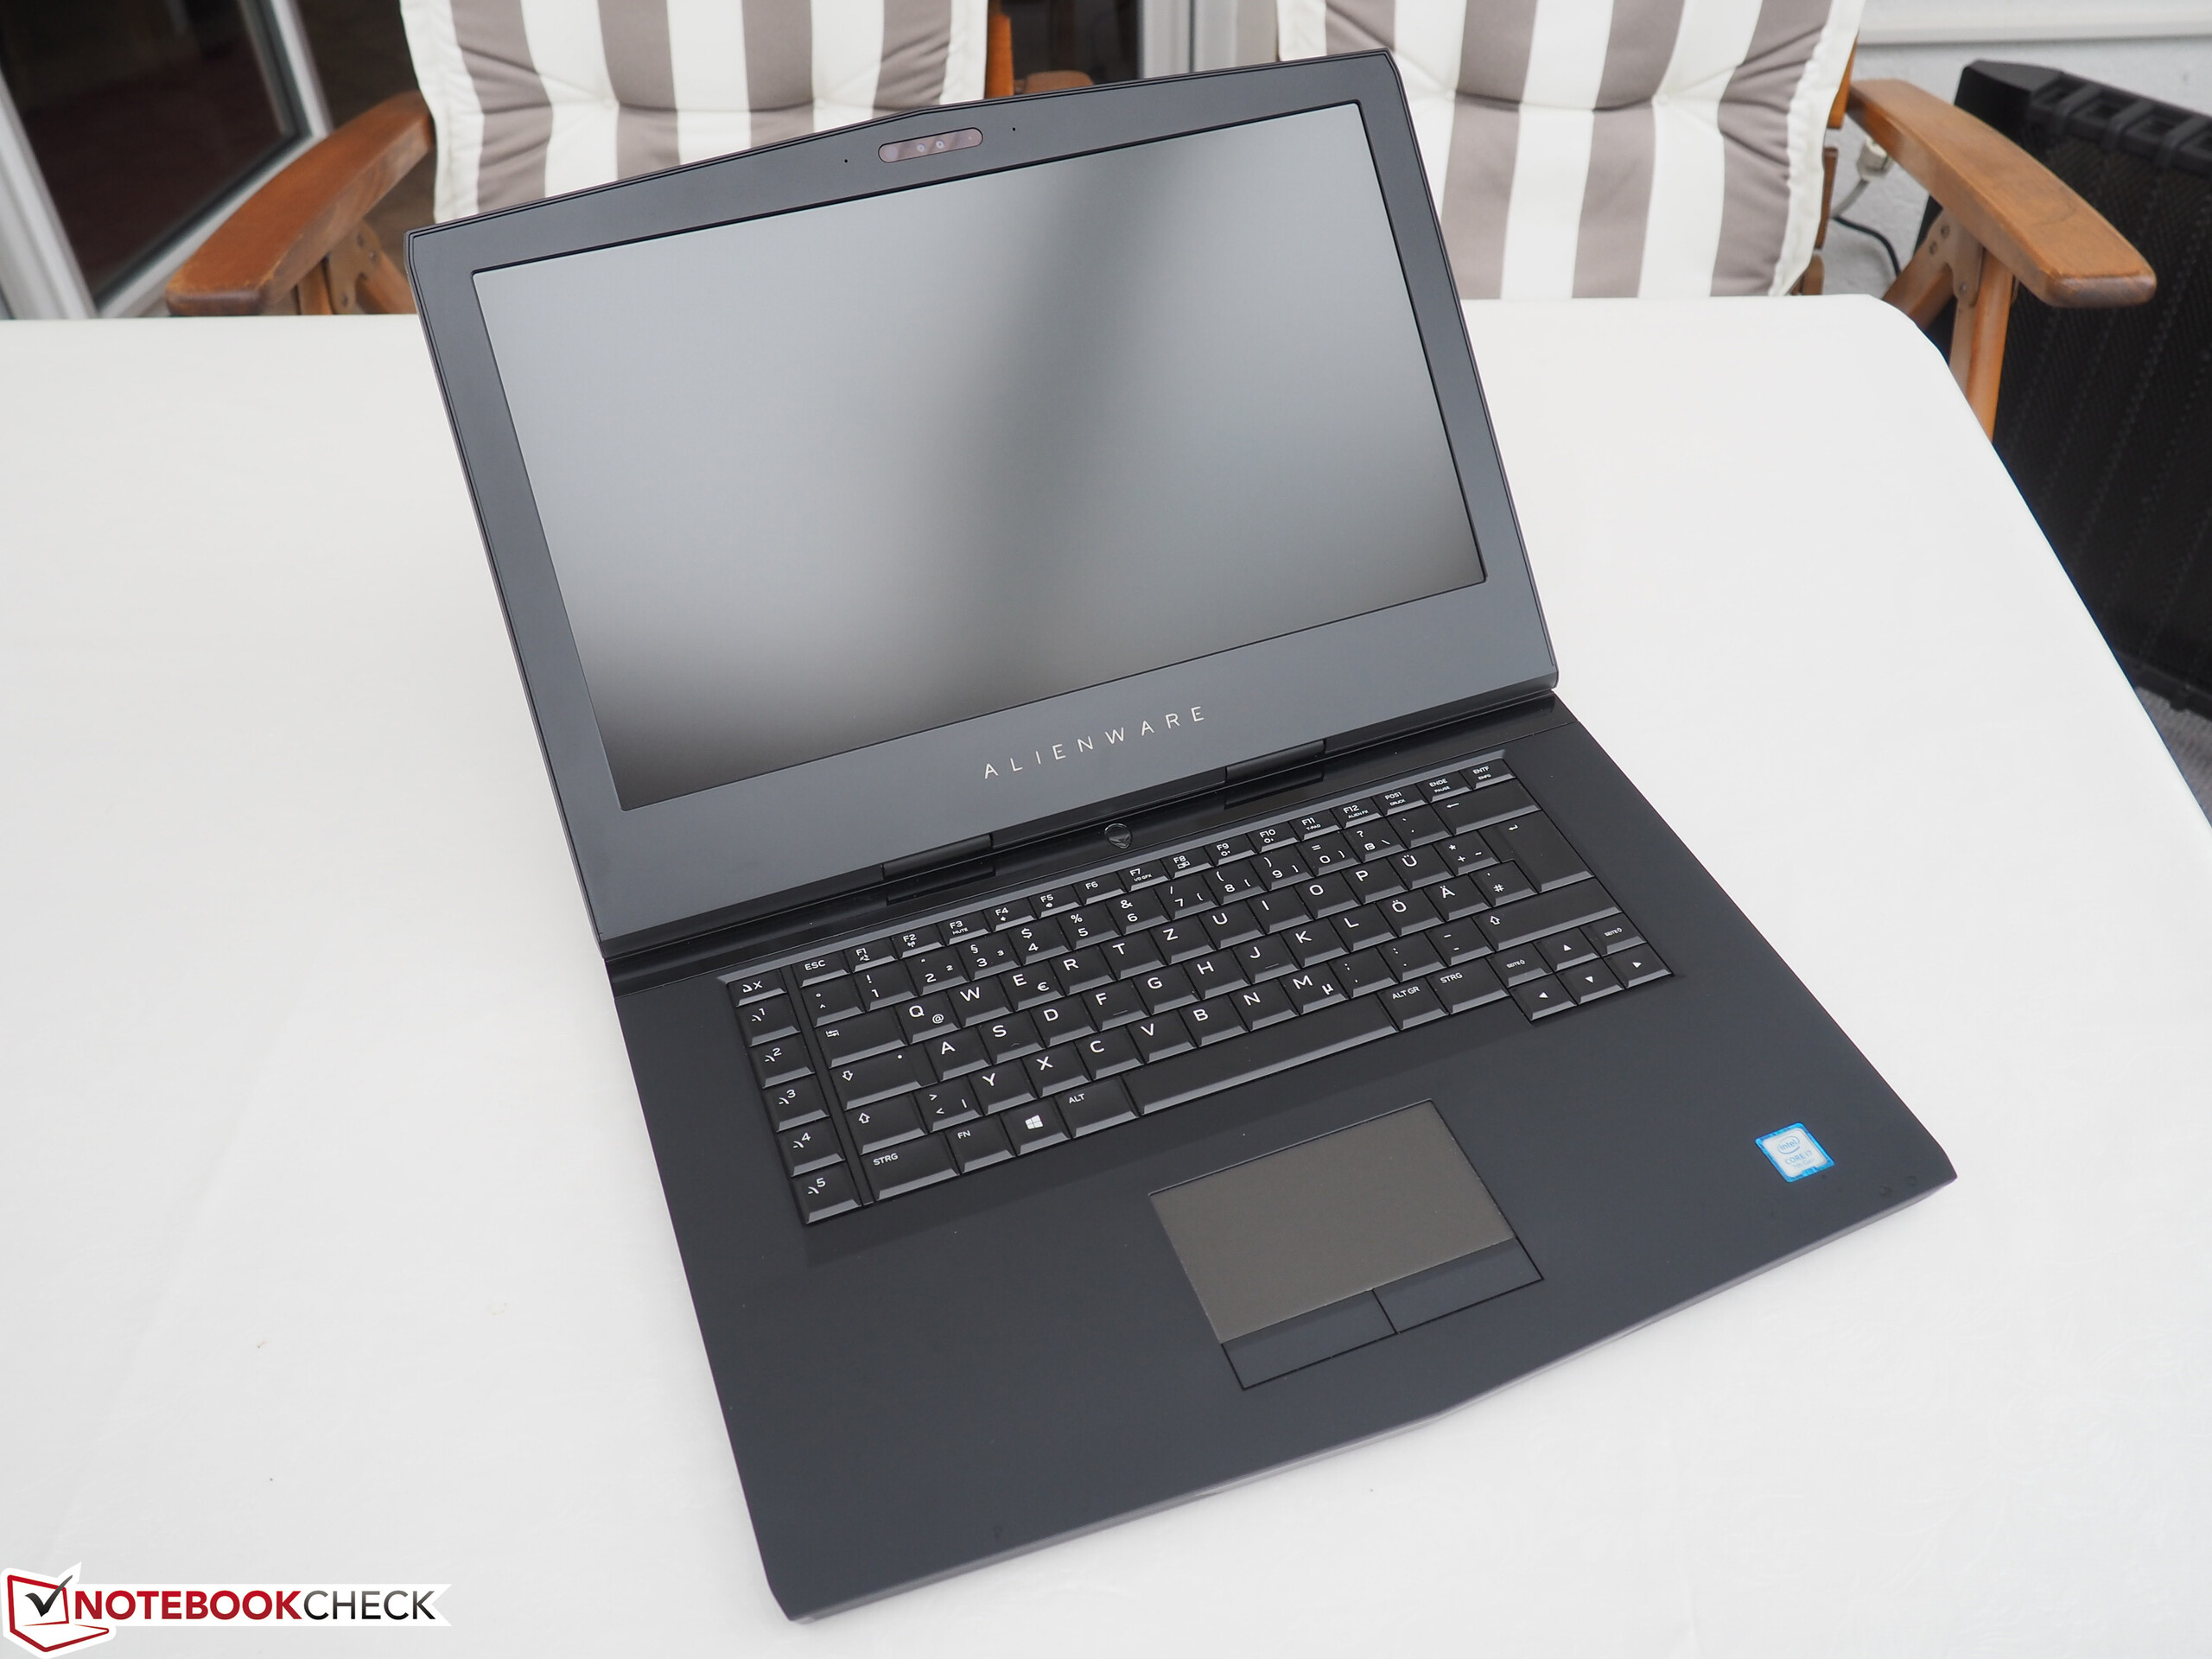
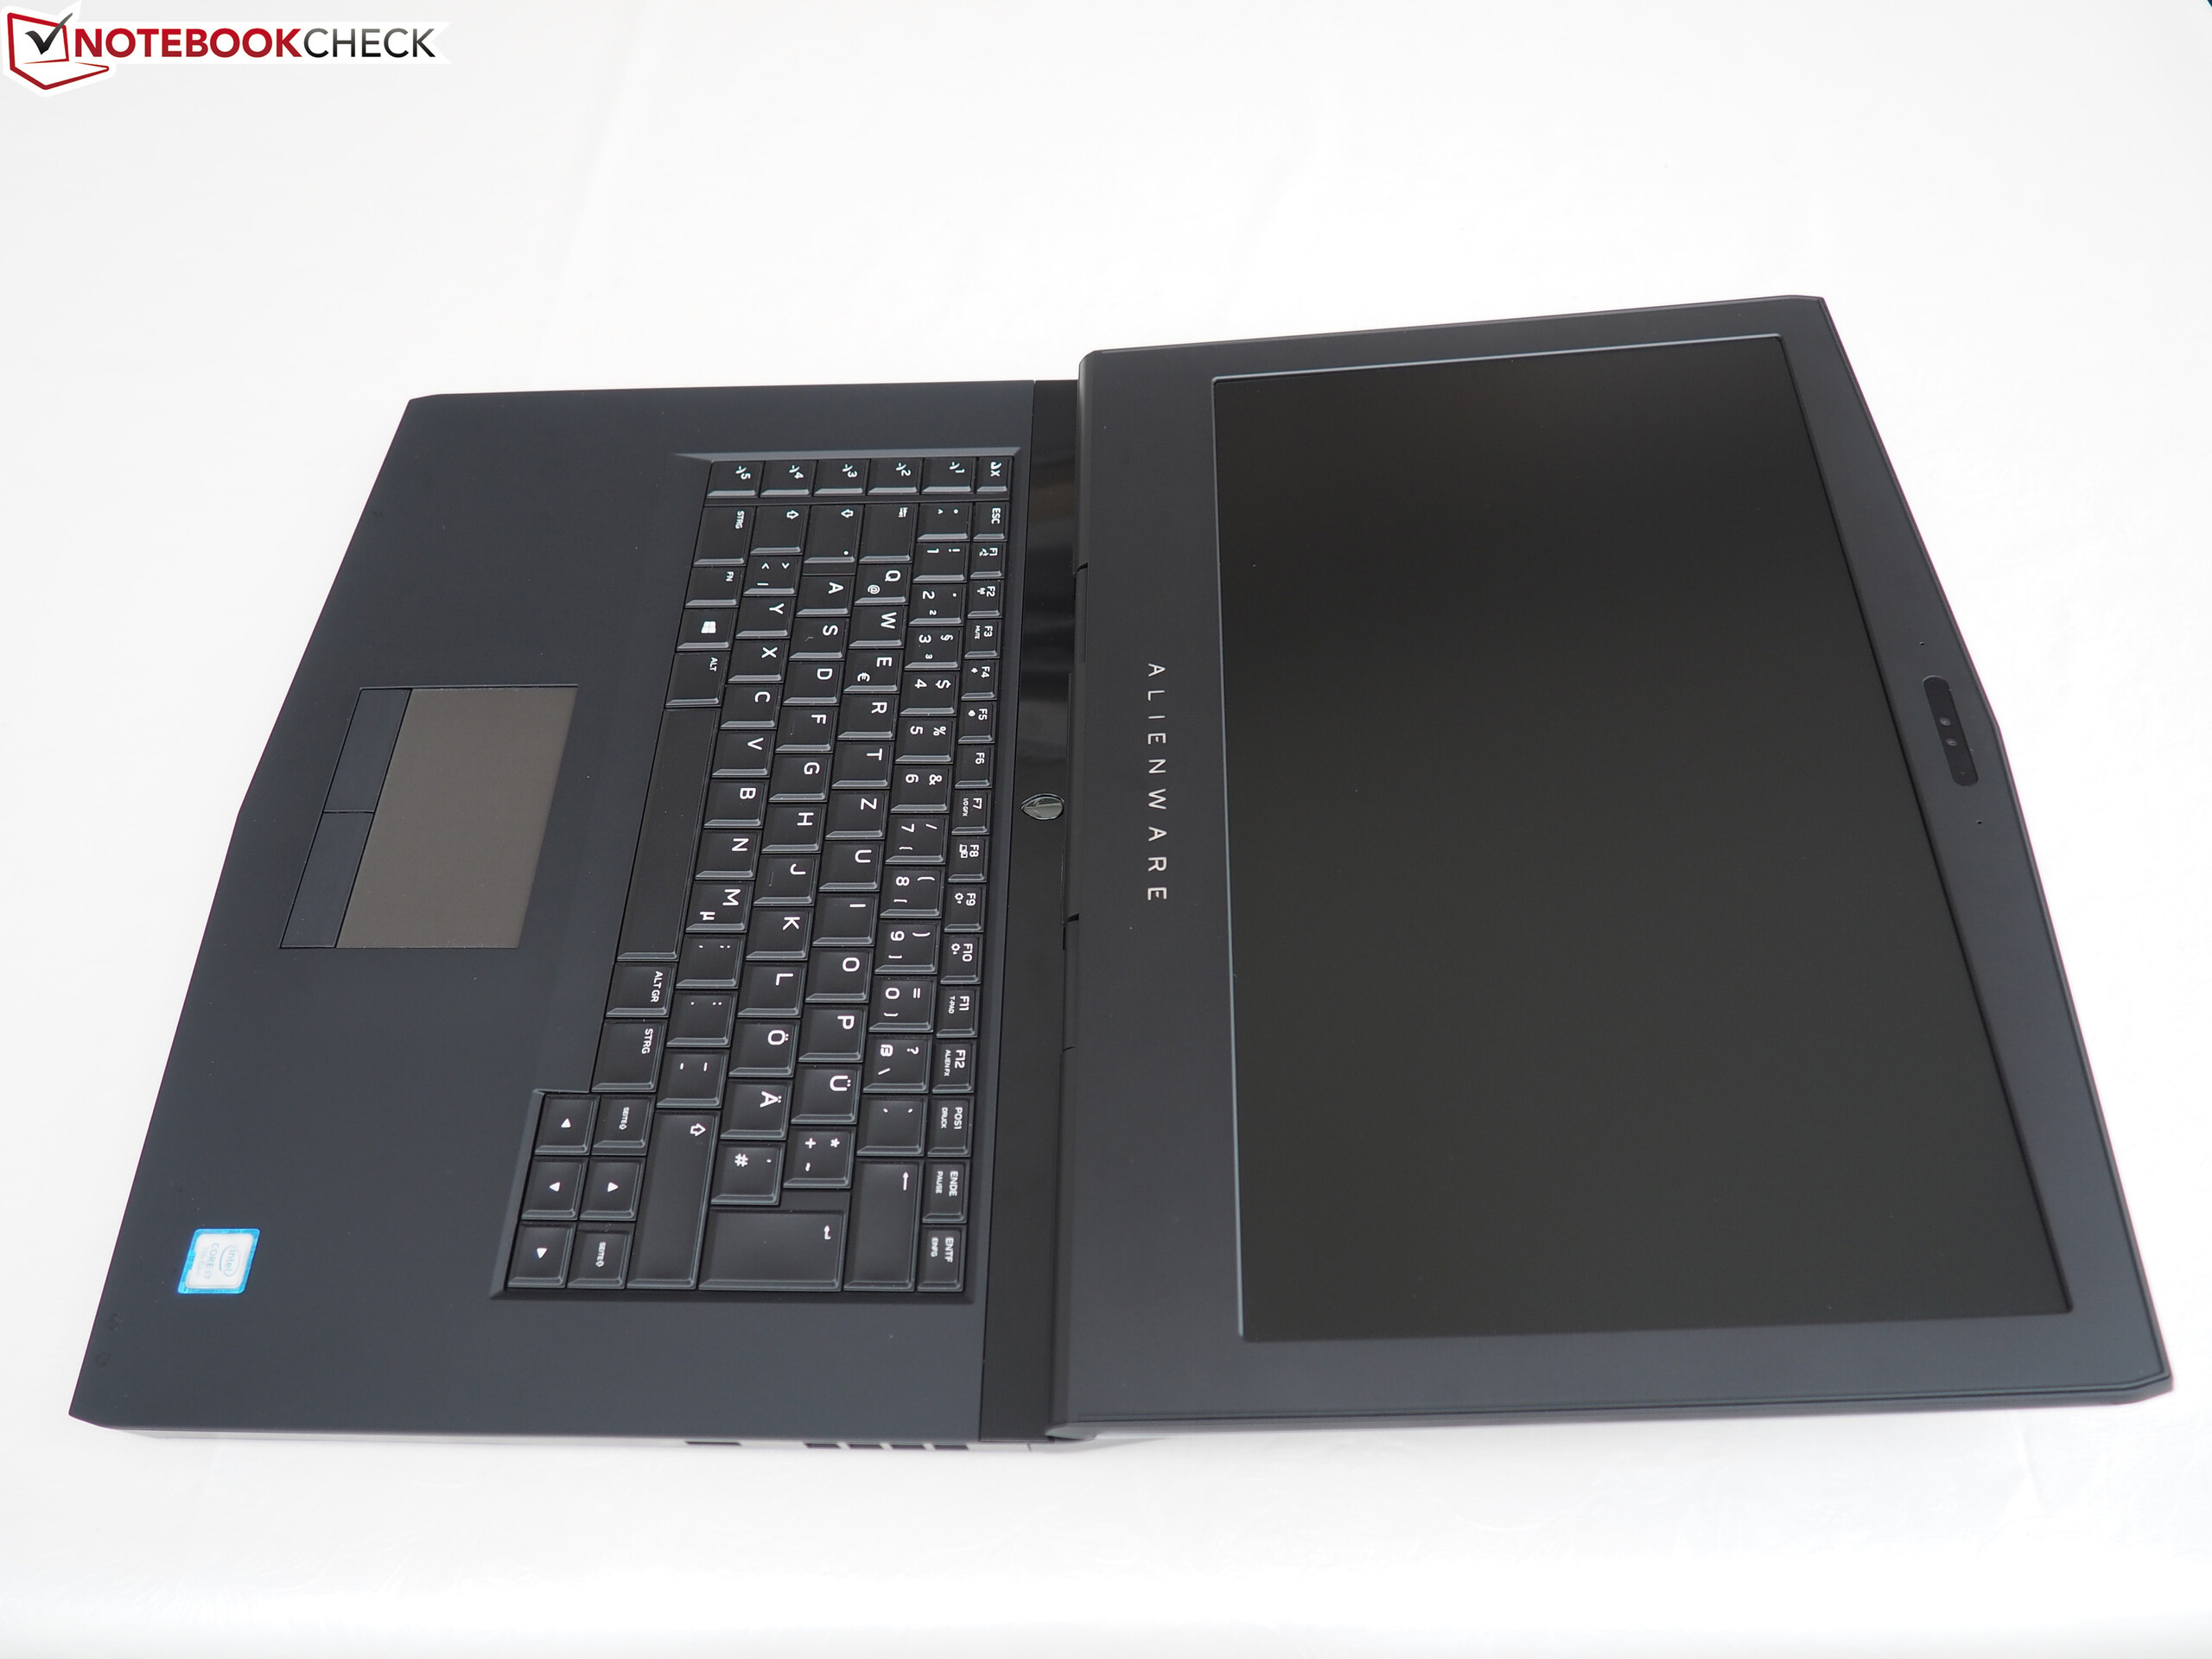
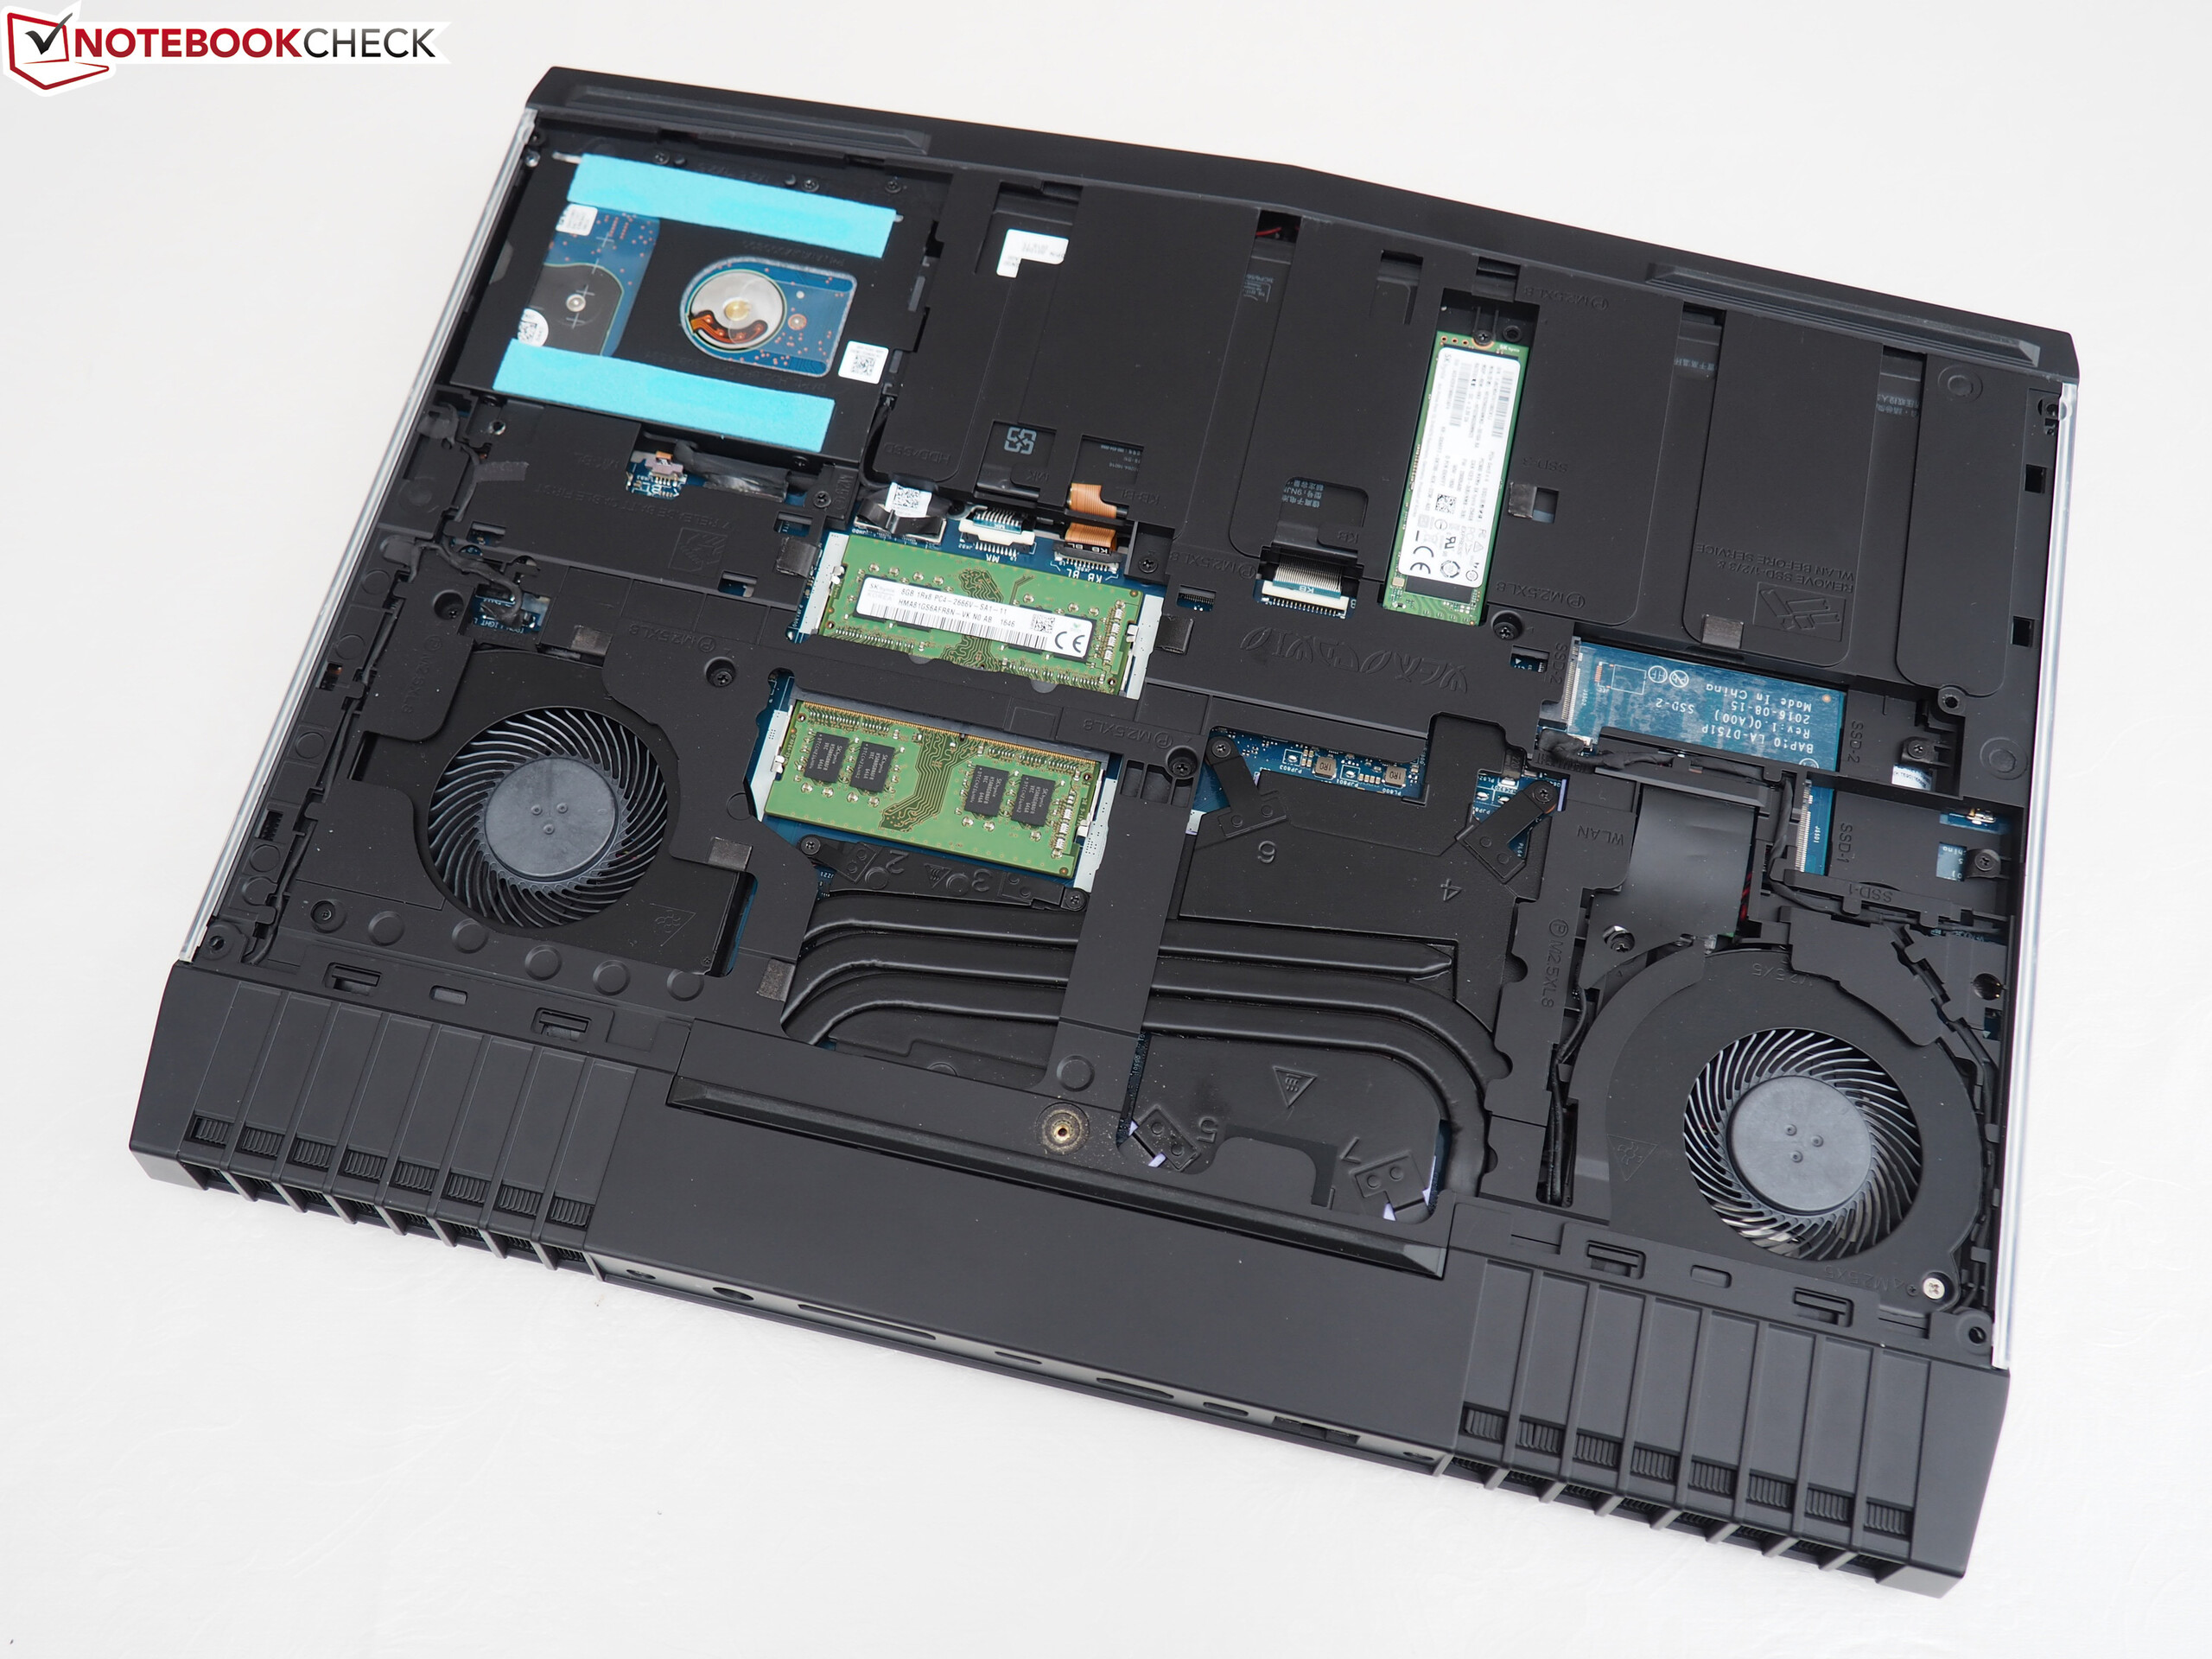
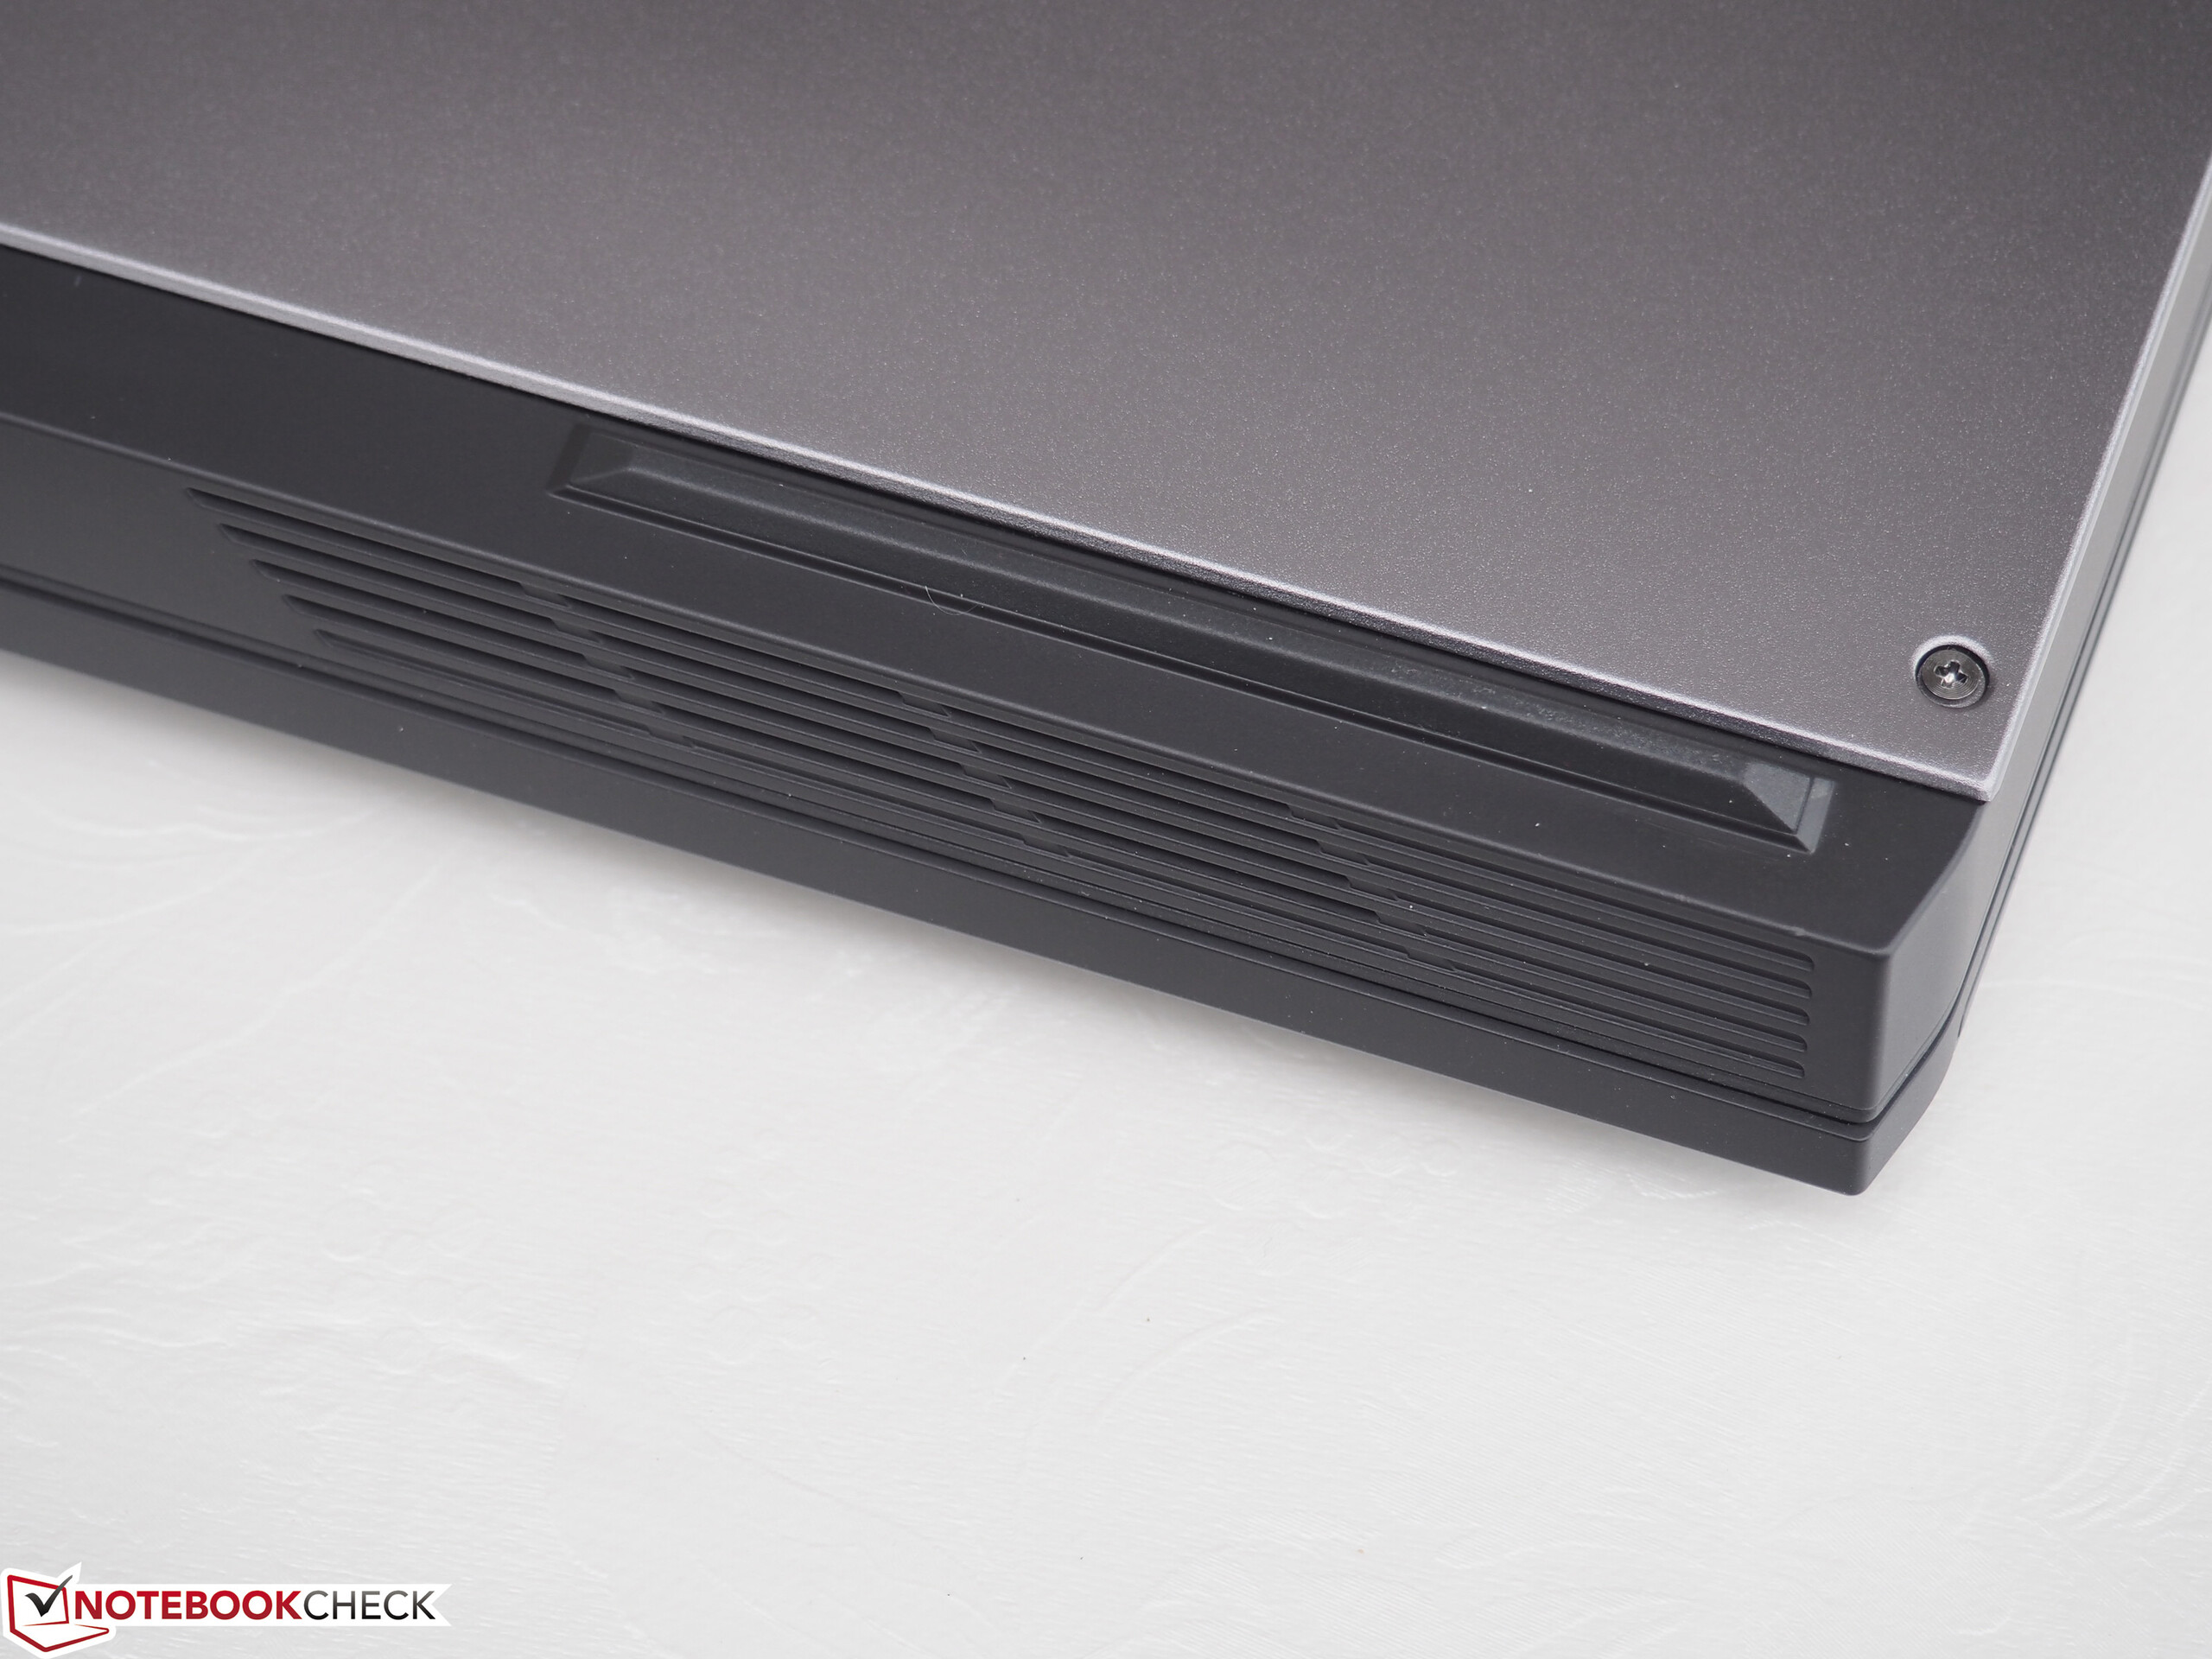
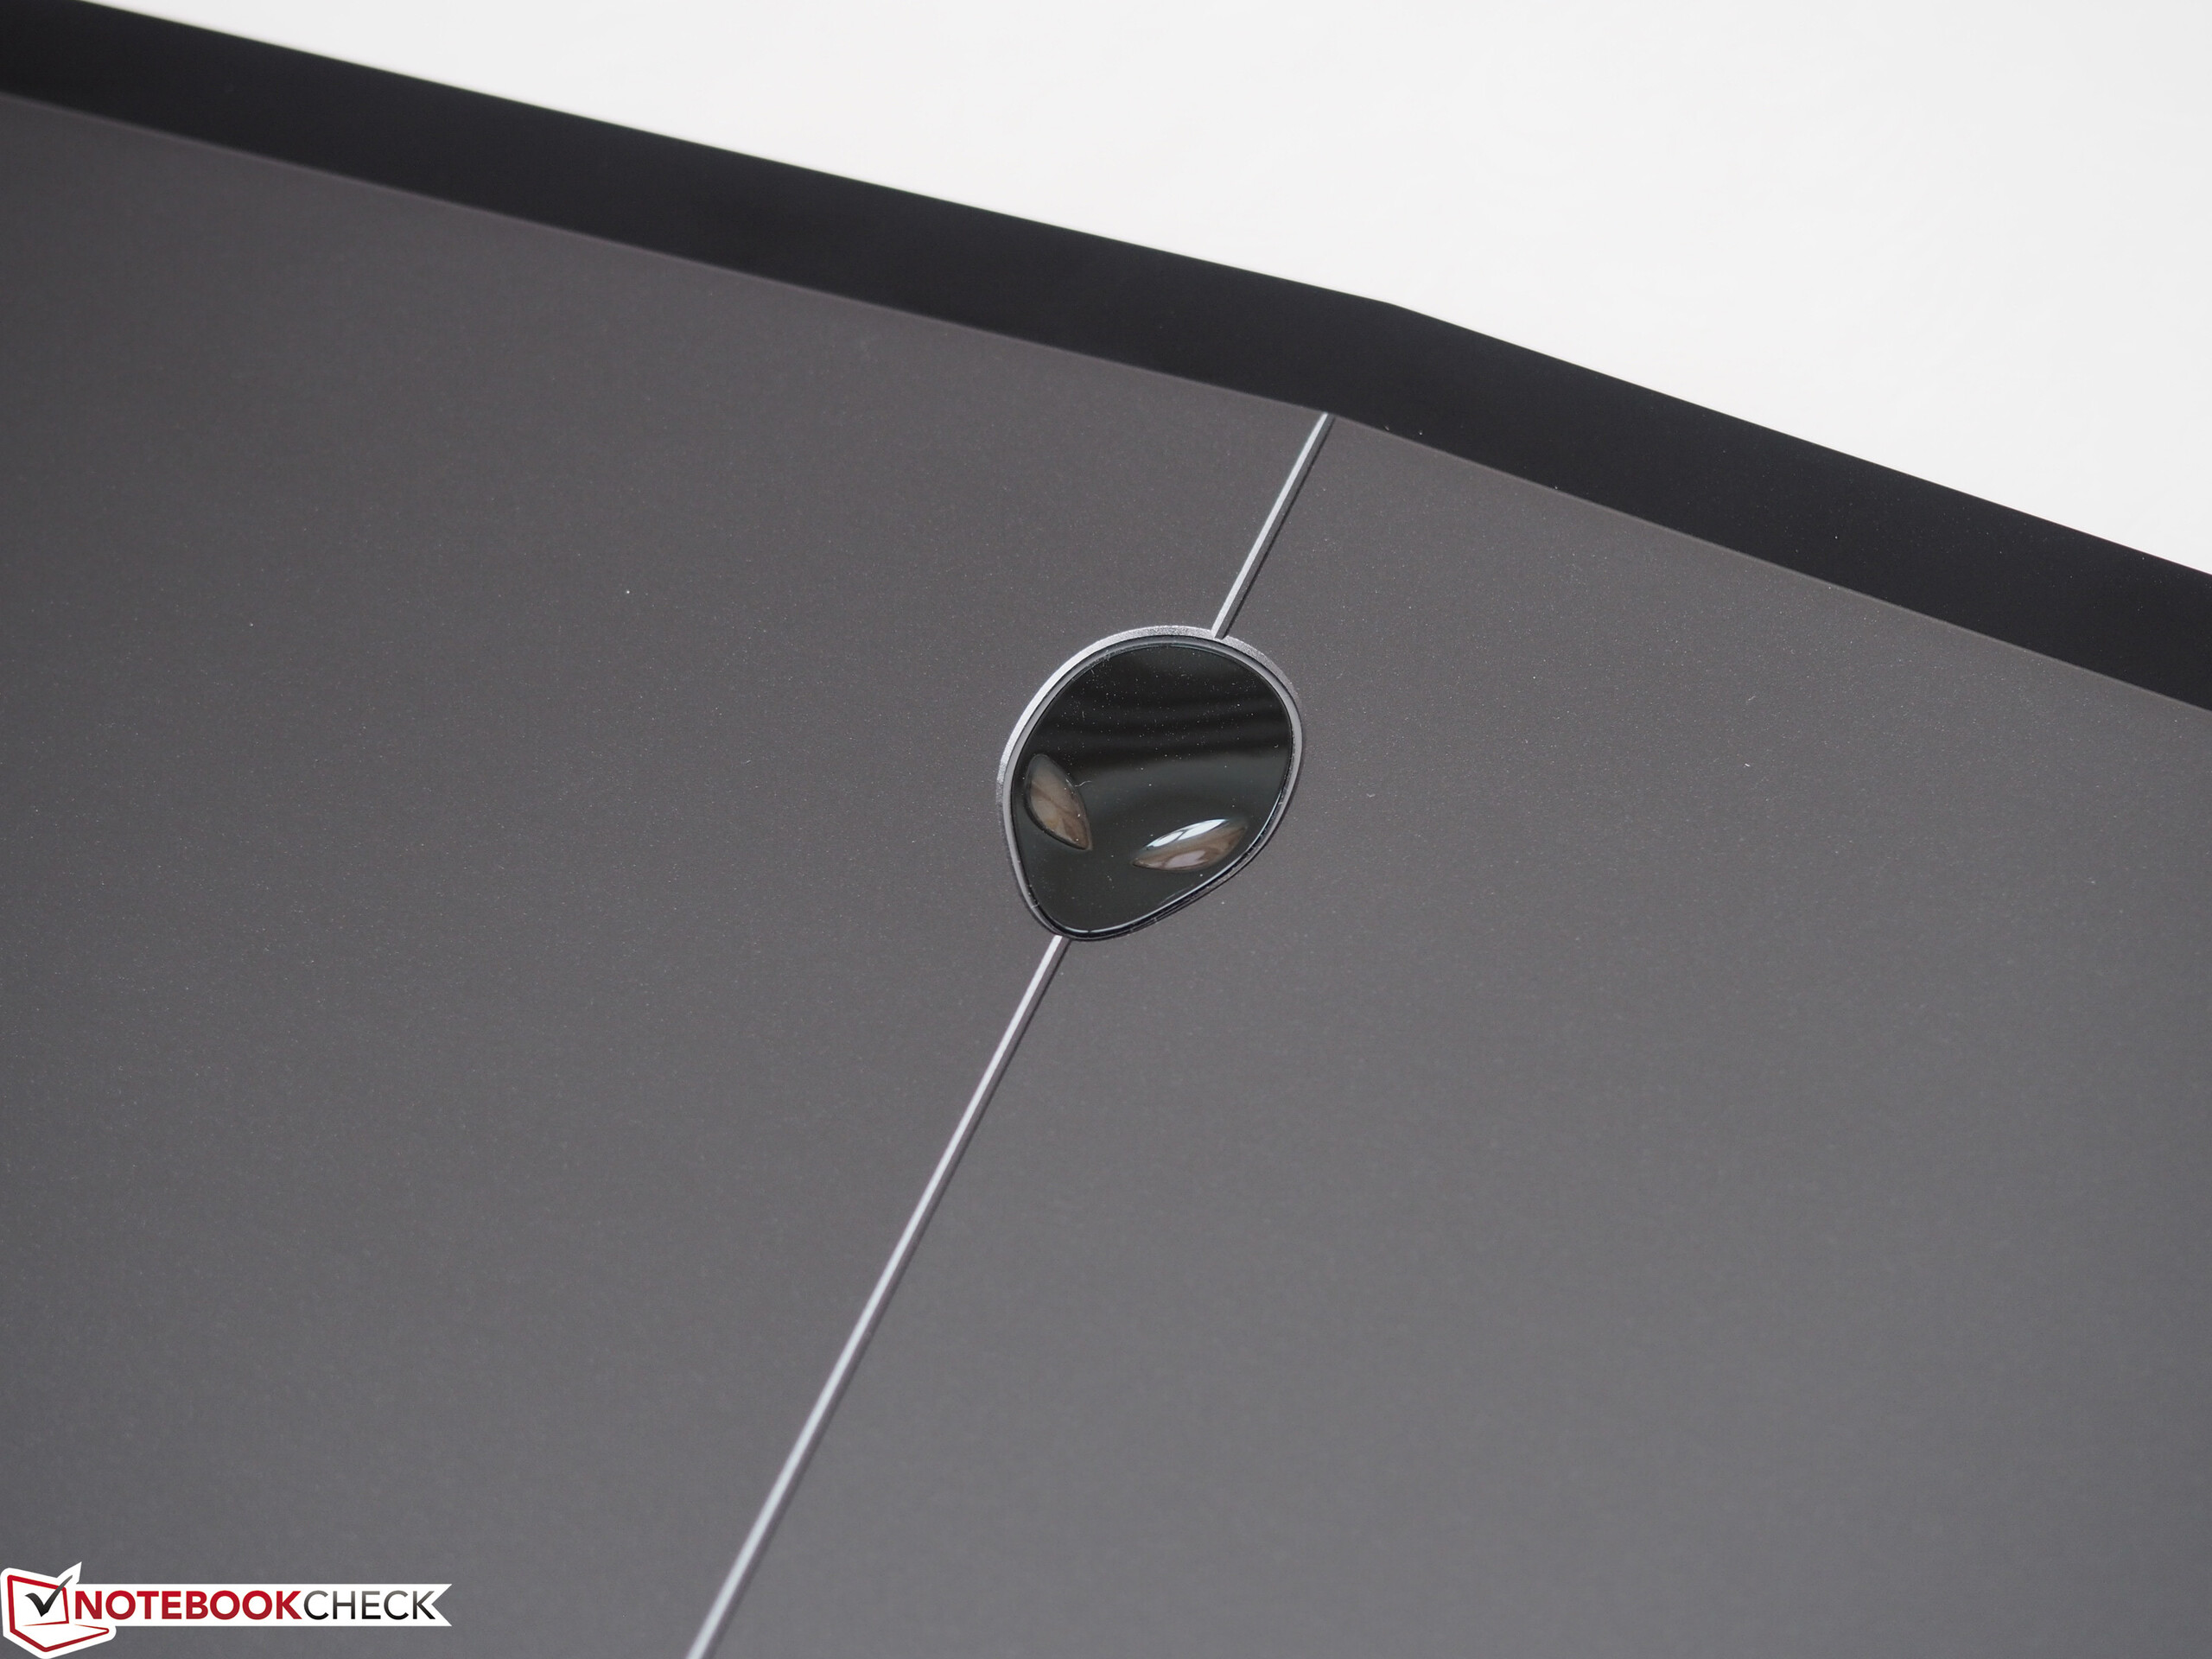
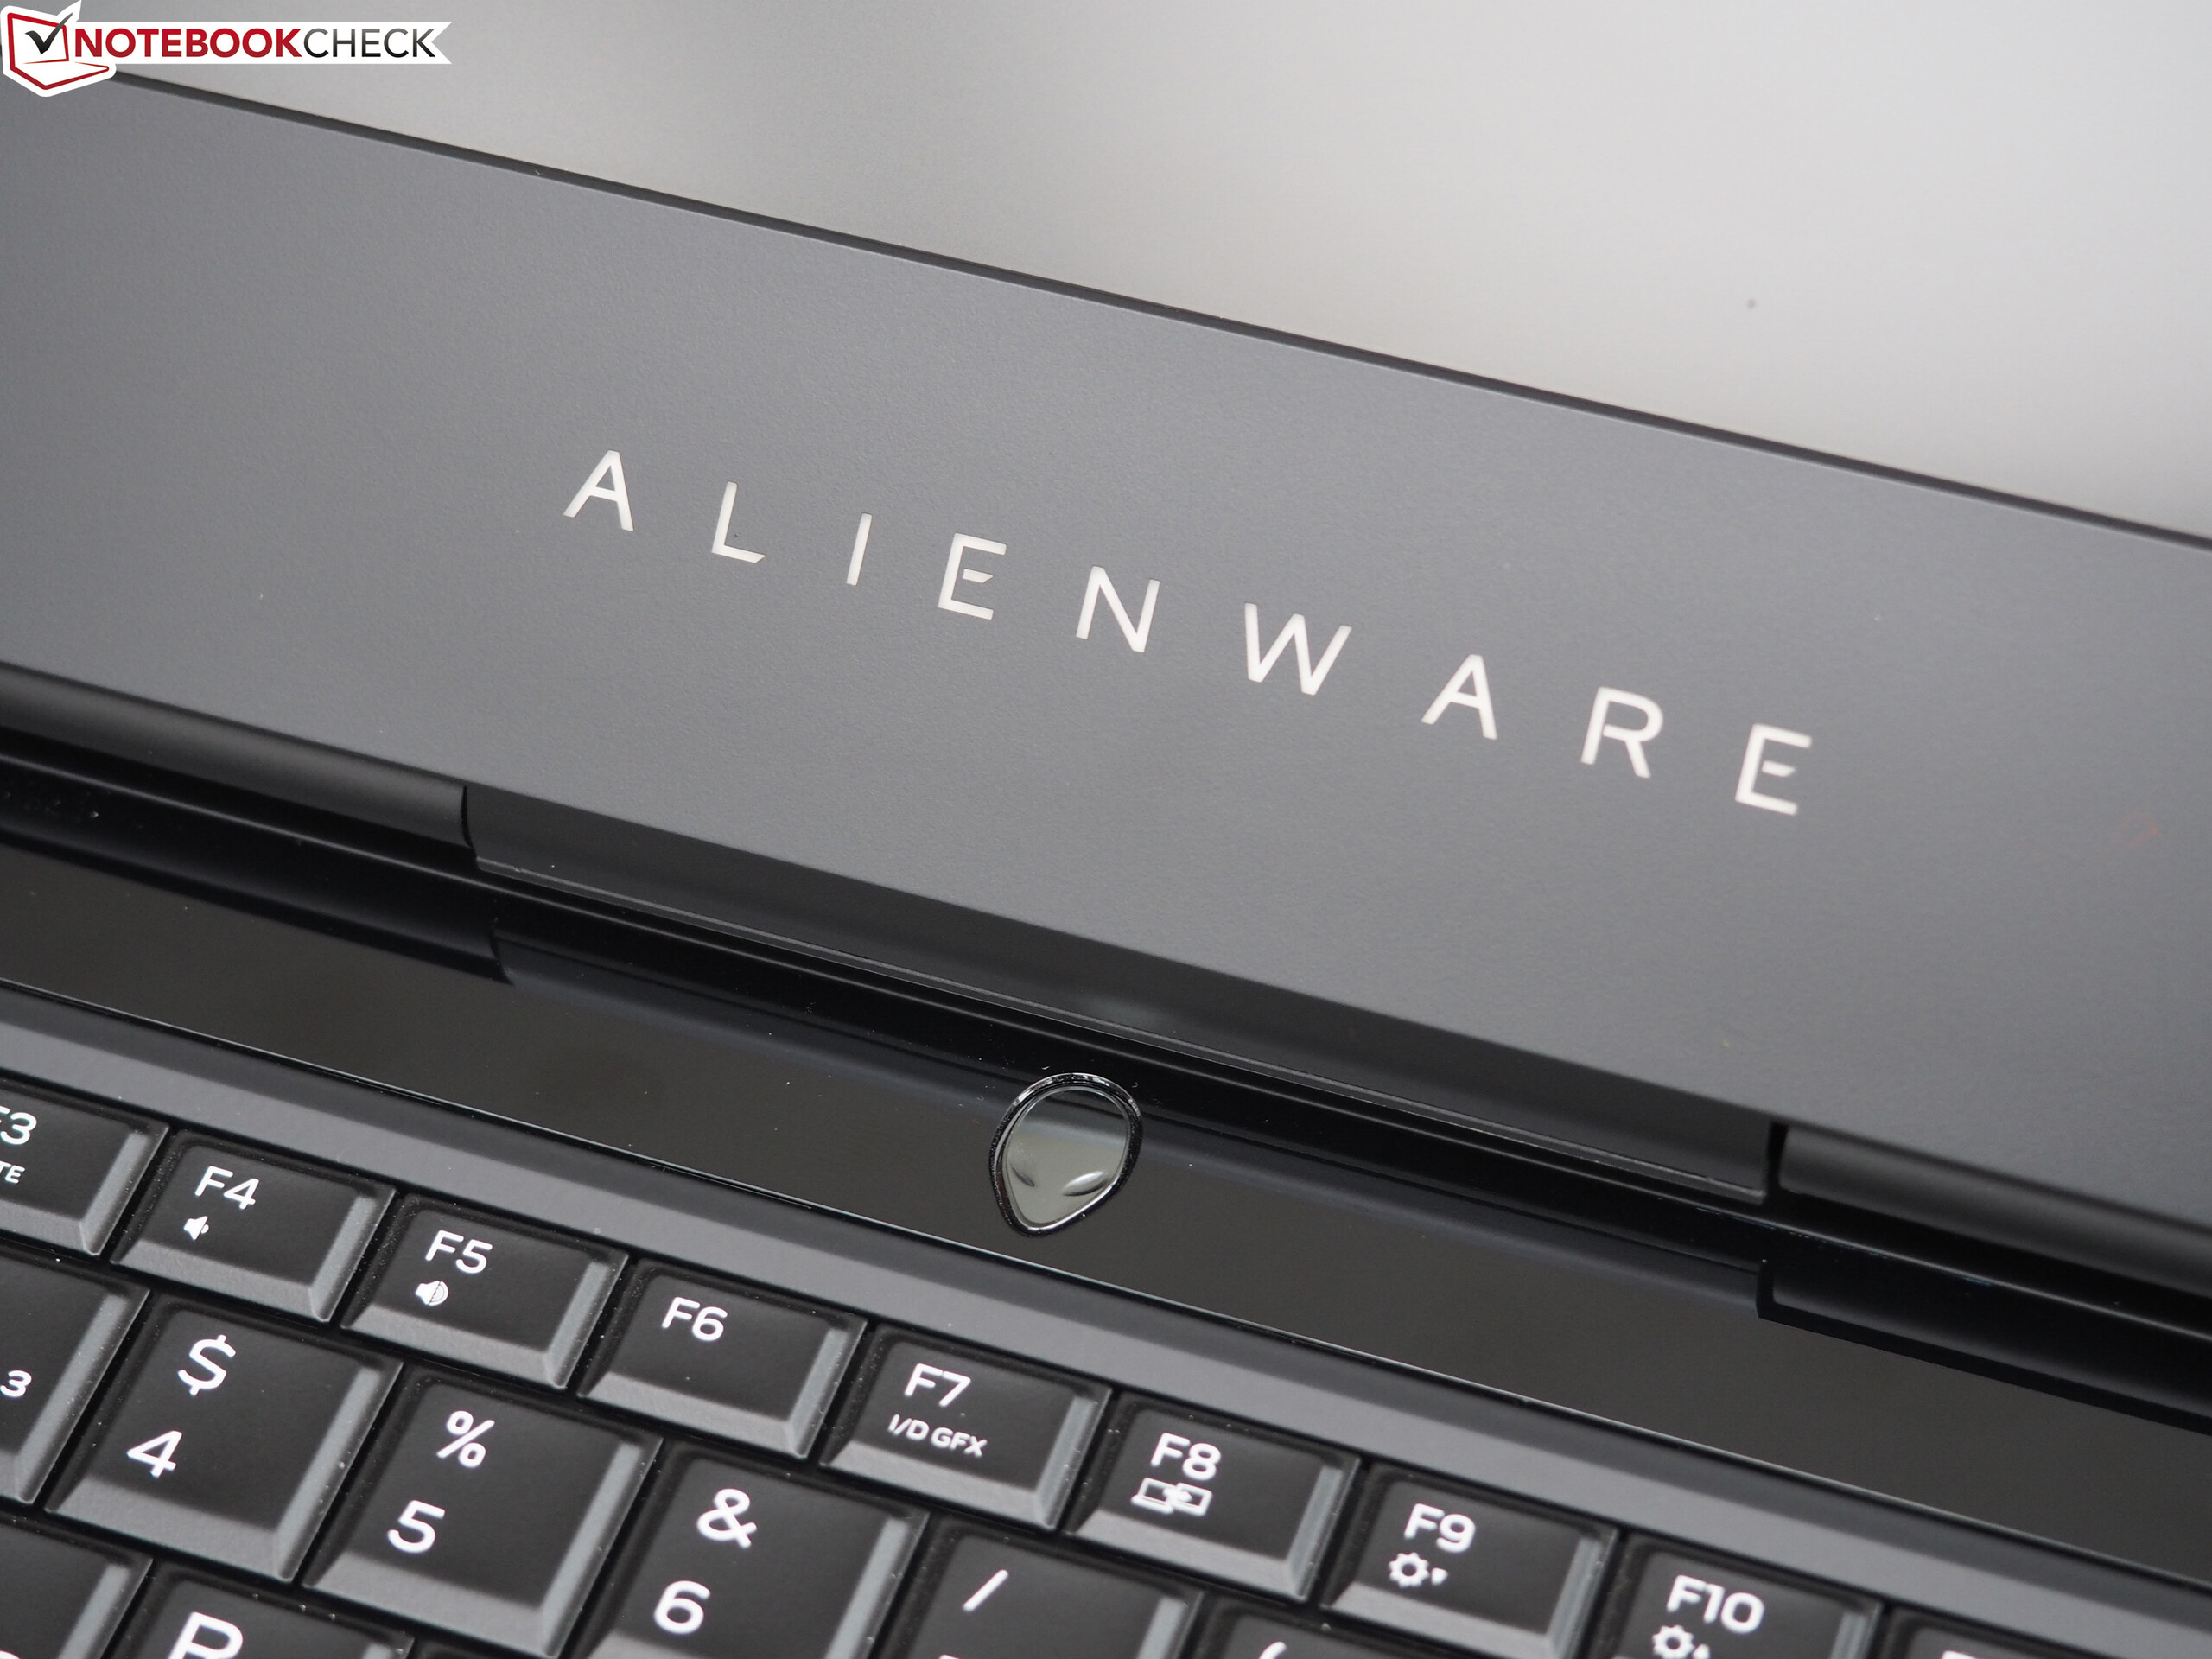
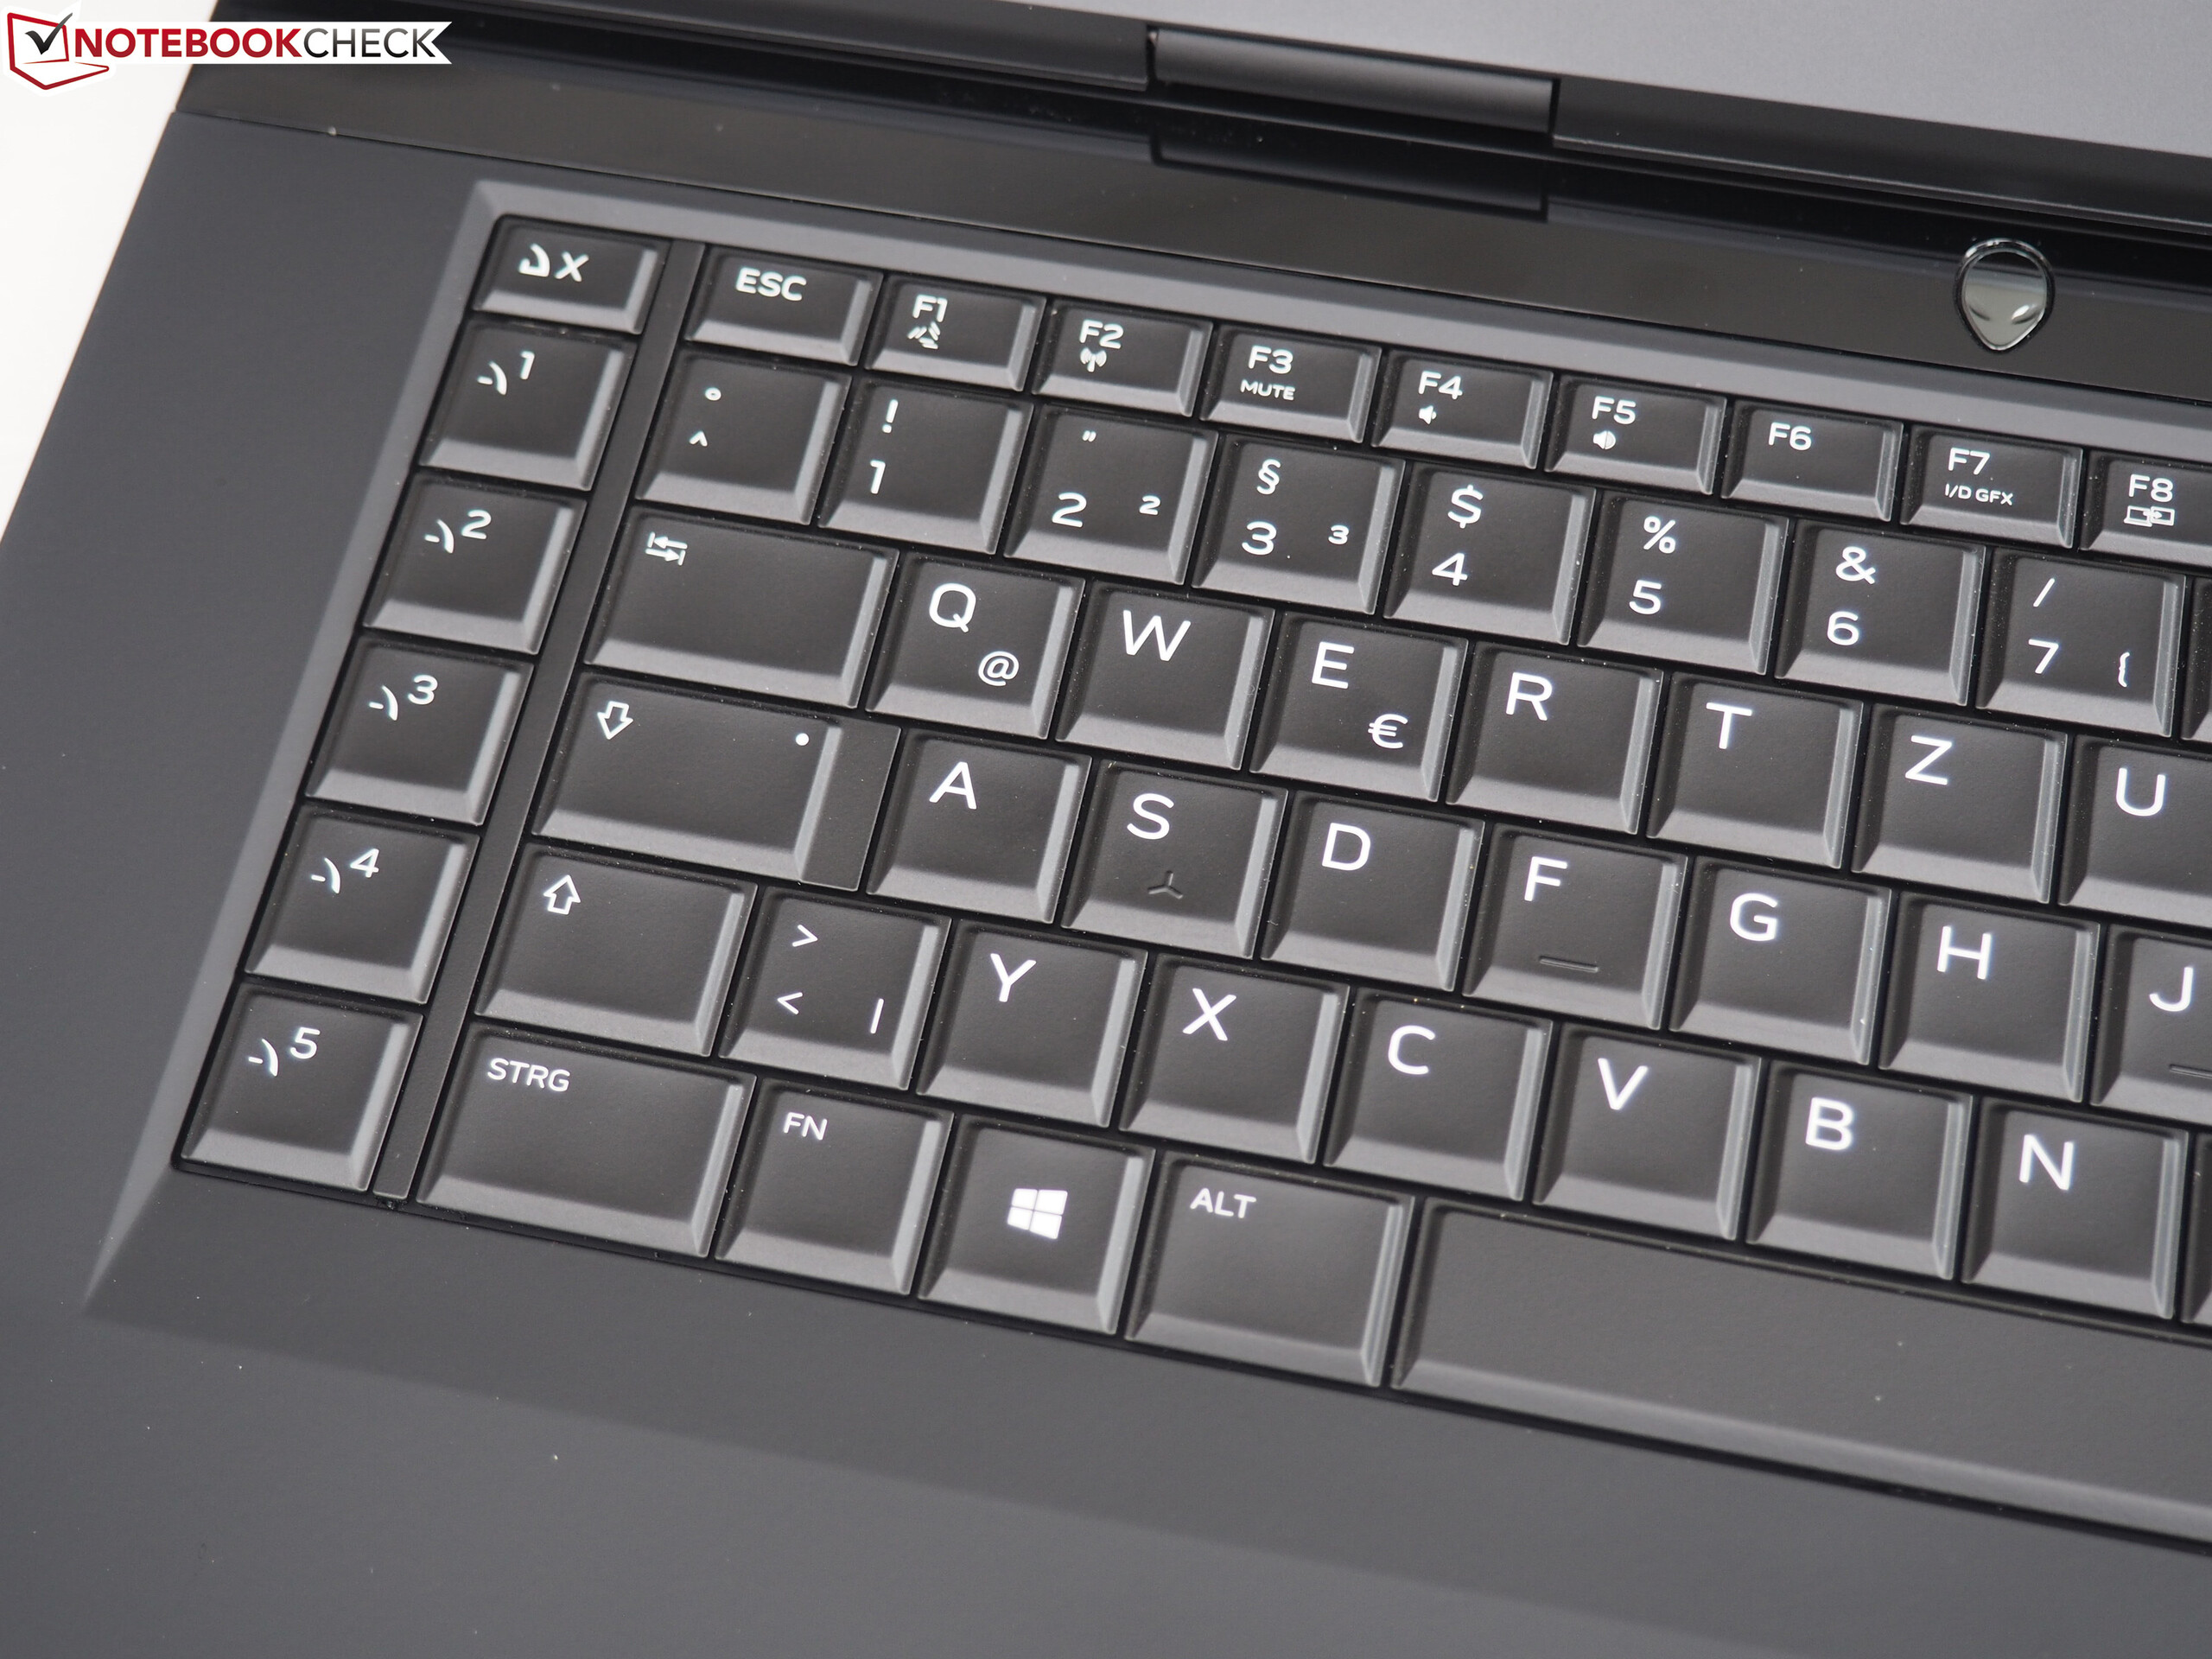
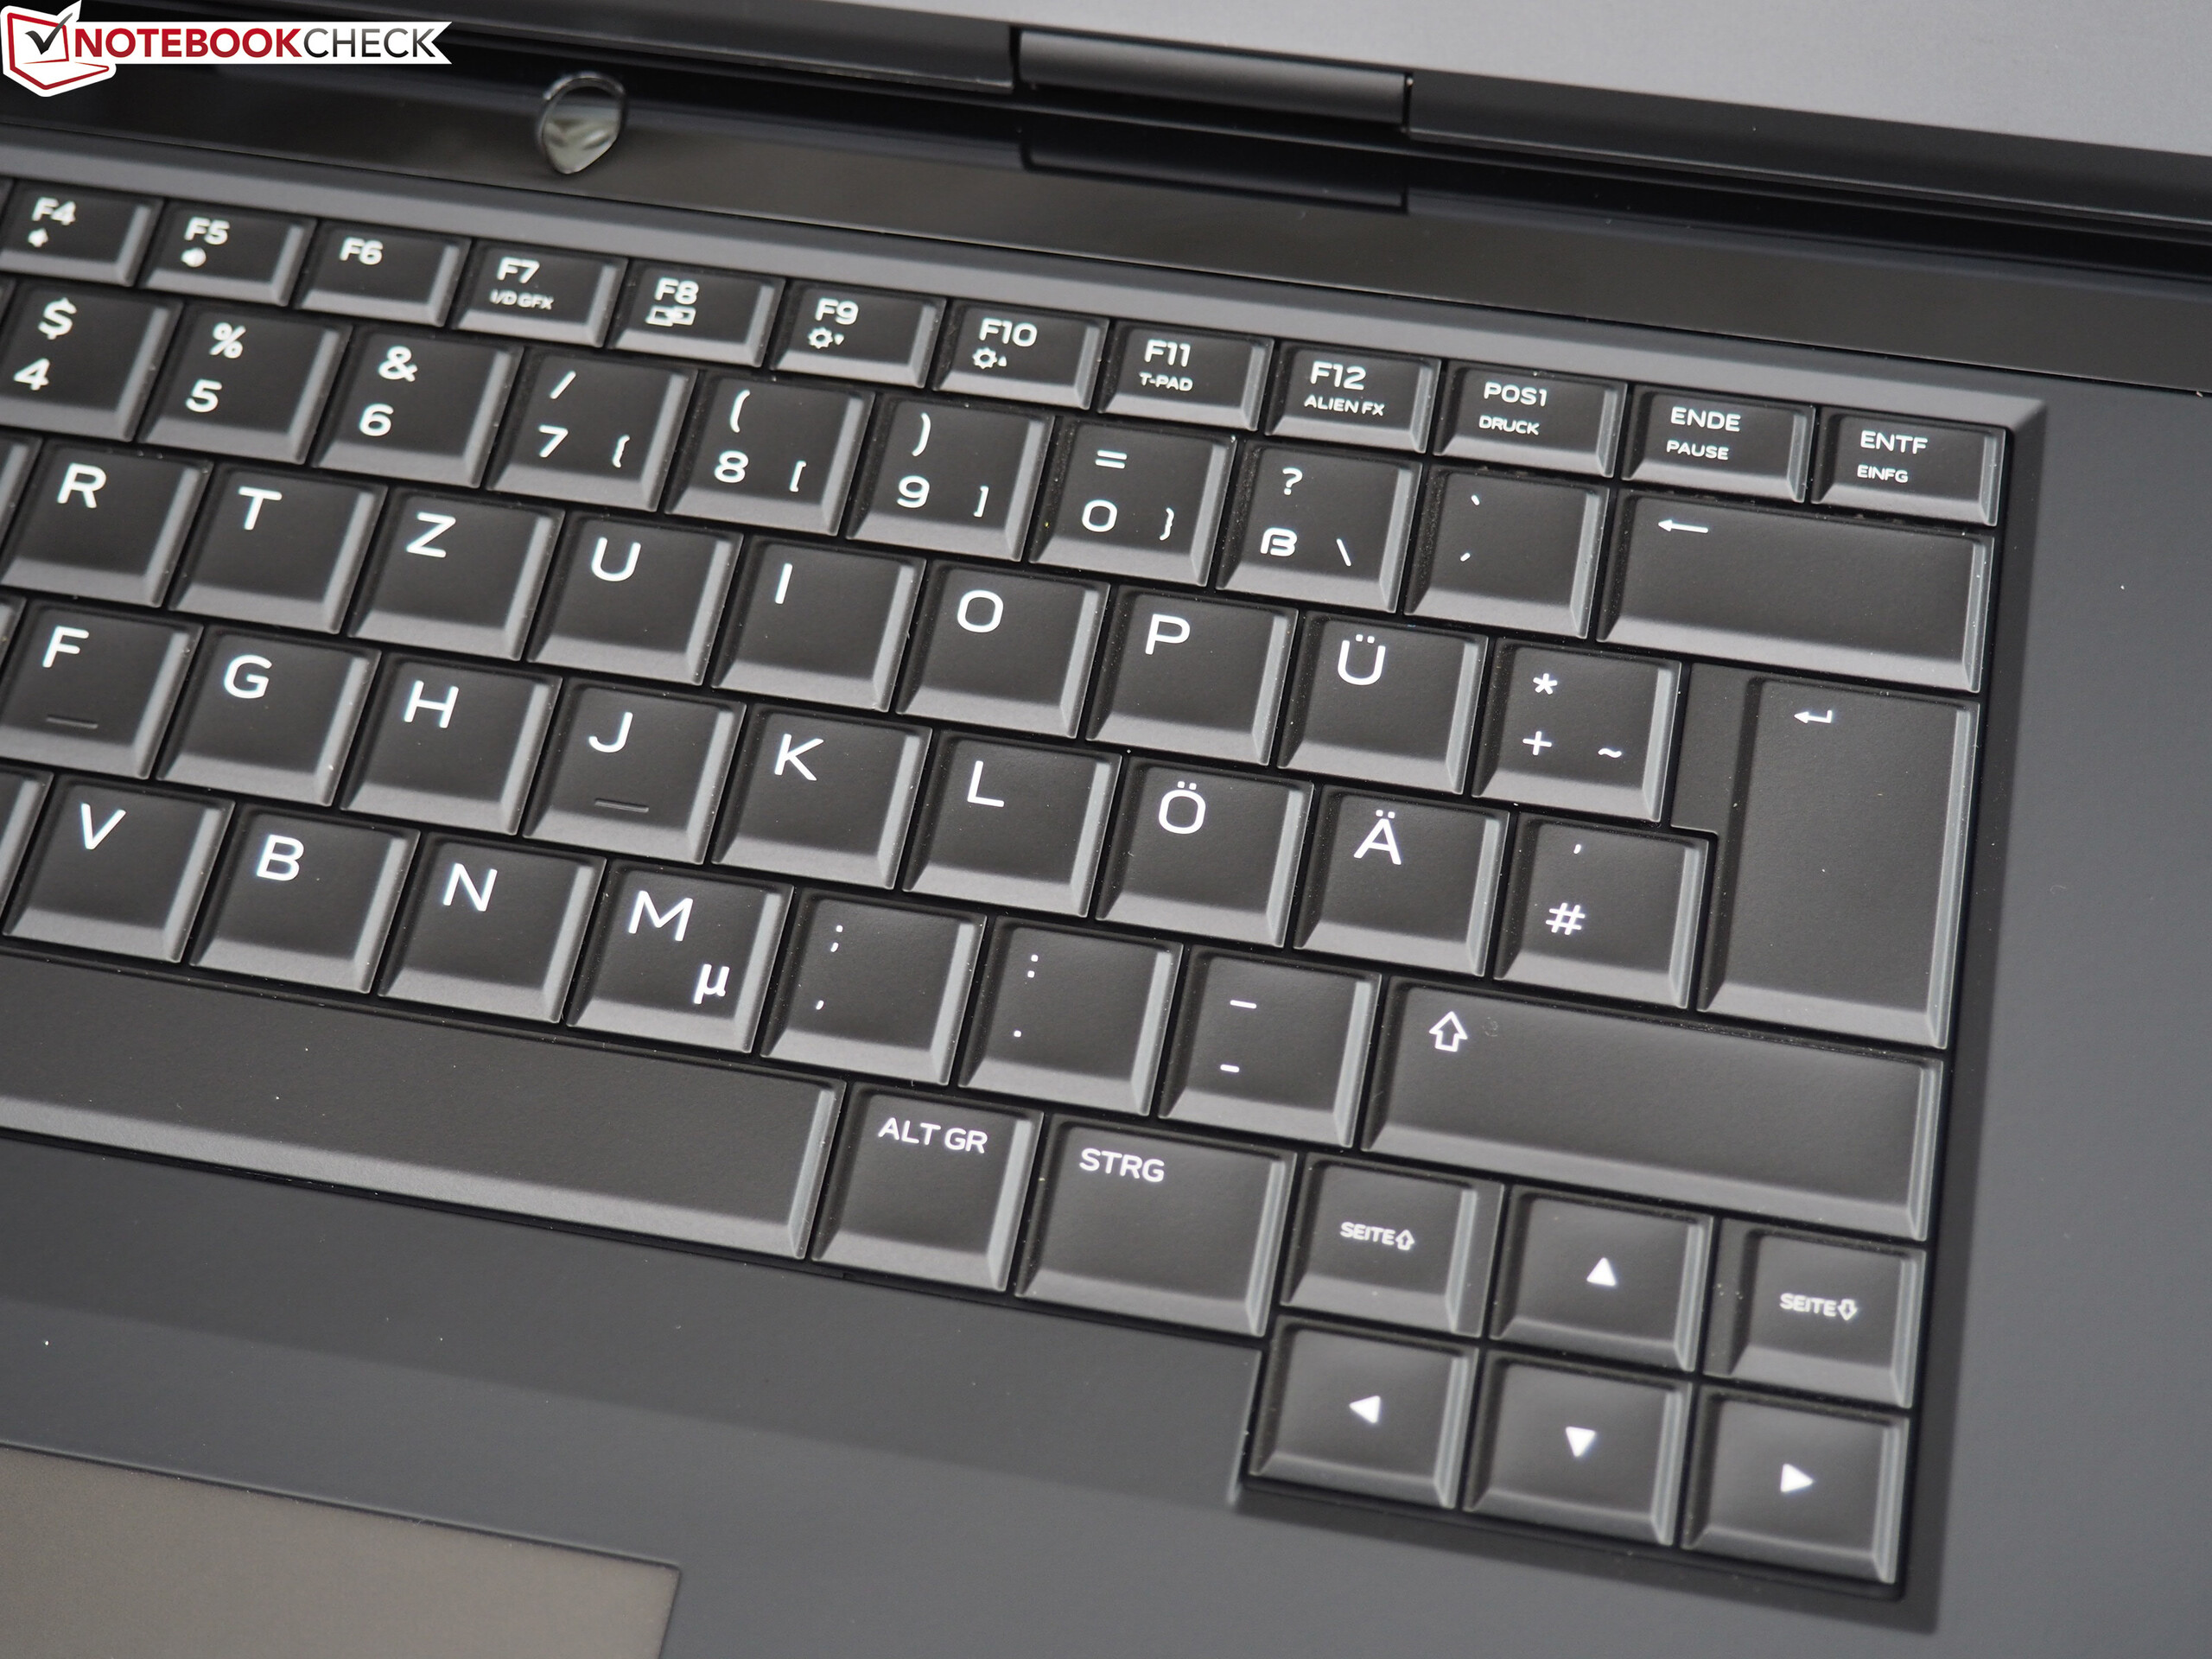
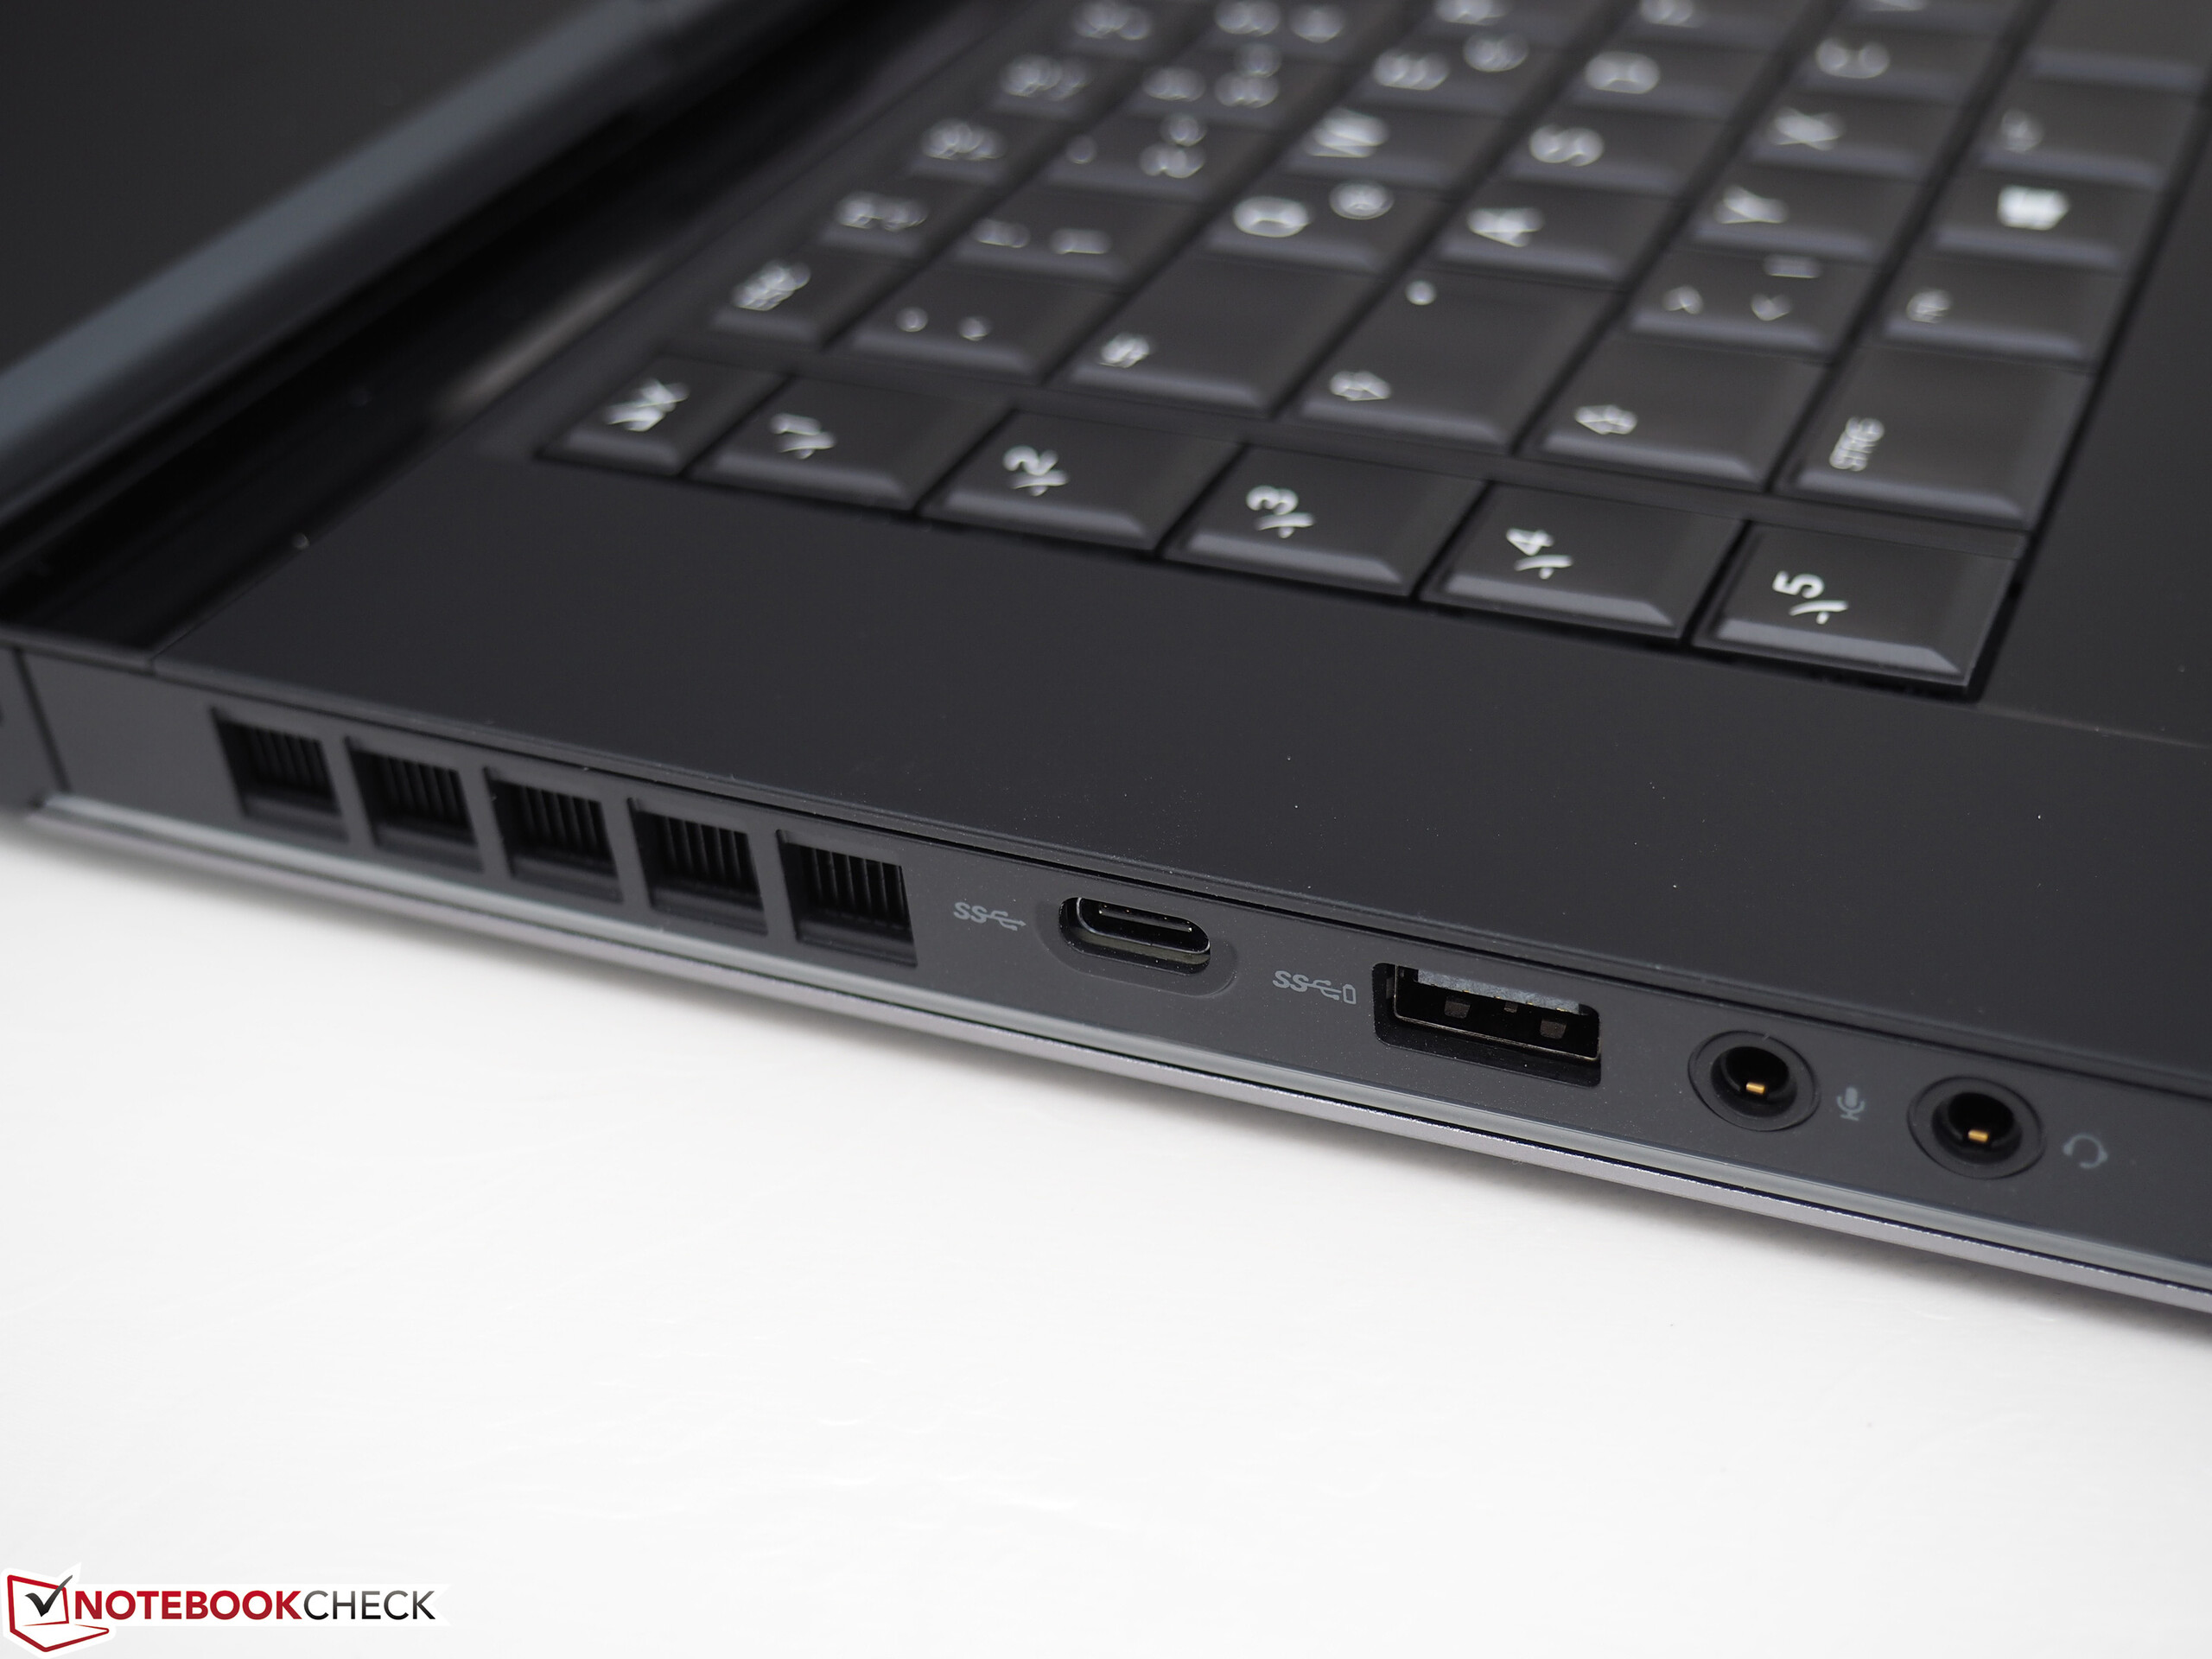
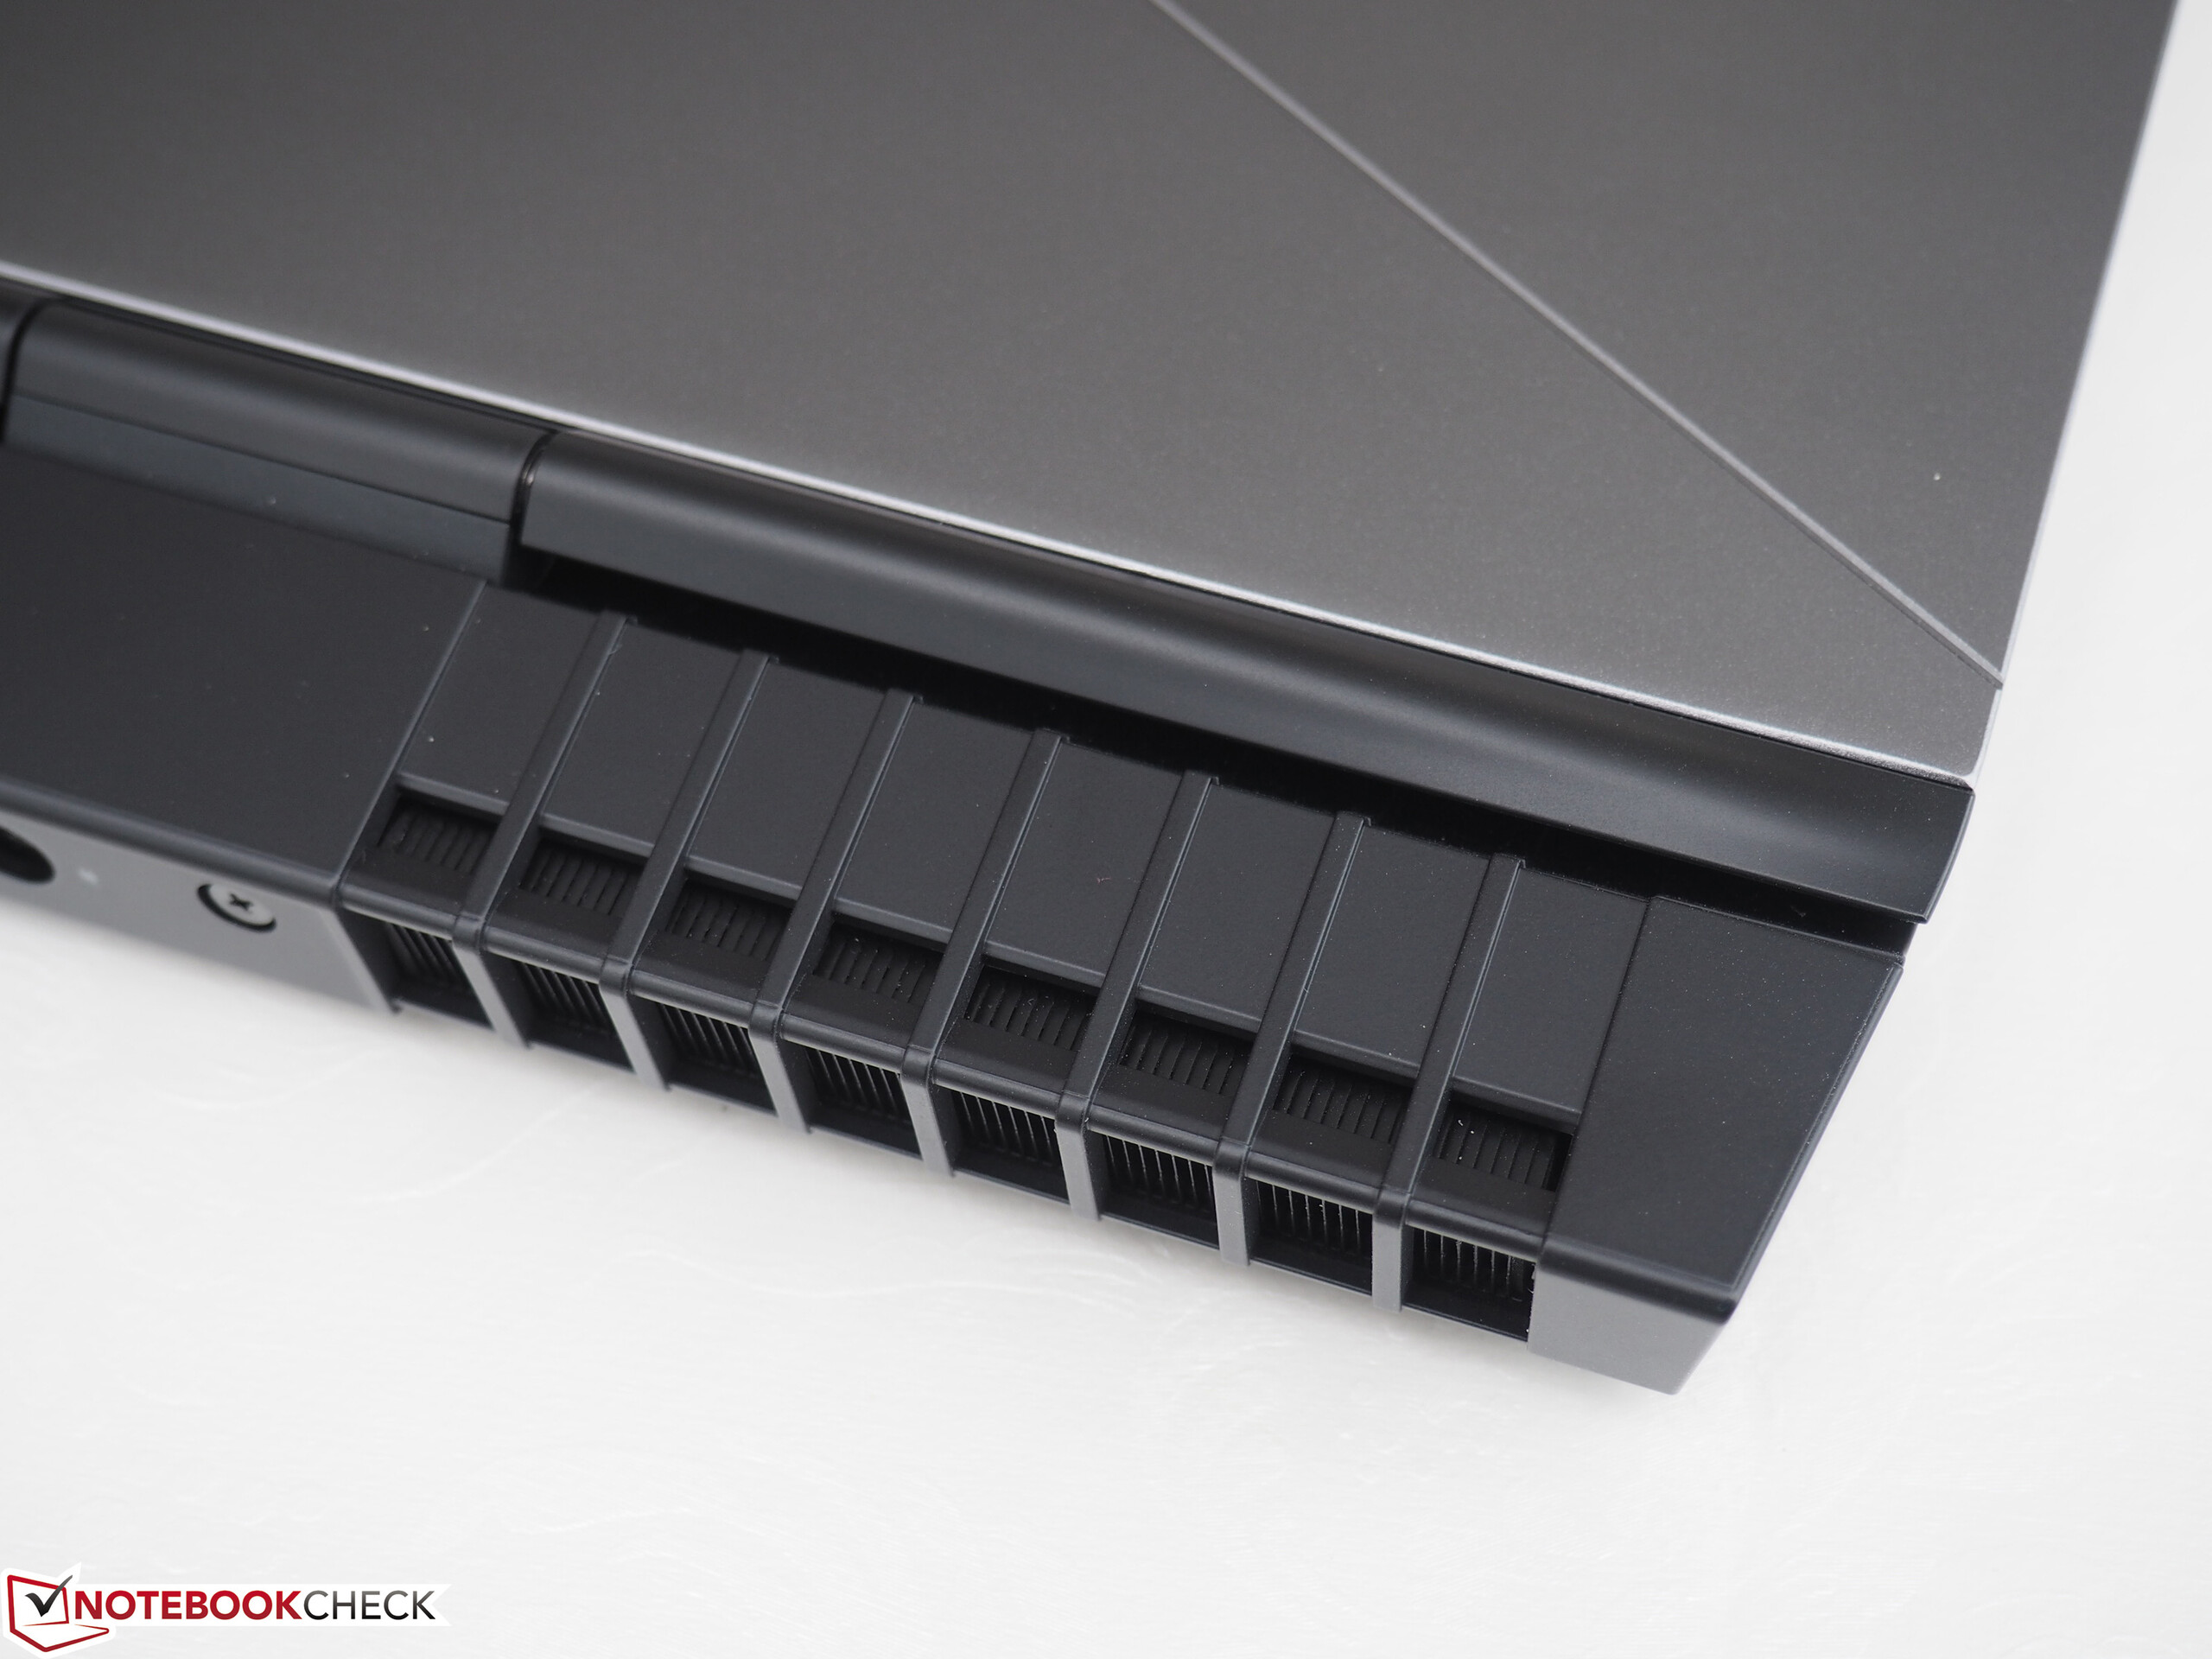
Utseendemässigt är den tredje revisionen av Alienware 15 (R3) en fullträff (med undantag för det utskjutande fläktområdet). Det finns för närvarande ingen annan bärbar speldator med ett så sofistikerat, stadigt och välbyggt chassi. Designen är unik, inmatningsenheterna bra och datorn har flera belysta element.
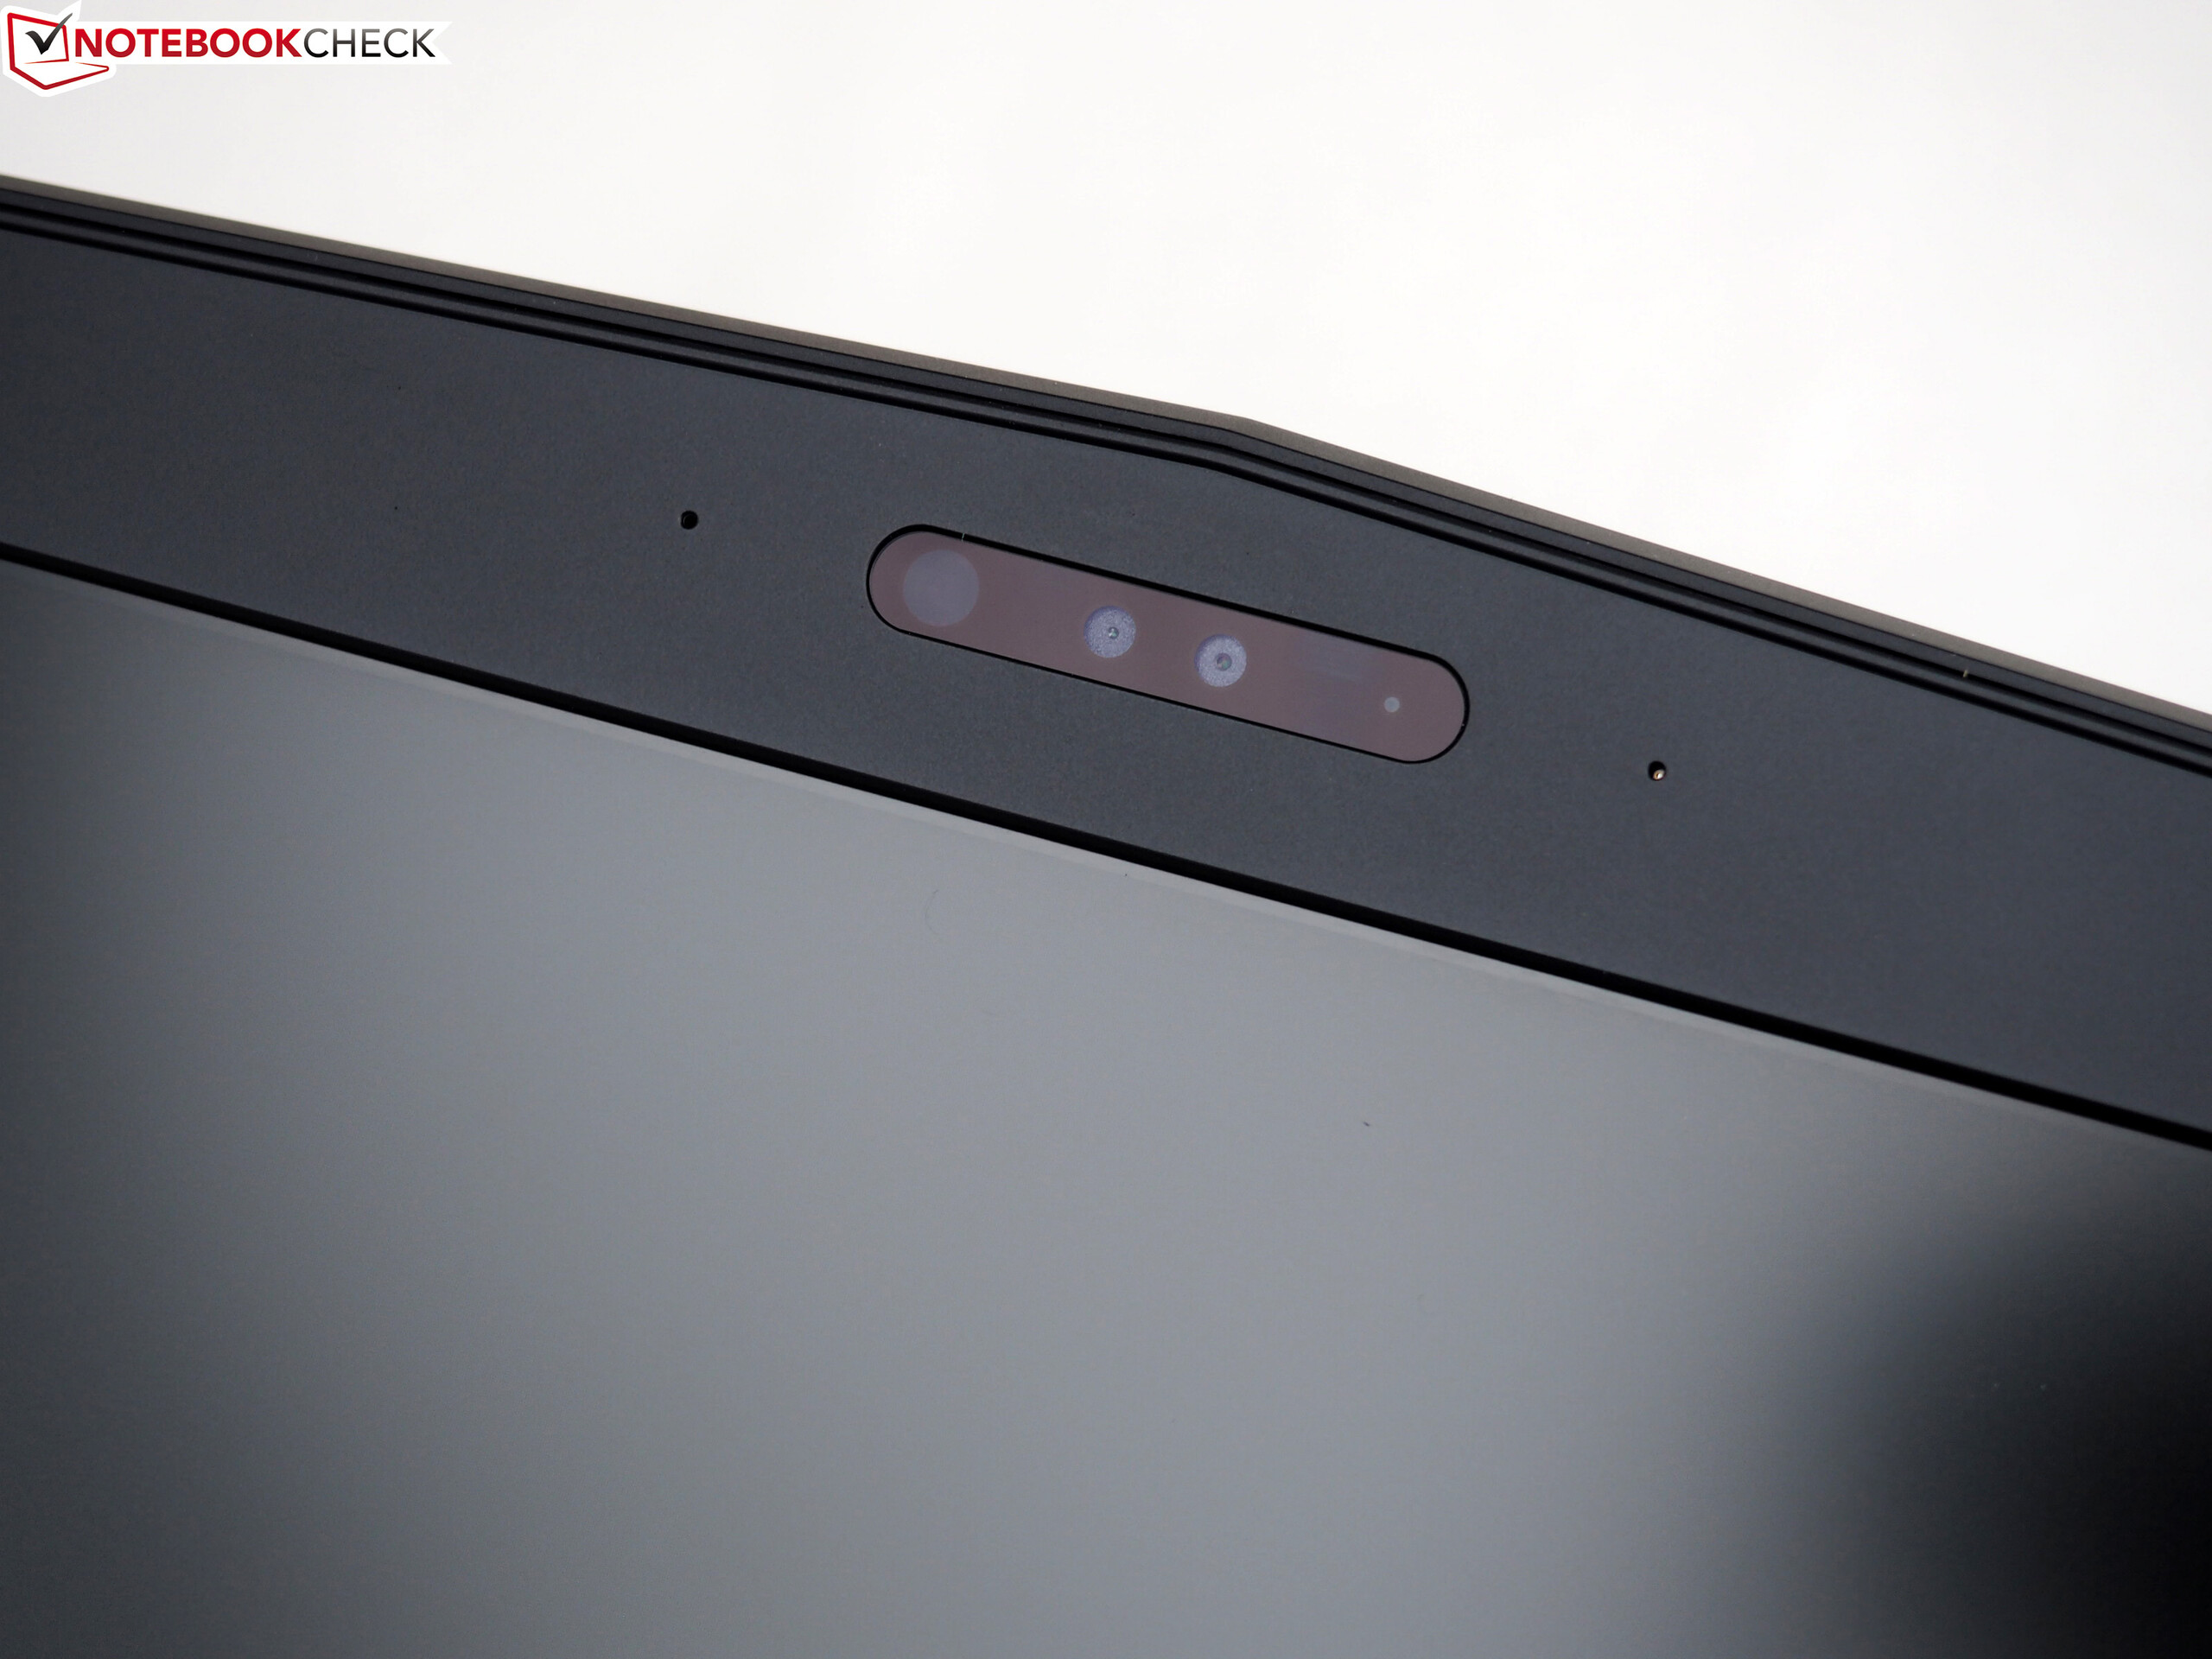
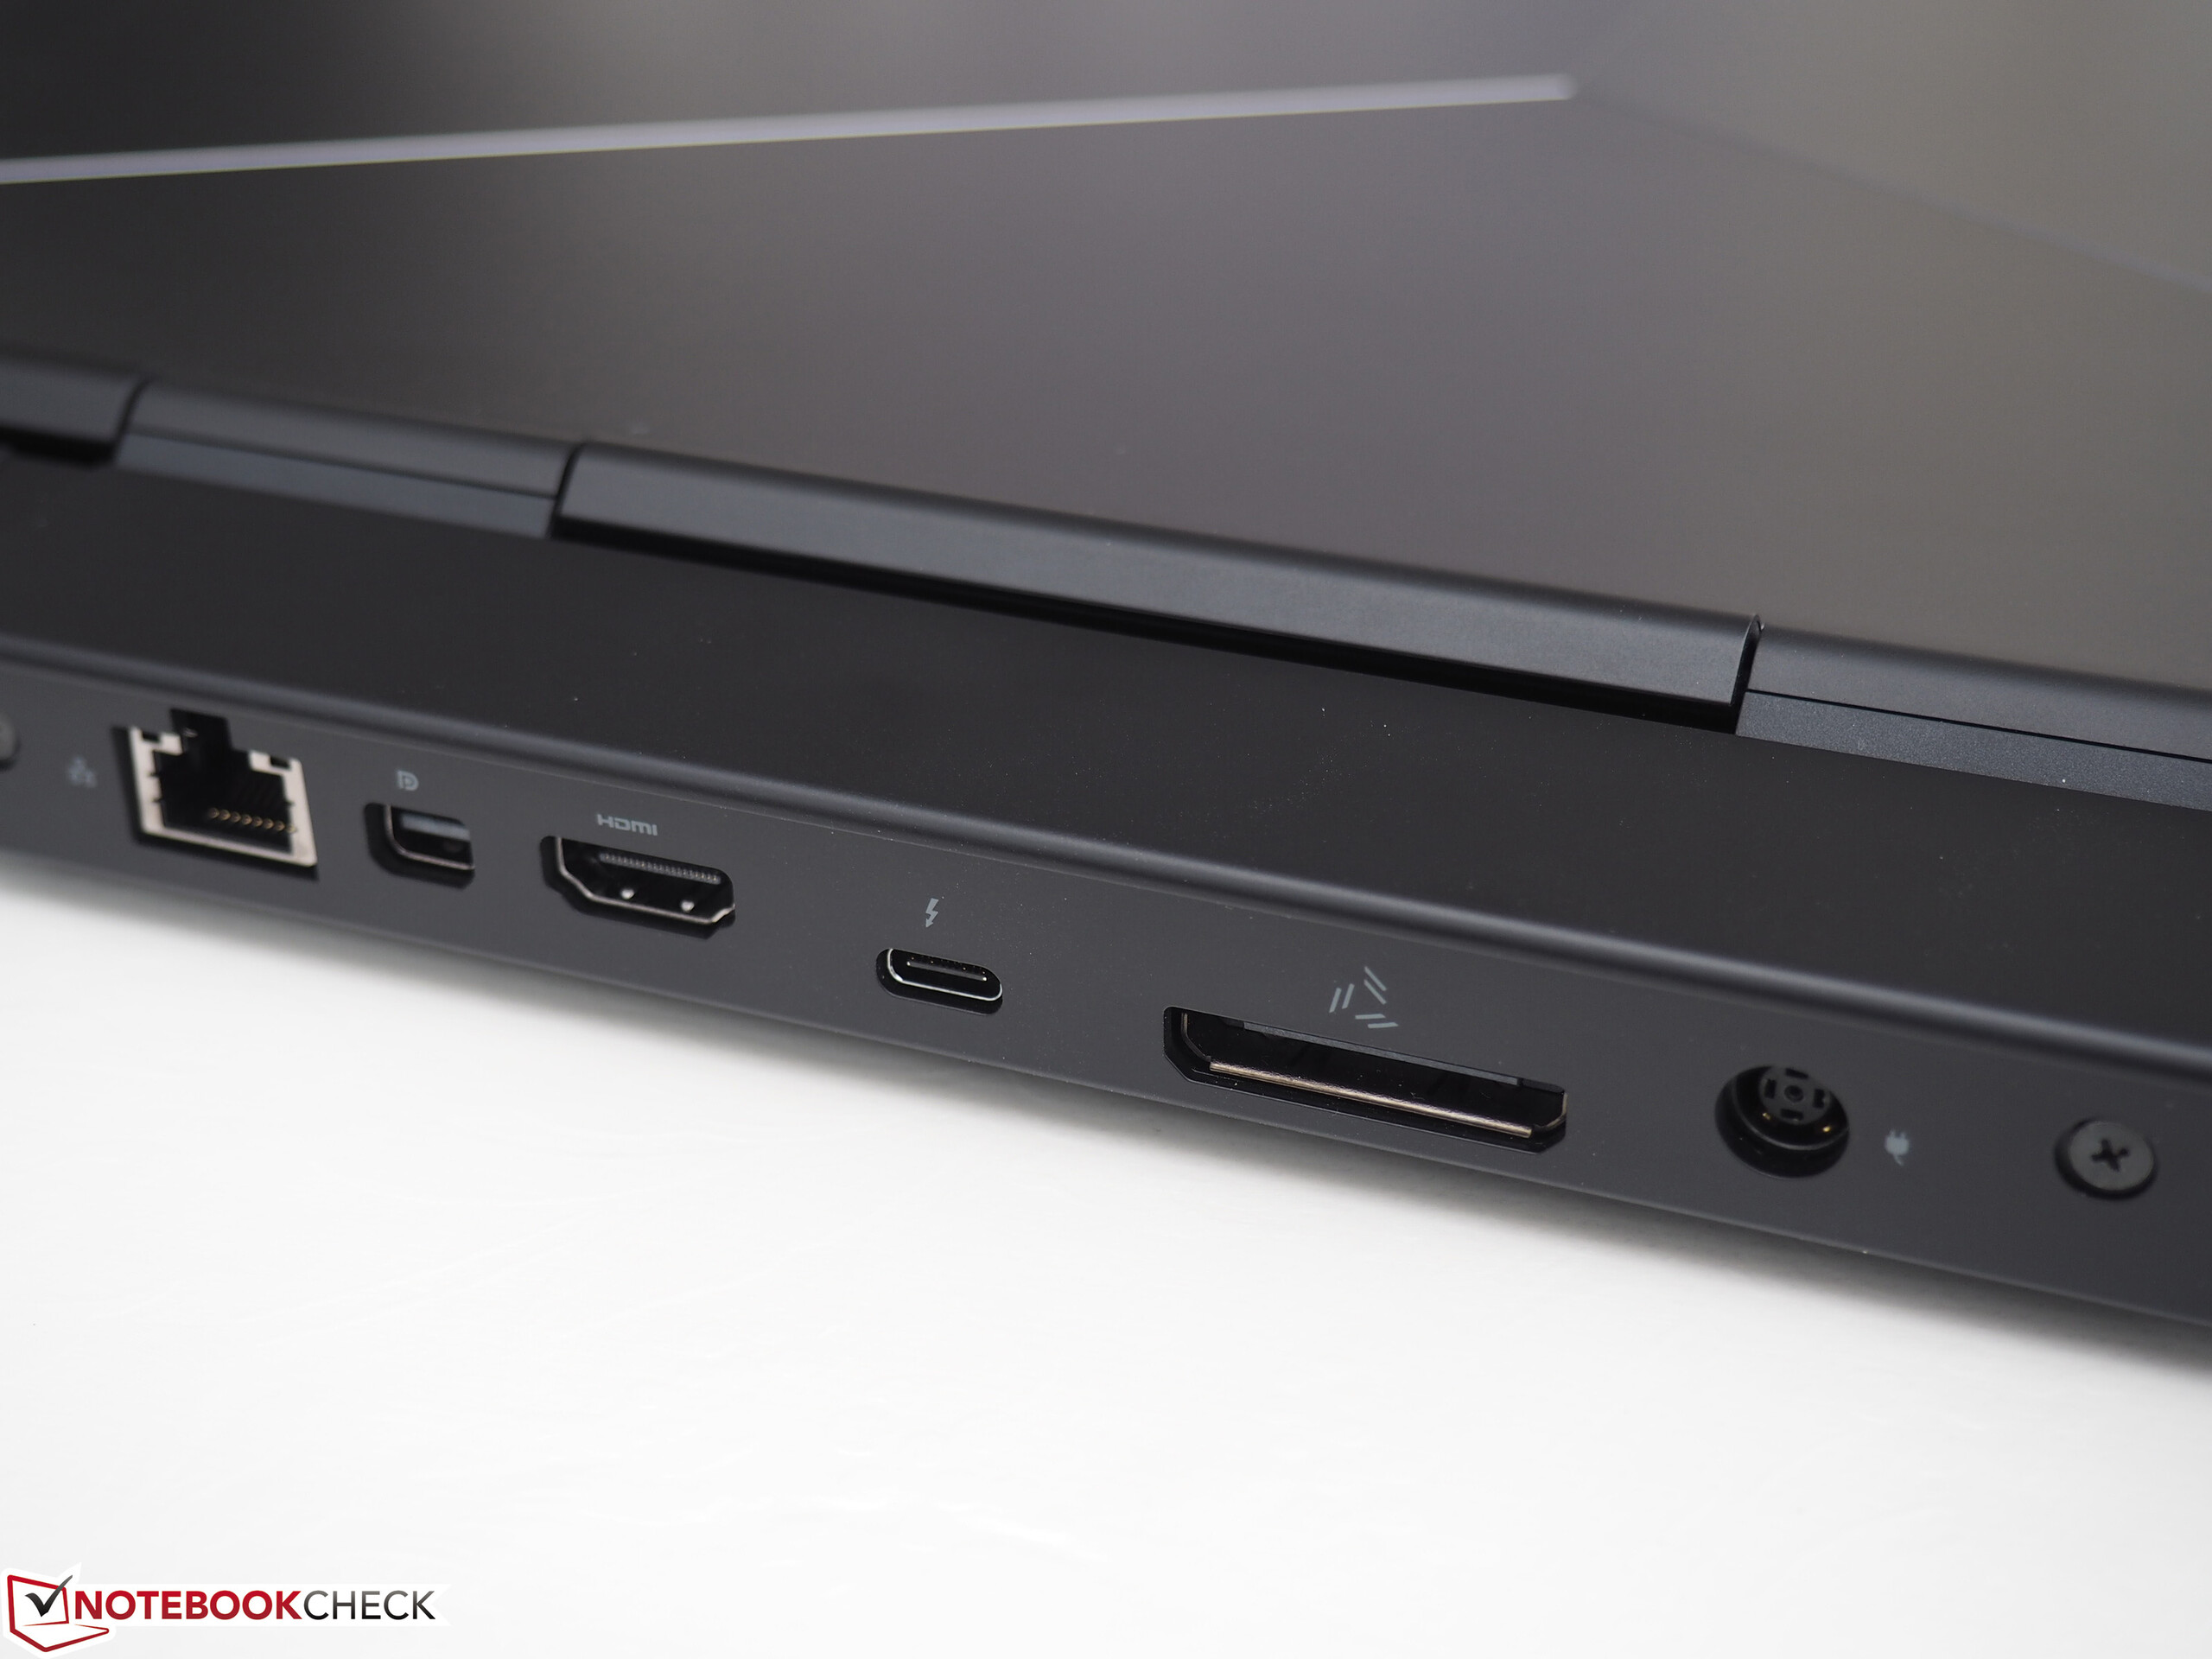
Den borde dessutom stå sig i ett par år – när GPU:n inte räcker till längre kan du bara ansluta en extern lösning via Thunderbolt 3 eller Graphics Amplifier-porten. 120 Hz-skärmen ger blandade känslor. Svarstider, belysning och kontrast är utmärkta, men betraktningsvinklarna, svärtan och färgåtergivningen är under genomsnittet. Det beror på TN-tekniken (60 Hz-modellen bygger på IPS).
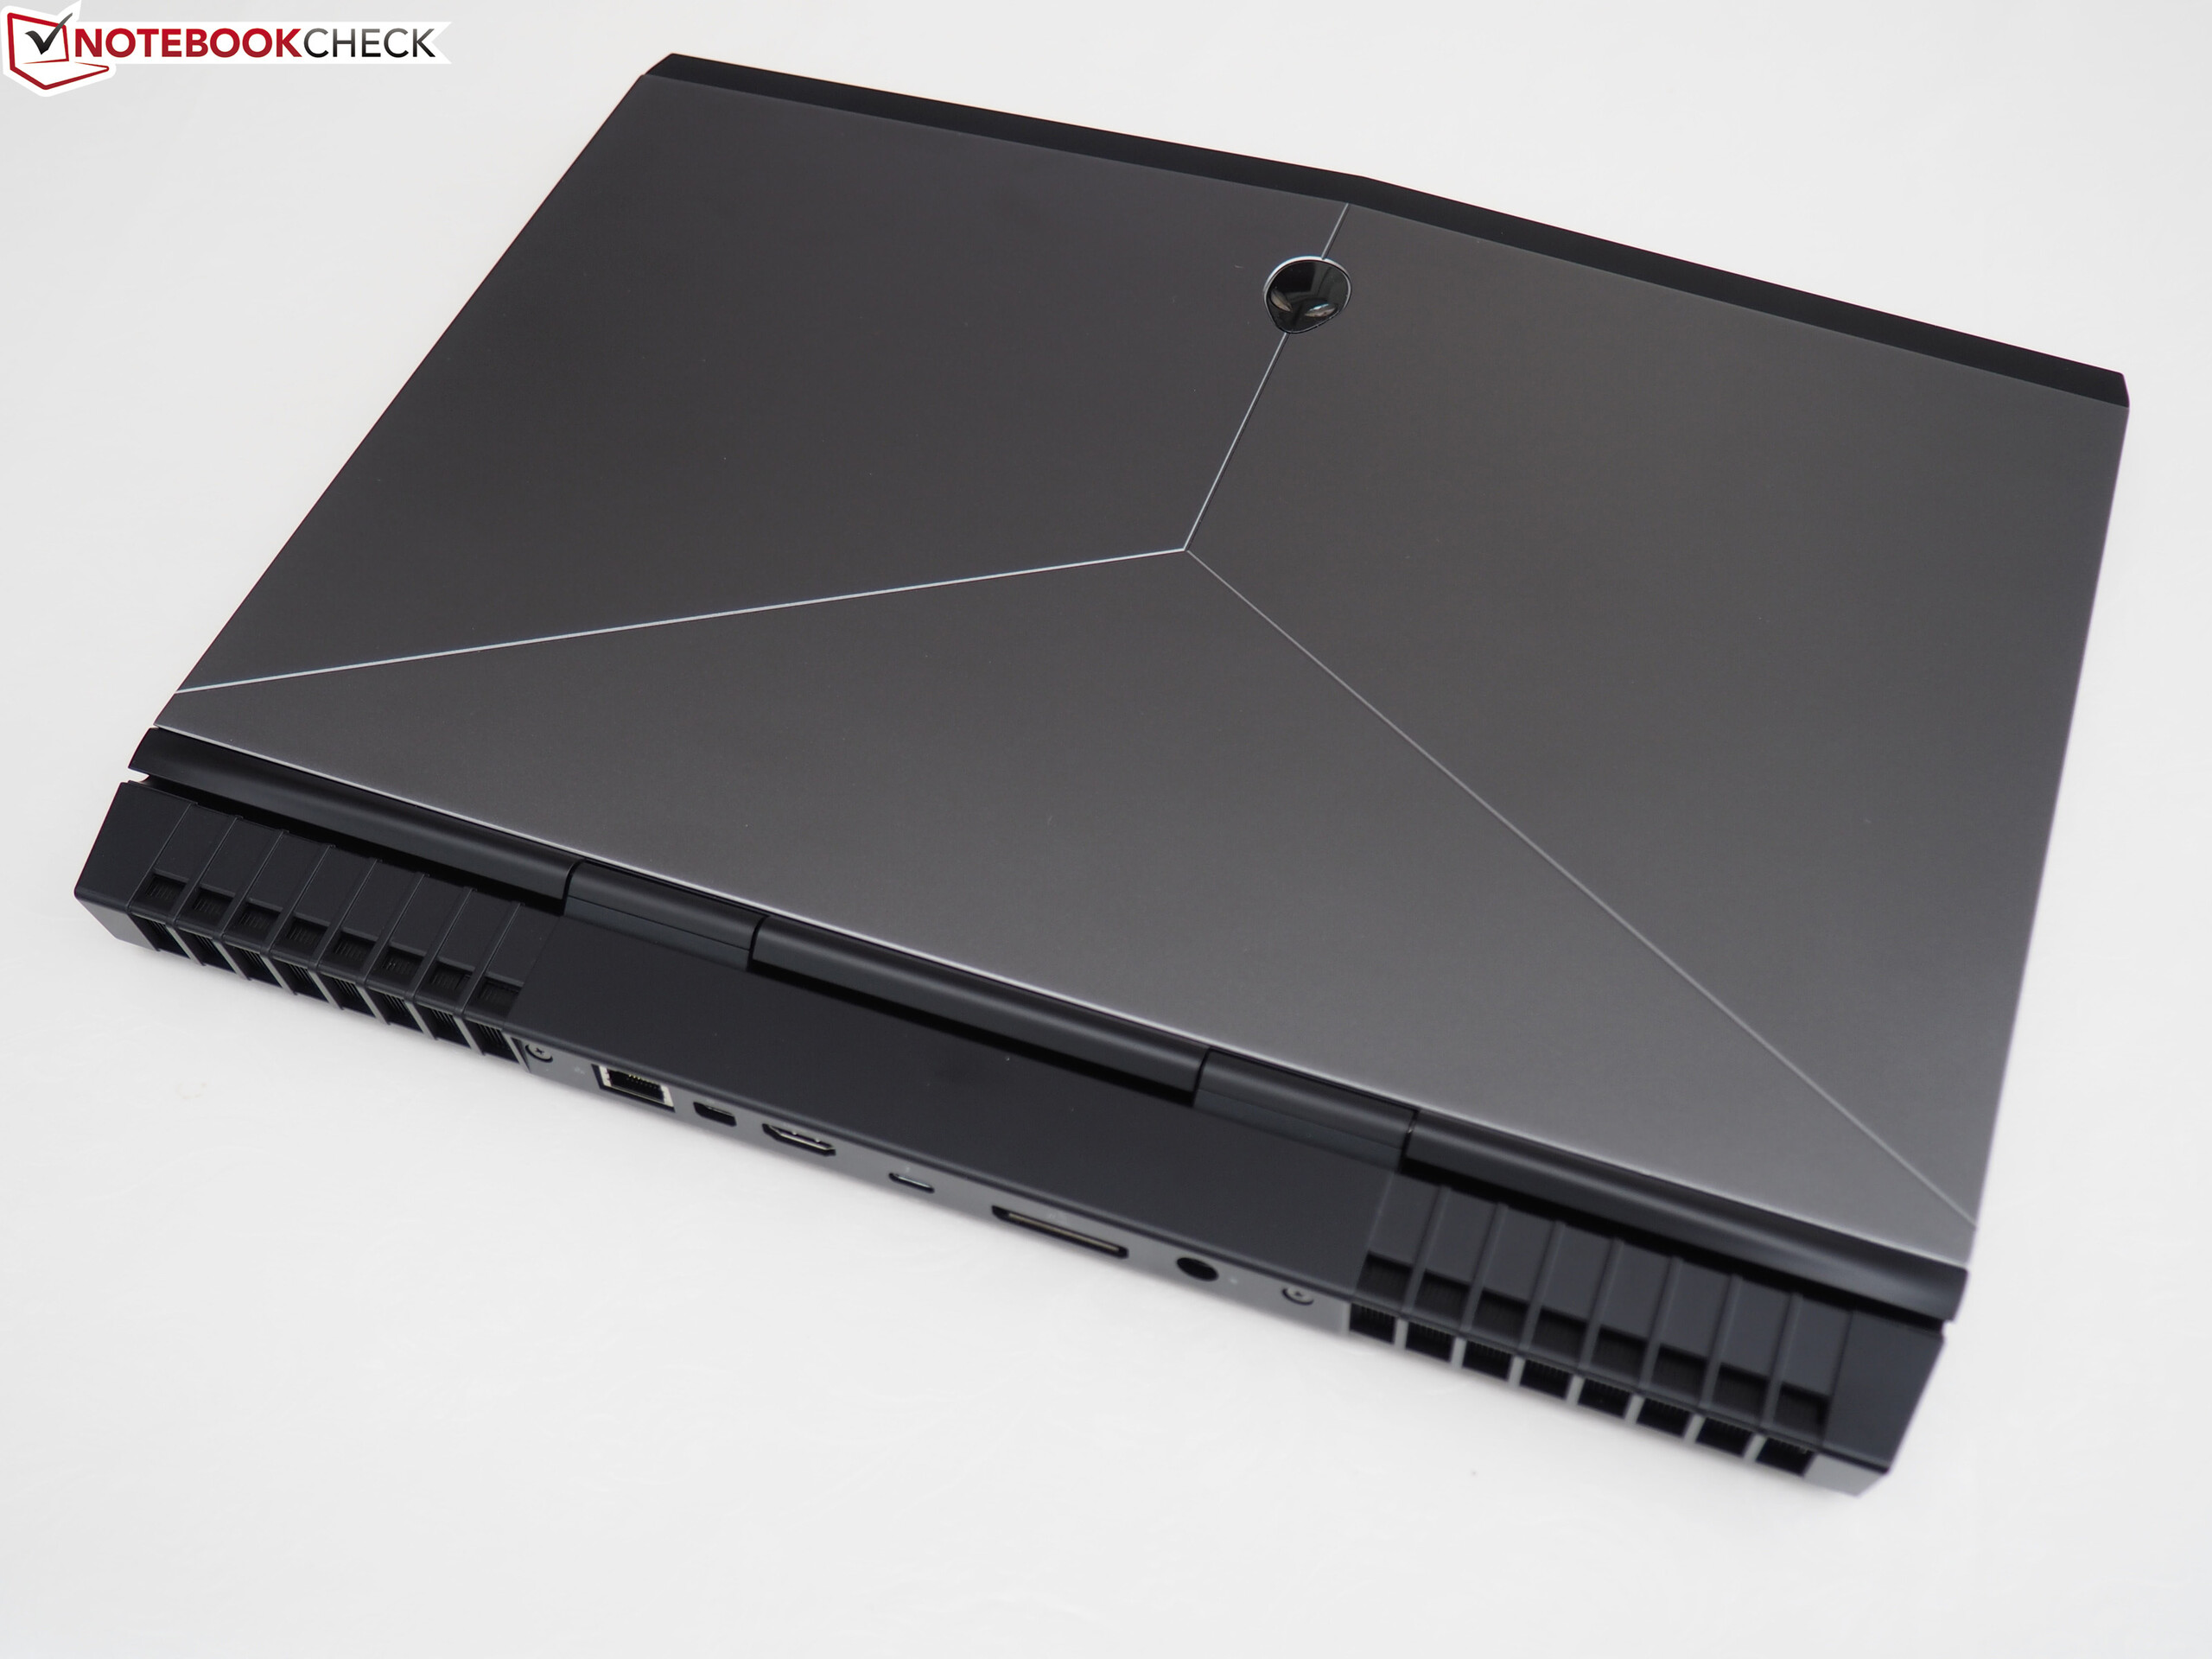
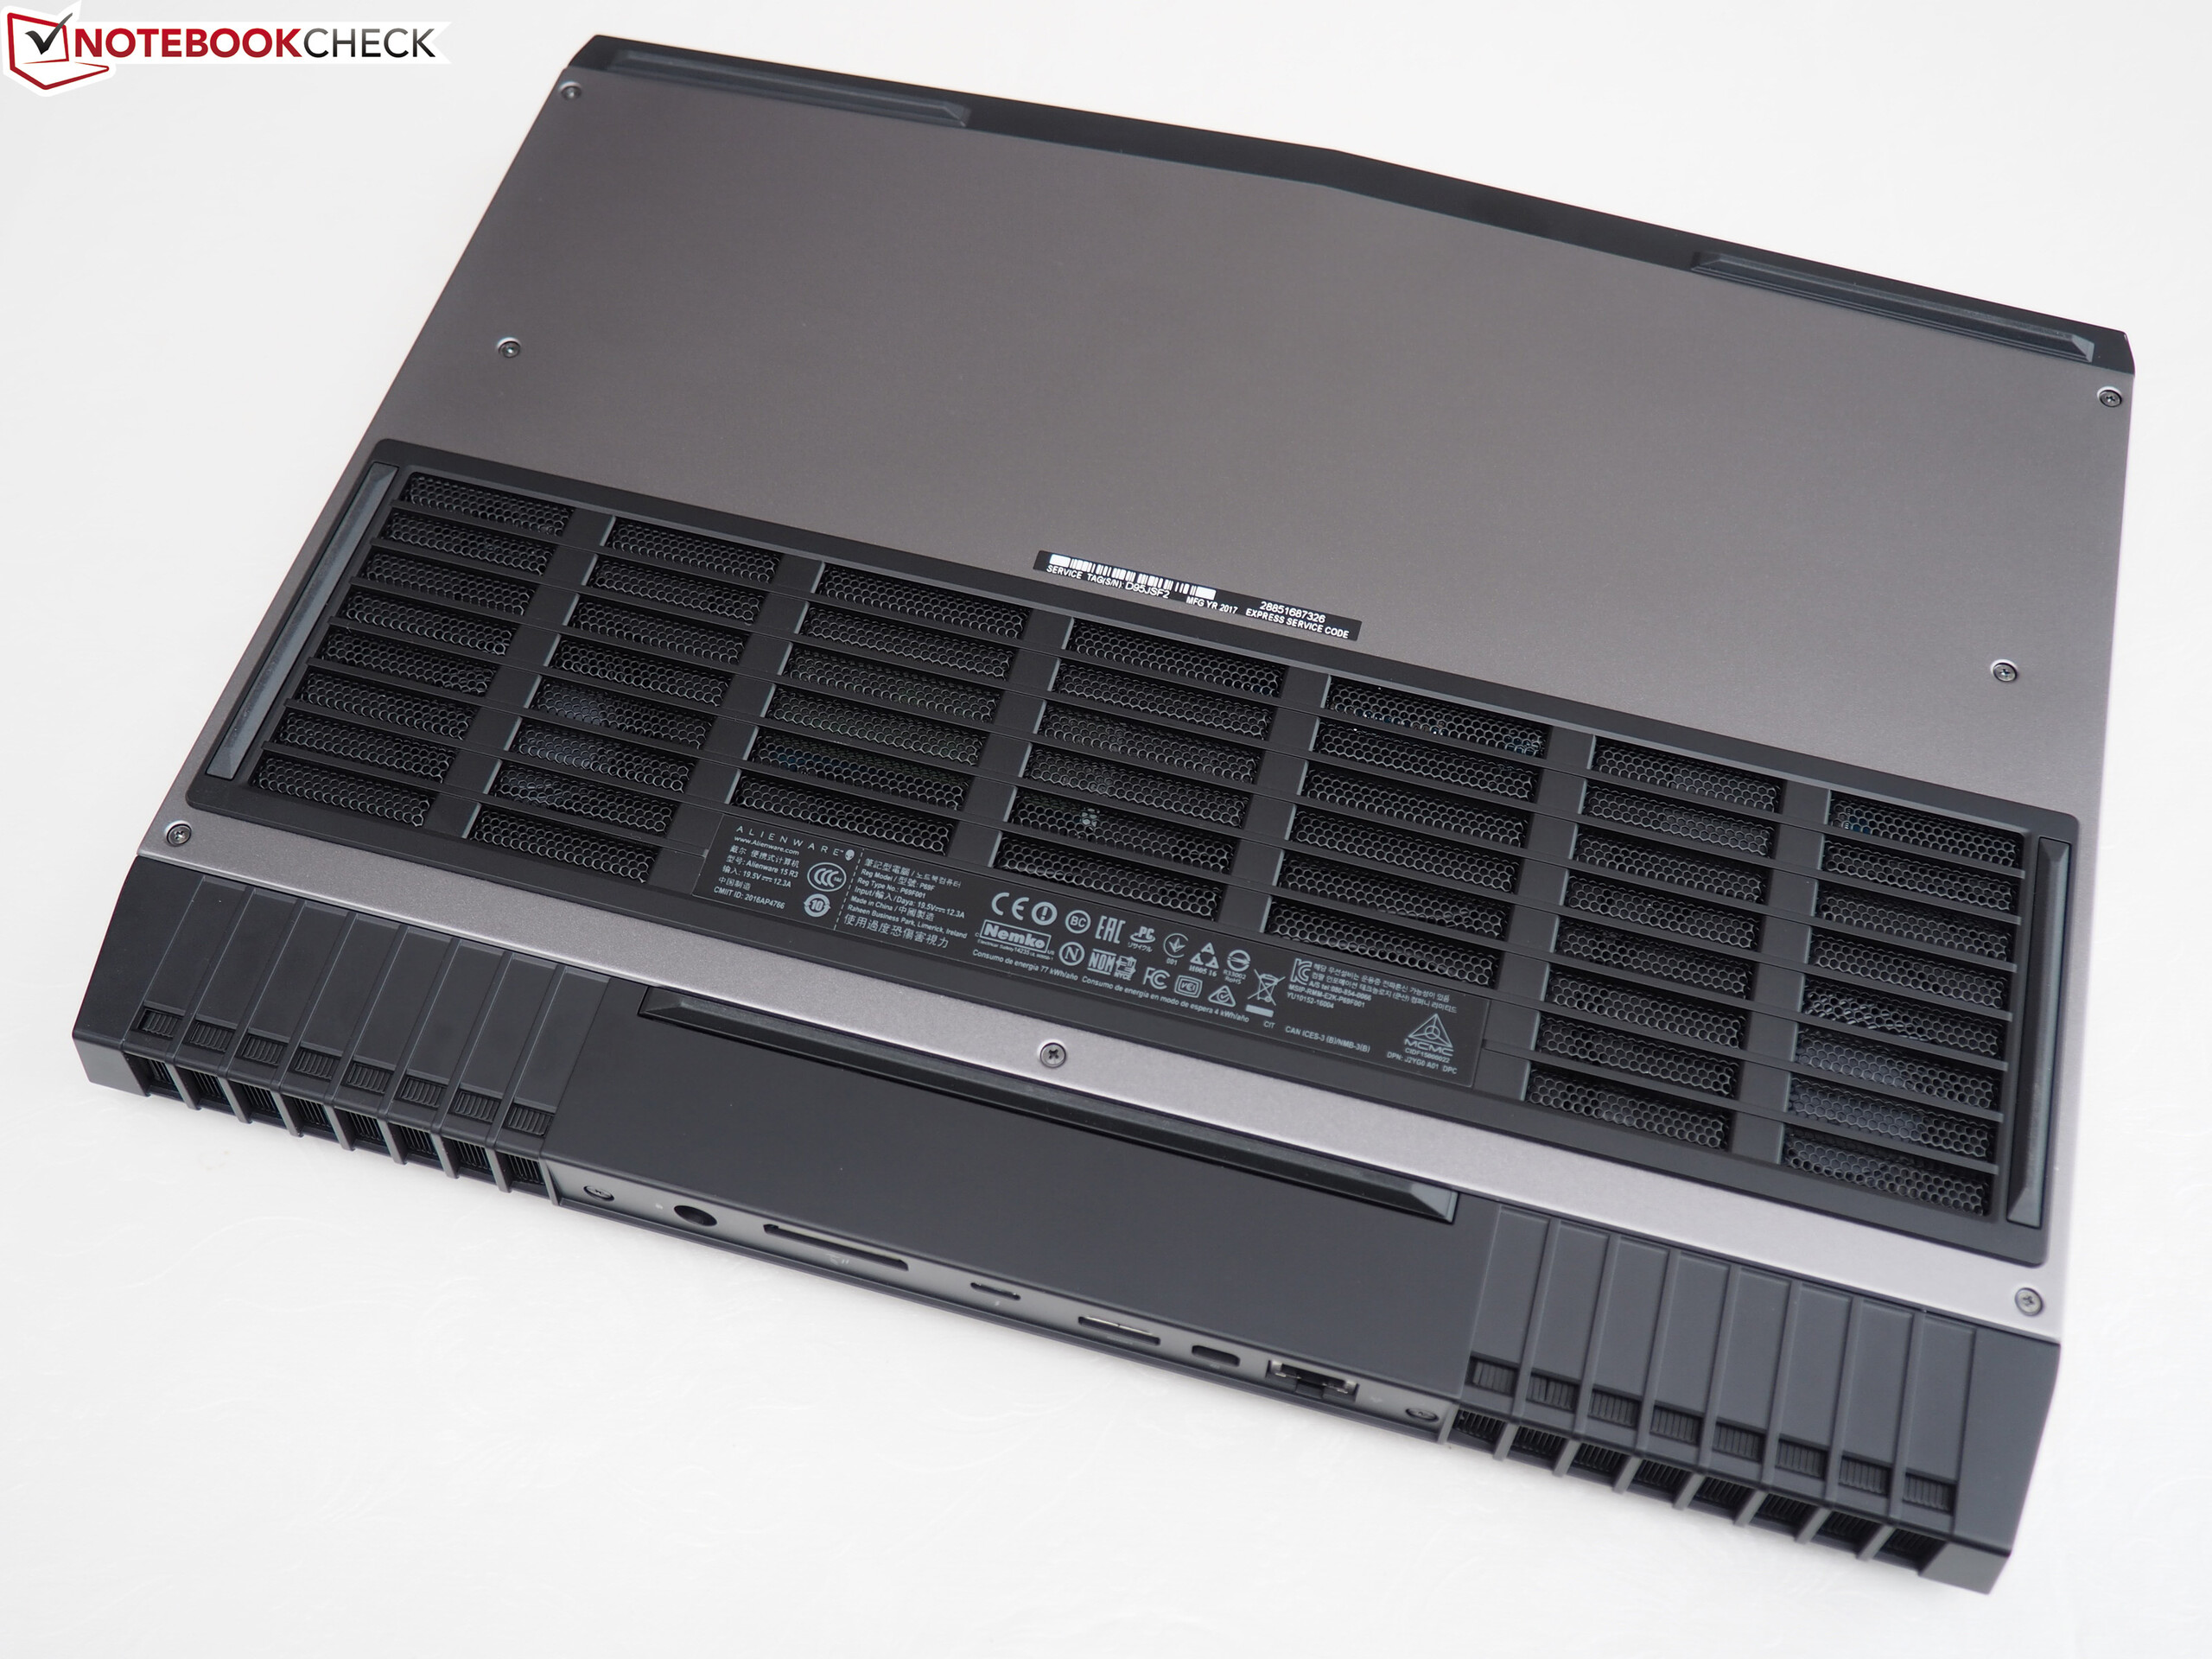
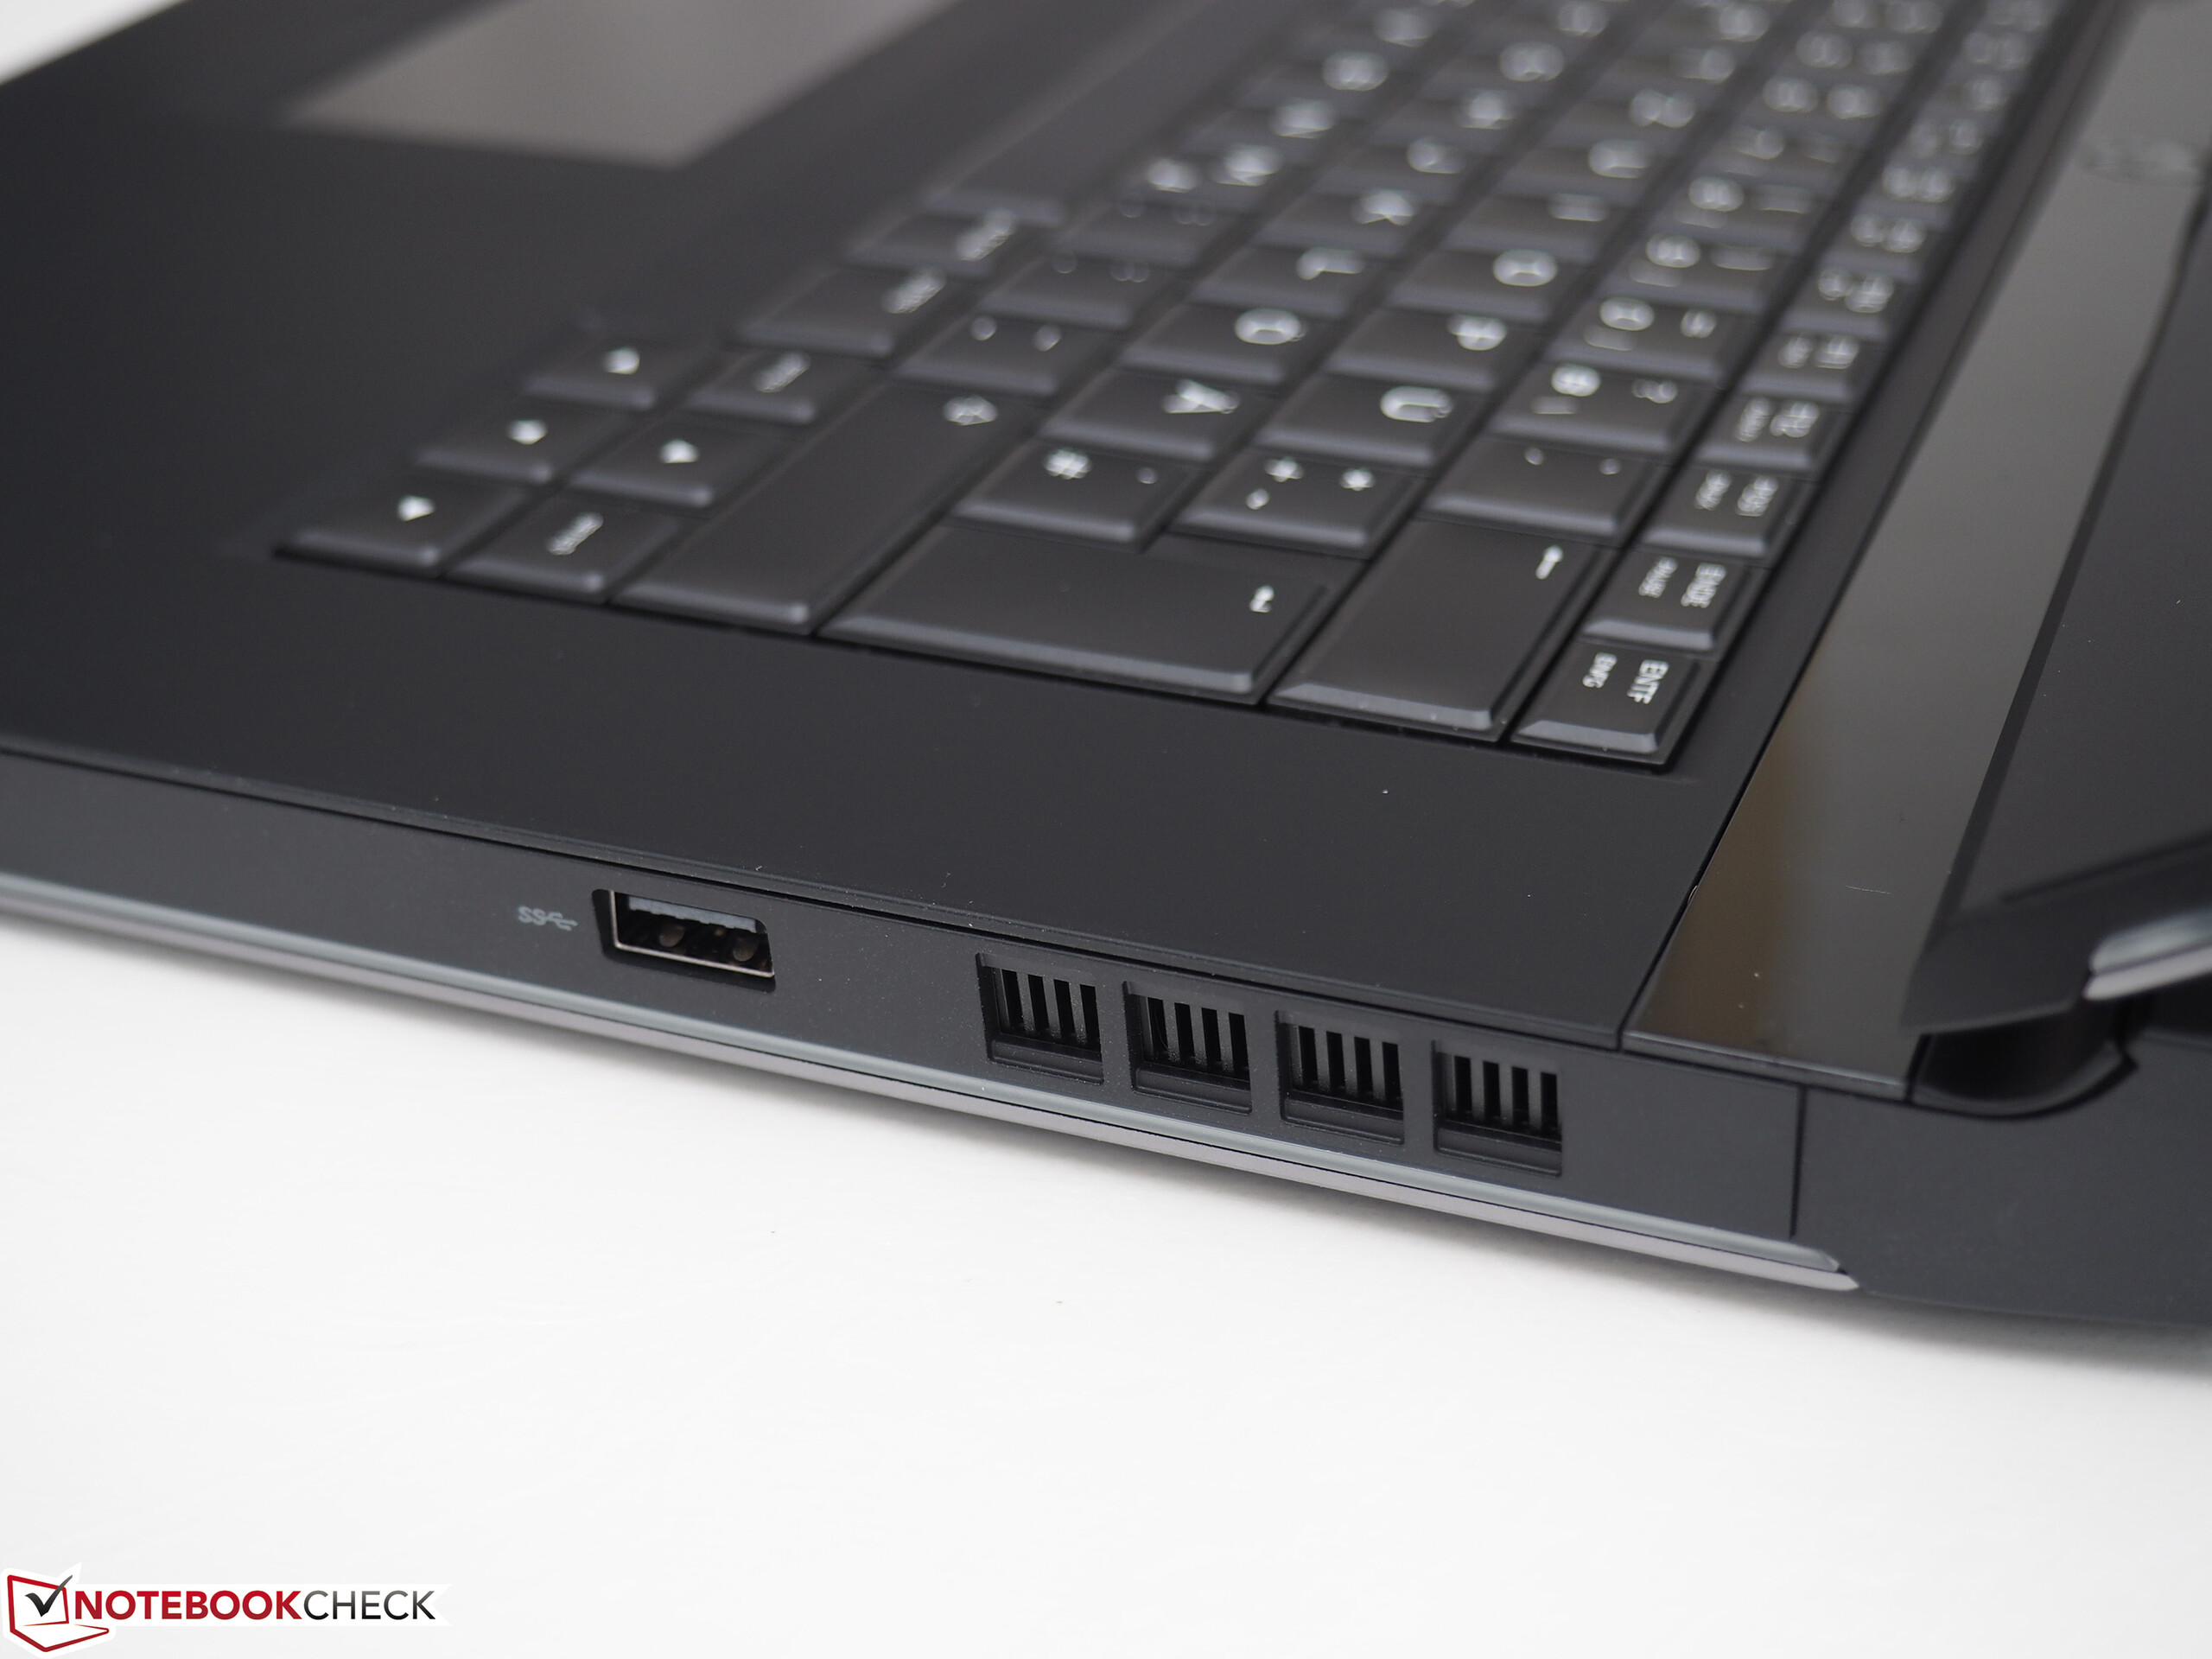
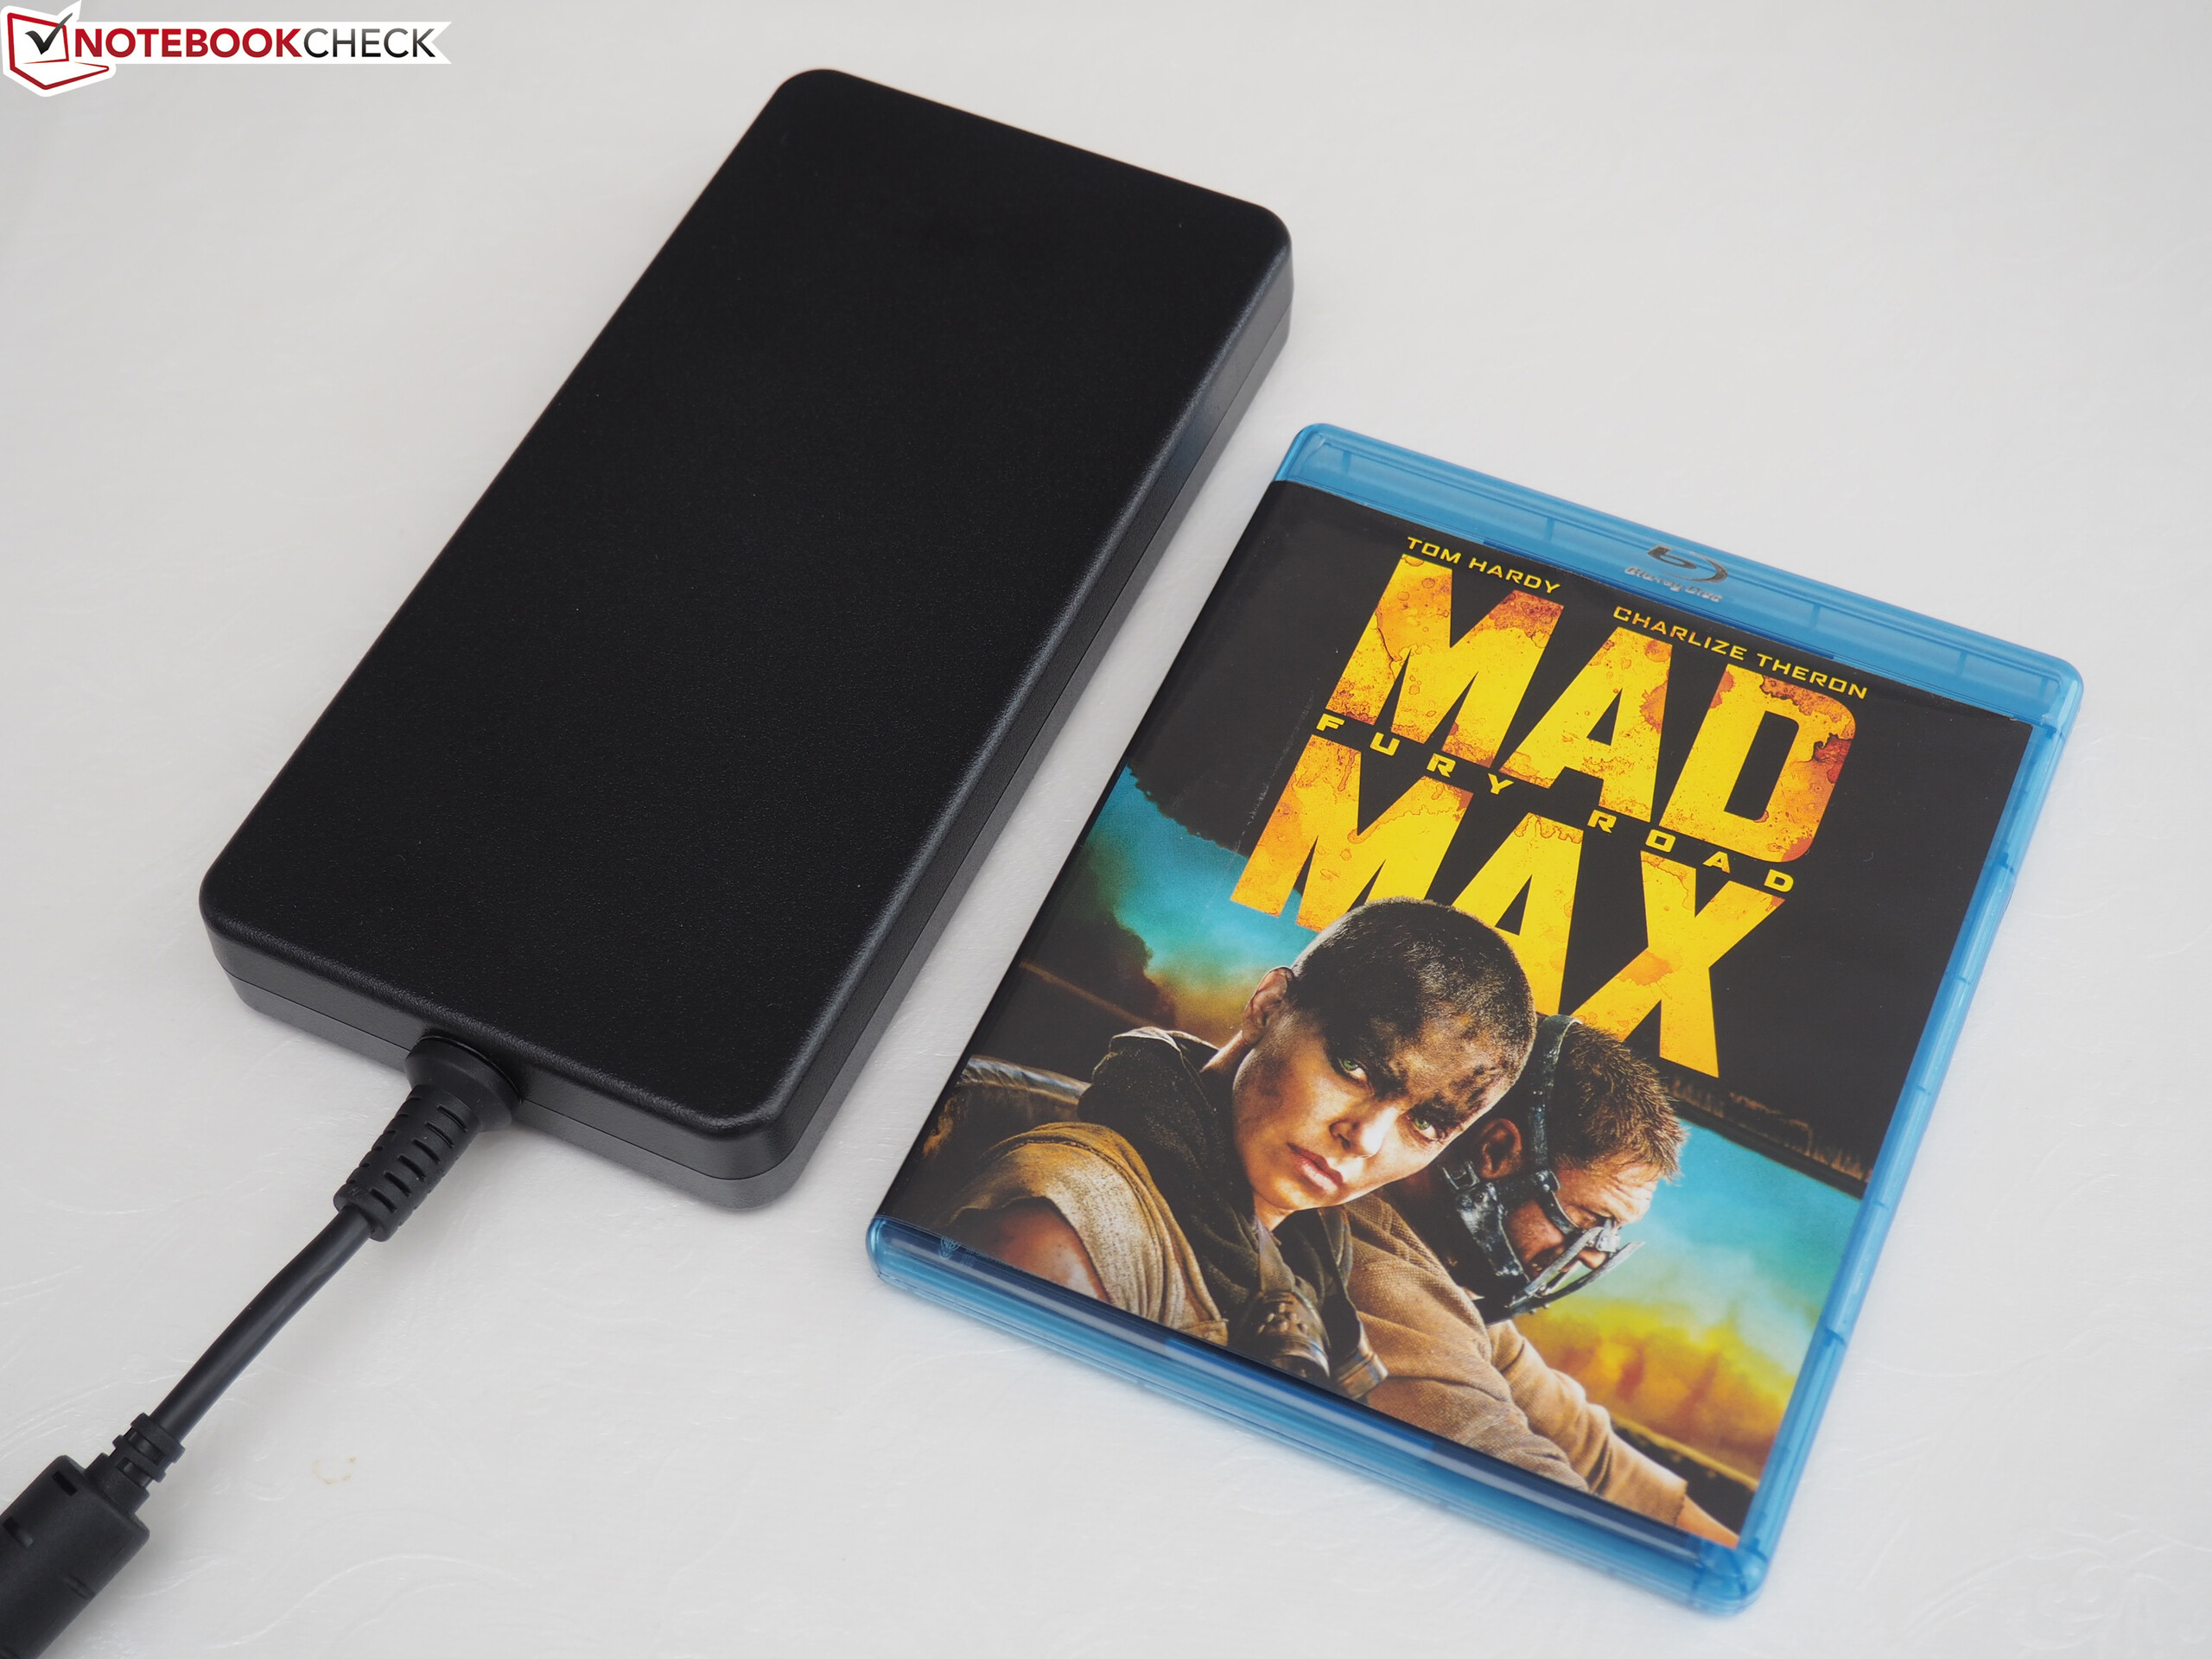
Men det största problemet med vår testmodell var temperaturen och ljudnivåerna under belastning, vilket förmodligen beror på den ojämna uppvärmningen av CPU-kärnorna. Nästan 50 dB (A) i 3D-spel är en hel del, även om Alienware 15 R3 är förvånansvärt tunn (2,5 cm). Kanske är det bara vår testmodell eller så är det ett generellt problem.
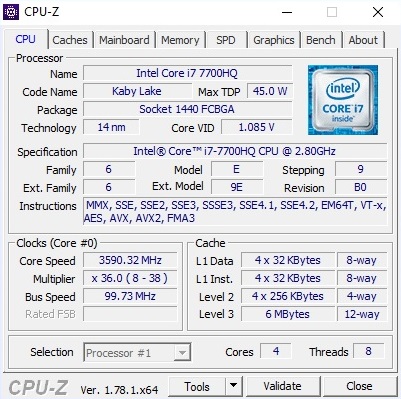
Om du har överseende med denna detalj – och den mediokra ljudbilden – övertygar Alienware 15 R3 på nästan alla punkter. Kombinationen Core i7-7700HQ och GeForce GTX 1070 kan hantera alla moderna spel med maxinställningar och Full HD-upplösning.
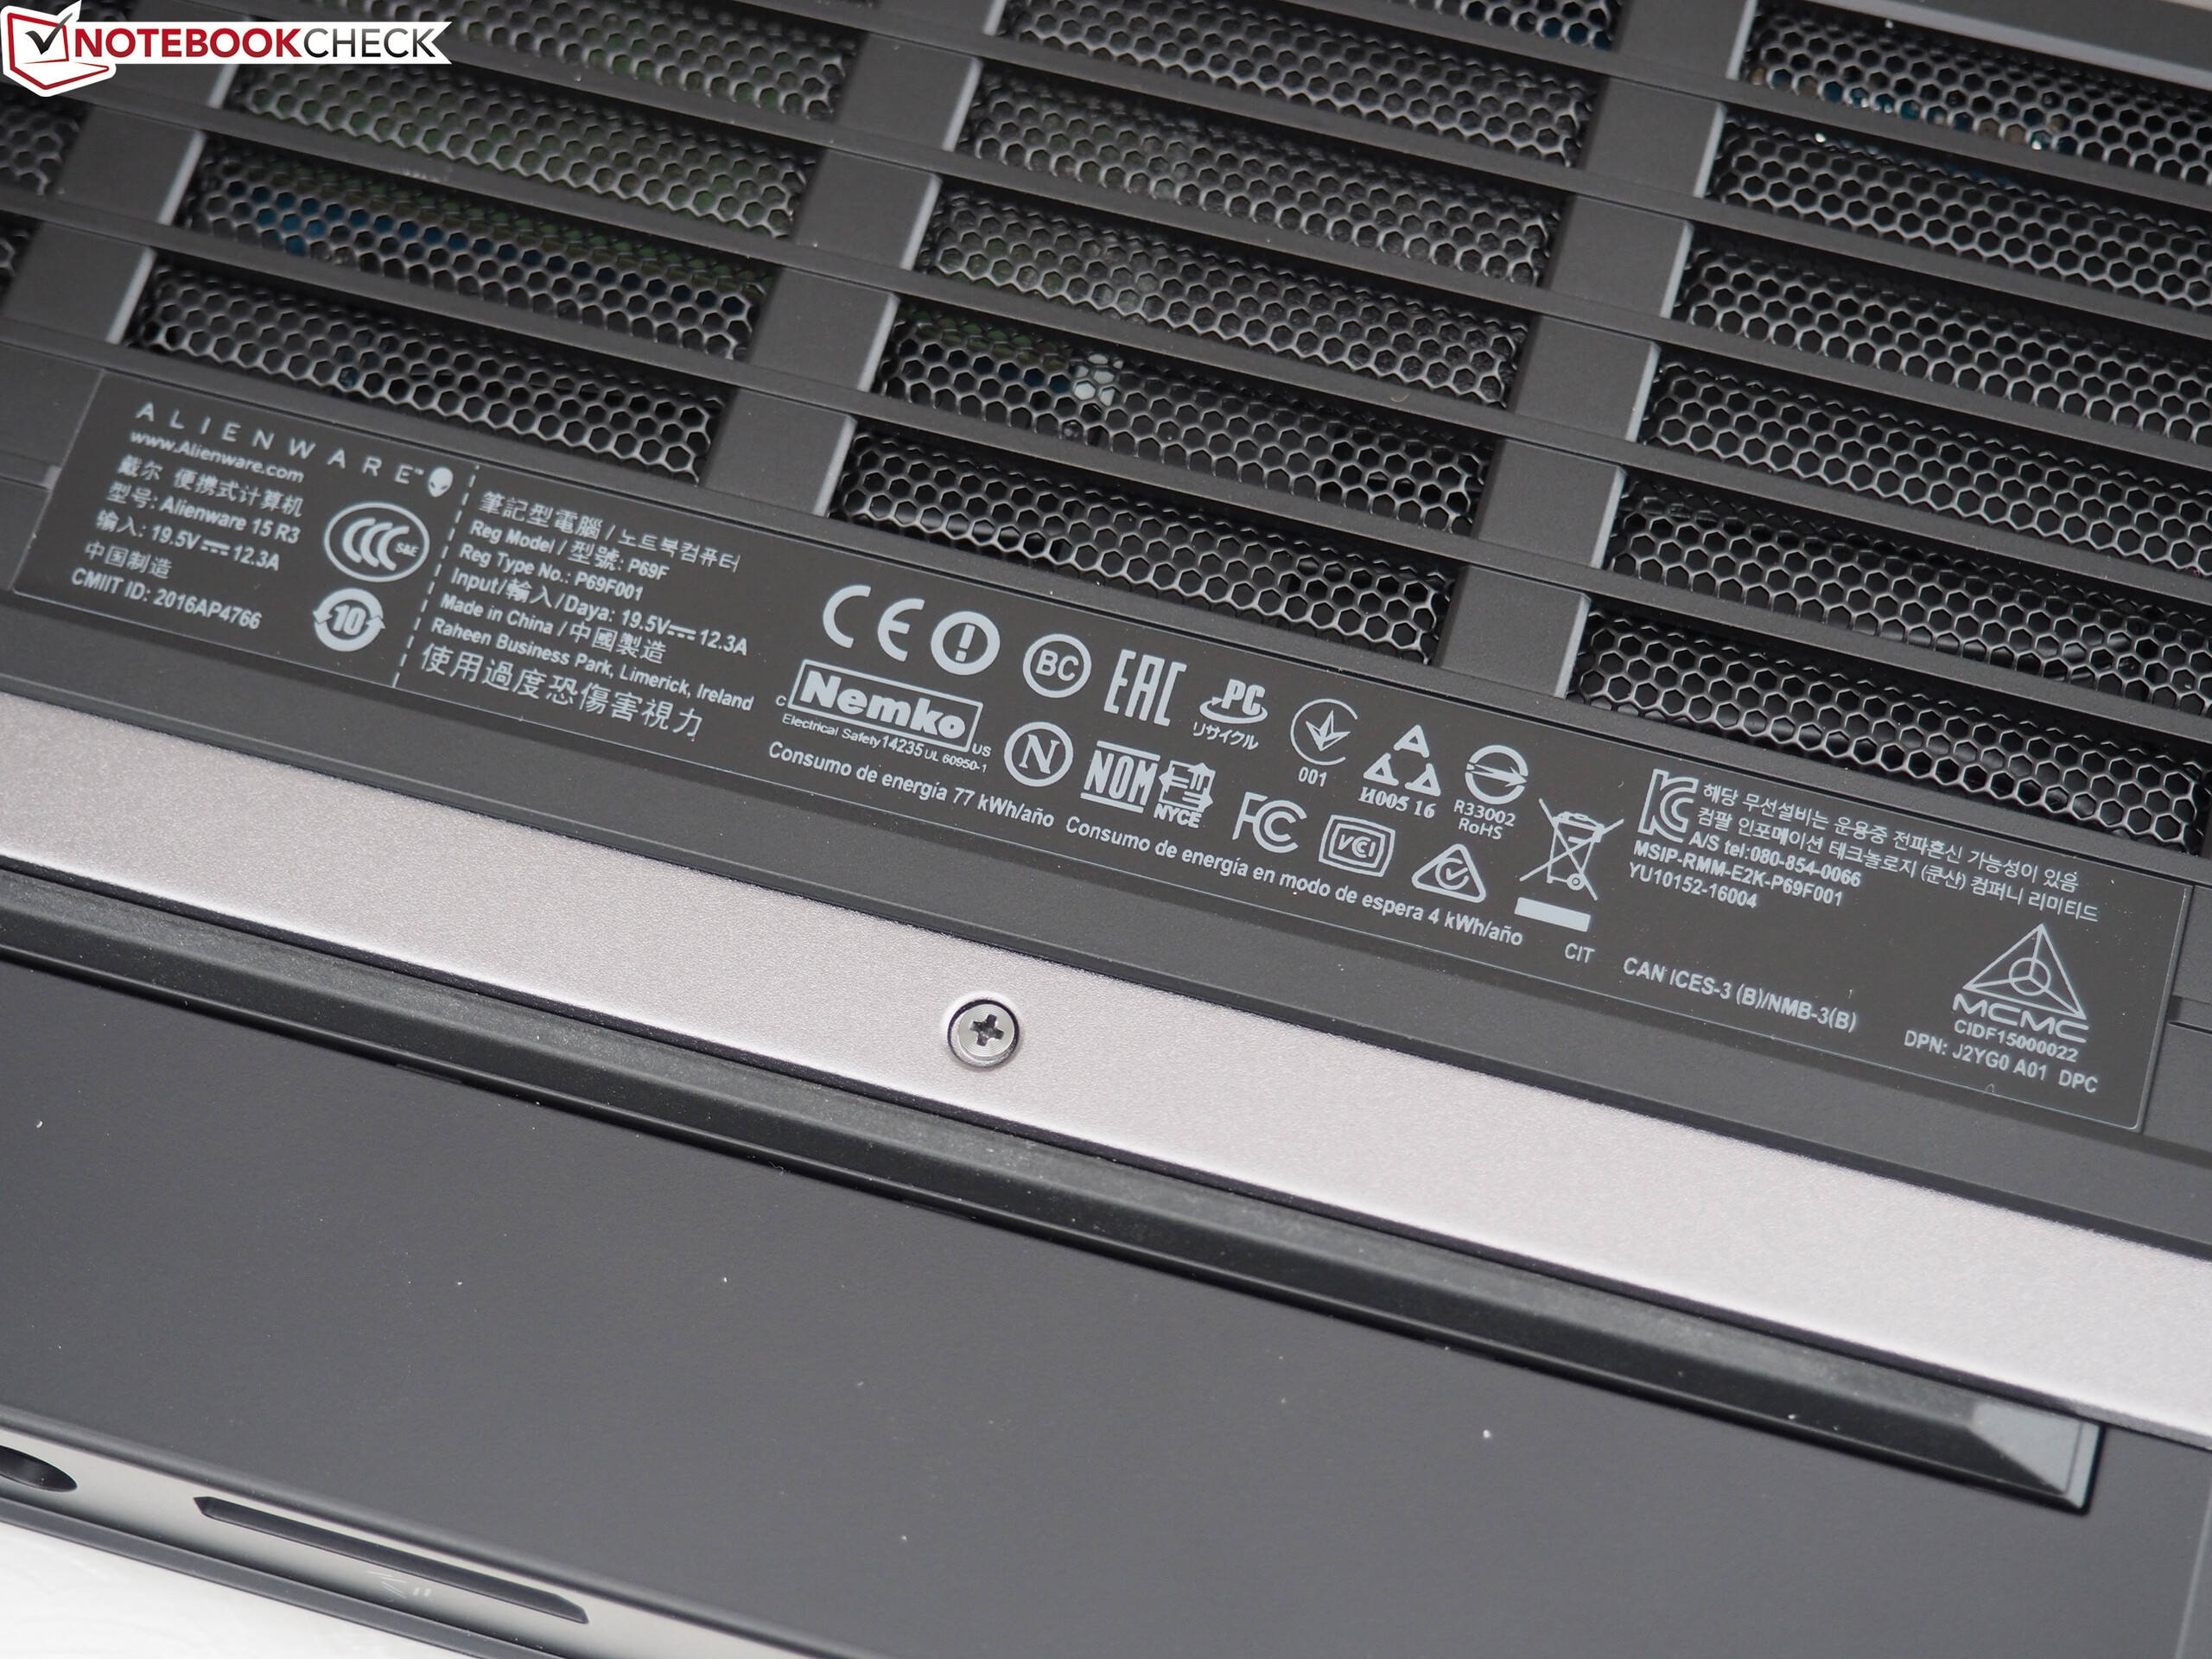
Alienware 15 R3
- 02/08/2017 v6 (old)
Florian Glaser
Price comparison