Test: HP EliteBook x360 1030 G2 (Core i5, Full HD) (sammanfattning)

| Networking | |
| iperf3 transmit AX12 | |
| Lenovo ThinkPad X1 Carbon 2017-20HQS03P00 | |
| Lenovo ThinkPad Yoga 370-20JJS00100 | |
| HP EliteBook x360 1030 G2 | |
| iperf3 receive AX12 | |
| Lenovo ThinkPad Yoga 370-20JJS00100 | |
| Lenovo ThinkPad X1 Carbon 2017-20HQS03P00 | |
| HP EliteBook x360 1030 G2 | |
| |||||||||||||||||||||||||
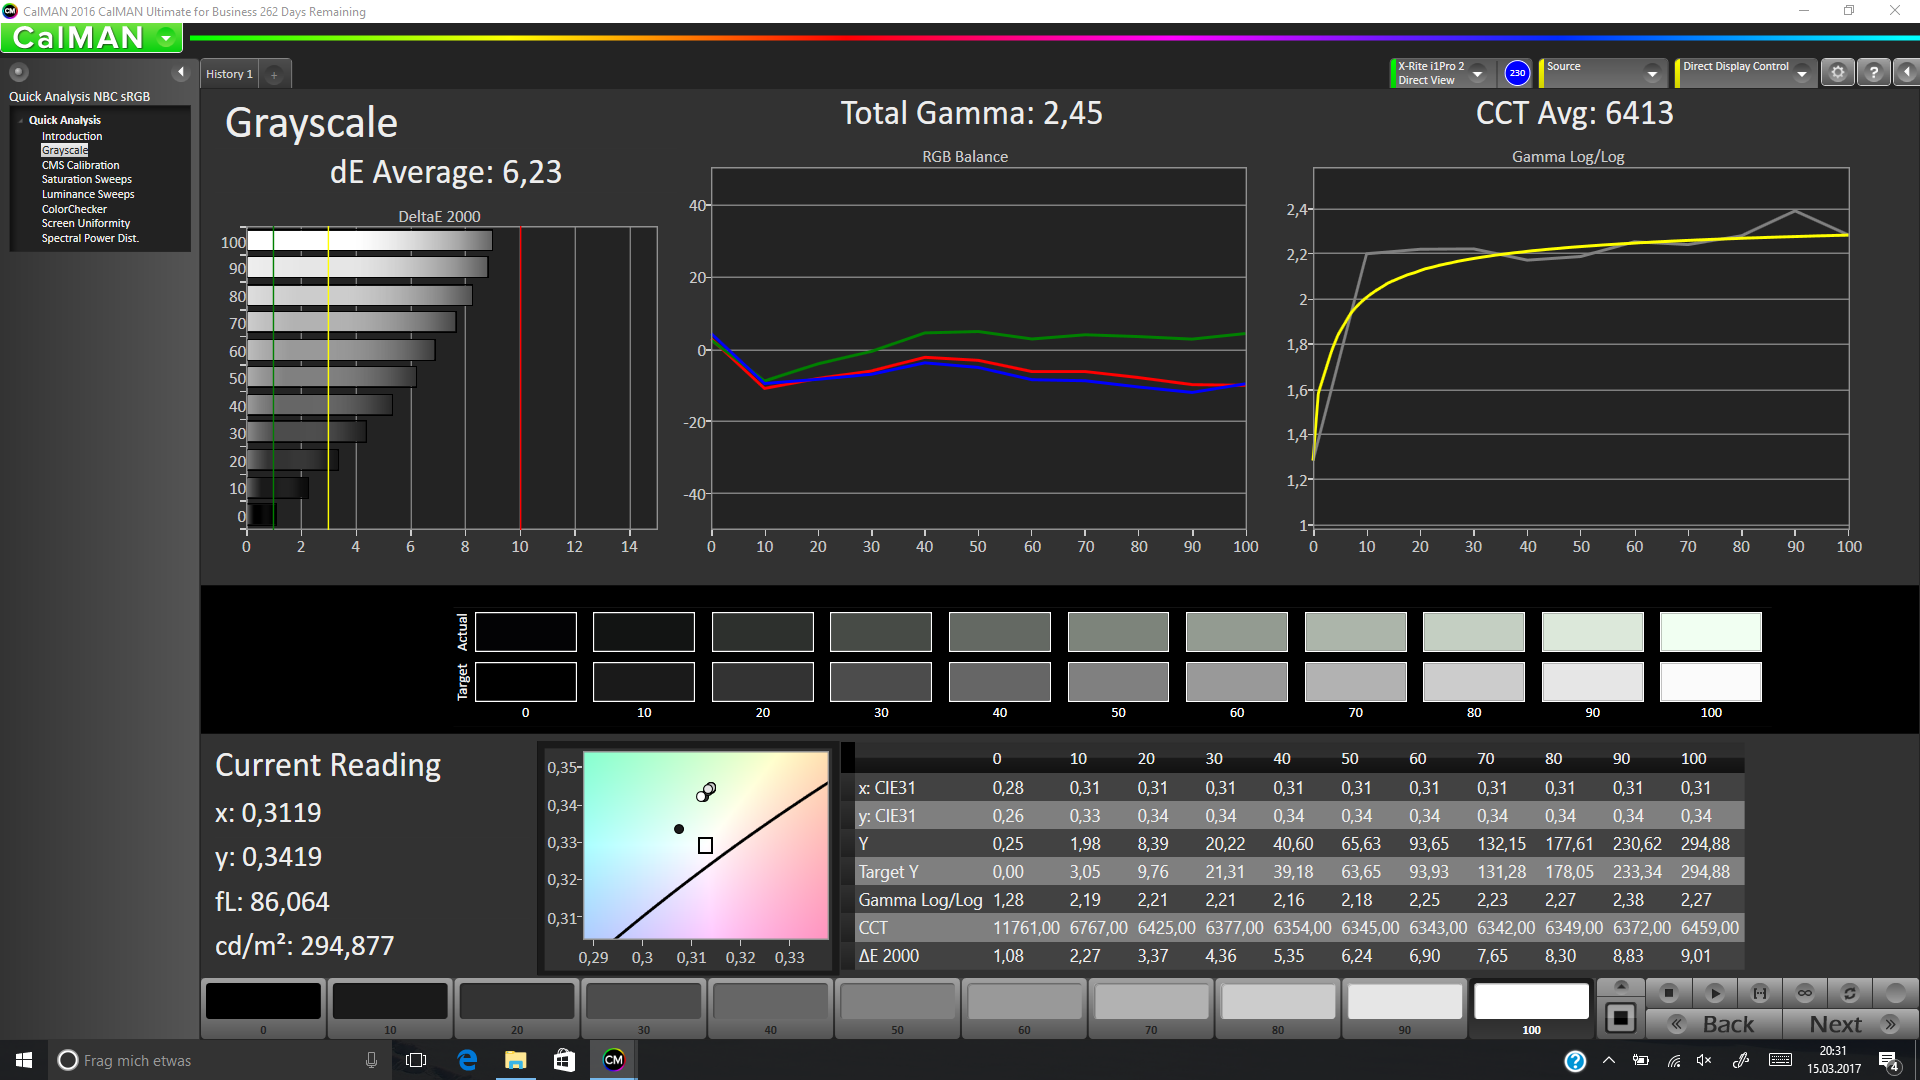
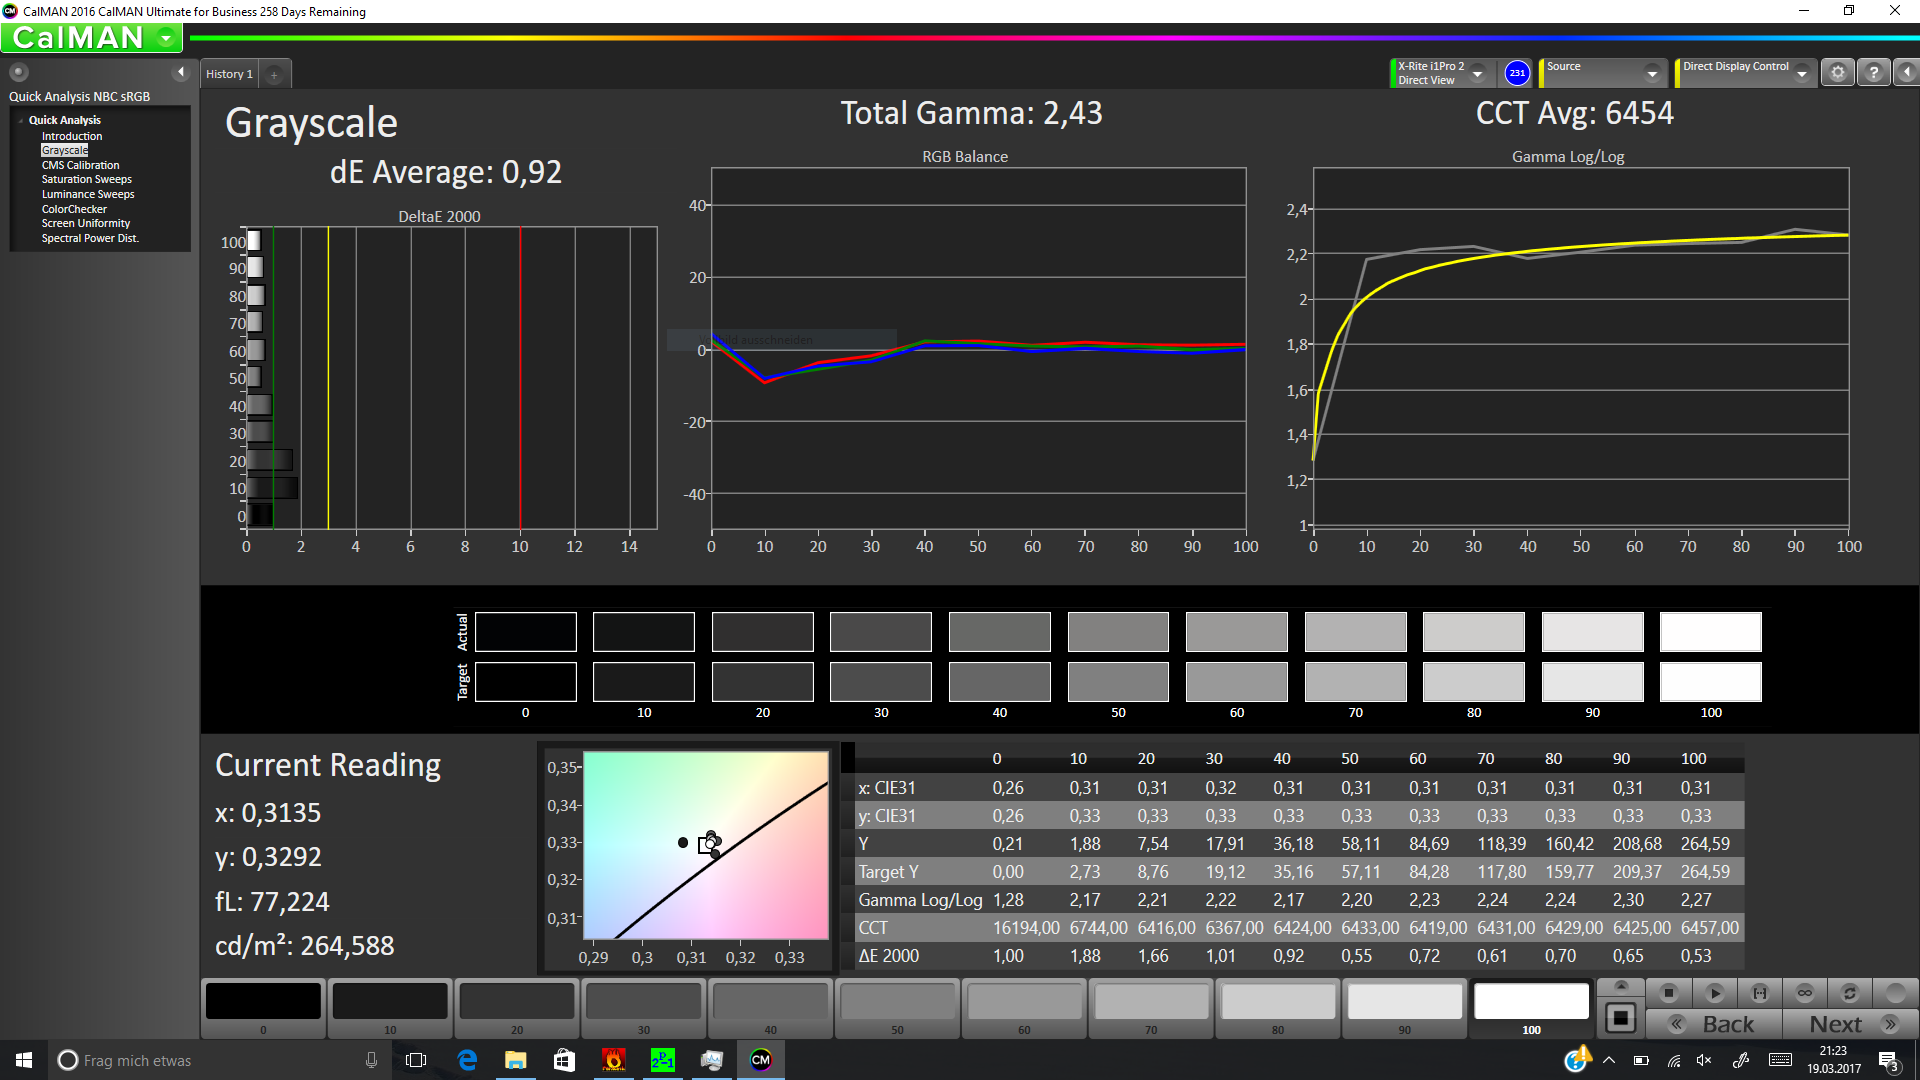
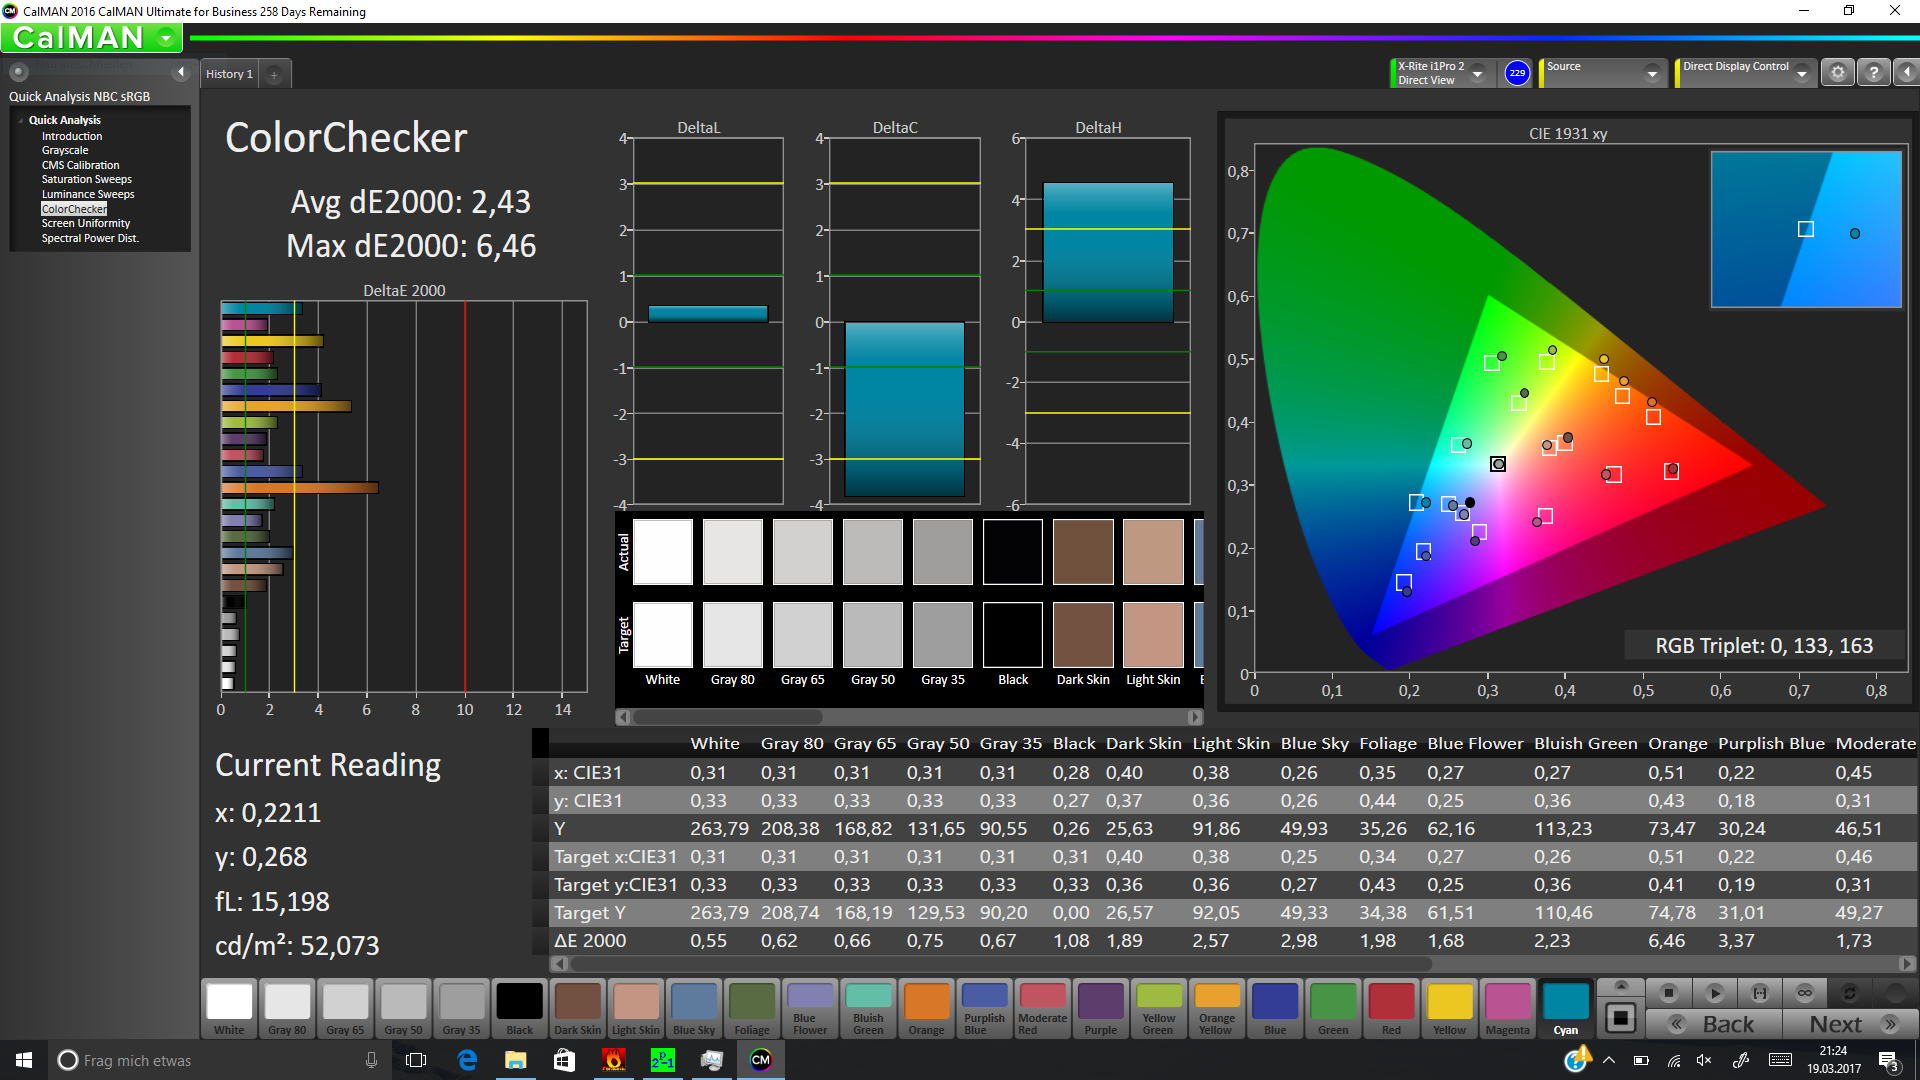
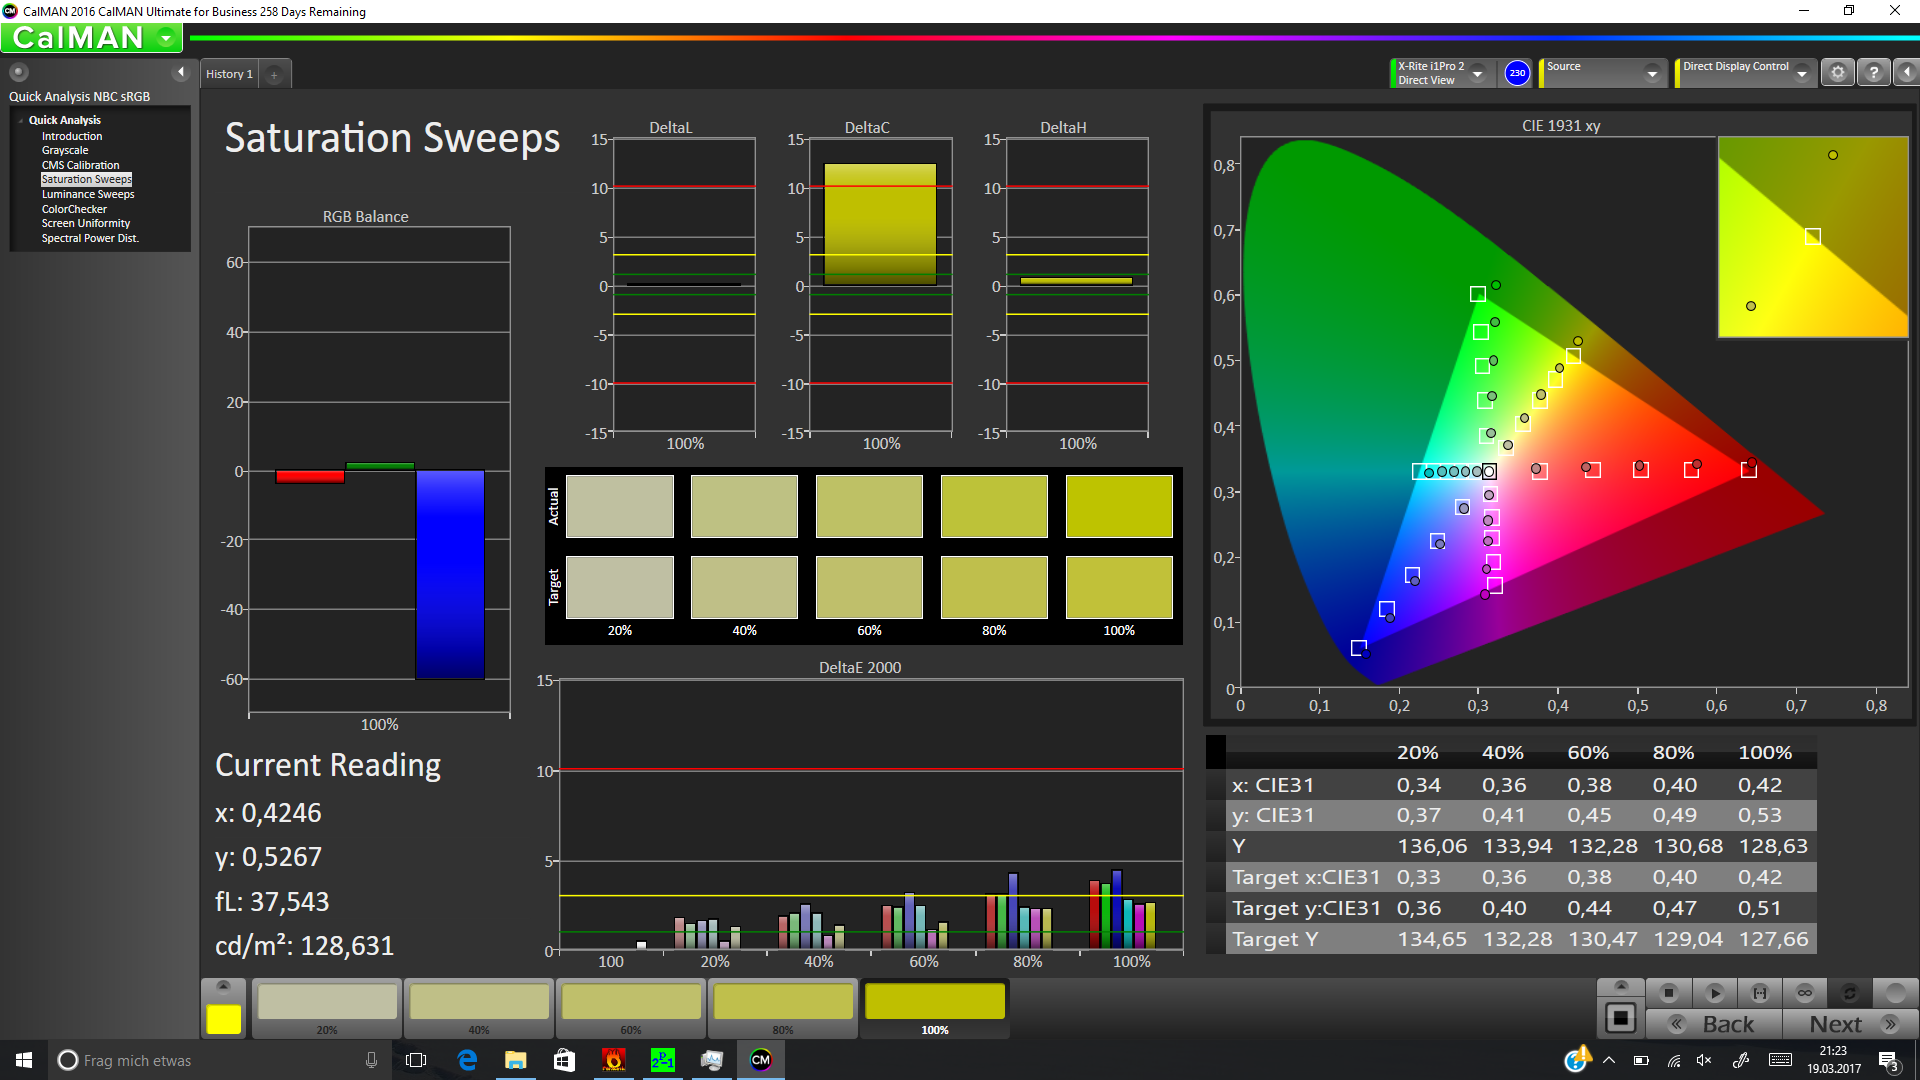
Distribution av ljusstyrkan: 83 %
Mitt på batteriet: 261 cd/m²
Kontrast: 1048:1 (Svärta: 0.25 cd/m²)
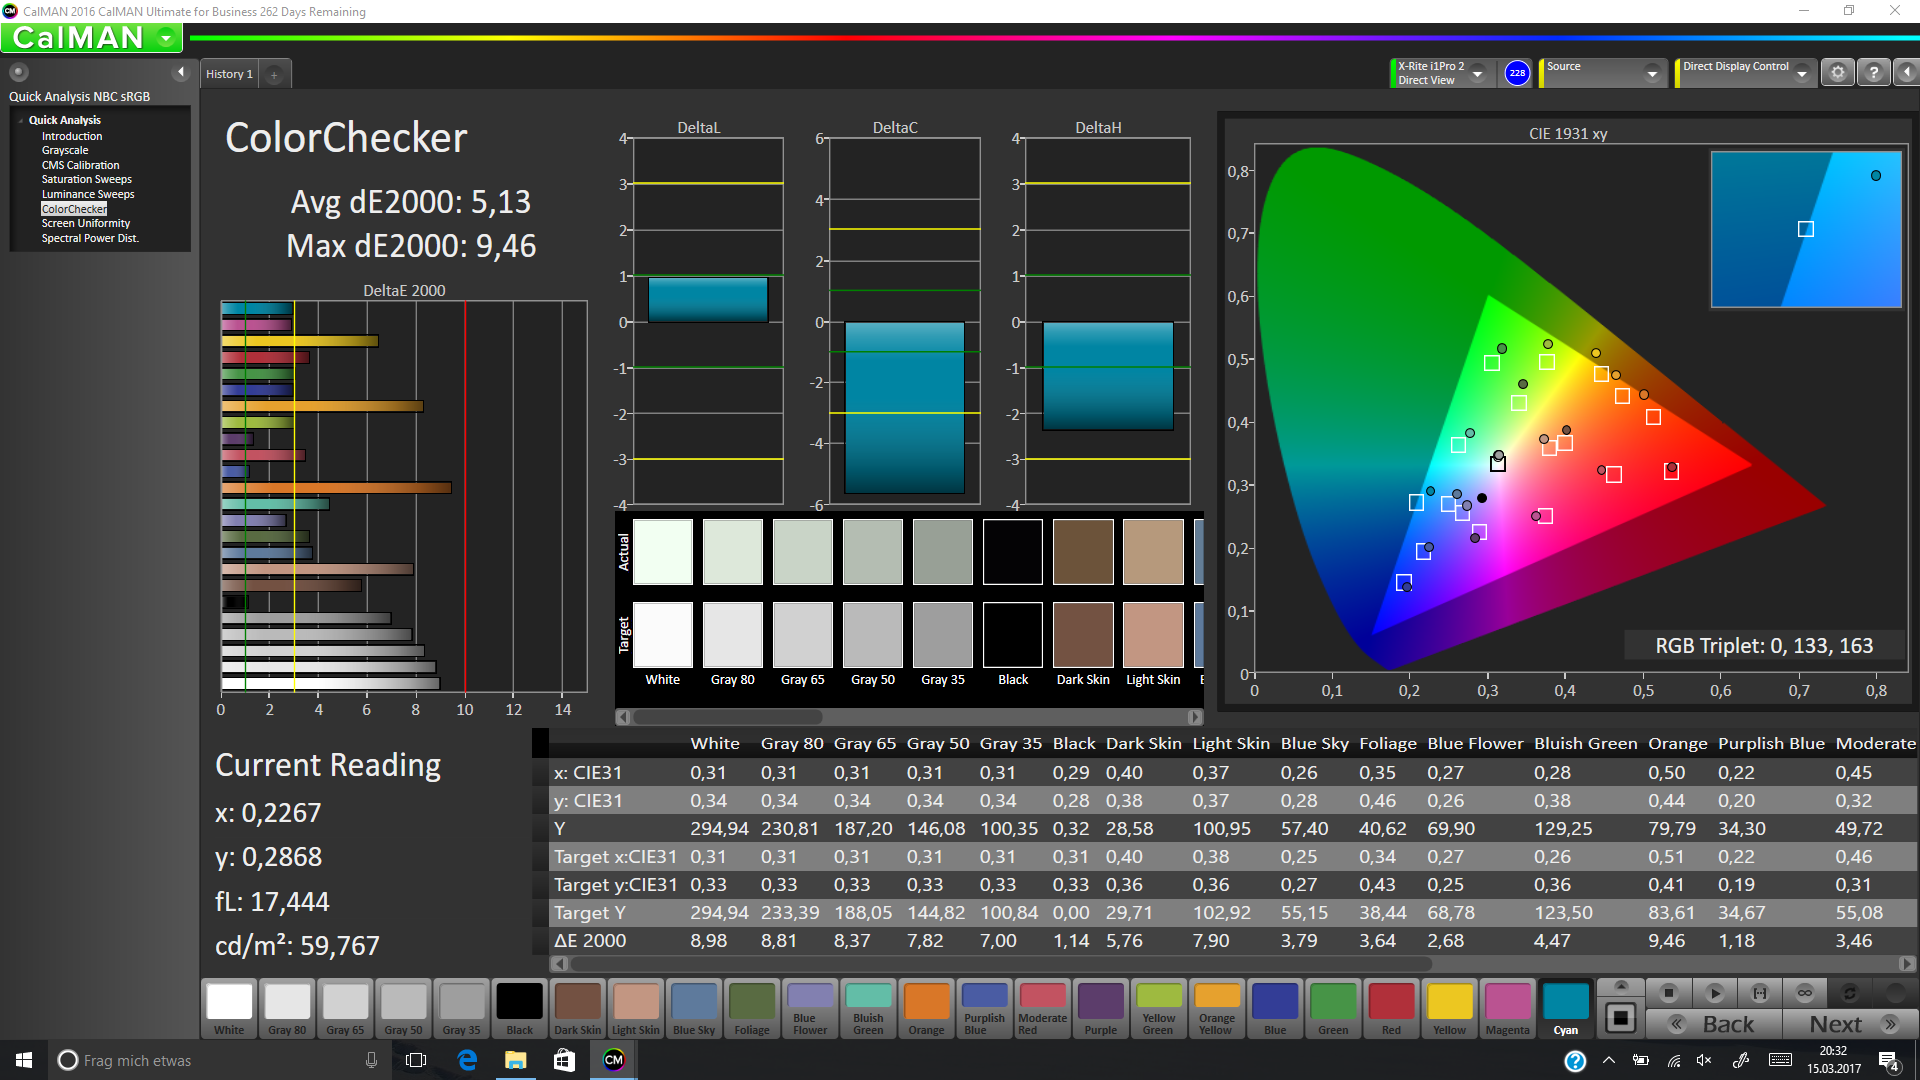
ΔE ColorChecker Calman: 5.13 | ∀{0.5-29.43 Ø4.72}
ΔE Greyscale Calman: 6.23 | ∀{0.09-98 Ø4.97}
88.57% sRGB (Argyll 1.6.3 3D)
57.84% AdobeRGB 1998 (Argyll 1.6.3 3D)
64.9% AdobeRGB 1998 (Argyll 3D)
88.8% sRGB (Argyll 3D)
65.5% Display P3 (Argyll 3D)
Gamma: 2.45
CCT: 6413 K
| HP EliteBook x360 1030 G2 CMN1374, 1920x1080, 13.3" | Lenovo Yoga 910-13IKB-80VF004CGE AU Optronics AUO323D / B139HAN03.2, 3840x2160, 13.9" | Lenovo ThinkPad X1 Yoga-20FRS1VS00 Samsung ATNA40JU01-0, 2560x1440, 14" | Lenovo ThinkPad X1 Carbon 2017-20HQS03P00 B140HAN03_1, 1920x1080, 14" | Dell Latitude 13 7370 Sharp LQ133M1, 1920x1080, 13.3" | HP Spectre x360 13-w023dx Chi Mei CMN1367, 1920x1080, 13.3" | Lenovo ThinkPad Yoga 370-20JJS00100 Sharp LQ133M1JX15, 1920x1080, 13.3" | |
|---|---|---|---|---|---|---|---|
| Display | -2% | -4% | -16% | 1% | 7% | ||
| Display P3 Coverage (%) | 65.5 | 62.2 -5% | 61.4 -6% | 52.2 -20% | 65.4 0% | 67.9 4% | |
| sRGB Coverage (%) | 88.8 | 90.1 1% | 85.9 -3% | 78.3 -12% | 90.4 2% | 97.3 10% | |
| AdobeRGB 1998 Coverage (%) | 64.9 | 63.5 -2% | 62.4 -4% | 53.9 -17% | 65.8 1% | 69.9 8% | |
| Response Times | 15% | 97% | 5% | -8% | 19% | 2% | |
| Response Time Grey 50% / Grey 80% * (ms) | 55.2 ? | 46 ? 17% | 1 ? 98% | 41.6 ? 25% | 50.4 ? 9% | 33.2 ? 40% | 42 ? 24% |
| Response Time Black / White * (ms) | 27.2 ? | 24 ? 12% | 1 ? 96% | 31.6 ? -16% | 33.6 ? -24% | 28 ? -3% | 32.8 ? -21% |
| PWM Frequency (Hz) | 240 ? | 217.4 ? | |||||
| Screen | -4% | 16% | 5% | -1% | -5% | 9% | |
| Brightness middle (cd/m²) | 262 | 348 33% | 279 6% | 311 19% | 261 0% | 334.6 28% | 374 43% |
| Brightness (cd/m²) | 256 | 310 21% | 277 8% | 288 13% | 241 -6% | 319 25% | 356 39% |
| Brightness Distribution (%) | 83 | 80 -4% | 91 10% | 85 2% | 85 2% | 90 8% | 87 5% |
| Black Level * (cd/m²) | 0.25 | 0.25 -0% | 0.24 4% | 0.26 -4% | 0.336 -34% | 0.33 -32% | |
| Contrast (:1) | 1048 | 1392 33% | 1296 24% | 1004 -4% | 996 -5% | 1133 8% | |
| Colorchecker dE 2000 * | 5.13 | 7.86 -53% | 5.15 -0% | 5.5 -7% | 4.3 16% | 6.21 -21% | 4.7 8% |
| Colorchecker dE 2000 max. * | 9.46 | 13.43 -42% | 8.28 12% | 9 5% | 8.66 8% | 12 -27% | 9.5 -0% |
| Greyscale dE 2000 * | 6.23 | 8.25 -32% | 5.44 13% | 6.2 -0% | 5.82 7% | 7.71 -24% | 6.5 -4% |
| Gamma | 2.45 90% | 2.05 107% | 2.28 96% | 2.02 109% | 2.44 90% | 2.36 93% | 2.19 100% |
| CCT | 6413 101% | 6834 95% | 5686 114% | 5950 109% | 6771 96% | 6458 101% | 7086 92% |
| Color Space (Percent of AdobeRGB 1998) (%) | 57.84 | 58 0% | 98 69% | 55.96 -3% | 49.18 -15% | 58.6 1% | 63.1 9% |
| Color Space (Percent of sRGB) (%) | 88.57 | 90 2% | 100 13% | 85.77 -3% | 77.84 -12% | 90 2% | 97.2 10% |
| Totalt genomsnitt (program/inställningar) | 3% /
-1% | 57% /
33% | 2% /
3% | -8% /
-5% | 5% /
-0% | 6% /
7% |
* ... mindre är bättre

Visa svarstider
| ↔ Svarstid svart till vitt | ||
|---|---|---|
| 27.2 ms ... stiga ↗ och falla ↘ kombinerat | ↗ 7.6 ms stiga | 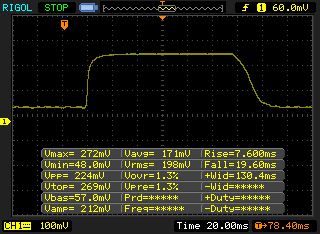 |
| ↘ 19.6 ms hösten | ||
| Skärmen visar relativt långsamma svarsfrekvenser i våra tester och kan vara för långsam för spelare. I jämförelse sträcker sig alla testade enheter från 0.1 (minst) till 240 (maximalt) ms. » 69 % av alla enheter är bättre. Detta innebär att den uppmätta svarstiden är sämre än genomsnittet av alla testade enheter (19.9 ms). | ||
| ↔ Svarstid 50 % grått till 80 % grått | ||
| 55.2 ms ... stiga ↗ och falla ↘ kombinerat | ↗ 21.2 ms stiga | 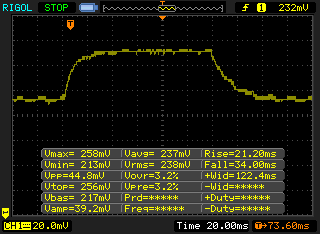 |
| ↘ 34 ms hösten | ||
| Skärmen visar långsamma svarsfrekvenser i våra tester och kommer att vara otillfredsställande för spelare. I jämförelse sträcker sig alla testade enheter från 0.165 (minst) till 636 (maximalt) ms. » 92 % av alla enheter är bättre. Detta innebär att den uppmätta svarstiden är sämre än genomsnittet av alla testade enheter (31.1 ms). | ||
Skärmflimmer / PWM (Puls-Width Modulation)
| Skärmflimmer / PWM upptäcktes inte | ||
Som jämförelse: 52 % av alla testade enheter använder inte PWM för att dämpa skärmen. Om PWM upptäcktes mättes ett medelvärde av 7784 (minst: 5 - maximum: 343500) Hz. | ||
| Cinebench R15 | |
| CPU Single 64Bit | |
| Lenovo Yoga 910-13IKB-80VF004CGE | |
| HP EliteBook x360 1030 G2 | |
| Lenovo ThinkPad X1 Carbon 2017-20HQS03P00 | |
| Lenovo ThinkPad X1 Yoga-20FRS1VS00 | |
| HP Spectre x360 13-w023dx | |
| Lenovo ThinkPad Yoga 370-20JJS00100 | |
| Dell Latitude 13 7370 | |
| CPU Multi 64Bit | |
| Lenovo ThinkPad X1 Carbon 2017-20HQS03P00 | |
| Lenovo Yoga 910-13IKB-80VF004CGE | |
| HP EliteBook x360 1030 G2 | |
| HP Spectre x360 13-w023dx | |
| Lenovo ThinkPad Yoga 370-20JJS00100 | |
| Lenovo ThinkPad X1 Yoga-20FRS1VS00 | |
| Dell Latitude 13 7370 | |
| Cinebench R11.5 | |
| CPU Single 64Bit | |
| HP Spectre x360 13-w023dx | |
| HP EliteBook x360 1030 G2 | |
| Lenovo ThinkPad X1 Yoga-20FRS1VS00 | |
| Dell Latitude 13 7370 | |
| CPU Multi 64Bit | |
| HP EliteBook x360 1030 G2 | |
| HP Spectre x360 13-w023dx | |
| Lenovo ThinkPad X1 Yoga-20FRS1VS00 | |
| Dell Latitude 13 7370 | |
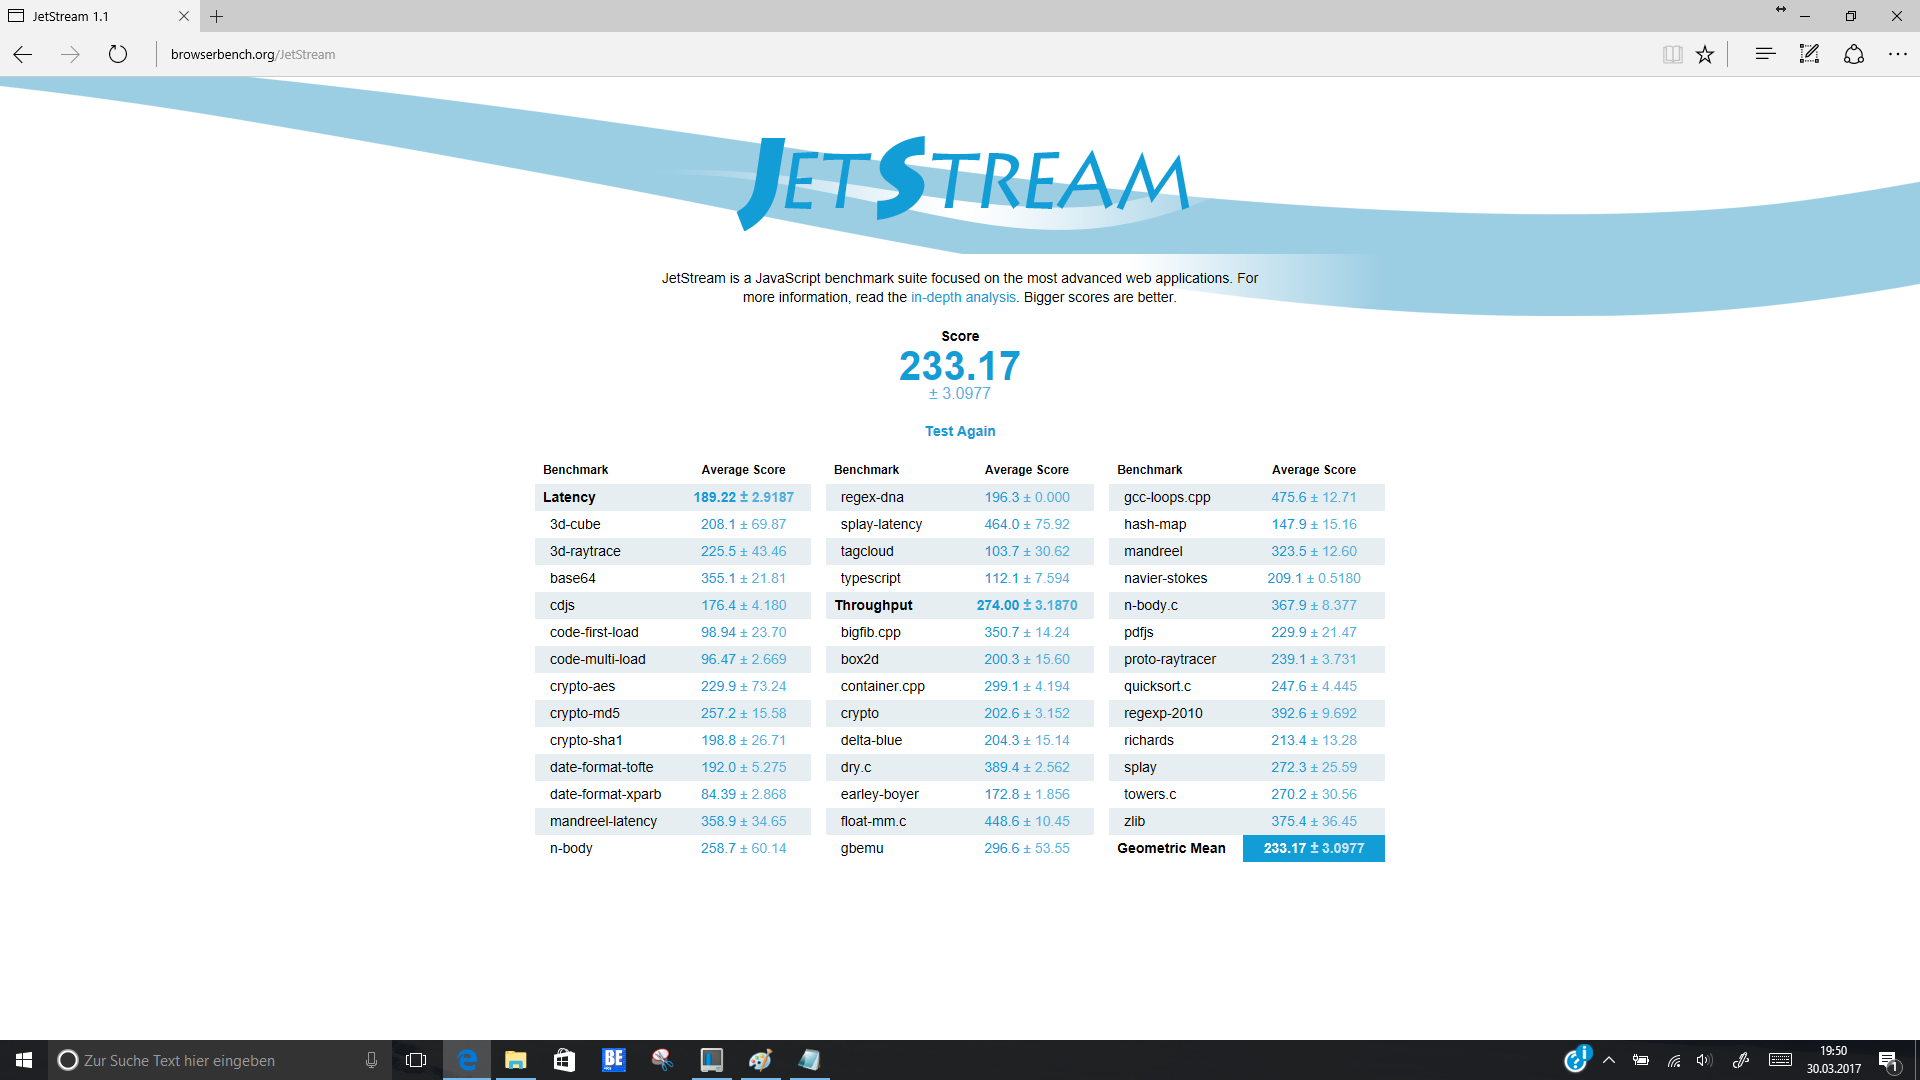
| JetStream 1.1 - 1.1 Total | |
| Lenovo Yoga 910-13IKB-80VF004CGE | |
| Lenovo ThinkPad X1 Carbon 2017-20HQS03P00 | |
| HP EliteBook x360 1030 G2 | |
| Lenovo ThinkPad Yoga 370-20JJS00100 | |
| Lenovo ThinkPad X1 Yoga-20FRS1VS00 | |
| Dell Latitude 13 7370 | |
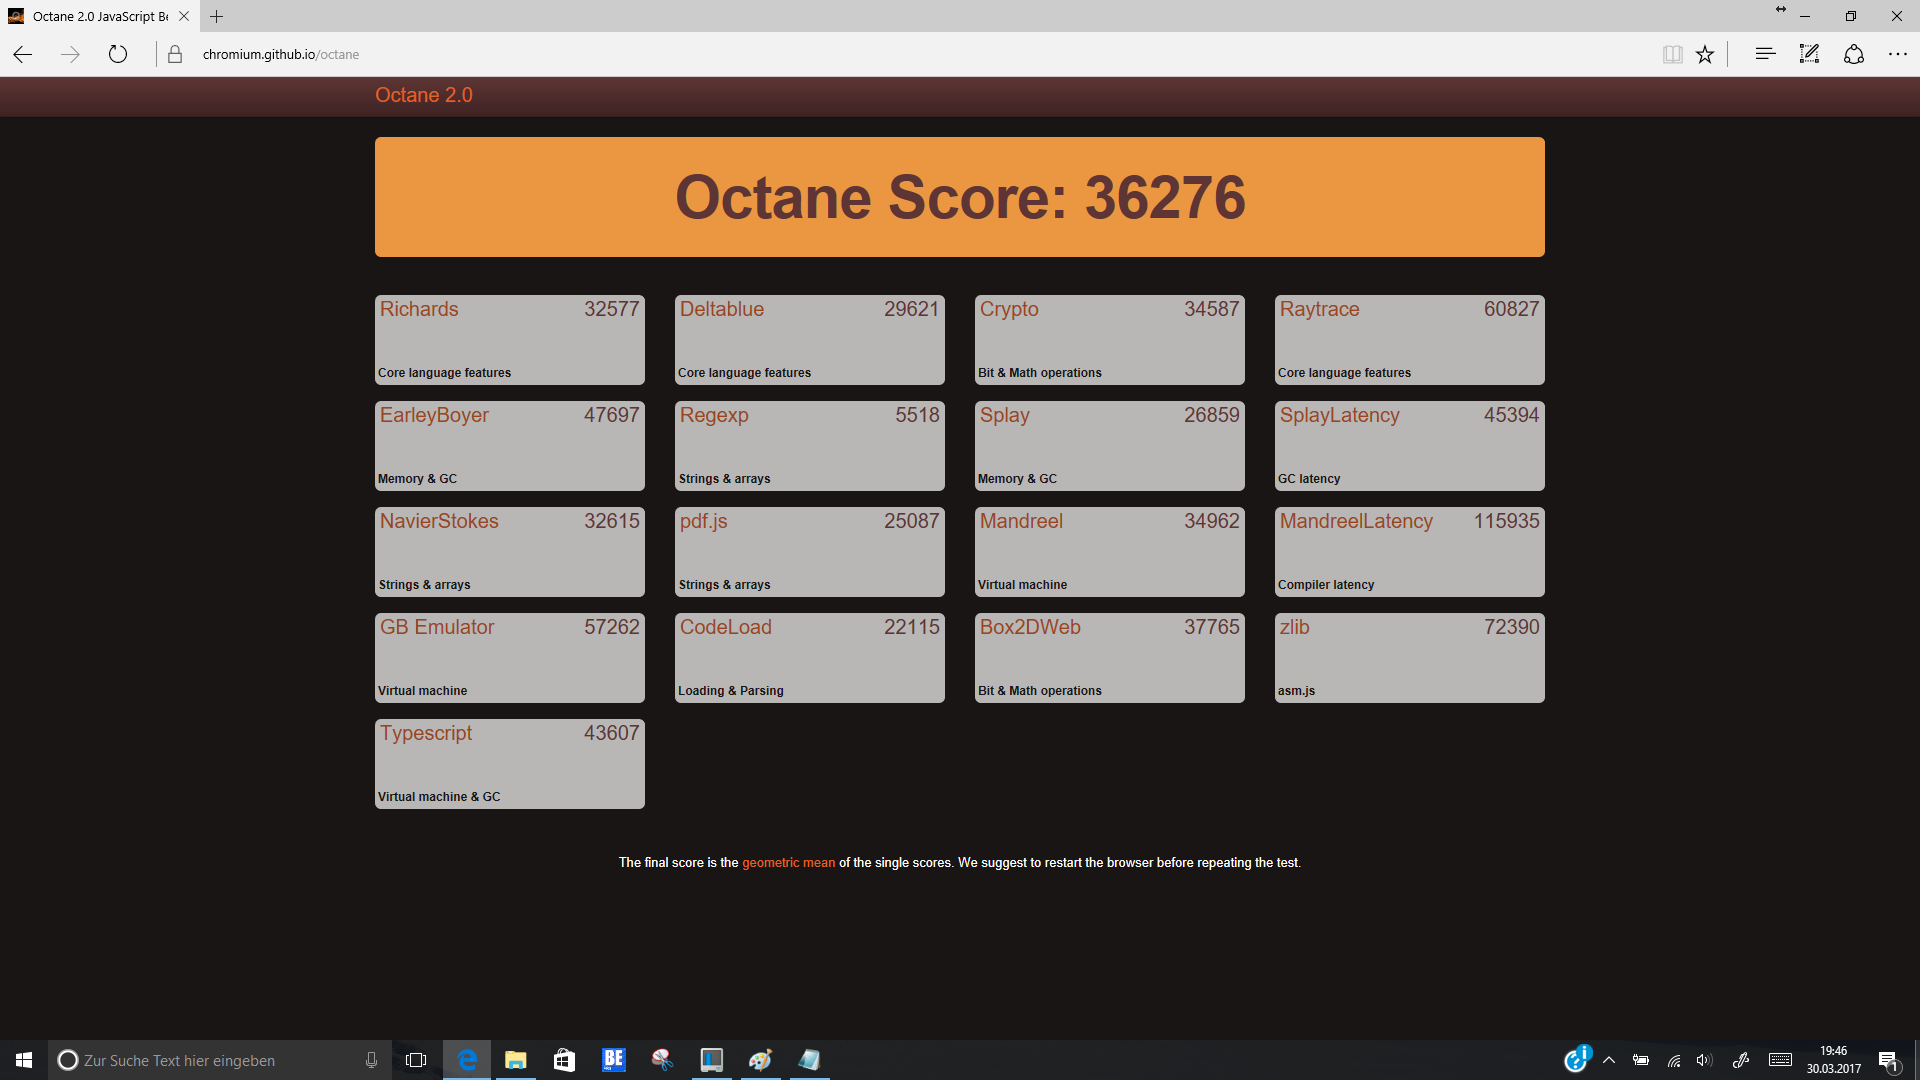
| Octane V2 - Total Score | |
| Lenovo Yoga 910-13IKB-80VF004CGE | |
| HP EliteBook x360 1030 G2 | |
| Lenovo ThinkPad X1 Carbon 2017-20HQS03P00 | |
| Lenovo ThinkPad Yoga 370-20JJS00100 | |
| Lenovo ThinkPad X1 Yoga-20FRS1VS00 | |
| Dell Latitude 13 7370 | |
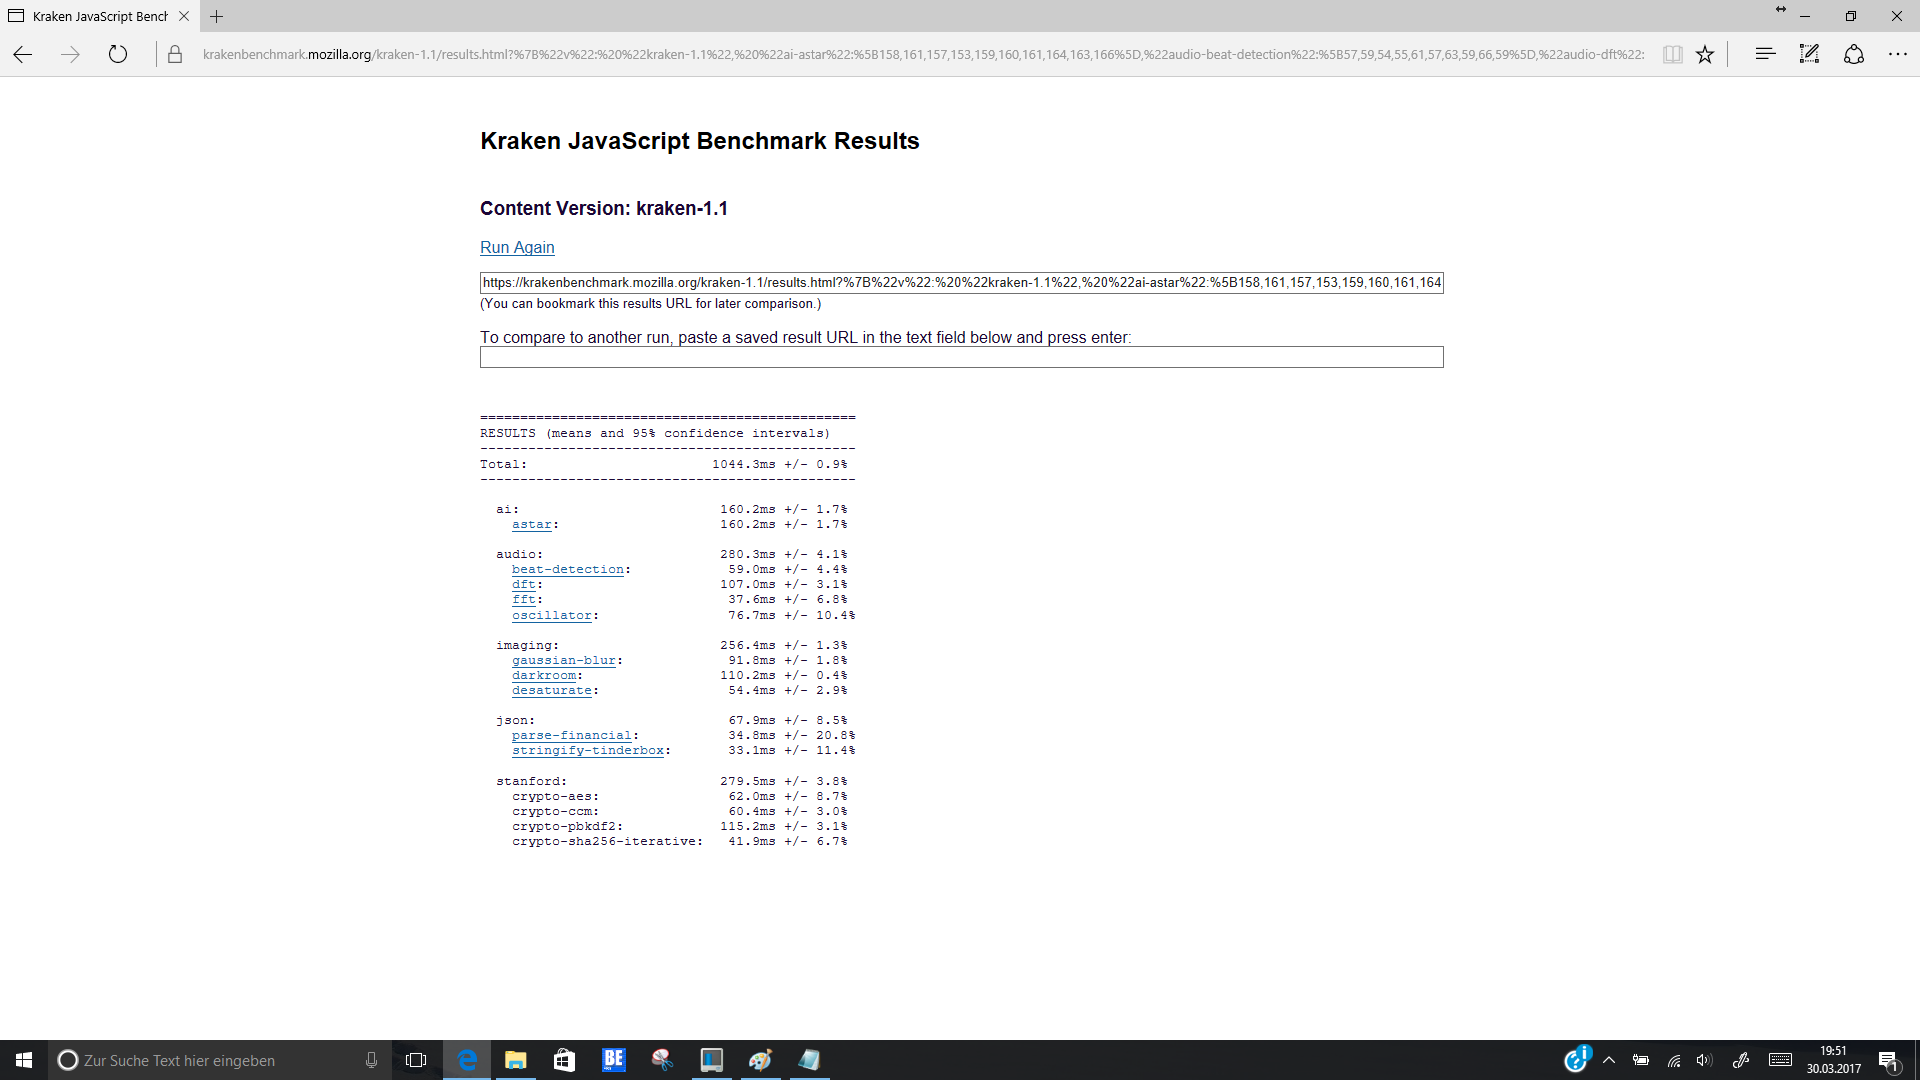
| Mozilla Kraken 1.1 - Total | |
| Dell Latitude 13 7370 | |
| Lenovo ThinkPad X1 Yoga-20FRS1VS00 | |
| Lenovo ThinkPad Yoga 370-20JJS00100 | |
| HP EliteBook x360 1030 G2 | |
| Lenovo ThinkPad X1 Carbon 2017-20HQS03P00 | |
| Lenovo Yoga 910-13IKB-80VF004CGE | |
* ... mindre är bättre
| PCMark 8 | |
| Home Score Accelerated v2 | |
| Lenovo ThinkPad X1 Carbon 2017-20HQS03P00 | |
| HP Spectre x360 13-w023dx | |
| HP EliteBook x360 1030 G2 | |
| Lenovo Yoga 910-13IKB-80VF004CGE | |
| Lenovo ThinkPad Yoga 370-20JJS00100 | |
| Lenovo ThinkPad X1 Yoga-20FRS1VS00 | |
| Dell Latitude 13 7370 | |
| Work Score Accelerated v2 | |
| Lenovo ThinkPad X1 Carbon 2017-20HQS03P00 | |
| HP Spectre x360 13-w023dx | |
| HP EliteBook x360 1030 G2 | |
| Lenovo ThinkPad X1 Yoga-20FRS1VS00 | |
| Lenovo ThinkPad Yoga 370-20JJS00100 | |
| Dell Latitude 13 7370 | |
| Creative Score Accelerated v2 | |
| Lenovo ThinkPad X1 Carbon 2017-20HQS03P00 | |
| HP EliteBook x360 1030 G2 | |
| HP Spectre x360 13-w023dx | |
| Lenovo ThinkPad Yoga 370-20JJS00100 | |
| Dell Latitude 13 7370 | |
| PCMark 7 | |
| Score | |
| Dell Latitude 13 7370 | |
| Productivity | |
| Dell Latitude 13 7370 | |
| PCMark 8 Home Score Accelerated v2 | 3774 poäng | |
| PCMark 8 Creative Score Accelerated v2 | 4781 poäng | |
| PCMark 8 Work Score Accelerated v2 | 4803 poäng | |
Hjälp | ||
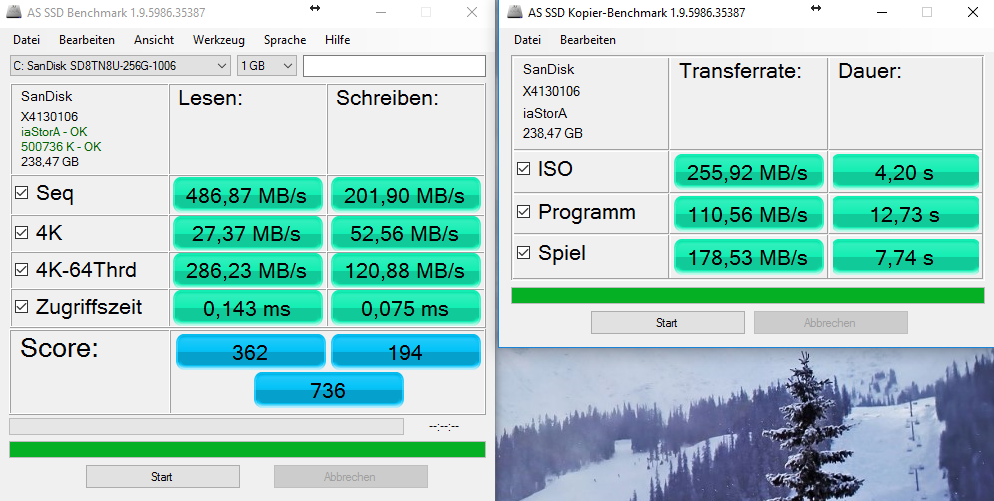
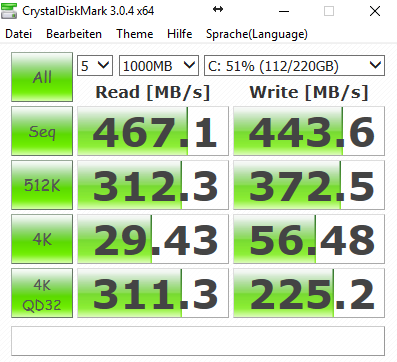
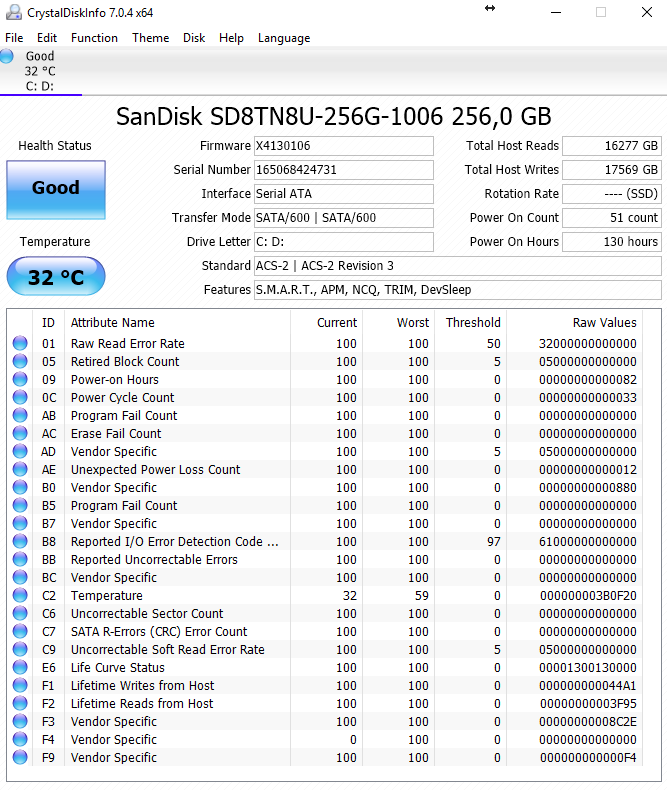
| HP EliteBook x360 1030 G2 Sandisk SD8TN8U-256G-1006 | Lenovo Yoga 910-13IKB-80VF004CGE Samsung PM951 NVMe MZVLV512 | Lenovo ThinkPad X1 Yoga-20FRS1VS00 Samsung SSD PM961 1TB M.2 PCIe 3.0 x4 NVMe (MZSLW1T0) | Lenovo ThinkPad X1 Carbon 2017-20HQS03P00 Samsung PM961 NVMe MZVLW512HMJP | Dell Latitude 13 7370 Toshiba NVMe THNSN5256GPU7 | HP Spectre x360 13-w023dx Samsung PM951 NVMe MZVLV512 | Lenovo ThinkPad Yoga 370-20JJS00100 Toshiba NVMe THNSF5512GPUK | |
|---|---|---|---|---|---|---|---|
| CrystalDiskMark 3.0 | 105% | 102% | 173% | 124% | 89% | 68% | |
| Read Seq (MB/s) | 467.1 | 1412 202% | 1510 223% | 1827 291% | 1354 190% | 1376 195% | 1070 129% |
| Write Seq (MB/s) | 443.6 | 578 30% | 1193 169% | 1383 212% | 1132 155% | 571 29% | 484.5 9% |
| Read 512 (MB/s) | 312.3 | 701 124% | 814 161% | 1140 265% | 679 117% | 680 118% | |
| Write 512 (MB/s) | 372.5 | 580 56% | 1098 195% | 1020 174% | 571 53% | 483.1 30% | |
| Read 4k (MB/s) | 29.43 | 43.5 48% | 37 26% | 61 107% | 42.13 43% | 42.66 45% | 30.55 4% |
| Write 4k (MB/s) | 56.5 | 159.7 183% | 126 123% | 172.2 205% | 105.8 87% | 137.9 144% | 127.3 125% |
| Read 4k QD32 (MB/s) | 311.3 | 570 83% | 404 30% | 601 93% | 400.5 29% | 535 72% | 460.8 48% |
| Write 4k QD32 (MB/s) | 225.2 | 488.7 117% | 319 42% | 495.6 120% | 328.4 46% | 361.2 60% | 414.5 84% |


| 3DMark | |
| 1280x720 Cloud Gate Standard Graphics | |
| Lenovo Yoga 910-13IKB-80VF004CGE | |
| Lenovo ThinkPad X1 Carbon 2017-20HQS03P00 | |
| HP EliteBook x360 1030 G2 | |
| HP Spectre x360 13-w023dx | |
| Lenovo ThinkPad X1 Yoga-20FRS1VS00 | |
| Lenovo ThinkPad Yoga 370-20JJS00100 | |
| Dell Latitude 13 7370 | |
| 1920x1080 Fire Strike Graphics | |
| Lenovo ThinkPad X1 Carbon 2017-20HQS03P00 | |
| Lenovo Yoga 910-13IKB-80VF004CGE | |
| HP EliteBook x360 1030 G2 | |
| HP Spectre x360 13-w023dx | |
| Lenovo ThinkPad X1 Yoga-20FRS1VS00 | |
| Lenovo ThinkPad Yoga 370-20JJS00100 | |
| Dell Latitude 13 7370 | |
| 3DMark 11 - 1280x720 Performance GPU | |
| Lenovo ThinkPad X1 Carbon 2017-20HQS03P00 | |
| Lenovo Yoga 910-13IKB-80VF004CGE | |
| HP Spectre x360 13-w023dx | |
| HP EliteBook x360 1030 G2 | |
| Lenovo ThinkPad X1 Yoga-20FRS1VS00 | |
| Lenovo ThinkPad Yoga 370-20JJS00100 | |
| Dell Latitude 13 7370 | |
| 3DMark 05 Standard | 12125 poäng | |
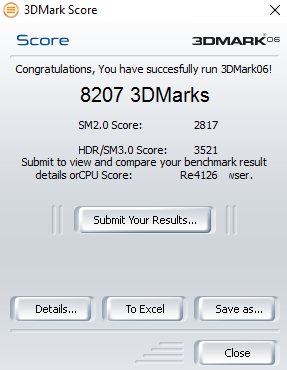
| 3DMark 06 Standard Score | 8207 poäng | |
| 3DMark Vantage P Result | 5803 poäng | |
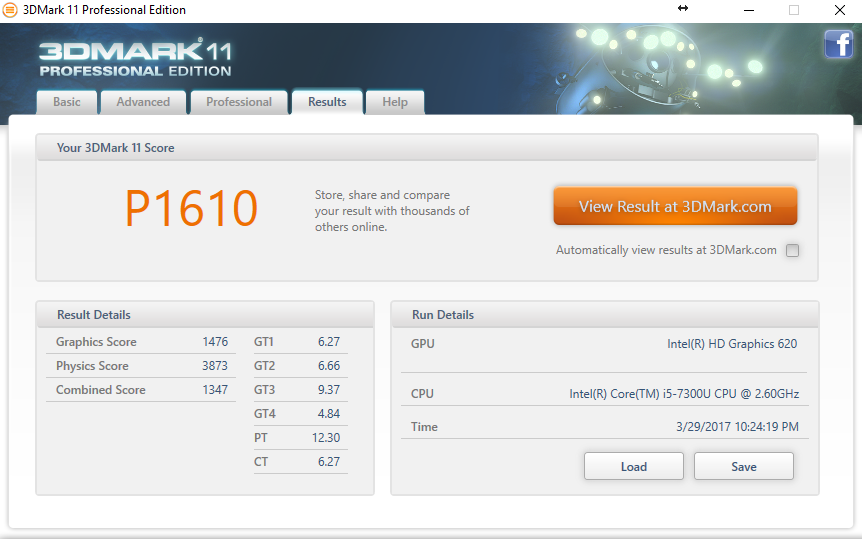
| 3DMark 11 Performance | 1610 poäng | |
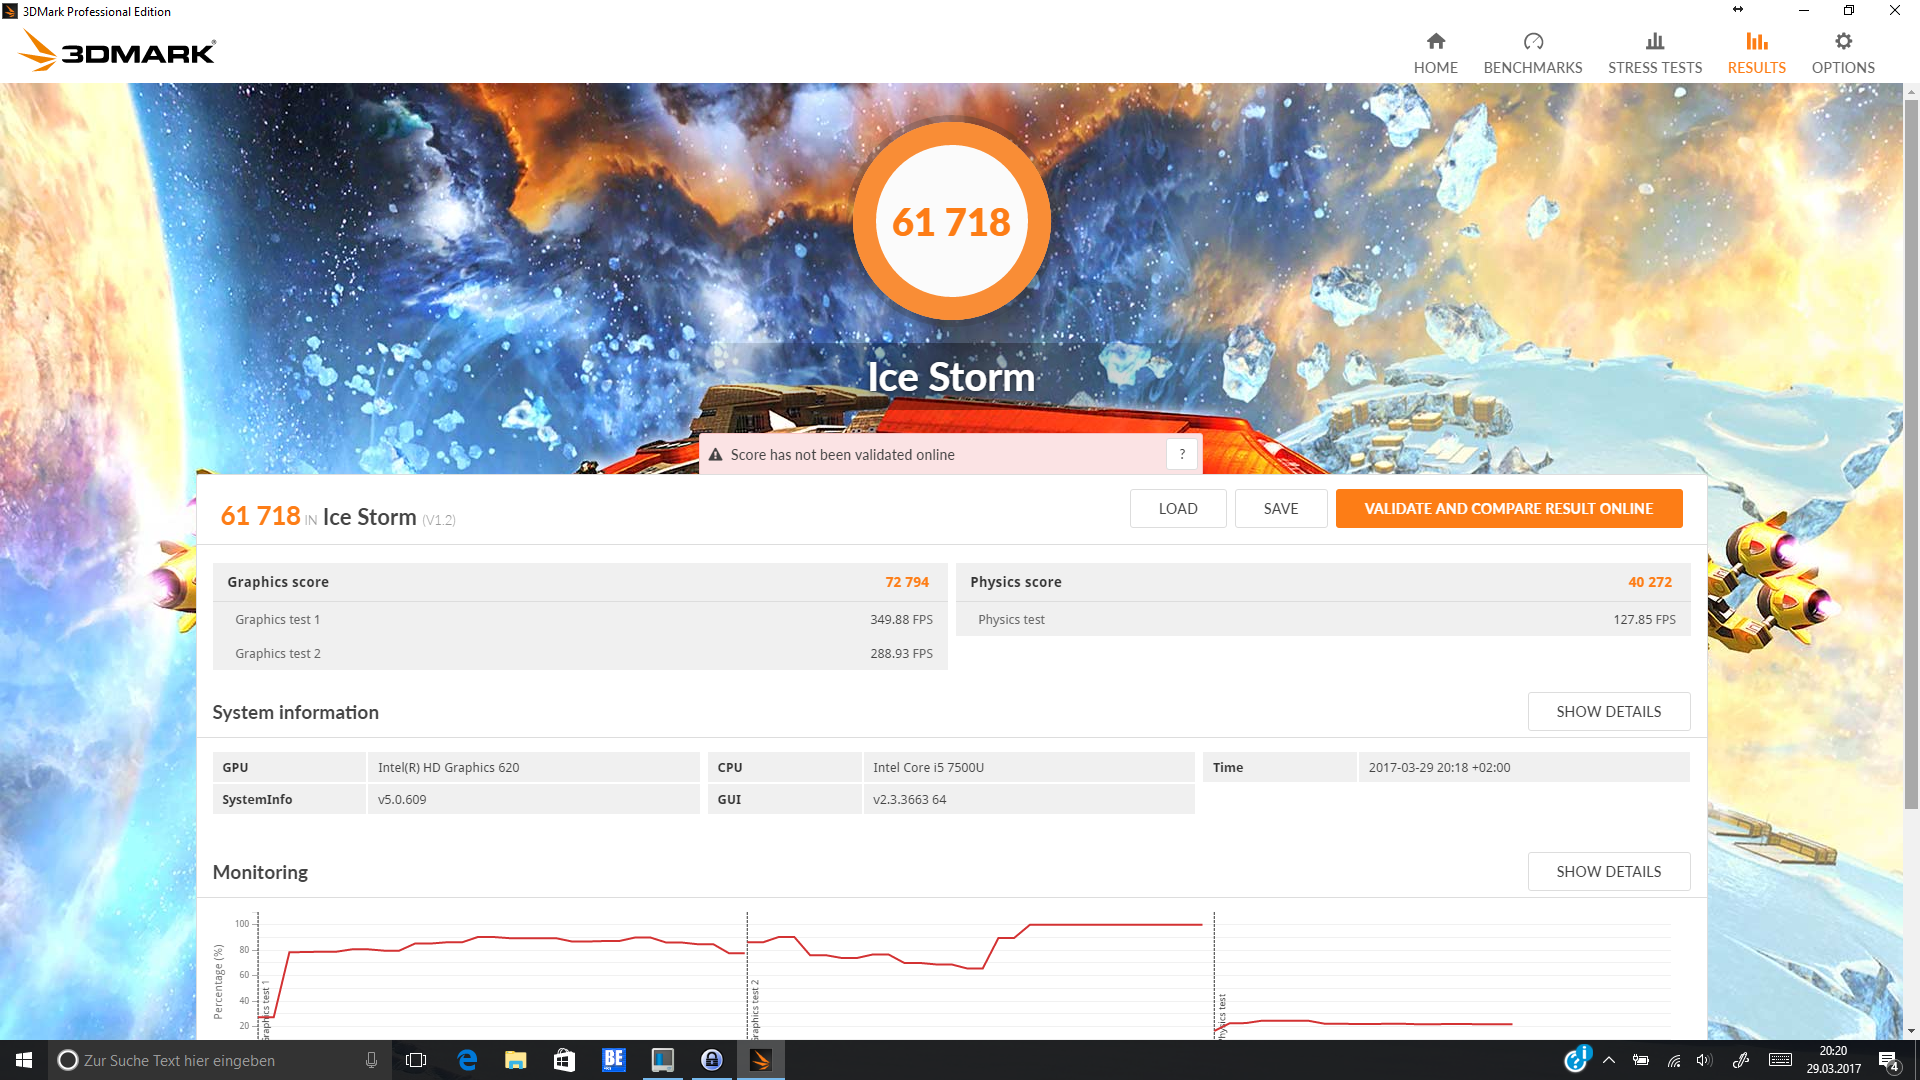
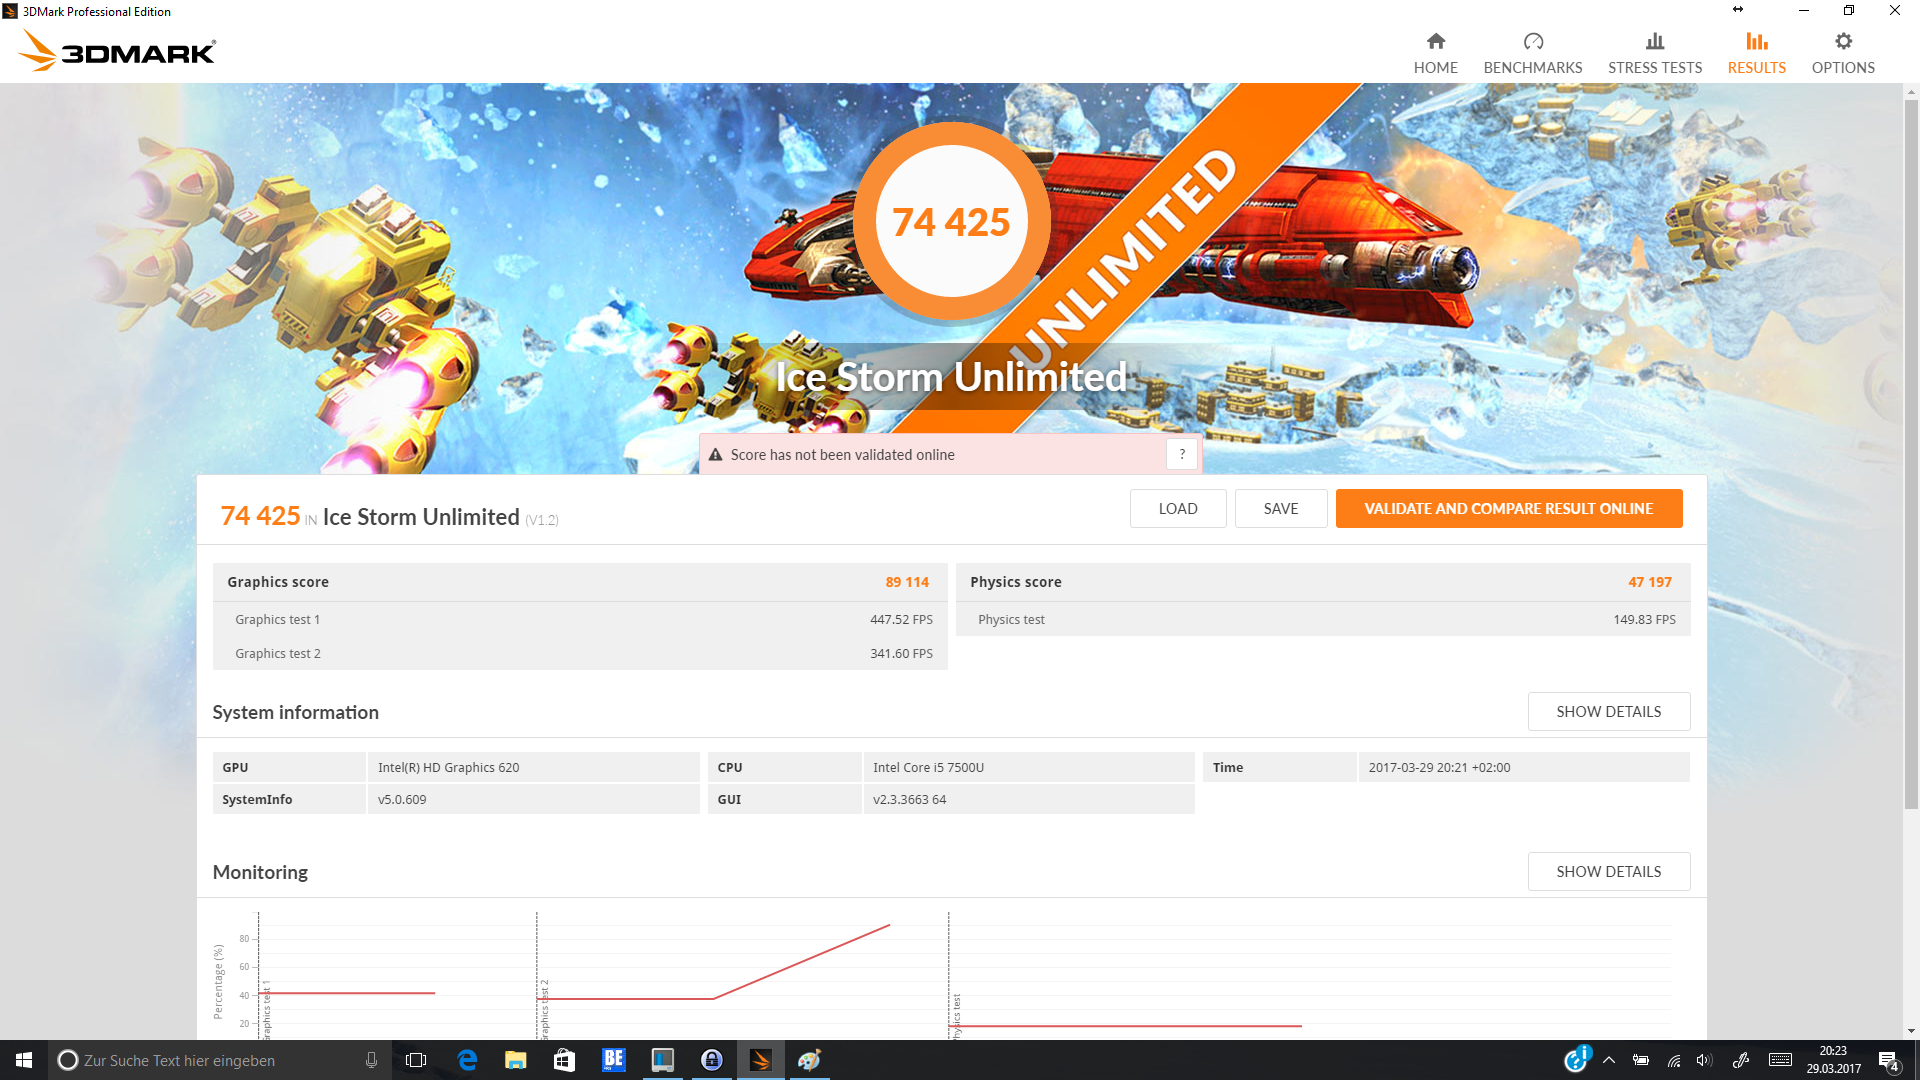
| 3DMark Ice Storm Standard Score | 61718 poäng | |
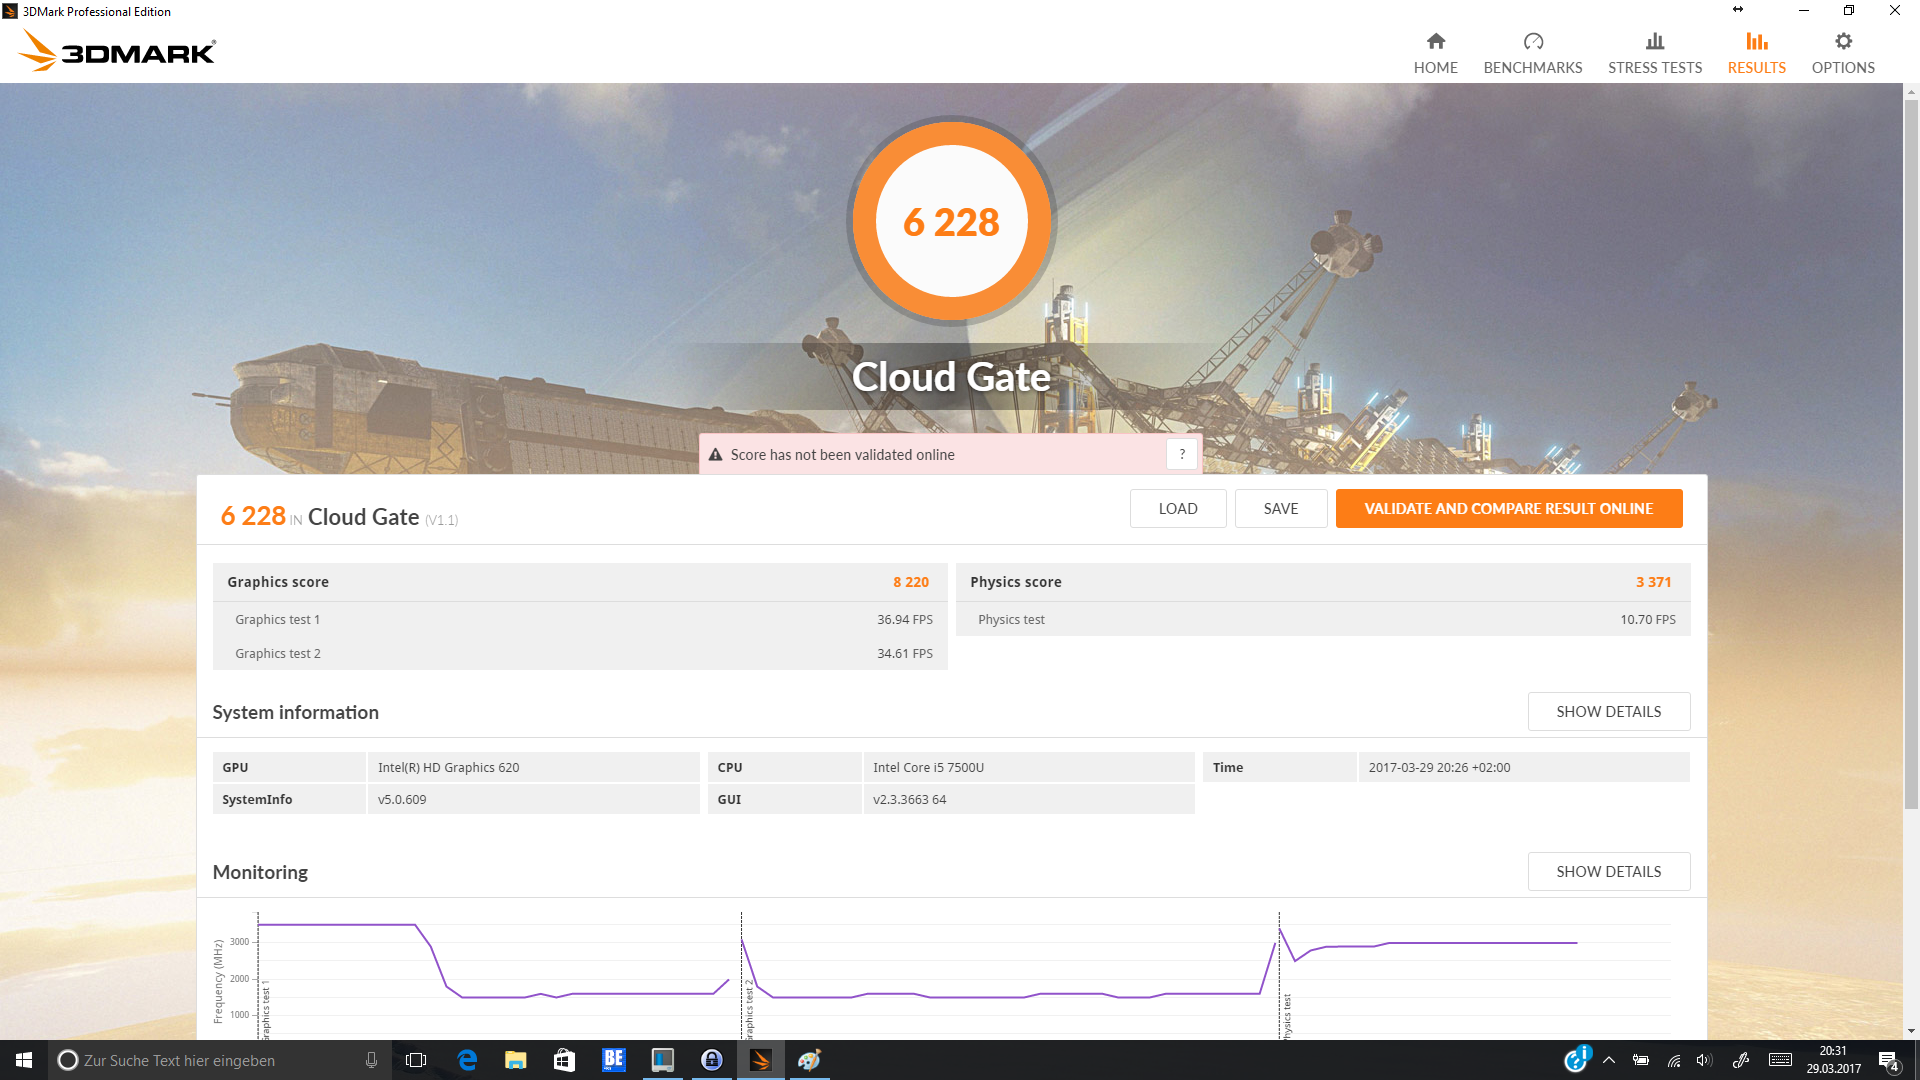
| 3DMark Cloud Gate Standard Score | 6228 poäng | |
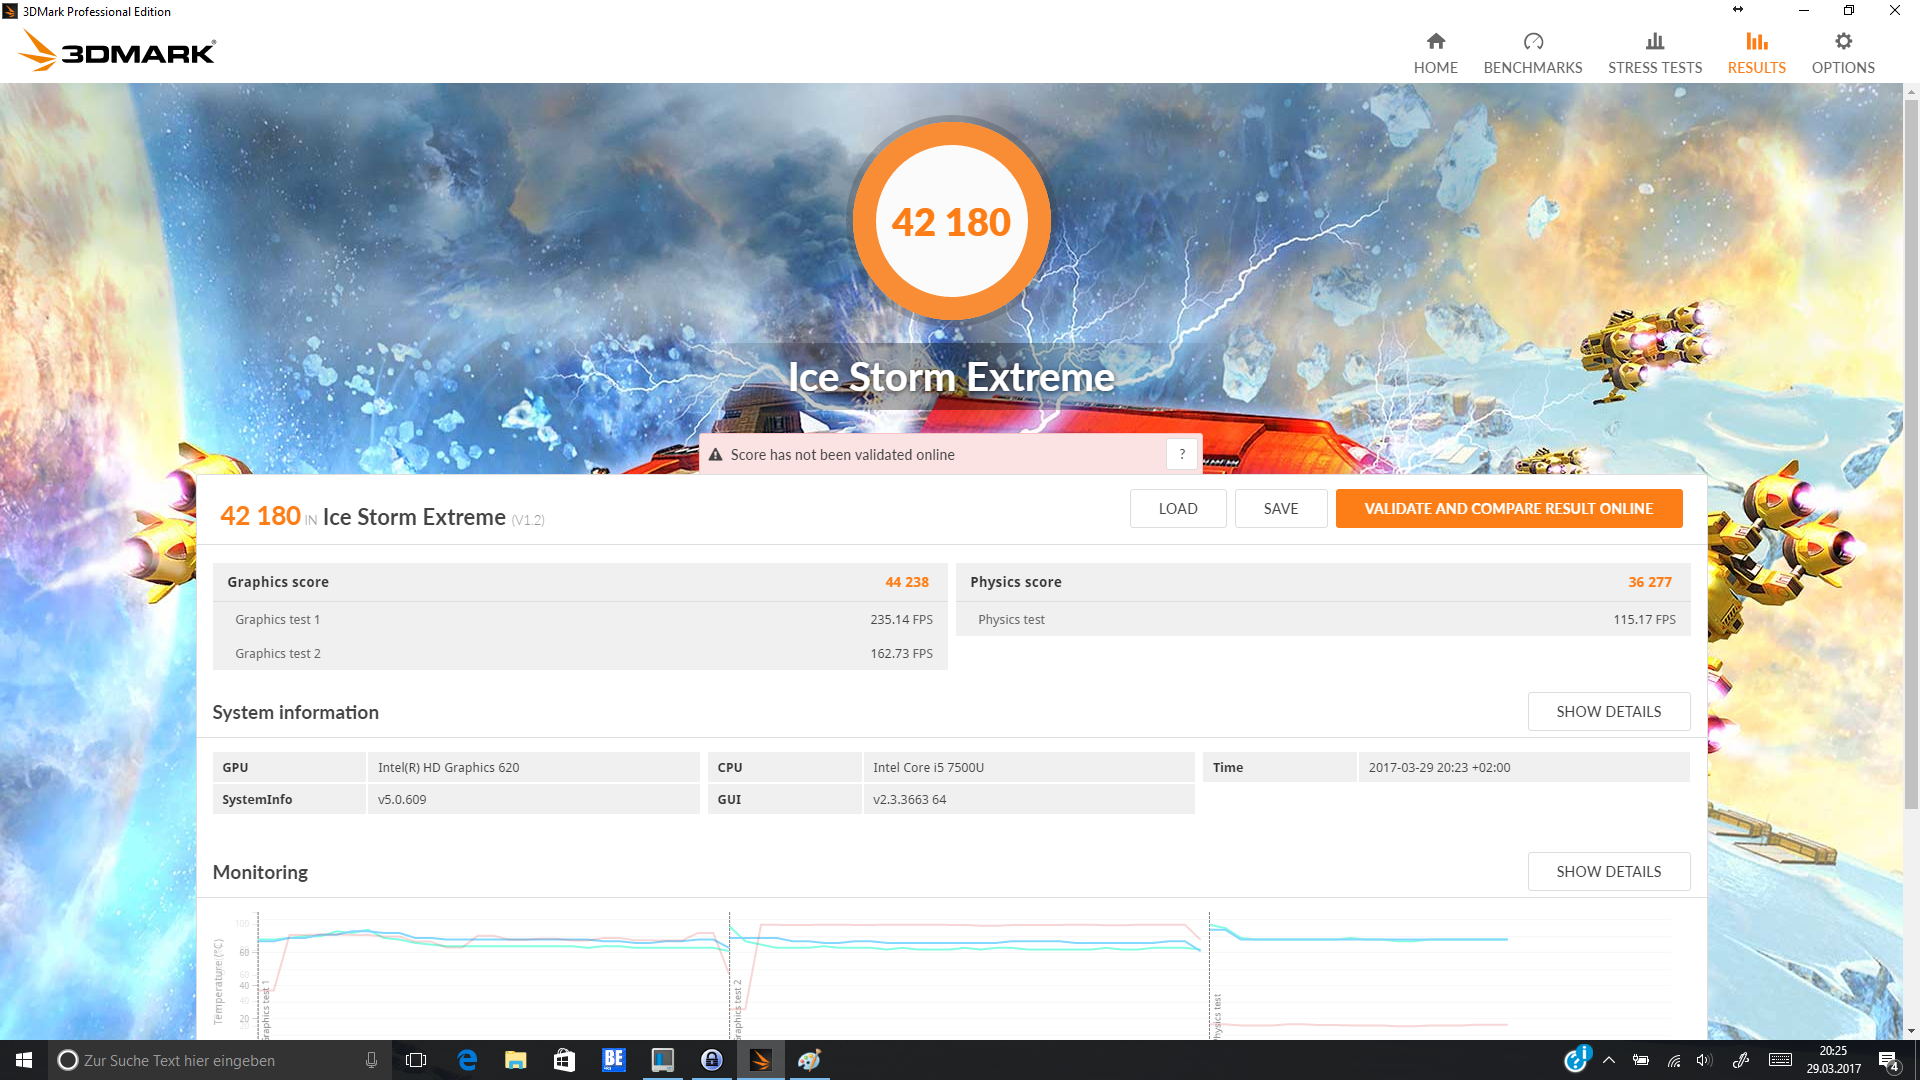
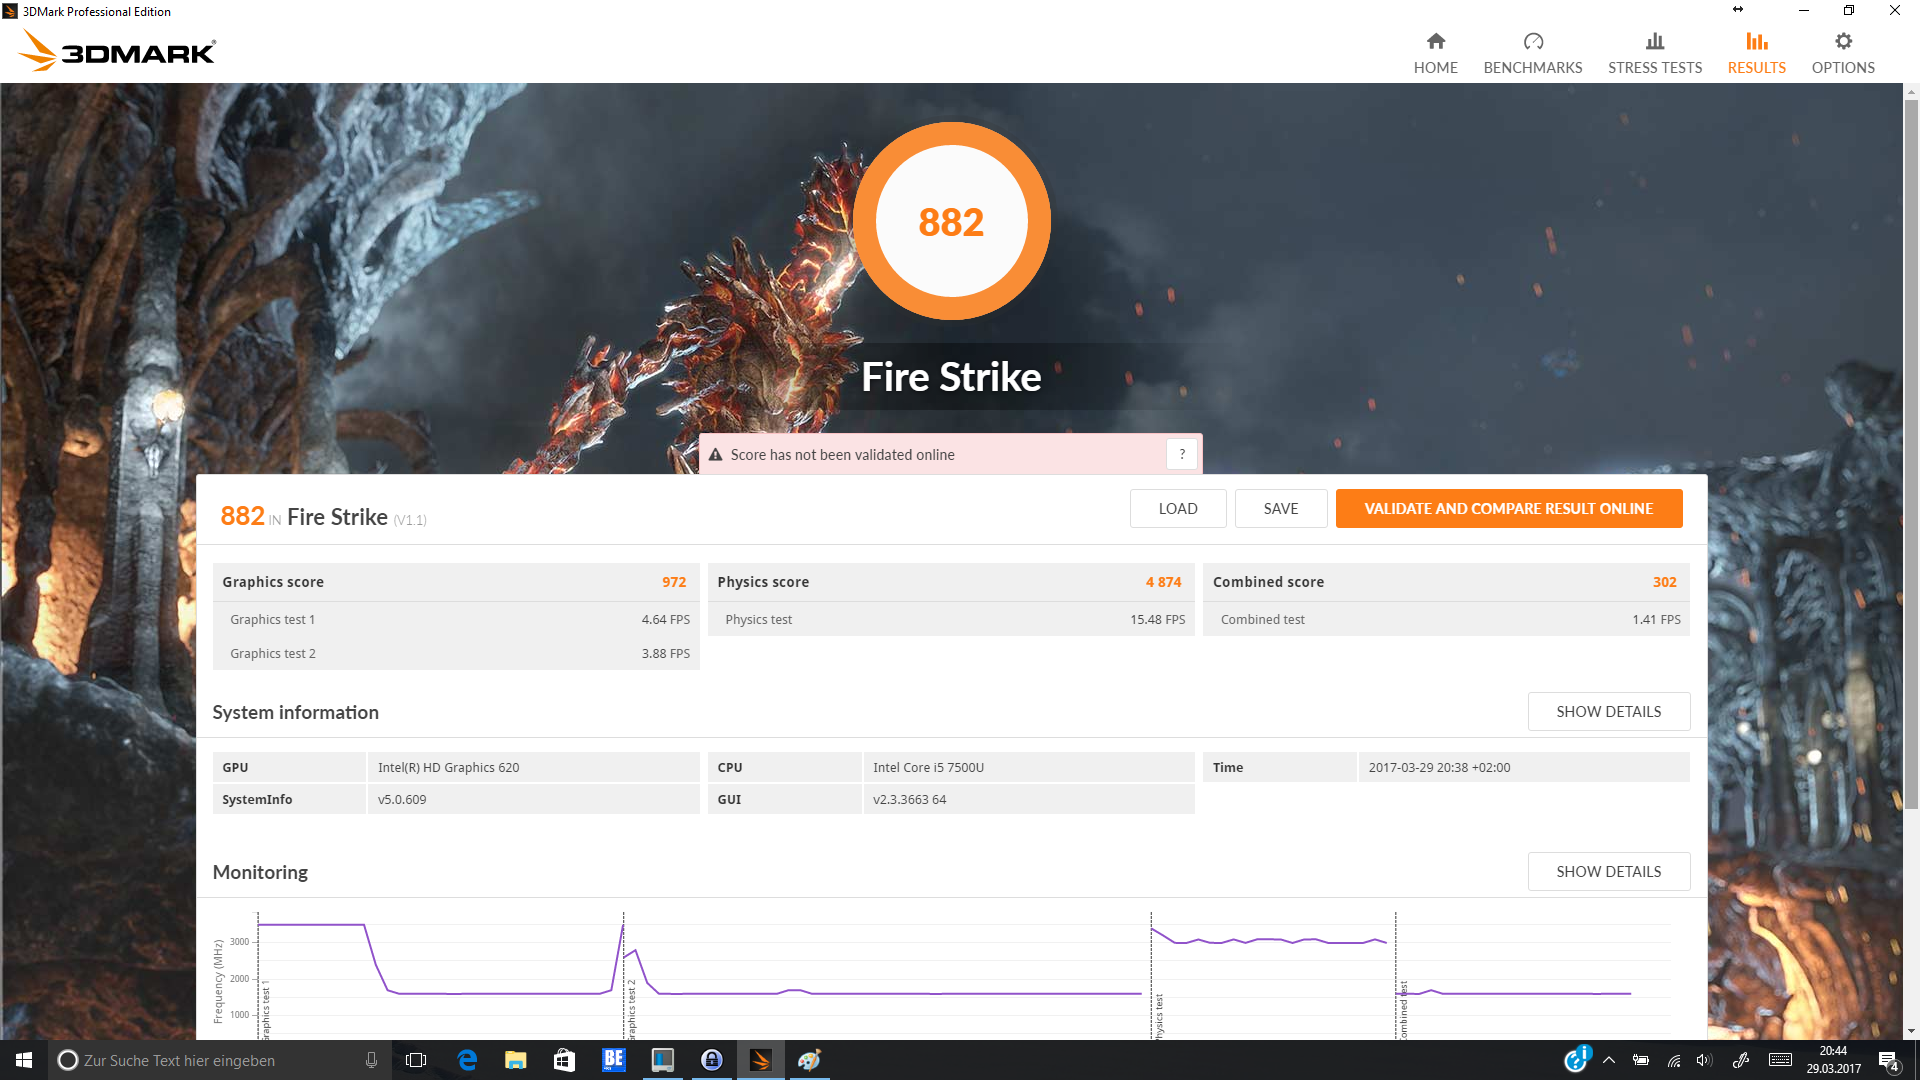
| 3DMark Fire Strike Score | 882 poäng | |
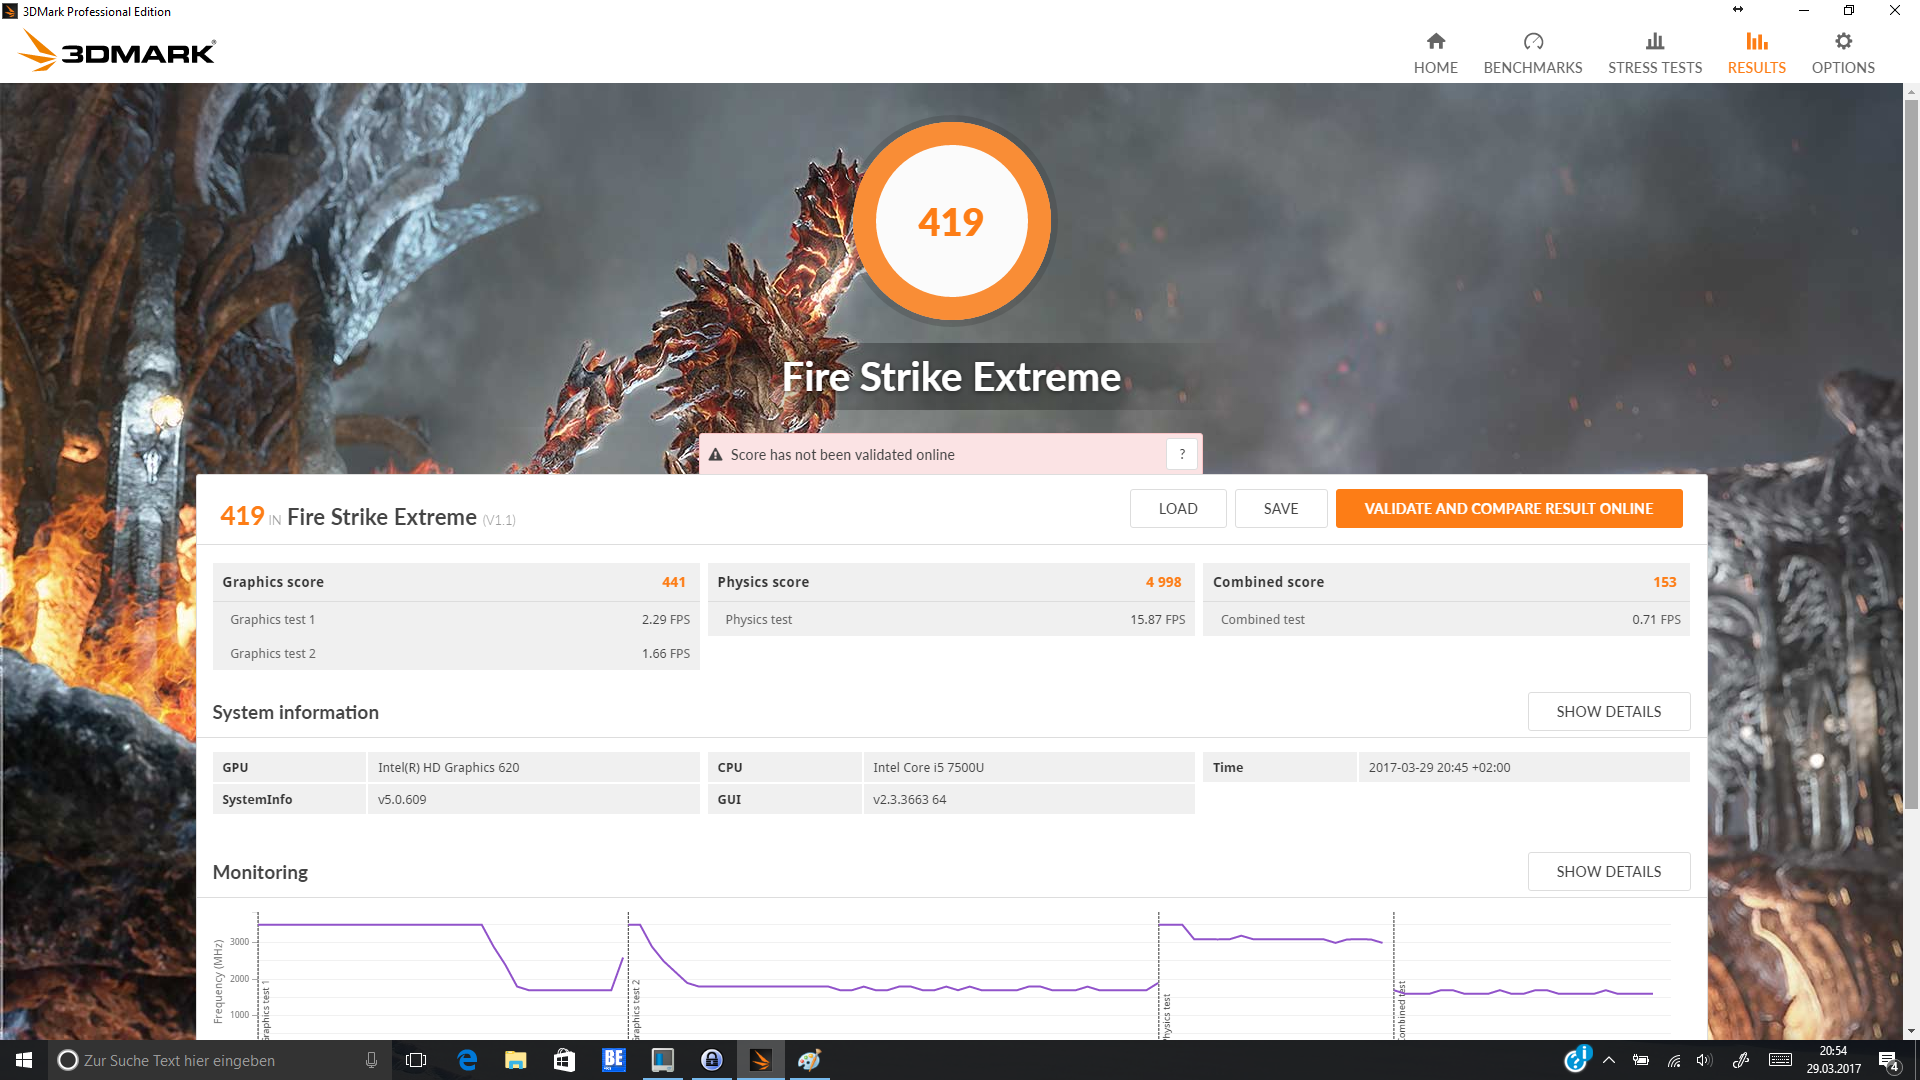
| 3DMark Fire Strike Extreme Score | 419 poäng | |
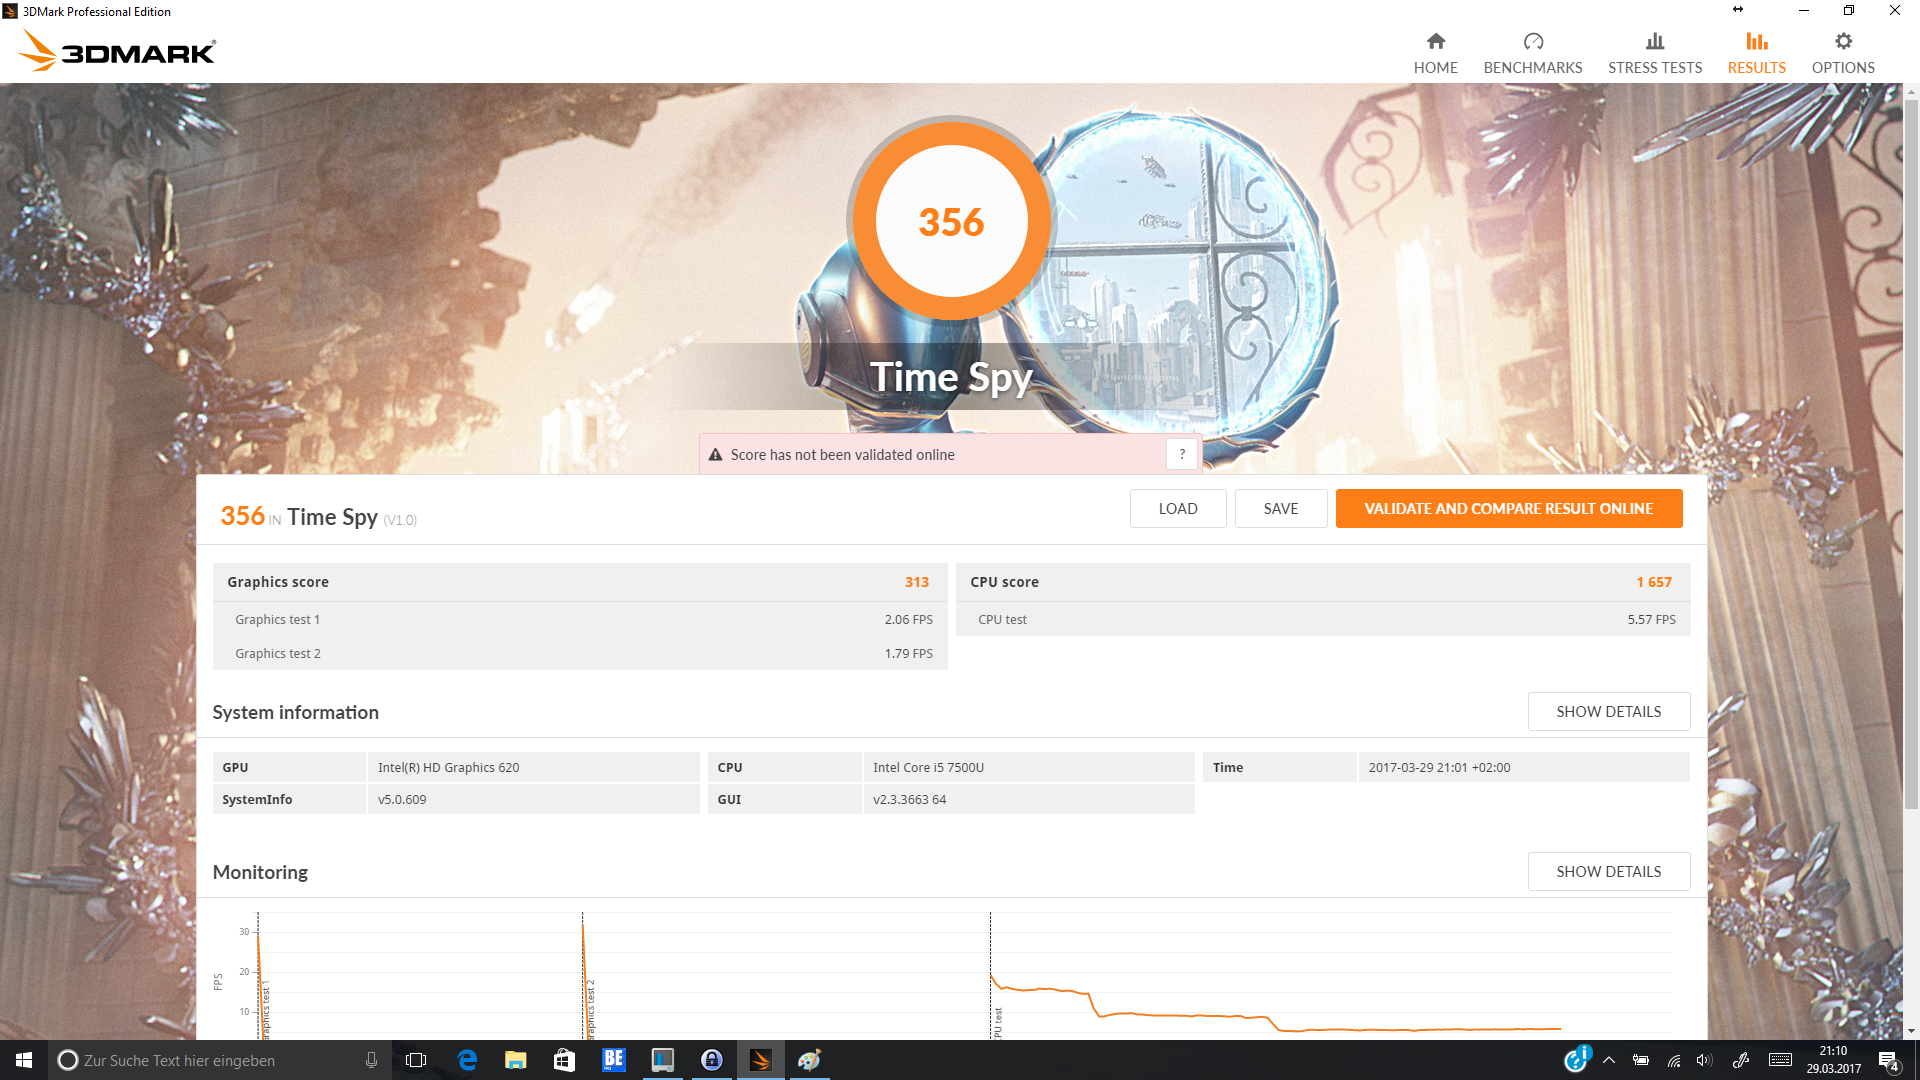
| 3DMark Time Spy Score | 356 poäng | |
Hjälp | ||
| låg | med. | hög | ultra | |
|---|---|---|---|---|
| BioShock Infinite (2013) | 54.4 | 30.7 | 24.9 | 7.8 |
| Battlefield 4 (2013) | 40.2 | 31.4 | 20.9 | 7.5 |
| The Witcher 3 (2015) | 14.4 | 12.3 | 5.5 | |
| Rise of the Tomb Raider (2016) | 17.6 | 11 | 6.7 |
Ljudnivå
| Låg belastning |
| 29 / 29 / 29 dB(A) |
| Hög belastning |
| 33.6 / 35.8 dB(A) |
 | ||
30 dB tyst 40 dB(A) hörbar 50 dB(A) högt ljud |
||
min: | ||
| HP EliteBook x360 1030 G2 i5-7300U, HD Graphics 620 | Lenovo Yoga 910-13IKB-80VF004CGE i7-7500U, HD Graphics 620 | Lenovo ThinkPad X1 Yoga-20FRS1VS00 6600U, HD Graphics 520 | Lenovo ThinkPad X1 Carbon 2017-20HQS03P00 i7-7500U, HD Graphics 620 | HP Spectre x360 13-w023dx i7-7500U, HD Graphics 620 | Lenovo ThinkPad Yoga 370-20JJS00100 i5-7200U, HD Graphics 620 | Dell Latitude 13 7370 6Y57, HD Graphics 515 | |
|---|---|---|---|---|---|---|---|
| Noise | -8% | -2% | -4% | -5% | -1% | ||
| av / miljö * (dB) | 29 | 31.7 -9% | 28.9 -0% | 29.3 -1% | 29.1 -0% | 28.6 1% | |
| Idle Minimum * (dB) | 29 | 31.7 -9% | 28.9 -0% | 29.3 -1% | 29.1 -0% | 28.6 1% | |
| Idle Average * (dB) | 29 | 31.7 -9% | 28.9 -0% | 29.3 -1% | 29.1 -0% | 28.6 1% | |
| Idle Maximum * (dB) | 29 | 31.7 -9% | 28.9 -0% | 32.2 -11% | 31.2 -8% | 31.2 -8% | |
| Load Average * (dB) | 33.6 | 38.4 -14% | 35.3 -5% | 34.3 -2% | 37.3 -11% | 33.7 -0% | |
| Load Maximum * (dB) | 35.8 | 34.7 3% | 38.9 -9% | 39.3 -10% | 39.6 -11% | 36.7 -3% |
* ... mindre är bättre
(+) Den maximala temperaturen på ovansidan är 36.1 °C / 97 F, jämfört med genomsnittet av 35.4 °C / 96 F , allt från 19.6 till 60 °C för klassen Convertible.
(+) Botten värms upp till maximalt 36.7 °C / 98 F, jämfört med genomsnittet av 36.9 °C / 98 F
(+) Vid tomgångsbruk är medeltemperaturen för ovansidan 24.7 °C / 76 F, jämfört med enhetsgenomsnittet på 30.3 °C / ### class_avg_f### F.
(+) Handledsstöden och pekplattan är kallare än hudtemperaturen med maximalt 25.5 °C / 77.9 F och är därför svala att ta på.
(+) Medeltemperaturen för handledsstödsområdet på liknande enheter var 28 °C / 82.4 F (+2.5 °C / 4.5 F).
| HP EliteBook x360 1030 G2 i5-7300U, HD Graphics 620 | Lenovo Yoga 910-13IKB-80VF004CGE i7-7500U, HD Graphics 620 | Lenovo ThinkPad X1 Yoga-20FRS1VS00 6600U, HD Graphics 520 | Lenovo ThinkPad X1 Carbon 2017-20HQS03P00 i7-7500U, HD Graphics 620 | Dell Latitude 13 7370 6Y57, HD Graphics 515 | HP Spectre x360 13-w023dx i7-7500U, HD Graphics 620 | Lenovo ThinkPad Yoga 370-20JJS00100 i5-7200U, HD Graphics 620 | |
|---|---|---|---|---|---|---|---|
| Heat | -12% | -24% | -9% | -23% | -10% | -16% | |
| Maximum Upper Side * (°C) | 36.1 | 41.4 -15% | 45.5 -26% | 48 -33% | 43.2 -20% | 48.2 -34% | 42 -16% |
| Maximum Bottom * (°C) | 36.7 | 38.5 -5% | 47.1 -28% | 47.2 -29% | 50.8 -38% | 46 -25% | 48 -31% |
| Idle Upper Side * (°C) | 26.8 | 31 -16% | 31.1 -16% | 23.5 12% | 30.5 -14% | 24.6 8% | 28 -4% |
| Idle Bottom * (°C) | 26.5 | 29.6 -12% | 33.1 -25% | 22.6 15% | 31.2 -18% | 23.2 12% | 29.7 -12% |
* ... mindre är bättre
HP EliteBook x360 1030 G2 ljudanalys
(+) | högtalare kan spela relativt högt (86.3 dB)
Analysis not possible as minimum curve is missing or too high
Lenovo ThinkPad Yoga 370-20JJS00100 ljudanalys
(±) | högtalarljudstyrkan är genomsnittlig men bra (79.4 dB)
Bas 100 - 315 Hz
(-) | nästan ingen bas - i genomsnitt 23.5% lägre än medianen
(+) | basen är linjär (6.5% delta till föregående frekvens)
Mellan 400 - 2000 Hz
(+) | balanserad mellan - endast 4.4% från medianen
(+) | mids är linjära (6.8% delta till föregående frekvens)
Högsta 2 - 16 kHz
(+) | balanserade toppar - endast 4.6% från medianen
(+) | toppar är linjära (6.9% delta till föregående frekvens)
Totalt 100 - 16 000 Hz
(±) | linjäriteten för det totala ljudet är genomsnittlig (24.2% skillnad mot median)
Jämfört med samma klass
» 73% av alla testade enheter i den här klassen var bättre, 5% liknande, 21% sämre
» Den bästa hade ett delta på 6%, genomsnittet var 20%, sämst var 57%
Jämfört med alla testade enheter
» 73% av alla testade enheter var bättre, 6% liknande, 21% sämre
» Den bästa hade ett delta på 4%, genomsnittet var 24%, sämst var 134%
| Av/Standby | |
| Låg belastning | |
| Hög belastning |
|
Förklaring:
min: | |
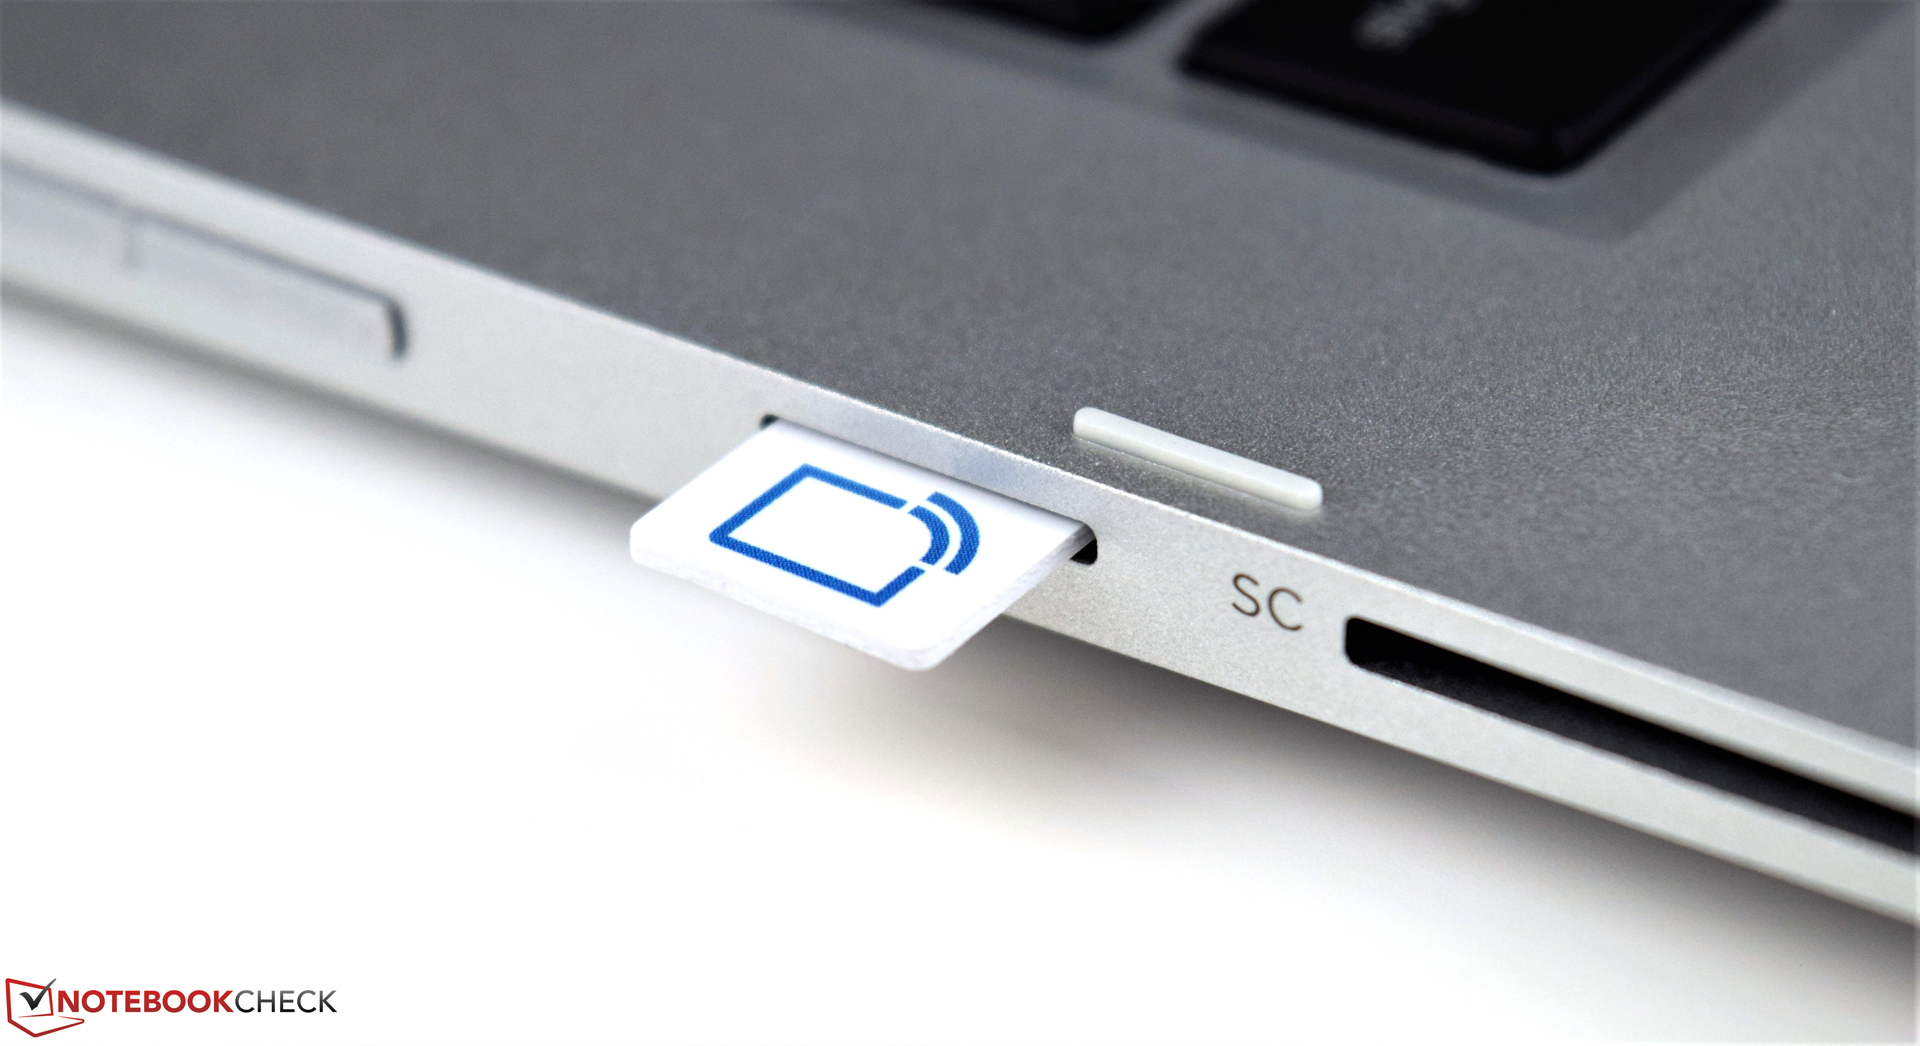
| HP EliteBook x360 1030 G2 i5-7300U, HD Graphics 620, Sandisk SD8TN8U-256G-1006, IPS, 1920x1080, 13.3" | Lenovo Yoga 910-13IKB-80VF004CGE i7-7500U, HD Graphics 620, Samsung PM951 NVMe MZVLV512, IPS, 3840x2160, 13.9" | Lenovo ThinkPad X1 Yoga-20FRS1VS00 6600U, HD Graphics 520, Samsung SSD PM961 1TB M.2 PCIe 3.0 x4 NVMe (MZSLW1T0), OLED, 2560x1440, 14" | Lenovo ThinkPad X1 Carbon 2017-20HQS03P00 i7-7500U, HD Graphics 620, Samsung PM961 NVMe MZVLW512HMJP, IPS, 1920x1080, 14" | Dell Latitude 13 7370 6Y57, HD Graphics 515, Toshiba NVMe THNSN5256GPU7, IPS, 1920x1080, 13.3" | HP Spectre x360 13-w023dx i7-7500U, HD Graphics 620, Samsung PM951 NVMe MZVLV512, IPS, 1920x1080, 13.3" | Lenovo ThinkPad Yoga 370-20JJS00100 i5-7200U, HD Graphics 620, Toshiba NVMe THNSF5512GPUK, IPS LED, 1920x1080, 13.3" | |
|---|---|---|---|---|---|---|---|
| Power Consumption | -13% | -43% | -25% | -6% | -20% | -10% | |
| Idle Minimum * (Watt) | 3.2 | 4.3 -34% | 4.7 -47% | 3.84 -20% | 5 -56% | 5.5 -72% | 3.6 -13% |
| Idle Average * (Watt) | 5.5 | 6.3 -15% | 8.6 -56% | 6.3 -15% | 7.5 -36% | 6.7 -22% | 7.2 -31% |
| Idle Maximum * (Watt) | 6.5 | 9 -38% | 12.2 -88% | 8.6 -32% | 8 -23% | 7.1 -9% | 8.4 -29% |
| Load Average * (Watt) | 29.7 | 32.7 -10% | 29.7 -0% | 41.9 -41% | 15.3 48% | 33.1 -11% | 29.9 -1% |
| Load Maximum * (Watt) | 41.3 | 28.8 30% | 50.5 -22% | 48.7 -18% | 26.8 35% | 35.2 15% | 32.2 22% |
* ... mindre är bättre
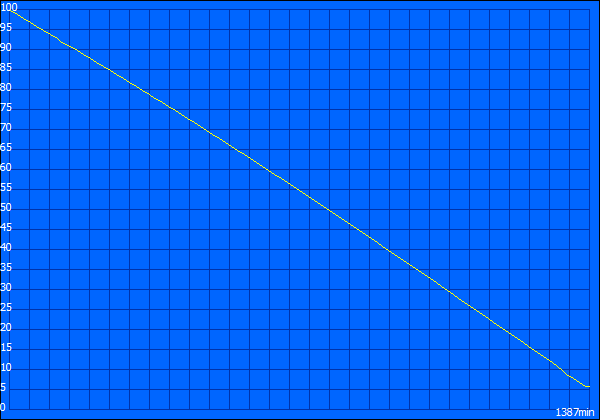
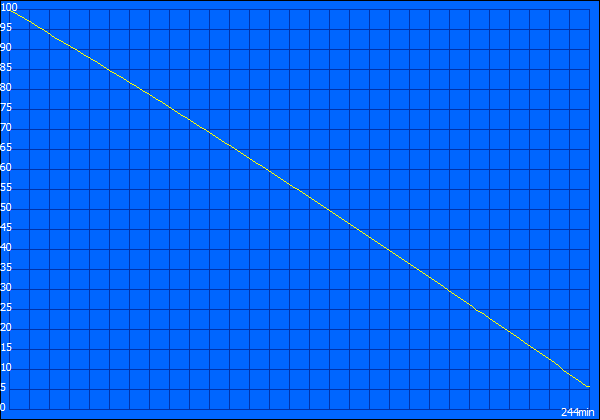
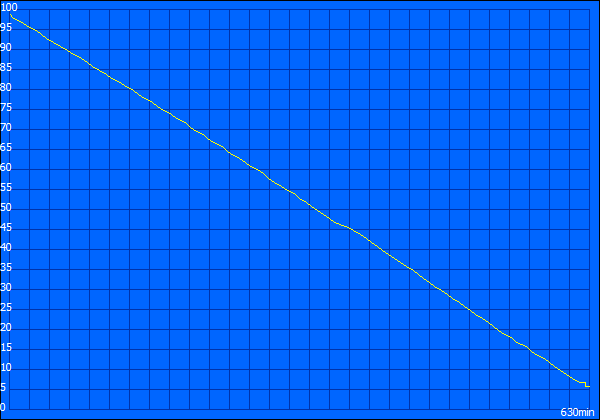

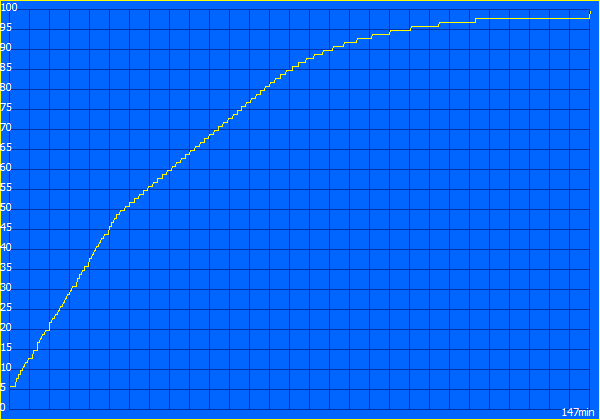
| HP EliteBook x360 1030 G2 i5-7300U, HD Graphics 620, 57 Wh | Lenovo Yoga 910-13IKB-80VF004CGE i7-7500U, HD Graphics 620, 78 Wh | Lenovo ThinkPad X1 Yoga-20FRS1VS00 6600U, HD Graphics 520, 56 Wh | Lenovo ThinkPad X1 Carbon 2017-20HQS03P00 i7-7500U, HD Graphics 620, 57 Wh | Dell Latitude 13 7370 6Y57, HD Graphics 515, 34 Wh | HP Spectre x360 13-w023dx i7-7500U, HD Graphics 620, 57.8 Wh | Lenovo ThinkPad Yoga 370-20JJS00100 i5-7200U, HD Graphics 620, 51 Wh | |
|---|---|---|---|---|---|---|---|
| Batteridrifttid | -17% | -40% | -20% | -43% | -24% | -25% | |
| Reader / Idle (h) | 23.1 | 17.8 -23% | 13.7 -41% | 20.9 -10% | 9.8 -58% | 20.6 -11% | 19.4 -16% |
| H.264 (h) | 11 | 8.7 -21% | 11.9 8% | 6.5 -41% | 9.6 -13% | ||
| WiFi v1.3 (h) | 10.5 | 10.7 2% | 5.3 -50% | 8.3 -21% | 6.1 -42% | 9.3 -11% | 8.1 -23% |
| Load (h) | 4.1 | 2.9 -29% | 2.2 -46% | 1.8 -56% | 2.9 -29% | 2 -51% | 2.1 -49% |
För
Emot
Läs originaltestet på engelska här.
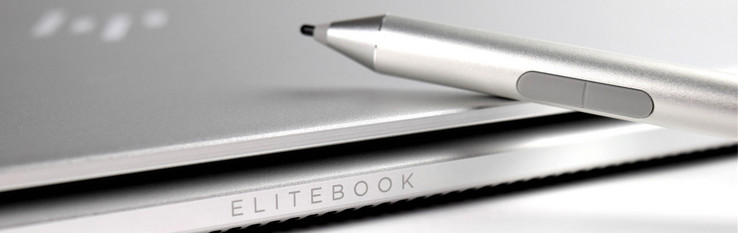
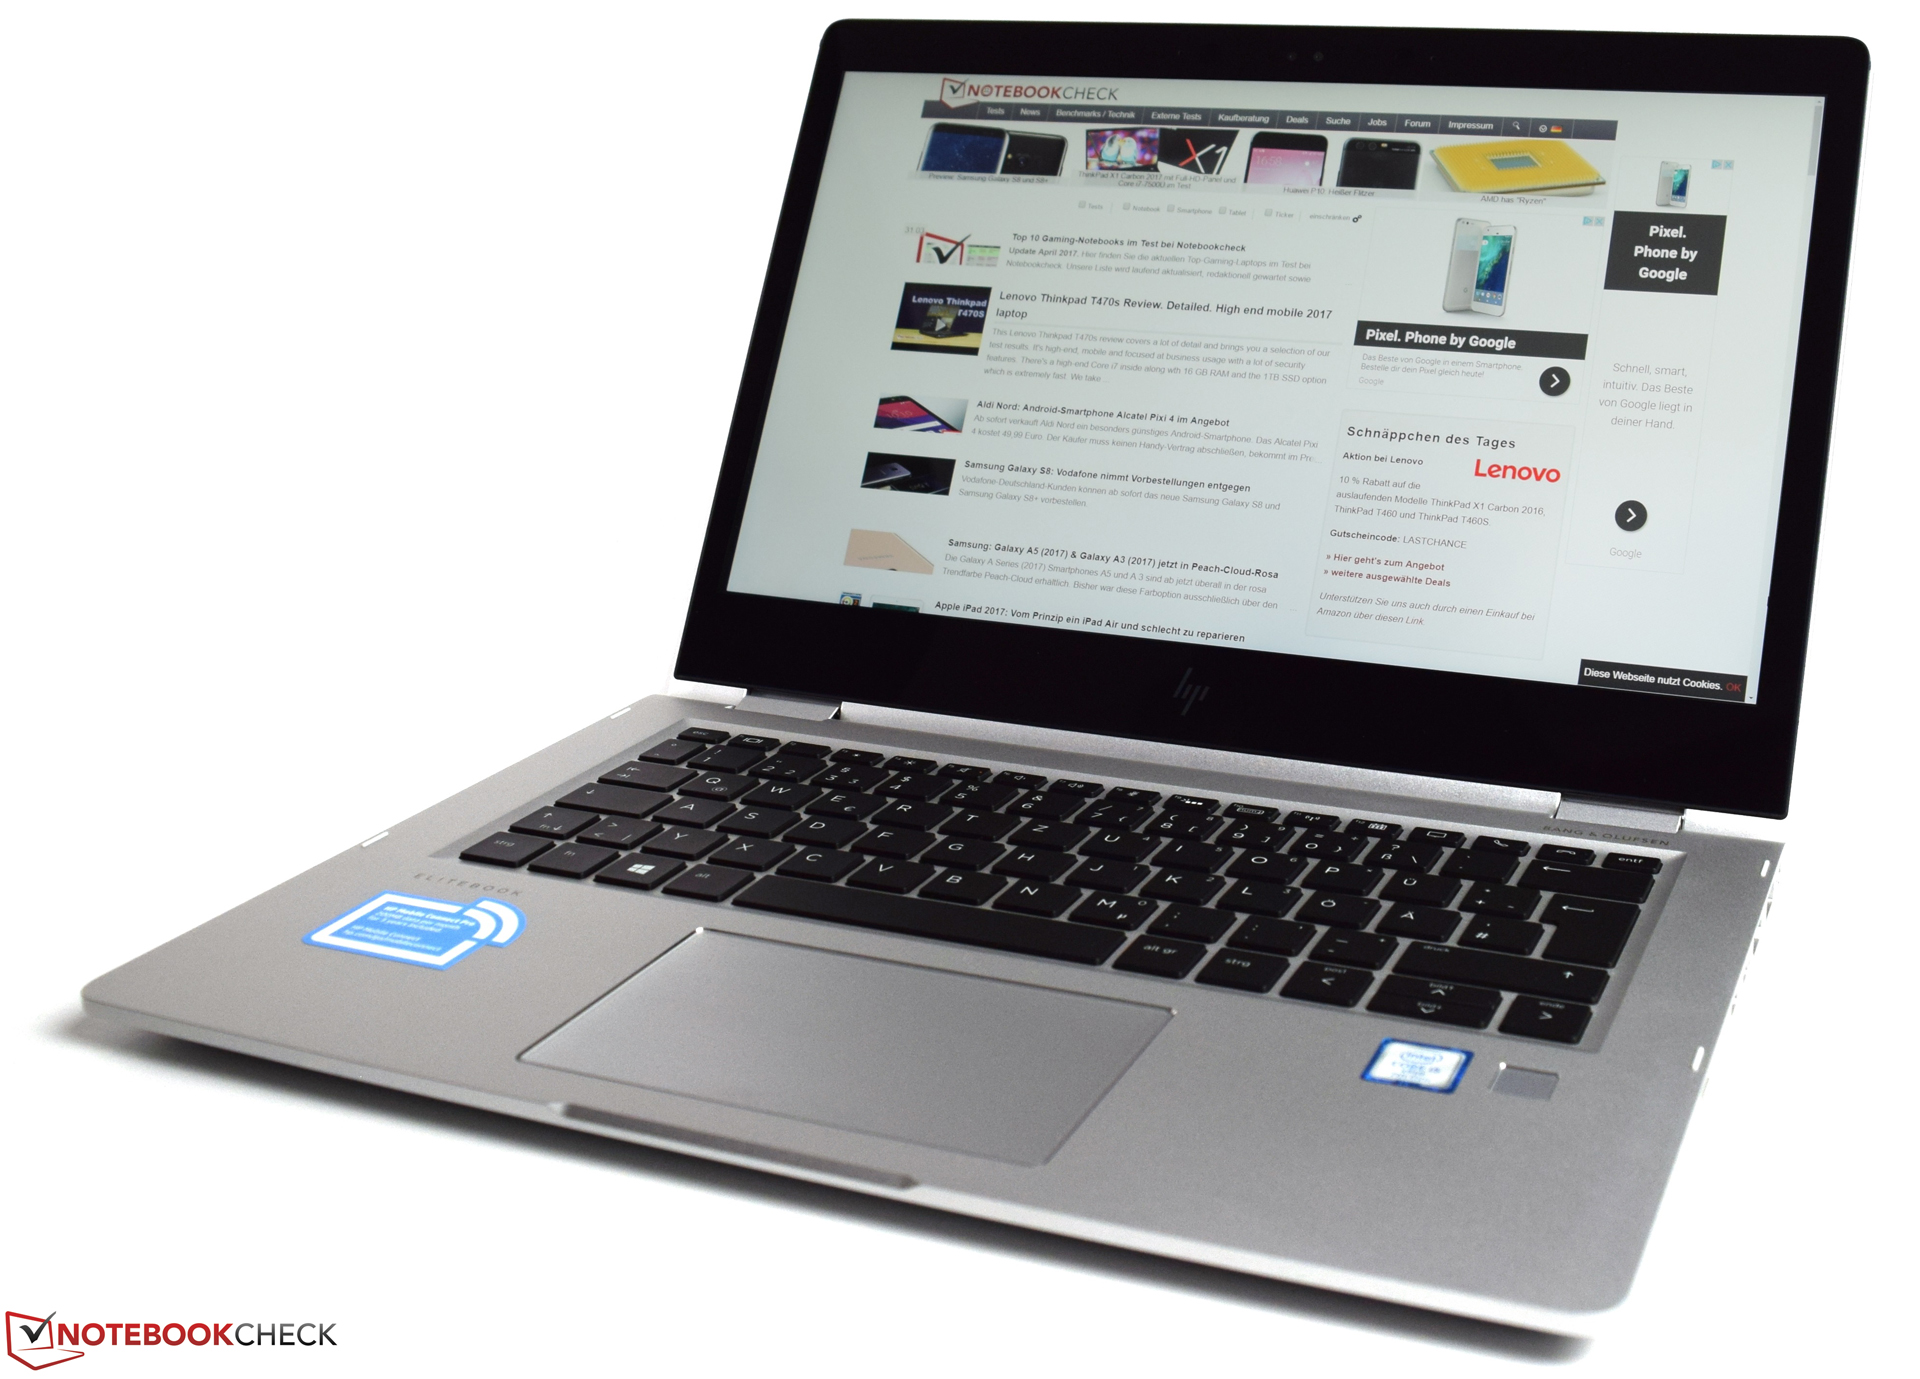
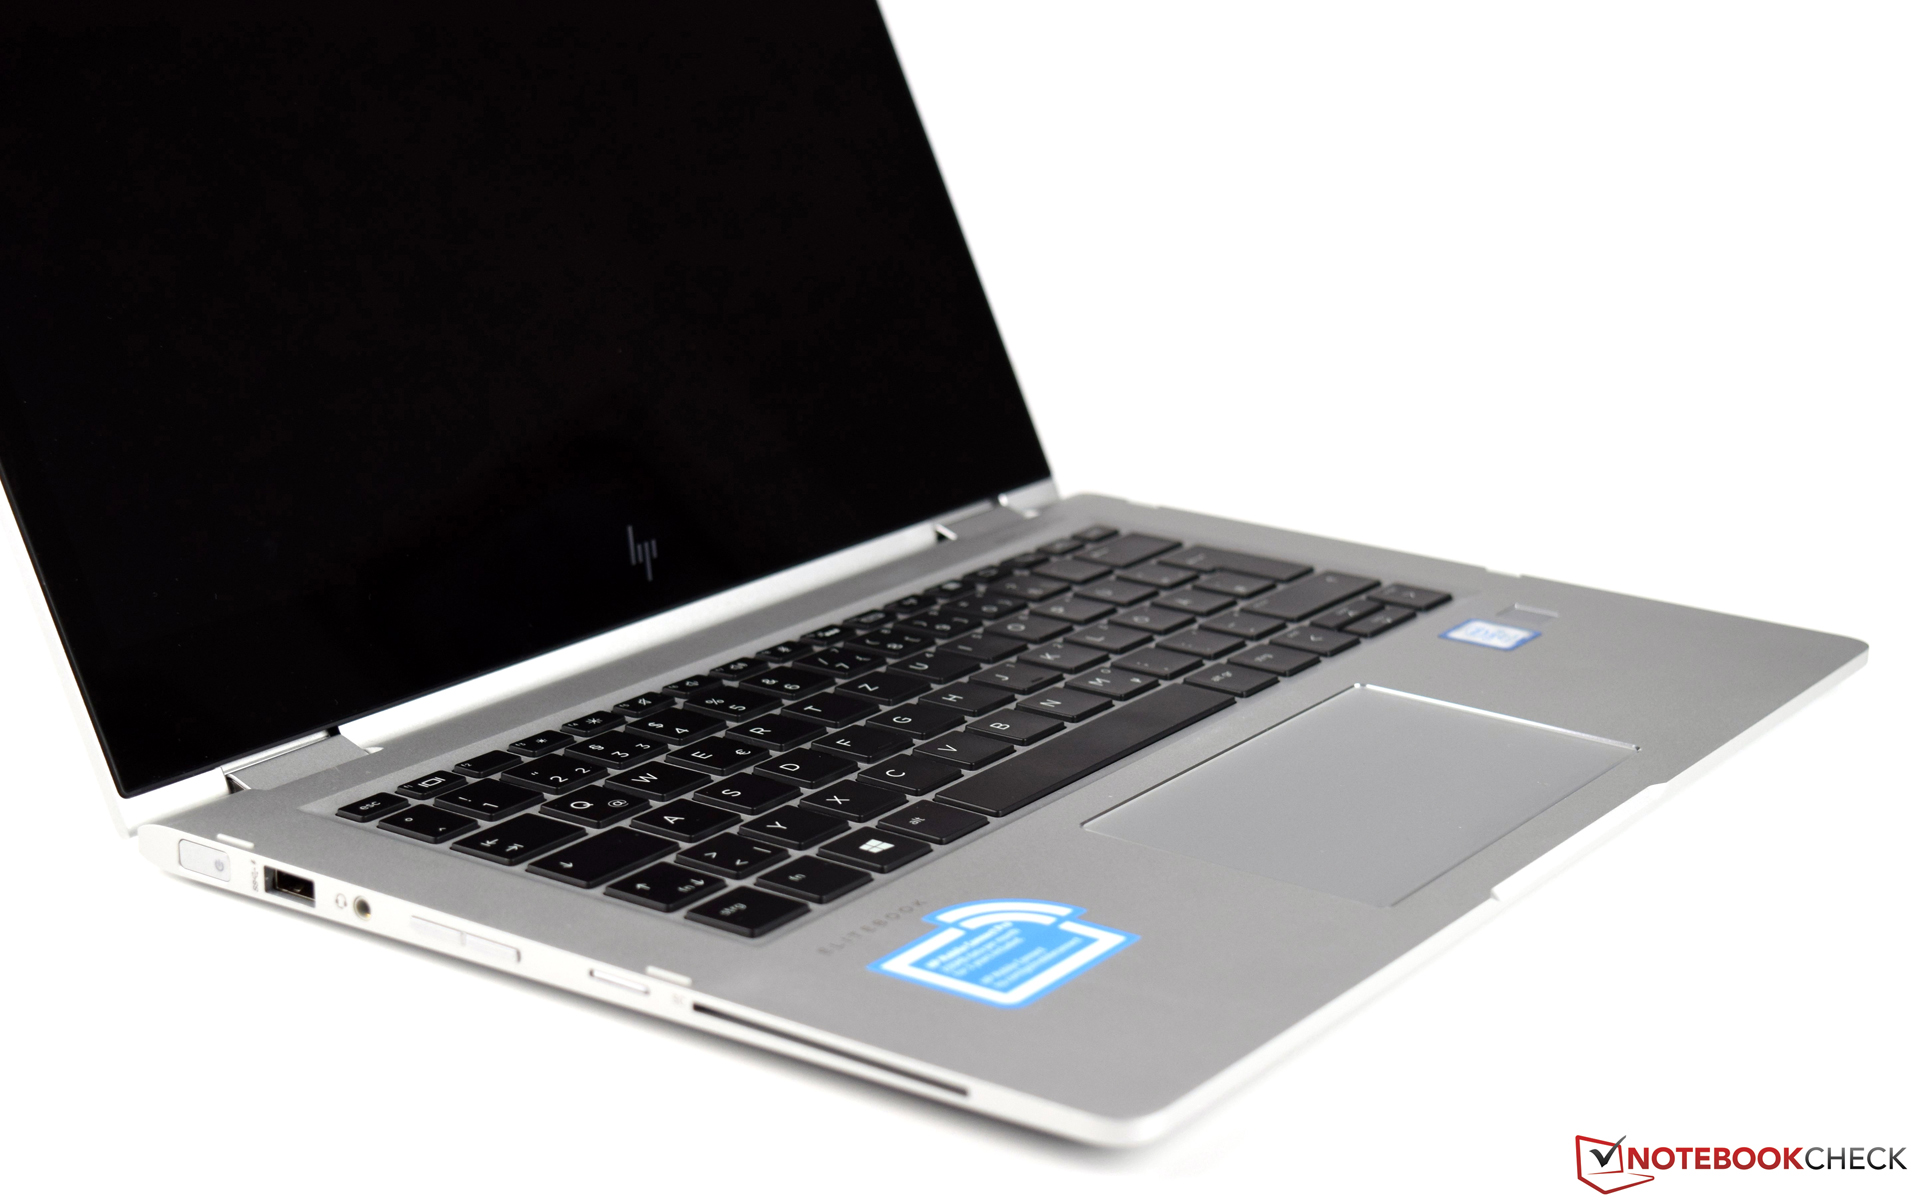
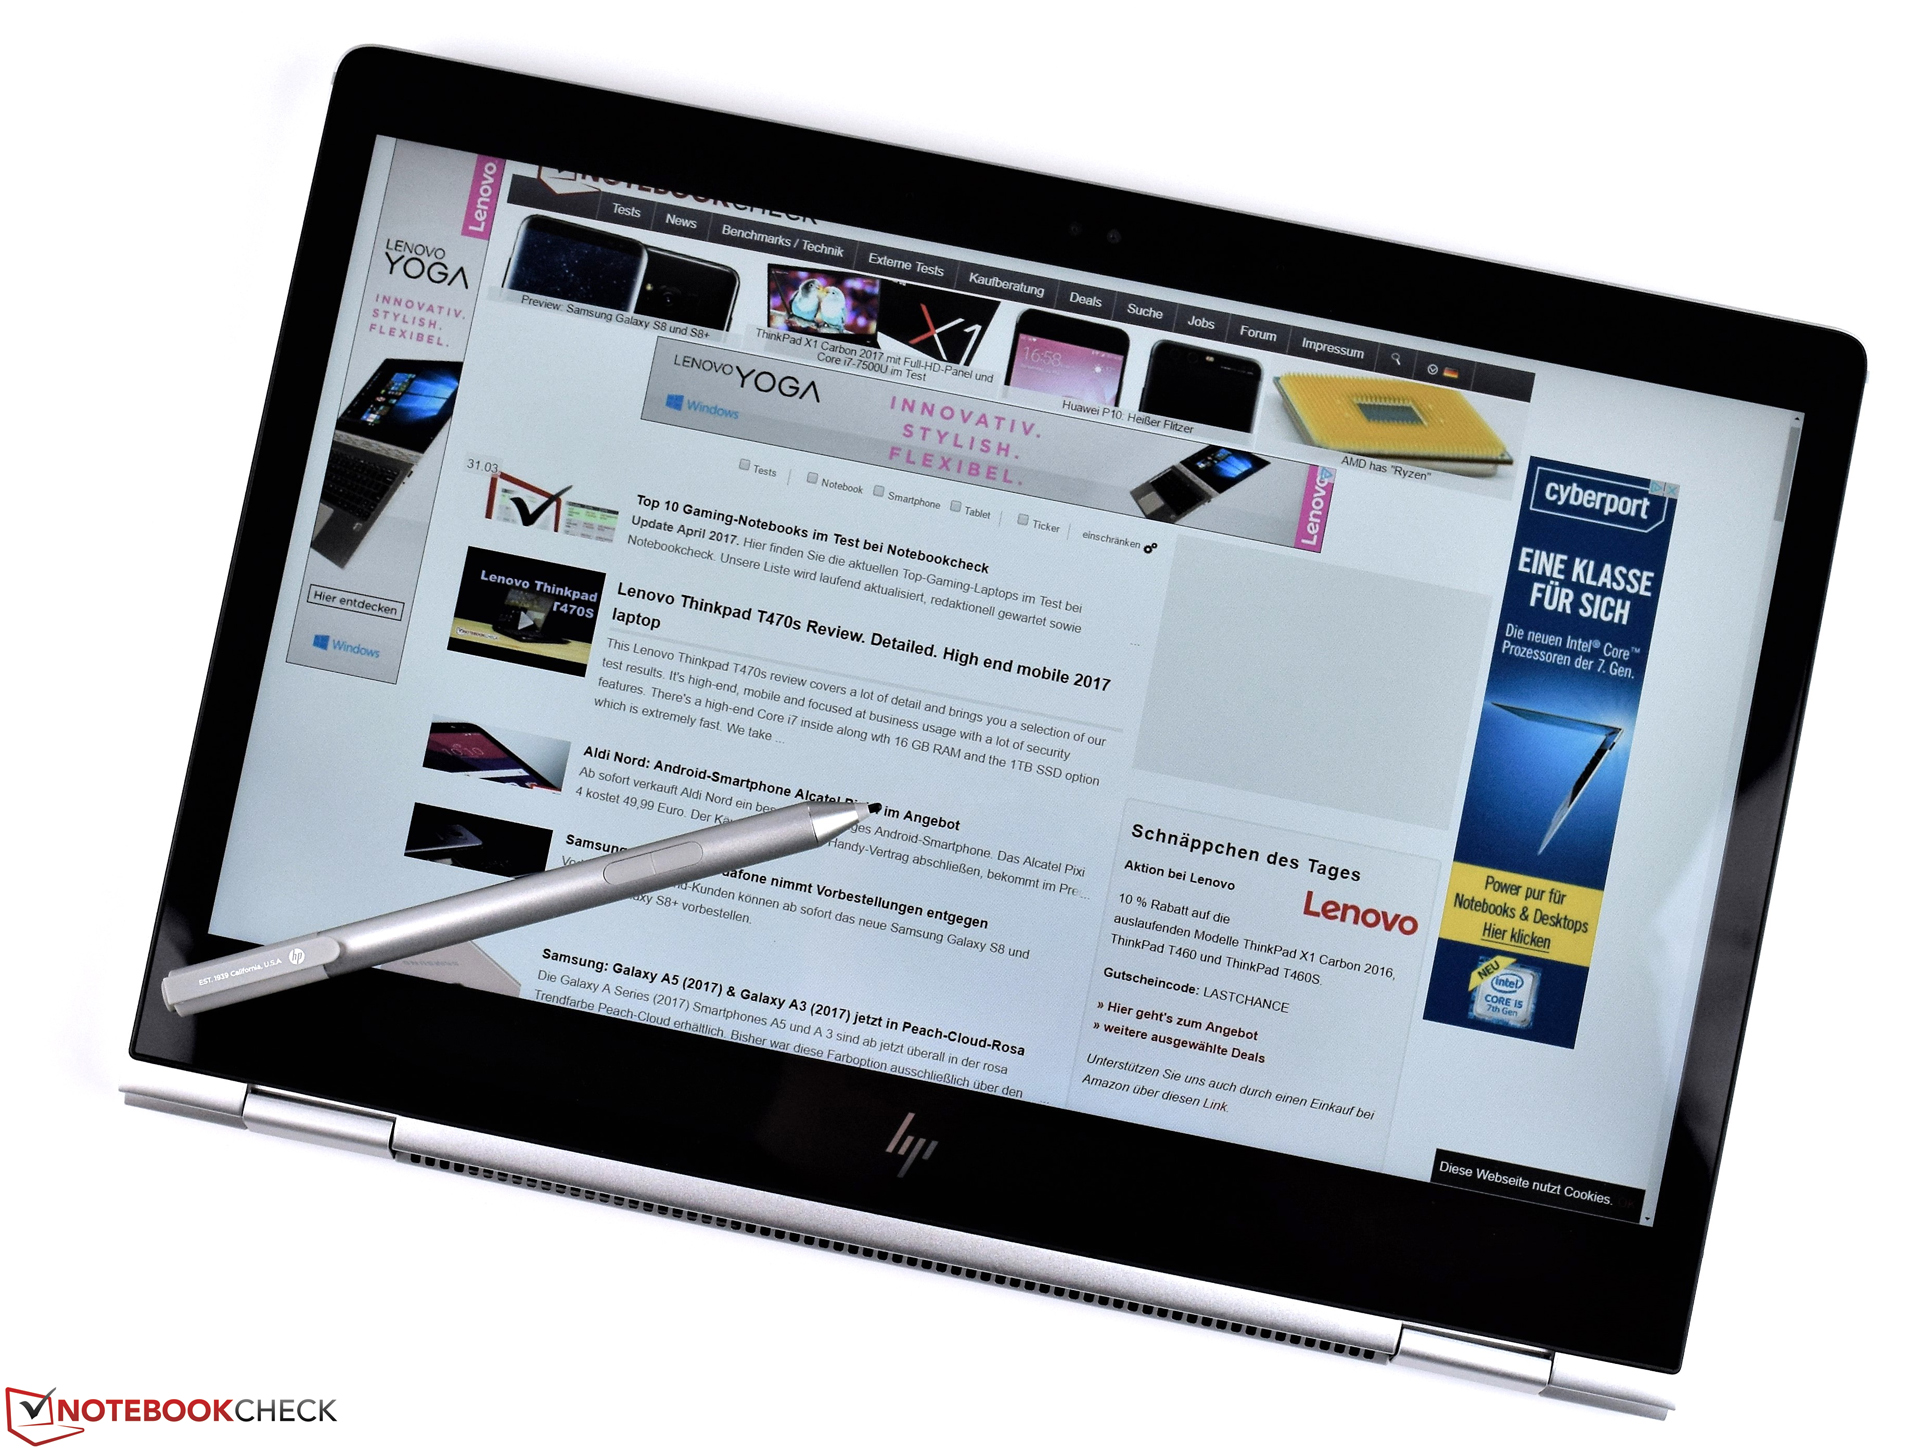
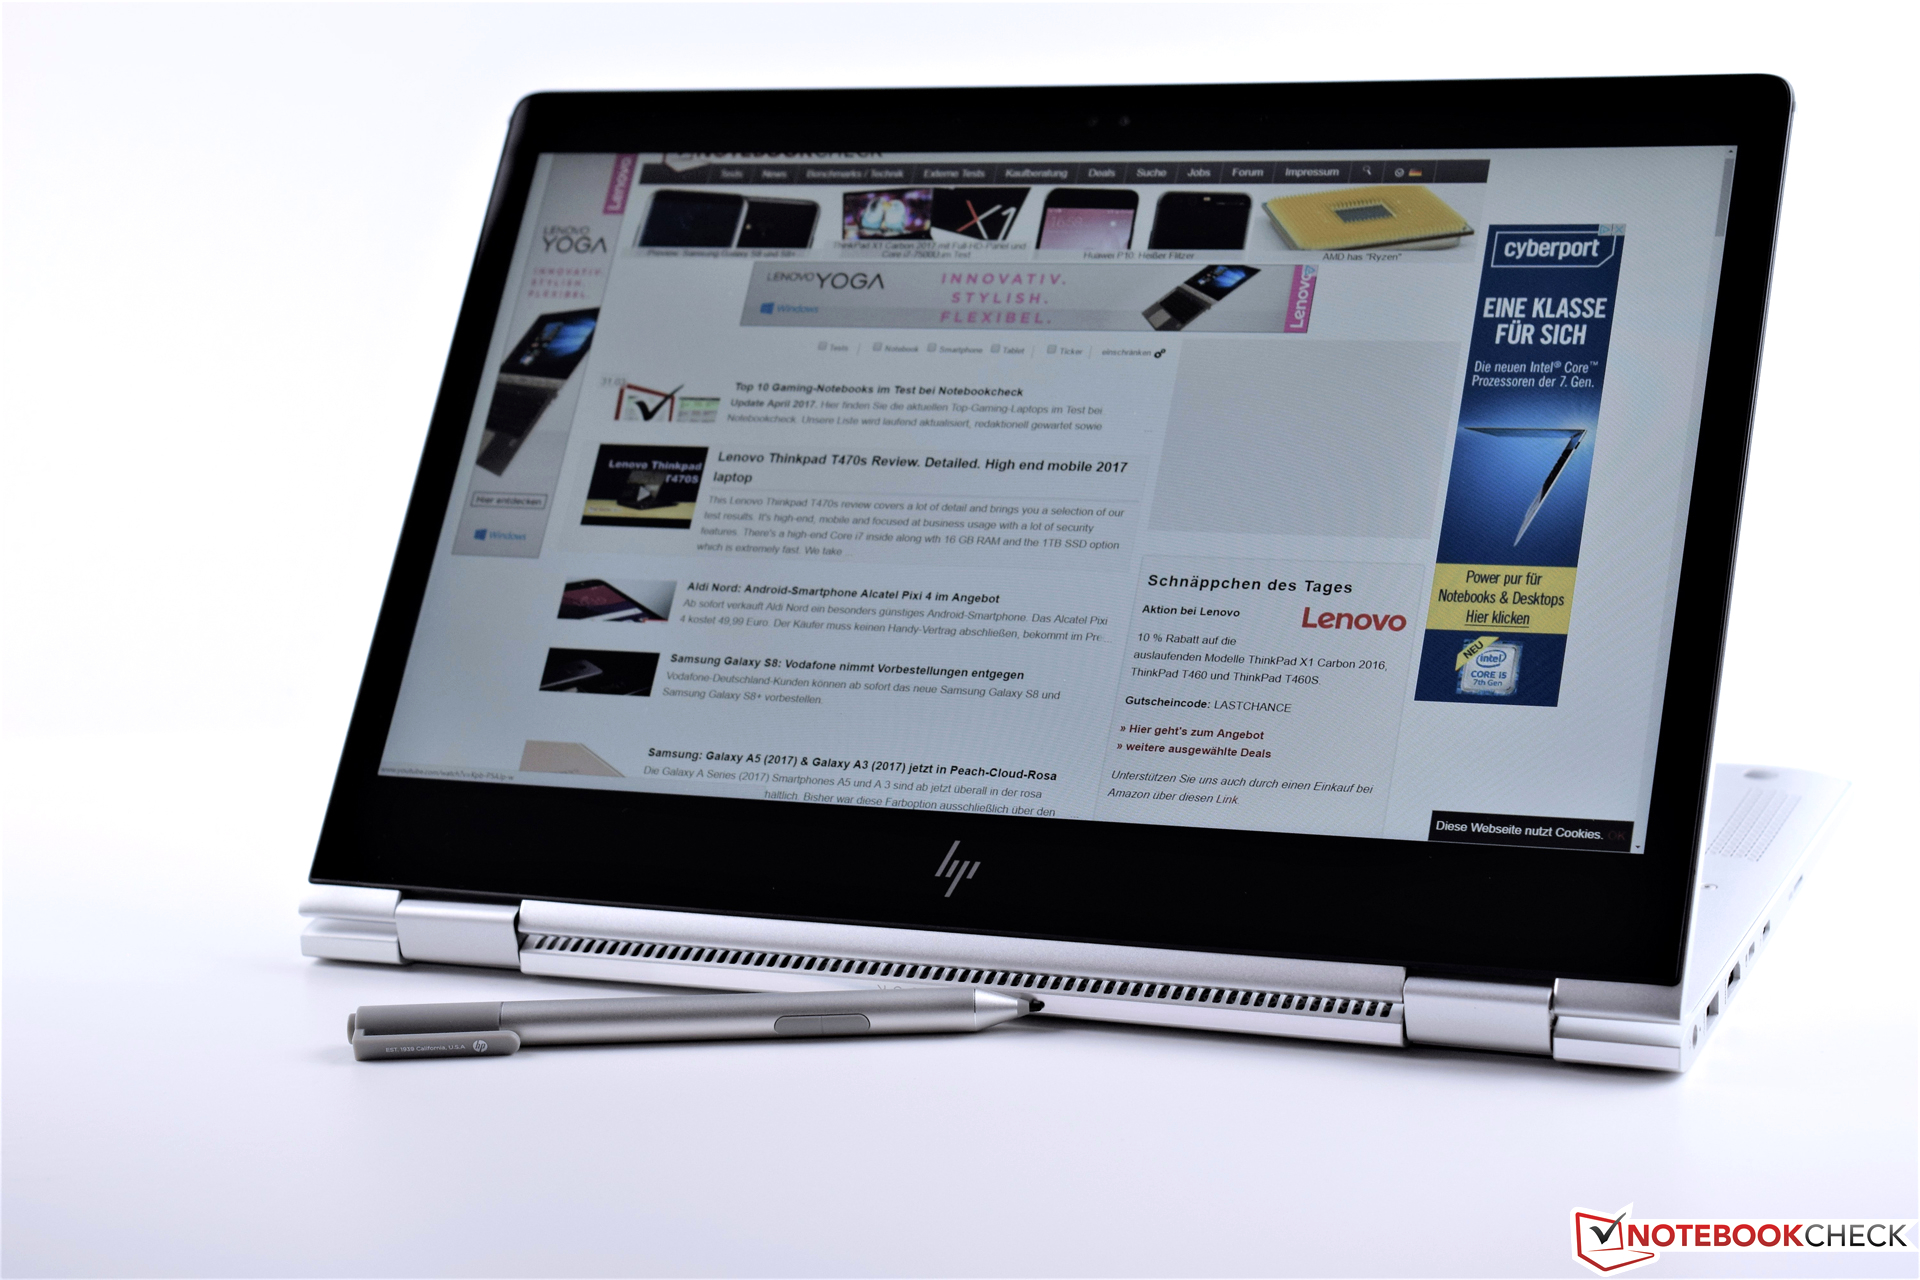
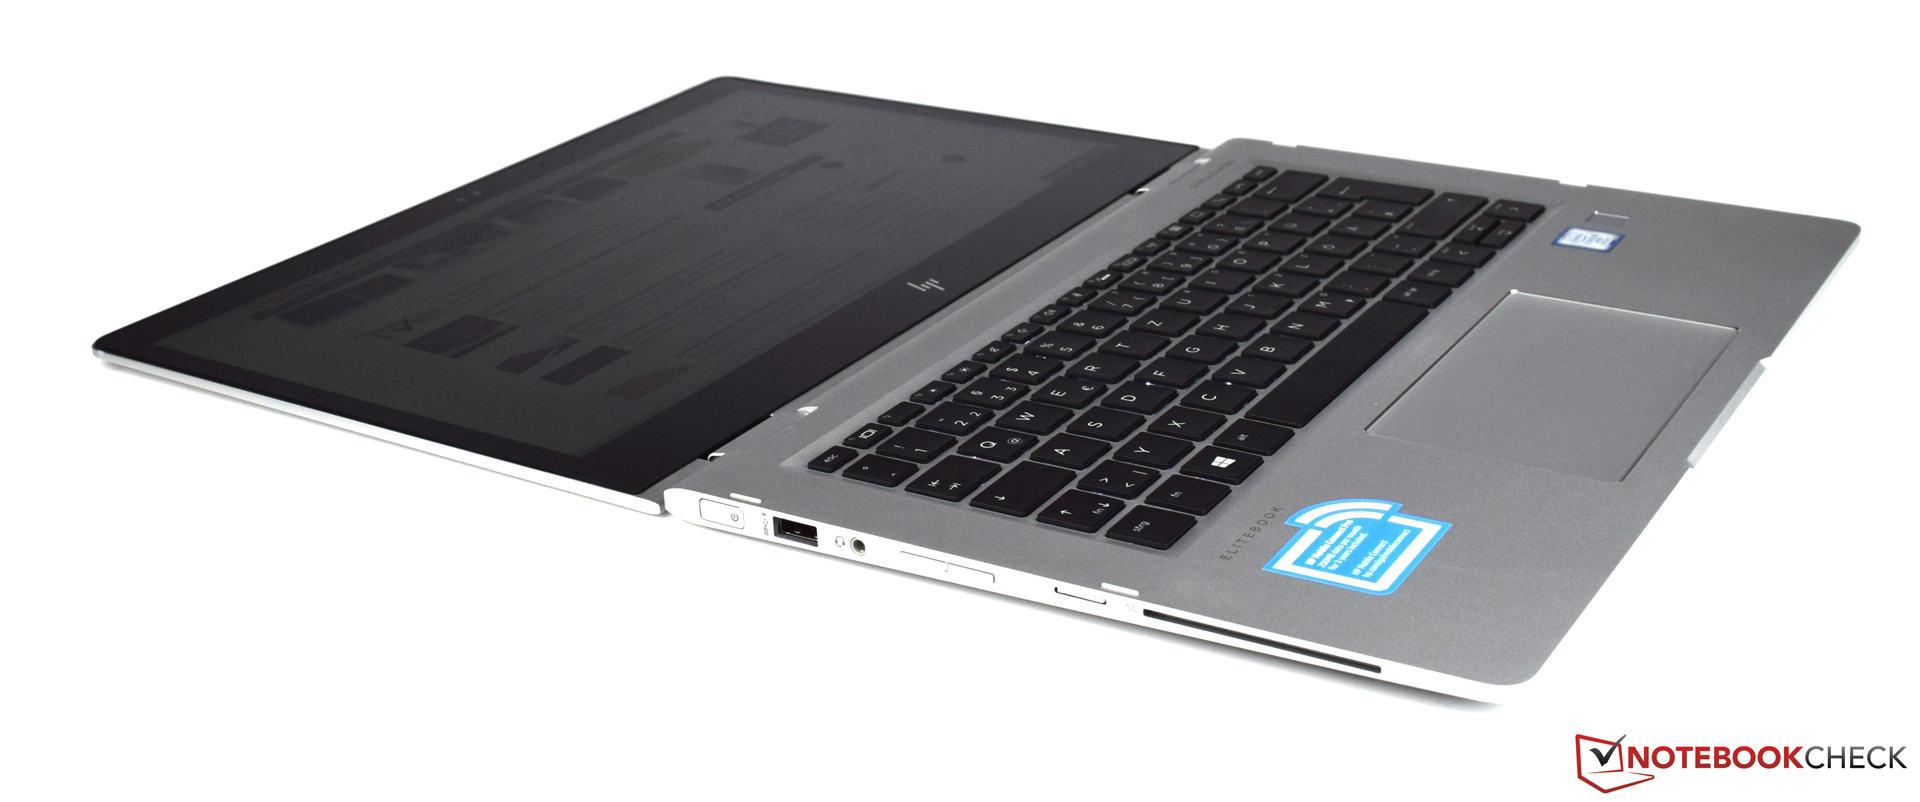
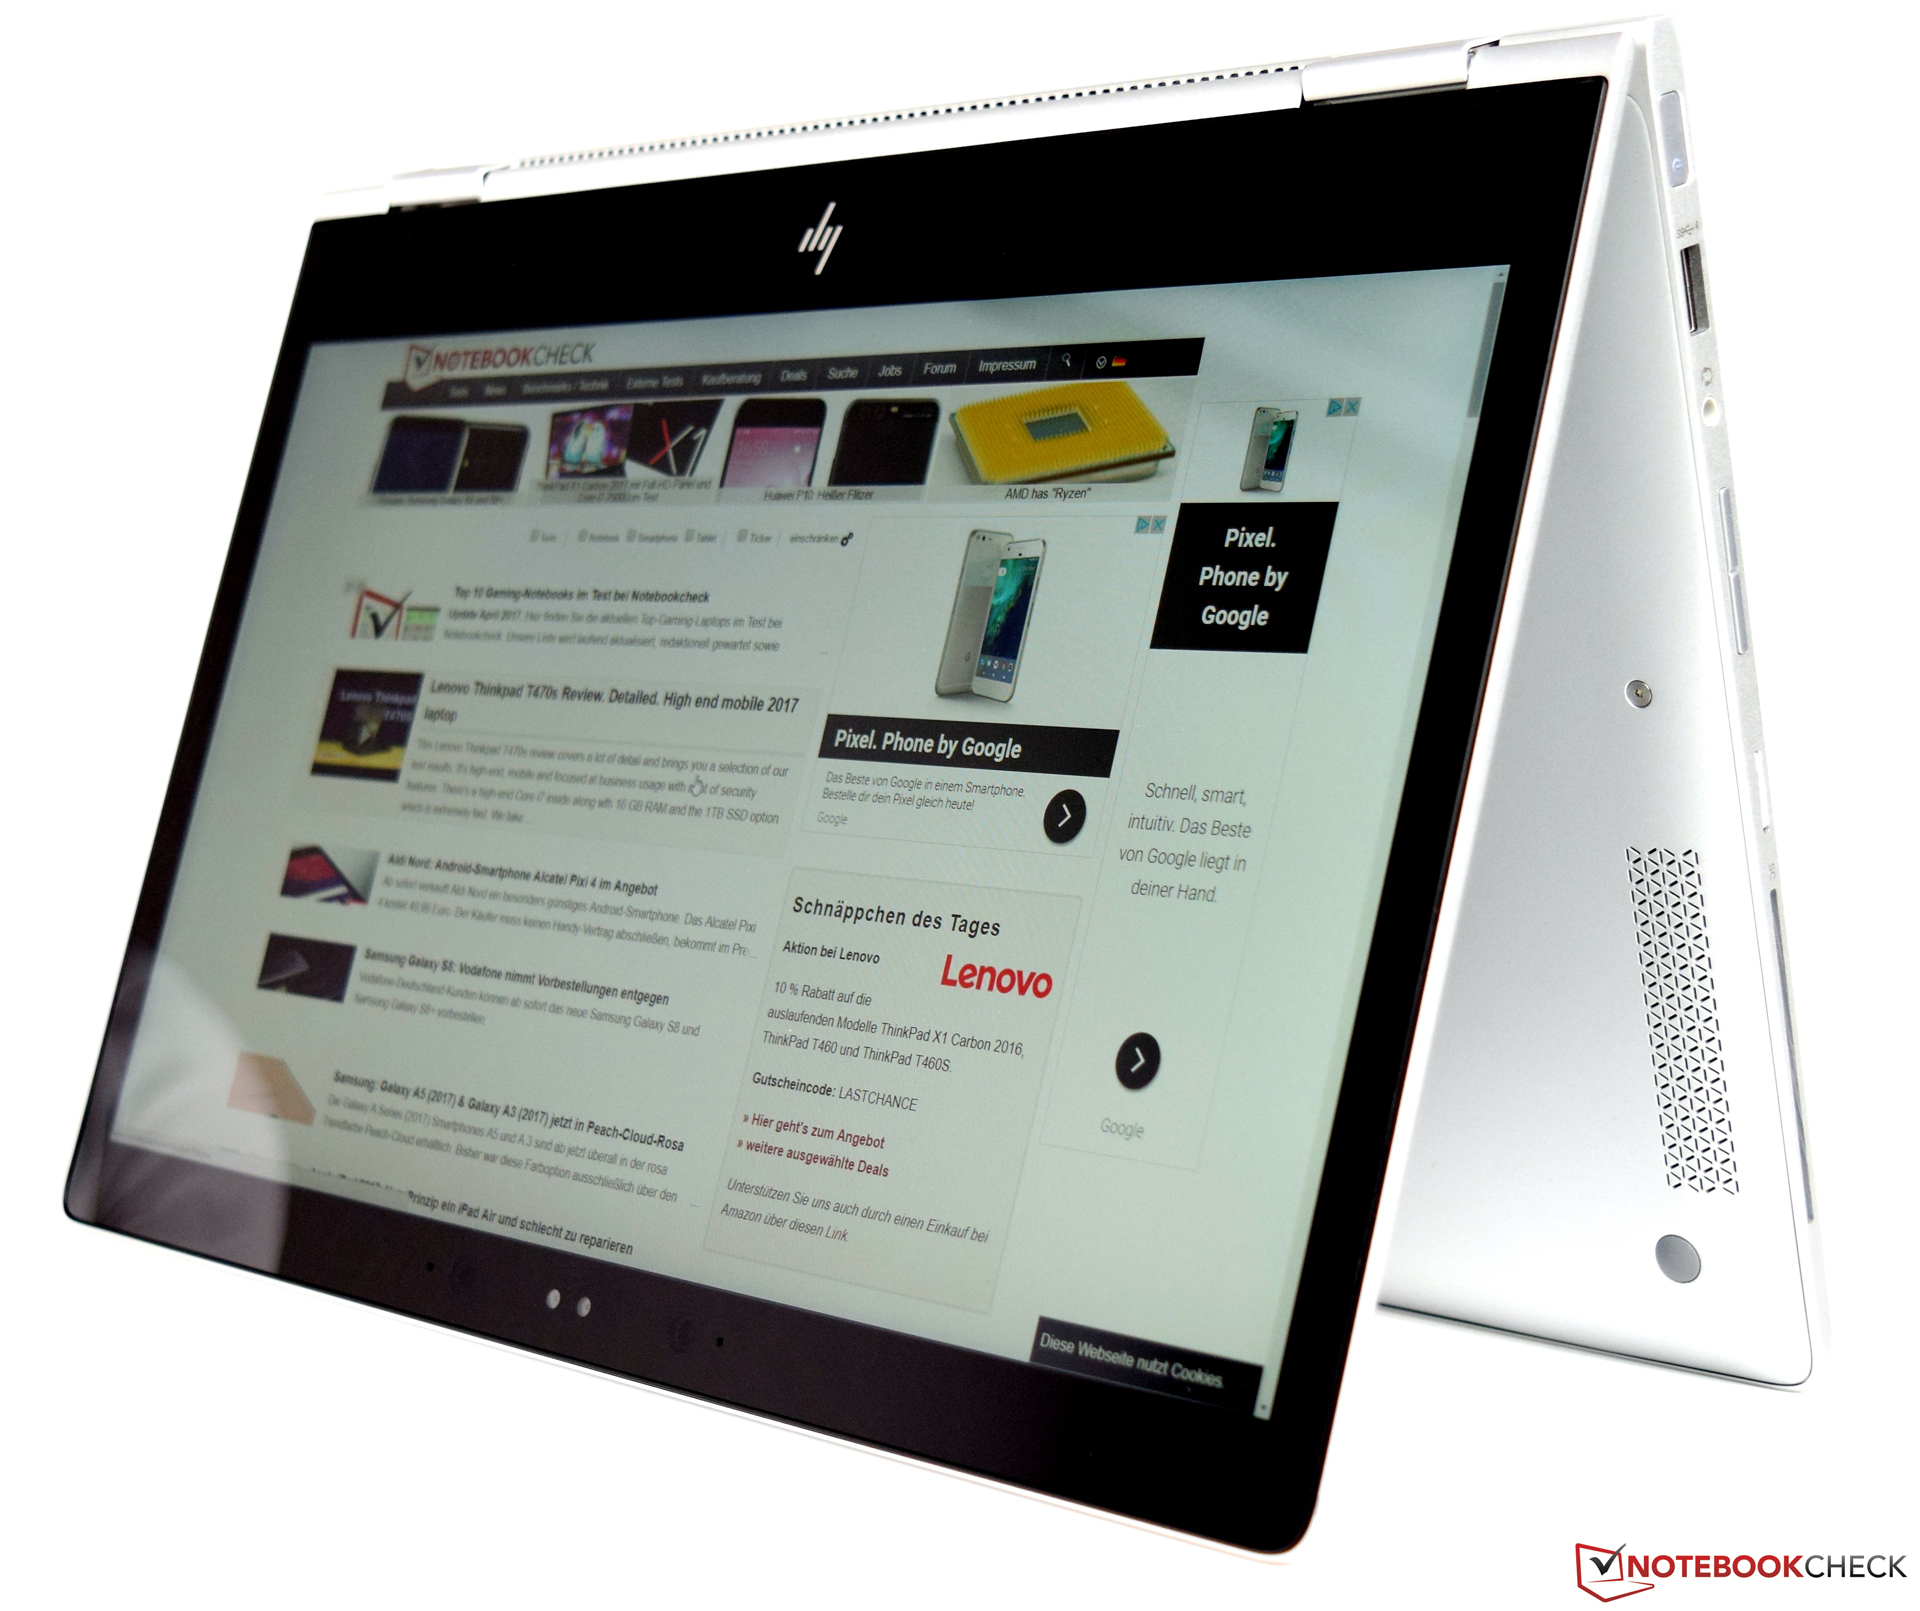
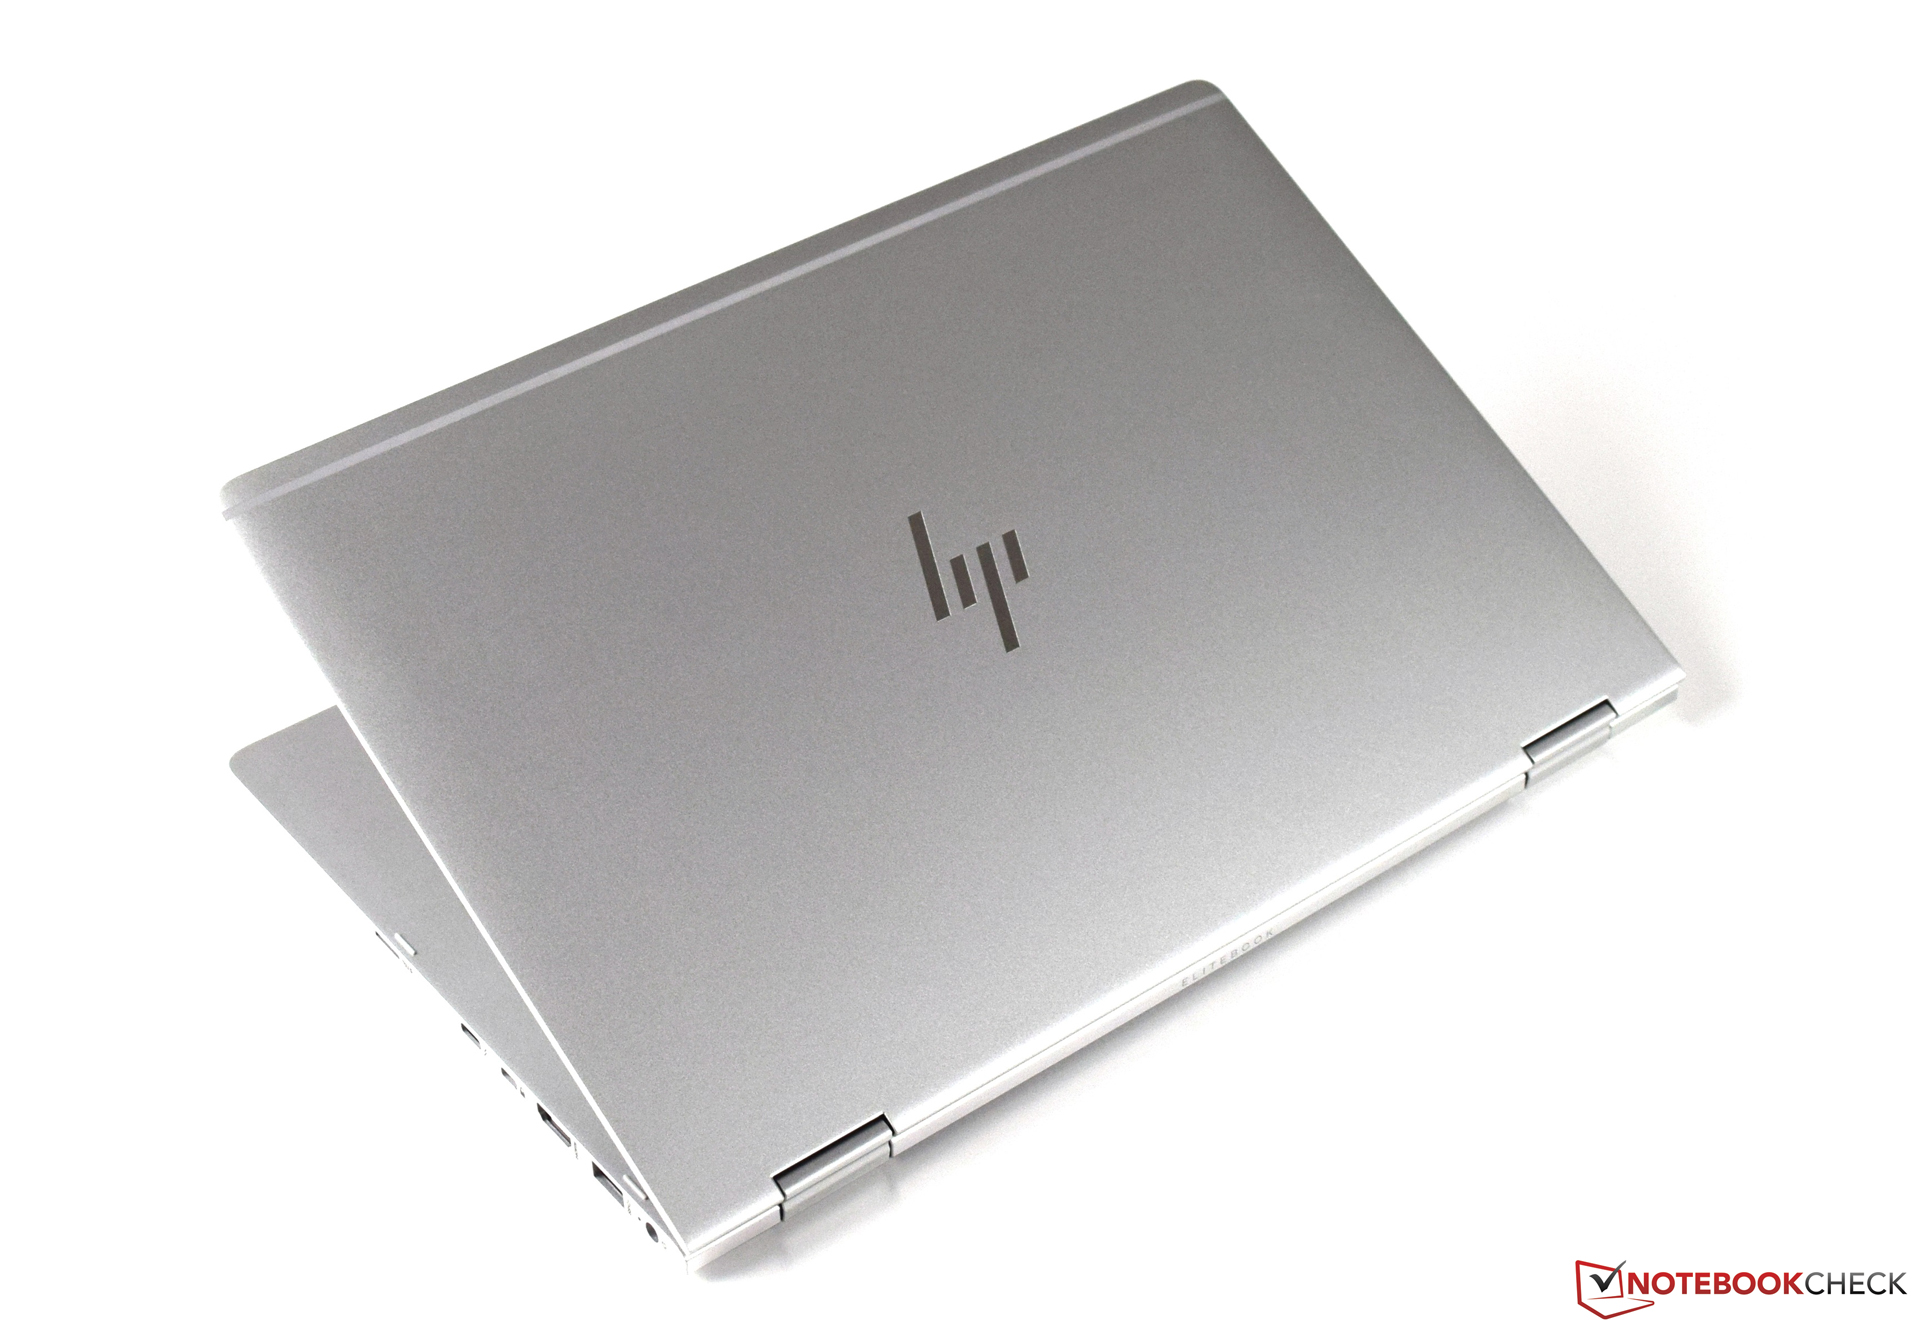
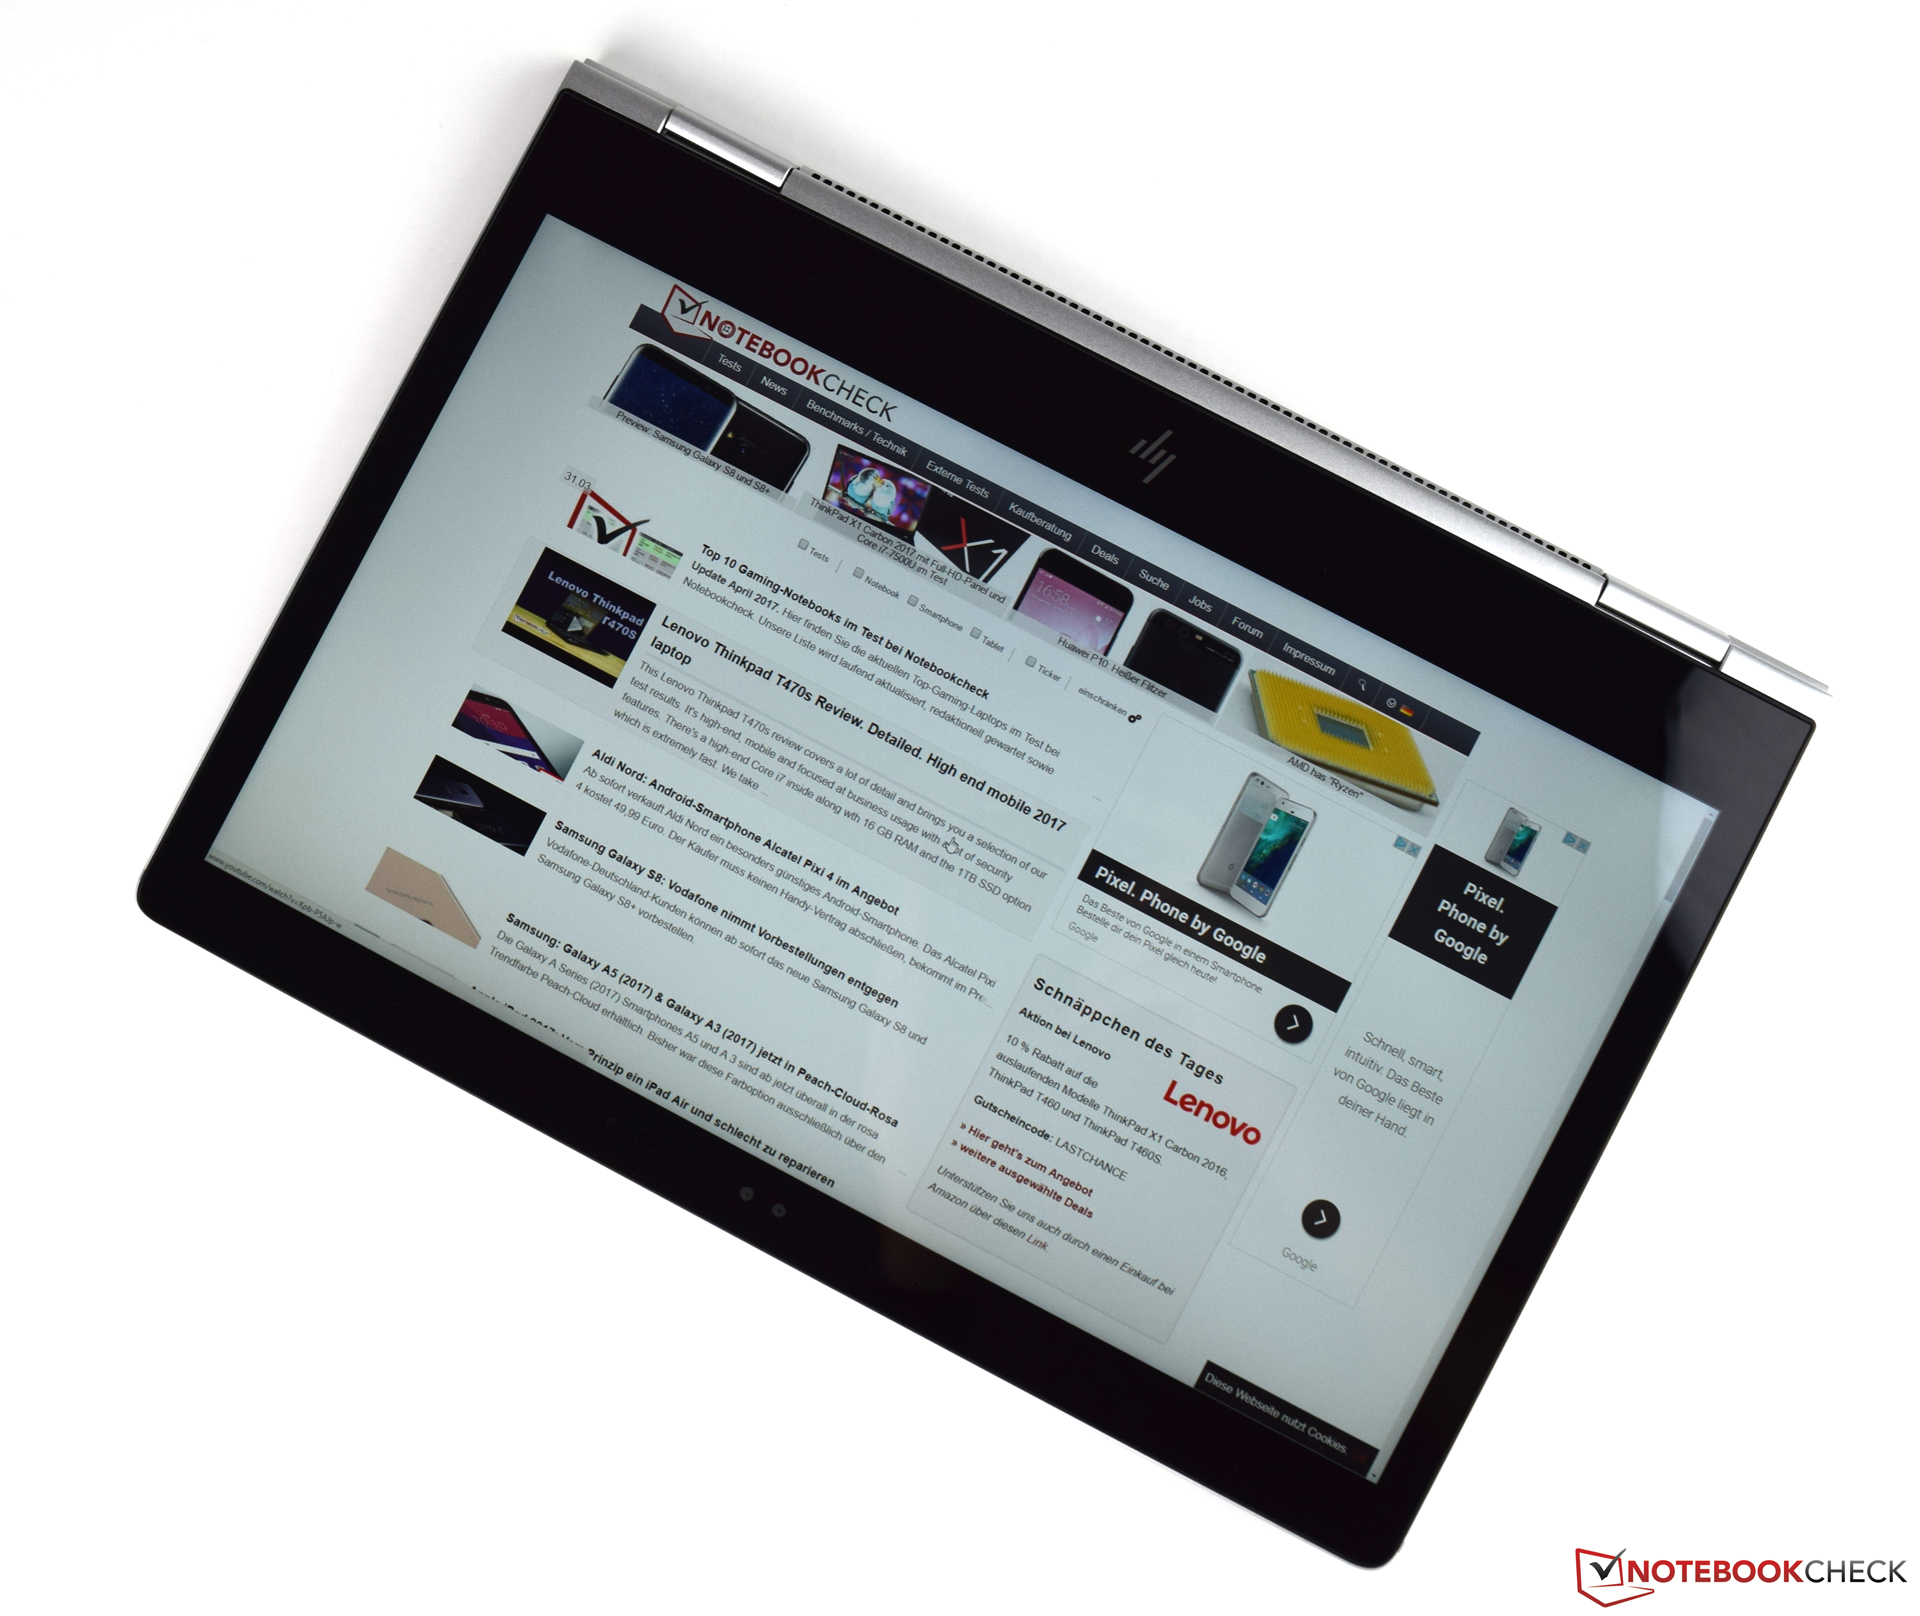
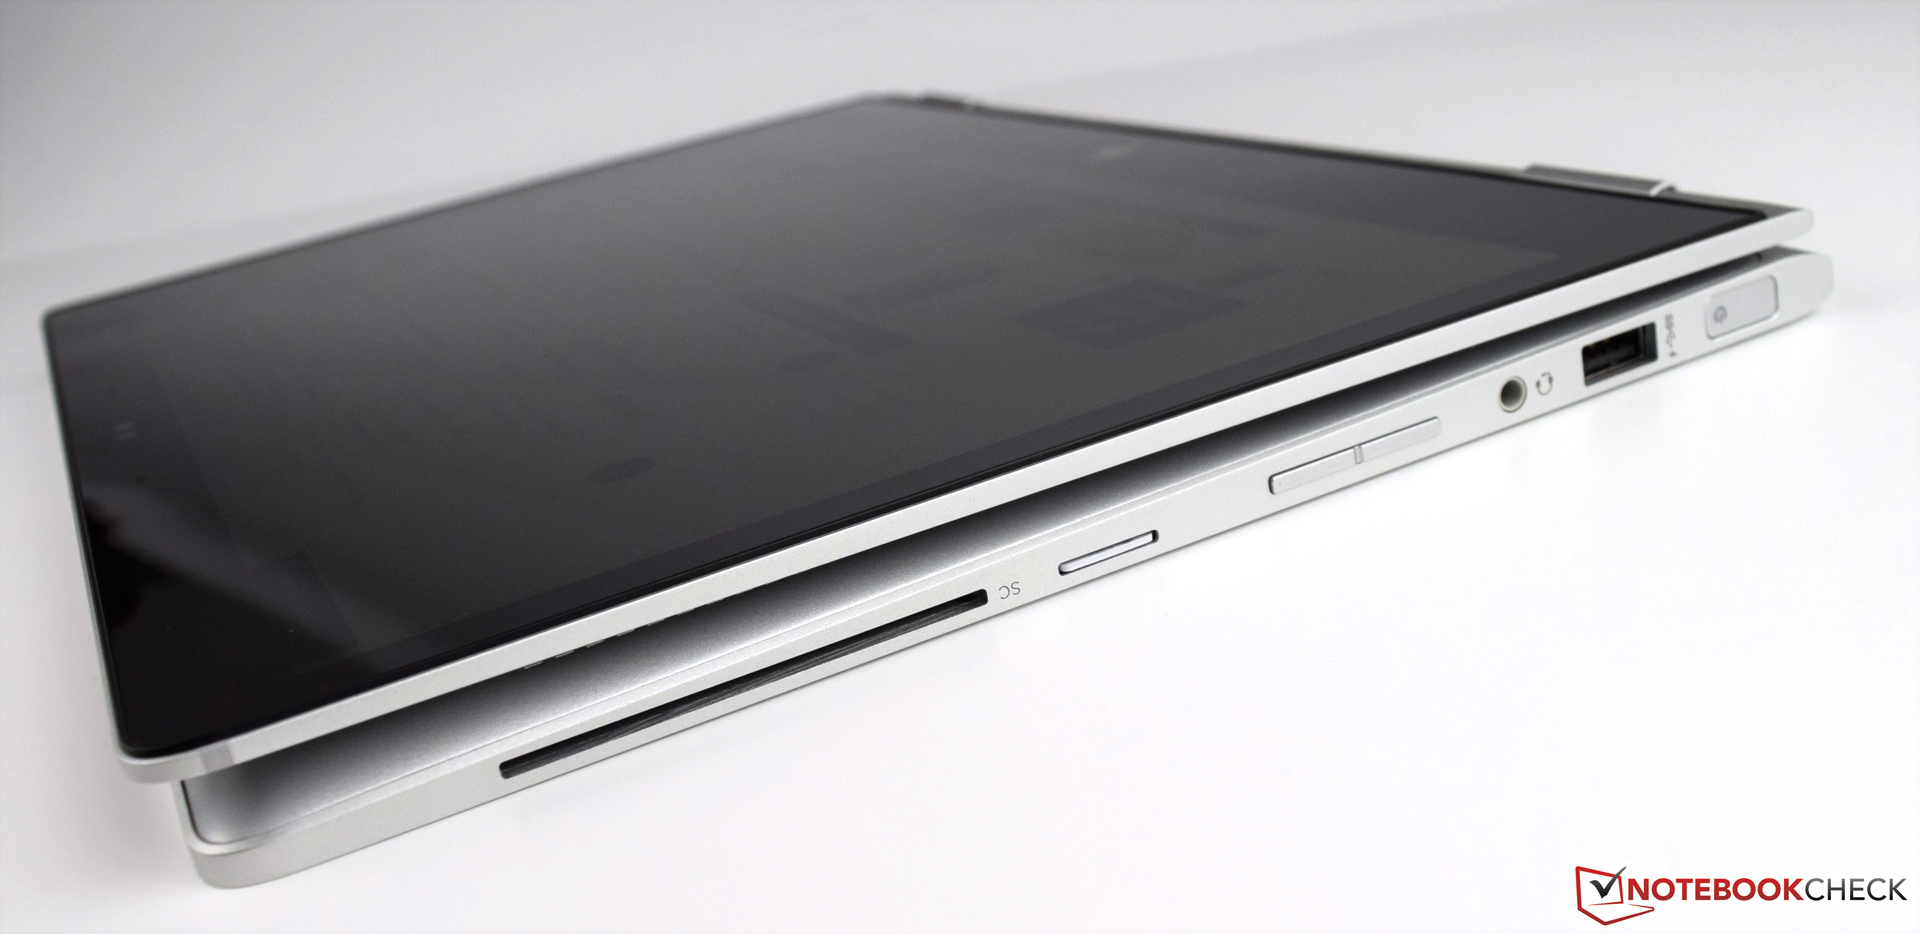
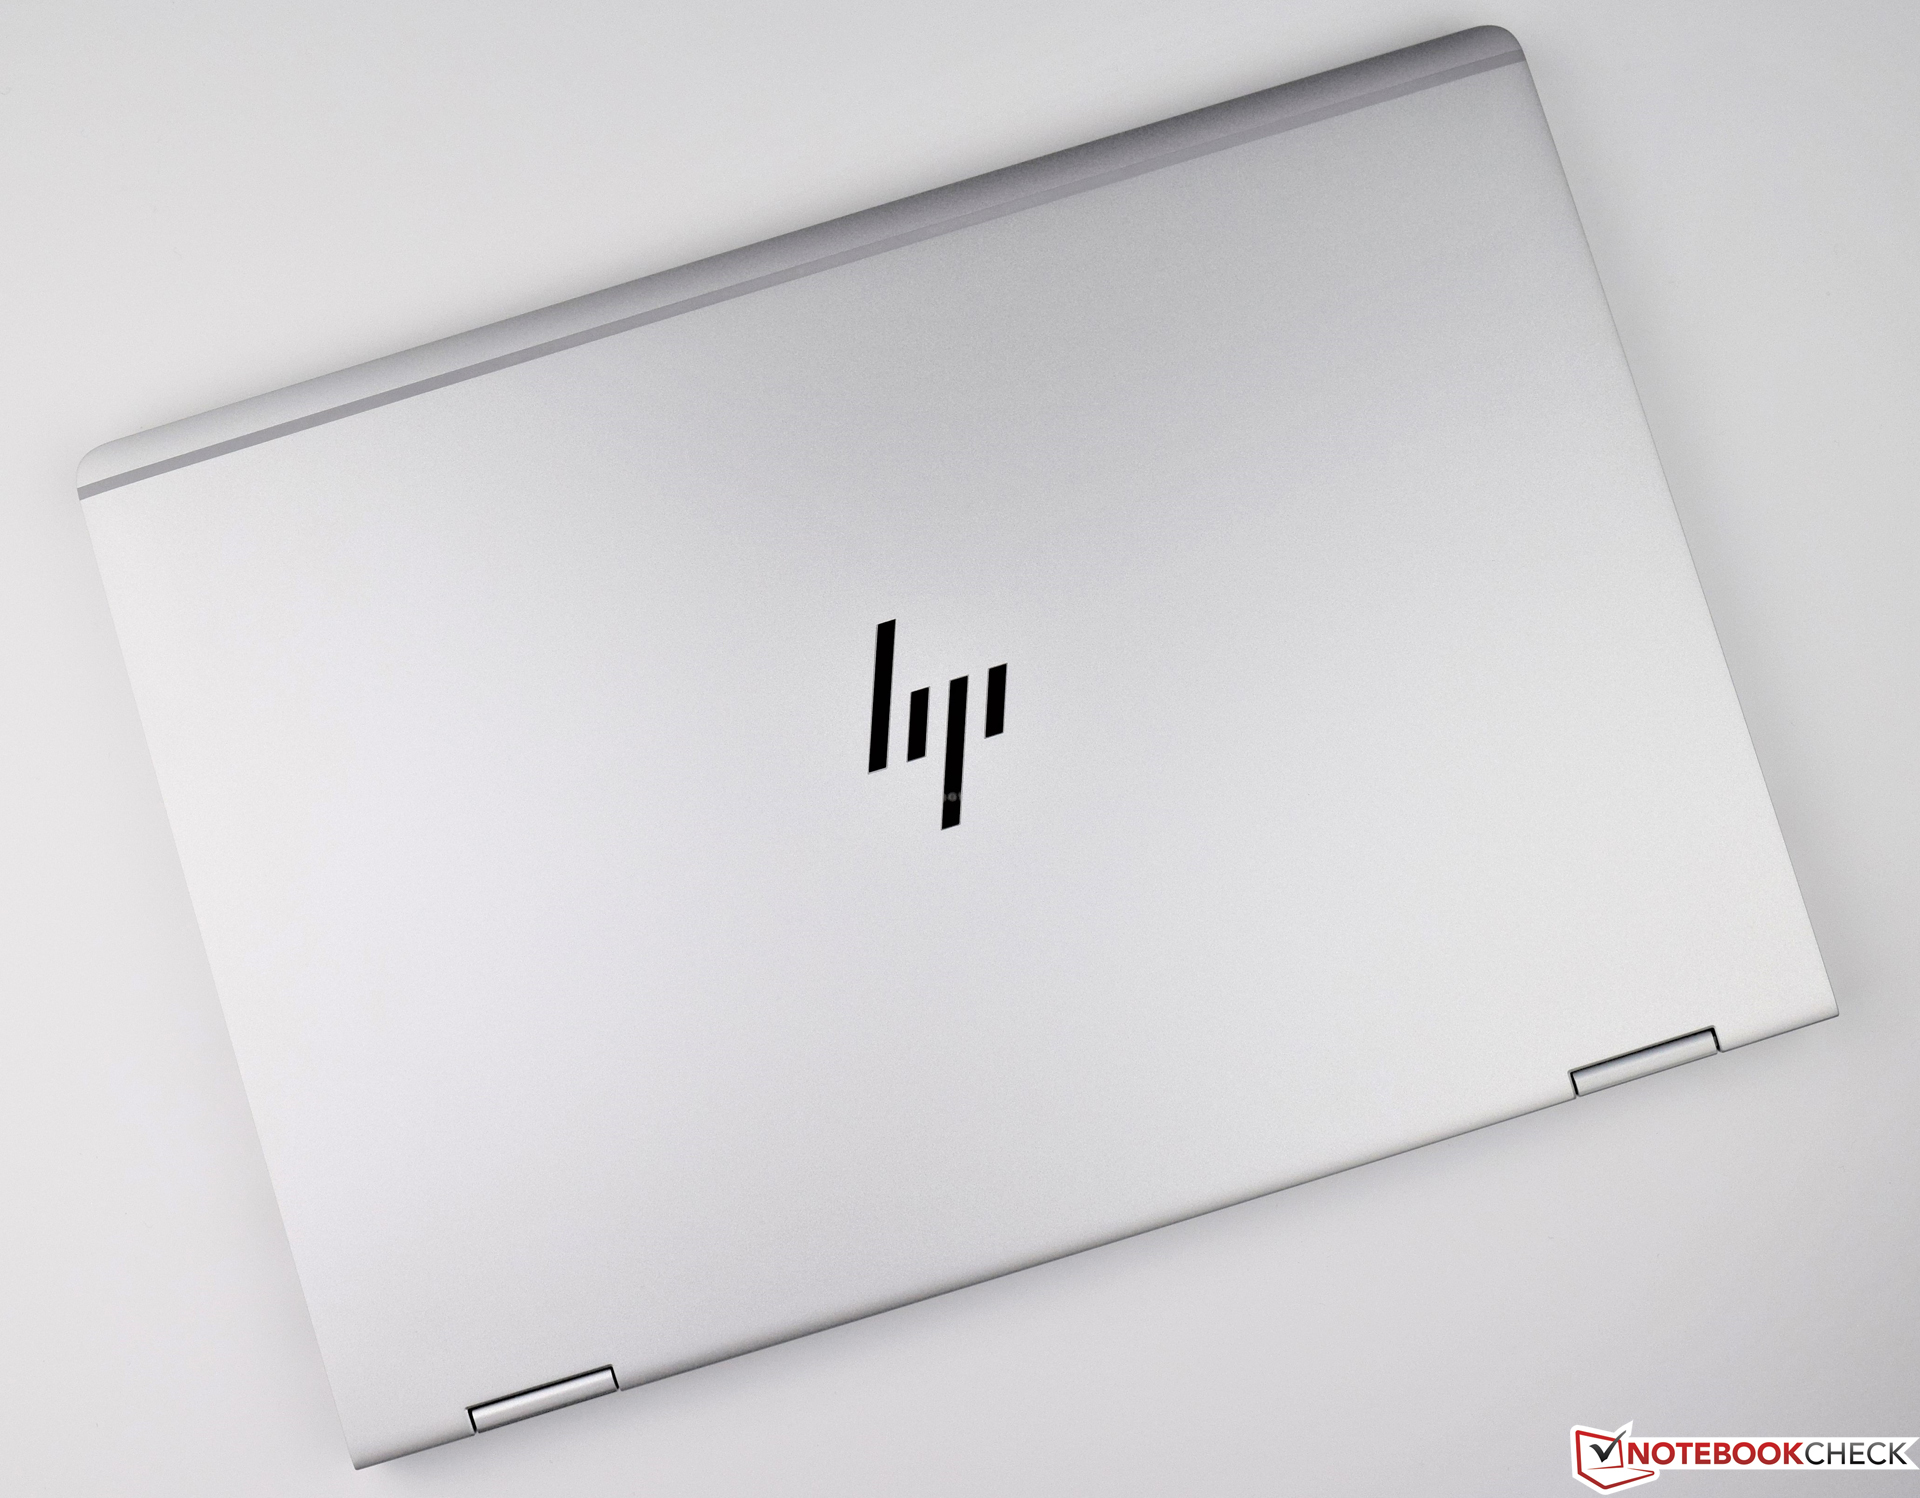
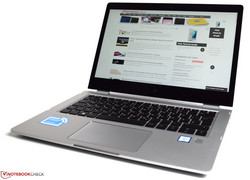
HP EliteBook x360 1030 G2 är mer än en klassisk bärbar dator. Tack vare 360-gradersgångjärnet är enheten extremt flexibel och HP Active Pen släpper loss kreativiteten. De många funktionerna är ett annat stort plus; enheten visar sig vara en bra allrounddator - med undantag för spelprestandan.
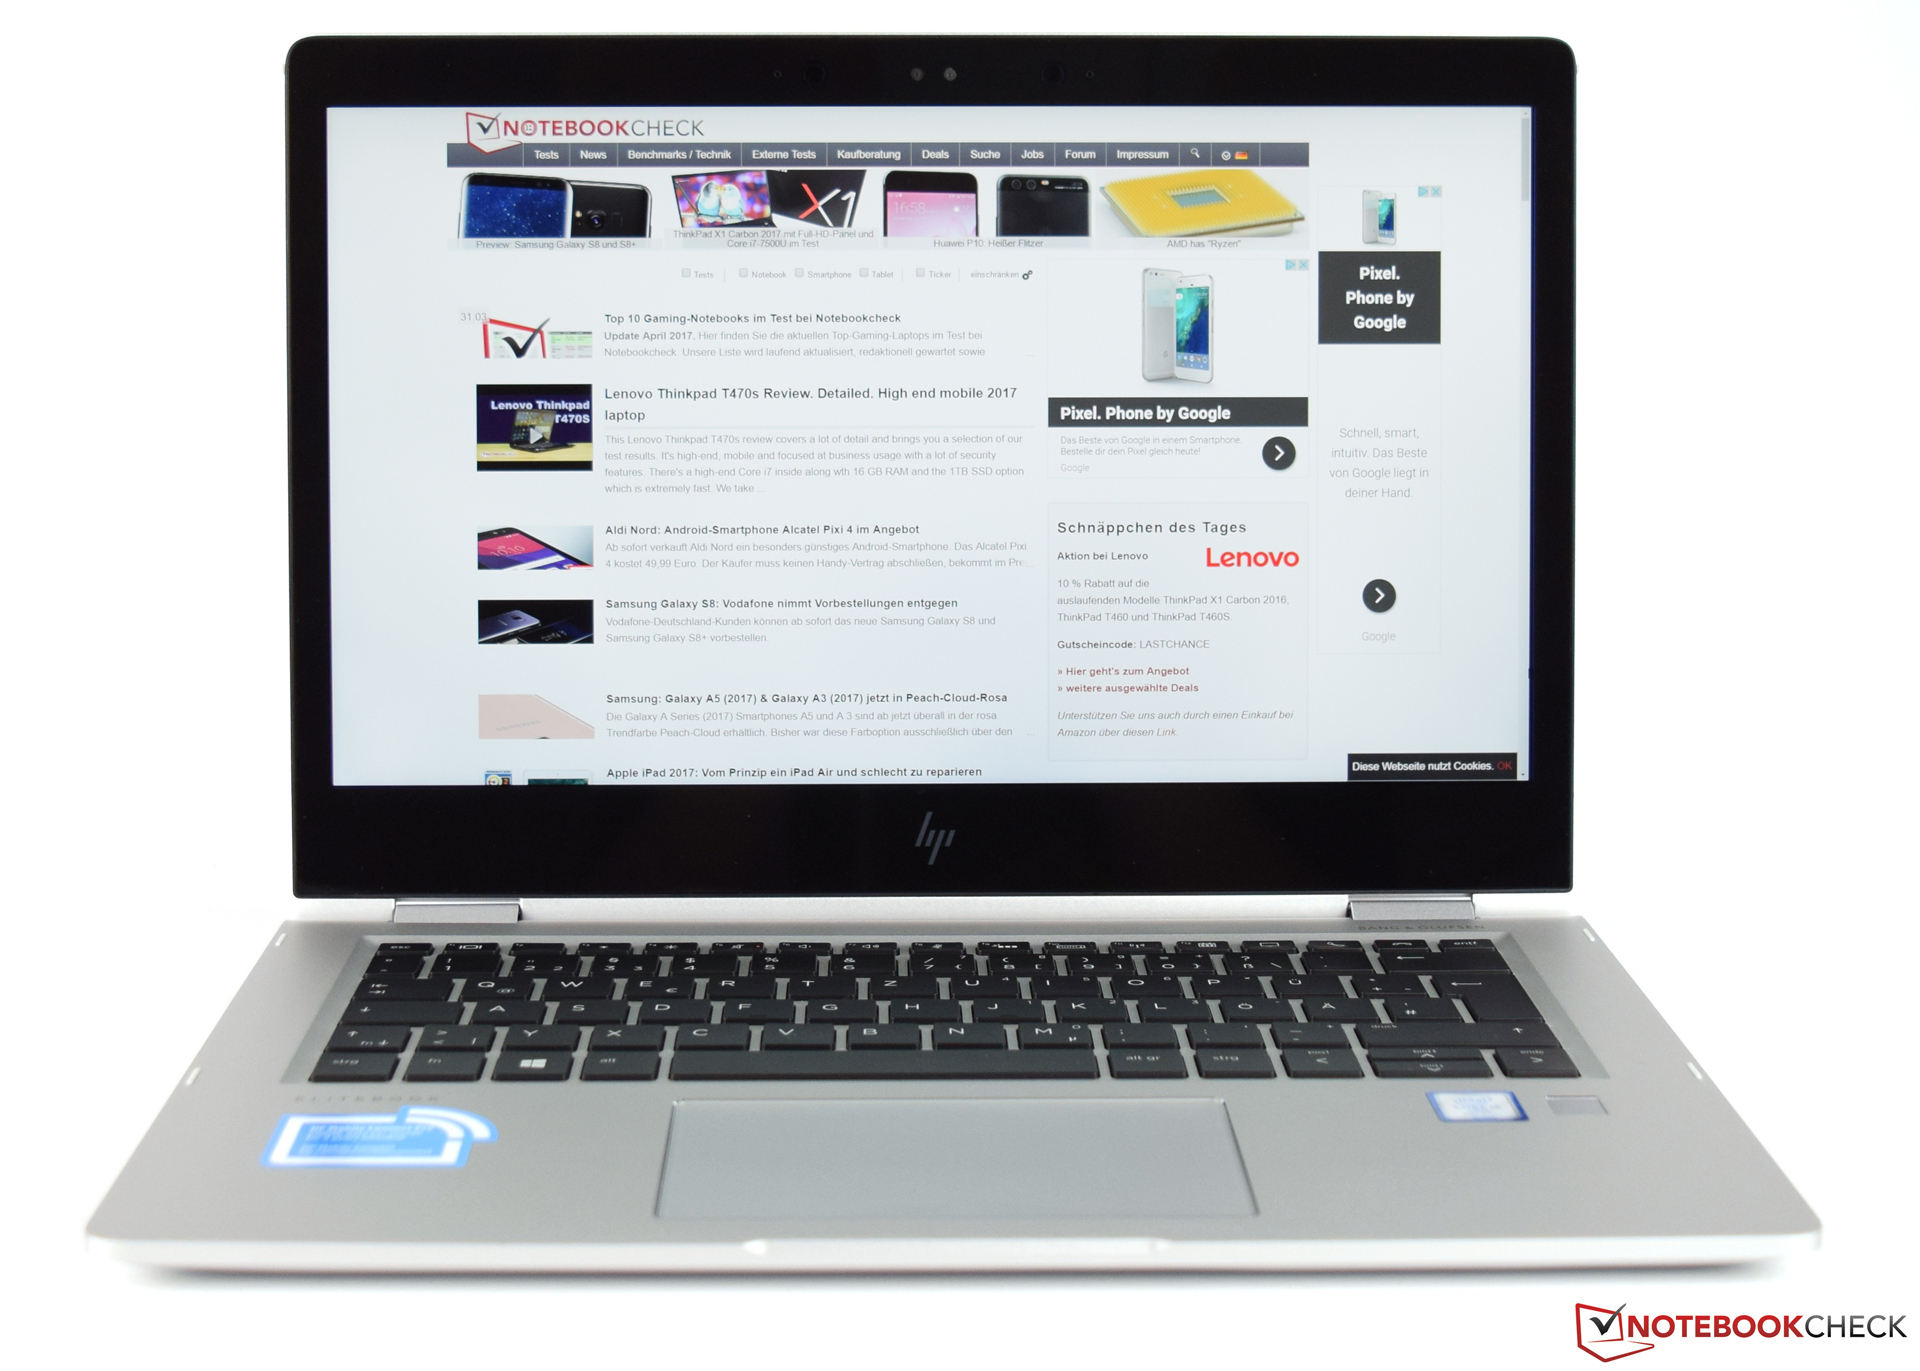
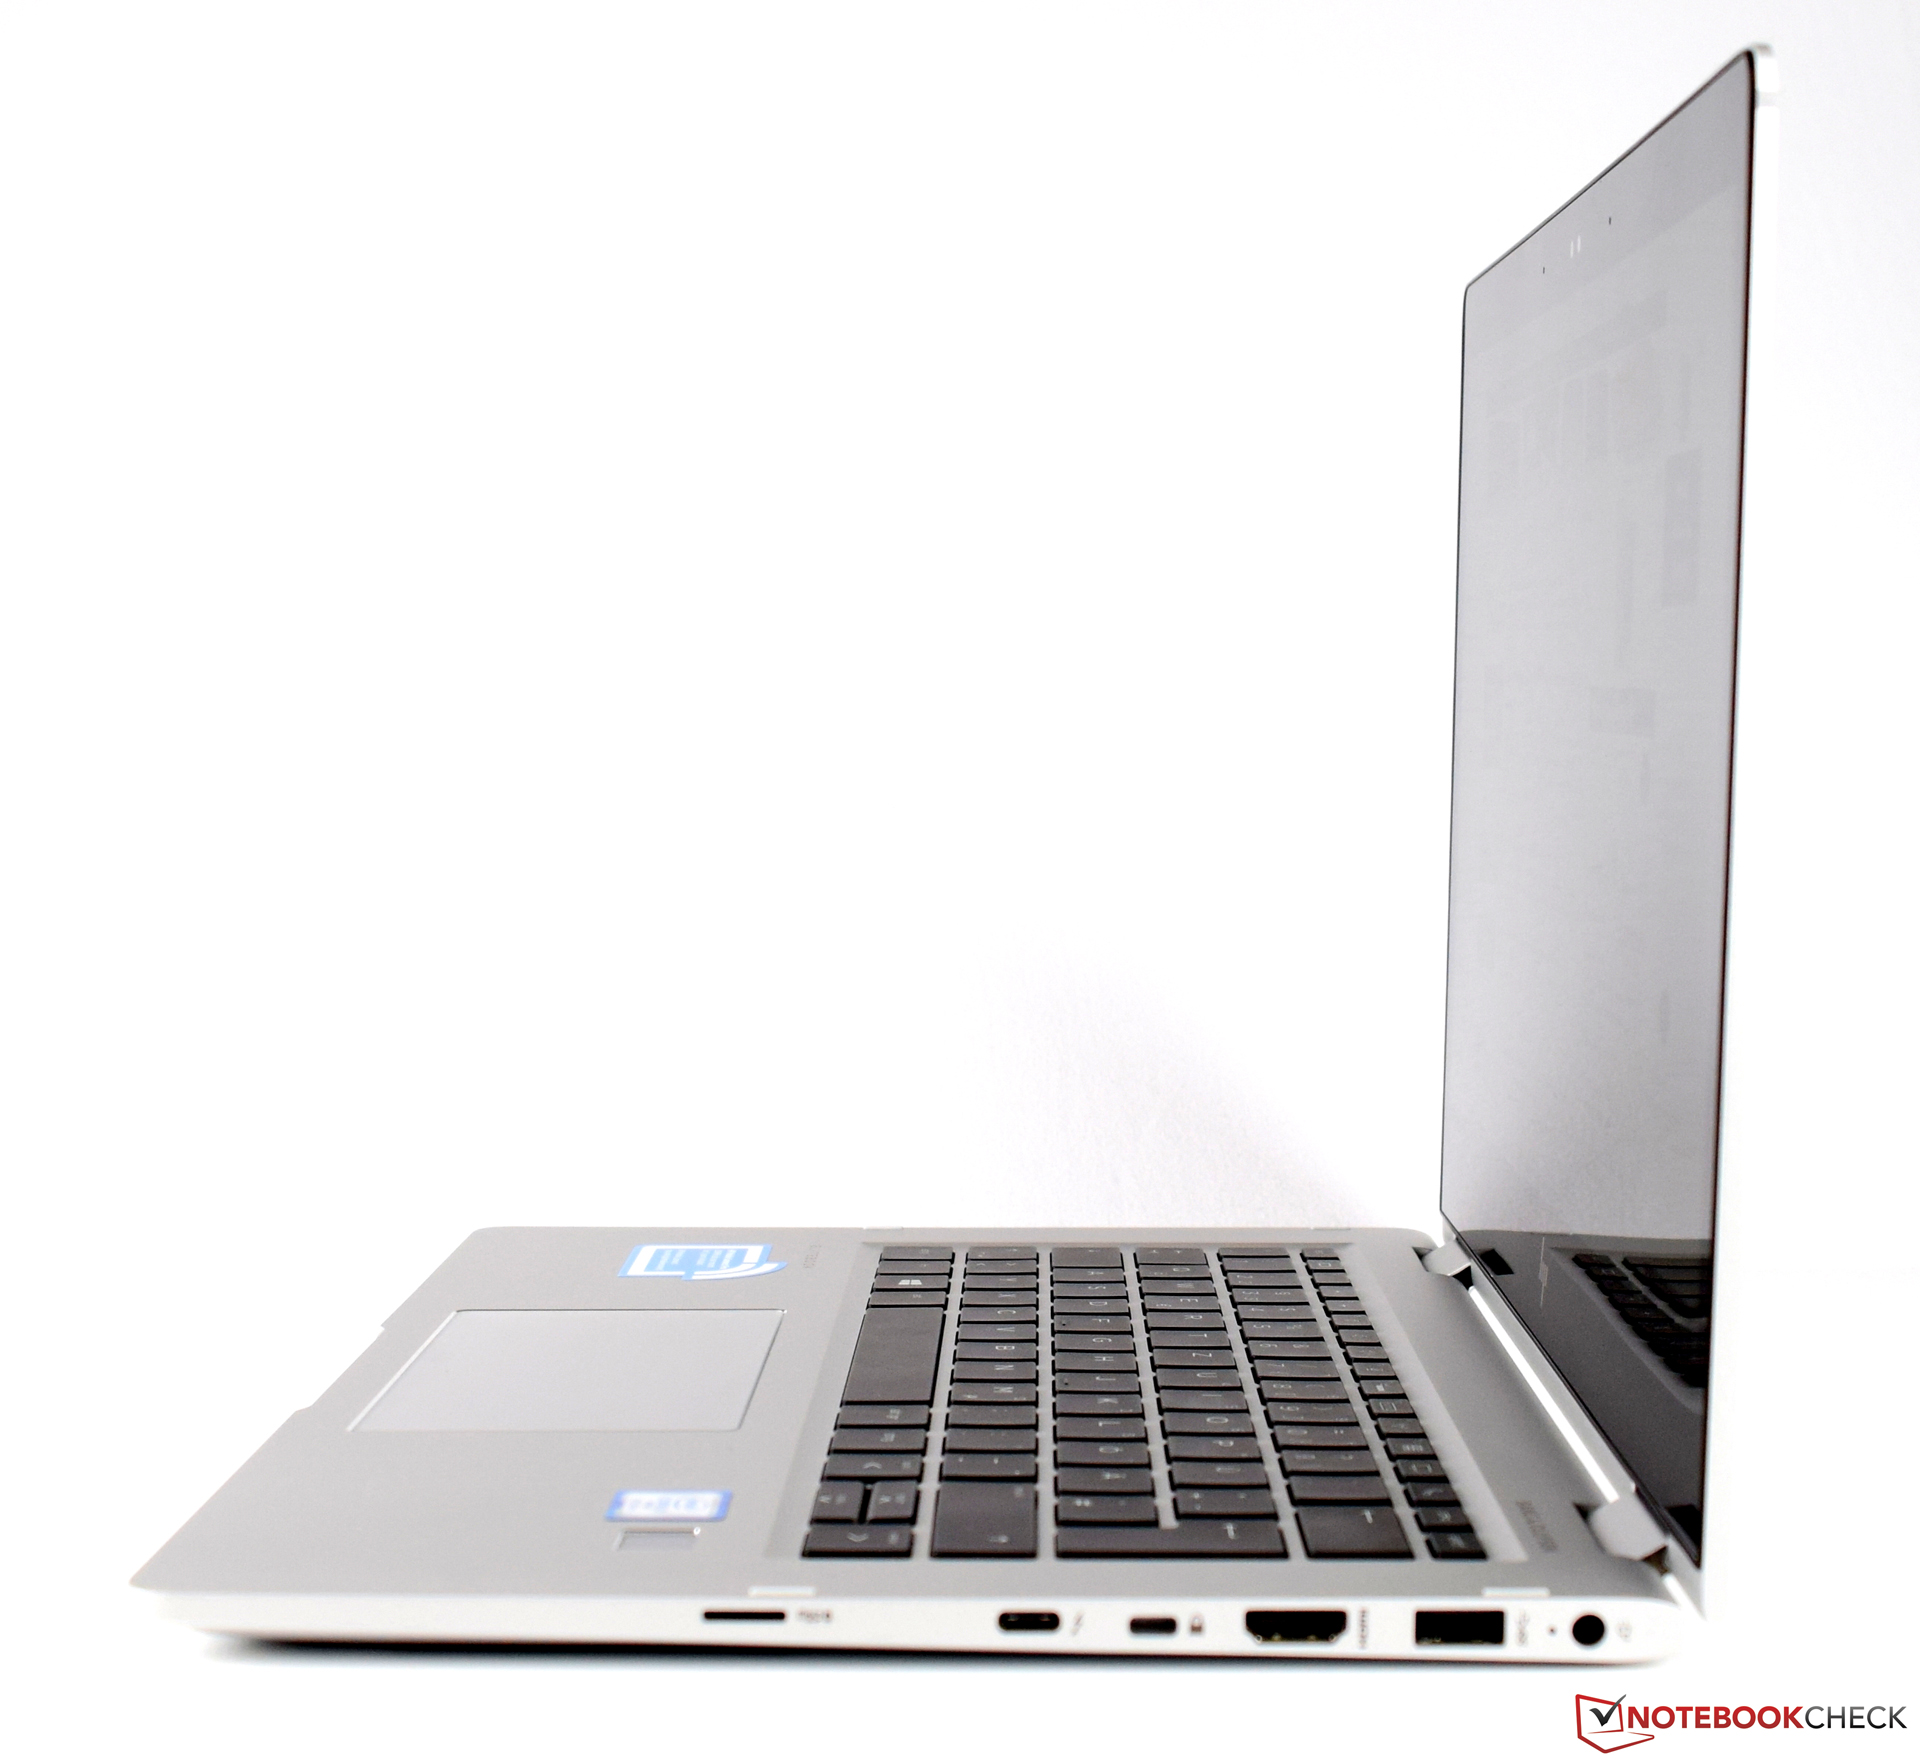
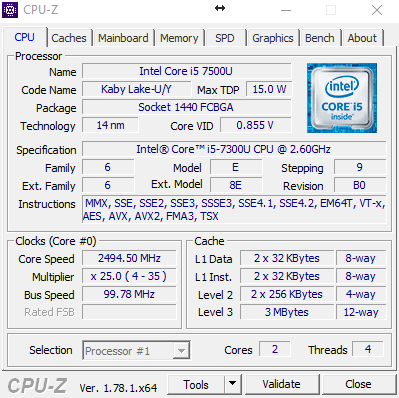
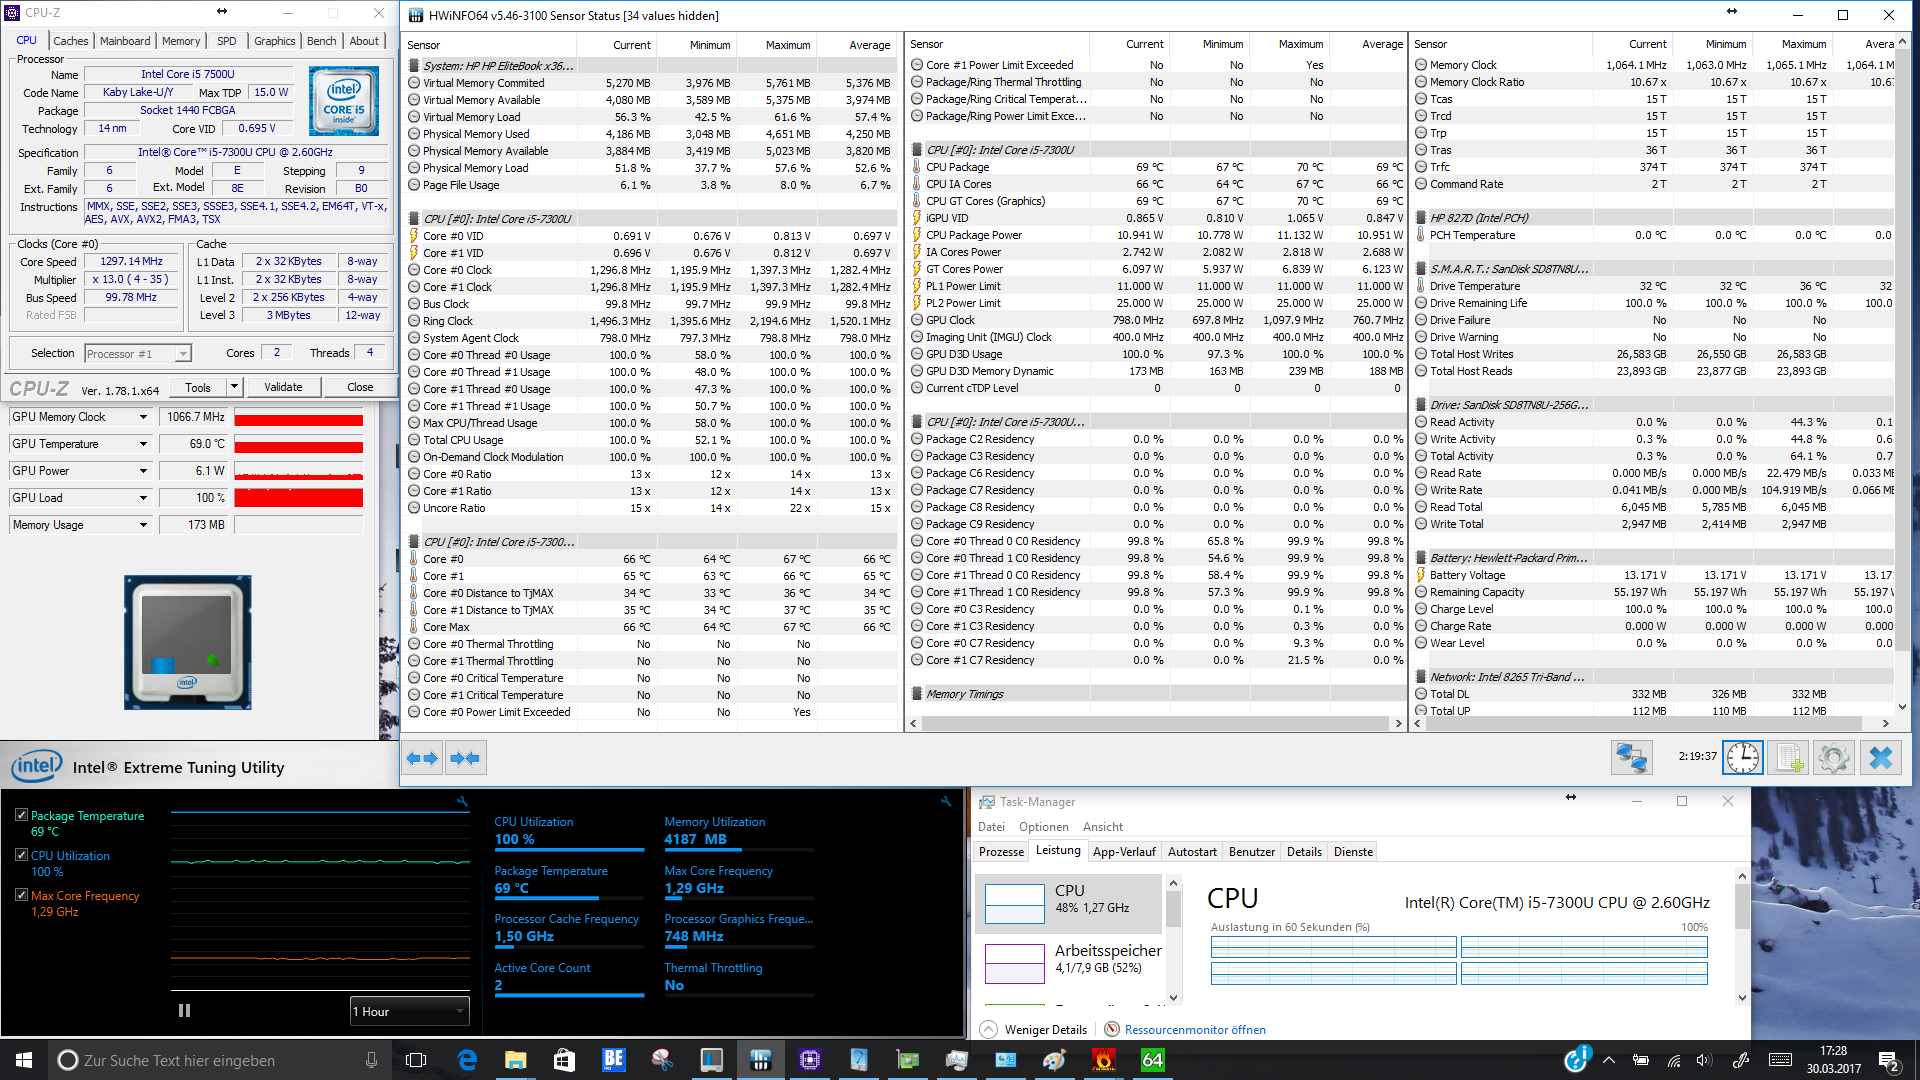
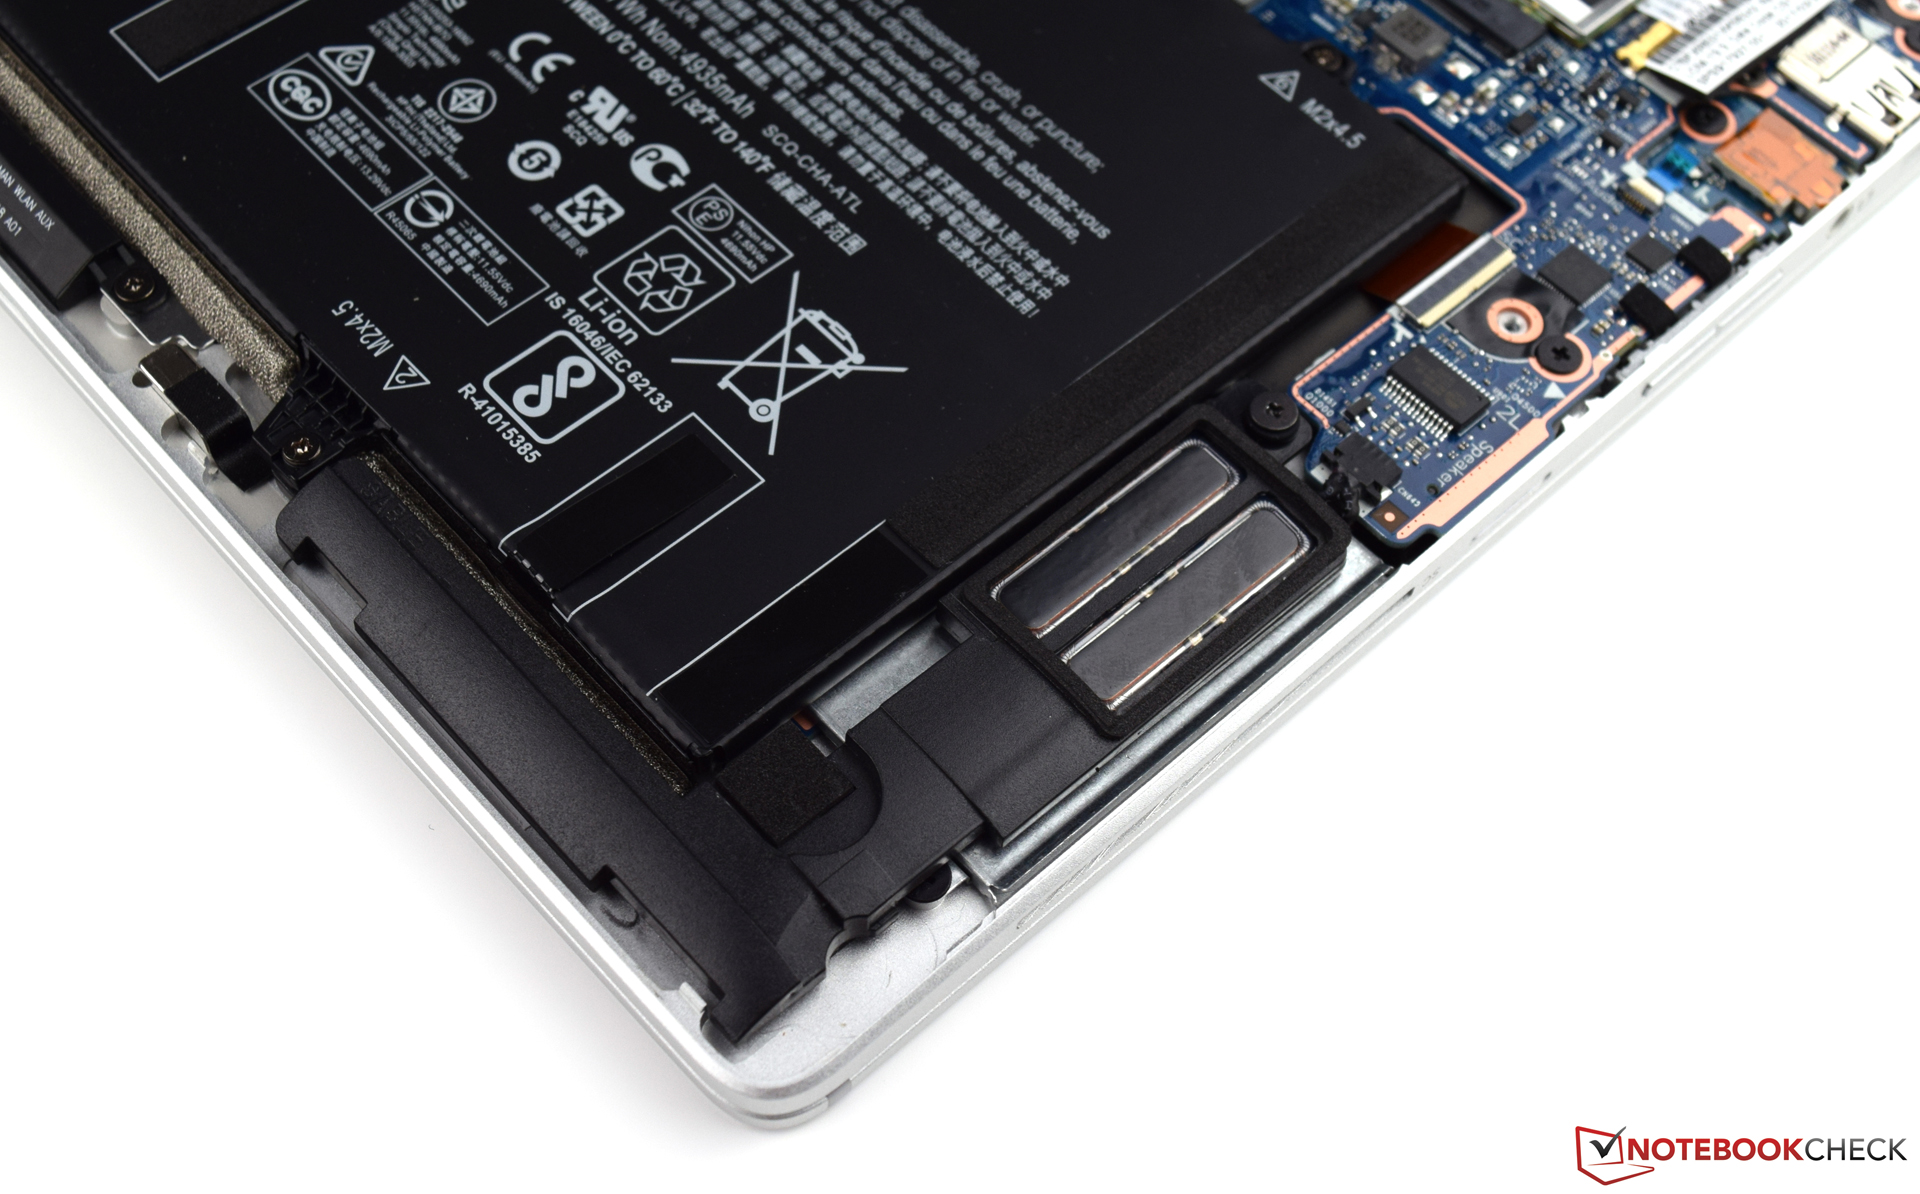
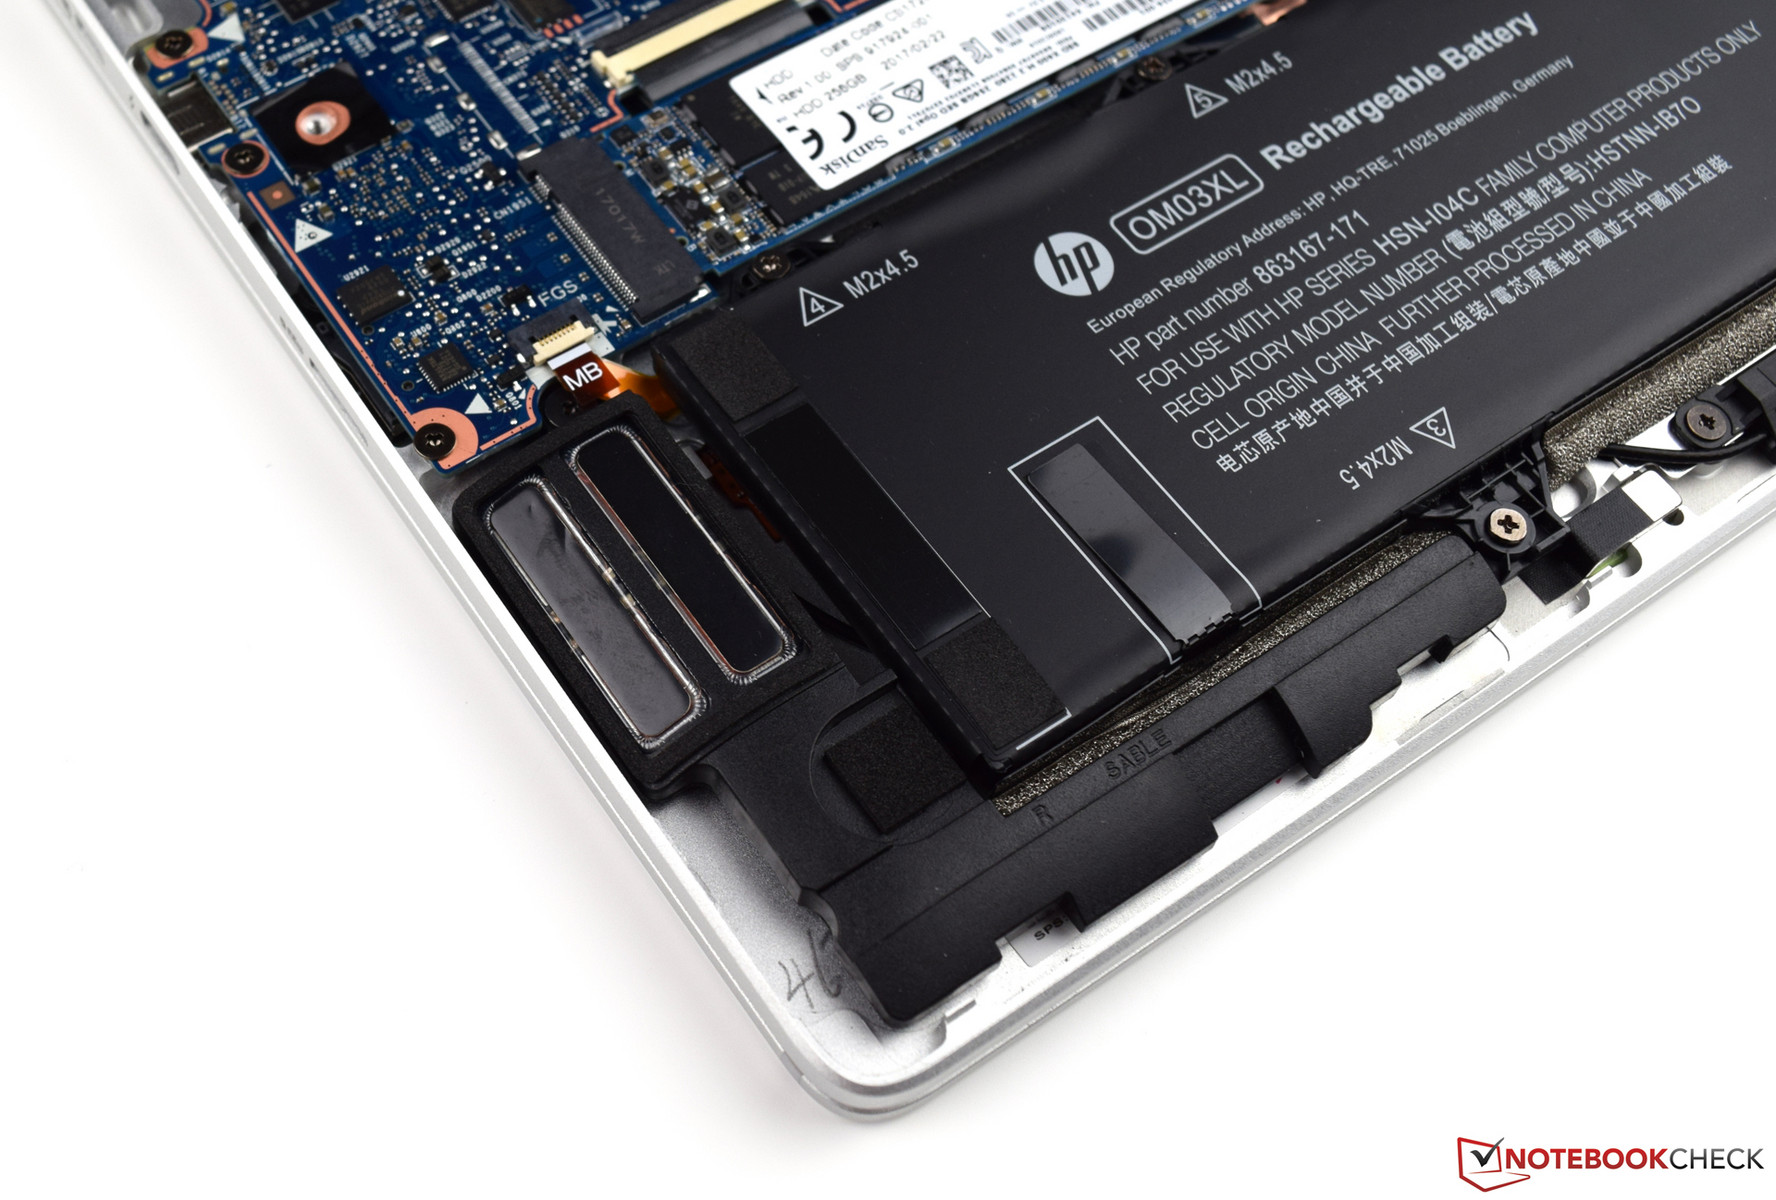
Eftersom den skapades huvudsakligen för företagssegmentet innehåller den en hel del säkerhetsfunktioner, vilket betyder att priset är rätt högt även med den mest grundläggande konfigurationen. Vår testenhet har en Intel Core i5-7300U-processor och 8 GB RAM. SSD:n har en kapacitet på 256 GB och full HD-skärmen svarar väl på inmatning med fingrarna. Den här konfigurationen kan köpas för 2 000 euro i skrivande stund.
Vi har några saker att kritisera. En sak är skärmen, som har bra betraktningsvinklar men medioker ljusstyrka. En annan sak är SSD-prestandan, som ligger under vad man kan förvänta sig av en enhet i den här prisklassen. Det hade varit mer representativt för priset om HP använt en modern NVMe-SSD. Men utöver dessa punkter har HP EliteBook x360 1030 G2 definitivt övertygat oss under testet. Självklart spelade den eleganta och smarta designen också en roll för intrycket.
HP EliteBook x360 1030 G2
- 04/10/2017 v6 (old)
Sebastian Bade