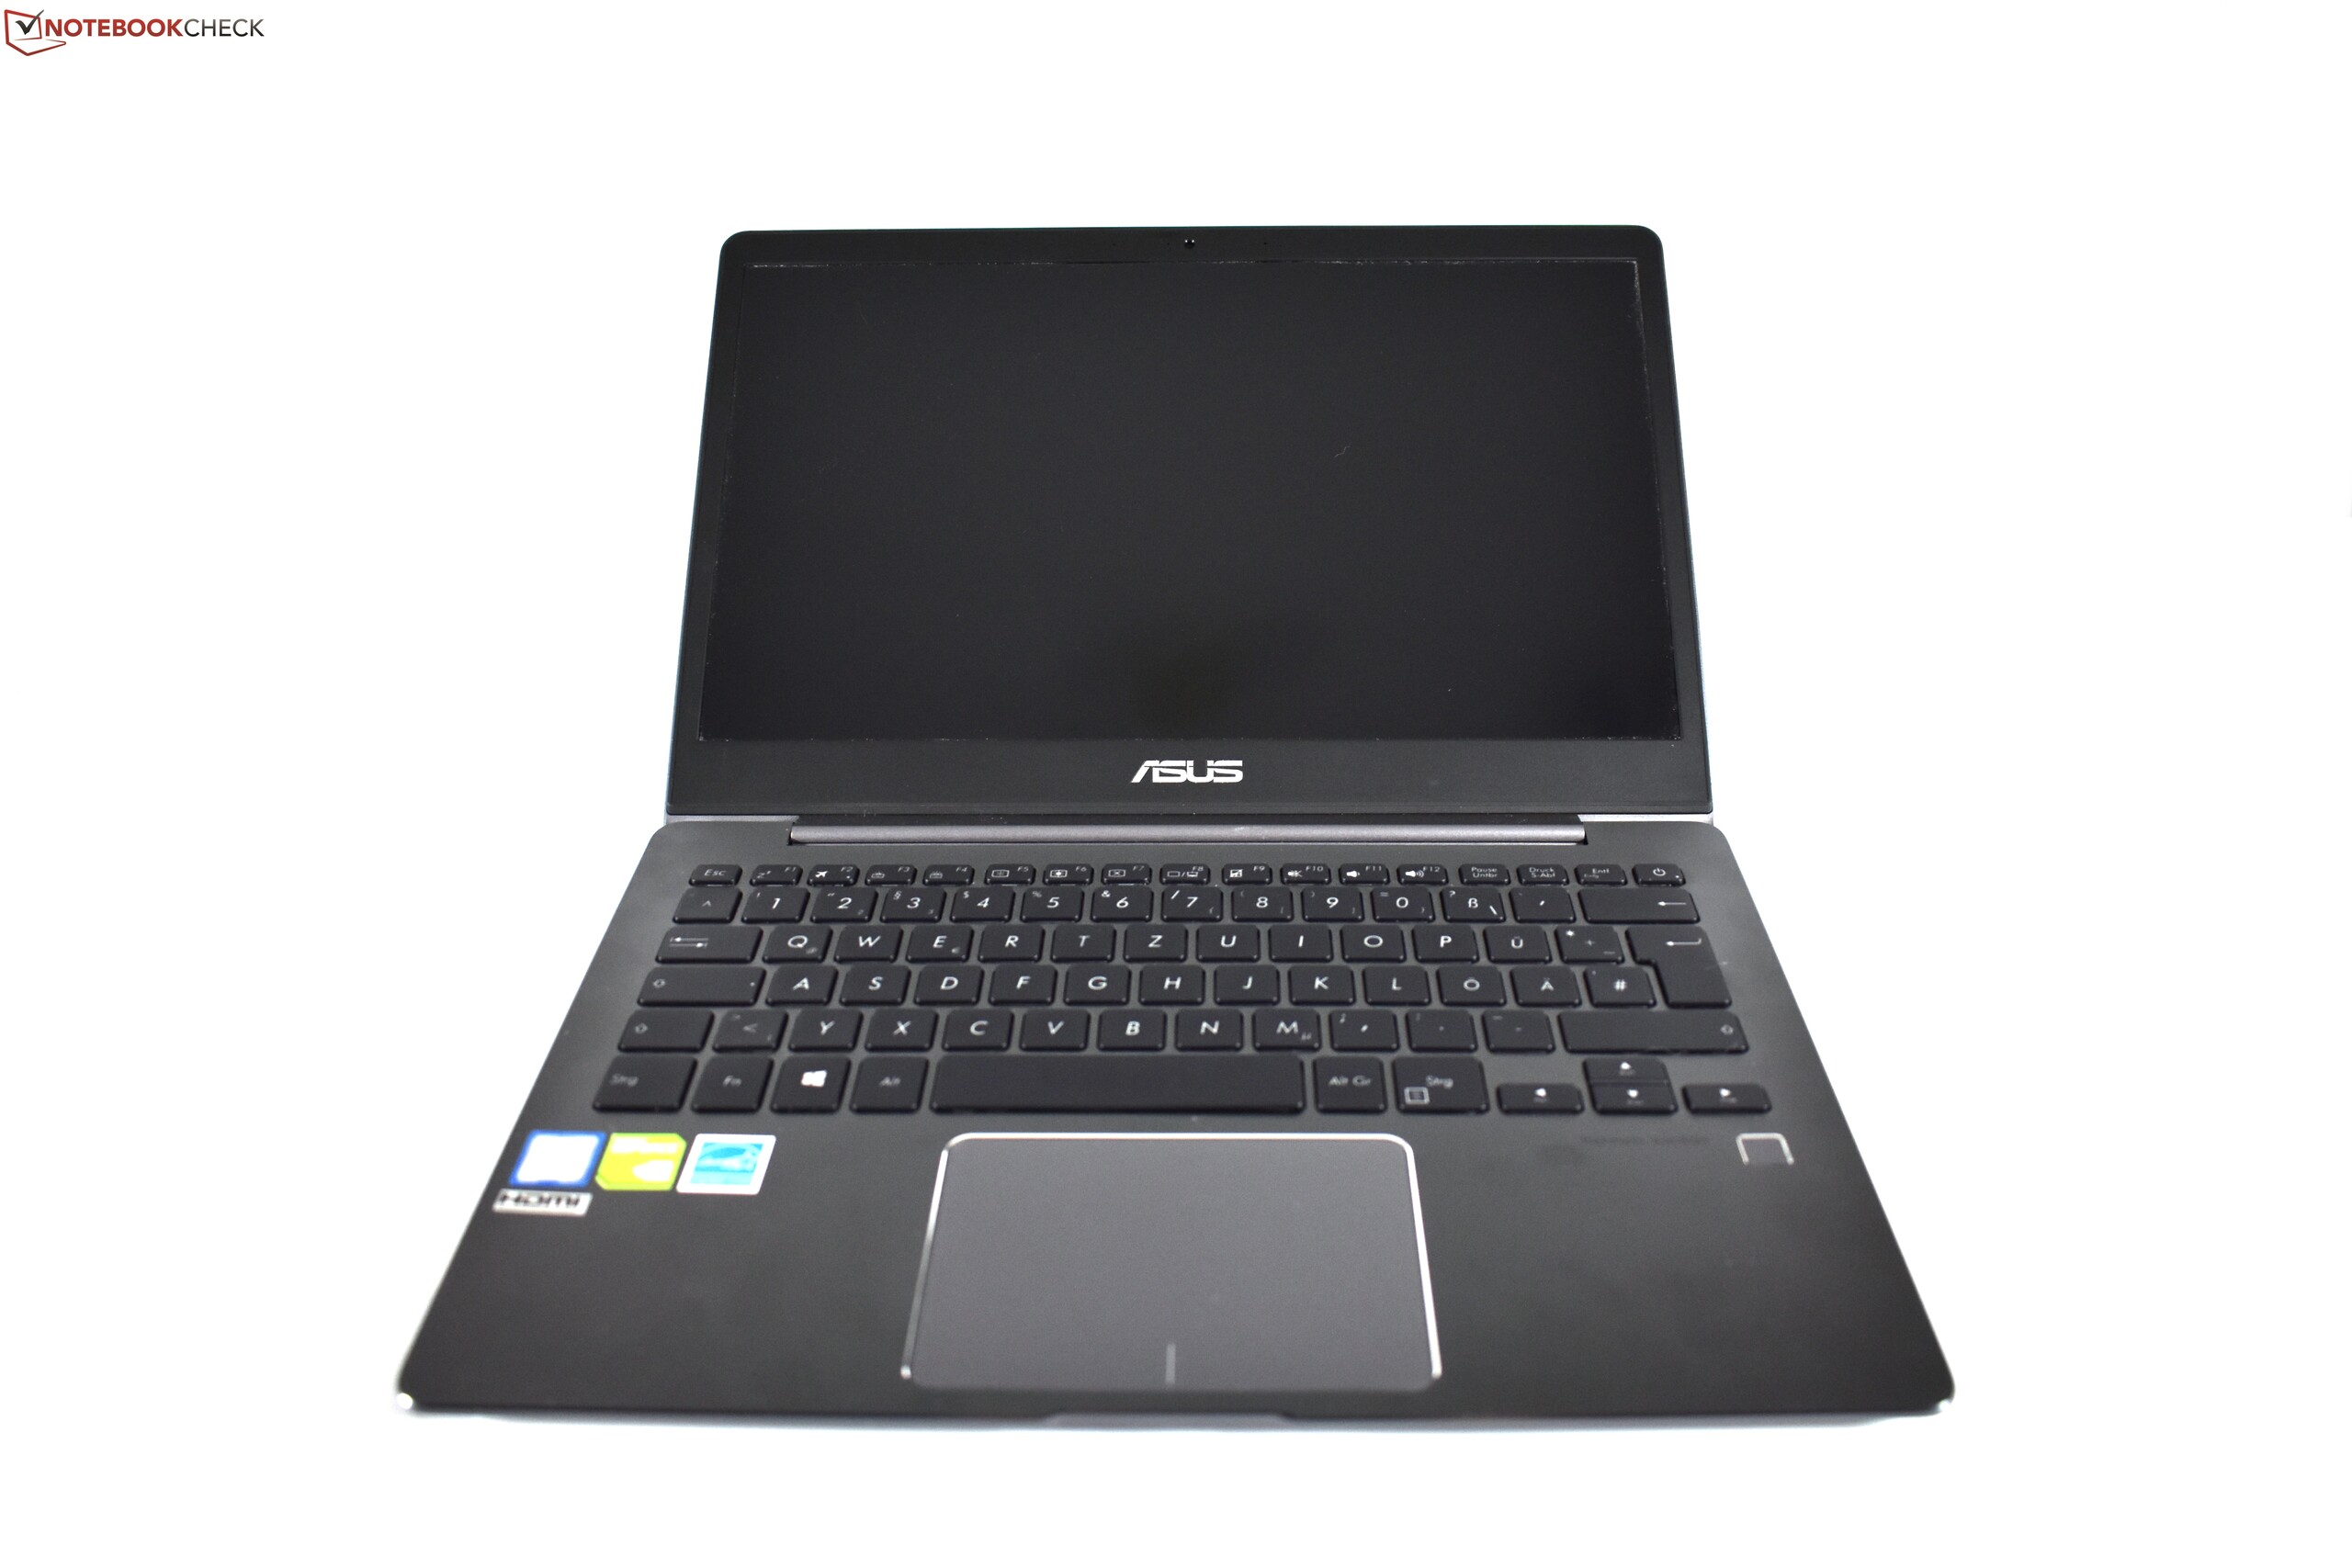
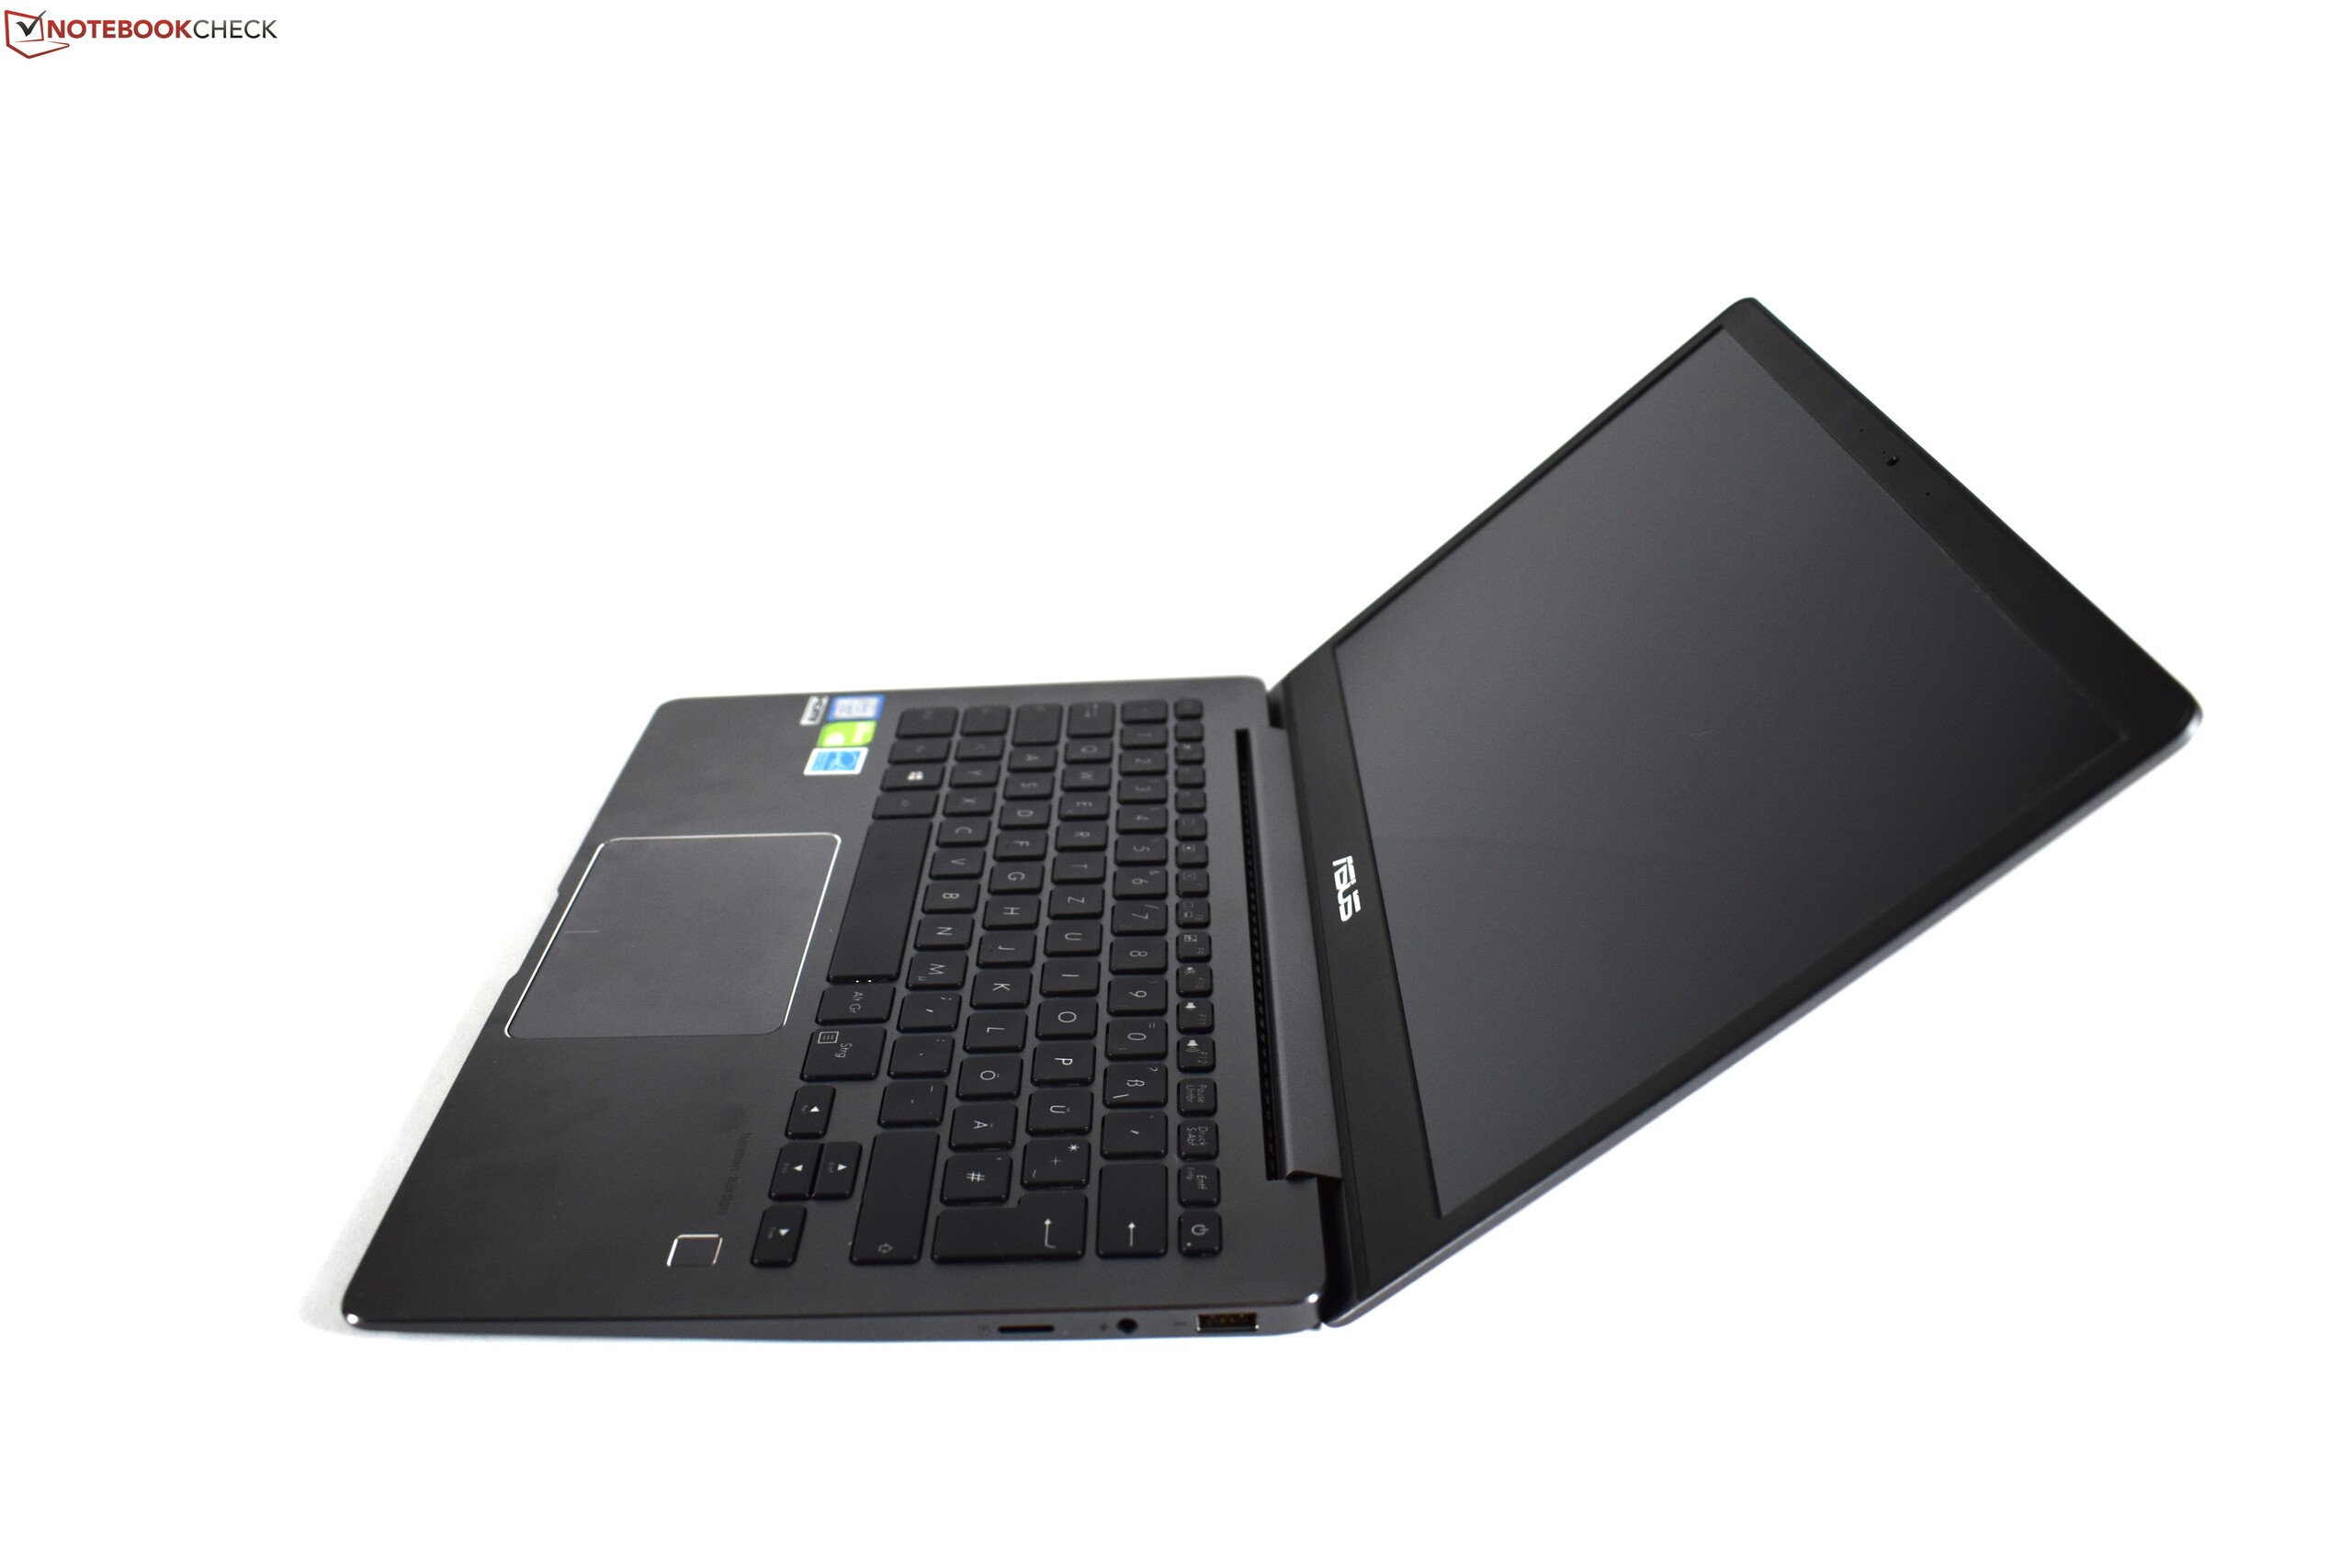
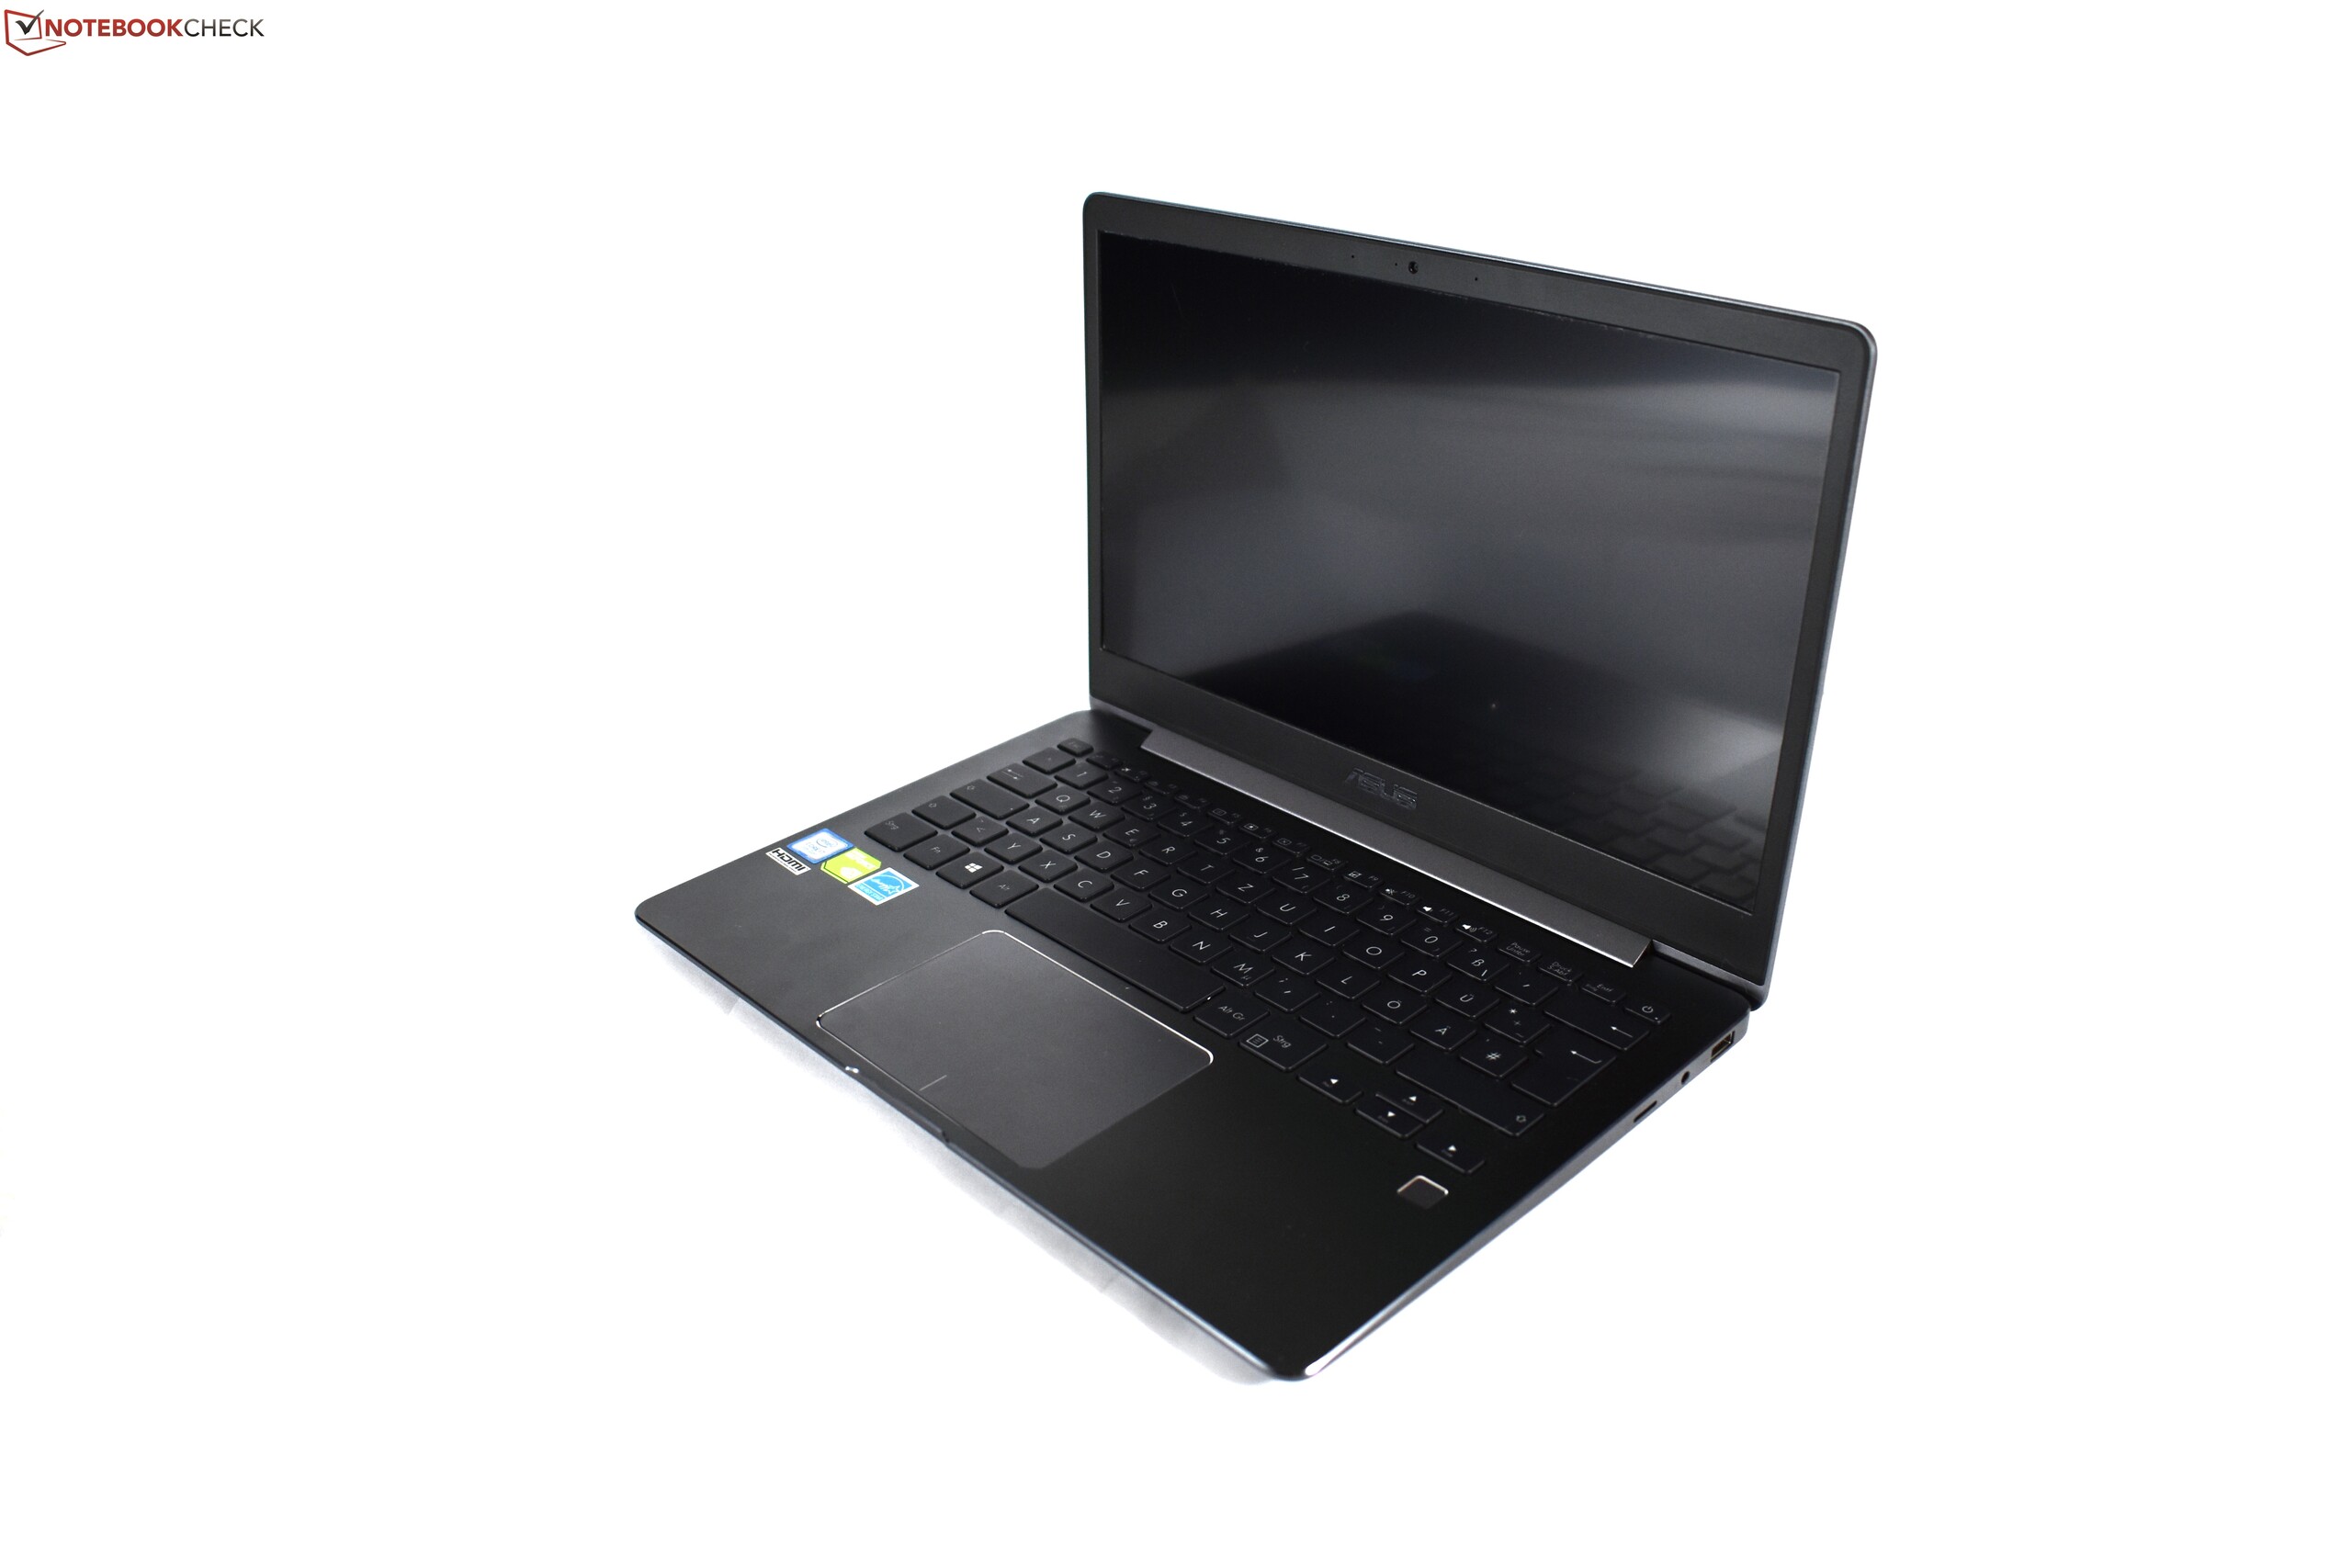
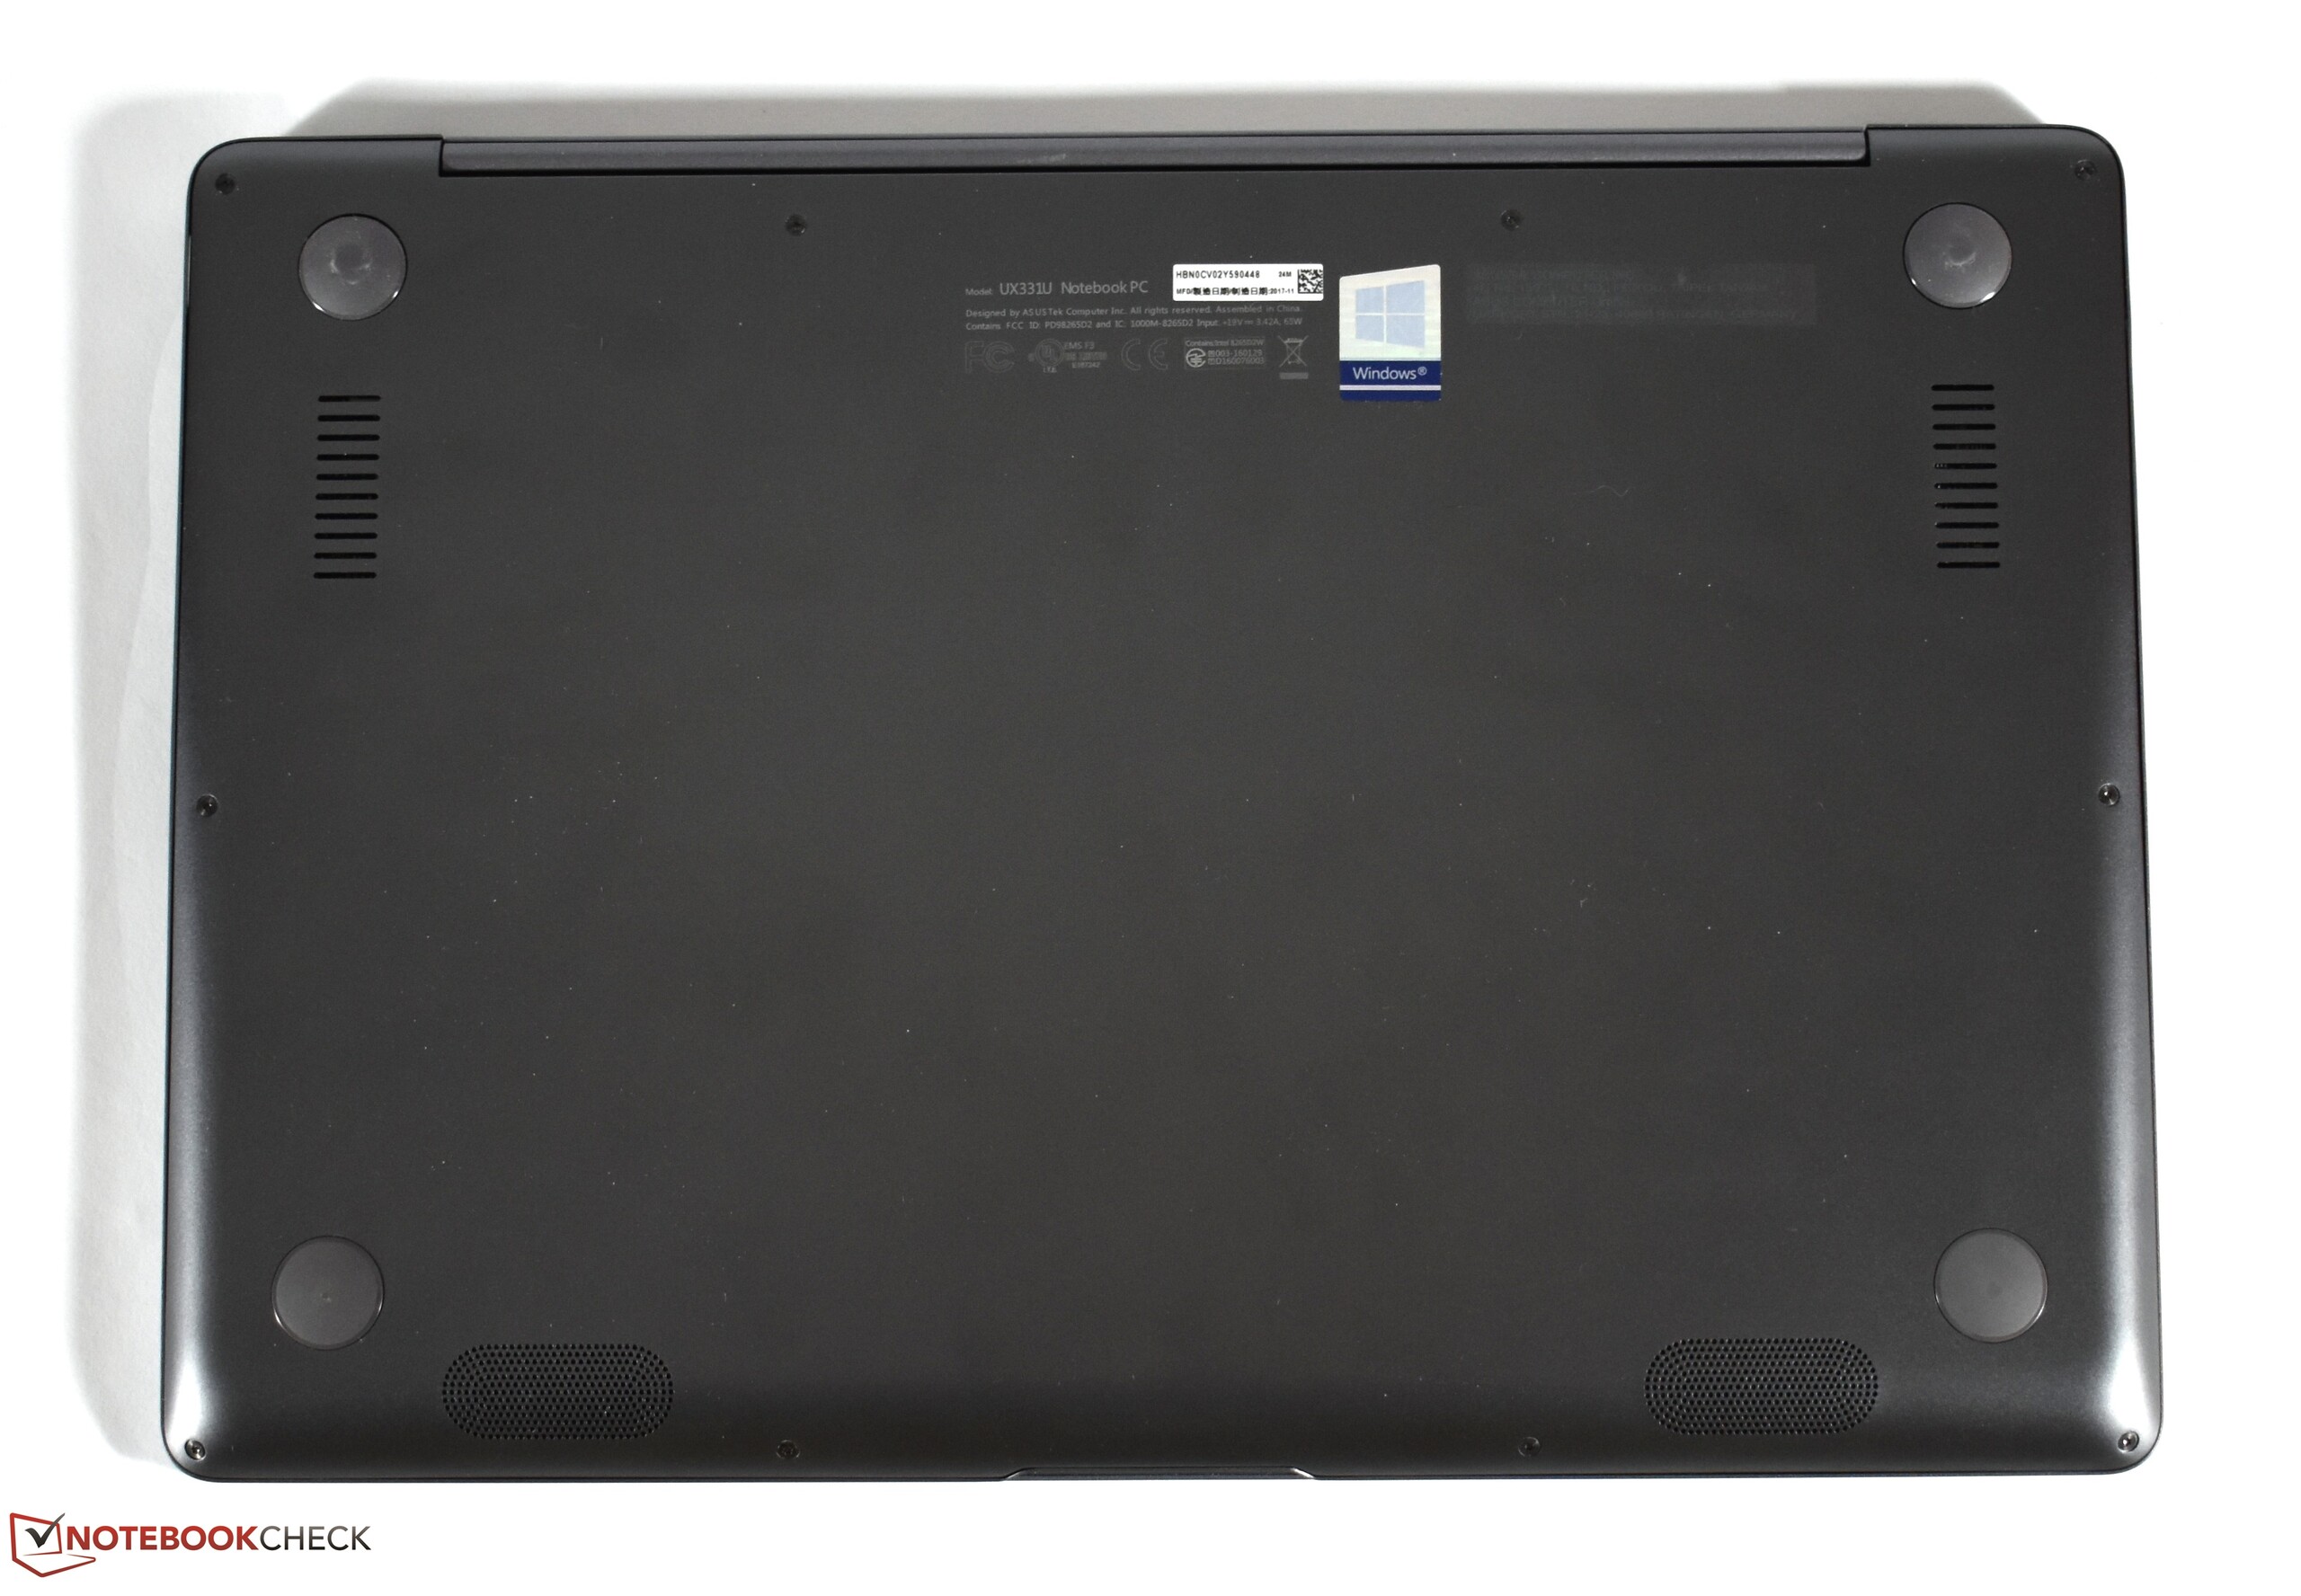
Test: Asus ZenBook 13 UX331UN (i7-8550U, MX150) Laptop (Sammanfattning)
| SD Card Reader | |
| average JPG Copy Test (av. of 3 runs) | |
| Dell XPS 13 i7-8550U | |
| Lenovo IdeaPad 320S-13IKB (Toshiba Exceria Pro M501) | |
| Asus ZenBook 13 UX331UN (Toshiba Exceria Pro M501) | |
| HP Envy 13-ad006ng (Toshiba Exceria Pro SDXC 64 GB UHS-II) | |
| Acer Swift 3 SF314-52G-89SL (Toshiba Exceria Pro SDXC 64 GB UHS-II) | |
| maximum AS SSD Seq Read Test (1GB) | |
| Dell XPS 13 i7-8550U | |
| Lenovo IdeaPad 320S-13IKB (Toshiba Exceria Pro M501) | |
| Asus ZenBook 13 UX331UN (Toshiba Exceria Pro M501) | |
| HP Envy 13-ad006ng (Toshiba Exceria Pro SDXC 64 GB UHS-II) | |
| Acer Swift 3 SF314-52G-89SL (Toshiba Exceria Pro SDXC 64 GB UHS-II) | |
| |||||||||||||||||||||||||
Distribution av ljusstyrkan: 90 %
Mitt på batteriet: 335 cd/m²
Kontrast: 966:1 (Svärta: 0.35 cd/m²)
ΔE ColorChecker Calman: 4.2 | ∀{0.5-29.43 Ø4.72}
ΔE Greyscale Calman: 3.9 | ∀{0.09-98 Ø4.97}
93.1% sRGB (Argyll 1.6.3 3D)
60.4% AdobeRGB 1998 (Argyll 1.6.3 3D)
66.4% AdobeRGB 1998 (Argyll 3D)
93.1% sRGB (Argyll 3D)
65.4% Display P3 (Argyll 3D)
Gamma: 2.43
CCT: 7144 K
| Asus ZenBook 13 UX331UN B133HAN04.9, , 1920x1080, 13.3" | Dell XPS 13 i7-8550U ID: Sharp SHP144A, Name: LQ133Z1, , 3200x1800, 13.3" | HP Envy 13-ad006ng BOE070E, , 1920x1080, 13.3" | Lenovo IdeaPad 320S-13IKB InfoVision M133NWF4R0, , 1920x1080, 13.3" | Acer Swift 3 SF314-52G-89SL AU Optronics B140HAN02.1, , 1920x1080, 14" | Dell XPS 13 9360 FHD i7 Iris SHP1449, , 1920x1080, 13.3" | |
|---|---|---|---|---|---|---|
| Display | -2% | -3% | 3% | -44% | -19% | |
| Display P3 Coverage (%) | 65.4 | 63.6 -3% | 66.8 2% | 66.3 1% | 36.09 -45% | 51.6 -21% |
| sRGB Coverage (%) | 93.1 | 93 0% | 86.3 -7% | 97.4 5% | 54.2 -42% | 77.4 -17% |
| AdobeRGB 1998 Coverage (%) | 66.4 | 65.4 -2% | 63.1 -5% | 68.1 3% | 37.28 -44% | 53.3 -20% |
| Response Times | -23% | -59% | -78% | -32% | -40% | |
| Response Time Grey 50% / Grey 80% * (ms) | 22.4 ? | 35.6 ? -59% | 48 ? -114% | 56.8 ? -154% | 41 ? -83% | 41.2 ? -84% |
| Response Time Black / White * (ms) | 31.2 ? | 27.2 ? 13% | 32 ? -3% | 31.6 ? -1% | 25 ? 20% | 30 ? 4% |
| PWM Frequency (Hz) | 19690 ? | 1000 ? | 198.4 ? | 19530 ? | ||
| Screen | -2% | -12% | 19% | -28% | 5% | |
| Brightness middle (cd/m²) | 338 | 386.1 14% | 281 -17% | 330 -2% | 233 -31% | 461 36% |
| Brightness (cd/m²) | 321 | 357 11% | 264 -18% | 304 -5% | 217 -32% | 418 30% |
| Brightness Distribution (%) | 90 | 83 -8% | 83 -8% | 88 -2% | 88 -2% | 85 -6% |
| Black Level * (cd/m²) | 0.35 | 0.33 6% | 0.23 34% | 0.25 29% | 0.27 23% | 0.2 43% |
| Contrast (:1) | 966 | 1170 21% | 1222 27% | 1320 37% | 863 -11% | 2305 139% |
| Colorchecker dE 2000 * | 4.2 | 4.2 -0% | 4.83 -15% | 1.8 57% | 5.85 -39% | 5.4 -29% |
| Colorchecker dE 2000 max. * | 6.5 | 7.6 -17% | 8.89 -37% | 4.3 34% | 11.51 -77% | 12.2 -88% |
| Greyscale dE 2000 * | 3.9 | 5.7 -46% | 6.63 -70% | 2.5 36% | 4.87 -25% | 5.4 -38% |
| Gamma | 2.43 91% | 2.28 96% | 1.85 119% | 2.11 104% | 2.47 89% | 2.15 102% |
| CCT | 7144 91% | 7336 89% | 6794 96% | 6588 99% | 6908 94% | 7258 90% |
| Color Space (Percent of AdobeRGB 1998) (%) | 60.4 | 59 -2% | 56 -7% | 61.8 2% | 34 -44% | 48.6 -20% |
| Color Space (Percent of sRGB) (%) | 93.1 | 92.2 -1% | 86 -8% | 97.3 5% | 54 -42% | 76.9 -17% |
| Totalt genomsnitt (program/inställningar) | -9% /
-5% | -25% /
-16% | -19% /
3% | -35% /
-32% | -18% /
-6% |
* ... mindre är bättre
Visa svarstider
| ↔ Svarstid svart till vitt | ||
|---|---|---|
| 31.2 ms ... stiga ↗ och falla ↘ kombinerat | ↗ 17.2 ms stiga | 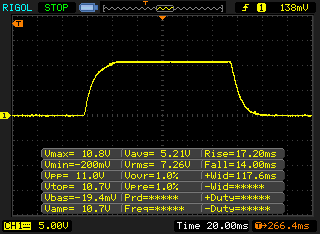 |
| ↘ 14 ms hösten | ||
| Skärmen visar långsamma svarsfrekvenser i våra tester och kommer att vara otillfredsställande för spelare. I jämförelse sträcker sig alla testade enheter från 0.1 (minst) till 240 (maximalt) ms. » 84 % av alla enheter är bättre. Detta innebär att den uppmätta svarstiden är sämre än genomsnittet av alla testade enheter (19.9 ms). | ||
| ↔ Svarstid 50 % grått till 80 % grått | ||
| 22.4 ms ... stiga ↗ och falla ↘ kombinerat | ↗ 10.8 ms stiga | 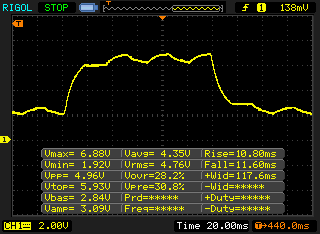 |
| ↘ 11.6 ms hösten | ||
| Skärmen visar bra svarsfrekvens i våra tester, men kan vara för långsam för konkurrenskraftiga spelare. I jämförelse sträcker sig alla testade enheter från 0.165 (minst) till 636 (maximalt) ms. » 34 % av alla enheter är bättre. Det betyder att den uppmätta svarstiden är bättre än genomsnittet av alla testade enheter (31.1 ms). | ||
Skärmflimmer / PWM (Puls-Width Modulation)
| Skärmflimmer / PWM upptäcktes inte |  | ||
Som jämförelse: 52 % av alla testade enheter använder inte PWM för att dämpa skärmen. Om PWM upptäcktes mättes ett medelvärde av 7784 (minst: 5 - maximum: 343500) Hz. | |||
| PCMark 8 | |
| Home Score Accelerated v2 | |
| Acer Swift 3 SF314-52G-89SL | |
| Asus ZenBook 13 UX331UN | |
| Lenovo IdeaPad 320S-13IKB | |
| HP Envy 13-ad006ng | |
| Dell XPS 13 i7-8550U | |
| Work Score Accelerated v2 | |
| Asus ZenBook 13 UX331UN | |
| HP Envy 13-ad006ng | |
| Lenovo IdeaPad 320S-13IKB | |
| Dell XPS 13 i7-8550U | |
| PCMark 10 - Score | |
| Acer Swift 3 SF314-52G-89SL | |
| HP Envy 13-ad006ng | |
| Lenovo IdeaPad 320S-13IKB | |
| Asus ZenBook 13 UX331UN | |
| PCMark 8 Home Score Accelerated v2 | 3899 poäng | |
| PCMark 8 Work Score Accelerated v2 | 5037 poäng | |
| PCMark 10 Score | 3071 poäng | |
Hjälp | ||
| Asus ZenBook 13 UX331UN SanDisk SD8SN8U512G1002 | Dell XPS 13 i7-8550U Toshiba XG5 KXG50ZNV256G | HP Envy 13-ad006ng Toshiba NVMe THNSN5256GPUK | Lenovo IdeaPad 320S-13IKB Samsung PM961 NVMe MZVLW512HMJP | Acer Swift 3 SF314-52G-89SL Intel SSD 600p SSDPEKKW512G7 | |
|---|---|---|---|---|---|
| AS SSD | 58% | 38% | 258% | 108% | |
| Seq Read (MB/s) | 448.2 | 1277 185% | 1369 205% | 2310 415% | 1609 259% |
| Seq Write (MB/s) | 283.3 | 249.2 -12% | 247.8 -13% | 1479 422% | 567 100% |
| 4K Read (MB/s) | 25.47 | 28.17 11% | 31.22 23% | 50.3 97% | 29.55 16% |
| 4K Write (MB/s) | 49.58 | 101.7 105% | 89.4 80% | 127.6 157% | 117.5 137% |
| 4K-64 Read (MB/s) | 362.8 | 423.6 17% | 616 70% | 1226 238% | 506 39% |
| 4K-64 Write (MB/s) | 174.9 | 325.1 86% | 66.7 -62% | 1236 607% | 521 198% |
| Access Time Read * (ms) | 0.143 | 0.102 29% | 0.233 -63% | 0.063 56% | 0.07 51% |
| Access Time Write * (ms) | 0.09 | 0.051 43% | 0.034 62% | 0.029 68% | 0.031 66% |
* ... mindre är bättre

| 3DMark 11 - 1280x720 Performance GPU | |
| Acer Swift 3 SF314-52G-89SL | |
| Asus ZenBook 13 UX331UN | |
| HP Envy 13-ad006ng | |
| Lenovo IdeaPad 320S-13IKB | |
| Dell XPS 13 i7-8550U | |
| 3DMark | |
| 1280x720 Cloud Gate Standard Graphics | |
| Asus ZenBook 13 UX331UN | |
| HP Envy 13-ad006ng | |
| Lenovo IdeaPad 320S-13IKB | |
| Dell XPS 13 i7-8550U | |
| 1920x1080 Fire Strike Graphics | |
| Asus ZenBook 13 UX331UN | |
| HP Envy 13-ad006ng | |
| Lenovo IdeaPad 320S-13IKB | |
| Dell XPS 13 i7-8550U | |
| 3DMark 11 Performance | 3811 poäng | |
| 3DMark Cloud Gate Standard Score | 9861 poäng | |
| 3DMark Fire Strike Score | 2563 poäng | |
Hjälp | ||
| BioShock Infinite - 1920x1080 Ultra Preset, DX11 (DDOF) | |
| Acer Swift 3 SF314-52G-89SL | |
| Asus ZenBook 13 UX331UN | |
| HP Envy 13-ad006ng | |
| HP Envy x360 15m-bq121dx | |
| Dell XPS 13 i7-8550U | |
| The Witcher 3 - 1366x768 Medium Graphics & Postprocessing | |
| Asus ZenBook 13 UX331UN | |
| HP Envy 13-ad006ng | |
| Lenovo IdeaPad 320S-13IKB | |
| låg | med. | hög | ultra | |
|---|---|---|---|---|
| BioShock Infinite (2013) | 101 | 77.9 | 68.5 | 29.91 |
| The Witcher 3 (2015) | 55.1 | 32.44 | 14.1 | 8.9 |
| Doom (2016) | 58.8 | 49.43 | 21.89 |
Ljudnivå
| Låg belastning |
| 29.6 / 29.6 / 29.6 dB(A) |
| Hög belastning |
| 41.7 / 43.5 dB(A) |
 | ||
30 dB tyst 40 dB(A) hörbar 50 dB(A) högt ljud |
||
min: | ||
(±) Den maximala temperaturen på ovansidan är 40.9 °C / 106 F, jämfört med genomsnittet av 35.9 °C / 97 F , allt från 21.4 till 59 °C för klassen Subnotebook.
(+) Botten värms upp till maximalt 38.1 °C / 101 F, jämfört med genomsnittet av 39.2 °C / 103 F
(+) Vid tomgångsbruk är medeltemperaturen för ovansidan 23.1 °C / 74 F, jämfört med enhetsgenomsnittet på 30.8 °C / ### class_avg_f### F.
(±) När du spelar The Witcher 3 är medeltemperaturen för ovansidan 34.8 °C / 95 F, jämfört med enhetsgenomsnittet på 30.8 °C / ## #class_avg_f### F.
(+) Handledsstöden och pekplattan är kallare än hudtemperaturen med maximalt 28.6 °C / 83.5 F och är därför svala att ta på.
(±) Medeltemperaturen för handledsstödsområdet på liknande enheter var 28.2 °C / 82.8 F (-0.4 °C / -0.7 F).
Asus ZenBook 13 UX331UN ljudanalys
(+) | högtalare kan spela relativt högt (82.8 dB)
Bas 100 - 315 Hz
(-) | nästan ingen bas - i genomsnitt 16.9% lägre än medianen
(±) | linjäriteten för basen är genomsnittlig (9% delta till föregående frekvens)
Mellan 400 - 2000 Hz
(+) | balanserad mellan - endast 4.3% från medianen
(+) | mids är linjära (4.2% delta till föregående frekvens)
Högsta 2 - 16 kHz
(+) | balanserade toppar - endast 1.8% från medianen
(+) | toppar är linjära (3.4% delta till föregående frekvens)
Totalt 100 - 16 000 Hz
(+) | det totala ljudet är linjärt (14.4% skillnad mot median)
Jämfört med samma klass
» 29% av alla testade enheter i den här klassen var bättre, 6% liknande, 66% sämre
» Den bästa hade ett delta på 5%, genomsnittet var 18%, sämst var 53%
Jämfört med alla testade enheter
» 18% av alla testade enheter var bättre, 4% liknande, 78% sämre
» Den bästa hade ett delta på 4%, genomsnittet var 24%, sämst var 134%
Dell XPS 13 i7-8550U ljudanalys
(-) | inte särskilt höga högtalare (66.8 dB)
Bas 100 - 315 Hz
(+) | bra bas - bara 4.5% från medianen
(±) | linjäriteten för basen är genomsnittlig (8.2% delta till föregående frekvens)
Mellan 400 - 2000 Hz
(±) | högre mellan - i genomsnitt 5% högre än median
(+) | mids är linjära (5.8% delta till föregående frekvens)
Högsta 2 - 16 kHz
(+) | balanserade toppar - endast 3% från medianen
(±) | linjäriteten för toppar är genomsnittlig (14.5% delta till föregående frekvens)
Totalt 100 - 16 000 Hz
(±) | linjäriteten för det totala ljudet är genomsnittlig (17.2% skillnad mot median)
Jämfört med samma klass
» 44% av alla testade enheter i den här klassen var bättre, 9% liknande, 47% sämre
» Den bästa hade ett delta på 5%, genomsnittet var 18%, sämst var 53%
Jämfört med alla testade enheter
» 32% av alla testade enheter var bättre, 8% liknande, 60% sämre
» Den bästa hade ett delta på 4%, genomsnittet var 24%, sämst var 134%
| Av/Standby | |
| Låg belastning | |
| Hög belastning |
|
Förklaring:
min: | |
| Asus ZenBook 13 UX331UN i5-8550U, GeForce MX150, SanDisk SD8SN8U512G1002, IPS LED, 1920x1080, 13.3" | Dell XPS 13 i7-8550U i5-8550U, UHD Graphics 620, Toshiba XG5 KXG50ZNV256G, IGZO IPS, 3200x1800, 13.3" | HP Envy 13-ad006ng i7-7500U, GeForce MX150, Toshiba NVMe THNSN5256GPUK, IPS LED, 1920x1080, 13.3" | Lenovo IdeaPad 320S-13IKB i5-8250U, GeForce MX150, Samsung PM961 NVMe MZVLW512HMJP, IPS LED, 1920x1080, 13.3" | Acer Swift 3 SF314-52G-89SL i5-8550U, GeForce MX150, Intel SSD 600p SSDPEKKW512G7, IPS, 1920x1080, 14" | |
|---|---|---|---|---|---|
| Power Consumption | -8% | -9% | -17% | -36% | |
| Idle Minimum * (Watt) | 2.7 | 4.1 -52% | 2.8 -4% | 3.4 -26% | 4.4 -63% |
| Idle Average * (Watt) | 5.3 | 5.8 -9% | 5.8 -9% | 6.1 -15% | 6.6 -25% |
| Idle Maximum * (Watt) | 6.2 | 6 3% | 7.7 -24% | 7.7 -24% | 9.2 -48% |
| Load Average * (Watt) | 37.6 | 42.5 -13% | 48 -28% | 44.2 -18% | 61 -62% |
| Load Maximum * (Watt) | 60.1 | 41.4 31% | 48 20% | 60.3 -0% | 50 17% |
| Witcher 3 ultra * (Watt) | 35 | 37.6 | 40 |
* ... mindre är bättre
| Asus ZenBook 13 UX331UN i5-8550U, GeForce MX150, 50 Wh | Dell XPS 13 i7-8550U i5-8550U, UHD Graphics 620, 60 Wh | HP Envy 13-ad006ng i7-7500U, GeForce MX150, 51 Wh | Lenovo IdeaPad 320S-13IKB i5-8250U, GeForce MX150, 36 Wh | Acer Swift 3 SF314-52G-89SL i5-8550U, GeForce MX150, 48 Wh | |
|---|---|---|---|---|---|
| Batteridrifttid | 7% | -11% | -39% | -7% | |
| Reader / Idle (h) | 22 | 18.5 -16% | 20 -9% | 12.3 -44% | |
| H.264 (h) | 9.6 | 7.9 -18% | 5.8 -40% | ||
| WiFi v1.3 (h) | 8.4 | 9.8 17% | 7.1 -15% | 5.7 -32% | 7.8 -7% |
| Load (h) | 2 | 2.4 20% | 2 0% | 1.2 -40% |
För
Emot

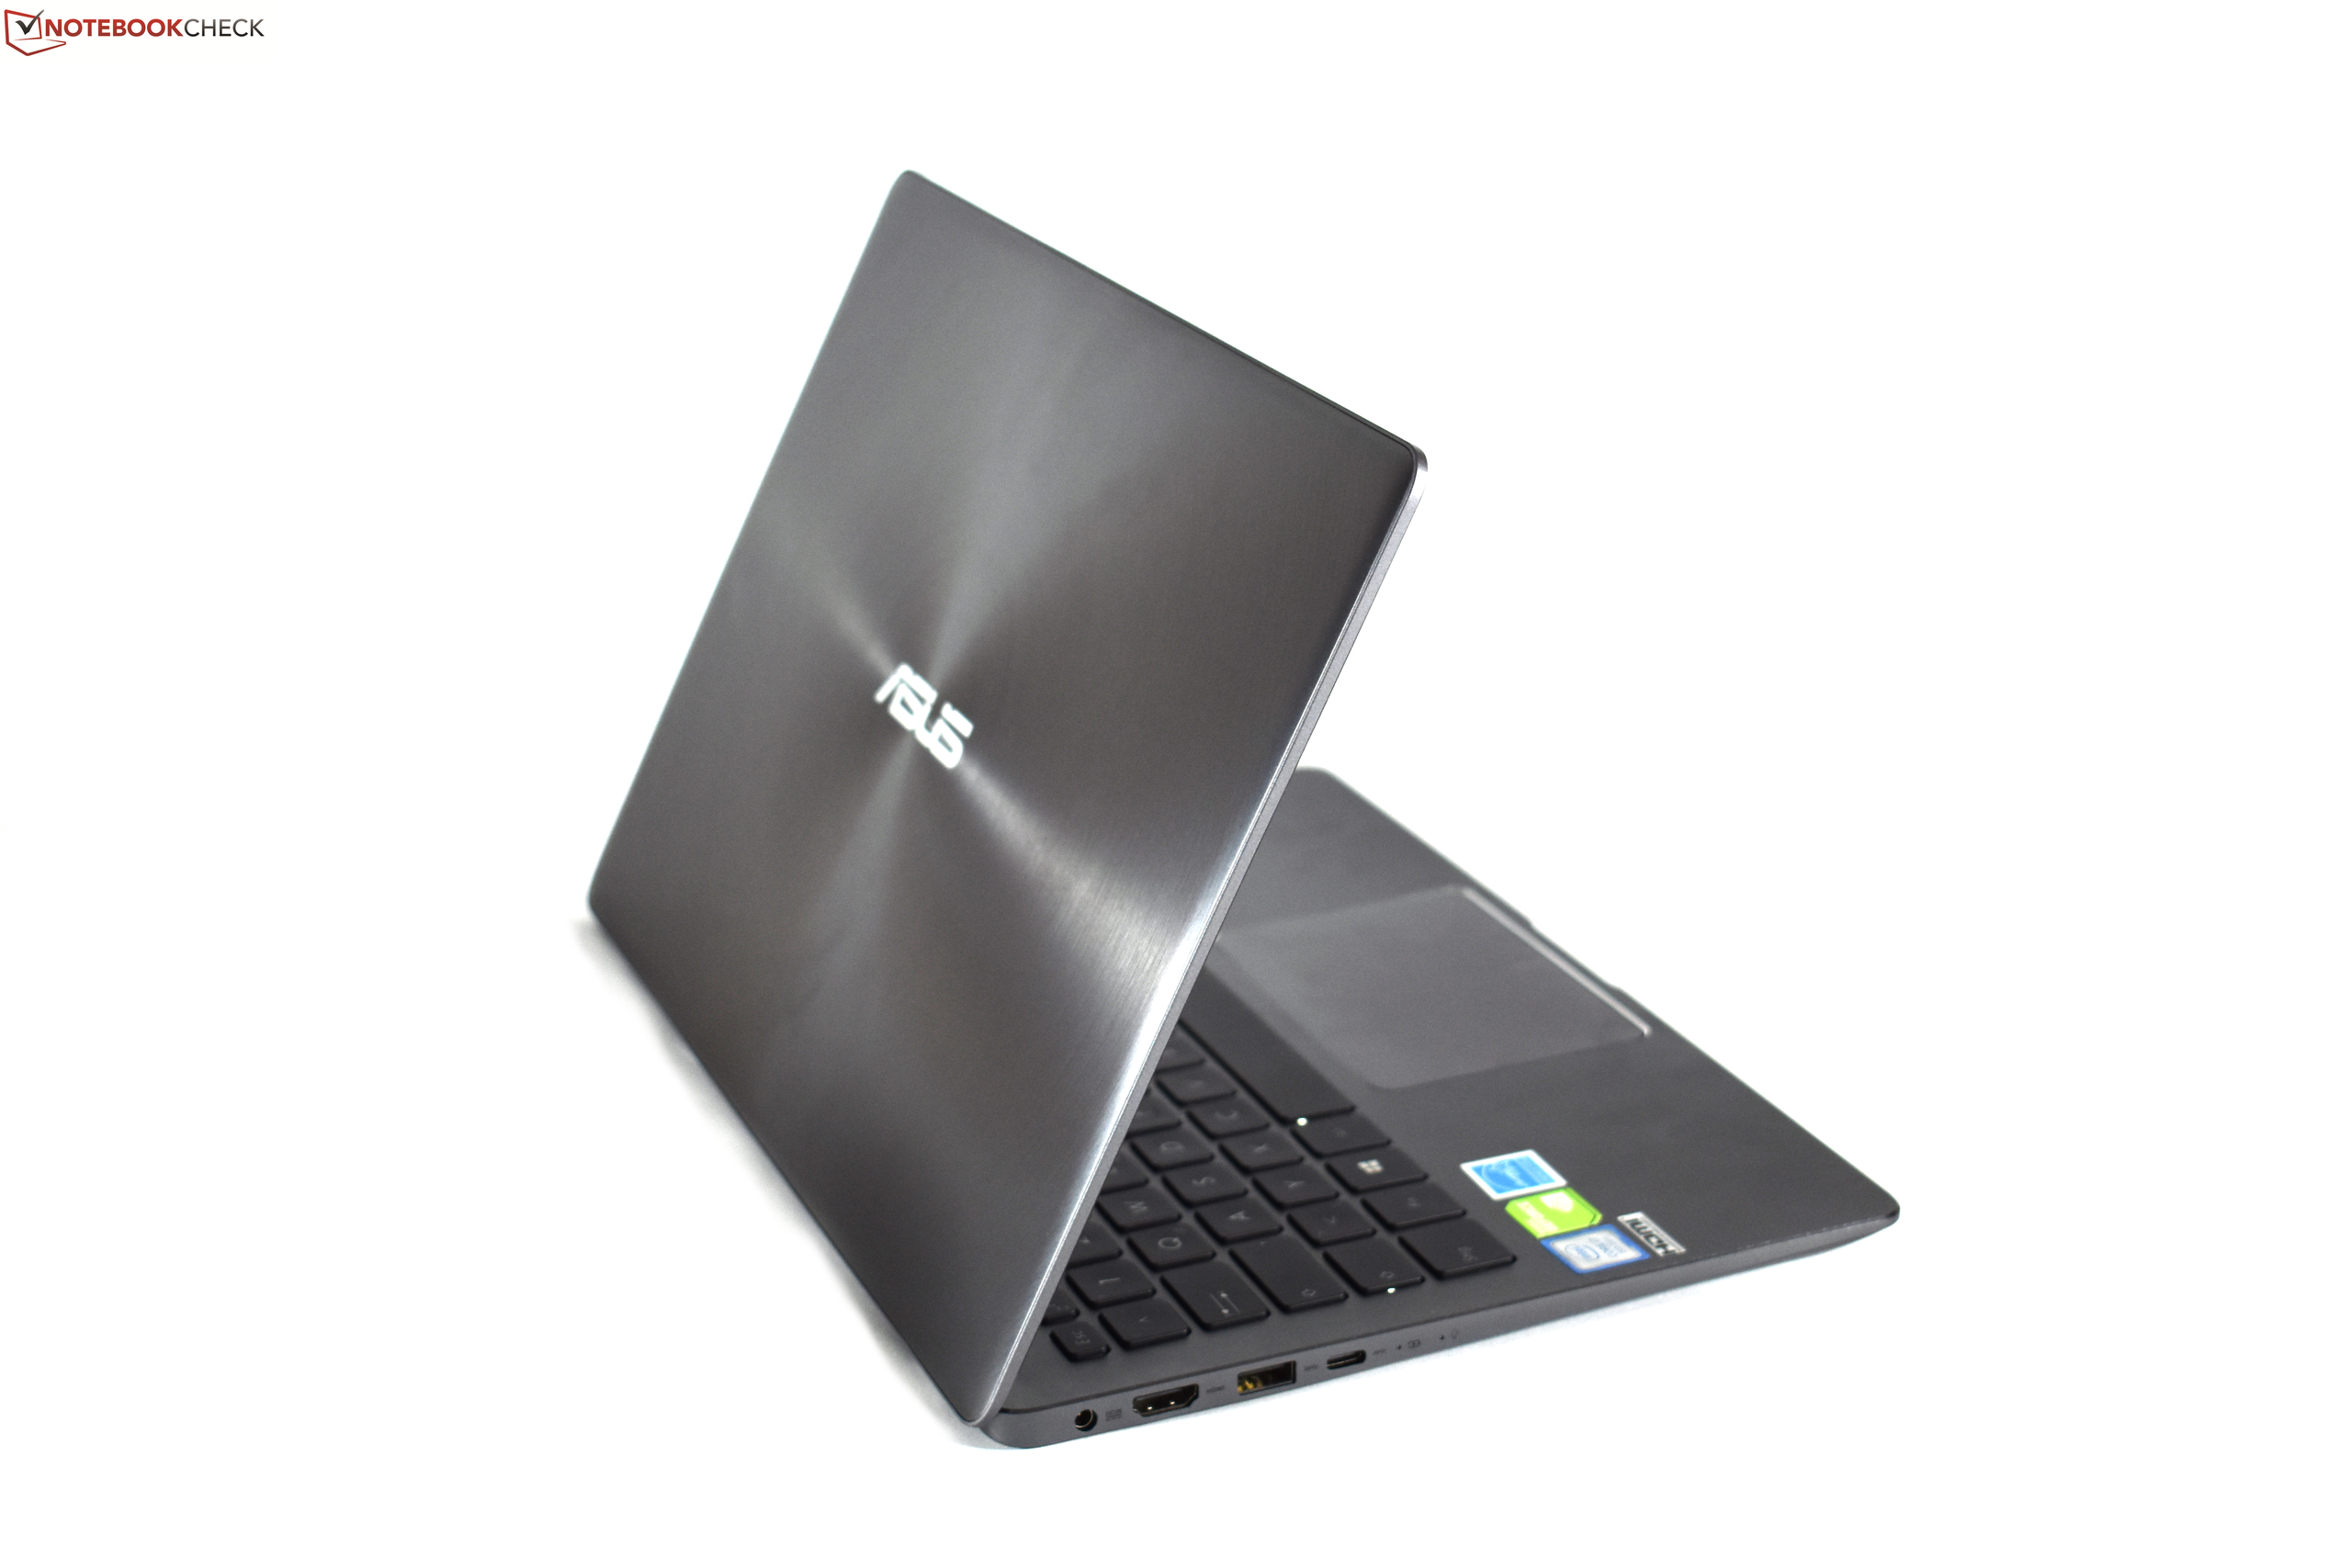
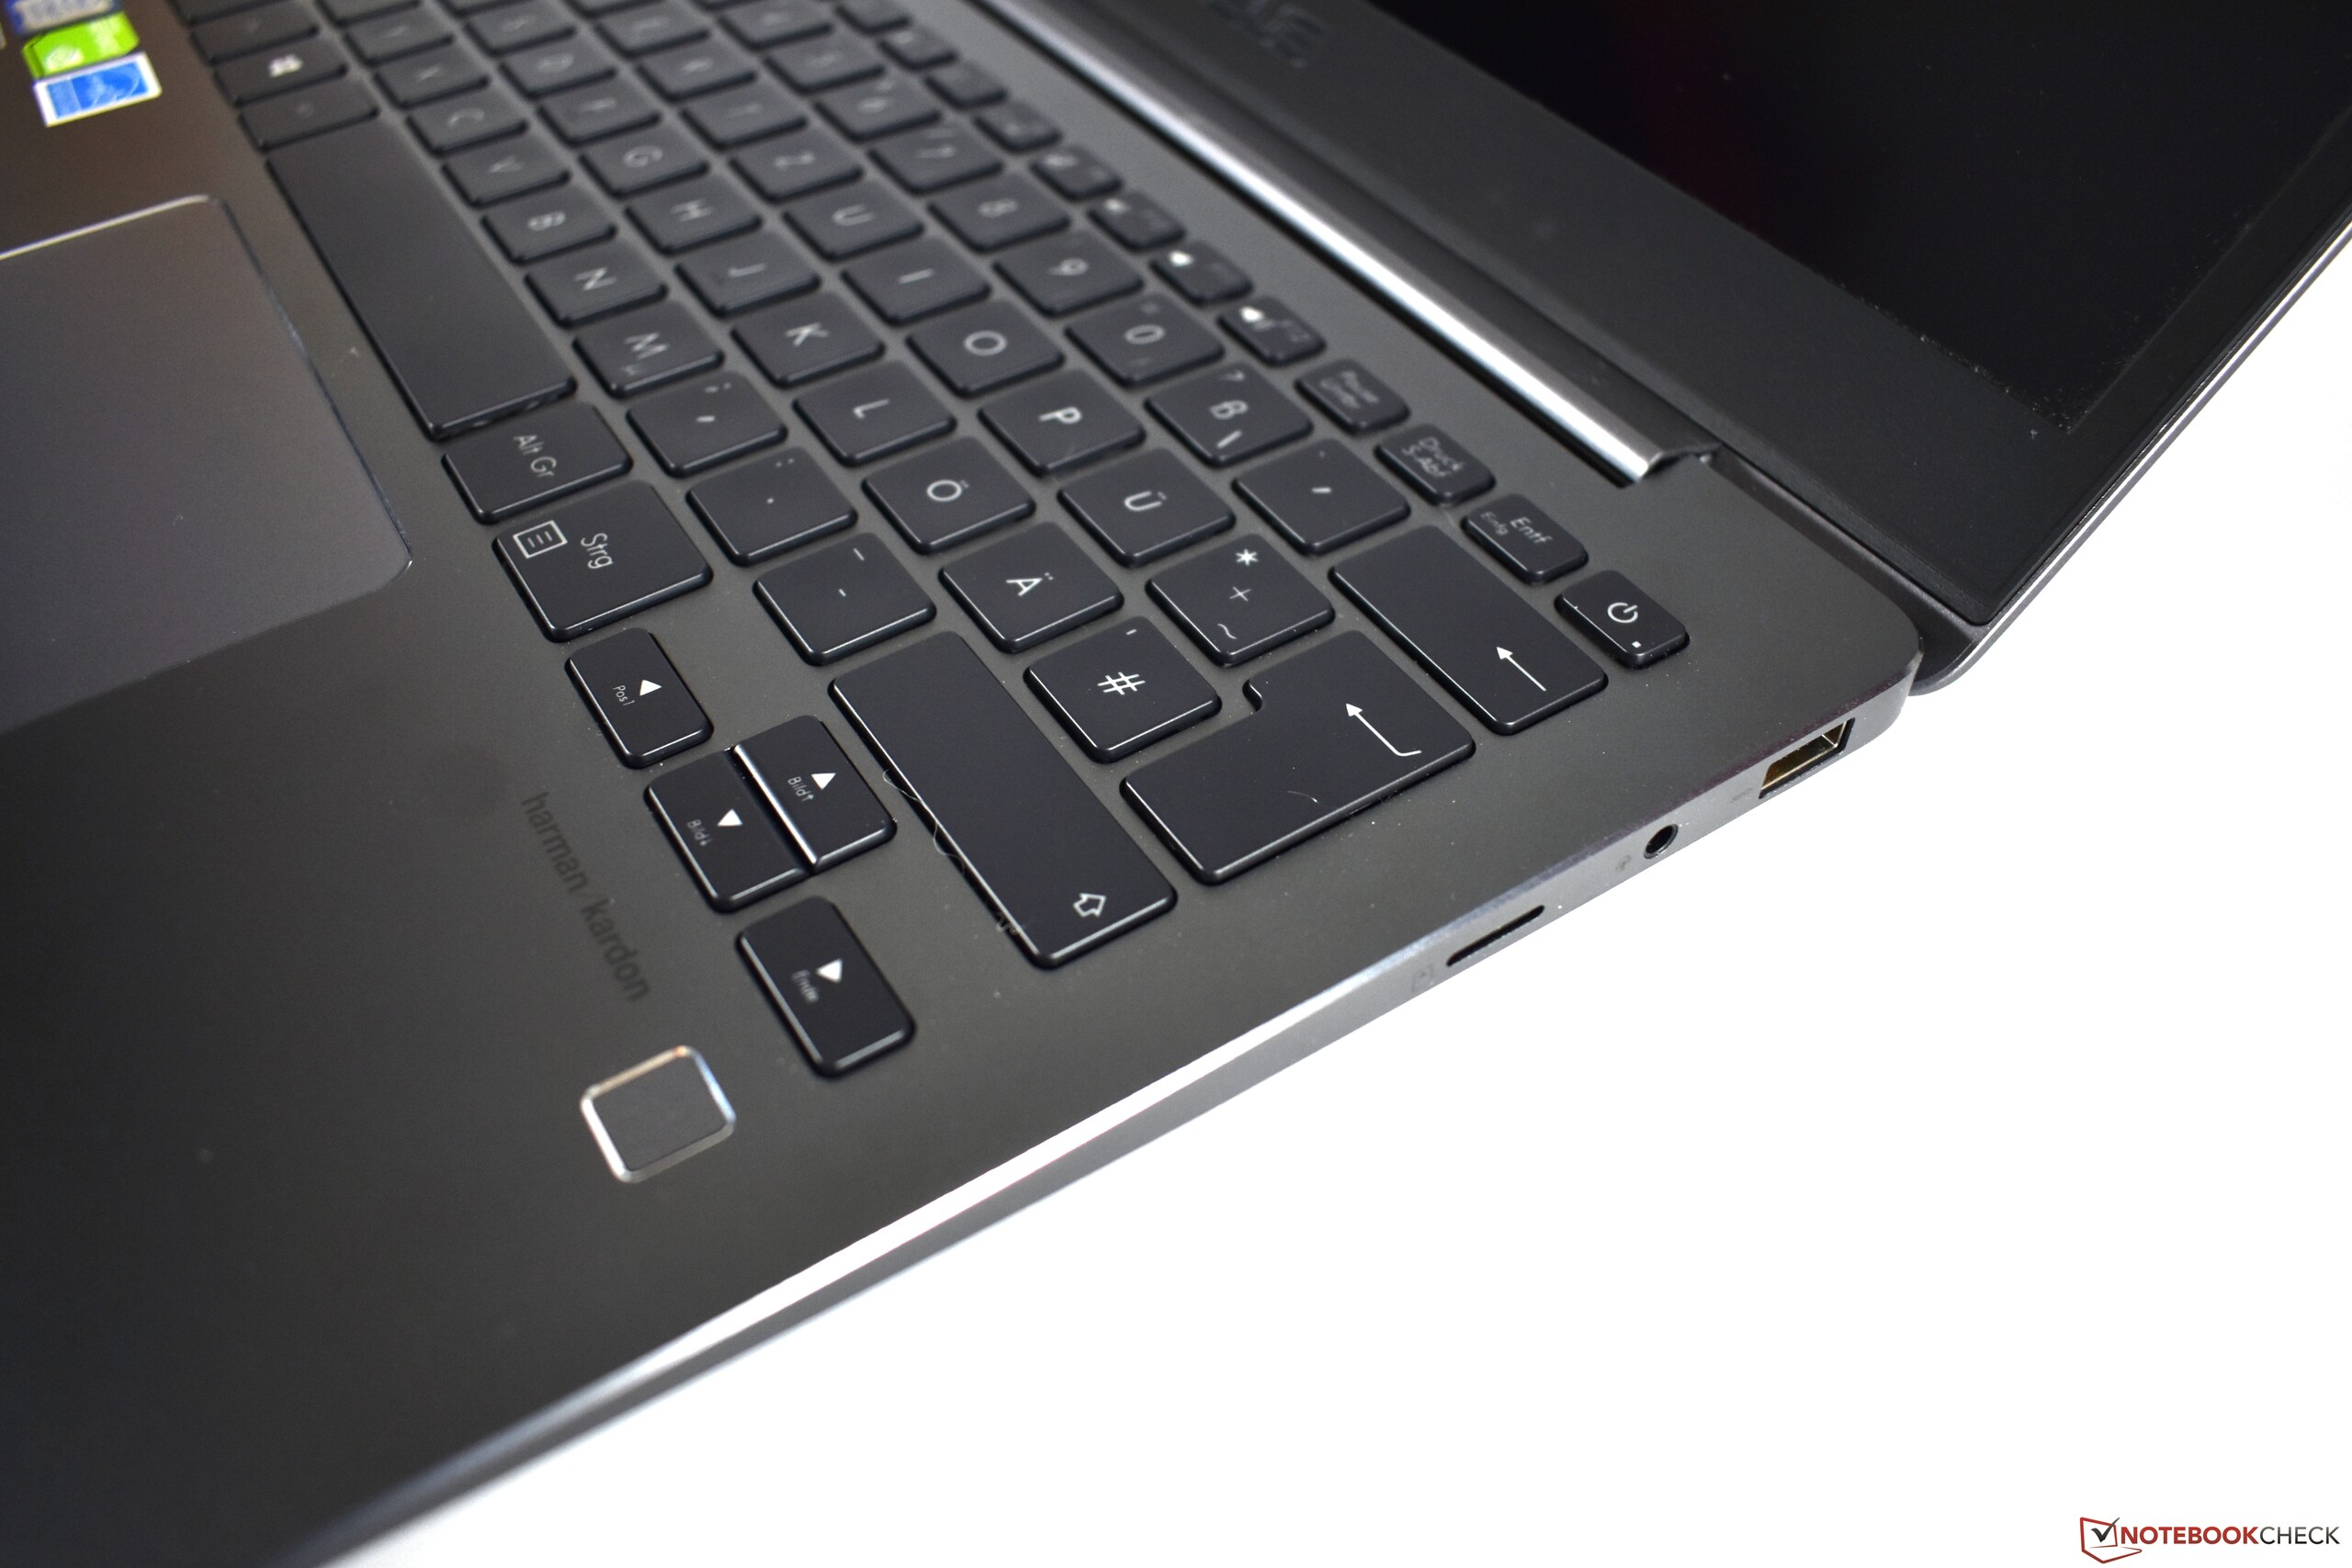
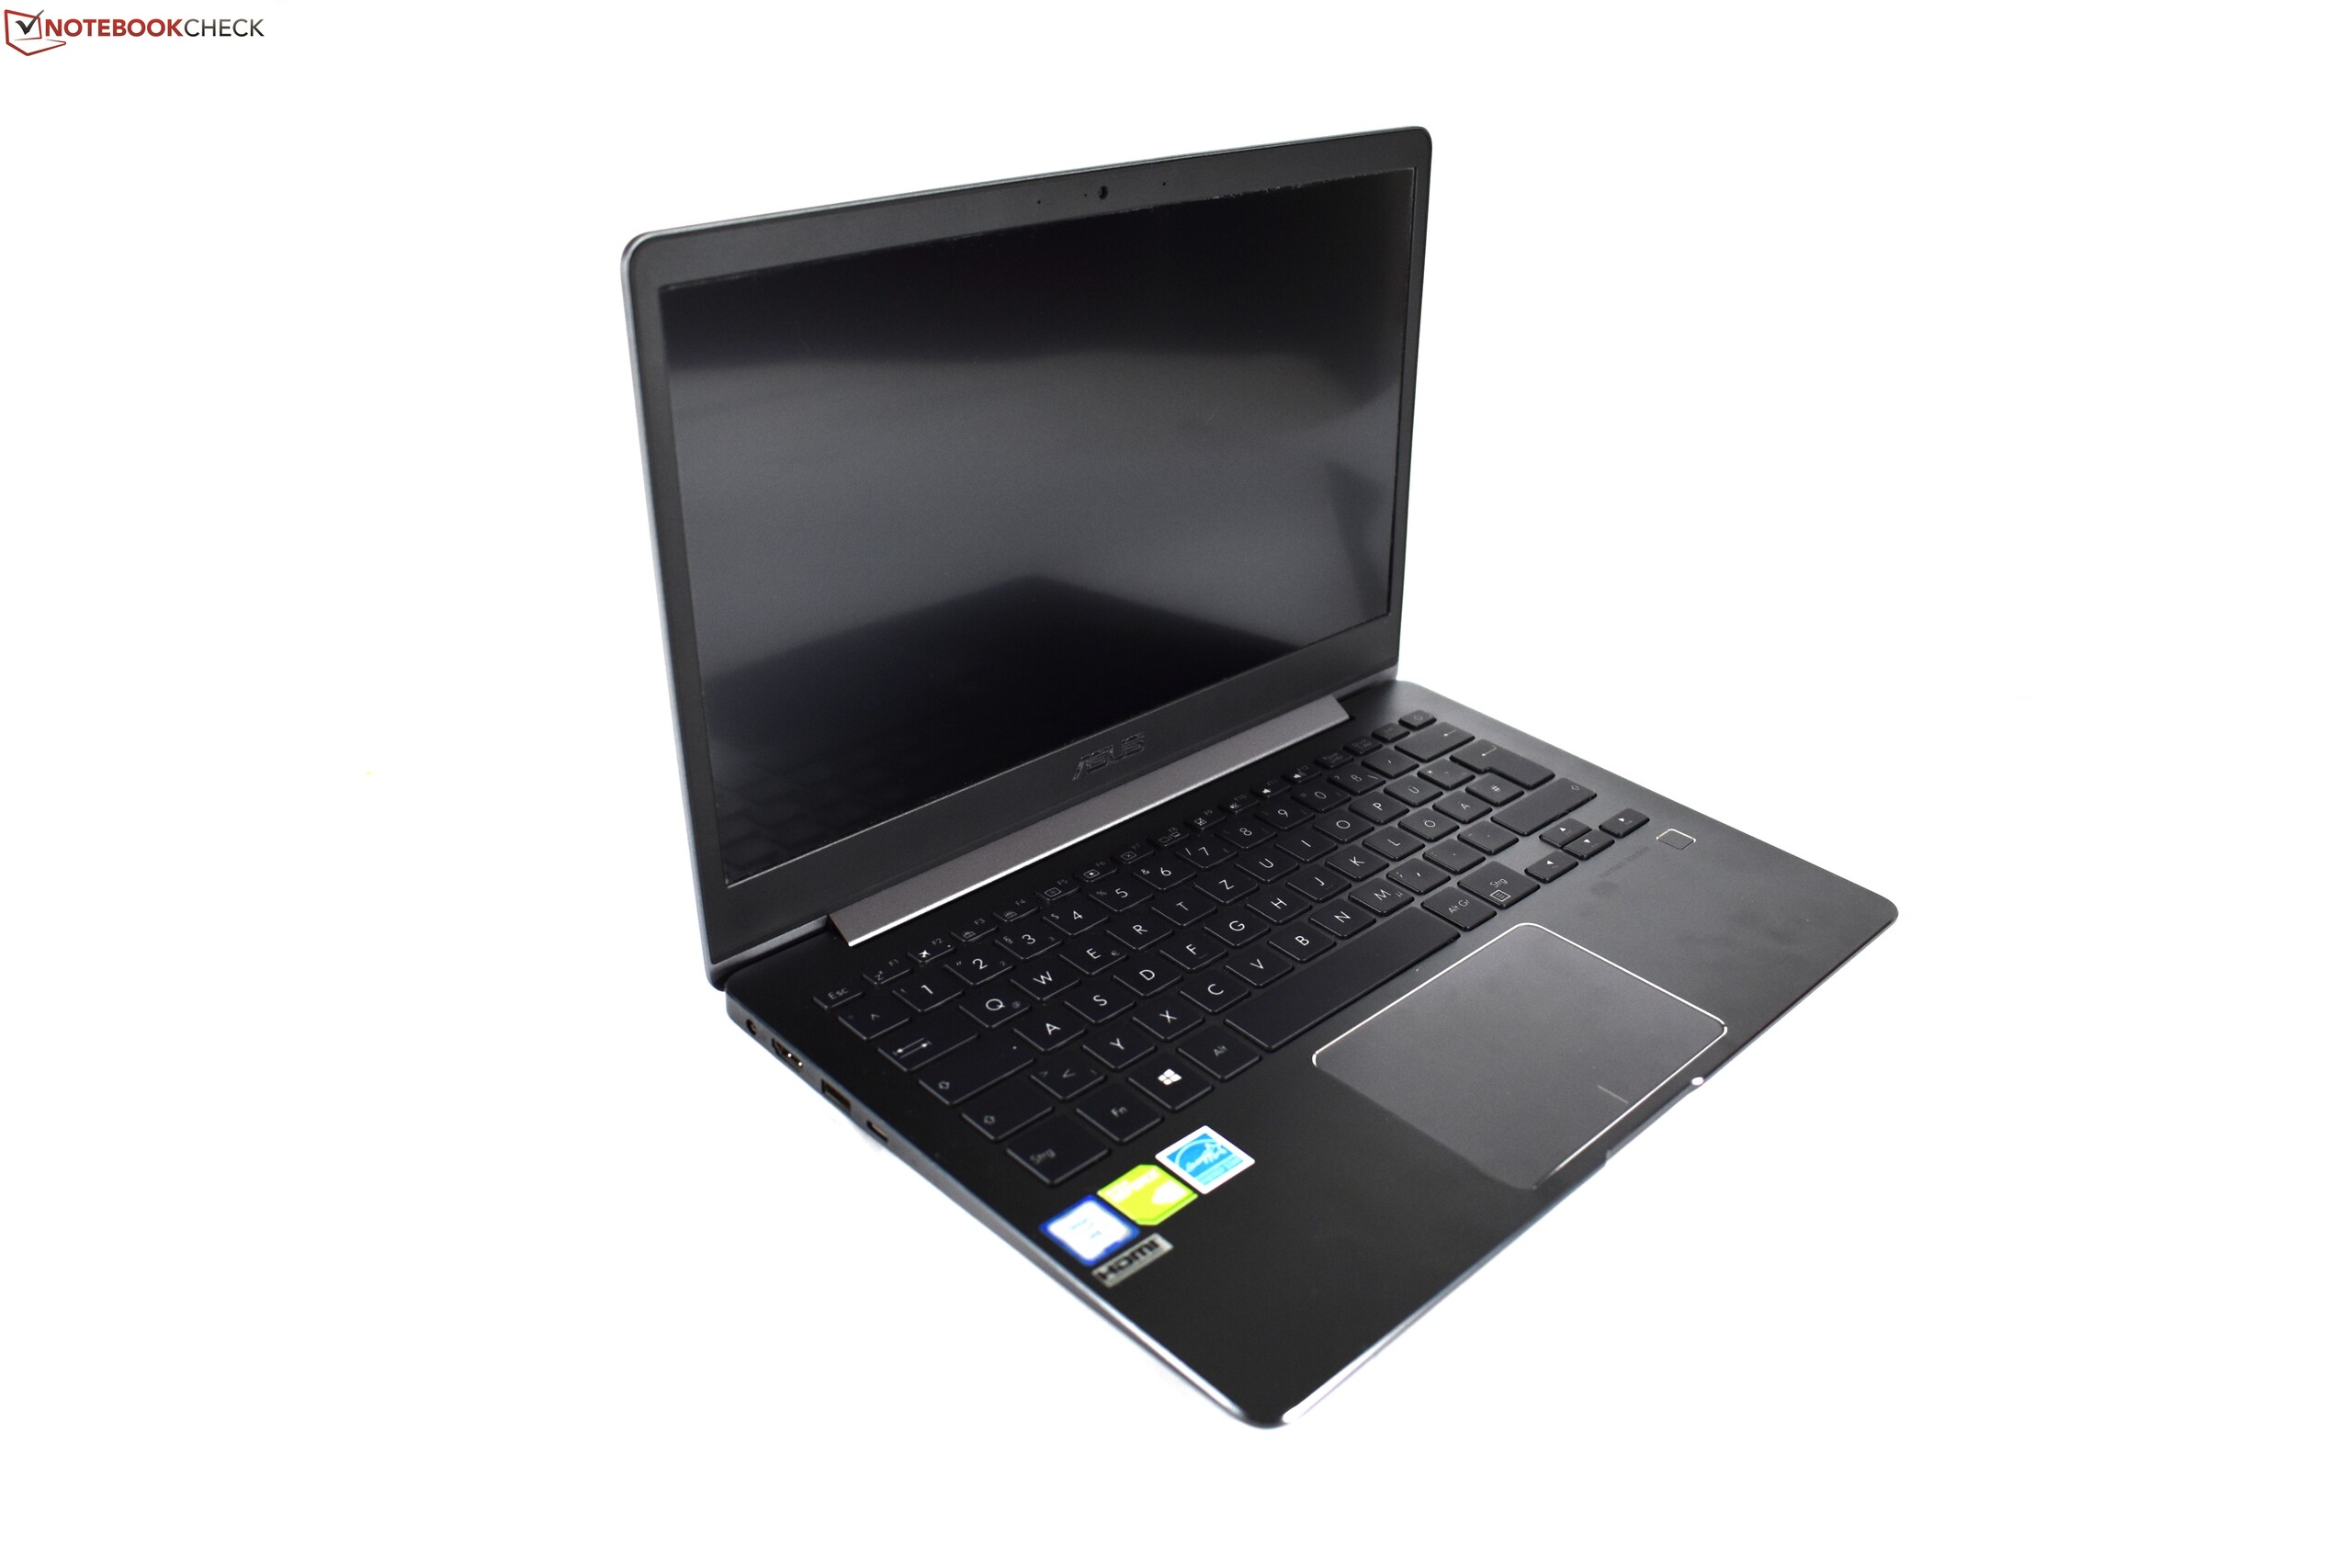
Allt som allt var vi mycket nöjda med ZenBook 13 UX331UN. Den kommer med en högkvalitativ skärm och förvånansvärt dugliga högtalare, vilket är dom viktigaste ingredienserna för en multimedia-laptop som kan användas utomhus tack vare sin imponerande maximala skärmljusstyrka. Utöver det så är kombinationen av CPU och GPU kraftfull nog för at köra spel smidigt vid reducerad upplösning och detalj. På så sätt är ZenBook ett skolboksexempel på en sann mångsysslare. Den är tunn och lätt, har ett hölje av hög kvalitet, en väldigt bra styrplatta och håller sig för det mesta sval. Dessutom är batteritiden utmärkt trots ett genomsnittligt 50 Wh-batteri.
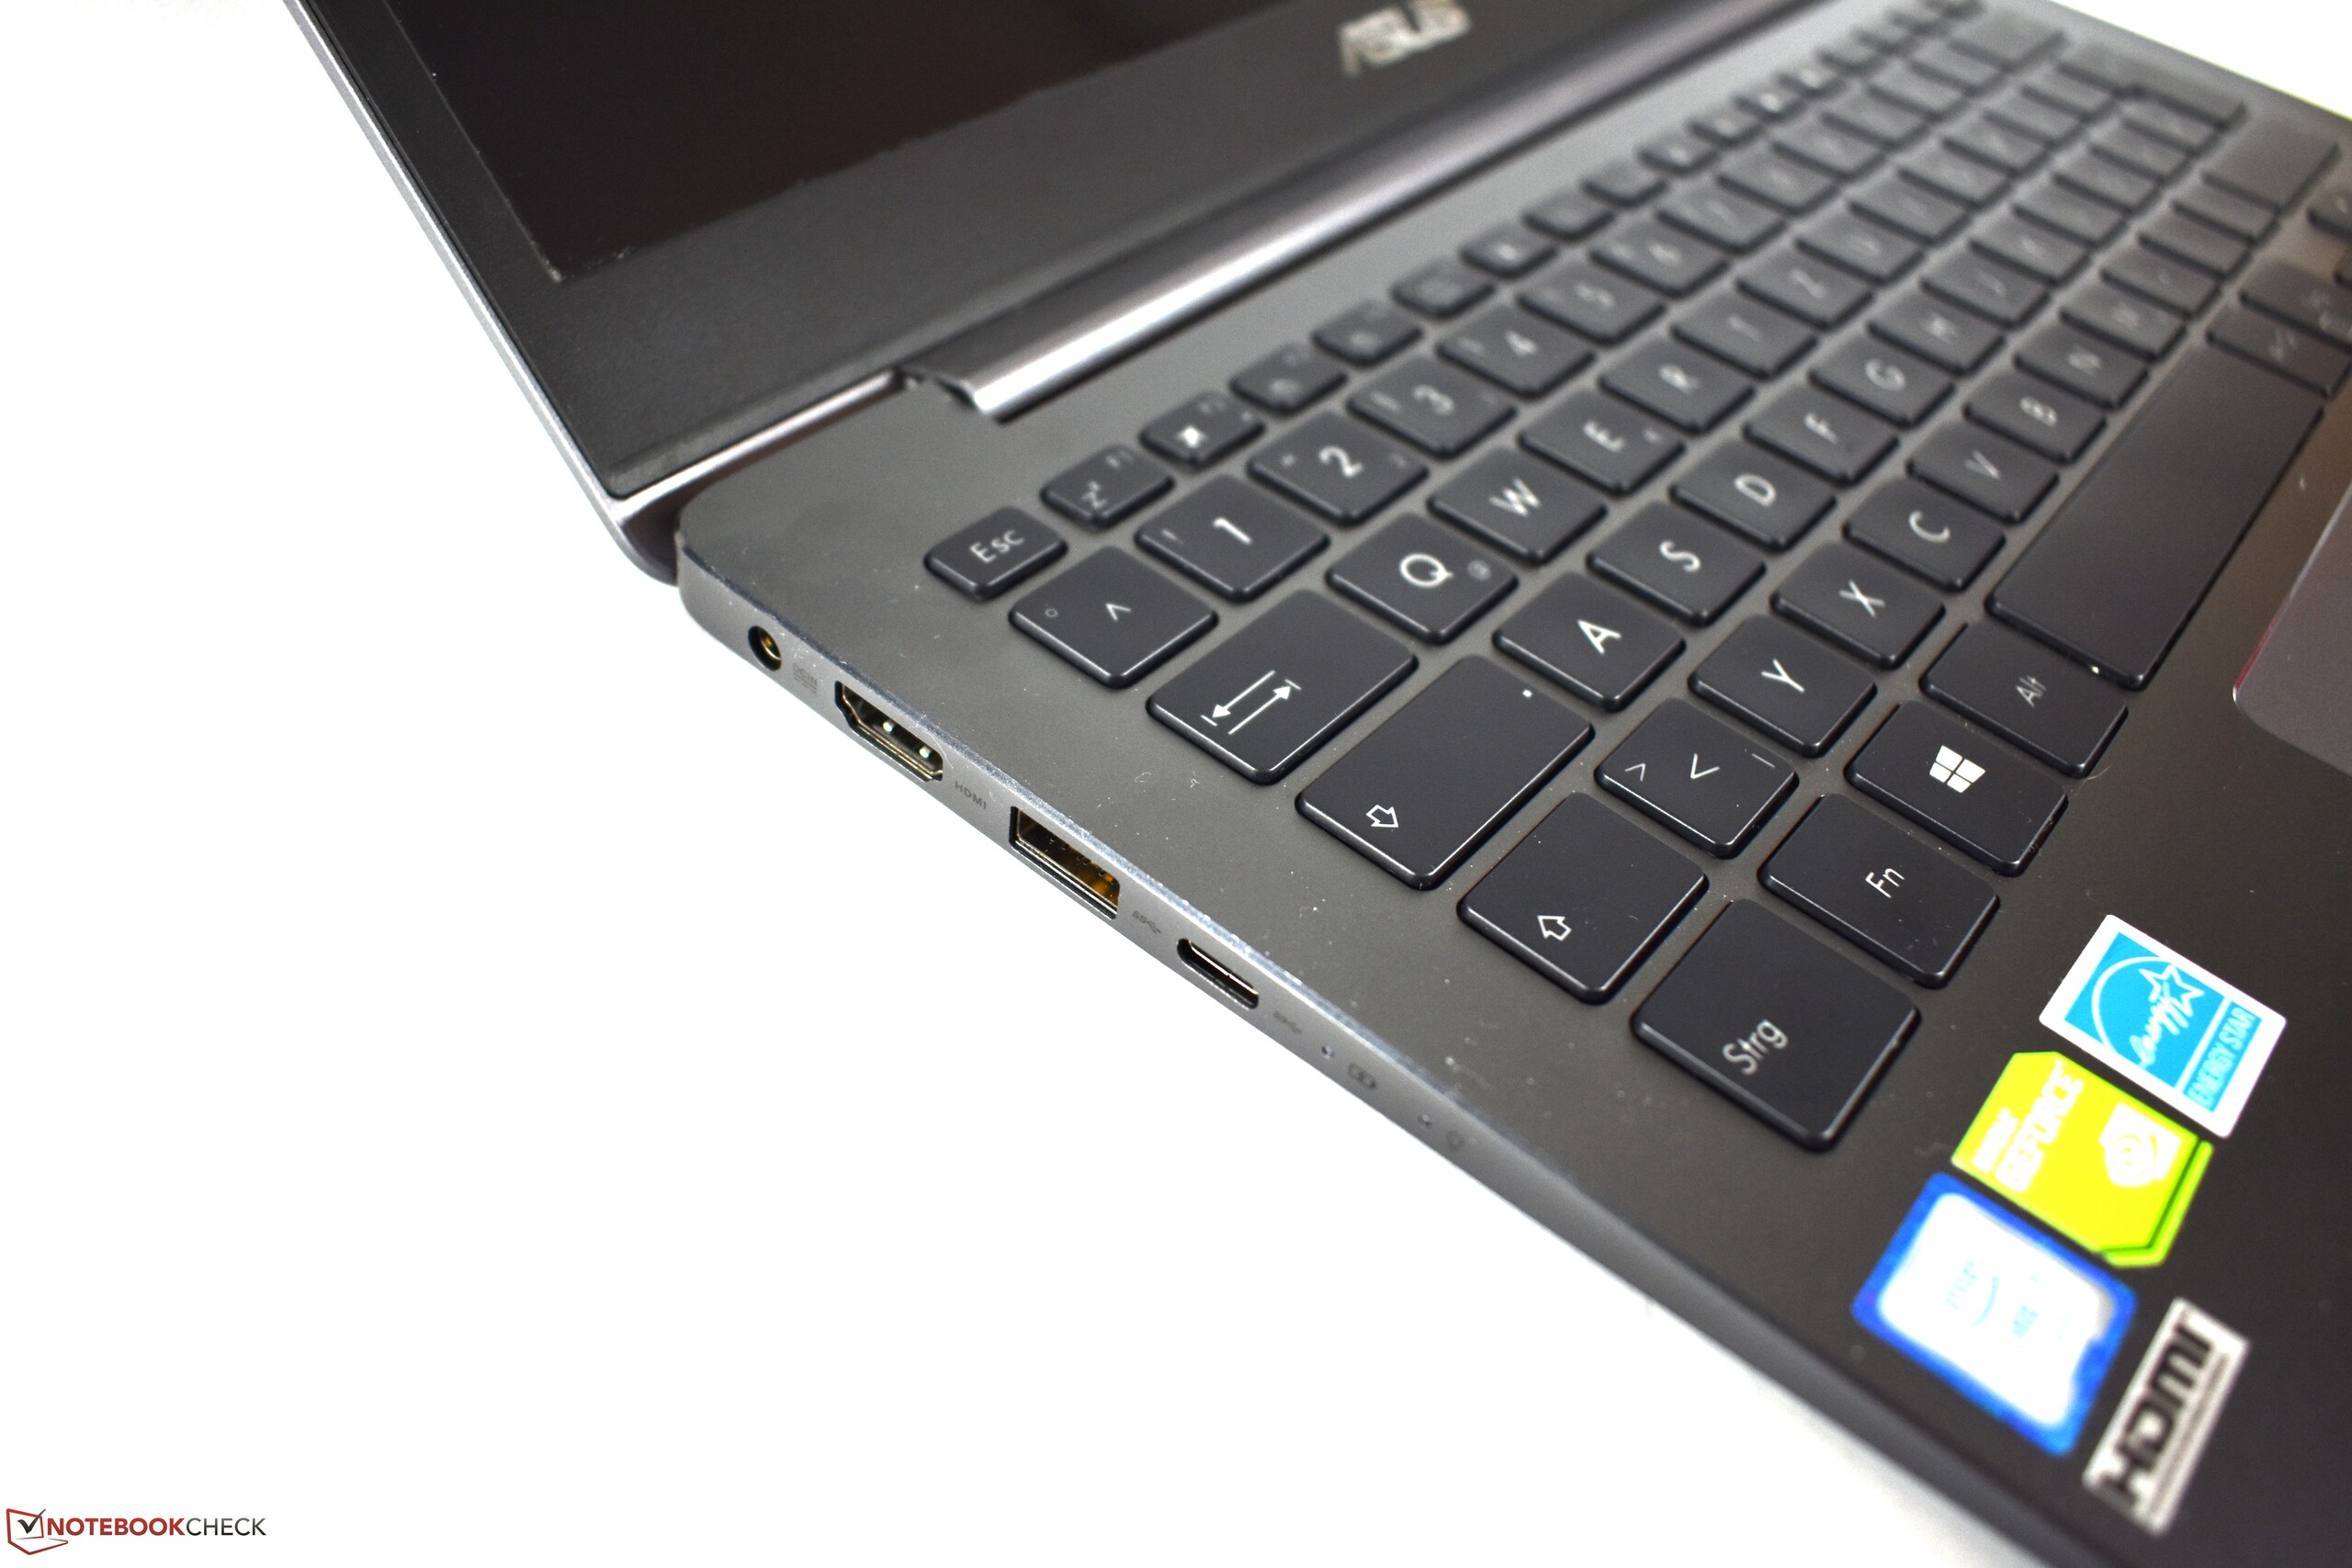
Tillsammans är dessa imponerande fördelar. Tyvärr är ZenBook ännu inte riktigt perfekt och har ett antal brister. Tangentbordet är bara halvdant, kylsystemet är inte tillräckligt kraftfullt, CPU-prestandan är inkonsekvent och processorn tenderar att strypas för tidigt eller för ofta (vilket vi kunde bekräfta i Cinebench R15 och vårt stresstest-scenario). Inte bara det, dess CPU är dessutom betydligt långsammare när datorn körs på batteri. Och låt oss inte glömma det oljud som ZenBook ger ifrån sig under belastning och vid spelande. Faktum är att det är på gränsen att kunna vara irriterande för den känsligare användaren. Sist men inte minst, den inbyggda SATA III SSD-enheten, avsaknaden av Thunderbolt 3 och den rejält begränsade USB-C porten (inget stöd för DisplayPort) är nackdelar som är värda att notera.
Lockande: I mångt och mycket har Asus lyckats träffa mitt i prick med ZenBook 13 UX331UN, på nästan alla områden.
Fördelarna väger tydligt upp nackdelarna, vilket är varför ZenBook 13 UX331UN förtjänar en rekommendation. På jakt efter en portabel laptop med en diskret GPU så är den definitivt ett strålande alternativ till Dell XPS 13.
Asus ZenBook 13 UX331UN
- 01/05/2018 v6 (old)
Benjamin Herzig
Price comparison
