Test: Apple iPad Pro 12.9 (2018, LTE, 256 GB) Surfplatta (Sammanfattning)


| |||||||||||||||||||||||||
Distribution av ljusstyrkan: 91 %
Mitt på batteriet: 632 cd/m²
Kontrast: 1975:1 (Svärta: 0.32 cd/m²)
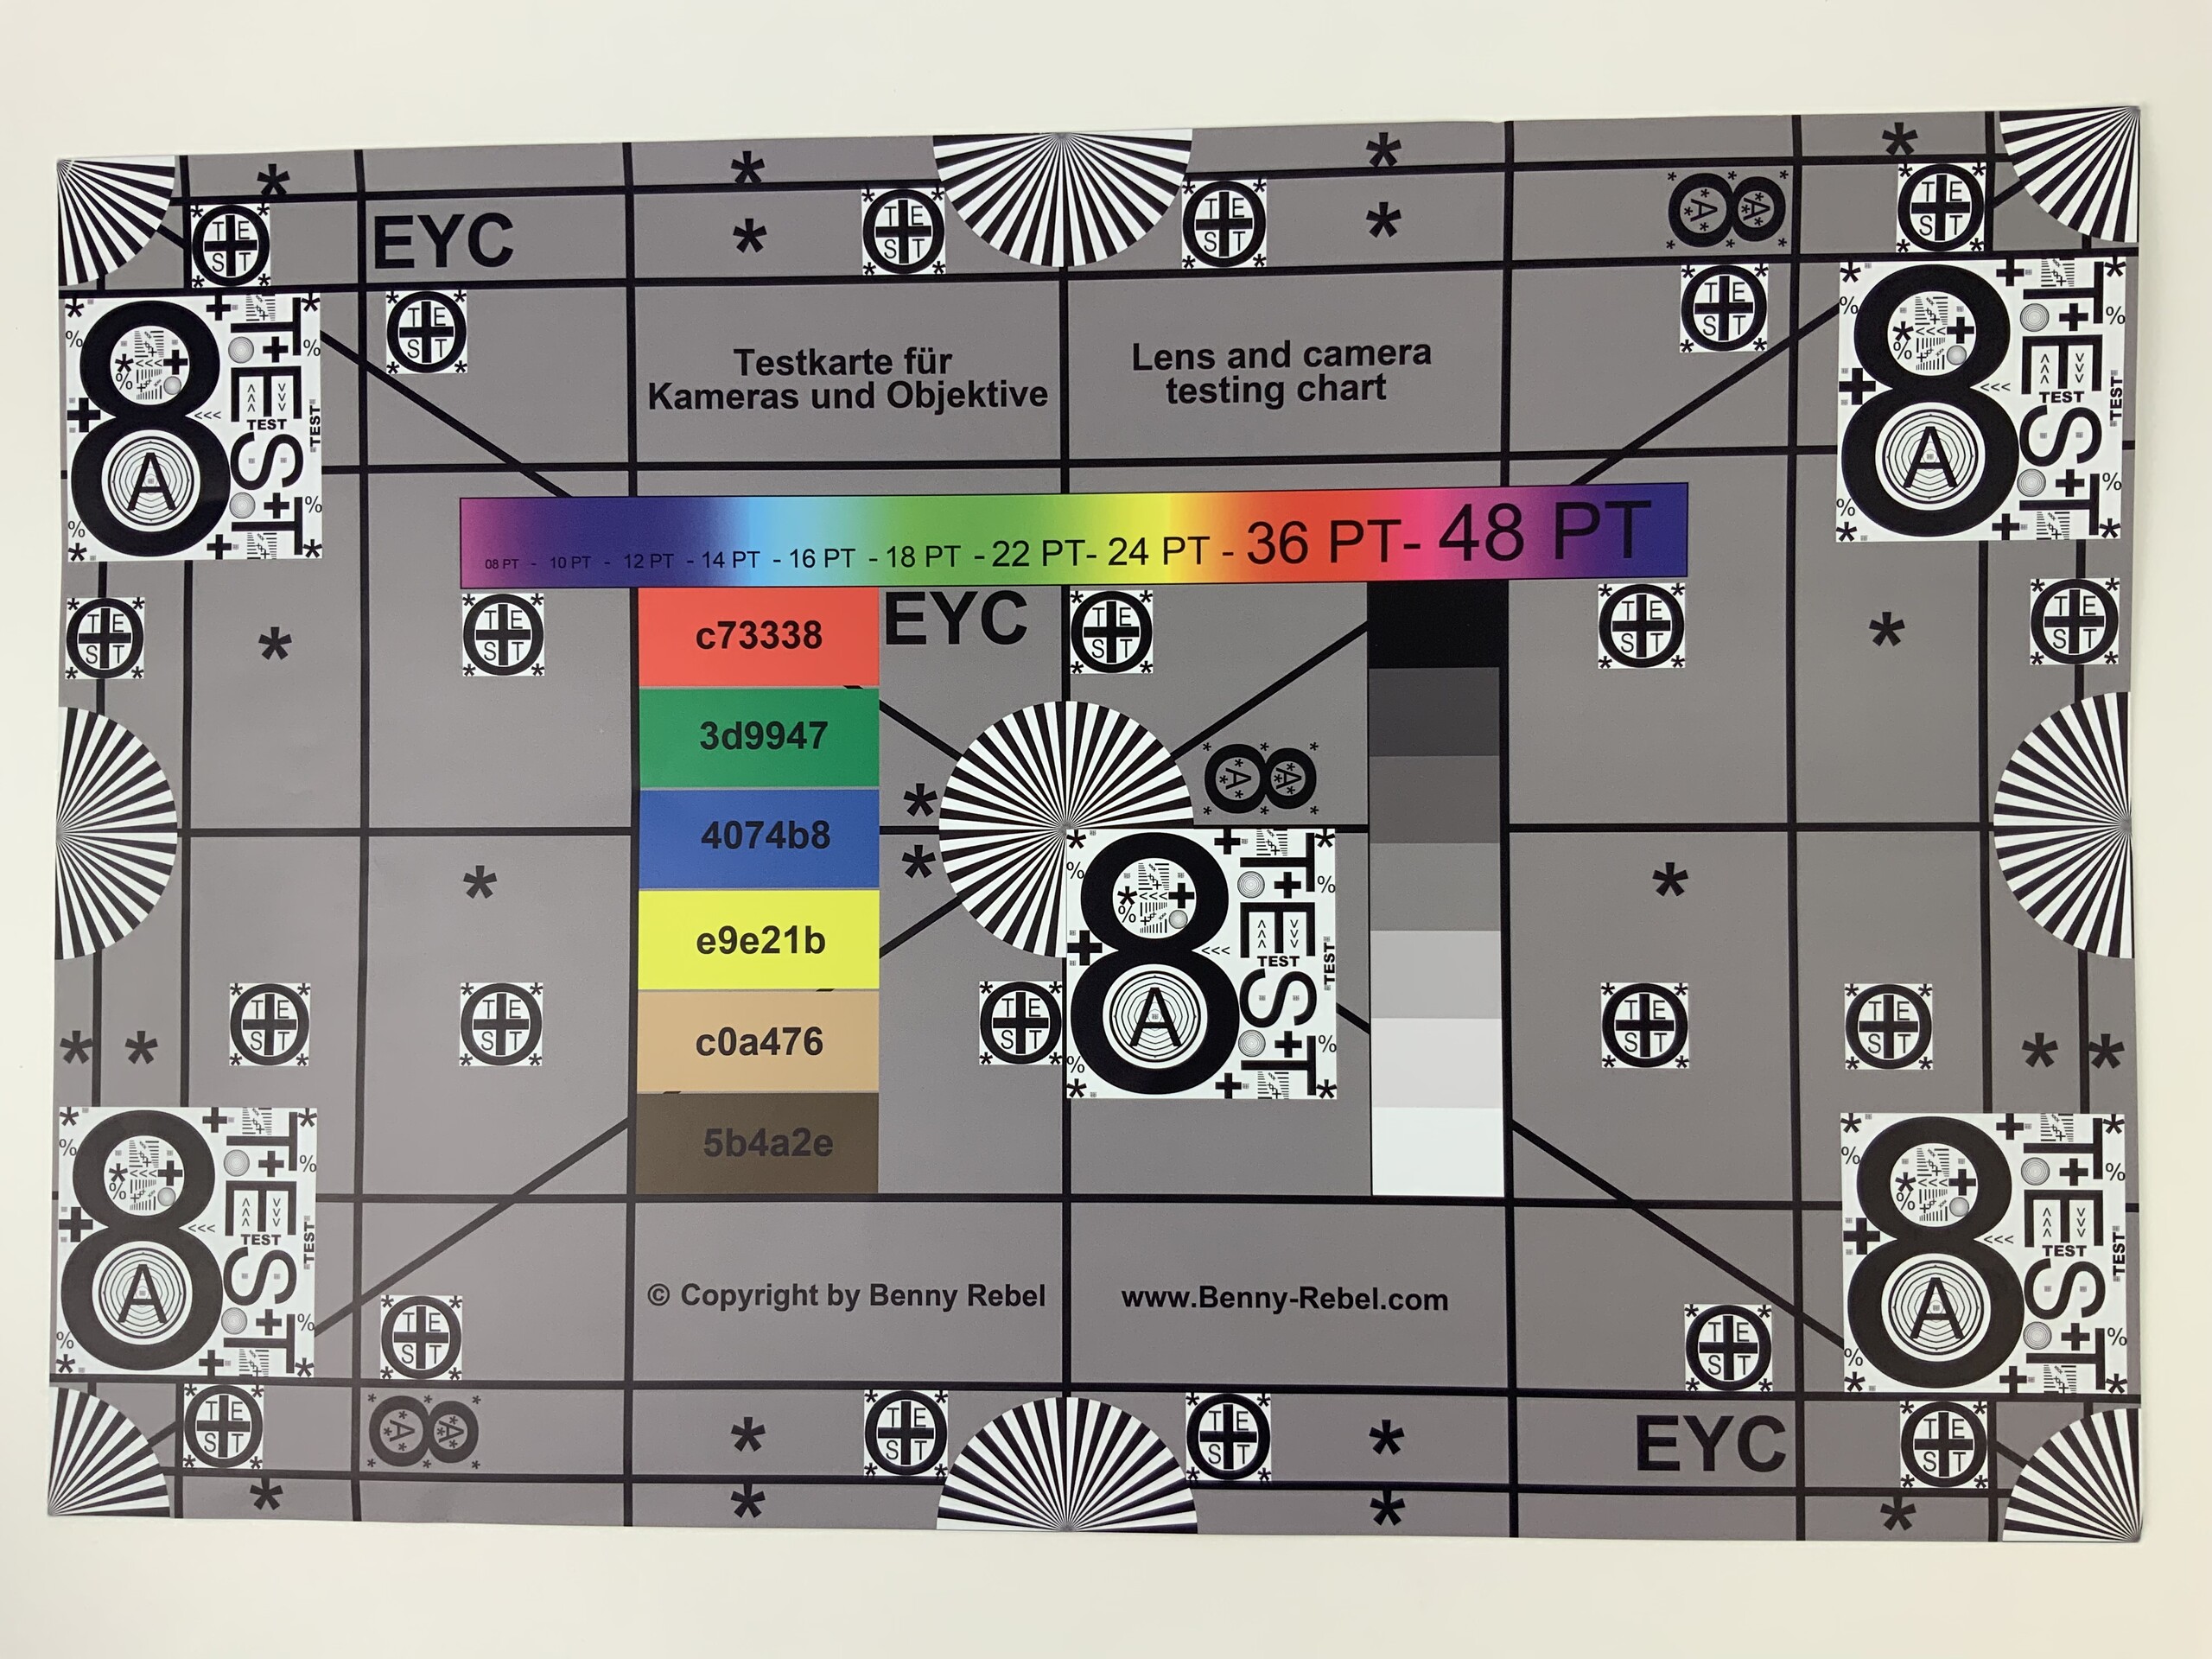
ΔE ColorChecker Calman: 1.1 | ∀{0.5-29.43 Ø4.72}
ΔE Greyscale Calman: 1.7 | ∀{0.09-98 Ø4.97}
99.7% sRGB (Calman 2D)
Gamma: 2.21
CCT: 6794 K
| Apple iPad Pro 12.9 2018 IPS, 2732x2048, 12.9" | Apple iPad Pro 12.9 2017 IPS, 2732x2048, 12.9" | Samsung Galaxy Tab S4 Super AMOLED, 2560x1600, 10.5" | Huawei MediaPad M5 10.8 Pro IPS, 2560x1600, 10.8" | Microsoft Surface Pro 6, Core i5, 128 GB IPS, 2736x1834, 12.3" | Apple iPad 6 2018 IPS, 2048x1536, 9.7" | |
|---|---|---|---|---|---|---|
| Screen | -1% | -57% | -201% | -78% | -22% | |
| Brightness middle (cd/m²) | 632 | 650 3% | 474 -25% | 384 -39% | 463 -27% | 530 -16% |
| Brightness (cd/m²) | 605 | 614 1% | 477 -21% | 360 -40% | 450 -26% | 513 -15% |
| Brightness Distribution (%) | 91 | 90 -1% | 91 0% | 84 -8% | 83 -9% | 92 1% |
| Black Level * (cd/m²) | 0.32 | 0.42 -31% | 0.8 -150% | 0.32 -0% | 0.61 -91% | |
| Contrast (:1) | 1975 | 1548 -22% | 480 -76% | 1447 -27% | 869 -56% | |
| Colorchecker dE 2000 * | 1.1 | 1 9% | 2.5 -127% | 6.83 -521% | 3.76 -242% | 1.2 -9% |
| Colorchecker dE 2000 max. * | 2.4 | 1.9 21% | 5.8 -142% | 12.7 -429% | 7.35 -206% | 3.2 -33% |
| Greyscale dE 2000 * | 1.7 | 1.5 12% | 2.1 -24% | 7.5 -341% | 3.18 -87% | 1 41% |
| Gamma | 2.21 100% | 2.25 98% | 2.08 106% | 2.199 100% | 2.53 87% | 2.28 96% |
| CCT | 6794 96% | 6734 97% | 6281 103% | 8544 76% | 6994 93% | 6588 99% |
| Colorchecker dE 2000 calibrated * | 2.68 | |||||
| Color Space (Percent of AdobeRGB 1998) (%) | 59 | |||||
| Color Space (Percent of sRGB) (%) | 90 |
* ... mindre är bättre
Skärmflimmer / PWM (Puls-Width Modulation)
| Skärmflimmer / PWM upptäcktes inte | 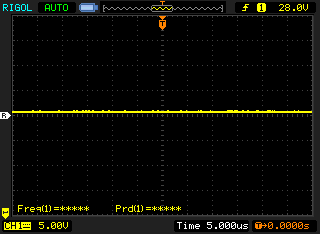 | ||
Som jämförelse: 52 % av alla testade enheter använder inte PWM för att dämpa skärmen. Om PWM upptäcktes mättes ett medelvärde av 7747 (minst: 5 - maximum: 343500) Hz. | |||
Visa svarstider
| ↔ Svarstid svart till vitt | ||
|---|---|---|
| 23.2 ms ... stiga ↗ och falla ↘ kombinerat | ↗ 7.6 ms stiga | 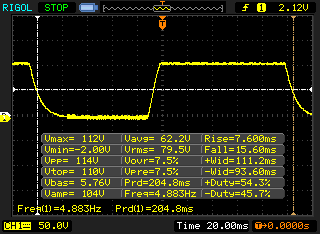 |
| ↘ 15.6 ms hösten | ||
| Skärmen visar bra svarsfrekvens i våra tester, men kan vara för långsam för konkurrenskraftiga spelare. I jämförelse sträcker sig alla testade enheter från 0.1 (minst) till 240 (maximalt) ms. » 53 % av alla enheter är bättre. Detta innebär att den uppmätta svarstiden är sämre än genomsnittet av alla testade enheter (19.8 ms). | ||
| ↔ Svarstid 50 % grått till 80 % grått | ||
| 49.6 ms ... stiga ↗ och falla ↘ kombinerat | ↗ 18.8 ms stiga | 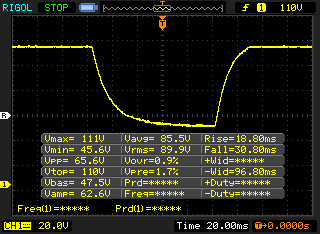 |
| ↘ 30.8 ms hösten | ||
| Skärmen visar långsamma svarsfrekvenser i våra tester och kommer att vara otillfredsställande för spelare. I jämförelse sträcker sig alla testade enheter från 0.165 (minst) till 636 (maximalt) ms. » 86 % av alla enheter är bättre. Detta innebär att den uppmätta svarstiden är sämre än genomsnittet av alla testade enheter (31 ms). | ||
| AnTuTu v7 - Total Score | |
| Genomsnitt Apple A12X Bionic (552676 - 566378, n=2) | |
| Apple iPad Pro 12.9 2018 | |
| Apple iPad Pro 12.9 | |
| Samsung Galaxy Tab S4 | |
| Huawei MediaPad M5 10.8 Pro | |
| Apple iPad 6 2018 | |
| Basemark ES 3.1 / Metal - offscreen Overall Score | |
| Apple iPad Pro 12.9 2018 | |
| Genomsnitt Apple A12X Bionic (5216 - 5300, n=2) | |
| Genomsnitt av klass Tablet (255 - 5784, n=6, senaste 2 åren) | |
| Apple iPad Pro 12.9 | |
| Apple iPad 6 2018 | |
| JetStream 1.1 - 1.1 Total | |
| Apple iPad Pro 12.9 2018 (Safari Mobile 12) | |
| Genomsnitt Apple A12X Bionic (278 - 279, n=2) | |
| Apple iPad Pro 12.9 2017 (Safari Mobile 10) | |
| Microsoft Surface Pro 6, Core i5, 128 GB | |
| Apple iPad 6 2018 (Safari Mobile 11.3) | |
| Apple iPad Pro 12.9 (Safari Mobile 9.0) | |
| Samsung Galaxy Tab S4 (Samsung Browser 8.0) | |
| Huawei MediaPad M5 10.8 Pro (Chrome 68.0.3440.91) | |
| Octane V2 - Total Score | |
| Genomsnitt av klass Tablet (1633 - 138481, n=70, senaste 2 åren) | |
| Apple iPad Pro 12.9 2018 (Safari Mobile 12) | |
| Genomsnitt Apple A12X Bionic (44425 - 45734, n=2) | |
| Apple iPad Pro 12.9 2017 (Safari Mobile 10) | |
| Apple iPad 6 2018 (Safari Mobile 11.3) | |
| Microsoft Surface Pro 6, Core i5, 128 GB | |
| Apple iPad Pro 12.9 (Safari Mobile 9.0) | |
| Samsung Galaxy Tab S4 (Samsung Browser 8.0) | |
| Huawei MediaPad M5 10.8 Pro (Chrome 68.0.3440.91) | |
| Mozilla Kraken 1.1 - Total | |
| Huawei MediaPad M5 10.8 Pro (Chrome 68.0.3440.91) | |
| Samsung Galaxy Tab S4 (Samsung Browser 8.0) | |
| Genomsnitt av klass Tablet (243 - 16233, n=64, senaste 2 åren) | |
| Apple iPad Pro 12.9 (Safari Mobile 9.0) | |
| Microsoft Surface Pro 6, Core i5, 128 GB | |
| Apple iPad 6 2018 (Safari Mobile 11.3) | |
| Apple iPad Pro 12.9 2017 (Safari Mobile 10) | |
| Apple iPad Pro 12.9 2018 (Safari Mobile 12) | |
| Genomsnitt Apple A12X Bionic (603 - 614, n=2) | |
| WebXPRT 3 - Overall | |
| Genomsnitt av klass Tablet (168 - 520, n=10, senaste 2 åren) | |
| Apple iPad Pro 12.9 2018 (Safari Mobile 12) | |
| Microsoft Surface Pro 6, Core i5, 128 GB (Edge 18) | |
| Genomsnitt Apple A12X Bionic (172 - 182, n=2) | |
| Apple iPad Pro 12.9 (Safari Mobile 12) | |
| Apple iPad 6 2018 (Safari Mobile 10) | |
| Samsung Galaxy Tab S4 (Samsung Browser 8.0) | |
| Huawei MediaPad M5 10.8 Pro (Chrome 68.0.3440.91) | |
| WebXPRT 2015 - Overall | |
| Genomsnitt Apple A12X Bionic (380 - 386, n=2) | |
| Apple iPad Pro 12.9 2018 (Safari Mobile 12) | |
| Apple iPad Pro 12.9 2017 (Safari Mobile 10) | |
| Apple iPad Pro 12.9 (Safari Mobile 9.0) | |
| Apple iPad 6 2018 (Safari Mobile 11.3) | |
| Samsung Galaxy Tab S4 (Samsung Browser 8.0) | |
| Huawei MediaPad M5 10.8 Pro (Chrome 68.0.3440.91) | |
* ... mindre är bättre
Battle Bay
PUBG Mobile
Arena of Valor
Asphalt 9: Legends
World of Tanks Blitz
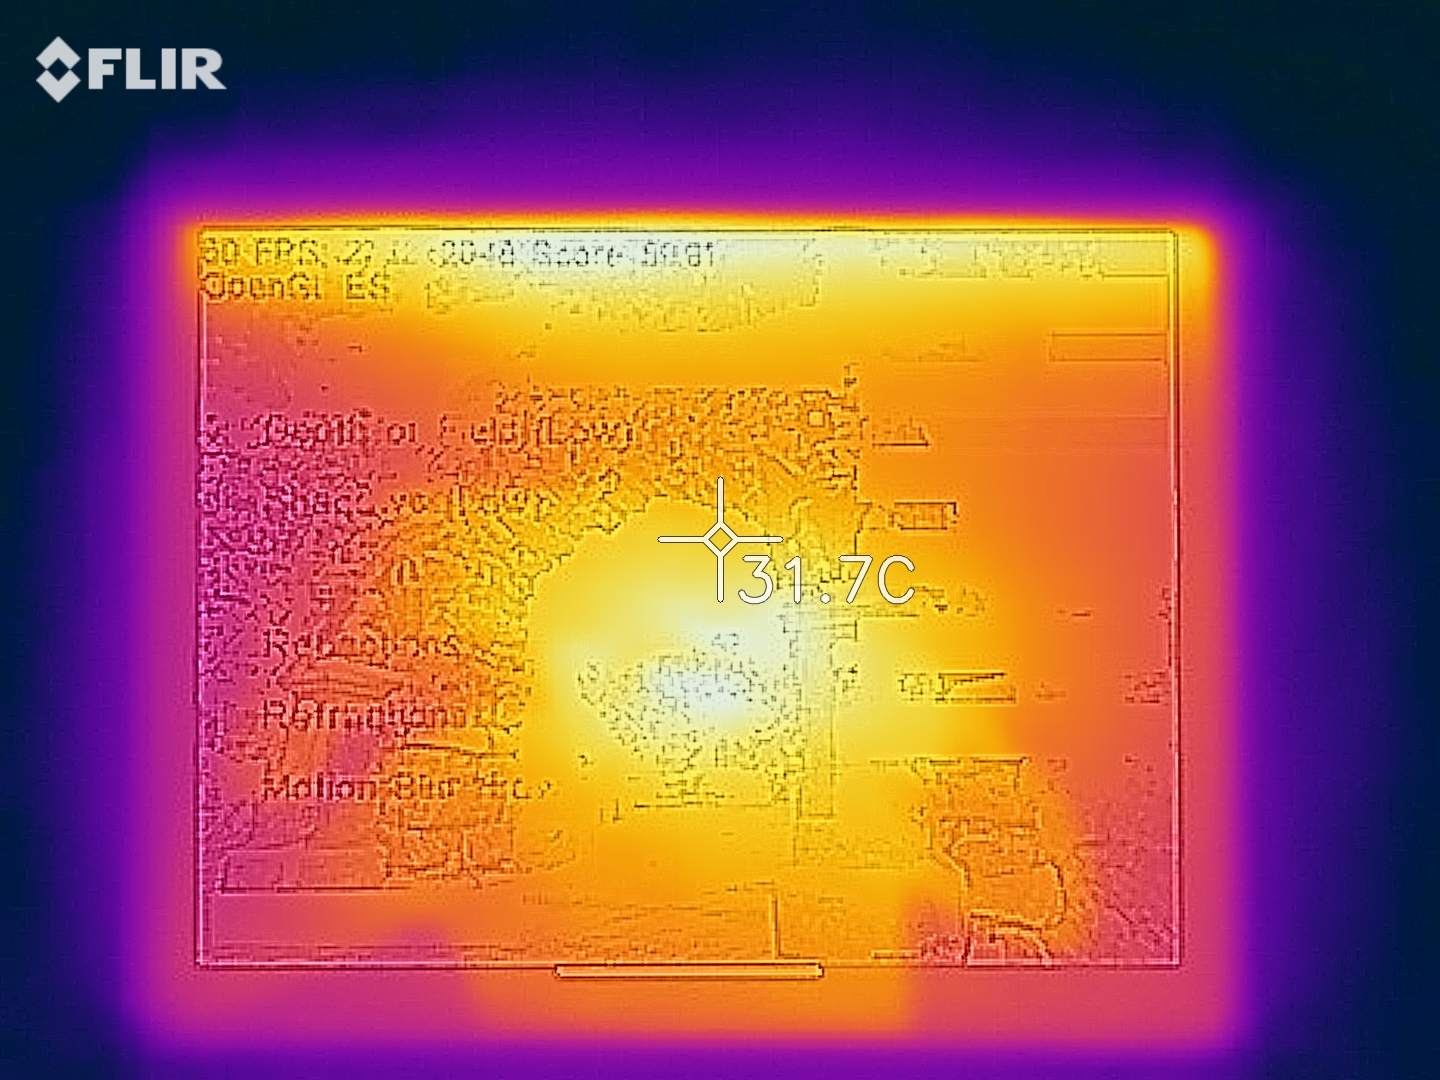
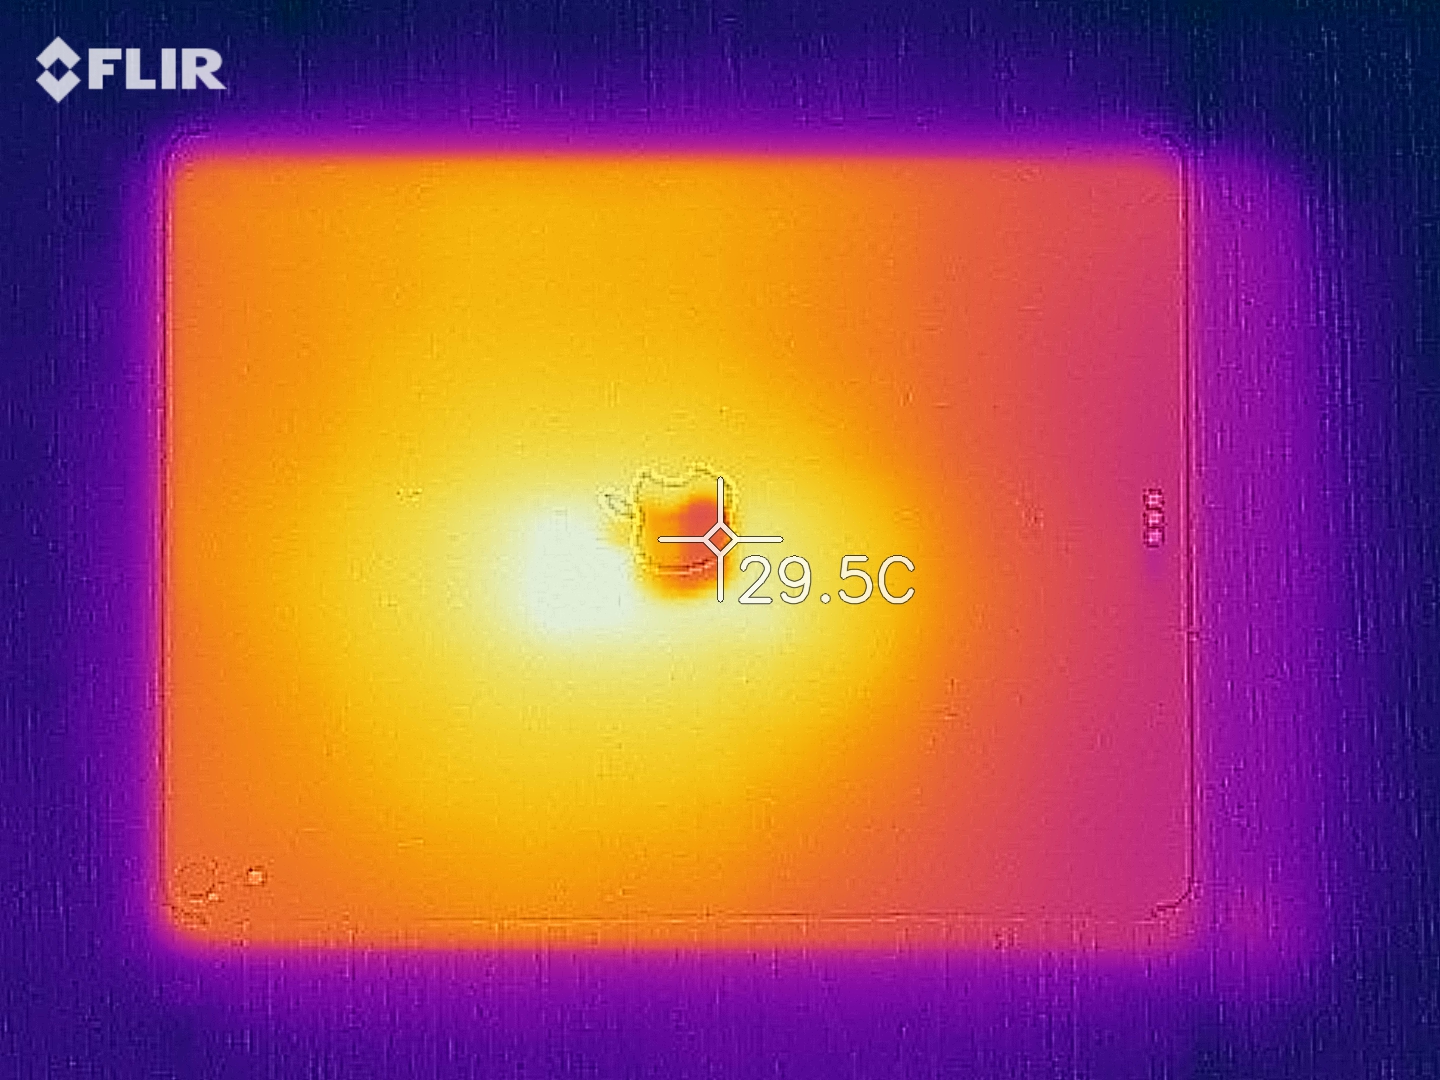
(+) Den maximala temperaturen på ovansidan är 38.3 °C / 101 F, jämfört med genomsnittet av 33.7 °C / 93 F , allt från 20.7 till 53.2 °C för klassen Tablet.
(+) Botten värms upp till maximalt 38.8 °C / 102 F, jämfört med genomsnittet av 33.2 °C / 92 F
(±) Vid tomgångsbruk är medeltemperaturen för ovansidan 32.3 °C / 90 F, jämfört med enhetsgenomsnittet på 30 °C / ### class_avg_f### F.
Apple iPad Pro 12.9 2018 ljudanalys
(+) | högtalare kan spela relativt högt (82.9 dB)
Bas 100 - 315 Hz
(±) | reducerad bas - i genomsnitt 7.8% lägre än medianen
(±) | linjäriteten för basen är genomsnittlig (12.1% delta till föregående frekvens)
Mellan 400 - 2000 Hz
(+) | balanserad mellan - endast 3.1% från medianen
(+) | mids är linjära (4.4% delta till föregående frekvens)
Högsta 2 - 16 kHz
(+) | balanserade toppar - endast 2.2% från medianen
(+) | toppar är linjära (4.1% delta till föregående frekvens)
Totalt 100 - 16 000 Hz
(+) | det totala ljudet är linjärt (9.7% skillnad mot median)
Jämfört med samma klass
» 4% av alla testade enheter i den här klassen var bättre, 3% liknande, 93% sämre
» Den bästa hade ett delta på 7%, genomsnittet var 20%, sämst var 129%
Jämfört med alla testade enheter
» 4% av alla testade enheter var bättre, 1% liknande, 95% sämre
» Den bästa hade ett delta på 4%, genomsnittet var 23%, sämst var 134%
Samsung Galaxy Tab S4 ljudanalys
(±) | högtalarljudstyrkan är genomsnittlig men bra (80.1 dB)
Bas 100 - 315 Hz
(-) | nästan ingen bas - i genomsnitt 18% lägre än medianen
(-) | basen är inte linjär (18.7% delta till föregående frekvens)
Mellan 400 - 2000 Hz
(+) | balanserad mellan - endast 4.3% från medianen
(+) | mids är linjära (1.9% delta till föregående frekvens)
Högsta 2 - 16 kHz
(+) | balanserade toppar - endast 3.3% från medianen
(±) | linjäriteten för toppar är genomsnittlig (7% delta till föregående frekvens)
Totalt 100 - 16 000 Hz
(±) | linjäriteten för det totala ljudet är genomsnittlig (19.2% skillnad mot median)
Jämfört med samma klass
» 53% av alla testade enheter i den här klassen var bättre, 6% liknande, 41% sämre
» Den bästa hade ett delta på 7%, genomsnittet var 20%, sämst var 129%
Jämfört med alla testade enheter
» 46% av alla testade enheter var bättre, 7% liknande, 46% sämre
» Den bästa hade ett delta på 4%, genomsnittet var 23%, sämst var 134%
| Av/Standby | |
| Låg belastning | |
| Hög belastning |
|
Förklaring:
min: | |
| Apple iPad Pro 12.9 2018 mAh | Apple iPad Pro 12.9 2017 10875 mAh | Samsung Galaxy Tab S4 7300 mAh | Huawei MediaPad M5 10.8 Pro 7500 mAh | Apple iPad 6 2018 mAh | Microsoft Surface Pro 6, Core i5, 128 GB mAh | |
|---|---|---|---|---|---|---|
| Power Consumption | 11% | 40% | -5% | -1% | -86% | |
| Idle Minimum * (Watt) | 1.42 | 1.55 -9% | 1.76 -24% | 3.3 -132% | 2.2 -55% | 4.3 -203% |
| Idle Average * (Watt) | 9.35 | 8.58 8% | 4.22 55% | 4.2 55% | 7.8 17% | 8.7 7% |
| Idle Maximum * (Watt) | 9.38 | 8.59 8% | 4.25 55% | 7 25% | 7.9 16% | 9.4 -0% |
| Load Average * (Watt) | 12.75 | 10.09 21% | 4.52 65% | 10.4 18% | 12.6 1% | 24.5 -92% |
| Load Maximum * (Watt) | 14.96 | 10.61 29% | 7.35 51% | 13.8 8% | 12.8 14% | 36 -141% |
* ... mindre är bättre
| Apple iPad Pro 12.9 2018 mAh | Apple iPad Pro 12.9 2017 10875 mAh | Samsung Galaxy Tab S4 7300 mAh | Huawei MediaPad M5 10.8 Pro 7500 mAh | Apple iPad 6 2018 mAh | Microsoft Surface Pro 6, Core i5, 128 GB mAh | |
|---|---|---|---|---|---|---|
| Batteridrifttid | 15% | -15% | -15% | -6% | -37% | |
| Reader / Idle (h) | 31.5 | 48.7 55% | 20.5 -35% | 20.9 -34% | 17.8 -43% | |
| H.264 (h) | 15 | 11.3 -25% | 12.3 -18% | 10.5 -30% | ||
| WiFi v1.3 (h) | 13.3 | 12.3 -8% | 8.3 -38% | 11.2 -16% | 11.9 -11% | 9.1 -32% |
| Load (h) | 3.1 | 4.3 39% | 4.1 32% | 3.7 19% | 3.1 0% | 2 -35% |
För
Emot
Läs den fullständiga versionen av den här recensionen på engelska här.
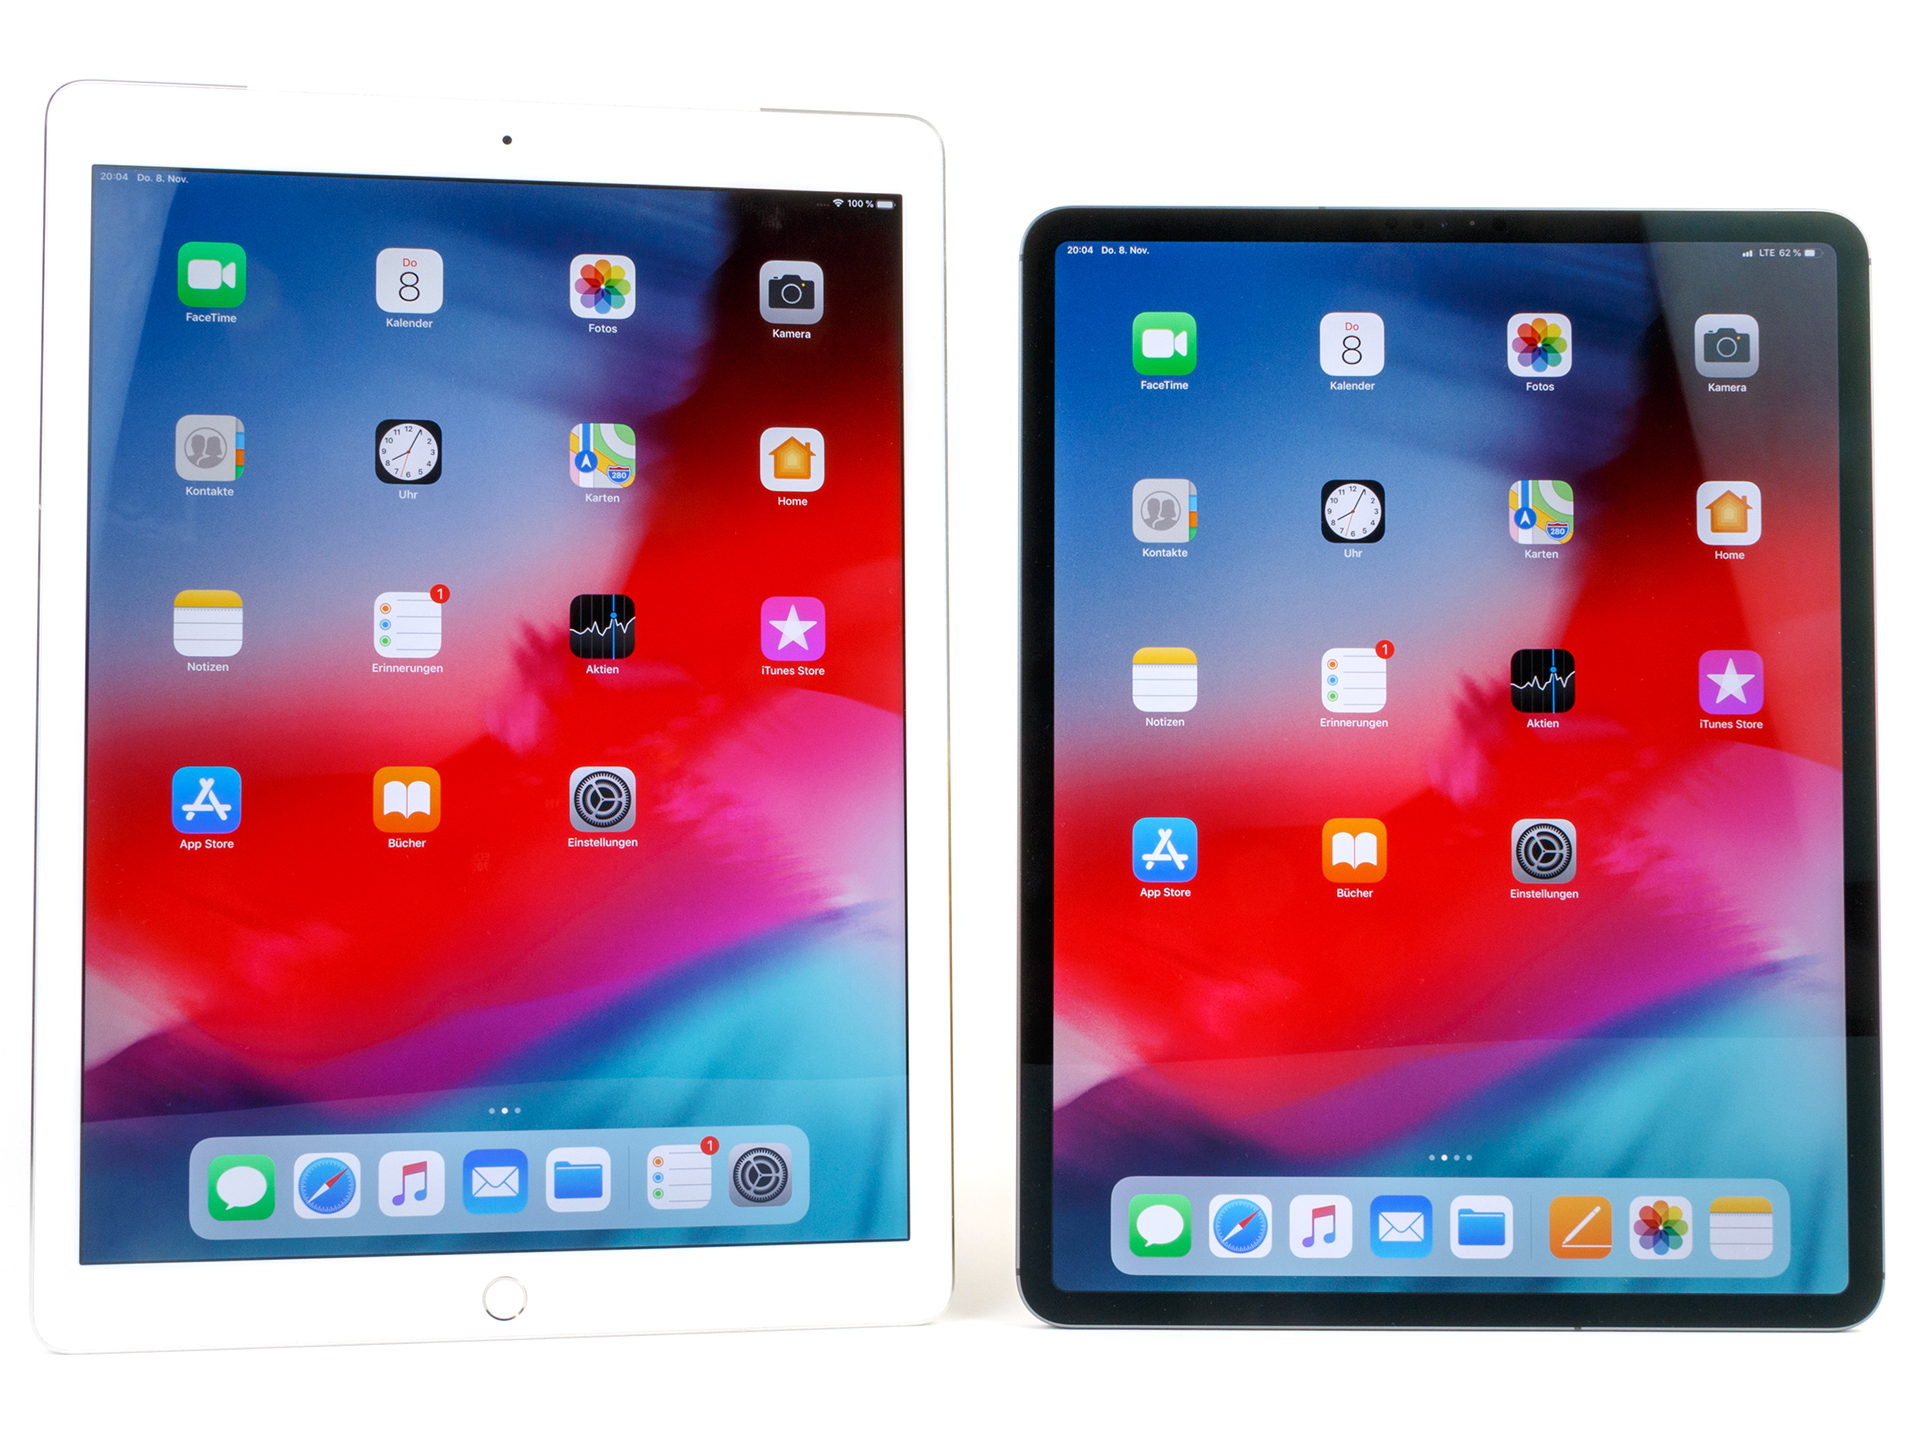
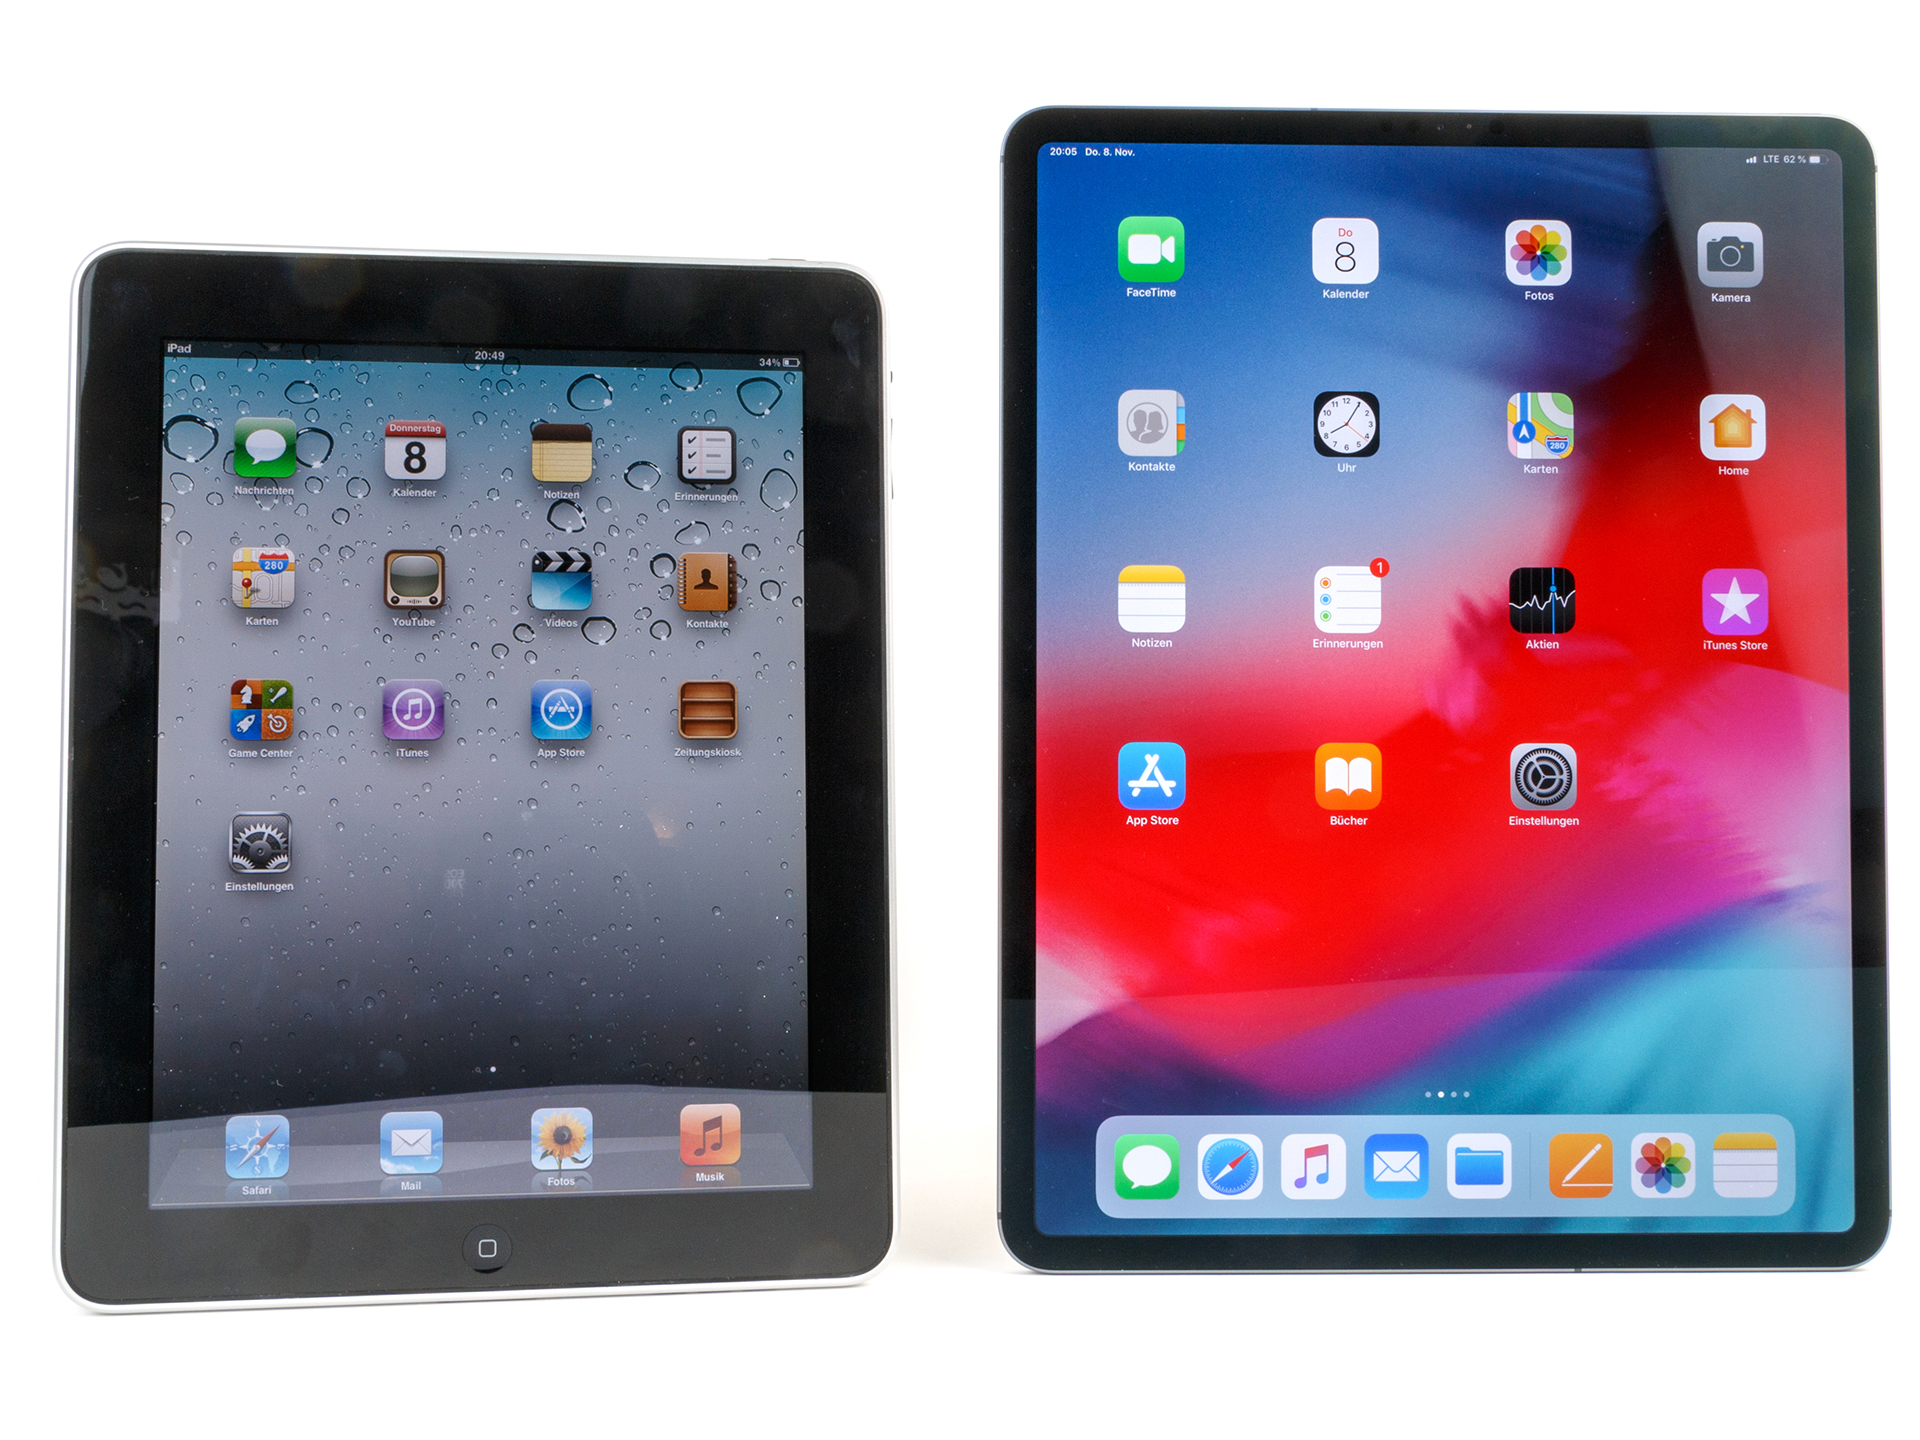
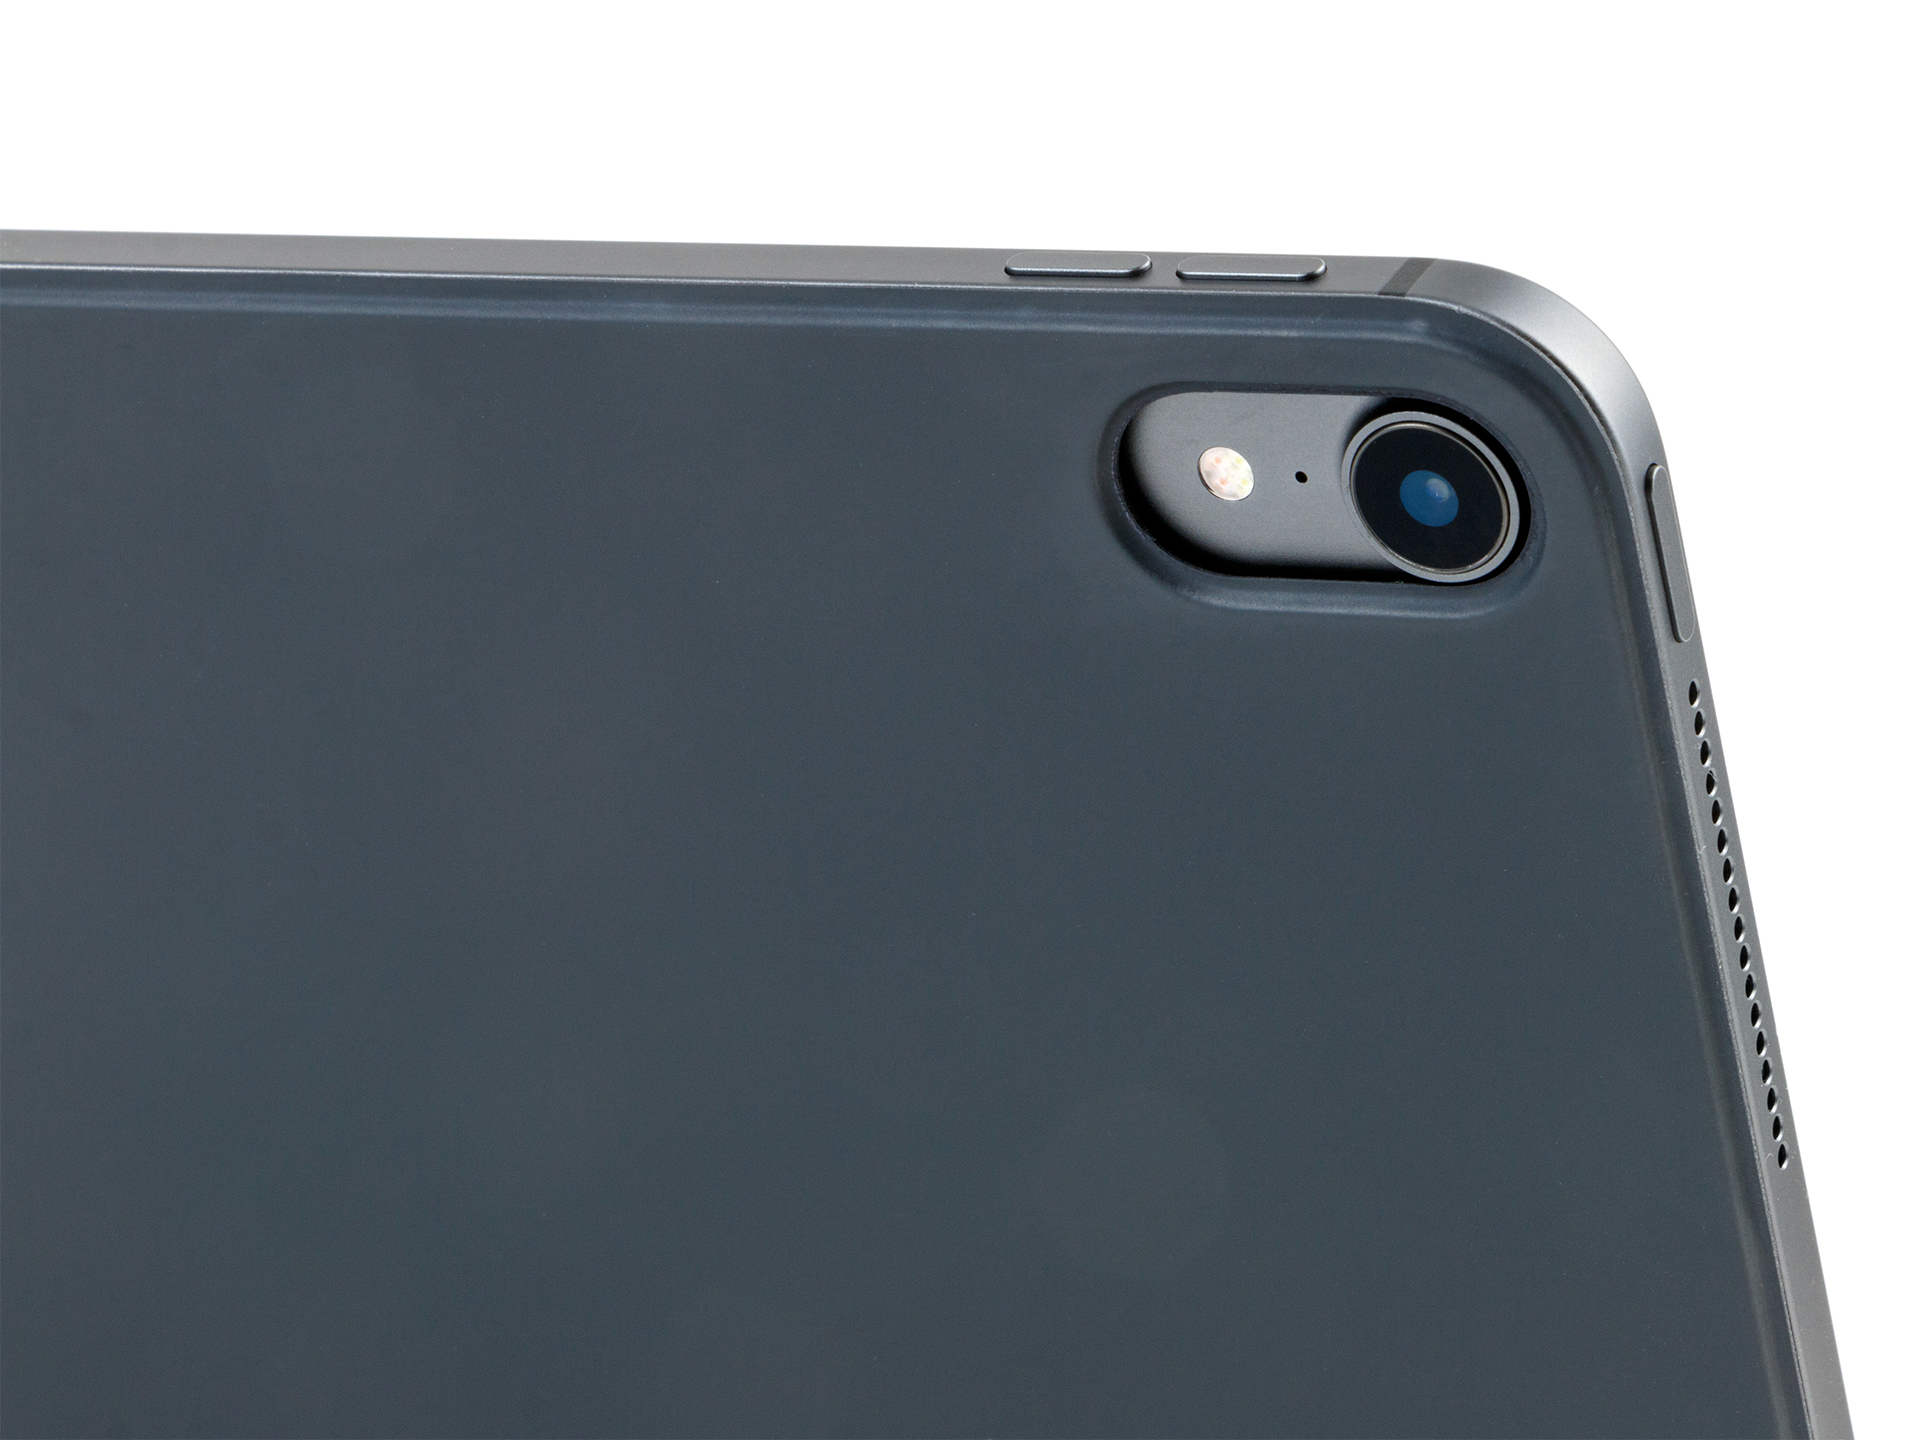
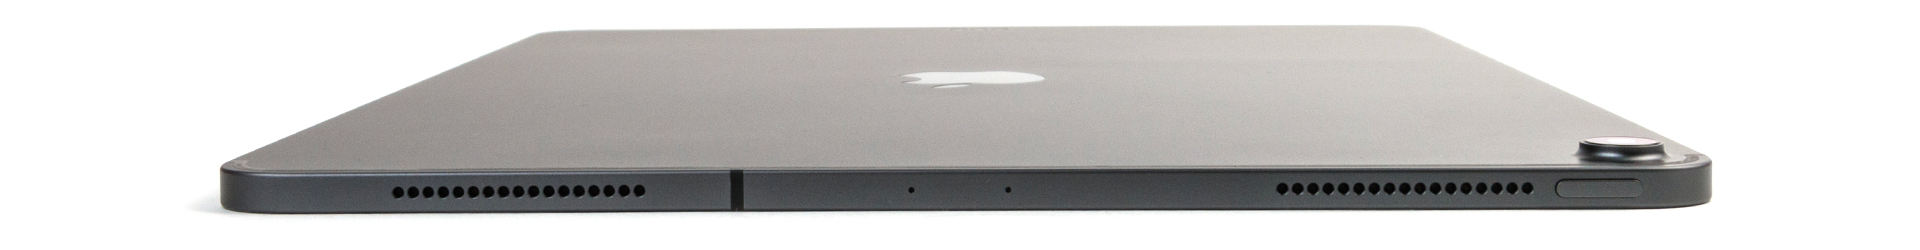
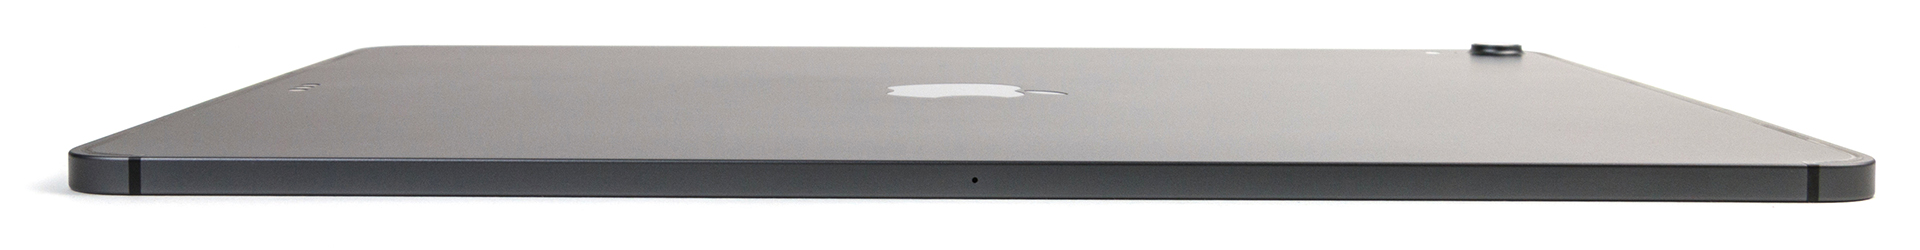
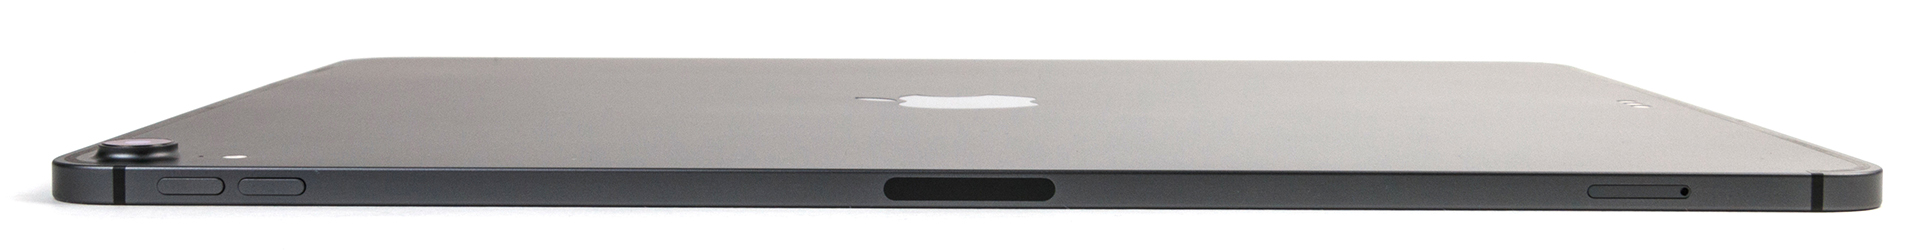
Apple iPad Pro 12.9 (2018) imponerade inte bara på oss under Apples presskonferens utan även när vi först fick vår testenhet. Ja, det är fortfarande en gigantisk surfplatta, men den är tunnare och lättare än sin föregångare. Nya Apple Pencil känns dessutom bra i handen.
Något som verkligen talar för nya iPad Pro 12.9 är dess påstådda prestanda, som Apple hävdar är bättre än 92% av alla bärbara datorer som släppts under 2018. Intressant nog inkluderar detta även en del Core i7-modeller. Företaget skryter också om att prestandan från A12X GPU:n bör kunna konkurrera med Xbox One S. Apple har verkligen tagit en risk med dessa stora påståenden och nya iPad Pro 12.9 kan inte riktigt leva upp till förväntningarna. A12X Bionic är för tillfället det snabbaste ARM-baserade chippet som finns på marknaden, men det finns inget exakt sätt att jämföra dess prestanda med x86-baserade processorer.
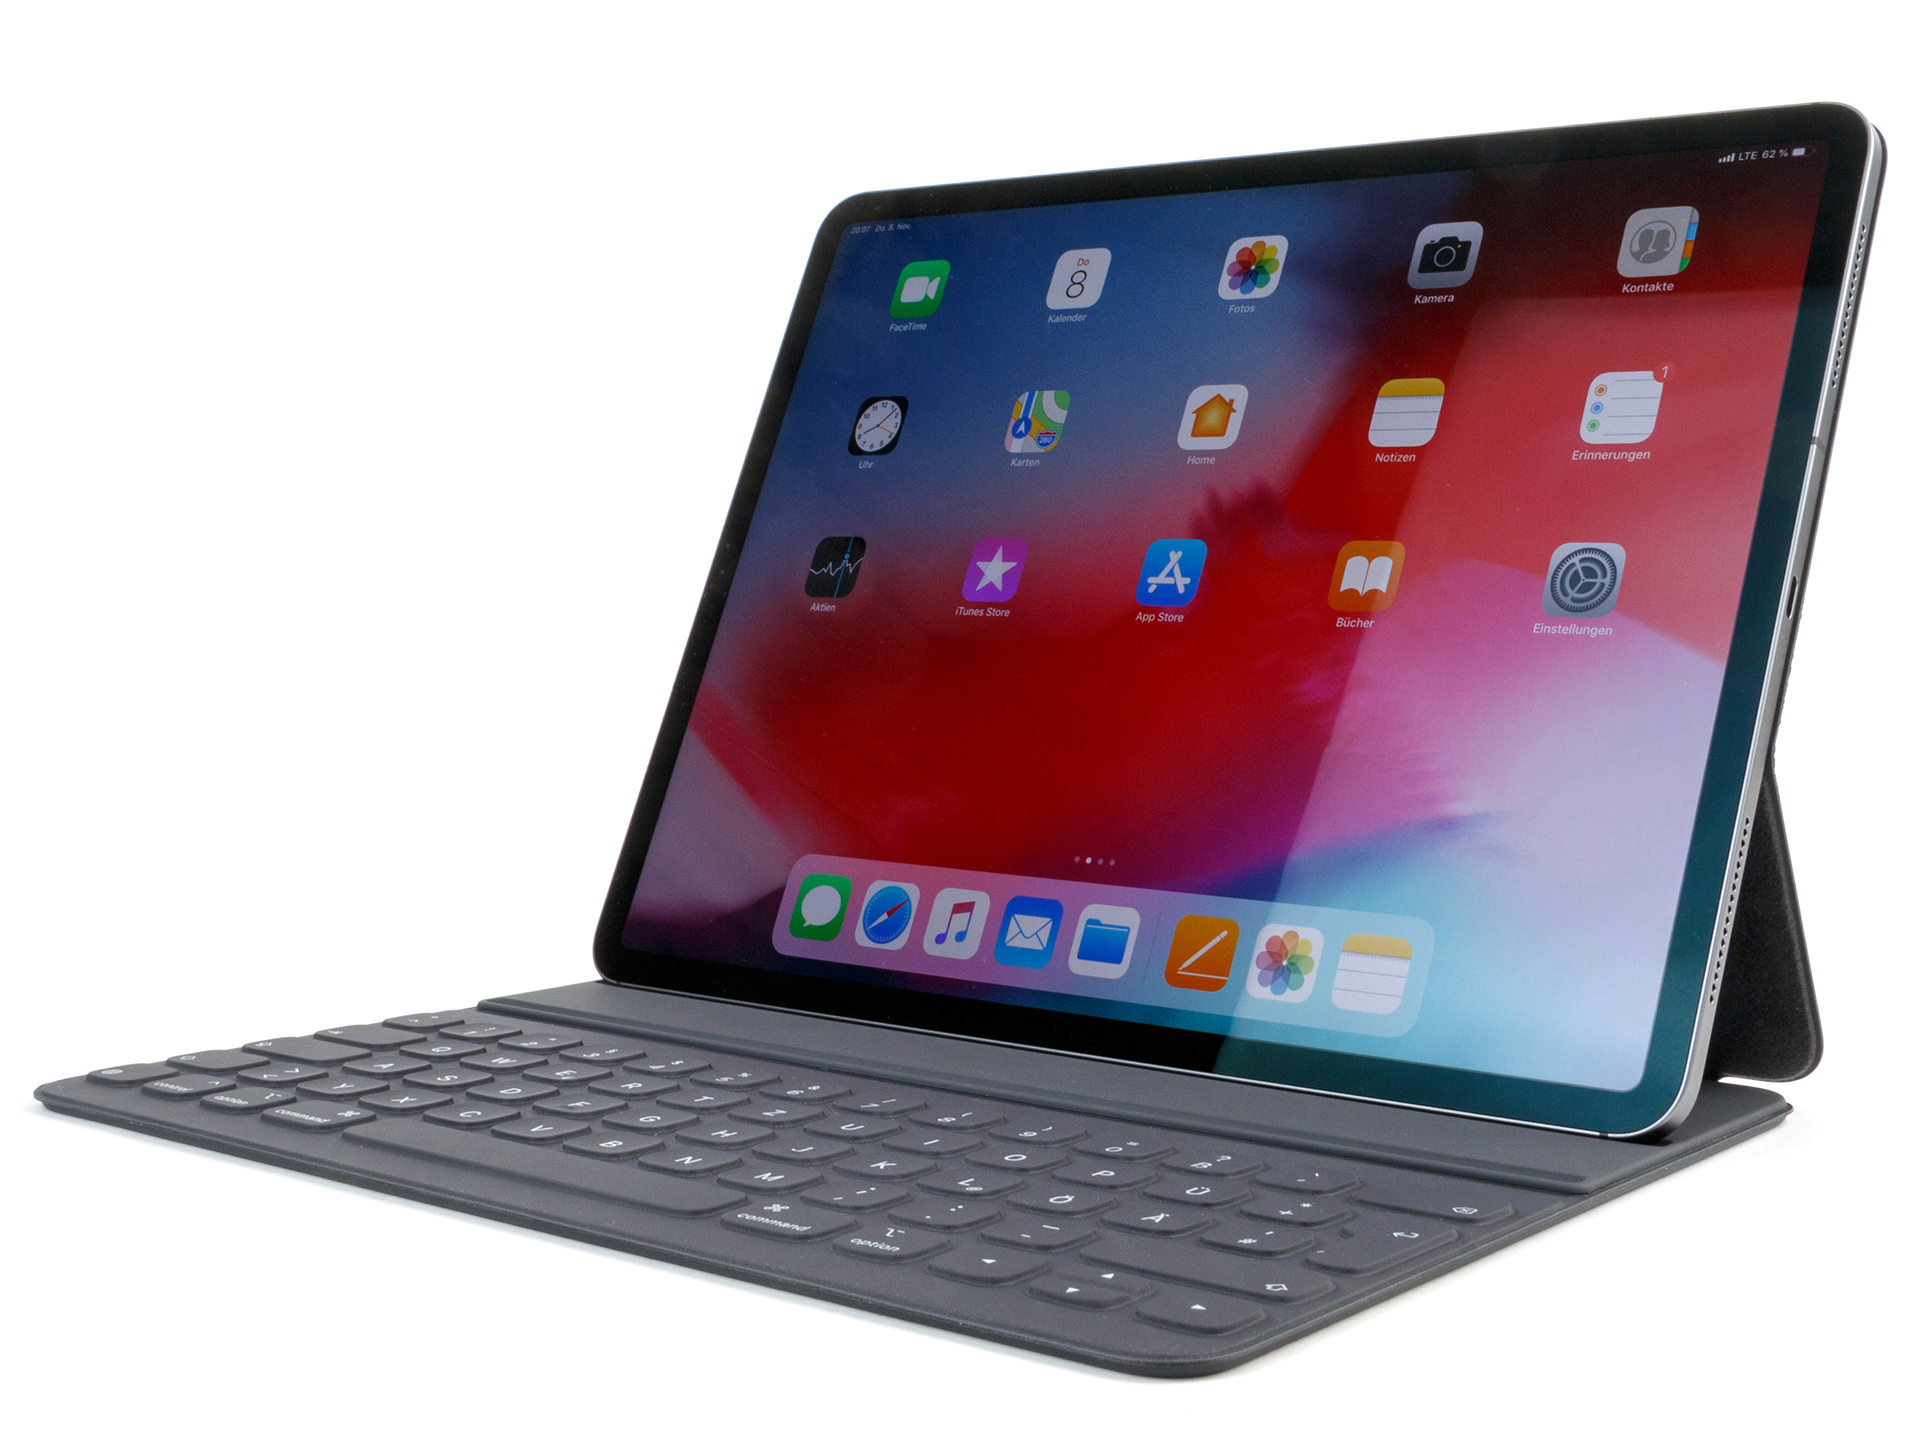
Tredje generationens iPad Pro 12.9 är en fantastisk surfplatta och är för tillfället den bästa ARM-baserade surfplattan som går att köpa för pengar. Men iOS fortsätter att hålla iPad Pro tillbaka och hindrar den från att verkligen vara en laptop-ersättning, vilket är synd eftersom den är tillräckligt kraftfull för att vara en sådan.
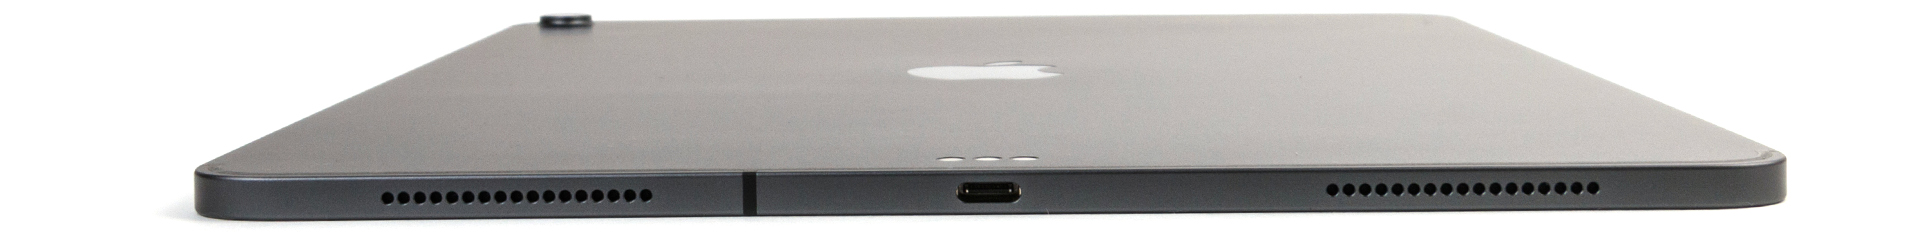
Den största bristen med iPad Pro 12.9 är iOS. Operativsystemet har inget användbart filsystem och enheten kan heller inte läsa från USB-minnen, för att bara nämna ett fåtal problem som finns med iOS. Galaxy Tab S4 är oändligt mycket mer flexibel i det hänseendet. Den som bara behöver en lätt enhet för epost, mediakonsumtion och kontorsprogram kommer vara nöjd med iPad Pro 12.9, även om den är synnerligen dyr. Men efter tre generationer håller Apple fortfarande inte vad de lovat: att erbjuda en surfplatta som kan ersätta en laptop.
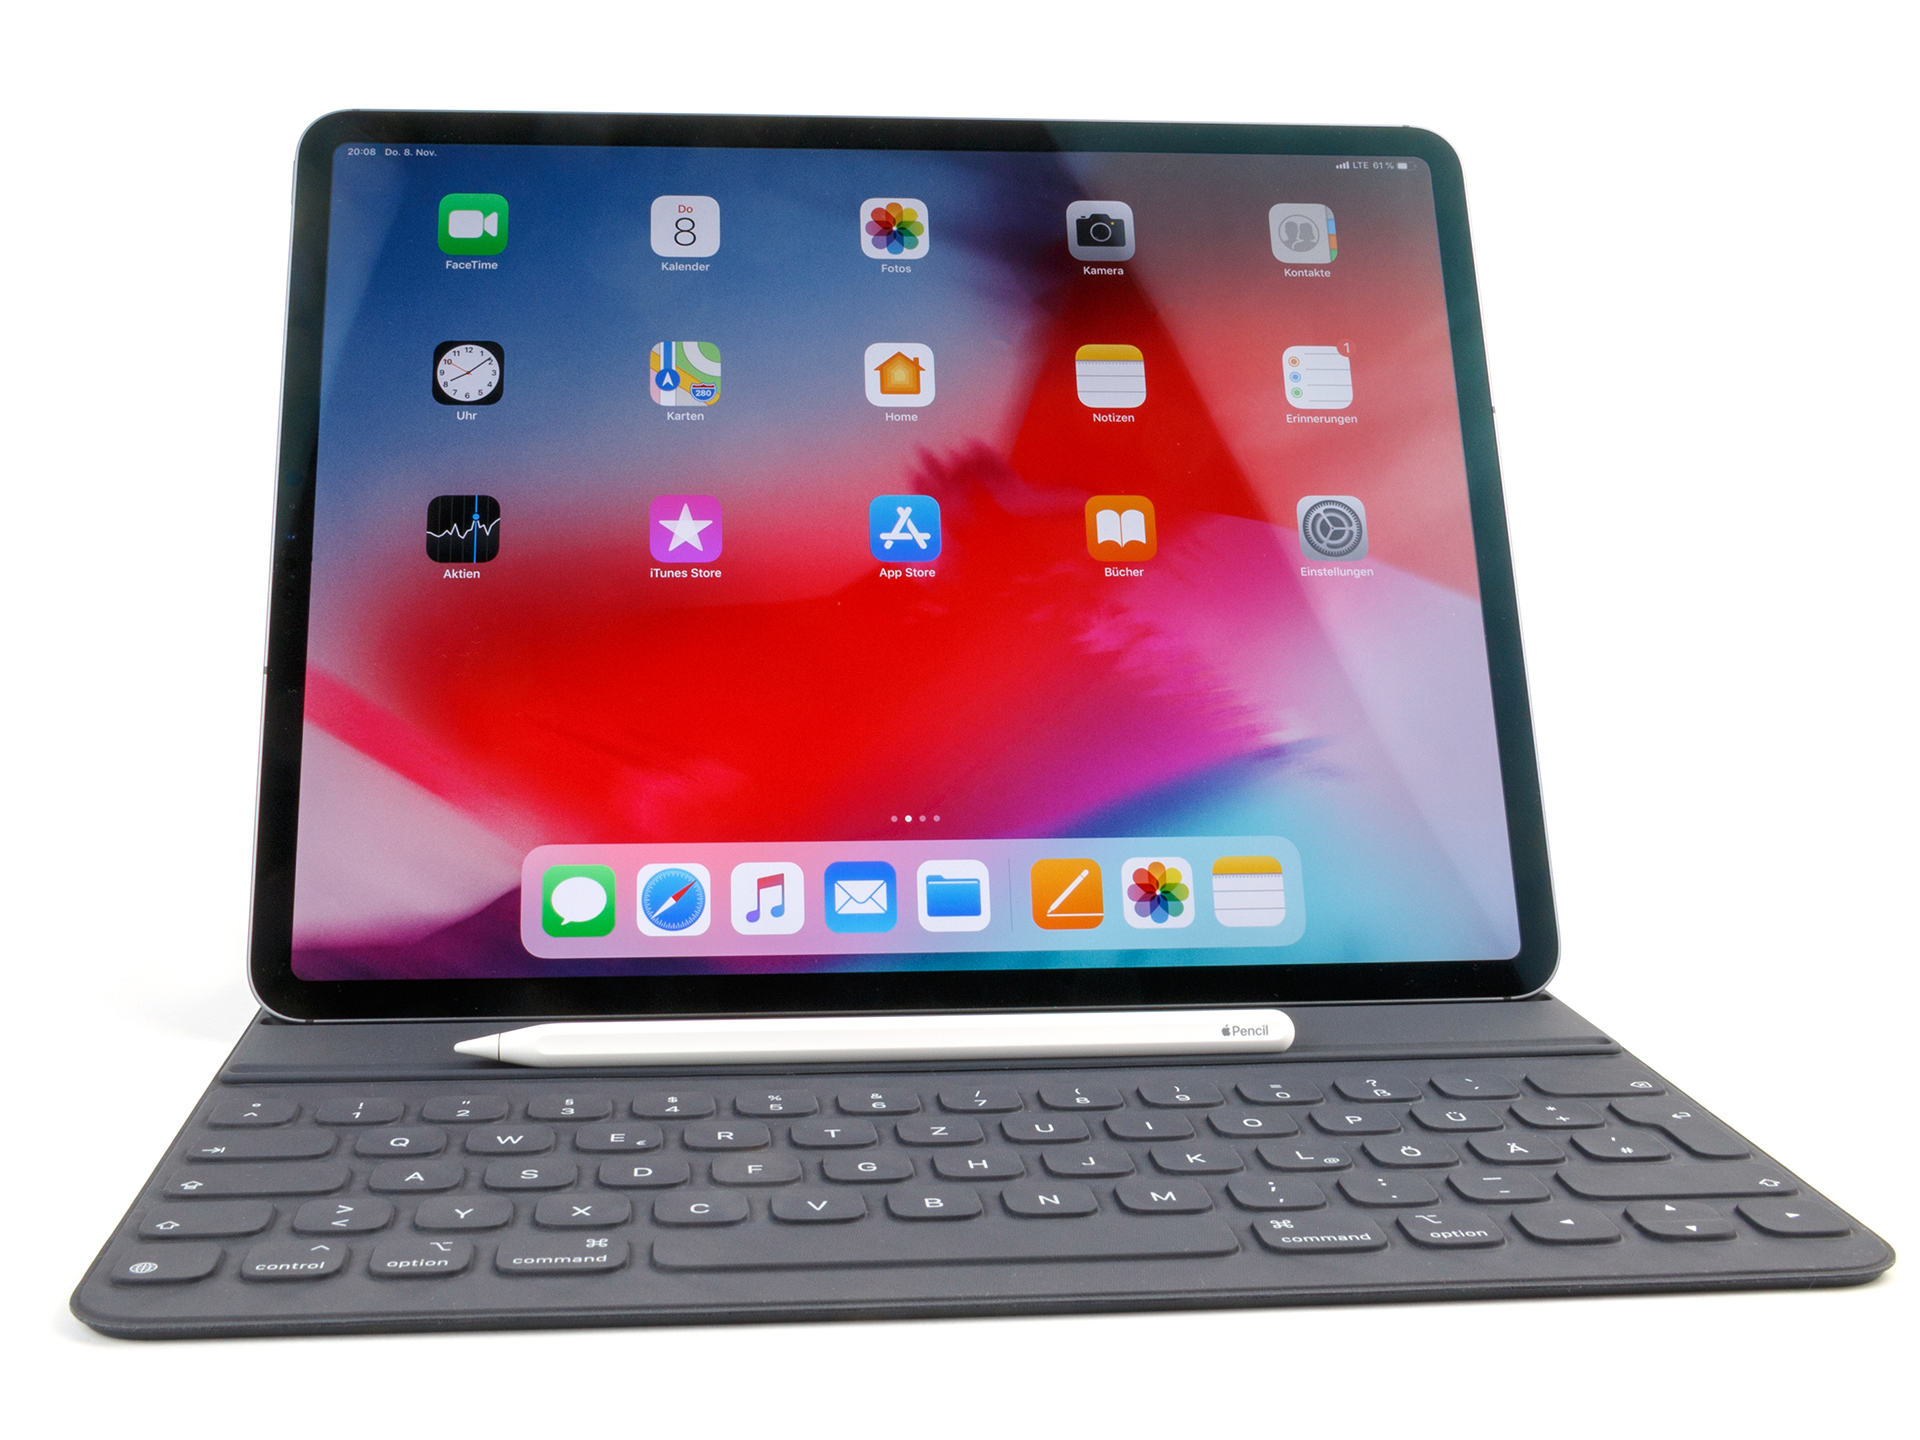
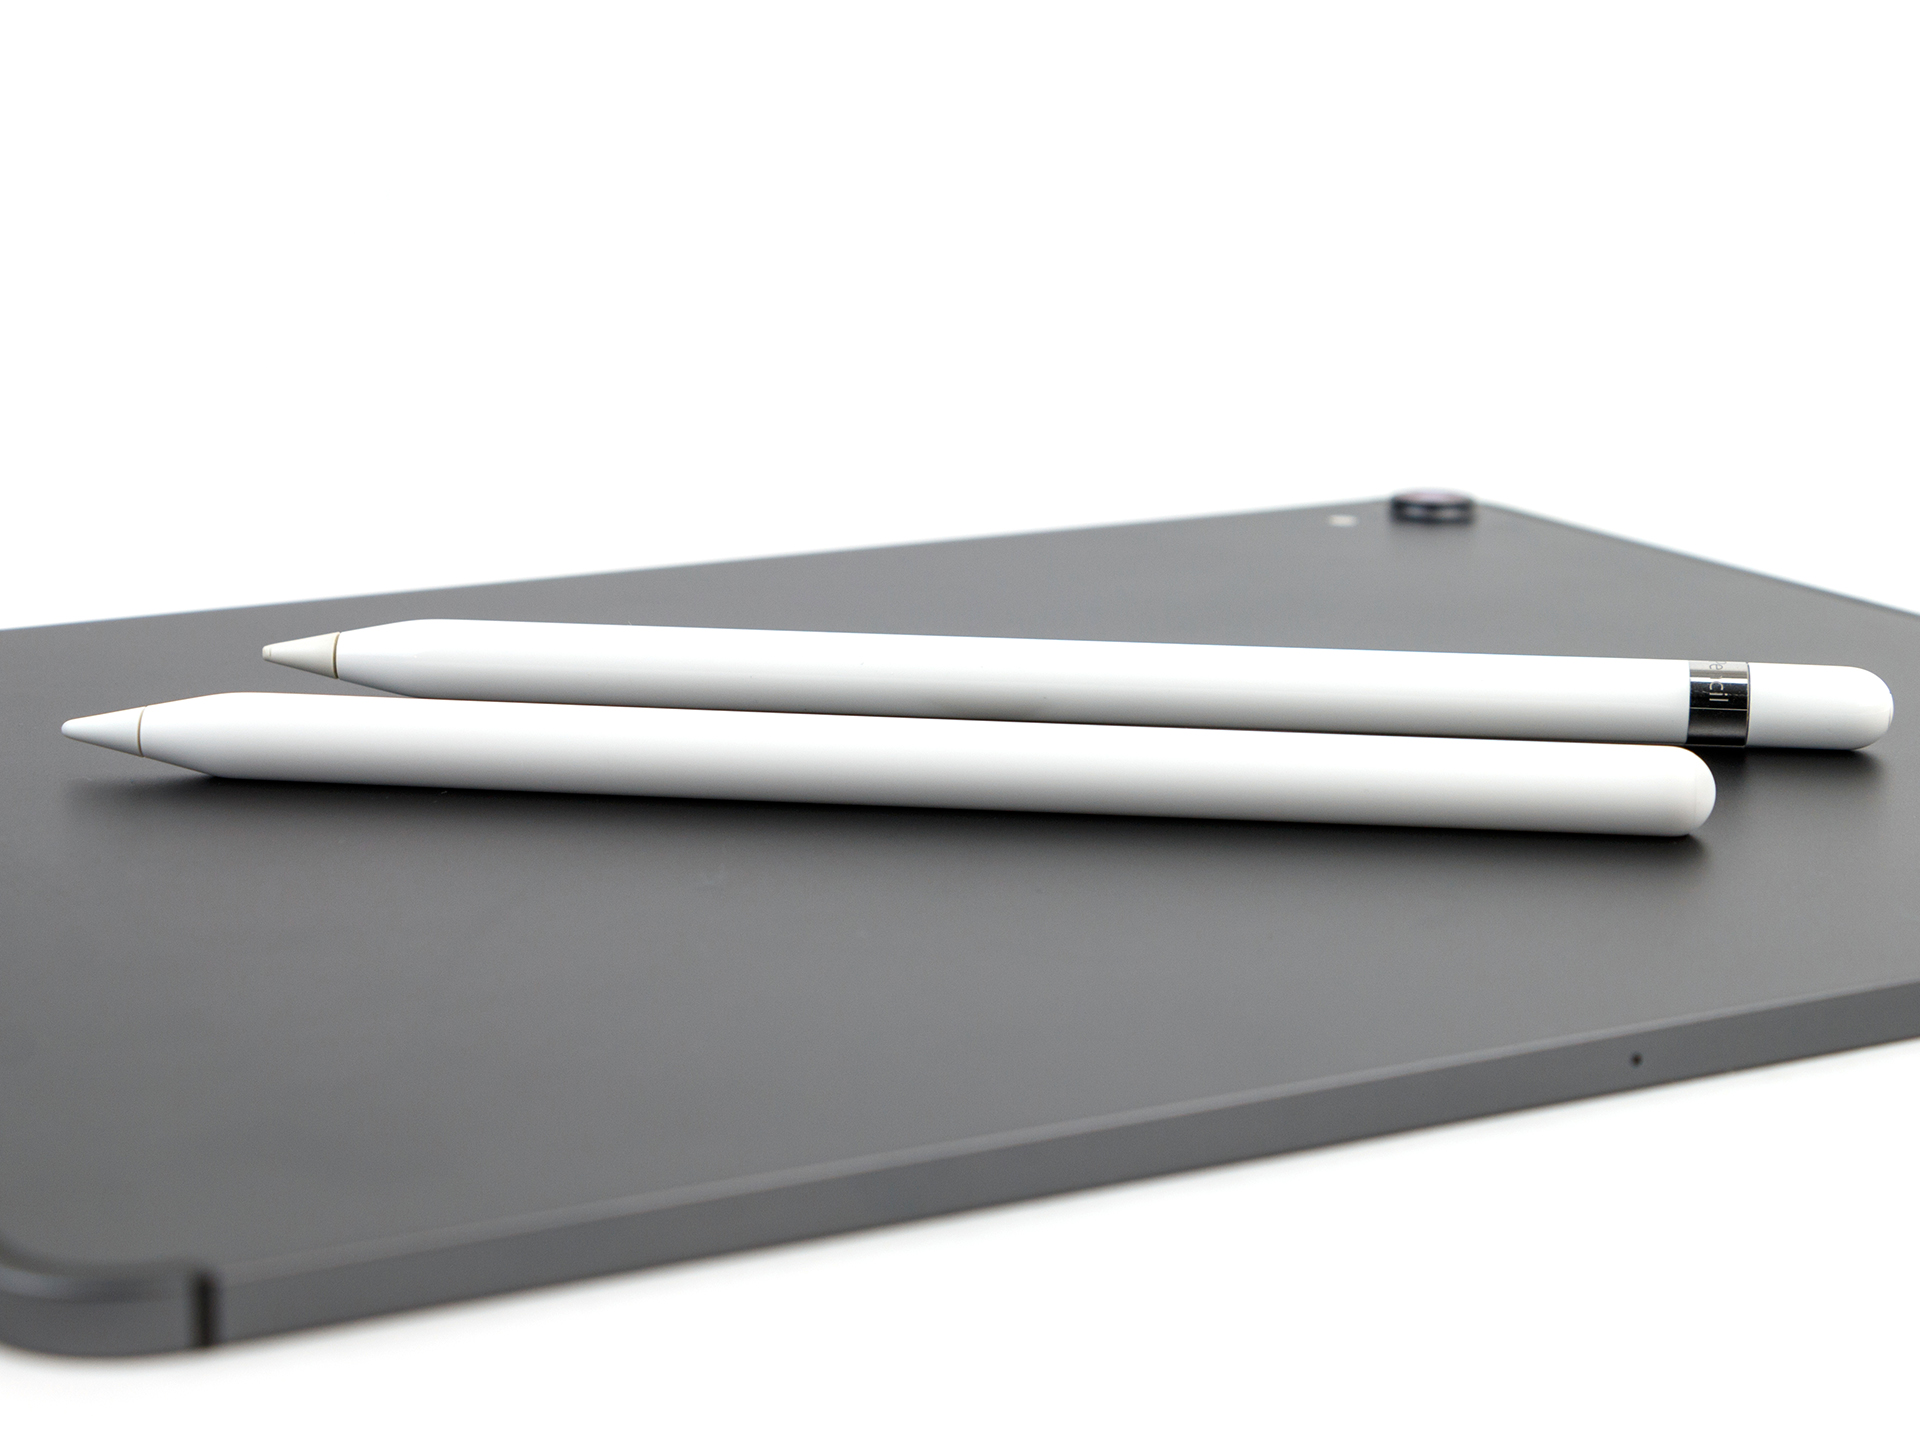
Nya iPad Pro 12.9 är bra för den som värdesätter Apple Pencil och vet hur den ska användas. Vi rekommenderar dock att välja den mindre modellen om du vill ha med enheten på resan. Vidare bör modellen med 64 GB ha tillräckligt med lagring för de flesta användare som bara vill ha en stor surfplatta för mediakonsumtion.
Apple iPad Pro 12.9 2018
- 09/16/2019 v7 (old)
Daniel Schmidt
Price comparison
